Speaking Truths to Power: Policy Ethnography and Police Reform in Bosnia and Herzegovina
Upload
khangminh22Category
view
0download
0
VIII. Alps-Adria Scientific Workshop Neum, Bosnia-Herzegovina, 2009
DOI: 10.1556/CRC.37.2009.Suppl.2
C R O P P R O D U C T I O N A N D P L A N T P R O T E C T I O N

VIII. Alps-Adria Scientific Workshop Neum, Bosnia-Herzegovina, 2009
DOI: 10.1556/CRC.37.2009.Suppl.2 5
EFFECTS OF BIOTIC STRESS ON THE UPTAKE AND DISTRIBUTION OF SOME ELEMENTS
László LÉVAI1 – Ferenc FODOR2 – Marianna MAROZSÁN3
1Department of Plant Physiology and Molecular Plant Biology, Eötvös Lóránd University, Pázmány P. str.
1/C. Budapest 1117, Hungary., email: [email protected] 2Institute of Crop Sciences, Division of Agricultural Botany and Crop Physiology, Debrecen University 3 NYÍRERDİ Nyírségi Forestry Corporation
Abstract: The distribution of Fe, Cu, Mg, Mn and Zn was measured in healthy and infected by Crown-gall
tumour (Ustilago maydis Dc.Cda.) corn seedlings five days after the infection. The distribution of elements
listed above was also measured under different iron supplies. Due to the infection – as a biotic stress – the
amount and distribution of examined elements have been changed in comparison to the non-infected (control)
plants. On the bases of the differences in the distribution of iron between the symptom-less and tumorial leaf
parts, we have come to the conclusion that the infection has also got an effect on the mobilization of iron
inside the plants. Only the total amount of iron was higher in the infected plants, while the infection increased
the translocation of iron and copper to the shoots. The iron efficiency also has an effect on iron uptake and
distribution. The distribution of iron between the roots and shoots was examined under 1/10, normal (5 x 10⁻⁴
M FeEDTA) and tenfold iron efficiency. The iron uptake was much higher in infected plants and the iron
status also had an effect on the uptake and distribution of other examined elements too.
Keywords: biotic stress, distribution of elements, infection.
Introduction
In respect of plant production the investigation the effect of biotic and abiotic factors on
plant physiology is essential (Birkás et al., 2006; Veres et al., 2006; Mészáros et al.,
2008, Szöllısi et al., 2008). Iron deficiency (chlorosis) can be observed on leaves,
which have sufficient iron contents. The decreased mobility and physiological activity
of iron is due to endogenous reasons The leaves or leaf parts also become chlorotic as a
result of certain infections e.g. in corn seedlings infected by crown-gall tumour
(Ustilago maydis, Dc.,Cda.). The leaf areas showing symptoms of infection are
chlorotic and tumour development can be seen. Other leaf areas of the same leaf are
green. The iron and other element contents were measured in the roots and shoots of
infected and healthy corn seedlings as well as in symptom-less and symptom-showing
leaf parts of infected corn seedlings.
Materials and methods
The monosporidial strains were separated from the multisporidial mixture. The infection
was induced with the 1:1 mixture of two compatible monosporidial strains. The
inoculums were diluted with distilled water corresponding to sporidium concentrations
of 2,5x10³x mm
-3. The two-strain hybrid of corn (Zea mays L. cv. Norma) was used in
the experiments. The seeds were treated for 4 hours with 5mM CaSO4, and transferred
on moistured filter paper and germinated in the dark at 25 °C for two days. The tip of
coleoptiles of seedlings with 5-10 mm shoots were cut then infected by vacuum
infiltration method. The non-infected seedlings got the same treatments without
sporidium. The seedlings were then transferred to nutrient solution that was
continuously aerated and changed in every second day. Plants were grown under
controlled environmental conditions with 70% humidity, a light intensity of 220 µEm-2
s-
1, a day-night temperature of 25–23 °C and a light-dark period of 14-10 hours. The

Vol. 37, 2009, Suppl. Cereal Research Communications
6
samples were collected on the 5th
day after the infection. The roots of seedlings were
washed in 0.1 N HCl to remove the apoplasmatic-bounded ions. The shoots and the
roots were separated. The leafs of infected seedlings were then divided into symptom-
showing and symptom-less parts. The samples were dried at 85 °C. The content of
elements was measured by OPTIMA 3300DV ICP-OA spectrophotometer (Perkin-
Elmer).
Results and discussion
The infection – as a biotic stress – has a significant effect on the uptake and distribution
of measured elements (Dadhich and Somani, 2007). There are differences in the
distribution of elements between the symptom-less and symptom-showing leaf parts of
infected corn seedlings. Except the Zn, contents of measured elements were lower in the
symptom-showing leaf parts then in the symptom-less leaf parts, in comparison with the
control (non-infected plants) leaves. The Fe and Mg content of infected leaves was an
average 21% and 5% higher than that of the control. Other element contents were higher
in the control leaves. The results can be seen in Table 1.
Table 1. The distribution of elements in the leaves of infected and non-infected seedlings
Cu Fe Mg Mn Zn
S-s(1) 5.8±0.9 75.3±1.7 1773±150 13.4±2.2 38.2±7.9
S-L(2) 8.7±1.6 113.0±8.2 2099±111 32.7±8.2 58.7±3.6
A 7.2±1.2 94.1±5.6* 1936±98 23.0±4.0 48.5±5.5*
C 8.3±0.8 77.8±4.8 1834±76 25.6±3.2 64.8±7.9
Values are in µg x g-1 dry wt, S-s/1/: symptom-showing leaf parts, S-L/2/: symptom-less leaf parts, A:
average of 1 and 2, C: control, sample number: 4. Significances of average of 1 and 2 to the control: p<0.05*
The distribution of elements between the shoots and roots of infected and non-infected
plants also was examined. The infection modified the distribution of Cu in comparison
to the control plants. The contents of Fe and Mg were higher in the roots while the
amount of Mn was higher in the shoots of both plant groups. There were no significant
differences observed in the distribution of examined elements in infected plants in
comparison to the non-infected ones- except the distribution of Cu. The results can be
seen in Table 2.
Table 2. Distribution of elements between the shoots and roots of infected and non-infected corn seedlings
Cu Fe Mg Mn Zn
LI 7.24±1.5 94.1±7.1 1936±221 23.1±5.2 48.5±2.9
RI 16.1±3.8** 151±11.2 2672±198 20.3±5.0 47.0±3.8
LC 8.3±2.0 77.8±6.9 1834±185 25.6±6.1 64.8±9.2
RC 40.7±6.3** 134±10.7 3239±271 24.7±3.8 48.4±5.3
Values are in µg x g-1 dry wt, LI: leaf of infected plants, RI: roots of infected plants, LC: leaves of non-
infected plants, RC: roots of non-infected plants, n= 4±s.e. Significances of infected to the control: p<0.01**
The roots of infected plants are symptom-less. There was observed a higher iron content
in the roots of infected plants, while the content of other elements was higher in the
roots of non-infected plants. The results can be seen in Table 3.

VIII. Alps-Adria Scientific Workshop Neum, Bosnia-Herzegovina, 2009
DOI: 10.1556/CRC.37.2009.Suppl.2 7
Table 3. Content of different elements in the roots of infected and non-infected corn seedlings
Cu Fe Mg Mn Zn
RC 40.7±2.8 134±7.9 3239±178.1 24.7±4.7 48.4±6.9
RI 16.1±3.1** 151±12.7 2672±132.9 20.3±4.1 47.0±5.3
Values are in µg x g-1 dry wt, RI: roots of infected plants, RC: roots of non-infected plants, n= 4±s.e.
Significances of infected to the control: p<0.01**
The infection is supposed to increase the iron uptake via a signalisation system. The
higher iron content in the leaves of infected plants shows, that the infection increases
also the transport of iron from the roots to the shoots.
Nevertheless, the contradiction remains: the symptom-showing leaf parts are chlorotic,
while the iron content of their surrounding leaf parts is 21 % higher than that of the
control. The effect of different iron supplies on the uptake and distribution of elements
also was examined. Iron was added in form of Fe-EDTA in the concentration stated
above. Under low iron supply, the iron content of the roots and shoots of infected plants
was similar to that of those observed under a normal iron supply. Under a low iron
supply, the iron content of the infected plants is significantly higher than that of non-
infected plants. There were no differences observed in the iron content of shoots of
infected and non-infected plants under normal and high iron supplies. The results are
shown in Table 4.
Table 4. Iron content of shoots and roots of infected and non-infected corn seedlings under different iron
supplies
Fe: 5x10⁻⁵ M Fe EDTA
RI RN SI SN
143±11,8** 98±8,9 94±10,5* 75±5,9
Fe: 5x10⁻⁴ M Fe EDTA
147±13,9 101±9,9 94±8,4 90±10,1
Fe: 5x10⁻³ M Fe EDTA
304±56,8* 220±38,9 140±15,6 135±9.7
Values are in µg x g-1 dry wt, RI: roots of infected seedlings, SI: shoots of infected seedlings, RN: roots of
non-infected plants, SN: shoots of non-infected plants, n= 4±s.e. Significances of infected to the non-infected:
p<0.05*, p<0.01**
Under a low iron supply lower zinc content in the roots of infected plants was observed
as compared to the roots of non-infected seedlings, but the zinc content of the shoots of
infected plants was higher by 39 %. The results are presented in Table 5.
Table 5. The content and distribution of zinc in the roots and shoots of infected and non-infected corn
seedlings under different iron supplies
Fe: 5x10⁻⁵ M Fe EDTA
RI RN SI SN
70,2±5,3* 93,5±4,7 97,1±7,1* 69,8±8,3
Fe: 5x10⁻⁴ M FeEDTA
58,8±6,8 47,5±6.1 66,2±4,2 47,8±5,5
Fe: 5x10⁻³ M Fe EDTA
62,9±8,1* 75,4±7,8 51,0±6,8 50,3±7,3
Values in mgL-1, IR: roots of infected seedlings, IS: shoots of infected seedlings, NR: roots of non-infected
plants, NS: shoots of non-infected plants, n= 4±s.e. Significances of infected to the non-infected: p<0.05*

Vol. 37, 2009, Suppl. Cereal Research Communications
8
Conclusions
The chlorosis of the leaves of infected plants is not caused by iron deficiency since the
leaves have high iron content. The content of the examined elements in symptom-
showing (tumorial) leaf parts was lower in comparison to the control, while there were
higher values observed in the symptom-less leaf parts of infected plants.
The highest difference was measured in the case of iron. The biotic stress also has an
effect on the distribution of elements between roots and shoots (Sharma et al., 2007).
The highest difference was measured in copper. The translocation of copper to the
shoots of infected plants was twice as high as in the non-infected plants. The iron
content of roots of infected plants was also higher. Supposedly the infection increases
the uptake and distribution of iron. The infection modifies the uptake and translocation
of elements, but the most significant results were observed in the case of iron. Iron
supply also has an effect on the uptake and distribution of several elements. The most
significant differences were observed in the uptake and distribution of iron and zinc.
The iron and zinc content of shoots seems to be normal under a low iron supply. The
infection is supposed to induce high iron, zinc and copper requirements. These ions play
a role in enzymes, e.g. SOD, that has a significant role in defence mechanism, and in the
elimination of free radicals, developed by the infection.
References
Birkás, M., Dexter, A. R., Kalmár, T. Bottlik, L.: 2006. Soil quality – soil condition – production stability.
Cereal Research Communications, 34: 1. 135 – 138.
Dadhich, S. K., Somani, L. L.: 2007. Effect of integrated nutrient management in a soybean-wheat crop
sequence on the yield, micronutrient uptake and post-harvest availability of micronutrients on typic
ustochrepts soil. Acta Agronomica Hungarica, 55: 2. 205 – 216.
Sharma, H., Behl, R. K., Singh, K. P., Narula, N., Jain, P.: 2007. Root and plant characters in wheat under low
input field conditions with dual inoculation of mycorrhiza and Azotobacter chroococcum: Gene effects.
Cereal Research Communications, 35: 4. 1573 – 1582.
Szıllısi, E., Koncz, P., Kanalas, P., Veres, Sz., Mészáros, I.: 2008. Effects of drought on some
cophysiological traits of sessile oak (Quercus petraea L.). Cereal Research Communications, 36: 295 –
298.
Mészáros, I., Veres, Sz., Szıllısi, E., Kanalas, P., Sárvári, É.: 2008. Ecophysiological traits of beech
regeneratingin contrasting environmental conditions. Cereal Research Communications, 36: 299 – 302.
Veres, Sz., Tóth, V.R., Láposi, R., Oláh, V., Lakatos, G., Mészáros, I.: 2006. Carotenoid composition and
photochemical activity of some sandy grassland species. Photosynthetica, 44: 2 255 – 261.

VIII. Alps-Adria Scientific Workshop Neum, Bosnia-Herzegovina, 2009
DOI: 10.1556/CRC.37.2009.Suppl.2 9
ACCUMULATION OF NON/ESSENTIAL ELEMENTS IN RADISH PLANTS GROWN IN SALT-AFFECTED AND CADMIUM-CONTAMINATED ENVIRONMENT
Gabrijel ONDRASEK1 – Zed RENGEL 2 – Davor ROMIC1 – Milan POLJAK1 – Marija ROMIC1 1 Faculty of Agriculture, University of Zagreb, Svetosimunska 25, 10000 Zagreb, Croatia, [email protected] 2 Soil Science & Plant Nutrition, Faculty of Natural & Agricultural Sciences, University of Western Australia,
Crawley WA 6009, Australia
Abstract: Soil salinization, as one of the most important abiotic stresses in irrigated plant production,
combined with metal contamination represents a serious threat to food production and human food safety. The
influence of a factorial combination of four salinity concentrations (0, 20, 40 and 60 mM NaCl added as
solution) and three cadmium (Cd) levels (0.3, 2.5 and 5 mg kg-1) in peat soil on mineral accumulation,
vegetative growth and edible hypocotyl yield of radish plants (Raphanus sativus L. var. sativus) was studied
in a greenhouse. After 34 days of exposure to NaCl treatment, salt-stressed plants had a reduced number of
fully developed leaves (up to 30%) and total fruit yield (up to 35%) in addition to the progressively increased
Na and Cl concentration as well as significantly lower K concentration in leaf and hypocotyl tissues. Salinity
significantly increased the uptake and accumulation of Cd in leaves (up to 20%). In contrast, raising salinity
levels did not affect the Cd translocation and deposition into the edible hypocotyls (Cd contents being 4- to 6-
fold lower than in leaves), which may indicate that the phloem mobility of Cd in radish plants is relatively
poor and unaffected by NaCl exposure. Contamination of growing media by Cd (separately and in
combination with NaCl salinity) had no effect on any measured parameter, except that accumulation of Cd in
radish tissues was increased by an order of magnitude compared with non-contaminated control.
Keywords: salt stress, metal pollution, phytoaccumulation
Introduction
Salt-affected and metal-contaminated areas are increasing rapidly, becoming one of the
greatest threats to modern agricultural production and human food safety (Varallyay,
2007; Ondrasek et al., 2009). Radish (Raphanus sativus L. var. sativus) is an important
commercial vegetable culture consumed worldwide, whose edible part (thickened fleshy
hypocotyl and the upper part of the root) grows and develops in the top soil, commonly
the part of the soil profile most exposed to salinization and metal pollution (e.g.
fertigation, atmospheric/fluvial deposition, etc.), (Ondrasek et al., 2008; Romic et al.,
2008).
Exposure to excessive rhizosphere salinity affects water and mineral nutrients transport
processes within the plants, which may disturb the ion homeostasis and compromise the
vegetative growth and crop yield. Phytoextraction from contaminated soils and
accumulation in edible crop parts represents the most common entry for potentially
harmful nonessential trace metals into the human foodstuffs. Only several metals (e.g.
zinc and copper) are essential in trace amounts, whereas highly toxic Cd has no known
essential physiological functions in plants, animals or humans (Clemens, 2006).
Trace metals cations form complexes of different solubility and phytoavailability with
inorganic (e.g. chlorides and sulphates) and organic ligands (e.g. humic and fulvic
substances). Organic matter, as one of the most important soil properties affecting
availability and phytoextraction of (non)essential trace elements (Rengel, 2007), can
create organically-complexed metal (Cd) forms that have poor bioavailability. In
contrast, excessive salinity in soil solution, especially increased concentration of
chloride ions (Cl-), could significantly enhance Cd solubility and thus bioavailability

Vol. 37, 2009, Suppl. Cereal Research Communications
10
and phytoaccumulation (Khoshgoftarmanesh et al., 2006). Thus, growing crops on
saline and Cd-contaminated soils may potentially increase bioaccumulation and toxicity
of Cd, namely by increasing Cd entry into the human food chain.
This study was conducted to quantify the effects of increasing root zone salinity and
contamination of organic soil with Cd on mineral accumulation, and vegetative and
yield parameters in radish plants.
Materials and methods
A two-factorial split-plot greenhouse experiment was performed with radish (Raphanus sativus L. var. sativus, cv. Tarzan) planted into the peat substrate (Klasmann, Potground
H). Treatments were: four levels of salinity applied in the nutrient solution (0, 20, 40
and 60 mM NaCl) (main factor), and three peat Cd levels achieved by spiking peat
substrate (initially containing 0.3 mg Cd kg-1
as 0 control) to the target levels of 2.5 and
5 mg Cd kg-1
(sub factor). To avoid early salt stress, salinity treatments started 3 weeks
after sowing, with salinity gradually increasing over time (10 mM NaCl daily
increments to final concentrations).
Samples of fully developed leaves (L) and edible hypocotyls (H) were taken at
technological maturity, 34 days after salinity treatments started. Concentrations of Cd in
plant samples were analyzed by inductively coupled plasma-atomic emission
spectrometry (ICP-OES) (MPX AX, Varian), whereas concentrations of K and Na were
detected by atomic emission spectrometry (Perkin Elmer, 3110), and Cl by a
colourimetric assay at 470 nm on Segmented Flow Analyser (Skalar San Plus).
Results were subjected to ANOVA by using MIXED procedure in statistical software
SAS (SAS Institute, 2001), and the means were compared using Tukey-Kramer's test at
the 0.05 probability level.
Results and discussion
There was no significant interaction of salinity and Cd contamination on any measured
parameter (Table 1). Raising root zone salinity significantly reduced vegetative growth
(up to 30%) and total hypocotyl yield (up to 35%) in addition to the progressively
increased Na (in leaves up to 11 times, in hypocotyl up to 10 times) and Cl (in leaves up
to 4 times, in hypocotyl up to 7 times) as well as significantly lower K concentration (in
leaves up to 37%, in hypocotyl up to 23%), (Table 1). Increasing salinity enhanced Na
and Cl accumulation in all analyzed tissues, most likely in combination with water
deficit, nutrient imbalance (e.g. K, Ca, Mg) and ion toxicity (Grattan and Grieve, 1999);
these combined effects resulted in decreased vegetative growth and total hypocotyl
yield of radish plants (Table 1).
Contamination of growing media by Cd resulted in significant increases of Cd
concentration (by one order of magnitude) in leaf and fruit tissues. Exposure to
increasing NaCl salinity in the rhizosphere environment increased accumulation of Cd
in leaves by 11-20% compared to unstressed control, whereas no significant difference
in Cd accumulation in edible hypocotyls was observed with increasing salinity (Table
1).

VIII. Alps-Adria Scientific Workshop Neum, Bosnia-Herzegovina, 2009
DOI: 10.1556/CRC.37.2009.Suppl.2 11
The interaction between salinity and trace elements is complex and poorly understood,
with salinity increasing, decreasing, or having no effect on micronutrient availability
and phytoextraction (Grattan and Grieve, 1999). Furthermore, it has been shown that
soil and/or nutrient solution salinity in environments low in organic matter and other
metal-binding components (e.g. clay particles) significantly improve Cd uptake and its
accumulation in shoots and/or edible tissues of some vegetable and leguminous crops
(Smolders and McLaughlin, 1996; Helal et al., 1999).
In this study, NaCl salinity also enhanced uptake and accumulation of Cd in leaves, but
not its translocation and deposition into the edible fruit tissue of radish plants (Table 1).
Table 1. Influence of salinity (0-60 mM NaCl) and Cd (0.3-5 mg kg-1 soil) on mineral accumulation in radish
leaves (L) and edible hypocotyl (H), and on vegetative growth (Vg; total number of fully developed leaves per
plant) and total hypocotyl yield 34 days after commencement of the salinity treatment. Interaction NaCl x Cd
was non-significant for all parameters shown.
K Na Cl Cd Vg Hypocotyl yield Part Level
g kg-1 g kg-1 g kg-1 mg kg-1 Number of leaves per plant g m-2
NaCl0 41a 2a 13a 27.5a 4.4a
NaCl20 35b 14b 37b 30.0ab 4.0a
NaCl40 28c 19c 45c 32.3b 3.3b
NaCl60 26c 22d 50d 33.1b 3.1b
Cd0 32a 14a 38a 3a 4.0a
Cd2.5 32a 14a 36a 30b 3.8a
L
Cd5 33a 14a 36a 60c 3.8a
NaCl0 83a 2.1a 6.7a 6.4a 659a
NaCl20 76b 11.2b 31b 5.7a 637a
NaCl40 65c 16.5c 39c 5.7a 505b
NaCl60 64c 21.4d 48d 5.9a 426c
Cd0 72a 12.7a 32a 0.7a 540a
Cd2.5 73a 12.1a 29a 6.0b 535a
H
Cd5 73a 13.6a 32a 11.1c 544a
Means with the same letter are not significantly different at P≤0.05.
An addition of Na+ could decrease Cd sorption on soil particles, thus increasing its
readily available soil solution concentration. Furthermore, plant roots act as a barrier
against excessive uptake of many potentially toxic elements (Rengel, 2007). As a non-
essential element, Cd most probably enters root cells via uptake pathways for essential
cations that are similar to Cd, e.g. Zn, Fe and Ca (Clemens, 2006); selectivity for these
ions under NaCl stress could be strongly compromised (Muhling and Lauchli, 2003).
Furthermore, some researchers suggested that Cd chlorocomplexation is one of the
possible mechanisms for enhancing Cd uptake and accumulation in plants (McLaughlin
and Singh, 1999, and references therein). In the present study, concentration of
dissolved chloride ions in salt-affected soil treatments was more than sufficient (>10
mM) to allow formation of relatively stable Cd chlorocomplexes (Naidu et al., 1994).
Leaf accumulation of all observed metals exceeded their accumulation in fruit,
suggesting that the apoplast and the vacuoles of leaf cells may be the sites of

Vol. 37, 2009, Suppl. Cereal Research Communications
12
preferential cadmium accumulation. Higher root zone salinity did not enhance Cd
accumulation in radish hypocotyls, suggesting that radish has low capacity to
translocate Cd via phloem from developed leaves to fruits, and that phloem mobility of
this element in radish is relatively poor and unaffected by NaCl salinity.
Conclusions
NaCl-induced salt stress (expressed as reduced vegetative growth/yield and K
accumulation) was accompanied by increasing Na and Cl concentration in radish
tissues.
Cadmium uptake and leaf deposition was markedly enhanced by NaCl, whereas Cd
translocation and hypocotyl accumulation was up to 6-fold lower and not influenced by
NaCl salinity.
References
Clemens, S.: 2006. Toxic metal accumulation, responses to exposure and mechanisms of tolerance in plants.
Biochimie. 88: 11. 1707-1719.
Grattan, S.R. – Grieve, C.M.: 1999. Salinity mineral nutrient relations in horticultural crops. Sci. Hort. 78: 1-
4. 127-157. Helal, H.M. – Upenov, A. – Issa, G.J.: 1999. Growth and uptake of Cd and Zn by Leucaena leucocephala in
reclaimed soils as affected by NaCl salinity. Journal of Plant Nutrition & Soil Science-Zeitschrift fur
Pflanzenernahrung und Bodenkunde. 162: 2. 589-592.
Khoshgoftarmanesh, A.H. – Shariatmadari, H. – Karimian, N. – Kalbasi, M. – van der Zee SEATM.: 2006.
Cadmium and zinc in saline soil solutions and their concentrations in wheat. SSSAJ. 70: 2. 582-589.
McLaughlin, M.J. – Singh, B.R.: 1999. Cadmium in Soils and Plants. Kluwer Academic Publishers,
Dordrecht, The Netherlands.
Muhling, K.H. – Lauchli, A.: 2003. Interaction of NaCl and Cd stress on compartmentation pattern of cations,
antioxidant enzymes and proteins in leaves of two wheat genotypes differing in salt tolerance. Plant &
Soil. 253: 1. 219-231.
Naidu, R. – Bolan, N.S. – Kookona, R.S. – Tiller, K.G.: 1994. Ionic strength and pH effects on the sorption of
cadmium and the surface charge of soils. Eur. J. Soil Res. 45: 419– 429.
Ondrasek, G. – Romic, D. – Borosic, J. – Herak-Custic, M. – Romic, M.: 2008. Water consumption and
macronutrients leaching in tomato substrate growing. Cereal Research Communications. 36: 2. 967-970.
Ondrasek, G. – Romic, D. – Rengel, Z. – Romic, M. – Zovko, M.: 2009. Cadmium accumulation by
muskmelon under salt stress in contaminated organic soil. Sci. Total Environ.
doi:10.1016/j.scitotenv.2008.12.032. (In press).
Romic, D. – Ondrasek, G. – Romic, M. – Borosic, J. – Vranjes, M. – Petosic, D.: 2008. Salinity and irrigation
method affect crop yield and soil quality in watermelon (Citrullus lanatus L.) growing. Irrigation &
Drainage. 57: 4. 463-469.
Rengel, Z.: 2007. Cycling of micronutrients in terrestrial ecosystems. In: Marschner P, Rengel Z, editors.
Nutrient Cycling in Terrestrial Ecosystems. Springer-Verlag, Berlin, Germany, pp. 93-113.
SAS Institute.: 2001. SAS Institute Inc. SAS/STAT User's guide, Version 8-1.
Smolders, E. – McLaughlin, M.J.: 1996. Effect of Cl and Cd uptake by Swiss chard in nutrient solution. Plant
Soil; 179: 57–64.
Varallyay, G.: 2007. Soil resilience (Is soil a renewable natural resource?). Cereal Research Communications.
35: 2. 1277-1280.

VIII. Alps-Adria Scientific Workshop Neum, Bosnia-Herzegovina, 2009
DOI: 10.1556/CRC.37.2009.Suppl.2 13
ANALYSIS OF THE QUALITY OF WHEAT VARIETIES AT EXTREMELY HIGH TEMPERATURES
Krisztina BALLA – Ildikó KARSAI – Ottó VEISZ
Cereal Resistance Breeding Department, Agricultural Research Institute of the HAS, Martonvásár,
P.O. box 19, H-2462, e-mail: [email protected]
Abstract: Nowadays the abiotic stress factor that causes the greatest problems for crop production is
extremely high temperature. The aim of the research was to determine the heat tolerance of various wheat
varieties and to measure changes in their quality in two phases of development (shooting and grain filling)
under controlled phytotronic conditions. Changes in the yield quantity, the grain diameter, the protein content
and the ratio of protein components were examined in plants exposed to extremely high temperatures. It could
be seen from the results that in the earlier developmental phase the varieties were much more sensitive to heat
stress than in the adult stage. Heat stress during grain filling led to a significant reduction in yield parameters.
Decreasing values of UPP% (unextractable polymeric protein) and the Glu/Gli (glutenin to gliadin) ratio
generally indicate a deterioration in quality despite the increase in the protein content. The plants suffered heat
shock when treated at 41°C.
Keywords: winter wheat, heat stress, grain yield, protein content, glutenin/gliadin ratio
Introduction
High temperature is one of the most important abiotic environmental factors during
grain filling and may influence both the quantity and quality of the yield. High
temperature after anthesis causes a reduction in grain filling (Wardlaw and Moncur,
1995; Veisz et al., 2008), more rapid apoptosis and the earlier attainment of harvest
maturity (Altenbach et al., 2003). The severe yield losses are caused by a reduction in
the starch content, which makes up more than 65% of the dry weight of cereals
(Barnabás et al., 2008; Rakszegi et al., 2006; Yan et al., 2008). Reductions in grain
weight in response to stress in the early phases of grain filling could be due to a lower
number of endosperm cells (Nicolas et al., 1985), while a decrease in starch synthesis
during the later phases of grain filling could be caused by limited supplies of grain
assimilates (Blum, 1998) or by direct effects on the process of synthesis in the grain
(Yang et al., 2004). High temperature stress has a greater influence on starch
accumulation in the middle phase of grain filling than in the early phase (Yan et al.,
2008). Starch accumulation was found to be coordinated with the sucrose content of the
grain and with the activity of the enzymes sucrose synthase, AGPP (adenosine
diphosphate glucose pyrophosphorylase), SSS (soluble starch synthase) and SBE (starch
branching synthase), suggesting that low sucrose supplies and a drop in the activity of
the enzymes involved in starch synthesis are responsible for the decline in starch
accumulation. The accumulation of proteins also undergoes a change in response to heat
stress. The accumulation of proteins active in biosynthesis and the metabolism shifts in
favour of storage proteins and of those involved in defence against biotic and abiotic
stress factors. Specific protein responses depend on whether high temperature is
experienced during the early or middle phase of grain filling (Hurkman et al., 2009). It
has been proved that the protein content of grains exposed to heat stress after anthesis
rose significantly in response to the stress (Balla and Veisz, 2007; Labuschange et al.,
2008, in press). A reduction in the glutenin/gliadin ratio has a negative effect on flour
quality, despite the increase in protein content (Bencze et al., 2004). High temperature is
capable of causing substantial changes in the accumulation level of gluten proteins

Vol. 37, 2009, Suppl. Cereal Research Communications
14
during grain filling. Grains exposed to stress exhibited reductions in thousand-kernel
weight, diameter and starch content in response to the treatment (Labuschange et al.,
2008, in press). The data indicate that reduced grain yield and grain number may be
caused not only by post-anthesis stress but also by pre-anthesis stress. The most
sensitive phase proved to be stem elongation, while booting and anthesis were
moderately sensitive, and the phase between heading and anthesis was the least
sensitive (Ugarte et al., 2007). The present paper discusses the response of the yield to
heat stress in two different developmental stages in wheat varieties with different levels
of heat tolerance.
Materials and methods
The heat stress studies were carried out under controlled conditions in a climatic
chamber on two winter wheat varieties (Mv Mambó and Bánkúti 1201) in early and late
stages of development (at shooting in the 8th
week, and 12 days after heading). High
temperature treatment was applied for 15 days. In the control treatment the plants were
kept at day/night temperatures of 17/13°C in the shooting stage and 24/20°C in the adult
stage, while in the stress treatments the temperature was raised to 30/20°C in the case of
young plants and to 41/20°C for the adult plants (Tischner et al., 1997) The grain
number per plant, grain yield and thousand-kernel weight were recorded after harvest.
The protein content was determined using a Kjeltec Auto Sampler System 1035
Analyser (with a factor of N × 5.8). The weight and diameter of the grains were
measured with a Single Kernel Characterization System 4100. The total glutenin,
gliadin contents of the samples were determined using the SE/HPLC technique
according to the modified method of Batey et al. (1991). The unextractable polymeric
protein fraction (UPP %) was determined using the method of Gupta and MacRitchie
(1993). Two-factorial analysis of variance was used for the statistical evaluation of the
data (Kuti et al., 1998).
Results and discussion
High temperature caused the greatest changes in the grain yield, grain number and
thousand-kernel weight. Stress caused more drastic reductions in young plants (e.g.
grain yield decreased by 49–55%, grain number by 46–63%) than in older plants (e.g.
grain yield decreased by 32–49%, grain number by 6–17%). Heat stress at shooting led
to significant reductions in yield and grain number in both varieties (Figs. 1–2). Fifteen
days of heat stress during grain filling caused a significant decline in both grain weight
and grain diameter in Mv Mambó and Bánkúti 1201 compared with the control (Figs.
3–4). In young plants the two varieties responded differently, with a slight increase in
grain weight and diameter for Mv Mambó and a slight reduction for Bánkúti 1201
compared with the control. An analysis of grain quality revealed that in both
phenophases there was a significant increase in grain protein content in both varieties
(Figs. 3–4). The greatest change was caused by heat stress to young plants, which could
be attributed to a drastic decline in the yield per plant and the grain number as a
consequence of forced heading. The varieties responded differently to extremely high
temperature (41°C) during grain filling, with a greater increase in protein content in Mv
Mambó and a smaller rise in Bánkúti 1201. The relative increase in protein content after
heat stress at a late stage of development could be attributed to a reduction in grain

VIII. Alps-Adria Scientific Workshop Neum, Bosnia-Herzegovina, 2009
DOI: 10.1556/CRC.37.2009.Suppl.2 15
weight and grain diameter and to a drastic decline in the starch content (Barnabás et al.,
2008; Yan et al., 2008). However, the rise in the grain protein content in heat-stressed
plants did not lead to an improvement in grain quality, as quality analysis indicated the
unfavourable composition of the gluten proteins. There were exceptions, such as the
increase in the unextractable polymeric protein content (UPP %) and the Glu/Gli ratio in
Bánkúti 1201. A serious decline in the UPP % is associated with poorer breadmaking
quality, despite the higher protein content caused by heat stress. In most cases a
reduction in the glutenin/gliadin ratio is indicative of quality deterioration. There was a
drastic (significant) reduction in the glutenin/gliadin ratio in Mv Mambó in both young
and older plants, suggesting poorer quality, but the old Hungarian variety Bánkúti 1201
proved to be much more resistant. This variety only exhibited greater sensitivity to the
30°C stress at the shooting stage (lower Glu/Gli ratio, but higher UPP %).
Mv Mambó
0
20
40
60
80
100
120
Yield Grain number Thousand-kernel
weight
as a
% o
f th
e co
ntr
ol
Control Shooting stage 30°C Grain filling stage 41°C
Bánkúti 1201
0
20
40
60
80
100
120
Yield Grain number Thousand-kernel
weight
as
a %
of
the
con
tro
l
Control Shooting stage 30°C Grain filling stage 41°C
Figures 1-2. Changes in grain yield, grain number and thousand-kernel weight in response to heat stress
Mv Mambó
70
90
110
130
UPP% GLU/GLI
ratio
Protein
content
Grain mass Grain
diameter
as
a %
of
the
con
tro
l
Control Shooting stage 30°C Grain filling stage 41°C
Bánkúti 1201
70
90
110
130
UPP% GLU/GLI
ratio
Protein
content
Grain mass Grain
diameter
as
a %
of
the
con
tro
l
Control Shooting stage 30°C Grain filling stage 41°C
Figures 3-4. Changes in UPP % (unextractable polymeric protein), Glu/Gli (glutenin/gliadin) ratio, protein
content, grain mass and grain diameter in response to heat stress
Conclusions
The results proved that high temperature had a substantial effect on the final grain yield
and breadmaking quality when applied not only during grain filling, but also at
shooting. The drastic rise in the protein content in response to the treatments was not
associated with an improvement in yield quality, due to the unfavourable gluten protein
composition (reduction in Glu/Gli ratio or UPP%). The rise in the relative protein
content when high temperature was applied during the grain filling phase could be
explained by reductions in the thousand-kernel weight (28–37%), the grain mass (22–
29%) and the grain diameter (16–23%), while in the shooting stage it could be attributed

Vol. 37, 2009, Suppl. Cereal Research Communications
16
mainly to the drastic decline in the grain number and yield per plant (with a significant
increase in the thousand-kernel weight), probably due to a reduction in spikelet
differentiation, caused by the incorporation of protein rather than starch (Barnabás et al.,
2008; Yan et al., 2008).
Acknowledgements
This research was funded by the projects AGRISAFE (EU-FP7-REGPOT 2007-1, No.
203288) and K63369.
References
Altenbach, S. B. - DuPont, F. M. - Kothari, K. M. - Chan, R. - Johnson, E. L. - Lieu, D.: 2003. Temperature,
water and fertilizer influence the timing of key events during grain development in a US spring wheat.
Journal of Cereal Science, 37: 9-20.
Balla K. - Veisz O.: 2007. Changes in the quality of cereals in response to heat and drought stress. Acta
Agronomica Óvariensis, 49: 2. 451-455.
Barnabás, B. - Jäger, K. - Fehér, A.: 2008. The effect of drought and heat stress on reproductive processes in
cereals. Plant, Cell and Environment, 31: 11-38.
Batey, I. L. - Gupta, R. B. - MacRitchie, F.: 1991. Use of size-exclusion high-performance liquid
chromatography in the study of wheat flour proteins: an improved chromatographic procedure. Cereal
Chemistry, 68: 207-209.
Blum, A.: 1998. Improving wheat grain filling under stress by stem reserve mobilisation. Euphytica, 100: 77-
83.
Bencze, S. - Veisz, O. - Bedı, Z.: 2004. Effects of high atmospheric CO2 and heat stress on phytomass, yield
and grain quality of winter wheat. Cereal Research Communications, 32: 1. 75-82.
Gupta, R. B. - Khan, K. - MacRitchie, F.: 1993. Biochemical basis of flour properties in bread wheats. I.
Effects of variation in the quality and size distribution of polymeric protein. Journal of Cereal Science,
18: 23-41.
Hurkman, W. J. - Vensel, W. H. - Tanaka, C. K. - Whitehand, L. - Altenbach, S. B.: 2009. Effect of high
temperature on albumin and globulin accumulation in the endosperm proteome of the developing wheat
grain. Journal of Cereal Science, 49: 12-23.
Kuti, Cs. - Láng, L. - Bedı, Z.: 2008. Informatical background of field experiments. Cereal Research
Communications, 36: 171-174.
Labuschange, M. T. - Elago, O. - Koen, E.: 2008. The influence of temperature extremes on some quality and
starch characteristics in bread, biscuit and durum wheat. Journal of Cereal Science, xxx: 1-6. in press
Nicolas, M. E. - Gleadow, R. M. - Dalling, M. J.: 1985. Effect of postanthesis drought on cell-division and
starch accumulation in developing wheat grains. Annals of Botany, 55: 433-444.
Rakszegi, M. - Láng, L. - Bedı, Z.: 2006. Importance of starch properties in quality oriented wheat breeding.
Cereal Research Communications, 34: 637-640.
Tischner, T. - Rajkainé Végh, K. - Kıszegi, B.: 1997. Effect of growth medium on the growth of cereals in the
phytotron. Acta Agronomica Hungarica, 45: 187-193.
Ugarte, C. - Calderini, D. F. - Slafer, G. A.: 2007. Grain weight and grain number responsiveness to pre-
anthesis temperature in wheat, barley and triticale. Field Crops Research, 100: 240-248.
Veisz, O. - Bencze, Sz. - Balla, K. - Vida, Gy.: 2008. Change in water stress resistance of cereals due to
atmospheric CO2 enrichment. Cereal Research Communications, 36: 1095-1098.
Wardlaw, I. F. - Moncur, L.: 1995. The response of wheat to high temperature following anthesis. I. The rate
and duration of kernel filling. Australian Journal of Plant Physiology, 22: 391-397.
Yan, S. H. - Yin, Y. P. - Li, W. Y. - Li, Y. - Liang, T. B. - Wu, Y. H. - Geng, Q. H. - Wang, Z. L.: 2008.
Effect of high temperature after anthesis on starch formation of two wheat cultivars differing in heat
tolerance. Acta Ecologica Sinica, 28: 12. 6138-6147.
Yang, J. C. - Zhang, J. H. - Wang, Z. Q. - Xu, G. W. - Zhu, Q. S.: 2004. Activities of key enzymes in sucrose-
to-starch conversion in wheat grains subjected to water deficit during grain filling. Plant Physiology, 135: 1621-1629.

VIII. Alps-Adria Scientific Workshop Neum, Bosnia-Herzegovina, 2009
DOI: 10.1556/CRC.37.2009.Suppl.2 17
THE EFFECT OF FERTILIZATION ON THE YIELD OF SUNFLOWER HYBRIDS IN DIFFERENT CROPYEARS ON CHERNOZEM SOIL
László ZSOMBIK
Institute of Crop Sciences, Agronomy Faculty, University of Debrecen, e-mail: [email protected]
Abstract: As the number of hybrids requiring new and more intensive cultivation methods is growing, the
importance of fertilization has significantly increased in sunflower production; the determination of the exact
fertilizer need as a hybrid specific cultivation method is becoming more important. In 1999 the capability for
nutrient uptake of hybrids showed great differences, the control yield ranged between 3300-3600 kg ha-1. In
the case of Arena hybrids, the yield enhancing effect of fertilization was significant. Yield maximum was
achieved at 90 kg ha-1 N+PK dose by the examined hybrid. However, the fertilizer response curve of Pixel was distinct and decreased from N30+PK fertilizer dose. In the crop year of 2000 the control hybrids were
significantly different. From among the hybrids, the fertilizer response curve of Alexandra and Arena PR
reached the highest yield-level, however, the response on increasing fertilizer doses was much lower in 2000
than in the previous year. In 2001, the yield surplus attained with fertilization exceeded 1200 kg ha-1, the
average yield increase was 910 kg ha-1. These values lead to the conclusion that the fertilization effect was
significant. In 2008, hybrid NX 65001 reached the highest absolute surplus yield (1047 kg ha-1). At N30+PK
dose each hybrid reached the maximum yield. The depressive effect of nutrient increase had most significant
effect on hybrid NK Neoma, in the case of which the yield decrease started already at N60+PK fertilizer dose.
To summarize the results of the four years, we can conclude that on chernozem soil in different years the
nitrogen dose belonging to the yield maximum changes in the range of 30 to 90 kg/ha N+PK depending upon
the hybrid, higher fertilizer dose was applied in drier years.
Keywords: sunflower, fertilization, cropyear, yield surplus
Introduction
Sunflower has very good adaptation capacity (Bíró and Pepó, 2008; Mijic et al., 2008¸
Borbélyné Hunyadi et al., 2008). Since the number of sunflower hybrids requiring new
and more intensive hybrid specific production technologies is growing, the importance
of fertilization has increased. Out of the hybrid specific elements of production
technology, the determination of the exact fertilizer need is of high importance. The
extreme values of specific fertilizer needs of sunflower to produce 100 kg grain are 3.5-
6 kg N, 0.9-3.0 kg P and 4.5-18 kg K (Lásztity, 1983). However, on low fertility soil
high share of the demand has to be supplied by artificial fertilization (Harmati, 1992).
The suggestion of small fertilizer doses are supported by Kandil (1984), who claims that
sunflower better utilises lower fertilizer doses than higher fertilizer doses. In field trial
conducted on meadow soil N induced only low increase of the grain yield and oil yield,
at the same time it decreased the oil content (Harmati, 1993). Examining the influence
of increasing N doses Angelova (2001) found that between 60-120 kg ha-1
doses the
yield increase is only in weak correlation with the increase of N active agent content.
According to Pepó and Szabó (2005), Simic et al. (2008) the increase of fertilizer doses
entails the increased emergence of pest.
Materials and methods
The experiments were conducted on the Látókép Research Site of the University of
Debrecen Centre of Agricultural Sciences and Engineering between 1999 and 2008. The
soil of the research site is calcerous chernozem with good nutrient supplying capacity,

Vol. 37, 2009, Suppl. Cereal Research Communications
18
the depth of the humus profile is 80 cm. Soil pH is neutral (pH 6.4-7.3), KA number is
44. Table 1 shows the fertilization doses in the experiment.
Table 1. Fertilization doses in the experiment (Debrecen, 1999-2001)
N P2O5 K2O Treatment
kg ha-1 Control 0 0 0
1 30 22.5 26.5
2 60 45 53
3 90 67.5 79.5
4 120 90 106
5 150 112.5 132.5
PK fertilizer was applied in autumn, while 50-50% of the N was supplied in autumn and
spring. The harvested yields were calculated to 8% moisture content.
Results and discussion
In 1999 no significant difference was found among the natural capability for nutrient
uptake of the hybrids, which was probably due to the good nutrient supplying capability
and water management of the soil. The control yield representing the natural capability
for nutrient uptake was ranging between 3300-3600 kg ha-1
. Without fertilization hybrid
Alexandra gave the highest yield. This year the yield increasing effect of fertilization
was significant, which is represented by the rise of the curve. The yield increase caused
by fertilization exceeded 1000 kg ha-1
by hybrid Arena, which means that the hybrid
had good fertilizer response that year. The yield maximum was obtained at 90 kg ha-1
N+PK dose, however, the fertilizer response curve of Pixel is distinct, decreasing from
N30+PK dose. Good water management resulted in good fertilizer utilization. It could
have been the reason for the smaller difference between the fertilizer response of the
hybrids and the hybrid specific fertilizer requirements in 1999 (Figure 1).
1500
2000
2500
3000
3500
4000
4500
5000
5500
Kontroll N30+PK N60+PK N90+PK N120+PK N150+PK
treatments
Yie
ld (
kg
ha-1
)
Pixel Alexandra Opera Arena
Figure 1. The effect of increasing fertilizer doses on the yield of sunflower hybrids
(Debrecen, 1999)
In 2000, yields ranged between 1942-3343 kg ha-1
according to the hybrid and the
fertilizer dose. Significant difference was found among the control yield of hybrids. The

VIII. Alps-Adria Scientific Workshop Neum, Bosnia-Herzegovina, 2009
DOI: 10.1556/CRC.37.2009.Suppl.2 19
fertilizer reaction curve of Arena and Arena PR reached the highest yield level;
however, in 2000 the response to increasing fertilizer doses was much lower than the
earlier year. The yield increase of fertilization was less than 650 kg ha-1
at each hybrid.
The fertilizer levels representing the highest yields significantly varied that year, the
highest yield was obtained at 30 kg ha-1
N+PK dose by Pixel and Opera, at N60+PK
dose by Alexandra, while the maximum yield was obtained at 90 kg ha-1
N+PK dose by
Cergold, Arena and Arena PR (Figure 2).
1500
2000
2500
3000
3500
4000
4500
5000
5500
Kontroll N30+PK N60+PK N90+PK N120+PK N150+PK
treatments
Yie
ld (
kg
ha-1
)
Cergold Pixel Arena
Opera Alexandra Arena PR
Figure 2. The effect of increasing fertilizer doses on the yield of sunflower hybrids
(Debrecen, 2000)
In 2001, crop yields ranged between 2489-3960 kg -1
ha according to the hybrid and the
fertilizer level. The yield increase of fertilization exceeded 1200 kg ha-1
by hybrid
Opera, the average yield increase of hybrids was 910 kg ha-1
, which points to significant
fertilizer effect. The fertilizer level belonging to the highest yield was 90 kg ha-1
N+PK
except from hybrid Opera, at which highest yield was obtained at N60+PK fertilizer
dose (Figure 3).
1500
2000
2500
3000
3500
4000
4500
5000
5500
Kontroll N30+PK N60+PK N90+PK N120+PK N150+PK
treatments
Yie
ld (
kg
ha-1
)
Alexandra PR Arena PR Melody Opera PR
Figure 3. The effect of increasing fertilizer doses on the yields of sunflower hybrids
(Debrecen, 2001)
Crop yields ranged between 3260-5467 kg ha-1
in 2008. The highest yield increase of
fertilization was obtained by hybrid NX 65001 (1047 kg ha-1
). In each case, the
maximum yield was obtained at N30+PK dose by the hybrids. The yield depressing
effect of fertilizer increase was found highest at NK Neoma, at which yield decrease
already started at N60 +PK fertilizer dose (Figure 4).

Vol. 37, 2009, Suppl. Cereal Research Communications
20
1500
2000
2500
3000
3500
4000
4500
5000
5500
Kontroll N30+PK N60+PK N90+PK N120+PK N150+PK
treatments
Yie
ld k
gha-1
NK Alego NX 65001 NK Neoma NK Velti NK Combi
Figure 4. The effect of increasing fertilizer doses on the yield of sunflower hybrids
(Debrecen, 2008)
Conclusions
In 1999 the capability for nutrient uptake of hybrids showed great differences, the
control yield ranged between 3300-3600 kg ha-1
. Yield maximum was achieved at 90 kg
ha-1
nitrogen-phosphorus-potassium dose by the examined hybrid. However, the
fertilizer response curve of Pixel was distinct and decreased from N30+PK (nitrogen,
phosphorus, potassium) fertilizer dose. In the crop year of 2000 the control hybrids were
significantly different. From among the hybrids, the fertilizer response curve of
Alexandra and Arena PR reached the highest yield-level, however, the response on
increasing fertilizer doses was much lower in 2000 than in the previous year. In 2001,
the yield surplus attained with fertilization exceeded 1200 kg ha-1
, the average yield
increase was 910 kg ha-1
. In 2008 at N30+PK (nitrogen, phosphorus, potassium) dose
each hybrid reached the maximum yield. To summarize the results of the four years, we
can conclude that on chernozem soil in different years the nitrogen dose belonging to
the yield maximum changes in the range of 30 to 90 kg ha-1
(+PK) depending upon the
hybrid, higher fertilizer dose was applied in drier years.
References
Angelova, M. (2001): The impact of nitrogen fertilization on the yield of sunflower when grown on
calcareous black soil in North-West Bulgaria. Rastenievdni Nauki. 38. 1. 14-21.
Bíró, J. – Pepó, P. (2008): Study of genotype fertilizer responses in sunflower (Helianthus annuus L.)
production. Cereal Research Communications. 36. 727-730.
Borbélyné Hunyadi, É. – Csajbók, J. – Lesznyák, M (2008): Yield stability of sunflower (Helianthus annus)
varieties on chernosem soil. Cereal Research Communications. 36. 1711-1714.
Harmati I. (1993): Mőtrágyázás hatása a napraforgó termésére. Agrokémia és Talajtan 42. 3-4. 282-291.
Kandil, A. A. (1984): Response of some sunflower cultivars to different fertily levels. Journal Agronomy and
Crop Science 153. 6. 401-406.
Lásztity B. (1983): A mőtrágyázás hatása a napraforgó fejlıdésére és tápanyagforgálmára a tenyészidı
folyamán I. Szárazanyag-felhalmozás és tápanyagtartalom. Növénytermelés. 32. 2. 137-146.
Mijic, A – Krizmanic, M. – Liovic, I. – Maric, S. – Duvnjak, T. (2008): Influence of different soil types and
rainfall conditions on oil content in sunflower. Cereal Research Communications 36. 1327-1330.
Pepó, P. – Szabó, A (2005): Effect of agrotechnical and meteorological factors on yield formation in
sunflower production. Cereal Research Communications. 33. 1. 49-52.
Simic, B. – Cosic, J. – Popovic, R. – Vrandecic, K. (2008): Influence of climate conditions on grain yield and
appearance of white rot (Sclerotinis sclerotiorum) in field experiments with sunflower hybrids. Cereal
Research Communications 36. 63-66.

VIII. Alps-Adria Scientific Workshop Neum, Bosnia-Herzegovina, 2009
DOI: 10.1556/CRC.37.2009.Suppl.2 21
EVALUATION OF NUTRIENT SUPPLY AS ABIOTIC STRESSOR ON WINTER WHEAT TRITICUM AESTIVUM L. PERFORMANCE
Kornél D. SZALAY 1 – Ildikó FARKAS
2 – Dezsı SZALAY
3
1 Corvinus University, Budapest, 1118. Budapest, Villányi út 29-43., e-mail: [email protected] 2 Crop Production Institute, Szent István University, Gödöllı 3 Secretariat of the Hungarian Academy of Sciences
Abstract: Alföld 90 winter wheat variety was studied in agronomic replicated block treatments representing
organic and conventional plant nutrition. Organic versions have not recieved any mineral fertilisers, while
conventional blocks were supplied with identical 80 kg/ha N amounts in form of ammonium nitrate. Both
variants have been simultaneously treated with foliar fertiliser substances. Treated and untreated plots were
evaluated concerning plant height (cm), leaf area (cm2), ear size (cm), yield (kg/plot), germination (%), and
quality parametres – farinographic value, wet gluten content (%), protein (%). The preliminary results suggest,
that wheat crop performance was influenced by means of plant nutrition. Most of the parametres studied had
minor alterations only, however plant height, and ear size had consequent alterations of various levels of
significance. As a consequence it can be stated, that lack of nutrients should be considered as abiotic stressor
to crop plants. The magnitude and the mechanism of the influencing effects need to be cleared in further
experiments
Keywords winter wheat, organic farming, foliar fertilizer, nitrogen ferilizer, yield, quality
Introduction
Enviromental aspects and an ascending demand towards healthy alimentation became
more and more important in developed countries. People exposed to various stresses
that are related to the food they consume. Food should not be only healthy for them, but
the way of production of that must be healthy for the environment as well (Bingham et
al. 1985; Várallyay, 2004). These needs combine in the system of organic farming,
where an enviromentally sound technolgy is used to produce food without any synthetic
residues. These are called „ecological” or „organic” food (Roszík, Kovács, 2006). This
system has strict regulations, that do not permit the use of chemical fertilizers, as well as
using synthetic subtances in plant protection. Without these treatments, with the
application of those natural based nutrition and plant protection, the purpose is to
produce not quantitative, but qualitative food. In the conditions of the organic farming
the magnitude of the capability of resistance and the adaptibility of the species increase,
because in the organic way there is less possibility to support and defend the plant than
in a conventional way. Consequently the practical way is to start the plant improvement
under organic conditions to breed species for ecological farming specifically. The
organic way of breeding started with the most of the important horticultural and
agricultural plants, but to breed new species and introduce them in the organic farming
further years are needed (Roszík, Kovács, 2006). At the moment the possibility is to
choose varieties from conventional species according to their adaptive abilities to the
organic conditions. In the following trial we have studied the possibilities of growing in
organic way a winter wheat variety Alföld 90, that is widely used in conventional
systems, too.

Vol. 37, 2009, Suppl. Cereal Research Communications
22
Matherials and methods
Alföld 90 plots were sown on chernozem soil (calciustoll) at Hatvan- Nagygombos,
(Central Hungary), in the year of 2008. Split-split-plot design with four replications was
used. The wheat variety was planted with a row spacing 12 cm at a rate of five million
live seeds/ha. Experimental plot size was 1 m wide and 10 m long. In the trial we
separated two areas for the different ways of management systems. The first represented
the organic farming without fertilizers, while the other represented the conventional
farming with 80 kg/ha (36-0-0) ammonium nitrate broadcasted. Futhermore we
broadcasted different type of foliar fertilizers to the replicated blocks. Each of them are
licensed in the ecological farming too, except one (Folicare), that is permitted in
conventional farming only. The following table represents the treatments applied and
their codes. Table 1. Foliar fertilizer applications
Blocks No fertilizer Blocks With feritlizer
4 Biomit Plussz E1 4 Biomit Plussz + 80 kg/ha N C1
4 Bioplasma Cu E2 4 Bioplasma Cu +80 kg/ha N C2
4 C-komplex E3 4 C-komplex +80 kg/ha N C3
4 Hungavit G E4 4 Hungavit G +80 kg/ha N C4
4 Natur Biokál 01 E5 4 Natur Biokál 01 + 80 kg/ha N C5
4 Folicare 19-11-24 Cu E6 4 Folicare 19-11-24 Cu + 80 kg/ha N C6
4 Kontroll E0 4 Kontroll + 80 kg/ha N C0
28 "ECOLOGICAL” E 28 "CONVENTIONAL" C
The winter wheat variety Alföld 90 (1987) is a quality whinter wheat in Hungary. Until
the year of 2002, Alföld 90 was a quality standard among the early winter wheat
maturity group in Hungary. The difference generated by the impact of various nutrition
levels were studied concerning yield (kg/plot), leaf area (cm2), plant height (cm), ear
size (cm), germination (%) and the quality parameters as protein (%), wet gluten content
(%) and farinographic value.
Results and discussion
The statistical evaluation of the yield and leaf area did not show any difference neither
between the foliar fertilizer, nor between the nitrogen fertilizer treatments. The data of
the yield are summarized in Figure 1. The means of the leaf areas are illustrated by
Figure 2.
0
1
2
3
4
5
6
7
8
9
10
Mean (kg/plot)
0 1 2 3 4 5 6
Foliar fertilizer treatment
Yield
E
C
21
22
23
24
25
26
Mean (cm2)
0 1 2 3 4 5 6
Foliar fertilizer treatment
Leaf area
E
C
Figure 1. Figure 2.

VIII. Alps-Adria Scientific Workshop Neum, Bosnia-Herzegovina, 2009
DOI: 10.1556/CRC.37.2009.Suppl.2 23
Studying plant height and the ear size we found connection at a certain level of
significance, that reveals N-fertilized wheat’s rate of the ear size and plant height
became smaller, than the untreated parallel’s. In case of foliar fertilizers we dindn’t find
any relation. The comparison of the rates is illustrated in Figure 3. Statistically the rate
of germination (Figure 4) was not influenced by the different nutrition levels.
7,4
7,5
7,6
7,7
7,8
7,9
8
8,1
(%)
0 1 2 3 4 5 6
Foliar fertilizer treatment
Height and
Ear rate
E
C
94
95
96
97
98
99
100
(%)
0 1 2 3 4 5 6
Foliar fertilizer treatment
Germination
E
C
Figure 3. Figure 4.
In quality parameters as the protein (Figure 5), wet gluten content (Figure 6) and the
farinographic value (Figure 7) we found strong statistically proved correlation with the
effect of ammonium-nitrate broadcasted. As a result of the treatment all three values
decreased significantly. Correspondences above are represented in figures, the data are
contrasted in Table 2.
0
2
4
6
8
10
12
14
16
18
(%)
0 1 2 3 4 5 6
Foliar fertilizer treatment
Protein
E
C
0
5
10
15
20
25
30
35
40
45
(%)
0 1 2 3 4 5 6
Foliar fertilizer treatment
Wet gluten
E
C
Figure 5. Figure 6.
Figure 7.
0
10
20
30
40
50
60
70
80
value
0 1 2 3 4 5 6
Foliar fertilizer treatment
Farinographic
value
E
C

Vol. 37, 2009, Suppl. Cereal Research Communications
24
Table 2. Comparison of organic and conventional treatments
Protein (%) Wet gluten (%) Farinographic value
Treatment E C E C E C
0 15,0 14,4 34,1 32,4 64,2 56,4
1 14,8 13,8 33,4 31,0 58,7 50,4
2 15,7 13,4 36,0 30,0 67,2 53,2
3 15,8 13,7 37,3 30,5 67,0 60,8
4 15,7 14,3 36,8 33,0 72,5 48,8
5 16,1 14,7 40,1 35,2 65,4 58,3
6 15,7 13,7 37,2 30,1 63,1 51,6
Conclusions
The correlations obtained show intense contrast in expected influence of ammonium-
nitrate fertilizer broadcasted, known as quantity and quality improvement. The
homogenous experimental area, the extremely rainy weather’s modifiing effect and the
low nutrient demand of the Alföld 90 variety can explain the diverse results. According
to these values, this winter wheat variety is specifically appropriate for the conditions of
organic farming. Nevertheless with a purpose of clearing the connections in nutrition
and to rule out the impact of the wheather, further data and continuation of the trial is
required (Szalay et al 2007; Szalay et al 2008; Varga et al 2007).
Acknowledgements
Authors would express their thanks for the financial support received from the
Hungarian Academy of Sciences, the Corvinus University, Budapest, Szent István
University, Gödöllı. Also we would like to say thanks to the Agrogén Ltd for the
technical contributions.
References
Bingham, J., Blackman, J.A., Newman, R. 1985: Wheat. National Seed Development Organization Ltd.
Cambridge.
Móroczné Salamon K., Roszík P., Kovács G. 2008: Organikus nemesítéső kukorica hibridek
teljesítményvizsgálata eltérı termesztési feltételek között. XIV. Növénytermesztési Tudományos Napok,
MTA Budapest, 103p.
Országos Mezıgazdasági Minısítı Intézet, Kalászos gabonák, Minısített fajták kísérleti eredményei, Leíró
fajtajegyzék Budapest, 1995 14 p.
Roszík G. – Kovács G. 2006: Általános tudnivalók az organikus gazdálkodásról. In: Kalászos Gabonafélék
ökológiai termesztése és nemesítése. Eds: Bezı Z. – Kovács G. Agroinform Kiadó Budapest. 11-24 pp.
Szalay D. – Klupács H. 2007: Quality benefits and failures induced by agronomic treatments in wheat crop.
Cereal Research Communications, 35.2. 1141-1144 pp.
Szalay D. -Szalay K. D., -Farkas I., 2008. Grain quality- a soil plant indicator, Alps-Adria Scientific
Workshop, Slovakia.
Várallyay, Gy. 2004: Eurosoil 2004. Agrokémia és Talajtan. 53: 3-4. 433-438. Varga B. – Svečnjak Z. – Jurković Z. – Pospišil M.: 2007. Quality responses of winter wheat cultivars to
nitrogen and fungicide applications in Croatia. Acta Agronomica Hungarica, Vol. 55: 1. 37-48.

VIII. Alps-Adria Scientific Workshop Neum, Bosnia-Herzegovina, 2009
DOI: 10.1556/CRC.37.2009.Suppl.2 25
EFFECT OF ABIOTIC STRESS ON FIELD PERFORMANCE OF MAIZE HYBRIDS
Tamás SPITKÓ – János PINTÉR – Beáta BARNABÁS
Agricultural Research Institute of the Hungarian Academy of Sciences
H-2462 Martonvásár, Brunszvik u 2.; e-mail: [email protected]
Abstract: Cultivated plants during the vegetation period are exposed to various abiotic stress factors (such as
chill, drought, storm in addition to undesirable soil effects). The main task, from a breeding point of view, is
the development of genotypes with better adaptability to environment conditions and soil properties.
Irrespective of weather the hybrids are developed via conventional or biotechnological means, it is these traits
that determine whether the new genotype prove satisfactory in commercial cultivation. To define the main
stress factors in our experiment twenty-two maize hybrids developed from doubled haploid inbred lines were
tested at three locations (Martonvásár: in loamy chernozem soil, Szarvas: in clay-loam chernozem,
Mezıkövesd: in clay-loam meadow soil) in three years (2006: wet; 2007: dry; 2008: changeable). For the
majority of the maize hybrids in the present multilocation trials, the yields achieved did not satisfy breeding
criteria. Nevertheless, it proved possible to identify one hybrid combination whose performance was on par
with that of commercial hybrids, despite the limited number of initial materials, which represented a
genetically narrow spectrum. The hybrid combinations tested in the present work were at most equal, but not
exceeding the standard mean. The environmental stress factors had different influence for the yield and grain
moisture content of the hybrids examined.
Keywords: abiotic stress, drought, maize, field performance
Introduction
Plants are extremely sensitive to changes, and do not generally adapt quickly. Plants
also adapt very differently from one another, even from a plant living in the same area.
When a group of different plant species was prompted by a variety of different stress
signals, such as drought or cold, each plant responded uniquely. Abiotic stress factors
exerting the most decisive effect on maize yield are soil–plant interaction, quantity and
distribution of annual rainfall and temperature during the critical late June–early July
period. In years with favourable water supply, maize hybrids have a yield of 8-10 t·ha-1
,
while in dry ones it amounts to only 3-4 t·ha-1
(Nagy, 2006). The yield fluctuation can
be reduced by ensuring adequate tillage as well as water and nutrient supplies (Nagy,
2007). The main task, from a breeding point of view, is the development of genotypes
with better adaptability to environmental conditions and soil properties. Irrespective of
whether the hybrids are developed via conventional or biotechnological means, it is
these traits that determine whether the new genotype will prove satisfactory in
commercial cultivation. This is also true of maize hybrids involving DH parental
components, whether they were developed by in vitro tissue culture or in vivo methods.
DH lines produced by laboratory methods are utilised for favourable morphological and
agronomical traits during several years of per se selection (Barnabás et al., 2005). A
number of lines selected in this way were tested for their field performance in the
present experiments.
Materials and methods
Twenty-two maize hybrids compared to standards were tested at three locations
(Martonvásár, Szarvas, Mezıkövesd) in three years (2006-2008) in a randomised
performance trial (with three replications) on different soil types with varying rainfall

Vol. 37, 2009, Suppl. Cereal Research Communications
26
supply. The soil types were as follows: loamy chernozem with lime deposits and good
water supplies (Martonvásár), clay-loam chernozem (Szarvas) and clay-loam meadow
soil subject to rapid drying (Mezıkövesd). Ten DH lines were developed via in vitro
plant regeneration from microspores (Spitkó et al., 2006). At their origin lies an exotic
Chinese line with good DH induction ability and Iodent-type Martonvásár inbred lines
with commercial value. The DH lines were developed in such a way that the
commercial lines were present in various ratios (F1 and BC1 combinations). The testers
were Martonvásár sister line crosses (SLC) of Iodent (ISLC), Lancaster (LSLC) and
Iowa Stiff Stalk Synthetic (ISSLC) origin, together with a fourth SLC tester not related
to any of the above (NRSLC). FAO 390 and FAO 450 standards were included in the
experiment. The traits evaluated included grain yield (t·ha-1
) and grain moisture at
harvest (%). Yield data were converted to 15% grain moisture content and subjected to
three-way (genotype, year and location) analysis of variance (Sváb, 1981).
Results and discussion
In present study three-locational data collected over three years were compared to the
standard yields (Table 1). The grand mean of yield (8.89 t·ha-1
) was significantly lower
than the standard mean (9.78 t·ha-1
), but one combination (DH56×NRSLC: 9.94 t·ha-1
)
was found which did not differ significantly (LSD5%=0.30 t·ha-1
) from the mean of the
commercial hybrids. The yield of this genotype was comparable to the standard mean in
both years at all locations (2006: 11.13 t·ha-1
vs. standard mean: 11.46 t·ha-1
; 2007: 7.77
t·ha-1
vs. standard mean: 7.98 t·ha-1
). However, this yield was coupled with a mean grain
moisture content at harvest of 20,11%, which was significantly higher than the standard
mean: 18.49 % (LSD5%=0.51 %, the grand mean for the moisture was 19.61 %).
Table 1. Field performance of hybrids and standards (Martonvásár-Szarvas-Mezıkövesd; 2006-2008)
Hybrids Yield (t⋅⋅⋅⋅ha-1) Moisture (%) Hybrids Yield (t⋅⋅⋅⋅ha-1) Moisture (%)
DH56*NRSLC 9.94 20.11 DH64*ISSLC 8.77 20.39
ST FAO 450 9.83 20.31 DH31*LSLC 8.74 21.46
ST FAO 390 9.73 16.68 DH141*NRSLC 8.73 20.47
DH 136*LSLC 9.48 20.06 DH53*NRSLC 8.72 19.54
DH 136*NRSLC 9.34 22.51 DH64*NRSLC 8.72 20.35
DH31*ISLC 9.09 20.16 DH141*ISLC 8.55 17.57
DH64*NRSLC 9.02 20.35 DH384*ISLC 8.52 18.14
DH141*LSLC 9.01 19.21 DH105*ISLC 8.52 17.91
DH136*ISLC 9.00 19.60 DH143*ISSLC 8.41 20.49
DH53*ISSLC 8.98 19.68 DH56*ISLC 8.39 17.23
DH57*NRSLC 8.96 21.37 DH384*ISSLC 8.17 19.49
DH143*NRSLC 8.95 20.83 DH57*ISLC 8.01 19.07

VIII. Alps-Adria Scientific Workshop Neum, Bosnia-Herzegovina, 2009
DOI: 10.1556/CRC.37.2009.Suppl.2 27
Hybrids with DH parental components were more similar to the FAO 450 standard,
having a longer vegetation period and higher grain moisture content at harvest, but in
most cases grain yield did not come up to expectations. With respect to hectolitre mass,
the standard mean and the grand mean did not differ significantly, indicating that most
of the combinations satisfied the 71 kg·hl-1
requirement (data not shown). However,
hectolitre mass is a relative index, which does not reflect the real value of a hybrid
combination. Almost two-thirds of the genotypes tested had values higher than the limit,
whereas one of the standards did not satisfy this criterion in either year (FAO 450:
69.48 kg·hl-1
), confirming that hybrids giving outstanding general performance in
previous years may also have low hectolitre masses. The differences in yield and grain
moisture at harvest over years and locations are presented in Figure 1.
Figure 1. Yield and moisture differences between years and soil types
(LSD5%: 0.09 for yield; LSD5%:0.18 for moisture)
The yield in 2006 and 2008, which were favourable for maize production, were more
than half more than that achieved in 2007. The considerable differences in mean
summer temperature and rainfall in the three years (data not shown) resulted in
substantial yield variations. The rapid drying down of the plants and the rainfall
deficiency in 2007 led to faster withering, so the grain moisture at harvest was lower in
the second year. The heat wave, with temperatures of 40-42°C for several consecutive
days, experienced during maize flowering in 2007 had a negative effect on pollen
production and on their viability. The pollen production of inbred maize lines is greatly
influenced by the genotype and year (Rácz et al., 2006). This suggests that yield losses
in 2007 were due not only to the drying out of the soil, but to an even greater extent by
the atmospheric drought at flowering. The effect of the location (soil) on the yield and
moisture content is demonstrated in the last three pairs of columns of Figure 1. The
better seed setting and higher yield averages achieved on the moderately heavy
chernozem soils at the excellent maize-growing locations in Martonvásár and Szarvas
could be attributed in part to their good water management. The rapid drying out of the
otherwise high-quality meadow alluvial soil in Mezıkövesd resulted in yield losses of
25-30% for the given combinations.

Vol. 37, 2009, Suppl. Cereal Research Communications
28
Conclusions
The environmental stress factors have different influence for the yield, grain quality and
moisture content of the hybrids. For instance, more starch is incorporated at wetter
locations (higher yield), while the protein and oil content is significantly lower (Hegyi
et al., 2007). The results suggested that the differing water retention traits of loam and
clay soils are of particular importance when weather conditions are unfavourable for
maize production. From the point of view of breeding, combinations found in
performance trials at multiple locations to have excellent yield stability can be
recommended for general cultivation. The interactions between these two factors,
together with the joint resultant of the year will determine the actual maize yield
average that can be achieved in a given year. For the majority of the maize hybrids
examined in the present multilocation trials, all of which had DH parental components,
the yields achieved did not satisfy breeding criteria. Nevertheless, it proved possible to
identify one hybrid combination whose performance was on par with that of commercial
hybrids, despite the limited number of initial materials, which represented a genetically
narrow spectrum. This result is significant not because the given combination
outyielded the standard (from this point of view none of the hybrids would be granted
registration), but because of the origin of the lines. The DH lines used in the
combinations not only had satisfactory combining ability, but also retained the haploid
induction ability of the Chinese partner suggesting that they could be used for the
development of in vitro DH lines with real commercial value. The DH hybrid
combinations tested in the present work were at most equal, but not exceeding the
standard mean, but if the studies are extended to include a wider range of genetic
sources, the in vitro DH technique could be utilised for the purposes of hybrid
development.
Acknowledgements
This research work was supported by Jedlik Ányos Grant (Project number:
KUKBOGMV OM00063/2008) of NKFP.
References
Barnabás B., Spitkó T., Jäger K., Pintér J., Marton L.C. 2005: Strategy for improvement of doubled haploid
production in maize. Acta Agronomica Hungarica, 53 (2) pp. 177-182
Hegyi Z., Pók I., Szıke C. and Pintér J. (2007): Chemical quality parameters of maize hybrids in various FAO
maturity groups as correlated with yield and yield components; Acta Agronomica Hungarica, 55 (2) pp.
217–225
Nagy J. 2006: A vízellátás hatása a korai (FAO 300-399) éréscsoportba tartozó kukorica (Zea mays L.) hibridek termésére öntözés nélküli termesztésben; Növénytermelés, 55: 1-2, 103-112. (in Hungarian)
Nagy J. 2007: Evaluating the effect of year and fertilisation on the yield of mid ripening (FAO 400-499)
maize hybrids, Cereal Research Communications 35 (3) 1497-1507
Rácz F., Hídvégi S., Záborszky S., Pál M., Marton L. C. 2006: Pollen production of new generation inbred
maize lines; Cereal Research Communications, 34: 1. 633-636.
Spitkó T., Sági L., Pintér J., Marton L.C., Barnabás B. 2006: Haploid induction capacity of maize (Zea mays L.) lines of various origin and of their hybrids. Maydica 51: 537-542.
Sváb J. 1981: Biometrical Methods in Research Work. Mezıgazdasági Kiadó, pp. 158-186 (in Hungarian)

VIII. Alps-Adria Scientific Workshop Neum, Bosnia-Herzegovina, 2009
DOI: 10.1556/CRC.37.2009.Suppl.2 29
EFFECTS OF WATER SUPPLY AS AN ABIOTIC STRESS ON THE YIELDS AND AGRONOMIC TRAITS OF WINTER WHEAT (Triticum aestivum L.) ON CHERNOZEM SOIL
Peter PEPÓ
Institute of Crop Sciences, Agronomy Faculty, University of Debrecen, H-4032 Debrecen, Böszörményi str.
138. e-mail: [email protected]
Abstract: The effects of different water supply cropyears (2007 year=dry, with water stress; 2008
year=optimum water supply) on the yields and agronomic traits of wheat in different crop models (crop
rotation, fertilization, irrigation) were studied. In non-irrigated treatment the maximum yields of winter wheat
were 5590 kg ha-1 in biculture (maize-wheat) and 7279 kg ha-1 in triculture (peas-wheat-maize) in 2007 year
characterized by water-deficit stress. In 2008 (optimum rain amount and distribution) the maximum yields
were 7065 kg ha-1 (biculture) and 8112 kg ha-1 (triculture) in non irrigated conditions. In water –deficit stress
cropyear (2007 year) the yield-surpluses of wheat were 2245 kg ha-1 (biculture) and 1213 kg ha-1 (triculture),
respectively. The nutrient utilization of wheat was modified by abiotic (water) and biotic (leaf – and stem –
diseases) stress. The fertilization surpluses of wheat were 2853-3698 kg ha-1 (non- irrigated) and 3164-5505
kg ha-1 (irrigated) in a dry cropyear (2007) and 884-4050 kg ha-1 (non-irrigated) and 524-3990 kg ha-1
(irrigated) in an optimum cropyear (2008). The optimum fertilizer doses varied N150-200+PK in biculture and
N50-150+PK in triculture depending on cropyear and irrigation. The abiotic stress (water deficit) influenced the
agronomic traits (diseases, lodging) of winter wheat. The optimalization of agrotechnical elements provides
7,8-8,5 t ha-1 yields in dry cropyear and 7,1-8,1 t ha-1 yields of wheat in good cropyear, respectively.
Keywords: winter wheat, abiotic stress, agronomic traits, yields
Introduction
In wheat production, yield quantity and the different agronomic traits are equally
determined by ecologic (weather, soil), biological (genotype) and agrotechnical (crop
rotation, nutrient supply, water supply, plant protection) factors. From these factors the
abiotic (weather, nutrient- and water-supply) and biotic (diseases, pests, weeds) are
especially important. According to SZÁSZ (2002) the frequency of dry cropyears
increased from 22,5 % to 52,6 % in Hungary in the last 150 years. The results of
OLSEN and BINDI (2002), BIRKÁS et al. (2006), VÁRALLYAY (2007), BALOGH
and PEPÓ (2008) showed that as a result of global climate change the yield of crops
have dropped and yield fluctuation has increased. To a certain extent, the unfavourable
abiotic stress effects (weather) can be reduced by appropriate variety selection and
optimum use of agrotechnical factors. Among agrotechnical elements the optimum
nutrient- and water supply (JOLÁNKAI 1982, PEPÓ 2002a, FOWLER 2003, PEPÓ
2007) and crop rotation (HORNOK 2008) have outstandingly high importance.
Materials and methods
Our long-term experiment was set up in 1983 on chernozem soil on the Látókép
Research Station of the University of Debrecen in the Hajdúság region (Eastern
Hungary). The following factors were examined in the long-term experiment:
- crop rotation: biculture (maize, wheat), triculture (pea-wheat-maize)
- fertilization: control, N = 50 kg ha-1
P2O5 = 35 kg ha-1
, K2O = 40 kg ha-1
, and
2-3-4 folds of this dose
- irrigation: irrigated and non irrigated (2007 = 100 mm; 2008 = 0 mm)
treatments

Vol. 37, 2009, Suppl. Cereal Research Communications
30
The weather was significantly different in the two examined years (Table 1). Compared
to the many-year average, the weather in 2007 was warm, dry and specifically draughty,
while in 2008 it was nearly optimal for wheat production (Table 1).
Table 1. Meteorological data of vegetation period
OctoberNovember December JanuaryFebruary March April May June
Average
Total
Temperature (oC)
30 year average 10,3 4,5 -0,2 -2,6 0,2 5,0 10,7 15,8 18,7 6,9
2007. year 11,3 6,2 2,2 3,7 4,1 9,1 12,6 18,4 22,2 10,0
2008. year 9,7 3,5 -0,6 1,0 3,0 6,2 11,4 16,8 20,6 8,0
Rainfall (mm)
30 year average 30,8 45,2 43,5 37,0 30,2 33,5 42,4 58,8 79,5 400,9
2007. year 22,9 9,2 5,0 23,9 53,2 14,0 3,6 54,0 22,8 208,6
2008. year 71,4 40,9 29,8 26,4 4,6 41,7 74,9 47,6 140,1 477,4
Results and discussion
The yields of winter wheat in 2007 and 2008 well reflect the weather stress effects and
the interrelation of those agrotechnical factors which modify (decrease or increase) it
(Table 2). The dry cropyear of 2007 had unfavourable effect on the vegetative and
generative growth and yield formation of winter wheat. The stress caused by the
unfavourable dry cropyear could significantly be decreased by optimal use of
agrotechnical factors. In the dry cropyear of 2007 among agrotechnical factors the
irrigation, fertilization and crop rotation had significant influence on the yields of wheat.
In 2007 the yields of wheat ranged between 1892-5590 kg ha-1
(non-irrigated) and
between 2330-7835 kg ha-1
(irrigated) in biculture, and between 4426-7279 kg ha-1
(non-irrigated) and 5328-8492 kg ha-1
(irrigated) in triculture, respectively. Our results
Table 2. The effects of cropyears and agrotechnical elements on the yields of winter wheat
(Debrecen, 2007-2008, chernozem soil)
2007 2008
Treatments Non irrigated Irrigated Non irrigated Irrigated
Biculture
Ø 1892 2330 3015 2892
N50+PK 3420 4002 5043 4870
N100+PK 5048 5932 6260 6517
N150+PK 5590 6926 7065 6882
N200+PK 5205 7835 6772 6585
Triculture
Ø 4426 5328 7228 7350
N50+PK 6273 7012 8112 7874
N100+PK 6913 8492 6346 6108
N150+PK 7279 8016 6036 6242
N200+PK 6842 7582 5440 5149
LSD5% 872

VIII. Alps-Adria Scientific Workshop Neum, Bosnia-Herzegovina, 2009
DOI: 10.1556/CRC.37.2009.Suppl.2 31
proved that in dry cropyear (2007) the yield increasing effect of irrigation itself was
extremely moderate without sufficient nutrient supply. In 2007 in the control treatment
(abiotic stress caused by nutrient deficiency) the yield increase generated by irrigation
was moderate and ranged between 438 kg ha-1
(biculture) and 902 kg ha-1
(triculture).
Contrary, in the optimal NPK treatment the yield increase by irrigation was significantly
higher. The yield increase caused by irrigation was 2630 kg ha-1
in biculture (after
maize forecrop which had higher water uptake) and 1579 kg ha-1
in triculture (after pea
forecrop that has lower demand for water).
438902
2630
1579
122-123 -183 -238
-1000
0
1000
2000
3000
4000
5000
6000
Bic
ult
ure
Tri
cult
ure
Bic
ult
ure
Tri
cult
ure
Bic
ult
ure
Tri
cult
ure
Bic
ult
ure
Tri
cult
ure
Ø Nopt+PK Ø Nopt+PK
Yie
ld s
urp
lus
kg
ha-1
2007. year 2008 year
Figure 1. The effect of irrigation on the yield surpluses of winter wheat
(Debrecen, 2007-2008)
3698
5505
28533164
4050 3990
884524
0
1000
2000
3000
4000
5000
6000
non
irrigated
irrigated non
irrigated
irrigated non
irrigated
irrigated non
irrigated
irrigated
2007. year 2008. year
Yie
ld s
urp
lus
kg h
a-1
Biculture Triculture Biculture Triculture
Figure 2. The effect of fertilization on the yield surpluses of winter wheat
(Debrecen, 2007-2008)
The yield increasing effect of fertilization and the optimal fertilizer dose were equally
influenced by cropyear, crop rotation and irrigation (Figure 2). Compared to the control
treatment, the yield surpluses of the optimal NPK dose treatment in 2007 were 3698 kg
ha-1
(non-irrigated) and 5505 kg ha-1
(irrigated) in biculture, while the yield surpluses
were significantly lower in triculture, 2853 kg ha-1
in non-irrigated treatment and 3164

Vol. 37, 2009, Suppl. Cereal Research Communications
32
kg ha-1
in irrigated treatment, respectively. In 2008 irrigation was not applied, so the
crop rotation determined the yield increase caused by fertilization. This year the yield
increase caused by fertilization was 4050 kg ha-1
(non-irrigated) and 3990 kg ha-1
(irrigated) in biculture and 884 kg ha-1
(non-irrigated) and 524 kg ha-1
(irrigated) in
triculture, respectively.
Conclusions
The effect of cropyear as abiotic stress on winter wheat was studied on chernozem soil
in long-term experiment in 2007 and 2008. In dry year (2007) in non-irrigated
circumstances the maximum yields of winter wheat were 5590 kg ha-1
in biculture, 7279
kg ha-1
in triculture, while in the cropyear with favourable water supply (2008) the
maximum yields were 900-1500 kg ha-1
higher (7065 kg ha-1
in biculture, 8112 kg ha-1
in triculture). In dry cropyear (2007) in biculture the N150-200+PK and in triculture the
N100-150+PK treatments proved to be optimal, while in the cropyear with favourable
water supply the N150+PK (biculture) and N50+PK fertilization treatments proved to be
optimal, respectively.
Our long-term experiments proved that by harmonizing the optimal agrotechnical
factors (irrigation, crop rotation, fertilization) even in unfavourable, dry cropyears
(abiotic stress effect) similar yield can be obtained (8500 kg ha-1
in triculture, with
irrigation in the N100+PK treatment) as in the cropyear with favourable water supply
(8100 kg ha-1
in triculture, with no irrigation in the N50+PK treatment). The negative
effects of unfavourable cropyear, the aboitic stress can be reduced and even eliminated
however it needs extremely intensive agrotechnical management and high inputs.
References
Balogh Á. – Pepó P. (2008): Cropyear effects on the fertilizer responses of winter wheat (Triticum aestivum
L.) genotypes. Cereal Research Communications, 36. 3. 731-734.
Birkás M. – Dexter A.R. – Kalmár T. – Bottlik L.: 2006. Soil quality – soil condition – production stability.
Cereal Research Communications, 34. 1. 135-138.
Fowler D.B.: 2003. Crop nitrogen demand and grain protein concentration of spring and winter wheat.
Agronomy Journal, 95. 2. 260-265.
Hornok M. (2008): Effects of the most important agrotechnical elements on the yield of winter wheat. Cereal
Research Communications, 36. 3. 1243-1246.
Jolánkai M.: 1982. İszi búzafajták tápanyag- és vízhasznosítása (Kandidátusi értekezés).
Olesen J.E. – Bindi M.: 2002. Consequences of climate change for European agricultural productivity, land
use and policy. European Journal of Agronomy, 16. 4. 239-262.
Pepó P.: 2002a. Az ıszi búza fajtaspecifikus tápanyagellátása csernozjom talajon. Ed: Pepó-Jolánkai:
Integrációs feladatok a hazai növénytermesztésben. MTA, Budapest. 105-110.
Pepó P.: 2007. The role of fertilization and genotype in sustainable winter wheat (Triticum aestivum L.)
production. Cereal Research Communications, 35. 2. 917-920.
Szász G.: 2002. Meteorológia mezıgazdáknak, kertészeknek, erdészeknek. Mezıgazda Kiadó, Budapest.
Várallyay Gy.: 2007. Láng I., Csete L. és Jolánkai M. (szerk): A globális klímaváltozás: hazai hatások és
válaszok (A VAHAVA Jelentés). Agrokémia és Talajtan, 56. 1. 199-202.

VIII. Alps-Adria Scientific Workshop Neum, Bosnia-Herzegovina, 2009
DOI: 10.1556/CRC.37.2009.Suppl.2 33
EFFECT OF CONTROLLED RELEASE FERTILIZER ON STRESS ENZYME ACTIVITY OF CUCUMBER TRANSPLANTS
Attila OMBÓDI 1 – Noémi KOCZKA
1 – Attila HEGEDŐS
2 – Masahiko SAIGUSA
3
1 Institute of Horticultural Technology, Faculty of Agricultural and Environmental Sciences, Szent István
University, H-2103 Páter K. str. 1. Gödöllı Hungary, e-mail: [email protected] 2 Department of Applied Chemistry, Faculty of Food Science, Corvinus University of Budapest 3 Bioresearch Center, Toyohashi University of Technology
Abstract: The objective of this study was to investigate the effect of controlled release fertilizer (CRF) on the
activity of three antioxidant enzymes in cucumber transplants. Three treatments - a 125 mg N/l and a 250 mg
N/l basal application level, and a 125 mg N/l level complemented by four sidedressings to 250 mg N/l – were
carried out either using a CRF, or a readily available fertilizer (RAF). Activity of guaiacol peroxidase,
ascorbate peroxidase and glutathione reductase were measured from the roots and the youngest leaves three
times during the raising period. Salt levels of the pot mixtures were higher in the RAF treatments than in their
corresponding CRF treatments during the first half of the experiment. The activity of ascorbate peroxidase
showed the strongest correlation with the salt level, especially at the time of the first measurement. According
to the dry weight data the sometimes two-fold differences in the salt level did not have a growth reducing
stress effect on cucumber transplants.
Keywords: salt level of pot mixture, ascorbate peroxidase, guaiacol peroxidase
Introduction
Due to their polymer coating, by the application of controlled release fertilizers (CRFs)
a low but continuous nutrient level can be maintained (Trenkel, 1999). This is a very
important characteristic for the production of the usually very salt sensitive transplants
of vegetable plants. That is why CRFs are extensively used for raising seedlings. The
salt level of the pot mixture can be a deciding factor especially when seeds are sown
directly into the pot mixture, as it is the case with cucumber (Slezák et al., 2000).
Stress factors, such as high salt level, can result in the formation of active oxygen forms
which reduce productivity of the crops (Sairam & Tyagi, 2004). In the plants the main
pathway for the neutralization of these compounds is the ascorbic acid – glutathione
cycle (Szepesi et al., 2008). By the monitoring of the so called stress enzymes of this
cycle the extent of the stress and the ability of stress tolerance of the plant can be
characterized (Eshdat et al., 1997; Bouazizi et al., 2007).
The objective of this study was to investigate the effect of CRF application on the
activity of three stress enzymes in the roots and leaves of cucumber transplants.
Materials and methods
Seeds of cucumber (cv. Gredos) were sown into plastic pots on July28th
. Type and
amount of fertilizer mixed into the pot mixture were the changing factors. Beside a zero
control three treatments were applied either with a 14:16:18 analysis readily available
fertilizer (RAF) and with a CRF (12:11:17). The three treatments were as follows: a 125
mg N l-1
and a 250 mg N l-1
basal application level, and a 125 mg N l-1
level
complemented by four sidedressings to 250 mg N l-1
. Treatments were replicated three
times, one replication consisted of 36 pots.
Progress of the salt level of the pot mixtures was monitored by measuring the ionic
activity with a PET 2000 Kombi device (Stelzner GmbH, Bad Klosterlausnitz,

Vol. 37, 2009, Suppl. Cereal Research Communications
34
Germany) four times during the experiments. The unitless so called AM value given by
this instrument was found to correlate very closely to the EC of the pot mixture solution
(Ombódi et al., 2003). Activities of guaiacol peroxidase (Chance & Maehly, 1955),
ascorbate peroxidase (Nakano & Asada, 1981) and glutathione reductase (Smith et al.,
1988) were measured from cell-free tissue extracts prepared from the roots and the
youngest leaves sampled three times (9, 15 and 21 days after sowing) during the raising
period. The experiment was finished 20 days after sowing, and dry weight of the
transplants was measured.
Results and discussion
As the RAF releases its total nutrient content almost immediately after mixing it into the
pot mixture, during the first half of the experiment salt levels were significantly higher
in the RAF treatments than in their corresponding CRF treatments (Table 1.). As
application of sidedressings started at 13 days after sowing, it could not have any effect
at the first two measurement times. Later during the experiment just the amount of the
fertilizer had an effect on the AM value, the fertilizer type did not.
Table 1. Effect of the type and amount of fertilizer on the progress of salt level (AM value) of the pot mixture
during the experiment
Days after sowing
0 9 15 21
0,09 0,12 0,09 0,11 Zero control
0,28 0,21 0,14 0,10 RAF 125 mg N l-1
0,30 0,21 0,16 0,19 RAF 125 mg N l-1 + sidedressings
0,47 0,31 0,25 0,19 RAF 250 mg N l-1
0,10 0,16 0,12 0,10 CRF 125 mg N l-1
0,10 0,14 0,16 0,19 CRF 125 mg N l-1 + sidedressings
0,10 0,21 0,20 0,15 CRF 250 mg N l-1
0,04 0,04 0,04 0,05 LSD 5%
Results of stress enzyme activity measurements are summarized in Figure 1. The
highest activities were observed for guaiacol peroxidase in the roots at the first
measurement time, and for the ascorbate peroxidase in the shoots at the end of the
experiment. Raise in guaiacol peroxidase activity is a general stress response. Athough
there are some similarities between the tendency of AM values and guaiacol peroxides
activities measured at 8 days after sowing, we did not find statistically significant
correltion between these two parameters. The activity of ascorbate peroxidase showed
the strongest correlation with the salt level of the pot mixtures, especially at 8 days after
sowing (Figure 2.). Ascorbate peroxidase activity values were significantly lower in the
CRF treatments than in the RAF treatments during the whole experiment. Activity of
glutathione reductase did not show any response to the treatments.
According to the dry weight data the RAF treatment with sidedressing resulted in the
most developed transplants (Table 2.). This was due to the higher shoot dry weight in
this case, as the treatments did not have statistically significant effect on root dry
weight. Also there were no statistically significant differences between the shoot dry
weight production of the other five treatments.

VIII. Alps-Adria Scientific Workshop Neum, Bosnia-Herzegovina, 2009
DOI: 10.1556/CRC.37.2009.Suppl.2 35
Figure 1. Effect of fertilizer type and rate on the activity of three stress enzymes in cucumber transplants
0
10
20
30
40
0,1 0,15 0,2 0,25 0,3 0,35
Salt level (AM value)
Asc
orb
ate
per
oxi
das
e ac
tivi
ty (
nk
at
g-1
)
shoot
root
shoot r=0,88
root r=0,87
Figure 2. Correlation between the salt level of the pot mixture and the ascorbate peroxidase activity in
cucumber transplants on the 8th day after sowing
6 32 14 39 18 13 2293 67 42 49
201
609
391
701
203237 236
178111103
0
200
400
600
800
Zer
o co
ntro
l
RA
F 125
mg N
l-1
RA
F 125
mg N
l-1 + s
ided
ress
ings
RA
F 250
mg N
l-1
CRF 1
25 m
g N l-
1
CRF 1
25 m
g N l-
1 + sid
edre
ssin
gs
CRF 2
50 m
g N l-
1
act
ivit
y (
nk
at
g-1
)
shoot
4 4 4 6 4 5 7
23
86
8 85 6
39
27
18
32
21 1917
0
10
20
30
40
50
Zer
o co
ntro
l
RA
F 125
mg N
l-1
RA
F 125
mg N
l-1 + s
ided
ress
ings
RA
F 250
mg N
l-1
CRF 1
25 m
g N l-
1
CRF 1
25 m
g N l-
1 + sid
edre
ssin
gs
CRF 2
50 m
g N l-
1
act
ivit
y (
nk
at
g-1
)
shoot
1317
21
12
6
25
41
24 25
1719
4
21 22
36
12
20
151618
23
0
10
20
30
40
50
Zer
o co
ntro
l
RA
F 125
mg N
l-1
RA
F 125
mg N
l-1 + s
ided
ress
ings
RA
F 250
mg N
l-1
CRF 1
25 m
g N l-
1
CRF 1
25 m
g N l-
1 + sid
edre
ssin
gs
CRF 2
50 m
g N l-
1
act
ivit
y (
nk
at
g-1
)
rootascorbate peroxidase
140
247 274
383
287 320
167
78 80 681048410997 103
1158069898486
0
200
400
600
800
Zer
o co
ntro
l
RA
F 125
mg N
l-1
RA
F 125
mg N
l-1 + s
ided
ress
ings
RA
F 250
mg N
l-1
CRF 1
25 m
g N l-
1
CRF 1
25 m
g N l-
1 + sid
edre
ssin
gs
CRF 2
50 m
g N l-
1
act
ivit
y (
nk
at
g-1
)
rootguaiacol peroxidase
11
30
2428
2528
3533
3734 33
14 1417 17
14 16 17
3328
27
0
10
20
30
40
50
Zero c
ontr
ol
RAF 12
5 m
g N l-
1
RAF 12
5 m
g N l-
1 +
sided
ress
ings
RAF 25
0 m
g N l-
1
CRF 12
5 m
g N l-
1
CRF 12
5 m
g N l-
1 +
sided
ress
ings
CRF 25
0 m
g N l-
1
act
ivit
y (
nk
at
g-1
)
shoot
7 7 7 8 7 7 7710 11
911 9 10
5
10 107
12910
0
10
20
30
40
50
Zero c
ontr
ol
RAF 12
5 m
g N l-
1
RAF 12
5 m
g N l-
1 +
sided
ress
ings
RAF 25
0 m
g N l-
1
CRF 12
5 m
g N l-
1
CRF 12
5 m
g N l-
1 +
sided
ress
ings
CRF 25
0 m
g N l-
1
act
ivit
y (
nk
at
g-1
)
8 days after sowing 14 days after sowing 20 days after sowing
rootglutation reductase

Vol. 37, 2009, Suppl. Cereal Research Communications
36
Table 2. Effect of the type and amount of fertilizer on the dry weight production (g per plant) of cucumber
transplants
Shoot Root Whole transplant
0,53 0,06 0,59 Zero control
1,42 0,12 1,53 RAF 125 mg N l-1
1,64 0,12 1,76 RAF 125 mg N l-1 + sidedressings
1,40 0,11 1,50 RAF 250 mg N l-1
1,29 0,12 1,40 CRF 125 mg N l-1
1,36 0,10 1,46 CRF 125 mg N l-1 + sidedressings
1,50 0,09 1,58 CRF 250 mg N l-1
0,25 0,04 0,26 LSD 5%
Conclusions
Type and amount of the fertilizer significantly effected the salt level of the pot mixture,
especially during the first half of the experiment. CRF resulted lower salt level. Activity
of ascorbate peroxidase showed strong correlation with the salt level during this period.
The other two investigated stress enzymes did not react to the treatments at this degree.
However, sometimes two-fold differences in the salt level did not induce such kind of a
stress effect which would restrict the growth of cucumber transplants significantly.
Acknowledgements
The authors are grateful to the Hungarian Research Fund for supporting this research
and to the Hungarian Science and Technology Foundation for financing the
international cooperation between the Hungarian and the Japanese sides. A. Hegedős is
the recipient of a János Bolyai Scholarship.
References
Bouazizi, H., Jouili, H., Ferjani, E.: 2007. Copper-induced oxidative stress in maize shoots (Zea mays L.):
H2O2 accumulation and peroxidases modulation. Acta Biologica Hungarica. 58: 2. 209-218.
Chance, B., Maehly, A.C.: 1955. Assay of catalases and peroxidases. Methods of Enzymology. 2: 764-817.
Eshdat, Y., Holland, D., Faltin, Z., Hayyim, B.G.: 1997. Plant glutathione peroxidases. Physiologia
Plantarum. 100: 1. 234-240.
Nakano, Y. Asada, K.: 1981. Hydrogen peroxide is scavanged by ascorbate specific peroxidase in spinach
chloroplasts. Plant Cell Physiology. 22: 867-880.
Ombódi A., Locher, J., Dimény, J.: 2003. Különbözı hatásmechanizmusú mőtrágyák hatása a palántaföld
ionaktivitására és a paprika palánták minıségére. Kertgazdaság. 35: 1. 77-83.
Sairam, R.K., Tyagi, A.: 2004. Physiology and molecular biology of salinity stress tolerance in plants. Current
Science. 86: 3. 407-421.
Slezák, K., Terbe, I., Seress Z.: 2000. Zöldségfajok magvainak csírázása és a csíráztató közegek EC értékének
összefüggése. Kertgazdaság. 32: 1. 1-7.
Smith, I.K., Vierheller, T.L., Thorne, C.A.: 1988. Assay of glutathione reductase in crude tissue. Analytical
Biochemistry. 175: 2. 408-413.
Szepesi, Á., Csiszár, J., Gallé, Á., Gémes, K., Poór, P., Tari, I.: 2008. Effects of long-term salycilic-acid pre-
treatment on tomato (Lycopersicon esculentum Mill. L.) salt stress tolerance: Changes in glutathione S-
transferase activities and anthocyanin content. Acta Agronomica Hungarica 56:2. 129-138.
Trenkel, M.E.: 1997. Contolled-release and stabilized fertilizers in agriculture. International Fertilizer Industry
Association, Paris.

VIII. Alps-Adria Scientific Workshop Neum, Bosnia-Herzegovina, 2009
DOI: 10.1556/CRC.37.2009.Suppl.2 37
RESPONSE OF S1 MAIZE PROGENY TO NITROGEN DEFICIENCY STRESS IN A RECURRENT SELECTION PROGRAM
Miroslav BUKAN – Hrvoje ŠARČEVIĆ – Jerko GUNJAČA – Snježana BOLARIĆ – Vinko KOZUMPLIK
Department of Plant Breeding, Genetics, Biometrics and Experimentations, Faculty of Agriculture, University
of Zagreb, Svetošimunska 25, 10000 Zagreb, Croatia, e-mail: [email protected]
Abstract: Nitrogen is one of the most important nutrients for plant development. It is also significant
economical factor in intensive plant production systems and responsible for agriculture related pollution.
Cultivars with high nitrogen use efficiency (NUE) would therefore be interesting for production. It was
expected that Maksimir 3 Synthetic (M3S) maize population had genetic variability for NUE, because it was
derived from local corn varieties used in low-input production systems. Field trial including 196 maize S1
progenies from third cycle of recurrent selection in M3S maize population was conducted at three locations
during the 2007 growing season. Two rates of nitrogen, 0 kg ha-1 and 150 kg ha-1, were applied in order to
detect response of the S1 progenies to nitrogen deficiency stress. In the nitrogen stress environment (0 kg N
ha-1), yield was reduced significantly 9.09%, ear height 4.13%, and leaf length and width 2.36% and 4.30 %,
respectively. Correlations between yield per plant and plant height were r = 0.46 and r = 0.53 in nitrogen
stress and non stress environment, respectively. Between yield and other traits correlations were week and
ranged from r = -0.09 to r = 0.32 in both environments. Moderate and positive correlation between yield in the
stress and yield in the non stress environment (r = 0.40), indicates that successful identification of nitrogen use
efficient genotypes could be done in low nitrogen environments, as suggested for improving NUE by several
authors.
Keywords: nitrogen stress, maize, recurrent selection, nitrogen use efficiency, NUE
Introduction
Nitrogen is one of the most important nutrients in plant growth and development, which
metabolism is complex and interdependent with photosynthesis and carbohydrate
metabolism (Presterl at al., 2002). Excessive and inadequate N application may result in
environmental and water pollution through leaching and denitrification (Barić et al.,
2007; Vuković et al., 2008; Mesić et al. 2007; Rutkoviene et al. 2007). It also increases
the crop plant production costs (Raun and Johnson, 1999). Cultivars with high nitrogen
use efficiency, NUE, would therefore be interesting for production. In maize, NUE can
be defined as grain yield per amount of nitrogen available in the soil (Moll et al., 1982),
or as ability of a genotype to realize superior grain yield at low soil nitrogen conditions
in comparison with other genotypes (Presterl et al., 2002). Genetic variability for NUE
in maize has been reported by several authors (Moll et al., 1982; Kamprath et al., 1982;
Moll et al., 1987; Presterl et al., 2002; Varga et al., 2008). Recurrent selection methods
were developed to improve the mean performance of genetically broad base populations
through gradual increase of the frequency of favourable alleles (Hallauer, 1985). Some
of these methods were used to improve NUE in corn (Moll et al., 1982; Kamprath et al.,
1982; Moll et al., 1987). S1 recurrent selection is of particular interest to breeders,
because it is theoretically expected to be more effective than selection among FS and
HS families during earlier cycles of selection (Hallauer, 1992). Objective of this paper
was to detect response of 196 S1 maize progenies derived from the third cycle (C3) of
recurrent selection in M3S maize population, to nitrogen deficiency stress.

Vol. 37, 2009, Suppl. Cereal Research Communications
38
Materials and methods
Field experiments including 196 S1 maize progenies derived from the third cycle (C3)
of recurrent selection in M3S maize population were conducted at three locations in
Croatia, Maksimir (sand loam soil), Rugvica (silt loam soil) and Kutjevo (silt loam soil)
during the 2007 growing season. Development of M3S maize synthetic population and
three cycles of its recurrent selection were described earlier (Šarčević at al., 2004;
Sabljo et al. 2008). At each location two experiments were carried out, one with
fertilization rate 0 kg N ha-1
, representing nitrogen stress environment and one with 150
kg N ha-1
, representing control environment. All other cultural practices were as
recommended for optimum maize production. Each experimental plot was single 12
plant row 2.50 m long. Planting distance was 0.70 m between, and 0.20 m within rows.
Morphological traits, plant and ear height, ear leaf length and width were recorded on
all plants of each experimental plot after anthesis at Maksimir and Kutjevo. All plots
were hand-harvested with gleaning of dropped ears. Yield of shelled grain was
expressed as g per plant, adjusted to 14% grain moisture, at all three locations.
Combined analysis of variance across locations was performed taking genotypes,
fertilizations and locations as fixed effects. Pearson’s correlation coefficients were
calculated among all the traits separately for stress and control environment, and
between yield under stress and control environment. All computations were performed
with SAS Release 8.2 (SAS Institute 1999 – 2001) computer program.
Results and discussion
Significant differences between nitrogen stress and control environment were found for
yield per plant, ear height, leaf length and leaf width (Table 1).
Table 1. Mean values, significance and coefficients of variability among 196 S1 progenies in nitrogen stress
(0 kg N ha-1) and control (150 kg N ha-1) environment for yield per plant (g), plant height (cm), ear height
(cm), leaf length (cm) and leaf width (cm)
Mean Coefficient of variability (%)
0 kg N ha-1 150 kg N ha-1
Significance
of F-test 0 kg N ha-1 150 kg N ha-1
Yield per plant, (g) 700.00 760.00 ** 27.4 29.1
Plant height, (cm) 140.29 141.63 n.s. 8.2 8.9
Ear height, (cm) 69.82 72.83 ** 12.6 13.1
Leaf length, (cm) 72.71 74.48 ** 6.0 6.0
Leaf width, (cm) 8.81 9.21 ** 7.6 8.0
**- F-test significant at p<0.01, n.s.- F-test not significant
In the nitrogen stress environment, yield was reduced by 9.09%, ear height by 4.13%,
and leaf length and width by 2.36% and 4.30 %, respectively. Coefficients of variability
for all the traits except leaf length were slightly lower in the nitrogen stress, than in the
control environment (Table 1). This is in agreement with Bertrán et al. (2003), who also
indicated smaller trait variability under stress environments. Differences among S1
progenies were significant for all the studied traits (data not shown). Grain yield per

VIII. Alps-Adria Scientific Workshop Neum, Bosnia-Herzegovina, 2009
DOI: 10.1556/CRC.37.2009.Suppl.2 39
plant was significantly different among locations and, Rugvica (103.26 g) outyielded
Kutjevo (69.18 g) and Maksimir (42.27 g).
Genotype x nitrogen (G x N) interaction (data not shown) was not significant for any
trait, indicating similar genotype response both environments. Genotype x nitrogen
interaction is needed for selection of genotypes adapted to specific level of nitrogen.
Presterl et al. (2002) selected two out of five best yielding selection hybrids at high
nitrogen environment under low nitrogen environment, confirming together with
Bänziger et al. (1997) that the amount of G x N interaction is dependent on the
dissimilarity of the N levels. Lack of the G x N interaction for grain yield in our study
might indicate that M3S population is equally adapted to nitrogen stress as well as to
control environment, or that two applied nitrogen levels were not different enough.
Severe drought during the 2007 growing season, with low precipitation from March to
September (data not shown) presumably affected this trail, and occurrence of G x N
interaction. Genotype x nitrogen interaction was not significant for grain yield in Moll
et al. (1982), also. Correlations between yield per plant and plant height in our study
were r = 0.46**
and r = 0.53**
in the nitrogen stress and in the non stress environment,
respectively (Table 2).
Table 2. Pearson's correlation coefficients among yield per plant (g), plant height (cm), ear height (cm), leaf
length (cm) and leaf width (cm) in nitrogen stress and control environment
N0
Trait Plant height Ear height Leaf length Leaf width
Yield 0.46 ** 0.16 ** -0.09 * 0.06 n.s.
Plant height 0.70 ** 0.37 ** 0.17 **
Ear height 0.38 ** 0.35 **
Leaf length 0.28 **
N150
Trait Plant height Ear height Leaf length Leaf width
Yield 0.53 ** 0.32 ** 0.18 ** 0.20 **
Plant height 0.70 ** 0.33 ** 0.16 **
Ear height 0.16 ** 0.23 **
Leaf length 0.21 **
*, **- significant at p<0.05 and p<0.01, respectively, n.s.-not significant
Between yield and other traits correlations were week and ranged from r = -0.09* to r =
0.32**
in both environments. Alonso Ferro et al. (2006) also detected significant and
positive phenotypic and genotypic correlations between grain yield and plant height
among 85 European maize landraces under high and low nitrogen inputs. Correlation
between yield in the stress and yield in the non stress environment was moderate and
positive (r = 0.40**
), similarly the one found by Bänziger et al. (1997), what indicates
that successful identification of nitrogen use efficient genotypes could be done in low
nitrogen environments.

Vol. 37, 2009, Suppl. Cereal Research Communications
40
Conclusions
Studied S1 progenies responded similarly to the nitrogen stress (0 N kg ha-1
), as to the
control (150 kg N ha-1
) environment. The studied traits varied more with genotype and
location than with fertilization rate. Lack of G x N interaction for grain yield in our
study might indicate that M3S population is equally adapted to the nitrogen stress, as to
the control environment, or that two applied nitrogen levels were not different enough.
Highest correlation were found between yield and plant height at both stress and control
environment. Drought during the 2007 growing season might have affected results of
this trail.
Acknowledgements
Financial support for this study has been provided by the Croatian Ministry of Science,
Education, and Sports, research grant No. 178-1780691-0690.
References
Alonso Ferro R. – Brichette I. – Evgenidis G. – Karamaligkas Ch. – Moreno-Gonzales J. 2006. Variability in
European maize (Zea mays L.) landraces under high and low nitrogen inputs. Genetic Resources and
Crop Evolution, 54: 295-308.
Baric M. – Sarcevic H. - Keresa S. - Habus Jercic I.- Rukavina I. 2007. Genotypic differences for nitrogen use
efficiency in winter wheat (Triticum aestivum L.). Cereal Research Communications, 35: 2. 213-216.
Bänziger M. – Betrán F. J.– Lafitte H. R. 1997. Efficiency of High-Nitrogen Environments for Improving
Maize for Low-Nitrogen Target Environments. Crop Science, 37: 1103-1109.
Bertrán F. J. – Beck D. – Bänziger M. – Edmeades G. O. 2003. Genetic Analysis of Inbred and Hybrid Grain
Yield under Stress and Nonstress Environments in Tropical Maize. Crop Science, 43: 807-817.
Hallauer A. R. 1985. Compendium of recurrent selection methods and their application. Critical Review in
Plant Sciences 3: 1-33.
Hallauer A. R. 1992. Recurrent Selection In Maize. Plant Breeding Reviews, 9: 115–179.
Kamprath E. J. – Moll R. H. –Rodriguez N. 1982. Effects of Nitrogen Fertilization and Recurrent Selection on
performance on Hybrid Populations of Corn. Agronomy Journal, 74: 955-958.
Mesić M. – Bašić F. – Kisić I. – Butorac A. – Gašpar I. 2007. Influence of mineral nitrogen fertilization on
corn grain yield and nitrogen leaching. Cereal Research Communications, 35: 2. 773-776.
Moll R. H. – Kamprath E. J. – Jackson W. A. 1987. Development of Nitrogen-Efficient Prolific Hybrids of
Maize. Crop Science, 27: 181-186.
Moll R. H. – Kamprath E. J. – Jackson W. A. 1982. Analysis and Interpretation of Factors Which Contribute
to Efficiency of Nitrogen Utilization. Agronomy Journal, 74: 562-564.
Presterl T. – Groh S. – Landbeck M. – Seitz G. – Schmidt W. – Geiger H. H. 2002. Nitrogen uptake and
utilization efficiency of European maize hybrids developed under conditions of low and high nitrogen
input. Plant Breeding, 121: 480-486.
Raun, W. R. – Johnson, G. V. 1999. Improving Nitrogen Use Efficiency for Cereal Production. Agronomy
Journal, 91: 3. 357-363.
Rutkoviene V. – Cesoniene L. – Steponavicius D. 2007. Nitrogen losses from organic and mineral fertilizers
in model soil systems. Cereal Research Communications, 35:2. 313- 316.
Sabljo A. – Šarčević H. – Palaveršić B. – Buhiniček I. – Kozumplik V. – Bukan M. – Gunjača J. – Beljo J. –
Tomasović S. – Ikić I. 2008. Improvement of grain yield and Fusarium stalk rot resistance in the M3S
maize population by recurrent selection. Cereal Research Communications, 36: Suppl. C, 159-160.
SAS(c) System for Microsoft Windows(c) Release 8.2. SAS Institute Inc. Cary, N.C., USA
Šarčević H. – Pejić I. – Barić M. – Kozumplik V. 2004. Performance and Inbreeding Depression of an Exotic
Maize Population under Selfed Progeny Recurrent >Selection. Die Bodenkultur, 55:1, 21-27.
Vuković I. – Mesić M. – Zgorelec Ž. – Jurišić A. – Sajko K. 2008. Nitrogen use efficiency in winter wheat.
Cereal Research Communications, 36:2. 1199-1203.

VIII. Alps-Adria Scientific Workshop Neum, Bosnia-Herzegovina, 2009
DOI: 10.1556/CRC.37.2009.Suppl.2 41
INFLUENCE OF CROPPING SYSTEM INTENSITY ON YIELD AND YIELD COMPONENTS OF NEW SOYBEAN GENOTYPES
Ana POSPIŠIL 1 – Milan POSPIŠIL 1 – Svjetlana MATOTAN 2 – Dario JAREŠ 1 – Bogdan KORIĆ 3
1 Department of Field Crops, Forage and Grasslands, Faculty of Agriculture, University of Zagreb,
Svetosimunska cesta 25, 10000 Zagreb, Croatia, e-mail: [email protected] 2 Podravka d.d., Koprivnica 3 Institute for Plant Protection in Agriculture and Foresty of Republic of Croatia, Zagreb
Abstract: Two-year investigations (2006 and 2007) were conducted within the three-year maize-soybean-
wheat crop rotation with the aim to assess the influence of two cropping systems, conditionally marked as
high-input and reduced-input systems, and of plant density on soybean seed yield and yield components of
two new genotypes. Cropping system intensity had a positive effect in both years on soybean seed yield, seed
number and seed weight per plant. In 2007, cropping system intensity had a positive effect also on number of
pods per plant. Plant density had no influence on soybean seed yield. The highest pod and seed number and
seed weight per plant were achieved at 35 plants m-2. Soybean genotype AF-4 achieved in both years
significantly higher seed yield. Abiotic stress (high temperature, smaller amount of precipitation and its less
favourable distribution) during the 2007 year had adverse influence on seed weight per plant and 1000 seed
weight, which was eventually reflected in lower yield especially of genotype AF-4.
Keywords: soybean, genotypes, cropping systems, plant density, yield
Introduction
A major role in increasing soybean seed yield is that of yield components that determine
it. Seed yield is determined by the number of seeds and seed weight, where seed weight
is often in negative correlation with seed number (Pedersen and Lauer, 2004).
According to Board et al. (2003), seed yield is most strongly influenced by the number
of seeds and pods per m2. Introduction of new soybean genotypes and improvement of
cropping practices are prerequisites for increasing soybean seed yields. Soybean
genotypes also differ in the efficiency of biological nitrogen fixation (Sudarić et al.,
2008), so introduction of new genotypes into production is associated with
determination of the optimal cropping system for achievement of highest yields.
Determination of optimal plant density is an essential factor for achievement of high
soybean seed yields. Gan et al. (2002) report that plant density had no impact on some
yield components, node number per plant and 1000-seed weight; however, an increase
in density increased the number of pods and seeds as well as seed yield per unit area in
all the genotypes studied.
When determining nitrogen fertilizer rates, it should be taken into account that higher
nitrogen levels have an adverse effect on its symbiotic fixation, thereby thwarting
soybean’s ability to satisfy part of its nitrogen requirements from its symbiotic
relationship with Bradyrhizobium japonicum (Kadar et al., 2008). New soybean
genotypes accumulate nitrogen more efficiently than old genotypes (Kumudini et al.,
2008). Soybean seed yield is also affected by soil tillage (Sabo et al., 2007). Although
conservation tillage systems enable higher humus accumulation in soil and reduce CO2
emission into the atmosphere (Birkas, 2007; Bencsik and Ujj, 2008), even conventional
deep tillage has its advantages in some cases. Deep tillage has a strong influence on
increasing soybean yield in dry years when cost effectiveness of this practice is realized
(Wesley et al., 2000).

Vol. 37, 2009, Suppl. Cereal Research Communications
42
The research objective was to assess the influence of high-input and reduced-input
cropping systems and four plant densities on soybean seed yield and yield components
of two new soybean genotypes.
Materials and methods
Investigations were conducted in field trials within the three-year maize-soybean-wheat
crop rotation set up at the experimental facility of the Faculty of Agriculture in Zagreb
in 2006 and 2007. Investigations involved two cropping systems and two new soybean
genotypes: AF-4 i AF-5, vegetation group 0, sown at four plant densities (35, 45, 55 and
65 plants m-2
). High-input cropping system had the following characteristics: ploughing
at 30-32 cm, fertilization with 30 kg N ha-1
, 80 kg P2O5 ha-1
and 120 kg K2O ha-1
, and
the reduced-input cropping system: ploughing at 20-22 cm, fertilization with a total of
15 kg N ha-1
, 40 kg P2O5 ha-1
and 60 kg K2O ha-1
.
Trials were laid out according to the strip-plot method with four replications. The trial
plot size was 8.1 m2. Prior to harvest, ten plants were taken from each plot for the
following analyses: plant weight, pod and seed number per plant, seed weight per plant,
harvest index, 1000-seed weight. After harvest, soybean seed yield per hectare was
determined and expressed at 13% moisture level. Obtained data were processed by the
analysis of variance using the MSTAT-C program (Michigan State University, 1990).
The trial was set up on eutric cambisol, of acid reaction in the plough layer (pH in 1 M
KCl = 5.30). The soil is poorly supplied with humus (2.9%) and well supplied with
nitrogen (0.21%), available phosphorus (21.1 mg/100 g soil) and potassium (30.0
mg/100 g soil).
Results and discussion
Significantly higher soybean seed yields were achieved in both trial years with the high-
input cropping system (Tables 1 and 2). High-input cropping system had in 2006 a
significant influence on the seed number and weight per plant whereas for other yield
components no significant difference was determined between the reduced-input and
high-input cropping systems. Significant influence of cropping intensity on all yield
components was recorded in 2007. Larger pod and seeds number and higher seed
weight per plant were achieved in the high-input system, while higher 1000-seed weight
was obtained in the reduced-input system. However, the increase of 1000-seed weight
from 114.8 g in the high-input system to 125.1 g in the reduced-input system was not
sufficient to compensate for the significantly smaller number and weight of other yield
components. Significantly higher harvest index (0.50) was also achieved with low-input
cropping in 2007. Wood et al. (1993) increased soybean yield by intensified nitrogen
fertilization whereas Varga et al. (1992) point to the small chance of increasing soybean
seed yield by applying higher nitrogen rates.
In 2006, genotype AF-4 gave significantly higher seed yield (Table 1). Higher yield of
genotype AF-4 is a result of its larger number of pods and seeds per plant as well as
higher seed weight per plant. In 2007, however, genotype AF-5 produced a significantly
larger number of pods and seeds per plant, but genotype AF-4 compensated lower
values of other yield components by its significantly higher 1000-seed weight to
eventually achieve a significantly higher seed yield compared to AF-5 (Table 2).
Genotype AF-5 showed greater tolerance of adverse weather conditions in 2007 until

VIII. Alps-Adria Scientific Workshop Neum, Bosnia-Herzegovina, 2009
DOI: 10.1556/CRC.37.2009.Suppl.2 43
the seed filling stage. During seed filling, however, genotype AF-4 made up for poorer
formation of other yield components, which was eventually reflected in the higher yield
of this genotype. Pedersen and Lauer (2004) maintain that the ability of a cultivar to
compensate certain yield components is more affected by the weather variability of a
year than by cropping intensity.
Table 1. Influence of cropping system intensity and plant density on yield and yield components of new
soybean genotypes in 2006
Yield Pods Seeds Seed
weight
1000 seeds
weight
Harvest
index
kg ha-1 ------no. plant-1------ g plant-1 g
Cropping system
intensity
low 2514 b 31.2 74.7 b 12.5 b 167.3 0.54
high 3741 a 37.0 93.3 a 15.7 a 167.7 0.54
Genotype
AF-4 3747 a 38.8 a 102.9 a 17.4 a 168.6 0.55
AF-5 2508 b 29.5 b 65.1 b 10.8 b 166.4 0.53
Plant density
plants m-2
35 2955 41.9 a 101.9 a 17.1 a 168.2 0.54
45 3200 35.9 b 88.7 b 14.9 ab 167.5 0.55
55 3184 31.2 bc 77.8 bc 13.0 bc 166.7 0.54
65 3172 27.5 c 67.6 c 11.3 c 167.7 0.53
Values followed by the same letter in a column are not significantly different at the 5% level of probability
Table 2. Influence of cropping system intensity and plant density on yield and yield components of new
soybean genotypes in 2007
Yield Pods Seeds Seed
weight
1000 seeds
weight
Harvest
index
kg ha-1 ------no. plant-1------ g plant-1 g
Cropping system
intensity
low 2394 b 32.8 b 76.8 b 9.5 b 125.1 a 0.50 a
high 2895 a 51.8 a 122.0 a 14.0 a 114.8 b 0.47 b
Genotype
AF-4 2755 a 36.5 b 90.7 b 11.1 124.0 a 0.48
AF-5 2534 b 48.1 a 108.1 a 12.4 115.9 b 0.49
Plant density
plants m-2
35 2575 52.5 a 127.2 a 14.6 a 116.4 0.49
45 2630 44.4 ab 101.9 b 12.2 b 120.9 0.49
55 2702 39.4 bc 92.0 bc 10.7 bc 119.0 0.48
65 2672 33.0 c 76.6 c 9.3 c 123.5 0.48
Values followed by the same letter in a column are not significantly different at the 5% level of probability
Plant density had no influence on soybean seed yield in either trial year (Tables 1 and
2). Lower yields in 2007 are a result of adverse weather conditions during the soybean
growing period. Smaller amount of precipitation and its less favourable distribution in
2007 were accompanied by temperatures higher than the long-term average throughout
the growing period, which was eventually reflected in lower yield.

Vol. 37, 2009, Suppl. Cereal Research Communications
44
Statistically significant influence of plant density on the number of pods and seeds as
well as on seed weight per plant was recorded in both trial years (Tables 1 and 2). In
2006, a significantly larger number of pods were produced at the lowest plant density,
while the largest number of pods in 2007 was achieved at plant densities of 35 and 45
plants m-2
. The largest number of seeds and the highest seed weight per plant were in
both trial years obtained at the plant density of 35 plants m-2
. Plant density had no effect
on 1000-seed weight, or on harvest index.
Conclusions
Significantly higher yield was achieved by high-input cropping. At the same time,
higher values were determined of yield components: pod and seed number, and seed
weight per plant. In 2007, however, higher 1000-seed weight was obtained in the
reduced-input cropping system, but this increase could not compensate for the lower
values of other yield components. In both trial years, genotype AF-4 produced significantly higher seed yield. In the
climatically less favourable 2007, genotype AF-5 produced a significantly larger
number of pods and seeds per plant, while genotype AF-4 compensated lower values of
other yield components by its significantly higher 1000-seed weight.
In both trial years, a larger number of pods and seeds, and higher seed weight per plant
were recorded at lower plant density. Plant density had no influence on 1000-seed
weight and harvest index.
References
Bencsik, K. – Ujj, A.: 2008. Evaluation of different soil tillage methods regarding soil-plant interrelations.
Cereal Research Communications, 36: Part 3 Suppl. S. 1559-1562.
Birkás, M. – Kalmár, T. – Fenyvesi, L. – Földesi, P.: 2007. Realities and beliefs in sustainable soil tillage
systems – A research approach. Cereal Research Communications, 35: 2. 257-260.
Board, J. E. – Kang, M. S. – Bodrero, M. L.: 2003. Yield components as indirect selection criteria for late-
planted soybean cultivars. Agronomy Journal, 95: 2. 420-429.
Gan, Y. – Stulen, I. – van Keulen, H. – Kuiper, P. J. C.: 2002. Physiological response of soybean genotypes to
plant density. Field Crops Research, 74: 231-241.
Kádár, I. – Vörös, J. – Radics, L.: 2008. NxP and NxPxK interactions in relation to yield, weed cover and
fungi infection in soybean. Cereal Research Communications, 36: Part 2 Suppl. S. 863-866.
Kumudini, S. – Omielan, J. – Hume, D. J.: 2008. Soybean genetic improvement in yield and the effect of late-
season shading and nitrogen source and supply. Agronomy Journal, 100: 2. 400-405.
Official Methods of Analysis of AOAC International, 2002. 17th Edition, Revision 1, Gaithersburg,
Maryland, USA
Pedersen, P. – Lauer, J. G.: 2004. Response of soybean yield components to management system and planting
date. Agronomy Journal, 96: 5. 1372-1381.
Sabo, M. – Jug, D. – Jug, I.: 2007. Effect of reduced tillage on quality traits of soybean [Glycine max (L.)
Merr.]. Acta Agronomica Hungarica, 55: 1. 83-88.
Sudarić, A. – Vratarić, M. – Duvnjak, T. – Majić, I. – Volenik, M.: 2008. The effectiveness of biological
nitrogen fixation in soybean linked to genotype and environment. Cereal Research Communications, 36:
Part 1 Suppl S. 67-70.
Varga, B – Čorni, A. – Kalšan, M.: 1992. Djelovanje gnojidbe mineralnim gnojivima i načina sjetve soje na
prinos zrna i njegove komponente. Agriculturae Conspectus Scientificus, 57: 1. 91-100.
Wesley, R. A. – Smith, L. A. – Spurlock, S. R.: 2000. Residual effects of fall deep tillage on soybean yields
and net returns on tunica clay soil. Agronomy Journal, 92: 5. 941-947.
Wood, C. W. – Torbert, H. A. – Weaver, D. B.: 1993. Nitrogen fertilizer effects on soybean growth, yield, and
seed composition. Journal of Production Agriculture, 6: 3. 354-360.

VIII. Alps-Adria Scientific Workshop Neum, Bosnia-Herzegovina, 2009
DOI: 10.1556/CRC.37.2009.Suppl.2 45
WATER STRESS. IN WHICH CASES DOES IRRIGATION REDUCE THE YIELD OF MAIZE?
HUZSVAI László1– VÁNYINÉ SZÉLES Adrienn1
1University of Debrecen, Centre of Agricultural Sciences and Engineering, Institute for Land Utilisation,
Regional Development and Technology, e-mail: [email protected]
Abstract: The impact of irrigation on crop yield is usually described by the yield growth extent. If
precipitation supply is average, maize irrigation is ineffective, but it can result in significant yield surplus in
drought. Also, there are – rather rare – conditions, in which irrigation causes yield drop. This happened at the
latitudinal degree 47°56’ and the longitudinal degree 21°44’ in 2005 and 2006. Many explain the negative
impact of irrigation by the lack of air in the soil. We found a different reason for this in our experiment, in
which we examined the impact of previous crop, cultivation and fertilisation on maize production. The lack of
air in soil cannot be observed in a chernozem soil with good structure. After maize as green croup, yield was
lower by 1 t ha-1, whereas was only a 0.34 t ha-1 drop after wheat. The impact of irrigation on maize yield
after autumn ploughing was -900 kg ha-1, whereas it was -800 kg ha-1 after disk cultivation and -600 kg ha-1
after spring ploughing. These results cannot be explained by the lack of air, as it would have provided the
opposite result. Due to our analyses, the N concentration of the soil solution is determinant. If there is a much
N in the soil, water will not dilute the N concentration to a critical extent. Fertiliser treatments supported this
hypothesis, as the irrigation-induced yield drop was the highest on non-fertilised plots and the lowest (zero)
on plots that with the highest amount of fertiliser.
Keywords: water stress, maize, irrigation
Introduction
As for maize, Hungary belongs to the zone of areas that can be irrigated only under
certain conditions. Maize growing is relatively simple in especially dry climate, where
natural precipitation does not interfere into the development of irrigation standards.
Nevertheless, the case is not that simple in the climate of Hungary. There are crop years,
when natural precipitation covers the water need of maize hybrids and there are cases
when even natural precipitation proves to be much in itself. The joint effect of the
precipitation in May and June significantly exceeding the average level and the higher
dose of irrigation could even cause yield depression. A proper irrigation forecast could
only be provided on the basis of the irrigation and groundwater conditions of the given
plot (Antal 1968; Posgay 1968, 1983; Balogh 1978; Racskó 2005). The regularity of
irrigation is also in connection with the yield by means of under- and over-irrigation.
Lack of water results in lack of water satisfaction. Over-irrigation also causes yield
depression, it can reduce yield under the potential level by leaching nutrients out of the
soil, causing airless conditions and increasing liability to diseases (Lelkes, 2001).
According to Csajbók (2007), irrigation also has effect on the physicial and chemical
characteristics of soil. Deteriorated soil conditions caused by the unfavourable physical
and chemical effects can frequently be observed in irrigated areas. Research results also
show that yield decrease can occur as a result of irrigation in certain crop years in areas
with inadequate nutrient supply, therefore the harmony of nutrient and water supply has
to be provided simultaneously (Láng, 1971; Nagy, 1995, 1997, 2006a, 2006b, 2007,
2008; Szalókiné and Szalóki, 2002). Cameira et al. (2003) examined the water and
nitrogen balance of soils. The current nutrient management systems do not attach
enough importance to the fact that a considerable amount of mineral nitrogen can be
produced by the mineralisation of soil in hydromorphic soils until sowing. It can lead to
a serious nitrogen accumulation until harvest and nitrogen can easily be leached out

Vol. 37, 2009, Suppl. Cereal Research Communications
46
from the root zone during the wet months of the autumn and winter. As for sandy soils,
nitrate leaching takes place owing to ineffective irrigation farming in the growth season.
Based on research carried out in Ohio, Hardjoamidjojov et al. (1982) proved that the
yield of maize hybrids is in close correlation with the stress sensitivity of cultivars. Széll
(1984) also stated that the yield stability of outstanding hybrids prevails only above an
adequate treshold value of degree of water supply.
Materials and methods
We carried out our research in the Látókép Experiment Site of the Centre of
Agricultural Sciences and Engineering of the University of Debrecen on chernozem soil
with lime deposits (latitudinal degree: 47°56’, longitudinal degree: 21°44’). The
experiment started in 1999 and has been going on in its unchanged form ever since. In
this research, we have the opportunity to examine the effect of the most important
agrotechnical factors influencing maize yield: irrigation, preceding crop, cultivation and
fertilisation, as well as their interactions. The preceding crop was winter wheat and
maize, the applied cultivation method was autumn ploughing, spring ploughing and disk
cultivation, the fertilisation treatments were: N_0: non-fertilised, N_120: 120 kg ha-1
N;
90 kg ha-1
P2O5; 106 kg ha-1
K2O, N_240:240 kg ha-1
N; 180 kg ha-1
P2O5; 212 kg ha-
1 K2O. We used a general linear model to examine the effect of treatments on yield. In
this study, we present the effect of irrigation in 2005 and the interactions of other factors
modifying it.
Results and discussion
We can come across studies about yield depression caused by excessive water supply
rather infrequently in the respective technical literature. Nevertheless, many researchers
mention that maize can only be irrigated under certain conditions in Hungary, therefore
yields increase only in years when there is a lack of water. Excessive water supply
causes yield drop through the airless conditions in soil, the leaching of nutrients, the
inadequate nutrient supply, the unfavourable physical and chemical soil characteristics.
During our examinations, we tried to rank and quantify the reasons (Figure 1). Airless
conditions in the soil do not cause yield depression in chernozem soils with good
structure and good water management. After winter wheat as a preceding crop, the
residual water in soil is always more than it is in the case if maize is the preceding crop.
Therefore, in the case of excessive water supply, if anaerobic soil conditions were to
develop, it would be reasonable to observe a bigger yield drop here, yet the case was the
opposite. After winter wheat, more easily accessible nitrogen can be found in the soil
and this is the reason why yield depression is lower in the case of excessive water
supply than it is after maize. The nitrogen content of soil is crucial, that is clearly
proven by fertilisation treatments. Plots that have not been fertilised for 15 years show
the greatest yield drop as result of irrigation. It is higher after maize (nearly 2 t ha-1
),
and it is lower after winter wheat (1 t ha-1
). Yield depression is smaller on fertilised
plots and it becomes smaller and smaller as fertiliser doses are increased. Practically, no
yield drop can be observed after fertilised winter wheat. Cultivation modifies this
correlation to a small extent. In the case of maize grown in monoculture, autumn
ploughing is the most advantageous (-0.757 t ha-1
), causing the smallest yield depression
and providing the most favourable conditions for nitrification, the production of mineral

VIII. Alps-Adria Scientific Workshop Neum, Bosnia-Herzegovina, 2009
DOI: 10.1556/CRC.37.2009.Suppl.2 47
nitrogen. In monoculture, spring ploughing is unfavourable (-1.075 t ha-1
). As for maize
grown after winter wheat, autumn ploughing (-0.256 t ha-1
) and disk cultivation (-
0.223 t ha-1
) are nearly the same, the results are the same within a margin of error. There
is not a huge difference between cultivation forms after a good preceding crop.
Winter wheatMaize
Forecrop
Dis
kS
pin
g P
lou
gh
ing
Win
ter P
lou
gh
ing
Cu
ltivatio
n
N_240N_120N_0 N_240N_120N_0
0,500
0,000
-0,500
-1,000
-1,500
-2,000
-2,500
t/h
a
0,500
0,000
-0,500
-1,000
-1,500
-2,000
-2,500
t/h
a
0,500
0,000
-0,500
-1,000
-1,500
-2,000
-2,500
t/h
a
Figure 1. The effect of irrigation on maize yield, Debrecen, 2005
In a long-term experiment, both treatments and yields of previous years influence the
yield of a given year. The volumes of biomass in previous years determine the volume
of removed nutrients. Table 1 shows the fertiliser-nutrient balance of the period before
2005 (1990-2004) in maize monoculture. The greatest ”deficiency” can be observed on
non-fertilised, irrigated plots. This ”deficiency” amounts to 140-170 kg ha-1
nitrogen
annually. This amount was provided for maize by chernozem soil.
Table 1. Fertiliser – yield balance (kg N ha-1), Debrecen, 1990-2004.
Cultivation Fertilisation Non
Irrigated Irrigated
N_0 -2 123 -2 586
Winter Ploughing N_120 -1 289 -2 373
N_240 545 -677
N_0 -1 959 -2 432
Spring Ploughing N_120 -910 -1 950
N_240 846 -250
N_0 -1 764 -2 121
Disk cultivation N_120 -926 -1 733
N_240 762 -144

Vol. 37, 2009, Suppl. Cereal Research Communications
48
Conclusions
Even in the Hungarian climate that tends to be dry, conditions where excessive water
supply causes yield drop can develop. The water content of soil greatly influences the
easily accessible nutrient forms, therefore the degree of water supply of maize can only
by adequately judged on the basis of the degree of nutrient supply. Professional
irrigation can only be carried out if soil characteristics – primarily its water and nutrient
management features – are taken into consideration. In the long term, irrigation can
increase maize yield only if adequate nutrient supply is provided. In our experiment, we
observed such an extent of nutrient deficiency on irrigated, non-fertilised plots after 15
years that causes a yield drop if the degree of precipitation supply is bigger than
average.
Acknowledgements
The Hungarian Scientific Research Fund (OTKA) subsidised our research projects on
the basis of contracts CK 77503 and NKTH OM-00210/2008.
References
Antal E.: 1968. Az öntözés elırejelzése meteorológiai adatok alapján. Kandidátusi értekezés, Budapest.
Balogh J.: 1978. Vízigény számítások az öntözıgazdálkodásban. Mezıgazdasági Kiadó, Budapest.
Cameira, M. R., Fernando, R. M., Pereira, L. S.: 2003. Monitoring water and NO3-N in irrigated maize fields
in the Sorraia Watershed, Portugal. Agricultural Water Management. 60. 3. 31: 199–216.
Csajbók J.: 2007. Az öntözéses növénytermesztés aktuális kérdései. Agrárágazat 3. évf.
Hardjoamidjojov, S., Skaggs, R. W., Schwab, G. O.: 1982: Corn yield response to excessive soil water
conditions. Transactions of the ASAE, St. Joseph, Michigan, 25. 4: 922–927.
Láng G.: 1971. A búza intenzív termesztése. Magyar Mezıgazdaság. 26: 40.
Lelkes, J.: 2001. Az öntözés és szabványosítás. Poszter anyag. Készült a Magyar Tudomány Napja
alkalmából. TSF MVKK. Szarvas.
Nagy J.: 1995. A mőtrágyázás hatásának értékelése a kukorica (Zea mays L.) termésére eltérı évjáratokban.
Növénytermelés. 44. 5–6: 493–506.
Nagy J.: 1997. A mőtrágyázás hatása a kukorica (Zea mays L.) termésére öntözés nélküli és öntözéses
termesztésben. Agrokémia és Talajtan. 46. 1–4: 275–288.
Nagy J.: 2006a. A vízellátás hatása a korai (FAO 300–399) éréscsoportba tartozó kukorica (Zea mays L.)
hibridek termésére öntözés nélküli termesztésben. Növénytermelés, 55: 1–2. 103–112.
Nagy J.: 2006b. Az évjárat hatásának értékelése a kukorica termésére. Növénytermelés, 55: 5–6. 299–308.
Nagy J.: 2007. Evaluating the effect of year and fertilisation on the yield of mid ripening (FAO 400–499)
maize hybrids.Cereal Research Communications, 35: 3. 1497–1507.
Nagy J.: 2008. Maize production. Akadémia Kiadó, Budapest, p. 393.
Posgay E.: 1968. Az öntözés idıpontjának és normájának meghatározása. Öntözéses Gazdálkodás. 2: 27–38.
Posgay E.: 1983. A vízellátás és a termés közötti kapcsolat az öntözéses növénytermesztésben. V. A vízhiány
és az öntözés jelzése szimulátorral. Növénytermelés. 32. 4: 339–346.
Racskó J.: 2005. Szántóföldi kultúrák öntözése. MezıHír Mezıgazdasági Szaklap IX. évfolyam.
Szalókiné Z. I., Szalóki S. (2002): A víz- és a tápanyagellátás hatása a kukorica termésösszetevıinek
mennyiségére és NPK-tartalmára. Növénytermelés. 51. 5–6: 543–557.
Széll E. (1984): Az aszály hatása a kukoricára. Magyar Mezıgazdaság. 39. 15: 9.

VIII. Alps-Adria Scientific Workshop Neum, Bosnia-Herzegovina, 2009
DOI: 10.1556/CRC.37.2009.Suppl.2 49
PHOSPHORUS TURNOVER OF CHERNOZEM MEADOW SOIL IN A LONG-TERM MINERAL FERTILISATION FIELD EXPERIMENT
Zoltán IZSÁKI
Agricultural Science Institute, Faculty of Water and Environmental Management, Szent István University,
H-5541 Szarvas, P.O.B. 3, Hungary, e-mail: [email protected]
Abstract: The effect of replenisment and replacement fertilisation on the AL-soluble P2O5 content of the soil,
on the P balance and on the degradation of fertiliser P in the soil was studied betwen 1989 and 2005 at four
levels of P supplies in a long-term mineral fertilisation experiment set up on chernozem meadow soil in
Szarvas in 1989 with a total of 64 treatments (4Nx4Px4K). Without P fertilisation the AL-P2O5 content of the
ploughed layer showed virtually no decrease over the course of the 16-year experiment cycle. The annual
application of 100 kg·ha-1 P2O5 fertiliser gradually increased the readily available P reserves of the soil, giving
a positive P balance. Replenishment P fertilisation resulted in a large positive P balance and substancial
amount of P chemical degradation.
Keywords: P turnover, P balance, fertilisation, long-term experiment
Introduction
Between 1971 and 1989 the P balance of Hungarian soils was strongly positive,
contributing to the fact that around 70 % of the agriculturally utilised soils were
classified as having good or very good P-supplying ability by the end of the eighties.
Over the last two decades, however, there has been a drastic decline in P fertiliser
application, which has dropped to below 10 kg ha-1
active agents on cultivated areas.
The farm practice with respect to P fertilisation over the last 20 years raises a number of
questions, such as: how long can under fertilisation with P continue before the stress
induced by P deficiency results in significant yield reductions and quality deterioration;
to what extent have the P supplies in Hungarian soils declined; what level of
fertilisation is required on soils with poor P-supplying capacity to bring this capacity up
to at least the medium category; what proportion of the P fertiliser applied at longer
intervals is subject to chemical degradation (Kádár and Csathó 1991, Kádár 1997, 2006,
2008, Füleky 1998, 2006, Németh 1998, Izsáki and Iványi 2002, Izsáki 2007, Kádár and
Márton 2007). Long-term mineral fertilisation experiments, such as those set up on
chernozem meadow soil in Szarvas in 1989, provide a basis for answering these
questions.
Materials and methods
Long-term mineral fertilisation experiments were set up at the Experimental Station of
the Crop Production Department in 1989 on chernozem meadow soil. The soil of the
experimental area had the following parameters in 1989: pH(KCl) 5.0-5.2, calcareous in
the deeper layers, humus content 3.0-3.2 %, 85-100 cm humus layer, upper limit of
plasticity according to Arany (KA) 50, clay content 32 %, AL-P2O5 156 mg·kg-1
.
Fertilisation was carried out in all possible combinations of four levels each of N, P and
K, giving a total of 64 treatments, set up in a split-split plot design with three
replications, with K fertilisation as the “A” factor, P fertilisation as the “B” factor and N
fertilisation as the “C” factor. The following P fertiliser rates (P2O5) were applied: P0=0;

Vol. 37, 2009, Suppl. Cereal Research Communications
50
P1=100 kg·ha-1
·year-1
; P2=500 kg·ha-1
in 1989, 1993 and 2001; P3=1000 kg·ha-1
in 1989,
1993 and 2001. In each year of the experiment four crops were included in the crop
rotation on 4x192 plots. The P uptake of the crops were determined at harvesting time.
The soil P content was determined with the AL(0.1 M NH4-lactate + 0.4 M acetic acid)
method.
Results and discussion
Changes in the parameters characteristic of the P-supplying capacity and P supply
levels of the soil in response to P fertilisation are illustrated in Table 1 and Figure 1.
Table 1. Phosphorus balance in the experiment
(Szarvas, 1990-2005)
P application rate P uptake of the
crops
P balance AL-P2O5 in the ploughed layer
P2O5 kg·ha-1 mg·kg-1 kg·ha-1 As a % of
applied P2O5
Over 16-year period In autumn 2005, in the 16th year
P0=0 830 -830 150 585 -
P1=1600(16x100) 955 645 217 846 16
P2=1500(3x500) 972 528 186 725 9
P3=3000(3x1000) 1042 1958 282 1100 17
When the experiment was set up the AL-P2O5 content of the ploughed layer was 156 mg
kg-1
, and the P supply levels in plots receiving no P fertiliser ranged from 120-158 mg
kg-1
over the 16 years of the experiment. It is a sign of the considerable P reserves and
good P-supplying capacity of the soil that even without fertilisation, the crops extracted
830 kg P2O5 ha-1
in the course of the experimental cycle, with no real decrease in the P
supplies of the soil. The application of 100 kg ha-1
P2O5 a year led to a gradual increase
in the readily available P supplies in the soil and by the end of the 16-year experimental
cycle the supply level had increased by approximately 70 mg kg-1
AL-P2O5 compared
with the control. The P balance of the ploughed layer was +645 kg ha-1
. The data
showed that an increase of 100 kg ha-1
in the P balance resulted in a rise of roughly 10
mg kg-1
in the AL-soluble P content of the ploughed layer. Of the 1600 kg ha-1
P2O5
active agents applied in the course of 16 years, 16 % could be detected in AL-soluble
form at the end of the experimental period.
In the case of replenishment fertilisation at a rate of 3x500 kg P2O5 ha-1
, the AL-P2O5
value of the ploughed layer exceeded the control level by 36 mg kg-1
at the end of the
16th
year. The first replenishment with 500 kg ha-1
P fertiliser resulted in an increase of
86 mg kg-1
in the soil AL-P2O5 value compared with the control, indicating that 58 kg
ha-1
P2O5 active agents was required to increase the soil AL-P2O5 content by 10 mg kg-1
.
In the year following the first replenishment fertilisation 67 % of the fertiliser P could
be detected in AL-P2O5 form, but this value declined in subsequent years. Of the 1500
kg ha-1
P2O5 applied over the 16 years the plants extracted 972 kg, and at the end of the
16th
year the P-balance was +528 kg ha-1
, while 9 % of the fertiliser P was in AL-soluble
form. The fact that a 100 kg ha-1
improvement in the P balance raised the AL-P2O5

VIII. Alps-Adria Scientific Workshop Neum, Bosnia-Herzegovina, 2009
DOI: 10.1556/CRC.37.2009.Suppl.2 51
content of the ploughed layer by 7 mg kg-1
indicates that more of the fertiliser P was
chemically degraded than in the case of annual applications of P fertiliser.
1989
1990
1991
1992
1993
1994
1995
1996
1997
1998
1999
2000
2001
2002
2003
2004
2005
Treatment
AL- P2O5 mg kg-1 in the plaughed layer
P0 156 125 129 134 122 134 144 155 149 158 138 120 120 128 139 143 150
P1 156 126 134 148 154 175 176 194 186 175 194 183 176 183 198 220 217
P2 156 211 169 194 184 247 248 233 203 217 185 156 153 195 222 213 186
P3 156 288 247 252 230 359 358 283 257 267 239 204 200 339 362 297 282
Figure 1. Effect of P fertilistation on the AL-P2O5 content of the ploughed layer
(Szarvas, 1989-2005)
Mineral fertilisation with 3x1000 kg P2O5 ha-1
increased the AL-P2O5 content of the soil
by 132 mg kg-1
compared with the control and 17 % of the fertiliser P was present in
AL-soluble form. In the year following the first replenishment fertilisation, 64 % of the
fertiliser P was detected in the form AL-P2O5, and 61 kg ha-1
P2O5 active agents was
required to increase the soil AL-P2O5 content by 10 mg kg-1
. Of the 3000 kg P2O5 ha-1
applied over the 16 years, the plants extracted 1042 kg and the P balance was +1958 kg
50
100
150
200
250
300
350
400
198
9
199
0
19
91
1992
199
3
19
94
19
95
199
6
199
7
19
98
19
99
200
0
20
01
20
02
200
3
200
4
20
05
AL-
P 2O
5 m
gkg-1
P0
P1
P2P3

Vol. 37, 2009, Suppl. Cereal Research Communications
52
ha-1
. An increase of 100 kg ha-1
in the P balance raised the AL-P2O5 value of the
ploughed layer by 7 mg kg-1
.
Conclusions
On a chernozem meadow soil with good P reserves, where the AL-P2O5 content is 130-
150 mg kg-1
, P exhaustion is a slow process; the readily available AL-P content hardly
changed over a period of 16 years. An increase of 100 kg ha-1
in the P balance raised the
AL-P2O5 content of the ploughed layer by 7-10 mg kg-1
. The periodic application of
higher rates of P fertiliser led to a greater proportion of the P being chemically
degraded.
Acknowledgements
This research project was funded by a grant from the National Scientific Research Fund
(T-034436, T-048816).
References
Füleky Gy.: 1998. Phosphorus fertilisation management in Hungary. Bibliotheca Fragmenta Agronomica, 3: 379-383.
Füleky Gy.: 2006. Phosphorus supply of typical Hungarian soil. Agrokémia és Talajtan, 55: 1. 117-126.
Izsáki Z. – Iványi I.: 2002. Csernozjom réti talaj AL-oldható foszfor- és káliumtartalmának változása
mőtrágyázási tartamkísérletben. (Changes in the AL-soluble phosphorus and potassium contents of
chernozem meadow soil in long-term fertilisation experiments) Növénytermelés, 51: 6. 703-712.
Izsáki Z.: 2007. N and P impact on the yield of maize in a long-term trial. Cereal Research Communications,
35: 4. 1701-1711.
Kádár I.: 1997. Talajaink tápelemgazdálkodása az ezredfordulón. (Nutrient management of Hungarian soils at
the and of the 20th century) Növénytermelés, 46: 73-84.
Kádár I.: 2006. Növény- és talajvizsgálatok értelmezése mőtrágyázási tartamkísérletben. (Interpretation of
plant and soil analysis data in a long-term mineral fertilisation experiment) Növénytermelés, 55: 123-137.
Kádár I.: 2008. A mőtrágyázás hatása az ıszi búzára karbonátos homoktalajon. (Effect of mineral fertilisation
on winter wheat grown on calcareous soil) Növénytermelés, 57: 1. 49-58.
Kádár I. – Csathó P.: 1991. Újabb adatok a foszfor és kálium feltöltı-fenntartó mőtrágyázáshoz. (Furthe data
on buildup and maintenance fertilization with phosphorus and potassium) Agrokémia és Talajtan, 40: 109-118.
Kádár I. – Márton L.: 2007. Búza utáni kukorica trágyareakciója a mezıföldi OMTK kísérletben 1969-2005
között. (Fertiliser response of maize grown after wheat in national long-term fertilisation trials in the
Mezıföld region between 1969 and 2005) Növénytermelés, 56: 147-159.
Németh T.: 1998. Role of phosphous in Hungarian agriculture. Bibliotheca Fragmenta Agronomica, 3: 298-
309.

VIII. Alps-Adria Scientific Workshop Neum, Bosnia-Herzegovina, 2009
DOI: 10.1556/CRC.37.2009.Suppl.2 53
THE EFFECT OF CROP PRODUCTION FACTORS ON YIELD QUANTITY AND QUALITY OF MAIZE
Mihály SÁRVÁRI – Beáta BOROS
1University of Debrecen Faculty of Agriculture, Institute of Crop Sciences, 4032 Debrecen 138 Böszörményi
str., e-mail: [email protected]
Abstract: Maize is one of Hungary’s major cereals. In the 1970s and 1980s, we were in the frontline
regarding yields and genetic advancement. However, yield fluctuation in maize has increased to 50-60% from
10-20% since the 1980s, which was partly caused by the increase in weather extremes due to climate change
and by agrotechnical shortcomings.
The experiments were carried out on typical meadow soil in four repetitions in the period of 2007-2008. In the
sowing time experiment, sowing was performed on 10 April, 25 April, 15 May under a uniform fertilization of
N120, P2O580 K2O 110 kg/ha. In the fertilization experiment, the yielding capacity of 10 hybrids with
different genetic characteristics was studied in a control (non-fertilized) treatment and basic treatment of N40
P2O5 25, K2O 30 kg ha-1 active ingredient and a treatment with fivefold dosages of the basic treatment. In the
plant density experiment, the relationship between plant density and yield was analysed at plant densities of
45, 60 and 75 thousand plants per ha.
We found a tight correlation between sowing time and yield and grain moisture content at harvest. We found
that grain moisture can be reduced by 5-10% by applying an earlier sowing time.
The agroecological optimum fertilizer dosage was N 40-120, P2O5 25-75, K2O 30-90 kg ha-1 active ingredient
at a plant density of 60-90 thousand plants ha-1 depending on the hybrid and the year.
Keywords: maize, yield, fertilization, plant density, sowing date.
Introduction
According to Berzsenyi and Gyırffy (1997), the aim of crop production has been the
maximalization of growth rate and plant biomass production for several decades.
N supply has the greatest influence on the amount of yield, Bocz (1976). The N content
of soils is an important factor in soil fertility (Nyíri, (1993). However, excess N results
in yield reduction and harmful nitrogen accumulation (Németh and Kádár, 1999).
According to the results of Nagy (1997), the natural nutrient exploration ability should
be taken into consideration besides the fertilizer response. Fertilization has a significant
effect on the ratio of grain and other plant parts (Nagy, 1978).
For environmental considerations, it is important to adjust the fertilization to the
requirements of the crop, to the dynamics of nutrient uptake and the growing site
conditions (Várallyay and Németh, 1996; Németh, 2001).
With an early sowing time, the grain moisture content at harvest can be considerably
reduced (Árendás, 2000). Very early and early hybrids have a wider optimal sowing
time interval than hybrids with longer vegetation periods (Sárvári, 2005).
The optimum plant density of maize hybrids depends not only on the length of the
variety’s vegetation period but also on the genotype (Nagy, 2000). According to Pepó et
al. (2002), the efficacy of maize production can only be improved via a hybrid-specific
plant density adapted to the growing site and the agronomical conditions.

Vol. 37, 2009, Suppl. Cereal Research Communications
54
Materials and methods
The experiments were carried out on typical meadow soil in four repetitions in the
period of 2007-2008. The organic matter content of the meadow soil was 4.2 % and the
groundwater level was 2-2.5 m.
The soil could be characterized by high clay content and poor phosphorus and medium
potassium contents.
Weather varied greatly among the experimental years. 2007 was a dry year, the amount
of precipitation in the vegetation period of maize was 303.2 mm and 355.6 mm in 2007
and 2008, respectively. The 30-year average of precipitation (April-September) was
345.1 mm. The amount of precipitation was 41.9 mm lower and 14.1 mm higher in
2007 and 2008, respectively, than the average of 30 years.
The monthly mean temperatures in the vegetation period of maize were 1.96 o
C and 0.6
oC higher in 2007 and 2008, respectively, than the average of many years.
Weather data of 2007 and 2008 are presented in Figure 1
2007.
-5
0
5
10
15
20
25
30
35
40
Jan. Febr. March Apr. May. Jun. July Aug. Sept.
Tem
per
atu
re oC
0
10
20
30
40
50
60
70
80
90
100
110
120
130
140
150
160
Pre
cip
ita
tio
n (
mm
)
Monthly precipitation
30-year averageprecipitationTemperature oC
2008.
-5
0
5
10
15
20
25
30
35
40
Jan. Febr. March Apr. May. Jun. July Aug. Sept.
Tem
per
atu
re oC
0
10
20
30
40
50
60
70
80
90
100
110
120
130
140
150
160
Pre
cip
ita
tio
n (
mm
)
Monthly precipitation
30-year average precipitation
Temperature oC
30-year average temperature
Figure 1. Weather data in Hajdúböszörmény 2007-2008
In the plant density and sowing time experiments, the standard nutrient supply was N
120, P2O5 80, K2O 110 kg ha-1
.
The fertilizer rates (active ingredient kg ha-1
) applied in the fertilization experiments
were N 40, P2O5 25, K2O 30 kg ha-1
as a basic dose while the highest dose was fivefold
the basic dose.
In the sowing time experiment, sowing was performed on 10 April, 25 April, 15 May.
In the plant density experiment, the relationship between plant density and yield was
analysed at plant densities of 45, 60, and 75 thousand plants ha-1
.
The results were evaluated by analysis of variance and parabolic regression analysis.
Results and discussion
Weather in 2007 was unfavourable for maize. Plant density and NPK fertilization
greatly determined the yield of maize hybrids. Without fertilization, the yield was 3.68-
5.19 t/ha. The lowest fertilizer dosage of N 40, P2O5 25, K2O 30 kg ha-1
increased the
yield by 2-3 t ha-1
. The optimum fertilizer dosage was N 120, P2O5 75, K2O 90 kg ha-1
.
The highest yields were obtained for hybrids PR38B12, PR38V45, PR37Y12 at a plant
density of 75 thousand plants ha-1
and for PR38A79 and PR37N01 at a plant density of

VIII. Alps-Adria Scientific Workshop Neum, Bosnia-Herzegovina, 2009
DOI: 10.1556/CRC.37.2009.Suppl.2 55
60 thousand plants ha-1
, while the yield of the hybrid PR35F38 was below 8 t ha-1
at all
three plant densities (Figure 2).
0
2
4
6
8
10
12
14
16
PR38B12 PR28A79 PR38V45 PR37N54 PR37N01 PR37Y12 PR35F38
45 60 75 thousand plants ha-1
LSD 5% Hybrid: 0.55 t ha-1
Plant density: 0.53 t ha-1
Interaction: 1.39 t ha-1
Yield t ha-1 2007.
0
2
4
6
8
10
12
14
16
X6P944 PR38A79 PR38R37 PR37K92 PR37N01 PR36V52 PR36D79 PR36Y23 PR35F38
2008.
Kontroll (1) 1 tr. (2) 2 tr. (3) 3 tr. (4) 4 tr. (5) 5 tr. (6)
Yield t ha-1
Figure 2. The effect of plant density on the yield of Figure 3. The effect of fertilization on yield of maize
maize hybrids in the average of the fertilizer treatments
(fertilizer levels 1-5, without control treatment)
In 2008, the correlation between fertilization and yield was very tight. The lowest
fertilizer dosage of N 40, P2O5 25, K2O 30 kg ha-1
increased the yield by 3-5 t ha-1
as
compared to the control (non-fertilized) plot, while there were only slight differences
among the different fertilizer dosages, the cause of which was the significant
mineralization of organic materials due to the favourable year.
The yield of the hybrids PR38A79 and PR38R37 was above 6 t ha-1
even without
fertilization. The best fertilizer responses were obtained for hybrids PR37K92 and
PR36Y23 (Figure 3).
Plant density greatly increased yield. The highest yields of hybrids were achieved at the
plant density of 75 thousand plants ha-1
.
In 2007, the highest yield was obtained for the second sowing time (25 April) for the
hybrid PR38A79, while all the other hybrids reached the maximum yield at the first
sowing time (10 April). The yield of hybrids ranged between 5.5 and 9.0 t ha-1
depending on the sowing time.
In 2008, the yield of hybrids ranged between 11 and 14 t ha-1
depending on the sowing
time due to the favourable year. The hybrids had a higher yield when the first sowing
time (10 April) was applied (Figure 4).
0
2
4
6
8
10
12
14
16
PR38B12 PR38A79 PR38V45 PR37N54 PR37N01 PR37Y12 PR35F38
03. Apr. 24. Apr. 15. May
Yield t ha-1
2007
0
2
4
6
8
10
12
14
16
X6P944 PR38A79 PR38R37 PR37K92 PR37N01 PR36V52 PR36D79 PR36Y23 PR35F38
18. Apr. 25. Apr. 13. May.
Yield t ha-1 2008
Figure 4. The effect of sowing time on the yield of maize on Hajdúböszörmény, 2007-2008

Vol. 37, 2009, Suppl. Cereal Research Communications
56
Sowing time also determined the grain moisture content at harvest. Depending on the
hybrid and sowing time, the grain moisture content at harvest in 2007 varied between
11.07 and 13.70 % (average: 12.39 %), 11.33 and 24.60 % (average 17.97 %) and 21.73
and 32.60 % (average 27.17 %) for the first, second and third sowing time, respectively.
In 2008, it was 11.93-17.87 (average 14.90 %), 13.33-20.60 % (average 16.97 %),
15.07-27.07 % (average 21.07 %) for the first, second and third sowing time,
respectively.
It can be concluded that the grain moisture content can be reduced by 3-5 % and 5-10 %
when applying the first sowing time as compared to sowing on 25 April and 15 May,
respectively.
N fertilization increased the protein content of maize hybrids by 0.5-1.0 %, a higher
plant density reduced the protein content and slightly increased the starch content of the
grains.
Conclusions
It can be concluded that the optimum NPK fertilizer dosages of the studied hybrids are
N 40-120, P2O5 25-75, K2O 30-90 kg/ha active ingredient depending on the hybrid and
the year. Plant density is a major determining factor of yield.
Maize hybrids gave the highest yield at the plant density of 75 thousand plants ha-1
.
With increasing plant density, the individual yield (cob size) was reduced, but the yield
per unit area (ha) increased.
The yield was higher while the grain moisture content at harvest was 5-10% lower at the
earlier sowing time (10 April), which results in lower drying costs.
The application of fertilization, plant density and sowing time should be hybrid-specific.
References
Árendás T.: 2000. A kukoricatermesztés korlátairól és lehetıségeirıl. Magyar Mezıgazdasáság.
Berzsenyi Z. – Gyırffy B.: 1997. A vetésforgó és a trágyázás hatása a kukorica termésére és
termésstabilitására tartamkísérletben. Növénytermelés. 45. 281-296.
Bocz E.: 1976. Trágyázási útmutató. Mezıgazda Kiadó, Budapest. 257.
Nagy J.: 1978. Az optimális víz és tápanyagellátás hatása a borsó és kukorica növények növekedésée,
fejlıdésére és termésmennyiségére. Egyetemi doktori értekezés, Debrecen.
Nagy J.: 1997. A mőtrágyázás hatása a kukorica (Zea mays L.) termésére öntözés nélküli és öntözéses
termesztésben. Agrokémia és Talajtan. 46. 1-4. 275-288.
Nagy J.: 2000. A talajmővelés és a mőtrágyázás hatása a kukorica (Zea mays L.) termésére aszályos és
kedvezı évjáratokban. In: Nagy J., Pepó Pé. (szerk.) Talaj, növény és környezet kölcsönhatásai III..
Debrecen. 97-119.
Németh T. – Kádár I.: 1999. Nitrát bemosódásának vizzsgálata és nitrogénmérlegek alakulása egy
mőtrágyázási tartamkísérletben. Növénytermelés. 48. 377-386.
Németh T.: 2001. A tápanyag-gazdálkodás szerepe a szántóföldi növénytermesztésben. MTA
Agrártudományok Osztálya, Budapest. 106-132.
Nyíri L.: 1993. Földmőveléstan. Mezıgazda Kiadó, Budapest. 438.
Sárvári M.: 2005. Agrotechnikai tényezık hatása a kukorica adaptációs képességére és termésbiztonságára. In:
Nagy J. (szerk.) Kukoricahibridek adaptációs képességének és termésbiztonságának javítása. Debrecen.
183-203.
Pepó P. – Szabó P. – Szieberth D.: 2002. Az állománysőrőség szerepe a fajtaspecifikus
kukoricatermesztésben. Agrofórum. 13. 3. 34-36.
Várallyay Gy. – Németh T.: 1996. A fenntartható mezıgazdasái talajtani-agrokémiai alapjai. MTA
Agrártudományos Osztályának tájékoztatója. Agrokémiai Kiadó, Budapest. 80-92.

VIII. Alps-Adria Scientific Workshop Neum, Bosnia-Herzegovina, 2009
DOI: 10.1556/CRC.37.2009.Suppl.2 57
EFFECTS OF ABIOTIC FACTORS (NPK FERTILIZERS + FUNGICIDES) ON THE RHEOLOGICAL CHARACTERISTICS OF WINTER WHEAT
Lajos TANÁCS1 – Tamás MONOSTORI1 – Károly BODNÁR1 – László GERİ2 – István M. PETRÓCZI3
1 University of Szeged Faculty of Agriculture, Hódmezıvásárhely 2 University of Szeged Faculty of Engineering, Szeged 3 Cereal Research Non-profit Company, Szeged
Abstract: Experiments were carried out with wheat varieties GK Garaboly, GK Kalász, GK Verecke, GK
Petur harvested in years 2005-2006. Small plots were sown at the Öthalom experimental station of the Cereal
Research Non-Profit Company after wheat forecrop, in a four-parallel random block design. NPK fertilizer
treatments of different level were combined with Artea + Amistar Xtra fungicide treatments of various doses
and spectrum. Results were evaluated for rheological characteristics using three-factor analysis of variance
(cultivar x treatment x year).
The fertilizer and fertilizer + fungicide treatments (factor B) had a statistically reliable effect at the 0.1% level
on the technological water absorption only. To summarize the results of the evaluated rheological parameters
we can conclude that the common effect of increasing fertilizer doses and modern fungicides of broad
spectrum works as a quality improving factor regarding baking value, technological water absorption, dough
development time and extensibility values. The effect of variety on the formation of several baking
characteristics is reliable. The phenophase of fungicide treatment can also influence several baking
characteristics therefore quality, too. Artea and Amistar Xtra applied at heading seem to have a negative effect
on quality in many cases. These are stresses which are factors influencing the baking quality of seed.
Keywords: fertilizer treatments, fungicide, variety, baking value, water absorbing ability.
Introduction
Fertilizer treatments of various doses and combinations, as well as fungicides applied at
different phenophases act as abiotic stress factors on crops including wheat. Most cases,
increasing fertilizer doses enhance yield, moreover they improve composition and
baking quality (Hoffmann et al. 2006, 2007; Jolánkai et al. 2006). Nitrogen containing
yield enhancers improve the nutritive value of seeds, this way increasing protein content
of wheat (Ruske et al. 2004; Jolánkai et al. 2006).
Tanács et al. (2003) studied the effect of 16 fungicide treatments applied at the 2-3 node
as well as at the heading-flowering stage on quality. Averaged over two varieties, the
time of stability tendentiously decreased in 13 cases due to the effect of fungicide
treatment. The results proved that the majority of the applied fungicides decrease the
resistance of the gluten network against kneading. Late foliar application of triadimenol
fungicide resulted in lower softness equivalent scores (Everts et al. 2001).
The aim of our experiments was to study how do NPK treatments of increasing doses
and various combinations as well as fungicides applied at different phenophases
influence rheological characteristics of doughs, water absorbing ability and baking
value at four winter wheat varieties cultivated in 2005, 2006.
Materials and methods
The studied wheat cultivars GK Garaboly, GK Kalász, GK Verecke, GK Petúr were
sown at the test area Öthalom of the Cereal Research Non-profit Company, Szeged, on a
deep-saline chernozem soil of medium nitrogen and good potassium and phosphorus

Vol. 37, 2009, Suppl. Cereal Research Communications
58
supply, in monoculture after wheat as forecrop, in the four-repeat, random block design.
The sowing dates were 26th
October 2004 and 14th
October 2005.
Table 1. Treatment with NPK fertilizers and fungicides (Szeged - Öthalom 2005-2006)
Fertilizer doses Fungicide doses and time of application
In autumn
kg/ha
In spring
kg/ha
Code of
treatment
N P K N
2nd node of stem
development
l/ha
Heading
l/ha
1. 30 0 0 30 - - - -
2. 30 0 0 30 - - Artea 0.5
3. 30 30 30 30 - - Artea 0.5
4. 30 30 30 30 Artea 0.5 Artea 0.5
5. 60 60 60 60 Artea 0.5 Artea 0.5
6. 60 60 60 60 Amistar Xtra 0.5 Artea 0.5
7. 90 90 90 90 Amistar Xtra 0.8 Artea 0.5
8. 90 90 90 90 Amistar Xtra 0.8 Amistar Xtra 0.8
The dates of fertilizer application were: 4
th October 2004, 5
th April 2005, as well as 13
th
October 2005 and 31st March 2006. The dates of fungicide treatment were: in 2005 at
2nd node stage (3rd
May) and heading (26th
May), similarly, in 2006 at 2nd node stage
(3rd
May) and heading (22nd
May).
The harvest dates were: 16th
July 2005 and 11th
July 2006. NPK fertilizer treatments of
increasing doses were combined with Artea + Amistar Xtra fungicide treatments of
various doses and spectrum (Table 1). Artea (propiconazole + cyproconazole) and
Amistar Xtra (azoxystrobin + cyproconazole) are fungicides of broad spectrum.
Results and discussion
Results were represented and evaluated in the case of rheological sub-characteristics, as
well as technological water absorbance and baking value (=valorigraphic value) using
three-factor analysis of variance (cultivar x treatment x year).
Considering the parameters studied, the effect of fertilizer (control) and fertilizer +
fungicide (factor B) treatments proved to be statistically reliable at the 0.1% level in the
case of technological water absorption only. The effect of treatments on baking value,
technological water absorbance, dough development time, stability, softening and
extensibility values averaged over the four varieties and the two years was not
statistically reliable. Baking value and technological water absorbance values increased
tendentiously as a result of higher fertilizer doses + fungicide treatments. Baking value. Averaged over two years and four wheat varieties, compared to the
control (Treatment 1) Artea applied at heading (Treatment 2), as well as Artea applied
at the second fertilizer level at heading (Treatment 3), or in both phenophases, 2nd node
stage and heading (Treatment 4) had a tendentiously deteriorating effect on baking
quality, in spite of the increasing fertilizer doses. The third fertilizer level + fungicide
treatment (Treatments 5 and 6) resulted in a tendentious improvement of baking quality.
At the fourth fertilizer level baking value improved further, but Amistar Xtra applied in
both phenophases (Treatment 8) tendentiously decreased baking value, compared to
Treatment 7 containing Artea and Amistar Xtra treatment (Table 2).

VIII. Alps-Adria Scientific Workshop Neum, Bosnia-Herzegovina, 2009
DOI: 10.1556/CRC.37.2009.Suppl.2 59
Table 2. Effect of fertilizers and fungicide treatments and crop years on the baking value of the four wheat
varieties (in relative value) (Cereal Research Non-profit Company, Szeged – Öthalom, 2005 – 2006)
2005 Variety (a) 2006 Variety (a) Code of treatment
(b) GK Garaboly
GK Kalász
GK Verecke
GK Petur
GK Garaboly
GK Kalász
GK Verecke
GK Petur
2-year mean of fert. + fung.
level (B)
1. 54.50 74.93 83.27 60.90 49.73 94.63 80.90 80.23 72.39
2. 45.50 79.60 72.30 66,53 47.03 88.63 81.83 89.00 71.30
3. 54,00 75.37 73.30 59.07 56.10 95.73 76.70 85.60 71.98
4. 45.93 79.47 78.17 65.33 52.30 96.20 75.43 85.53 72.30
5. 44.87 74.57 78.87 67.83 62.03 90.73 74.43 86.47 72.48
6. 46.53 74.13 82.87 71.13 56.83 93.13 81.87 87.30 74.23
7.. 43.57 81.00 88.50 75.17 58.50 96.70 69.10 84.73 74.66
8. 53.03 82.23 76.77 58.33 58.60 100.00 73.23 82.27 73.06
Mean of
var. (A) 48.49 77.66 79.25 65.54 55.14 94.47 76.69 85.14 72.80
Mean of
year (C) 67.74 77.86
LSD 5%, between any two values, a1b1c,-a4b3c2 15.69
LSD 5%, between variety means, a1-a4 22.13
LSD 5%, between fertilizer and fung. treatment means, b1-b5 22.13
LSD 5% between years means, c1-c2 22.13
Note: In Tables 2-3 bold numbers mean the positive while underlined values the negative alterations
compared to control. Table 3. Effect of fertilizers and fungicide treatments and crop years on the water absorbing ability of the four
wheat varieties (in per cent) (Cereal Research Non-profit Company, Szeged–Öthalom, 2005–2006)
2005 Variety (a) 2006 Variety (a) Code of treatment
(b)
GK Garaboly
GK Kalász
GK Verecke
GK Petur
GK Garaboly
GK Kalász
GK Verecke
GK Petur
2 –year mean of
fert.+ fung.
level (B)
1. 59.20 63.47 62.40 56.60 56.27 61.07 63.93 52.07 59.38
2. 57.27 64.27 61.47 57.53 57.07 60.67 62.47 52.67 59.18
3. 59.20 65.73 60.27 59.33 57.67 62.80 61.07 52,13 59.78
4. 60.07 67.00 62.40 57.80 59.33 62.40 61.80 53.20 60.50
5. 61.00 64.47 63.40 61.73 59.00 63.13 61.60 53.27 60.95
6. 62.40 66.53 62.73 60.13 58.40 62.07 61.53 52.47 60.78
7. 63.07 68.53 63.33 61.53 57.93 64.80 62.87 58.93 62.63
8. 60.60 68.20 63.33 61.53 59.47 63.13 62.67 57.27 62.03
Mean of
var. (A) 60.35 66.03 62.42 59.53 58.14 62.51 62.24 54.00 60.65
Mean of
year (C) 62.08 59.22
LSD5%, between any two values, a1b1c1-a4b5c2 2.53
LSD5%, between variety means, a1-a4 3.57
LSD5%, between fertilizer and fung. treatment means, b1-b5 3.57
LSD5%,between years. means, c1-2 3.57
Water absorbing ability. Artea applied at heading (Treatment 2) tendentiously reduced
technological water absorbing ability. Increasing fertilizer doses tendentiously improved
this baking characteristic. Regarding this phenomenon, too, Amistar Xtra applied in
both phenophases tendentiously decreased the values of water absorbing ability
compared to Artea and Amistar Xtra fungicide treatment (Table 3).

Vol. 37, 2009, Suppl. Cereal Research Communications
60
Dough development time. The fourth fertilizer level (Treatments 7 and 8) tendentiously
increased dough development time compared to control. At Treatment 8, Amistar Xtra
applied in both phenophases tendentiously increased swelling time.
Dough softening. On the third (Treatments 5-6) and fourth (Treatment 7) fertilizer levels
the value of dough softening decreased tendentiously, thus the quality improved. On the
first fertilizer level Artea sprayed out at heading (Treatment 2) tendentiously increased
the. On the fourth fertilizer level, at Treatment 8 Amistar Xtra tendentiously increased
softening values compared to Artea and Amistar Xtra fungicide combinations
(Treatment 7), thus decreasing quality.
Extensibility. Tendentious increase in extensibility values can be detected at Treatments
5, 7, 8 only, suggesting quality improvement. Application of fungicides in general
tendentiously decreased extensibility values. On the fourth fertilizer level, Amistar Xtra
applied at both phenophases (Treatment 8) tendentiously decreased extensibility values
compared to Artea and Amistar Xtra fungicide treatments (Treatment 7).
Conclusion
To sum up, in the case of the evaluated parameters we can conclude that increasing
fertilizer doses always act as quality improving factors regarding baking value,
technological water absorbance, as well as, at higher fertilizer doses, for swelling time
and stability. In contrast, the effect of fungicides is not always evident.
As the result of the counter-effect of fertilizers and fungicides applied at different
phenophases, the quality improving effect of increasing fertilizer doses could not get on
significantly. The effect of variety on the changes in certain rheological characteristics
was found to be reliable.
Above all, fungicides and their active ingredients applied at heading had a special way
of influence on the formation of certain baking properties. Wet or dry pre-harvest weather can cause counter-effects in the formation of baking
value, as well as technological water absorbance (Tanács and Soós 2001).
References
Evert, K.L. – Leath, S. – Finney, P.L. (2001): Impact of powdery mildew and leaf rust on milling and backing
quality of soft red winter wheat. Plant Disease, 85: 423-429.
Hoffmann, S. – Debreceni, K. – Hoffmann, B. – Nagy, E. (2006): Grain yield and baking quality of wheat as
affected by cropyear and plant nutrition. Cereal Research Communications, 34: 1. 473-476.
Hoffmann, S. – Debreczeni, K. - Berecz, K. (2007): Grain yield of wheat and maize as affected by previous
crop and seasonal impats. Cereal Research Communications, 35: 2. 469-472.
Jolánkai, P. – Tóth, Z. – Kismányoki, T. (2006): Effect of nitrogen and pesticides on the yield and protein
content of winter wheat. Cereal Research Communications, 34: 1. 509-512.
Ruske, R.E. – Gooding, M.J. – Dobraszczyk, B.J. (2004): Effects of triazole and strobilurin fungicide
programmes with and without late-season nitrogen fertilizer, on the baking quality of Malacca winter
wheat. Journal of Cereal Science 40: 1-8.
Tanács, L. - Soós, J. (2001): Effect of chemical treatments on the valorigraph grain quality index of winter
wheat varieties. Növénytermelés, 50: 2-3. 153-168.
Tanács, L. – Gerı, L. – Soós, J. (2003): Rheological characteristics of doughs from wheat varieties treated
with fungicides in different phenophases. Növénytermelés, 52: 3-4. 291-304.

VIII. Alps-Adria Scientific Workshop Neum, Bosnia-Herzegovina, 2009
DOI: 10.1556/CRC.37.2009.Suppl.2 61
THE PROPORTION OF WEATHER CONDITIONS ON AGRONOMIC TRAITS VARIABILITY OF WINTER WHEAT IN ENVIRONMENTALLY-SOUND TECHNOLOGIES
Milan MACÁK 1 – Štefan ŽÁK 2 – Nora SZOMBATHOVÁ 1 – Eva CANDRÁKOVÁ 1
1 Department of Sustainable Agriculture and Herbology, Faculty of Agrobiology and Food Resources, Slovak
University of Agriculture, Tr. A.Hlinku 2, 949 76 Nitra, Slovak Republic, e-mail: [email protected] 2 Research Institute of Plant Production in Piešťany, Bratislavská cesta122, 921 68 Piešťany, Slovak Republic
Abstract: The field experiment was carried out over the period 1999-2005 on Luvi-Haplic Chernozem in
Western Slovakia. The purpose of the study was to investigate the impact of weather conditions, organic and
low input system under two N fertilization treatments on yield and yield components and quality traits of
winter wheat. Winter wheat was grown in six-crop rotation pattern as follows: common pea – winter wheat –
early potato – spring barley with the under-sowing of red clover – first year red clover – winter wheat. The
partitioning of the variance showed that weather conditions prevailing during particular evaluated year were
the most important factor in determining yield of winter wheat, thousand of kernels weight, number of spike
per m2 and weight of kernels per spike. Relatively small proportion of total variance (that is explained by
growing system) can be the result of the suitable crop rotation pattern and evaluated management practices
(green manure, catch crops, farm yard manure). Grain yields of winter wheat calculated from the mean values
achieved during seven years significantly differed between organic (5.97 t ha-1) and low input (6.34 t ha-1)
systems. A top dressing of wheat by Vermisol significantly influenced crude protein and wet gluten content.
The present study contributes to designing of management practices to reduce environmental impacts and
improve crop production.
Keywords: organic and low input system, environmental stress, winter wheat, yield, yield components
Introduction
Abiotic stress is the most harmful factor limiting the growth and productivity of cereals
crops worldwide. Very often it is the simultaneous occurrence of several abiotic
stresses, rather than a particular stress condition (Mittler, 2005). The effect of a
combination of drought and heat stress on crop production is remarkable (Márton,
2008). Since winter wheat is a quite stress tolerant species, but even in Middle Europe
the drought may case remarkable losses in grain yield and quality (Matuz et al., 2008).
However, plants grown in healthy soil and suitable cropping systems are less
susceptible to such stressors (Bujnovský, 2000; Birkás et al., 2008a), but in sustainable
and more resistant cropping systems have to be taken into account also plant and soil
interrelations (Jolankai, et al., 2008). Nevertheless, surface protection during and out of
the growing season and cover plants are recognized as fundamental requirements for
mitigate climate-stress (Birkás et al., 2008b). Development of environmentally sound
production systems on arable land is great challenge of agricultural research and
involves many partial targets (Lacko Bartošová, 2006a; Kvaternjak et al., 2008;
Porhajašová et al., 2008; Valtýniová and Křen, 2008). The principal aim of the present
study was to investigate the impact of weather conditions on yield, yield components
and quality traits of winter wheat grown in organic and low input system.
Materials and methods
The field experiment was carried out over the period 1999-2005 on Luvi-Haplic
Chernozem in Borovce, Western Slovakia (E 17º75’, N 48º58’). The location has a
continental climate with an average annual temperature of 9.2 ºC and an average annual

Vol. 37, 2009, Suppl. Cereal Research Communications
62
precipitation of 593 mm. A split-plot design experiment with four replicates of a six-
course crop rotation was designed as follows: common pea – winter wheat and catch
crops – early potato and catch crops – spring barley undersown with red clover – first
year red clover – winter wheat and catch crops. Experimental details of plant culture
and weather conditions are shown in Table 1.
Table 1. Experimental details of plant culture of winter wheat in Borovce – Slovakia during years 1998-2005.
Weather condition
from sowing to harvest
Years
Sowing
date
Crop
emergence
date
Time
(days)
after crop
emergence
Dates of
harvest rainfall
(mm)
sum of
temp. (˚C)
sunlight
(hours)
1998/1999 24 October 16 November 269 19 July 430.0 1709.20 1185
1999/2000 05 October 17 October 276 06 July 331.0 1851.00 1370
2000/2001 05 October 15 October 283 14 July 363.7 2066.25 1282
2001/2002 09 October 18 October 274 09 July 341.3 1916.00 1357
2002/2003 10 October 25 October 266 02 July 320.0 2036.00 1369
2003/2004 13 October 03 November 282 20 July 324.2 2117.55 1271
2004/2005 05 October 19 October 285 16 July 412.8 2184.75 1433
In organic system, the cultural practices were performed in accordance with the IFOAM
rules. Well composted farmyard manure (FYM) was applied under potato (30 t ha-1
) and
winter wheat (15 t ha-1
). For qualitative fertilization a top-dressing of 50 L ha-1
Vermisol
was applied, but only on fertilized treatment. Straw and crops residues were ploughed in
by tillage and catch crops phacelia and mustard were sown. The low input system uses
the same production practices as organic farming but allows limited use of pesticides
and mineral fertilizers inputs. The dose of 30 + 30 N kg ha-1
; and P, K mineral fertilizers
calculated according to input output balance were applied (Bujnovský and Ložek,
1996). When winter wheat on particular stands was matured, plant samples from an area
of 0.5 m2 were uprooted and used for analysis of yield components and qualitative
analysis from each subplot replication. After, the rests of total subplot area from each
replication were harvested for grain and straw yield. The data were statistically
evaluated by analysis of variance using the Statg. plus version 5.0 and the Fisher’s
protected LSD test.
Results and discussion
To evaluate the climatic conditions impact on winter wheat growing in two
environmentally sound cropping systems we have investigated the variation in yield and
yield components structure and selected quality traits.
Partitioning of the variance (Table 2) showed that climatic conditions prevailing during
a specific year was the crucial factor in determination of winter wheat grain yield
(84.1%) and thousand of kernels weight (85.9%), followed by kernels per spike
(55.2%), weight of kernels per spike (47.8%) and spike length (42.6%). Relatively small
proportion of total variance (that is explained by different growing system) can be the
result of the suitable crop rotation pattern and evaluated management practices (green
manure, catch crops, FYM).

VIII. Alps-Adria Scientific Workshop Neum, Bosnia-Herzegovina, 2009
DOI: 10.1556/CRC.37.2009.Suppl.2 63
Table 2. Partitioning of yield components, yield and quality traits of winter wheat by ANOVA analysis for the
years 1999-2005.
Components Years (Y) Systems
(S) Y x S
Explain
variance Residual Total
SS 134.87 3.89 5.06 8.30 160.43 Yield of grain
V 84.07 2.42 3.15 89.64 5.17 -
SS 685303 14265 44133 182981 1330609 Number of spikes
per m-2 V 51.50 1.07 3.32 55.89 13.75 -
SS 2114.82 14.21 111.79 914.65 3827.96 Kernels per spike
V 55.25 0.37 2.92 58.54 23.89 -
SS 1626.42 1.46 305.14 1057.6 3819.13 Spike length
V 42.59 0.04 7.99 50.62 27.69 -
SS 3.84 0.24 0.20 2.01 8.03 Weight of kernel per
spike V 47.82 2.99 2.49 53.30 25.03 -
SS 2345.7 96.23 33.32 187.34 2732.34 Thousand of kernels
weight (TKW) V 85.85 3.52 1.22 90.59 6.86 -
SS 298.79 25.53 15.14 19.15 386.44 Crude protein
V 77.32 6.61 3.92 87.85 4.96
Wet gluten SS 5386.41 489.81 264.56 369.07 7128.23
V 75.56 6.87 3.71 86.14 5.17
SS - sum of square, V - variance (% of total)
Climatic conditions considerably influenced average content of crude protein and wet
gluten, which ranged from 7.91/15.64% in 2001 to 13.20/39.78% in 2003 respectively,
so the effect of climatic conditions during all evaluated years were 77.3% of the total
variance in crude protein and 75.6% in wet gluten. Similarly Seremesic et al. (2008)
noted significant influence of cropping years and crop rotation on variability of grain
protein content of winter wheat. In spite of great proportion of variance (due to
environmental factors), a top-dressing of Vermisol significantly increased the content of
crude protein (from 10.99% to 11.57%) and wet gluten (from 28.7% to 31.2%).
Table 3. Effect of organic and low input systems on yield components, yield and quality traits of winter wheat
during years 1999-2005.
Systems Yield of
grain
t ha-1
Number
of spikes
per m-2
Number of
kernels per
spike
Weight of
kernels per spike
g
TKW
g
Crude
protein
%
Wet
gluten
%
Organic 5.97** 519.6* 37.11 NS 1.63** 42.18** 10.80** 27.87**
Low
input
6.34** 497.1* 37.82 NS 1.72** 44.04** 11.75** 32.05**
LSD 0.05 0.13 20.35 1.43 0.06 0.65 0.20 0.91
LSD 0.01 0.18 27.05 1.91 0.08 0.86 0.27 1.21
*, ** significant at P < 0.05 and P < 0.01 probability level respectively, NS non significant
In our study, beside number of kernels per spike, in all yield components the organic
and a low input system differed significantly (Table 3). Grain yields of winter wheat
calculated from the mean values achieved during seven years significantly differed
between organic (5.97 t ha-1
) and low input (6.34 t ha-1
) system. Generally, agronomic
disturbances and cropping systems affect crops qualitative and quantitative traits
through alteration of soil temperature, moisture and nutrients availability (Kováčik et
al., 2006; Lacko-Bartošová, 2006b; Hoffman et al., 2007).

Vol. 37, 2009, Suppl. Cereal Research Communications
64
Our results indicate that significantly lower number of spikes in low input system was
compensated by significantly higher TKW and weight of kernels per spike.
Conclusions
Results obtained in this study contribute to the development of environmentally sound
technologies which have the potential for mitigation of environmental stresses. Beyond,
our work also promotes the management practices for mitigation of environmental
stresses through increasing of soil cover (suitable crop rotation, catch crops,
undersowing) and adoption of less intensive cropping systems.
Acknowledgements
The paper was supported by the VEGA 1/4441/07 “Ekologization of agronomical
practices and the Environemntal Function of Agriculture on the Intensive Farmland”.
References
Birkás, M. – Szemık, A. – Antos,G. – Neményi, M.: 2008a. Environmentally-sound adaptable tillage.
Akadémiai Kiadó, Budapest.
Birkás, M. – Stingli, A. – Szemık. A. – Kalmár. T. – Bottlik. L.: 2008b. Soil condition and plant interrelations
in dry years. Cereal Research Communications, 36: 15-18.
Bujnovský, R.: 2000. Towards the soil quality evaluation. Ecology-Bratislava, 19: 3. 317-323.
Bujnovský, R. – Ložek, O.: 1996. Zásady výpočtu dávok hnojív a ich aplikácia. VUPU, Bratislava.
Hoffman, S. – Debreczeni, K. – Hoffmann, B. – Berecz, K.: 2007. Grain yield of wheat and maize as affected
by previous crop and seasonal impacts. Cereal Research Communications, 35: 2. 469-472.
Jolánkai, M. – Nyárai, H.F. – Tarnawa, Á. – Klupács, H. – Farkas, I.: 2008. Plant soil interrelations. Cereal
Research Communications, 36: 7-10.
Kováčik, P. – Jančovič, J. – Tomáš, J.: 2006. Nitrogen fertilization of spring barley at tillering stage.
Agriculture, 52: 2. 77-86.
Kvaternjak, I. – Kisic, I. – Birkas, M. – Sajko, K. – Simunic, I.: 2008. Soil tillage as influenced by climate
change. Cereal Research Communications, 36: 1203-1206.
Lacko-Bartošová, M.: 2006a. Sustainable agricultural systems – production and qualitative parameters.
Scientifical Papers Agriculture, 38: 151-154.
Lacko-Bartošová, M.: 2006b. Sustainable agricultural systems – productivity and winter wheat quality.
Bibliotheca Fragmenta Agronomica, Proceeding of the IX ESA Congress, Warszawa, Part II, 11: 549-
550.
Márton, L.: 2008. Long-term study of precipitation and fertilization interactions on winter wheat (Triticum aestivum L.) yield in the Nyírlugos field trial in Hungary between 1973 and 1990. Cereal Research
Communications, 36: 3. 511-522.
Matuz, J. – Cseuz, L. – Fonád, P. – Pauk, J.: 2008. Wheat breeding for drought resistance by novel field
selection methods. Cereal Research Communications, 36: 123-126.
Mittler, R.: 2006. Abiotic stress, the field environment and stress combination. Trends in Plant Science, 11: 1.
15-19.
Porhajašová, J. – Petřvalský, V. – Šustek, Z. – Urminská, J. – Ondrišík, P. – Noskovič, J.: Long-termed
changes in ground beetle (Coleoptera: Carabidae) assemblages in a field treated by organic fertilizers.
Biologia, 63: 6. 1184-1195.
Seremesic. S. – Djuric. V. – Milosev. D. – Jacimovic. G. The effects of crop rotation and nitrogen on grain
yield and protein content of winter wheat. Cereal Research Communications, 36: 691-694.
Valtýniová, S. – Křen, J.: 2008. Analysis of organic and conventional farming system – a case study. Acta
Agrophysica. 11: 1. 271-278.

VIII. Alps-Adria Scientific Workshop Neum, Bosnia-Herzegovina, 2009
DOI: 10.1556/CRC.37.2009.Suppl.2 65
ADAPTIVE RESPONSE AND STRESS TRANSFER OF PLANT PRODUCTION AND CONNECTED SYSTEMS
Kálmán RAJKAI1 – Zsófia BAKACSI – Árpád TÖRZSÖK2 – Szilárd KESZTHELYI3
1 Soil Science Department, Institute for Soil Science and Agricultural Chemistry of Hungarian Academy of
Sciences, 1025 P.O.Box, Budapest, Hungary, e-mail: [email protected] 2 Arkon Zrt., 1461 P.O.Box 390, Budapest, Hungary, e-mail: [email protected] 3 Farm Business Analysis Department of Agricultural Economics Research Institute, 1355 PO Box 5,
Budapest, 55. Hungary, e-mail: [email protected]
Abstract: In the real world systems are in many ways interrelated to other systems, applying stress on one of
them will have an effect on the other. In a controlled system, adaptive response can be improved in a way that
the connected systems face less stress. In this approach we take plant production as a system controlled
through nitrogen fertilizer and irrigation, and nitrogen leaching as an example for stress imposed on the
connected ecological system. A plant growth model is used to demonstrate adaptation ways to different direct
environmental stressors as drought and deficiency of available nitrogen. The adaptive response of the plant
(i.e. slower growth) imposes stress on the ecological system. The amount of stress transferred by a controlled
system can be reduced through control. Such a control presumes using models to predict adaptive response,
feedback control is prone to over regulation. Modeling also allows easy interfacing to other modeled systems
like ecologic or even the economic system, and thus the amount of stress transferred can be balanced to avoid
extreme consequences. Our conclusion is that careful analysis and a better control can improve sustainability
of plant production even within changing climatic and economic conditions.
Keywords: nitrogen leaching, fertilization, crop model, economy sub-model, environmental stress
Introduction
Recent changes of the climate often meant less precipitation and lead to reduced yields
in some areas. Shortage or lack of water is an obvious stress to most plants but for the
plant production business less yield over prolonged periods of time involves the risk of
bankruptcy. The stress introduced by water shortage will occur as economic stress for
the farmers and their adaptation may transfer amplified stress back to the environment.
Ecological awareness, use of models, careful planning and self restraint can reduce the
stress transferred to nature. Reducing the stress imposed to nature is an approach that is
less strict than “sustainability”, but it is still a huge step forward.
The model we use to demonstrate the above statement combines simulations of plant
growth, soil fertility and economic results of crop yields. Though the model internals
use a large number of parameters and data, we focus on two variable inputs and two
outputs to be observed. Végh and Szundy (2004), and Végh et al. (2003) demonstrated
that water (i.e. precipitation and irrigation) and nitrogen, the two primary “nutrients” of
wheat. These are the model variable inputs. One of the outputs observed is gross margin
(the difference of certain income types and costs): reduction of monetary results is a
stress factor that induces the farmer’s adaptation (Takács-György, 2007). The other
output, the stress transferred to the surrounding nature, is nitrogen leaching, which is the
drainage of water and movable nitrogen compounds from the field to groundwater and
the downstream ecosystem. Nitrogen leaching to a threshold is one possible criterion of
sustainability of a plant production scheme that can be observed and tested with this
model.
The numerous other parameters used by the model include a detailed description of the
soil (8 parameters), weather conditions as well as cultivation options such as the crop
selection, fertilizer dose and irrigation.

Vol. 37, 2009, Suppl. Cereal Research Communications
66
By coupling the crop growth model with economic factors such as expenses and
incomes allows testing profitability, thus economic sustainability similarly. This
combined model is used to demonstrate adaptation ways to different direct
environmental stressors as drought and deficiency of available nitrogen.
The stress–adaptation cycle of the connected systems in our approach is the following:
Primary stress is drought. The adaptive response of the plant (i.e. slower growth)
imposes stress on the agro-ecological production system in the form of lower yield.
Depending on the adaptive answer by the farmer a certain amount of stress transferred
to nature. This amount can be reduced by a controlled agricultural plant production
system through controlling water and available nitrogen supply of the crop.
Materials and methods
The study area situates in the Nyírség region of the Great Hungarian Plain. It is a part of
the large basin filled with fluvial-, plus eolic sand and loess sediments. The slightly
undulate surface is between 97 and 162 m above Baltic Sea level. The mean annual
precipitation is close to 600 mm with rather inhomogeneous distribution. Potential
evapotranspiration (ET) exceeds the precipitation consequently the soil water balance is
negative. Groundwater table depth varies between 2 and 4 m.
Soil types of the study area are humus sandy and chernozem like meadow soils with
loamy sand texture. Soil characteristics used as model inputs are given in Table 1.
Table 1. Soil properties of the study area used as model parameter values
Model runs included three different annual precipitation patterns: average (550 mm),
wet (610 mm) and dry (520 mm), and two field crops, winter wheat and rye. Model
options include irrigation, but irrigation of this kind – especially in this area – is strictly
theoretical. When irrigation is switched on, the model assumes that all the water needed
by the plant is available.
Economic aspects of the model boil down to optimizing gross margin of the specific
production. Gross margin is the difference between the production value and variable
costs. We have to stress that gross margin is neither income nor profit. Variable costs
are only a part of a farm’s costs, fixed costs like rent and depreciation are not covered.
A high gross margin can mean loss especially when paired with expensive machinery,
and therefore high depreciation costs. The simulated economic results, production value
and cultivation costs are based on FADN data (Keszthelyi, 2006).
Optimization is done by Excel’s Solver. The economic optimum is the highest possible
gross margin as a function of fertilizer use under the conditions given by precipitation
pattern, cultivation type and the constraint of N leaching that should be under 50 mg l-1
.
Soil Layer
depth
cm
Texture H
%
Clay
%
Ground water
table depth
m
NO3-
kgha-1
CN
ratio
0-30 loamy
sand
1.7 11
-
40 20
30-80 loamy
sand
0.1 11 3.5 0 0

VIII. Alps-Adria Scientific Workshop Neum, Bosnia-Herzegovina, 2009
DOI: 10.1556/CRC.37.2009.Suppl.2 67
Leachable N is assumed to be 30% of available N. For soil described in Table 1 the
amount of N in kgha-1
approximately equals to the N-concentration of soil solution in
mgl-1
since usable water storage of the 80 cm deep soil profile is 110 mm.
Results and discussion
On this land, assuming rye production and N fertilizer dose of 80 kgha-1
, the difference
in gross margin between a wet and a dry year is roughly 50%. Such drop in gross
margin will often mean loss for the farmer. The farmer trying to cope has few
opportunities in the range of agricultural production. He can try to compensate yield
loss by increasing the dose of N fertilizer. To reach the same gross margin the amount
of fertilizer should be increased to 100 kgha-1
. By increasing the dose to 160 kgha-1
,
modeled gross margin can even be doubled in a dry year.
Figure 1. Modeled potentially leachable nitrogen amount from a differently cultivated rye field
Such a dosage raises the risk of nitrogen leaching but not dramatically. Figure 1 shows
how the amount of leachable N rolls off throughout the with rye production using
different fertilizer doses (0, 80 and 160 kgha-1)
, with and without irrigation. Only the
highest dose of fertilizer the N concentration of the leachable soil solution is above 50
mgl-1
. We emphasize, that this amount is potentially leachable. If there is no heavy rain
or high water table before the vegetation begins, N will stay in the soil and will be
available for the plant to take. In practice N fertilizer is usually applied in two doses,
one in autumn and one in spring. It means that the potentially leachable amount is
increased to some extent, but the time span of the risky period is reduced to a few
weeks.
0
1 0
2 0
3 0
4 0
5 0
6 0
Po
ten
tial
N le
ach
kg
ha
-1
N 0
N 0 Ir r ig a te d
N 8 0
N 8 0 Ir r ig a te d
N 1 6 0
N 1 6 0 I r r ig a te d
J A N F E B M A R A P R M A Y J U N J U L A U G S E P O C T N O V

Vol. 37, 2009, Suppl. Cereal Research Communications
68
High N dosage still means a risk of environmental stress. If the crop does not take up N
due to unfavorable weather conditions, disease or pest damage the remaining N is
potentially leachable throughout the whole year (e.g. Rutkoviene et al. 2007).
Figure 1 shows how the leachable N changes under different production conditions. The
economic optimization process of the model specifies non-irrigated and irrigated N
doses for rye production. As Fig. 1 shows even high doses of N fertilizer mean no stress
for the environment under normal conditions. Ideal irrigation water supply provided by
the crop requirement reduces the leachable N amount due to N uptake. However the
reduced precipitation does not mean less heavy rains and floods, on the contrary,
extreme weather conditions may occur more frequently.
Table 2. Simulated crop yields and gross margins of N-fertilizations and irrigation
Crop Rainfall
mm
Irrigation
mm
N-fertilizer
kgha-1
yield
tha-1
Gross margin
HuFt
610
wet 0
110
0 80 180 1.5
2.1
3.2
4,9
5.2
7.2
-3400
13400
44400
92000
52000
139400
550
average 0
150
0 50 180 1.6
2.1
2.4
4.2
4.6
7.2
-8500
20280
17000
67500
52000
139800
Wheat
520
dry 0
170
0 40 180 1.6
2.1
2.0
3,5
4.3
7.2
-10500
13400
2500
58500
42400
139400
610
wet 0
90
0 130 160 1.9
2.4
5.1
6.1
5.5
6.2
20000
25500
95800
115600
97700
142000
550
average 0
120
0 100 160 1.9
2.4
4.1
5.4
5.4
6.2
14300
32000
71300
105900
94900
117400
Rye
520
dry 0
140
0 80 160 1.9
2.4
3.5
5,1
5.4
6.2
12700
32000
47900
95700
94500
116200
Conclusions
Reduced precipitation and is a stress for crop production. This stress is immediately
transferred to the farmer in the form of lower yields and reduced gross margin. The
farmer’s adaptation, the usage of economically optimal – thus higher – fertilizer dose
reduces stress under normal conditions. In case the weather changes for the worse, the
adaptation will still reduce the stress on the farmer, but the stress is transferred to the
environment in the form of N leaching.
References
Takács-György K. 2007. Economic effects of chemical reduction in arable farming. Cereal Research
Communications, 35: 1177 – 1181.
Végh K. R. and Szundy T. 2004. Water supply and utilization of maize genotypes. Agrokémia és Talajtan,
53: 5-6. 35-55. (in Hungarian)
Keszthelyi, Sz.: 2008. Results of F.A.D.N farms in 2007. In
Agricultural Management Reports, 8., AKI, Budapest. (in Hungarian)
Végh K. R., Füleky Gy., and Gupta S.C. 2003. N supply and N fertilization effects on N turnover of sand and
loam texture soils under different precipitations. In.: B. Vécsi and Gy. Elek (eds.) XVII. Conference on
Environmetnatl Protection. Siófok, 2002., p 356-364. (in Hungarian)
Rutkoviene V., L. Cesoniene, D. Steponavicius 2007. Nitrogen losses from organic and mineral fertilizers in a
model soil system. Cereal Research Communications, 35: 313-316.

VIII. Alps-Adria Scientific Workshop Neum, Bosnia-Herzegovina, 2009
DOI: 10.1556/CRC.37.2009.Suppl.2 69
OLD-FIELD SUCCESSION ON ABANDONED SOILS, AND OPPORTUNITY TO REDUCE BIOTIC STRESS BY SKIPPING EARLY WEEDY STAGES
Péter CSONTOS 1,4
– Júlia TAMÁS 2 – Orsolya SZÉCSY
1 – Csaba SZINETÁR
3 –
Michael KIEHN 4
1 Institute for Soil Science and Agricultural Chemistry, Hungarian Academy of Sciences, P.O. box: 35.
Budapest, H-1525 Hungary, e-mail: [email protected] 2 Botanical Department, Hungarian Natural History Museum 3 Institute of Biology, University of West Hungary 4 Department of Biogeography and Botanical Garden, University of Vienna
Abstract: Weed invasion is a serious biotic stress on fallow lands. To suppress weeds, it is suggested to sow
high diversity seed mixtures composed by non-weedy disturbance tolerant and generalist members of the
biological flora. Available seed ecological knowledge on these species is more or less satisfactory regarding
seed weight, seed shape and dispersal type, however, more research needed to learn their soil seed bank types,
germination and seed storage requirements. To determine exact composition of multi-species seed mixtures
applicable in practice, case studies should be conducted under major climatic and soil conditions.
Keywords: biodiversity, fallow land, seed ecology, vegetation succession, weed suppression
Introduction
Abandoned fields are subjected to spontaneous secondary succession that results in
considerable plant cover within short time (Bazzaz 1975). This plant cover is efficient in
preventing soil deflation and erosion (Jolánkai et al. 2008), as well as supporting soil
resilience (Várallyay 2007). However, the weedy character of early successional stages
makes a strong biotic stress on the soil. Weed seed bank of the soil increases conside-
rably and it becomes a long lasting source of weed contamination (Roberts 1981).
To prevent colonization of early-successional (arable weed) species Van der Putten et
al. (2000) manipulated the aboveground species diversity on abandoned arable lands by
sowing more or less diverse species mixtures of later-successional plant species. They
found high-diversity mixtures more effective than low-diversity ones, and the exact
species composition also proved to be important. The idea of this paper is (1) to identify
species groups potentially suitable for acceleration of vegetation succession by sowing
their seeds on abandoned fields; and (2) to survey available seed ecological information
about these species.
Materials and methods
Concerning question 1, species pools of five abandoned fields were studied on loessy
gentle slopes near Lake Balaton, after 5-10 years of abandonment. Size of fields varied
between 2-8 ha. Ecological classification of vascular species into functional groups was
based on Borhidi's (1995) system. Regarding question 2, four databases developed for
the Hungarian flora were used, as follows: thousand-seed-weight and seed shape
databases (Csontos 1998), the soil seed bank type database (Csontos 2001) and the seed
dispersal type database (Csontos et al. 2002).

Vol. 37, 2009, Suppl. Cereal Research Communications
70
Results and discussion
After 5-10 years of spontaneous vegetation succession 32.4% of the species pool was
still composed by weeds (W) plus ruderal- and alien competitors (RC, AC) on the
studied abandoned fields (Table 1). Among species groups of close-to-nature character
disturbance tolerants and generalists had the largest proportions (DT+G= 54.2%).
Earlier studies have also demonstrated the key importance of the latter groups in
vegetation regeneration (Tamás 2001, Malatinszky 2008). Species from the specialist
group (S) had negligible contribution since they generally require much longer time for
re-establishment (Sendtko 1999, Malatinszky et al. 2008), however, the equally poor
presence of natural pioneers (NP) was unexpected (Table 1).
Table 1. Contribution of nine ecological species groups after 5-10 years of spontaneous succession on
abandoned fields in the Lake Balaton region, Transdanubia. (Fr.= frequency)
Ecological groups (Social behaviour types1) Summed Fr.2 Relative Fr. (%)
Disturbance tolerants (DT) 108 34.6
Weeds (W) 63 20.2
Generalists (G) 61 19.6
Competitors (C) 33 10.6
Ruderal competitors (RC) 22 7.1
Alien competitors (AC) 16 5.1
Introduced alien species (I) 7 2.2
Natural pioneers (NP) 1 0.3
Specialists (S) 1 0.3
Total 312 100
1: According to Borhidi (1995); 2: Considering five sampling sites, the total number of occurrences of
all species belonging to a certain ecological group
Taking the concept of Van der Putten et al. (2000), it is obvious from the results that we
should support species of DT and G groups of the natural vegetation. After directly
introducing them into the abandoned fields we can rely on their ability to occupy the
fields quickly and control weed invasion via competitive exclusion.
The successful application of this preventive method in practice strongly depends on the
available knowledge about seed ecology, germination characteristics, seed storage re-
quirements, etc of native DT and G species. In these respects wild growing species were
much less studied than cultivated crop plants and ornamental species, therefore a survey
of currently available data was necessary. Results of such survey are shown in Table 2,
concerning to the Angiosperms and Gymnosperms of the Hungarian flora that counts
2378 species. About thousand-seed-weight, seed shape and chorological type most of
the species are already classified (68-80%), and our knowledge regarding the two target
groups are even wider. The increase of known records is especially remarkable for DT
species. Soil seed bank types of the species are much less known, though one of the
simplest seed bank classification system was applied (transient, short-term persistent
and long-term persistent; Thompson 1993, Csontos and Tamás 2003). It is because the
identification of soil seed bank types of species is either labour intensive or extreme
time consuming depending on the methods applied (Thompson et al. 1997, Telewski

VIII. Alps-Adria Scientific Workshop Neum, Bosnia-Herzegovina, 2009
DOI: 10.1556/CRC.37.2009.Suppl.2 71
and Zeevaart 2002, Gurnell et al. 2007). Nevertheless, increased percentages of species
of known data can be reported again when DT or G species are taken account (Table 2).
Table 2. Percentage of species with known seed characteristics of the Hungarian flora (n= 2378) with special
attention to functional groups of disturbance tolerants (DT; n= 284) and generalists (G; n= 585)
Seed characteristics Total flora DT G
Thousand-seed-weight 71.0 86.3 69.6
Seed shape (in quantitative terms)1 68.3 87.3 68.2
Soil seed bank type 21.1 40.1 25.8
Seed dispersal mode (Chorological type) 80.0 88.3 84.6
1: Seed shape of a species makes possible to estimate its soil seed bank type (Thompson et al. 1993)
According to the results above it is obvious that DT and G species are promising
candidates for using them in vegetation manipulation techniques already at the present
state of knowledge. However, further research would be welcome especially on the soil
seed bank behaviour of these species. Additionally, germination characteristics and seed
storage requirements should also receive much attention. In this respect, there is a large
gap between our understanding on cultivated plants and wild growing species (Szabó
1980), though a considerable increase in research activity on biological floras can be
seen at international scale (Baskin and Baskin 1998). In this respect a break-through
took place, more recently, within the frame of an EU supported project, the European
Native Seed Conservation Network (ENSCONET). The project aims to build extensive
databases for a large scale of information on seeds, with special attention to germination
success of wild growing species and to optimal storage conditions of their seeds (in seed
gene banks). Then these databases will be offered as research infrastructure to the
scientific community. This should allow us to compose adequate multi-species seed
mixtures for a wide scale of habitat types under various climatic conditions and soil
types of Europe. Besides controlling weed invasion on abandoned fields, these seed
mixtures will probably be successfully applied in further cases of ecological operations,
including practices on landscape management and ecological restoration.
Conclusions
Massive establishment of arable weeds and invasive alien species is a great problem in
fallow lands. To reduce this biological stress a well funded method based on diversity
concept, niche pre-emption and competitive exclusion was proposed (Van der Putten et
al. 2000), that relies on sowing high diversity mixture of seeds of non-weedy native
species immediately after abandonment. For this operation, a case study on successional
old-fields in Hungary identified the most applicable species groups (disturbance
tolerant- and generalist species). A species intensive survey showed that information
about seed weight, seed shape and dispersal type are available for 68-88% of the
potentially useful species. A need to increase our knowledge regarding the mentioned
seed attributes is obvious, and even more research should be done on germination
behaviour and seed storage requirements of the target species groups. To determine
species composition of seed mixtures applicable at different climate and soil types,
further case studies should be conducted.

Vol. 37, 2009, Suppl. Cereal Research Communications
72
Acknowledgements
Many thanks are due to colleagues of the ENSCONET project for various help during
the work. Department of Biogeography and Botanical Garden, University of Vienna
financially supported our contribution at the VIII. Alps-Adria Scientific Workshop.
References
Baskin C.C. - Baskin J.M.: 1998. Seeds: ecology, biogeography, and evolution of dormancy and germination.
Academic Press, San Diego.
Bazzaz F.A.: 1975. Plant species diversity in old-field successional ecosystems in Southern Illinois. Ecology,
56: 485-488.
Borhidi A.: 1995. Social behaviour types, the naturalness and relative ecological indicator values of the higher
plants in the Hungarian flora. Acta Botanica Hungarica, 39(1-2): 97-181.
Csontos P.: 1998. The applicability of a seed ecological database (SEED) in botanical research. Seed Science
Research, 8: 47-52.
Csontos P.: 2001. A természetes magbank kutatásának módszerei. Scientia Kiadó, Budapest.
Csontos P. - Tamás J: 2003. Comparisons of soil seed bank classification systems. Seed Sci. Res. 13: 101-111.
Csontos P. - Tamás J. - Tobisch T.: 2002. A magyar flóra magterjesztési mód adatbázisának bemutatása,
elemzési példákkal: a szociális magatartás típusok értékelése. In: Salamon-Albert É. (szerk.) Magyar
botanikai kutatások az ezredfordulón. PTE Növénytani Tanszék, Pécs, pp: 557-569.
Gurnell A. - Goodson J. - Thompson K. - Mountford O. - Clifford N.: 2007. Three seedling emergence
methods in soil seed bank studies: implications for interpretation of propagule deposition in riparian
zones. Seed Science Research 17(3): 183-199.
Jolánkai M. - Nyárai F.H. - Tarnawa Á. - Klupács H. - Farkas I.: 2008. Plant and soil interrelations. Cereal
Research Communications, 36, Suppl.: 7-10.
Malatinszky Á.: 2008. Relationships between cultivation techniques, vegetation, pedology and erosion on
extensively cultivated and abandoned agricultural areas in the Putnok Hills. Acta Agr. Hung., 56: 75-82.
Malatinszky Á. - Siller I. - Penksza K.: 2008. Abandoned loessy grape yards as refuges of rare steppe plant
species. Cereal Research Communications, 36, Suppl.: 1139-1142.
Roberts H.A.: 1981. Seed banks in soils. Advances in Applied Biology, 6: 1-55.
Sendtko A.: 1999. Die Xerothermvegetation brachgefallener Rebflächen im Raum Tokaj (Nordost-Ungarn) -
pflanzensoziologische und populationsbiologische Untersuchungen zur Sukzession. Phytocoenologia
29(3): 345-448.
Szabó L.Gy. (ed.): 1980. A magbiológia alapjai. Akadémiai Kiadó, Budapest.
Thompson K.: 1993. Seed persistence in soil. In: Hendry G.A.F. - Grime J.P. (eds), Methods in comparative
plant ecology. Chapman and Hall, London, pp: 199-202.
Thompson K. - Band S.R. - Hodgson J.G. 1993. Seed size and shape predict persistence in soil. Functional
Ecology, 7: 236-241.
Thompson K. - Bakker J.P. - Bekker R.M.: 1997. The soil seed banks of North West Europe: methodology,
density and longevity. Cambridge University Press, Cambridge.
Tamás J.: 2001. Post-fire succession studies in Austrian pine plantations. Ph. D. Theses, ELTE, Budapest, 140
pp. (in Hungarian, with Engl. summ.)
Telewski F.W. - Zeevaart J.A.D.: 2002. The 120-yr period for Dr. Beal’s seed viability experiment. American
Journal of Botany 89(8): 1285-1288.
Van der Putten W.H. - Mortimer S.R. - Hedlund K. - Van Dijk C. - Brown V. K. - Leps J, - Rodriguez-
Barrueco C. - Roy J. - Diaz Len T.A. - Gormsen D, - Korthals G.W. - Lavorel S. - Santa Regina I. -
Smilauer P.: 2000. Plant species diversity as a driver of early succession in abandoned fields: a multi-site
approach. Oecologia, 124: 97-99.
Várallyay Gy.: 2007. Soil resilience. (Is soil a renewable natural resource?) Cereal Research Communications,
35, Suppl.: 1277-1280.

VIII. Alps-Adria Scientific Workshop Neum, Bosnia-Herzegovina, 2009
DOI: 10.1556/CRC.37.2009.Suppl.2 73
COMPARISON BETWEEN CAPACITANCE AND NIT SENSING TECHNOLOGY TO CONTINUOUSLY EVALUATE GRAIN MOISTURE DURING HARVEST
Mátyás CSIBA
University of West Hungary, Faculty of Agricultural and Food Sciences, Institute of Biosystems Engineering,
9200 Mosonmagyaróvár, Vár 2., +36 96 566 635, e-mail: [email protected]
Abstract: The soil – as the most utilized biotic factor in food production – is one oft the main renewable
energy resources (Várallyay, 2007) and also the key factor of rational and environmental friendly use of the
sustainable development. The environmental stressors as: soil, weather, nutrients, etc. are greatly influencing
the successfulness of agricultural production. With a logical farming we can alleviate both environmental and
anthropogenic impact with an applying of precision techniques (e.g. tillage, site site-specific nutrient and
chemical assignment, yield and moisture measuring during harvest). The grain moisture varies on filed not
only during the season or the day, but especially spatially, therefore to determine the exact harvest time, as an
alleviating biotic tool a continuous measurement of this parameter is required. During my investigations I
compared an on-field, combine mounted capacitance moisture sensor results with the filling of the grain tank
and a NIT (Near Infrared Transmittance) sensor mounted on a clean grain elevator. With our near-infrared on-
combine grain analyzer we are capable to record also oil and protein content beside moisture that makes the
whole measurement more valuable. Based on the new results an earlier measuring method (capacitance)
should be corrected or a new one (NIT) could be used.
Keywords: capacitance sensor, NIT, grain moisture, site-specific measuring techniques
Introduction
Improving sustainability of agricultural production systems has recently become one of
the main goals for the agricultural policy (Rajkai et al., 2007, Németh et al., 2007,
Jolánkai et al., 2008, Neményi et al., 2008). The harvest always should be managed in
conjunction with post-harvest operations in order to achieve the highest quality and
quantity of grain (Zoerb et al., 1993). We need to have adequate information (whether
to harvest - now or delay - or which area of the crop should be harvested next) in order
to make the proper decision, because there is a spatial variation of moisture content
within and between fields. Also, cropping intensity, planting date, fertilization by
nitrogen, hybrid properties and weather conditions influence the rate of water release
from the kernel (field drying rate) examined the impact of different soil mineral
nitrogen treatments on the level and dynamics of corn kernel moisture loss (Jukic et al.,
2007). Moisture content must be measured to obtain accurate yields since both volume
and mass of grain are affected by grain moisture (Arslan et al., 2002). To measure the
grain moisture content in a site-specific way, capacitive, microwave, acoustic
(Amoodeh et al., 2006) or near-infrared measurement devices are used. The main
problem of capacitive and microwave measurements is the dependence of other
parameters as mass density and temperature. Moreover, microwave measurements are
expensive. Recently, good results were reported with a NIR sensor, used for both
protein and moisture measurements (Reyns et al., 2002). The yield is very important for
the growers, however quality parameters and water content is probably just so important
since it affects grain sale price. By mathematically combining the results from protein
and yield maps we can also estimate N removal from a field (Engel et al., 1997).
Summarizing the above mentioned it can be declared that the on-line measurement of
different parameters (protein, oil, moisture, starch) during the harvest are providing the

Vol. 37, 2009, Suppl. Cereal Research Communications
74
necessary base for decision making, therefore the precision of these measurements is
remarkable.
Materials and methods
Experiments were carried out in the No 80/1. field (47°54’19.2” N, 17°15’08.29” E)
belongs to the experimental farm of the University of West Hungary, Faculty of
Agricultural and Food Sciences. The employed system for capacitance moisture sensing
was the Agrocom ACT and Zeltex AccuHarvest On-Combine Grain Analyzer for NIT
sensing installed on a Deutz Fahr M 35.80 combine harvester. The operation of the
sensor mounted in the exit of the tank feeding auger is based on the principle of
conductivity. One of the major error of this sensor comes from the inconstant measured
volume. By filling and emptying of the grain tank the area is changing continuously,
which causes a great fluctuation during on-to-go moisture sensing (Fig. 1.).
10
15
20
25
30
0 200 400 600 800 1000Measured data flow
Gra
in m
oist
ure
[%]
Figure 1. The grain (corn) moisture change during harvest in 2006
Therefore a microsonar sensor (Nivelco Hungary Inc.) was mounted on a top of the
grain tank, what measures the crop distance from the bottom of the tank in centimeters.
Using a DellAxim X50v PDA with in house software and connected to a GPS, the grain
distance from the top has been recorded spatially during the harvest. With Eq. (1) from
distance values (d) the saturation of the grain tank (Table 1.) can be counted in
percentage. Using the equation of the calibration curve (Fig. 2.) the recorded raw
moisture data were modified by the Eq. (2).
38.1
)42( −=
dx (1)
( )100
092.241694.10085.0100
)()(
2 +−+=
xx
rawAgrocomcorrectedAgrocom (2)
The NIT sensor was mounted on the clean grain elevator. The sensor consists of a test
chamber which is periodically refilled. The reflected light is scattered at different

VIII. Alps-Adria Scientific Workshop Neum, Bosnia-Herzegovina, 2009
DOI: 10.1556/CRC.37.2009.Suppl.2 75
wavelengths by means of a diffraction grating. The scattered light is detected by a
photodiode array. For calibration, factory (Zeltex Inc.) data were used. As a control
measurement for grain moisture content I have used the drying chamber results.
Results and discussion
Using the microsonar controller I have recorded the grain distance from the bottom of
the tank continuously. As Fig. 2. shows there was a clear correlation between grain tank
saturation and between the bias from the standard moisture, therefor the result is, if we
don’t ensure a permanent volume for capacitance sensor, there will be under and
overmeasures depending on grain tank saturation. As a solution we can use an
additional sensor (e.g. misrosonar), and during the post process of the data we can
correct (Eq. 2.) our moisture values (Table 1.). The precision was ± 0.6% in both NIT
and corrected capacitance sensors, what is a great achievment in a comparison with raw
capacitnace sensor data where the precision was ± 2.7% and also the fluctuation (Fig.
1.) after the emptying of the grain tank was much greater (appr. ± 8%), which caused
additional inappropriate data, too. This change in measured data flow showed up the
same result in year 2004 (winter wheat), 2005 (corn) and in 2008 (corn) too.
Table 1. Comparison between different moisture sensors precision during harvest
Microsonar
distance [cm]
Grain tank
saturation [%]
Drying
chamber [%]
Zeltex NIT
sensor [%]
Agrocom
(raw) [%]
Agrocom
(corr.) [%]
162 88 20.3 19.0 17.4 20.0
142 73 19.4 19.8 16.9 20.1
127 62 18.5 18.3 15.4 18.3
116 54 19.2 21.2 16.2 18.9
87 33 19.6 19.2 18.8 19.9
58 12 18.7 18.6 21.3 19.2
45 3 17.7 18.2 21.4 17.7
41 0 18.7 18.9 24.2 19.5
y = 0.0085x2 - 1.1694x + 24.092
R2 = 0.9356
-30
-20
-10
0
10
20
30
40
0 20 40 60 80 100
Avaible space in a grain tank [%]
Bia
s fr
om th
e st
anda
rd
moi
stur
e [%
]
Figure 2. Bias from the standar moisture in a function of the grain tank saturation

Vol. 37, 2009, Suppl. Cereal Research Communications
76
Conclusions
The precision agricultural techniques can be treated as alleviating tools for
environmental and anthropogenic stressors; therefore the successfulness of the
production depends on the accuracy of recorded data. The precision of a capacitance
moisture sensor highly depends on actual compactness of the grain (grain/air ratio) in
the grain tank. If we can not ensure a place for the sensor in a harvester, where the flow
rate is constant, therefore the measuring volume is not permanent an additional sensor
(e.g. microsonar) should be used to detect continuously a grain tank status, during the
harvest. As a second solution a NIT technology could be used. During my investigation
I have stated that the accuracy was the same as measured with the corrected capacitance
sensor. In addition with Zeltex On-Combine Grain Analyzer oil and protein content
could be recorded (starch content calibrations are under development, what will a great
advantage for future investigations in bioetanol production Jolánkai et al., 2007), so we
can gain valuable site-specific information besides water content about those quality
parameters too.
Acknowledgements
I would like to render special thanks for the technical knowledge and leading during the
research work to my PhD supervisor Prof. Dr. Neményi Miklós. I am also grateful to
the workers of Institute of Biosystems Engineering, who helped me to carry out the
investigation.
References
Amoodeh M.T. – Khoshtaghaza M.H. – Minaei S.: 2006. Acoustic on-line grain moisture meter. Computers
and Electronics in Agriculture. 52: 71-78.
Arslan S. – Colvin S. T.: 2002. Grain Yield Mapping: Yield Sensing, Yield Reconstruction, and Errors.
Precision Agriculture. 3: 135–154.
Engel R. – Long D. – Carlson G.:1997. On-to-go grain protein sensor is near. Better Crops. 81: 20-23.
Jolánkai M. – Nyarai F.H. – Farkas I. – Szentpétery Zs.: 2007. Agronomic impacts on energy crop
performance. Cereal Research Communication. 35: 537-540.
Jolánkai M. – Nyárai F.H. – Tarnawa Á. – Klupács H. – Farkas I.: 2008. Plant and soil interrelations. Cereal
Research Communication. 36: 7-10.
Jukic Z. – Janusic V. – Matin A. – Tomic F.: 2007. Water release rate from corn kernel affected by cropping
intensity. Cereal Research Communication. 35: 569-572.
Neményi M. - Nagy, V. - Stekauerová, V. 2008: Limiting factors of precision farming – soil compaction and
precipitation. Cereal Research Communications, Akadémiai Kiadó, 36, 1859-1862 pp.
Németh T. – Neményi M. – Harnos Zs. (eds.): Theory of precision plant production. (In Hungarian: A
precíziós mezıgazdaság módszertana.) JATE Press-MTA TAKI, Szeged.
Rajkai K. – Végh K.R – Németh T.:2007. Sunstainability measures of different land use forms in Hungary.
Cereal Research Communication. 35: 969-972.
Reyns P. - Missotten B., Ramon H. - Baerdemaeker J. De.: 2002. A Review of Combine Sensors for Precision
Farming. Precision Agriculture. 3: 169–182.
Várallyay, Gy. 2007. Soil resilience (Is soil a renewable natural resource?) Cereal Research Communications,
35: 1277-1280 pp.
Wright S. L. - Hood C. F.: 1998. Near infrared spectrometer used in combination with a combine for real time
grain analysis. USA Patent no. 5.751.421.
Zoerb G.C. – Moore G.A. – Burrow R.P.: 1993. Continuous measurement of grain moisture content during
harvest. Transaction of the ASAE. 36: 5-9.

VIII. Alps-Adria Scientific Workshop Neum, Bosnia-Herzegovina, 2009
DOI: 10.1556/CRC.37.2009.Suppl.2 77
COMPETITION BETWEEN XANTHIUM ITALICUM AND CROPS UNDER FIELD CONDITIONS
Gabriella KAZINCZI1 – Mária TORMA
2 – Imre BÉRES3 – József HORVÁTH
3
1Department of Botany and Plant Production, Faculty of Animal Sciences, Kaposvár University, H-7400
Kaposvár, Guba S. str. 40, e-mail: [email protected] 2BASF Hungaria Kft, H-1132 Budapest, Váci str. 30. 3Institute for Plant Protection, Georgikon Faculty, University of Pannonia, H-8360 Keszthely, Deák F. str. 16.
Abstract: The aim of our investigation was to study the interaction between crops and and Xanthium italicum
in additive treatments. In additive experiments two species are grown together, the density of the crop is
maintained constant, while that of the weed species is varied. Small plot experiments were set up in order to
study the effect of X. italicum density (1, 2, 5, and 10 plants m-2) on maize and sunflower yields under field
conditions. Generally, average yield proportionally decreased as the weed density increased, but at higher
weed densities intraspecific competition among Xanthium plants was stronger than competition between crops
and weed. Sunflower was a stronger competitor than maize. X. italicum caused an average of 43 and 90%
yield losses of sunflower and maize, respectively.
Keywords: Xanthium italicum, maize, sunflower, competition
Introduction
Xanthium italicum was first detected in the 1920’s along the Tisza river in Hungary and
was a typical weed of river banks and waste lands. Its germinating seeds and plant parts
contain poisonous alkaloids and glycosides which can cause animal diseases and play
important role in plant-plant interactions (Borbély and Dávid, 2008). Today X. italicum
is considered a dangerous invasive alien weed species in Hungary, causing considerable
yield losses in agricultural crops. Similar to other plant invaders (Jenser et al., 2008)
until now no pests and pathogens are known to cause considerable biological decline of
this species. Competition is considered as a type of interference among higher plants
(Harper, 1977). Under field conditions a lot of environmental factors – in close
connection with each other – can influence interspecific competition between crops and
weeds (Pozsgai 1984; Kovacevic et al., 2004; Kovács et al., 2006; Nádasy and Nádasy,
2006; Nádasy et al., 2008). The majority of agricultural competition studies are based
on the additive experiments. In additive experiments two species are grown together, the
density of the crop is maintained constant, while that of the weed species is varied. The
effect of weed density on yield loss has been extensively studied and relations between
weed density and yield loss are described with different type of functions (Zimdahl,
2004). The aim of our examinations was to study the interaction between crops (maize
and sunflower) and X. italicum in additive experiments.
Materials and methods
Small plot (15m-2
) experiments in randomized blocks, in three replicates were set up on
Ramann brown forest soil with clay illuviation, at Keszthely (Hungary), in spring of
2007 year. Maize (‘Dekalb’) and sunflower (‘Sonja Benita’) were sown on the 23rd
and
18th
April, respectively. The treatments were the followings:
1. Untreated weedy control
2. Weed-free control
3. X. italicum, 1 plant m-2

Vol. 37, 2009, Suppl. Cereal Research Communications
78
4. X. italicum, 2 plant m-2
5. X. italicum, 5 plant m-2
6. X. italicum, 10 plant m-2
Hand hoeing was continuously applied to maintain weed-free control plots. Plots of the
treatments 3 to 6 were kept free from weed species – except X. italicum – and weed
density was also continuously checked. At the beginning of maize and sunflower
flowering (on the 15th
July) the height of 20 representative crop individuals were
measured in each plot. Maize and sunflower harvest happened on the 21st and 14
th Sept,
respectively. The yield was calculated to the 14% and 8% wet content for maize grains
and sunflower achiness, respectively. Analysis of variance (ANOVA) was used to
evaluate the results with an alpha-error of 5%.
Results and discussion
The height of sunflower was significantly reduced in all treatments as compared to
weed-free control plots (2nd
treatment). The height reduction in maize was not
significant, when weedy plots and the 5th
treatment (X. italicum, 5 plant m-2
) was
compared to the weed-free control ones (Figure 1).
X. italicum at densities of 1, 2, 5 and 10 plant m-2
caused 87, 82, 96 and 94% reduction
in maize yield, respectively, while the same weed densities caused 31, 43, 43 and 56%
reduction in sunflower yield. 23 and 92% yield losses were observed on weedy control
plots, as compared to weed-free control ones, with sunflower and maize crops,
respectively (Figure 2.). No significant difference was observed between the crop yields
– except the treatments, when weed density was 1 and 10 plants m-2
for sunflower – due
to the different weed densities, suggesting that at higher densities intraspecific
competition between Xanthium plants is stronger than interspecific competition between
crops and weeds. Similar observations were made in earlier experiments with other
weed species (Kovács et al. 2006; Kazinczi et al. 2007).
.
020406080
100120140160180200
1 2 3 4 5 6
LSD5%
treatments
hei
ght (c
m)
maize
sunflower
Figure 1. The effect of Xanthium italicum weed density on the height of crops (1, weedy control; 2, weed-
free control; 3, X. italicum, 1 plant m-2; 4, X. italicum, 2 plant m-2; 5, X. italicum, 5 plant m-2; 6, X. italicum, 10
plant m-2)

VIII. Alps-Adria Scientific Workshop Neum, Bosnia-Herzegovina, 2009
DOI: 10.1556/CRC.37.2009.Suppl.2 79
0
1
2
3
4
5
6
7
1 2 3 4 5 6
LSD5%
treatments
t ha-
1
maize
sunflower
Figure 2. The effect of Xanthium ithalicum weed density on the yield of crops (1, weedy control; 2, weed-
free control; 3, X. italicum, 1 plant m-2; 4, X. italicum, 2 plant m-2; 5, X. italicum, 5 plant m-2; 6, X. italicum, 10
plant m-2).
Conclusions
X. italicum caused an average of 43 and 90% yield losses of sunflower and maize,
respectively, suggesting that sunflower has a stronger competitive ability as compared
to that of maize. It was also proved in earlier additive crop-weed competition studies,
when Ambrosia artemisiifolia (Varga et al., 2006) and Abutilon theophrasti (Kovács et
al., 2006) were the competition partners. In the respect of competitive ability - on the
basis of previous similar experiments - the weed species follow the order: X. ithalicum>Datura stramonium>A. artemisiifolia>A. theophrasti (Kovács et al., 2006;
Varga et al., 2006; Dávid et al., 2006; Dávid and Tarcali, 2008).
It is considered, that weed species and density are not unexclusive factors influencing
crop yield. Other factors, such as relative leaf area, relative emergence time may be also
important, influencing crop yield (Cousens et al., 1987; Kropff and Spitters, 1991).
Results of different years and locations may differ due to the different climatic and
edaphic factors.
Acknowledgements
Authors wish to express their thanks to the Hungarian Scientific Research Found
(OTKA) for its financial support (Grant No. 049093).
References
Borbély, M., Dávid, I. 2008. Changeability of allelopathy depending on several factors. Cereal Res. Comm.
36: 1383-1386.
Cousens, R., Brain, P., O’Donovan, J.T., O’Sullivan, A. 1987. The use of biologically realistic equations to
describe the effects of weed density and relative time of emergence on crop yield. Weed Science 35: 720-
725.

Vol. 37, 2009, Suppl. Cereal Research Communications
80
Dávid, I., Radócz, L., Kazinczi, G., Béres, I., Kovács, I. 2006. Competitiveness of velvetleaf (Abutilon theophrasti Medic.) and italian cocklebur (Xanthium italicum Mor.) in maize and sunflower. Analele
Universitatii Din Oradea 12: 63-67.
Dávid, I., Tarcali, G. 2008. Competition of maize with three noxious weeds. Cereal Res. Comm. 36: 1119-
1122.
Harper, J.L. 1977. Population Biology of Plants. Academic Press, London.
Jenser, G., Kiss, B., Takács, A. 2008. Ambrosia artemisiifolia is joint host of Tomato spotted wilt tospovirus (TSWV) and of its transmitters, Thrips tabaci and Frankliniella occidentalis in Hungary. First Internat.
Ragweed Conference, Budapest 2008. p. 16.
Kazinczi, G., Béres, I., Varga, P., Kovács, I., Torma, M. 2007. Competition between crops and Ambrosia artemisiifolia L. in additive field experiments. Hungarian Weed Research and Technology 8 (1): 41-47.
Kovacevic, V., Banaj, D., Brkic, L., Antunovic, M., Petosic, D. 2004. Fertilization impacts ont he yield and
nutritional status of maize (Zea mays L.) . Cereal Res. Comm. 32: 403-410. Kovács, I., Béres, I., Kazinczi, G., Torma, M. 2006. Competition between maize and Abutilon theophrasti
(Medik.) in additive experiments. Z. PflKrankh. PflSchutz Sonderh. 20: 767-771.
Kropff, M.M., Spitters, C.J. 1991. A simple model of crop loss by weed competition from early observations
on relative leaf area of the weeds. Weed Research 31: 97-105.
Nádasy, E., Nádasy, M. 2006. Some harmful or useful environmental effect of nitrogen fertilisers. Cereal Res.
Comm. 34: 49-52.
Nádasy, E., Nádasy, M., Nagy, V. 2008. Effect of soil herbicides on development of sunflower hybrids.
Cereal Res. Comm. 36: 847-850.
Pozsgai J. 1984. A cukorrépa és fıbb gyomnövényei közötti kompetíció. II. A termésveszteség biológiai
össztevıi és a kompetíció kritikus periódusa. Növénytermelés 33: 27-40.
Varga, P., Kazinczi, G., Béres, I., Kovács, I. 2006. Competition between sunflower and Ambrosia artemisiifolia in additive experiments. . Cereal Res. Comm. 34: 701-704.
Zimdahl, R.L. 2004. Weed-crop competition. Blackwell Publishing, USA

VIII. Alps-Adria Scientific Workshop Neum, Bosnia-Herzegovina, 2009
DOI: 10.1556/CRC.37.2009.Suppl.2 81
EFFECT OF CHLORIDE ANIONIC STRESS ON THE YIELD AMOUNT AND SOME QUALITY PARAMETERS OF STRAWBERRY (Fragaria ananassa)
Imre VÁGÓ1 – László TOLNER
2 – Jakab LOCH
1
1 Department of Agricultural Chemistry and Soil Science, Faculty of Agricultural Sciences, University of
Debrecen, H-4032 Debrecen, Böszörményi street 138. , e-mail: [email protected], [email protected] 2 Department of Soil Science and Agricultural Chemistry, Szent István University, H-2103 Gödöllı., e-mail:
Abstract: To study the effect of chloride stress, and potassium and magnesium supply of soils, we set up field
trials on acidic sandy soil with different fertilizers, such as potassium chloride, potassium sulphate and
Patentkali (which contains both of magnesium sulphate and potassium sulphate). It was stated, that the
application of the potassium chloride was ineffective on the strawberry yield. The most favourable conditions
for the berry development were ensured by the joint treatments with potassium sulphate and magnesium
sulphate. Nutrients applied in form of sulphate inhibited the uptake of chloride ions. It is presumable, that the
decrease in the chloride ion content of plants contributed to the yield and quality increment.
Keywords: strawberry, yield and quality, chloride stress, potassium chloride, potassium sulphate, Patentkali
Introduction
Potassium plays an important role in the plant’s development: it promotes the
elongation of the cells, takes part in the water management of plant and in the synthesis
of all kinds of carbohydrates: sugar, starch, and cellulose (Bergmann and Neubert,
1976). Strawberry that is well supplied with potassium synthetizes more sugar, so the
yield will be sweeter (Babicz, 2002). In plant production mostly potassium chloride is
used as potassium fertilizer. Strawberry – like many horticultural plants (Nagy et
al., 2008) – reacts sensitive to chloride ions, because elevated chloride ion content
inhibits the translocation of assimilates. Therefore a comparison of the application of
potassium chloride and chloride-free fertilizers such as potassium sulphate is
reasonable.
Besides potassium, magnesium plays also a relevant role in plant life (Loch and
Nostíczius, 1992). It is important to watch out on magnesium supply on soils that are
treated with a higher potassium dosage: because of the antagonism between the two
ions, high potassium content can hinder magnesium utilization (Kátai et al., 2008).
To study the effect of chloride stress, of potassium and magnesium supply of soils, we
set up field trials on acidic sandy soil with different fertilizers, such as potassium
chloride, potassium sulphate and Patentkali (which contains both magnesium sulphate
and potassium sulphate).
Materials and methods
The field experiment was set up on an acidic soil (pH-KCl = 4.4) with sandy texture,
near to Újfehértó, Eastern Hungary. The initial ammonium-lactate – acetic acid (AL-)
extractable nutrient content is the following: 129.6 mg kg-1
P2O5; 208.8 mg kg-1
K2O,
1 243 mg Ca and 67.3 mg Mg kg-1
soil. The area of each plot was: 2.8 m * 3.75 m =
10.5 m2, the distance between rows was 0.75 m, and the plant to plant distance was
0.25 m, so these were 60 plants in each plot. We used the sort “Polana” in our

Vol. 37, 2009, Suppl. Cereal Research Communications
82
experiment. To reach a higher statistical reliability we set up our experiment in
6 replications, in a randomised arrangement.
Treatment factors were the following:
1. Treatment without K- and Mg-fertilization („control“)
2. 120 kg K2O ha-1
(KCl)
3. 120 kg K2O ha-1
(K2SO4)
4. 120 kg K2O ha-1
(K2SO4) + 40 kg MgO ha-1
(MgSO4) = Patentkali
Chemical fertilization was executed a week before planting, so on 6th
of April. We
chose to give the same potassium dosage (120 kg K2O ha-1
) to each treatment
combination with fertilization, so we had the opportunity to study and compare the
effects of anions. In treatment Nr 4 we used Patentkali that besides potassium-sulphate
contains magnesium-sulphate as well, to test, how the applied magnesium affects the
yield. At the same time we treated the whole experimental area with a standard joint
fertilizer of 100 kg N ha-1
and 100 kg P2O5 ha-1
in form of ammonium nitrate (AN) and
mono-ammonium phosphate (MAP). We avoided using superphosphate because of its
sulphate content. During the experimental period we adjusted the care of the crop and
plant protection to the needs of plants. Unfortunately we did not have any opportunity
for irrigation.
In the first vegetation period we could not collect any considerable and evaluable
amount of berry yield. Therefore we measured the yield per plot and its quality
parameters only a year after plantation. In the second year between the 21st of May and
11th
of June we collected and measured the yield amount continually, 16 times
altogether.
Plants’ dry matter was analysed for their carbon and nitrogen content by an Elementar
analyser, using a dry combustion method in oxygen atmosphere (Nagy, 2000). From the
fresh berry samples of the 6th
picking we determined the vitamin C-content of the
berries per each plot. For that we used iodometric titration method. Beside this we
determined the reducing sugar content expressed in fructose with Cu2+
/Cu+ redoxy
titration method and the chloride ion content of the yield with HPLC ion-
chromatography method (Balláné Kovács A., 2000; Balla Kovács et al., 2007). The
results were statistically evaluated with single factor ANOVA.
Results and discussion
An overview table from the results of the experiment and its statistical analysis was
made (Table 1.). The consolidated yield amounts, the vitamin-C-, the reducing sugar-
(expressed in fructose) and the chloride-ion-content are shown per plot in this table.
In accordance to the better perspicuity we also represent the results on figures.
Figure 1. shows the yield mass of strawberry of the second year in the average of the
6 replications. The summarized yield was the highest in this year, depending on the
treatments it varied between 17.2 and 20.6 kg per plot. It can be stated, that the yield
was the highest in treatments with both potassium-sulphate and magnesium-sulphate
(Patentkali).

VIII. Alps-Adria Scientific Workshop Neum, Bosnia-Herzegovina, 2009
DOI: 10.1556/CRC.37.2009.Suppl.2 83
Compared to the treatments with potassium-chloride, potassium-sulphate itself resulted
in a statistically significant yield increment, but this increment fell short of that in
treatments with magnesium. As the results of the analysis of variance shows, the effects
of the treatments were statistically proved at P = 0.1 % significance level (***).
Table 1. The total yield of strawberry and the vitamin-C-, fructose and chloride-ion-content
of berries (Újfehértó)
Parameters Treatments
Total yield
kg plot-1
Vitamin C
mg kg-1
Fructose
g kg-1
Chloride ion
mg kg-1
Without K and Mg (control) 17.2 556 42.4 698
120 kg K2O ha-1 (KCl) 17.3 503 39.9 727
120 kg K2O ha-1 (K2SO4) 19.7 586 49.0 449
120 kg K2O ha-1 (K2SO4) +
40 kg MgO ha-1 (MgSO4) 20.6 495 44.5 401
SD5% 1.1 96 9.2 118
F value 21.4*** n.s. n.s. 16.4***
*** significant at P = 0.1 % level n.s. = not significant
Figure 1. The consolidated yield of strawberry in the
average of 6 replications (kg plot-1) Figure 2. The chloride-ion-content of strawberry
berries (mg kg-1)
On Figure 2. the chloride-ion-content of the fresh berries is shown.
It became also evident, that there was a really close significant treatment effect on the
chloride-ion-content of strawberry. Of course the chloride-concentration of strawberry
increased parallel to the potassium-chloride treatments.
In treatments with potassium-sulphate, and potassium-sulphate in combination with
magnesium-sulphate (Patentkali) the chloride-content of the berries fell back. This
0
100
200
300
400
500
600
700
800
Ch
lori
de
con
cen
trat
ion
mg
/kg
Control KCl K2SO4 K2SO4+MgSO4 SD5%
0
5
10
15
20
25
Yie
ld k
g/p
lot
Control KCl K2SO4 K2SO4+MgSO4 SD5%

Vol. 37, 2009, Suppl. Cereal Research Communications
84
relationship proved close significant (P = 0.1 % probability level). This fact contributed
definitely to the yield increment of strawberry.
It can also be stated, that none of the treatments had a significant effect on the
vitamin-C- and the reducing sugar-content of berries. The smaller differences weren’t
confirmed by the statistical analysis. There were also no significant differences in the
plant’s dry matter carbon and nitrogen content either.
Conclusions
Summarizing our results, we can state, that the most favourable conditions for the
strawberry development and for the amount of yield were ensured by the treatments
with a combination of potassium-sulphate and magnesium-sulphate (Patentkali). This
positive effect was confirmed by the statistical analysis at P = 0.1 % probability level.
From the quality parameters vitamin-C- and sugar-content of berries were not affected
by any of the treatments, but nutrients applied in form of sulphate inhibited the uptake
of chloride-ions. It is presumable, that the decrease in the chloride-ion concentration of
plants contributed to the yield increment.
Acknowledgements
This research work was financially supported by the “Internationales Kali Institute”
(Horgen, ZH, Switzerland).
References
Babicz Sz.: 2002. Minıségi szamócatermesztés gazdaságosan. Agrofeld Mg. Mérnöki Iroda Bt. Nyíregyháza.
Balláné Kovács A. (2000): Az ionkromatográfia lehetıségei és alkalmazása talaj- és növénykivonatok
aniontartalmának meghatározására. Doktori (PhD) értekezés, Debrecen.
Balla Kovács A. – Kincses I. – Vágó I. (2007): Effects of nitrogen and different N:S ratio on yield and
nutrient uptake of mustard (Sinapis alba L.) Cereal Research Communications. 35. 201-205.
Bergmann, W. – Neubert, P. (1976): Pflanzendiagnose und Pflanzenanalyse. G. Fischer Verlag, Jena.
Kátai J. – Sándor Zs. – Tállai M. (2008): The effect of an artificial and a bacterium fertilizer on some soil
characteristics and on the biomass of the rye-grass (Lolium perenne L.) Cereal Research Communications.
36. 1171-1174.
Loch J. – Nostíczius Á. (1992): Agrokémia és növényvédelmi kémia. Mezıgazda Kiadó, Budapest.
Nagy P. T. (2000): Égetéses elven mőködı elemanalizátor alkalmazhatósága talaj- és növényvizsgálatoknál.
Agrokémia és Talajtan 49. (3-4): 521-534.
Nagy P. T. – Nyéki J. – Szabó Z. – Sándor Zs. (2008): Floral analysis as an early plant analytical tool to
diagnose nutritional status of fruit trees. Cereal Research Communications. 36. 1335-1338.

VIII. Alps-Adria Scientific Workshop Neum, Bosnia-Herzegovina, 2009
DOI: 10.1556/CRC.37.2009.Suppl.2 85
EFFECT OF NUTRIENT DEFICIENCY AND SURPLUS ON WHEAT AND MAIZE PRODUCTION
Katalin DEBRECZENI1 – Katalin BERECZ1 – Miklós MIHÁLOVICS2
1 Department of Plant Production and Soil Science, Georgikon Faculty, Pannon University, Keszthely,
Hungary, 8360 Keszthely, Deák F. street 16, e-mail: [email protected] 2 Feed Crops Research Institute Iregszemcse, Kaposvár University, Hungary
Abstract: The National Long-Term Field Fertilization Trials, which form a unique network in Hungary, were
set up in 1967. They were established with uniform NPK fertilization treatments at different agro-ecological
regions of the country. Cumulative yield differences from two sites, Iregszemcse (IR) with calcaric chernozem
soil type and Bicsérd (BI) with chernozem brown forest soil affected by nutrient stress (deficiency or surplus)
will be presented. In the wheat-maize-maize-wheat rotation, the long-term effect of the applied 20 fertilization
treatments (0, N, NP, NK, NPK) was studied in 8 rotation cycles. The stress effect caused by nutrient
deficiency was considerable first of all in the unfertilized plots (a yield decrease of 36.8-39.5% and 14.6-
31.7% compared to the average with wheat and maize, respectively), while unbalanced nutrient supply
effected a marked nutrient stress through nutrient surplus. Wheat responded to the accumulating P-deficiency
more markedly, while maize was more remarkably affected by nutrient stress caused by K-deficiency.
Keywords: long-term fertilization trials, winter wheat, maize, grain yield, nutrient deficiency and surplus.
Introduction
Different crops respond to nutrient surplus or deficiency very differently. The more
beneficial the plant supply with other nutrients is, the more efficient the yield increasing
effect of N is. Nutrient stress caused by N surplus or deficiency results in poor grain
development. The yield increasing effect of P is not very considerable, but its deficiency
in the early vegetative phase disadvantageously influences the tillering of wheat, the
number of earless shoots. Wheat is especially sensitive to P deficiency, maize is less
responsive to it. K deficiency does not cause visible symptoms immediately, but it
manifests itself in a remarkable yield decrease. The excess or deficiency of nutrients
depends also on the nutrient status of the soil, which is considerably influenced by the
different soil characteristics and water supply as well (Izsáki, 2007; Kátai et al., 2006;
Németh, 2006).
Materials and methods
In 1967 a network of long-term fertilization field trials were set up with uniformly
applied 20 fertilization treatments including increasing NPK doses and different nutrient
proportions (Table 1), with two different four-year crop rotations, in four replications at
different agro-ecological regions of Hungary (Debreczeni and Debreczeni, 1994). In our
study the grain yields in 8 cycles of winter wheat-maize-maize-winter wheat rotation
were evaluated at two sites, IR and BI in the period of 1967-1999. IR has an alkaline
soil type, while BI an acidic one: calcaric chernozem and chernozem brown forest soil,
respectively (Table 2). The yield data were evaluated as follows: The grain yields of the
20 treatments were averaged for each of the rotations (wheat, 2 years; maize, 2 years)
and these averages were regarded as basic data. In each rotation the yield differences,
compared to these basic data, were calculated (with positive or negative sign), then they
were added (cumulated) according to the rotations. Because of the limited size of this
paper, only data from the 2nd
, 4th
, 6th
and 8th
rotations are discussed.

Vol. 37, 2009, Suppl. Cereal Research Communications
86
Table 1. NPK treatments of the trials (N, P2O5, K2O, kg ha-1 yr-1)
1st rotation
(1967-1971) 2nd - 3rd rotation
(1972-1979)
4th - 5th rotation
(1980-1987)
from the 6th rotation (1988 onwards)
Nutrient
codes w. wheat maize w. wheat-maize w. wheat-maize w. wheat maize
N0P0K0 0 0 0 0 0 0
N1 35 40 50 50 100 100
N2 70 80 100 100 150 150
N3 105 120 150 150 200 200
N4 140 160 200 200 250 250
P1 35 35 50 50 60 60
P2 70 70 100 100 120 120
P3 105 105 150 150 180 180
K1 70 100 100 100 100 200
K2 140 200 - - 150 250
Table 2. Main soil characteristics of the test soils in the 12th and 32nd years of the long-term fertilization trials
pHKCl Humus
(%)
AL-P2O5
(mg kg-1)
AL-K2O
(mg kg-1)
year year year year
Sites and
NPK code
numbers 12th 32nd 12th 32nd 12th 32nd 12th 32nd
Plasticity
index
according
to Arany
(0-20 cm)
IR 000 7.25 7.35 2.26 2.07 151 146 169 141 37
IR 221 7.32 7.42 2.55 2.12 212 306 238 269 37
BI 000 6.40 5.04 2.30 2.00 58 51 263 268 45
BI 221 6.44 5.11 2.13 2.10 64 122 299 337 45
Results and discussion
In the columns of Tables 3 and 4, showing the yield differences, we shifted the numbers
to the right or left according to their + and – signs in order to more easily survey the
stress effects of the treatments. The 32-year long-term effect of fertilization on the grain
yields clearly shows the deficiency or surplus of nutrients. The cumulative average
yields of the 8 rotations amounted to 30.8(IR)-32.9(BI) t ha –1
and 60.3(IR)-59.4(BI) t
ha –1
with wheat and maize, respectively.
Stress effect caused by long-term nutrient deficiency: In the unfertilized wheat and
maize plots (code number: 000) significant yield decreases could be detected, which
was attributable to the increasing nutrient demand during the 32 years of the trials.
Wheat was more sensitive to stress effects at IR, while maize at BI.
Stress effect caused by fertilization only with N: In the treatments of increasing N doses
(100, 200, 300), the ratio of NPK nutrients gradually became distorted. The N over-
fertilization resulted in a stress effect of undesirable degree with both crops and at both
soil types. At BI the deleterious effect was higher. Compared to the control, this stress
effect was not so marked, but clear-cut. According to the P and K supplying capacity of
the experimental soils, the plants could uptake some P and K nutrients.
Stress effects in the NP treatments, regarding the role of P fertilization: The increasing
N doses given together with P fertilizer (110, 210, 310; 120, 220, 320) reduced the
stress effect. In the NP treatments wheat favorably responded to the P fertilizer, mainly

VIII. Alps-Adria Scientific Workshop Neum, Bosnia-Herzegovina, 2009
DOI: 10.1556/CRC.37.2009.Suppl.2 87
at BI, because the soil fertility is poor for phosphorus at this site. At IR the effect of P
fertilizer was lower, because this experimental soil has a medium phosphorus status.
Table 3. Cumulative yield differences and average yields of winter wheat (t ha-1)
I r e g s z e m c s e B i c s é r d NPK
codes 2nd.
rotation
4th
rotation
6th
rotation
8th
rotation
2nd
rotation
4th
rotation
6th
rotation
8th
rotation
000 -2.47 -5.54 -8.19 -11.33 -2.69 -5.89 -9.27 -12.99
100 -0.60 -2.13 -3.70 -4.93 -0.72 -2.08 -3.15 -5.49
200 0.11 -0.56 -1.98 -1.54 -0.60 -2.48 -4.01 -7.04
300 -0.16 -1.30 -3.32 -4.03 -0.73 -2.69 -3.66 -5.67
110 -0.18 -0.52 -0.24 0.02 -0.31 -0.67 -1.17 -1.26
210 0.20 0.92 1.70 2.07 0.62 1.82 2.11 2.84
310 0.50 1.42 2.18 2.91 0.89 2.23 2.49 2.94
120 -0.30 -1.14 -0.75 -0.62 0.19 0.24 0.40 1.23
220 0.64 1.92 2.86 2.86 0.96 3.10 4.80 6.15
320 0.48 1.60 2.65 3.05 0.98 3.17 3.91 4.90
101 -0.40 -2.24 -3.80 -5.05 -0.71 -2.89 -3.94 -5.09
201 -0.09 -1.29 -1.52 -1.65 -0.31 -2.29 -3.57 -5.32
301 -0.19 -1.55 -4.24 -5.46 -0.49 -2.62 -3.62 -4.03
111 -0.52 -0.79 -0.10 -0.17 -0.49 -0.92 -0.24 -0.05
211 0.54 1.31 2.19 2.98 0.51 1.50 2.78 4.30
311 1.11 3.02 4.40 5.31 0.82 2.49 2.91 4.31
121 -0.34 -0.78 -0.23 -0.52 -0.54 -0.61 -0.04 0.79
221 0.54 2.53 4.05 5.21 0.72 2.70 4.16 5.79
321 0.47 2.35 3.89 4.79 0.94 2.94 4.62 6.99
432 0.65 2.76 4.15 5.07 0.95 2.96 4.51 6.71
average
yield 4.01 4.68 5.80 2.09 3.68 4.40 5.42 3.28
LSD5% 0.41 0.76 0.67 0.47 0.46 0.35 0.86 0.61
Relationships between K supply and stress effects on the tested soil types: Wheat
showed P deficiency in the NK treatments (101, 201, 301) on both test soils, at BI
cumulatively because of the long-term effect. At IR the P reserves of the soil reduced
the stress effects in the NK treatments.
Relationships between NPK treatments and stress effects: In treatments 101, 201, 301,
111, 211, 311,121, 211, 321, 432 increasing N doses were given with increasing P and
K doses. Wheat showed stress effects in case of P deficiency at both sites. At IR, the
cumulative yield differences of maize were positive in the above treatments. At BI, in
PK treatments combined with the lowest N dose, N deficiency caused the stress effect,
because of the unbalanced nutrient ratios.
Optimal treatments: Treatment 221 gave the optimal wheat yield at IR (5.21 t ha-1
=
16.9% increase compared to the average), while treatment 321 proved to be optimal at
BI (6.99 t ha-1
= 21.3 %). Treatment 311 gave the optimal maize yield at IR (4.68 t
ha -1
= 7.8 %), while treatment 321 proved to be optimal at BI (7.13 t ha-1
= 12.0%).

Vol. 37, 2009, Suppl. Cereal Research Communications
88
Table 4. Cumulative yield differences and average yields of maize (t ha-1)
I r e g s z e m c s e B i c s é r d NPK
codes 2nd
rotation
4th
rotation
6th
rotation
8th
rotation
2nd
rotation
4th
rotation
6th
rotation
8th
rotation
000 -1.71 -3.73 -4.59 -8.78 -3.56 -8.91 -12.83 -18.82
100 -0.72 -0.86 -2.07 -2.22 -0.59 -1.76 -3.41 -4.69
200 -0.66 -1.39 -1.15 -1.78 -0.90 -1.72 -3.30 -4.42
300 -0.01 -1.05 -1.09 -1.33 -0.20 -0.52 -2.56 -2.37
110 -0.92 -1.67 -1.95 -1.87 -1.98 -3.87 -4.85 -4.22
210 -1.81 -2.49 -3.20 -3.51 0.59 0.75 1.16 2.32
310 -0.28 -0.86 -2.46 -2.50 0.66 -0.28 0.06 0.60
120 -2.23 -2.73 -4.35 -5.05 -0.73 -2.32 -2.99 -2.43
220 -0.80 -1.01 -1.72 -1.10 0.45 0.81 1.50 2.23
320 -0.59 -1.46 -2.40 -3.13 0.86 2.44 3.90 5.13
101 0.53 1.01 1.63 1.80 -0.53 -1.27 -1.48 -2.64
201 0.62 1.23 2.76 3.25 0.01 0.19 0.18 -0.43
301 1.55 2.62 3.22 2.63 0.64 0.83 0.51 0.72
111 0.19 0.32 1.20 1.91 -0.18 -0.38 0.20 0.52
211 0.77 2.39 3.09 4.42 0.63 2.16 3.25 3.59
311 0.86 1.98 2.56 4.68 1.41 4.09 5.84 6.39
121 0.77 1.29 2.21 2.61 -0.64 -1.92 -1.37 -1.05
221 0.83 1.08 1.97 2.72 0.71 2.12 3.16 3.56
321 1.99 3.11 4.14 5.40 1.73 4.36 5.68 7.13
432 1.61 2.11 2.18 1.87 1.65 5.21 7.36 8.90
average
yield 7.27 6.96 4.73 10.52 7.58 8.08 7.03 7.32
LSD5% 0.69 0.57 0.55 0.90 0.69 1.04 1.24 1.22
Conclusions
Fertilization 000 resulted in stress effects through nutrient deficiency, while unbalanced
NPK rates now through nutrient surplus, now through nutrient deficiency. In the 8
rotations, the cumulative yield decrease of wheat amounted to 11-13 t ha-1
at both sites.
At BI the yield decrease of maize (18.82 t ha-1
) was twice as much as at IR (8.78 t ha-1
).
The stress effects were markedly affected by long-term deficiency or not optimal ratios
of nutrients and by the different nutrient supplying capacity of the experimental soils.
References
Debreczeni, B. - Debreczeni- B.-né.:1994.Trágyázási kutatások 1960-1994. Akadémia Kiadó, Budapest
Izsáki, Z.:2007. N and P impact on the yield of maize in a long-term trial. Cereal Res. Comm. 35:4.1701-
1711.
Kátai, J. – Vágó, I. – Nagy, P. T. − Lukács, V. E.: 2006. Correlation between the nitrogen content of soil and
element uptake of maize in a pot experiment. Cereal Res. Comm. 34: 1. 215-218.
Németh, T.: 2006. Nitrogen in the soil-plant system, nitrogen balances. Cereal Res. Comm. 34: 1. 61-65.

VIII. Alps-Adria Scientific Workshop Neum, Bosnia-Herzegovina, 2009
DOI: 10.1556/CRC.37.2009.Suppl.2 89
EFFECTS OF PRECIPITATION ON THE STARCH YIELD OF MAIZE GROWN FOR BIOETHANOL PRODUCTION
Tamás RÁTONYI1– Endre HARSÁNYI2 – Csongor KISS2 – Attila MEGYES1
1 Institute for Land Utilisation, Technology and Regional Development, Centre for Agricultural Sciences and
Engineering, University of Debrecen, H-4032 Debrecen Böszörményi u. 138.,e-mail: [email protected] 2 University Regional Development Centre, Centre for Agricultural Sciences and Engineering, University of
Debrecen, H-4032 Debrecen Böszörményi u. 138.
Abstract: The objective of this study was to evaluate the effects of water stress (precipitation), under rain fed
conditions, on the main components of maize grown for bioethanol production. Yield, starch content and
starch yield per hectare of maize hybrids were investigated in a droughty (2007) and in a favourable year with
optimal weather conditions (2008). This study was conducted at the Látókép Experimental Station of the
Centre for Agricultural Sciences and Engineering, Debrecen University. The investigations were part of a
multi-factorial long-term field experiment. The starch content was determined by a Foss InfratecTM 1241 type
Grain Analyzer. Based on our results, optimal treatment combinations can be determined that can be used to
maximalize starch yield per hectare in both droughty and wet crop seasons. In the water-stressed crop season
of 2007, the highest starch yield was obtained with the hybrids Mv Tarján and Mv Koppány in moisture-
saving shallow spring tillage at 120 kg ha-1 N dose (2.96 and 2.93 t ha-1). The higher fertilizer dose
significantly decreased starch yield values. In 2008, the best treatment combination proved to be the winter
plowing when applying a N fertilizer dose of 120 kg ha-1 in the case of ED 5110 hybrid (8.42 t ha-1). The N
fertilizer dose of 240 kg ha-1 further increased starch yield (9.25 t ha-1), but this dose cannot be applied either
from environmental protection aspects, or from economical causes.
Keywords: maize, starch content, starch yield, water stress, precipitation
Introduction
In the recent 4-5 years, the importance of maize processing for industrial purposes
increased significantly, whose reason is the revaluation of renewable energy resources
and the starch-based ethanol production. In order be able to more thoroughly understand
the hybrids getting into common production, the factors influencing quality have to be
examined to a more detailed extent. The data about each hybrid help the producer and
the integrator in producing hybrids that best conform to the aim of usage and its related
quality requirements. As the overwhelming majority (50-70%) of the processing costs
of bioethanol production is constituted by raw material expenses, it is important to be
able to extract the highest amount of ethanol possible from the purchased grain yield.
Prokszáné et al. (1995) stated that the increasing nitrogen fertilizer doses resulted in the
significant increase of the protein content of maize, but starch content justifiably
decreased at the same time. Similarly to yield, higher starch yield was obtained in the
case of higher nitrogen fertilizer levels. Both starch and extractable starch content were
decreased by N fertilization in the studies of Singh et al. (2002) and Kiss and Andorkó
(2008). Gyıri et al. (2008) concluded that there is also a negative relationship between
protein and starch content. They call attention to the fact that the previous decades’
strategy to increase the protein mass should be supervised when appraising hybrids, as
the carbohydrate content of grains is being revaluated during bioethanol production. The
authors’ question is whether the breeding strategy has to be rethought due to this reason,
or maize hybrids with low protein content or high total fermentable (HTF) hybrids will
be the ideal raw material for the bioethanol industry under Hungarian conditions.

Vol. 37, 2009, Suppl. Cereal Research Communications
90
Materials and methods
The objective of this study was to evaluate the effects of water stress (precipitation),
under rain fed conditions in eastern Hungary, on the main components of maize grown
for bioethanol production over the 2007-2008 crop seasons. Yield, starch content and
starch yield per hectare of maize hybrids were investigated in a droughty (2007) and in
a favourable year with optimal weather conditions (2008). This study was conducted at
the Látókép Experimental Station of the Centre for Agricultural Sciences and Engineering, Debrecen University located in the north-eastern part of the Great
Hungarian Plain (47° 30’ N, 21° 36’ E, 121 m elevation). The investigations were part
of a multi-factorial (irrigation, tillage, fertilization, plant density) long-term field
experiment. The soil of the experimental site was a lowland pseudomyceliar chernozem
(Mollisol-Calciustoll or Vermustoll, silt loam). The climate is temperate continental,
with a mean annual precipitation of 566 mm of which approximately 60% (345 mm)
occurs during the growing season (from April to September). In 2007, the
extraordinarily dry half year (128 mm) was followed by a very long drought period
from early spring that was brought to an end by a moist period starting in mid-August.
The weather conditions in 2008 were very favorable for maize, with sufficient
precipitation both in the winter and in the vegetation period. Total precipitation for the
2008 growing season was 484 mm. The April to September precipitation was 23% more
than the fifty-year average. Five maize hybrids chosen for bioethanol production were
set up in the experiment: DKC 4005 (FAO 300); Kamaria (FAO 370); MV Tarján (FAO 380); MV Koppány (FAO 420); ED 5110 (FAO 420). Corn grain samples were collected
before harvest. The laboratory examinations of corn grain samples were done at the
Institute for Land Utilisation, Technology and Regional Development, Centre for
Agricultural Sciences and Engineering, Debrecen University. After sample preparation
starch content of maize hybrids were evaluated by Foss InfratecTM 1241 Grain Analyzer. The measurements are based on the fact that the main components in the grain
(corn), such as protein, moisture, starch, fat, absorb electromagnetic radiation in the
near-infrared region of the spectrum (570-1100 nm). The Near Infrared Transmission
(NIT) instrument measures the transmission absorption, the main components of whole
corn grain samples are determined by calibration curves.
Results and discussion
The precipitation supply of the examined years basically determined the starch yields
per hectare and the starch content specified for dry matter units. In the extremely
droughty year of 2007, the starch content of hybrids (73.0%) exceeded the average
value measured in 2008 (72.4%), which had a much more favorable precipitation
supply, but the precipitation shortage during the spring and the vegetation period and
water stress resulting from it ended up in a low average starch yield (1.57 t ha-1
). As
opposed to this, much higher average starch content per hectare (7.7 t ha-1
) was obtained
in 2008, in rather favorable weather conditions.
The increasing fertilizer doses significantly decreased the starch content per dry matter
units in both years. The highest starch content was obtained in non-fertilized control
plots, whereas the lowest values were registered on plots on which N fertilizer doses

VIII. Alps-Adria Scientific Workshop Neum, Bosnia-Herzegovina, 2009
DOI: 10.1556/CRC.37.2009.Suppl.2 91
240 kg ha-1
were applied. Nevertheless, fertilization had an adverse effect on starch
yield per hectare. The fertilizer doses increased the starch yield of hybrids parallel with
the increase of grain yield, the maximum value was obtained in 2008, in the case of 240
kg ha-1
N. The extremely dry crop year of 2007 provided adverse results to those
published in the specialized literature, because fertilization reliably increased starch
yield only to a dose of 120 kg ha-1
N, the highest dose (240 kg ha-1
) significantly
decreased it (Figure 1).
70
71
72
73
74
75
N 0 N 120 N 240
Fertilization (kg ha-1)
Sta
rch
co
nte
nt
(%)
2007
2008
0
2
4
6
8
10
N 0 N 120 N 240
Fertilization (kg ha-1)
Sta
rch
yie
ld (
t h
a-1
)
2007
2008
Figure 1. Corn starch content and starch yield response to different N rates (Debrecen-Látókép, 2007-2008)
As a result of the fertilization treatments applied during the experiment, different results
of starch yield per hectare was obtained for every type of hybrids. Based on our results,
the optimal treatment combinations could be determined that made it possible to achieve
higher starch yield per hectare. In 2007, the highest starch yield was obtained with the
hybrids Mv Tarján and Mv Koppány in moisture-saving shallow spring tillage with a N
dose (120 kg ha-1
). The results were 2.96 and 2.93 t ha-1
, respectively. The higher
fertilizer dose significantly decreased starch yield values. It also reinforces the
observations and practical experience gained so far about adaptive, moisture-saving
tillage. As a result of this tillage method, the advantage of the moisture surplus stored in
soil will be revealed in extremely dry and droughty crop years, because there will be a
lot more water available for maize development in the critical period when there is
shortage of water. In 2008, the best treatment combination proved to be the winter
plowing when applying N fertilizer dose of 120 kg ha-1
in the case of ED 5110 hybrid
(8.42 t ha-1
). The N fertilizer dose 240 kg ha-1
further increased starch yield (9.25 t ha-1
),
but this dose cannot be applied either from environmental protection aspects, or from
economical causes.
The protein content of the examined hybrids was between 9-12% in the droughty year
of 2007, whereas it was lower (8-10%) in 2008, despite the high yields obtained as a
result of the favorable crop year. 72-74% starch content was measured in 2007, whereas
they were lower (71-73%) in 2008. The examination results of the two year also
reinforce the fact that there is a negative correlation between these two factors. Linear
regression was applied to describe the relationship between these two parameters. The
linear functions characterize the relationship between protein and starch content
reliably.

Vol. 37, 2009, Suppl. Cereal Research Communications
92
A
2007: y = -0.7863x + 81.092
R2 = 0.8109n = 132
2008: y = -0.7723x + 78.944
R2 = 0.7377n = 132
70
71
72
73
74
75
76
2 4 6 8 10 12 14 16
Protein content (%)
Sta
rch
co
nte
nt
(%)
2007
2008
B
2008: y = -0,91x + 78,456
R2 = 0,1719n = 132
2007: y = 0,3692x - 24,567R2 = 0,0822
n = 132
0
2
4
6
8
10
12
14
16
18
70 71 72 73 74 75 76
Starch content (%)
Co
rn y
ield
(t
ha-1
)
2007
2008
Figure 2. Relationship between the corn protein and starch content (A) and between the corn yield and the
starch content (B) (Debrecen-Látókép, 2007-2008)
Based on the high r2 values (0.72 and 0.82), the fitting of regression lines was good in
both years (Figure 2/A).
When assessing the relationship between the grain yield and starch content of maize, it
was stated that a rather weak correlation can be shown between the two parameters on
the basis of the r2 values in 2008. Nevertheless, the negative correlation did not prevail
at all in 2007, therefore the starch content of grains increased parallel with the increase
of hybrid yields. At the same time, the alignment of the regression line to the data is
rather weak (r2 = 0.08), the correlation between the two factors is not significant (Figure
2/B).
Conclusions
Based on our results, optimal treatment combinations can be determined that can be
used to maximalize starch yield per hectare in both droughty and wet crop seasons. In
the water-stressed crop season of 2007, the highest starch yield was obtained in
moisture-saving shallow spring tillage at 120 kg ha-1
N dose. The higher fertilizer dose
significantly decreased starch yield values. In 2008, the best treatment combination
proved to be the winter plowing when applying N fertilizer dose of 120 kg ha-1
. The N
fertilizer dose of 240 kg ha-1
further increased starch yield, but this dose cannot be
applied either from environmental protection aspects, or from economical causes. All
these could serve as an important argument during the development of a production
technology guideline.
Acknowledgements
This work was supported by the Baross Gábor Regional Research and Development
Innovation Program (EA_KFI_07) and the Bolyai János Research Scholarship of the
Hungarian Academy of Sciences.
References
Gyıri Z., Sipos P., Ungai K.: 2008. A kukorica minıségének aktuális kérdései. Agrofórum, 19: Extra 22. 88-
89.
Kiss Cs., Andorkó I.: 2008. Small-plot field experiment with maize hybrids, aiming to study starch content.
Cereal Research Communications, 36: 1. 1535-1538.
Prokszáné Paplogó Zs., Széll E., Kovácsné Komlós M.: 1995. A N-mőtrágyázás hatása a kukorica termésére
és néhány beltartalmi mutatójára eltérı évjáratokban réti öntéstalajon. Növénytermelés, 44: 1. 33-42.
Singh, M., M.R. Paulsen, L. Tian, and H. Yao: 2002. Site-specific study of corn protein, oil, and extractable
starch variability using NIT spectroscopy. ASAE Meeting Pap. 02-1111. ASAE, St. Joseph, MI.

VIII. Alps-Adria Scientific Workshop Neum, Bosnia-Herzegovina, 2009
DOI: 10.1556/CRC.37.2009.Suppl.2 93
POSSIBILITIES TO INCREASE STRESS TOLERANCE OF WHEAT
Borbála HOFFMANN 1 – Nikolett ARANYI
1 – Sándor HOFFMANN
2 – Márta
MOLNÁR-LÁNG 3
1 Department of Plant Sciences and Biotechnology, Georgikon Faculty, University of Pannonia, 8360.
Keszthely, Deák F. u. 16., e-mail: [email protected] 2 Department of Crop Production and Soil Sciences, Georgikon Faculty, University of Pannonia,
3 Agricultural Research Institute of the Hungarian Academy of Sciences, Martonvásár
Abstract: Agricultural production is limited primarily by environmental stresses among those the most
important is water deficiency. The safety of wheat production requires the propagation of drought tolerant
cultivars. Hybridization between related species makes it possible to transfer desirable traits from one species
into another. Barley - known to have good drought tolerance - is a potential gene source for wheat
improvement. Lines developed from wheat/barley hybrids were investigated to determine how the added
barley chromosomes (segments) influence drought tolerance in wheat. Data were obtained for anthesis- and
maturity date, plant height, root/shoot ratio and components of grain yield. On the basis of our data new lines
with valuable agronomic traits can be selected which could be used in wheat breeding programs and
consequently in wheat production.
Keywords: wheat-barley translocation, addition, substitution lines, drought tolerance
Introduction
Agricultural production is limited primarily by environmental stresses among those the
most important is water deficiency. The efficient use of water stored in soil has special
significance. Annual precipitation in Hungary will not be more in the future and its
unfavorable spatial and time distribution will even be less favorable (Várallyay, 2008).
The primary approach for alleviation of environmental stresses focused on modification
of the environment. These are, however, expensive and effective only in the short run,
contemporaneously loading the environment. Economic and ecological constraints
make the approach of genetic improvement of stress tolerance a viable alternative.
Differences were found between genotypes regarding their tolerance to environmental
stress, allowing selection to be made for better tolerance (Balla et al., 2006). Limited
soil moisture influences nutrient availability for plants. Pepó and Balogh (2008) found
that advantageous water supply decreased the optimum nutrient level of the cultivars.
Hybridization between related species makes it possible to transfer desirable traits from
one species into another. Barley - known to have good drought tolerance - is a potential
gene source for wheat improvement. The introgression of barley (Hordeum vulgare L.)
chromosome segments into wheat (Triticum aestivum L.) may result in the transfer of
new, useful traits, such as earliness, tolerance of drought and soil salinity or various
traits for specific nutritional quality into wheat. Since the first successful hybridization
between wheat and barley (Kruse 1973) only a few wheat-barley translocation and
substitution lines have been developed (Islam and Shepherd 1992; Koba et al. 1997;
Molnár-Láng et al. 2000a.) and were investigated regarding cytogenetic characteristics
and fertility (D. Nagy et al. 2002; Szakács and Molnár-Láng, 2007.). Even less
information is available on the ability of barley chromosomes to compensate for wheat
chromosomes regarding agronomically important characteristics and there is no
information available on the behaviour of wheat-barley derivates grown on the field.

Vol. 37, 2009, Suppl. Cereal Research Communications
94
The aim of our study was to determine how the added barley chromosome (segments)
influence various agronomic traits in wheat.
Materials and methods
Two wheat/barley addition (2H, 3H) and one translocation line (7D-5HS) produced
from the 'Mv9kr1' × 'Igri' hybrid (Molnár-Láng et al. 2000b), and one substitution [4H
(4D)] and two translocation lines (3HS.3BL, 6B-4H) orginating from the ‘Chinese
Spring’ × ‘Betzes’ hybrid (Molnár-Láng et al. 2000a) developed in Martonvásár with
the parental cultivars together were investigated.
The field experiment was carried out at UP Georgikon Faculty, Keszthely, during 2007-
2008. The soil of the experimental site is a lessivated brown forest soil (FAO: Luvic
phaosem) with low organic material, medium K- and P content. Row space was 30 cm.
Each genotype was sown in a 15m long row. The half length of the rows were covered
with a plastic folia on 21th of April (EC: 30-31) to protect plants from rain (Picture 1) indicating 180 mm difference in water supply between control (not cowered) and stress
(cowered) treatment. Sowing and harvest was made with hand. Data were obtained for
dates of ontogenesis (EUCARPIA decimal code for growth stages), plant height,
root/shoot ratio at EC 30-31, leaf water potential (ΨL: was determined in a pressure
chamber – PMS Instrument – with N2 gas), ear length, thousand grain weight, number
of kernels, and grain yield.
Results and discussion
At tillering (EC 30-31) 6 plants of each genotype were grubbed up and length and mass
of root and shoot were measured. From point of drought tolerance root length and
root/shoot ratio are important characteristics. The larger root biomass could contribute
to an increased drought tolerance (Hoffmann and Burucs, 2005). All wheat-barley
derivates had longer roots and shorter shoots than the wheat parent resulting in an even
more increased root/shoot ratio (Figure 1). The mean of lines was 47%, while the
root/shoot ratio of the parents was 22- and 41% for wheat and barley respectively. The
most favorable result was measured in case of 7D-5HS (65%) and 4H (4D) (55%).
0
10
20
30
40
50
60
3BL.3HS (35%)
6B-4H (33%)
7D-5HS (65%)
4H (4D) (55%)
2H (50%)
3H (43%)
Mv9kr1 (22%)
Igri (41%)
cmrootshoot
Figure 1. Root- and shoot length (cm) and root/shoot ratio (in parentheses under the sign of the line) of wheat-
barley derivates in both treatments.
Picture 1. Half of the rows were covered with a plastic folia at EC: 30-31 to protect plants from rain. Each
row (15m) is one genotype. Differences in plant height are visible.

VIII. Alps-Adria Scientific Workshop Neum, Bosnia-Herzegovina, 2009
DOI: 10.1556/CRC.37.2009.Suppl.2 95
-140
-130
-120
-110
-100
-90
-80
-70
3BL.
3HS
6B-4
H
7D-5
HS
4H (4
D)
2H 3H
Mv9
kr1
Igri
Bet
zes
t.á
Chi
nese
S
%
!!
Figure 2. Leaf water potential (ΨL ) of wheat-barley derivates and their parents in stress treatment expressed
in percent (%) of the control treatment.
During drought stress the water potential of the plant decreases leading to the
strengthening of suction force, that can be considered as the result of osmotic
adaptation, depending on the drought tolerance strategy of the genotype (Hoffmann et
al. 2006). Leaf water potential (ΨL) in our experiment (Figure 2) was only reduced by
3-5 % in stress treatment in the case of 3BL.3HS, 6B-4H and 3H lines and the wheat
parent and 12- 15% in the case of 2H and 7D-5HS lines while it was 30- and 34% in the
case of 4H (4D) and the barley parent compared to their control plants.
3BL.
3HS (8
0)
6B-4
H (
73)
7D-5
HS (
84)
4H (4
D)
(99)
2H (
84)
3H (
96)
Mv9
kr1
(88)
Igri
(93)
Bet
zes
(86)
Chi
nese
S (8
7)
0
50
100
150
200
250
300
350
SZEMTERMÉS (g)
stress
control
(g)
Figure 3. Grain yield (g) of wheat-barley derivates and their parents harvested on 1 m in control and stress
treatments and the relative value (%) in parentheses behind the sign of the line.
Grain yield was reduced by 12,4 % in the mean of genotypes examined (Figure 3). The
highest yield loss was measured in case of 6B-4H (27%), while there was no yield

Vol. 37, 2009, Suppl. Cereal Research Communications
96
decrease in the case of 4H (4D). The barley parent Igri lost 7- and the wheat parent
Mv9kr1 12% of its control’s yield. But it is not enough to consider only the decrease of
yield, we have to take into account the absolute values as well to become a more
sophisticated conclusion. Lines 3H and 4H (4D) had the smallest yield in both
treatment, while 3BL.3HS over yielded the wheat parent, though it has lost 20% of it’s
controls yield (Figure 3).
Conclusions
Six addition, substitution and translocation lines developed from wheat-barley hybrid
were investigated in a field experiment to determine how the added barley
chromosomes (segments) influence drought tolerance in wheat. Plants adapted to water
deficiency by intensifying root growth and at the same time by the retention of shoot
growth, resulting in a relative increase of root/shoot ratio. But the retention of shoot
growth causes the decrease of assimilating leaf area which resulted in yield losses.
During drought stress the water potential of the plant decreased, that can be considered
as osmotic adaptation. The use of these genetic material in wheat breeding programs can
result in new varieties with better drought tolerance.
Acknowledgements
This work was supported by the Generation Challenge Programme (CGIAR GCP SP3,
G4007.23) and the Hungarian National Research Fund (K 75 381).
Reference samples
Balla K. – Bedı Z. – Veisz O.: 2006. Effect of heat and Drought stress on the photosynthetic processes of
wheat. - Cereal Research Communications, 34: 1. 381-385.
D. Nagy E. – Molnár-Láng M. – Linc G. – Láng L.: 2002. Identification of wheat-barley translocations by
sequential GISH and two-colour FISH in combination with the use of genetically mapped barley SSR
markers. Genome, 45: 1238 – 1247
Hoffmann B. - Burucs Z.: 2005. Adaptation of wheat (Triticum aestivum L) genotypes and related species to
water deficiency. Cereal Research Communications. 33: 4. 681-687.
Hoffmann B. - Cseuz L. - Pauk J.: 2006. Az ıszibúza szárazságtőrésre történı nemesítésének lehetıségei és
korlátai. In: Dudits Dénes (ed), A búza nemesbítésének tudománya: A funkcionális genomikától a
vetımagig. Winter Fair Kft., ISBN-13: 978-963-87189-2-1 Szeged, 191-224.
Islam, A.K.M.R. – Shepherd, K.W.: 1992. Production of wheat-barley recombinant chromosomes through
induced homoeologous pairing. 1. Isolation of recombinants involving barley arms 3HL and 6HL. Theor.
Appl. Genet. 83: 489-494.
Koba, T. – Takumi, S. – Shimada, T.: 1997. Isolation, identification and characterization of disomic and
translocated barley chromosome addition lines of common wheat. Euphytica, 96: 289-296.
Kruse, A.: 1973. Hordeum × Triticum hybrids. Hereditas, 73: 157-161.
Molnár-Láng M. - Linc G. - Friebe, R. B. - Sutka J.: 2000a. Detection of wheat-barley translocations by
genomic in situ hybridization in derivatives of hybrids multiplied in vitro. Euphytica 112: 2. 117-123.
Molnár-Láng M. – Linc G. – Logojan, A. – Sutka J.: 2000. Production and meiotic pairing behaviour of new
hybrids of winter wheat × winter barley (Hordeum vulgare L.). Genome, 43: 1045-1054.
Pepó P. – Balogh Á.: 2008. A vízellátás szerepe az ıszi búza (Triticum aestivum L.) fajtaspecifikus
tápanyagreakciójában. Role of water supply in the variety-specific fertiliser responses of winter wheat
(Triticum aestivum L.). Növénytermelés, 57: 1. 85-94.
Szakács É. – Molnár-Láng M.: 2007. Development and molecular cytogenetic identification of new winter
wheat/winter barley (Martonvásári 9 kr1/Igri) disomic addition lines. Genome, 50: 43-50.
Várallyay G.: 2008. Extreme soil moisture regime as limiting factor of the pplants’ water uptake Cereal
Research Communications. 36: (Suppl.) 3-6

VIII. Alps-Adria Scientific Workshop Neum, Bosnia-Herzegovina, 2009
DOI: 10.1556/CRC.37.2009.Suppl.2 97
ABIOTIC AND BIOTIC STRESS EFFECTS ON THE YIELD OF DIFFERENT SUNFLOWER GENOTYPES
András SZABÓ
Institute of Crop Sciences, Agronomy Faculty, University of Debrecen, H-4032 Debrecen, Böszörményi str.
138. e-mail: [email protected]
Abstract: The effect of an abiotic factor the crop year on the sowing time and crop density of sunflower
hybrids was examined in a field research. We have evaluated the crop yield and the pathologic reaction of
sunflower hybrids in two years with different amount of precipitation (2007 and 2008), at three sowing times
(end of march, middle of april, beginning of may) and at 4 crop density levels (35000 plant ha-1-65000 plant
ha-1). The soil of the research site was calcaleorus chernozem and no irrigation was applied. We found that at
the average of the hybrids, crop density levels and sowing times the crop yield was higher (4390 kg ha-1) in
the dryer year of 2007 than in the crop year of 2008 (4051 kg ha-1), when the amount of precipitation was
higher but its distribution was rather extreme. In the year of 2007 the sowing time in the middle of april
resulted the highest yield at the average of the hybrids and crop density levels (4664 kg ha-1), while in the year
of 2008 the sowing time in the beginning of may resulted the highest yield (4362 kg ha-1). The maximum crop
yield was resulted at the lower (45000-55000 plant ha-1 ) crop density level in the humid year (2008), while in
the dryer year (2007) the highest yield was resulted at the higher (55000-65000 plant ha-1 ) crop density level.
The extent of stalk lodging and the infection by Diaporte, Sclerotinia and head diseases was different in the
years. The Diaporhte infection of sunflower hybrids was 2-47 % in 2007, and it was 17-72 % in 2008. The
Sclerotinia infection of sunflower hybrids was 1,1-13,9 % in 2007, and it was 0,1-3,9 % in 2008. Stalk
bending and the infection by the examined diseases increased with the increase of crop density levels (from
35000 plant ha-1 to 65000 plant ha-1). As regards the examined factors, we found significant differences
among the hybrids. Our results proved that the different genotype sunflower hybrids have good abiotic (water
deficiency) stress tolerance compared to other filed crops.
Keywords: sunflower, crop year, plant density, sowing time, infection, yield
Introduction
Besides cereals and maize, sunflower has the largest growing area among crops in
Hungary (LEHOCZKY and SÁRKÁNY 2007; MIJIC et al. 2007). Sunflower has very
good adaptation ability. It adapts well to relatively unfavourable weather conditions
(BÍRÓ and PEPÓ 2008). The effects of year and the global climate change
(VÁRALLYAY 2007) manifest both in the amount of yield and in yield safety
(BIRKÁS et al. 2006). The year has a decisive influence on the amount of yield,
however, this effect varies with the hybrid (BORBÉLYNÉ et al. 2008). The yield of
sunflower varies significantly among the years and genotypes (GÖKSOY and TURAN
2007). The agroclimatic factors have the most significant effect on the yield of
sunflower hybrids, while the effect of the hybrid assortment is less strong. The
incidence of diseases and the degree of their intensity are significantly determined by
the hybrid assortment and the agroclimatic conditions of the year (temperature, the
amount and distribution of precipitation) (BRANIMIR et al. 2008). ZSOMBIK (2008)
found that the largest yields were obtained at the early sowing time (3913 kg ha--1
),
while the yields were lower at the standard sowing time (3865 kg ha-1
) and the lowest
yields were measured at the late sowing time in May (3422 kg ha-1
) for the hybrids
involved in the experiment. According to PEPÓ and SZABÓ (2005), the response of
sunflower hybrids to increasing plant density is influenced by both the year and the
genotype. Increasing plant density results in a higher infection of pathogens.

Vol. 37, 2009, Suppl. Cereal Research Communications
98
Materials and methods
The experiment was carried out in the Hajdúság loess region at Experimental Station of
Látókép in 2007 and 2008. The experimental plots were set up in four replications in a
randomized block design. The hybrids were grown at four plant densities (35000-65000
plants ha-1
) with 10000 plants ha-1
differences between the groups. The sunflower
hybrids were sown at early (end of March), standard (mid-April), and late (beginning of
May) sowing times. When analyzing the weather of the experimental years, it can be
stated that 2008 was more rainy than 2007 regarding the whole year, however, the
distribution of precipitation was uneven, the amount of rain was less in May and August
and twice higher in the summer (June and July) than the average of 30 years.
Results and discussion
The abiotic (climate) requirements of sunflower hybrids are different from those of
other field crops. Due to the significant susceptibility to fungal diseases and the good
draught tolerance, the highest yields can be obtained in dry years on chernozem soils. In
this paper, we present the results of the experiments with the newest hybrids for 2007
and 2008. Regarding the experimental years, higher yields were obtained in 2007 due to
the dry weather more favourable for sunflower than in 2008 which was more wet with
an unfavourable distribution of precipitation. The amount of yield calculated as an
average of the different sowing times and plant densities was 4390 kg ha-1
in 2007 and
4051 kg ha-1
in 2008. In 2007, the highest yields were obtained at the plant densities of
55000 plants ha-1
(NK Delfi, PR64D82, ES petúnia) and 65000 plants ha-1
(NK Dolbi,
ES Albatre), except for the hybrid PR64A04 (4926 kg ha-1
at 45000 plants ha-1
). In
2008, the plant density of 55000 plants ha-1
proved to be optimal in the average of the
sowing times except for the hybrids NK Delfi (4720 kg ha-1
) and NK Kondi (4539 kg
ha-1
). In both years, the maximum yield was obtained at the plant density of 55000
plants ha-1
in the average of the hybrids (4626 kg ha-1
in 2007, 4325 kg ha-1
in 2008),
which was lower in 2008 due to the more rainy weather and the resulting greater
phytopathological pressure. Due to the differing weather conditions, the optimum
sowing time of hybrids varied with the year. In 2007, the largest yield was obtained
with the mid-April sowing time for most of the hybrids (except for the hybrid
PR64A04). When applying the late sowing time, the yield was lower due to the
shortening of the vegetation period of sunflower. In 2008, the vegetation period was
prolonged by the significant amount of rain in the middle of the season (140.1 mm in
June, 144.9 mm in July), consequently, the largest yields were obtained with the late
sowing time (early May) for all hybrids in contrast to the previous results and the lowest
yields were measured in the case of the standard sowing time. The largest yields were
obtained with the standard sowing time in 2007 (4664 kg ha-1
) and with the late sowing
time in 2008 (4362 kg ha-1
) in the average of the hybrids and the plant densities.
The largest yield was measured for the hybrids PR64A04 (4926 kg ha-1
) and NK Delfi
(4720 kg ha-1
) at 45000 plants ha-1
plant density in the average of sowing times in 2007
and 2008, respectively. The largest yield in the average of plant densities was measured
for the hybrid ES Albatre (4909 kg ha-1
) with standard sowing time and for NK Delfi
(4740 kg ha-1
) with the late sowing time in 2007 and 2008, respectively (Table 1).

VIII. Alps-Adria Scientific Workshop Neum, Bosnia-Herzegovina, 2009
DOI: 10.1556/CRC.37.2009.Suppl.2 99
Table 1. Yields of sunflower hybrids according to different plant density levels and sowing times in 2007-
2008 (Debrecen-Látókép, 2007-2008)
2007
NK Delfi PR 64A04 PR 64D82 NK Dolbi ES Petunia ES Albatre Average
Yield at different plant density levels averaging the sowing times
35000 plant ha-1 4192 4348 3956 3925 3540 3855 3969
45000 plant ha-1 4544 4926 4390 4295 3898 4581 4439
55000 plant ha-1 4831 4551 4761 4427 4365 4824 4626
65000 plant ha-1 4388 4322 4604 4660 4282 4886 4524
Yield of different sowing times averaging the plant density levels
1. sowing time 4398 4725 3988 4484 3804 4225 4271
2. sowing time 4770 4638 4870 4611 4188 4909 4664
3. sowing time 4297 4248 4426 3886 4072 4476 4234
2008
NK Delfi ES Petunia NK Kondi PR 64D82 Pikasol ES Albatre Average
Yield at different plant density levels averaging the sowing times
35000 plant ha-1 4219 3652 4110 3521 3708 3652 3810
45000 plant ha-1 4720 3887 4539 3936 4090 4119 4215
55000 plant ha-1 4468 4318 4316 4254 4304 4291 4325
65000 plant ha-1 4254 3900 3923 3730 3696 3614 3853
Yield of different sowing times averaging the plant density levels
1. sowing time 4298 3886 4107 3809 3958 3905 3994
2. sowing time 4208 3578 3965 3600 3685 3745 3797
3. sowing time 4740 4354 4594 4173 4206 4108 4362
The degree of lodging and the infection by Diaporthe, Sclerotinia and head diseases
increased with the increasing plant densities, while they were reduced by a later sowing
time in both years. With increasing plant density, the average Diaporthe infestation
increased from 9% to 26% and from 31% to 49% in 2007 and 2008, respectively, in the
average of hybrids and sowing times.
Infection by Sclerotinia was lower in 2007. Even at a plant density of 65000 plants ha-1
,
it was only 1.6 %, while it was over 8% in 2008. In the average of the tested hybrids,
the infection by head diseases increased from 6.5% to 16.4% and from 18.8% to 33.1%
in 2007 and 2008, respectively, when plant density was increased. As a result of
increasing plant densities, the degree of lodging increased from 3.1 % to 12.8 % and
from 5.3 % to 25.6 % in 2007 and 2008, respectively.
Table 2. Yields and pathological parameters of sunflower averaging plant density levels and sowing times in
2007 and 2008 (Debrecen-Látókép, 2007-2008)
NK Delfi ES Albatre PR 64D82 ES Petunia NK Dolbi PR 64A04 Average
Yield kg ha-1 4488 4537 4428 4021 4327 4537 4390
Stalk bending (%) 5,4 5,4 12,1 5,5 6,7 10,5 7,6
Head diseases (%) 15,5 7,2 15,0 8,5 14,5 11,3 12,0
Sclerotinia (%) 1,3 0,7 1,0 0,8 1,7 1,2 1,1
2007
Diaporthe (%) 15 13 21 13 21 18 17
NK Delfi ES Albatre PR64D82 ES Petunia NK Kondi Pikasol Average
Yield kg ha-1 4415 3919 3860 3939 4222 3950 4051
Stalk bending (%) 16,9 14,5 18,3 13,4 15,5 13,5 15,4
Head diseases (%) 29,6 25,7 28,6 26,1 23,1 25,5 26,4
Sclerotinia (%) 4,7 4,5 7,1 6,5 6,4 5,1 5,7
2008
Diaporte (%) 41 35 48 36 31 47 40

Vol. 37, 2009, Suppl. Cereal Research Communications
100
When evaluating the tested sunflower hybrids in the average of sowing times and plant
densities, we found that the largest yields were obtained for the hybrids NK Delfi and
ES Albatre (4537 kg ha-1
) in 2007. The hybrid ES Albatre had the lowest infection
values among the hybrids regarding lodging (5.4 %), head diseases (8.5 %), Sclerotinia
(0.8 %) and Diaporthe (7.2 %). The highest values of lodging and infection were
measured for the hybrids PR64D82, NK Dolbi and NK Delfi. The highest yield was
obtained for the hybrid NK Delfi (4415 kg ha-1
) in 2008, however, its values of lodging
(16.9 %) and head diseases (29.6 %) were among the highest ones. The yield of the
hybrid PR64D82 was the lowest (3860 kg ha-1
), while its values of lodging (18.3 %),
head disease infection (28.6 %), Sclerotinia infection (7.1 %) and Diaporthe infection
(48 %) were the highest among the hybrids (Table 2).
Conclusions
In the drier year of 2007, the yield was higher in the average of hybrids, plant densities
and sowing times (4390 kg ha-1
) than in the more wet year of 2008 with more extreme
rain distribution (4051 kg ha-1
). In 2007, the largest yield was obtained with the mid-
April sowing time in the average of the hybrids and plant densities (4664 kg ha-1
), while
in 2008, the early May sowing time resulted in the highest yield (4362 kg ha-1
). For the
tested hybrids, the maximum yield was obtained at a lower plant density of 45000-
55000 plants ha-1
in the more wet year (2008) and at a higher plant density of 55000-
65000 plants ha-1
in the drier year (2007). The degree of lodging, Diaporthe, Sclerotinia
and head disease infection differed between the years. The degree of lodging and
infestation by the studied diseases increased with increasing plant densities (from 35000
plants ha-1
to 65000 plants ha-1
). There were great differences among the hybrids
regarding the studied agronomical and phytopathological factors. Based on the studied
parameters, the hybrids ES Albatre, NK Delfi and NK Kondi proved to be the best.
References
Birkás M. – Dexter A. R – Kalmár T. – Bottlik L. 1993: Soil quality – soil condition – production stability.
Cereal Research Communications 35. 2. 257-260.
Bíró J. – Pepó P. 2008: Study of genotype fertilizer responses in sunflower (Helianthus annuus l.) production.
Cereal Research Communications. 36. 727-730.
Borbélyné Hunyadi É. – Csajbók J. –Lesznyák. M. 2008: Yield stability of sunflower (helianthus annuus)
varieties on chernosem soil. Cereal Research Communications. 36. 1711-1714.
Branimir S. – Jasenka C. – Ruza P. – Karolina V., 2008: Influence of climate conditions on grain yield and
appearance of white rot (sclerotinia sclerotiorum) in field experiments with sunflower hybrids. Cereal
Research Communications. 36. 63-66.
Göksoy, A. T. - Turan , Z. M.: 2007. Correlations and path analysis of yield components in synthetic varieties
of sunflower (Helianthus annuus L.). Acta Agronomica Hungarica, 55. 3. 339-345.
Lehoczky É. – Sárkány E. Sz. 2007: Influence of pre-emergence herbicides on the early growth of sunflower
hybrids. Cereal Research Communications. 35. 2. 1033-1036.
Mijic A. - Krizmanic M. - Zdunic Z. - Maric S.: 2007. Response of sunflower hybrids to growing in different
environments. Cereal Research Communications, 35. 2. 781-784.
Pepó P. – Szabó A. 2005: Effect of agrotechnical and meeorological factors on yield formation in sunflower
production. Cereal Research Communications. 33. 1. 49-52.
Várallyay Gy. 2007. Láng István, Csete László, Jolánkai Márton (szerk): A globális klímaváltozás: hazai
hatások és válaszok (A VAHAVA Jelentés). Agrokémia és talajtan 56. 1. 199-202.
Zsombik L. 2007: Effect of sowing time on yield and oil content of sunflower hybrids in hajdúság. Cereal
Research Communications. 35. 2. 1349-1352.

VIII. Alps-Adria Scientific Workshop Neum, Bosnia-Herzegovina, 2009
DOI: 10.1556/CRC.37.2009.Suppl.2 101
QUANTIFYING ABIOTIC STRESS: THE USE OF RESPONSE FUNCTIONS
Krisztina R. VÉGH1 – Imre CSERNI2 – Péter LÉVAI2
1Research Institute of Soil Science and Agricultural Chemistry of the Hungarian Academy of Science
Herman Ottó 15., 1022. Budapest, Hungary; [email protected] 2Institute of Environment Science, Faculty of Horticulture, Kecskemet College, Erdei F. sq 1-3., 6000.
Kecskemét, Hungary
Abstract: Both for economic considerations and risk assessment it is essential to quantify abiotic stress
conditions and evaluate their impact on yield for a given environment or for possible scenarios. We applied
simulation modeling to quantify stress by its level, time, duration and dynamics on irrigated tomato culture.
The dynamics of photosynthetic response function to (1) soil water stress (expressed as daily values of the
ratio of actual and potential transpiration), (2) nitrogen availability (leaf C/N ratio) and (3) temperature stress,
as well as to their combined effect was determined. Sudden events of high temperature, transient water
deficiencies and gradually ongoing N depletion restricted tomato growth. Sensitivity of the system decreased
in late development and response functions differed between the soils.
Keywords: abiotic stress, response function, water and nitrogen supply, temperature, tomato, COUP model
Introduction
In agricultural systems the exposure of crops to abiotic stress is generally unavoidable
since growth conditions in most field environments are suboptimal. Crop productivity is
controlled by the interactions of the genotype of crops, their environment and the
management practices, since it depends on the physiological functions in response to the
environment. Water and/or nitrogen deficiency may impact on crop yield substantially
due to the changing physiological processes before the appearance of deficiency
symptoms (Česká et al. 2008), therefore to realize stress in due time and minimize its
effects may be essential even if proceeded in the late development of the crop. The
quality of the final marketable product may be affected too; for example wheat and
maize quality parameters have been shown to depend upon genotype and environmental
factors (Fónad et al. 2008; Hegyi et al 2008). Szalay et al. (2008) reported that milling
and baking quality of wheat was highly affected by the climate and soil conditions.
Kassai et al (2008) found that both the amount and the distribution of precipitation had
crucial effect on wheat yield and quality parameters. Quality concerns are still more
expressed in vegetable production, where the control of the quality parameters of fresh
vegetables and other high value horticulture products is essential to realize them on a
right price in the market. With physiologically balanced complete nutrition, careful
water supply and temperature optimization the visual attributes, size (or weight), shape
and color and, “freshness” as well as the taste and nutritive value of the products can be
generally improved in order to meet the main commercial criteria (Fabek et al. 2008,
Ledencan et al, 2008, Svoboda et al. 2008). However, N nutrition of irrigated vegetables
is often hazardous concerning both the nutritive value of the product and the production
environment (Neeteson, 1995, Linker et al. 2005,Vázquez et al. 2006). Both for
economic considerations and risk assessment it is essential to quantify water and
nitrogen stress conditions and evaluate their impact on yield and quality for a given
environment or for possible scenarios (Árendás et al. 2008, Sulyok et al. 2008).
Simulation modeling helps making the decisions in crop management before severe
deficiency symptoms appear, by the designation and characterization of abiotic stress.

Vol. 37, 2009, Suppl. Cereal Research Communications
102
In the approach based on systems ecology (Bouman et al, 1996) the state of the system
can be expressed at any point in time with the changes of it can be expressed through
mathematical terms. Crop yield is defined as a function of biomass and harvest index,
where biomass is a function of growth and development. Harvest index, growth, as well
as development are a function of stress and genetics; the latter two are controlled by
environmental factors controlling photosynthesis, as solar radiation or temperature.
Generally, the main growth-limiting, abiotic stress factors are drought and N deficiency
as well as temperature extremes (Hoogenboom, 2003, Jansson and Karlberg, 2003). The
objective of our study is the application of simulation modeling to quantify stress by its
level, time, duration and dynamics in irrigated tomato culture, by response functions
used in crop growth models.
Materials and methods
In the experimental station of Kecskemét College four nitrogen levels (0, 60, 120 and
180 kg ha-1
of N) were created in soils with different texture filled in lysimeters with 0.6
m height and diameter in 2006. Before planting 60 kg of N was applied as Cropcare
(N:P:K = 10:10:20) slow release fertilizer, the additional amounts were added as
ammonium-nitrate top dressing 3 and 6 weeks after planting. Two tomato plants were
grown per lysimeter and watered by a drip irrigation system from the end of May till
early October. Experimental details are reported by (Végh et al., 2007) and (Végh et al.,
2009). The results presented here have been obtained in the N120 nitrogen treatment on
sandy soil (S1: 94.7% sand, 2.66% clay, 0.64% organic matter content (OM), pH=7.8)
and clay loam soil (S3: 26.63% sand, 42.08% clay, 2,72% OM, pH=7.40). The COUP
model that consists of the SOIL and SOILN models (Jansson and Karlberg, 2003) has
been used for the simulation. SOIL water and heat model simulates soil moisture
dynamics and provides driving variables for the soil N transport and crop growth model
SOILN. Here total plant growth Catm is proportional to the radiation absorbed by canopy
(Rspl), but limited by unfavorable conditions of temperature: f(Ta), nitrogen (=C/N ratio
in the leaf: f(CNleaf)) and water (=f(Eta/Etp): the ratio of potential to actual
evapotranspiration) represented by functions ranging between zero and unity as:
spltptaleafaLaAtmREEfCNfTfC )/()()(ε=
→
where εL is the radiation use efficiency. Driving variables for SOIL model (daily
meteorological data) were measured in the experimental site. Soils were sampled at the
beginning and at the end of growth, and analyzed for total and mineral N. Also soil
hydraulic properties were evaluated. CS615 moisture sensors with data loggers were
buried in the 10-40 cm soil depth to monitor the moisture content.
The above ground parts of crops were sampled four times during growth and four
harvests of fruits were done to determine the development of leaf area, the accumulation
of biomass and N content in shoot and fruit. Experimental data was analyzed using two-
ways ANOVA. The measured and derived growth parameters were used in the
parameter optimization of the growth model. The SOIL model outputs were fitted on
the volumetric moisture content of the soil monitored by the sensors. SOILN model
outputs were fitted on the yield, and crop N uptake data. The model parameter set finely
tuned on the soil moisture and crop data was then used to simulate N dynamics in the
soil and evaluate the dynamics of the response functions.

VIII. Alps-Adria Scientific Workshop Neum, Bosnia-Herzegovina, 2009
DOI: 10.1556/CRC.37.2009.Suppl.2 103
Results and discussion
Tomato yields were 158 t ha-1
in the S1N120 (sand) and 185 t ha-1
in the S3N120 (clay
loam) treatment, ranged from 64 -178 t ha-1
on S1 soil and 129-241 t ha-1
on S3
depending on soil type and N rate (p< 0.001). Total N uptake of crop varied between
90-350 kg ha-1
in S1 and 184-330 kg ha-1
in S3 soil and was 271 kg ha-1
and 304 kg ha-1
in the S1N120 and S3N120 treatments respectively.
Figure 1. Dynamics of response functions for the temperature: f(T), N: f(N) and water: f(W) stress as well as
their combined effect: f(Tot) on tomato growth in sandy (left) and clay loam soil (right) in N120 treatment.
The dynamic weather-soil-crop system is continually changing. Sensitivity is changing
with stages of development and response differs between soils as shown in Figure 1.
Sudden events of high temperature, transient water deficiencies and gradually ongoing
N depletion restricted photosynthesis. Average daily temperature had exceeded 25 oC
several times in June and July and inhibited growth. Irrigation that started on June 22
improved water supply. In the sandy soil from the mid of August N availability became
the main constraint to growth (Figure 1). According to the final nitrogen balance, crop
exploited 118 % of the total mineral nitrogen input (involving atmospheric deposition,
fertilizer and soil initial mineral N content) in sandy soil whereas in clay loam only the
77% of its N input was taken up. N shortage was compensated by the more intensified
N translocation from leaves to the fruits reflected in the much higher leaf litter fall
compared to the clay loam during the last two months (not shown). Crop with the lower
growth rate and smaller leaf area transpired less water in sandy soil and could satisfied
water demand even in this coarse texture soil with unfavorable hydraulic properties. On
the contrary the higher transpiration rate due to higher N supply caused transient
occurrences of water deficiency stress and limitation of photosynthetic activity on clay
loam soil, though available water was not completely depleted in the root zone.
Considering N balance of the systems the role of nitrogen mineralization cannot be
overestimated. In the COUP model simulated microbial processes are also affected by
soil temperature, moisture content and pH. In the irrigated an N fertilized system the
total release of N from organic form substantially contributed to N uptake of tomato
crop even in the sandy soil as it is clearly shown by the final N balance.
0
0.2
0.4
0.6
0.8
1
1.2
7-May 4-Jun 2-Jul 30-Jul 27-Aug 24-Sep
f(T) f(Tot) f(N) f(W)
0
0.2
0.4
0.6
0.8
1
1.2
7-May 4-Jun 2-Jul 30-Jul 27-Aug 24-Sep
f(T) f(Tot) f(N) f(W)

Vol. 37, 2009, Suppl. Cereal Research Communications
104
Conclusions
The effects of high temperature, transient water deficiencies and gradually developing N
insufficiency were quantified by evaluating the photosynthetic response functions of
irrigated and fertilized tomato. Sensitivity of the system decreased in late development
and response functions differed between the soils.
Analyzing the dynamics of the response functions of a given system helps adjusting
system manipulation by automatic irrigation/fertigation, mulch or shading, to minimize
stress impacts on crop yield and quality in an environment friendly way.
Acknowledgements
This study was supported by the Hungarian Scientific Research Fund (OTKA) under
Grant No. K62548. Thanks to Tamás Németh, Kálmán Rajkai and Tibor Szili-Kovács
for their participation in the study project.
References
Árendás T., Németh T., Radimszky L. and Bedı Z.: 2008. Applicability of the Nmin method as a function of
the year, based on the results of wheat experiments. Cereal Research Communications, 36: 207-211.
Bouman, B.A.M., van Keulen H., van Laar H.H. and Rabbinge R.: 1996. The “school of de Wit” crop growth
simulation models: A pedigree and historical overview. Agricultural Systems 52: 171-198.
Ceská J., Hejnák V., Ernestová Z. and Krizková J.: The effect of soil drought on photosynthesis and
transpiration rates of maize (Zea mays L.). Cereal Research Communications, 36: 823-827.
Fabek S., Benko B. Toth N., Novak B. and Delonga K.: 2008. Broccoli and lettuce yield components as
affected by organic fertilization. Cereal Research Communications, 36: 391-395.
Fónad P., Ács E., Cseuz L., Bóna L. and Matuz J.: 2008. Effects of harvest time on the quality components of
winter wheat. Cereal Research Communications, 36: 127-131.
Hegyi Z., Árendás T., Pintér J. and Marton C. L.: 2008. Evaluation of the grain yield and quality potential of
maize hybrids under low and optimum water supply. Cereal Research Communications, 36: 1263-1267.
Hoogenboom G.: 2003. Crop growth and development. In: Benbi D. K. and Nieder R. (eds): Handbook of
processes and modeling in the soil-plant system. The Haworth Press Inc., NY, London, Oxford. 655-691.
Jansson, P-E. and Karlberg, L. 2003. Coupled heat and mass transfer model for soil-plant- atmosphere
systems. Stockholm: Royal Institute of Technology, Department of Civil and Environmental Engineering. Kassai K., Nyárai F. and Hidvégi S.: 2008. Water supply, yield and quality of winter wheat on chernozem
brown forest soil. Cereal Research Communications, 36: 883-887.
Ledencan T., Sudar R., Simic D., Zdunic Z. and Brkic A.: 2008. Effects of the agroecological factors on sweet
corn quality. Cereal Research Communications, 36: 1411-1415.
Linker R., Johnson-Rutzke C.: 2005. Modeling the effect of abrupt changes in nitrogen availability on lettuce
growth, root–shoot partitioning and nitrate concentration Agricultural Systems 86: 166–189
Neeteson, J.J.: 1995. Nitrogen management for intensively grown arable crops and field vegetables. In:
Bacon, P.-E. (Ed.), Nitrogen Fertilization in the Environment. Marcel Dekker, New York, pp. 295–325. Sulyok D., Megyes A., Rátonyi T. and Huzsvai L.: 2008. Agro-economical examination of maize growing in
the Hajdúság Loess Ridge. Cereal Research Communications, 36: 771-775.
Svoboda P., Hnilicková H.and Hnilicka F.: 2008: Changes in yield and quality of hop depending on the
irrigation. Cereal Research Communications, 36: 891-895.
Szalay D., Szalay K. and Farkas I.: 2008. Grain quality – a soil-plant indicator. Cereal Research
Communications, 36: 1295-1299.
Vázquez N., Pardo A., Suso M.L. and Quemada M.: 2006. Drainage and nitrate leaching under processing
tomato growth with drip irrigation and plastic mulching. Agriculture, Ecosystems and Environment, 112:
313–323.
Végh K. R., Rajkai K., Szili-Kovács T., Cserni I. and Németh T. 2007. Nitrogen efficiency in tomato culture.
Cereal Research Communications, 35 (2): 973-976. Végh K. R., Rajkai K., Szili-Kovács T., Cserni I. and Németh T. 2009. Simulated and measured nitrogen
conditions in tomato culture. Commun. Soil Sci Plant Anal. In press.

VIII. Alps-Adria Scientific Workshop Neum, Bosnia-Herzegovina, 2009
DOI: 10.1556/CRC.37.2009.Suppl.2 105
INFLUENCE OF BIOTIC AND ABIOTIC ENVIRONMENTAL CONDITIONS ON SUNFLOWER (Helianthus annuus L.) GRAIN YIELD
Zlatko PUŠKADIJA1 – Anto MIJIĆ2 – Tihomir FLORIJANČIĆ1– Siniša OZIMEC1– Anñelko OPAČAK1 1Faculty of Agriculture, University of J.J. Strossmayer, Trg Svetog Trojstva 3, 31000 Osijek, Croatia, e-mail:
[email protected] 2Agricultural Institute Osijek, Južno predgrañe 17, 31000 Osijek, Croatia
Abstract: Way of pollination in sunflower is allogamy and therefore the presence of insects is essential for
successful production. Trial material was consisting of six sunflower hybrids that were grown on majority of
sunflower’s fields in Croatia. Trial was conducted on trial-field situated in Kneževi Vinogradi (Baranja
region). Honey bees were transported in Langstroth-Rooth (LR) beehives to the trial-field; three days before
sunflower’s blooming. Impact of honey bee on selection and production traits of sunflower was expressed as a
difference between results gained by free pollination and results under the condition of isolation. The most
important pollinator of sunflower is a honey bee. Weather conditions (air temperature, relative air humidity
and rainfalls) considerably influenced activities of honey bees during sunflower blooming. Honey bees were
mostly active during the days without rain, at air temperature from 23 to 26 oC and relative air humidity from
65 to 75 %. The most attractive hybrid for honey bee was hybrid H4. Presence of pollinators resulted in
improvement of selection and production traits of sunflower: number of flowers per head, number of full up
field grains per head, percentage of pollination, 1000 kernel weight, hectolitre mass, oil content and oil yield.
Considerable economic rationale was determined for the introduction of pollination with honey bee in
agriculture practice.
Keywords: honey bee, sunflower, yield components
Introduction
Sunflower (Helianthus annuus L.) is a very important plant for agricultural industry.
Global agricultural land under the sunflower is 22.6 million ha, and it increased for
around 1.85 million ha during the last decade (FAOSTAT database, 2005). Sunflower
production in Croatia is present at 30,000 ha, and is characterised in high fluctuations in
the area and yield. Production is mainly placed in the Eastern Croatia, which belongs to
the Panonian region, mainly due to favourable precipitation regime in comparison to
other parts of Croatia (Liović et al., 2006).
Main objectives in sunflower production are reaching high yield of the kernel and oil
(Szabo and Pepo, 2007). These traits are quantitative traits and, beside genotype, large
influence on their expression has environment and genotype vs. environment interaction
(Hunyadi-Borbeli and Lesznyak, 2006; Mijić et al., 2007). Other traits, directly or
indirectly related with kernel and oil yield, also influencing successful sunflower
production (Goksoy and Turan, 2007). The presence of pollinator is among these traits.
Due to allogamy, sunflower developed specific flower structure, pollinated by insects.
Pollination of sunflower in presence of insects improved kernel yield (Miklič, 1996).
Aim of this research work is to evaluate impact of pollinator’s presence at examined
hybrids, and expression of most important selection and production traits.
Materials and methods
Research work was conducted at trial-field situated near Kneževi Vinogradi in Baranja
region (450 46’ 13.70’’ N, 180 44’ 24.34’’ E), during 2002 year.

Vol. 37, 2009, Suppl. Cereal Research Communications
106
Soil type is eutric cambisol, pH 7.1 in KCl, with good supply of nutrients. Maize was
grown on this field a year before. Main soil tillage cultivation in autumn was consisted of
fertilization with 250 kg ha-1
NPK 7:20:30 and 100 kg ha-1
urea (46% N), and of
ploughing on 30 cm depth. Fertilization before sowing was with 150 kg ha-1
NPK
15:15:15. Protection against diseases was done by Konkerom (vinklozolin+karbendazim).
Sowing date was 26th April, with final plant density of 57 143 plants ha-1
. Trial material
consisted of six sunflower hybrids (H1-H6) prevailing in sunflower growing in Croatia.
Length of trials was 300 m, and each hybrid was sown in eight rows (0.7 m between rows
and 0.25 m within rows). Honey bees were transported in Langstroth-Rooth (LR) beehives
to the trial-field, three days before sunflower’s blooming (phase R3 according to Schneiter
and Miller, 1981). Strength of transported honey bee colonies was adequate to strength of
honey bee colonies prepared for pollination of planted crops (McGregor, 1976). Four
honey bee colonies per hectare were placed at the start of trial plot, with an aim of equal
exposition of hybrids to the honey bees. Isolation of sunflower’s heads was done in phase
R3 (according to Schneiter and Miller, 1981). Presence of honey bees was counted at 9,
11, 13 and 17 hours, within the distance of 100, 200 and 300 m from beehives. Amount of
insuficently filled and fully field kernels was measured by hand; weight of 1000 kernels
was measured with instrument Contador; hectolitre mass with instrument Dickey Yohn
(model GAC 2000 grain analysis computer); yield was counted on 9% of moisture, and oil
content in kernels was determined with Newport 4000 NMR analyzer. Oil yield in dry
matter for control and treated groups were counted on the basis of kernel yield and content
of oil in kernels. Impact of honey bee on selection and production traits of sunflower was
expressed as a difference between results gained in free pollination and results under the
condition of isolation.
Results and discussion
The mostly present pollinator on sunflower (99.53%) was honey bee (Apis mellifera carnica L.), followed by bumblebee (Bombus spp.) with 0.32%, and fly (Diptera,
family: Syrphidae) with 0.15%. These results are in accordance with the research work
of Miklič (1992). Different results were presented by Arbol (1996) and Singh and Singh
(1999). In their research, bumblebee was the mostly present (34%), and honey bee (Apis cerana) was second one (26%). Data in Table 1. shows that hybrid H4 had the highest,
and H2 the lowest presence of honey bees. Significant differences were not found
between other hybrids.
Table 1. Honey bee’s presence per sunflower head during blooming and standard deviation
Hybrid Values Rang
H1 16.868 ± 3.47 abc*
H2 15.838 ± 4.25 ab
H3 16.454 ± 3.85 abc
H4 17.444 ± 3.71 c
H5 16.818 ± 3.87 abc
H6 16.808 ± 4.07 abc
Average 16.705 ± 3.89

VIII. Alps-Adria Scientific Workshop Neum, Bosnia-Herzegovina, 2009
DOI: 10.1556/CRC.37.2009.Suppl.2 107
Figure 1. Influence of air temperature and relative air humidity on honey bee’s presence during sunflower
blooming
During sunflower blooming, an average daily temperature was from 19.9 to 27.5oC, relative
air humidity was 65-88%, with 16.1 mm of rainfalls in total. According to Figure 1., highest
activity of honey bees was at air temperature of 23 to 26oC, and relative air humidity from 65
to 75 %. During the trials, three days with rain had occurred; on 4th and 7th July rain was
falling during the day. Night rainfall was on 8th July, and during the day it does not
influenced any of honey bee’s activity. The lowest presence of honey bees was during the
days with local showers. Total absence of honey bees was on 7th July, due to all-day rainfall.
Miklič (1996), Sihag and Khatkar (1999) concludes that the highest activity of honey bees is
at air temperature of 20-28oC and relative air humidity of 50-75%. They also determined that
higher or lower values of these parameter significantly influence activities of the honey bees.
Rainfalls during the day considerably influence activity of honey bees, because they do not
fly during the rain (Miklič, 1996). Research work showed complexicity of the relation
between honey bee and flower. Delaplane and Mayer (2000) stressed the significance of the
length of tube flower’s corolla as a favourable or unfavourable for honey bee’s presence, in
connection with the length of bee’s mouth part. Kevan (2001) pointing out statistically
significant differences between the quality and quantity of pollen and nectar among hybrids.
According to the author, this traits are very important for the presence of honey bees. Hybrid
H4 was the most attractive hybrid for the honey bees, while hybrid H2 was the least
attractive. Between other four hybrids there were no differences for the intensity of the
presence of honey bees.
Impacts of pollination with honey bee on the selection and production traits of
sunflower are presented in Table 2. Amount of flower per head under the condition of
free pollination is higher for 132 flowers in average, than under the conditions of
isolation. Also, number of fully filed kernels per head is higher (for 525.5 kernels in
average), and percentage of pollination is higher for 27.61%. Under the conditions of
free pollination, hectolitre mass is higher for 3.6 kg, 1000 kernel weight for 2.6 g, oil
content 1.41% higher and oil yield is 49.99 kg ha-1
higher. Results are indicating that
application of pollination with honey bee in agricultural practice considerably improved
all measured traits.
0
500
1000
1500
2000
0 5 10 15 20 25 30
temperature (oC)
num
ber
of b
ees
0
500
1000
1500
2000
0 20 40 60 80 100
relative air hunidity (%)
nu
mb
er o
f b
ees

Vol. 37, 2009, Suppl. Cereal Research Communications
108
Table 2. Honey bee’s presence per sunflower head during blooming and standard deviation Hybrid
Flowers
per head
Filled
kernels
per head
Fertilization
rate
(%)
Hectolitre
mass
(kg)
1000
kernel
weight
(g)
Oil
content in
kernel
(%)
Oil yield
in dry
matter
(kg/ha)
1 - 22 + 633.6 + 60.91 + 3 -2.8 +1.47 -
2 - 36 + 342.8 + 20.89 +3 -4.3 + 2.14 + 73.89
3 + 161 + 671 + 29.85 + 1.4 +3.3 + 2.5 + 78.27
4 + 392 + 446.8 + 7.71 + 1.8 +2.6 + 0.37 + 11.47
5 + 149 + 541.4 + 28.12 + 8.8 +6.6 + 0.29 + 6.93
6 + 149 + 575.6 + 18.18 + 3.6 +10.2 + 1.66 + 38.00
Average + 132
± 155
+ 532.5
± 122.2
+ 27.61
± 18.13
+ 3.6
± 2.67
+2.6
± 5.5
+1.41
± 0.91
49.99
± 36.24
Conclusions
The most important pollinator of sunflower in Baranja region is a honey bee. The highest
activity of honey bees was at air temperature 23-26oC and relative air humidity 65-75 %, in
the days without rain. The most attractive hybrid for honey bee was H4, while hybrid H2
was the least attractive. Differences in the intensity of the presence of honey bees were not
found between other four hybrids. Pollination with honey bee under described weather
conditions has positive impact on improvement of selection and production traits of
sunflower, recognized in following: number of flowers per head, number of fully field
kernels per head, percentage of pollination, hectoliter mass, 1000 kernel weight, oil content
in kernels, and oil yield in dry matter. Application of pollination of sunflower with honey
bee in agricultural practice have considerable economic rationale.
References
Abrol, D.P.: 1996. Sunflower pollination: abundance and diversity of pollinating insects and their effect on
seed yield. Indian Bee Juornal, 58: 2. 60-63, Bj.
Delaplane, K.S., Mayer, D.F.: 2000. Crop Pollination by Bees. CABI Publishing. New York. USA., 55.
FAOSTAT Database: 2005. http://faostat.fao.org/
Goksoy, A.T., Turan, Z.M.: 2007. Correlations and path analysis of yield components in synthetic varieties of
sunflower ( Helianthus annuus L.). Acta Agronomica Hungarica, 55: 3. 339-345.
Hunyadi Borbely E. - Lesznyak M.: 2006. Investigating yield and phenological stages of sunflower varietes in
agro- ecological environment – Cereal Research Communications, 34: 1. 417-421.
Kevan, P.G.: 2001. Pollination: A Plinth, Pedestal, and Pillar for Terrestrial Productivity. The Why, How, and
Where of Pollination Protestion, conservation and Promotion. Entomological Society of America
Proceedings from Bees and Crop pollination-Crisis, Crossroads, Conservation. 7- 68.
Liović I. - Kovačević V - Krizmanić M. - Mijić A. - Šimić B.: 2006. Precipitation influence on edible oil
production from sunflower in Croatia – Cereal Research Communications 34: 1. 573-576.
McGregor, S.E.: 1976. Insect pollination of cultivated crop plants. Agriculture Handbook No. 496,
Agricultural Research Service, USDA, Washington, DC., 23-32.
Mijić A. - Krizmanić M. - Liović I. - Zdunić Z. - Marić S.: 2007. Response of sunflower hybrids to growing in
different environments. Cereal Research Communications, 34: 1. 573-576.
Miklič, V.: 1992. Utjecaj klimatskih činilaca i genotipa suncokreta na posetu polinatora. Poljoprivredni
fakultet Univerziteta u Novom Sadu. «Zbornik radova», 20. 449 – 458.
Miklič, V.: 1996. Utjecaj različitih genotipova i pojedinih klimatskih činilaca na posetu pčela i drugih
polinatora i oplodnju suncokreta. Magistarska teza. Poljoprivredni fakultet Novi Sad.
Schneiter A.A. - Miller J.F.: 1981. Description of sunflower growth stages. Crop Science 21. 901-903
Singh, L., Singh, N.: 1999. Relative abundance of various insect visitors and foraging activity of Apis
mellifera L. on sunflower hybrid. Journal of Insect Science, 12:2. 122-124.
Sihag, R.C., Sunita Khatkar: 1999. Effect of diferent enviromental factors on the foraging activity of three
honeybee species visiting eight cultivars of oil seed crops. Annals of Agri Bio Research, 2: 257-261.

VIII. Alps-Adria Scientific Workshop Neum, Bosnia-Herzegovina, 2009
DOI: 10.1556/CRC.37.2009.Suppl.2 109
THE DISTRIBUTION OF PRECIPITATION AS A STRESS COEFFICIENT ON HARVEST AMOUNTS OF DIFFERENT GRASSLANDS
Julianna TASI 1– Márta BAJNOK
1 – Szilárd SZENTES
2 – Károly PENKSZA2
1 Institute of Crop Production, Faculty of Agriculture and Environmental Sciences, Szent István University,
H-2103 Gödöllı, Páter K. 1., e-mail: [email protected] 2 Institute of Environmental Management, Faculty of Agriculture and Environmental Sciences, Szent István
University, H-2103 Gödöllı, Páter K. 1.
Abstract: The yield in grasslands is determined by the ecological conditions such as soil, climate, height
above sea-level, weather but mostly the amount and distribution of precipitation. The yield can be increased
by using different grassland management elements (grassland usage, fertilizing, weed control). In our
experiment, two different locations with different dispersion of precipitation were examined.
We simulated 3 types of grassland usage (2, 3, 4 utilisation per year) with the same method in both places,
without fertilisation. The 2-times utilisation mean a late first (the third decade of June) and an autumn
mowing. The simulation of the 3-times utilisation meant a sampling in the third decade of May, the end of
July and at the beginning of October. The 4-times utilisation meant a May, end of June, end of July and at
beginning of October mowing.
Our main conclusions on relations between the yield of dry matter, stress of moisture, annual effect and
intensity of utilisation are the followings:
The complete annual dry matter yield of the Festuca pseudovinetum vegetation, dry located natural grasslands
was highly influenced by the total amount and dispersion of precipitation in the examined 2 years. The
amount of increments depended on the dispersion of precipitation. Independently from the annual effect the
extensive grassland usage produces the highest yield of dry matter.
On the planted moist meadow the more intensive utilisation (3 mowing/year) caused a better yield. The
reaction to the irregularities of dispersion of precipitation (stress of moisture) was the more difference
between harvest amounts.
Keywords: grassland, stress of moisture, intensity of utilisation
Introduction
Grassland management is Hungary’s third-largest type of soil usage. 1 million ha is
covered by grasses. Grass is an essential of mass feed production and environmental
protection. The grass species are shallow-rooted, have a large evapotranspiration surface
and we urge it to sprout continuously by pasturage and mowing (Nagy 2006). Because
of these, grass has a significant water demand and is sensitive to any water-stress
(Czövek et al. 2006). Moreover, the evapotranspiration is higher when the air is warm,
the vapour level is low and there is an intensive sunshine, so in the middle of
summertime the heat-stress must be considered (Balla et al. 2006; Mészáros et al. 2006).
The increasing level of CO2 in the air which reduces the competitiveness of grass
species against the dicotyledonous weeds is also an addition (Anda et al. 2006). As an
effect of the climate change, the crop of grasses could highly reduce in the Carpathian
basin, the scorching period could lengthen (Dobó et al. 2006; Mikulec et al. 2006; Várallyay 2007;). In pastures, shady areas must be provided to allow animals avoid the
heat-stress (Pajor et al. 2007; 2008). New grassland-management tools required to adapt
to the different, changed conditions. To find the new possibilities and show the damage
to grasses caused by the water- and heat-stress, we’ve made experiments at two
locations examining two different types of grasses between 2006 and 2008.

Vol. 37, 2009, Suppl. Cereal Research Communications
110
Materials and methods
The two flat grounded locations in an experiment made in the years 2006 and 2007 a
Festuca arundinaceatum vegetation, formerly planted, valley-located, moist meadow
(in Mende) and a saline grassland, dry located, Festuca pseudovinetum vegetation
pasture (in Bösztör) were examined. There is organic farming in both locations without
using artificial fertilizers. In the autumn of 2006 we simulated the manure dropped by
grazing animals with the same mass of manure, because there was mowing in the
experiment only. We searched for the less yield deficiency, caused by water- and heat-
stress in case of which intensity of utilisation, what divergences are between the
different grass types. The examined three intensity of utilisation and management were
the followings: Table 1. Timetable of the experiment
2 cut *year -1 3 cut *year -1 4 cut *year -1
1st increment 19th Jun. 17th May 17th May
2nd increment 10th Oct. 28th Jul. 19th Jun.
3rd increment 10th Oct. 28th Jul.
4th increment 10th Oct.
The experiments were made in 3 repetitive periods, each time with coenological
inclusion and samples were taken to define nutritive substance content. The laboratory
analyses were made in Austria (Raumberg-Gumpenstein). Soil investigation was made
in the beginning and at the end of the trial.
Results and discussion
According to the analysed data of rainfall in two years, there were approximately 14%
less rain in both locations (Table 2).
Table 2. Distribution of precipitation (mm)
Mende Bösztör
Month 2006 2007 2006 2007
1 19 17.2 28.8 20.2
2 56.6 40.9 49.8 46.7
3 46.5 28.8 37.3 29.3
4 46 0 24.2 1.4
5 69.2 80.8 92.5 42.9
6 119.1 28.2 121.1 67.6
7 61 24.5 40.2 18.7
8 76 64.8 167.3 120.1
9 17.8 51.6 18.8 48.4
10 26.5 28.2 13.8 49.1
11 25.3 56.3 17.3 49
12 5.3 69.1 4.1 38
∑ 568.3 490.2 615.2 531.4
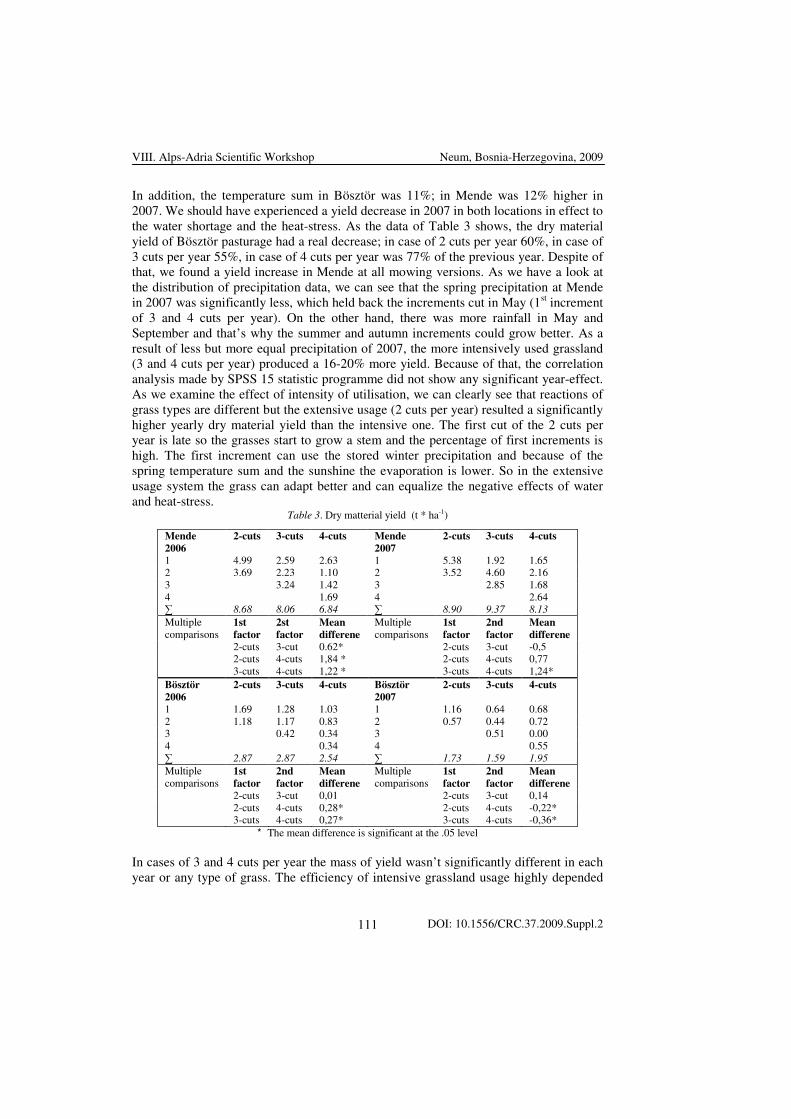
VIII. Alps-Adria Scientific Workshop Neum, Bosnia-Herzegovina, 2009
DOI: 10.1556/CRC.37.2009.Suppl.2 111
In addition, the temperature sum in Bösztör was 11%; in Mende was 12% higher in
2007. We should have experienced a yield decrease in 2007 in both locations in effect to
the water shortage and the heat-stress. As the data of Table 3 shows, the dry material
yield of Bösztör pasturage had a real decrease; in case of 2 cuts per year 60%, in case of
3 cuts per year 55%, in case of 4 cuts per year was 77% of the previous year. Despite of
that, we found a yield increase in Mende at all mowing versions. As we have a look at
the distribution of precipitation data, we can see that the spring precipitation at Mende
in 2007 was significantly less, which held back the increments cut in May (1st increment
of 3 and 4 cuts per year). On the other hand, there was more rainfall in May and
September and that’s why the summer and autumn increments could grow better. As a
result of less but more equal precipitation of 2007, the more intensively used grassland
(3 and 4 cuts per year) produced a 16-20% more yield. Because of that, the correlation
analysis made by SPSS 15 statistic programme did not show any significant year-effect.
As we examine the effect of intensity of utilisation, we can clearly see that reactions of
grass types are different but the extensive usage (2 cuts per year) resulted a significantly
higher yearly dry material yield than the intensive one. The first cut of the 2 cuts per
year is late so the grasses start to grow a stem and the percentage of first increments is
high. The first increment can use the stored winter precipitation and because of the
spring temperature sum and the sunshine the evaporation is lower. So in the extensive
usage system the grass can adapt better and can equalize the negative effects of water
and heat-stress. Table 3. Dry matterial yield (t * ha-1)
Mende 2006
2-cuts 3-cuts 4-cuts Mende 2007
2-cuts 3-cuts 4-cuts
1 4.99 2.59 2.63 1 5.38 1.92 1.65
2 3.69 2.23 1.10 2 3.52 4.60 2.16
3 3.24 1.42 3 2.85 1.68
4 1.69 4 2.64
∑ 8.68 8.06 6.84 ∑ 8.90 9.37 8.13 1st factor
2st factor
Mean differene
Multiple
comparisons
1st factor
2nd factor
Mean differene
2-cuts 3-cut 0.62* 2-cuts 3-cut -0,5
2-cuts 4-cuts 1,84 * 2-cuts 4-cuts 0,77
Multiple
comparisons
3-cuts 4-cuts 1,22 * 3-cuts 4-cuts 1,24*
Bösztör 2006
2-cuts 3-cuts 4-cuts Bösztör 2007
2-cuts 3-cuts 4-cuts
1 1.69 1.28 1.03 1 1.16 0.64 0.68
2 1.18 1.17 0.83 2 0.57 0.44 0.72
3 0.42 0.34 3 0.51 0.00
4 0.34 4 0.55
∑ 2.87 2.87 2.54 ∑ 1.73 1.59 1.95 Multiple
comparisons
1st factor
2nd factor
Mean differene
Multiple
comparisons
1st factor
2nd factor
Mean differene
2-cuts 3-cut 0,01 2-cuts 3-cut 0,14
2-cuts 4-cuts 0,28* 2-cuts 4-cuts -0,22*
3-cuts 4-cuts 0,27* 3-cuts 4-cuts -0,36*
* The mean difference is significant at the .05 level
In cases of 3 and 4 cuts per year the mass of yield wasn’t significantly different in each
year or any type of grass. The efficiency of intensive grassland usage highly depended

Vol. 37, 2009, Suppl. Cereal Research Communications
112
on the distribution of precipitation. That’s what the results in Bösztör in 2007 show
when the outstanding rainfall in August could be used better by the more intensively
used grassland and the 4 cuts per year delivered a significantly higher yield.
Conclusions
The distribution of precipitation, the amount of precipitation per one increment has a
higher effect on the dry material yield of the grasses than the yearly sum of
precipitation. This is especially true on intensively used grasses.
The distribution of precipitation could not be exactly expected, so in the regions
becoming more extreme-weathered in an effect of the climate change, the extensive
grassland management means a safer yield.
Further questions appear from the following definition: The 2 cuts per year usage do not
satisfy the needs of the grazing grassland usage, the extensive usage means a lower feed
value.
Acknowledgements
The research was made in an Austrian – Czech – Hungarian co-operation. The mobility
of the researchers was supported by the Stiftung Aktion Österreich – Ungarn in 2008.
References
A. Anda– Zs. Lıke: 2006. A növény–légkör rendszer kölcsönhatásai kétszeres CO2-koncentrációnál
Növénytermelés Vol.: 55 nos 3-4
K. Balla – Z. Bedı – O. Veisz: 2006. Effect of heat and Drought stress on the photosynthetic processes of
wheat. Cereal Research Communications, Vol.: 34 No. 1 pp. 381-385
P. Czövek - I. Király - E. Páldi - et al.: 2006. Comparative analysis of stress tolerance in Aegilops accessions
and Triticum wheat varieties to detect different drought tolerance strategies. Acta Agronomica
Hungarica, Vol.: 54, No 1 pp. 49 – 60
E. Dobó – M. Fekete-Farkas – M. Kumar Singh – I. Szőcs: 2006. Ecological-economic analysis of climate
change on food system and agricultural vulnerability: a brief overview. Cereal Research
Communications, Vol.: 34 No. 1 pp. 777-781
M. Harcsa – M. Bajnok – B. Kulin - L. Szemán – J. Prutkay: 2008. Effect of ecological soil aptitude on grass
stand planning. Cereal Research Communications, Vol.: 36,. No. 1 pp 1931-1934
Mészáros, I. - Miklánek, P.: 2006. Calculation of potential evapotranspiration based on solar radiation income
modeling in mountainous areas. In Biologia : section botany. Bratislava : Slovak Academy of Sciences,
Vol.: 61, suppl. 19, pp. 284-288.
Nagy J.: 2006. Adatok a tiszántúli öntözetlen réti talajú gyepek fıbb gyepalkotó főfajainak optimális kémiai
talajjavításához és tápanyagellátásához. Növénytermelés Vol.: 55 Nos 3-4
Pajor F. - Láczó E. - Póti P.: 2007. Sustainable sheep production: evaluation of effect of temperament on lamb
production. Cereal Research Communication, 35: 2. 873-876.
Pajor F. - Szentléleki A. - Láczó E. - Tızsér J. - Póti P.: 2008. The effect of temperament on weight gain of
Hungarian Merino, German Merino and German Blackhead lambs. Arch. Tierz., 51: 247-254
L. Szemán – M. Bajnok – M. Harcsa – J. Prutkay – G. Zsigó: 2008. The effect of soil nutrients and animal
excreta on grassland biodiversity improvement Cereal Research Communications, Vol.: 36,. No. 1 pp
1935-1938
G. Várallyay: 2007. Láng I., Csete L. és Jolánkai M. (szerk): A globális klímaváltozás: hazai hatások és
válaszok (A VAHAVA Jelentés). Agrokémia és Talajtan, Vol.: 56 No. 1 pp 199-202

VIII. Alps-Adria Scientific Workshop Neum, Bosnia-Herzegovina, 2009
DOI: 10.1556/CRC.37.2009.Suppl.2 113
EFFECT OF WATER SUPPLY ON CANOPY TEMPERATURE AND YIELD OF PROCESSING TOMATO
András BİCS – Zoltán PÉK – Lajos HELYES – András NEMÉNYI – László KOMJÁTHY
Institute of Horicultural Technology, Faculty of Agriculture and Environment, Szent István University,
Gödöllı, Hungary, e-mail: [email protected]
Abstract: Tomato is one of the most extensively cultivated horticultural crops in the world. Water supply is
important for yield quantity and quality. The aim of the present study is to evaluate the canopy temperature
and the yield on processing tomato substances with different water supply. There were two treatments, one of
them was the irrigated plant material which got 333 mm water, including the precipitation and the other was
the cut off substance which means the watering was stopped at the beginning of the ripening process, there
was a control as well which got 189 mm precipitation. The canopy temperature was measured row by row
with a Raytek MX 4 type infrared thermometer. The stomatal conductance was measured by AP4 type
porometer. There were significant differences between the control and irrigated plants according to the water
supply which was formulated the canopy values. The plants with a deficient water supply were decreased the
transpiration rate, therefore its cooling effect didn’t show up. The permanently irrigated tomato plants’ yield
exceeded the unirrigated ones with almost 50%. It is emerged from the study that the irrigation has a positive
effect on the amount of the harvestable yield. It’s came from the regression analysis that over a specific
amount of water (285 mm), the ripened yield is affected negatively.
Keywords: tomato, water supply, canopy temperature
Introduction
The importance of tomato cultivation has been growing rapidly in the last decades in the
world. Beside the fresh market tomatoes, the processing tomato has a great importance
in the food industry. The processing tomato cultivation has changed a lot recently, the
production areas were decreased, but the yield is getting higher due to the widespread
use of hybrids and better growing technologies in Hungary. Processing tomato
cultivation is only profitable in Hungary if the yield is over 40-50t/ha (Fruitveb 2008).
Ecological conditions e.g. solar radiation, temperature and water supply take a great
effect on tomato yield (Pék et al. 2008), so the irrigation is essential to keep yield higher
and it is possible to increase the amount till 80-100t/ha. It is important to measure the
different water supply on canopy by monitor the activity of stomas in the leaves. The
prognosis could be done for the irrigation and calculation the amount of irrigation water
is possible only in the view of stomatal conductance and canopy temperature (Schober
et al. 2008).
Materials and methods
The experiment was carried out in open field in Gödöllı. The soil is sandy in that area
with low water capacity and the hydraulic conductivity is good. Tomato cultivars
(Brigade F1) were investigated in the present study. Area of the experiment was 300 m2
and the area of one plot was 25m2. Seeds were sown on the 7
th of April 2008 in
greenhouse and transplanted on the 12th
of May 2008. Tomato seedlings were planted
out in twin rows, 0.4m spacing inside the raw and 1.2m between adjacent twin rows, the
space between the plants in the row was 0.4m. There were two treatments, regularly
irrigated plants which got 333 mm water, including the precipitation and the other was
the cut off substance which means the irrigation was stopped at the beginning of the
ripening process; there was a control as well which got 189 mm precipitation. Drip

Vol. 37, 2009, Suppl. Cereal Research Communications
114
irrigated water was given out according to the air temperature (daily irrigation water
(mm) = average daily temperature×0.2). The canopy temperature was measured by
Raynger II infrared thermometer and the stomatal conductance by AP4 type porometer.
These processes were taken every day within the crops from 1PM.
All statistical analyses were performed using the Microsoft® Excel 2002 Analysis
Toolpak (Microsoft Corporation Corporate Headquarters Redmond, USA).
Results and discussion
According to Katerji et al. (1988), we measured first leaf above terminal cluster, which
is well characterise water status of the whole plant.
There is significant difference between the irrigated and unirrigated control treatment
during the measuring period. Accumulated stomatal conductance was 20.2 mol m-2
s-1
for the irrigated, 17.5 mol mol m-2
s-1
for the cut off, and 10.2 mol m-2
s-1
for the
unirrigated control plants respectively (Figure 1).
0
2
4
6
8
10
12
14
16
18
20
22
24
29/6 09/7 19/7 29/7 08/8
date
Acc
um
ula
ted s
tom
atoal
conduct
ance
(mol m
-2 s
-1)
regularly irrigated irrigation cut-off rainfed
Figure 1. Accumulated stomatal conductance of processing tomato in the three different treatments during the
measuring period, based on data recorded at 1PM Vertical bars represent significant differences at p=0.05
(n=41).
The stomas of regularly irrigated tomato plants opened up more widely, because of the
high turgor capacity, therefore the water could effuse as a vapour. The unirrigated
control plants showed the contrast of that, to avoid the unnecessary water loss, hence the
lower conductivity value.

VIII. Alps-Adria Scientific Workshop Neum, Bosnia-Herzegovina, 2009
DOI: 10.1556/CRC.37.2009.Suppl.2 115
The canopy temperature rates confirm the difference between irrigation treatments and
unirrigated control. It was appointed that there was an upward tendency in the range of
control, cut off and regularly irrigated plants, the more water supplies they had, the
more yields they produced.
The canopy temperature of control plants was 27.3 °C, the irrigated plants was 26.2 °C
on the average. This means 1.1 °C average deflection through a day. A deflection of 1 C
on the canopy temperature causes 10% in the transpiration rate (Tanner, 1963),
therefore the regularly irrigated treatment could vaporize 10% more then the control
ones. Canopy temperature of irrigated and unirrigated plants were split at the beginning
of the treatment, and the species are separable as well.
Canopy temperature of the plants from both treatments were under or close to the air
temperature during the monitoring period, except the control treatment (Figure 2.).
Since the control’s temperature was nearly always higher than the air temperature, the
plants had lack of water. From the calculations it can assessed that the air temperature
affects the leaves’ temperature significantly. It can assess from correlation coefficients
that the air temperature affects the constantly irrigated, cut-off and control plants’ leaf’s
temperature by 60-, 54- and 59% in range. Lesser water supply coupling higher canopy
temperature, which comes from the equations. In the constantly irrigated treatment the
cooling effect intensify over 28ºC air temperature.
0
10
20
30
40
0 10 20 30 40
air temperature (°C)
leaf
surf
ace
tem
per
ature
(°C
)
cut-off regularly irrigated rainfed
y = 1.02x - 0.07 R²=0.55 y = 0.98x + 0.48 R²=0.60 y = 1.17x - 3.05 R²=0.59
Figure 2. Correlation between canopy temperatures of different irrigated tomato treatments and air
temperature, during the monitoring period at 1PM. ( Brigade F1, n=41).

Vol. 37, 2009, Suppl. Cereal Research Communications
116
Conclusions
There were significant differences among three different water supplies in accumulated
stomatal conductance, at the end of measuring period. The stomas of regularly irrigated
tomato plants opened up more widely, because of the high turgor capacity, therefore the
water could effuse as a vapour, while unirrigated control plants showed the contrast of
that, to avoid the unnecessary water loss.
Air temperature took strong positive effect on leaf surface temperature. The rainfed and
cut-off irrigated tomato plants could not transpire sufficient water to cool leafs below air
temperature and it causes stress. But regularly irrigated plants did not heat over air
temperature owing to enough soil water content.
Both stomatal conductance and canopy temperature is suitable to characterize the
tomato plant water status.
Acknowledgements
The study was partly supported by Seminis Hungária Ltd.
References
Fruitveb (2008): A zöldség-gyümölcs ágazat helyzete Magyarországon, 9-10.
Helyes L., Dimény J., Pék Z., Lugasi A. (2006a): Effect of the variety and growing methods as well as
cultivation conditions on ingredient of tomato (Lycopersicon lycopersicum (L.) Karsten) fruit. Acta
Horticulturae, 712: 511-516.
Katerji N., Itier B. és Ferreira M.I (1988): Etude de quelques critères indicateurs de l'état hydrique d'une
culture de tomate en région semi-aride. Agronomie, 8: 425-433.
Schober G., Pék Z., Helyes L. (2007): Effects of drip irrigation in processing tomato (Lycopersicon lycopersicum (L.) Karsten). Cereal Research Communications, 36: Suppl. 1. 627-630.
Tanner V. (1963): Plant temperature. Agronomy Journal, 55: 210-211.
Pék Z., Helyes L., Dimény J., Paksi A., Bıcs A. (2008): Effect of ecological conditions on tomato fruits
colour and ingredients during the ripening process. Cereal Research Communications, 36: Suppl. 1. 519-
522.

VIII. Alps-Adria Scientific Workshop Neum, Bosnia-Herzegovina, 2009
DOI: 10.1556/CRC.37.2009.Suppl.2 117
EFFECTS OF REGULAR UNDER- AND OVER-FERTILISATION ON THE CHEMICAL FEATURES OF A CHERNOZEM SOIL AND ON THE YIELD OF WINTER WHEAT
György ZSIGRAI – József ZSEMBELI – Györgyi KOVÁCS
Karcag Research Institute of Centre for Agricultural Sciences and Engineering University of Debrecen, 5300
Karcag, Kisújszálási út 166., e-mail: [email protected]
Abstract: Both lack and surplus of nutrients can cause stress for crops and have unfavourable effects on
chemical features of soils as well. Effects of NPK fertilisation of different dose on chemical features of a
chernozem soil and on yield of winter wheat were tested in the framework of the 40-year-old National
Uniformed Long-term Fertilisation Experiments (NULTFE) at Karcag in 2007. Results proved that regular
application of too small and too big fertilizer doses have unfavourable effects on some chemical properties
(the readily available nutrient contents, the soil acidity, the amounts and the rate of exchangeable cations) of
the tested soil and the yield of winter wheat. We tested the CO2-emission of soils as a potential indicator of
stress situations as well.
Keywords: under- and over-fertilisation, winter wheat, long-term fertilisation experiment, CO2-emission
Introduction
Fertilisation has both favourable and unfavourable effects on the chemical features of
soils and on amounts of yield of different crops (Tisdale and Nelson 1966).
Unfavourable effects get stronger if too big or too small fertiliser doses are applied
regularly (Csathó 2003; Pepó 2007; Kádár 2008). Hence, lack and surplus of nutrients
can result in stress for crops. These stress situations decrease the quantity and the
quality of yields (Blazenca et al. 2007) and have effects of the microbiological activities
of soils (Kátai 1992). The mitigation of these unfavourable effects is one of the most
important tasks of farmers and agrochemists. Long-term fertilisation experiments
provide important information for the completion of this task. Effects of long-term NPK
fertilisation on different chemical features of the soil and on the yield of winter wheat
were tested in the NULTFE in Karcag. We tried to get information about the stress-
provoking role of over- and under-fertilisation as well. Additionally, we tested the CO2-
emission of the soil as a potential indicator of nutrient stress situations.
Materials and methods
Effect of NPK fertilisation on some chemical features of the soil and on the amounts of
winter wheat yield was tested on a meadow chernozem soil at Karcag in 2007. The
applied fertiliser doses were published previously by ZSIGRAI (2001). We applied a
conventional crop production technology during the vegetation period. The pH(H2O),
pH(KCl), humus content, hydrolytic acidity (y1), AL-soluble P2O5, K2O, Ca-, Mg-, Na-,
KCl+EDTA soluble Cu-, Fe-, Zn- and Mn-contents, exchangeable Ca-, Mg-, K- and Na-
contents of the soil samples taken from the 0-20 cm layer were determined. The
experimental data were processed with the method of MANOVA. In situ CO2-emission
of soil was measured by means of an ANAGAS 98 infrared gas analyser in the control
plots and plots getting 200 kg ha-1
year-1
N at 6 dates along a 15-month-long period.

Vol. 37, 2009, Suppl. Cereal Research Communications
118
Results and discussion
While the NP fertilisation decreased the pH(H2O) values of the soil, the potential acidity
was modified by the N fertilisation only (Table 1). The pH(H2O) of the control plots
was almost neutral, but significant potential acidity was found in their top soil layer at
the same time. This result proved that the artificial fertilisation is not the only reason of
the acidification of our soils. Very serious changes of soil acidity can happen without
artificial fertilisation caused by other acidifying factors. Until the acid-base buffer
capacity of the soils does not get worn out, harmful stress situation caused by
acidification will not be developed, but the acid-base status of soils should be monitored
regularly in case of non calcareous mineral soils.
Table 1 Effects of fertilisation on chemical features of the tested soil and on the amount of winter wheat yield
(NULFTE, Karcag, 2007)
N-fertilisation P- fertilisation K- fertilisation
liming Parameter Cont-rol
N100 N150 N200 P0 P60 P120 K0 K100 M+ M-
pH(H2O) 6.80 6.52 6.36 6.17 6.39 6.37 6.29 6.41 6.29 7.18 5.52
SD5% - 0.09 0.09 0.08
pH(KCl) 5.61 5.44 5.30 5.15 5.28 5.31 5.31 5.32 5.28 6.14 4.46
SD5% - 0.1 - -
hydrolytic acidity 10.0 12.2 13.7 15.4 13.6 13.6 15.4 13.7 13.9 5.5 22.0
SD5% - 1.0 - - AL-sol. P2O5 (mgkg-1) 40 94 81 83 27 68 163 85 87 97 75 SD5% - 11 11 - AL-sol. K2O (mgkg-1) 245 319 326 315 336 313 312 227 414 320 320 SD5% - - 21 17 KCl+EDTA sol. Fe (mg kg-1)
177 196 202 213 194 203 216 204 203 157 250
SD5% - 10 10 - Exch. Ca (meq 100 g-1) 23.5 22.3 21.5 21.2 21.1 21.6 22.2 22.1 21.2 25.7 17.6 SD5% - 0.7 0.7 0.6 Exch. Mg (meq 100 g-1) 3.80 2.85 2.75 2.62 2.82 2.71 2.69 2.88 2.60 2.44 3.04 SD5% - 0.15 - 0.12 Exch. K (meq 100 g-1) 0.59 0.80 0.80 0.80 0.83 0.80 0.77 0.55 1.05 0.80 0.80
SD5% - - - 0.06
Yield of winter wheat (t ha-1)
2.29 5.13 5.52 5.71 4.20 6.16 5.99 5.62 5.28 5.37 5.53
SD5% - 0.44 0.44 -
Very significant differences were observable in case of all investigated acidity
parameters due to the chemical amelioration even in the 8th
year after the liming.
Without chemical amelioration, the pH(H2O) approached the limit value considered
harmful for crops. Regular liming or Ca-fertilisation should be built in the crop
production technology carried out on soils which are sensitive to the acidification.
The AL-P2O5 contents of the soil increased significantly due to the regular P
fertilisation. The average AL-P2O5 content of the control plots was higher than the P2O5
content of plots treated with NK fertilisers. It can be explained with the increased P
uptake of the bigger yields of the NK treated plots. Hence, we established that the
chance of the formation of stress (lack of phosphorus) can be more significant in case of
regular unbalanced NPK fertilisation than in case of fertilisation of small dose. 65-70 kg
P2O5 ha-1
dose could be considered as an amount that is suitable for maintaining the P-
balance of the given soil in equilibrium. In case of the application of bigger P doses,
filling up processes can be expected in the tested soil. The AL-P2O5 content was

VIII. Alps-Adria Scientific Workshop Neum, Bosnia-Herzegovina, 2009
DOI: 10.1556/CRC.37.2009.Suppl.2 119
decreased significantly by the N fertilisation as well, because of the higher P-demand of
the bigger amounts of yield. Corresponding to the results of another experiments
(Füleky 1983), the liming increased the solubility of the P compounds of the soil. But,
sometimes liming can result in lack of some kind of microelements.
The regular K fertilisation increased the AL-K2O contents of the soil significantly.
Symptoms of stress situations caused by K over- or under-fertilisation could never be
observable in the experiments, because the K-fund of the soil could provide the K
supply of the plants. The higher acidity of the soil resulted in increase of solubility of
the Fe-compounds which represents a possibility of development of stress situations.
Amounts of the exchangeable Ca-ions were decreased by the N and the K fertilisation
and increased by the P fertilisation. In case of the N fertilisation the acidifying effect of
the ammonium-nitrate, but in case of the K fertilisation the cation exchange processes
were the causing factors of these changes. The regular spread of superphosphate
containing a great amount of Ca-ions increased the adsorbed Ca content of the soil. Of
course the liming had the same effect. The effect of the N and the K fertilisation on the
exchangeable Mg content of the soil was very similar to their effects on the
exchangeable Ca content, but the P fertilisation and the liming decreased the amounts of
this cation significantly. The exchangeable K content of the soil was affected by the K
fertilisation only.
According to the yield data, application of 100-130 kg N and 70-80 kg P2O5 effective
substances is reasonable in the ecological conditions of the experiment. The application
of NP-doses exceeding the amounts mentioned above can reduce the amount of yield.
We came to the conclusion that there is a possibility of omitting K-fertilization on the
examined soil type sometimes, because we observed effects of K-fertilization neither on
the amount, nor on the safety of winter wheat yield in the experiments. In our opinion
these results could be adapted to the fields of the Middle-Tisza Region with ecological
conditions similar to the trial site. But the decision concerning the omitting K-
fertilization always must be established by exact soil tests. The yield data call our
attention to the importance of the P fertilisation of winter wheat. The regular application
of 60 kg P2O5 ha-1
increased the amount of winter wheat yield by 2 t ha-1
comparing to
the yield of plots without P fertilisation. But, the further increase of the P dose resulted
in yield decrease. This phenomenon must be a symptom of a stress situation induced by
P over-fertilisation. In circumstances of insufficient nutrient supply represented by the
control plots, the amount of winter wheat yield reached 50 % of the yield of fertilised
plots only.
On the basis of the CO2-emission data, only a small difference was observable between
the control plot and the plot treated with N fertiliser (Figure 1). We could not detect
significant differences in the CO2-emission of the different plots when the
microbiological activity was limited by the low soil moisture content (August) or by the
low soil temperature (October). In June the microbiological activity of the soil was not
limited by other ecological factors, so the effect of the different nutrient supply of the
soil was traceable by the measuring of the CO2-emission. When the moisture contents of
the plots were similar (in July, after precipitation), no significant differences were
detected. Similar experiences were reported in scientific papers dealing with the
correlation between soil moisture content and CO2-emission (Zsembeli et al., 2005;
Gyuricza et al. 2006). It can be concluded that the soil moisture content is the main

Vol. 37, 2009, Suppl. Cereal Research Communications
120
limiting factor determining the extent of the CO2-emission originated only from the
microbiological activity of the soil under the given circumstances.
0,00
0,05
0,10
0,15
0,20
0,25
0,30
May Aug Oct June July Sept
CO
2 em
issi
on
(g
m-2
h-1
)
control fertilised
Figure 1. CO2-emission of the soil
Conclusions
Unfavourable fertiliser effects could induce stress situations for the winter wheat which
were indicated by the amounts of yield. The lack of N and P, and the P surplus resulted
in significant yield losses. We found that regular application of 100-130 kg N and 70-80
kg P2O5 effective substances is reasonable in the ecological conditions of the
experiment. The application of NP-doses which are bigger or smaller than the amounts
mentioned above can induce some kind of stress and can reduce the amount of yield.
The chance of the formation of stress was more significant in case of regular unbalanced
NPK fertilisation than in case of fertilisation of small dose. The application possibility
of the CO2-emission measurement is limited in scientific works focusing on the analysis
of fertiliser effects.
References
Blazenka, B. – Loncaric, Z. – Vukadinovic, V. – Vukobratovic, Z.: 2007. Winter wheat yield responses to
mineral fertilisation. Cereal Research Communications. 35. 2. 245-248.
Csathó P.: 2003. İszi búza P-hatásokat befolyásoló tényezık vizsgálata az 1960 és 2000 között publikált
hazai szabadföldi kísérletek adatbázisán. Növénytermelés, 52. 1. 679-701.
Füleky Gy.: (1983.) Fontosabb hazai talajtípusok foszforállapota. Agrokémia és Talajtan 32. 7-30.
Gyuricza, Cs. – Mikó, P. – Földesi, P. – Ujj, A. – Kalmar, T.: 2006. Investigation of green manuring plants as
secondary crop improving unfavourable field conditions to efficient food production. Cereal Research
Communications, 34. 1. 191-195.
Kádár, I.: 2008. A mőtrágyázás hatása az ıszi búzára karbonátos homoktalajon. Növénytermelés, 57. 49-58.
Kátai, J.: 1992. Kölcsönhatások a talajtulajdonságok, néhány agrotechnikai eljárás és a mikrobiológiai
aktivitás között. Kandidátusi értekezés tézisei. 12-13.
Pepó, P.: 2007. The role of fertilization and genotype in sustainable winter wheat (Triticum aestivum L.)
production. Cereal Research Communications. 35. 2. 917-920.
Tisdale, S.L. - Nelson, W.L.: 1966. A talaj termékenysége és a trágyázás. Mg. Kiadó, Budapest.
Zsembeli, J., Tuba, G., Juhász, Cs., Nagy, I.: 2005. CO2-measurements in a soil tillage experiment. Cereal
Research Communications. 33. 1. 137-140.
Zsigrai, Gy.: 2001. The Effect of Artificial Fertilization on Some Chemical Properties of The Soil and on The
Yield of Maize in Long-Term Experiments. (In. Ed. LAZÁNYI, J.: Sustainable Agriculture and Rural
Developement. Vider Plus Bt., Debrecen. 91-117.)

VIII. Alps-Adria Scientific Workshop Neum, Bosnia-Herzegovina, 2009
DOI: 10.1556/CRC.37.2009.Suppl.2 121
CEREAL CANOPY CHARACTERISTICS AS THE STRESS INDICATORS
Jan KREN 1,2
– Petr MISA 2 – Lubomir NEUDERT
1
1 Department of Agrosystems and Bioclimatology, Faculty of Agronomy, Mendel University of Agriculture
and Forestry in Brno, Zemedelska 1, 613 00 Brno, Czech Republic, e-mail: [email protected] 2 Agrotest Fyto, Ltd., Havlickova 2787/121, 767 01 Kromeriz, Czech Republic
Abstract: During three years (2005-2007), small-plot field experiments with winter wheat and spring barley
were carried out in the Czech Republic at two locations differing in soil and climatic conditions. Variants with
contrast stand structure (different seed rates and N rates) were investigated during stem elongation. Analyses
involved determination of individual plants and tillers, above-ground biomass and nitrogen uptake. Two types
of relationships were observed as reaction to the level of sources and its effect as stress factor - relationships
among plants which are more or less of a random nature and intra-plant relationships dependent on the
hierarchic structure of plants. Plant responses were reflected in variability of their tillers. A higher inter-plant
competition was expressed by lower values of the coefficient of variation (CV) of the plant weight and the
number of tillers per plant. On the other hand, intra-plant competition increased values of the CV of the shoot
weight. During stem elongation, the differentiation of tillers into two groups, i.e. vegetative and potentially
productive, take place. This was accelerated by the lack of nitrogen or by a higher plant density. The
separation of shoots into two groups enabled to determine the proportion of the potentially productive biomass
in the total above-ground biomass. A low variability of this proportion (CV ranged from 7.06 to 15.79 % and
from 7.37 to 17.46 % for winter wheat and spring barley, respectively) gives a possibility to use it as the
indicator of the effectiveness of inputs and of a crop productive potential. These may contribute to the
development of more efficient methods for canopy control and assessment of stress factors by using canopy
spectral characteristics.
Keywords: winter wheat, spring barley, canopy structure, inter- and intra-plant competition, tillers
differentiation
Introduction
The stand state and structure reflect variability in soil conditions as well as cropping
treatments. To attain higher effectiveness of crop management practices, extensive
research on cereal stand structure was conducted in the 1980s and 1990s (Masle-
Meynard and Sebillote, 1981; Porter, 1984; Kren, 1991). Understanding the rules of
cereal canopy development can contribute to the identification of stress factors (Grieve
et al., 2001) and to the improvement of both, crop management practices and breeding
(Uzik and Zofajova, 2007). Therefore, this study is focused on a more detailed analysis
of differentiation of cereal tillers during the period of generative growth and
development. The aim was to acquire knowledge of more effective diagnostic methods
for cereal canopy assessment.
Materials and methods
Evaluation of the canopy development of winter wheat (variety Cubus) and spring
barley (variety Malz) was performed in small-plot field experiments established at two
locations in Central and South Moravia (Zabcice and Kromeriz differing in soil and
climatic conditions) within the period of three years (2005-2007). Experiments were
conducted as contrast variants which took into account differences in the stand density
and nutritional status of plants. Each experimental variant was established in five
replications: three of them were harvested and two were used for sampling, which

Vol. 37, 2009, Suppl. Cereal Research Communications
122
enabled the analyses of the structure and nutritional status of the stand. In sampling
plots, squares of the size 0.25 m2 (0.5 x 0.5 m) were marked out to obtain plants for
analyses of stand structure and nutritional status at developmental stages BBCH 31, 37,
55 and 65. Analyses of stand structure and nutritional status involved: estimation of
numbers and weight of individual tillers and plants, and estimation of dry matter (DM)
weight of the above-ground part of plants. The segregation of tillers to productive and
non-productive ones was performed according to their decreasing weight and by taking
the number of fully ripe ears per plot as the number of productive tillers. Tillers with the
highest weight at the given developmental stage were rated as productive ones and the
sum of their weights represented the so-called productive biomass. This value was
separated from the total weight of fresh above-ground biomass per unit area of the
stand. Results were evaluated using elementary statistical characteristics (including
histograms of the distribution of weights of tillers) and correlation analysis.
Results and discussion
The process of tiller differentiation was evaluated by means of histograms illustrating
the frequency distribution of their weights. To respect given size limits of the paper, it is
not possible to present results of all provided analyses, therefore, the process of tiller
differentiation is schematically illustrated in Figure 1. The higher density of plants and a
lack of nitrogen accelerated the process of differentiation and made it also more
intensive. Application of nitrogen prolonged processes of differentiation till the stage of
heading. From the viewpoint of yield formation, a gradual differentiation of tillers is
beneficial because potentially productive tillers can be preserved for a longer time
interval. On the other hand, however, too dense stands can suffer from a lack of sources
(e.g. during dry periods). The separation of tillers into two groups, i.e. vegetative and
generative (potentially productive) ones enabled us to determine the share of potentially
productive and non-productive biomass in the total above-ground biomass of the stand.
The application of nitrogen was manifested in a higher weight of potentially productive
tillers and lower values of their coefficients of variation (CV). The lowered variability
of productive tillers was associated with their higher density and also with the increased
amount of productive biomass per unit area. Correlations between total above-ground
biomass and biomass of potentially productive tillers were positive and statistically
highly significant while correlations between the total above-ground biomass and the
share of the biomass of potentially productive tillers were very variable (Table 1).
Similar values and a similar character of correlations were also between the content of
nitrogen in the total above-ground biomass and biomass of potentially productive tillers
and also their share in the total above-ground biomass. Low values (i.e. less than a half)
of the CV for the proportion of biomass of productive tillers in the total above-ground
biomass (ranging from 7.06 to 15.79 % and from 7.37 to 17.46 % for winter wheat and
spring barley, respectively) were found (Table 2) while values of CV for other traits
under study ranged from 29.81 to 54.43 %. Because of a low variability, the proportion
of potentially productive tillers in the total above-ground biomass can be used for the
estimation of a productive potential of the crop. The results also indicate that there is a
possibility of the occurrence of various, dynamically changing situations in cereal crops.

VIII. Alps-Adria Scientific Workshop Neum, Bosnia-Herzegovina, 2009
DOI: 10.1556/CRC.37.2009.Suppl.2 123
The population concept applied in studies concerning modular units (tillers) enabled to
create a unifying base for these relatively chaotic phenomena. Therefore, they can be
used when studying and testing new methods for efficient and areal screening of the
condition of cereal stands by means of spectral characteristics and technologies of
remote and terrestrial sensing (Scotford and Miller, 2004; Reyniers et al., 2006).
Figure 1. A schematic presentation of changes in the distribution of tiller weights during the period of
generative development (BBCH 31 - 65). V – vegetative tillers, G – generative tillers (stems); the dark area
represents tillers that can become, depending on availability of sources, either vegetative or generative
Table 1. Relationships in stands of winter wheat and spring barley
Correlation coefficients between
Crop
Develop-
mental stage
BBCH
n-
2
Total and
productive
biomass
Total biomass and
share of productive
biomass
N-content in
biomass and
productive biomass
N-content in
biomass and share
of productive
biomass
31 8 0.9111** 0.0850 0.8657** 0.1841
37 6 0.9659** -0.3515 0.9409** -0.1133 Winter
wheat 65 8 0.9720** 0.2182 0.9130** -0.2676
31 14 0.9501** -0.7810** 0.8847** -0.7603**
37 6 0.9995** 0.9657** 0.9664** 0.8949** Spring
barley 55/65 18 0.9835** 0.1695 0.8743** 0.3365
Note: * Statistically significant (P = 95 %); ** highly statistically significant (P = 99 %)
Table 2. Mean values and coefficients of variation for traits in stands of winter wheat and spring barley
Trait
Total biomass N-content in
biomass
Productive
biomass
Share of productive
tillers
Crop
Develop-mental
stage
BBCH
n-
2 Mean
(g.m-
2)
CV
(%)
Mean
(g.m-2)
CV
(%)
Mean
(g.m-2)
CV
(%)
Mean
CV
(%)
31 10 1,586 33.12 8.78 39.86 1031 38.74 0.65 15.79
37 8 3032 30.76 12.65 46.64 2667 29.81 0.89 7.06 Winter
wheat 65 10 3775 35.00 16.14 45.13 3533 34.31 0.94 7.57
31 16 1376 39.58 6.55 36.24 1060 30.99 0.80 12.80
37 8 2430 54.43 8.03 49.95 2573 50.36 0.84 17.46 Spring
barley 55/65 20 2777 38.19 9.83 34.46 2485 40.44 0.89 7.37

Vol. 37, 2009, Suppl. Cereal Research Communications
124
Conclusions
The differentiation of tillers occurred under conditions of a lack of sources (e.i.
nitrogen). Application of nitrogen prolonged processes of differentiation till the end of
heading. From the viewpoint of yield formation, a gradual differentiation of tillers is
beneficial because potentially productive tillers can be preserved for a longer time
interval. On the other hand, however, too dense stands can suffer under conditions of
lacking sources (e.g. during dry periods).
The share of productive biomass in the total above-ground biomass can be an important
indicator of the effectiveness of farming inputs into the crop cultivation. The application
of nitrogen was manifested in a higher weight of an average tiller even under conditions
of an increased stand density and in lower values of CV for tiller weight. Decreased
tiller variability was associated with a higher productive density of the stand and with a
higher amount of productive biomass per unit area of the stand.
There is a close relationship between the total above-ground biomass and that of
potentially productive tillers already at the stage of stem elongation. Because of a low
variability, it is possible to use the proportion of potentially productive tillers in the total
above-ground biomass for the estimation of a productive potential of the crop.
Various and dynamically changing situations can occur in cereal stands. The population
concept applied in studies concerning modular units (tillers) enabled to create a unifying
base for these relatively chaotic phenomena. They can, therefore, be used when
studying and testing new methods for efficient and areal screening of the condition of
cereal stands by means of spectral characteristics and technologies of remote and
terrestrial sensing.
Acknowledgements
This study was supported by the Czech Science Foundation of the Czech Republic,
project No. 521/05/2299 and by Research plan No. MSM6215648905 financed by the
Ministry of Education, Youth and Sports of the Czech Republic.
References
Grieve, C.M. - Francois, L.E. - Poss, J.A.: 2001. Effect of salt stress during early seedling growth on
phenology and yield of spring wheat. Cereal Research Communications, 29: 1-2. 167-174.
Kren, J.: 1991. Využití poznatků o variabilitě rostlin a stébel v porostu pšenice (The use of knowledge in
variability of plants and stems in the wheat stand). Rostlinna vyroba, 37: 4. 297-305.
Masle-Meynard, J. - Sebillotte, M.: 1981. Etude de l'hétérogénéité d'un peuplement de blé d'hiver. I. Notion de
structure du peuplement (Study on the heterogeneity of a winter-wheat stand. 1. Notion of stand
structure). Agronomie, 1: 3. 207–215.
Porter, J.R.: 1984. A model of canopy development in winter wheat. Journal of Agricultural Science,
Cambridge, 102: Apr. 383-392.
Reyniers, M. - Vrindts, E. - De Baerdemaeker, J.: 2006. Comparison of an aerial-based system and an on the
ground continuous measuring device to predict yield of winter wheat. European Journal of Agronomy,
24: 2. 87-94.
Scotford, I.M. - Miller, P.C.: 2004. Estimating tiller density and leaf area index of winter wheat using spectral
reflectance and ultrasonic sensing techniques. Biosystems Engineering, 89: 4. 395-408.
Uzik, M. - Zofajova, A.: 2007. Translocation of dry matter in ten winter wheat cultivars released in the years
1921-2003. Cereal Research Communications, 35: 4. 1583-1592.

VIII. Alps-Adria Scientific Workshop Neum, Bosnia-Herzegovina, 2009
DOI: 10.1556/CRC.37.2009.Suppl.2 125
THE EFFECT OF ABSCISIC ACID AND BENZYLAMINOPURINE ON PRODUCTION OF DRY MATTER AND CHLOROPHYLL CONTENT IN MAIZE (ZEA MAYS L.) UNDER WATER STRESS
Václav HEJNÁK – Kateřina KYKALOVÁ
Department of Botany and Plant Physiology, Faculty of Agrobiology, Food and Natural Resources, Czech
University of Life Sciences Prague, Kamýcká 129, 165 21 Prague 6 - Suchdol, Czech Republic, e-mail:
Abstract: The young plants of maize, cv. Anjou 245, were cultivated in sand culture under controlled
conditions in a greenhouse. The water stress was caused by interruption of irrigation for a period of 8 days.
The relative water content (RWC) decreased from 87.5 % to 79.7–83.2 %. This had the effect of a significant
decrease of the dry matter production in shoots and roots of the maize plants. When the plants were treated
with a 100 µM abscisic acid (ABA) solution before the interruption of irrigation, this limited the growth of
their aboveground parts and supported the production of dry matter in roots. Benzylaminopurine (BAP),
applied as a 10 µM solution, also supported the production of dry matter in the roots of the stressed plants to a
statistically significant extent. At the same time, the application of ABA and BAP also reduced the ratio of the
dry matter in aboveground parts to the dry matter in roots in the plants stressed by drought; the change in
favour of the roots is a significant adaptation mechanism of plants to cope with water stress. The 8-day
interruption of irrigation resulted in decreasing the a and b chl content levels in the plants. This shows that the
production of dry matter was influenced not only by the stomatal limitation of photosynthesis (by the partial
closing of stomata) but also by non-stomatal limitation of photosynthesis. The negative effect of water stress
on the chlorophyll content was mitigated by BAP. The effect of ABA was inconclusive (when applied at the
roots) or negative (when applied on the leaves).
Keywords: Zea mays L., dry matter, chlorophyll content, water stress, abscisic acid, benzylaminopurine
Introduction
Drought is one of the highly significant factors limiting the yield of most agricultural
crops, including maize. The works of Stuchlikova et al. (2007) and Ceska et al. (2008)
proved the effect of water stress on the physiology of stomata: their conductivity, rate of
gas exchange and water use efficiency. It was also found out that these characteristics
can be influenced in stressed plants by application of abscisic acid (ABA) and synthetic
cytokinin benzylaminopurine (BAP). The aim of this related work was to find out how
water stress limits the production of dry matter and the chlorophyll content in maize
plants. The aim was also to identify how these parameters influence ABA and BAP and
their method of application (on leaves or at the roots). Young plants were chosen for the
experiment. Similarly like Keresa et al. (2008), we assume that the identified results will
indicate the responses of plants even in the later phases of ontogenesis.
Materials and methods
Young plants of maize (Zea mays L., cv. Anjou 245) were cultivated in a physiological
greenhouse in pots under controlled conditions: with 16-hour photo-period (16 hours of
light/8 hours of darkness), with temperature set at 25 °C during the day and 20 °C at
night and with air humidity hovering around 50 %. The pots had the area of 0.05 m2 and
were filled with silica sand and 10 plants were grown in each pot. They were irrigated
by Knop's nutrient solution. The silica sand moisture was maintained at the level of 60–
70 % of the maximum capillary water capacity (θMCC). 28-day-old plants were divided

Vol. 37, 2009, Suppl. Cereal Research Communications
126
into 8 variants with 4 repetitions. Two variants (the irrigated control sample and the
stressed, i.e. non-irrigated control sample) were treated with 50 cm3 of water; on the
other variants, 50 cm3 100 µM abscisic acid (ABA) or 10 µM benzylaminopurine (BAP)
or 100 µM ABA + 10 µM BAP were applied either by sprinkling or by irrigation. These
concentrations were selected according to preliminary experiments. Subsequently, in the
stressed control variant and in the variants treated by growth regulators, irrigation was
interrupted for 8 days. The responses of plants to changes of the moisture in the
substrate were identified by measuring the relative water content in leaves (RWC)
gravimetrically. The chlorophyll content in the leaves of the experimental plants was
identified spectrophotometrically by means of the Helios Γ apparatus. After the
pigments were extracted into acetone, the solution absorbance levels at wave lengths of
663 and 644 nm were measured. The a and b chlorophyll content levels in 1 gram (g) of
fresh leave matter were then calculated according to Nybom (1955). The dry matter of
the aboveground part and the plants' roots was identified after the samples had been
dried at 80 °C and had reached constant weight. The statistical evaluation was carried
out by the variance analysis with α = 0.05 in the computer software Statistica, ANOVA
module. The mean values measured in three series of experiments have been published.
Results and discussion
Figure 1. The dry matter of the young maize plants after the growth regulators application and the 8-day
interruption of irrigation (Mean ± SD).
In the control group where moisture content of the silica sand was maintained at 60–70 %
θMCC throughout the experiment, a mean RWC of 87.5 % was identified in measurement.
An eight-day interruption of irrigation and the related decrease of θMCC resulted in decreasing
RWC in the stressed plants down to 79.7–83.2 %. The differences among the individual
stressed groups were not statistically significant (see Stuchlikova et al., 2007 for more
information). According to the results shown in Fig. 1, this water stress had the effect of a

VIII. Alps-Adria Scientific Workshop Neum, Bosnia-Herzegovina, 2009
DOI: 10.1556/CRC.37.2009.Suppl.2 127
statistically significant decrease of the dry matter production in shoots and roots of the maize
plants as compared with the plants under no stress. This is caused by the reduced intensity of
elongation of cells and growth of organs, the increasing accumulation of ABA in leaves and
the incipient closing of stomata as a result of loss of turgor (Hejnak et al., 2009). The change in
the opening of stomata consequently leads to decreasing the photosynthesis rate, the
transpiration rate and the rate of assimilate production (Stuchlikova et al., 2007; Ceska et al.,
2008; Csajbok et al., 2008). When the plants were treated with a 100 µM abscisic acid (ABA)
solution before the interruption of irrigation, this limited the growth of their aboveground parts
and supported the production of dry matter in roots. The application by irrigation at the roots
was more effective than spraying the solution on leaves. ABA can improve the water
management of maize plants not only by closing stomata and decreasing the losses resulting
from transpiration, as stated by Stuchlikova et al. (2007) and Ceska et al. (2008). Our results
show that it can also increase the intake of water by enlarging the root system. Cytokinin BAP,
applied at the roots or on leaves as a 10 µM solution, supported the production of dry matter in
the roots of the stressed plants even more. At the same time, the application of BAP at the roots
limited production of dry matter in the aboveground parts of the plants. The application of BAP
on the leaves conversely supported growth of dry matter in aboveground parts. The application
of ABA as well as the application of BAP reduced the ratio of the dry matter in aboveground
parts to the dry matter of roots in the plants stressed by drought. Supplying these growth
regulators to the roots through irrigation had a much more significant effect on reduction of this
ratio than supplying the regulators by spraying leaves with them. The ratio between the
produced dry matter of the aboveground parts and the roots of the young maize plants was also
reduced by the combined application of ABA and BAP. In this case, no differences depending
on the application method were identified. There is enough information on the effect of ABA
but there is little information on the effect of cytokinins on reduction of the ratio between stems
and roots in plants exposed to drought. The work of Havlova et al. (2008) suggests a significant
role of cytokinins in the response of the roots of plants to water deficit.
Table 1. The chlorophyll content in the leaves of young maize plants after the growth regulators application
and the 8-day interruption of irrigation [mg g-1fresh leave matter]
chlorophyll a [mg g-1fresh leave
matter]
chlorophyll b [mg g-1fresh leave
matter] Variants of trial
Mean SD. Mean SD.
Irrigated control 0.82 0.01 0.47 0.02
Water stress (WS) 0.74 0.01 0.39 0.01
WS + ABA irrigation 0.74 0.02 0.40 0.02
WS + ABA spraying 0.68 0.02 0.34 0.02
WS + BAP irrigation 0.77 0.01 0.42 0.01
WS + BAP spraying 0.80 0.01 0.46 0.01
WS + ABA + BAP irrigation 0.81 0.01 0.46 0.01
WS + ABA + BAP spraying 0.77 0.01 0.44 0.01
The samples for identifying chlorophylls were prepared from the leaf blades of all
leaves on the plant, including the youngest ones. We believe that this could explain the
narrow chlorophyll a/b ratio in the control group (Tab. 1). The 8-day interruption of
irrigation resulted in decreasing the a and b chl content levels in the young maize plants. The
reduction of chlorophyll content indicates non-stomatal limitation of photosynthesis in the

Vol. 37, 2009, Suppl. Cereal Research Communications
128
maize leaves under water stress. When ABA was sprayed on the leaves, this resulted in further
reduction of the chlorophyll content in the leaves of the plants stressed by drought. The effect
of ABA applied at the roots was statistically inconclusive. Conversely, BAP applied at the
roots or directly on the leaves resulted in an increased content of chlorophylls in the plants
stressed by drought. Other authors state that not only cytokinins but also ABA mitigates the
negative effect of water stress on the chlorophyll content in the leaves of maize and other plants
(for example, Haisel et al., 2006).
Conclusions
The water stress, during which RWC decreased from 87.5 % to 79.7–83.2 % was
manifested in the young maize plants by limitation of growth and production of dry
matter in stems and roots. ABA or BAP supplied exogenously supported the growth and
production of dry matter in roots in the plants exposed to drought, consequently
reducing the ratio between stems and roots. The change of ratio between the
aboveground part and the roots in favour of the roots is a significant adaptation
mechanism of plants to cope with water stress. The plant increases the water intake and
limits the water output. This improves its water management mode. The decrease of the
chlorophyll content in maize leaves under water stress shows that production of dry
matter was influenced not only by stomatal (by the partial closing of stomata) but also
by non-stomatal limitation of photosynthesis. The negative effect of water stress on the
chlorophyll content was mitigated by BAP. The effect of ABA was inconclusive (when
applied at the roots) or negative (when applied on the leaves).
Acknowledgements
Supported by the MEYS of the Czech Republic, Project No. 6046070901.
References
Ceska J. - Hejnak V. - Ernestova Z. - Krizkova J.: 2008. The effect of soil drought on photosynthesis and
transpiration rates of maize (Zea mays L.). Cereal Research Communications. 36: 823-826.
Csajbok J. - Kutasy E. - Borbely-Hunyadi E. - Lesznyak M.: 2008. Effect of soil moisture on the
photosynthetic activity and transpiration of plants. Cereal Research Communications. 36: 603-606.
Haisel D. - Pospisilova J. - Synkova H. - Schnablova R. - Batkova P.: 2006. Effects of abscisic acid or
benzyladenine on pigment contents, chlorophyll fluorescence, and chloroplast ultrastructure during water
stress and after rehydration. Photosynthetica. 44: 4. 606-614.
Havlova M. - Dobrev P.I. - Motyka V. - Storchova H. - Libus J. - Dobra J. - Malbeck J. - Gaudinova A. -
Vankova R.: 2008. The role of cytokinins in responses to water deficit in tobacco plants over-expressing
trans-zeatin O-glucosyltransferase gene under 35S or SAG12 promoters. Plant Cell and Environment. 31: 3. 341-353.
Hejnak V. - Skalicky M. - Hnilicka F. - Novak J.: 2009. Responses of cereal plants to environmental and
climate changes. A review. In: Lichtfouse, E. (ed.), Sustainable Agriculture Reviews Volume 2. Springer,
Dordrecht. in press.
Keresa S. - Baric M. - Sarcevic H. - Jercic I.H. -Vujic V.: 2008. Tolerance to drought stress of Croatian winter
wheat genotypes at seedling stage. Cereal Research Communications. 36:1039-1042.
Nybom N.: 1955. The pigment characteristics of chlorophyll mutations in barley. Hereditas. 41: 3-4. 483-498.
Stuchlikova K. - Hejnak V. - Safrankova I.: 2007. The effect of abscicic acid and benzylaminopurine on
photosynthesis and transpiration rates of maize (Zea mays L.) under water stress and subsequent
rehydration. Cereal Research Communications. 35: 4. 1593-1602.
VIII. Alps-Adria Scientific Workshop Neum, Bosnia-Herzegovina, 2009
DOI: 10.1556/CRC.37.2009.Suppl.2 129
RESPONSE OF MAIZE, WHEAT AND BARLEY TO PHOSPHORUS AND POTASSIUM FERTILIZATION
Vlado KOVAČEVIĆ 1 – Biserka STOJIĆ 2 – Mirta RASTIJA 1 – Ivan BRKIC 3 – Georg DREZNER 3 1 Faculty of Agriculture, Trg Svetog Trojstva 3, HR-31000 Osijek, Croatia, e-mail:[email protected] 2 Petrokemija Fertilizer Factory, HR-44320 Kutina, Croatia 3 Agricultural Institute, Juzno predgradje 17, HR-31000 Osijek, Croatia
Abstract: The experiment with increased rates of fertilization was conducted in spring of 2003 in Badljevina
(west edge of Pozega-Slavonia County). Total seven treatments were applied as follows (kg ha-1): a) standard
fertilization or control (160 N + 150 P2O5+ 100 K2O); b) a + 500 P2O5; c) a + 1000 P2O5 ; d) a + 500 K2O; e) a
+ 1000 K2O, f) a + 500 P2O5 + 500 K2O and g) a + 1000 P2O5 + 1000 K2O. Phosphorus was added as MAP
(monoammonium-phosphate: 12% N + 52% P2O5) and potassium in KCl form (60% K2O). The field trial was
conducted by randomized block design in four replicates. Size of the individual plot of fertilization was 46.2
m2 (11 x 4.2 m). Crop rotation has been as follows: maize (2003-2004) – wheat (2005) – maize (2006) - winter
barley (2007) – maize (2008). In general, maize yields in the experiment were high (4-year mean 11.08 t ha-1)
and response to applied fertilization was not significant. However, wheat and barley responded by
considerably yield increases (wheat up to 17%: 6.14 and 7.17 t ha-1; barley up to 19%: 6.19 and 7.35 t ha-1; for
the control and the higher rate of PK, respectively).
Keywords: maize, wheat, barley, grain yield, phosphorus and potassium fertilization
Introduction
Low plant available phosphorus (P) and potassium (K) levels are in place limiting factor
of the field crop yields (Petošić et al., 2003; Izsaki, 2007; Kadar, 2007; Ragalyi and
Kadar, 2008). Aim of this study was testing ameliorative P and K fertilization impacts
on field crops (maize, wheat and barley) yields in the 2003-2008 period. Response of
maize for the 2003 and 2004 growing seasons, including yields and plant nutritional
status, were detailed shown in the previous study (Lončarić et al., 2005).
Material and methods
The field experiment The experiment with increased rates of fertilization was conducted in spring of April
2003 in Badljevina (west edge of Pozega-Slavonia County). Total seven treatments
were applied as follows (kg ha-1
): a) standard fertilization or control (160 N + 150
P2O5+ 100 K2O); b) a + 500 P2O5; c) a + 1000 P2O5 ; d) a + 500 K2O; e) a + 1000 K2O,
f) a + 500 P2O5 + 500 K2O and g) a + 1000 P2O5 + 1000 K2O. Phosphorus was added as
MAP (monoammonium-phosphate: 12% N + 52% P2O5) and potassium in KCl form
(60% K2O). As with MAP were applied additional quantities of nitrogen, they were
equaled for all treatments with CAN (calcium ammonium nitrate containing 27% N) as
follows (kg CAN ha-1
): 850, 425, 0 850, 850, 425 and 0, for the treatments a, b, c, d, e, f
and g, respectively. The field trial was conducted by randomized block design in four
replicates. Size of the individual plot of fertilization was 46.2 m2
(11 x 4.2 m). Crop
rotation has been as follows: maize (2003-2004) – wheat (2005) – maize (2006) - winter
barley (2007) – maize (2008).
Maize was sown at the end of April / beginning of May by pneumatic sowing machine
and harvested manualy at the end of September / the first half of October. Wheat and

Vol. 37, 2009, Suppl. Cereal Research Communications
130
barley were sown at the end of October and harvested at the beginning of July. Area of
1 square metter was harvested from each plot for yield and ears quantities
determinations. The ears were treshed by special mini treshing mashine.
Soil sampling and chemical analysis of soil Soil sampling (depth 0-30 cm) from different fertilization treatments was made in term
at the end of the second year of testing (October 5, 2004). Nutritional status of soil was
determined by the AL-method.
Soil and weather characteristics Very acid reaction and moderate levels of plant available P and K are the main soil
properties. Fertilization correspondingly influenced on increases of P and K availability,
while soil pH, hydrolitical acidity and humus contents were similar for all applied
treatments (Table 1).
Table 1. Soil characteristics
Fertilization Soil (0-30 cm) properties (HA = hydrolitical acidity)
kg ha-1 pH % mg kg-1 (AL-method) Cmol kg-1 P2O5 K2O H2O KCl Humus P2O5 K2O HA
Soil status at end of the second year of the experiment (Oct., 4, 2004)
a 150 100 4.61 3.93 2.02 47.2 85.3 5.58
c 1150 100 4.58 3.90 2.08 126.2 91.8 5.80
e 150 1100 4.55 3.90 2.03 49.2 187.0 5.75
g 1150 1100 4.54 3.86 2.12 141.5 172.8 5.75
LSD 1% ns (non-significant) 2.2 2.3 ns
Table 2. Weather characteristics for the maize growing seasons
The data of State Hydrometeorological Institute in Zagreb: Daruvar * Weather Bureau
Year Precipitation (mm) Mean air-temperatures ( oC)
May June July Aug. Sept. Total May June July Aug. Sept Mean
The 2003-2006 growing seasons The 2003-2006 growing seasons
2003 35 36 38 46 111 266 18.5 23.6 22.2 23.7 15.0 20.6 2004 55 97 65 63 103 383 14.2 18.7 20.4 20.2 14.9 17.7 2006 106 95 19 160 27 407 15.2 19.1 22.5 18.6 16.6 18.4 2008 21 163 102 49 95 430 16.7 20.7 21.0 20.5 14.3 18.6
Long-term mean (LTM) 1961-1990 Long-term mean (LTM) 1961-1990 LTM 86 99 86 91 65 427 15.7 18.9 20.6 19.7 16.1 18.2
* Daruvar = 10 km toward N-direction from the experimental field.
Drought stress is main characteristic of the 2003-growing season. Precipitation for 4-
month period (May-Aug.) was only 155 mm or only 43% compared to long-term value
(the data of Daruvar Weather Bureau). At the same time, mean air-temperatures were
22.0°C or for 3.3°C higher (Table 2). In general, under middle and eastern European
conditions, the lower maize yields are in close connection with water shortage and the
higher air-temperatures, especially during two summer months, July and August
(Kovačević et al., 2009; Maklenović et al., 2009) and these findings are in accordance
with Corn Belt (USA) experiences (Shaw, 1988). The remaining three growing seasons
(2004, 2006 and 2008) were mainly favorable for maize growing regarding water and
temperature regimes. For example, precipitation and mean air-temperatures in July +
August were 104 mm and 23.0 oC, 128 mm and 20.02
oC, 179 mm and 20.6
oC, 151 mm
and 21.8 oC, for 2003, 2004, 2006 and 2008, respectively (30-year means: 177 mm and

VIII. Alps-Adria Scientific Workshop Neum, Bosnia-Herzegovina, 2009
DOI: 10.1556/CRC.37.2009.Suppl.2 131
20.2 oC). The growing season 2004/2005 was less favorable for winter crops growing
compared to the 2006/2007 growing season because of water excess in autumn and
lower air-temperatures during the winter period (Table 3).
Table 3. Weather characteristics (Daruvar* Weather Bureau)
State Hydrometeorological Institute in Zagreb: Daruvar * Weather Bureau
Precipitation (mm) and mean air-temperatures (oC) Total
Oct. Nov. Dec. Jan. Feb. Mar. Apr. May June July Mean
The growing season 2004/2005 (winter wheat growing in the experiment)
mm 114 102 74 66 64 68 74 69 45 106 782 oC 13.3 6.1 1.8 -0.4 -2.4 4.2 10.7 15.9 18.9 20.8 8.9
The growing season 2006/2007 (winter barley growing in the experiment)
mm 39 59 42 44 66 108 290 95 62 29 834 oC 12.4 8.1 3.9 6.2 6.6 7.8 12.4 17.5 21.5 22.5 11.9
The long-term means (30-years: 1961-1990)
mm 64 82 66 55 49 58 77 86 99 86 722 oC 10.9 5.8 1.4 -0.4 2.1 6.2 11.0 15.7 18.9 20.6 9.2
* 10 km toward N-direction from the experimental field.
Results and discussion
In general, maize yields in the experiment were high (4-year mean 11.08 t ha-1
) and
response to applied fertilization was mainly low because only in 2006 significant yield
increase for 10% was found as a result of ameliorative P fertilization (Table 4).
Table 4. Influences of fertilization (spring of 2003) on grain yields of field crops (2003-2008)
Fertilization
(April 15, 2003)
Realized plant densities (RD for maize = % of planned or PD; for wheat and barley =
number of ears per m2) and grain yields (Y in t ha-1) of field crops in rotation
(kg/ha) Maize Maize W. Wheat Maize W. Barley Maize
2003 2004 2005 2006 2007 2008
P2O5 K2O RD Y RD Y RD Y RD Y RD Y RD Y a)
b)
c)
d)
e)
f)
g)
150
650
1150
150
150
650
1150
100
100
100
600
1100
600
1100
89.3
90.0
90.3
83.2
85.6
89.0
90.0
9.77
10.1
9.92
9.77
10.3
10.1
10.7
88.4
88.2
87.0
90.0
89.5
87.7
90.8
11.9
11.8
11.9
12.1
12.0
12.3
12.2
642
644
625
601
567
605
585
6.14
6.58
6.41
6.80
6.53
7.04
7.17
98.4
98.4
96.6
98.4
99.6
95.4
100
9.47
10.1
10.4
9.10
9.64
9.52
9.62
696
670
707
681
741
743
695
6.19
6.47
6.59
6.74
6.91
6.99
7.35
89.6
88.4
91.2
89.6
92.5
90.2
91.4
12.2
12.5
12.6
12.1
12.4
12.7
12.9
LSD 5%
LSD 1% ns ns
0.60
ns
0.64
ns ns
0.69
ns ns
Average 88.2 10.1 88.8 12.0 98.1 9.73 90.4 12.5
* 100 % RD or RD (plants ha-1) = 54946 (2003 and 2004), 57143 (2006) and 58310 (2008)
** maize yield calculations on 14% moisture and 90% (2003, 2004 and 2008) and 96% (2006) of PRD basis;
yield calculation on 13% moisture, 600 (wheat) and 700 (barley) ears per m2 basis.
However, wheat and barley responded by considerably yield increases (wheat up to
17%: 6.14 and 7.17 t ha-1
; barley up to 19%: 6.19 and 7.35 t ha-1
; for the control and the
higher rate of PK, respectively). Application of fertilizers two weeks before sowing and
their shallow incorporation by presowing tillage (until 15 cm of depth) as well as very
dry growing season could be explanation for absent of maize response for the 2003
growing season. The remaining three years (2004, 2006 and 2008) regarding

Vol. 37, 2009, Suppl. Cereal Research Communications
132
precipitation and temperature regimes (Table 2) were favorable for maize growing and
under these conditions response to fertilization is mainly lower compared to less
favorable years. The second explanation for low response of maize to the fertilization is
possible low degree of AL-method (Egner et al., 1960) suitability for estimation of P
and K nutritional status for this soil type. The results of this study are mainly in
agreement with our earlier experiences (Banaj et al., 2006; Kovačević et al., 2007, 2008;
Rastija et al., 2006).
Conclusions
In general, ameliorative P and K fertilization had no significant effects on maize, while
wheat and barley yields were increased up to 17% and 19%, respectively. Also,
application of both elements was more effective compared to either P or K application.
Acknowledgements
This study was supported by the project 079-0730463-0447: „Overcomming of maize
stress growing on acid soils by fertilization and plant breeding” under support of
Ministry of Science, Education and Sport in Zagreb, Croatia.
References
Banaj D. - Kovačević V. - Šimić D. - Šeput M. - Stojić B.: 2006. Phosphorus impacts on yield and nutritional
status of maize. Cereal Res. Commun. 34: 1. 393-396.
Egner, H. - Riehm, H. - Domingo, W.R.: (I960.): Untersuchungen őber die chemische Bodenanalyse als
Grundlage fur die Beurteilung des Nahrstoffzustandes der Boden II. Chemische Extractionsmetoden zu
Phosphor- und Kaliumbestimmung. K. Lantbr. Hogsk. Annlr. W.R., 26: 199-215.
Izsaki Z.: 2007. N and P impact on the yield of maize in a long-term trial. Cereal Res. Commun. 35: 4. 1701-
1711.
Kadar I.: 2007. Sustainability of soil fertility nutrient levels. Cereal Res. Commun. 35: 1. 573-576.
Kovačević V. - Jolankai M. - Birkas M. - Lončarić Z. - Šoštarić J.: 2009. Influences of precipitation and
temperature trend on maize yields. Proc. of the XLIV Croatian Symposium on Agriculture (Loncaric Z.
and Maric S. Eds.), 16-20 Febr. 2009, Opatija, (CD-form).
Kovačević V. - Rastija M. - Šimić B. - Andrić L. - Kaučić D.: 2008. Phosphorus and potassium fertilization
impacts on yield and nutritional status of maize. Cereal Res. Commun. 36: Suppl. 43-46.
Kovacevic V. - Seput M. - Andric L. - Sostaric J.: 2007. Response of maize and soybeans to fertilization with
phosphorus and potassium on acid soil. Cereal Res. Commun. 35: 2. 645-648.
Lončarić Z. - Kovačević V. - Šeput Miranda - Šimić B. and Stojic B.: 2005. Influences of fertilization on yield
and nutritional status of maize. Cereal Res. Commun. 33: 1. 259-262.
Maklenović V. - Vučković S. - Kovačević V., - Prodanović S. - Živanović Lj.: 2009. Precipitation and
temperature regimes impacts on maize yields. Proc. of the XLIV Croatian Symposium on Agriculture
(Loncaric Z. and Maric S. Eds.), 16-20 Febr. 2009, Opatija, (CD-form).
Ragalyi P. - Kadar I.: 2008. NxP and NxK interactions on grass yield and mineral element composition.
Cereal Res. Commun., 36: Suppl. 79-82.
Petošić D. - Kovačević V. - Josipović M.: 2003. Phosphorus availability in hydromorphic soils oh Eastern
Croatia. Plant, Soil and Environment, 49: 9. 394-401.
Rastija M. - Kovačević V. - Vratarić M. - Sudarić A. - Krizmanić M.:2006. Response of maize and soybeans
to ameliorative fertilization in Bjelovar-Bilogora county. Cereal Res. Commun. 34 :1. 641-644.

VIII. Alps-Adria Scientific Workshop Neum, Bosnia-Herzegovina, 2009
DOI: 10.1556/CRC.37.2009.Suppl.2 133
IMPACT OF AN ABIOTIC STRESS AS DIFFERENT RATES OF N AND S FERTILIZERS ON NO3
-, SO42- AND CL-
ACCUMULATION AND DISTRIBUTION IN BUSH BEAN-PLANT (PHASEOLUS VULGARIS L.)
Andrea BALLA KOVÁCS – Rita KREMPER – Sándor BERÉNYI
Department of Agricultural Chemistry and Soil Science, Faculty of Agricultural Science, University of
Debrecen, 4032 Debrecen Böszörményi út 138. Hungary, e-mail:[email protected]
Abstract: Greenhouse pot experiment was set up to determine the effect of an abiotic stress as different N and
S doses on NO3-, SO4
2- and Cl- accumulation and distribution in leaves and in pods of bean (Phaseolus vulgaris var. Nanus). Four N rates (0.36, 0.66, 0.96, 1.27 g pot-1) in combination with three levels of S rates
(0.043, 0.085, 0.170 g pot-1) were applied as treatments in a randomized complete block design in four
replications. P and K doses were identical in all pots (0.29 g pot-1 P2O5 and 0.79 g pot-1 K2O). Nitrogen,
phosphorus, potassium and sulphur were added in solution made of NH4NO3, NH4H2PO4, KCl and K2SO4,
respectively. Four plants were grown in Mitscherlich pots containing 10 kg soil.
With increasing rates of applied N decreased the Cl- concentration both in leaves and in pods. On the contrary,
highest N dosages resulted in the accumulation of both NO3- and SO4
2- ions in bean-plant. Higher S doses
significantly reduced the Cl- and NO3- concentration of plant. The decrease of Cl- content in the leaves was
larger extent than in podes. There was a significant increase in SO42- concentration both in leaves and pods
with the application of growing S rates.
According to our results different rates of N and S fertilizers have influenced the quality of the bean and the
distribution and accumulation of anions inside of bean-plant.
Keywords: nitrogen, sulphur, nitrate, sulphate, chloride, bean
Introduction
Among the pulses the common bean is one of the most important food crop worldwide
(Graham and Ranalli, 1997). Bean environment, for example nutritional supply vary
widely in their productivity and their quality. Nitrogen fertilization may affect
vegetative growth and quality of pods of bean plant (El-Kramany et al., 2001). Excessive use of N fertilizers may cause nitrate accumulation in vegetable plant tissues
which may be a health hazard and is therefore undesirable (Boskovic and Pavlovic,
2007; Nádasy and Nádasy, 2006).
Sulphur is considered as the fourth major nutrient element, plays an important role in
the biosynthesis of methionine and cysteine (Giczi et al., 2006). S application not only
increases growth rate of bean but also may improve the quality of production (Khurana
and Bansal, 2007). In the literature, there are some reports which are dealing with N
fertilization of bean (Sánchez et al., 2004), but little attention has been given to study
the effects of combined application of N and S.
Application of high N and S fertilization may result an excessive storage of inorganic
nitrate and sulphate ions in plant tissue. Determination of anions in bean plant may be
important, because they determine some relevant properties (nutritional qualities) of the
food and they provide information about the nature and origin of the foods. The
objective of this research was to evaluate the effects of different nitrogen and sulphur
rates on NO3-, SO4
2- and Cl
- accumulation and distribution of garden bean.

Vol. 37, 2009, Suppl. Cereal Research Communications
134
Materials and methods
The greenhouse pot experiment was performed with a loamy soil (pHCaCl2=7.68;
Hu%=2.22; K A=41.4; (KA: plasticity index according to Arany)).
The bi-factorial trials were arranged in a randomized complete block design with four
replications, applying four levels of nitrogen and three levels of sulphur. For the
treatment applied see Table 1.
Table 1. Scheme of treatments applied
Treatment
code
N doses
(g pot-1)
S doses
(g pot-1)
N1S1 0.36 0.043
N1S2 0.36 0.085
N1S3 0.36 0.170
N2S1 0.66 0.043
N2S2 0.66 0.085
N2S3 0.66 0.170
N3S1 0.96 0.043
N3S2 0.96 0.085
N3S3 0.96 0.170
N4S1 1.27 0.043
N4S2 1.27 0.085
N4S3 1.27 0.170
Phosphorus and potassium doses applied were identical in all pots (0.29 g pot-1
P2O5 (84
kg ha-1
P2O5)) and 0.79 g pot-1
K2O (228 kg ha-1
K2O)). N, P, K and S were added in
solution made of NH4NO3, NH4H2PO4, KCl and K2SO4, respectively. Treatment N2
ensured recommended, 192 kg ha-1
N dose. 10 kg soil was weighed into Mitscherlich
type pots. The indicator plant was bush bean (Phaseolus vulgaris var. nanus). Sex seeds
of bean were sown into the soil per pot and after emergence, four plants per pot were
left to grow. Ion exchanged water was added to all pots to keep the soil at constant
moisture (60% of the water-holding capacity) using daily weighing.
At the end of the vegetation period plant samples (pods and leaves) were collected and
were dried for further analysis. NO3-, SO4
2- and Cl
- ions of plant water extracts were
measured by single column ion chromatography (Balláné and Loch, 2004). Analysis of
variance was carried out on the data in order to provide a statistical comparison between
the treatment means. The least significant difference (LSD) test was used to detect
differences between means.
Results and discussion
The effects of nitrogen and sulphur doses on NO3-, SO4
2- and Cl
- content of pods and
leaves are given in Figures 1., 2., 3.

VIII. Alps-Adria Scientific Workshop Neum, Bosnia-Herzegovina, 2009
DOI: 10.1556/CRC.37.2009.Suppl.2 135
0
200
400
600
800
1000
1200
1400
1600
1800
S1 S2 S3 S1 S2 S3
NO
3- m
g k
g -
1
N1 N2 N3 N4
pods pods pods leaves leaves leaves
0.0
500.0
1000.0
1500.0
2000.0
2500.0
3000.0
S1 S2 S3 S1 S2 S3
SO
42
- mg k
g-1
N1 N2 N3 N4
pods pods pods leaves leaves leaves
Figures 1., 2. Mean of NO3
- and SO42- content (mg kg-1, DW) of pods and leaves as influenced by N and S
rates. For interpretation of treatments see Table 1.
0
500
1000
1500
2000
2500
3000
3500
4000
4500
5000
S1 S2 S3 S1 S2 S3
Cl- m
g k
g-1
N1 N2 N3 N4
pods pods pods leaves leaves leaves
Figure 3. Mean of Cl- content (mg kg-1, DW) of bean pods and leaves as influenced by N and S
rates. For interpretation of treatments see Table 1.
Table 2. Summary of ANOVA (F-test) for different source of variance
NO3- (mg kg-1) Source of
variation leaves pods
significance LSD5% significance LSD5%
N doses ***(+) 166.8 ***(+) 248.1
S doses **(-) 144.4 n.s. -
SO42- (mg kg-1)
significance LSD5% significance LSD5%
N doses **(+) 281.2 ***(+) 159.1
S doses ***(+) 243.5 ***(+) 137.8
Cl- (mg kg-1)
significance LSD5% significance LSD5%
N doses ***(-) 262.1 *** (-) 209.3
S doses ***(-) 227.0 *** (-) 181.3
n.s.:non-significant; ***:significant at P<0.1%; **:significant at P<1%;
(+): increasing effect; (-) decreasing effect
Concentration of NO3- in leaves was higher than in pods of bean. The same observation
was made by Ira Stancheva et al. (2004), namely, in vegetable plants the NO3- is
accumulated mainly in the leaves. NO3- content of leaves and pods were found to
significantly increase with N fertilization on averages from 1046 to 1428 mg kg-1
(DW)
and from 149.5 to 772 mg kg-1
(DW), respectively. Increasing effect of N was more
effective on NO3- content of pods, rather than of leaves. The application of high S rates
reduced NO3- concentration of leaves, possibly due to an antagonism between SO4
2- and

Vol. 37, 2009, Suppl. Cereal Research Communications
136
NO3-. This supposition is consistent with that reported by Ruiz et al. (2005). The highest
NO3- values of leaves were measured at N4S2, while the lowest ones were at N1S3
treatments. In pods the highest NO3- were found in N4S1 and the lowest values in N1S2
treatments. At N4S1 treatment the NO3- content of pods has reached the leaves NO3
- but
did not exceed the maximum acceptable limit for vegetables (4500 mg kg-1
NO3- FW).
The SO42-
contents of leaves in all cases were higher than measured values in pods. The
highest N doses caused growing accumulation of SO42-
in plant. Inreasing effect of N
was more effective on SO42-
content of pods rather than of leaves. Increments of S doses
also increased the SO42-
content of pods and leaves. The highest SO42-
accumulation of
leaves and pods were measured in N4S3 treatment.
The Cl- contents of leaves were also higher than measured values in pods. With
increasing soil N treatments Cl- concentration both in pods and in leaves decreased
significantly. Increase of S doses also decreased Cl- content of plant. Decreasing effect
of S rates on Cl- values was more effective in leaves, than in pods. Therefore the pod Cl
-
content to leave Cl- content ratio increased with increasing S rates.
Conclusions
- Concentration of NO3-, SO4
2- and Cl
- ions were higher in leaves than in pods.
- Increment of N doses resulted in the accumulation of NO3- and SO4
2- ions in plant.
Inreasing effect of N was more effective on NO3- and SO4
2- concentrations in pods
rather than in leaves. On the contrary, increment of N doses resulted in the decrease
of Cl- content both in leaves and in pods.
- Higher S doses reduced the Cl- and NO3
- concentration, while increased the SO4
2-
values of plant tissues.
According to our results different rates of N and S fertilizers have influenced the quality
of bean and the distribution and accumulation of anions inside of bean-plant.
References
Balláné, K. A. - Loch, J.: 2004. Néhány anion ionkromatográfiás meghatározása talaj- és növénymintákban,
Agrokémia és Talajtan 53. (3-4) 391-400.
Boskovic-Rakocevic, L. and Pavlovic, R.: 2007. Nitrogen fertilization influences on nitrate contents in
spinach. Cereal Research Communication 35. 2. 289-292.
El-Kramany, M. F. – Bahr, A. A. – Gomaa, A. M.: 2001. Response of a local and some exotic mungbean
varieties to bio-and mineral fertilization. Acta Agronomica Hungarica, Vol. 49, 3. 251-259.
Giczi, Zs. – Kalocsai, R. – Schmidt, R. – Szakál, P.: 2006. The effect of N, P, K fertilisation and bacterial
inoculation on the oxidation of elemental sulphur in Danube alluvial soil Cereal Research
Communication, Vol: 34, 1. 187.-190.
Graham, P.H. - Ranalli, P.: 1997. Common bean (Phaseolus vulgaris L.). Field Crops Research 53, 131-146.
Khurana, M. P. S. – Bansal, R. L.: 2007. Sulphur management in moong ( Phaseolus aureus L.) and raya (
Brassica juncea L.) crops Acta Agronomica Hungarica Vol. 55, 4. 437-445.
Nádasy, E. – Nádasy, M.: 2006. Some harmful or useful environmental effect of nitrogen fertilizers Cereal
Research Communication, 34. 1. 49-52.
Ruiz, JM; Rivero, RM; Romero, L.: 2005. Regulation of nitrogen assimilation by sulphur in bean. Journal in
Plant Nutrition Vol: 28, 7 1163-1174. Sánchez, E. – Rivero, R. M. – Ruiz, J. M.- Romero, L.: 2004. Changes in biomass, enzymatic activity and
protein concentration in roots and leaves of green bean plants (Phaseolus vulgaris L. cv. Strike) under
hogh NH4NO3 application rates.Scientia Horticulturae 99. 237-248.
Stancheva, I – Mitov, I. – Petkova, Z.: 2004. Effects of different nitrogen fertilizer sources on the yield, nitrate
content and other physiological parameters in garden beans. Environmental and Experimental Botany,
Vol. 52, Issue 3, December 2004, Pages 277-282.

VIII. Alps-Adria Scientific Workshop Neum, Bosnia-Herzegovina, 2009
DOI: 10.1556/CRC.37.2009.Suppl.2 137
INVESIGATIONS OF P-Zn IONANTAGONISM, AS A STRESS WITH YOUNG MAIZE PLANTS
Zoltán GYİRI 1 – Diána UNGAI
1 Institute of Food Science, Quality Assurance and Microbiology, Faculty of Agricultural Science, University
of Debrecen Centre of Agricultural Sciences and Engineering, 138. Böszörményi street, Debrecen, Hungary,
H-4032, e-mail: [email protected]
Abstract: It is known from literature (Olson et al., 1965, Tisdale and Nelson, 1966) that some species and
hybrids of maize are sensitive to the deficiency of certain microelements (especially Zinc and Copper)
appearing in the early phenological phase (3-leaves, 5-7-leaves stage) as chlorosis, which is enhanced by the
fact that in the case of these phases temperature (heat stress) is lower than average. As a result of these effects
these individuals grow slower and have difficulties in catching the ones free from microelement deficiency.
Concerning microelements this effect appears as lower Zinc and Copper content caused by the over supply of
available Phosphorus (P-Zn stress). Under adverse conditions this Phosphorus–Zinc antagonism causes not
only loss in yield but changes in amino-acid composition and lower ratio of tryptophan as compared with
normal individuals. It is very difficult to prevent the maize crop in the phenological phase 3-5 leaves from the
cold stress and the deficiency of Zinc supply. In addition we can not influence the weather of this period, but
we can prevent the inhibition of the Zinc uptake (Phosphorus stress). Reducing and ceasing this
disadvantageous effect in early phenophases of maize is difficult since leaf area is small thus spraying
fertilisation is not efficient enough, even if only rows are treated, besides placing of Zinc manure into the soil
also can be complicated. In model and small-plot experiments tests and investigations were carried out with
Zinc compounds placing into the soil and fertilisers of different complex stability and thus of different ligand
systems (mono- and poliligands). In these observations we analysed plants in different phenophases including
harvesting stage.
Keywords: zinc, chelates, foliar fertilization, soil fertilization, leaf analysis, P-Zn stress
Introduction
Various amounts of nutrients are added to the soil by regular NPK fertilization
complying with advisory services. Utilization (bioavailability) of these can be different
and is influenced by factors based on the interactions of elements (Schmidt and Szakál,
2007, Schmidt et al., 2008). One of the strongest manifestation of these interactions is
inhibition of zinc uptake induced by phosphorus (P-Zn stress), that has an economic
importance concerning plants sensitive to them (maize, pea). In this case the assurance
of appropriate yield amount is prior to quality. In our experiments we focused on how
plants can be got through the inhibition in growth caused by stress. Therefore small pot
and field experiments were carried out with different products for microelement
supplying. Soil and plant samples were analyzed by ICP-OES. We have found that the
effect depends on the chemical characteristics of products, time and way of application
notably. Zn supplying into the soil proved to be the most efficient method to avoid P-Zn
stress of maize at 3-5-leaves stage.
Materials and methods
According to the literature (Kádár and Pusztai, 1982, Kádár and Shalaby, 1986) P-Zn
stress is considerable in calcareous chernozem with great concentration of biologically
available phosphorus (AL-soluble). Our experiments were carried out under laboratory,
small pot and field conditions using this type of soil. We determined chemical
properties (pH, chemical stability constant of the metal and ligand and dependence of

Vol. 37, 2009, Suppl. Cereal Research Communications
138
these on temperature and pH) of applied microelement fertilizers (Gyıri and Mátz,
1979, Gyıri and Varró, 1987). Soil used in small pot had the following properties:
medium nitrogen and phosphorus supply, high potassium content, 2.8-3 % humus
content, 0.14-0.18 % total nitrogen, AL-P2O5=130-200 mg kg-1
, AL-K2O=240-280 mg
kg-1
), pH (KCl)=6.2, plasticity number: 43, zinc content: 0.262 mg kg-1
0.01 M CaCl2-
soluble, 2.390 mg kg-1
AL-soluble, 350 mg kg-1
0.1 M KCl+0.5 M EDTA soluble, 3.40
mg kg-1
Lakanen-Erviö soluble 70.5 mg kg-1
after cc. HNO3+H2O2 digestion. The soil of
field experiments (Békés county, calcareous chernozem) contained 250 and 400 mg/kg
AL-soluble P2O5. Small pot experiments were performed in Mitscherlich type dishes.
Whole plant samples were collected at 3-5-leaves stage, 10-leaves stage, the leaf
opposite to the maize cob was collected at blooming in field experiments . The whole
plant was analyzed at harvesting. Element content and yield were studied. The results
of 3-5-leaves and 10-leaves stage samples are presented in this report. The whole young
plants were collected and after cleaning with distilled water parts above and under the
soil (shoots and roots) were separated . They were dried on 105 ºC to constant weight,
ground by Retsch SK1 grinder applying sieve of 1mm. Sample preparation for ICP
analysis was carried out according to Kovács et al. (1996, 2000). Soil analysis with
different extractants were performed by ICP-OES (Gyıri, 1998).
Results and discussion
The efficiency of the different microelement-products depends on several factors, like
chemical characteristic, amount of applied agent, time of application, main conditions of
element-uptake or macro- and microelement content of soil, species/hybrid being
sensitive to element-uptake stress. Most of the products recommended making up the
shortfall of microelements, form metal-ligand systems with different nutrient-uptake
possibilities. Based on our experiment, the following order of ions have been
established for the main microelements concerning complex formation facility with
generally applied ligands: Fe >> Cu >> Zn > Mn. The metal ion binding capability of
EDTA type ligands seems to be the highest comparing to the other type ligands or
ligand-pairs that are commercially available. Efficiency of products applying on leaves
depends partly on their chemical characteristic, partly on the proportion of sprayed
material and the amount on the leaves of plants. It is influenced by the different
diffusion speed of metals and ligands in plant tissues. In our comprehensive experiment
series with various products offered for microelement supply, mainly the effect of the
foliar fertilization was examined. In the experiment 10 treatments were applied in 4
replications, at 10-leaves-stage. Different zinc ligand and/or pair of ligands systems
(glycine-citric acid, EDTA, citric acid-acetic acid, dimethyl-glycine derivative,
carbamid derivative, citric acid-tartaric acid, amino acids), where used, the foliar zinc
dose was equal. Only one treatment resulted significant increase in yield (13.02 t ha-1
–
control and 14.44 02 t ha-1
10 l ha-1
Folisol maize). Since adaptation of foliar
fertilization into technology at later phenological phases is difficult, if it is possible
another method has to be chosen to cease element-uptake stress. Getting microelement
fertilizer onto the topsoil at a steady pace can be one possibility, however, we decided to
get element(s) being at minimum level due to ion-antagonism during uptake close to the
grain sown on ground. There are several products for this purpose, eg. metal-ammonium

VIII. Alps-Adria Scientific Workshop Neum, Bosnia-Herzegovina, 2009
DOI: 10.1556/CRC.37.2009.Suppl.2 139
salts besides all of the agents that do not bind irreversibly to the soil and do not inhibit
germination. Zinc-content of three hybrids are shown in Table 1 (shoots and roots
separately) after addition of different levels of microelement into the soil. According to
the results 300 mg of zinc or more raised the zinc-content of shoot significantly in each
hybrid (Carla, P3732, Pannonia), while zinc-content of root increased remarkably in the
case Carla and Pannonia. Increase of zinc –content in the root of Pannonia is so
significant that it refers to sensitivity to P-Zn. After that we decided to set field
experiments where visible symptoms of P-Zn stress were observed and temperature was
low after emergence. Three plots were chosen, where Pannonia hybrid was sown by
hand. Zinc-content of samples collected in 3-5- and 10-leaves-stages can be seen in
Table 3. Data show different effect depending on the soil and its element-uptake
conditions. In some cases there is not significant difference between zinc-content of
control and treated plants but roots show remarkable growth. In other cases treatments
resulted in detectable increase of zinc-content in both phenophases. That’s why zinc-
uptake stress caused by P-Zn antagonism at early 3-5-leaves-stage of maize is so
important. To avoid it is rather difficult even in case of applying foliar fertilizers,
because it is not effective enough due to the relatively small leaf area and or the small
root surface area.
Table 1. Small pot experiment (1990), zinc content of maize at 5-leaves-stage (mg kg-1)
Carla P 3732 Pannónia Treatment shoot root shoot root shoot root Control (distilled water) 21.2 17.1 22.3 20.0 22.7 17.1
12.5 mg Zn 22.0 17.4 22.5 19.8 21.8 17.5
50 mg Zn 25.0 17.0 22.0 20.4 22.6 17.7
100 mg Zn 24.5 18.2 22.0 23.0 22.8 20.8
200 mg Zn 26.0 19.3 24.5 24.6 23.0 19.6
300 mg Zn 29.3 22.2 27.7 25.8 23.4 23.8
400 mg Zn 32.8 24.0 27.6 26.7 26.5 30.0
500 mg Zn 30.7 27.3 28.9 294 25.2 28.4
600 mg Zn 33.0 22.0 28.0 26.9 26.5 27.6
LSD5% 5.9* 4.9* 4.2* 13.0 2.8* 6.8*
Carrying out the experiment with other hybrids applying two levels of zinc we can
observe very different reactions of hybrids. Dose of 400 mg kg-1 caused the highest
increase in P3475 hybrid, while P3901 didn’t react to the treatment at 3-5-leaves-stage
(Table 2). Although, effects were considerably slighter at 10-leaves-stage zinc content
of leaves increased in every examined hybrid.
Table 2. Results of microelement dressing experiment, zinc content of different hybrids of maize(mg kg-1)
P3732 RSC
P3901 SC
P3737 SC
P3475 SC
Mean Deviation %
Treatments 3-5-leaves-stage Control 18.8 24.7 27.0 22.8 23.33 100
400 mg kg-1 Zn 20.3 21.1 37.9 37.3 29.15 125
200 mg kg-1 Zn 19.8 19.0 32.0 26.7 24.38 105
10-leaves-stage
Control 20.0 22.3 24.3 17.5 21.03 100
400 mg kg-1 Zn 24.0 25.0 25.0 18.0 23.0 109
200 mg kg-1 Zn 26.0 18.0 23.0 20.0 21.75 103

Vol. 37, 2009, Suppl. Cereal Research Communications
140
Table 3. Zn content of Pannonia hybrid from field trials (mg kg-1)
Zn 5 leaves-stage
Field trials
Treatments shoot LSD5% root LSD5%
Control 18.0 29.0 1
400 mg kg-1 Zn 20.7 2.06
35.5 3.57
Control 18.9 26.2 2
400 mg kg-1 Zn 27.0 3.35
31.3 5.80
Control 19.2 23.7 3
400 mg kg-1 Zn 25.4 3.37
28.4 4.10
10 leaves-stage
Field trials
Treatments shoot LSD5% root LSD5%
16.0 18.0
400 mg kg-1 Zn 17.0 2.53
35.0 5.99
Control 18.5 18.1 2
400 mg kg-1 Zn 23.5 1.65
33.8 5.85
Control 16.0 26.9 3
400 mg kg-1 Zn 26.0 4.66
28.8 4.20
Conclusions
Comparing our data to data from literature we can state, that less than 20 mg kg-1
zinc
content is qualified as low or medium (Csathó and Árendás, 2009) and according to our
method it grew to 20-30 mg kg-1
at 5-leaves-stage. This intervention can cease P-Zn
stress in maize in early phenophases when visual symptoms (chlorotic leaves) can be
observed and the plant avoids it in later phenophases. This favourable effect could lead
to 3-10 % increase in yield.
References
Gyıri, D. – Mátz, G.: 1979. Changes in the zinc and tryptophan contents of maize grains as a response to
increasing rates of phosphorus fertilization. Acta Agric. Acad. Sci. Hung. 28. 1-2. 158-167.
Gyıri, Z. – Varró, T.: 1987. Study of transport processes in maize leaf by radioabsorption. Int.
Agrophysics.3.4.353-359.
Gyıri, Z. 1998.: A termesztési tényezık hatása egyes gabonafélék és maghüvelyesek minıségére. MTA
Doktori Értekezés. Agrártudományi Egyetem. Debrecen.
Csathó, P. – Árendás, T.: 2009. A foszfor indukálta cinkhiány orvoslása levéltrágyázással. Agrofórum Extra.
27. 60-62.
Kádár, I. – Pusztai, A.: 1982. Az NPK túltrágyázás hatása a 6 leveles kukorica makro- és mikroelem-
tartalmára II. Növénytermelés. 31:6. 523-531.
Kádár, I. – Shalaby, M. H.: 1986. A P és Zn trágyázás közötti összefüggések vizsgálata meszes csernozjom
talajon. Növénytermelés 35:419-425.
Kovács,B.–Gyıri,Z.–Prokisch,J.–Loch,J.–Dániel,P.:1996. A study of plant sample preparation and inductively
coupled plasma emission spectrometry parameters. Comm. in Soil Sci. and Plant Anal.27,1177-1198.
Kovács, B. – Prokisch, J. – Gyıri, Z. – Balla, A. – Kovács, A. – Palencsár, J.: 2000. Studies on soil sample
preparation for inductively coupled plasma atomic emission spectrometry analysis. Communications in
Soil Science and Plant Analysis, 31, 1949-1963.
Olson, R. A. – Stukenholtz, D. D. – Hooker, C. A.:1965. Phosphorus-Zinc relations in corn and sorghum
production. Better Crops with Plant Food, 49. 1. 19-24.
Schmidt, R. – Szakál, P.: 2007. Zn fertilisation of wheat higher protein, lower carbohydrate content. Cereal
Research Communications. 35: 2. 1041-1045.
Schmidt, R. – Szakál, P. – Barkóczi, M. – Matus, L.: 2008. Controlled supply of nutrients, microelements
provided by ion exchanged sythesised zeolite. Cereal Research Communications. 36. 1919-1923.
Tisdale, S. L. – Nelson, W. L.: 1966. A talaj termékenysége és a trágyázás. Mezıgazdasági Kiadó, Budapest.

VIII. Alps-Adria Scientific Workshop Neum, Bosnia-Herzegovina, 2009
DOI: 10.1556/CRC.37.2009.Suppl.2 141
CHARACTERIZATION OF PLANT STRESS SYNDROME BY SOME CORRELATIONS OF BIOCHEMICAL VARIABLES
Zsolt István NÉMETH 1*
– Mónika POZSGAI-HARSÁNYI 1– Éva STEFANOVITS-
BÁNYAI 2– Éva SÁRDI
3
1 Department of Chemistry, Faculty of Forest Science, University of West Hungary, Sopron, Hungary,
H-9400, P O Box 132, e-mail: [email protected] 2 Department of Applied Chemistry, Faculty of Food Science, Corvinus University of Budapest, Hungary 3 Department of Genetics and Plant Breeding, Faculty of Horticultural Science, Corvinus University of
Budapest, Hungary
Abstract: Manifestations of plant stress syndromes have been tracked by the regressions of enzyme activities
and metabolite concentrations, respectively. Maintaining the linear character of the regressions, the stress has
been established to induce significant alterations in the parameters of the regression. With application of
covariance analysis (ANCOVA), significant deviations or identities can be interpreted between the
physiological states symbolized by state dependent regressions. Since covariance analysis is able to avoid the
breaking effect of standard deviation on comparability of individual variables, it is possible to detect
physiological state alteration in a much more sensitive manner by comparing the linear correlations of the
variables.
Keywords: enzyme correlation, state dependent correlation, peroxidase, polyphenol oxidase, quaternary
ammonium compound
Introduction
In recent investigations of plant stress the authors more and more characterize the
syndromes by correlations of some stress sensitive variables, too (Janda et al. 2008,
Pourdad 2008, Lepeduš et al. 2008, Osipova et al. 2007, Polišenská et al. 2007).
Therefore, the origin of stress sensitive correlations has been subject to a recent model
investigation (Németh et al. 2009a). It has been supported that physical meanings can be
related to the regression straight lines representing these correlations. The correlations
belonging to concrete sampling times provide some information about specific
physiological states, thus they are considered as state dependent correlations (Németh et
al. 2009a). The parameters of state dependent regression (slope, intercept, coefficient of
determination) can change in time if the variables are susceptible to the alteration of
physiological state. It makes a possibility to track the plant stress syndrome with the
correlations of biochemical variables. On executing the investigations dominated by
correlative standpoint, the sampling states of plant stress are characterized by linear
regressions of some biochemical variables. Among these state dependent regressions
statistical identity or deviation are established by using covariance analysis whose
detailed application is shown in another recent paper (Németh et al. 2009b).
Materials and methods
Plants. Pendunculate oak tree and seedling (Németh et al, 2009a), water melon (Sárdi
and Tyihák 1998), European pear (Pyrus communis L. ‘Alexander Lucas’).
Analitical methods. Sample preparation: 300 mg plant powdered in liquid nitrogen/ 800
µl of methanol : H2O, 80:20, v/v, centrifugation at 1500 g, 10 min, 4 OC; OPLC
separation of carbohydrates, Stationary phases and eluent: TLC and HPTLC silica 60
F254 (Merck Co.), ACN: H2O (85:15, v/v); Staining: aniline - diphenyl amine -
phosphoric acid, λ =540 nm; OPLC separation of choline and TML: OPLC silica gel 80

Vol. 37, 2009, Suppl. Cereal Research Communications
142
F 254, i-propanol-methanol-0.1 M sodium acetate (20:3:30 v/v), Dragendorff reagent,
525 nm (Sárdi and Tyihák 1998). Extraction of enzymes. 1.2 g plant samples / 15 ml K-
Na-phosphate buffer (pH = 6.0), 4oC, 20 min at 6000 rpm, 10 min. Protein
determination: Bradford’s method (1976). Assay (POD). Reaction mixture: 1.7 ml
buffer (pH=6.0), 30 µl of 0.3 % H2O2, 20 µl o-dianizidine, 10-20 µl extract, 480 nm, 1
Unit = 0.01 absorbance unit·min-1
. Assay (PPO): 1 ml buffer (pH=6.0), 1 ml (0.2 M)
catechol, 0.5 ml extract, 420 nm, 1 Unit = 0.001 absorbance unit·min-1
.
Results and discussion
Consider three plant physiological states (I. – III.) deviating from each other in
significant manner that are characterized by linear correlations of variables x1 and x2 (Figures 1a and 1b).
Figure 1a. State dependent regressions in various Figure 1b. State dependent regressions in various
physiological states with centre point correlation. physiological states without centre point correlation.
Let the values of x1 and x2 be the results of independent parallel measurements that can,
for example, originate from the foliage of some plant. Moreover, let the values of
variables x1 and x2 characterize the leaves sampled by chance. If the priority or
importance is only given to the means and the confidence intervals of the results x1 and
x2 at describing the physiological state then physiological states will only be represented
in the coordinate system of x1 and x2 as the centre points determined by the means of x1
and x2. The confidence domains will be determined by confidence ellipses. These centre
point with confidence ellipses have provided no information about the existence of state
dependent correlations or regressions. In this case, possibility can only be made to
correlative investigation among centre points of data sets. Of course, there may be a
linear correlation among them (Figure 1a) whose significant deviation from those ones
of state dependent correlations will be undetectable. Moreover, the absence of
correlation among centre points do not preclude the existence of state dependent
correlations either (Figure 1b). In the next our conception is supported by exhibiting a
few examples. In Figure 2 carbohydrate contents of leaves of European pear tree, which
indicate the states of drought induced by various Carbowax treatments (0, 2, 5, 7 and
10%) of pear shoots, are depicted. The points in the coordinate system are centre points
of measurements since the blending of leaf samples could integrate the deviations
resulting from the foliage. The total carbohydrate content (the sum of concentrations of

VIII. Alps-Adria Scientific Workshop Neum, Bosnia-Herzegovina, 2009
DOI: 10.1556/CRC.37.2009.Suppl.2 143
glucose, fructose, sucrose, galactose and maltose) linearly correlates to the glucose
concentration. This correlation is a kind of centre point correlation. The decrease of
metabolic intensity relating to drought stress can also be detected in the decrease of
carbohydrate contents along the linear relationship.
Figure 2. Effect of Carbowax treatment on carbohy- Figure 3. Effect of Fusarium infection on choline
drate content in European pear tree leaf. and TML levels in various water melon tissues.
The data of Figure 3 derive from Sárdi (Sárdi 1994, Sárdi and Tyihák 1998). Time
domain responses of water melon varieties infected by Fusarium oxysporum, the alarm
phase of this biotic stress can be tracked by the measurements of concentrations of some
quaternary ammonium compounds. Among the means of choline and Nε-trimethyl-
lysine (TML) there is a linear correlation (Figure 3). Periodic alterations of their
amounts within alarm phase are highlighted with the ranks of correlation points in time.
At first, the average data pairs of choline and TML shift to the directions of lower
values and later they return to the higher range along the regression straight lines. This
linear regression can reflect synchronic regulation of these two variables in the
metabolism. Figure 4 contains the results of draining investigation of Pendunculate oak
seedlings.
Figure 4. Characterization of drought stress of oak Figure 5. Characterization of interruption of
seedling with PPO-POD correlation. nutrient intake with PPO-POD correlation.
The process of desiccation was characterized by resultant oxidative activities of
peroxidase (POD) and polyphenol oxidase (PPO) isoenzymes, respectively. The

Vol. 37, 2009, Suppl. Cereal Research Communications
144
sampling states produced state dependent regressions that can be distinguished from
each other by ANCOVA method. In this case the centre points of these regression
straight lines do not create linear correlation. During manifestation of drought the centre
points move to lower values. The slope of state dependent regression decreases towards
the apoptosis. The decrease of coefficient of determination (r2) reflects the disturbance
of metabolic regulation (Németh et al. 2009a). This phenomenon also appeared in
another model investigation of a specific plant stress (see. Figure 5). To model the
interruption of nutrient intake a Pendunculate oak branch with more than sixty leaves
were cut off and put into a bottle of water and after the POD and PPO activities of five
or six leaves were measured. In this experiment such state dependent regressions were
experienced that had various slopes, intercepts and coefficients of determination and
whose centre points provided linear relationship with a very good fitting.
Conclusions
With respect to the evaluation of means and confidence intervals of biochemical
variables, investigation of the correlations can supply more information about plant
stress effects. In the case of classical statistical characterization this extra information in
the analytical results remains hidden. State dependent correlations can be considered as
the indicators of metabolic regulation.
Acknowledgements
This work was supported by a grant from the Hungarian Scientific Research Fund
(OTKA, No T 046408) and it is also an important part of a HAS’s Bolyai scholarship
research.
References
Bradford M. M.: 1976. A rapid and sensitive method for the quantisation of microgram quantities of protein
utilising the principle of protein-dye binding. Analitical Biochemistry, 72: 248-257.
Janda, T., Cséplı, M., Németh, Cs., Vida, Gy., Pogány, M., Szalai, G., Veisz O.: 2008. Combined effect of
water stress and infection with the necrotrophic fungal pathogen Drechslera tritici-repentis on growth and
antioxidant activity in wheat. Cereal Research Communications 36: 1, 53-64.
Lepeduš, H., Fulgosi, H., Benšić, M., Cesar V.: 2008. Efficiency of the photosynthetic apparatus in
developing needles of Norway spruce ( Picea abies L. Karst.). Acta Biologica Hungarica 59: 2, 217-232.
Németh, Zs. I., Sárdi, É., Stefanovits-Bányai É.: 2009a. State dependent correlations of biochemical variables
in plants. Journal of Chemometrics 23: (in press).
Németh, Zs.I., Pozsgai-Harsányi, M., Gálos, B., Albert, L.: 2009b. Stress sensitivity of correlation between
oxidative activities in plants. Acta Silvatica et Lignaria Hungarica 5: (in press), (http://aslh.nyme.hu).
Osipova, S., Permyakov, A., Mitrofanova, T., Trufanov, V., Ermakova, M., Chistyakova, A..,
Pshenichnikova T.: 2007. GSH-dependent proteindisulphide oxidoreductase of wheat grain: Activity in
maturing wheat kernels, and relationship with rheological properties of dough. Cereal Research
Communications 35: 3, 1477-1486.
Polišenská, I., Tvarůžek, L.: 2007. Relationships between deoxynivalenol content, presence of kernels
infected by Fusarium spp. pathogens and visually scabby kernels in Czech wheat in 2003–2005. Cereal
Research Communications 35: 3, 1437-1448.
Pourdad, S. S.: 2008. Study on drought resistance indices in spring safflower. Acta Agronomica Hungarica
56: 2, 203-212.
Sárdi, É.: 1994. The study of formaldehyde and its generators on water melon plants infected with Fusarium oxysporum f. sp. niveum. Ph D Thesis. Faculty of Horticultural Industry, University of Horticultural and
Food Industry, Budapest, Hungary.
Sárdi, É., Tyihák, E.: 1998. Change of biotransformation steps of formaldehyde cycle in water-melon plants
after infection with Fusarium oxysporum. Acta Biologica Hungarica, 49: 2-4, 353-362.

VIII. Alps-Adria Scientific Workshop Neum, Bosnia-Herzegovina, 2009
DOI: 10.1556/CRC.37.2009.Suppl.2 145
STUDY OF THE EFFECT OF LIMITING PRODUCTION FACTORS – HYBRID, NUTRIENT-SUPPLY LEVEL AND IRRIGATION – ON THE YIELD AND STARCH-CONTENT OF MAIZE (Zea Mays L.)
Marianna SIPOS1 – Ida KINCSES
1 – Emese BERTA SZABÓ
1
1 Department of Agricultural Chemistry and Soil Science, Faculty of Agricultural Science, University of
Debrecen, H-4032 Debrecen, Böszörményi út 138., e-mail: msipos@ agr.unideb.hu
Abstract: In sense of optimization of site-specific nutrient-supply we studied the effect and interactions
between hybrid, nutrient-supply and irrigation on the yield, starch-content and starch-yield within the confines
of a long-term field experiment at Debrecen-Látókép. We found that the yield and the starch-content was
optimal on a nutrient-level 120 : 92 : 108 kg ha-1 N : P2O5 : K2O, further inputs don’t result in significant
increment. The yield was affected by all three production factors, while starch-content depended on irrigation
and nutrient-supply. As a consequence starch-yield was also affected by all three studied factors. We
concluded that it’s reasonable to choose inputs in accordance to the production site and the purpose.
Keywords: maize, yield, starch-content, starch-yield, nutrient-supply, hybrid, irrigation, field experiment
Introduction
Yield of plants is primarily determined by the effects and interactions between genotype
of plants as well as agrotechnical and ecological elements (Kreuz, 1977; Megyes et al.,
2005; Kátai et al., 2006, Pepó et al., 2007). Production factors such as nutrient- and
water-supply have a great impact on the yield amount and quality of plants (Vágó,
2008; Balláné et al., 2008; Nagy et al., 2008).
In sense of site-specific nutrient-supply and the purpose of production we have to adapt
to the given site by choosing the appropriate plant, nutrient- and water-supply and
technology. Berzsenyi – Dang (2008) stated that hybrids with longer vegetation period
produced higher grain yield. The dry matter accumulation is decreasing by plants with
N-deficiency (Huzsvai – Nagy, 2003), while growing fertilization dosages (Izsáki,
2007) especially N-fertilization increases the yield (Berzsenyi – Dang, 2008).
Kiss – Andorkó (2008) also observed the highest starch content in the unfertilized
treatments, while parallel to the growing fertilization it decreased. Under humid
conditions a higher amount of starch incorporates into the grain that leads to higher
yields (Hegyi et al., 2007).
Materials and methods
Within the confines of a long-term field experiment in Debrecen-Látókép we studied the
effect and interactions between nutrient-supply, hybrid and irrigation on the yield and
starch-content of maize. Our aim was to find out and optimize the site-specific nutrient-
supply for the starch-based use of these hybrids of different FAO maturity groups.
The soil of the experiment represents the soils of the region: it’s a calcareous chernozem
based on loess, with good fertility. The experiment was set up on a slightly acidic loamy
soil with a middle plasticity. For its cultivation the upper 30 cm layer is leached.
We studied the hybrids with different long vegetation periods: Mv 251 (FAO 280),
Mv Koppány (FAO 420) and Mv 500 (FAO 510). We tried to reveal whether the yield
and starch-content depend on the maturity group of hybrids.

Vol. 37, 2009, Suppl. Cereal Research Communications
146
Nutrient-supply was applied in 6 dosages with a fix 1.0 : 0.75 : 0.88 N : P2O5 : K2O rate.
Besides control treatments ranged from 30 : 23 : 27 to 150 : 115 : 135 kg ha-1
N : P2O5 : K2O active substance.
The half of the experimental area can be irrigated by linear irrigation system. It has to
be noted that from the aspect of distribution of precipitation the year 2008 was optimal,
so there was no need to apply any additional water-amount. Still it is reasonable to
investigate both irrigated and not irrigated combinations to reveal the long-term effect
of irrigation. On the other half of the experimental area plants use only water input from
precipitation.
We measured the yield per each treatment and the starch content of grain in year 2008 at
an average moisture content of 14%. We analysed our results statistically by a 3-way
ANOVA using the software developed by Tolner (2008).
Results and discussion
Regarding the yield (t ha-1
) results it can be stated that in the year 2008 it was
determined by all 3 plant production factors: nutrient-supply, irrigation and hybrid at
P = 0.1 % significance level. The interaction between the nutrient-supply and the hybrid
was also significant at P = 1.0 %. Therefore all 3 factors– in lack of – are potential
stress factors. The yield amounts – depending on the hybrid and the nutrient-supply
levels – are shown in Figure 1.
The hybrid Mv 251 produced yield at a range from 4.89 (control treatment) to
10.57 t ha-1
(highest nutrient-level: 150 kg ha-1
N, 115 kg ha-1
P2O5 and 135 kg ha-1
K2O). Parallel to the growing nutrient levels the yield showed a growing tendency, still
there was no difference between the two highest dosages; therefore in sense of the site-
specific nutrient-supply it’s reasonable to apply lower dosage without any loss of yield.
The yield of Mv Koppány was significantly higher than that of Mv 251 in all treatment
combinations. The yield ranged from 7.6 to 12.1 t ha-1
. The higher nutrient dosage was
applied, the higher yield was measured, still there could not be revealed a significant
difference between nutrient dosages of closer fertilizer active substance rates
(60 : 46 : 54 kg ha-1
vs. 90 : 69 : 81 kg ha-1
N : P2O5 : K2O, respectively 120 : 92 : 108
vs. 150 : 115 : 135 kg ha-1
N : P2O5 : K2O).
Compared with the two hybrids of shorter vegetation periods it can be stated that the
yield of hybrid Mv 500 was significantly higher than that of Mv 251, but in some
treatments it did not differ from Mv Koppány. It has to be noted, that at lower nutrient-
supply levels Mv Koppány (middle maturity group) produced a higher amount of yield
than Mv 500 (longer maturity group). On a middle nutrient-supply rate there was no
difference between the yields of the two hybrids, still by higher nutrient levels the yield
of Mv 500 was significantly higher. This fact lets us conclude that for the production of
higher yield amount plants need higher nutrient dosages, therefore a high dosage of
fertilizers enable plants to produce the potentially highest yield. The lowest yield
(5.27 t ha-1
) was also measured in the control treatment, while the highest (14.48 t ha-1
)
at a nutrient level 120 : 92 : 108 kg ha-1
N : P2O5 : K2O. In case of all 3 hybrids –
however in different rates – it’s possible that in the control and low nutrient dosages
were the stress factors, because yield didn’t reach the potential rate.

VIII. Alps-Adria Scientific Workshop Neum, Bosnia-Herzegovina, 2009
DOI: 10.1556/CRC.37.2009.Suppl.2 147
The significant effect of irrigation could be observed in all treatments, although there
was no additional water-supply in 2008 (theoretically water supply didn’t mean a direct
stress factor). This effect can be explained by the cumulative effect of irrigation on the
nutrient-amount in the root zone of plants: in the irrigated treatments plant roots took up
more nutrients, so in this year there was a lower plant-available nutrient-amount in those
treatments. Still it would not be reasonable to confirm the long-term effect of irrigation
upon these one-year results.
Figure 1. Yield of maize (t ha-1) depending on the
nutrient-levels and hybrids
Figure 2. Starch-content (%) of maize depending on
the nutrient-levels and hybrids
The starch-content (%) of the yield grain depending on the hybrid and the nutrient-
supply is shown in Figure 2. As the statistical analysis confirmed, it was affected by the
irrigation (P = 5 %) and the nutrient-supply (P = 10 %), it varied between 60.1 and
63.4 %. The maximal starch-content was measured in the control treatment, while
parallel to the growing nutrient-levels it decreased – but not always significantly. The
starch-content of irrigated treatments was higher than of not irrigated ones.
It is also reasonable to investigate the starch-yield (t ha-1
) because it gives us further
information to optimize the starch-based production. The starch-yield of Mv 251 was
the lowest: in the control treatment it produced 3.07, while by 120 : 92 : 108 kg ha-1
N : P2O5 : K2O fertilizer active substance the starch-yield was 6.47 t ha-1
. There was no
difference between the two highest nutrient levels. The starch-yield of Mv Koppány
varied between 3.7 (control) and 8.27 t ha-1
, so it was significantly higher than that of
Mv 251. It is due to its longer vegetation – therefore starch synthesis – period and to the
higher yield. There was no difference between the starch-yield of the 2 highest nutrient
dosages, so it is more reasonable to apply a lower amount of fertilizer. The starch-yield
of Mv 500 ranged from 3.30 to 8.89 t ha-1
. It was definitely higher than Mv 251. But by
lower nutrient levels it stayed under the Mv Koppány, because the amount of nutrients
wasn’t enough for plant development (nutrient stress). However by middle dosages
there was no difference and by higher dosages it was significantly higher. It suggests
that to reach the maximal starch-yield we have to supply the plant’s demand – avoid
firstly nutrient stress – and use higher inputs.
It also has to be noted that the longer vegetation period means a plus risk for plant
production (more stress factors like weather conditions, diseases etc. can reach plants),

Vol. 37, 2009, Suppl. Cereal Research Communications
148
still in many production sites it is worth to take it. Anyway we have to choose
production factors and inputs considering the production site.
Conclusions
Summarizing the yield results it can be stated that beside nutrient-supply the production
of maize strongly depends on the hybrid and additional production factors, such as
irrigation. To avoid stress and the fall-back of the yield it’s reasonable to choose hybrids
and inputs in accordance with the site parameters and the results of previous years.
Choosing a hybrid with a shorter vegetation period the yield will be safe, but lower and
the opposite: a hybrid with longer vegetation period result a higher (starch)-yield but it
needs higher nutrient-input levels and the yield is more exposed to the stress effects
through the year. We also suggest using lower inputs if the yield and starch-yield
increment is not in accordance to the higher input levels. Our results show than both
from the aspect of yield and the starch-content (and -yield) the nutrient dosage
120 : 92 : 108 kg ha-1
N : P2O5 : K2O fertilizer active substance resulted to be optimal.
References
Balláné K. A. – Kremper R. – Vágó I. – Filep T. (2008): Az NH4NO3 mőtrágya és a Phylazonit MC
baktériumtrágya hatása a fejessaláta (Lactuca sativa L.) N, S, NO3- és SO4
2- tartalmának változására. 50th
Jubilee Georgikon Scientific Conference, Keszthely. 148.
Berzsenyi Z. – Dang Q. L. (2006): Effect of crop production factors on the yield and yield stability of maize
(Zea mays L.) hybrids. Acta Agronomica Hungarica. 54. 413-424.
Berzsenyi Z. – Dang Q. L. (2008): Effect of N-fertilization on the growth characteristics of maize (Zea mays L.) hybrids. Cereal Research Communications.36. 1. 211-214.
Huzsvai L. – Nagy J. (2003): A mőtrágyázás hatása a kukorica (Zea mays L.) termésére öntözés nélküli és
öntözéses termesztésben. Növénytermelés. 52. 5. 533-541.
Hegyi Z. – Pók I. – Szıke C. – Pintér J. (2007): Chemical quality parameters of maize hybrids in various FAO
maturity groups as correlated with yield and yield components. Acta Agronomica Hungarica. 55. 2. 217-
225.
Izsáki Z. (2007): N and P impact on the yield of maize in a long-term trial. Cereal Research Communications.
35. 4. 1701-1711.
Kátai J. − Vágó I. − Nagy P.T. − Lukács V. E. (2006): Correlation between the nitrogen content of soil and
element uptake of maize in a pot experiment. Cereal Research Communications. 34. 1. 215-218.
Kiss Cs. – Andorkó I. (2008): Small-plot field experiments with maize hybrids, aiming to study starch-
content. Cereal Research Communications. 36. 3. 1535-1538.
Kreuz E. (1977): Neue Ergebnisse zur Ernährung und zum Wasserhaushalt des Maises. Übersichtsbeitrag.
Arch. Acker- und Pflanzenbau. Bodenk. Berlin. 21. 4. 327-344.
Megyes A. – Nagy J. – Rátonyi T. – Huzsvai L. (2005): Irrigation of maize (Zea mays L.) in relation to
fertilization in a long term field experiment. Acta Agronomica Hungarica. 53. 1. 41-46.
Nagy P. T. – Szabó Z. –Nyéki J. – Soltész M. (2008): Éghajlati anomáliák hatása gyümölcsültetvények
tápanyag-utánpótlására. Klíma-21 Füzetek. 53. 68-75.
Pepó P. – Zsombik L. – Vad A. – Berényi S. – Dóka L. (2007): Agroecological and management factors with
impact on the yield and yield stability of maize (Zea mays L.) in different crop rotation. Analele
Universitatii Oradea, Facultatea de Protectia Mediului. 13. 181-187.
Tolner L. – Füleky Gy. – Aydinalp, C. (2008): Öntözés talajszennyezı hatásának igazolása valódi ismétlést
nem tartalmazó megfigyelési adatok segítségével. VIII. Magyar Biometriai és Biomatematikai
Konferencia. Budapest.
Vágó I. (2008): A talajok tápanyag-gazdálkodása. In: Kátai J. (szerk.): Talajtan, talajökológia. DE AMTC,
Debrecen. 94-104.

VIII. Alps-Adria Scientific Workshop Neum, Bosnia-Herzegovina, 2009
DOI: 10.1556/CRC.37.2009.Suppl.2 149
PRECIPITATION AND TEMPERATURE STRESS IMPACTING WEED-CROP COENOLOGY PERFORMANCE
Ákos TARNAWA 1 – Katalin M. KASSAI
1 – András MÁTÉ
1 – Zsolt SZENTPÉTERY
2
1 Crop Production Institute, Szent István University, H-2103 Páter K. str. 1. Gödöllı, Hungary, e-mail:
[email protected] 2 HAS-SIU Agronomy Research Group, Gödöllı
Abstract: Weed canopy and species composition has been studied in relation with two climatic factors –
precipitation and temperature – in a long term trial. 12 years experimental series of winter wheat and maize
agronomic trials run at the Szent István University’s Nagygombos experimental site have been evaluated
regarding coenological performance of weed-crop interrelation. 28 weed species representing 7 phenological
types (T1, T2, T2-3, T3, T4, G1 and G3) were examined in relation with seasonal precipitation and
temperature prior to their life cycles. Strong correlations were found in cases of various precipitation patterns,
however in some cases precipitation x temperature interactions proved to be significant as well.
Keywords: weed-crop coenology, precipitation, temperature, stress
Introduction
Abiotic stresses are most common means regarding alterations within weed-crop
coenoses. Weed development in a certain agri-environment is highly influenced by
climatic conditions – precipitation and temperature, as well as agronomic applications
(Jolánkai-Birkás, 2007; Jolánkai et al., 2008; Kassai et al., 2006; Láng et al., 2007).
Weed development, canopy and species composition are exposed to several factors.
Most of these are performed in accordance with the phenological type of weeds
(Berzsenyi et al., 2006; Szentpétery et al. 2006; Szentpétery et al 2007; Varga et al.
2007). The present study is dealing with weed-crop performance in relation with
precipitation and temperature induced stresses over a 12 years period in a winter wheat
– maize (Triticum aestivum L. – Zea mays L) long term trial at the Nagygombos
experimental site.
Materials and methods
In long term field trials a wide range winter wheat Triticum aestivum L. varieties and
maize Zea mays L. hybrids were examined under identical agronomic conditions in the
experimental years of 1996-2007. The small plot trials were run at the Nagygombos
experimental field of the SZIU Crop Production Institute. Soil type of the experimental
field is chernozem (calciustoll). Experiments were conducted in split-plot design with
four replications. The size of each plot was 10 m2. Plots were planted and harvested by
plot machines. Various agronomic treatments were applied to plots. Weed control
(furoxipir, bromoxynil, dicamba and MCPA a.i.), the rate and application time of
nitrogen top dressing (ammonium nitrate 0-40-80 kgha-1
in direct and split applications),
fungicides and insecticides (triadimefon, tebukonazol+triadimefon, besultap a.i.) were
applied in single and combined treatments. Coenological performance of weed-crop
interrelation have been evaluated. 28 weed species representing 7 phenological types
(T1, T2, T2-3, T3, T4, G1 and G3) were examined in relation with seasonal
precipitation and temperature prior to their life cycles. Weed canopy records have been

Vol. 37, 2009, Suppl. Cereal Research Communications
150
evaluated over the 12 years period in wheat biculture and maize monoculture cropping
systems respectively.
Results and discussion
Twelve years (1996-2007) herbology and coenology data have been evaluated in favour
of exploring climatic impacts – mainly that of precipitation and temperature records.
Dominant weed species and their phenology are presented in Table 1.
Table 1. Phenological and taxonomic data of dominant weed species
Weed Phenology Species taxonomy
1 AMARE T4 Amaranthus retroflexus
2 AMBEL T4 Ambrosia artemisiifolia
3 BILCO T4 Bilderdykia convolvulus
4 CANSA T4 Cannabis sativa
5 CAPBP T1 Capsella bursa-pastoris
6 CHEAL T4 Chenopodium album
7 CHEHY T4 Chenopodium hibridum
8 CIRAR G3 Cirsium arvense
9 CONAR G3 Convolvulus arvensis
10 CONMA T2 Conium maculatum
11 DESSO T2 Descurainia sophia
12 ECHCG T4 Echinochloa crus-galli
13 FUMSE T3 Fumaria officinalis
14 GALAP T2 Galium aparine
15 HIBTR T4 Hibiscus trionum
16 LACSE T4 Lactuca serriola
17 LAMAM T1 Lamium amplexicaule
18 LATTU G1 Lathyrus tuberosus
19 LEPDR G3 Lepidium draba
20 MATIN T4 Matricaria indora
21 POLAV T4 Polygonum aviculare
22 POLLA T4 Polygonum lapathifolium
23 RAPRA T3 Raphanus raphanistrum
24 SINAR T3 Sinapis arvensis
25 SONOL T4 Sonchus oleraceus
26 STAAN T4 Stachys annua
27 THLAR T2-3 Thlaspi arvense
28 VERHE T1 Veronica hederifolia
Evaluation of the 28 weed species examined has been done in accordance with their
phenological patterns. Correlations were found between weed canopy records and
precipitation and temperature values of certain periods in relation with phenophases or
periods prior to vegetation, and their combinations. Table 2 indicates significant
correlation values and equations.
The results obtained support an evidence, that weed populations have been influenced
by precipitation patterns mainly. The occurence of precipitation has not always been
related to the vegetation period, but more to the phenology pattern of the weed species
examined. Early annual weed populations have been correlated with precipitation in
most cases, however late annuals were affected by temperature values as well. From
among perennial G1 species no correlations were obtained. G3 species were affected by

VIII. Alps-Adria Scientific Workshop Neum, Bosnia-Herzegovina, 2009
DOI: 10.1556/CRC.37.2009.Suppl.2 151
previous to life cycle precipitation and temperature values. Canopies and climatic
interactions have been evaluated, too.
Table 2. Precipitation and temperature impacts on weed phenology groups
phenology Stress factors equations
Spring – winter precipitation y = 66,869x + 68,198
R2 = 0,6247
Summer – winter precipitation y = 39,49x + 67,777
T1
R2 = 0,7105
Spring – winter precipitation y = 56,171x + 62,772
R2 = 0,5669
Summer– spring precipitation y = 1,7486x + 9,1771
T2
R2 = 0,699
Spring – winter precipitation y = 29,173x + 65,955
R2 = 0,6861
Summer – winter precipitation y = 38,312x + 60,766
T2-3
R2 = 0,6762
Summer– previous winter precipitation y = -1,2199x + 0,2112
R2 = 0,7015
Summer – previous winter precipitation X temperature y = -109,9x + 23,993
T3
R2 = 0,7217
Spring – vegetation period precipitation y = 2,9658x + 367,64
R2 = 0,5707
Spring – vegetation period precipitation X temperature y = 23,314x + 3378,7
T4
R2 = 0,5447
G1 ns
Spring – previous autumn precipitation y = 6,4041x + 55,991
R2 = 0,649
Spring – previous autumn precipitation X temperature y = 64,872x + 535,81
G3
R2 = 0,688
Canopy ranking of dominant weed species have been evaluated over the time range of
the study. Figure 1 shows the changes in canopies and their tendencies. It can be stated,
that the originally homogenous coenosys of weed species has been altered by both
monocropping and biculture. Also, there is a notable phenomenon regarding the
decrement of some highly frequented weeds like Echinocloa or Ambrosia species.
Conclusions
Canopy and species composition of dominant weeds has been studied in relation with
two climatic factors – precipitation and temperature – in a long term trial. 12 years
experimental series of winter wheat and maize agronomic trials run at the Nagygombos,
Hungary experimental site have been evaluated regarding coenological performance of
weed-crop interrelation. 28 weed species belonging to seven phenological types (T1,
T2, T2-3, T3, T4, G1 and G3) have been examined in relation with seasonal and prior to
their life cycles values of precipitation and temperature. Strong correlations were found
in cases of various precipitation patterns. Some precipitation x temperature interactions
proved to be significant, mainly in perennial types. Consecutive agronomic applications
in both monocropping and biculture have resulted in elimination of noxious species.

Vol. 37, 2009, Suppl. Cereal Research Communications
152
Triticum aestivum biculture Zea mays monoculture
Changes in canopy ranking of dominant weed species in monoculture and biculture. Nagygombos,1996-2007
0 2 4 6 8 10
VERHE
MATIN
STEME
AMBEL
CIRAR
CHEAL
CONAR
LATTU
1996
2003
2006
0 2 4 6 8 10
MATIN
STEME
BYLDE
THLAS
CIRAR
AMBEL
VIOAR
ECHCG
AMARE
CONAR
CHEAL
CAPBP
1996
2003
2006
Figure 1. Weed species canopy changes over time range of the experiment
Acknowledgements
Authors are indebted regarding the support recieved from NKTH and from the HAS.
References
Berzsenyi Z. – D. Q. Lap: 2006. A növényszám hatásának vizsgálata különbözı tenyészidejő kukorica- (Zea mays L.) hibridek vegetatív és reproduktív szerveinek növekedésére Richards-függvénnyel.
Növénytermelés, 55. 3-4.
Jolánkai M. – Birkás M.: 2007. Global climate change impacts on crop production in Hungary. Agriculturae
Conspectus Scientificus, 72. 1. 17-20.
Jolánkai M. – Nyárai H.F. – Tarnawa Á. – Klupács H. – Farkas I.: 2008. Plant and soil interrelations. Cereal
Research Communications, 36. Suppl. 7-10.
Jolánkai M. – Szentpétery Zs. – Klupács H.: 2007. Precíziós növénytermesztési beavatkozások hatása a búza
(Triticum aestivum L.) és a kukorica (Zea mays L.) termesztésére. XVII. Keszthelyi Növényvédelmi
Fórum, PE Georgikon, Keszthely, 77-81.
Kassai K. – Nyárai H.F. – Jolánkai M. – Szentpétery Zs.: 2006. Investigating nutritional relationship among
weediness, yield and quality of winter wheat. Cereal Research Communications, 34.1. 533-536 pp.;
Láng I. – Csete L. – Jolánkai M. /Eds./: 2007. A globális klímaváltozás: hazai hatások és válaszok. A
VAHAVA Jelentés. Szaktudás Kiadó Ház, Budapest.
Szentpétery Zs. – Kleinheincz Cs. – Tarnawa A. – Jolánkai M.: 2006. Herbicide residues’ changes in wheat
samples in late weed control. Acta Alimentaria, 35. 1. 25-31.
Szentpétery Zs. – Klupács H. – Tarnawa Á. – Jolánkai M.: 2007. Késıi posztemergens gyomirtás hatása az
ıszi búza termésére. Acta Agronomica Óváriensis 49. 2. 539-544.
Varga B. –Svečnjak Z. –Jurković Z. –Pospišil M.: 2007. Quality responses of winter wheat cultivars to
nitrogen and fungicide applications in Croatia. Acta Agronomica Hungarica, 55. 1. 37-48.

VIII. Alps-Adria Scientific Workshop Neum, Bosnia-Herzegovina, 2009
DOI: 10.1556/CRC.37.2009.Suppl.2 153
APPRISE THE SIGNIFICANCE OF GRAPEVINE VIRUSES IN WEST HUNGARY
Eszter CSEH – Ágnes DARAGÓ – András SZERECZ – András TAKÁCS – Richard GÁBORJÁNYI
Plant Protection Institute Georgikon Faculty, University of Pannonia, H-8361 Keszthely, P.O. Box 71,
Hungary, e-mail: [email protected]
Abstract: Leaf samples bearing virus symptoms were collected from different vineyards of West Hungary in
the summer. Samples were analyzed by DAS-ELISA for Grapevine fanleaf virus (GFLV), Arabis mosaic virus (ArMV), Tomato black ring virus (TBRV), Grapevine chrome mosaic virus (GCMV), Grapevine leafroll associated virus 1-3 (GLRaV 1-3) and Grapevine virus A (GVA). Among about fifty samples
eighteen were positive in serological tests. Six proved to be infected by GLRaV-1, one by GLRaV-2, eight by
GLRaV-3. GCMV were found in six cases. ArMV and GFLV occurred once, TBRV in two samples. Complex
infections (GLRV-1 and -3; GCMV and GLRaV-1; GCMV and GLRaV-3; GCMV and ArMV) were detected
in seven occasions. In autumn canes of the same stocks were also collected to isolate the pathogens for further
studies. In the serological assay the different groups of GLRaV proved to be the most abundant virus.
However, according to the symptoms in the vineyards the grapevines degeneration was also important. To
solve this difference the overwintered canes should be checked by woody indexing on indicator grapes species
and by mechanical transmission onto herbaceous plants. The majority of viruses of grapevines are detectable
by ELISA tests, but not all. The occurrence of virus transmitting nematodes will be discussed.
Keywords: virus, grapevine, nematode, ELISA
Introduction
Grapevine productions have serious pathological problems, especially the grapevine
degeneration and the ESCA disease causing the early decline of grape stocks. Some of
them could be solved by the changing of rootstock varieties (Cseh et al., 2006), but the
problem of virus disease remained unsolved (Cseh et al., 2008a). The results of constant
infections are: reduced yield and quality, shortening in productive period, weakening in
rooting of propagation materials, reduction in disease resistance to abiotic and biotic
stressors, and at least the early dieback of grape stocks (Cseh et al, 2008b). The main
object of our study was to collect samples from different vineyards in West Hungary.
Additionally we tried to find correlation between the occurrence of virus diseases and
the presence of virus vector nematodes in the same area.
Materials and methods
Leaf samples showing disease symptoms were collected from different vineyards of the
west Hungarian region in summer and autumn, 2008. Until ELISA test leaf samples
were store for some days on 4 o
C in special plastic bags. Virus content was checked by
DAS ELlSA method using antisera from Agritest S.r.l. (Italy) and Bioreba AG
(Switzerland), Loewe Biochemica (Germany). Substrate absorbances were measured at
405 nm wavelengths on Labsystem Multiscan ELISA reader (Clark and Adams 1977,
Takács et al, 2006a). Samples were considered positive if the absorbance values
exceeded three times those of the healthy controls (Horváth et al, 2007, Takács et al,
2006b). Soil samples infested by nematodes were taken from the upper 5 cm depth
(Nádasy et al, 2000, 2002, 2008). The isolation of nematodes were based on their active

Vol. 37, 2009, Suppl. Cereal Research Communications
154
moving, using “Baermann’s funnel running method” (Seinhorst 1956), and determined
under light microscope.
Results and discussion
Among 45 samples 18 proved to be positive for one virus, and in 7 cases complex
infections were detected. GLRaV-1 have been found in six samples, GLRaV-2 occurred
only one, GLRaV-3 in eight cases. GCMV infection was detected in six samples, ArMV
and GFLV in one case and TBRV in two samples (Table 1.).
Table 1. Occurrence of grapevine infecting viruses in West Hungary
Number Variety Origin Symptoms Virus
1.
Kékfrankos Kıszeg R, Lr
GLRaV-1
GLRaV-3
2. Kékfrankos Kıszeg R, Lr GLRaV-3
3. Kékfrankos Kıszeg R, Lr GLRaV-3
4. Cabernet
sauvignon Balatonboglár Y, ChM
GLRaV-3
5. Cabernet
sauvignon Balatonboglár Y, ChM
GCMV
ArMV
6.
Sauvignon blanc Balatonboglár Ld
GCMV
GLRaV-1
7. Királyleányka Balatonboglár Ld GLRaV-1
8. Juhfark Badacsonytomaj Lr GLRaV-1
9.
Kéknyelő Badacsonytomaj VM
GLRaV-1
GLRaV-3
10. Pinot blanc Badacsonytomaj D, M TBRV
11.
Pinot noir Badacsonytomaj Ld
GCMV
GLRaV-1
12. Pátria Cserszegtomaj Sl GCMV
13. Olaszrizling Cserszegtomaj Y, Lr GLRaV-3
14.
Tempranillo Cserszegtomaj R, Lr
GCMV
GLRaV-3
15. Cserszegtomaj R, Lr GLRaV-2
16.
Cserszegtomaj R, Lr
GCMV
GLRaV-3
17. Cserszegtomaj R, Lr TBRV
18. Korona Cserszegtomaj Ld GFLV
Abbreviations: R - Redding, Lr - Leaf roll, Y - Yellowing, M - mosaic, ChM - Chrome mosaic, VM - Vein
mosaic, Ld - Leaf deformation, D - Degeneration, Sl - Symptomless
GFLV –Grapevine fanleaf nepovirus, ArMV – Arabis mosaic nepovirus, GCMV- Grapevine chrome mosaic nepovirus, TBRV – Tomato black ring nepovirus, GLRaV-1 – Grapevine leafroll-associated virus 1 ampelovirus, GLRaV-2 – Grapevine leafroll-associated virus 2 closterovirus, GLRaV-3. – Grapevine leafroll- associated virus 3 ampelovirus
The higher abundance of viruses was found in Cserszegtomaj (near to the Lake Balaton)
and the less infected area proved to be at Kıszeg (near to the Austrian border). Complex
infections of GCMV plus ArMV occurred in one case, GLRaV-1 plus 3 and GCMV
plus GLRaV-1 also in one case and GCMV plus GLRaV-3 were detected twice.

VIII. Alps-Adria Scientific Workshop Neum, Bosnia-Herzegovina, 2009
DOI: 10.1556/CRC.37.2009.Suppl.2 155
Conclusions
Until now fifteen different virus diseases have been reported in Hungary (Cseh et al.,
2008a, b). Half of them are soil-borne pathogens, transmitted by nematode vectors.
Soil-borne viruses can reduce crop yield and their impact is particularly acute in the
degeneration and early decline of vine stocks. The second half part of the viruses spread
by aphids and mealy bugs and the remaining group of viruses whose mode of
transmission is not known. In 2008 in the West-Hungarian vineyards among the viruses
infecting grapevines GFLV, ArMV, GCMV, TBRV, GLRaV 1-3 viruses could be
detected by visual and serological means. According to the serological study the most
abundant viruses were belonging to the GLRaV group.
The detection of nepoviruses was not always reliable because the high level of phenolic
compounds of the leaves. In the field fan leaf symptoms were the most frequent;
however the presence of nepoviruses were not demonstrated in every case. At presence
their serodiagnosis became possible by using antioxidants in the extraction buffer. In
autumn ripened branches were collected from the same sites, and serological diagnoses
will be repeated from the rooted branches in the spring. By this method it will be
possible to modify the significance of specific viruses in the degradation process of
grape stocks.
Practically all samples made from the grape growing areas proved the presence of
nematode species. However until now among the virus vector nematodes only the
occurrence of Xyphinema ssp. was identified.
The control of grapevine virus diseases has been improved by the application of sanitary
methods: as heat therapy and shoot apex culture for virus eradication from clones. In the
control of virus diseases especially the overwintering weeds, natural host of virus
diseases has especially impact (Mikulás et al. 2003, Kazinczi et al. 2007, 2008).
Recently very few data are available on the susceptibility or resistance of grapevine
species or colonies to distinct viruses, which can profoundly influence the degree of
economic loss. Therefore in the future careful studies are needed to compare this
behaviour of Hungarian grape varieties.
Acknowledgements
We are grateful to the National Scientific Research Found (OTKA K67658).
References
Cseh, A., Taller, J., Podmaniczky, P. and Kocsis, L.: 2006. Comparative analysis of the most widespread
grapevine rootstock lines in the world, the Teleki lines, with microsatellite markers. Cereal Research
Communications, 34: 773-776.
Cseh, E., Lázár, J., Takács, A., Kazinczi, G. and Gáborjányi, R.: 2008a. Survey of soil-borne virus diseases of
grapevine in Hungary. Cereal Research Communications, 36: Suppl. 99-102.
Cseh E., Lázár J., Takács A., Kazinczi G. és Gáborjányi R.: 2008b. A szılı Magyarországon elıforduló és
várhatóan megjelenı vírusos betegségeinek és kórokozóinak áttekintése. Növényvédelem, 44: 11. 535-
544.

Vol. 37, 2009, Suppl. Cereal Research Communications
156
Clark, M.F., Adams, A. N. (1977): Characteristics of the microplate method of enzyme linked immunosorbent
assay for detection of plant viruses. J. Gen. Virol. 34:475-483.
Horváth, J., Takács, A., Farkas, K., Kazinczi, G., Gáborjányi, R.: 2007. Epidemiology of tomato pathogen
viruses in Hungary. Cereal Research Communications, 35: 489-492.
Kazinczi, G., Béres, I., Torma, M.: 2007. Invasive species in Hungary in context of investigations an research.
14th EWRS Symposium (Hamar, Norway) p.32.
Kazinczi, G., Onofri, A., Horváth, J., Torma, M.: 2008. The effect of some herbicides on host-virus relations.
Cereal Res. Comm. 36: 1155-1158.
Mikulás J., Lázár J. és Kazinczi G.: 2003. A Reglone (diquat-dibromid) gyomirtó szer transzlokációja és
felhasználási lehetısége környezetkímélı (szelektív) gyomszabályozásra. Növényvédelem 39: 495-498.
Nádasy, M., Sáringer, Gy., Lucskai, A., Fodor, A., Samu, Z., Ignácz, J., Budai, Cs., Klein, M.: 2000. Effect of
entomopathogenic nematodes (Steinernema spp. and Heterorhabditis spp.) on larvae of selected insect
species causing damage in vegetables. Vegetable Crops Research Bulletin, Poland, 52: 75-90.
Nádasy, M., Simon, F., Marczali, Zs., Nádasy, E.: 2008. Effect of entomopathogenic nematodes on larvae of
scarabs and western corn rootworm, Diabrotica virgifera virgifera LeConte. Cereal Research
Communications 36: 851-854.
Nádasy, M., Pekár, Sz., Fodor, A., Sáringer, Gy., Budai, Cs.: 2002. The bioassay of entomopathogenic
nematodes on agricultural insect pests in laboratory conditions. Inernational Journal of Nematology 25: 195-196.
Seinhorst, J. W.: 1956. The quantitative extraction of nematodes from soil. Nematologica 1: 249-267.
Takács, A., Jenser, G., Kazinczi, G. and Horváth, J: 2006a. Natural weed host of Tomato spotted wilt virus
(TSWV) in Hungary. Cereal Research Communications, 34: 685-688.
Takács, A., Kazinczi, G, Horváth, J. and Hadzsi, M.: 2006b. Natural virus infection of tomato plants in
Hungary. Cereal Research Communications, 34: 689-691.

VIII. Alps-Adria Scientific Workshop Neum, Bosnia-Herzegovina, 2009
DOI: 10.1556/CRC.37.2009.Suppl.2 157
MORPHOLOGICAL AND BIOCHEMICAL INDICATORS OF DROUGHT TOLERANCE IN SWEET SORGHUM (Sorghum dochna L.)
Éva ERDEI1 – Pál PEPÓ1 – Norbert BOROS2 – Szilárd TÓTH1– Béla SZABÓ1
1Department of Horticulture and Plant Biotechnology Centre for Agricultural Sciences and Engineering 2Institute of Food Science, Assurance and Microbiology University of Debrecen Centre of Agricultural
Sciences and Engineering, H – 4032 Debrecen Böszörményi str. 138., e-mail: [email protected]
Abstract: Plant adapt to heat stress by morphological, biochemical and metabolic changes. Sweet sorghum is
a C4 type plant characterized by a high photosynthetic efficiency and drought tolerance. Reducing sugar
component has an important part of drought tolerance. There was a decrease in the accumulation of total
sugar/protein content due to the heat stress. Increase of proline concentration showed a positive correlation
with the increase of reducing sugar concentration. Accumulation of soluble materials will increase the osmotic
potential and as a consequence will create seasonal osmoregulation capability.
Under field conditions we estimated the reaction of RL 4, RL 9, RL 15, RL 18, K1 restorer sweet sorghum
lines to heat stress. There were differences between lines in total sugar (SD5%=0.79), reducing sugar
(SD5%=0.30) and protein content (SD5%=0.034). Under stress conditions we measured the highest reducing
sugar content in case of RL 18 (4.11 %) during waxy maturation. In most cases we measured the highest
values in case of RL 15, which were the following: reducing sugar content 3.23 %, protein 0.25 % and total
sugar 15.43 % and furthermore the degree of foliation were the highest 26.57. Plant heights were between
184.6 and 259.6 cm and the degree of foliation changed between 18.14 and 26.57. Total sugar varied between
10.07 % and 15.43 % and reducing sugar 3.17 and 4.11 % in waxy maturation.
In juvenile plant parts the concentration of fructose and glucose was higher than that of the sucrose. During
drought conditions the soluble sugars maintain the reasonable turgor level. In different sweet sorghum
genotypes the reducing sugars and the proteins are the indicators of drought tolerance/resistance.
Keywords: sweet sorghum, drought tolerance, reducing sugar.
Introduction
Due to climate change plants with drought tolerance, as sweet sorghum, are very
important. Primary gene centers are semi arid and subtropical regions, where annual
precipitation is less than 1200 mm. Sorghum is well adapted to arid zones, therefore it
can be cultivated in several countries of Europe, where in growing period temperature
amount is between 2500-3000 °C, and the annual precipitation is between 350-400 mm.
This grain crop is the fifth most important cereal grown worldwide, due particularly to
its unusual tolerance to adverse environmental conditions (Gill et al., 2003). Part of
extensive breeding programs, sorghum is well adapted to low-input conditions as well
as to biotic and abiotic stress factors (Uptmoor et al., 2006). The plant adapts to abiotic stress by different mechanisms including changes in the
morphological pattern, biochemical processes and metabolic changes (Lásztity, 2003).
Major differences in stress adaptation between species and cultivars may depend on
allelic differences in a small number of genes, as suggested for genes controlling
responses to drought (Galiba, 2002). Sorghum as breeding materials helps to increase
yield and to maintain the stability of crop productivity by serving as a source for
tolerance to environmental stress, especially drought (Mamo et al., 2007). It is necessary
to produce plants with good adaptability and drought resistance altogether with the
commonly used cereals (Erdei and Pepó, 2008).
As a C4 type of plant, it has a high photosynthetic efficiency and drought tolerance
(Channappagoudar et al., 2007). Sorghum has thick epidermis and waxy leaves, which

Vol. 37, 2009, Suppl. Cereal Research Communications
158
detain water submission and assist regeneration (Billa et al., 1997). In vegetation period
C4 plants are also able to absorb higher volume of CO2 as a result of their more effective
photosynthesis. C4 plants have higher CO2 compensation point and their daily dry mass
production is more intensive than that of C3 plants (Lehoczky and Tóth, 2005). C4 plants have far the largest intensity of maximum net photosynthesis, optimal
temperature and productivity of photosynthesis, at the same time the transpiration
coefficient is less than that of C3 plants (Mojzes and Kalapos, 2008). Drought tolerance
was indicated in early period by proline content of water deficient leaves, then by
proline dehydrogenase activity. Activity of glutathione reductase and antioxidase
enzymes were in connection with drought tolerance. (Pintér, 1997).
Abiotic stress is a multigenic trait, that has an effect on synthesis of proteins, enzymes
and metabolites. Osmotic stress effects water and ion transport in cellular membranes,
maintaining homeostasis. Under heat stress proteins denaturate. In short-term stress
experiments, decrease in sucrose and strach content was observed. In long term
experiments, a higher amount of soluble sugars and a lower amount of starch were
found under heat stress. In drought tolerant plants the trehalose, as non-reducing sugar
is important, which absorb reversible water and protects against desiccation. In
solutions the following compounds are accumulated: mannitol (mannitol phosphatase dehydrogenase), sucrose, maltose, glucose, phenols, proline and reducing sugar.
Materials and methods
The experiment was set in the garden of the Department of Horticulture and Plant
Biotechnology, UD Faculty of Agricultural Science. The experiment was planted on
18th
April 2007; under field conditions we estimated the reaction of five restorer sweet
sorghum lines to heat stress. The examined lines were the following: RL 4, RL 9, RL 15, RL 18, control. The aim of the experiment was to determinate the metabolic changes of
plants by morphological and biochemical data. We measured the following
morphological characteristics of drought tolerance: plant height, number of leaves and
determined the degree of foliation. We examined dry matter content, which was determinates by refractometer, total sugar,
reducing sugar, protein content and non-reducing sugar for data on nutritional value.
Plots were set 30 m x 5 m (150 m2) per each, and distance between rows was 75 cm. In
vegetation period from May to August we determinates beneficial (useful) temperature
amount, maximum- and average temperature and precipitation. Morphological
parameters and nutritional value were evaluated with SPSS program.
Results and discussion
Sweet sorghum restorer lines, belong to C4 type plants, were investigated in growing
period from May 5 to August 30. Maximum of C4 type plants photosynthesis is 35 0C.
We set our experiment in a drought period, when the highest temperature was 38.3 0C,
and the precipitation was 32 mm/month. In vegetation period the beneficial temperature
amount was 2627.2 0C. Sorghum is originated from tropical areas so we set 10
0C
as
basic temperature (Table 1.).

VIII. Alps-Adria Scientific Workshop Neum, Bosnia-Herzegovina, 2009
DOI: 10.1556/CRC.37.2009.Suppl.2 159
Table 1.: Changes in temperature- and precipitation data in growing period (Debrecen, 2007.)
Months/data May Jun July August
Average temperature (0C) 18.4 22.2 23.3 22.3
Maximum temperature (0C) 32.2 31.9 38.3 36.3
Average precipitation (mm) 69.8 32.2 77.8 34.1
Beneficial temperature amount
in vegetation period (0C)
2627.2 0C
In this drought period our C4 plants have excellent drought tolerance, it was concluded
by turgor state of leaves. In drought period soluble sugar has important role to maintain
osmotic concentration and the turgor level of leaves. The plant accumulated reducing sugar in solution.
Reducing sugar content of total sugar varied between 3.17 and 4.11 % in waxy
maturation. Under stress conditions we measured the highest reducing sugar content in
case of RL 18. This value was 4.11 % in waxy maturation. In the case of RL 4 we
measured 4.01 % reducing sugar in solution. In the control plant reducing sugar content
was 1.52 %. There were differences between lines in reducing sugar (SD5%=0.30), as an
indicator of heat stress. In these tolerant genotypes the reducing sugar was accumulated
in leaves, under and upper internodium. Accumulation of soluble materials increased
the osmotic potential and as a consequence created seasonal osmoregulation capability.
Due to drought stomata closed and photosynthesis decreased therefore there was
decrease in the accumulation of sucrose. The above mentioned can be explained by the
high reducing sugar level. In waxy maturation more reducing sugar was accumulated
than in the full maturation (Table 2).
Table 2.: Biochemical parameters of drought tolerance in sweet sorghum restorer lines
Total sugar
(%)
Reducing sugar
(%)
Non-reducing sugar
(%)
Line
waxy
maturation
full
maturation
waxy
maturation
full
maturation
waxy
maturation
full
maturation
RL 4 10.07* 10.02* 4.01* 2.47* 6.06* 7.54*
RL 9 11.76* 11.08* 3.17* 2.01* 8.59* 9.07*
RL 15 15.43* 15.36* 3.23* 1.71* 12.19* 13.64*
RL 18 13.78* 13.26* 4.11* 2.23* 9.66* 11.02*
Control 9.35* 6.15* 1.52* 0.77* 7.83* 5.38*
SD5% 0.79 0.30 0.75
There was a decrease in the accumulation of total sugar, non-reducing sugar and
protein content due to the heat stress. In solutions total sugar varied between 10.07 %
and 15.43 %, non-reducing sugar content of total sugar was measured between 6.06
and 12.19 % and the protein content was between 0.057 and 0.072 %. There were
differences between lines in total sugar (SD5%=0.79), protein content (SD5%=0.034) and non-reducing sugar (SD5%=0.75). Drought tolerance is developed by metabolic changes
and morphology. Plant heights of examined lines were between 184.6 and 259.6 cm and
the degree of foliation changed between 18.14 and 26.57. In the case of RL 15 we
measured the highest value. This value was 26.57 (Table 3.).

Vol. 37, 2009, Suppl. Cereal Research Communications
160
Table 3.: Morphological- and biochemical parameters of drought tolerance in sweet sorghum restorer lines
Protein
(%)
Plant height
(cm)
Degree of
foliation
Line
waxy
maturation
full
maturation
full maturation full maturation
RL 4 0.057 0.068 184.60* 21,46*
RL 9 0.089 0.168* 259.60* 23,60*
RL 15 0.250* 0.442* 249.80* 26,57*
RL 18 0.061 0.142* 254.00* 18,14*
Control 0.072 0.029* 251.00* 17,92
SD5% 0.034 2.48 2.06
Conclusions
Abiotic stresses, especially drought and temperature stress are the primary causes of
plant loss worldwide. Plants adapt to environmental stresses by molecular processes.
These processes are importanat to maintain homeostasis. Adaptation is developed by
morphology and physiology. Our experiments were set under field conditions in a
drought period, when temperature was 38 0C and precipitation was 32.2 mm/month. In
vegetation period the beneficial temperature amount was 2627.2 0C. Due to drought the
stomata of plants closed and sucrose metabolism decreased. Due to osmotic stress
reducing sugar was accumulated in solutions. There was decrease in accumulation of
total sugar, non-reducing sugar and protein content. We measured the highest reducing sugar content in case of RL 18 (4.11 %), in the case of RL 4 we measured 4.01 %. In the
case of RL 18 degree of foliation was 18.14 and the plant height was 254 cm, while in
the case of RL 4 plant height was 184.60 cm and the degree of foliation was 21.46.
These lines were stress tolerant. In different sweet sorghum genotypes the reducing sugars and the proteins are the indicators of drought tolerance/resistance.
References
Billa E.- Dimitris P. Koullas - Bernard Monties - Emmanuel G. Koukios: 1997. Structure and composition of sweet
sorghum stalk components, Industrial Crops and Products , 1997. 6. 297.
Channappagoudar B.B.-Biradar N.R.-Patil J.B. -Math S.M.: 2007. Assesment of sweet sorghum genotypes for cane
yield, juices characters and sugar levels, Journal Agricultural Science, 2007. 2. 294.
Erdei É.-Pá. Pepó.:2008. Sugar contents of stalk juices in sweet sorghum types, Cereal Research Communication,
2008. 36. Suppl. 5. 1427.
Galiba G.:2002. Mapping of genes regulating abiotic stress tolerance in cereals, Acta Agronomica Hungarica, 2002. 50. 3. 235.
Gill P. K.- Sharma A. D. Sing P. Bhullar S. S.: 2003. Changes in germination, growth and soluble sugar contents of
Sorghum bicolor (L.) Moench seeds under various abiotic stresses, Plant Growth Regulation, Vol. 40. Nr. 2 157-
162.
Lásztity B.:2003. Comparative analysis of non-essential element turnover in C4 plants, Növénytermelés, 2003. Vol.
52. 3-4. 378.
Lehoczky E.-Tóth V.:2005. Study on the biomass production of the C4 weed, johnson grass (Sorghum halepense/L./
PERS.). Cereal Research Communications, 2005. Vol.. 3. Nr.1. 255. Mamo S.-Ayana A. Tesso T.: 2007. RAPD variation of late-maturing sorghum (Sorghum bicolor(L.) Moench)
landraces from Ethiopia, Acta Agronomica Hungarica, 2007. Vol. 55. 3. 375.
Mojzes A.-Kalapos T.: 2008. Leaf gas exchange responses to abrupt changes in light intensity for two invasive and
two non-invasive C4 grass species, Environmental and Experimental Botany 2008, Vol. 64. 3. 232-238.
Pintér L.: 1997. Contribution of maize breeding for stress tolerance and low input demands, Növénytermelés, 1997.
46. 2. 211.
Uptmoor R.- Wenzel W.G.-Abu Assar A.H.- Donaldson G.-Ayisi K.K.-Friedt W.-Ordon F.: 2006. Evaluation of South African sorghum landraces and breeding of varieties suitable for low-input agriculture, Acta Agronomica
Hungarica, 2006. Vol. 54. .3. 380.

VIII. Alps-Adria Scientific Workshop Neum, Bosnia-Herzegovina, 2009
DOI: 10.1556/CRC.37.2009.Suppl.2 161
HYDROGEN PEROXIDE HAS A KEY ROLE IN RESISTANCE TO LEAF RUST (PUCCINIA TRITICINA) IN SEVERAL EGYPTIAN AND OTHER WHEAT CULTIVARS
Yasser M. HAFEZ1 – Zoltán KIRÁLY2 – Klára MANNINGER1
1 Permanent address: Department of Agricultural Botany (Plant Pathology Branch), Faculty of Agriculture,
Kafrelsheikh University, Kafr-El-Sheikh, Egypt, e-mail:[email protected] 2 Plant Protection Institute, Hungarian Academy of Sciences, Budapest, Hungary
Abstract: In the resistant infected plants reactive oxygen species (ROS) are produced after inoculation, such
as superoxide (O2.-), hydrogen peroxide (H2O2), hydroxyl radical (OH·), etc. Wheat leaves of resistant and
susceptible cultivars were inoculated with wheat leaf rust, Puccinia triticina. Levels of H2O2 were determined
applying xylenol orange, 2,7-dichlorofluorescin diacetate (DCFH-DA) and 3,3-diaminobenzidine (DAB). In
susceptible host/pathogen combinations accumulation of H2O2 did not occur. However, level of H2O2 was
high in resistant cultivars. We have shown that if we inoculate wheat with an inappropriate barley powdery
mildew (Blumeria graminis f.sp. hordei) creating a non-host type resistance, accumulation of H2O2 also
occurred very early.
Keywords: Hydrogen peroxide, disease resistance, non-host resistance, wheat leaf rust
Introduction
It was shown earlier that after infection plant tissue necrotization including the HR
(hypersensitive reaction) is associated with generation of reactive oxygen species (ROS)
(cf. Király et al., 2007, 2008). Furthermore, a few publications also referred to the in vitro as well as in vivo sensitivity of plant pathogens to the action of ROS (Tzeng and
DeVay, 1993, Ouf et al., 1993, Wu et al., 1997, El-Zahaby et al., 2004). The mechanism
of non-host resistance of plants is only partially understood (Schulze-Lefert and
Panstruga, 2003, Schweizer, 2007, Király et al., 2007). So far, almost no experimental
results have been achieved which would explain the question: what is indeed arresting
or killing the pathogen in the non-host resistant plants? The aim of our research was to
study the role of one of the ROS, hydrogen peroxide (H2O2), in symptom expression of
leaf rust resistant wheat cultivars and in various non-host/pathogen combinations.
Materials and methods
We used wheat (Triticum sativum L.) resistant cultivars Thatcher (near isogenic lines
Lr9 and Lr19) and the Egyptian Sakha 94, Giza 168 and Gimmeza 9, and the
susceptible Egyptian Sakha 61 and the Hungarian Délibáb as well as the German R 23
cultivars.
Wheat leaf rust Puccinia triticina (P. recondita f.sp. tritici) pathotype 43522 and barley
powdery mildew (Blumeria graminis f.sp. hordei, race A6) were used.
Histochemical analysis of H2O2: DAB method: Leaf discs (2 cm) were vacuum infiltrated
or injected with a 3,3-diaminobenzidine (DAB) according to Ádám et al. (1989) and
Hückelhoven et al. (1999). Level of H2O2 was measured several times after infection. Xylenol orange method: To detect H2O2 spectrophotometrically with a peroxidase
independent reaction, a xylenol orange based method was used according to the method
of Gay et al., (1999). DCFH-DA method: 2,7-Dichlorofluorescin diacetate (DCFH-DA)

Vol. 37, 2009, Suppl. Cereal Research Communications
162
reacts with H2O2 in the presence of peroxidase yielding the fluorescent 2,7-
dichlorofluorescein (DCF). We used the method described by Lu and Higgins (1998)
with modifications.
Results and discussion
Leaves of resistant and susceptible wheat cultivars were inoculated with wheat leaf rust,
Puccinia triticina pathotype 43522. Accumulation of H2O2 measured with the DAB
method was very low in infected compatible wheat/pathogen combinations or there was
no accumulation at all (Fig.1). In incompatible combinations (resistant cultivars
producing HR) accumulation of H2O2 was significantly high and began to accumulate
three days after inoculation. If we inoculated wheat leaves with an inappropriate fungus,
the barley powdery mildew (Blumeria graminis f.sp. hordei), we created a non-host
type resistance, with lack of HR. Accumulation of H2O2 in these non-host resistant
plants was also very intensive and began earlier (1 DAI) than in the resistant but host
plants (Fig. 2). Accumulation of ROS in infected or stressed plants seems to be a general phenomenon
and may be related to the resistance phenomenon of infected or stressed plants (Doke,
1983, Barna et al., 1993, Lamb and Dixon, 1997, Deák et al., 1999, Király, 2000, Király
and Király, 2006, Király et al., 2007). On basis of the hypothesis of Bendahmane et al.
(1999) in connection with plant virus resistance, one can suppose that the early
accumulation of H2O2 in non-host plants is the cause of killing the rust early after
infection, therefore the HR cannot develop. In the resistant but host plants, the pathogen
can develop for a short while before it is inhibited or killed, and this would be the
reason for the development of HR. However, in the susceptible host accumulation of
H2O2 is very low or missing, thus the pathogen can induce the typical rust symptoms in
wheat leaves.
Figure 1. Accumulation of hydrogen peroxide (H2O2) in wheat leaves measured with the DAB method. Left: Cultivar R 23: susceptible to infection by leaf rust (Puccinia triticina). Lr9: a line of cultivar Thatcher which
is resistant to leaf rust producing HR (necroses). Middle: accumulation of H2O2 72 hours after inoculation
(R23: susceptible wheat cultivar. Lr9: a line of cultivar Thatcher which is resistant to leaf rust producing HR).
Right: accumulation of H2O2 24 hours after inoculation. Host: susceptible wheat leaves (cv. R23) were
inoculated with leaf rust. Non-host: cultivar R23 was inoculated with barley powdery mildew (Blumeria graminis f.sp. hordei).
R23 Lr9 R23 Lr9 Host Non-host

VIII. Alps-Adria Scientific Workshop Neum, Bosnia-Herzegovina, 2009
DOI: 10.1556/CRC.37.2009.Suppl.2 163
Figure 2. Level of hydrogen peroxide (H2O2) determined by the DAB staining method, xylenol orange dye
and 2,7-dichlorofluorescein diacetate (DCFH-DA) dye in wheat cultivars infected with wheat leaf rust
(Puccinia triticina) in several days after inoculation (DAI). Lr9 and Lr19 lines of cultivar Thatcher are
resistant to leaf rust and produce HR (necroses). Sakha 94, Giza 168 and Gimmeza 9 are Egyptian rust
resistant wheat cultivars. Délibáb is a Hungarian, R 23 is a German and Sakha 61 is an Egyptian susceptible
wheat cultivar.
Acknowledgements
This work was supported by grants from the Hungarian Scientific Research Fund
(OTKA AT 048866). Y. M. Hafez was supported by a Postdoctoral University and
Research Scholarship of the Hungarian Scholarship Board (HSB) during 2006-2008.
DAB staining
0
10
20
30
40
50
60
70
1 DAI 2 DAI 3 DAI 4DAI 5DAI 6 DAI
Days after inoculation
Arb
itra
ry u
nit
s
Lr9 Lr19
Délibáb R23
DAB staining
0
10
20
30
40
50
60
70
1 DAI 2 DAI 3 DAI 4DAI 5DAI 6 DAI
Days after inoculation
Arb
itra
ry u
nit
s
Sakha 94 Giza 168 Gimmeza 9 Sakha 61
Xylenol orange dye
0
0,05
0,1
0,15
0,2
0,25
0,3
0,35
0,4
Lr9
Lr1
9
Délib
áb
R23
Sakha 9
4
Giza
168
Gim
meza
9
Sakha 6
1
Arb
itra
ry u
nits
3 DAI
Xylenol orange dye
00,050,1
0,150,2
0,250,3
0,350,4
0,45L
r9
Lr1
9
Délib
áb
R23
Sakha 9
4
Giza
168
Gim
meza
9
Sakha 6
1
Arb
itra
ry u
nit
s4 DAI
Dichlorofluorescein diacetate dye
0100000200000300000400000500000600000700000800000900000
Lr9
Lr1
9
Délib
áb
R23
Sakha 9
4
Giza
168
Gim
meza
9
Sakha 6
1
Photo
n c
ounts
s-1
3 DAI
Dichlorofluorescein diacetate dye
0
100000
200000
300000
400000
500000
600000
700000
800000
Lr9
Lr1
9
Délib
áb
R23
Sakha 9
4
Giza
168
Gim
meza
9
Sakha 6
1
Photo
n c
ounts
s-1
4 DAI

Vol. 37, 2009, Suppl. Cereal Research Communications
164
References
Ádám A. - Farkas T. - Somlyai G. - Hevesi M. - Király Z.: 1989. Consequence of O2.- generation during a
bacterially induced hypersensitive reaction in tobacco: deterioration of membrane lipids. Physiol.
Molec. Plant Pathol. 34: 13–26.
Barna B. - Ádám A. - Király Z.: 1993. Juvenility and resistance of a superoxide-tolerant plant to diseases and
other stresses. Naturwissenschaften, 80: 420–422.
Bendahmane A. - Kanyuka K. - Baulcombe D.C.: 1999. The Rx gene from potato controls separate virus
resistance and death responses. Plant Cell, 11: 781–791.
Deák M. - Horváth G.V. - Davletova, S. - Török K. - Sass L. - Vass I. - Barna B. - Király Z. - Dudits D.:
1999. Plants ectopically expressing the iron-binding protein, ferritin, are tolerant to oxidative
damage and pathogens. Nature Biotech. 17: 192–196.
Doke N.: 1983. Involvement of superoxide anion generation in the hypersensitive response of potato tuber
tissues to infection with an incompatible race of Phytophthora infestans and to the hyphal wall
components. Physiol. Plant Pathol. 23: 345–357
El-Zahaby H.M. - Hafez Y.M. - Király Z.: 2004. Effect of reactive oxygen species on plant pathogens in planta and on disease symptoms. Acta Phytopathol. Entomol. Hung. 39: 4. 325–345.
Gay C. - Collins J. - Gebicli J.M.: 1999. Hydrogen peroxide assay with the ferric xylenol orange complex.
Annals Biochem. 273: 149–155
Hückelhoven R. - Fodor J. - Preis C. - Kogel K-H.: 1999. Hypersensitive cell death and papilla formation in
barley attacked by the powdery mildew fungus are associated with H2O2 but not with salicylic acid
accumulation. Plant Physiol. 119: 1251–1260.
Király Z.: 2000. New aspects of breeding crops for disease resistance: the role of antioxidants. In: Hrazdina G
(ed): Use of Agriculturally Important Genes in Biotechnology. Amsterdam, Berlin, Oxford, Tokyo,
Washington, DC: IOS Press. 124–130
Király L. - Király Z.: 2006. To die or not to die – is cell death dispensable for resistance during the plant
hypersensitive response? Acta Phytopathol. Entomol. Hung. 41: 11–21.
Király L. - Barna B. - Király Z.: 2007. Plant resistance to pathogen infection: Forms and mechanisms of
innate and acquired resistance. J. Phytopathol. 155: 385–396.
Király L. - Hafez Y.M. - Fodor J. - Király Z.: 2008. Suppression of tobacco mosaic virus-induced
hypersensitive-type necrotization in tobacco at high temperature is associated with downregulation of
NADPH oxidase and superoxide and stimulation of dehydroascorbate reductase. J. Gen. Virol. 89:
799–808.
Lamb C. - Dixon R.A.: 1997. The oxidative burst in plant disease resistance. Annu. Rev. Plant Physiol. Plant
Molec. Biol. 48: 251–275
Lu H. - Higgins V.J.: 1998. Measurement of active oxygen species generated in planta in response to elicitor
AVR9 of Cladosporium fulvum. Physiol. Molec. Plant Pathol. 52: 35–51
Ouf M.F. - Gazar A.A. - Shehata Z.A. - Abdou El-S. - Király Z. - Barna B.: 1993. The effect of superoxide
anion on germination and infectivity of wheat stem rust (Puccinia graminis Pers. f.sp. tritici Eriks.
and Henn.) uredospores. Cereal Res. Commun. 21: 31–37.
Schulze-Lefert P. - Panstruga R.: 2003. Establishment of biotrophy by parasitic fungi and reprogramming of
host cells for disease resistance. Annu. Rev. Phytopathol. 41: 641–67.
Schweizer P.: 2007. Nonhost resistance of plants to powdery mildew - new opportunities to unravel the
mystery. Physiol. Molec. Plant Pathol. 70: 3-7.
Tzeng D.D. - DeVay J.E.: 1993. Role of oxygen radicals in plant disease development. In: J. H. Andrews, I.
C. Tommerup (eds), Advances in Plant Pathology. Vol 10., Academic Press, London. 1–34.
Wu G.S. - Shortt B.J. - Lawrence E.B. - Leon J. - Fitzsimmons K.C. - Levine E.B. - Raskin I. - Shah D.M.:
1997. Activation of host defense mechanisms by elevated production of H2O2 in transgenic plants.
Plant Physiol. 115: 427–435.

VIII. Alps-Adria Scientific Workshop Neum, Bosnia-Herzegovina, 2009
DOI: 10.1556/CRC.37.2009.Suppl.2 165
EFFECTS OF ECOLOGICAL AND AGROTECHNICAL STRESS FACTORS ON THE YIELDS OF MAIZE (Zea Mays L.) IN LONG TERM EXPERIMENT
Ádám LENTE
Institute of Crop Sciences, Agronomy Faculty, Centre of Agricultural Sciences and Engineering,
University of Debrecen, H-4032., Debrecen, Böszörményi str. 138., e-mail:[email protected]
Abstract: We have been studied some agricultural factors (plant density, fertilization) the crop year (different
water supply years: 2007.= dry, 2008.= optimal) effect on the yields of the corn in different crop-rotation
(mono-, bi-, triculture) in long term experiment, on chernozem soil in the Hajdúság.
We did not applied irrigation in both crop years. The water supply of the year like an abiotic stress factor was
the strongest effect on the corn yields and it determined the optimal plant density and the dose of fertilizer.
In dry year (2007) the maximum yield of corn were almost 5 000 kg ha-1 (mono), 8 000 kg ha-1 (bi), higher
than 8 000 kg ha-1 (tri), and in an optimal water supply year (2008) over than 13 000 kg ha-1 (mono), 14 000
kg ha-1 (bi) and close to 15 000 kg ha-1 (tri) without irrigation. The yield decreasements caused by abiotic
stress (water deficit) were 9.0 t ha-1 (mono), 7.0 t ha-1 (bi) and 6.0 t ha-1 (triculture), respectively.
The ecological stress (waterdeficit) and the agrotechnical stress (crop-rotation) affected the optimal plant
number and dose of fertilizer.
In a dry crop year (2007) the optimum plant density was 40 000 ha-1 (mono-, bi-, triculture) and in an
optimum water supply crop year (2008) it varied between 60 000 ha-1 (mono) and 80 000 ha-1 (bi, tri),
respectively.
The crop year and the crop-rotation change the optimal dose of fertilizer. Our scientific results proved that the
corn is very sensitive to ecological and agricultural stress effects.
Keywords: maize, crop year, crop-rotation, plant density, fertilization, yield
Introduction
Maize is a high productivity crop which is produced on 1.1-1.2 million ha in Hungary.
The average yields range between 4-7 t ha-1
depending on the cropyears and the
production level (Pepó et al., 2006). Increasingly frequent extreme weather conditions
prove that climate change is a real problem and can increase the rate of dry years in
Hungary (Sárvári, 2005). In extremely dry year (1990) the kernel yield of fodder maize
dropped to its half as a result of increasing NP fertilization (Kádár-Márton, 2007)
furthermore, the higher than optimal crop density increases water need and makes plant
more sensitive to draught (Sárvári, 2009).
According to experiments by Nagy (2007) conducted on chernozem soil for two
decades crop year significantly influences yield fluctuation which can reach 7 t/ha.
Yield decrease was highest in monoculture in 2007, when the increase of fertilizer doses
caused further yield depression (Pepó et al., 2008).
For successful maize production harmonized nutrient supply is needed and especially
nitrogen supplementation is of high importance. The optimal nitrogen dose is influenced
by soil, cliamtic factors, genotype and agrotechnical factors (Bocz and Nagy, 1981).
According to Berzsenyi and Dang (2008) in favourable year the highest yield was
obtained at 120 kg N ha-1
fertilizer dose while in unfavourable year the optimal fertilizer
dose was 60 kg N ha-1
.

Vol. 37, 2009, Suppl. Cereal Research Communications
166
Materials and methods
The examinations were carried out on the Látókép Research Site of the University of
Debrecen Centre of Agricultural Sciences and Engineering, Institute of Crop Sciences.
The soil of the research site is calcerous chernozem. The examinations were conducted
in long term experiment set by Ruzsányi in 1983 and controlled by Pepó from 2004.
Our experiment covered the years of 2007 and 2008.
The experiment involves three crop rotation systems: monoculture (maize), biculture
(wheat-maize) and triculture (pea-wheat-maize).
Five fertilization doses and three crop density levels were used.
The five fertilization levels are as follows: control (untreated), N60P45K45, N120P90K90,
N180P135K135, N240P180K180, the three plant density levels are 40 thousand ha-1
, 60
thousand ha-1
and 80 thousand ha-1
.
Concerning ecologic stress effects, 2007 is considered dry while 2008 was favourable.
Table 1 shows the precipitation and monthly temperature in the growing season in the
two years.
Table 1. Meteorological data of the cropyears (Debrecen )
Precipitation
(2007)
Precipitation
(2008)
30 years’
average
Temperature
(2007)
Temperature
(2008)
30 years’
average
March 14,0 41,7 33,5 9,1 16,8 5,0
April 3,6 74,9 42,4 12,6 11,4 10,7
May 54 47,6 58,8 18,4 16,8 15,8
June 22,8 140,1 79,5 22,2 20,6 18,7
July 39,7 144,9 65,7 23,3 20,4 20,3
August 77,6 34,2 60,7 22,3 20,6 19,6
September 86,1 42,2 38,0 14 14,8 15,8
sum/average 297,8 525,6 378,6 17,4 17,3 15,1
Results and discussion
Maize has high nutrient demand and well utilizes both the natural nutrient supply in the
soil and artificial fertilizers. The effectiveness of fertilization is significantly influenced
by the status of the soil, water supply and biologic and agrotechnical factors.
We examined some agrotechnical factors (fertilization, plant density) in different crop
rotation systems (mono-, bi- and triculture) in long term field trial set in the Látókép
Research Experimental Station, Universiy of Debrecen 25, years ago. The cropyear of
2007 was rather dry (unfavourable) and 2008 was humid (favourable). In 2007 in the
period from March to June the amount of precipitation was 80.8 mm lower than the 30-
year average. However, in 2008 in each month of the growing season the amount of
precipitation was either average or above, therefore the precipitation in the vegetation
period was 147.0 mm higher. In both growing seasons the monthly temperature values
increased the many-years average (in 2007 by 2.3 °C and in 2008 by 2.2 °C)
The stress caused by monoculture cultivation was significant in the dry cropyear of
2007 when yields ranged between 3874 - 5681 kg ha-1
. In the same year, yields ranged
between 7156 - 7929 kg ha-1
in biculture and 7214 - 8192 t ha-1
in triculture according to

VIII. Alps-Adria Scientific Workshop Neum, Bosnia-Herzegovina, 2009
DOI: 10.1556/CRC.37.2009.Suppl.2 167
fertilization doses. However, in the humid cropyear of 2008 this unfavourable effect
was smaller. In 2008 the yields were as follows: 12902-13787 kg ha (monoculture),
13974-14603 kg ha (biculture) and 13594- 14839 kg ha (triculture).
On non-treated fertilized (control) plots in the dry cropyear of 2007 the highest yields
were obtained at each plant density levels (40-, 60-, 80 ezer ha-1
) in triculture crop
rotation (6526- 7938 t ha-1
). In the favourable cropyear of 2008 the excellent nutrient
supplying capacity of chernozem soil was well reflected by yields. In 2008 the
maximum yields were harvested from biculture control plots with yields ranging
between 11328- 12128 t ha-1
.
2007
0
2000
4000
6000
8000
10000
12000
14000
16000
Mono Bi Tri Mono Bi Tri Mono Bi Tri
40 thousand ha-1 60 thousand ha-1 80 thousand ha-1
yiel
d kg
ha-1
Ø N60+PK N120+PK N180+PK N240+PK
2008
0
2000
4000
6000
8000
10000
12000
14000
16000
Mono Bi Tri Mono Bi Tri Mono Bi Tri
40 thousand ha-1 60 thousand ha-1 80 thousand ha-1
yiel
d kg
ha-1
Ø N60+PK N120+PK N180+PK N240+PK
Figure 1. The effect of crop year and agrotechnical factors on maize yields
Water makes natural nutrients and fertilizers available for plants. In the dry crop year of
2007 as a result of smaller amount of precipitation lower fertilizer doses had better

Vol. 37, 2009, Suppl. Cereal Research Communications
168
effect than higher fertilizer doses, which had unfavourable effects on the physiological
processes of plants.
In 2007 the N240+PK fertilizer treatment caused the following yield losses: at 40
thousand ha-1
plant density level in triculture 842 kg ha-1
, at 60 thousand ha-1
plant
density level in monoculture 198 kg ha-1
, in triculture 86 kg ha-1
, at 80 thousand ha-1
crop density level 471 kg ha-1
, and in triculture 434 kg ha-1
. This effect (witch value was
between 3-19 %) can be considered as abiotic stress (Bocz, 1976).
Contrary, in the humid crop year of 2008 at each plant density level and in each crop
rotation system the lowest yield was obtained from control plots with yields ranging
between 8590- 11769 kg ha-1
. In 2008 in the N120+PK treatment the highest yield was
obtained at 40 thousand ha-1
and 60 thousand ha-1
plant density level in bi- and
triculture, and in the N180+PK treatment at 40 thousand ha-1
and 60 thousand ha-1
plant
density level in monoculture and at 80 thousand ha-1
crop density level in mono-, bi-
and triculture.
In dry year lower crop density level is optimal. In all three crop rotation systems the
highest yield was obtained at 40 thousand ha-1
crop density level (monoculture 5681 kg
ha-1
, biculture 7926 kg ha-1
and triculture 8192 kg ha-1
). The lowest yields were obtained
at 80 thousand ha-1
crop density level in each crop rotation system.
In favourable year (2008) the highest yield was obtained at 60 thousand ha-1
plant
density level in monoculture (13787 kg ha-1
), while in bi- and triculture the highest yield
was obtained at 80 thousand ha-1
crop density level (14603 kg ha-1
in biculture and
14839 kg ha-1
in triculture)
Conclusions
The polifactorial long term experiment set in Látókép 25 years ago allowed of the joint
analysis of agrotechnical (crop rotation, nutrient supply, plant density) and
environmental (cropyear) factors. The optimal agrotechnical conditions were at different
agrotechnical levels. In the dry crop year of 2007 the highest yield was obtained in
triculture at N60+PK fertilizer dose at 40 thousand ha-1
plant density level (8192 kg ha-1
),
while in the favourable crop year of 2008 the highest yield was obtained in triculture at
N180+PK fertilizer dose at 80 thousand ha-1
plant density level (14839 kg ha-1
).
References
Berzsenyi Z.-Dang Q. L.: 2008. Effect of sowing date and N fertilization on the yield and yield stability of
maize (zea mays L.) hybrids in a long-term experiment. Acta Agronomica Hungarica. 56.: 247-264.
Bocz E.: 1976 Trágyázási útmutató 117-146. Mezıgazdasági kiadó, Budapest.
Bocz E.-Nagy J.: 1981. A kukorica víz- és tépanyagellátásának optimalizálása és hatása a termés tömegére.
Növénytermelés. 30: 6:539-547.
Kádár I.- Márton L.: 2007. Kukorica utáni kukorica trágyareakciója a mezıföldi OMTK kísérletben 1970-
2006 között
Sárvári M.: 2005. Impact of nutrient supply, sowing time and plant density on maize yield. – Acta
Agronomica Hungarica vol.53: 1. 59-70
Sárvári M.: 2009. A kukorica hibridspecifikus trágyázása és optimális tıszáma. Agrofórum Extra. 27.: 40-45.
Nagy J.: 2007 Evaluating the effect of year and fertilisation on the yield of mid ripening (FAO 400-499)
maize hybrids. Cereal Research Communication. 35: 3. 1497-1507.
Pepó P. - Vad A. – Berényi S.: 2006 Effect of some agrotechnical elements on the yield of maiza on
chernozem soil. Cereal Research Communications. 34. 1:621-624.
Pepó P. - Vad A. – Berényi S.-Vad Attila.: 2008 Az öntözés hatása a kukorica (Zea mays L.) termésére száraz
évjáratban csernozjom talajon. Növénytermelés. 57. 2:171-179.

VIII. Alps-Adria Scientific Workshop Neum, Bosnia-Herzegovina, 2009
DOI: 10.1556/CRC.37.2009.Suppl.2 169
WEATHER CHARACTERISTIC IMPACTS ON BROMEGRAS (Bromus inermis Leyss) DEVELOPMENT
Géza NAGY – János LAZÁNYI – Péter KOVÁCS
Department of Rural Development, Faculty of Agroeconomics and Rural Development Debrecen University
Abstract: Based on the data of meteorological conditions and morphological measurements on spring grass
growth, the purpose of this paper is to analyze the effects of some climatic variables on grass growth and
development as well as to search correlation between climatic conditions and grass growth. Two years quite
different climatic conditions were selected for the investigations. Spring weather in 2006 was extremely rainy,
ordinary warm and cloudy. In contrast with that 2007 was a bit rainy, extremely warm and very sunny.
Growth and development of bromegrass were significantly different in the investigation years. More
favourable conditions had positive effects not only on the size of plant parts but on the differentiation of these
plant parts as well. Regression analysis showed different correlation between independent climatic variables
and phenological traits of bromegrass during primary growth in both years. Strong positive correlations were
found between annual rainfall, annual temperature sum, annual sum of sunny hours as independent variables
and extended shoot height (ESH), number of leaves developed (NL), number of dead leaves (NDL) as
dependent variables. Other morphological traits, number of active leaves per shoot and sum of active leaf
lamina lengths responded differently to climatic variables. It is concluded that the vegetative growth (size of
plant parts) is more influenced by existing weather conditions than development of new shoots (tiller bud
differentiation).
Keywords: climatic conditions, grass growth and development, bromegrass
Introduction
Biomass production of temperate grasses during primary growth primarily is constituted
from the development and growth of vegetative shoots, consisting of leaves. The
differentiation and growth of leaves under natural conditions are determined by soil and
climatic conditions. While soil conditions on a given site may be considered as constant,
climatic conditions under continental climate may differ from year to year to a great
extend. From climatic conditions light (irradiance and photoperiod), temperature and
water supply are considered (Robson et al., 1988) as key factors influencing growth and
development of grasses during primary growth.
In a basic research programme between 2004-2007 data were collected on the existing
weather conditions and field measurements were made on the growth and development
of some grasses including bromegrass during primary growth.
Based on the data of meteorological conditions and morphological measurements on
spring grass growth, the purpose of this paper is to analyze the effects of some climatic
variables on grass growth and development as well as to search correlation between
climatic conditions and grass growth.
Materials and methods
Results of this investigation will refer to field conditions existing at the demonstration
garden of Debrecen University, Agricultural Centre. Meteorological data for the periods
of primary growth of investigation years were measured by the local observatory.
Annual rainfall, annual temperature sum and annual sum of sunny hours will be
considered as abiotic environmental variables for grass growth. Climate index for grass

Vol. 37, 2009, Suppl. Cereal Research Communications
170
growth (Vinczeffy, 1991) will be calculated to present differences in annual weather
conditions in the investigation years.
Measurements data on the growth and development of bromegrass during primary
growth were taken from sets of data collected between 2004 and 2007 in a basic
research programme (Nagy, 2008). Identification of the different traits for growth and
development as well as the methods of measurements of these traits were formerly
discribed in details by Nagy (2008).
To catch the correlation between environmental variables and spring growth of
bromegrass, two years with more or less extreme climatic conditions (2006 and 2007)
were selected for the investigations.
The regression analysis between independent (annual rainfall, annual temperature sum,
annual sum of sunny hours) and dependent variables (morphological traits of
bromegrass) was made by using General Linear Model of the SPSS 13.0 for Windows
(2004) software.
Results and discussion
The climatic conditions
Weather conditions of selected years were quite different (Figure 1). The climatic index
for grass growth (Vinczeffy, 1991) was autstandingly higher and slightly lower than 40
year average through the investigation periods in 2006 and 2007 respectively.
Figure 1. The climate index for grass growth
To find the reasons for these differences the relative availability of key environmental
variables compared to the 40 year average was calculated (Table 1). On the basis of this
calculation the nature of the year for 2006 was extremely rainy, ordinary warm and
cloudy. In contrast with that 2007 was a bit rainy, extremely warm and very sunny.
0,00
0,10
0,200,30
0,40
0,50
0,60
IV.15. IV.30. V.10. V.20. V.30. VI.15.
date
clim
ate
inde
x m
m/°
C
2006 2007average

VIII. Alps-Adria Scientific Workshop Neum, Bosnia-Herzegovina, 2009
DOI: 10.1556/CRC.37.2009.Suppl.2 171
Table 1. Weather characteristics (Debrecen Weather Bureau)
Rainfall, Temperature sum (TS) and Sum of Sunny hours ( ain he period from January 1 to mid June):
Debrecen Weather Bureau (LTM = long-term means from 40-y period 1968-2007)
Rainfalla TSa SSHa Relative values (LTM = 100)
mm 0C (h) hours Rainfall TS SSH
2006 429.3 1243.3 769.3 189 100 86
Year characteristics: extremely rainy, ordinary warm, cloudy
2007 280.5 1795.3 1043 124 144 117
Year characteristics: a bit rainy, extremely warm, very sunny
LTM 227.1 1244.5 889.2 100 100 100
Growth and development of bromegrass to experimental years
Growth and development of bromegrass were significantly different in the investigation
years (Table 2). Phenological traits reflecting spring biomass production (e.g. ESH, NL,
NAL, SALL) were in favour of 2006. The relative differences (2007=100%) for these
traits were 79%, 29%, 19% and 36% respectively. These results suppose that more
favourable conditions had positive effects not only on the size of plant parts (ESH,
SALL) but on the differentiation of these plant parts as well (NL, NAL). However the
size of effects are different depending on the plant morphological traits.
Table 2. Response of Hungarian bromegrass to weather conditions
Values of tested properties Correlation coefficients** Propertya Year Rainfall (mm) Temp. sum
(0C) Sum of Sunny hours
2006 2007 Mean LSD5% 2006 2007 2006 2007 2006 2007
ESH, cm
77.23 43.06 60.15* 4.91 0.954 0.850 0.995 0.985 0.982 0.960
NL 7.77 6.03 6.90* 0.43 0.882 0.861 0.973 0.906 0.978 0.957
NDL 2.07 1.23 1.65* 0.56 0.856 0.898 0.972 0.989 0.982 0.973
NAL 5.70 4.80 5.25* 0.44 0.405 0.123 -
0.536
0.048 -
0.555
0.184
SALL 123.39 90.83 107.11* 12.59 0.809 -
0.160
0.672 -
0.176
0.619 -
0.002
IL 1.71 2.15 1.93* 0.34
LL 21.75 18.69 20.22* 1.65
** properties under a = dependent variables; rainfall,
temp. sum and sum of Sunny hours = independent
variables a ESH=extended shoot height, NL=number of leaves per shoot, NDL=number of dead leaves per shoot,
NAL=number of active leaves per shoot, SALL=sum of active/live leaf lamina lengths on the shoot,
IL=index of leafiness, LL=average lengths of live leaves; * the data of mean values are significant in level of
LSD 1%
Correlation between climatic variables and grass growth
Regression analysis showed different correlation between independent climatic
variables and phenological traits of bromegrass during primary growth in both years
(Table 2).
Strong positive correlations were found between annual rainfall, annual temperature
sum, annual sum of sunny hours as independent variables and extended shoot height
(ESH), number of leaves developed (NL), number of dead leaves (NDL) as dependent
variables. No reliable correlations were found between climatic variables and number of
active leaves per shoot (NAL). Correlation between climatic conditions and sum of

Vol. 37, 2009, Suppl. Cereal Research Communications
172
active leaf lamina length (SALL) were different in the two investigation years. In 2006,
when climate conditions were favourable for grass growth strong positive correlation
was found between climatic variables and SALL. However in 2007, when climatic
conditions were not favourable for spring grass growth, the effects of climatic variables
were negative on SALL, without any statistical correlation between them.
The results of regression analysis indicate that climatic conditions as variables have
different effects on growth and development of bromegrass. The vegetative growth (size
of plant parts) is more influenced by existing weather conditions than development of
new shoots (tiller bud differentiation).
Acknowledgements
Basic data for this study were taken from a research programme aimed at spring
phenological development of some grasses, financed by Hungarian National Scientific
Foundation (OTKA T042506).
References
Nagy G. (2008) Spring phenological development of perennial ryegrass and its response to annual weather
conditions. Cereal Research Communications. VII. Alps-Adria Scientific Workshop. Stara Lesna, Slovaki
28 April-2 May 2008. Akadémiai Kiadó, Budapest. CD, 787.
Robson M.J., Ryle G.J.A. and Woledge J. (1988) The grass plant – its form and function. In: the grass crop
(eds: Jones M.B. and Lazenby A.) Chapman and Hall, London, New York, 25-84.
Vinczeffy I. (1991) Gyepgazdálkodási Praktikum, DATE, Debrecen, 43-46.

VIII. Alps-Adria Scientific Workshop Neum, Bosnia-Herzegovina, 2009
DOI: 10.1556/CRC.37.2009.Suppl.2 173
STUDIES ON THE RESISTANCE OF WHEAT GENOTYPES TO PYRENOPHORA TRITICI-REPENTIS IN THE SEEDLING STAGE
Mónika CSÉPLİ1 – Dalma PRIBÉK1 – Mária CSİSZ2
1 Agricultural Research Institute of the Hungarian Academy of Sciences, P.O. Box 19, H-2462 Martonvásár,
e-mail: [email protected] 2 The Cereal Research Non-Profit Company, P.O. Box 391, H-6701 Szeged
Abstract: Tan spot (Pyrenophora tritici-repentis) is an important biotic stress factor of wheat, causing
significant yield reductions in wheat growing areas throughout the world. Differences in susceptibility are
known to occur between wheat varieties, but the level of resistance of the Hungarian varieties currently grown
is more or less unknown. A large quantity of inoculum and an exact method of evaluation are required for
correct determination. The objective of this study was to identify the tan spot (race 1) resistance of various
wheat genotypes. The varieties bred in Martonvásár, and other genotypes with known genetic background,
were inoculated under greenhouse conditions with an isolate of tan spot. The AUDPC values were calculated
from the values of lesion types at various dates. The genotypes tested were found to be 4 % resistant, 46 %
moderately resistant, 38 % moderately resistant to moderately susceptible, 11 % moderately susceptible and
1 % susceptible. The varieties ‘Atlas 66’ and ‘M-3’, reported in the literature as resistance sources, had
significantly smaller AUDPC values than the average. The values recorded for the Martonvásár varieties ‘Mv
Mambó’, ‘Mv Mazurka’ and ‘Mv139-08’ did not differ significantly from those obtained for these varieties.
There was a moderate correlation between the greenhouse and field data. The greenhouse test currently
employed thus appears to be suitable for the relatively simple, reproducible determination of resistance in
wheat.
Keywords: biotic stress factor, tan spot, wheat, resistance
Introduction
The pathogen causing tan spot, Pyrenophora tritici-repentis (Died.) Drechs. (anamorph:
Drechslera tritici-repentis), was first mentioned as a biotic stress factor of wheat in
Hungary in 1988 (Apponyiné et al. 1988), after which several other authors drew
attention to the danger (Balogh et al. 1991, Rátainé and Pecze 1997). Since this first
attack it has been regularly isolated from cereal stands, to different extents each year.
Control is complicated by the fact that the symptoms caused by the pathogen are
extremely variable, and distinguishing them on the leaves is not as simple as in the case
of biotrophic pathogens (Csısz 2007). Yield losses may be as high as 25% (Csısz
2006), which can be attributed to reductions in the grain number per spike and in the
thousand-kernel weight (Shaber and Bockus 1988). The AUDPC value of the flagleaf is
a good indicator of the wheat seed infection (Schilder and Bergstrom 1994, Bathal et al.
2003). It has been suggested that the pathogen may also be spread by the seed (Carmona
et al. 2006). Based on the two types of symptoms (necrosis, extensive chlorosis),
Pyrenophora tritici-repentis isolates are separated into several races (Lamari et al.
2003) in Europe as well (Sárová et al 2005). An increasing body of information is
available on the resistance of Hungarian varieties, based on natural infection and
artificial inoculation in the seedling and adult stages (Bakonyi et al. 1992, Csısz et al.
2006, Cséplı et al. 2004, Ágoston and Pepó 2005, Németh et al. 2006, Janda et al.
2008).The aim of the present experiments was to determine the resistance of various
wheat genotypes in seedling stage after artificial inoculation with Drechslera tritici-repentis (race 1).

Vol. 37, 2009, Suppl. Cereal Research Communications
174
Materials and methods
The experiments were set up in the greenhouses of the Agricultural Research Institute of
the Hungarian Academy of Sciences, first on 49 varieties, breeding lines and genotypes
with known genetic background, and then on a further 43 breeding lines bred in
Martonvásár. The genotypes were inoculated with an isolate of tan spot developed on V8PDA medium (Lamari and Bernier 1991) (Pti2, race 1) (Ali and Francl 2001). The
number of conidia required for inoculation (5000 conidia/ml) was adjusted under a light
microscope by means of Bürker chamber counts. The inoculum was sprayed onto the
leaf surface when the plants were in the 1-leaf stage. In order to promote infection, the
plants were covered with polythene for 48 hours, after which the 80–90% relative
humidity required for pathogen development was ensured using a humidifier (Cséplı et
al. 2004). The genotypes were evaluated from the 5th day after inoculation, scoring the
lesion types on a 1–5 scale (1 = resistance, 5 = susceptible) (Lamari and Bernier 1989).
The area under the disease progress curve (AUDPC) was calculated from the lesion type
values recorded at various dates (Shaner and Finney 1977). Data analysis was carried
out with the Breeder statistical program package (Kuti et al. 2008).
Results and discussion
Analysis of variance on the greenhouse results revealed significant differences in
susceptibility between the varieties in all four experiments (Fig. 1). The AUDPC values
were significantly greater than average for the varieties Katepwa, ND495 and Glenlea,
reported in the literature to be susceptible to race 1 of Pyrenophora tritici-repentis,
while the lowest value was found for the resistant genotype ‘M-3’ (Ali and Francl
2001). ‘Kavkaz’ and the Martonvásár varieties ‘Mv Mambó’, ‘Mv Mazurka’, ‘Mv
Menüett’, ‘Mv Magdaléna’ and ‘Mv Karizma’ had significantly smaller AUDPC values
than the experimental mean, and these did not differ significantly from that of ‘Atlas
66’, noted as a source of resistance (Rees and Platz 1990).
0,00
5,00
10,00
15,00
20,00
25,00
30,00
35,00
40,00
45,00
KA
TE
PW
AN
D495
BE
ZO
ST
AJA
-1M
V-M
AK
AR
ON
I
GK
-KA
LAS
ZG
LEN
LEA
WA
TT
INE
SA
LCE
DO
GK
-PE
TU
RM
V-P
ALO
TA
S
MV
-CS
AR
DA
SF
RO
NT
AN
A
MV
-TO
BO
RZ
O
BA
NK
UT
I-1201M
V-K
OD
MO
N
MV
-SU
VE
GE
SM
V-M
AG
VA
S
MV
-LAU
RA
FA
TIM
A-2
MV
-VE
RB
UN
KO
SM
V-B
ER
ES
GK
-GA
RA
BO
LYM
V-P
ALM
A
MV
-KO
LOM
V-K
OLO
MP
OS
MV
-TO
LDI
MV
-SU
BA
DIS
PO
NE
NT
SA
LAM
OU
NI
MV
-WA
LZE
RG
K-C
SILLA
G
MV
-RE
GIM
EN
TM
V-M
AR
SA
LL
GK
-AT
IM
V-H
OM
BA
R
MV
-BO
DR
I
MV
-TA
MA
RA
MV
-PE
TR
EN
CE
MV
-LUC
IAM
V-V
EK
NI
MV
-KA
RIZ
MA
MV
-MA
GD
ALE
NA
KA
VK
AZ
MV
-ME
NU
ET
T
MV
-MA
ZU
RK
AM
V-M
AM
BO
AT
LAS
-66M
-3
Wheat genotypes
AU
DP
C v
alu
e
LSD5%=6,10
Figure 1. Infection of wheat genotypes with Pyrenophora tritici-repentis (race 1) on the basis of the area
under the disease progress curve (AUDPC)
The percentage distribution of infection scores for the genotypes examined is illustrated
on the Figure 2. Correlation analysis revealed a close significant correlation

VIII. Alps-Adria Scientific Workshop Neum, Bosnia-Herzegovina, 2009
DOI: 10.1556/CRC.37.2009.Suppl.2 175
(r = 0.934***) between the AUDPC values and the extent of infection. The data show
that in the first two experiments (Fig. 2.a.) 4% of the varieties, advanced lines and
genotypes with known genetic background could be placed in the 0–10 (resistant)
AUDPC group, 46% in the 11–20 (moderately resistant) group, 38% in the 21–30
(moderately resistant to moderately susceptible) group, 11% in the 31–40 (moderately
susceptible) group and 1% in the 41–50 (susceptible) group. Among the genotypes bred
in Martonvásár, ‘Mv Mambó’, ‘Mv Mazurka’ and one breeding line (‘Mv139-08’) had
similar resistance to the resistant controls (‘M-3’, ‘Atlas 66’).
4%
46%
38%
11%
1%
0-10
11-20
21-30
31-40
41-50
a.)
6%
27%
54%
10% 3%
b.)
Figure 2. Percentage distribution of the infection of wheat genotypes with Pyrenophora tritici-repentis (race
1) on the basis of lesion types
In the second series of experiments (Fig. 2b.), in addition to varieties and advanced
lines, tests were also made on the greenhouse resistance of breeding lines, when a
further 43 genotypes were included in the study. The data show that in these
experiments 6% of the genotypes could be classified in the 0–10 (resistant) AUDPC
group, 27% in the 11–20 (moderately resistant) group, 54% in the 21–30 (moderately
resistant to moderately susceptible) group, 10% in the 31–40 (moderately susceptible)
group and 3% in the 41–50 (susceptible) group. The results indicated that four
Martonvásár breeding lines (’Mv14’, ’Mv19’, ’Mv20’, ’Mv22’) had significantly lower
AUDPC values than the average and did not differ in resistance from the resistant
genotype ’M-3’.
Conclusions
Under greenhouse conditions it was found that several varieties and advanced lines bred
in Martonvásár had reliable resistance to race 1 of tan spot. Correlation analysis
revealed that the greenhouse data (AUDPC values calculated on the basis of lesion type
and severity %) exhibited a significantly positive moderate correlation (r = 0.4 –0.6)
with the field data (AUDPC values calculated from the lesion type and severity % on
the flagleaf). Similar results were reported by Evans et al. (1999). The more extensive
analysis of breeding lines could contribute to further improvements in the complex
disease resistance of future Martonvásár wheat varieties and to an increase in selection
efficiency.
Acknowledgements
This work was funded by the Jedlik Project (OM188/2007).

Vol. 37, 2009, Suppl. Cereal Research Communications
176
References
Ágoston T. - Pepó P.: 2005. İszibúza-fajták termıképességének és betegségellenállóságának vizsgálata.
Növénytermelés, 54: 5-6. 387-401.
Ali S. - Francl L. J.: 2001. Recovery of Pyrenophora tritici-repentis from barley and reaction of 12 cultivars
to five races and two host-specific toxins. Plant Disease, 85: 580–584.
Aponyiné G. I. - Békési P. - Matók I.: 1988. Újabb betegség veszélyezteti a gabonát. Magyar Mezıgazdaság,
43: 4. 9.
Bakonyi J.- Fischl G. - Szunics L.: 1992. A Helminthosporium (Drechslera, Bipolaris, Exserohilum) fajok és
izolátumok patogenitásának összehasonlítása ıszi búzafajtákon mesterséges inokulációs kísérletben.
Növényvédelem, 28: 9. 361-365.
Balogh S. - Rátainé V. R. - Aponyiné G. I.- Schweigert A.- Füzi I.: 1991. A kalászosok helmintospóriumos
levélszáradása. Gyakorlati Agrofórum, májusi különszám. 30–33.
Bathal J. S. - Loughman R. - Speijers J.: 2003. Yield reduction in wheat in relation to leaf disease from
yellow (tan) spot and Septoria nodorum blotch. Europian Journal of Plant Pathology, 109: 435–443.
Carmona M. A. - Ferrazini M. - Barreto D. E.: 2006. Tan spot of wheat caused by Drechslera tritici-repentis :
Detection, transmission, and control in wheat seed. Cereal Research Communications, 32: 2-3. 1043-
1049.
Cséplı M. - Vida Gy. - Bakonyi J. - Veisz O.: 2004. Studies on the resistance of wheat genotypes to two
different races of Pyrenophora tritici repentis (Died.) Drechsler. Proc. of the EUCARPIA XVII, Tulln,
2004. (eds.: J. Wollmann, H. Grausgruber, P. Ruckenbauer). Genetic Variation for Plant Breeding, 185-
188.
Csısz L-né.: 2007. Növénykórtani és rezisztencia vizsgálatok az ıszi búza rozsda, lisztharmat és
levélfoltosságok kórokozóival. PhD értekezés, Keszthely.
Csısz L-né.: 2006. Hat év tapasztalata az ıszi búza levélfoltosságát elıidézı kórokozókról. Gyakorlati
Agrofórum Extra, 14: 44-47.
Evans C. K. - Hunger R. M. - Siegerist W. C.: 1999. Comparison and field testing to identify wheat resistant
to tan spot. Plant Disease, 83: 269-273.
Janda T. - Cséplı M. - Németh Cs. - Vida Gy. - Pogány M. - Szalai G. - Veisz O.: 2008. Combined effect of
water stress and infection with the necrotrophic fungal pathogen Drechslera tritici-repentis on growth
and antioxidant activity in wheat. Cereal Research Communications, 36: 1. 53-64.
Kuti Cs. - Láng L. - Bedı Z.: 2008. Informatical background of field experiments. Cereal Research
Communications VII. Alps-Adria Scientific Workshop, 36: 5. 171-174.
Lamari L. - Bernier C. C.: 1989. Evaluation of wheat lines and cultivars to tan spot Pyrenophora tritici-repentis based on lesion type. Canadian Journal of Plant Pathology, 11: 49–56.
Lamari L. - Bernier C. C.: 1991. Genetics of tan necrosis and extensive chlorosis in tan spot of wheat caused
by Pyrenophora tritici-repentis. Phytopathology, 81: 1092–1095.
Lamari L.- Strelkov S. E. – Yahyaoui A. – Orabi J. - Smith R. B.: 2003. The identification of two new races
of Pyrenophora tritici-repentis from the host center of diversity confirms a one-to-one relationship in tan
spot of wheat. Phytopathology, 93: 391-396.
Németh Cs.- Cséplı M. - Vida Gy. - Bedı Z. - Veisz O.: 2006. Az abiotikus (szárazság) és a biotikus
[Pyrenophora(Drechslera) tritici-repentis (Died.)Drechsler] stressz-ellenállóság kapcsolatának
vizsgálata búzafajtákban. Növénytermelés, 55: 3-4. 141-151.
Rátainé V. R. - Pecze R. 1997. Ismerkedjünk az ıszi búza levélszáradásával! Gyakorlati Agrofórum, 8: 6. 41–
43.
Rees R. G. - Platz G.J.: 1990. Sources of resistance to Pyrenophora tritici-repentis in bread wheats.
Euphytica, 45: 59-69. Sárová J. - Hanzalová A. - Bartos P.: 2005. Races of Pyrenophora tritici-repentis in the Czech Republic.
Acta Agrobotanica, 58: 73-78.
Schilder A. M. C. - Bergstrom G. C.: 1994. Infection of wheat seed by Pyrenophora tritici-repentis. Canadian
Journal of Botany, 72: 510-519.
Shabeer A. - Bockus W.W.: 1988. Tan spot effects on yield and yield components relative to growth stage in
winter wheat. Plant Disease, 72: 599-602.
Shaner G. - Finney R. E.: 1977.The effect of nitrogen fertilization on the expression of slow-mildewing
resistance in Knox wheat. Phytopathology, 67: 151–156.

VIII. Alps-Adria Scientific Workshop Neum, Bosnia-Herzegovina, 2009
DOI: 10.1556/CRC.37.2009.Suppl.2 177
SUSCEPTIBILITY OF CROATIAN MAIZE HYBRIDS TO EUROPEAN CORN BORER
Emilija RASPUDIĆ 1 – Marija IVEZIĆ
1 – Mirjana BRMEŽ
1 – Ivana MAJIĆ
1
1 Department of Plant Protection, Faculty of Agriculture in Osijek, Josip Juraj Strossmayer University of
Osijek, Trg Sv. Trojstva 3, 31000 Osijek, Croatia, e-mail: [email protected]
Abstract: European corn borer (ECB) tunnel and feed within vascular tissues of maize whereas disrupt water
and nutrient transport within plants. Occurred injuries predispose plant to stalk breakage and ear droppage,
and may result in serious maize yield losses. The aim of this work is to evaluate susceptibility of maize
hybrids to ECB. Two years of field studies were conducted among seven maize hybrids at Croatian site.
Susceptibility to ECB was assessed by measuring tunnel length and number of ECB larva in dissected maize
stalks. Grain yield was measured and calculated to 14% moisture level. Intensity of ECB attack in both years
was 100%. Means for tunnel length were significantly higher in 2008 then in 2007. The extent of tunneling
injury ranged between hybrids from 13.70 to 29.20 cm in 2007, and from 40.84 to 64.42 cm in 2008.
Significant differences for tunnel length and number of larva among hybrids were found in both years. One
larva in average was found in each dissected stalk, whereas mean number ranged from 0.96 and 2.16 in 2007,
and from 1.28 to 2.03 larva in 2008, respectively. A significant positive correlation between tunnel length and
number of larva has been observed for all hybrids in both years with exception of one hybrid in 2008 year.
Our results indicate substantial variability among hybrids, and hybrid OsSK 602 showed tolerant
characteristics. However, all investigated hybrids potentially may encounter detrimental effects of ECB attack.
Keywords: European corn borer, maize hybrids, susceptibility
Introduction
European corn borer (Ostrinia nubilalis Hübner) is one of the most important pests
attacking maize (Zea mays L.) in Europe. The main damage to maize is caused by larvae
which tunnel into the stalk, or bore into the ear shank resulting in grain yield losses.
Heavily tunneled stalks suffer from ear droppage, stalk breakage and lodging reducing
the possibility for proper machine harvest. Larval feeding within the plants cause
vascular disruption injury and produces physiological stress in plants that predisposes
the plants to secondary infections by other pathogens such as stalk rot (Peterson and
Higley, 2000). According to Malvar et al., (2007), corn borer attack is the main biotic
stressor for the maize crop although maize is very sensitive as well to other
agroecological and agrotechnical conditions (Pepó et al., 2008).
Research on early maturing European commercial hybrids against ECB reports 6.1%
grain yield loss for each ECB larva per plant (Bohn et al., 1999). Similar results are
reported from USA by Bode and Calvin (1990). Studies from Spain characterized
several maize landraces from southern Europe as more tolerant to ECB attack (Malvar
et al., 2007).
In Croatia, the ECB occur univoltine or bivoltine (Raspudic et al., 1998). In 1990’s, in
eastern Croatia which is considered as a main maize growing area of the country
(Jambrović et al., 2008), the extent of infested maize stalks by ECB increased
significantly, exceeding 50% intensity of attack while control measures have never been
implemented (Ivezić and Raspudić, 2001). Maize production in Croatia is under
constant threat of several other major pests (Ivezić et al., 2007; Jug et al., 2008).
Raspudić et al. (1998) performed research on resistance of maize hybrids against ECB
by evaluation of several agronomic traits associated with tolerance. Several Croatian
hybrids (OsSK 382, OsSK 664 and OsSK 462) proved to be more tolerant but farmers

Vol. 37, 2009, Suppl. Cereal Research Communications
178
gradually substituted these hybrids with newly developed high yielding maize hybrids
which are often cultivated in monoculture. Pest management measures such as chemical
or biological control are requiring precisely timing and application, and therefore the
cultivation of resistant genotypes would be the most effective tool for controlling ECB
considering both ecological and economical aspects (Melchinger et al., 1998).
This paper reports a screening of a seven commercial maize hybrids for susceptibility to
ECB. The aim of our study was to compare commercial maize hybrids using tunnel
length as a tolerance trait, number of larva per plant and their relationship and by
measuring grain yield.
Materials and methods
Croatian maize hybrids representing FAO 400 – 700 maturity groups were evaluated in
2007 and 2008 for susceptibility to ECB. Each year seven commercial maize hybrids:
OsSK 444, OsSK 499, OsSK 552, OsSK 596, OsSK 602, OsSK 617, OsSK 713
(Agricultural Institute Osijek) were in planted in plots with two replications in the fields
characterized by high natural occurrence of ECB. Trials were planted in Osijek, Croatia
(45º32″N, 18º44″E). Plots were planted in density of approximately 57 000 plants ha-1
. For each hybrid, the percentage of grain moisture was recorded and yield at 140 g kg
-1
moisture content was calculated. Damage was evaluated in September, prior to the
harvest. Maize stalks of 25 plants of each hybrid in each replication (total of 50 plants)
were dissected and tunnel length (cm) was measured. Number of larva occurring in
stalks was recorded and intensity of attack was determined.
A combined analysis of variance across years was performed with PROC GLM
procedure of SAS software (2000). Mean comparisons were made by least significant
difference (LSD).
Results and discussion
Mean for tunnel length showed high level of variance within the investigated hybrids
(Table 1.). Although number of larva detected in plants across years was similar, length
of tunneling in 2008 was longer for 22 cm in average for all hybrids compared to 2007.
Intensity of attack of ECB reached 100% for each hybrid in each year.
Table 1. Basic statistics for tunnel length and number of larva per plant
Mean Std Dev CV Min Max
Variable 2007 2008 2007 2008 2007 2008 2007 2008 2007 2008
Tunnel length
(cm) 23.82 45.78 15.83 29.65 66.48 67.79 0 3 94 143
Number of
larva 1.59 1.72 1.44 2.60 90.86 21.20 0 0 9 7
Differences were significant for tunnel length and number of larva for all hybrids across
years (Table 2.). Hybrid OsSK 444 significantly differed among hybrids in 2007 since it
had the least damaged stalk with tunnel length in average of 13.7 cm, and lowest
number of larva in 2008. All hybrids, except OsSK 444 and OsSK 552 produced higher

VIII. Alps-Adria Scientific Workshop Neum, Bosnia-Herzegovina, 2009
DOI: 10.1556/CRC.37.2009.Suppl.2 179
yields in 2008 although damage by ECB measured by tunnel length was significantly
higher in the same year. The most productive hybrids were OsSK 713 and OsSK 602 in
2008. Hybrid OsSK 713 had shortest tunnel length in 2008 and second highest grain
yield. However, in 2007 level of tunneling for the same hybrid was significantly higher
in relation to four hybrids but again it had satisfactory grain yield. The least effect by
ECB occurred for hybrid 602 since this hybrid was significantly different in 2008
compared to all other hybrids when it suffered the greatest damage and scored the
highest grain yield. Same hybrid was the highest yielding hybrid across the years as
well.
Table 2. Mean values of tunnel length and number of larvae in maize stalks, with correlation coefficient
between tunnel length and number of larvae, and grain yield
Year 2007
Hybrid Larva Tunnel length
(cm) r tunnleng, larv
Grain yield
(t ha-1)
OsSK 444 0.96c 13.70d 0.476 9.00
OsSK 499 1.60b 21.36c 0.430 8.85
OsSK 552 1.80ab 28.10ab 0.643 11.81
OsSK 596 2,16a 29.50a 0.544 9.49
OsSK 602 1.30bc 22.60bc 0.618 12.03
OsSK 617 1.68ab 22.28bc 0.446 9.62
OsSK 713 1.66ab 29.20a 0.407 10.37
Year 2008
OsSK 444 1.28b 42.96c 0.513 8.75
OsSK 499 1.45ab 41.45c -0.330 12.51
OsSK 552 1.66ab 48.10b 0.046 11.27
OsSK 596 2.03a 59.19ab 0.358 11.31
OsSK 602 1.76ab 64.42a 0.136 14.21
OsSK 617 1.76ab 42.28c 0.271 12.54
OsSK 713 1.98a 40.84c 0.142 14.20
Mean values with a different letters are significantly different at the 0.05 probability level; Larva – number of
larva per plant; r tunnleng, larv – correlation between tunnel length and number of larvae; Grain yield adjusted to
14% grain moisture content
Correlation between the tunnel length and number of larva has been moderate to strong
positive in 2007, while low to moderate positive correlation was found for all except
one hybrid (OsSK 499) in 2008 when moderate negative correlation occurred.
Since stalk lodging resistance is an important aspect of achieving economically justified
yields, agronomic traits like tunnel length and yield loss per cm tunnel length are used
for evaluation of tolerance (Melchinger et al., 1998). Number of larva per plant solely
can not be taken as an indicator of severity of ECB damage in terms of tunnel length
since level of tunneling was significantly different between the years while number of
larva was at similar size. In general, all hybrids proved to be susceptible to ECB
however high yields were achieved in both years. Grain yields were not subjected to
statistical analyses since reduction in grain yield is not solely due to direct impact of
ECB but also influenced by secondary infestations of other pathogens (Jarvis et al.,

Vol. 37, 2009, Suppl. Cereal Research Communications
180
1984). Melchinger et al. (1998) suggested higher level of resistance in late maturing
groups and our results proved late maturing hybrid OsSK 602 to be able to produce high
yields with severely damaged stalk.
Conclusions
Damage caused by ECB is of major concern for Croatian farmers since maize has been
often cultivated in monoculture and traditionally it has been considered as one of the
most important cereal. All hybrids proved to be susceptible to ECB but also able to
produce high yields under ECB attack. Most of the hybrids had higher grain yields in
2008 although stalks were more damaged compared to 2007 indicating that genotype
and environment were the main factors influencing grain yield. Nevertheless, in 2008,
one hybrid OsSK 602 showed tolerant characteristics by scoring highest yield with the
most damaged stalk. The effect of ECB on reduction of grain yield can be associated in
two hybrids (OsSK 444 and OsSK 552) since the grain yield decreased in 2008 while
the tunnel length was longer. The ECB is common pest in Croatia and continuous threat
to production of high yields so more screening studies against ECB including more
commercial hybrids will be necessary in order to make recommendations to farmers.
Acknowledgements
This research was conducted within the project financed by the Ministry of Science,
Education and Sport of Republic of Croatia.
References
Bode W.M. - Calvin. D.D.: 1990. Yield–loss relationships and economic injury levels for European corn borer
(Lepidoptera: Pyralidae) populations infesting Pennsylvania field corn. Journal of Economic Entomology,
83:1595–1603.
Bohn M. - Kreps R.C.- Klein D. – Melchinger A.E.: 1999. Damage and grain yield losses caused by European
corn borer (Lepidoptera: Pyralidae) in early maturing European maize hybrids. Journal of Economic
Entomology, 92:723-731.
Ivezić M. - Raspudić E. - Mlinarević M. – Šamota D.: 1998. Suzbijanje kukuruznog moljca (Ostrinia nubilalis Hübner) na kukuruzu, biološkim preparatom Biobit XL. Poljoprivreda, 4: 1. 45-49
Ivezić M. – Raspudić E.: 2001. The European Corn Borer (Ostrinia nubilalis Hübner) review of results from
Croatia. Poljoprivreda, 7: 1. 15-17.
Ivezić M.–Raspudić E.–Brmež M.–Pančić S.–Majić I.: 2007. Implementation of pheromone traps in detecting
click beetles population level in East Croatia. Cereal Research Communications, 35: 2. 513-516.
Jambrović A. – Andrić L. – Ledenčan T. – Zdunić Z.: 2008. Soil and genotype influences on yield and
nutritional status of maize hybrid parents. Cereal Research Communications. 36: 2. 1015-1018.
Jarvis J.L. – Clark R.L. – Guthrie W.D. – Berry E.C. - Russell W.A.: 1984. The relationship between second-
generation European corn borers and stalk rot fungi in maize hybrids. Maydica 29:247-264.
Jug D. – Brmež M. – Ivezić M. – Stipešević B. – Stošić M.: 2008. Effect of different tillage systems on
populations of common voles (Microtus arvalis). Cereal Research Communications, 36: 2. 923 -926.
Malvar R.A -. Butrón A. – Alvarez A. - Padilla G. - Cartea M.E. - Revilla P. - Ordás A.: 2007. Yield
performance of the European Union Maize Landrace Core Collection under multiple corn borer
infestations. Crop Protection, 26: 775–781.
Melchinger A.E. - Kreps R.C. – Späth R. - Klein, D. - Schulz B.: 1998. Evaluation of early-maturing
European maize inbreds for resistance to the European corn borer. Euphytica , 99: 115–125.
Pepó P. – Vad A. – Berényi S.: 2008. Effects of irrigation on yields of maize (Zea mays L.) in different crop
rotations. Cereal Research Communications. 36: 2. 735-738.
Peterson R.K.D. - Higley L.G. (ed.): 2000. Biotic stress and yield loss. CRC Press, Boca Raton, FL.
SAS/STAT User's Guide.: 2000.Version 8. Cary, NC, SAS Institute Inc.

VIII. Alps-Adria Scientific Workshop Neum, Bosnia-Herzegovina, 2009
DOI: 10.1556/CRC.37.2009.Suppl.2 181
WEED AS AN IMPORTANT STRESS FACTOR IN ECOLOGICAL FARMING
Stefan TÝR – Tomáš VEREŠ – Magdaléna LACKO-BARTOŠOVÁ
Department of Sustainable Agriculture and Herbology, Faculty of Agrobiology and Food Resources, Slovak
University of Agricultural in Nitra, Tr. A. Hlinku 2, 94901 Nitra, Slovakia, e-mail: [email protected]
Abstract: Weed surveys were conducted on farms being under conversion to ecological farming system
between 2005-2007. The aim was to detect the most harmful weeds, as important biotic, environmental stress
factor, on the farms in the canopies of winter cereals, spring barley, maize for grain and silage and pea for
grain in all production region of the Slovak Republic. The actual weed infestation was evaluated by standard
methods common used by EWRS a numerous method per square. In the winter cereals 19 weed species were
determined, the most problematic were: annual winter weeds (Tripleurospermum perforatum, Capsella bursa pastoris, Thlaspi arvense, Lamium purpureum), annual spring weed (Persicaria spp.) and perennial weed
(Elytrigia repens). In the spring barley 19 weed species were determined, the most problematic were: annual
winter weeds (Tripleurospermum perforatum, Galium aparine), annual early spring weed (Avena fatua) and
perennial weeds (Elytrigia repens and Cirsium arvense).
Keywords: weed infestation, conversion, ecological farming system, biotic stress
Introduction
Development of environmentally and economically sound agricultural production
systems of cereals is an important aim in agricultural research (Hoffmann et al., 2007;
Hornok et al., 2007; Kovacevic et al., 2006; Lalic et al., 2007; Takács-György 2007).
The development of integrated weed management strategies requires knowledge of the
mechanism that influences the compositional changes in weed flora (Shresta et al.,
2002). Competition by weeds is more important in ecological systems than in
conventional systems, where weeds can be controlled by herbicides. Diversifying
rotation patterns to include both spring and winter crops has helped producers to control
weeds (Blackshaw et al., 1994; Buzsáki, Béres, 2007).
Materials and methods
In 2005-2007 weed survey on the farms in conversion to ecological agriculture was
conducted in the west and central part of the Slovak Republic.
Actual weed infestation of winter cereals and spring barley was evaluated at nine
ecological farms in conversion, situated in all production area of the Slovak Republic.
Time of sampling was spring, before mechanical regulation of weeds. Pre-crops of
winter wheat were legumes and oil crops; pre-crop of spring barley was maize for
silage. For evaluation, modified international scale EWRS (Anonymous, 1988) was
used. Weed infestation of each field was determined at monitoring 1 m2 area. Number
of replicates for each field was determined according to EWRS (Anonymous, 1988).
Randomly distributed quadrants were situated min. 20 m from field margin and apart of
each other. Total area of evaluated winter cereals fields was 2 452 ha and of spring
barley 608 ha. The weeds were arranged to the following groups: 'T' means Therophyta
(annual) - T1: Sprouting in autumn, overwinters and develop its vegetative parts in early
spring (e.g. Stellaria media) - T2: These weeds sprouts in autumn (mainly) or
sometimes in springtime (e.g. Avena sterilis) - T3: Sprouting in spring and develop its
seed in early summer (e.g. Cyperus spp) - T4: Sprouting in spring or early summer and

Vol. 37, 2009, Suppl. Cereal Research Communications
182
its lifecycle takes till the end of summer (e.g. Chenopodium album) 'G' means Geophyta
(perennials, which overwinter in the soil) - G1: rhizome (e.g. Agropyron repens)
Table 1. Modified EWRS evaluation scale of actual weed infestation.
Actual weed infestation
None Weak Low Medium High
Infestation level
0 1 2 3 4
Group of weeds
Number of weeds per m2
Very dangerous - ≤ 2 3-5 6-15 ≥ 16
Less dangerous - ≤ 4 5-8 9-20 ≥ 21
Less important - ≤ 8 9-15 16-30 ≥ 31
Results and discussion
Weeds cause the major problem in conversion to ecological system. Beside nutrients,
weed management is regarded as the main technical and system problems, which affect
the yields and economic viability (Lacko-Bartošová, Macenková, 2006). During 2005 –
2007, weed survey was conducted on 2 452 ha of winter cereals fields and 608 ha of
spring barley fields in conversion to ecological farming. In the winter cereals fields
there were determined 19 weed species, three from the group G1 (perennials), the most
species from the T2 group. Three weed species of these two groups belong to the very
dangerous, namely: Tripleurospermum perforatum, Galium aparine and Elytrigia repens. These species, even ender low weed numbers per m
2, may lower the yields of
crops at about 1-2 t per ha. The highest weed infestation was determined for Capsella bursa-pastoris, Thlaspi arvense and Persicaria spp., over 28% of field area reached
infestation level 4, with more than 31 weed plants per m2. These 3 weed species are less
important and with mechanical weed measures can be suppressed in ecological farming.
In the winter wheat fields, 6 species were determined from T4, T3, T1 groups. To the
most important from mentioned groups belongs Avena fatua, annual species with
similar growth and development pattern as cereals. In our previous research (Týr, 2008;
Týr, Lacko-Bartošová, 2007) in conventional system was determined lower weed
diversity, at about 50% less weed species as compared with ecological. That weed
infestation level before chemical treatment in conventional system was higher than in
ecological. The most problematic weed species in conventional system were Avena fatua, Cirsium arvense, Convolvulus arvensis, Elytrigia repens, Persicaria spp., Thlaspi arvense, Capsela bursa pastoris, Tripluerospermum perforatum.
In the spring barley fields also 19 weed species were found. More weed species belong
to very dangerous like Tripleurospermum perforatum, Galium aparine, Elytrigia repens, Avena fatua; where high level of weed infestation was achieved. Avena fatua
was the most problematic, as a biotic stress factor may reduce the yield of spring barley
to 50 percent. Spring barley as a crop with short vegetative period is in ecological
system more vulnerable to biotic and abiotic stresses and more sensitive to weed
infestation. Therefore complex weed management approach should be applied.
Also Macák et al. (2008a,b) reported significant increase in weed diversity in ecological
system, when weed species occurred in a low incidence. Enhancement of weed diversity

VIII. Alps-Adria Scientific Workshop Neum, Bosnia-Herzegovina, 2009
DOI: 10.1556/CRC.37.2009.Suppl.2 183
in low-input systems, variations caused by weather, soil, nutrient conditions were
studied by Fodor, Pálmai (2008); Kneževic et al. (2008).
Table 2. Weed infestation of winter cereals (2452 ha = 100%)
Weeds infestation of crop in %
0 1 2 3 4 Weed species Weed type
none rare low medium high
Stellaria media L. VILL T1 53.2 10.1 36.7 0.0 0.0
Veronica spp. L. T1 76.0 12.9 8.2 2.9 0.0
Viola spp. MURRAY T1 76.0 13.3 8.2 2.5 0.0
Anthemis arvensis L. T2 94.2 0.0 2.9 2.9 0.0
Apera spica-venti L. T2 47.2 20.2 28.5 4.1 0.0
Capsella bursa pastoris L. T2 50.0 10.1 8.2 3.2 28.5
Galium aparine L. T2 46.6 14.8 24.3 14.3 0.0
Lamium purpureum L. T2 71.5 0.0 0.0 28.5 0.0
Papaver rhoeas L. T2 47.0 20.2 28.5 0.8 3.5
Thlaspi arvense L. T2 52.8 10.1 8.2 0.4 28.5
Tripleurospermum perforatum
Sch. BIP T2 10.1 22.1 24.6 22.8 20.4
Avena fatua L. T3 47.2 24.3 28.5 0.0 0.0
Amaranthus retroflexus L. T4 88.9 8.2 2.9 0.0 0.0
Atriplex spp. L. T4 97.1 2.9 0.0 0.0 0.0
Chenopodium spp. L. T4 77.2 22.4 0.4 0.0 0.0
Persicaria spp. S.F.GRAY T4 53.0 8.9 9.6 0.0 28.5
Acetosa spp. MILL. G1 99.8 0.1 0.1 0.0 0.0
Cirsium arvense L. SCOP. G1 53.1 14.4 24.3 4.1 4.1
Elytrigia repens L. DESV. G1 68.3 2.9 8.2 8.4 12.2
Table 3. Weed infestation of spring barley (608 ha = 100%)
Weeds infestation of crop in %
0 1 2 3 4 Weed species Weed type
none rare low medium high
Stellaria media L. VILL T1 53.9 0.0 46.1 0.0 0.0
Veronica spp. L. T1 87.1 6.1 6.1 0.7 0.0
Viola spp. MURRAY T1 87.1 6.1 6.1 0.7 0.0
Anthemis arvensis L. T2 87.8 6.1 0.0 6.1 0.0
Capsella bursa pastoris L. T2 53.9 0.0 46.1 0.0 0.0
Galium aparine L. T2 47.2 0.0 19.2 16.5 16.5
Lamium purpureum L. T2 53.9 0.0 46.1 0.0 0.0
Melandrium pretense Rohl. T2 53.9 46.1 0.0 0.0 0.0
Thlaspi arvense L. T2 53.9 46.1 0.0 0.0 0.0
Tripleurospermum perforatum
Sch. BIP T2 20.6 20.6 13.2 16.5 16.5
Avena fatua L. T3 54.7 0.0 0.0 0.0 46.1
Galeopis tetrahit L. T3 46.0 33.4 20.6 0.0 0.0
Raphanus raphanistrum L. T3 58.8 30.8 0.0 10.4 0.0
Sinapis arvensis L. T3 47.2 52.1 0.7 0.0 0.0
Amaranthus retroflexus L. T4 58.8 20.6 20.6 0.0 0.0
Chenopodium spp. L. T4 12.8 20.6 66.6 0.0 0.0
Persicaria spp. S.F.GRAY T4 32.7 20.6 46.7 0.0 0.0
Cirsium arvense L. SCOP. G1 17.1 6.1 33.7 43.1 0.0
Elytrigia repens L. DESV. G1 7.0 46.1 13.9 16.5 16.5

Vol. 37, 2009, Suppl. Cereal Research Communications
184
Conclusions
Weed infestation can be regarded as important stress factor in conversion from
conventional to ecological agriculture. In winter wheat and spring barley fields were
determined 19 weed species. Very dangerous in winter cereals were Tripleurosprermum
perforatum, Elytrigia repens and Galium aparine. In spring barley except of these three
species, Avena fatua was the most important. Weed species diversity increased in
ecological system, but the level of weed infestation was lower as compared with
conventional system. Spring barley is more sensitive crop regarding the weed
management in ecological system as winter cereals.
Acknowledgements
This paper has been supported by VEGA Project No. 1/0457/08 “Research and
Development of Technologies for Sustainable Agricultural Systems.”
References
Anonymous. 1988. Guidance for the use and presentation of statistics in weed researching. Weed Research,
28: 139-144.
Blackshaw RE, Larney FO, Lindwal CW, Kozub GC. 1994. Crop rotation and tillage effect on weed
populations on the semiarid Canadian prairies. Weed Technology 8, 231-237. Buzsáki K, Béres I. 2007. Competition for nutrients between yellow nutsedge (Cyperus esculentus) and maize. Cereal
Research Communications 35, 305-308.
Fodor L, Pálmai O. 2008. The influence of nitrogen fertilization and sowing time on the weediness of winter wheat.
Cereal Research Communications 36, Suppl. 1159-1162.
Hoffmann S, Debreczeni K, Hoffmann B, Berecz K. 2007. Grain yield of wheat and maize as affected by previous
crop and seasonal impacts. Cereal Research Communications 35, 2. 469-472. Hornok M, Balogh A, Pepó P. 2007. Critical elements of sustainable winter wheat (Triticum aestivum) management
in biculture and triculture crop rotation. Cereal Research Communications 35, 2. 481-484.
Knežević M, Ranogajec L, Šamota D. 2008. Effects of soil tillage and herbicides on weeds and winter wheat yields.
Cereal Research Communications 36, Suppl. 1403-1406.
Kovacevic J, Lalic A, Kovacevic V, Banaj D. 2006. Response of barley to ameliorative fertilization. Cereal Research
Communications 34, 1. 565-568. Lacko-Bartošová M, Macenková K. 2006. Produkčné parameter v udržateľných systémoch hospodárenia na ornej
pôde. Aktuálne problémy riešené v Agrokomplexe, SPU Nitra, 45-48. ISBN 80-8069-799-X.
Lalic A, Kovacevic J, Šimic G, Drezner G, Guberac V. 2007. Environmental effects on grain yield and malting
quality parameters of winter barley. Cereal Research Communications 35, 2. 709-712.
Macák M, Žák Š, Djalovic I, Szombathová N. 2008a. The influence of an ecological and a low input system on weed
density, weed diversity and weed competition in spring barley. Journal of Plant Diseases and Protection, Special
Issue XXI, 425-430.
Macák M, Žák Š, Birkás M, Djalovic I, Slamka P. 2008b. The influence of an ecological and low input system on yield and yield components of spring barley. Cereal Research Communications 36, Suppl. 1343-1346.
Shrestha A, Knezevic SZ, Roy RC, Ball-Coelho BR, Swanton CJ. 2002. Effect of tillage, cover crop and crop rotation
on the composition of weed flora in a sandy soil. Weed Research 42, 76-87.
Takács-György K. 2007. Economic effects of chemical reduction in arable farming. Cereal Research
Communications 35, 2. 1177-1180.
Týr Š. 2008. Weed infestation of winter wheat with monocotyledons weeds in the integrated agricultural systems in
the years 1997-2006. Lucrari Stiintifice Facultatea De Agricultura 40, 1. 533-537.
Týr Š, Lacko-Bartošová M. 2007. Weed infestation and weed management in the integrated and ecological farming systems. Savremena Poljoprivreda 56, 3-4. 243-251.

VIII. Alps-Adria Scientific Workshop Neum, Bosnia-Herzegovina, 2009
DOI: 10.1556/CRC.37.2009.Suppl.2 185
COMPARATION OF YIELDS AND FINANCIAL RESULTS FOR DIFFERENT DURUM WHEAT VARIETIES IN MEDITERRANEAN CONDITIONS
Anita Silvana ILAK PERŠURIĆ1 – Milan OPLANIĆ1 – Elvino ŠETIĆ2 – ðordano PERŠURIĆ2 1 Department of Economics and Rural Development, Institute of Agriculture and Tourism, K. Hugues 8,
Poreč, Croatia, e-mail: [email protected]
2 Department of Agriculture and nutrition, Institute of Agriculture and Tourism, K. Hugues 8, Poreč, Croatia
Abstract: Production costs, gross revenue and profitability of ten durum wheat cultivars was evaluated during
two vegetation seasons in Poreč, Croatia at northwestern Mediterranean area. Gross revenues and profits
depended upon grain yield and protein content. Highest average biannual profit was 287 EUR ha-1 for variety
Iride, followed by varieties Claudio, Solex and Preco with profits 256 – 211 EUR ha-1. Lowest average profit
had Simeto, 68 EUR ha-1. Varieties Iride, Simeto and Neodur gained higher profits in dry climate
circumstances 2002., while varieties Claudio, Colosseo and Torrebianca gained higher profit in 2001. as a
consequence of higher precipitation during vegetation. The study highlights, that varietal stress tolerance of
crop plants may have an economic importance.
Keywords: gross revenue, profit, protein, Triticum turgidum L. Var durum.
Introduction
Durum wheat (Triticum turgidum L. Var durum) is a high quality wheat, used mostly
for semolina in pasta products. In scientific research, grain yield and quality are key
quantitative traits reported (Balogh et al., 2007; Steward et al., 2002; Royo et al., 2006).
Although some papers discuss on simultaneous effects of temperature and rainfall
(Garcia del Moral et al., 2003; Royo et al., 2007), still yield is mostly concerned
(Simmonds, 1995; Vita and Maggio A. 2007). Manufacturing and marketing of durum
products is concentrated in the Mediterranean region. Since Croatia is situated in the
Mediterranean and has favorable climate conditions this paper examines different
durum varieties production. Our aim was to examine economic potential of durum
wheat, focused to gross revenue and profits as reported in other Mediterranean countries
(Drezner et al., 2006, Ferraresi, 2002, Ozberk et al. 2006; Royo et al., 2007).
Materials and methods
Field trials were carried out at Poreč in nortwest Croatian Mediterranean area during
two vegetations (2000/2001. and 2001/2002.) on deep red clay soil with average 600
mm precipitation. Ten cultivars were examined: Neodur, Colosseo, Duilio, Simeto,
Torrebianca, Claudio, Iride, Verdi, Solex and Preco. Technological procedures, manure
and pesticide costs were equal in both years and for all varieties. Grain yield and protein
concentration for each cultivar were analysed by NIT technology. Achieved yields were
calculated to standard moisture value 13%. Cost-benefit method was used for economic
analysis. Direct costs were determined by calculations. Marketing and management fees
were 2% of variable costs while interest on operating capital was 5%. In gross revenue
State subventions were added (225 EUR ha-1
). Durum market prices in 2001. and 2002.
were 150 EUR t-1
for less than 12.5% protein, 165 EUR t-1
for 12.5-13.5% protein, while
for 13.5% protein it was marketed at 185 EUR t-1
(USDA, 2007).

Vol. 37, 2009, Suppl. Cereal Research Communications
186
Results and discussion
Durum wheat yield in 2001. rated from 5.51 t ha-1
for Simeto to 7.07 t ha-1
for Solex,
while in 2002. lower yields were evident, from 4.95 t ha
-1 at Torrebianca to 6.43 t ha
-1
for Iride (data not show). All cultivars achieved lower yields (in average 10%) in 2002.
when precipitation was 345 mm (from October 2001.- May 2002.) respectively 228 mm
less comparing to same period of season before (data not show). Higest sensitivity to
reduced precipitation were noticed by Torrebianca that yielded 27% less in 2002. and
Solex that yielded 25% less. Most homogenous yields were noticed by Coloseo and
Verdi which yield varieted for only 1% in 2002, respectively for 2% less in 2001. (data
not show). Highest biannual average grain yield had Iride (6.68 t ha-1
) followed by
Claudio and Verdi (6.32 respectively 6.25 t ha-1
)(Figure 1). Lowest average biannual
yields were recorded for Simeto (5.42 t ha-1
), Colosseo (5.54 t ha-1
) and Neodur (5.73 t
ha-1
). Grain yields were higher than ones recorded in Italian and Spanish literature
(Ferraresi, 2002; Royo et al., 2006).
4,0
4,5
5,0
5,5
6,0
6,5
7,0
Neo-
dur
Colo-
sseo
Duilio Simeto Torre-
bianca
Cla-
udio
Iride Verdi Solex Preco
Cultivar
Yie
ld (t
ha-1
) .
0
2
4
6
8
10
12
14
16
Pro
tein
conte
nt (%
) .
Average grain yield Average protein content
Figure 1. Average biannual grain yield and protein content by cultivar
Highest biannual protein content (14.44%) had cultivar Simeto, followed by Colosseo
(13.99%) and Neodur (13.89%) (Figure 1). Lowest average protein content had Duilio
(10.59%) and Verdi (10.88%). Protein values ranged similar to the variation reported by
Fiez et al. (1994). Also as expected, there was a medium negative correlation between
grain yield and protein concentration (r =−0,43, P=0,05). This relationship has been
reported in the literature (Simmonds, 1995). All cultivars except of Duilio and Verdi
had higher grain protein content in 2002. when lower precipitation was recorded.
Highest deviations were evident for Simeto in 2002. which had protein content 174 g
kg-1
, respectively 59 g kg-1
higher than in 2001. Mulla et al. (1992) and Fiez et al. (1994) also confirmed relationships of higher protein concentration and lower
availability of water in soils. Both authors identified moisture stress-nitrogen

VIII. Alps-Adria Scientific Workshop Neum, Bosnia-Herzegovina, 2009
DOI: 10.1556/CRC.37.2009.Suppl.2 187
interactions during grain fill. Gross revenues for durum wheat rated from 1.057 EUR ha-
1 for Simeto up to 1.379 EUR ha
-1 for Claudio in 2001., respectively from 1.040 EUR
ha-1
for Torrebianca up to 1.415 EUR ha-1
for Iride in 2002. (Table 1). Average biannual
revenues above 1.300 EUR ha-1
were achieved by Claudio and Iride which met two
criteria: grain yield higher than 6,3 t ha-1
along with protein content above 12,5%.
Lowest biannual gross revenues 1.133 EUR ha-1
had Simeto. Production costs structure
Table 1. Economical results for durum production
Cultivar
Value Neodur
Colo-
sseo Duilio Simeto
Torre-
bianca
Clau-
dio Iride Verdi Solex Preco
2000/2001.
Gross return
(EUR ha-1) 1.105 1.254 1.127 1.057 1.246 1.379 1.269 1.266 1.291 1.229
Production cost
(EUR ha-1) 1.069 1.085 1.050 1.065 1.052 1.068 1.055 1.051 1.036 1.061
Profit
(EUR ha-1) 36 169 77 -8 194 311 214 215 255 168
2001/2002.
Gross return
(EUR ha-1) 1.266 1.132 1.159 1.209 1.040 1.268 1.415 1.157 1.208 1.315
Production cost
(EUR ha-1) 1.069 1.085 1.050 1.065 1.052 1.068 1.055 1.051 1.036 1.061
Profit
(EUR ha-1) 196 47 109 145 -12 200 361 106 172 254
showed major share related to material costs (48-51%) depending on seed quantities and
value. Costs of other materials, human and mechanized labour were equal for all
cultivars because of equal technology used. Highest average biannual profit was
achieved by Iride (287 EUR ha-1
) followed by Claudio (256 EUR ha-1
). In 2001. profit
losses were noticed for Simeto because of low protein content (11.5%) and in 2002. for
Torrebianca because of low grain yield (4.95 t ha-1
) (Table 1). Correlation analysis
determined strong correlations of profits with grain yield (r=0.83, P=0.05) and weak
correlation with protein content (r=0.11, P=0.05). Significant aberration of these values
for different cultivars imply economic success in different climate environments. In this
sense Iride, Simeto and Neodur gained significantly higher profits (147-161 EUR ha-1
)
in dry 2002. because of protein content, while Claudio, Colosseo and Torrebianca
gained higher profit (111-206 EUR ha-1
) in 2001. as a consequence of higher grain
yield.
Conclusions
According to our field trials we determined highest average biannual profits for cultivar
Iride of 287 EUR ha-1
, as a consequence of grain yield of 6.68 t ha-1
and average protein
content at 12.9%. Next highest average biannual profit had Claudio, 256 EUR ha-1
with
average grain yield 6.32 t ha-1
and grain protein content at 13.7%. Lowest profit at 68
EUR ha-1
had Simeto at average grain yield 5.42 t ha-1
and grain protein content 14.4%.

Vol. 37, 2009, Suppl. Cereal Research Communications
188
Correlations between profit and grain yield was strong while between profit and protein
content was weak. Iride, Simeto and Neodur achieved better economic results in low
precipitation environment (total 345 mm during vegetation), while Claudio, Colosseo
and Torrebianca were economically successful in higher precipitation environments
(total 572 mm during vegetation). Therefore we recommend cultivar Iride as best in
accordance with economic terms and area suitability for examined Mediterranean area
of Croatia. The study highlights, that varietal stress tolerance of crop plants may have
an economic importance.
References
Balogh Á. – Hornok M.– Pepó P.: 2007. Study of physiological parameters in sustainable winter wheat
(Triticum aestivum L.) production. Cereal Research Communications, 35: 2. 205-208.
Drezner G. – Dvojković K. – Horvat D. - Novoselović D. - Lalić A. - Babić D. - Kovačević J.: 2006. Grain
Yield and Quality of Winter Wheat Genotypes in Different Environments. Cereal Research
Communications, 34: 1. 457-460.
Garcia del Moral L.F. - Rharrabti, Y. – Villegas D. – Royo C.: 2003. Evaluation of grain yield and its
components in durum wheat under Mediterranean conditions. An Ontogenic Approach Agronomy
Journal, 95: 266-274.
Ferraresi A.: 2002. Sperimentazione varietale sui cereali autunno-verninni. Agricoltura, 9: 87-92.
Fiez T.E. – Miller B.C. – Pan W.L.: 1994. Winter wheat yield and grain protein across varied landscape
positions. Agronomy journal 86: 1026-1032.
Mulla D.J. – Bhatti A.U. – Hammond M.W. – Benson J.A.: 1992. A comparison of winter wheat yield and
quality under uniform versus spatially variable fertiliser management. Agriculture, Ecosystems and
Environment 38: 301-311.
Ozberk I. – Atli A. – Ozberk F. – Braun H.J.: 2006. The effect of grading factors on marketing prices in
durum wheat. Pakistan Journal of Biological sciences, 9: 6. 1132-1138.
Royo, C., Ramdani, A., Moragues, M., Villegas, D.: 2006. Durum Wheat under Mediterranean Conditions as
Affected by Seed Size. J. Agronomy&Crop Science 192: 257-266.
Royo C. – Villegas D. – Rharrabti Y. – Blanco R. – Martos V. – Garcia del Moral L.F.: 2007. Grain growth
and yield formation of durum wheat grown at contrasting latitudes and water regimes in a Mediterranean
environment. Cereal Research Communications, 34: 2-3. 1021-1028.
Simmonds, N. W. 1995. Yields of cereal grain and protein. Experimental Agriculture, 32: 351–356.
Steward C.M. – McBratney A.B. – Skerritt J.H.: 2002. Site-specific durum wheat quality and its relationship
to soil properties in a single filed in Nortern New South Wales. Precision Agriculture 3: 2. 155-168.
USDA: 2007. Increasing wheat prices lead Italians to worry about the cost of pasta and food. Italian Pasta
Prices Climb with Durum Wheat, prepared by Sandro Perini. 7/20/2007, GAIN Report Number: IT7017
Vita P. – Maggio A. 2007. Yield stability analysis in durum wheat progress over the last two decades in Italy.
Cereal Research Communications, 34: 4. 1007-1014.

VIII. Alps-Adria Scientific Workshop Neum, Bosnia-Herzegovina, 2009
DOI: 10.1556/CRC.37.2009.Suppl.2 189
A NEW BIOTIC STRESS FACTOR IN MAIZE PRODUCTION: THE WESTERN CORN ROOTWORM (DIABROTICA V.
VIRGIFERA LECONTE) Csaba L. MARTON
1 – Emese NAGY
1 – Dénes OROSS2
1 Agricultural Research Institute of the Hungarian Academy of Sciences, H-2462 Martonvásár, Brunszvik 2.,
e-mail: [email protected] 2 Mv Bázismag Kft., H-2462 Martonvásár-Erdıhát, Pf.: 1., e-mail: [email protected]
Abstract: The appearance of corn rootworm is one of the greatest plant protection challenges that European
maize production has faced in its 500-year history. Since the first specimens were caught in 1992, the pest is
to be found on all the major maize-producing areas. In several regions the damage it causes has reached the
threshold of economic loss, making it the most problematic of all the biotic and abiotic stress factors faced by
maize growers. The aim of the research was to determine the level of corn rootworm tolerance in various
maize genotypes and to use selection methods to breed maize hybrids whose tolerance level provided
satisfactory protection against this biotic stress factor. The present paper describes studies on the tolerance
level of 43 Martonvásár hybrids at three locations in two years and that of the parental lines at two locations in
one year. Significant differences were found in the tolerance levels of the hybrids, and a close positive
correlation was revealed between root-pull resistance and yield, while there was a close negative correlation
between root lodging and yield and between root-pull resistance and lodging. Root regeneration is also an
important factor, good values of which were found for three hybrids. Inbred lines had smaller root diameter
and lower root pull resistance than hybrids. The heterosis on root diameter was 140 %, while in case of root
pull resistance the heterosis is 123 %.
Keywords: western corn rootworm, resistance breeding, tolerance level
Introduction
Maize production is one of the most important sectors of agriculture in Hungary. On the
basis of profitability it has been one of the top-ranking field crops in recent years, and is
grown on an area of around 1.1–1.2 hectares. Until recently, apart from a few pathogens
(Šimić et al., 2007, Szıke et al., 2007) it has suffered little damage from pests, but this
situation changed after the appearance of the corn rootworm in 1995. It is estimated that
around 100,000 ha were affected on a third of which lodging has been recorded. No
accurate data are available on the yield losses suffered in Hungary, but they probably
amount to around 5% on a national scale. The yield losses caused by the pest may range
from only a few per cent to as much as 70–80% (Sivcev and Tomasev, 2002, Széll et
al., 2005). American data indicate that yield losses combined with the cost of control
lead to a loss of income amounting to around a billion dollars a year (Krysan and Miller,
1986). In addition to agronomic, chemical and biotechnological control measures
(Keszthelyi et al., 2007, Németh et al., 2008) work has been underway for several
decades to breed maize varieties resistant to the pest (Owens et al., 1974, Ivezic et al.,
2006, Pepó and Bódi 2006, Šimić et al., 2007, Tollefson, 2007, Szıke et al., 2008).
Among the three basic mechanisms of host-plant resistance (non-preference, antibiosis,
tolerance) defined by Painter (1951), conventional plant breeding can only be based on
tolerance, where differences arise mainly as the result of diverse growth habits (stronger
stalks, more robust root mass, better root regeneration). The present paper aimed to
determine the corn rootworm tolerance levels of 43 maize hybrids and that of the
parental lines.

Vol. 37, 2009, Suppl. Cereal Research Communications
190
Materials and methods
In order to determine the level of tolerance against corn rootworm, 43 Martonvásár
maize hybrids were sown in experiments at three locations with three replications in
2007 and 2008. All parental inbred lines of the 43 hybrids were also evaluated in 2008.
The extents of natural rootworm infection in the previous year and the type of soil were
taken into consideration when choosing the locations, which included heavily infested
chernozem soils only. The two-rowed plots were 6 m in length with row and plant
spacings of 0.7 m and 0.2 m, respectively. At each location the root-pull resistance was
recorded on two occasions (end of June, middle of Sept.) on 5 plants per plot for each
genotype, after which the visible root damage was scored using the Iowa scale (1: no
damage, 6: loss of three or more root levels) and the root diameter was measured. The
latter values were used to determine the extent of root regeneration (by subtracting the
June values from the September values). After counting the number of lodged plants the
yield was harvested from a 2 m section of each plot. The data were evaluated using
analysis of variance and regression analysis.
Results and discussion
Different levels of root damage were recorded for the tested hybrids at the three
locations and in the two years. The infestation was most severe in Kıszárhegy in 2007,
followed by Lászlópuszta, with the least damage in Martonvásár. A higher level of
infestation was expected based on the corn rootworm damage in the previous year. The
infestation was most severe in Martonvásár in 2008, followed by Lászlópuszta, with the
least damage in Martonvásár. Differences in the degree of infestation were also
observed between the two scoring dates for root damage in 2007. At the second scoring
date there was a substantial reduction in damage compared with the first scoring date in
Kıszárhegy, mainly due to root regeneration (Figure 1), which could be attributed partly
to timely rainfall and partly to genetic differences in regeneration between the hybrids.
There was no significant differences between the two sampling date in 2008.
0
1
2
3
4
5
6
1st sampling
date
2nd sampling
date
1st sampling
date
2nd sampling
date
2007 2008
(Io
wa
scal
e)
Kıszárhegy Lászlópuszta Martonvásár
Figure 1. Root injury in different locations, averages of hybrids (2007-2008)

VIII. Alps-Adria Scientific Workshop Neum, Bosnia-Herzegovina, 2009
DOI: 10.1556/CRC.37.2009.Suppl.2 191
The 43 genotypes tested had different levels of tolerance of the pest, as shown by the
considerable differences in root-pull resistance (72–126 kp) and in the values on the
Iowa scale (1.2–2.4) (Figure 2). Hybrids with greater root-pull resistance values
exhibited significantly less root damage than those with weaker resistance. In 2008, the
resistance levels of both the hybrids and their parent lines were investigated in all three
locations. The degree of root infection demonstrates that corn rootworm damaged the
inbred lines 20 % more severely than hybrids according to Iowa scale (Figure 3).
0
30
60
90
120
150
180
210
EXP37
EXP13
EXP31
EXP28
EXP02
EXP27
EXP01
EXP12
EXP05
(kp
)
0,0
0,5
1,0
1,5
2,0
2,5
3,0
Iow
a sc
ale
Root-pull IOWA
0
0,5
1
1,5
2
2,5
Hybrid Parent
(Iow
a sc
ale)
Kıszárhegy Martonvásár Lászlópuszta
Inbred lines have smaller root diameter (Fig 4) and lower root pull resistance than
hybrids (Fig 5). The heterosis on root diameter, compared to the average of parents is
140 %, while in case of root pull resistance the heterosis is 123 %. However, significant
variation can be observed in the root pull resistance of inbred lines. The root pull
resistance was 37 kp for the inbred lines with the weakest resistance, and 129 kp for the
strongest ones, requiring 3 times larger force to be pulled out from the soil. The low
level of heterosis and the wide range of variation enable efficient selection during
inbreeding.
Conclusions
The 43 maize hybrids tested were found to have different levels of tolerance against the
corn rootworm. Tolerance is based mainly on external traits such as a stronger root
Figure 2. Root-pull and root injury of the hybrids
(average of 3 locations, 2 years and 2 samples) Figure 3. Root injury of the hybrids and lines in
different locations (First sample, 2008)
Figure 4. Root size of the hybrids and lines in
different locations (First sample, 2008) Figure 5. Root pull values of the hybrids and lines
in different locations (First sample, 2008)
0
20
40
60
80
100
120
140
160
180
200
Hybrid Line
(kp
)
Kıszárhegy Martonvásár Lászlópuszta
0
5
10
15
20
25
Hybrid Parent
(cm
)
Kıszárhegy Martonvásár Lászlópuszta

Vol. 37, 2009, Suppl. Cereal Research Communications
192
system with better regeneration ability. Some hybrids had outstanding root regeneration
ability. The selection method used in the experiments, based on root-pull resistance
measurements combined with the counting of lodged plants and the scoring of root
damage on the Iowa scale, proved to be suitable for the relatively rapid testing of the
tolerance of large numbers of maize genotypes.
Inbred lines had smaller root diameter and lower root pull resistance than hybrids. The
heterosis on root diameter was 140 %, while in case of root pull resistance the heterosis
is 123 %. However, significant variation can be observed in the root pull resistance of
inbred lines. The root pull resistance was 37 kp for the inbred lines with the weakest
resistance, and 129 kp for the strongest ones. The low level of heterosis and the wide
range of variation enable efficient selection during inbreeding.
Acknowledgements
This research work was supported by Jedlik Ányos Grant (Project number:
KUKBOGMV OM00063/2008) of NKFP.
References
Ivezic M., Tollefson J. J., Raspudic E., Brkic I., Brmez M. and Hibbard B. E. (2006): Evaluation of corn
hybrids for tolerance to corn rootworm (Diabrotica virgifera virgifera LeConte) larval feeding. Cereal Research Communications 34 (2-3) 1001-1007.
Keszthelyi S., Szabó T., Kurucsai P. (2007): Az amerikai kukoricabogár (Diabrotica virgiferav irgifera LeConte) kártételének vizsgálata. (Study on damage by Western corn rootworm (Diabrotica virgifera virgifera LeConte) Növényvédelem 43 (8) 345-351
Krysan, J. L. and Miller, T. A. (1986): Methods for study of pest Diabrotica. Springer-Verlag, New York,
USA.
Németh T., Nádasy M., Marczali Zs., Simon F., Nádasyné E. I., Takács J. (2008): Effect of soil microbe
preparation (EM-1) on the damage of Western corn rootworm (Diabrotica virgifera virgifera LeConte) Cereal Research Communications 36:843-846
Owens, J.C, Peters, D.C., Hallauer, A.R. (1974): Corn rootworm tolerance in maize. Environ. Entomology 3:
767-772
Painter, R.H (1951): Insect Resistance in Crop Plants. University of Kansas Press, Lawrence, KS.
Pepó P. and Bódi Z. (2006): Adaptation of maize lines and hybrids to abiotic/biotic stresses Acta Agronomica Hungarica, 54 (4) 397-403
Šimić B., Ćosić J., Rozman V., Liska A. (2007): Maize inbred lines resistance to fusarium ear rot. Cereal Research Communications 35 (2) 293-296
Šimić D., Ivezi M., Brkić I., Raspudić E., Brmez M., Majić I., Brkić A., Ledenćan T., Tollefson J. J., Hibbard
B. E. (2007): Environmental and genotypic effects for western corn rootworm tolerance traits in american
and european maize trials. Maydica 52:425-430
Sivcev I., Tomasev I. (2002). Distribution of Diabrotica virgifera virgifera LeConte in Serbia in 1998. Acta Phytopatholigica et Entomologica Hungarica 37:145-153
Széll E., Zsellér I., Ripka G., Kiss J., Princzinger G. (2005): Strategies for controlling Western corn rootworm
(Diabrotica virgifera virgifera) Acta Agronomica Hungarica 53 (1), 71-79.
Szıke Cs., Árendás T., Rácz F., Pintér J., Nagy E., Marton L. Cs. (2007): Correlation between maize
genotypes and the stalk rot caused by maize Fusarium. Acta Agronomica Hungarica 55(4) 447-452
Szıke Cs., Pintér J., Hegyi Zs., Marton L. Cs. (2008): Studies on the tolerance of maize hybrids to corn
rootworm on various types of soil. Cereal Research Communications 36:1675-1678
Tollefson J. J. (2007): Evaluating maize for resistance to Diabrotica virgifera virgifera Leconte (Coleoptera:
Chrysomelidae). Maydica 52:311-318

VIII. Alps-Adria Scientific Workshop Neum, Bosnia-Herzegovina, 2009
DOI: 10.1556/CRC.37.2009.Suppl.2 193
OBSERVATION OF NUTRIENT STATUS OF MAIZE MONOCULTURE AS A MAJOR STRESSOR IN LONG-TERM FIELD EXPERIMENT OVER 38 YEARS
Zoltán TÓTH – Péter JOLÁNKAI – Tamás HERMANN – Tamás KISMÁNYOKY
Department of Plant Production and Soil Science, Georgikon Faculty, University of Pannónia, 16 Deák
Ferenc Str, 8360 Keszthely, Hungary, e-mail: [email protected]
Abstract: In this paper the effect of high dose mineral fertilizer application –as a major stressor– to the grain
yield of maize in continuous maize cropping long-term field experiment was studied, as well as the crop year
effect in Keszthely, Hungary. The two factors of the experiment are:
-rate of fertilizers (0–300–600–900 N:P2O5:K2O (1:1:1) kg ha-1 year-1) and the
-timing of N fertilizer application (spring, autumn, spring shared two times)
The 300 kgha-1 level of nutrition increased the yield of the maize significantly, but with the further rise in
fertilizer rates resulted in much smaller yield increase. At the overdosed 900 kgha-1 level there was no
significant additional yield compared to the 600 kgha-1 level. Between the effects of the variants of N
applications no significant differences were observed. The relative deviation of the yield data decreased with
the rise in fertilizer rates, while the differences between the minimum and maximum absolute yield values (t
ha-1) increased.
Keywords: mineral fertilization, continuous maize cropping, crop year effect, yield stability
Introduction
The issue of crop rotation and continuous cropping have been studied for a long time.
Several similar and contrasting opinions and results have been published about their
advantages and disadvantages and time by time new aspects increase the importance of
this subject. On the one hand Gyırffy (1975/a) concluded that - after introduction of
mineral fertilization - crop rotation is not important any more from the point of view of
plant nutrition. On the other hand Gyırffy (1975/b) and Gyırffy and Berzsenyi (1992)
published that grain yield of both maize and wheat was lower in continuous cropping
than in crop rotation in their experiment, because of plant diseases in case of wheat and
because of water managent problems and herbicide resistant weeds in case of maize.
The stability of yield is also important. Several authors published that maize yield
responded sensitively to the effect of crop year and the yield of maize was more stable
in crop rotation than in continuous cropping (Pepó et al. 2008, Nagy 1995) especially in
dry periods (Gyırffy 1975/b, Ruzsányi 1992). Optimal fertilization can also increase
yield stability, but the optimum level depens on the crop year (Pepó and Balogh 2008,
Tanács et al. 2008). Kádár and Márton (2007) reported that in extreme dry crop year
fertilization reduced the grain yield of maize in a monoculture experiment. Plant
nutrition especially macronutrient application is a basic factor of agronomy influencing
either crop quantity or quality (Izsáki 2007, Izsáki 2008, Németh and Izsáki 2007,
Kismányoky and Lehoczky 2007) as well as soil fertility and resilience (Várallyay
2007).
Materials and methods
The study was conducted in a long-term continuous maize cropping field experiment set
up by the Department of Plant Production of the Georgikon Faculty of the University of
Pannonia, in Keszthely, Hungary in 1969.

Vol. 37, 2009, Suppl. Cereal Research Communications
194
The soil was a Ramann-type brown forest soil (Eutric Cambisol) containing 41 % sand,
32 % silt, and 27 % clay. The available phosphorus content of this sandy loam soil was
low (AL- P2O5: 60-80 mg kg-1
), the potassium content medium (AL-K2O: 140-160
mgkg-1
) and the humus content fairly low (1.6-1.7%), with a pHKCl value of 7,3. The
100 year average annual precipitation was 683 mm, but the distribution was often
unequal. The long-term annual mean temperature was 10.8 oC.
In the monoculture maize experiment the effect of increasing rates of mineral
fertilization on the grain yield was studied in the periode of 1969-2008 including
different crop years. Four rates of mineral fertilizer application were studied: control (0
kg N:P2O5:K2O ha-1
yr-1
), 300, 600 and 900 kg N:P2O5:K2O ha-1
yr-1
(N:P2O5:K2O =
1:1:1). This treatments are refered in the text as NPK 0, NPK 300, NPK 600 and NPK
900. Beside the fertilizer rates the effect of three different variants of timing of N
application was also studied: once in autumn (Autumn 1), once in spring (Spring 1),
twice in spring (Spring 2, 1/3 N was applied as a top dressing). The applied fertilizers
were: nitrochalk (27 % N), superphosphate (18 % P2O5) and KCl (60 % K2O). Analysis
of variance was used to test the statistical significance of the treatments.
Results and discussion
The differennt crop years influenced the grain yield of maize significantly (Figure 1.).
The deviation of yield data was higher on the fertilized plots year by year compared to
the control plots, since on the fertilized plots not the nutrition was the minimum yield
factor (Figure 2.). The differences between the minimum and maximum absolute yield
values (t ha-1
) increased with fertilizer application, while the relative deviation of the
yield data decreased (NPK 0: 40 %, NPK 300: 29 %, NPK 600: 32 %, NPK 900: 31 %).
Comparing the long term yield and precipitation data it can be concluded that
correlation between them is not always strong, so the amount of precipitation itself is
not able to express the effect of crop year on the yield. Rainfall conditions presumably
correlates with the weed infestation and with the effectiveness of the applied method of
weed control, which can be a serious yield limiting factor in maize. The effect of
rainfall conditions therefore can be different in correlation with the other
agrotechnological factors.
The mineral fertilizer application increased the yield of maize significantly when
averaged over 38 year data (Table 1. and Figure 2.) The 300 kg NPK ha-1
mineral
fertilizer rate application resulted in the highest yield increase (3,72 t/ha). The further
rise in the fertilizer rates did not resulted in such a great extent, but the NPK 600
treatment had still significant yield increasing effect.
From the variants of the N application (once in spring, once in autumn, twice in spring)
when N was applied in split dosages in the spring, the yield of maize was slightly higher
than in case of autumn 1 and spring 1 applications, but the effect of N application was
no significant when averaged over the 38 year data.

VIII. Alps-Adria Scientific Workshop Neum, Bosnia-Herzegovina, 2009
DOI: 10.1556/CRC.37.2009.Suppl.2 195
0,00
2,00
4,00
6,00
8,00
10,00
12,00
1969
1971
1973
1975
1977
1979
1981
1983
1985
1987
1989
1991
1995
1997
1999
2001
2003
2005
2007
t h
a-1
NPK 0 NPK 300 NPK 600 NPK 900
Figure 1. Grain yield of maize in different crop years (1969-2008, Keszthely)
0,00
1,00
2,00
3,00
4,00
5,00
6,00
7,00
8,00
N Spring1
NAutumn
1
N Spring2
NPK 0 NPK300
NPK600
NPK900
SD5%NPK
t h
a-1
average standard deviation
Figure 2. Standard deviation of the grain yield of maize when averaged over 38 year data
Table 1. Grain yield of maize when averaged over 38 year data
N Spring 1 N Autumn 1 N Spring 2 mean
NPK 0 2,48 2,45 2,46 2,46
NPK 300 6,20 6,03 6,30 6,18
NPK 600 7,10 7,17 7,42 7,23
NPK 900 7,25 7,18 7,51 7,31
mean 5,76 5,71 5,92 5,79
SD5% between the variants of NPK= 0,56
SD5% between the variants of N applivation= non significant
SD5% between combinations= non significant

Vol. 37, 2009, Suppl. Cereal Research Communications
196
Conclusions
In this study site the data showed that as an effect of mineral fertlizer application the
grain yield of maize increased significantly and the deviation of the yield data in the
different experimental years was also higher than on the control plots. The differences
between the minimum and maximum absolute yield values (t ha-1
) increased with
fertilizer application, while the relative deviation of the yield data decreased (when
expressed by % values). Between the the variants of N applications no significant
differences were observed.
Acknowledgements
The study presented in this paper was supported by the National Scientific Research
Fund (OTKA T016469, OTKA T030768 and OTKA F042641).
References
Gyırffy B.: 1975/a A növénytermesztési kutatások 30 éve. Tudomány és mezıgazdaság. 13: 17-20.
Gyırffy B.: 1975/b Vetésforgó-vetésváltás-monokultúra. Agrártudományi Közlemények, Budapest. 34. 61-90.
Gyırffy B. - Berzsenyi Z.: 1992. Martonvásári vetésforgó kísérlet 30 év termésadatának összesítése 1961-
1992. Martonvásár. 2: 16.
Izsáki Z.: 2007. N and P impact on the yield of maize in a long-term trial. Cereal Research Communications,
35: 4. 1701-1711.
Izsáki Z.: 2008. Effect of soil P supply on P-ZN interactions in a maize (Zea mays L.) long-term field
experiment. Cereal Research Communications, 36:. 1851-1854 pp.
Kádár I. – Márton L.: 2007. Kukorica utáni kukorica trágyareakciója a mezõföldi OMTK kísérletben 1970–
2006 között. Növénytermelés, 55: 5-6. 307-320.
Kismányoky A – Lehoczky É.: 2007. Effect of the nutrient supply ont he biomass production of winter wheat
and weeds. Cereal Research Communications, 35: 617-620.
Nagy J.: 1995. A mőtrágyázás hatásának értékelése a kukorica (Zea mays L.) termésére eltérı évjáratokban.
Növénytermelés. 44: 493-506.
Németh T. - -Izsáki Z.: 2007. Effect of nutrient supply on the green mass, dry matter accumulation and
nutrient uptake of silage sorghum (Sorghum bicolor L/Moench) Cereal Research Communications, 35: 841-844.
Pepó P. – Balogh Á.: 2008. A vízellátás szerpe az ıszi búza (Triticum aestivum L.) fajtaspecifikus
trágyareakciójában. Növénytermelés, 57: 1. 85-94.
Pepó P. – Dóka L. – Berényi S. – Vad A.: 2008. Az öntözés hatása a kukorica (Zea mays L.) termésére száraz
évjáratban csernozjom talajon. Növénytermelés, 57: 2. 171-180.
Ruzsányi L.: 1992. Gondolatok, adatok a mőtrágyaigény és mőtrágyahatás értékeléséhez. Agrofórum. 3: I.
Külünszám. A tápanyaggazdálkodásról. 38.
Tanács L - Krisch J - Gerı L - Monostori T - Petróczi I. M.: 2008. Effect of new type herbicides and crop
year on gluten rheological and falling number characteristics of winter wheat varieties. Cereal Research
Communications, 36: 71-74.
Várallyay Gy.: 2007. Soil resilience (Is soil a renewable natural resource?). Cereal Research Communications,
35: 1277-1280.

VIII. Alps-Adria Scientific Workshop Neum, Bosnia-Herzegovina, 2009
DOI: 10.1556/CRC.37.2009.Suppl.2 197
REACTION OF COVERED OATS TO ARTIFICIAL INFECTION WITH FUSARIUM CULMORUM SACC.
Svetlana ŠLIKOVÁ – Valéria ŠUDYOVÁ – Edita GREGOVÁ – Daniel MIHÁLIK
Department of Applied Genetics, Slovak Agricultural Research Centre, Research Institute of Plant Production,
Bratislavská cesta 122, 921 68 Piešťany, Slovak Republic, e-mail:[email protected]
Abstract: Oat has been more often used in human nourishment in recent years for any rational diet. Grains
contaminated with Fusarium spp. are unsuitable for both human and animal consumption because of the
adverse health effects of fusariotoxins. The aim of this work was to examine the reactions of covered oats to
artificial infection with Fusarium culmorum (W. G. Smith) Sacc. and the accumulation of deoxynivalenol
mycotoxin in seeds. Covered cultivars registered in Slovakia (Zvolen, Auron, Atego, Flämingsstern, Kanton,
Viktor, Zlaťák, Euro and Ardo) were inoculated during flowering in 2006 and 2007 with conidial suspensions
of aggressive isolate of F. culmorum Sacc. After ripening, twenty panicles were harvested manually from each
plot of blocks (block 1. inoculated, block 2. uninoculated). The threshed seeds were then manually cleaned
and hulled. The reduction in 1000-kernel weight (R-TKW) was calculated. The kernel samples were also
analysed for deoxynivalenol (DON) content by a commercial ELISA kit for quantitative analysis of DON in
cereals. The differences between the oat cultivars were observed in R-TKW and DON contents. A high R-
TKW was discovered in Flämingsstern and a low reduction in Euro, Ardo and Zlaťák. The average range of
DON accumulation was from 3.45 mg kg-1 to 19.05 mg kg-1. From the oat cultivars a mean high DON
accumulation (in 2006 and 2007 years) was found in Kanton and Ardo cultivars, a low one in seeds of Zlaťák,
Euro and Auron. This is the first piece of information on reduction in 1000-kernel weight and concentrations
of DON in covered oat cultivars in Slovakia after artificial infection with Fusarium culmorum.
Keywords: covered oat cultivars, yield component, deoxynivalenol
Introduction
Several Fusarium species are widespread pathogens on small-grain cereals (soft and
durum wheat, barley, oats, rye and triticale) around the world, including all European
cereal-growing areas. In the Slovak Republic (SR), the data about the occurrence of
genus Fusarium on oat is not known as soon as in wheat there are the most common F. culmorum (W. G. Sm.) Sacc. and F. graminearum Schwabe (Šrobárová, 2008).
Fusarium head blight (FHB) of oat is caused by a complex Fusarium species, the
composition and proportions of which varied considerably among years and regions
(Tekauz, 2008). The head infection of cereals with fungi of the Fusarium spp. group
may cause a decrease in quality and yield and contaminating cereal products with
mycotoxins. The analysis of one hundred and fifty-six samples of breakfast cereals
(included corn-, oat-, wheat- and rice-based cereals, as well as mixed-grain cereals)
from the Canadian retail marketplace has shown that deoxynivalenol was the most
frequently detected mycotoxin - it was detected in over 40% of all samples analysed
(Roscoe, 2008). In the Slovak Republic, the limit specified by the EU (1.25 mg.kg-1
DON content) was exceeded in 9.3 % of the wheat samples collected in the maize
growing area, 5 % in the sugar beet growing area and 14.3 % in the potato growing area
between 2004 and 2006 (Šliková, 2008). Oat breeders are searching for information
about the reaction of oat genotypes to Fusarium infection. There is information known
about the resistant to fusariosis of oats and cumulation of Fusarium toxins in seeds
(Tekauz, 2008; Bjørnstad, 2008, Perkowski, 2008), but little information is known about
yield reduction.
This paper presents the results obtained from the evaluation of reduction in 1000-kernel
weight and DON accumulation in covered oat cultivars after artificial inoculation with

Vol. 37, 2009, Suppl. Cereal Research Communications
198
F. culmorum. The reaction of wheat and barley cultivars to artificial infection by Fusarium spp. and the cumulation of DON in seeds of cultivars registered in Slovakia
was reported (Vančo, 2007), but there was an absence of information about covered oats
to fusarioses and cumulation of toxins.
Materials and methods
In the spring of 2006 and 2007, plot experiments with two blocks (inoculated (I) and
non-inoculated (N)) and registered cultivars of covered ones (Zvolen, Auron, Atego,
Flämingsstern, Kanton, Viktor, Zlaťák, Euro and Ardo) were established under natural
conditions at Piešťany. The region of Piešťany belongs to produced type maize – wheat,
with an elevation above sea level of 160 m. The weather conditions for Piešťany are
shown in Table 1. There were five rows per plot, with 1-m length and 150-mm row
spacing. At anthesis, 20 panicles from each cultivar were sprayed (block 1) with of F. culmorum. The isolate F. culmorum (W. G. Sm.) Sacc. (RA/02) from the location
Radošina (SR) was obtained from a microorganism collection at the Research Institute
of Plant Production, Piešťany and used for artificial inoculation of oat panicles. After
inoculation, the panicles were covered with plastic bags for 24 h.
After ripening, the panicles were harvested by hand from each cultivar and from each
plot. The threshed grains were manually cleaned and separated from the hulls. The
reduction in 1000-kernel weight (R-TKW) was calculated in comparison with the non-
inoculated block as shown in general form: R = 100 – (100 × I/N). The percentage R-
TKW (in arcsine) was statistically evaluated by analysis of variance (ANOVA) using
SPSS software.
A commercial ELISA kit for quantitative analysis of DON in cereals was used to
determine the DON concentration in oat samples (Ridascreen® Fast DON, RBiopharm
AG, Darmstadt, Germany). The absorbencies (of the wells) were determined
photometrically at 450 nm (MRX II, DYNEX Technologies). DON concentrations were
calculated in mg kg–1
by Revelation Version 4.25.
Results and discussion
The oat is characterized by ambiguous symptomatic manifestations after panicle
infection with Fusarium spp. Evaluation of oat reaction to artificial infection by F. culmorum was aimed at the analysis of kernel obtained from infected and control
panicles. The seeds from infected panicles by F. culmorum were separated from the
hulls and looked to be smaller than normal, they were dwarf, wrinkly, and less
developed. Typical, Fusarium damaged kernels, as in wheat, were not observed in seeds
from infected panicles.
ANOVA of R-TKW confirmed statistically significant differences between the years
and cultivars (Tab. 1). The inoculation of panicles with fungi Fusarium culmorum
reduced 1000-kernel weight, on average, by 28.9 %. The average R-TKW in oat
cultivars was higher by 32.1% in 2007 than in 2006. This was probably due to
precipitations, because in June 2006 (IInd decade), during the artificial inoculation of
panicle the weather was dry (0.0 mm, 0 days with rainfall) but in June 2007 (Ist
decade), precipitations appeared during artificial inoculation (17.0 mm, 4 days with

VIII. Alps-Adria Scientific Workshop Neum, Bosnia-Herzegovina, 2009
DOI: 10.1556/CRC.37.2009.Suppl.2 199
rainfall). Precipitations could probably create more favourable conditions for a more
intensive start of infection in 2007 and resulted in TKW reduction of seeds. Interaction
year x cultivar (Tab. 1) was statistically highly significant. The cultivars Auron and
Viktor had different reaction to F. culmorum in both years. Statistically significant
differences in R-TKW in oat genotypes after artificial infection with Fusarium avenaceum in years x cultivars interaction was presented by Kiecana (2002) . He
mentioned different reactions of some of the genotypes to infection in the years and
indicated that the weather affected the reduction of yield parameters of the tested oat
genotypes every year. The factors which influence the reduction of yield parameters in
oat after artificial infection with Fusarium spp. are less investigated than in other
cereals, e.g. wheat (Goliński, 2002).
Table 1. Analysis of variance for the reduction in 1000-kernel weight (R-TKW) in Piešťany (2006, 2007)
Parameter Source of variation Degrees of freedom
Sum of Square Mean Square P-value
. years (Y ) 1 11020.19 24.02 0.000
cultivars (C ) 8 1968.46 4.29 0.000
Y x C 8 1811.89 3.94 0.000
R-TKW (arcsin)
residuum 342 458.58
The different R-TKW between tested genotypes were observed (Fig. 1). The low R-
TKW values were foud in Euro, Ardo and high Flämingsstern in both years. The total
mean of DON content in the tested oats was 2.5 times higher in 2006 than in 2007. The
average range of DON accumulation was from 3.45 mg kg-1
to 19.05 mg kg-1
. In 2006
the DON content was ranged from 2.10 mg kg-1
to 28.91 mg kg-1
and in 2007 from 2.30
mg kg-1
to 9.20 mg kg-1
. A mean high DON accumulation (2006 and 2007 years) from
the oat cultivars was found in Kanton (19.05 mg kg-1
) and Ardo (17.90 mg kg-1
)
cultivars, a low one in seeds of Zlaťák (3.45 mg kg-1
), Euro (4.15 mg kg-1
) and Auron
(4.30 mg kg-1
). The Zlaťák and Euro with low DON accumulation had low R-TKW,
too. The Fig.1 shows that the DON content in seeds of individual cultivars does not
correspond with R-TKW. The hulls of covered oat grains have an important role in the
protection grains against Fusarium infection. Dehulling may generally remove the
toxins (Bjørnstad, 2008).
0
5
10
15
20
25
30
35
40
45
Flämingsstern Zvolen Auron Viktor Attego Kanton Zlaťák Ardo Euro
R-TKW % DON mg kg-1
Figure 1. The average reduction in 1000-kernel weight (R-TKW) and DON content in covered oats (the
kernels were separated from the hulls) after artificial infection with Fusarium culmorum (2006; 2007)

Vol. 37, 2009, Suppl. Cereal Research Communications
200
Conclusions
The inoculation of oat panicles with fungi Fusarium culmorum reduced 1000-kernel
weight, on average, by 28.9 %. The reaction of covered oats to artificial infection with
Fusarium culmorum (W. G. Smith) Sacc. was different. The high R-TKW was in
Flämingsstern and the lowest one in Euro. DON contents were the high in Kanton, Ardo
and in Zlaťák and Euro was the lowest DON content. This information would be used
growers for selection of cultivars for their production region and breeders in oat
breeding programmes to develop new oat cultivars, too.
Acknowledgements
This work was supported by Science and Research Support Agency “No. VMSP-P-
0022-07“ of the Slovak Republic.
References
Bjørnstad, Å., Skinnes, H.: 2008. Resistance to Fusarium infection in oats (Avena sativa L.). Cereal Research
Communications, 36: Suppl. B. 57-62.
Goliński P., Kaczmarek Z., Kiecana I., Wiśniewska H., Kaptur P., Kostecki M., Chełkowski J.: 2002.
Fusarium head blight of common Polish winter wheat cultivars – comparison of effects Fusarium avenaceum and F. culmorum on yield. J. Phytopathol, 150: 135-141.
Kiecana, I., Mielniczuk, E., Kaczmarek, Z., Kostecki, M., Goliński, P.: 2002. Scab response and moniliformin
accumulation in seeds of oat genotypes inoculated with Fusarium avenaceum in Poland. European J. of
Plant Pathology, 108: 245–251.
Perkowski, J., Basiński, T.: 2008. A comparison of grain contamination with fusarium toxins in naked and
husked oat cultivars. Cereal Research Communications, 36: Suppl. B. 377-379.
Roscoe, V., Lombaert, G. A., Huzel, V., Neumann, G., Melietio, J., Kitchen, D., Kotello, S., Krakalovich, T.,
Trelka, R., Scott, P. M.: 2008. Mycotoxins in breakfast cereals from the Canadian retail market: A 3-year
survey. Food Additives & Contaminants, 25: 3. 347-355.
Šliková, S., Šudyová, V., Gregová, E.: 2008. Deoxynivalenol in wheat from the growing areas of Slovakia.
Cereal Research Communication, 36: 2. 279–287.
Šrobárová, A., Šliková, S., Šudyová V.: 2008. Diversity of the Fusarium species associated with head and
seedling blight on wheat in Slovakia, Biologia, 63: 3. 332–337.
Tekauz, A., Mitchell Fetch, J. W., Rossnagel, B. G., Savard, M. E.: 2008. Progress in assessing the impact of
Fusarium head blight on oat in western Canada and screening of avena germplasm for resistance. Cereal
Research Communications, 36: Suppl. B. 49–56.
Vančo, B., Šliková, S., Šudyová, V.: 2007. Influence of localities and winter wheat cultivars on
deoxynivalenol accumulation and disease damage by Fusarium culmorum, Biologia, 62: 1. 62–66.
Vančo, B., Šliková, S., Šudyová, V., Šrobárová, A.: 2007. Response to Fusarium culmorum inoculation in
barley, Biologia, 62: 1. 56–61.

VIII. Alps-Adria Scientific Workshop Neum, Bosnia-Herzegovina, 2009
DOI: 10.1556/CRC.37.2009.Suppl.2 201
EFFECT OF ATMOSPHERIC CO2 ENRICHMENT ON TOMATO, GROWN IN SOIL
Árpád CSUVÁR 1– Ágnes KRECZ
1– András PAKSI
2– Tamás KASSAI
2 – Judit
DIMÉNY 2
1 Termo-Energo-System Ltd, Vásárosnamény, e-mail: [email protected] 2 Institute of Horticultural Technology Faculty of Agriculture and Environment Szent István University,
Gödöllı
Abstract: In some cases, the indoor CO2 level, in greenhouses, can drop below assumable rate, especially in
cold weather when gas exchange between the greenhouse and the outdoor atmosphere is limited. When this
happens, plant production stops, it uses up the nutrients assimilated during normal CO2 content. On the other
hand in high CO2 level different symptoms can occur such as leaf roll and carbohydrate transport problems.
Optimizing CO2 level is necessary for effective horticultural production. Different influences such as higher
yield, earliness, and higher heat tolerance were observed with CO2 enrichment. Depends on the source, SO2
and NOx are present in the atmosphere which also can impair the plants and the environment. A partly new
source of CO2 is becoming more and more available which doesn’t have this contamination. Fermenting
ethanol, from cereals for fuel, produces tons of waste CO2 which can make CO2 enrichment economic, in such
cultivation circumstances, where this element was not profitable. Our aim was to examine the effect of CO2
enrichment in typical Hungarian conditions in tomato, grown in soil. The main representatives were the major
commercial characteristics: the weight by classes, colour as the marker of maturity and the firmness which
affects shelf life of the fruit
Keywords: tomato, CO2 enrichment, firmness
Introduction
Nowadays when hard to forecast the weather vegetable growing turns more and more to
the protected cultures. Indoor growing of species, consumed in the highest degree, is
notable. This way the culture is protected from stress caused by the extreme weather but
there are other influences, which are not present in open field, effects that blast the
yield. In a greenhouse the chance of sunburn is much lower and low night-time
temperature is not a threat, in the other hand, depends on the ventilation, daytime
temperature can rise over optimal, and CO2 drops under assumable level. CO2 content
of the air, as an ecological condition, have great effect on yield and fruit components of
tomato (Végh et al., 2007). Atmospheric CO2 enrichment is one method for supplying
carbon. The cost of the gas let this technique use only in the most intensive units.
Fermenting ethanol from cereals produces tons of waste CO2, which can make
profitable this element in other horticultural sections, where forcing is not heated and
climate control is based only on ventilation and shading, where environment highly
affects the yield.
Atmospheric CO2 enrichment raises the yield (van Berkel, N., 1984) and has other
positive impacts such as enhanced drought stress tolerance (Veisz, 2008), earlier yield
and higher nutrient uptake (Juan et al., 2007), but overdose of it stresses the plants
causing leaf roll (Tripp et al., 1991), associated with high starch accumulation (Madsen,
1974) and drop in photosynthetic activity.

Vol. 37, 2009, Suppl. Cereal Research Communications
202
Materials and methods
Our measurements were conducted in the Experimental Farm of the Institute of
Horticultural Technology, Faculty of Agriculture and Environmental Sciences, at Szent
István University, Gödöllı. Our aim was to examine the effect of atmospheric CO2
enrichment in short term cultures on varieties Celsus F1, Platus F1 and Vulkanus F1.
The tomatoes were planted in twin rows with 1,2 m between thin rows the spacing
inside the rows was 0,4 m and 0,3 m between the plants. The house was a 7 meters wide
4 meters high and 33 m long tunnel type polyethylene covered tent. We enriched the
CO2 level 6 hours daily. Gas supply was bottled gas, managed by a Fuji Electric’s
(ZFP9) infra red CO2 controller on the level of 850 ppm. Fertigation was managed
manually.
During picking the main commercial values were measured, the yield, the colour, the
Brix° measured by a refractometer and firmness measured by an electric penetrometer.
All statistical analyses were performed using the Microsoft® Excel 2002 Analysis
Toolpak (Microsoft Corporation Corporate Headquarters Redmond, USA).
Results and discussion
During the growing season the berries were picked 7 times, after the 7th
picking the
stock was eliminated
At the first harvest there was significant difference in the yield of the variety Vulkanus
F1 between the enriched and control tents.
Yield of the 1st picking
0
0,5
1
1,5
2
2,5
Celsus F1 Platus F1 Vulkanus F1
kg/m2
CO2 Erichted Controll
Figure 1. Yield of the first Picking (June 26th)

VIII. Alps-Adria Scientific Workshop Neum, Bosnia-Herzegovina, 2009
DOI: 10.1556/CRC.37.2009.Suppl.2 203
Total yield
0
2
4
68
1012
14
16
18
Celsus F1 Platus F1 Vulkanus F1
kg/m2
CO2 Enrichted Control
Figure 2. Total yield of the growing season
Ongoing the growing season the differences reduced and become equate for each
picking. At the end of the season differences showed up again but in the total yield
significant difference was not present.
As the enriching pipes were on the ground and the tent was filled up from the bottom to
the top, high CO2 concentration was only present around the lower leaf section where
leaf roll occurred but it had no negative effect on the yield.
One of today’s values is the firmness which affects the self life.
Firmness
0
500
1000
1500
2000
2500
3000
3500
4000
4500
Celsus F1 Platus F1 Vulkanus F1
KPa/mm
CO2 enrichted Control
Figure 3. Mean firmness of 7 picking
In our examine, in the mean firmness of the seven picking, there was significant
difference in the genotype Platus F1 (p=0,005) and Vulkanus F1 (p=0,02). Berries
grown in CO2 enriched atmosphere were harder than the control ones.

Vol. 37, 2009, Suppl. Cereal Research Communications
204
Conclusions
Highest differences showed in the early part of the growing season, when limiting
factors where the light and temperature, so these effects can be reduced by using CO2
enrichment.
Leaf roll as an overdose effect shown on lower leaf did not stress the plants.
Atmospheric CO2 enrichment hardened the berries which lengthen the self life offering
us better logistic circumstances.
Atmospheric CO2 enrichment could be a useful technique for producing better quality
horticultural products.
Acknowledgements
This work was supported by the KUTREG 06 research program by the Nemzeti
Kutatási és Technológiai Hivatal and the Kutatás-fejlesztési Pályázati és
Kutatáshasznosítási Iroda (National Office for Research and Technology and the
Agency for Research Fund Management and Research)
References
Kim E. Tripp, Mary M. Peet, D. Mason Pharr, Daniel H. Willits, and Paul V. Nelson 1991 C02-Enhanced
Yield and Foliar Deformation among Tomato Genotypes in Elevated CO2 Environments. Plant
Physiology, 96: 713-719
Li Juan , Zhou Jian-Min, Duan Zeng-Qiang, Du Chang-Wen and Wang Huo-Yan 2007 Effect of CO2
Enrichment on the Growth and Nutrient Uptake of Tomato Seedlings. Pedosphere 17:343-351
Madsen, E. 1974 Effect of CO2 concentration on growth and fruit production of tomato plants. Acta
Agriculturae Scandinavica, 24: 242-246
Ottó Veisz, Szilvia Bencze, Krisztina Balla, Gyula Vida 2008 Changes in water stress resistance of cereals
due to atmospheric CO2 enrichment. Cereal Research Communications, 36: 1095-1098
Van Berkel, N. 1984: Injurius effects of high CO2 concentrations on cucumber, tomato, chrysanteanthemum
and gerbera. Acta Horticulture (ISHS) 162:101-112
Végh K.R., Rajkai K., Szili-Kovács T., Cserni I., Németh T. (2007): Nitrogen efficiency in tomato culture.
Cereal Research Communications, 35: 2. 973-976.

VIII. Alps-Adria Scientific Workshop Neum, Bosnia-Herzegovina, 2009
DOI: 10.1556/CRC.37.2009.Suppl.2 205
AN ACID PHOSPHATASE ISOENZYME PATTERN IS CHARACTERISTIC FOR THE PONTICAN CULTIVARS
Gizella JAHNKE1 – János MÁJER1 – Zsuzsanna VARGA2 – Edit DEÁK1 – Péter VARGA1 1 Research Institute for Viticulture and Oenology, Badacsony, Centre of Agricultural Sciences, University of
Pannonia, e-mail: [email protected] 2 Department of Viticulture, Faculty of Horticultural Sciences, Corvinus University of Budapest
Abstract: The range of grapevine cultivars traditionally grown in Hungary differs from these that are growing
in western Europe, as they mostly belong to the pontican cultivars. Most of these cultivars are more resistant
for abiotic stress factors, specially they have higher drought tolerance. Our aim was to find an isoenzyme
marker, what is characteristic for most of the traditional Hungarian grapevine cultivars, to help our breeding
work as well. First 20 grapevine cultivars were investigated by isoenzyme analyses. We used a 3-parted
vertical poliacrylamide gel system for the separation of the soluble isoenzymes of acid phosphatase (AcP),
peroxidase (PER), glutamate-oxalacetate-transaminase (GOT) and cathecol-oxidase (CO). Comparing the
banding patterns we noticed a special banding pattern of the acid phosphatase (AcP) of the woody stems (in
the case of 4 cultivars) that we don’t find in the literature. In the investigation of leaf extracts, we find that
these 4 cultivars have one additional band in their zymogram as well. It perhaps means, that this additional
form of acid phosphatase in these cultivars is controlled by an additional locus. As all this 4 cultivars has
pontican origin, we extended the range of cultivars to 60 to clarify if this phenotype appears only in the range
of the pontican cultivars, or can be encountered in other groups of Vitis vinifera. On the basis of this result it
can be established, that more than 2/3 of the cultivars, which morphologically belongs to the subconvarietas
pontica gives this zymogram, as from the other groups (subconvar. occidentalis and orientalis) only one
cultivar gave this phenotype.
Keywords: isoenzyme, grape Vitis vinfera
Introduction
The range of grapevine cultivars traditionally grown in Hungary differs from those
grown in western Europe, as they mostly belong to the pontican cultivars. The
efficiency of the breeding of plant species is closely connected with the knowledge of
the genetic background of the indicated species, particularly in the case of the grape,
where the change of generations takes 3-5 years. Nowadays besides the morphological
features molecular markers are also available to investigate the genetic background of
various genotypes and to improve the efficiency of breeding work (Bretting et al.,
1995). Of these, isoenzyme analysis provides significant advantage over the traditional
methods for the identification and characterisation of grape cultivars. The use of these
novel methods in taxonomical studies has got an emerging importance because, despite
the vegetative propagation, the grape (Vitis spp.) has a quite high degree of genetic
variability (Olmo, 1976).
Molecular marcers for grape cultivar identification and their genetic characterisation
have widely been used during the last 20-30 years (Crespan et al., 1999; Cseh et al,
2006.). In most cases starch gel electrophoresis was used to separate the isoenzymes.
Recently poliacrylamide-gel electrophoresis has been preferred for such studies
(Sánchez-Escribano et al. ,1998) and for isoelectric focusing as well (Paar et al., 1999,
Stefanovits-Bányai et al., 2002).
The acid phosphatase enzyme was reported to be quite polymorphic in higher plant, for
example in weat (Dudinkov, 2007.) and in grapes as well (Royo et al., 1997; Vidal et
al.,1998). We aimed at characterising grapevine cultivars by acid phosphatase

Vol. 37, 2009, Suppl. Cereal Research Communications
206
isoenzyme analyses.
Materials and Methods
The 60 grapevine (Vitis vinifera L.) cultivars and intraspecific hybrids used for isoenzyme
analyses are listed in Table 1. Plant materials (canes and young leaves) were collected
from Hungarian plantations located in Badacsony, Pécs and Tarcal (Tokaj wine district) in
January, May and July of years 2004 and 2005. For protein extraction 150 mg polyclar AT
and 1 ml of 4oC extraction buffer (described by Arulsekar and Parfitt.,1986.) were added
to about 300 mg of plant material (canes or young leaves) and was homogenized in a
mortar and centrifugalized at 4°C and 1400 rpm for 5 minutes. After centrifugation we
applied 50 µl of clear supernatant onto the polyacrylamide gel for the analyses. For further
examination remaining extracts were stored at -75°C.
Vertical poliacrylamide gel electrophoresis was used for the separation of the
isoenzymes of acid phosphatase (AcP). We used the polyacrylamide gel system for the
separation as described by Sànchez-Escribano et al. (1998). The electrophoresis for the
extracts was carried out at 4 oC and 2 mA per well for 3-4 hours. After the
electrophoresis the gels were stained for the detection of acid phosphatase (AcP) as
described by Arulsekar and Parfitt (1986). The isoenzyme pattern obtained in the gel
complex at a fix pH was evaluated visually.
Results
The acid phoshphatase patterns of 60 grapevine genotypes have been analysed. Expression
of acid phosphatases does not show seasonal changes, and the isoenzyme patterns do not
depend on the time of the sampling time, that is on dormancy. It can also be concluded, that
adequate activity can be measured only in leaf samples taken before blooming.
Figure 1. Acid phosphatase zymogram types. (Type 4, 5 and 6 are characteristic for the pontican cultivars)
A special banding pattern of the acid phosphatase could be observed of the woody stems
in the case of 22 cultivars (see Figure 1, and Table 1). This characteristic pattern has not
been reported in the literature yet. These cultivars have four bands in the faster
migrating region of the gel, while the others have only three bands (Figure 2). Analysis
of leaf extracts of these cultivars resulted in one additional band in their zymogram as
well. It may mean, that this additional form of acid phosphatase is controlled by an
additional locus. 20 of these 22 cultivars are described by morphological features as

VIII. Alps-Adria Scientific Workshop Neum, Bosnia-Herzegovina, 2009
DOI: 10.1556/CRC.37.2009.Suppl.2 207
pontican cultivars (for example the Furmint).
Table 1. The acid phosphatase zymogram types of the investigated cultivars (bold letter indicate Vitis vinifera
convar. pontica cultivars, italic letters indicate intraspecific hybrids with at least on pontican parent)
Cultivar AcP type
Cultivar AcP type
Cultivar AcP type
Arany sárfehér 6 Hárslevelő 4 Piros furmint 5
B-15 2 Juhfark (Badacsony) 1 Pozsonyi fehér 6
B-43 1 Juhfark (Tarcal) 1 Purcsin 2
Bakator 4 Kadarka 6 Rajnai rizling 3
Balafánt 1 Kékfrankos 3 Rózsakı 1 Bouvier 1 Kéknyelő 1 Sárga muskotály 3
Budai 3 Királyleányka 1 Sárga ortlibi 3
Budai góhér 6 Kövérszılı 6 Sauvignon 3
Cabernet franc 3 Kövidinka 4 Semillon 3
Cabernet sauvignon 3 Leányka 2 Török góhér 6
Chardonnay 1 Medoc noir 3 Tramini 1
Chasselas 3 Mirkovácsa 6 Változó furmint 5
Cirfandli 6 Olasz rizling 1 Vulcanus 1 Csomorika 4 Oportó 2 Zefir 1 Ezerjó 2 Ottonel muskotály 1 Zengı 3 Fehér góhér 4 Picolit 5 Zenit 1 Fehér járdovány 6 Pinot blanc 1 Zéta 5 Fehér lisztes 6 Pinot gris 1 Zeus 3 Furmint 5 Pinot noir 1 Zöld veltelíni 1
Furmint T. 85. 5 Pintes 4 Zöld szilváni 3
From the 24 pontican cultivars (with bold letters in Table 1) involved in the analysis 20
showed this pattern (with bold, underlined letters in Table 1). The newly bred grapevine
cultivar ‘Zéta’ originates from the cross Bouver (occidentalis) x Furmint (pontica)
produces the special acid phosphatase isoenzyme band. The only one, which has this
special pattern but does not belong to the pontican cultivars, and is not an intraspecific
hybrid of a cultivar of pontican origin is the Cirfandli.
Discussion
Genetic differences of the convarietas of the grape (Vitis vinifera L) were indicated.
Experiences have shown that ancient cultivars can be divided into three groups, viz. convars.
pontica, occidentalis and orientalis, each of which reproduces its distinguishing features in
its progeny (Negrul, 1968,). RFLP data of Bourquin et al. (1993) showed, that various
cultivars of the same presumed geographical origin are related. Grando et al. (1995) analysed
wild and cultivated grapes by RAPD markers. They noted that some vines ascribed to the
occidentalis Negr. group were clearly separated from the other genotypes whereas the
RAPD profiles of Vitis vinifera ssp. silvestris accessions are often very more similar or even
identical to those of the cultivars ascribed to the proles pontica Negr. group.
Most of the pontican cultivars are more resistant for abiotic stress factors, specially they have
higher drought tolerance. Enzymes of phosphate metabolism can play important role in
abiotic stress tolerance in higher plants. For example Kovács et al (2007) reported, that PFP
plays important role in drought and cold tolerance of carrot plants.
Based on our results it can be supposed, that the pontican convarietas of the species Vitis
vinifera L. has a characteristic genetic basis, as the occurrence this additional acid
phosphatase isoenzyme band likely relates to the eco-geographical group of these cultivars.

Vol. 37, 2009, Suppl. Cereal Research Communications
208
Figure 2. Acid phosphatase isoenzyme zymograms of ten Vitis vinifera cultivars (from left to right: 1:
Bouvier, 2: Furmint, 3: Hárslevelő, 4: Muscat de Lunel, 5: Zéta, 6: Zöld veltelíni, 7: Zöld szilváni 8:
Traminer, 9: Budai góhér, 10: Leányka
References
Arulsekar S. - Parfitt D.E.: 1986. Isozyme analysis procedures for stone fruits, almond, grape, pistachio, and
fig. HortScience 21: 928-933.
Bourquin J.C. - Sonko A. - Otten L. - Walter B.: 1993. Restriction fragment length polymorphism and
molecular taxonomy in Vitis vinifera L. Theoretical and Applied Genetics 87: 431-438
Bretting P.K. - Wildrlechner M.P.: 1995. Genetic markers and horticultural germplasm management.
HortScience 30: 1349-1356.
Crespan M. - Botta R. - Milani N. 1999. Molecular characterisation of twenty seeded and seedless table grape
cultivars (Vitis vinifera L.). Vitis 38: 87-92.
Cseh A. - Taller J. - Podmaniczky P. - Kocsis L.: 2006. Comparative analysis of the most widespread
grapevine rootstock lines in the world, the Teleki lines, with microsatellite markers. Cereal Research
Communications 34: 773-776.
Dudinkov A. J.: 2007. An Acid Phosphatase Gene Set (Acph-2) of Common Wheat Orthologous to Acph1 of
Aegilops tauschii. Cereal Research Communications 35: 11-13.
Grando M.S. - De Micheli L. - Biasetto L. - Scienza A.: 1995. RAPD markers in wild and cultivated Vitis
vinifera. Vitis 34: 37-39.
Kovács G. - Sorvari S. – Scott P. – Toldi Ol.: 2007. Pyrophosphate: Fructose 6-Phosphate 1-
Phosphotransferase is Involved in the Mobilization of Sugar Reserves in the Taproots of Cold- and
Drought-Stressed Carrot Plants. Acta Agronomica Hungarica 55: 71-82.
Negrul A. M.: 1968. Questions of origin and breeding of the grape vine an a genetical basis. Genetika
(Genetics):, 4: 87-97.
Olmo L. P.: 1976. Grapes. In: Simmonds N. W. (ed.): Evaluation of crop plants. Longman, London, New
York, 294-298.
Paar E. - Doubek S. - Eder R.: 1999. Differenzierung von Weiβweinsorten mittels isoelektrischer
Fokussierung. Mitteilungen Klosterneuburg 49: 176-185.
Royo J. B. - Cabello F. - Miranda S. - Gogorcena Y. - Gonzalez J. - Moreno S. - Itoiz R. - Ortiz J. M.: 1997.
The use of isoenzymes in characterisation of grapevines (Vitis vinifera L.): . Influence of environment
and time of sampling. Scientia Horticulturae 69: 145-155.
Sánchez-Escribano E. - Ortiz J. M. - Cenis J. L.: 1998. Identification of table grape cultivars (Vitis vinifera L):
by isozymes from the woody stems. Genetic Resources and Crop Evolution 45: 173-179.
Stefanovits-Bányai É. - Lakatos S. - Hajós-Novák M. - Hajdu E. - Balogh I.: 2002. Recent developments in
biochemical characterisation of Vitis vinifera L. varieties in Hungary. International Journal of
Horticultural Science 8:57-61.
Vidal J. R. - Moreno S. - Masa A. - Ortiz J. M.: 1998. Study of the genetic homogeneity of Albariňo (Vitis
vinifera L.): growing in Galicia (Spain): using isozyme and RAPD markers. Vitis 37: 145-146

VIII. Alps-Adria Scientific Workshop Neum, Bosnia-Herzegovina, 2009
DOI: 10.1556/CRC.37.2009.Suppl.2 209
COMPARATIVE STUDY OF DROUGHT STRESS RESISTANCE IN TWO WINTER WHEAT VARIETIES RAISED AT AMBIENT AND DOUBLED CO2 CONCENTRATION
Balázs VARGA – Szilvia BENCZE
Agricultural Research Institute of the Hungarian Academy of Sciences, H-2462 Martonvásár, PO Box 19.
e-mail: [email protected]
Abstract: In preparation for the abiotic stress effects likely to be caused by climate change the impact of
doubled carbon dioxide concentration and drought stress on two winter wheat varieties, Mv Mambó and Mv
Regiment, were studied in growth chambers at the Agricultural Research Institute of HAS. The
meteorological parameters (temperature, humidity, radiation) were the same in both PGV-36 chambers but the
carbon dioxide concentration was either ambient (380 ppm) or doubled (750 ppm). The effect of elevated CO2
level and drought stress were examined in various phenological stages (first node appearance, heading and
grain filling). The drought stress was continued for 3-7 days, during which period the soil water humidity
decreased from 20-25 volumetric water content (VWC%) to 3-5 VWC%. Photosynthesis and antioxidant
enzyme activities (catalase, glutathione reductase, glutathione S-transferase, ascorbate peroxidase, guaiacol
peroxidase) were measured at various levels of water stress. Phenological and yield parameters were
determined at the end of the vegetation period. Significant differences were found between the varieties and
treatments in the antioxidant enzyme activity and a number of phenological parameters. Elevated CO2
concentration improved stress tolerance increasing biomass production and the grain number in both varieties.
High CO2 concentration also reduced the negative effect of drought stress on yield parameters.
Keywords: abiotic stress, climate change, elevated CO2 level, drought.
Introduction
The global atmospheric carbon dioxide concentration has been increasing continuously
during the last two centuries and its value is 35 % higher nowadays than before the
industrial revolution. The present average level is 385 ppm, but according to predictions
the carbon dioxide concentration will reach 650 to 970 ppm by the end of the 21st
century (IPCC 4th
report). The increase in temperature, which is more intensive in the
Carpathian Basin than global, and the decrease in precipitation in summer (Bartholy,
2008; Mika, 1991) and the declining water reserves aggregate the disposition of the
Hungarian climate to drought (Huszár, 1999). One direct consequence of the increasing
CO2 concentration is that the assimilation rate of plants is more intens (Wolf, 1996).
Elevated CO2 level increase both the above-ground and below-ground biomass. The two
impacts may interact as higher carbon dioxide levels can decrease the negative effect of
drought on quantitative yield parameters (Bencze, 2007). Different varieties have
different levels of adaptability which will make it possible to select genotypes which
can be grown successfully even under changed conditions (Veisz et al. 2005). High
temperature reduces the antioxidant enzyme activities and the intensity of the reactions
decrease as the plants age (Balla et al. 2007).
Materials and methods
This study was carried out in two PGV-36 growth chambers at the Agricultural
Research Institute of HAS in Martonvásár. Two winter wheat varieties, Mv Mambo and
Mv Regiment, were raised at normal (380 ppm)(NC) and elevated (750 ppm)(EC)
carbon dioxide concentration and the Spring 2 - Summer 2 climatic programme

Vol. 37, 2009, Suppl. Cereal Research Communications
210
(Tischner et al. 1997) was applied in both chambers. Four seedlings were planted after
vernalization for 42 days in pots containing approximately 3000 cm3 of a soil and sand
mixture. The irrigation was constant and nutrient solution was used twice a week till the
start of the treatments. Drought effects and yield parameters were examined at both CO2
concentrations compared to the control. The first period of water withdrawal was after
the first node appearance (FNA), the second during heading (H) and the last 10 days
after full heading, in the grain filling (GF) period. Drought was continued for 3-7 days
during which time the volumetric water content (VWC %) of the soil decreased from
20-25 VWC% to 3-5 VWC% while the plants started to wilt. The water content of the
pots was measured using an Em50 data logger and ECH2O EC-05 sensors (Decagon
Inc., USA). Antioxidant samples were collected at various level of water stress and were
stored at at -80oC until the analyses. Antioxidant enzyme activity was recorded using
the methodology of Janda et al. (2005). Measurements were made on five enzymes:
catalase, glutathione reductase, glutathione S-transferase, ascorbate peroxidase and
guaiacol peroxidase. The grain number, grain weight, biomass production per plant, and
the thousand-kernel weight (TKW) were determined after harvest. Two-way ANOVA
was used to establish the significant level between the treatments (Kuti et al. 2008).
Results and discussion
The grain number per plant did not change significantly in response to drought stress in
Mv Mambo (Table 1.) while higher atmospheric CO2 level increased the grain number
in the control and in the GF treatment compared to the ambient CO2 but it had no effect
in the other two treatments (Table 2.). In response to higher atmospheric CO2 level there
was an increase in grain number in the control and in the GF plants, compared with
normal CO2, while the other two treatments did not respond to enhanced CO2. The grain
number of Mv Regiment declined significantly as the result of drought in the FNA and
H treatments at high CO2 level, but was still higher than that recorded at the ambient
concentration under water stress conditions.
In response to a dry period the grain yield of Mv Mambó did not change in the FNA or
H treatments at either CO2 level. Plants treated at the grain filling period, however,
exhibited a 30.1% reduction in the grain weight per plant at normal CO2 level, while
this decrease was considerably smaller (17.8%) at the higher concentration. High CO2
concentration thus had a favourable effect on the grain production. At normal CO2 a
significant difference was only observed in Mv Regiment in the GF treatment, with a
value 22.3% lower than the control, while no difference was observed between the
treatments at enhanced CO2. In response to higher CO2, an increase in grain yield per
plant was observed both in the control and in the three treatments. The effect of drought
stress at the grain filling period was particularly striking at higher CO2, where the grain
weight was 65.7% higher than that of plants raised under normal CO2.
A significant reduction in the aboveground biomass of plants exposed to water stress in
various phenophases was only observed in the GF treatment at normal CO2 (15.2% for
Mv Mambó and 14.5% for Mv Regiment). In the case of Mv Mambó the biomass
production in the control and GF treatments was 16.9% and 32.15% higher,
respectively, at high CO2 than at the normal concentration, while in Mv Regiment a

VIII. Alps-Adria Scientific Workshop Neum, Bosnia-Herzegovina, 2009
DOI: 10.1556/CRC.37.2009.Suppl.2 211
considerable increase in biomass was observed in all the plants in response to enhanced
CO2.
Table 1. Impacts of drought stress at various phenophases compared to values at the corresponding CO2
concentration and normal water supply level
Mv Mambó Mv Regiment
Treatments
Grain
Number
%
Grain.
weight
%
Biomass
%
TKW
%
Grain
weight
%
Grain
mass
%
Biomas
s
%
TKW
%
NC 107.5 104.4 106.7 102.4 100.8 95.5 95.6 96.3 First
node apparen-
ce EC 89.2 94 96.3 106.2 87.7 89.0 97.3 101.7
NC 112.5 118.9 118.4 105.9 90.7 94.6 93.2 104.8 Heading
EC 90.3 98.0 102.7 107.4 84.3 92.1 96.5 109.8
NC 106.7 69.9 84.8 77.5 88.9 78.8 85.5 90.3 Grain
filling EC 103.5 78.2 95.8 71.1 104.6 102.7 101.6 99.9
100%= the normal water supply and either the ambient or the elevated CO2 level, respectively.
In Mv Mambó drought treatment had no significant effect on TKW except the GF
treatment, where the size of the grains decreased by 22.5% at normal CO2 and 29% at
the elevated CO2 level compared to the controllower at the higher level. The thousand-
kernel weight of plants grown at enhanced CO2 and exposed to drought during grain
filling was significantly (12.5%) lower than at normal CO2, indicating that higher
atmospheric CO2 concentration aggravated the unfavourable effects of drought. In Mv
Regiment the TKW of water stressed plants did not differ from the control at either CO2
level, but the grai weight was significantly higher at the enhanced CO2 level than at
normal CO2 in all the treatments.
Table 2. Effect of enhanced CO2 concentration on the biomass and yield components, compared with plants
grown at normal CO2 concentration at same water supply level
Mv Mambó
Mv Regiment
Treatments Grain number
%
Grain weight
%
Biomass
%
TKW
%
Grain number
%
Grain weight
%
Biomass
%
TKW
%
Control 19.34 11.95 16.93 -4.50 14.20 27.06 23.52 11.12
First node a. -0.95 0.80 5.53 -0.91 -0.63 18.48 25.73 17.32
Heading -4.18 -7.77 1.39 -3.16 6.13 23.66 27.93 16.39
Grain fill. 30.96 25.31 32.15 -12.50 34.41 65.70 46.64 22.85
Significant values in bold
Investigations on the effect of drought stress and enhanced CO2 on the antioxidant
enzyme system revealed that the activity of the ascorbate peroxidase enzyme was
modified to the greatest extent in both varieties, particularly during the ripening period
(Fig. 1). In both varieties glutathione reductase exhibited greater activity at higher CO2
level, especially in the grain filling period and in the case of low soil moisture. High
catalase activity was characteristic of both varieties at high CO2 in the GF treatment,
particularly at soil moisture levels below 6 VWC%. No significant changes were
observed in the activity of glutathione reductase or glutathione-S-transferase.

Vol. 37, 2009, Suppl. Cereal Research Communications
212
Figure 1. Activity of ascorbate peroxidase and guaiacol peroxidase at normal and enhanced CO2 level after
drought stress at grain filling period
Conclusions
The two varieties tested exhibited considerable differences in their responses to drought
and to enhanced atmospheric CO2 concentration. Mv Mambó made better use of low
soil moisture contents, with only slight changes in yields, but the effect of a higher level
of available CO2 was not reflected in the yield, despite the fact that positive changes
were recorded in the spike number and productivity. Mv Regiment proved to be more
sensitive to water withholding, but it exploited surplus CO2 more efficiently and was
thus able to compensate for the negative effects of drought, resulting in a higher yield
level than that of Mv Mambó at enhanced atmospheric carbon dioxide concentration.
Acknowledgements
This research was funded by the AGRISAFE 203288 EU-FP7-REGPOT 2007-1
programme and the K63369 OTKA project.
References
Balla, K., Bedı, Z., Veisz, O.: 2007. Heat stress inducted changes in the activity of antioxidant enzymes in
wheat. Cereal Res. Commun., 35: 197-200. Bartholy, J., Pongrácz, R.: 2008. Analyses of the regional climate change in the Carpathian Basin. Climate
Change: environment-risk-society (eds: Harnos, Zs.). Szaktudás Kiadó, 15-53.
Bencze, Sz., Keresztényi, E., Veisz, O.: 2007. Change in heat stress resistance in wheat due to soil nitrogen
and atmospheric CO2 levels. Cereal Res. Commun., 35: 229-232.
Huszár, T., Mika, J., Lóczy, D., Molnár, K., Kertész, Á.:1999. Climate change and soil moisture: A case
study. Physics and Chemistry of the Earth, Part A: Solid Earth and Geodesy, 24: 10. 905-912.
Janda, T., Kósa, E., Pintér, J., Szalai, G., Marton, C.L., Páldi, E.:2005. Antioxidant activity and chilling
tolerance of young maize inbred lines and their hybrids. Cereal Res. Commun., 33: 541-548.
Kuti, Cs., Láng, L., Bedı, Z.: 2008. Informatical background of field experiments. Cereal Res. Commun, 36:
171-174.
Mika, J.: 1991. Predictable features of major global warming in Hungary. Idıjárás, 95: 265-278.
Veisz, O., Bencze, Sz., Zoltán, B.:2005. Effect of elevated CO2 on wheat and various nutrient supply levels.
Cereal Res. Commun., 33: 333-336.
Tischner, T., Rajkainé Végh, K., Kıszegi, B.: 1997. Effect of growth medium on the growth of cereals in the
phytotron. Acta Agron. Hung, 45 187-193.
Wolf, J.: 1996. Effects of nutrient supply (NPK) on spring wheat response to elevated atmospheric CO2. Plant
Soil, 185: 113-123.

VIII. Alps-Adria Scientific Workshop Neum, Bosnia-Herzegovina, 2009
DOI: 10.1556/CRC.37.2009.Suppl.2 213
EFFECTIVENESS OF DESIGNATED MAJOR POWDERY MILDEW RESISTANCE GENES IN VARIOUS WHEAT GENOTYPES
Judit KOMÁROMI – Gyula VIDA
Agricultural Research Institute of the Hungarian Academy of Sciences, Brunszvik utca 2, Martonvásár,
Hungary, e-mail: [email protected]
Abstract: One of the most important biotic stress factors for wheat in Hungary is powdery mildew. The
effectiveness of the powdery mildew resistance conferred by 18 major Pm genes and their combinations were
tested both in greenhouse experiments using various mono-isolates and in the field in the period between 2006
and 2008. The differential set recommended by the COST817 Action was used in greenhouse experiments and
a variety that does not carry any known Pm gene served as the control. The results showed that none of the
Pm genes tested were able to confer complete resistance against powdery mildew. In all three years a high
level of virulence (>90%) was observed on test varieties carrying resistance genes Pm2, Pm3c, Pm4a, Pm5,
Pm6 and Pm8. During the experimental period there was an increase in the ratio of isolates virulent to Pm17,
which could be due to the introduction of varieties carrying the 1A/1R translocation. The field trials revealed
that several Pm genes were able to confer above-average resistance in the wheat genotypes tested.
Differentials carrying genes Pm3d, Pm3f, Pm4b or Pm5 or the gene combination Pm2+6 exhibited resistance
that did not differ significantly from 0 % severity. Genotypes carrying genes Pm2, Pm3c, Pm4a, or one of the
most widespread genes in Hungary, Pm8, were severely infected, so these genes did not confer effective
control of powdery mildew infection in the field.
Key words: powdery mildew, Pm genes, biotic stress
Introduction
Wheat powdery mildew, caused by Blumeria graminis, is a disease that causes
extensive losses every year in all the wheat-growing regions of the world. The first
epidemic in Hungary was reported in 1961 (Podhradszky and Csuti 1962), and since
then natural infection has occurred every year. The powdery mildew resistance of wheat
genotypes is determined by known major genes and/or quantitative resistance genes
with an additive effect. Up till now 58 powdery mildew resistance genes or alleles have
been identified at 39 loci on 16 different chromosomes (McIntosh et al. 2008), but more
and more major genes are being incorporated into wheat from alien species (Tang et al.
2008). The gene-for-gene effect first reported by Flor (1955) can be clearly proved
between the pathogen and the majority of the host plants carrying these genes. In the
case of the wheat–wheat powdery mildew relationship, Powers and Sando (1960) were
the first to demonstrate that avirulence genes corresponding to the resistance factors in
the host plant could be found in the pathogen. Most race-specific genes function
throughout the wheat vegetation period, but a few (Pm5, Pm6, Pm 17) are mainly
effective in adult plants (Lebstock and Briggle 1974, Csısz et al. 1997). A knowledge
of the genetic background of powdery mildew resistance in cultivated varieties and in
the parental genotypes used in crossing programmes is valuable information for
breeders. This knowledge, combined with information on the virulence spectrum of the
pathogen, allows resistance to be retained for a long period (Hsam and Zeller 2002).
The powdery mildew population is constantly changing. On the basis of thirty years of
data, Szunics et al. (2000) observed a general tendency for an increase in the ratio of
pathotypes with complex virulence in the pathogen population over recent decades. This

Vol. 37, 2009, Suppl. Cereal Research Communications
214
was confirmed by results obtained in the eastern part of the United States (Niewoehner
and Leath 1998).
This paper discusses the results of three years (2006–2008) of research on the powdery
mildew resistance of wheat varieties and lines grown in the greenhouse and nursery in
Martonvásár.
Materials and methods
The efficiency of major gene resistance was tested for 18 Pm genes or gene
combinations under greenhouse and field conditions in three consecutive years (2006–
2008).
In seedling tests in the greenhouse, a total of 558 single-pustule wheat powdery mildew
isolates were used to test the efficiency of major genes. The powdery mildew pustules
originated from winter wheat varieties currently or previously grown on large areas in
Hungary. Sixteen varieties from the test collection recommended by COST Action 817
(Clarkson 2000) and a susceptible genotype carrying resistance genes not found in these
varieties (Carsten V. – susceptible control and Michigan Amber/Chancellor*8) were
used in the experiments. The greenhouse experiment was evaluated as described by
Vida et al. (2007).
The degree of powdery mildew infection of wheat genotypes carrying known Pm genes
or gene combinations was investigated in a field experiment with three replications.
Irrigation was carried out in the vicinity of the experiment so that the increased
humidity would favour the spread of the pathogen. In the course of the vegetation
period the severity % was observed every seven days on a total of five occasions and the
area under the disease progress curve (AUDPC) was calculated from the data. Two-way
analysis of variance was used to evaluate the data (Kuti et al. 2008).
Results
The seedling test revealed virulence in the pathogen population to all the resistance
genes tested, but substantial differences were observed in the degree of virulence for the
individual genes (Table 1).
Table 1. Virulence of the powdery mildew population on wheat varieties and lines carrying known resistance
genes Martonvásár, 2006–2008
Variety Pm Virulence% Variety Pm Virulence%
gene 2006 2007 2008 gene 2006 2007 2008
Carsten V. 0 100.0 100.0 100.0 Ronos 4b 76.0 85.9 87.6 Axminster/8*CC 1 55.6 59.1 53.2 Rektor 5 100.0 99.0 100.0
Ulka/8*CC 2 91.8 91.8 90.3 NK-747 6 90.8 97.6 98.4
Asosan/8*CC 3a 70.4 79.3 79.0 Transfed 7 74.5 95.6 97.8
Chul/8*CC 3b 21.9 26.0 28.0 Disponent 8 100.0 99.5 100.0
Sonora/8*CC 3c 94.4 97.6 100.0 Amigo 17 62.2 88.5 93.0
Ralle 3d 43.9 36.1 38.2 M. Huntsman 2+6 77.0 86.0 88.7
M. Amber/CC*8 3f 42.4 35.1 36.0 Apollo 2+4b+8 66.3 81.7 79.6
Khapli/8*CC 4a 100.0 99.5 100.0 Normandie 1+2+9 65.8 89.9 52.2
LSD5%=11.7 Abbreviations: CC=Chancellor, M. Amber=Michigan Amber, M.Huntsman= Maris Huntsman

VIII. Alps-Adria Scientific Workshop Neum, Bosnia-Herzegovina, 2009
DOI: 10.1556/CRC.37.2009.Suppl.2 215
Virulence was less than 50% for several alleles of the Pm3 gene (Pm3b, Pm3d, Pm3f),
while virulence of over 90% was observed in the pathogen population for resistance
genes Pm2, Pm3c, Pm4a, Pm5, Pm6 and Pm8. During the three years of the experiment
there was an increase in the ratio of isolates virulent to Pm17, which could be associated
with the appearance of varieties carrying the 1A/1R translocation in general cultivation.
The powdery mildew infection of varieties carrying known resistance genes was also
tested in the field in a replicated experiment (Table 2). In contrast to the results of
preliminary virulence surveys, Pm3d was found to provide excellent protection against
powdery mildew. Several genes and gene combinations (Pm3f, Pm4b, Pm5 and Pm2+6)
conferred partial resistance. Genotypes carrying genes Pm2, Pm3c, and Pm4a, as well
as one of the most widespread gene in Hungary, Pm8, were infected considerably and
did not confer effective control against powdery mildew infections in the field.
Table 2. Area under the disease progress curve (AUDPC) calculated from the severity % of wheat genotypes
carrying known resistance genes Martonvásár, 2006–2008
Variety Pm AUDPC Variety Pm AUDPC
gene 2006 2007 2008 gene 2006 2007 2008
Carsten V. 0 886.7 393.8 1166.7 Ronos 4b *226.2 *333.2 677.0 Axminster/8*CC 1 699.3 431.7 1102.5 Rektor 5 *158.8 *256.8 624.4
Ulka/8*CC 2 1888.3 1411.7 1884.2 NK-747 6 354.2 501.7 793.7
Asosan/8*CC 3a *221.5 746.7 1038.5 Transfed 7 382.5 665.0 974.4
Chul/8*CC 3b 354.5 1131.7 1225.1 Disponent 8 830.0 950.8 1545.8
Sonora/8*CC 3c 1000.2 1540.0 1306.8 Amigo 17 385.2 1050.0 1324.4
Ralle 3d *9.0 *0.0 *0.0 M. Huntsman 2+6 *261.2 *163.3 513.6
M.Amber/CC*8 3f *96.8 *338.3 613.8 Apollo 2+4b+8 356.8 *216.8 857.7
Khapli/8*CC 4a 1323.3 1446.7 1775.7 Normandie 1+2+9 373.5 *361.7 1195.8
*Not significantly different from 0 at the P=0.05 level. Abbreviations: CC=Chancellor, M.Amber=Michigan
Amber, M.Huntsman= Maris Huntsman
Conclusions
Due to the biology of the powdery mildew fungus and to the great variability of its
populations, the exploitation of major gene resistance is only a short-term solution
(McDonald and Linde 2002). This was confirmed by the present experiments, as
virulence was detected in the pathogen population to all the Pm genes tested.
Nevertheless the variety ‘Ralle’, which carries the Pm3d gene and was infected in
greenhouse seedling tests by 36.1–43.9% of the powdery mildew isolates, exhibited
excellent powdery mildew resistance under field conditions. Although this gene can be
found in several varieties of European origin (McIntosh et al. 2008), to the best of our
knowledge, no varieties carrying the Pm3d gene are currently cultivated in Hungary,
which could explain the low ratio of virulent pathotypes in the pathogen population.
Further tests will be required to determine whether this resistance is only effective in
adult plants, like many other powdery mildew genes, or whether any other Pm genes are
present in ‘Ralle’ apart from the Pm3d gene, thus improving its resistance by
pyramiding.
The present results indicate that none of the resistance genes tested is capable of
providing reliable protection against the Hungarian pathogen population, so none of
them can be used alone as the basis of efficient resistance breeding.

Vol. 37, 2009, Suppl. Cereal Research Communications
216
Acknowledgements
This research was funded by the GAK TRIPATOL (OMFB-00890/2005) project.
References
Csısz M. - Barabás Z. - Mesterházy Á.: 1997. Genes effective against powdery mildew and leaf rust in
Hungary. In: Tvaruzek, L. (ed): Proceedings of International Conference on Protection of cereal crops
against harmful organisms. Kromeriz, Czech Republic. 171-173.
Clarkson J. D. S.: 2000. Virulence survey report for wheat powdery mildew in Europe, 1996-1998. Cereal
Rusts and Powdery Mildews Bulletin http://www.crpmb.org/2000/1204clarkson. Accessed 24 Jan 2009
Flor H. H.: 1955. Host-parasite interaction in flax rust – its genetics and other implications. Phytopathology,
45: 680-685.
Hsam S. L. K. - Zeller F. J.: 2002. Breeding for powdery mildew resistance in common wheat (Triticum
aestivum L.). In: Bélanger, R.R. – Bushnell, W.R. – Dick, A.J. – Carver, T.L.W. (eds): The powdery
mildews A comprehensive treatise. APS Press St. Paul, Minnesota
Kuti Cs. - Láng L. - Bedı Z.: 2008. Informatical background of field experiments. Cereal Research
Communications 36: 171-174.
Lebsock K. L. - Briggle L. W.:1974. Gene Pm5 for resistance to Erysiphe graminis f. sp. tritici in Hope
wheat. Crop Sci., 14: 561-563.
McDonald B. A. - Linde C.: 2002. Phatogen population genetics, evolutionary potential, and durable
resistance. Annu. Rev. Phytopathol., 40: 349-379.
McIntosh R. A. - Yamazaki Y. - Dubcovsky J. - Rogers J. - Morris C. - Somers D. J. - Appels R. - Devos K.
M.: 2008. Catalogue of gene symbols for wheat. In: Komugi - Integrated Wheat Science Database.
http://www.shigen.nig.ac.jp/wheat/ komugi/genes/symbolClassList.jsp. Accessed 24 Jan 2009
Niewoehner A. S. - Leath S.: 1998. Virulence of Blumeria graminis f. sp. tritici on winter wheat in the eastern
United States. Plant Disease, 82: 64-68.
Podhradszky J. - Csuti I.-né: 1962. Búza- és árpa lisztharmatjárvány 1961. évben Magyarországon.
Növénytermelés, 11: 3. 249-254.
Powers H. R. - Sando W. J.: 1960. Genetic control of the host-parasite relationship in wheat powdery mildew.
Phytopathology, 50: 454-457.
Szunics L. - Szunics Lu. - Vida Gy.: 2000. A búzalisztharmat-populáció virulenciaváltozása közel három
évtized alatt. Növénytermelés, 49: 1-2. 13-25.
Tang Z. X. - Fu S. L. - Ren Z. L. - Zhang H. Q. - Yang Z. J. - Yan B. J. - Zhang H. Y.: 2008. Production of a
new wheat cultivar with a different 1B.1R translocation with resistance to powdery mildew and stripe
rust. Cereal Research Communications, 36: 3. 451-460.
Vida Gy. - Komáromi J. - Szunics L. - Láng L. - Bedı Z. - Veisz O.:2007. Búzalisztharmat-virulencia
felmérése és szántóföldi rezisztenciavizsgálatok Martonvásáron. Növénytermelés, 56:1-2. 3-11.

VIII. Alps-Adria Scientific Workshop Neum, Bosnia-Herzegovina, 2009
DOI: 10.1556/CRC.37.2009.Suppl.2 217
REGISTRATION AND UTILISATION OF MOLECULAR BREEDING DATA IN RESISTANCE BREEDING
Csaba KUTI – László LÁNG – Zoltán BEDİ
Wheat Breeding Department, Agricultural Research Institute of the Hungarian Academy of Sciences
H-2462 Martonvásár, Brunszvik utca 2., e-mail: [email protected]
Abstract: The aim of resistance breeding is to transfer naturally occurring genes into major crops in order to
improve their resistance to biotic and abiotic stress factors. In recent years a complete information system has
been elaborated in Martonvásár, which amalgamates breeding and IT knowledge and is continually revised.
The use of methods based on molecular breeding and the transgenic technique have made it necessary to
create new types of databases to record information on genes, markers and transformation vectors. In order to
facilitate the use of the data by breeders, new software also had to be designed for the following functions: (1)
to identify useful resistance genes in genomic databases, (2) to identify and store markers suitable for the
marker-assisted selection of basic genetic materials, (3) to provide real-time information to breeders (at the
required time for the required search parameters) to facilitate the choice of crossing partners, (4) to test the
ability to monitor transformation experiments, and (5) to make these experiments compatible with
conventional breeding (crossing) programmes.
Keywords: agroinformatics, breeding, marker-assisted, selection, genomic database, software
Introduction
The aim of (wheat) breeding against biotic and abiotic stress effects is to develop highly
resistant varieties with better disease resistance than currently cultivated varieties and
with better tolerance of drought, frost and herbicides, on the basis of which they can be
recommended to growers.
In Martonvásár there is a long tradition of testing wheat varieties, breeding lines and
resistance sources in artificially inoculated nurseries, followed by the selection of
disease-resistant plants from the segregating progeny populations (Szunics, 1973). The
development of resistant or only slightly susceptible wheat varieties continues to be a
high priority (Vida, 2008). Another tradition is the testing of lines for frost resistance in
the phytotron before entering them for state trials (Veisz, 2001). The future aims of
wheat breeding can only be achieved if these traditional breeding methods are
successfully integrated with molecular breeding methods (Bedı, 2007). Molecular
marker analysis generates a new type of data (Uhrin, 2006), (Tar, 2008), which need to
be linked with the wheat breeding information system already operating. The present
system (Láng, 2001) was set up in order to ensure the uniform handling of data from
breeding and field research programmes, to facilitate the organisation of breeding
activities, and to increase the size and efficiency of research programmes. It can be used
to register breeding materials, to design field and laboratory experiments, to collect
experimental data online and to rapidly evaluate the experiments. Cereal gene bank
records and the exchange of basic stock use the same system as the registration of
breeding data, including the pedigree database. In the framework of the institute’s
research projects, molecular marker-assisted selection is used to incorporate known
resistance genes into varieties adapted to Hungarian conditions and to select resistant
phenotypes, with the aim of improving biotic and abiotic stress resistance. Work has
begun on the pyramiding of resistance genes into winter wheat genotypes. The IT tools
required for molecular plant breeding include: (1) a uniform data structure, which
provides the easily accessed, centralised storage of specific information from various

Vol. 37, 2009, Suppl. Cereal Research Communications
218
breeding programmes, (2) direct links between existing gene source records (Kuti,
2006) and newly generated molecular marker data, and (3) a software module to ensure
that the expensively produced and recorded data are displayed in groupings that
facilitate scientific decisions on the selection of breeding materials.
Materials and methods
The handling of a large volume of data can be simplified by storing them in databases,
which also facilitates the intelligent processing and evaluation of the results. When
designing the gene technology database, the normalisation of the structure of the tables
in the database was continued until the third normal form was reached, which proved to
be a good compromise between the relatively simple ordering of the data and the
resulting redundancy (Hernandez, 2003).
The database and the tables it contains were developed using the database engine of
Microsoft® MS Access and Microsoft JET (Joint Engine Technology). The application
package for data handling, processing and evaluating (Breeder) was developed using the
Microsoft® Visual Basic Integrated Development Environment (VB-IDE). The
application can be run using various versions of the Windows operating system:
Windows® 2000/XP/VISTA.
The majority of the output and input data used by the Breeder package are in formats
that can also be displayed in Microsoft OfficeXP® package components such as
Microsoft® Excel, Microsoft® Access and Microsoft® Word, all of which run in the
Windows® operating system, so it is advisable to install the Office package in the
workstations.
Results and discussion
Data modelling The gene technology database ensures the storage and flow of specific information
related to molecular marker-assisted selection, thus providing a reliable source of
information for the analysis of the genetic background of lines including in crossing
programmes. It allows the grouping/selection of gene sources from which a higher
percentage of lines with good resistance are likely to arise. The information is stored in
the database according to various topic, so that each topic is represented by a data table.
It is important that each table should only contain information referring to the relevant
topic (Fig. 1).
As is clear from Figure 1., the gene technology database consists of several tables, some
of which (a, b, c) serve for the recording of information on genes, markers and primers,
while others fulfil a linking role, managing many-to-many (M:N) relationships within
the database (d, e) or between databases (f). How data are entered into the tables
depends on the type of table. Gene, marker and primer data can be entered in various
ways: directly into the tables with the help of the database handling system (MS
ACCESS), using the user-friendly data input module of Breeder, or from tables of a
given structure (Excel), using the special functions of Breeder. The Breeder system
automatically keeps the linking tables up to date. Whenever any change occurs in the
interconnected tables, the relevant data are also entered into the linking tables. The

VIII. Alps-Adria Scientific Workshop Neum, Bosnia-Herzegovina, 2009
DOI: 10.1556/CRC.37.2009.Suppl.2 219
database is open and new data are continually added to the tables. Their structure can be
flexibly changed so that previously unplanned parameters or new topics of value for
decision-making can be added to the data structure.
Operation of the system
Using new molecular marker data originating from various sources (own data,
literature) the genetic background of the basic breeding stock can be defined
increasingly accurately. This means that decisions on selection can be based on an up-
to-date, relevant gene technological information base providing a characterisation of the
genetic background of the gene sources. In practice this was achieved by linking (data
design + special applications) the pedigree database (approx. 150,000 genotypes) and
the breeding trial and field data records (approx. 130,000 records each year) with the
uniform database of the gene technology records, as seen in Figure 1. In this way, the
gene technology information can be directly linked to specific wheat varieties, breeding
lines and resistance sources (both Martonvásár and non-Martonvásár).
Figure 1. Relationship between the FIELD TRIAL, PEDIGREE and MOLECULAR databases
This means that, when planning crossing programmes, the system is able to set up
parental groups consisting of all the genotypes identified on the basis of the available
information as carrying the resistance gene(s) targeted by the crossing programme (Fig.
2). Conversely, information on a selected parental line (relevant genes, markers,
primers, etc.) can be made instantly available to the breeder from the gene technology
subsystem. In other words, the specific information on parental partners stored in the
gene technology database allows more accurate predictions to be made concerning the
traits likely to be inherited, without having to carry out phenotypic testing for disease
resistance. Priority is given to data originating from research carried out in Martonvásár
or in cooperation with foreign partners, while data from the literature are treated with
more circumspection.

Vol. 37, 2009, Suppl. Cereal Research Communications
220
Figure 2. Technology of data
processing
Conclusions
The enormous advances in
molecular genetics and its
methodological application
(biotechnology) have cont-
ributed to improvements in
the agronomically impor-
tant traits of crops,
increasing their resistance
to biotic and abiotic stress
factors. This new techno-
logy complements conven-
tional breeding techniques and, in combination with information technologies,
considerably improves their efficiency. The collection of molecular marker-assisted
selection data from our own research and from the literature, and their integration into
earlier data models and pedigree records means that the genetic background of
fundamentally important resistance sources can be analysed during the design of
crossing programmes. The results reach the breeder via specific applications in the form
of predictive and prognostic selection information, making use of the available IT tools
and the accelerated recognition of the genetic background of the traits. The new system
can also be applied in other research projects where the large number of genotypes and
markers for testing means that the body of data is too large to be analysed by
conventional methods. The system will also play an important role in the integration of
conventional and molecular plant breeding.
References
Bedı Z., Láng L., Rakszegi M.: 2007. Gene technology as a tool for plant breeding. Magyar Tudomány, 4: 418-427.
Hernandez J. M.: 2003. Database Design for Mere MortalsTM. Addison Wesley Professional
Kuti Cs., Láng L., Bedı Z.: 2006. Pedigree records in plant breeding: from independent data to interdependent
data structures. Cereal Research Communications, 34. 2-3: 911-918. Láng L., Kuti C., Bedö Z.: 2001. Computerised data management system for cereal breeding. Euphytica 119:
1-2, 235-240.
Szunics L., Szunics Lu.: 1973. Adatok egyes búzafajták és keresztezési származékaik lisztharmat-
rezisztenciájáról és produktivitásáról. Növénytermelés, 22:1. 1-7.
Tar M., Purnhauser L., Csısz M.: 2008. Identification and localization of molecular markers linked to the
Lr52 leaf rust resistance gene of wheat. Cereal Research Communications, 36:3. 409-415.
Uhrin A., Vida Gy., Gál M., Láng L., Bedı Z.: 2006. Marker-assisted selection for leaf rust resistance gene
Lr37 in the Martonvásár breeding programme. Cereal Research Communications, 34:1. 89-91.
Veisz O., Braun HJ., Bedı Z.: 2001. Plant damage after freezing, and the frost resistance of varieties from the
facultative and winter wheat observation nurseries. Euphytica, 119:1-2. 179-183.
Vida Gy., Gál M., Szunics L., Láng L., Bedı Z., Veisz O.: 2008. A búza rozsdagombákkal szembeni
ellenállóságának javítása nemesítéssel. Növényvédelem, 44:7. 322-327.

VIII. Alps-Adria Scientific Workshop Neum, Bosnia-Herzegovina, 2009
DOI: 10.1556/CRC.37.2009.Suppl.2 221
THE EFFECT OF HEAT ON TABLE BEET (Beta vulgaris ssp.
esculenta var. rubra) QUALITY
Maria TAKACS-HAJOS
Szent Istvan University, Faculty of Water- and Environment Management, 1-3. Szabadság u., Szarvas, H-
5540, Hungary, e-mail: [email protected]
Abstract: As a result of our three-year-long experiment it was concluded that the daily maximum
temperatures should be carefully considered at the sowing of table beet seeds at the beginning of July on
fluvial meadow soil, as the days of extremely high temperature (>30oC) or the days with temperature over
20oC decrease the germination and later the accumulation of colour materials in the beet root. According to our studies the Hungarian varieties, Favorit and Rubin approved to be the most stable, which
showed good quality even at extremely high temperatures.
Keywords: table beet varieties, colour content, betacyanine, betaxantine, air temperature
Introduction
The quality of table beet is based mainly on its colour material content, the amount of
which depends not only on the genotype but on the environmental conditions as well
(light, rainfall, temperature, nutrient supply). Thus the growing season also determines
the produce quality. In Hungary the table beet is grown mostly as a second crop. Thus
the short vegetation season (100 days) makes the autumn processing possible. However,
in other European countries it is sown in spring, too. In our experiment (Takácsné
Hájos, 1993) the influence of different sowing times on colour material accumulation of
beet root was studied. Experiments with carrot indicated, that during unfavourable
environmental changes the sucrose content in taproot is influenced by PFP
(pyrophosphate:fructose 6-phosphate 1-phosphotransferase), with is involved in the
mobilisation of energy reserves (Kovács et al., 2007). It was found that the colour
material accumulation of beet root is determined mostly by the variety, sowing time and
air temperature. This hypothesis was also proven by Watson and Gabelman’s
experiments (1982). Researchers determined that there are differences between the
carrot varieties in their adaptability to drought and heat. It is could be detected as
changes in the chlorophyll and carotene contents of the leaves even at 30/15 °C
(Nemeskéri et al., 2008). In our climatic conditions the higher than 20oC daily average
temperature influenced the colour accumulation of beet roots negatively. The highest
beta-cyanine content was found on 75th
day of vegetation in case of May sowing, while
it was found on 135th
day in case of June sowing, and the water soluble dry matter
content was also low in this case. Such a basic material is utilizable for producing
natural colouring substance. Based on our experiments the climatic conditions for
sowing of table beet were the best in July, which is explained by the favourable effect of
cool temperature of less then 20oC. The colour substance content of beet roots from this
sowing showed the maximum level on the 100th
day of the vegetation season, while the
water soluble dry matter content was also high.
In this study the effects of high summer temperatures on the amount of red and yellow
colour substance of table beet were evaluated, and the proportion of the two colour
substances to each other was also studied. Sometimes apply salicylic acid (SA)
treatment to increase stress tolerance. It was successful in the experiment with tomato,
where the acclimation to high salinity was stated (Szepesi et al., 2008). The expectable

Vol. 37, 2009, Suppl. Cereal Research Communications
222
effects of the climatic change are the sultry summers and the lack of rainfall, which
might highly modify the growing technology of some vegetables. Therefore the testing
of effects of scorcher days (>30 o
C) on vegetables might be important. Such a plant is
the table beet, which is sown at the end of June and the beginning of July in Hungary.
Materials and methods
The experiments were conducted in Galambos Horticultural Experimental Farm of
Faculty of Agricultural Water and Environmental Management of Szent Istvan
University between 2006 and 2008. Among the experimental varieties there were four
Hungarian ones (Favorit, Rubin, Bordó, Detroit) and a Dutch one (Little Ball). The
seeds were sown in four repetitions on fluvial meadow soil, the characterization of
which is shown in Table 1. The sowing was carried out at the end of June and beginning
of July, which are the most preferred time periods in the Hungarian table beet growing.
The row space was 40 cm. During the vegetation season the agro-technical processes
needed for the table beet were carried out. The colour substance quantities were
measured by the atomic absorption method. The absorbance values of the two colour
substances were determined (betacyanine – 537 nm, betaxantine – 478 nm), finally
measurements were taken at 600 nm, too. The colouring substance concentration was
calculated by Nilsson’s method (1970), and the results were given for the amount of mg
betacyanine/100 g raw mass.
Table 1 Meteorological data (Szarvas, 2005-2008)
Air temperature (oC) Month/ 2005 2006 2007 2008
July 21.71 24.95 23.61 21.59 August 19.96 22.04 23.09 22.16
September 17,57 18,75 14,66 15,81
Average 19.75 21.91 20.45 19.85 Soil temperature (oC) July 22.76 23.22 24.96 23.15 August 22 21.37 24.81 23.74
September 19.64 17.38 16.89 18.16
Average 21.47 20.66 22.22 21.68 Quantity of rainfall (mm) July 80.1 29 43.2 42
August 173.7 88.3 31 56.4
September 58.2 20.2 82.3 36.9
Total 312 137.5 156.5 135.3
Results and discussion
It is clearly visible from the air temperature data of Tables 1 and 2 that the highest
average temperature was measured in 2007, and the number of scorcher days was also
the highest this year (32 days). This year complete plant canopy could not develop
during the experiment as the real scorcher during the days of sowing inhibited the

VIII. Alps-Adria Scientific Workshop Neum, Bosnia-Herzegovina, 2009
DOI: 10.1556/CRC.37.2009.Suppl.2 223
growing of germinating plants. In 2007 the monthly average temperature in June and
July was much higher than 20oC (23.61 and 23.09
oC), and the soil temperature was also
hardly less than 25oC. Besides these extraordinary temperature conditions there was
very low precipitation during the time of sowing.
Table 2 Number of scorcher days (>30°C), Szarvas 2005-2008
Month/year 2005 2006 2007 2008 July 7 21 15 7
August 3 5 17 13
During the other examined years (2005, 2006 and 2008) a complete plant canopy
developed. The red (BC) and yellow (BX) colouring substance content of beet roots
compared to (Table 3-4) the September average temperature of different years it was
found that the temperatures around 15oC influenced the accumulation of colouring
substance in the beet root favourably. The lowest colouring substance values were
found in 2005 when the natural precipitation was more than double of the years 2006
and 2008. It was found that the better water supply in the vegetation season resulted in
bigger beet roots, which at the same time resulted in the dilution of colouring
substances. It is demonstrated by the correlation connection between the amount of
precipitation and betacianine content: r = -0.95. The highest colouring substance content
was found in the Hungarian variety Favorit, while the varieties Detroit and Little Ball were characterized by weaker quality than the other ones as a consequence of our very
hot summers.
Table 3 Betacyanine content of table beet varieties (mg 100g-1)
Years “B” varieties “A” 2005 2006 2008 mean of years Favorit 66.46 89.01 81.30 78.92
Rubin 77.41 75.67 67.40 73.49 Detroit 40.68 36.84 51.85 43.12
Bordó 47.1 68.02 76.95 64.08 Little Ball 39.64 63.11 62.51 55.09
Mean of 54.26 66.53 68.00 - LSD(5%) 4.887 5.104 5.503 - LSD(1%) 6.757 7.056 7.608 - LSD(0.1%) 9.339 9.752 10.516 -
Significant differences: Between either two version: P(5%): 2.44
Between the version of “A” in the mean of “B” P(5%): 1.41
Between the version of “B” in the mean of “A” P(5%): 1,09
Between the differences (example: b1-b2 in the different version of “A”) P(5%): 3.46

Vol. 37, 2009, Suppl. Cereal Research Communications
224
Table 4 Betaxantine content of table beet varieties (mg 100g-1)
Years “B” varieties “A” 2005 2006 2008 mean of years Favorit 73.09 85.90 88.43 82.47
Rubin 77.04 73.93 77.41 76.13
Detroit 47.86 40.51 50.38 46.25
Bordó 51.88 66.50 77.52 65.30
Little Ball 40.77 62.94 73.06 58.92
Mean of 58.13 65.96 73.36 - LSD(5%) 7.021 6.530 5.950 - LSD(1%) 9.031 8.130 6.215 - LSD(0.1%) 12.051 10.950 9.314 -
Conclusions
If the second crop will be applied in the home table beet production, it would be useful
to sow varieties selected in Hungary as they are more resistant against the extreme
climatic conditions. The accumulation of yellow and red colouring substances determining the quality of
table beet might be influenced more favourably by the September cool weather (under
20oC), which is in the period of intensive root development phase of table beet.
It is advised to wait with the sowing for a cooler period in the period between the end of
June and beginning of July, as the germination will be more favourable. The application
of irrigation water on the scorcher days at nearly 25oC soil temperature, the glomerule
could not survive in the soil.
It is also suggested to postpone the sowing to the middle of July or do it as early as May
because otherwise the summer scorcher might cause difficulties in the early
development and the accumulation of colouring substances.
References
Kovács G.- Sorvari S.- Scott, P. – Toldi O.: 2007. Pyrophosphatase: fructose 6-phosphate 1- phosphotrans-
ferase is involvedin the mobilisation of sugar reserve in the taproot of cold- and drought-stressed carrot
plants. Acta Agronomica Hungarica.55.1:71-82.
Nemeskéri E. – Remenyik L. – Fári M: 2008. Studies on the drought and heat stress response of green bean
(Phaseolus vulgaris L.) varieties under phytotronic conditions. Acta Agronomica Hungarica. 56. 3:321-
328.
Nilsson, T.: 1970. Studies into the pigment sin the beetroot. Lantbr. Högsk. Anner. 36:179-219.
Szepesi Á. – Csiszár J. – Gallé Á. – Gémes K. – Poór P. – Tan I.: 2008. Effects of long –term salicilya acid
pretreatment on tomato (Lycopersicon esculentum Mill. L.) salt stress tolerance: Changes in glutathione
S-transferase activities and anthocyanin contents. Acta Agronomica Hungarica. 56. 2:12-138.
Takácsné Hájos M.: 1993. A cékla optimális betakarítási idejének meghatározása a répatest színanyag
tartalmának függvényében. Zöldségtermesztési Kutató Intézet Bulletinje. Kecskemét. 25:81-95.
Watson, I. F. – Gabelman, W. H.:1982. Seasonal changes and cultivar difference in pigment concentration and
percent dissolved solids in roots of table beets. Journal od the Amerrican Society for Horticultural
Science. 107.5:713-716.

VIII. Alps-Adria Scientific Workshop Neum, Bosnia-Herzegovina, 2009
DOI: 10.1556/CRC.37.2009.Suppl.2 225
EFFECT OF INSECTICIDES AS CHEMICAL STRESSORS ON HARMFUL AND USEFUL ARTHROPODS OF POTATO FIELDS
Balázs KERESZTES1 – Miklós NÁDASY1 – Zsolt MARCZALI1
1Department of Applied Zoology, Institute for Plant Protection, Georgikon Faculty, University of Pannonia,
H-8360 Keszthely Ferenc Deák Str. 57., e-mail: [email protected]
Abstract: Keszthely is a famous Hungarian town for the potato improvement which has been starting within
the frames of the University’s Potato Research Centre for 30 years. Arthropod species as potato pests can
cause severe damages. Chemical treatments are inevitable in protection of potato plants but insecticides have
an effect of useful species too. We have been studying the arthropod fauna of potato fields of the centre in
three consecutive years (2006-2008) with the aim of revealing the effect of insecticide treatments on the
harmful and useful species. Standard sweep netting was used for collecting insects from the foliage of potato
plants. Collections were made one day before then 24 and 96 hours after insecticide treatments. Collected
material was preserved, separated and identified. There was a considerable difference in the numbers of
species among the three investigated years. It was established that different types of insecticide treatments
effect quite differently on the number of harmful and useful arthropods.
Keywords: insecticides, useful and harmful arthropods, potato
Introduction
There were several researches performed in Hungary and its neighbouring countries
with reference to potato production (JERMY et al. 2006, POLJAK et al. 2007,
HORVAT et al. 2008, NOVAK et al. 2008). But there are not any references in the
scientific literature about the useful organisms of this crop. There were some
unsuccessful attempts trying to resettle and acclimatize a predator bug of Colorado
potato beetle, but they did not provide any information about the useful fauna of potato
(JERMY 1967, KERESZTES et al. 2004). Natural enemies of other potato pests were
not studied in the extra-European region either, but former researches proved, that
predators of potato aphids are permanent visitors of potato fields (BEN SAAD and
BISHOP 1976). It is more and more typical nowadays to study the natural enemies of
each pest than investigate the whole useful community (KESZTHELYI 2004).We had
the opportunity to join in the researches of Potato Research Centre for surveying the
fauna of their potato fields in consecutive years (2006-2008). Our investigations were
aimed at studying the effect of different insecticide treatments on harmful and useful
arthropods living in the foliage of potato plants.
Materials and methods
Collections were made with standard sweep net one day before then 24 and 96 hours
after insecticide treatments. Ten samples were drawn per plots and ten net strokes
represented a sample with the exception of the year 2008, when six samples were drawn
per each plot. Collected material was sorted into major taxonomic groups and then
preserved in 70% ethanol till the identification. Standard identification keys were used
in case of spiders (Araneae), and other arthropods (HEIMER and NENTWIG 1991,
STEINMANN 1967, 1974, MERKL, 1982). Some species of plant hoppers
(Auchenorrhyncha) and true bugs (Heteroptera) were identified with the help of
specialists. Insecticide treatments were not the same in the different years. The three

Vol. 37, 2009, Suppl. Cereal Research Communications
226
consecutive years were evaluated separately owing to the differences percept on the
untreated control plots as well.
Results and discussion
There were a lot of aphids collected in 2006. Aphis nasturtii (Kaltenbach 1843) was the
dominant among them, but there occurred two other typical potato aphids too. Plant-
parasitic hemipterans were represented by some psyllids. Among plant hoppers
Empoasca decipiens (Paoli 1930) and E. pteridis (Dahlborn 1850) leafhoppers were the
richest in number every year. Eupteryx atropunctata (Goeze 1778) and Laodelphax
striatellus (Fallén 1826) delphacid planthoppers were also significant species. Philaenus
spumarius (Linnaeus 1758) polyphagous froghopper was detected in each examined
year. In case of harmful true bugs Lygus rugulipennis (Poppius 1911) was the dominant
species and Closterotomus norwegicus (Gmelin 1790) was also quite frequent.
Caterpillars of Lacanobia oleracea (Linnaeus 1758) owlet moth were collected in large
numbers only in 2007 when it was the dominant chewing pest. Different developmental
stages of Leptinotarsa decemlineata (Say 1824) were collected only in 2007 and 2008.
The family Anthocoridae (minute pirate bugs) was the most significant useful group
within true bugs. For species were caught among them with the dominance of Orius minutus (Linnaeus 1758) and Orius majusculus (Reuter 1879) in each year. Damsel
bugs (Nabidae) were only found in 2007 and 2008 represented by the dominant species
Nabis punctatus (A. Costa 1847). Among ladybirds seven-spotted ladybird Coccinella
septempunctata (Linnaeus 1758) was dominant. Lacewings (Neuroptera) were
represented mostly by green lacewing Chrysoperla carnea (Stephens 1836). Parasitic
wasps (Ichneumonoidea and Chalcidoidea) were only collected in 2006 owing to the
large number of aphids that time. Among earwigs (Dermaptera) Chelidura
acanthopygia (Gene 1832) was found in 2006, however there was not any single
specimen collected in 2007 and 2008 owing to the lack of aphids. Spiders (Araneae)
were represented by numerous families (both web-building and hunting). In 2006
Theridion impressum (L. Koch 1881) cobweb spider was quite frequent, but sheetweb
spiders (Linyphiidae) were dominant. In 2007 Araeoncus humilis (Blackwall 1841)
sheetweb spider was dominant and its other family members gave the greater part of
collected spiders. In 2008 Misumenops tricuspidatus (Fabricius 1775) crab spider
(Thomisidae) was dominant, moreover its family occurred in large number all year. The
different dominance ratios of polyphagous spiders clearly demonstrated the diversity of
meteorological conditions in the three examined years.
In 2006 insecticide treatments were applied with Prestige 290 FS (pencycuron +
imidachloprid), Mospilan 20 SP (acetamiprid), Bancol 50 WP (bensultap) + Talstar 10
EC (bifentrine) and Steward (indoxacarb) on 23th
June. Our collections were carried out
on a field where seed tubers were dressed with Marshal 25 EC (carbosulfane). There
were only two samples drawn 24 hours before treatments without netting each plot,
therefore that result are not comparable to those made after the applications so they
were not symbolised on the diagrams. Material derived from collections made 24 and 96
hours after treatments were symbolised as 24’ and 96’ written after the name of
insecticides. Marshal 24’ and Marshal 96’ can be reckoned as a control compared to
other years.

VIII. Alps-Adria Scientific Workshop Neum, Bosnia-Herzegovina, 2009
DOI: 10.1556/CRC.37.2009.Suppl.2 227
Only the number of aphids showed some decrease in the control plots after 24 hours. It
is not likely that this decrease occurred on account of insecticide treatments since all
other plots were also dressed. Their decrease in occurrence was considered to be drastic
on plots treated with Prestige 290 FS (Figure 1.). Owing to the lower number of aphids
number of parasitoids was also lessened. Diminished number of spiders and parasitoids
can be observed on the plots treated with Steward (Figure 2.).
Hemiptera (harmful) - 2006
0
10
20
30
40
50
60
70
Banco
l+Talst
ar 24
'
Banco
l+Talst
ar 96
'
Mar
shal
24'
Mar
shal
96'
Mos
pilan
24'
Mos
pilan
96'
Presti
ge 24'
Presti
ge 96'
Stewar
d 24'
Stewar
d 96'
abu
nd
ancy
AphidinaPsyllinaAuchenorrhynchaHeteroptera (Miridae)
Useful arthropods - 2006
0
10
20
30
40
50
60
Banco
l+Talst
ar 24
'
Banco
l+Talst
ar 96
'
Marsh
al 24
'
Marsh
al 96
'
Mospil
an 24
'
Mospil
an 96
'
Prestig
e 24'
Prestig
e 96'
Stewar
d 24'
Stewar
d 96'
abu
nd
ancy
useful bugsAraneaeother useful predatorsparasitoids
Figure 1. Number of harmful hemipterans in 2006 Figure 2. Number of useful arthropods in 2006
In 2007 there were two other insecticides Kohinor 200 SL (imidachloprid) and Chess 50
WG (pymetrozine) also applied on 29th
June beside Prestige, Bancol + Talstar and
Mospilan. There was not any basic treatment used so compared with the preceding year
collections were made in an absolute untreated control plot as well. The same quantity
of samples was taken 24 hours before and after the treatments from each plot and they
were symbolised with 00’written after the names of insecticides, other markings were
the same as in the preceding year. Treatments with Bancol + Tastar and Kohinor
decreased the number of pest markedly while Chess had lesser reductive effect on
sucking pests (Figure 3.). Only the treatments with Chess seemed to be considerate
towards spiders (Figure 4.).
Sucking- and chewing pests - 2007
0
20
40
60
80
100
120
Control
00'
Control
24'
Control
96'
Prestig
e 00'
Prestig
e 24'
Prestig
e 96'
Banco
l+Talst
ar 0
0'
Banco
l+Talst
ar 2
4'
Banco
l+Talst
ar 96
'
Kohino
r 00'
Kohino
r 24'
Kohino
r 96'
Mos
pilan
00'
Mos
pilan
24'
Mos
pilan
96'
Chess
00'
Chess
24'
Chess
96'
abu
nd
ancy
sucking pests
chew ing pests
Useful arthropods - 2007
0
5
10
15
20
25
30
35
Contro
l 00'
Control 2
4'
Control 9
6'
Prestig
e 00'
Prestige 2
4'
Prestig
e 96'
Banco
l+Talst
ar 0
0'
Bancol+
Talstar 2
4'
Banco
l+Talstar 9
6'
Kohinor 0
0'
Kohino
r 24'
Kohinor 9
6'
Mosp
ilan 0
0'
Mos
pilan
24'
Mosp
ilan
96'
Chess 0
0'
Chess 2
4'
Chess 9
6'
abu
nd
ancy
useful bugs
Araneaeother useful predators
parasitoids
Figure 3. Number of sucking and chewing pests in 2007 Figure 4. Number of useful arthropods in 2007
In 2008 there were Nurelle-D (cypermethrin + clorpyriphos), Sherpa (cypermethrin) and
Vertimec 1,8 EC (abamectin) also applied beside the former Steward on 16th
June.
Collections and markings were the same as in precedent years. Treatments with Sherpa
and Nurelle-D had an obvious reductive effect on harmful and useful organisms too,
although effect of Sherpa on useful bugs was not really striking (Figure 5-6.).

Vol. 37, 2009, Suppl. Cereal Research Communications
228
Sucking- and chewing pests - 2008
0
20
40
60
80
100
120
Control
00'
Control
24'
Control
96'
Sherp
a 00
'
Sherp
a 24
'
Sherp
a 96
'
Nurelle
-D 0
0'
Nurelle
-D 2
4'
Nurelle
-D 9
6'
Steward 0
0'
Steward 2
4'
Steward 9
6'
Vertim
ec 0
0'
Vertim
ec 2
4'
Vertim
ec 9
6'
abu
nd
ancy
sucking pests
chew ing pests(only potato beetle)
Useful arthropods - 2008
0
2
4
6
8
10
12
14
Control 0
0'
Control 2
4'
Control 9
6'
Sherpa
00'
Sherp
a 24'
Sherp
a 96'
Nurelle-D
00'
Nurelle-D
24'
Nurelle-D
96'
Steward 0
0'
Steward 2
4'
Steward 9
6'
Vertimec 0
0'
Vertim
ec 2
4'
Vertim
ec 9
6'
abu
nd
ancy
useful bugsAraneaeother useful predators
Figure 5. Number of sucking and chewing pests in 2008 Figure 6. Number of useful arthropods in 2008
Conclusions
It can be established that beside the effect of insecticides meteorological conditions of
different years had also a serious effect on the number of harmful and useful arthropods.
In many cases treatments were ineffective still against harmful organisms but
destructive effect of insecticides with wide spectrum (pyrethroids or organic
phosphates) and preserving effect of certain insecticides was evident from our results.
Acknowledgements
We should like to express our thanks to Prof. Gyula Sáringer member of Hungarian
Academy of Sciences and to Dr. Elıd Kondorosy CSc associate professor of the
University for rendering help to identification of plant hoppers and bugs. Thanks are
due to the workers of Potato Research Centre as well for providing the experimental
plots and all other conditions for our investigations.
References
Ben Saad, A.A., Bishop, G.W.: 1976. Attraction of insects to potato plants through use of artificial honeydews
and aphid juice. Entomophaga, 21 (I): 49-57.
Heimer, S., Nentwig, W.: 1991. Spinnen Mitteleuropas. Paul Parey, Berlin.
Horvat, T., Majic, A., Svecnjak, Z., Jurkic, V.: 2008. Effects of foliar fertilization and water stress on yield
and physiological characteristics of potato. Cereal Research Communications 36: (3): 1659-1662.
Jermy T.: 1967. Biológiai védekezés a növények kártevıi ellen. Mezıgazdasági Kiadó, Budapest.
Jermy T., Szentesi Á., Tóth M., Szıcs G.: 2006. Pest Control: from Chemical Ecology to Evolution. A
Hungarian Perspective. Acta Phytopathologica et Entomologica Hungarica. 41: (1-2.): 121-135.
Keresztes B., Sipos J., Nádasy M., Budai Cs., Marczali Zs., Márton L.: 2004. A biológiai védekezés
lehetıségei rovarkártevık ellen. Környezeti ártalmak és a légzırendszer, XIV. 175-182.
Keszthelyi S.: 2004. Rovarparazitológiai vizsgálatok kukoricamoly (Ostrinia nubilalis Hb.) populációkkal
2000-2001-ben. Acta Agraria Kaposv., 8 (2): 51-56. XVIII. köt. 3. füzet. Akadémiai Kiadó, Budapest.
Merkl O.: 1982. Taxonómiai és faunisztikai vizsgálatok a Kárpát-medence katicabogár (Coleoptera:
Coccinellidae) faunáján. Doktori értekezés.
Novak, B., Zutic, I., Toth, N., Benko, B., Fabek, S. 2008. Evaluation of sweet potato growing in different
environments of Croatia. Cereal Research Communications 36: (1): 291-294.
Poljak, M., Herak-Custic, M., Horvat, T., Coga, L., Majic, A. 2007. Effects of nitrogen nutrition on potato
tuber composition and yield. Cereal Research Communications 35: (2): 937-940.
Steinmann H.: 1967. Magyarország állatvilága (Fauna Hungariae), Tevenyakú fátyolkák, Vízifátyolkák,
Recésszárnyúak és Csırös rovarok – Raphidioptera, Megaloptera, Neuroptera és Mecoptera XIII. 14.
füzet. Akadémiai Kiadó, Budapest.
Steinmann H.: 1974. Magyarország állatvilága (Fauna Hungariae), Bırszárnyúak – Dermaptera V. 10. füzet.
Akadémiai Kiadó, Budapest.

VIII. Alps-Adria Scientific Workshop Neum, Bosnia-Herzegovina, 2009
DOI: 10.1556/CRC.37.2009.Suppl.2 229
PARTIAL ROOT DRYING: NEW APPROACH FOR POTATO IRRIGATION
Zoran BROĆIĆ1 – Zorica JOVANOVIĆ 1 – Radmila STIKIĆ1 – Biljana Vucelić
RADOVIĆ1 – Mirjana MOJEVIĆ2
1Faculty of Agriculture, University of Belgrade, Serbia, e-mail: [email protected] 2Faculty of Agriculture, University of East Sarajevo, Bosnia and Herzegovina
Abstract: Drought is one of the most common environmental stresses that may limit agricultural production
worldwide. To overcome the drought problems efficiently, an innovative sustainable irrigation technique
called Partial Root Drying (PRD) was proposed. PRD is an irrigation technique where half of the root zone is
irrigated while the other half is allowed to dry out. The treatment is then reversed, allowing the previously
well-watered side of the root system to dry down while fully irrigating the previously dry side. The PRD
benefit is in the terms of improved water-use efficiency (IWUE). The aim of presented work was to compare
the effects of PRD with full irrigation (FI) on yield of field-grown potato, and to test for effects of PRD on
IWUE, tuber yield and quality. The experiments were conducted during 2007 and 2008 seasons. In PRD
treatment in 2007 season 70% of the irrigation water in FI was applied to one half of the root system, although
in 2008 season PRD was applied dynamically (by replacing 70% PRD with 50% PRD in last two weeks).
Irrigation scheduling was based on evapotranspiration and soil water data (measured by TDR). Experimental
results for both seasons confirmed that with PRD irrigation it is possible to increase IWUE, save water for
irrigation and increase quality of potato tuber (starch content).
Keywords: potato, PRD, yield, IWUE, starch, sugars
Introduction
Drought is one of the most common environmental stresses that may limit agricultural
production worldwide. Many vegetables, including potato, have high water
requirements and supplemental irrigation is necessary for successful production
(Fabeiro et al., 2001). However, in many countries as a consequence of global climate
changes and environmental pollution, water use for agriculture is reduced (FAO, 2002).
To overcome the drought problems efficiently, an innovative sustainable irrigation
technique called Partial Root Drying (PRD) was proposed. Partial root drying (PRD) is
an irrigation technique where half of the root zone is irrigated while the other half is
allowed to dry out. The treatment is then reversed, allowing the previously well-watered
side of the root system to dry down while fully irrigating the previously dry side.
Comparing to other irrigation methods implementation of the PRD technique is simple
and requires only the adaptation of irrigation systems in a such way to allow alternate
wetting and drying of part of the root zone (FAO, 2002). The PRD results for different
plant species (including potato) demonstrated the benefit of these methods in terms of
improved water-use efficiency (Davies et al., 2000; Liu et al., 2006; Shanhazari et al.,
2007). The aim of the presented research was to apply and assess the effects PRD
technology on potato yield, yield quality and irrigation water use efficiency in the field
trial in Serbia.
Materials and methods
The experiment with potato was conducted in the opened field situated in the farm for
growing vegetables (“Salate Centre”), 10 km north of Serbian capital Belgrade. The soil
of field site is a silty-clay and it was developed on alluvial deposit. Potato seeds tubers
(Solanum tuberosum var. Liseta) were planted in the beginning of April. During the

Vol. 37, 2009, Suppl. Cereal Research Communications
230
vegetation seasons plants were treated against weeds and fungal disease and regularly
fertilized.
Irrigation system applied was subsurface drip irrigation and the irrigation management
included partial root drying (PRD) and full irrigation (FI). For the FI treatment, one drip
line was placed in the top of the ridge although in PRD treatment two drip lines were
operated separately and were placed in parallel in the top of the ridge. In both
investigated seasons the irrigation started during the tuber filling and ended 2 weeks
before final harvest. The soil water content in FI treatment was kept close to field
capacity. In PRD treatment one side of the row was irrigated while the other was kept
dry and plants received 70% or 50% of FI depending of investigated season. During
2007 year PRD treated plants received 70% of the irrigation water of FI, although in
2008 the PRD system was applied as 70% of FI and 50% of FI (last two weeks of
irrigation period). The PRD irrigation was shifted between two sides of the plants every
5 to 7 days depending on soil water content. Measurements of soil water content were
done by TDR probes (Time domain reflectometer, TRASE, Soil Moisture Equipment
Corp., USA) twice per week and these data were used to adjust irrigation water
requirement during growing seasons. At the end of the vegetation seasons, analyses of
tuber yield, irrigation water use efficiency (IWUE) and tubers quality were carried out.
Potato yield was calculated as tuber fresh weight per plant, IWUE as the ratio of tuber
fresh mass and irrigation water applied in during vegetation season. The tuber harvest
quality was characterised by analysing of starch (after isolation followed by acid
hydrolysis detected as reducing sugar) and soluble reducing sugars (by Luff-Schoorl's
method, ISI, 2002).
The measured traits have been analyzed for statistically significant differences by
Student’s unpaired t-tests (Sigma Plot 6.0 for Windows - SPW 6.0, Jandel Scientific,
Erckhart, Germany.
Results and discussion
The climate in field side is continental type with hot and dry summers and cold and
rainy winters. As in the rest of Serbia, farm suffers from water deficit during the main
growing season. Precipitation data (Fig.1) showed that during the experimental period
(from April to the end of August) the precipitation was lower in 2008 than in 2007,
although the mean temperature were similar in both seasons (Fig.1). Due to lower
precipitation in 2008, comparing to 2007 (about 50mm) and higher evapotranspiration
(about 20mm) during the growing season, the water deficit was bigger in 2008
comparing to 2007 and thus the number of irrigation and amounts of applied water was
increased in 2008 comparing to 2007.

VIII. Alps-Adria Scientific Workshop Neum, Bosnia-Herzegovina, 2009
DOI: 10.1556/CRC.37.2009.Suppl.2 231
Pre
cipi
tatio
n (m
m)
0
2 0
4 0
6 0
8 0
1 0 0
1 2 0
1 4 0
Tem
pera
ture
(o C
)
0
5
1 0
1 5
2 0
2 5
3 0P re c ip . 2 0 0 7 P re c ip . 2 0 0 8 T 2 0 0 7 T 2 0 0 8
A p ri l M a y J u n e J u ly A u g u s t S e p te m b e r Figure 1. Average precipitation and mean temperature in the area of the field trial
during growing seasons of 2007 and 2008
Comparison between investigated years showed that yield in 2008 seasons was ca. 20%
higher than in 2007 season (Table 1). It is well known that potatoes are very sensitive to
soil moisture stress (Onder et al., 2005) and, thus, the increased number of irrigation in
2008 had positive effect on yield. Comparing to FI the PRD treatment had a reducing
effect on yield in both investigated years (20 and 12% for 2007 and 2008, respectively).
In the literature there is an inconsistency on the effects of the PRD on potato yield. Our
results are in agreement with the results of Liu et al., (2006) which showed that yield
was reduced in potato plants exposed to PRD and comparing to FI treatments. However,
the results of Shanhazari et al., (2007) showed that with the PRD treatments
maintenance of yield and number of tubers could be achieved. Comparison between
PRD treatments in investigated 2007 and 2008 seasons showed that yield of PRD
treated crops in 2008 ca. 65% higher than in 2007 years. These results confirmed that
the dynamic approach of PRD, when during the late tuber filling stages the PRD 70%
was replaced by PRD 50%, had a positive effect on yield.
Table 1. The effects of applied irrigation treatments on yield and irrigation water use efficiency (IWUE)
of potato grown in 2007 and 2008 years (means ± S.E)
2007 year 2008 year
Treatments Tuber FW
(t ha-1)
Irrigation
water
applied
(m3 ha-1)
IWUE
(kgha-1m-3)
Tuber FW
(t ha-1)
Irrigation
water
applied
(m3ha-1)
IWUE
(kgha-1m-3)
FULL 45.73± 1.31 1970 23.21± 0.66 55.40± 1.53 2770 20.00± 0.55
PRD 36.74± 3.13 1300 28.26± 2.41 49.24 ±3.86 1410 34.92± 1.28
The PRD treatment in both years (especially in 2008) resulted in highly significant
increases in IWUE especially during 2008. Compared with FI, the PRD treatment saved
670 m3/ha (2007 season) and 1360 m
3/ha (2008 season) of irrigation water, leading to a
21% and 75 % (for 2007 and 2008, respectively) increase of irrigation water use
efficiency. Similar data were also obtained by other authors (Liu et al., 2006;
Shanhazari et al., 2007).

Vol. 37, 2009, Suppl. Cereal Research Communications
232
Table 2. Biochemical characteristics of the tubers of investigated potato plantsexposed to PRD and FI
treatments during 2007 and 2008 years (means ± S.E)
2007 year 2008 year
Treatments Reducing
sugars
(g kg-1 FW)
Starch
(% on FW)
Reducing
sugars
(g kg -1 FW)
Starch
(% on FW)
FULL 6.76 13.72 6.30 13.78
PRD 6.22 15.02 5.32 15.04
Some of the potato tuber quality data are shown in Table 2. The concentrations of
quality parameters (starch and reducing sugars) in both investigated years fitted the
range of values that have usually been reported for potato tubers with no indication of
promoting undesirable changes when potatoes are intended for further processing
(Nourian et al., 2003). Technological quality with regard to starch content in tubers of
PRD comparing to FI-treated plants showed an increased effect in both years.
Comparison between treatments in both years showed that PRD treatments negligibly
but not significantly reduced the content of sugars comparing to FI treatment.
Conclusions
Experimental results for both seasons confirmed that with PRD irrigation it is possible
to increase IWUE, save water for irrigation and increase quality of potato tuber (starch
content). Also, results indicated that PRD should be applied as a dynamic system which
depends not only on available water for crops but also on crop growth stage. In general,
two potatoes growing seasons confirmed that PRD could be useful strategy to save
water for irrigation. This could be especially important for countries facing with drought
and limited water resources for agricultural production as it is current situation in Serbia
or other Western Balkan countries.
Acknowledgements
This study was supported by EU Commission (FP6 projects – SAFIR and CROPWAT) and Serbian Ministry
of Science (TR 20025).
References
Davies, W.J. Bacon, M.A. Thompson, W. Sobeigh, L.G. Rodriguez, M.L.: 2000. Regulation of leaf and fruit
growth in plants in drying soil: exploitation of the plant’s chemical signalling system and hydraulic
architecture to increase the efficiency of water use in agriculture. J. Exp. Bot. 51: 1617-1626.
Eva Babet Abraham and Sarvari Mihaly.:2006. Effect of year and irrigation on the yield and quantity of
different potato varieties. Cereal Research Communications, 32., No 1. 369-372
Fabeiro, C. Martın de Santa Olalla, F. de Juan, J.A.: 2001. Yield and size of deficit irrigated potatoes. Agric.
Water Management, 48: 255–266.
FAO. :2002. Deficit Irrigation Practices. Water Reports No. 22. Rome.
Liu, F Shahnazari, A. Andersen, M.N. Jacobsen, S.E. Jensen, C. R.: 2006. Effects of deficit irrigation (DI)
and partial root drying (PRD) on gas exchange, biomass partitioning, and water use efficiency in potato.
Sc. Hort. 109:113–117.
Marton, L.: 2008. Effect of precipitation and fertilization on the changes in soil organic carbon (SOC). Cereal
Research Communications. 36., No 4. 611-622
Nourian, F. Ramswamy, H.S. Kusahalappa, A.C. :2003. Kinetics of quality change associated with potatoes
stored at different temperatures. Lebensm.-Wiss. U.-Technol. 36: 49-65.
Onder, S. Caliskan, M.E. Onder, D. Caliskan, S.: 2005. Different irrigation methods and water stress effects
on potato yield and yield components. Agric. Water Manage. 73: 73–86.
Poljak, M., Mirjana Herak-Custic, Tea Horvat, Coga , L.: 2007. Effects of nitrogen nutrition on potato tuber
composition and yield. Cereal Research Communications, 35., No 2. 937-940

VIII. Alps-Adria Scientific Workshop Neum, Bosnia-Herzegovina, 2009
DOI: 10.1556/CRC.37.2009.Suppl.2 233
EFFECT OF ABIOTIC STRESS FACTORS ON THE YIELD QUANTITY AND QUALITY OF MAIZE HYBRIDS
Zsuzsanna HEGYI – Tamás BERZY
Agricultural Research Institute of the Hungarian Academy of Sciences, Hungary, Martonvásár
e-mail: [email protected], [email protected]
Abstract: If maize production is to be successful it is essential to be clear about the intended end-use and the
farm conditions in order to make a wise choice of variety and technology. Recommendations on the end-use
of the varieties can only be made based on knowledge of both yield levels and chemical quality. A total of 96
hybrids from four FAO maturity groups were examined at four locations in 2008 in order to analyse their
yield and quality and to determine the effect of ecological factors on a number of parameters. The highest
yield averages were recorded for hybrids in the FAO 300 group (12.95 t ha-1) at locations with the highest
rainfall (Debrecen). In Debrecen and Iregszemcse the plants were able to develop a second ear, thus
increasing the yield average (12.31 t ha-1, 11.75 t ha-1). In Szarvas irrigation helped to achieve good yields and
reduce drought damage (10.97 t ha-1), while in Martonvásár, although rainfall sums were adequate, the uneven
distribution and atmospheric drought led to lower yields (9.65 t ha-1). In this experiment, early hybrids (FAO,
200, FAO 300) had the best yield stability. The starch content of the grain exhibited a close correlation with
the yield average. The greatest starch incorporation was recorded for FAO 300 hybrids (72.86%). The
expected negative correlation between starch content and protein/oil content was observed. The FAO 200
hybrids had the highest protein and oil contents (9.70 and 3.89%), which gradually declined at later maturity
dates (FAO 500: 9.14 and 3.51%). The thousand-kernel mass and the length of the main ear were closely
correlated with the maturity date, being lowest for the earliest hybrids (326.39 g, 18.91 cm) and highest in the
latest group (346.91 g, 19.74 cm). For protein and oil content, genetic differences between the hybrids were
greater (1.50, 1.00%) than between locations (0.97, 0.82%), while in the case of starch the latter caused
greater differences (2.84, 4.06%).
Keywords: maize hybrid, FAO maturity group, abiotic stress factors, protein, oil, starch
Introduction
The quantity and quality of the grain yield of maize hybrids are greatly influenced by
ecological factors, particularly abiotic stress factors such as temperature and drought
(Hegyi et al., 2008). Under Hungarian conditions the quantity and distribution of
rainfall during the vegetation period are unfavourable (Polerecky, 1976). Long- term
water deficiency at flowering increases the frequency of aborted grains (Zinselmeier et
al., 1995), and water stress also affects flowering, yield quantity and the quality
parameters of the yield (Bertic et al., 2008). In the driest months (July, August) maize
needs 155–180 mm rainfall. In wet locations, or as the result of irrigation (Pepó et al.,
2008) more starch is incorporated into the grains, leading to higher yields, but irrigation
resulted in a significant reduction in the protein and oil concentrations of the grain
(Josipovic et al., 2007). The grain yield is negatively correlated with the protein content
(r = -0.48) and oil content (r = -0.19) of the grain (Svecnjak et al., 2007). Bioethanol
production, which could provide a major market for maize, raises different quality
criteria than the fodder industry (Voca et al., 2007). It is thus important to regularly
check the grain quality of cultivated and newly bred hybrids, as new varieties tend to
become uniform due to the narrow range of breeding aims (Sipos and Ungai, 2008).
Materials and methods
A total of 96 hybrids from four FAO maturity groups (FAO 200, FAO 300, FAO 400,
FAO 500) were tested at four locations in Hungary (Iregszemcse, Debrecen,

Vol. 37, 2009, Suppl. Cereal Research Communications
234
Martonvásár, Szarvas) in 2008. The main aim of the experiment was to determine the
yield, yield components and chemical quality parameters of the maize hybrids and the
effect of ecological factors on these parameters. The locations differed as regards
rainfall, temperature and number of very hot days. The highest rainfall quantity during
the vegetation period was recorded in Debrecen (492.8 mm), while the 482.7 mm
measured in Martonvásár had very unfavourable distribution, with little rainfall during
critical months when the number of very hot days was the greatest (temperatures above
30°C for 37 days). In Szarvas only 292.8 mm rain fell during the vegetation period, but
this was supplemented by irrigation in June and July. Iregszemcse was the worst
location as regards rainfall quantity (275.3 mm), but here the distribution was
favourable, with 218 mm falling evenly between May and August.
Results and discussion 1. Analysis of plant traits for each FAO maturity group (averaged over location and variety) Each trait was first examined for the individual FAO maturity group, averaged over
hybrids and locations (Table 1). The highest yield averages were recorded for hybrids in
the FAO 300 and FAO 400 groups (11.65; 11.36 t ha-1
). Under the ecological conditions
in Hungary it is these mid-season hybrids that give the highest yields over the average
of wet and dry years. The lowest yields were found for the FAO 200 group (10.40 t ha-1
)
and those of the latest maturing hybrids (11.27 t ha-1
) were also lower than for the mid-
season groups. On the basis of several years of results it can be concluded that hybrids
in the FAO 500 group are not always able to achieve their greater genetic yield
potential, especially in dry years.
Table 1. Yields, yield components and grain quality of hybrids in each FAO maturity group, averaged over
hybrids and locations
FAO number
yield, t ha-1
thousand kernel mass, g
ear length,
cm
starch-content,
%
starch-yield, t ha-1
protein-content,
%
oil-content,
%
200 10.40 326.39 18.91 72.27 7.51 9.70 3.89
300 11.65 332.44 19.12 72.86 8.45 9.37 3.84
400 11.36 343.57 19.56 72.36 8.19 9.29 3.72
500 11.27 346.91 19.74 72.57 8.03 9.14 3.51
The starch content of the hybrids exhibited tendencies similar to that of the yield, the
smallest values being recorded for the early (FAO 200) group (72.27%) and the greatest
for the FAO 300 hybrids (72.86%). In the case of maize the primary cause of an
increase in total yield is the increased accumulation of carbohydrates in the grains. It is
probable that the rainfall quantity was satisfactory or optimum during the starch
incorporation period for this maturity group. The average grain starch contents of FAO
400 and FAO 500 hybrids were lower than for FAO 300 hybrids (72.36; 72.57%).

VIII. Alps-Adria Scientific Workshop Neum, Bosnia-Herzegovina, 2009
DOI: 10.1556/CRC.37.2009.Suppl.2 235
The protein content of the hybrids (averaged over locations and varieties) was greatest
in the FAO 200 group (9.70%), with values of 9.37% for FAO 300, 9.29% for FAO 400
and 9.14% for FAO 500. A similar tendency was observed for the grain oil content,
with 3.89% for FAO 200, 3.84% for FAO 300 (which was not significantly different
from the former), 3.72% for FAO 400 and 3.51% for FAO 500. The Bravais correlation
coefficient between the protein and oil contents had a value of 0.62.
The early FAO 200 hybrids had the smallest thousand-kernel mass (326.39 g), after
which a linear increase was observed as the maturity period lengthened. The length of
the main ear was also closely correlated with the length of the vegetation period, rising
from 18.91 cm for FAO 200 hybrids to 19.12 cm for FAO 300, 19.56 cm for FAO 400
and 19.74 cm for the latest hybrids.
02468
10121416
Deb
rece
n
Ireg
szem
cse
Mar
tonv
ásár
Sza
rvas
Deb
rece
n
Ireg
szem
cse
Mar
tonv
ásár
Sza
rvas
Deb
rece
n
Ireg
szem
cse
Mar
tonv
ásár
Sza
rvas
Deb
rece
n
Ireg
szem
cse
Mar
tonv
ásár
Sza
rvas
Mv 255 Amanita Miranda Mv 500
FAO 200 FAO 300 FAO 400 FAO 500
yiel
d t/h
a
Figure 1. Yield stability of the hybrids giving the greatest yield averages in each maturity group
2. Evaluation of traits according to locations (averaged over varieties and maturity groups) The maize hybrids had the highest average yields in Debrecen (12.31 t ha
-1). In this
location the hybrids were able to develop secondary ears. The grand average at
Iregszemcse was 11.75 t ha-1
, where secondary ears again contributed to the good yield.
The average yield was 10.97 t ha-1
in Szarvas and 9.65 t ha-1
in Martonvásár.
For each of the maturity groups the hybrid with the highest yield average was selected
and the yield stability of these hybrids was investigated (Fig. 1). The least yield
fluctuation was exhibited by the earliest hybrid (Mv 255: 2.42 t ha-1
), followed by the
FAO 300 hybrid Amanita (3.09 t ha-1
). Both the FAO 400 and FAO 500 hybrids
exhibited greater yield fluctuations between locations (3.51, 5.00 t ha-1
). The genetic
determination of grain protein content is 0.67, which explains why the environment had
a smaller effect on this parameter in the present experiment (difference between
locations 0.97%) than differences between the varieties (1.50%). Due to the
considerable genetic variability and the dependence on environmental conditions, it is
possible to use breeding methods to develop varieties with higher inherited protein
content, while also improving the protein ratio by agronomic means. A similar tendency

Vol. 37, 2009, Suppl. Cereal Research Communications
236
was noted for the grain oil content. Among the quality traits, the genetic determination
of the starch content is the smallest, but no numerical value is available. In the present
experiment the difference between the varieties was 2.84%, while the location had a
greater influence, mainly due to the quantity of rainfall (4.06%).
Conclusions
Many scientists agree that, despite the decisive effect of inherited traits, the quality and
quantity of maize yields can be considerably influenced by mineral fertilisation,
irrigation and the use of up-to-date technologies (Bertic et al., 2008; Pepó el al., 2008).
In the present experiment the highest yield averages were achieved with FAO 300
hybrids, which also exhibited the smallest yield fluctuations and had the highest starch
contents. The greatest grain starch contents were recorded in wet locations (Debrecen),
and this was closely correlated with the lowest grain protein and oil contents (Josipovic
et al., 2007).An analysis of the relationship between location and quality traits revealed
that the ecological differences between locations had a greater influence on the grain
starch content than on the protein or oil content, which were subject to greater genetic
determination than the starch content. There were greater differences in protein and oil
content between the hybrids than between the locations. Knowledge on the effects of
genetic factors and on their relationship with environmental and agronomic factors at
both the species and hybrid level may have a fundamental influence on the method and
success of farming (Hegyi et al., 2008; Sipos and Ungai, 2008).
Acknowledgements
This research work was supported by OMFB-00519/2007 grant.
References
Bertic B. – Jug I. – Jug D – Vukadinovic V. – Engler M.: 2008. The effects of year, genetic and morphologic
specificity at the kernel mass, chemical composition ang vigour of the maize seed. Cereal Research
Communications. 36: 923-926.
Hegyi Z. – Árendás T. – Pintér J. – Marton L. C.: 2008. Evaluation of the grain yield and quality potential of
maize hybrids under low and optimum water supply levels. Cereal Research Communications. 36:
1259-1262.
Josipovic M. – Jambrovic A. – Plavsic H. – Liovic I. – Sostaric J.: 2007. Responses of grain composition
traits to high plant density in irrigated maize hybrids. Cereal Research Communications. 35: 549-552.
Pepó P. – Vad A. – Berényi S.: 2008. Effects of irrigation on yields of maize (Zea mays L.) in different crop
relations. Cereal Research Communications. 36: 735-738.
Polerecky O.: 1976. Yield and yield components of newly-bred high-yielding grain maize hybrids. Rostlinna
Vyroba. 22: 10, 1021-1027.
Sipos P. – Ungai D.: 2008. Evaluation of the chemical composition of the maize kernel in 2007. Cereal
Research Communications. 36: 495-498.
Svecnjak Z. – Varga B. – Grbesa D. – Pospisil M. – Macesic D.: 2007. Environmental and management
effects on grain quality of maize hybrids. Cereal Research Communications. 35: 2, 1117-1120.
Voca N. – Kricka T. – Janusic V. – Matin A.: 2007. Bioethanol production from corn kernel grown with
different cropping intensities. Cereal Research Communications. 35: 1309-1312.
Zinselmeier C. – Westgate M. E. – Schussler J. R. – Jones R. J.: 1995. Low water potential disrupts
carbohydrate metabolism in maize (Zea mays L.) ovaries. Plant-Physiology. 107: 2, 385-391.

VIII. Alps-Adria Scientific Workshop Neum, Bosnia-Herzegovina, 2009
DOI: 10.1556/CRC.37.2009.Suppl.2 237
INSUFFICIENT PHOSPHORUS NUTRITION AS A STRESS FACTOR AND ITS EFFECT ON SPRING BARLEY YIELD PARAMETERS
Peter KOVÁČIK1 – Czesława JASIEWICZ2 – Barbara WIŚNIOWSKA-KIELIAN2
1 Department of Agrochemistry and Plant Nutrition, Faculty of Agrobiology and Food Resourses, Slovak Agricultural University in Nitra, Tr. A. Hlinku 2, 949 01 Nitra, email: [email protected]
2 Department of Agricultural Chemistry, Faculty of Agriculture and Economics, Hugo Kołłątaj´s Agricultural
University in Krakow, Al. Mickiewicza 21, 31-120 Krakow, Poland
Abstract: The stress effect of insufficient phosphorus nutrition on spring barley parameters was determined
over a three-year trial in a small plots situated 11 kilometers far from town Nitra on haplic luvisol with low
supply of Nan, P and Cox.
Stress resulted from inadequate phosphorus nutrition during spring barley NK fertilization in relation to full
NPK nutrition significantly decreased the grain yield, independently of whether nitrogen nutrition had taken
place before seeding or during barley vegetation (growth stage DC 25). When nitrogen was applied before
seeding, the decline of grain yield was by 1 270 kg ha-1, and by 590 kg ha-1 when nitrogen was applied during
vegetation. These findings indicate that a deficit in phosphorus nutrition had a more negative effect on the
level of the yield if nitrogen was applied before seeding, compared with N application in the DC 25 growth
stage. It is clear from these findings that nitrogen fertilization restrains the symptoms caused by the lack of
phosphorus during vegetation.
The absence of phosphorus nutrition has also a negative effect on grain quality parameters (thousand kernel
weight, volume weight, first-class grain percentage). This impact was also more significant when nitrogen had
been applied before seeding.
Keywords: phosphorus deficit, nutritional stress, nitrogen fertilization, spring barley
Introduction
In period 1980-1990, application rates of mineral fertilizers per hectare of agricultural
land in Slovakia and Poland represented the level of about 150% of the rates applied in
member states of European Union (12 countries). At present, consumption of mineral
fertilizers reaches only 60% of current EU consumption (25 countries) in both these
countries, i.e. about 45% in comparison with the eighties of last century. In addition,
consumption of organic manures declined even more than twice (Pl) or three-times
(SVK) during this time period. This situation caused decline of mobile forms of
nutrients in soil and evoked that the effect of nutritional stress on yield parameters of
grown crops is increasingly studied by many authors (Slamka et al., 2008; Macák et al.,
2008) in both the states. Topic of nutritional stress effect on agricultural crops has been
studying systematically within the framework of national research in Hungary over 40
years (Debreczeny and Berecz, 2008).
The aim of our experiment was to contribute to solve this problematic from the
viewpoint of phosphorus deficiency effect study on the spring barley yield
characteristics, as nowadays phosphorus becomes limiting factor of soil fertility in both
Poland and Slovakia.
Materials and methods
The field experiment was carried out in locality of Kolíňany (48°22´N and 18°12´E) on
haplic luvisol with low supply of available phosphorus (44-48 mg kg-1
) in soil profile of
0.0-0.3 m which enables to examine the effect of phosphorus deficiency stress on spring

Vol. 37, 2009, Suppl. Cereal Research Communications
238
barley yield parameters. Haplic luvisol agrochemical parameters were determined by
methodical procedures stated below table 1. The experiment was established by block
method with checkerboard arrangement of plots in three replications. As a model crop
spring barley (variety Jubilant) was seeded at the seeding rate of 4 millions of
germinative grains per hectare and grown in crop rotation after sugar beet which was
fertilized insufficiently (for only 75% of its requirements).
Experimental treatments and nutrient rates are illustrated in table 2. In treatment 1
(control) no fertilizers were applied. In treatments 2 to 5 mineral fertilizers were applied
at the rates taking into account the supply of nutrients in soil.
In relation to the low supply of P and medium supply of K in soil, there was used
saturating system of fertilizing with phosphorus (amount of P taken off by aboveground
phytomass + P needed for reaching medium supply level of P in soil) and so called
substituting one with potassium (when only the amount taken by aboveground
phytomass is returned into the soil) (Table 2).
In treatments 2 and 3 nitrogen was applied before barley seeding and in treatments 4
and 5 at the end of tillering. Rate of nitrogen (DN) for treatments 2 and 3 was calculated
by formula DN = PN –Nan x 9, where PN = need of nitrogen for planning yield of 5 t.ha-1
of grain (formation of 1t of grain needs 24 kg of nitrogen). Nan = content of inorganic
(mineral) nitrogen determined before seeding in soil profile of 0.0-0.6 m. Number 9
represents coefficient for recalculating mg kg-1
unit to kg ha-1
one and is valid for the
soil depth of 0.6 m and volume weight of 1.5 kg m-3
in this profile.
Table 1. Content of nutrients in the soil layer 0.0 – 0.6 m before establishing the trial
Term of sample
before sowing tillering
Nin N-NH4+ N-NO3
- P K Mg Cox Nan Year
pHKCl
[mg kg-1] % [mg kg-1]
2000 6.36 7.80 3.90 3.90 30.3 181 225 1.02 8.14
2001 6.02 6.45 2.95 3.50 27.0 118 277 1.04 5.15
2002 5.96 7.55 3.85 3.70 25.2 145 225 1.03 9.80
pHKCl - 1,0 M KCl; Nin - calculated as N-NH4+ + N-NO3
-; N-NH4+ - colorimetric method, Nessler agent; N-
NO3- - colorimetric method, phenol- 2,4 disulphonic acid; P - colorimetric method, Mehlich II;, K - flame
photometry, Mehlich II; Mg - atomic absorb. spectrophotometer, Mehlich II; Cox - oxidizable carbon, Tjurin
Table 2. Treatments of experiment and dosage of nutrients (average of three years)
Treatment Nutrients and term of application Average rate of nutrients (kg ha-1)
number symbol before sowing tillering N P K
1 0 - - - - -
2 NPK NPK - 54.6 45 99.5
3 N-K NK - 54.6 - 99.5
4 PK+N1 PK N1 28.2 45 99.5
5 -K+N1 K N1 28.2 - 99.5
Rate of nitrogen (DN) in treatments 4 and 5 was calculated by formula DN = PN – Nan x 9
- NR, where PN = need of nitrogen for planning yield of 5 t ha-1
of grain (formation of 1t
of grain needs 24 kg of nitrogen). Nan = content of inorganic (mineral) nitrogen
determined in the growth stage of tillering (DC 25) in soil layer 0.0-0.6 m. NR = amount
of nitrogen (kg ha-1
) in aboveground phytomass of spring barley in this time. Harvest of

VIII. Alps-Adria Scientific Workshop Neum, Bosnia-Herzegovina, 2009
DOI: 10.1556/CRC.37.2009.Suppl.2 239
crop was done by hand. Achieved results were evaluated by analysis of variance using
computer programme Statgraphics, version 5.
Results and discussion
The stress of phosphorus deficit (low supply of mobile P in soil and absence of P
nutrition - treat. 3 and 5) at sufficient NK nutrition (Table 3) caused statistically
significant decrease of spring barley grain yield in comparison with complete NPK
nutrition (treat. 2 and 4). Yield decline was more expressive when nitrogen fertilization
was carried out before seeding (1 270 kg ha-1
, treat. 3 versus treat. 2) in comparison
with N fertilization during growing season (590 kg ha-1
, treat. 5 versus treat. 4).
Table 3. Effect of nutrition on the yield parameters of spring barley
Treatment Grain Straw Crude protein 1st class∗ TKW∗∗ Volume weight
number symbol [t ha-1] [%] [g] [g l-1]
1 0 7.20 a 5.54 a 8.34 a 94.01 b 45.77 b 764.82 a
2 NPK 9.24cd 6.63 b 8.39 a 93.21 b 45.92 b 776.69bc
3 NK 7.97 b 5.82 a 8.52ab 91.18 a 43.97 a 774.83 b
4 PK+N1 9.60 d 6.08ab 8.74ab 91.99 a 45.55 b 783.83 c
5 K+N1 9.01 c 6.07ab 8.89 b 91.49 a 45.00ab 783.43bc
LSD0,05 0.383 0.586 0.483 1.081 1.159 8.991
LSD0,01 0.514 0.786 0.648 1.449 1.554 12.056
∗Grain of the 1st class, ∗∗ Thousand kernel weight
Phosphorus deficit also showed negative impact on quality parameters of barley grain. It
decreased portion of the 1st class grain, thousand kernel weight and volume weight
(treat. 2 versus treat. 3 and treat. 4 versus treat. 5), but worsening of these parameters
was more marked under pre-seeding N fertilization like when nitrogen was applied
during growing season. It implies from above stated facts that application of N during
tillering softened negative effect of phosphorus deficit on quantitative as well as
qualitative parameters of spring barley grain. Similar effect of N fertilization on the
crude protein content was also found out. Content of crude protein in grain was
increasing in consequence of P deficit under full NK nutrition; what is evaluated
positively in this case, because there were the low crude protein contents in all
treatments generally.
Deficit of phosphorus nutrition negatively influenced economy of spring barley growing
(Table 4). Under the absence of P nutrition, profit per hectare declined by 146.6 € when
nitrogen was applied before seeding (treat. 3 versus treat. 2). However, when nitrogen
was applied during growing season profit decreased only by 33.7 € ha-1
(treat. 5 versus
treat. 4). Although the profit achieved in treatment 5 (absence of P nutrition) was lower
than in treatment 4 (complete nutrition), it was higher than in other investigated
treatments. At the same time the highest economical effectiveness of mineral fertilizers
application was achieved in this treatment (treat. 5). This finding gives reasons why
farmers in Poland and Slovakia (in spite of the spring barley yield parameters worsening
in a consequence of insufficient P nutrition) are oriented particularly towards nitrogen
nutrition and examination of its the most effective application.

Vol. 37, 2009, Suppl. Cereal Research Communications
240
Existing more than 25 years old opinion on impropriety of spring barley fertilization
with nitrogen during growing season in Central Europe space, especially in soils with
low supply of Nan, P and Cox showed to be less reasonable. It is also confirmed by yield-
forming and economical effect of treatments 4 and 5 in relation to treatments 2 and 3.
The highest grain yield of spring barley with adequate quality parameters was achieved
in the treatment with complete NPK nutrition and when nitrogen was applied during
growing season at the rate respecting its supply in soil and plant. Good experiences with
barley fertilizing during growing season are stated by several authors, for instance
Sardana and Zhang (2005), Balázsy and Sárdi (2008).
Table 4. Effectiveness of fertilizer application
Treatment Costs [Sk ha-1] Increase of the yield CEE ∗ Profit
No. symbol purchase application total t ha-1 Sk ha-1 Sk Sk ha-1 € ha-1
1 0 0 0 - - - - - -
2 NPK 4365.4 400 4 765.4 2.04 10 200 2.14 5 435 180.4
3 NK 2 430.4 400 2 830.4 0.77 3 850 1.36 1 020 33.8
4 PK+N1 3863.8 400 4 263.8 2.40 12 000 2.81 7 736 256.8
5 K+N1 1928.8 400 2 328.8 1.81 9 050 3.89 6 721 223.1
∗ Coefficient of economical effectiveness, 1 € = 30.126 Sk, Sk – Slovak national currency (till 31. 12. 2008),
1 t = 5000 Sk, 1 kg N = 19 Sk, 1 kg P = 43 Sk, 1 kg K = 14 Sk
Conclusions
The stress of phosphorus deficit at sufficient NK nutrition caused statistically significant
decrease of spring barley grain yield and showed also negative impact on grain quality
parameters resulting in decline of profit per hectare and effectiveness of malt barley
growing independently on whether the nitrogen was applied before seeding or during
tillering. However, when nitrogen was applied during tillering, yield and quality
decrease of grain was lower than when application was realized before seeding.
Acknowledgements
This research was supported by the project VEGA 1/4418/07.
References
Balázsy, Á. – Sárdi, K.: 2008. ffects of increasing K rates on the nutrient status of malting barley at the stage
of tillering. Cereal Research Communications, 36: S. Part III. 1723-1726.
Debreczeni, K. – Berecz, K.: 2008. Influence of different fertilization on the plant available P content in the
Hungarian national long-term field fertilization experiment. Cereal Research Communications, 36: S. Part
II. 815-818.
Slamka, P. – Hanáčková, E. – Benčíková, M. – Macák, M. – Demjanová, E.: 2008. Effect of nitrogen supply
level in soil on malt characteristics of winter barley grain. Cereal Research Communications, 36: S. Part
III. 1439-1442.
Macák, M. – Žák, Š. – Birkás, M. – Slamka, P.: 2008. The influence of an ecological and a low input system
on yield and components of spring barley. Cereal Research Communications, 36: S. Part II. 1343-1346.
Sardana, V. – Zhang, G. P.: 2005. Effect of time of nitrogen application on the growth and yield of two barley
(Hordeum vulgare L.) cultivars. Cereal Research Communications, 33: 4, 785-791.

VIII. Alps-Adria Scientific Workshop Neum, Bosnia-Herzegovina, 2009
DOI: 10.1556/CRC.37.2009.Suppl.2 241
PLUM POX VIRUS AS A STRESS FACTOR IN THE ONE-YEAR-OLD SHOOT AND FRUIT GROWTH AND YIELD OF PLUM CV. STANLEY
Tomo MILOSEVIC 1 – Nebojsa MILOSEVIC
2
1 Faculty of Agronomy, Cacak, Cara Dusana 34, Serbia, e-mail: [email protected]
2 Fruit Growing Institute, Cacak, Kralja Petra I/9, Serbia
Abstract: The stress effect of Plum pox virus (PPV) on the vegetative growth and yield of cv. Stanley was
examined under the conditions of Cacak (Western Serbia) in 2006-2007. The results showed that PPV induced
significant differences in one-year-old shoot length (17.00%), fruit weight (6.21%) and yield per tree and unit
area (20.61%) between infected and non-infected trees.
Keywords: fruits, plum, plum pox virus, shoots, stress, yield
Introduction
Plum pox virus was registered in Serbia in 1936. Its negative effect is manifested in the
stress being caused in infected cells, tissues and organs of plums and other stone fruits
and ornamental plants (Horváth et al., 2007), particularly the fruit, inducing highly
destructive changes inhibitory to normal metabolic processes (Hernández et al., 2007;
Moor et al., 2007; Balla et al., 2008). Therefore, production in plum-growing countries
have suffered great economic damages, being reflected in fruit size reduction and fruit
shape deformities in susceptible cultivars (Christov, 1947; Jordovic and Janda, 1963)
and reduced yields (Vágó et al., 2007) due to premature fruit drop - ranging from 20-
30% (Pribék, 2001) to 80-100% - in highly susceptible ones (Kegler and Hartman,
1998). The PPV-infected trees exhibit limited vegetative growth (Kišpatić, 1987),
adversely affecting their vitality and yield capacity in subsequent years (Pribék and
Gáborjányi, 1998). Stanley is an old American plum cultivar grown in Serbia since
1956. It is PPV tolerant (Rankovic, 1986). However, in some Serbian plum orchards of
cv. Stanley, PPV symptoms have occurred recently on both the leaf and the fruit,
resulting in shape deformities, size reduction and premature fruit drop. The main
objective of the study was to determine the PPV effect on the growth dynamics in one-
old-year shoots and fruits as well as on the fruit yield per tree and hectare in cv. Stanley.
Materials and methods
The commercial orchard of cv. Stanley grafted on Myrobalan rootstock is located in
Prislonica (Cacak, Western Serbia). It was established at a 5 × 3 m spacing in 1994. The
trial was conducted in 2006-2007. At the end of May 2004, five trees with four
replications with clearly visible PPV symptoms (RT-PCR positive for PPV), and as
many without visible
symptoms (RT-PCR negative for PPV) were marked. Non-infected trees were also
registered and checked by RT-PCR throughout the observation period. After the
commencement of the growing season in 2005, upon reaching a length of 5 cm, 20
vegetative shoots in five replications were marked on each of the selected trees in order
to monitor the dynamics of growth in length (cm). Fruit weight (g) was measured in a
sample of 20 fruits per tree in five replications after the fruits reached the size of a

Vol. 37, 2009, Suppl. Cereal Research Communications
242
wheat grain. One-year-old shoots length (cm) and fruit weight (g) were measured every
10 days by ruler, vernier calipers and a Tehnica ET-1111 electric scale. An ACS system
electronic scale was used to measure fruit yield per tree. Fruit harvest was followed by
measurements of fruit yields per tree (kg) and hectare (t). Significant differences among
treatments were analyzed by ANOVA using an LSD at P < 0.05 (Statistica 6.0).
Results and discussion
One-year-old shoot and fruit growth The analysis of the dynamics of one-year-old shoot growth in length is given in Fig. 1a.
Results suggested that the shoots of the virus-free trees had a more intensive growth
compared to those of the infected ones. Until 5 May, no differences were found in the
one-year-old shoot growth dynamics, whereas from mid-May to the end of the
measurement (15 August), the difference in growth intensity was evident in one-year-
old shoots of the virus-free trees.
Non-infected
trees (Y1)
Infected
trees (Y2)
Date of measuring
Len
gth
of
shoo
ts (
cm)
0
10
20
30
40
50
25 Apr
5 May
15 May
25 May
5 Jun
15 Jun
25 Jun
5 Jul
15 Jul
Y1=14.35-18.88x+11.22x2-1.76x
3+0.10x
4-0.01x
5
Y2=23.71-36.65x+22.27x2-1.76x
3+0.10x
4-0.02x
5
a)
Non-infected
trees
Infected
trees
Date of measuring
Wei
ght
of f
ruit
s (g
)
0
5
10
15
20
25
30
35
40
45
25 Apr
5 May
15 May
25 May
5 Jun
15 Jun
25 Jun
5 Jul
15 Jul
25 Jul
5 Aug
15 Aug
Y1=-3.72+8.18x-0.95x2
+0.05x3
Y2=-4.07+8.41x-1.04x2
+0.05x3
b)
Figure 1. Dynamics of one-year-old shoot growth in legth (a) and dynamics of fruit weight change (b)
Whether originating from the infected or non-infected trees, they grew most intensively
until 25 June, when their growth noticeably slowed down until 5 July and finally
ceased. The data given in Table 1 suggest the one-year-old shoot length in infected and
non-infected trees to be 36.74±0.109 cm and 44.27±0.323 cm, respectively. There are
growth differences between the shoots of purely vegetative character and future bearing
shoots. Namely, the former shoots grow long for two to three months, and the latter
ones take shorter time. According to Prica (1977), short bearing shoots of Pozegaca, a
cultivar highly susceptible to PPV, take 10-20 days to grow in length. The initial shoot
growth and fruit growth stages coincide, both using the reserve nutrients that have
remained after the previous growing season, and competitive relationship later develops
between them, which was also confirmed by this study, regardless of whether the
Stanley trees were infected (Fig. 1a). The vegetative growth of shoots in length was a
slow process at first, which suddenly progressed faster, and slowed down again until it
eventually ceased (Milosevic, 1997). The shoots of both infected and non-infected trees
of cv. Stanley grew intensively till 25 June on average but their length remained
unchanged thereafter, which suggested that it reached its maximum on the said date in
both infected and non-infected trees (Table 1). The intensive length growth of cv.
Stanley shoots terminated on 15 June or 10 days before the results of the present study,

VIII. Alps-Adria Scientific Workshop Neum, Bosnia-Herzegovina, 2009
DOI: 10.1556/CRC.37.2009.Suppl.2 243
the differences being due to internal and external factors (Paunović and Ogašanović, 1972). PPV does not significantly affect the growth and vigour of infected plum trees,
but the more susceptible the cultivar, the greater the changes, particularly on the fruits
(Kišpatić, 1987). However, in our study, the difference in one-year-old shoot length was
significant at P < 0.05.
Table 1. Mean±SE of one-year-old shoot length, fruit weight and yield of cv. Stanley in non-infected and
infected trees in 2006-2007
Parameter Shoot length
(cm)
Fruit weight
(g)
Total yield
(kg tree-1)
Total yield
(t ha-1)
Non-infected trees 44.27±0.323* 37.68±0.615* 16.5±0.499* 20.62±0.357*
Infected trees 36.74±0.109 35.34±0.713 13.1±1.003 16.37±0.269
Differences 7.53±0.091 2.34±0.015 3.4±0.098 4.25±0.436
The asterisks indicate significant differences between means in vertical columns at P < 0.05
The fruit weight dynamics curve in Fig. 1b shows that no significant differences were
observed from the beginning of measurement on 25 April to 5 June. Thereafter, until
harvest performed on 25 August in the period 2006-2007, the fruits of the infected trees
exhibited lower intensity of change in fruit weight. The differences between fruit weight
in the infected (35.34±0.713 g) and non-infected trees (37.68±0.615 g) were significant
at P < 0.05 (Table 1).
Plum fruits show a specific growth dynamics. There are three distinct stages of stone
fruit growth – the rapid stage, the slow stage and the very rapid stage (Milosevic, 1997).
As far as this is concerned, there are no differences between non-infected and infected
fruits of cv. Stanley, the only exception being the less intensive dynamics of changes in
dimensions of infected fruits (Fig. 1b). Jordovic and Janda (1963) showed that the fruits
of susceptible plum cultivars (Pozegaca, Italian Prune), while they were still green,
developed hollow depressions that enlarged as the fruit matured, as well as wrinkles that
deformed the fruit form, consequently affecting the dynamics of change in the final fruit
form. According to the stated authors, PPV infected fruits of cv. Stanley, which retained
their normal form, but not the size. The lowest fruit size reduction was registered in cv.
Stanley (1.0%). The results of our study show that the infected and non-infected fruits
of cv. Stanley exhibited an almost identical dynamics of change in weight, the dynamics
in infected fruits, however, showing lower intensity (Fig. 1b). The above dynamics
induced differences in the final fruit weight of 6.21%. Christov (1947) conducted a
thorough examination of the morphological changes in fruits of some plum cultivars
and determined that the changes resulted in weight and size losses, as confirmed by the
present study (Table 1). The above author also reported that the content of resinous
substances in the infected fruits was twice the content in non-infected ones. The fruits of
cv. Stanley follow a three-stage sigmoid curve growth pattern from fruit setting to
maturity, the stages being the rapid, slow and very rapid one of different duration,
depending on the cultivar, the second stage being the shortest, lasting 10-12 days
(Milosevic, 1997), as confirmed by the results of our study.
Yield The data in Table 1 show that the final fruit yield of non-infected trees was 16.5± kg or
20.62±0.357 t ha-1
, that of the infected ones being 13.1±1.003 kg tree-1
or 16.37±0.269 t

Vol. 37, 2009, Suppl. Cereal Research Communications
244
ha-1
. The difference in the total yield per tree between the infected and non-infected
trees was 3.4±0.098 kg or 4.25±0.436 t ha-1
. The above indicates that the trees of
Stanley showing PPV symptoms gave a 20.61% lower yield per tree and per hectare.
The differences between the infected and non-infected trees were significant at P <
0.05, being most likely due to the destructive effect of PPV on the yield of cv. Stanley
in the our study, although Ranković (1986) reported cv. Stanley to be a tolerant cultivar
under Serbian conditions. Pribék (2001) reported yield losses of 20-30% in PPV-
infected plum trees. About 100 million stone fruit trees in Europe are currently infected,
and susceptible cultivars can result in 80-100% yield losses (Kegler and Hartman,
1998). The results by Pribék and Gáborjányi (1998) could be given serious
consideration in terms of the stress effect of PPV on the growth and yield of cv. Stanley.
Conclusions
PPV induced significant differences in one-year-old shoot length (17.00 %), fruit weight
(6.21%) and yield per tree and unit area (20.61%) between infected and non-infected
trees of cv. Stanley under the conditions of Cacak (Western Serbia).
References
Balla B. –Abonyi F. –Drén G. –Barkaszi I. –Holb I.: 2008. Effect of three storage methods on fruit decay and
brown root of apple. Cereal Research Comunnications, 36: 799-802.
Christov A.: 1947. The Sharka disease on Plums. News of the Chamber of National culture. Series: Biology, Agriculture and Silviculture 1: 97-111.
Hernández A. J. –Díaz-Vivancos P. –Rubio M. –Olmos E. –Clemente J. M. –Ros-Barceló A. –Martínez-
Gómez P.: 2007. Plum pox virus (PPV) infection produces an imbalance on the antioxidative systems in
Prunus species. Acta Phytopathologica et Entomologica Hungarica, 42: 209-221.
Horváth J. –Takács A. –Farkas K. –Kazinczi G. –Gáborjányi R.: 2007. Epidemiology of tomato pathogen
viruses in Hungary. Cereal Research Communications, 35: 489-492.
Jordović M. –Janda Lj.: 1963. Morfološko-anatomske i hemijske promene na plodovima nekih sorata šljive
zaraženih virusom šarke šljive. Zaštita bilja, 76: 653-670.
Kegler H. –Hartman W.: 1998. Present status of controlling conventional strains of plum pox virus. In: Hadidi
A. –Khetarpal R. K. –Koganezawa H. (ed.), Plant Virus Disease Control. St. Paul, MN: APS Press, 616-
628.
Kišpatić J.: 1987. Bolesti voćaka i vinove loze. Fakultet Poljoprivrednih znanosti, Zagreb.
Milosevic T.: 1997. Growth dynamics of shoots and fruits in newly-breed plum cultivars. Kertészeti
Tudomány, 29: 9-12.
Moor U. –Karp K. –Pöldma P. –Strarast M.: 2007. Effect of 1-MCP treatment on apple biochemical content
and physiological disorders. Acta Agronomica Hungarica, 55: 61-70.
Paunović S. –Ogašanović D.: 1972. Proučavanje dinamike rasta i diferencijacije cvetnih pupoljaka važnijih
sorti šljiva. Jugoslovensko voćarstvo, 20: 459-467.
Pribék D. –Gáborjányi R.: 1998. A hazai szilvahimlı vírus izolátumok eltérı szerotípusai. Növényvédelem,
34: 243-249.
Pribék D.: 2001. Study on transmission and isolates of Plum pox potyvirus, and possibilities for establishing
integrated protection. PhD thesis, University of Veszprém Georgikon Faculty of Agricultural Sciences
Keszthely, Plant Protection Institute, Department of Plant Pathology and Plant Virology, Hungary.
Prica V.: 1977. Opšte voćarstvo. I deo: Biologija voćaka. Poljoprivrdni fakultet, Sarajevo.
Ranković M.: 1986. Ispitivanje otpornosti nekih novijih sorti šljiva prema virusu šarke. Jugoslovensko
voćarstvo, 20: 601-606.
Vágó I. –Balla-Kovács A. –Nagy P. T.: 2007. Effects of boron, calcium and magnesium foliar fertilization
apple (Malus domestica) yields. Cereal Research Communications, 35: 1261-1264.

VIII. Alps-Adria Scientific Workshop Neum, Bosnia-Herzegovina, 2009
DOI: 10.1556/CRC.37.2009.Suppl.2 245
WHEAT BREEDING FOR DROUGHT TOLERANCE. (Efforts and results.)
Laszlo CSEUZ – Janos PAUK – Csaba LANTOS – Istvánné KOVÁCS
Cereal Research Non-profit Ltd.Co. – H-6726 Alsókikötı sor 9. Szeged, Hungary,
Abstract: Drought tolerance of wheat was tested by a mobile automatic rain shelter (MARS) in a
conventional pedigree breeding program of Cereal Research Non-Profit Ltd. Co. (CRC) in Szeged. The
MARS, parallel with ideal water supply gives a good chance for field testing of relatively high number of
genotypes for drought tolerance. Using the automatic rain shelter which was installed in 2006, advanced lines
of winter wheat could be tested for tolerance to water shortages under irrigated (control treatment) and under
dry conditions. Withdrawal of water caused significant effects on yield and yield components and raised the
canopy temperature of the genotypes tested. We have developed a novel breeding system by which we can
routinely select for drought resistance. The methods applied can easily be incorporated into our working
pedigree breeding system.
Keywords: drought tolerance, wheat, breeding
Introduction
In all over the world the capacity of crop production highly depends on the availability
of water. Climatic changes and deforestation accelerate the process of desertification
and persistent water deficits may generate tragic consequences in different parts of the
world. Even in Europe the shortage of water is the most important abiotic stressor in
plant growing. One of the possible defences against drought is breeding for drought
tolerance. Under our conditions the goal is to produce genotypes, which are resistant to
drought in every developmental stage of their life cycle.
Winter wheat (Triticum aestivum L.) is a quite stress tolerant species, but water
deficiency may cause remarkable losses in grain yield and quality. Grain yield
improvement under drought stress conditions must combine the high yield potential and
specific factors, which are able to protect the crop against reductions due to water
shortages. Although there are new sensing methods available (Tamás et al. 2007)
drought stress can not be measured precisely in the field. Since the weather and natural
water supply is changing year by year in Hungary, grain yield data are not suitable to
judge the tolerance level of cultivated genotypes. The problem is even more
complicated, because most drought tolerance mechanisms are in negative correlation
with grain yield capacity. We have to evaluate the tolerance level of genotypes by
means of inexpensive, fast but reliable testing methods, which can be applied in the
field or even in laboratories and can be performed independently of the weather
conditions. In this paper we demonstrate our efforts in this field.
Materials and methods
Our breeding system is a modified pedigree method, based on manual crossing, head
selection from F2 generation until uniform head-rows are available. Generally from F4
generation information yields trials, later four-replicated yield trials, and at last multi-
location performance tests help selecting the best ones among the advanced lines. From
the generation of F5, quality tests and parallel scoring in rust (P. recondita, P. graminis)
and virus nurseries (under provocative conditions) give additional information for the

Vol. 37, 2009, Suppl. Cereal Research Communications
246
successful selection. In the younger, segregating generations (F3-F5) visual scoring of
morphological and phenological characters is the only effective method to evaluate the
drought tolerance of large number of genotypes (10000-20000 accessions per year). The
most important traits that may be checked visually are: leaf firing, leaf rolling, leaf color
under serious stress, the hairiness or glaucosity of the leaves, kernel size and
healthiness. Fast seedling emergence, rapid phenological development in spring,
earliness in heading, anthesis and maturity are also advantageous parameters when the
goal is drought tolerance.
For testing drought tolerance per se in the field, mobile automatic rain shelter (MARS)
was constructed and installed in the nursery of CRC in Szeged (fig.1.).
Figure 1. The automatic rain shade
MARS covers a 720 square meter area. Rain sensors set the closing mechanism which
completely covers the field plots by a convertible plastic tunnel. Drain ditches prevent
the side-wetting from the neighboring soil profiles. Drought can be traced by two
automatic meteorological stations which continuously measure the rainfall, sun
radiation dew point, soil moisture, soil temperature, air temperature, wind direction and
speed. 85 winter wheat genotypes have been tested on two-row plots in three
replications in the 2007/2008 wheat year. Most of the tested genotypes were the
advanced breeding lines of the Cereal Research Non-Profit Co., and check varieties. All
the genotypes were planted in two-row plots in 3 replications by a Wintersteiger
Seedmatic sowing machine in October, 2007. Plot size was 0,5 m2. The effects of
drought were evaluated by measuring plant height, acceleration in heading time,
depression of the yield components, grain yield and the difference between the canopy
temperatures of stressed/control plots of the different genotypes. The later method has
been considered to be effective in screening wheat genotypes for drought tolerance
(Blum, 1988, Inagaki and Nachit, 2008, Matuz et al. 2008, Winter, 1988) since tolerant
genotypes can maintain photosynthesis (and evaporation) longer (Winter et al. 1988)

VIII. Alps-Adria Scientific Workshop Neum, Bosnia-Herzegovina, 2009
DOI: 10.1556/CRC.37.2009.Suppl.2 247
and their canopy temperature is lower. Canopy temperature was determined by infrared
thermometer (Crop Trak, Spectrum Technologies Inc.).
Results and discussion
The effect of water withdrawal (under MARS) caused significant differences on plant
height and thousand kernel mass, and significantly decreased grain yield and changed
heading time and canopy temperature.
Among the tested genotypes plant height was 89,4 cm in the treated (shaded) and 94,5
cm in the control treatment. Water shortage decreased plant height by 5,1 cm which
means a 5,4 % depression.
Tolerant genotypes’ depression in growth was more moderate than susceptible ones’.
Water stress also affected heading time. Mean of heading time was 137,7 days after the
first of January (17th of May) in the control treatment while it happened on the 12th of
May in the stress treatment. Here heading accelerated, and on the average of the tested
genotypes heading time started earlier by 5,8 days, which means a 4,2 % shorter time
from the beginning of the year.
On the average of the 85 genotypes tested, grain yield decreased by 36,8 %, while
thousand kernel mass (TKM) decreased by 7,8 %. The two-row plots’ average grain
yield was 394 g in the irrigated, and 249 g in the stress treatment, which means a 36,8 %
depression. Only about 22 % of grain yield loss could be explained by TKM depression.
The rest of the yield depression could be happen due to the less number of fertile and
productive spikes. The higher number of secondary spikes also decreased the difference
of TKM between the two treatments.
Table 1. The effects of water deficiency on the tested genotypes
cm days g g ºC ºC
Control treatment 94,5 137,7 44,7 394 22,7 19,1
Stress treatment 89,4 131,9 41,2 249 27,9 24,2
Difference 5,1 5,8 3,5 145 -5,2 -5,1
LSD.5% 3,3 3,4 3,9 23,5 4,8 5,1
Control % 94,6 % 95,8 % 92,2 % 63,2 % 122,9 % 126,7 %
Grain yieldCanopy
temperature
Canopy
temperatureTreatments Plant height Heading time TKM
Midday canopy temperature measurements were executed on two hot days, the 28th and
on the 30th of May. Air temperature was 34 ºC and 30 ºC during the measurements.
Canopy temperature was 22,7 ºC and 19,1 ºC on the average of the control plots and
27,9 and 24,2 in the treated (stressed) treatments. Generally the results of drought stress
trials has no correlation to yield data. The best correlation with MARS data were found
with grain yield (r = 0,628 - 0,836*** ).
Conclusions
Rain shelter is an appropriate device to generate drought stress in the field. However
selecting for drought tolerance even using this equipment is a difficult project. Under

Vol. 37, 2009, Suppl. Cereal Research Communications
248
our conditions following the coldest months the withdrawal of water must be started as
soon as possible (not later than in February), otherwise the sufficient seriousness of
drought stress could not be achieved.
Comparing the canopy temperature of the control and stressed wheat plots is a very fast
screening method, by which single measurements can be made within a few seconds.
Even hundreds of genotypes can be measured easily. However, the results can be
affected by numerous factors such as wind, moving clouds, the angle of the equipment,
the density of the canopy etc. so the results must be based on replicated measurements
and a competent number of control measurements (on check genotypes). The mentioned
selection methods are applied in our conventional winter wheat breeding program. All
these tests can only be additional methods in the breeding procedure besides visual
scoring of morphological and phenological traits. Also, important information can be
obtained from the multi-location yield trials especially at drier locations and/or in drier
years. Significant improvement in drought tolerance of future wheat varieties can only
be achieved by the combination of all these data. The advance in drought tolerance can
be found among our latest registered wheat varieties and numerous new winter wheat
candidates with a higher level of adaptability to dry environments. Bread wheat
varieties: GK Jászság (1999), GK Szálka (2000), GK Ati, (2001), GK Csongrád (2001)
GK Békés (2005) GK Csillag (2005) GK Hunyad (2005) are reputed tolerant to water
shortages, and performed very well under stress conditions, too.
Acknowledgements
Present work was supported by Teller Ede German-Hungarian Project. (NAP_Bio_06)
and Jedlik Ányos Project (OM-187/2007)
References
Blum, A. 1998: Improving wheat grain filling under stress by stem reserve mobilization. In: H.-J. Braun et al.
(eds.), Wheat: Prospects for Global Improvement. Kluwer Academic Publishers. p:135-141.
Inagaki, M.N., and Nachit, M.M. 2008: Visual monitoring of water deficit stress using infrared thermography
in wheat In: R. Appels, R. Eastwood, E. Lagudah, P. Langridge, M. Mackay, L. McIntyre, P. Sharp (Eds.)
Proceedings of the 11th International Wheat Genetics Symposium. Sydney: Sydney University Press.
Matuz, J., Cseuz, L., Fónad, P., Pauk, J. 2008: Wheat breeding for drought resistance by novel field selection
methods VII. Alps-Adria Scientific Workshop, Stara Lesna, Slovakia. Cereal Research Communication
Suppl. 123-126.
Tamás, J., Lénárt, Cs., Nagy, I. 2007: Evaluation of cropfield water supply by remote sensing method.
Cereal Res. Com. 35(1):1189-1192.
Winter, S. R., Musick, J.T. and Porter, K.B. 1988: Evaluation of screening techniques for breeding drought
resistant winter wheat. Crop Sci. 28(3): 512-516.

VIII. Alps-Adria Scientific Workshop Neum, Bosnia-Herzegovina, 2009
DOI: 10.1556/CRC.37.2009.Suppl.2 249
THE IMPACT OF PRECISION NUTRIENT SUPPLEMENTATION ON WHEAT YIELD AND QUALITY
Andrea AMBRUS 1 – József PETHES
2 – Erika FODORNÉ FEHÉR
3
1Department of Environmental Management and Agronomy, Károly Róbert College, Gyöngyös,
e-mail: [email protected] 2 Department of Environmental Management and Agronomy, Károly Róbert College, Gyöngyös 3 Mátra Secondary Technical School, Mátrafüred,
Abstract: The aim of our research has been to survey the impact of precision plant growing on the quality and
quantity of autumn wheat on compound soil in Hungary. Our goal is to size up the possibility of the
homogenization of the quality of wheat on compound soil. The results of the first year have shown a
significant correlation between the quality of wheat and the phosphorus contents of the soil of the plot. For the
sake of the yield of the second year potash and phosphorus fertilizer was distributed by precision technology
in the course of autumn nutrient supply. The extraordinary vintage had a strong effect on crop quality this year
as well as in the first. The quantitative data were acceptable but certain quality parameters were reduced to the
level of forage wheat due to the heavy rainfall right before harvest time which also delayed harvesting.
Keywords: precision plant growing, crop quality, crop quantity, compoundness
Introduction
Winter wheat is the most important field crop in the world and in Hungary as well.
According to Sárvári (2006) the quantity of wheat grown in Hungary is satisfactory, it
is, therefore, not the quantity but the quality of wheat crop which needs to be improved.-
This cannot be realized without being aware of the ecological, biological and agro-
technical factors and their interactions. Due to Harmati (1987) the nutrient supply plays
a significant role in the growth and development of winter wheat. Nutrient supply is the
agro-technical factor most apt for improving the yield and the quality of wheat. Ragasits
states based on the results of long term experiments that nutrient economy based on soil
analysis and on the cognition of ecological makings is the vital condition of economic
wheat growing. Plants need balanced nutrition for normal growth and good health.
Crops that grow in a good quality soil and have balanced nutrient supply yield better,
because nutrient balance results in increased nutrient and water use efficiency by plants.
(Kádár 2007). Phosphorous plays a determinative role in the development of wheat
grain due to its physiological significance. Phosphorous accumulation increases in the
vegetative phase, grows in spots till the milky ripening in the generative phase and the
state of component loss is to be observed afterwards. The period of rapid accumulation
is to be experienced between the fenophase of shooting and ear emergence independent
from production area. By harvesting at the end of the vegetation the major part of
accumulated phosphorous is infiltrated into the seed grain a smaller proportion of it is to
be found in the vegetative parts. (Lastity 2006) On the basis of the results obtained
effects of different treatments on seed quantity and quality were determined. Form the
results it could be concluded that the various circumstances had effects on different
quality parameters depending on the crop year and the variety used. Seed quality and
quantity values proved to be variety specific. Further examinations are needed to
evaluate crop year effects on the parameters studied. (Klupács et al. 2008) The presence
and availability of N during the first half of wheat development has a decisive influence
on the development of the generative organs and thus on the grain yield (Varga et al.,

Vol. 37, 2009, Suppl. Cereal Research Communications
250
2007). According to Jolánkai – Németh (2002) the aim of precision plant production is
to adapt the production technology more precisely to the conditions prevailing in the
production area. The survey of inhomogenity within the basic ecological unit of
production the production plot and the demand of biological, productional and
technological accommodation to it has an age-long history. Czinege et al. (2000)
identify the spatial identification of the pattern of characteristics within the plot as the
philosophical key issue of precision farming. Agro-technical tasks can be determined on
this basis which can be connected to agro-ecological features and at the same time to the
dynamically changing cultural state as well.
Materials and methods
The experiment took place in Gyöngyöspata 12 km from Gyöngyös. The soil type of the
experimental area is brown forest soil which shows great diversity even within the plot
regarding nutrient supplying ability as well as microclimate or relief. The experiment
was set within the framework of large-scale farming by the filed splitting method. A 50
ha area was allocated on the plot as experimental area. By selecting the variety our aim
was to choose a variety growing securely in the given production area. The variety
surveyed was the Mv Magdaléna characterized by its heritably high gluten contents and
the high average yield which can reach 7,0-7,5 t ha-1
under favourable conditions. Its
high falling number stability contributes to quality preservation even if the weather is
rainy at the harvesting period. Preparation works of the experiment were done in the
first year the contours of parcels were drawn up by GPS and soil analysis was carried
out on the basis of which the nutrient content maps of the territory were prepared. The
bottleneck among the nutrients was the phosphorous provision as there was a significant
heterogeneity regarding this nutrient as on certain parts of the parcel only clues of it
were to be found. In the first year samples were taken at certain GPS coordinates and
the quality resp. the deviation of the quality of the yield was surveyed for the
preparation of a yield map. The 2007 samples showed a significant coherence between
the quantity of the crop and the phosphorous content of the soil. In autumn 2007
traditional nutrients delivery was applied on one part of the parcel while the P quantity
suggested by the computer programme was delivered by precision technology on the
other. When harvesting in 2008 knowing the GPS coordinates we returned to the
sampling points of the previous year and took samples repeatedly. Surveying the
deviation of the quantity and quality parameters of the two years we were eager to know
how the deviation of the quantity and quality parameters of the crop are affected by
phosphorous fertilizer delivered by precision method at the same point.
Results and discussion
Neither the year 2008 nor 2007 can be considered a standard vintage. Though the
quantity of rainfall in the vegetation period did not exceed 514,5 mm, but 138 mm of it
in July, right before harvesting. This fact affected the crop quality heavily. On the basis
of the average yield one can come to the conclusion that the distribution of rainfall was
more favourable in 2008, as the average yield was 4,55 t ha-1
which means a

VIII. Alps-Adria Scientific Workshop Neum, Bosnia-Herzegovina, 2009
DOI: 10.1556/CRC.37.2009.Suppl.2 251
remarkable increase compared to the 3,28 t ha-1
figure of 2007. Surveying the deviation
we stated that the deviation of the average yield did not supportably increase. Nearly
all the quality parameters of the year 2008 showed a significant decrease compared to
same of 2007 which was a mainly dry vintage. (Table 1.)
Table 1. The quantity and quality parameters of winter wheat in the years 2007 and 2008
Sample
Average grain yield at given point (Yield) and quality parameters of wheat grain in two growing seasons
designation t ha-1 Percent in grain
Yield Protein yield Moisture Protein Gluten 2007 2008 2007 2008 2007 2008 2007 2008 2007 2008
1 2.10 3.90 0.30 0.54 13.20 11.80 14.50 13.90 29.53 29.30
2 2.10 3.40 0.38 0.48 12.90 11.90 18.00 14.20 38.85 31.20
3 2.70 3.20 0.46 0.47 13.00 11.90 17.10 14.80 36.61 31.70
4 2.10 3.90 0.36 0.56 13.40 11.90 17.20 14.40 36.64 30.60
5 3.70 5.60 0.64 0.81 13.10 11.90 17.20 14.40 36.70 30.60
6 4.20 5.30 0.68 0.78 13.30 11.90 16.20 14.80 34.05 31.80
7 3.70 4.80 0.63 0.64 13.30 12.00 16.90 13.40 35.64 28.40
8 2.10 3.60 0.38 0.48 13.20 11.80 18.20 13.40 38.84 29.60
9 4.80 5.80 0.90 0.81 13.30 11.90 18.70 13.90 39.52 29.80
10 3.70 5.00 0.68 0.69 13.50 12.00 18.30 13.80 38.93 29.60
11 3.20 3.20 0.59 0.44 13.60 12.10 18.40 13.70 39.06 29.30
12 4.20 6.30 0.76 0.96 13.80 11.90 18.10 15.20 38.38 32.70
13 4.20 6.80 0.76 0.90 14.00 11.80 18.20 13.20 37.63 28.10
14 3.20 3.20 0.59 0.43 13.90 12.00 18.40 13.50 38.69 30.60
15 2.70 3.00 0.46 0.42 14.30 11.80 17.20 13.90 35.81 31.80
16 3.70 5.80 0.61 0.79 14.30 11.90 16.40 13.60 33.49 28.70
Average 3.28 4.55 0.57 0.64 13.51 11.91 17.44 14.01 36.77 30.24
Deviation 0.86 1.23 0.16 0.18 0.42 0.08 1.06 0.56 2.57 1.31
CV% 26.23 26.98 28.36 27.57 3.14 0.69 6.07 3.99 7.00 4.33
Frate 2.04 1.17 26.23 3.58 3.85
Fcrit 5% 2.41 2.41 2.41 2.41 2.41
Fcrit 1.0% 3.52 3.52 3.52
Fcrit 0.5% 4.07
According to the survey of relative deviation a remarkable heterogeneity of the average
yield within parcel can still be experienced in both years. The handling did not decrease
the heterogeneity of crop quantity within parcel. Comparing the data of relative
deviation after handling of the two years it can be stated that the parcel shows a notable
heterogeneity regarding protein quantity in both years. The percentage of gluten and
protein became more homogeneous in the second year. The relative deviation of the
percentage of protein decreased from 6,07 to 3,99 while that of the gluten from 7,00 to
4,33 in case of samples taken from the same points. F-probe was applied for the analysis
of crop and protein data. The average crop and protein data did not exceed the Fcrit 5%.
The gluten and the protein exceeded the Fcrit 1%, the moisture content of the crop the
Fcrit 0,5%.

Vol. 37, 2009, Suppl. Cereal Research Communications
252
Conclusions
On the surveyed territory we have expected similar or smaller deviations besides the
increase, stagnation or decrease of the average of different parameters. The percentage
of protein decreased to 14,01 from 17,44 besides the certifiable decrease of deviation.
The average protein quantity and its deviation did not change significantly. The average
gluten percentage decreased by 18% - from 36,77 to 30,24 – compared to the results of
2007 but a significant decrease of deviation was also to be observed. Regarding
moisture contents the results of the year 2008 were more favourable than those of the
previous year in spite of the hugh quantity of rainfall right before harvesting which had
a negative effect on the quality. On the basis of the results of the second year of the
experiment it can be stated that the quantity and quality parameters of the crop can be
strongly affected by the vintage effect. After applying precision phosphorous nutrient
delivery a significant decrease of deviation was experienced in case of more quality
parameters at points determined by GPS coordinates. Though the results of the survey
are based on the data of two years only and the evaluation and analysis of the data of
several years would be needed to verify the conclusion that the precision nutrient
delivery makes it possible to homogenize the crop quality within parcel. The survey of
more and more quality parameters and the expansion of the information gathered about
the parcel and its agro-ecological environment are suggested in order to come to this
conclusion.
Acknowledgements
The authors are indebted for the support of their reseach for SZIE NTTI, Gyöngyöspata
Farm and KITE Zrt.
References
Czinege E. – Pásztor L. – Szabó J. – Csathó P. – Árendás T. 2000. Térinformatikai alapokra épülı mőtrágyázási szaktanácsadás. Agrokémia és Talajtan 49-64 pp.
Harmati I. 1987. Tápanyagellátás. In: A búzatermesztés kézikönyve Ed: Barabás Z. Mezıgazdasági Kiadó.
Budapest. 351-361 pp.
Jolánkai M. – Németh T. 2002. Crop responses induced by precision management techniques. Acta
Agronomica Hungaria 50, Supplementum, 173-178 pp.
Kádár, I.: 2007. Sustainability of soil fertility nutrient levels. Cereal Research Communications, 35:2. 573-
576. pp.
Lastity B. 2006. Az ásványi tápelemek felhalmozása gabonafélékben. Mőegyetem Kiadó. Budapest. 35-42 pp.
Ragasits I. 1998. Búzatermesztés. Mezıgazda Kiadó. Budapest. 68-81 pp.
Sárvári M. 2007. A vetésforgó és a tápanyagellátás szerepe az ıszi búza termesztésben. In: Búzavertikum
aktuális kérdései. Ed: Pepó P. Debreceni Egyetem Kiadó. Debrecen. 64-72. pp.
Varga B., Svečnjak Z., Jurković Z., Pospišil M. 2007. Quality responses of winter wheat cultivars to nitrogen
and fungicide applications in Croatia. Acta Agronomica Hungarica, 55: 37-48.

VIII. Alps-Adria Scientific Workshop Neum, Bosnia-Herzegovina, 2009
DOI: 10.1556/CRC.37.2009.Suppl.2 253
CROPYEAR AS ABIOTIC STRESSOR REGARDING YIELD OF MAIZE (Zea mays L.) IN DIFFERENT CROP ROTATIONS
Attila VAD – Lajos Fülöp DÓKA
Research Institute and Model Farm, Agronomy Faculty, University of Debrecen
H-4032 Debrecen, Böszörményi út138, e-mail: [email protected], [email protected]
Abstract: Effects of crop-rotation, fertilization and irrigation on the yield of maize has been studied in
different cropyears characterized by different water supply (2007 year=dry; 2008 year=optimum) on
chernozem soil. Our scientific results proved that in water stress cropyear (2007) the maximum yields of
maize were 4316 kg ha-1 (monoculture), 7706 kg ha-1 (biculture), 7998 kg ha-1 (triculture) in non irrigated
circumstances and 8586 kg ha-1, 10 970 kg ha-1, 10 679 kg ha-1 in irrigated treatment, respectively. In dry
cropyear (2007) the yield-surpluses of irrigation were 4270 kg ha-1 (mono), 3264 kg ha-1 (bi), 2681 kg ha-1
(tri), respectively. In optimum water supply cropyear (2008) the maximum yields of maize were 13 729-
13 787 (mono), 14 137-14 152 kg ha-1 (bi), 13 987-14 180 kg ha-1 (tri) so there was no crop-rotation effect. In
water stress cropyear (2007) fertilization caused yield depression in non irrigated treatment (control=2685 kg
ha-1; N240+PK=2487 kg ha-1). Our scientific results proved that the effects of abiotic stress could be strongly
reduced by using the optimum crop models in maize production. We obtained 8,6-11,0 t ha-1 maximum yields
of maize in water stress cropyear and 13,7-14,2 t ha-1 in optimum cropyear on chernozem soil with using
appropriate agrotechnical elements.
Keywords: maize, abiotic stress, cropyear, yield
Introduction
Maize is an important grain crop both in Hungary and in the World. In Hungary, maize
is produced on 1.1- 1.2 million ha (25% of the arable land) and the yields range between
4 and 7 t ha-1
depending on the cropyear and the applied agrotechnical methods. The
yield of maize is significantly changes on farm and plot level as well, which shows the
high sensitivity of the plant for ecologic and agrotechnical factors (PEPÓ et al. 2006).
Fertilization, genetics, crop protection, plant density and irrigation as production
technology factors play important role in the determination of maize yields (GYİRFFY
1976, NAGY 1996, SÁRVÁRI and SZABÓ 1998, PEPÓ 2001).
To some extent, the negative influence of climatic factors can be reduced by appropriate
hybrid selection (SÁRVÁRI 1995, PEPÓ et al. 2007) and by appropriate agrotechnical
management. Nutrient and water supply are determining agrotechnical factors. Maize
needs harmonized NPK fertilization; however, out of macroelements nitrogen has
significant importance (BERZSENYI 1993, LIANG and MAC KENZIE 1994,
KOVAČEVIC et al. 2006, IZSÁKI 2007). In dry years the role of irrigation is
especially significant in ensuring high yields of maize (RUZSÁNYI 1990, PEPÓ et al.
2008).
Materials and methods
The long-term experiment was set up in 1983 on chernozem soil in the Hajdúság
(Eastern Hungary) by Prof. László Ruzsányi. The multifactorial experiment has been
managed by Prof. Péter Pepó since 2004. Regarding the physical characteristics of the
soil, the area can be classified as loam and has a nearly neutral pH value (pHKCl=6.46).
It has a medium-level humus content (2.8 %) and a humus depth of about 80 cm. Its
supply of phosphorous is medium and its supply of potassium can be considered good.
The structure of the multifactorial experiment is as follows:

Vol. 37, 2009, Suppl. Cereal Research Communications
254
- crop rotation: monoculture (maize), biculture (wheat-maize), triculture (peas-
wheat-maize)
- fertilization: control, one-, two-, three- and fourfold amounts of the basic dosage
of N=60 kg ha-1
, P2O5=45 kg ha-1
, K2O=45 kg ha-1
- irrigation: not irrigated and irrigated
During the vegetation period of 2007, irrigation was applied 4x50 mm (200 mm) in the
irrigated treatment (between early May and late June). In 2008 year we did not applied
irrigation. Against Diabrotica virgifera in 2007 year we used soil desinfection in
monoculture (Force 1,5 G 14 kg ha-1
) and sprayed in mono-, bi- and triculture (17 July,
Karate Zeon 0,3 l ha-1
) and in 2008 year we applied soil desinfection (Force 1,5 G 14 kg
ha-1
) in mono- and biculture but there was no spraying in the vegetation period. We
applied 60.000 ha-1
plant density in 2007 and 2008 years in all crop rotations. The other
agrotechnical elements met the requirements set by modern maize production. The
hybrid Reseda (PR 37 M 81) was used in our long-term experiments.
Table 1 contains the 30 year average of the most important meteorological parameters
(rainfall, temperature) and these parameters in the cropyears of 2007 and 2008.
Table 1. Meteorological data of vegetation period
April May June July August September Average
Total
Temperature oC 30 year average 10,7 15,8 18,7 20,3 19,6 15,8 16,8
2007. year 12,6 18,4 22,2 23,3 22,3 14,0 18,8
2008. year 11,4 16,8 20,6 20,4 20,6 14,8 17,4
Rainfall (mm)
30 year average 42,4 58,8 79,5 65,7 60,7 38,0 345,1
2007. year 3,6 54,0 22,8 39,7 77,6 86,1 283,8
2008. year 74,9 47,6 140,1 144,9 34,2 42,2 483,9
Results and discussion
In our long-term experiment the yields of maize were primarily determined by abiotic
stress (meteorological factors) (Table 2). In the dry cropyear of 2007, in natural
circumstances (if no irrigation was applied) the yields of maize ranged between 2685-
4316 kg ha-1
yields in monoculture, 6258-7706 kg ha-1
in biculture and 6716-7998 kg
ha-1
in triculture. In years with favourable climatic conditions the yields difference
among the different crop rotation systems was minimal and not significant. In 2008 no
irrigation was necessary. The yields of maize ranged between 9154-13 787 kg ha-1
(non-
irrigated) and 8830-13 729 kg ha-1
(irrigated) in monoculture, 11 613-14 137 kg ha-1
(non-irrigated) and 12 314-14 152 kg ha-1
(irrigated) in biculture, and 11 291-13 987 kg
ha-1
(non-irrigated) and 10 874-14 180 kg ha-1
(irrigated) in triculture.
In dry cropyear (2007) the yield increase generated by irrigation was modified partly by
crop rotation and partly by nutrient supplementation. The yield-increasing effect of
irrigation only prevailed if sufficient nutrient supply was provided, i.e. there is close
correlation between the nutrient and water supply (Figure 1). In the control treatment in
2007 the yield surpluses of irrigation ranged between 1436-2525 kg ha-1
, in the optimal
fertilization treatment it ranged between 2681-4270 kg ha-1
.

VIII. Alps-Adria Scientific Workshop Neum, Bosnia-Herzegovina, 2009
DOI: 10.1556/CRC.37.2009.Suppl.2 255
Table 2. Effects of cropyear and agrotechnical elements on the yields of maize
(Debrecen, 2007-2008, chernozem soil)
Monoculture Biculture Triculture
2007 2008 2007 2008 2007 2008
Non irrigated Ø 2685 9154 6258 11613 6716 11291
N60+PK 3465 11057 7012 13740 7998 13323
N120+PK 4316 13494 7706 14137 7062 13987
N180+PK 2691 13787 7096 14003 6802 13351
N240+PK 2487 13058 6829 13688 6630 13423
Irrigated
Ø 5210 8830 8413 12314 8152 10874
N60+PK 7105 10827 9735 13709 10358 13576
N120+PK 8449 12964 10970 14152 10679 13857
N180+PK 8586 13729 9965 13859 9880 14180
N240+PK 8007 13372 9189 13600 9918 13245
LSD5% 825
The highest yield increases were obtained in the most unfavourable monoculture system
concerning the water management of the soil, while in crop rotation systems involving
low water consuming crops the yield-increasing effect of irrigation was moderate (in
biculture 2155-3264 kg ha-1
, in triculture 1436-2681 kg ha-1
as results of irrigation).
25252155
1436
4270
3264
2681
701193
-324 -58 -278-417
-1000
0
1000
2000
3000
4000
5000
Mo
no Bi
Tri
Mo
no Bi
Tri
Mo
no Bi
Tri
Mo
no Bi
Tri
Ø Nopt+PK Ø Nopt+PK
2007 year 2008 year
yie
ld s
urp
luse
s k
g h
a-1
Figure 1. Effects of irrigation on the yield surpluses of maize
(Debrecen, 2007-2008, chernozem soil)
The appropriate nutrient supply of maize is highly important in the decreasing of
unfavourable abiotic stress (weather) and in the realizing of yield increasing effect of
optimal water supply. Our results prove that in dry year (2007) the yield increasing
effect of fertilization was lower than in humid year (2008). In dry year compared to the
control treatment fertilization caused only moderate yield increase (1282-1631 kg ha-1
according to the crop rotation system) in non-irrigated circumstances. In treatments
where irrigation was applied the yield increasing effect of fertilization was significantly
higher, almost twice compared with the non-irrigated treatment. In humid year (2008)
the yield increase generated by fertilization was determined by the crop rotation system.

Vol. 37, 2009, Suppl. Cereal Research Communications
256
In dry year (2007) in non-irrigated circumstances the fertilization dose exceeding the
agronomic optimum of maize (N240+PK) decreased the yields compared to the optimal
treatment, furthermore, in extreme water conditions the yields were lower than in the
control treatment (control treatment in monoculture: 2685 kg ha-1
, in the N240+PK
treatment: 2487 kg ha-1
, in triculture were: 6716 kg ha-1
, 6630 kg ha-1
yield,
respectively).
Conclusions
In draughty cropyear the maximum yield increase caused by irrigation was 4270 kg ha-1
(monoculture), 3264 kg ha-1
(biculture) and 2681 kg ha-1
(triculture). In dry cropyear
there was strong interaction between water and nutrient supply. The yield surpluses of
maize were significantly lower in the control treatment (1436-2525 kg ha-1
) than in the
optimal NPK treatment (2681-4270 kg ha-1
). The yield increasing effect of fertilization
was primarily influenced by the cropyear and modified by crop rotation and irrigation.
In dry cropyear the yield increase over the control was 1282-1631 kg ha-1
(non-
irrigated) and 2527-3376 kg ha-1
(irrigated). In favourable year the yield increase was
highest in monoculture (4633-4899 kg ha-1
) but it was high in biculture (1838-2524 kg
ha-1
) and in triculture (2696-3306 kg ha-1
) as well, respectively.
The scientific results of our long-term experiments proved that applying appropriate
agrotechnical elements the abiotic stress effects caused by weather can be moderated
but cannot be eliminated.
References
Berzsenyi Z.: 1993. Növényanalízis a kukoricatermesztési kutatásokban. Akadémiai doktori értekezés tézisei,
Martonvásár.
Gyırffy B.: 1976. A kukorica termésére ható növénytermesztési tényezık értékelése. Agrártudományi
Közlemények, 35. 239-266.
Izsáki Z.: 2007. N and P impact on the yield of maize in a long-term trial. Cereal Research Communications,
35, 4. 1701-1711.
Kovačević, V. - Rastija, M. - Rastija, D. - Josipović, M. - Šeput, M.: 2006. Response of Maize to Fertilization
with KCl on Gleysol of Sava Valley Area. Cereal Research Communications, 34. 2-3. 1129.
Liang B.C. – MacKenzieA.F.: 1994. Corn yield, nitrogen uptake and nitrogen use efficiency as influenced by
nitrogen fertilization. Canadian Journal of Soil Science, 74. 2. 235-240.
Nagy J.: 1996. Effects of tillage, fertilization, plant density and irrigation on maize (Zea mays L.) yields. Acta
Agronomica Hungarica 196, 2-3. 189-202.
Pepó P.: 2001. A genotípus és a vetésváltás szerepe a kukorica tápanyagellátásában csernozjom talajon.
Növénytermelés, 50. 2-3. 189-202.
Pepó P.-Vad A.-Berényi S.: 2006. Effect of some agrotechnical elements ont he yield of maiza on chernozem
soil.–Cereal Research Communications. 34. 1. 621-624.
Pepó P. - Zsombik L. - Vad A. - Berényi S. - Dóka L.: 2007. Agroecological and management factors with
impact on the yield and yield stability of maize (Zea mays L.) in different crop rotation. Analele
Universitatii Oradea, Facultatea de Protectia Mediului, Vol. 13. 181-187.
Pepó P. - Vad A. - Berényi S.: 2008. Effects of irrigation on yields of maize (Zea mays L.) in different crop
rotation. Cereal Research Communication. 36. 3. 735-738.
Ruzsányi L.: 1990. A növények elıvetemény-hatásának értékelése vízháztartási szempontból.
Növénytermelés, 40. 1. 71-77.
Sárvári M.: 1995. A kukorica hibridek termıképessége és trágyareakciója réti talajon. Növénytermelés. 44. 2.
179-191.
Sárvári M. - Szabó P.: 1998. A termesztési tényezık hatása a kukorica termésére. Növénytermelés, 47. 2. 213-
221.

VIII. Alps-Adria Scientific Workshop Neum, Bosnia-Herzegovina, 2009
DOI: 10.1556/CRC.37.2009.Suppl.2 257
WHEAT KERNEL SIZE AND PHYSICAL FEATURES: A POSSIBLE CONSEQUENCE OF ABIOTIC STRESS
Ernı GYIMES1
1 University of Szeged Faculty of Engineering Department of Food Technology,
e-mail: [email protected]
Abstract: The primary aim of cultivation is to provide permanent quality for food industry because new
processing technologies need constant features of raw materials. In real conditions, biosystems are widely
influenced by different factors that are hard or unpossible to manipulate . For example the cropyear effects are
such factors that consist of two important parts: the temperature and precipitation. The author has investigated
the geometric and agro-physical parameters of wheat kernel sampled from four different years. The width of
kernel varied year by year but there was no significant difference between dry and moist years. The effect of a
dry year caused notable difference for the length and thickness. The kernel length was significantly smaller in
the year of drought and at the same time the thickness increased.
Keywords: wheat, kernel size, kernel shape, hardness,
Introduction
The aim of growing cereals is to supply food industry and animal feed. Wheat is the
most valuable crop, its production is the biggest. It is used in various forms of milling
products: among others bread is made from that. It is a world trade product, so not only
the growing conditions (weather, insect, etc.) determine it, but the market conditions,
too. The reason of the wide spread is the good adaptability. It grows everywhere in the
World within the tropical, desert and the polar region. The weather conditions determine
both the quantity and the quality (FÓNAD et al 2008). In Hungary, the weather is
changeable; and thus there is an extreme effect of rain and temperature. When the wheat
has better quality properties the effect of the weather is less as reported PEPÓ and
GYİRI (1997). KUTASY (2002) examined different wheat varieties from different
season. He determined that from the investigated 26 different samples the quality of 9
varieties was stable in every year. In his study the wheat quality was determined by the
genetical conditions, the growing and agro technology. The kernel size and shape are
the common behaviour of the wheat and for both of them good measuring techniques
are available. It is important parameter as showed by MORGAN et al.(2000), and
TROCCOLI and di FONZO (1999). In all operation of milling technology kernel size
has a significant role, thus it is important to be aware of it. As well, in the planning of
the agricultural machines it is needed to have the information about the size of the
kernel (POLYÁK, N.I., 2001).
Materials and methods
In this study we tested the varieties of Cereal Research Ltd. Szeged from 1999 to 2002.
The samples were harvested from three different plots. Mustard was the plant in
Kecskéstelep and Bemutató plot, the fertilizer was N/P/K, 75 kg/hectare. In the Öthalom
plot, there was pea plant in 2000 and 2002, and corn in 2001. The fertilizer was 45-45
kg/hectare after pea and 150 kg nitrogen and 75-75 kg phosphorus and potassium after
corn.

Vol. 37, 2009, Suppl. Cereal Research Communications
258
The amount of the rain (near 890 mm) was 60 % higher than the average in 1999. This
was the reason that there wasn’t a product short fall and the quality was good in that
droughty years (2000). The Table 1. has shown the different weather parameters
according to different year.
Table 1. Agro meteorology properties of the Szeged plot in different year
Year
Agricultural land
Average
temperature (ºC)
Amount of rain
(mm)
Hours of
sunshine
(hours)
Average (1961-1990)
9,8 586 1960
Kecskéstelep 1999 881
Kecskéstelep 2000 250
Öthalom 2000 265
Kecskéstelep 2001 588
Öthalom 2001 661
Kecskéstelep 2002 393
Öthalom 2002 416
Each kernel size was measured by the three axes with digital caliper (Mitutoyo Ltd.)
100 times repeated. The caliper has 0,01 mm disassembly and 0,03 mm precision.
To determine the error of method of the kernel size measurement, we provided control
measure using 100-100 kernels. The reproducibility of the method was analysed and the
standard deviation determined which is a margin of error. The Hardness Index (HI) was
measured by SKCS 4100 (PERTEN INSTRUMENTS, INC.). The statistical analysis
has been carried out the investigate the effect of the year of cultivation on the size and
kernel hardness index using Statistica for Windows.
Results and discussion
The Table 2 contains the statistical data of the wheat kernel size.
Table 2. Some main statistical data of kernel sizes
1999 2000 1999-2002
Samples 7800 8800 27900
W L T W L T W L T
Mean 3.049 6.545 2.531 3.235 6.162 2.825 3.178 6.392 2.738
Minimum 2.090 4.940 1.560 2.010 4.020 1.640 1.990 3.170 1.560
Maximum 3.990 8.270 3.970 4.290 8.690 3.910 4.290 9.080 3.970
Variance 0.286 0.488 0.231 0.286 0.566 0.259 0.306 0.619 0.286
2001 2002 1999-2002
Samples 5000 6300 27900
W L T W L T W L T
Mean 3.309 6.799 2.764 3.153 6.203 2.852 3.178 6.392 2.738
Minimum 1.980 4.400 1.530 1.990 3.170 1.800 1.990 3.170 1.560
Maximum 4.220 9.080 3.860 3.910 7.900 3.710 4.290 9.080 3.970
Variance 0.309 0.696 0.284 0.290 0.548 0.244 0.306 0.619 0.286

VIII. Alps-Adria Scientific Workshop Neum, Bosnia-Herzegovina, 2009
DOI: 10.1556/CRC.37.2009.Suppl.2 259
In the year 2001 our results were the closest to the average of the four years.
Although the length size was two times that of the width size but there was no
significant correlation between these parameters.
There is a middle correlation between the width and thickness, the ratio is 1.16. The
determination coefficient is lower (R2=0,3131), thus the relationship is rather
deterministic than significant. The size is influenced by the genetical behaviour of the
variety and the conditions of the growing. The ANOVA shows that the effect of year is
very strong parameter for the kernel size (Figure 1.).
Thickness size Lenght size
Width size
Figure 1. Kernel size according to harvested year 1999-2002 (n=278)
The weather conditions of the different cultivation year determine the length and the
thickness parameter. In the drier and drought warm year (2000 and 2002) the kernels
were shorter and more thick. The width parameter did not show the same trend, except
in year 1999. The milling technology requires knowing the kernel size, so it is
indispensable. They have to know the kernel size and its distribution to the riddle. It is
more important if it is an export wheat, because it needs a homogenous mass, it is
requirement.
Figure 2 show that the year of cultivation effected the kernel hardness. There is a
significant difference among the four growing years, so the hardness depend on the
weather conditions. In Figure 2, the statistical analysis of the HI is displayed with a
confidental interval of 0.95?. It is noticeable that the HI was much lower in year 1999
when the amount of rain was the largest. In years 2000 and 2002, when the was a

Vol. 37, 2009, Suppl. Cereal Research Communications
260
droughty years, the HI was highest. The possible reason for the good quality of the
wheat from year 2000 was the high amount of rainfall in the previous 1999 year.
Évjárat
Hi
1999
2000
2001
2002
404550
5560657075
808590
Figure 2. The hardness index (HI:%) values according to harvested year (n=173)
Conclusions
There was no connection among the geometrical behaviour of the wheat kernel
parameters. The parameters are independent, but there is a connection with the agro
physical behaviours. The nearest connection is between the width and the thickness.
The wheat kernel size is determined by genetical pattern and the condition of the
growing. The year effect and the place of plot have a great impact. There was dry and
warm in the examined years of 2000 and 2002, the amount of the rain was essential less,
than the average. The width size varied, but there was no significant difference between
the dry (2000) and the rainy year (2001). The droughty weather has significant effect to
the length and the thickness size. The length size was shorter but the thickness size
increased. So the axes were changed and it caused the increase of the sphericity. This
relationship was examined and determined by the sphericity examination.
Acknowledgements
The author is grateful to Mrs. Mónika Bakos and Ms. Dóra Csercsics for helping the
sample preparation, to Ms. Nora Pap for reading the manuscrip and to University of
Szeged, Faculty of Engineering for providing the equipments. The research work was
financed by János Bólyai Research Fellowship of HAS and OTKA F68984.
References Fónad, P. – Ács, E. – Cseuz, L. – Bóna, L. –Matuz, J.: 2008. Effects of harvest time on the quality
components of winter wheat. Cereal Research Communications, Volume 36,
10.1556/CRC.36.2008.Suppl.1, p. 127-130
Kutasy, E: 2002. İszi búza fajták minısége és minıségstabilitása (in szerk. Pepó, P. – Jolánkai, M.;
Integrációs feladatok a hazai növénytermesztésben, p. 232-237.)
Morgan, B. – Dexter, C. – Preston, K.: 2000. Relationship of kernel size to flour water absorption for Canada
Western Red Spring wheat. Cereal Chemistry, Vol. 77. No. 3 p. 286-292.
Pepó – Gyıri Z.: 1997. A minıségi búzatermesztés meghatározó tényezıi az ıszi búzafajták aratási idejének
hatása a termés mennyiségére és minıségére. in szerk. Pepó, P. – Jolánkai, M.; Integrációs feladatok a
hazai növénytermesztésben, p. 232-237.)
Polyák, N.I.: 2001. Búzaszemek aerodinamikai jellemzıi MTA-AMB 25. Kutatási és Fejlesztési Tanácskozás
Gödöllı, Nr. 25, Vol. 1. p. 168-175.
Szabó P. B. – Véha A.: 2008. Physico-mechanical properties of winter wheat, Cereal Research
Communications, Volume 36, 10.1556/CRC.36.2008.Suppl.2, p. 1003-1006
Triccoli, A. – di Fonzo, N.: 1999. Relationship between kernel size features and test weight in triticum durum.
Cereal chemistry, Vol. 76, No. 1, p. 45-49

VIII. Alps-Adria Scientific Workshop Neum, Bosnia-Herzegovina, 2009
DOI: 10.1556/CRC.37.2009.Suppl.2 261
APPLICABILITY OF CHLOROPHYLL-FLUORESCENCE PARAMETERS AS STRESS INDICATOR UNDER INSUFFICIENT NUTRIENT SUPPLY
Szilvia VERES – Nóra BÁKONYI
1 Division of Agricultural Botany and Crop Physiology, Institute of Plant Science, Debrecen University,
Böszörményi 138., Debrecen, H-4032, e-mail: [email protected]
Abstract: Adequate nutrient supply is one of the main abiotic factors of acceptable plant production.
According to the requirements of sustainable agriculture the plant-cultivation applies adequate tools and
matters in the given environmental capability beside the environmental protection in such a manner that it
would give a profit for the agriculture. Application of chemicals, such as fertilizers may cause some problem
for the environment. Abiotic stress, such as toxic elements, unconformable nutrient supply, may affect the
operation of photosynthetic mechanisms. Measurements of chlorophyll fluorescence parameters make it
possible to evaluate the plant's photosynthetic performance and the extent of its tolerance to environmental
stress. The aim of work was to investigate the relationship between different nutrient supply and some
chlorophyll-fluorescence parameters in the case of corn and sunflower. Plants were grown in hydroponic
condition applying different nutrient solutions, and the parameters of in vivo chlorophyll fluorescence were
detected with a PAM-2001 modulated light fluorometer. Sensibility of fluorescence parameters were different
in altered amount and type of nutrient solution. Relative fluorescence decrease (RFD), as a vitality index of
stress response was also calculated in the case of all treatments and plants.
Keywords: chlorophyll-fluorescence, plant nutrition
Introduction
Chlorophyll fluorescence has been routinely used for many years to monitor the
photosynthetic performance of intact plants and algae (Janda 1998; Antal and Rubin
2008; Elster et al., 2008; Solti et al., 2008). Chlorophyll fluorescence measurements
could be used to estimate rapidly the operating quantum efficiency of electron transport
through PSII in leaves and this PSII operating efficiency was related to CO2
assimilation (Genty et al., 1989). There are several aspects and parameters of the
chlorophyll fluorescence, which can be used for stress detection. Excess of excitation
energy can be de-excited by thermal dissipation processes. Non-photochemical
quenching (NPQ) of chlorophyll fluorescence is an indicative of the level of non-
radiative energy dissipation in the light-harvesting antenna of photosystem II. The
importance of the non-photochemical quenching results from the fact that it shows that
the level of excitation energy in the PSII antenna can be regulated. This is thought to
prevent over-reduction of the electron transfer chain and, therefore, provides protection
from photodamage. Non-photochemical quenching is induced under conditions when
the photosynthetic apparatus cannot use the total of absorbed light energy for
photochemistry. Stress conditions markedly promote NPQ, therefore the amount of
NPQ is an indicator of the stress severity (Schreiber et al., 1986). Fluorescence decrease
ratio (RFD) values as a vitality index also provides very much useful information on the
physiological state of photosynthesis and has been applied with great success as stress
detection (Lichtenthaler and Rinderle 1998). Fluorescence studies have been applied to
investigate the effects of major abiotic stresses on photosynthesis during crop
production and to identify cultivars that are tolerant. Changes in the status of many
nutrients in leaves also have an effect on fluorescence characteristics (Kastori et al.,
2000), but there is no has sufficient knowledge in this topic.

Vol. 37, 2009, Suppl. Cereal Research Communications
262
Materials and methods
The seeds of corn (Zea mays, L cv. Norma sc.) and sunflower (Helianthus annus L. cv Arena PR) were grown on different nutrient solutions under controlled laboratory
conditions. Three different nutrient contents were applied. First of all, complete nutrient
solution (totalns) is contains 2.0 mM Ca(NO3)2, 0.7 mM K2SO4, 0.5 mM MgSO4, 0.1
mM KH2PO4, 0.1 mM KCl, 1 µM H3BO3, 1 µM MnSO4, 1 µM ZnSO4, 0.25 µM
CuSO4, 0.01 µM (NH4)6Mo7O24, 10-4 M FeEDTA. In the second applied nutrient
solution (1/2ns) was the 50% diluted variant of complete nutrient solution. Thirdly, only
distilled water (dw) was used. Parallel of these treatments plant growth promoting
bacteria containing biofertilizer (Phylazonit MC®) was added to the solutions (1ml l-1)
on the 1st day of experiments. Phylazonit MC® is a viscous solution containing
Azotobacter chroococcum and Bacillus megatherium, these microorganisms help
nitrogen and other elements uptake and mobilisation in the rhizosphere. Measurements
were carried out on 8days old seedlings.
The parameters of in vivo chlorophyll fluorescence were detected with a PAM-2001
(Walz,Germany) modulated light fluorometer as described by Schreiber et al. (1986).
Samples were dark-adapted for 30 minutes. After dark adaptation, the initial
fluorescence (Fo) was excited by weak light, the maximal fluorescence (Fm) was
induced by white saturating flash (fast phase of chlorophyll fluorescence). After that,
the slow phase of chlorophyll fluorescence induction was detected under 200 µmol m-2
s-
1 light intensity for 5 minutes with the saturation pulse method, which allows the
analysis of photochemical (qP=(Fm’-Ft)/(Fm’-Ft)), non-photochemical chlorophyll
fluorescence quenching (NPQ=(Fm-Fm’)/Fm’ processes, relative fluorescence decrease
ratio (RFD) values.
Results and discussion
The abiotic stress factors such as cold, heat, wrong nutrient supply has an unfavourable
direct or/and indirect impact on all living organisms (Mészáros 1994; Vinkovics et al.,
2007). The quantity and quality of nutrients can influence soil life, the physiology of
plant and thereby the lives of other organisms (Précsényi and Mészáros 1999). Too
much chemicals cause environmental pollution, but in our days any activity or method
that aims at the moderation of environmental pollution has and will have a major role in
our lives (Várallyay 2007, Kádár 2008). Bio-fertilizers containing plant growth
promoting bacteria and less chemical compounds. These useful microorganisms
facilitate nutrient uptake for plants, enhance the decomposition and mobility of
nutrients, and directly increase the volume of nutrient utilization. The nutrients
availability can operate the activity of photosynthesis. Chlorophyll fluorescence method
is applicable to detect changes in CO2 assimilation (Genty et al., 1989).
The results of Table 1 and 2 show values of qP/qN and non-photochemial quenching
(NPQ) in correlations with nutrient contents and applicance of biofertilizer. The ratio of
qP/qN was the highest in the case of the lowest nutrient level both in corn and
sunflower. The value of qP was remained invariable, but qN was increased parallel with

VIII. Alps-Adria Scientific Workshop Neum, Bosnia-Herzegovina, 2009
DOI: 10.1556/CRC.37.2009.Suppl.2 263
the increasing nutrient concentrations. The NPQ values are also increased with the level
of higher nutrient content in both investigated plants.
Table 1. Changes in the values of the ratio of photochemical and non-photochemical quenching (qP/qN) and
non-photochemial quenching (NPQ) in correlations with nutrient contents and applicance of biofertilizer
(+Phyl). n=3±s.e. (dw: destillated water, 1/2ns: half amount of complete nutrient solution, totalns: complete
nutrient solution) in the case of corn (significances of dw to other nutrient level: p<0.05*, p<0.01**)
corn dw 1/2ns Totalns dw+Phyl 1/2ns+Phyl totalns+Phyl
qP/qN 4.67±0.52 2.01±0.21** 1.91±0.14** 4.11±0.17 2.28±0.11** 1.74±0.19**
NPQ 0.18±0.02 0.47±0.07* 0.55±0.06** 0.19±0.01 0.46±0.01* 0.64±0.09**
RFD 2.34±0.05 2.74±0.02 2.57±0.08 2.34±0.03 2.65±0.08 2.68±0.03
As RFD values show in the Table 1 and 2 the insufficient nutrient supply did not caused
by stress. The RFD is a measure of the potential photosynthetic capacity of a leaf. The
values of RFD steadily decline with increasing stress from 3-5 via values of 1-2 to
values far below 1 which indicate irreversible damage to the photosynthetic apparatus
(Lichtenthaler and Rinderle, 1998). Although the RFD values were lower in the case of
corn, but it does not sign stress situation. The RFD values were higher in sunflower by
20-25 percentages. The differences between the values of plants perhaps originate from
the dissimilar composition of plant tissues. The corn has more schlerophyll leaves,
which can modify fluorescence measurement, but there is no scientific evidence and
literature to certify it. If biofertilizer was added to the nutrient solution there were not
significant differences.
Table 2. Changes in the values of the ratio of photochemical and non-photochemical (qP/qN) and non-
photochemial quenching (NPQ) in correlations with nutrient contents and applicance of biofertilizer (+Phyl).
n=3±s.e. (dw: destillated water, 1/2ns: half amount of complete nutrient solution, totalns: complete nutrient
solution) in the case of sunflower (sunf.) (significances of dw to other nutrient level: p<0.05*, p<0.01**)
sunf. dw 1/2ns Totalns dw+Phyl 1/2ns+Phyl totalns+Phyl
qP/qN 4.90±0.01 3.50±0.25* 3.39±0.27* 4.22±0.62* 3.67±0.23* 3.17±0.13*
NPQ 0.43±0.04 0.26±0.02* 0.29±0.03 0.22±0.04** 0.25±0.02** 0.30±0.01*
RFD 3.42±0.01 3.10±0.13 3.55±0.18 3.09±0.01 3.16±0.07 3.24±0.13
Conclusions
The applicability of chlorophyll-fluorescence parameters as stress indicator under
insufficient nutrient supply is not adequate, but only the slow phase parameters of
chlorophyll fluorescence induction were presented in this paper. In the laboratory the
growing circumstances, eg. light intensity mainly does not perform similarly to field
conditions. Moreover, the insufficient nutrient treatments may cause alterations during
the relatively short time under laboratory conditions. The applied biofertilizer also had
no effect on the measured parameters. Similar investigations are proposed under field
conditions.

Vol. 37, 2009, Suppl. Cereal Research Communications
264
Acknowledgements
I would like to express our sincere gratitude to Szuro-Trade Ltd. for supporting studies.
References
Antal, T., Rubin, A.: 2008. In vivo analysis of chlorophyll a fluorescence induction. Photosynthetic Research,
96: 217-226
Elster, J., Peter Degma, P., Kováčik, L., Valentová, L., Šramková, K., Pereira, B.A.: 2008. Freezing and
desiccation injury resistance in the filamentous green alga Klebsormidium from the Antarctic, Arctic and
Slovakia. Biologia, 63/6: 843 – 851.
Genty, B., Briantais, J.M., Baker, N.R., (1989): The relationship between the quantum yield of photosynthetic
electron transport and quenching of chlorophyll fluorescence. Biochimia Biophysica Acta, 990: 87 – 92..
Janda, T.: 1998. Use of chlorophyll fluorescence induction techniques in the study of low temperature stress
in plants. Acta Agr. Hung. 46: 77-91.
Kádár, I.: 2008. A talajszennyezés megítélése kutatói szemmel. 2. Agrokémia és Talajtan, 57/1:. 177 – 190
Kastori, R., Plesnicar, M., Arsenijevic-Maksimovic, I., Petrovic, N., Pankovic, D., Sakac, Z.: 2000.
Photosynthesis, chlorophyll fluorescence and water relations in young sugar beet plants as affected by
sulfur supply. Journal of Plant Nutrition, 23: 1037 – 1049.
Lichtenthaler, H.K., Rinderle, U.: 1988. The role of chlorophyll fluorescence in the detection of stress
conditions in plants. Critical Reviews in Analytical Chemistry, 19: 329 – 383.
Mészáros, I.: 1994. Biological monitoring in terrestrial environment: plants as bioindicators. Acta Biol. Debr.
Oecol. Hung., 5: 181 – 191.
Prasanna, R., Jaiswal, P., Singh, Y.V., Singh, P. K.: 2008. Influence of biofertilizers and organic amendments
on nitrogenase activity and phototrophic biomass of soil under wheat Acta Agronomica Hungarica, 56/2: 149 – 159.
Précsényi, I, Mészáros, I.: 1999. An application of communication system theory to soil-plant relationships.
Coenoses, 14: 7 – 12.
Schreiber, U., Schliwa, U., Bilger, W.: 1986. Continuous recording of photochemical and non-photochemical
chlorophyll fluorescence quenching with a new type of modulation fluorometer. Photosynthetic Research,
10: 51 – 62.
Solti, Á., Gáspár, L., Mészáros, I., Szigeti, Z., Lévai, L., Sárvári, É.: 2008. Impact of Iron Supply on the
Kinetics of Recovery of Photosynthesis in Cd-stressed Poplar (Populus glauca). Annals of Botany, 102: 771 – 782.
Várallyay, G.: 2007. Soil resilience (Is soil a renewable natural resource?) Cereal Research Communications.
35/2: 1277 – 1280.
Vinkovics, T., Paradikovics, N., Plavsic, H., Guberac, V. Lévai, L.: 2007. Maize and soybeen seed vigour
under influence of seed age, seed treatment and temperature in cold stress test. Cereal Research
Communications. 35/2: 1213 – 1216.

VIII. Alps-Adria Scientific Workshop Neum, Bosnia-Herzegovina, 2009
DOI: 10.1556/CRC.37.2009.Suppl.2 265
„CHESTNUT BLIGHT” INFECTION ON OAKS IN THE CARPATHIAN-BASIN
László RADÓCZ – Gábor TARCALI
Department of Plant Protection, Centre for Agricultural Sciences and Engineering, University of Debrecen,
e-mail: [email protected]
Abstract: Cryphonectria parasitica (Murr.) Barr [syn: Endothia parasitica (Murr.) And.] fungus caused big
damages of the chestnut stands throughout the World. In 1969, symptoms of the disease were reported first on
chestnut in the Carpathian-Basin, in Hungary. Until 1998, the fungus was only detected on chestnut there.
Then blight symptoms were also detected on some young sessile oak (Quercus petraea) trees in South-
Transdanubie (Hungary) and later in Slovakia. Main goals of our studies were field investigations of oaks in
different regions of the Carpathian-Basin (in Romania, in Ukraine, in Slovakia and in Hungary) to detect the
symptoms of the blight fungus. During our examinations, blight symptoms on oaks were identified on three
Hungarian sites. Infected oak trees with bark necrosis were also found near Baia Mare, Romania and in
Slovakia near Duchonka. Blighted oak trees were not yet found in Ukraine so far. Four fungal strains were
identified from bark samples of infected oaks (EU-3, EU-16, EU-9 and EU-11) in Hungary. Only one strain
(EU-2) was identified in the Slovakian site and also one fungal strain (EU-12) was identified in Romania from
oak bark samples. Until now, C. parasitica have not caused so serious destruction on oaks as on chestnut trees
in the Carpathian-basin, but it could be a more serious parasite for our forests in the future.
Keywords: Cryphonectria parasitica, oak spp., Quercus petraea, blight symptoms
Introduction
Cryphonectria parasitica (Murr.) Barr (syn: Endothia parasitica [Murr.] And.) is an
important pathogenic fungus for Castanea species. At the beginning of the XX-th
century, this pathogen killed almost the whole American chestnut (Castanea dentata)
populations in the USA (Anagnostakis, 1987). In the middle of the last Century, it was
reported in Europe too in an European chestnut (Castanea sativa) forest near Genova
(Italy) (Biraghi, 1946), and it caused the "Chestnut blight" epidemia throughout the
continent. In Europe, C. parasitica spread rapidly and heavily infected the chestnut
stands. Then blight symptoms were detected in the Carpathian-Basin, including
Hungary (Körtvély, 1970), Austria (Donaubauer, 1964), Slovakia (Juhasova, 1976),
Romania (Florea and Popa, 1989) and Ukraine (Radócz, 2001). At the second half of
the last Century, typical blight symptoms were observed on some oak trees in the USA
(Torsello et al., 1994), in Switzerland (Bissegger and Heiniger, 1991) and in South-Italy
(Dallavalle and Zambonelli, 1999). Until 1998, C. parasitica was only detected on
Castanea sativa in Hungary. But later some young Quercus petrea trees were found in
mixed chestnut-oak forests which showed typical blight symptoms in Zengıvárkony
and in Kıszeg (Radócz and Holb, 2002) (Figure 1). Although the symptoms were not so
serious on Quercus petraea than on Castanea sativa, it seems that Cryphonectria parasitica became a new serious pathogen for young oak trees in the Central-European
region, mainly in heavily infected mixed chestnut-oak forests. Field investigations were
done in several regions of the Carpathian-basin to examine oaks and to find blight
symptoms. During the field works, bark samples were collected for laboratory
examinations and identifications. Main goals of our studies were the followings:
- investigation of damages caused by C. parasitica on oak trees,
- isolation of the fungus from bark samples and study the fungal isolates in vitro.

Vol. 37, 2009, Suppl. Cereal Research Communications
266
Figure 1. Map of test sites in Central-Europe
Materials and methods
Field examinations were done in chestnut-oak mixed forests in different regions of the
Carpathian-Basin in Romania, in Ukraine, in Slovakia and in Hungary. During the field
works, all of the oak trees were investigated in the examined populations, or a sample-
field. Bark samples for laboratory identifications and further examinations were
collected from the infected trees with a disinfected sharp scalpel. PDA (potato-dextrose-
agar) media were used in the laboratory cultivations. Surface sterilized bark samples
were cultivated on PDAmb media and the isolates were incubated for 7 days in a
climated chamber. Then vegetative compatibility tests were done, when isolates were
paired to study their compatibility. Finally, the pure cultures of the isolates were paired
with EU-tester strains to classify their Vegetative Compatibility Groups (VCG-s). Those
isolates which formed a visible barrage zone at the edge of the growing mycelia were
classified into different VCGs.
Results and discussion
In 2004, field examinations were done in South-Hungary in several chestnut-oak mixed
forests on the Mecsek-mountain and in Zala county. Chestnut trees were infected by the
chestnut bligth fungus in the examined sites. Symptoms of the pathogen were found on
sessile oak trees on three examined plots (Bakonya 16I., Iharos, Pogányszentpéter), but
oak trees in the other examined populations (Bakonya 18A., Boda, Hetvehely) were
healthy (Table 1). A test site with 150 oak trees were selected in the Bakonya 16I. area.
All trees of the test site were checked yearly since that time, so 4 examinations were
done on the signed oak trees of this test site until 2008. It was detected that more and
more oak trees become infected year by year on the test site. Results of the yearly
examinations are presented in Table 1. It was also detected that symptoms of the disease
are becoming more and more serious on oak trees and the infection ratio (I%) was
increasing year by year. Field examinations were done in North-West Romania between
2004 and 2006 near the town Baia Mare on five different chestnut populations mixed
with oak trees (Baia Mare-Tautii de S., Baia Mare-Kıbánya, Baia Mare-Borpatak, Baia
Mare-Veresvíz, Tautii Magheraus). It was detected that chestnut trees were heavely
infected by Cryphonectria parasitica on all examined sites. On the other hand some
infected young oak trees were detected on three examined Romanian plots (Table 1).
Remarks:
1 – Kıszeg,
2 – Zengıvárkony,
3 – South-Hungarian
test sites,
4 – Romanian test sites,
5 – Ukrainian test sites,
6 – Slovakian test sites

VIII. Alps-Adria Scientific Workshop Neum, Bosnia-Herzegovina, 2009
DOI: 10.1556/CRC.37.2009.Suppl.2 267
Table 1. Results of examinations on oak trees in the Carpathian basin
Infection degree/Number
of trees
Test sites Dates of
field work
Exami-
ned
trees (numb).
1 2 3 4 5
Infec-
tion
index
(Ii)
Infec-
tion %
(I%)
Identi-
fied
VCG-s
Bakonya-16I
(HU)
2004.05.06.
2005.12.07.
2006.11.10.
2007.09.28.
150
150
150
150
126
110
99
98
13
17
16
12
2
8
15
16
3
10
14
16
6
5
6
8
3,08
3,08
3,20
3,38
16,00
26,67
34,00
34,67
EU-11
EU-9
Bakonya-18A
(HU)
2004.05.06.
2006.09.28.
100
100
100
100
-
-
-
-
-
-
-
-
-
-
0
0
Boda-4 D
(HU)
2004.05.06.
2006.09.28.
100
100
100
100
-
-
-
-
-
-
-
-
-
-
0
0
Hetvehely
(HU)
2004.05.06.
2006.09.28.
100
100
100
100
-
-
-
-
-
-
-
-
-
-
0
0
Iharos
(HU)
2006.03.23.
2006.09.29.
50
50
41
40
2
3
4
5
3
2
-
-
3,11
2,90
18,00
20,00
EU-3
P.szentpéter (HU) 2003.03.23.
2006.09.29.
50
50
38
36
3
5
4
4
4
3
1
2
3,25
3,14
24,00
28,00
EU-16
Baia Mare-
Borpatak
(RO)
2004.06.11.
2006.11.08.
50
50
50
50
-
-
-
-
-
-
-
-
-
-
0
0
Baia Mare-
Veresvíz II
(RO)
2004.06.11.
2005.11.15.
2006.11.08.
50
50
50
47
44
43
1
3
2
2
3
5
-
-
-
-
-
-
2,66
2,50
2,71
6
12
14
EU-12
Baia Mare-
Kıbánya
(RO)
2004.06.11.
2006.11.08.
50
50
50
50
-
-
-
-
-
-
-
-
-
-
0
0
Baia Mare-
Felsıtótfalu
(RO)
2004.06.11.
2005.11.15.
2006.11.08.
20
20
20
18
18
18
1
-
-
1
2
1
-
-
1
-
-
-
2,50
3,00
3,50
4
4
4
EU-12
Tautii-
Magherau
(RO)
2004.06.11.
2005.11.15.
2006.11.08.
50
50
50
40
38
35
3
4
4
5
6
7
2
2
3
-
-
1
2,90
2,83
3,07
20
24
30
EU-12
Ukrainian
test sites
2004.11.02.
2006.10.23.
-
-
-
-
-
-
-
-
-
-
-
-
0
0
Duchonka
(SK)
2006.11.17. 50 42 4 4 - - 2,50 16 EU-2
Remarks of table 1: Infection degree (I degree) 1- healthy tree, 2- suspect symptoms on the trunk and/or
in the crown, 3- 1 canker, 4- more cankers, 5- died tree HU-Hungary, RO-Romania, SK-Slovakia
Laboratory examinations confirmed that Cryphonectria parasitica infected several oak
trees in Hungary (Figure 2) and in Romania (Figure 3). All of the tested isolates were
virulent. According to the results of the laboratory examinations, Romanian oak trees
were infected by the same C. parasitica strain (EU-12) that was detected from chestnut
trees in Baia Mare region. In Hungary, EU-3 fungal strain (from Iharos), EU-16 strain
(from Pogányszentpéter), EU-9 and EU-11 strains (from Bakonya) were identified from
bark samples of infected oaks (Table 1). In 2005, infected oak trees were detected also
in Slovakia, near Duchonka. EU-2 fungal strain was identified from this Slovakian site
(Table 1). Field investigations were done in West-Ukraine near Uzghorod and
Munkacevo in 7 chestnut-oak mixed populations . Although, C. parasitica are on

Vol. 37, 2009, Suppl. Cereal Research Communications
268
chestnut trees in Ukraine, until now, blight infected oak trees have not been found yet in
these Ukrainian regions.
Figure 2. Canker and pycnidia on sessile oaks Figure 3. Blight symptoms on
in Bakonya 16I test site (Hungary) sessile oak in Romania
Conclusions
Blight symptoms were identified on oaks in Hungary, in Romania and in Slovakia. It
was confirmed by laboratory examinations. Until now C. parasitica have not caused so
serious damages on oaks as on European chestnut trees in these countries, but
potentially it could be a more serious parasite for our forests in the future. Summer
drought which occured in 2003 and in 2006 may also have long-term affects for the
forest condition by making the oak trees susceptible to abiotic and biotic stresses
occuring in the growing seasons (Szıllısi et al., 2008).
References
Anagnostakis, S.:1987. Chestnut blight: The classical problem of an introduced pathogen. Mycologia 79: 23-
37.
Bissegger, M. - Heiniger, U.: 1991. Chestnut blight (Cryphonectria parasitica) north of the Swiss Alps.
Forest, Snow and Landscape Research 66 (2):250-252.
Dallavalle, E. - Zambonelli, A.: 1999. Epidemiological role of strains of Cryphonectria parasitica isolated
from hosts other than chestnut. Eur. J. For. Path., 29.: 97-102.
Biraghi, A.: 1946. Il cancro del castagno da Endothia parasitica. Ital. Agric. 7: 406-412.
Donaubauer, E.: 1964. Untersuchungen über den die Variation der Krankheitsanfälligkeit verschiedener
Pappeln. Mitt. FBVA Maria Brunn. 70-120.
Florea, S. - Popa, I.: 1989. Diseases of the edible chestnut reported in the fruit growing area of Baie Mare. In: Cercetarea stiintifica in sluiba productiei pomicole 1969-1989. Bucuresti, Romania 365-372.
Juhasova, G.: 1976. A summary of knowledge on fungal diseases of Spanish chestnut in Slovakia. Forestry
38: 449-460.
Körtvély A.: 1970. A gesztenye endotiás kéregelhalása. (Bark destruction caused by Endothia parasitica (Murr.) Anderson, on chestnut trees). Növényvédelem 6: 38-361
Radócz, L.: 2001. Study of subpopulations of the chestnut blight (Cryphonectria parasitica) fungus in the
Carpathian-basin. For. Snow Landsc. Res. 76(3): 368-372.
Radócz, L. - Holb, I. J.: 2002. Detection of natural infection of Quercus spp. by the chestnut blight fungus
(Cryphonectria parasitica) in Hungary. Int. J. Hort. Sci. 8(2): 54-56.
Szıllısi, E. - Koncz, P. - Kanalas, P. - Veres, Sz. - Mészáros, I.: 2008. Effects of drought on some
ecophysiological traits of sessile oak (Quercus petraea L.). Cereal Research Communications. 36: 295-298.
Torsello, M. - Torsello, M.L. - Davis, D.D. and Nash, B.L.: 1994. Incidence of Cryphonectria parasitica cankers on scarlet oak (Quercus coccinea) in Pennsylvania. Plant Dis. 78: 313-315.

VIII. Alps-Adria Scientific Workshop Neum, Bosnia-Herzegovina, 2009
DOI: 10.1556/CRC.37.2009.Suppl.2 269
STRESS EFFECTS OF EXTENSIVE AND INTENSIVE NUTRIENT SUPPLY ON GRASSLAND COENOSYS
Marietta HARCSA
Department of Grassland Management, Institute of Crop Production Science, Szent István University, H-2103
Gödöllı, Páter K. út 1., e-mail: [email protected]
Abstract: Fertilization is a yield-increasing procedure, but its effects on botanical composition have also been
proven by several experiments. In case of fertilizing, the major yield increasing nutrient is nitrogen, but
phosphorus and potassium are also having a profound influence. Effects of extensive (without nutrient
supply), medium (150 kgha-1) and large dose (300 kgha-1) intensive fertilizers on the botanical combination of
meadows are compared in this study. As a summary it can be concluded, that the level of nutrient supply
modifies grassland composition. Stress caused by the lack of nutrients will not only result in a decrease in the
number of species, but also in the disappearance of valuable grass species from the area. In case of nutrient
supplies, first-rate grassland components are going to remain on the area, but the numbers of other species are
going to decrease in direct proportion due to the effects of the stress caused by the increasing dose of
fertilizers.
Keywords: extensive grassland management, intensive grassland management, nutrient supply, coenosys of
grasslands
Introduction
Fertilization is a yield-increasing procedure, but its effects on botanical composition
have also been proven by several experiments. According to Szemán (2007a), the
number of grass species increases when nitrogen fertilizers are applied, but fertilization
with the same amount of nitrogen each year stabilizes the composition of species.
Applying a minimum of 100-150 kgha-1
N causes a considerable change in the number
of species (Magyar et al. 2005, Tasi 2008). According to Bánszki (1991), nitrogen
fertilizers promote the propagation of Dactylis glomerata L. and Bromus inermis
Leyss., as these species prefer nitrogen. It has also been observed that leguminous
species disappear from grasslands after large doses of nitrogen (100 kgha-1
) are applied
(Bánszki 1991, Szemán 2007a).
Potassium and phosphorous provide favourable conditions for the spreading and
survival of leguminous species (Szemán, 2007a; Vinczeffy ed., 1993; Barcsák, 2004).
Both the lack of fertilizing as well as overdosing may cause stress in the plant
community (Penksza et al. 2008). The degree of stress depends on the type of utilization
and the aim of grassland management. The lack of nutrients, for instance, can not be
considered a stress factor in case the aim of the management is sustaining a natural
habitat (Szemán 2007b; Tasi 2007, Harcsa et al. 2008), and the decrease in the number
of species caused by applying fertilizers in large doses can not be considered a stress
effect on lawns either (Kulin et al. 2008).
As a summary, we can conclude that the level of nutrient supply can modify the
proportions of different grassland components in the grassland composition (Tasi, 2007;
Kulin et al. 2008; Füleky, 2008). According to Bánszki (1991) in case of major changes
in the nutrient level, the type of grasslands can also undergo transformation.
In my article, I compare the effects of extensive (without nutrient supply), and intensive
(150 kgha-1
and 300 kgha-1
fertilizers) grassland management methods on the botanical
composition of natural meadows.

Vol. 37, 2009, Suppl. Cereal Research Communications
270
Materials and methods
In the recent study, analysis of the effects of nutrient supply on natural grasslands in
Kosd, a hilly area, and in Mátra, a mountainous area, in Hungary have been carried out
in five years. Three kinds of treatments were applied at both sites on small plots: a 150
kgha-1
(N1) (with 50 kgha-1
P2O5 and 100 kgha-1
KCl) fertilizer and a 300 kgha-1
(N2)
(with 100 kgha-1
P2O5 and 200 kgha-1
KCl) fertilizer were applied each year, while the
third plot was left untreated as the control area (Ø)(0 kgha-1
N). The size of plots was
4x5 m, in randomised block design. The botanical survey was carried out through
Balázs’s dominancy analysis (1949) at both sites on all plots four replications. The
results presented in this article refer to the changes in cover rates and species’
composition comparing the initial (zero) year to the final year of the experiment.
Results and discussion
In the experiment in Kosd (1. table), throughout the five years of the experiment, a
continuous degradation was experienced on the control plot. Succession processes could
be identified on the natural grassland. The area got weedy because of the stress caused
by the lack of nutrient supplies and treatment. The coverage and diversity of grass
species showed a decreasing tendency.
As a result of fertilizers, the coverage of grass species increased, the number of species
became balanced, but their numbers were less than those in the control area. The
coverage of other plant species were also increasing, but to a smaller extent. The
number of weed species was smaller, than on the control areas. Applying a larger
dosage of fertilizer, the number of plant species decreased considerably.
Table 1. Cover rates and number of species
Kosd, 1998-2002
Treatments Botanical composition
Control N1 N2
1.year 2. year 3. year 4. year 1. y 2. y 3. y 4. y 1.y 2. y 3. y 4. y
Cover rates (%)
Grass species 60 55 34 22 78 68 69 78 81 80 86 90
Legumes 0 0 0 2 0 0 0 0 0 0 0 0
Weeds 22 26 41 38 10 14 18 13 5 6 9 7
Uncovered area 18 19 25 38 12 18 13 9 14 14 5 3
Number of species
Grass species 4 5 5 3 3 4 5 4 2 4 4 2
Legumes 0 0 0 1 0 0 0 0 0 0 0 0
Other 11 11 13 12 8 10 11 8 3 4 6 2
Total 15 16 18 16 11 14 16 12 5 8 10 4

VIII. Alps-Adria Scientific Workshop Neum, Bosnia-Herzegovina, 2009
DOI: 10.1556/CRC.37.2009.Suppl.2 271
0
2
4
6
8
10
12
14
16
18
20
C N1 N2 C N1 N2 C N1 N2 C N1 N2
1. year 2. year 3. year 4. year
Other
Legumes
Grass species
0
5
10
15
20
25
30
35
40
C N1 N2 C N1 N2 C N1 N2 C N1 N2
1.year 2. year 3.year 4. year
Other
Legumes
Grass species
Figure 1. Changes in number of species in Kosd Figure 2. Changes in number of species in Mátra
C- control, N1- 150 kgha-1 , N2- 300 kgha-1
Values of Mátra’s area (2. table) showed similar results, as the grassland in Kosd.
However, at first, in the control areas there was an increase in the cover rates of grass
species; decrease only started in the third year of the experiment. The number of grass
species in the control area was almost constant. The number and cover rate of
leguminous species was also constant. The number and cover rates of weeds fluctuated;
they decreased in the second and third years of the experiment, and showed an
increasing tendency afterwards. This result was presumably caused by the different
climate effects of the different years.
As a result of fertilization, the botanical composition of Mátra’s natural grassland went
through substantial changes. The coverage of grass species was increasing, while the
number of species remained constant. Compared to the Kosd experiment, larger doses
of nitrogen did not cause so large a change in the cover of grass species. As a result of
nutrient supplies, legumes disappeared from the area. The number of dicotyledonous
plant species (“other”) and their coverage also showed a major decrease, compared to
the results of the control plot.
Table 2. Cover rates and number of species
Mátra, 1998-2002
Treatments Cover rates (%)
Control N1 N2
1. year 2. year 3. year 4. year 1. y 2. y 3. y 4. y 1. y 2. y 3.y 4. y
Grass species 26 33 30 28 60 70 72 72 63 75 78 80
Legumes 1 1 1 1 0 0 0 1 0 0 0 0
Weeds 63 52 56 60 36 27 26 26 34 19 18 17
Uncovered area 10 14 13 11 4 3 2 1 3 6 4 3
Number of species
Grass species 8 8 9 9 8 9 9 9 8 9 9 8
Legumes 1 1 1 1 0 0 0 1 0 0 0 0
Other 23 21 24 24 20 16 12 15 17 9 7 9
Total 32 30 34 34 28 25 21 25 25 18 16 17

Vol. 37, 2009, Suppl. Cereal Research Communications
272
Conclusions
From the results it can be concluded that stress caused by the lack of nutrient supplies
and treatment may result in degradation of natural grassland communities. The use of
fertilizers increases the cover ratio of valuable grass species, while undesirable weed
species can be eliminated from meadows. On the other hand, as an effect of the use of
large dose nitrogen fertilizers, the number of species may show a major decrease.
It can be concluded from the results, that leaving natural grasslands without any
treatment leads to degradation because of the stress caused by the lack of nutrients. If
natural grasslands are brought under cultivation, the botanical components of the
meadow can be changed according to the aim of utilization by using the suitable amount
of nutrient supplies. Still, it should always be considered carefully that the use of large
doses of fertilizers results in a major decrease in the number of grassland species.
References
Balázs F.: 1949. A gyepek termésbecslése növényszociológiai felvételek alapján. Budapest. Agrártudomány I.
kötet. 1. szám 109-118.
Bánszki T.:1991. Kisadagú nitrogéntrágyázás hatása pillangósokban gazdag telepített gyepen.
Növénytermesztés 1991. 40. 5.
Barcsák Z.: 2004. Biogyep-gazdálkodás. Biogazda Kiskönyvtár. Mezıgazda Kiadó, Budapest.
Füleky Gy.: 2008. Results of a 30-year-old fertilisation experiment. Acta Agronomica Hungarica. 56: 3. 265-
273.
Harcsa M. - Bajnok M. - Kulin B. - Szemán L. – Prutkay J.: 2008. Effects of ecological soil aptitude on grass
stand planning. Cereal Research Communications. 36: 1931-1934.
Kulin B. - György A. - Prutkay J. - Tóth L. - Zsigó G.: 2008. The effect of soil nutrient content on the mowed
turf. Cereal Research Communications. 36: 879-882.
Magyar I. E. – Szemán L.: 2005. Gyógynövényes gyep botanikai összetételének alakulása a telepítési idı és a
vetımagnorma hatására. Növénytermelés, Tom 54. No. 5-6. 375-386.
Penksza K. - Ádám Sz. - Csontos P. - Vona M. - Malatinszky Á.: 2008. Signs of environmental change as
reflected by soil and vegetation on sandy areas in the Carpatian Basin. Cereal Research Communications.
36: 1063- 1066.
Szemán L.: 2007a. Gyepgazdálkodási módszertan. Egyetemi jegyzet, Gödöllı Szemán L.: 2007b. Environmental consequences of sustainability on grassland. Cereal Research
Communications. 35: 2. 1157-1160.
Tasi J.: 2007. Diverse impacts of nature conservation grassland management. Cereal Research
Communications. 35: 2. 1205-1208.
Tasi J.: 2008. Macroelement, heavy metal and selenium content of grass species and dicotyledons. Cereal
Research Communications. 36: 271- 274.
Vinczeffy I. ed.: 1993. Legelı- és gyepgazdálkodás. Mezıgazda Kiadó, Budapest 19-35.

VIII. Alps-Adria Scientific Workshop Neum, Bosnia-Herzegovina, 2009
DOI: 10.1556/CRC.37.2009.Suppl.2 273
THE EFFECT OF THE DROUGHT STRESS ON THE PLANTING OF MISCANTHUS SINENSIS
Attila PERCZE1 – Barnabás PÓSA1 – Mahesh Kumar SINGH2
1 Institute of Crop Production, Szent István University, 2100 Gödöllı, Páter K u. 1. e-mail:
[email protected] 2 Institute of Economics, Szent István University
Abstract: The increase of the greenhouse gases caused by the change of climate, the rising environmental
pollution and the limited sources of fossil fuels make the word’s countries cooperate and use renewable
energy sources in a wilder field. Hungary is eager to meet the criteria in the Kyoto protocol. The usage of
biomass energy has the greatest potential in Hungary.
According to these requirements plant production for energy purposes has been stressed lately. The
Miscanthus is a kind of perennial grass containing a great amount of energy, which could be the most relevant
plant for producing biomass in Hungary. The major cost in growing Miscanthus is planting. In our experiment
the effect of soil moisture on the rhizome and plant propagated Miscanthus has been investigated under
different planting times.
Keywords: biomass energy, energy cane, rhizome, nurseling, drought stress
Introduction
The increase of the amount of greenhouse gases that cause the change of climate, the
rising environmental pollution and the limited sources of fossil fuels make the World’s
countries cooperate and use renewable energy sources in a wilder field (Reijnders 2006,
Dobó et al. 2007). The increasing of the CO2 level of the air, and the average
temperature, together with the more and more frequent occurrence of weather anomalies
means a cumulative stress effect to the living being of the World, also to the human
population. (NÉS). The agro-policy of the EU emphasises on the increase of usage of
renewing energy sources. Bio energy offers sustainable resource to minimize current
environmental, economical and social draw backs of fossil fuel (Percze et al. 2007). The
huge energy import dependence and the big rate of fossil energy sources in energy
production, that is more than 80% nowadays makes the situation of Hungary worse.
(Gockler 1996, Csoknyai 2007), the rate of renewing energy sources is only 3-4%
(Sulyok et al.2007, Csoknyai 2007), that sounds very low. The usage of biomass energy
has the greatest potential in Hungary to change the usage rate of renewing energy
sources (Csoknyai, 2007). According to this requirement plant production for energy
purposes has been stressed lately. The Miscanthus is a kind of perennial grass
containing a great amount of energy, which could be the most relevant plant for
producing biomass in Hungary.
Materials and methods
It is a condition of the economical energy production from biomass to harvest the
biggest amount of energy from point area. In the case of energy cane it can be expected
from a 3 years old, well set plantation. The yield in this case is 10-20 tons per hectare if
it is not irrigated. The yield is in important connection with the fallen moisture, on a
field where the yearly amount of precipitation is less than 500 mm the cultivation is
risky. The planting of the Mischantus should be done with rhizome and transplants, but

Vol. 37, 2009, Suppl. Cereal Research Communications
274
the last one is hard to purchase. This is why the propagation happens with rhizome. But
after the spring planting the emergence is usually not equal, and the ten thousand
emergence plants per hectare is also not typical. According to our experience, the
nurseling 3 months after planting was 75-85% depending on the quality of the rhizome
material. To achieve the expected plant number, a posterior planting is needed. In our
experiment we examined the plant replacement with rhizomes and transplants.
The date of the first planting was 2008. May 17th
, the second, provocation planting was
on 2008. June 24th
, this one is the model of the posterior planting. We planted 20 plants
in each plot. After this we examined the nurseling two times, on July, 22nd
, and on
August, 13th, by counting the living plants.
We measured the percentage of soil moisture five times (05.17., 06.11., 07.02., 07.22.,
08.13.) with a PT-1 type hand instrument. We examined the activity of the lateral
(axillar) buds of the Miscanthus in laboratory in a year period, on samples collected
every three weeks. Part of the results of the exams can be seen on figure 2.
The small and big plot examinations were set near Felsıpetény, in Nográd county. The
water management of the soil is average, it is clayey brown forest soil. KA: 43, humus
content is 1.5-1.9 %.
Results and discussion
We did the crop counting (nurseling) three times after the plantings. The results are on
the Table 1. After the favourable Spring planting, more than 50% of the rhizomes are
burgeoned in the small plot examination. Whilst we experienced that in the model
plantation (06.24.) that modelled the posterior planting no plants were burgeoned from
the 20 rhizomes. But the transplants that were planted in the second plantation were
alive despite of the drought. The nurseling varied between 58-77% (Table 1)
Table 1. Results of nurseling examination of Miscanthus sinensis (Felsıpetény, 2008)
Rhizome (%) Nurseling (%) Date (crop
counting) 05.17 06.24 06.24
2008.06.11 51 0
2008.07.22 51 0 77
2008.08.13 53 0 58
Lot of researcher determined that the activity of the rhizomes show seasonality.
(Lukács-Hunyadi 1998, Lukács 2002). From the activity examination of the lateral buds
of Miscanthus it was revealed that the activity of the buds is rising in June (Figure 1) so
these were able to grow shoots. The late planted rhizomes did not push out, but because
of other issues. According to the weather data of Felsıpetény, after the second planting
there was a small amount of precipitation (22mm) within 3 weeks, but the temperature
of the air was 30 C during the days (gray cells in Table 2). The soil moisture was very
favourable at the time of the first planting, but this changed until the second planting.
(19,55 M%)(Tab 3.) that made hard the watering of the rhizomes and their buds.

VIII. Alps-Adria Scientific Workshop Neum, Bosnia-Herzegovina, 2009
DOI: 10.1556/CRC.37.2009.Suppl.2 275
0
5
10
15
20
25
30
35
07.17 07.21 07.24 07.28 07.31 08.04 08.07
aver
age s
hoot
long (m
m)
Figure 1. Length of shoots grown on axillar buds of rhizome segments, 2008.07.17.
According to the examinations of Hunyadi (1993) of the Agropyron repens the runners
(that are similar to the rhizome in construction) are die after they lose 36% of their
moisture content. This amount of moisture loss can decrease the capacity of living of
the rhizomes. A heavy amount of the rooted transplants is also died, but 60% of them
remained alive.
Table 2. Weather data (Felsıpetény Weather Bureau, 2008)
May Total
Calendar week
18.week 19.week 20.week 21.week 22.week
Moisture (mm/week) 0 3 8 18 29 58
Average
Temperature (14:00) [0C] 20.86 21.43 26.43 23.14 30 24.372
June Total
Calendar week
23.week 24.week 25.week 26.week
Moisture (mm/week) 28 16 11 12 67
Average
Temperature (14:00) [0C] 24.86 26.27 29 31 27.7825
July Total
Calendar week
27.week 28week 29.week 30.week 31.week
Moisture (mm/week) 10 12 31 72 0 125
Average
Temperature (14:00) [0C] 28.29 30.43 25 24.71 31.71 28.028

Vol. 37, 2009, Suppl. Cereal Research Communications
276
Table 3. Moisture content in the upper 20 cm layer of the soil, Felsıpetény, 2008
Average soil moisture content (m/m%) Depth of
soil 05.17 06.11 07.02 07.22 08.13 0-10 24,43 24,37 18,2 23,77 23,53
10-20 34,23 26,63 20,9 25,83 26,13
0-20 29,33 25,5 19,55 24,84 24,83
Conclusions
From the examinations we can conclude that the posterior planting to supplant the
energy cane the use of rhizome is very risky in case of dry and not irrigated field. So for
the summer supplanting rooted transplants are advised.
Acknowledgements
This research was supported an financed by NKTH and BIOWATT Consortium
References
Csoknyainé: 2007. Megújuló energiaforrásokra alapozott energiaellátás növelése a fenntartható fejlıdés
érdekében. Geotermikus energia hasznosításának lehetıségei. Konf. Ea., Szeged 2007. 11. 12.
Dobó E. - Singh M.K - Szőcs I.: 2007. Global enviromental change solutions from biomass, bioenergy and
biomaterials: global overwiev for sustainable development. Cereal Research Communications, Vol.35.
Issue 2. 349-352.
Gockler L.: 1996. Economic issues of energy forest wood chips production. Mezıgazdasági Technika,
January, 24-26.
Hunyadi K. 1993: Jelentısebb szántóföldi egyéves és évelı gyomnövények biológiája. Akadémiai doktori
értekezés, Keszthely.
Lukács D. és Hunyadi K. (1998): A nád szaporodásbiológiai vizsgálata. Növényvédelem, 34 (1): 11-14.
Lukács D. 2002: A nád (Phragmites australis (Cav.) Trin. ex Steudel) szántóföldi ökotípusának biológiája és
a védekezés lehetıségei. Doktori (PhD) értekezés. Keszthely.
Percze A. - Singh M.K. – Szőcs I.: 2007. Environmental and ecological sustainability of biomass energy
production in Europe. Cereal Research Communications, Vol.35. Issue 2. 921-924.
Reijnders L.: 2006. Conditions for the sustainability of biomass based fuel use. Energy Policy 34. 863-876.
Sulyok D – M.egyes A. – Rátonyi T. – Nagy J. 2007. Establishment of short rotation energy plantations as an
alternative possibility in less favoured areas. Cereal Research Communications, Vol.35. Issue 2. 1109-
1112

VIII. Alps-Adria Scientific Workshop Neum, Bosnia-Herzegovina, 2009
DOI: 10.1556/CRC.37.2009.Suppl.2 277
EFFICIENCY OF DIFFERENT LABORATORY METHODS FOR SELECTION OF DROUGHT TOLERANT BARLEY GENOTYPES
Pavlína MIKULKOVÁ 1 – Ludmila HOLKOVÁ 1 – Monika HRONKOVÁ 2 – Marek
KLEMŠ 3 – Marta BRADÁČOVÁ 1 1 Department of Crop Science, Breeding and Plant Medicin
,, Fakulty of Agronomy, Mendel University of
Agriculture and Foresty in Brno, Zemedělská 1, 613 00 Brno, Czech Reublic, e-mail: [email protected] 2 Department of Plant Physiology, Faculty of Science, University of South Bohemia 3 Department of Plant Biology, Faculty of Agronomy, Mendel University of Agriculture and Foresty in Brno
Abstract:. Drought tolerance is a complex phenotypic trait that involves multiple physiological mechanisms
that result of the expression of several protective genes and QTLs. We tried to compare reactions of five
different barley genotypes exposed to drought stress with values of some physiological and molecular
biological parameters that could describe different strategies of these genotypes for overcoming drought
stress. Samples for evaluation of C13 isotope, endogenous ABA content and transcription activity of two
dehydrine genes were collected during two weeks of drought conditions.
A relation between level of drought sensitivity and gene expressions of two dehydrine genes were observed.
Higher expression level of tested Dhn genes was detected in two more tolerant genotypes. Comparison of the
results from all analyses enabled us described different drought adaptation mechanisms in cv. Tadmor and
Malz.
Keywords: Drought tolerance, Dhn genes, ABA , barley, carbon isotope discrimination
Introduction
The adaptation of plants to stress conditions is a very complex trait and it is influenced
by many physiological and biochemical processes. The progress of breeding for drought
tolerance depends on effectiveness of selection, which could be based on the evaluation
of several these processes together, because the well adapted genotypes demonstrate
more drought related mechanisms on different levels simultaneously (Cattivelli et
al.2008). Important physiological parameters are connected with the water use
efficiency, transpiration and photosynthesis. These factors can be indirectly evaluated
by the carbon isotope discrimination. During photosynthesis plants discriminate against
the heavy isotope of carbon (13
C) and the ratio is associated with transpiration efficiency
and stomatal conductance (Farquhar and Richards, 1984). Other biochemical parameters
are determined by ABA sensitivity and osmotic adjustment. ABA controls transpiration
water loss by promoting stomatal closure and induces activation of the many stress
activated genes (refer to Cattivelli et al. 2008) and it is often studied in relation with the
rates of the photosynthesis and the transpiration (Stuchlíková et al. 2007). On molecular
biological level, the activity of stress related genes and their transcript factors can be
used for selection. The faster activation and higher level of expression is often
connected with higher tolerance to abiotic stresses. In barley, expression of dehydrine
genes Dhn1 and Dhn6 have been used for prediction of sensitivity level (Surprunova et
al., 2004).
The our work was aimed at the evaluation of the stress response of five barley cultivars
with different level of drought tolerance. For evaluation, several physiological and
molecular biological methods were applied with the purpose to cover more adaptation
mechanisms simultaneously.

Vol. 37, 2009, Suppl. Cereal Research Communications
278
Materials and methods
Five barley cutivars were selected for evaluation of drought sensitivity: Tadmor
H.vulgare, spp. spontaneum, (TAD) from Syria, well drought adapted genotype, Czech
spring cultivars Amulet (AMU), Bojos (BOJ) and Malz (MAL) and spring cultivar from
Netherlands Jersey (JER) (Hordeum vulgare). The plants were grown in hydroponics in MS (Murashige and Skoog, 1962) medium.
Two-week old seedlings were transferred into MS with PEG (0.3 MPa) to simulate
drought conditions. The control plants were all-time cultivated in MS medium. Light
and temperature were controlled (light 12/12 hours (day/night), 18/16 °C and after 14
days 20/18 °C). After 3, 6, 12 and 24 hours and then after 4, 7 and 14 days of cultivation
in PEG, samples of yang leaves were collected for all planned analyses.
Total RNA was extracted from 50 mg of leaf tissue using Ambion RNAqueousTM
Kit
and purificated by Turbo DNA freeTM
(Ambion). First-strand cDNA was prepared from
500 ng of total RNA using QuantiTect® Reverse Transcription Kit (Qiagen).
Gene quantification was performed using Real time PCR (QuantiTect SYBR Green
PCR Kit, Qiagen). Reaction conditions of Dhn1 genes were the same as in Surprunova
et al. (2004) In case of Dhn4, the new primers were designed (5'aagtgtaccggccaaaagaa
3',
5'gtccctcatgggctggtaat
3') and reaction conditions were modificated: 2 min 50ºC, 15 min
95ºC, 40 x (15 s 94ºC, 30 s 56ºC, 30 s 72ºC).
Transcription activity was evaluated as normalised relative expression calculated with
real-time PCR efficiency correlation according to method of Pfaffl (2001).The changes
in the activity of both genes normalised to α-tubulin and relative to the expression at
optimal growth conditions (25°C) was calculated for each sample.
Radioimmunological assay (RIA) of ABA endogenous level was done according
Quarrie et al. (1988). 200 mg of leave tissues were collected and 50 µl of water extract
were analysed.
Leaf samples (the youngest leaves, 150mg) were ground to a fine powder and composite
samples from three replicates was used for carbon isotope composition according
(Farquhar et al. 1989).
All analyses were done in triplicate and each value are characterised by means and
standard deviation +/-SD.
Results and discussion
Tadmor (5.2% loss of water), Malz (7.4%), Amulet (22.5%), Bojos (30.3%) The tested
cultivars could be sized according its water loss from leaves tissue during 14 days in
drought conditions and the most sensitive Jersey (37%).
During the experiment the activity of two Dhn genes was evaluated, one of them (Dhn4)
is known as ABA regulated and the second one (Dhn1) is not (Fig. 1). High expression
of both genes was detected in both tolerant cultivars, but their responses varied in
timing, Malz reached the maximum activity after 7 days and Tadmor after 14 days.
Faster activation of the Dhn genes in more sensitive barley cultivars was reported by
Surprunová at al, (2004), but in case of our experiment Tadmor probably used different
defence mechanisms, particularly in the earliest stages of stress induction. This
suggestion corresponded with much lower level of endogenous ABA in Tadmor

VIII. Alps-Adria Scientific Workshop Neum, Bosnia-Herzegovina, 2009
DOI: 10.1556/CRC.37.2009.Suppl.2 279
compared with Malz (Fig. 2). In Malz, the high level of endogenous ABA was detected
after 7 and 14 days of stress, together with high expression of Dhn genes. ABA level in
Tadmor was 8 times lower than in Malz, but he expression of Dhn genes was only 3
times lower. Those findings confirm the fact, that due to its origin, cv. Tadmor is well
adapted to arid conditions (Teulet et al. 2002).
Figure 1. Evaluation of normalised relative expression (RE) Dhn1 and Dhn4 expression in drought condition
(PEG -0.3 MPa).
The ABA level was increasing during experiment in all tested cultivars and the highest
concentration was detected in Malz, this fact corresponded with expressed level of
drought tolerance of this cultivar, measured by other approaches.
0
200
400
600
800
TAD MAL AMU BOJ JER
ng
.g-1
FM
6 h 12 h 24 h 4d 7d 14d
Figure 2. Evaluation of ABA endogenous level in five barley cultivars during drought stress conditions
Water use efficiency (WUE) was the next parameter for the estimation of stress
tolerance. WUE was expressed as carbon isotope discrimination, the negative
correlation between WUE and isotope discrimination was studied in many plant species,
e.g. cereals (Hafsi et al. 2007). Lower ∆13C values were associated with higher WUE. In
favourable conditions the increasing of ∆13C was connected with higher production of
green mass and consequently higher yield (Condon et al, 2004)
15
17
19
21
23
25
27
TAD MAL AMU BOJ JER
∆13 C
(‰
) 12h
24h
4d
7d
14d
Figure 3. Comparison of carbon izotope discrimination (∆13C) in different barley cultivars Tadmor (TAD),
Malz (MAL), Amulet (AMU), Bojos (BOJ) and Jersey (JER) affected by osmotic stress during two week
stress conditions.
Cv. Tadmor seemed to have the highest WUE in comparison to others and together with
Amulet improved the WUE during the time of stress induction. According to WUE, cv.
RE Dhn1
0
500
1000
1500
2000
2500
TAD MAL AMU BOJ JER
RE
6h
12h
24h
4d
7d
14d
RE Dhn4
0
100
200
300
400
500
600
700
TAD MAL AMU BOJ JER
RE
6h
12h
24h
4d
7d
14d

Vol. 37, 2009, Suppl. Cereal Research Communications
280
Jersey proved as the most sensitive to stress. The Malz reached the highest values ∆13C
in control optimal conditions (data not shown) and at the beginning of drought stress
action. But during prolonged drought condition, also Malz can improve the WUE (better
then Jersey, similarly as Bojos but not so well as Amulet or Tadmor).
Conclusions
All tested methods were applicable for evaluation of stress sensitivity induced in our
experiments. We were able to distinguish tested cultivars according their expressed
sensitivity. The most sensitive cultivar was Jersey (ABA low level, low activity of both
Dhn genes, the lowest level of WUE), the sensitivity of Amulet and Bojos were
comparable but in some parameters (activity of Dhn1 and WUE) Amulet was better then
Bojos. This fact corresponded with lower level of leave tissue desiccation during this
experiment. The highest tolerance was found in cv. Malz and Tadmor. However, these
two cultivars differed significantly in defence mechanisms against stress, Tadmor showed very low accumulation of ABA and the activations of gene expression in stress
conditions were delayed in comparison to Malz, which reacted very intensively on stress
(high levels of ABA and earlier activation of Dhn genes). Is it possible, that Tadmor adopts some other defence strategies (mainly in the first stage of stress), but the
productivity of this cultivar selected from a Syrian landrace is much worse than that of
modern high yielding cultivars as Malz, particularly in a favourable environment.
Acknowledgements
This work was supported by the Grant of the Czech Ministry of Education, Youth and
Sports, RC 1M0570 and by the Czech Ministry of Agriculture, project NAZV QH91192
References
Cattivelli, L. - Rizza, F. - Badeck, F.W. - Mazzucotelli, E. - Mastrangelo, A.M. - Francia, E. - Mare C., -
Tondelli, A. - Stanca, A.M.: 2008. Drought tolerance improvement in crop plants: an integrated view
from breeding to genomics. Field Crop Res. 105: 1-14.
Condon, A.G. - Richards, R.A. - Rebetzke, G.J. and Farquhar, G.D.: 2004. Breeding for high water-use
efficiency. J. Exp. Bot. 55: 2447-2460.
Farquhar, G.D. - Ehleringer, J.R. - Hubick, K.T.: 1989. Carbon isotope discrimination and photosynthesis.
Annu. Rev. Plant Physiol. Plant Mol. Biol. 40: 503–537. Hafsi, M. - Akhter, J. - Monneveux, P.: 2007. Leaf Senescence and Carbon Isotope Discrimination in Durum
Wheat (Triticum durum Desf.) under Severe Drought Conditions. Cereal Res. Commun. 35:1. 71–80 Murashige, T. - Skoog, F.: 1962. A revised medium for rapid growth and bioassays with tobacco tissue
cultures. Physiol Plant 15: 473–497.
Pfaffl, M.: 2001. A new mathematical model for relative quantification in real-time RT-PCR. Nucleic Acids
Res. 29 (9): e45.
Quarrie, S.A. - Whitford, P.N. - Appleford, N.E.J. - Wang, T.L. - Cook, S.K. - Henson, L.E. - Loveys, B.R.:
1988. A monoclonal antibody to (s)-abscisic acid: its characterization and use in a radioimmunoassay for
measuring abscisic acid in crude extracts of cereal and lupin leaves. Planta 183: 330-339.
Stuchlíková, K. - Hejnák, V. - Šafránková, I.: 2007. The Effect of Abscisic Acid and Benzylaminopurine on
Photosynthesis and Transpiration Rates of Maize (Zea mays L.) under Water Stress and Subsequent
Rehydration. Cereal Res. Commun. 35: 4. 1593–1602. Surprunova, T. - Krugman, T. - Fahima, T. - Chen, G. - Shams, I. - Korol, A. and Nevo, E.: 2004. Differential
expression of dehydrin genes in wild barley, Hordeum spontaneum, associated with resistance to water
deficit. Plant, Cell Environ. 27: 1297–1308.
Teulat, B. - Merah, O. - Sirault, X. - Borries, C. - Waugh, R. and This, D.: 2002. QTLs for grain carbon
isotope discrimination in field-grown barley. Theor. Appl. Genet. 106: 118–126.

VIII. Alps-Adria Scientific Workshop Neum, Bosnia-Herzegovina, 2009
DOI: 10.1556/CRC.37.2009.Suppl.2 281
SELECTION TO ADAPTABILITY OF ADVANCED WHEAT LINES IN MULTI-LOCATION TRIALS
Péter FÓNAD – Andrea CSUKÁS
Cereal Research Non-profit Ltd. Co., Szeged, Alsókikötı sor 9. H-6726, Hungary, www. gabonakutato.hu,
e-mail: [email protected]
Abstract: Many agronomical features of winter wheat have molecular markers which may accelerate the
selection process significantly. However, the stability of yield or rheological parameters as polygenic
attributes cannot be approached simply by the MAS (marker assisted selection) technique. The use of multi-
location trials is a more practicable way and provides the first possibility to describe the adaptability of the
advanced lines after their 6-8-year-long breeding procedures. In 2008, 57 wheat lines were tested in an
experimental network at nine growing locations representatively. The abiotic and biotic stress factors like
drought, nutrient deficiency, soil acidity or pathogen pressure affecting heavily these important agronomic
parameters were different over locations. Yield, TKW (thousand kernel weight) were weighed, and wet
gluten, protein content and hardness index of seed samples from each location were measured by NIR (near-
infrared) method on intact seeds. The data were evaluated by different statistical methods. Variance analyses,
mainly the dispersion along the series of the location were an effective way to characterize the adaptability of
wheat lines. Cluster analysis was efficient to identify the similarity of flexible lines or similar locations,
respectively. The statistical quantity of the locations and their diverse growing conditions allowed to measure
and predict the yielding stability of each wheat line related to their tolerance to different stress factors. The
main goal of the rough quantity screening was similar and could make easy to identify genotypes with
fluctuating parameters. This experimental network decisively contributed to register seven new candidate
genotypes in the Hungarian state variety experiments in 2008.
Keywords: field trial, adaptation
Introduction
The key of the high adaptability of GK (GabonaKutató Non-profit Kft = Cereal Research Non-profit Co.Ltd.) winter wheat varieties resides in screening them in a type
of multi-location experiment fitted to our breeding system. Year by year, wheat
genotypes are tested for yield potential, seed quality and tolerance to abiotic and biotic
stresses. On the different growing areas the experiments are performed by the same
method. The experimental locations cover a lot of ecological diversity to make us able
to exclude downsides (e.g. low frost tolerance or lodging tendency), or conversely, to
select for favourable parameters (e.g. drought tolerance, stem strength, high adaptability
to different growing conditions). By the help of this multi-location system, we can trace
the physiological responses of potential candidates given to different growing
conditions before their registration. This knowledge is indispensable to produce and
maintain the genetic base of the wheat varieties together with introducing them into the
market.
Materials and methods
At the F6-F8 population, multi-location yield tests were set up for testing the adaptability
of advanced wheat lines. In 2008, the trials were executed in 11 locations under
different conditions (diverse soil types, altitude, precipitation, lowest temperature in
winter, high and low inputs, sowing time). At each location, 56 winter wheat and one
durum wheat genotypes were tested together with three early, three medium and two
late ripening check varieties. The experimental design was randomized Latin square

Vol. 37, 2009, Suppl. Cereal Research Communications
282
block with four repetitions. The size of the plots was 6.5 m2. The yield harvested from
each plot was weighed and the TKM (thousand kernel mass) was calculated.
Some of the most important quality parameters of the samples from each location like
gluten and protein contents, hardness index were determined by Mininfra 2000T tester
running with NIR (near-infrared) technique on intact seeds.
To evaluate of the yield and quality data, different statistical methods were carried out
like one factor variance analysis and correlation analysis, classification and clustering.
Results and discussion
The mean yield values dispersed between 3.53 and 4.62 t/ha. There was significant
correlation among certain yield series along locations (e.g. Enying/Mezıkövesd,
Öthalom/Fülöpszállás). Conversely, other pairs of yield series did not show any
significant correlation (e.g. Enying/Szeged, Enying/Kiszombor, Kocs/Lippó) (Table 1).
Table 1. Correlation between the yield (Y) gluten content (G) and TKM (T) series. *P=5%, **P=1%,
***P=0,1%, ‘-‘ no significant correlation, n.d. no data.
Location
Y G T Y G T Y G T Y G T Y G T Y G T Y G T Y G T Y G T Y G T
Törökszentmiklós - *** ***
Kocs ** *** *** *** *** ***
Lippó - *** *** ** *** *** - *** ***
Mezıkövesd *** *** *** ** *** *** *** *** *** - *** ***
Dicháza - *** *** ** *** *** ** *** *** ** *** *** - *** ***
Öthalom *** *** *** *** *** *** *** *** *** *** *** *** *** *** *** ** *** **
Fülöpszállás *** *** *** - - *** * - *** - ** *** *** ** ** - ** *** *** *** ***
Kiszombor - *** *** *** - *** ** - *** *** ** *** - ** *** *** ** *** *** *** *** - *** **
Szeged - n.d. n.d. ** n.d. n.d. *** n.d. n.d. ***n.d. n.d. - n.d. n.d. *** n.d. n.d. * n.d. n.d. - n.d. n.d. ***n.d. n.d.
Táplán - * n.d. *** *** n.d. * ***n.d. * *** n.d. ** *** n.d. - *** n.d. * * n.d. - - n.d. ** - n.d. ** n.d. n.d.
Enying Töröksz Kocs Lippó Mezıköv. Dicháza Öthalom Fülöpsz. Kiszombor Szeged
As regards TKM, either pair of locations showed close significant correlation. This
finding demonstrates the determining role of fluctuating rates of other yield components
(head/m2
and seeds/head) among local yield anomalies. The results verified the
genotype-specific character of TKM strongly determined genetically with good
heritability. The close correlation was also connected with the loss of severe rust
epidemic affecting heavily the TKW.
The hardness index is a genotype-specific agronomic feature, similarly to TKW. There
was significant correlation between the locations in each case. The lowest HI values
were in Dicháza but, generally, the values were not below the hardness category limit.
As regards gluten content data, there were no significant correlations between certain
locations (Tab. 1.). Apparently, the sensitive and tolerant genotypes could be diverged
by the help of these „indicator” locations (Fülöpszállás, Kiszombor). The genotypes
responded in different ways to the nutrient supply and stresses specific to the growing
environments. (Fig. 2.)
The genotypes 22, 44 and 46 having variable gluten content showed significant gluten
loss in the experiment at Fülöpszállás (Fig. 1b). Conversely, the 23, 50 and 70
genotypes proved to be stable for this trait (Fig. 1a).

VIII. Alps-Adria Scientific Workshop Neum, Bosnia-Herzegovina, 2009
DOI: 10.1556/CRC.37.2009.Suppl.2 283
Similar establishment can apply to the results of protein content.
a)
10
15
20
25
30
35
Fülö
psz.
Táplá
nsz.
Kocs
Öth
alom
Enyin
g
Kiszo
mbor
Mezık
.
Török
sz.
Dic
háza
Lippó
Mea
n
Glu
ten
co
nte
nt,
%
23 50 70
b)
10
15
20
25
30
35
Fülöps
z.
Táplá
nsz.
Kocs
Öth
alom
Enyin
g
Kiszo
mbor
Mezık
.
Török
sz.
Dic
háza
Lip
pó
Mea
n
Glu
ten
co
nte
nt,
%
22 44 46
Figure 1. Pattern of the gluten content at more (a) and less stable (b) wheat genotypes.
16
3 20
21
17
8 9 7 12
2 5 6 11
10
Kalá
sz
60
62
71
Magdalé
na
32
34
42
63
64
Gara
boly
15
31
Holló
46
22
23
50
44
70
0
5
10
15
20
25
30
35
40
45
Entry
Dis
tance
Figure 2. Classification of the pre-selected wheat genotypes with higher gluten content than the mean of
experiment. The cluster was made with complete linkage (farthest neighbour) method, on the basis of gluten
content data
Interestingly, significant negative correlation presented between the means of the gluten
content and their standardized variances (r=-0,31**), between the TKW means and their
standardized variances (r=-0,35**). The closest negative correlation was found between
the hardness index values and their variances (r=-0,74***) (Fig. 3.) There was also
negative but not significant correlation in the cases of the yield and protein content data.
The most important result of our work is the developed variety itself. Year by year, the
multi-location trial is the basis of the development of our new winter wheat and winter
durum wheat varieties. The high-yielding, good quality GK wheat lines with wide
resistance spectrum and outstanding adaptability are generally applied for registration.
In 2008, six new winter wheat and one durum wheat candidate were registered and their
testing started in the state experiments. Simultaneously, their variety maintenance and
seed multiplication began.
Conclusions The results certified that local abiotic stresses may have strong effect indirectly on
certain yield components like head/m2, seeds/head and some quality features like gluten
and protein content. Our experiences suggest that the parameters like hardness index
and TKW were more considerably determined by the cultivar itself than by the diverse
local abiotic factors. The consequence in connection with the agronomical values and
their stability can be useful in breeding. Probably, the positive selection to certain

Vol. 37, 2009, Suppl. Cereal Research Communications
284
agronomical features (TKW, gluten, hardness index), simultaneously, will be positive
selection to their stability. However, it is necessary to execute further trials of several
years to test a wider range of quality and resistance parameters to verify and extend
these observations on the adaptability of wheat.
The enlargement of this experimental information is also crucial in order to substantiate
the agronomic recommendations attached to the marketed GK (Szeged-bred) wheat
varieties and the recommended variety list itself.
y=2362-25,42x
0
500
1000
1500
2000
2500
3000
40 50 60 70 80 90 100
Hardness index
Sta
nd
ard
ized
vari
an
ce
y=271,5-5x
0
50
100
150
200
250
30 35 40 45 50
TKM
Sta
nd
ard
ized
vari
an
ce
Figure 3. Connection between the hardness index values and their variances (above), TKM values and their
variances (below), respectively.
Acknowledgements
This work was funded by the German-Hungarian Research NAP OMFB-00516/2007
Consortium and the Jedlik Ányos project DTR_2007.
References
János Matuz – László Cseuz – Péter Fónad – János Pauk: 2008. Wheat breeding for drought resistance by
novel field selection methods. VII. Alps-Adria Scientific Workshop, Stara Lesna, Slovakia. Cereal
Research Communication Suppl. 123-126.
Péter Fónad – Erika Ács – László Cseuz – Lajos Bóna – János Matuz: 2008. Effects of harvest time on the
quality components of winter wheat. VII. Alps-Adria Scientific Workshop, Stara Lesna, Slovakia. Cereal
Research Communication Suppl. 127-130.
László Cseuz – János Matuz – Erika Ács – Péter Fónad – János Falusi: 2008. Changes in bread-making
quality of Szeged wheat cultivars due to the differences in location and year effects. VII. Alps-Adria
Scientific Workshop, Stara Lesna, Slovakia. Cereal Research Communication Suppl. 131-134.

VIII. Alps-Adria Scientific Workshop Neum, Bosnia-Herzegovina, 2009
DOI: 10.1556/CRC.37.2009.Suppl.2 285
THE EFFECT OF SERIOUS DROUGHT STRESS ON WEED DYNAMICS OF DIFFERENTLY MANAGED LOESS GRASSLANDS
Szilárd CZÓBEL1 – Orsolya SZIRMAI
2
1 Institute of Botany & Ecophysiology, Faculty of Agriculture & Environmental Sciences, Szent István
University, H-2103 Gödöllı, Páter K. st. 1. HUNGARY, e-mail: [email protected] 2 Plant Ecological Research Group, Hungarian Academy of Sciences & Szent István University
Abstract: To examine how water addition, fertilization and different abiotic stress factors can affect the
species, especially weed composition and structure of a Central European loess grassland community, ex situ
and in situ grassland plots were irrigated and fertilized for three consecutive years, including an extremely dry
year (2003). During the studied period not only serious drought stress occured but other abiotic stress (e.g.
heat) factors also influenced the species and weed composition. The treatments consisted of spray irrigation in
the growing season at ex situ plots, while a compound mineral fertilizer was applied once a year at in situ
plots. In addition aboveground biomass was removed twice per year. Interannual and intraannual dynamics of
species richness, percentage cover, and different plant functional groups in treated and untreated permanent
plots, were studied simultaneously. The majority of the examined parameters varied considerably among years
at both treatments and their controls. At the treated plots, in general species richness, the number of plant life
forms and social behaviour types, the ratio of dicots and C4 plants declined with addition of water and
extensive fertilization. The ratio and number of disturbance tolerants, weeds and alien competitors declined
due to the affect of water addition and compared to control stand. Fertilization created gaps in the treated
plots, thus the number and ratio of weeds increased at the beginning.
Keywords: drought stress, weed dynamics, fertilization, irrigation, managed grasslands
Introduction
Weeds are part of different ecosystems and can invade both managed and natural
ecosystems. Any change in their species number and density provide an early sign of
degradation processes, thus weed monitoring can be used to characterize terrestris
vegetation. Grassland ecosystems in the Carpathian Basin may be particularly
vulnerable to current and predicted changes in precipitation and nutrient supply, and
ecosystem responses to potential effects of water and fertilizers are not well understood
(Czóbel et al. 2009). However, relatively little research has focused on understanding
how ecosystems respond to changes in precipitation regimes (Weltzin et al. 2003). The
temporal changes of Pannonian natural grassland and wetland communities on species
composition have been well studied from both ecological and ecophysiological point of
view (Nagy et al. 2007, Szerdahelyi & Nagy 2007, Tuba 2005, Tuba et al. 1996). But
little is known about how change in source availibility and abiotic stress parallel may
influence weed cover and richness in temperate natural grasslands. Irrigation (and other
resource manipulations) resulted to increased invasibility of the grassland community,
and resource enrichment generally increased diversity and productivity, these responses
were contingent upon species availability and tended to be more pronounced in the
presence of an expanded propagule pool (Kirchner 1977, Foster & Timothy 2004). To
examine how water addition, fertilization and abiotic stress factors can affect the
species, especially weed composition and structure of a Central European loess
grassland community, ex situ and in situ grassland plots were irrigated and fertilized for
three consecutive years, including an extremely dry year (2003). During the studied

Vol. 37, 2009, Suppl. Cereal Research Communications
286
period not only serious drought stress occured but other abiotic stress (e.g. heat in 2003,
flood in 2004) factors also influenced the species and weed composition.
Materials and methods
Study sites and experimental plots The in situ investigation was partly carried out on a tall-grass loess steppe near Isaszeg
(47o42’N, 19
o24’E, 255 m a.s.l.). Plots (1m x 1m) were selected along two tansects (5
fertilized, 5 control). Fertilizer was applied once a year in early summer in 2002 and at
the beginning of the vegetation period in the ensuing years till 2004. The following
amount were dispersed: 100 kg N ha-1
, 50 P ha-1
, 50 K ha-1
.
Vegetation covered loess monoliths were transplanted from Gödöllı Hills (near Isaszeg)
to the Botanical Garden of Szent István University in spring 2002 in order to study,
among other the plant compositional and structural effects of irrigation. The measuring
site is situated at Gödöllı (47036’N, 19
026’E, 220 m above sea level). Transplanted
monoliths were also positioned along two transects (5 irrigated, 5 control) and arranged
to same sized loess grass patches (0.8m x 0.8m x 0.4m). Irrigation was scheduled to
maintain a near steady state soil water content during the growing season (April-
October). Top spray irrigation operated at night was used for the water supply. Soil
water cc. was kept below but near 0.35m3/m
3 in treated plots.
The climate of both site is temperate continental (mean annual precipitation is 560mm,
mean annual temperature is 10.50C), and the soil of the studied plots was a moderately
eroded lime-impregnated chernozem. During the three years of our study, annual
precipitation ranged from 432mm in 2003 to 627mm in 2004.
Vegetation description The vegetation studied was xeric, species rich, tall loess grassland /Salvio-Festucetum rupicolae/. Selected plots initially dominated by Festuca ovina ssp. valesiaca (80%), Bromus inermis (8.7%) and Brachypodium rupestre (6.7%) in spring 2002. Other
characteristic taxa of the community, like Salvia nemorosa, Euphorbia pannonica,
Seseli osseum and Galium verum were commonly encountered in the plots.
Applied methods Percent cover for each species was estimated using the relevé method (See e.g. Van Der
Maarel 1979) out of which species richness, Shannon Diversity, mean cover and
number of C4 species, and the relative distribution of functional groups (including social
behaviour types based on Borhidi /1993/) were calculated.
Results and discussion
In general the species richness of weeds had been continuously low in both site and the
higher weed ratio occured in autumn (Figure 1 & 2). At Isaszeg site weeds occured only
in the fertilized plots with very low density in spring 2004, while in autumn the number
of weed taxa was the same and the relative weed cover was almost equal in the fertilized
and control plots. In every autumn the mean no. of weed taxa was the same in the
fertilized and its control plots (Fig. 1). Both fertilization and irrigation resulted
increasing weed cover in the first year but significant shift followed it in the consecutive
years (autumns). At Gödöllı site after 2 treated years the number of weed taxa
decreased significantly in spring and by half in autumn in the irrigated stand. In 2004
both the weed richness and relative cover were lower (the latter significantly) in the

VIII. Alps-Adria Scientific Workshop Neum, Bosnia-Herzegovina, 2009
DOI: 10.1556/CRC.37.2009.Suppl.2 287
treated stand. In irrigated stand the mean weed cover only twice exceeded the control
values probably due to the adaptation of the vegetation to the treatment (Fig. 2).
Spring_2
002
Spring_2
004
Autum
n_200
2
Autum
n_200
3
Autum
n_200
4
Rel
ativ
e co
ver
of
wee
d t
axa
(%)
0
20
40
60
80
100
No
. of
wee
d s
pec
ies
0
1
2
3control - coverfertilized - covercontrol - no. of weed taxafertilized - no. of weed taxa
Figure 1. Temporal variation of percent weed cover and number of weed species in fertilized and control plots
Spring_2
002
Spring_2
003
Spring_2
004
Autum
n_200
2
Autum
n_200
3
Autum
n_200
4
Rel
ativ
e co
ver
of
wee
d t
axa
(%)
0
20
40
60
80
100
No
. of
wee
d s
pec
ies
0
1
2
3
4
5
6
7
8control - coverirrigated - covercontrol - no. of weed taxairrigated - no. of weed taxa
Figure 2. Temporal variation of percent weed cover and number of weed species in irrigated and control plots
Vol. 37, 2009, Suppl. Cereal Research Communications
288
In autumn of the drought stressed year 2003 the weed cover decreased significantly in
both fertilized and irrigated stand, while increased in their controls compared to the fall
2002. In Gödöllı site the extreme dry spring 2003 resulted less decline in the total weed
richness of non-stressed irrigated stand, while in autumn 2003 its number was equal in
the treated and non-treated stand. In the latter period drought stress caused the largest
difference of relative weed cover between the 2 stands, because it significantly
increased the weed cover of the control plots.
Conclusions
The majority of the examined parameters varied considerably among years at both
treatments and their controls. At the treated plots, in general species richness, the
number of plant life forms and social behaviour types, the ratio of dicots and C4 plants
declined with addition of water and extensive fertilization. The ratio and number of
weeds, alien competitors and disturbance tolerants also decreased due to the affect of
water addition and the increasing dominance of a strong competitor, Dactylis glomerata. Fertilization created gaps in the treated plots, thus the number and ratio of
weeds increased at the beginning but because of the rapid natural regeneration of native
taxa declined later. Our study gave further evidence that it is important to allow for an
initial acclimation period in the evaluation of any manipulation experiment.
Acknowledgements
This work is a part of the PhD dissertation of Szilárd Czóbel. The authors acknowledge
Professor Zoltán Tuba, János Nagy and Tibor Szerdahelyi for their invaluable
assistance. The study was supported by the GREENGRASS (EVK2-CT2001-00105)
and NITROEUROPE-IP projects.
References
Borhidi A.: 1993. Social behaviour types of the Hungarian Flora, its naturalness and relative ecological
indicator values. Janus Pannonius Tudományegyetem, Pécs.
Czóbel Sz. - Szirmai O. - Nagy J. - Balogh J. - Ürmös Zs. - Péli E.R. - Tuba Z.: 2009. Effects of irrigation on
the community composition, and carbon uptake in Pannonian loess grassland monoliths. Community
Ecology, 9: 91-96.
Foster B. L. - Timothy L. D. (2004): Grassland diversity and productivity: The interplay of resource
availability and propagule pools. Ecology, 85: 1541-1547.
Kirchner T. B. (1977): The Effects of Resource Enrichment on the Diversity of Plants and Arthropods in a
Shortgrass Prairie. Ecology, 58: 1334-1344.
Nagy J. – Molnár A. – Cserhalmi D. – Szerdahelyi T. - Szirmai O.: 2007. The aims and results of the nature-
protection management on the north-east Hungarian mires. Cereal Research Communications, 35: 1. 813-
816. Szerdahelyi T. – Nagy J.: 2007. Coenological comparisons of some stands of temperate grassland associations
(Hungary). Cereal Research Communications, 35: 1. 1165-1168.
Tuba Z. (2005): Ecological Responses and Adaptations of Crops to Rising Atmospheric Carbon Dioxide.
Haworth Press Inc., New York, USA.
Tuba Z. - Szente K. - Nagy Z. - Csintalan Zs. - Koch J. 1996. Responses of CO2 assimilation, transpiration
and water use efficiency to long-term elevated CO2 in perennial C3 xeric loess steppe species. J. Plant
Physiol., 148: 356-361.
Van Der Maarel E.: 1979. Transformation of cover-abundance values in phytosociology and its effects on
community similarity. Vegetatio, 39: 97–114.
Weltzin J. F. - M. E. Loik - S. Sscwinning - D. G. Williams - P. A. Fay - B. M. Haddad - J. Harte - T. E.
Huxman - A. K. Knapp - G. Lin - M. R. Shaw - E. E. Small - M. D. Smith et al. (2003): Assessing the
Response of Terrestrial Ecosystems to Potential Changes in Precipitation. BioScience, 53: 941–952.

VIII. Alps-Adria Scientific Workshop Neum, Bosnia-Herzegovina, 2009
DOI: 10.1556/CRC.37.2009.Suppl.2 289
CHLOROPHYLL FLUORESCENCE AS AN INSTRUMENT FOR THE ASSESSMENT OF HERBICIDE EFFICACY
Vojtěch KOCUREK – Vladimír SMUTNÝ – Jana FILOVÁ
Department of Agrosystems and Bioclimatology, Faculty of Agronomy, Mendel University of Agriculture and
Forestry in Brno, Zemědělská 1, 613 00 Brno, Czech Republic, e-mail: [email protected]
Abstract: Chlorophyll fluorescence is a light with specific wavelength which is emitted by plants as a
“waste” of unused sunlight energy and its intensity depends on many stress factors. Methods based on
chlorophyll fluorescence measurement are perspective for the assessment of herbicide efficacy and their
phytotoxicity for grown crops. Current methods are mainly based on subjective assessment of treated plants
by human senses, which can cause some inaccuracies. A fluorescence camera FluorCam is able to determine
differences and intensity of fluorescence emitting caused by spreading herbicides in plant. We can assess their
distribution in leaves, speed and effect on plant health. This method is non-invasive, non-destructive, fast and
very sensitive. In the experiment, six herbicides were tested and assessed using a parameter called Quantum
yield of fluorescence (QY). Treated experimental plants of redroot pigweed (Amaranthus retroflexus) were
measured using a FluorCam at 0, 1, 2, 3, 6, 9 and 15 days after treatment and results were compared with
current subjective assessment and growth parameters. Herbicides with active ingredients dicamba, bentazone,
mesotrione, terbuthylazine, nicosulfuron and glyphosate-IPA were used in 100% registered doses in the
experiment. The results showed that the effect of herbicides with active ingredients bentazone, mesotrione,
terbuthylazine was detected earlier by QY than by any other parameter. Subjective assessment was the best
parameter for detection of dicamba, nicosulfuron and glyphosate-IPA. We can say that measuring of QY
values is suitable for herbicides that affect plant photosynthesis and can be used for herbicide assessment
together with main subjective assessment for other herbicides as a supplementary parameter.
Keywords: herbicide efficacy, chlorophyll fluorescence, fluorcam
Introduction
Chlorophyll fluorescence analysis has become one of the most powerful and widely
used techniques available to plant physiologists and ecophysiologists (Maxwell,
Johnson, 2000). Measuring the chlorophyll fluorescence has appeared to be reliable
method to assess photosynthesis (Lu et al., 2000).
Chlorophyll fluorescence is a light with specific wavelength which is emitted by plants
as a “waste” of unused absorbed sunlight energy and its intensity depends on many
stress factors. Methods based on chlorophyll fluorescence measurement are perspective
for the assessment of herbicide action in plant, efficacy and phytotoxicity for grown
crops. Current methods are mainly based on subjective assessment of treated plants by
human senses which can cause some inaccuracies. Moreover, in many cases the actual
effect of the herbicide is not visible by human eye, while the plant itself can be very
seriously and significantly damaged.
This method is non-destructive, non-invasive, fast and also very sensitive (Mouget and
Tremblin, 2002). It is used for early detection of abiotic and biotic stress (high
temperature, frost, drought, lack of nutrients, infection, exposure to herbicides, etc.)
(Oukarroum et al., 2007, Toth et al., 2007, Christen et al., 2007), for polymorphism
detection by fluorescent in situ hybridization (Szakács and Molnár-Láng, 2008) or for
assessing of antioxidant activity, chilling tolerance of crops (Janda et al., 2005), etc.
Materials and methods
Six herbicides (Table 1) were tested and assessed using a parameter called Quantum yield of fluorescence (QY) in the experiment. Experimental plants of redroot pigweed

Vol. 37, 2009, Suppl. Cereal Research Communications
290
(Amaranthus retroflexus) were grown in a light-box with defined growth conditions to
the stage of four true leaves, treated with herbicides (sprayer SOLO SPRAYSTAR 460)
and measured by a FluorCam at 0, 1, 2, 3, 6, 9 and 15 days after treatment (thereinafter
as DAT; Figure 1). Results were compared with current subjective assessment (10-point
scale) and selected growth parameters (plant height, number of leaves > 5mm) and
statistically tested by analysis of variance with subsequent testing by Tukey´s test and
analysis of correlation coefficients (Table 2).
The fluorometer FluorCam FC-800 (closed version) is an instrument for multi-spectral
kinetic fluorescence imaging that measures sequences of chlorophyll fluorescence
images with user-defined irradiance protocols and timing of measurements
(www.psi.cz). QY is currently the most studied and used fluorescence parameter. For
simplicity, we can say that the value of QY refers to the "health state of the plants." It
has range from 0 to 1 and healthy plants in the field show the max value of around 0.8,
and the value below 0.7 means serious damage of plant. QY = (Fm-Fo) / Fm, QY is a
measure of the Photosystem II efficiency, Fm is maximal fluorescence intensity and Fo
minimal fluorescence intensity of selected object.
Table 1. Description of tested herbicides (s = systemic herbicide, c = contact herbicide)
Herbicide Active ingredient Group Mode of action Regist. dose BASAGRAN
SUPER (c)
480g bentazone +
150g activator benzothiadiazinone
inhibitor of
photosynthesis 2 l / 300 l
CLICK 500 SC
(s)
500g
terbuthylazine triazine
inhibitor of
photosynthesis 2 l / 300 l
BANVEL 480 S
(s) 480g dicamba aminobenzoic acid
synthetic growth
stimulator 0.5 l / 300 l
CALLISTO 480 SC
(s) 480g mesotrione triketone
inhibitor of
4-hydroxyphenyl pyruvate 0.25 l / 300 l
MILAGRO
(s) 40g nicosulfuron sulfonylurea
inh. of acetolactate
synthase (ALS) 1 l / 300 l
ROUNDUP KLASIK
(s) 480g glyphosate-
IPA glycine derivate
inhibitor of EPSP
synthesis 3 l / 200 l
Results and discussion
Table 2. Possibility of conclusive differences detection for all assessed parameters on days after treatment
(DAT) compared to control variant and values of correlation coefficients between values of quantum yield of
fluorescence and other growth characteristics (p <0.05)
Plant height Number of leaves
> 5mm Subjective assessment
QY Herbicide
DAT Correl. x QY DAT Correl. x QY DAT Correl. x QY DAT
BASAGRAN SUPER 3 0.55* 1 0.66* 1 0.68* 0
CLICK 500 SC 6 0.45* 3 0.43* 3 0.43* 1
CALLISTO 480 SC 6 0.54* 6 0.63* 3 0.84* 3
BANVEL 480 S 1 0.57* 3 0.41* 1 0.94* 6
MILAGRO 2 0.81* 6 0.81* 1 0.83* 6
ROUNDUP KLASIK 1 0.81* 3 0.80* 1 0.90* 3

VIII. Alps-Adria Scientific Workshop Neum, Bosnia-Herzegovina, 2009
DOI: 10.1556/CRC.37.2009.Suppl.2 291
Table 2 shows that high values of correlation coefficients (significant in all cases)
indicate that the parameter QY can be used to express the effect of the tested herbicides
(except bentazone). The closest relationship was found between QY and values of
subjective assessment. Parameter of plant height can be significantly used for early
detection of active ingredients dicamba and glyphosate-IPA already at 1-DAT; the
parameter number of leaves > 5mm did not show any advantage against other
parameters for early detection. Subjective assessment can detect significant differences
at 1-DAT for dicamba, nicosulfuron, glyphosate-IPA and at 3-DAT for mesotrione. QY
values were conclusively different at 0-DAT for bentazone, at 1-DAT for terbuthylazine
and at 3-DAT for mesotrione.
0,00
0,10
0,20
0,30
0,40
0,50
0,60
0,70
0,80
0,90
0-DAT 1-DAT 2-DAT 3-DAT 6-DAT 9-DAT 15-DAT
days after treatment
QY
control
BANVEL 480 S
BASAGRAN SUPER
CLICK 480 SC
CALLISTO 480 SC
MILAGRO
ROUNDUP KLASIK
Figure 1. The average values of quantum yield (QY) for tested herbicides for 1-15 DAT (p <0.05)
The measured values of QY showed that the largest and fastest decline in the value of
QY occurred in photosynthesis inhibitors bentazone and terbuthylazine. QY of
bentazone (compared with control) was conclusively different already several minutes
after application (0-DAT). The active ingredient terbuthylazine was found conclusively
different at 1-DAT, mesotrione and glyphosate-IPA at 3-DAT, dicamba and
nicosulfuron at 6-DAT.
Conclusions
A very important finding based on the results obtained from the experiments is that the
effect of herbicides is expressed in the change of chlorophyll fluorescence and the
camera FluorCam provides sufficient opportunities in assessing the efficacy of
herbicides. The results revealed that the measurement of chlorophyll fluorescence using
the FluorCam device can be used for early efficacy assessment of herbicides which
affect photosynthesis.

Vol. 37, 2009, Suppl. Cereal Research Communications
292
Possibility of early determination can be very well justified by the fact that we can
determine the effect of the herbicide just before visible symptoms. Fluorescence
measurement gives us early reference of the current status of the plants while the
subjectively rated symptoms of herbicide damage can be visible later. This is
particularly true for the results of the contact herbicide with active ingredient bentazone
and systemic herbicides containig terbuthylazine and mesotrione because of their direct
effect on photosynthesis. For active ingredients dicamba, nicosulfuron and glyphosate-
IPA, QY measurement is not so sensitive for early detection in comparison with
subjective assessment because of their indirect influence on photosynthesis.
The FluorCam also allows us to capture the speed and intensity of exposure to the
herbicide in different parts of plants. In particular, when monitoring systemic herbicides
on fluorescent photographs, we can clearly see visible difference in young parts of
plants that are most affected by the herbicide.
Acknowledgements
This paper was written as part of research project No. 2B06124 supported by the
Ministry of Education, Youth and Sports of the Czech Republic and of research project
No. 1B53045.
References
Christen, D. - Schönmann, S. - Jermini, M. - Strasser, R.J. - Défago, G.: 2007. Characterization and early
detection of grapevine (Vitis vinifera) stress response to esca disease by in situ chlorophyll fluorescence
comparison with drought stress. Environmental and Experimental Botany, 60: 3. 504-514.
Janda, T. - Kósa, E. - Pintér, J. - Szalai, G. - Marton, C.L. - Páldi, E.: 2005. Antioxidant activity and chilling
tolerance of young maize inbred lines and their hybrids. Cereal Research Communications, 33: 2-3. 541-
548.
Lu C. M., Chau C. W., Zhang J.H.: 2000. Acute toxicity of excess mercury on the photosynthetic performance
of cyanobacterium, S. platensis--assessment by chlorophyll fluorescence analysis. Chemosphere 41:191-
196.
Maxwell, K., Johnson G. N.: 2000. Chlorophyll fluorescence-a practical guide. Journal of experimental
botany, 51: 659-668.
Mouget, J.L. - Tremblin, G.: 2002. Suitability of the Fluorescence Monitoring System (FMS, Hansatech) for
measurement of photosynthetic characteristics in algae. Aquatic Botany, 74: 3. 219-231.
Oukarroum, A. - Madidi, S.E. - Schansker, G. - Strasser, R.J.: 2007. Probing the responses of barley cultivars
(Hordeum vulgare L.) by chlorophyll a fluorescence OLKJIP under drought stress and re-watering.
Environmental and Experimental Botany, 60: 3. 438-446.
Szakács, E. - Molnár-Láng , M.: 2008. Fluorescent in situ hybridization polymorphism on the 1RS
chromosome arms of cultivated Secale cereale species. Cereal Research Communications, 36: 2. 247-
255.
Tóth, S.Z. - Schansker, G. - Garab, G. - Strasser, R.J.: 2007. Photosynthetic electron transport activity in heat-
treated barley leaves: The role of internal alternative electron donors to photosystem II. Biochimica et
Biophysica Acta, 1767: 295-305.
Trtílek, M. - Šebela, P.: 2008. Products of company Photon systems instruments, web database of products
[on-line]: www.psi.cz/products/fluorcams/open-fluorcam.

VIII. Alps-Adria Scientific Workshop Neum, Bosnia-Herzegovina, 2009
DOI: 10.1556/CRC.37.2009.Suppl.2 293
FROST-INDUCED NUTRIENT DISORDERS IN INTEGRATED APPLE ORCHARD
Péter Tamás NAGY 1 – Zoltán SZABÓ
2 – József NYÉKI 2
1Department of Agricultural Chemistry and Soil Science, Faculty of Agricultural Science, University of
Debrecen, 4032, Böszörményi út 138., Debrecen, Hungary, e-mail: [email protected] 2 Institute for Extension and Development, University of Debrecen, Hungary, H-4032 Debrecen, Böszörményi
út 138.
Abstract: Frost is an abiotic environmental stress factor significant hazard to many horticultural regions in Hungary.
Now we should be focusing more studies on the effects of climatic changes because understanding and ability
to minimise the risk of crop loss or damage
is fundamental to managing a profitable enterprise.
The year of 2007 was critical for Hungarian fruit growers, especially in Alföld region. Serious frost damaged
was observed at blooming time in this region, which was approximately 100%.
The aim of our research is to study the effects of frost of 2007 on nutrient uptake of an integrated apple
orchard in North-West Hungary. Besides plant observations, macronutrient status of eight apple cultivars was
studied for three years (2006-2008) to study the effects of frost on fruit load of trees and to conclude the
degree and long-term impact of frost stress.
Leaf N content decreased while leaf P and K was increased at all cultivars in the year of frost. In the next year
leaf P and K dramatically decreased while leaf N increased and reached the earlier N level. Plant observations
pointed out that the vegetative and generative balance of trees was significantly shifted due to the frost stress.
Fruit loss caused higher vigour and nutrient disorder of trees. The damage not only puts at risk the current
season’s fruit, but also because of the perennial nature of fruits, can influence the productivity of fruits for
several seasons in the future.
Keywords: frost, nutrient disorder, apple, environmental stress
Introduction
The climate condition is one of the main key factors in the production of high and
qualitative yields of fruits (Bramagle, 1993). Nowadays climate extremities result more
and more problems for fruit growers all over world (Várallyay, 2007). Frost is an
abiotic environmental stress factor significant hazard to many horticultural regions in
Hungary. As fruit trees are perennial plants, should they be damaged, the consequence
of that event may have impact on growth and yield for years, which cause severe
economic losses (Rodrigo, 2000). Spring frost damage in 2007 points out that the
degree of injury depends on the minimum temperature reached the rate at which the
temperature falls, the amount of time below a critical temperature and the orchard site.
However, appropriate cultural techniques will enable damage to be minimal (Kincses et
al., 2008). As a consequence yield and fruit composition return to maximum levels as
quickly as possible.
In practice managing frost injury can be divided into three broad sections:
• Understanding the factors that affect the frost sensitivity of a particular site.
• Managing a site and fruits to minimise risk in a particular season.
• Managing fruits that have been damaged to reduce immediate.
The aim of our research is to study the effects of frost of 2007 on nutrient uptake of an
integrated apple orchard in North-West Hungary. Besides plant observations,
macronutrient status of eight apple cultivars was studied for three years (2006-2008) to

Vol. 37, 2009, Suppl. Cereal Research Communications
294
study the effects of frost on fruit load of trees and to conclude the degree and long-term
impact of frost stress.
Materials and methods
Our investigations were carried out between 2006 and 2008 in an integrated apple
orchard (Malus domestica Borkh.) of TEDEJ Rt., Hajdúnánás-Tedej, in Eastern
Hungary. The orchard was set up on lowland chernozem soil. It was established in the
autumn of 1999, using grafted on MM106 rootstocks at a spacing of 3.8 x 1.1 m. Soil
samples were taken from three layers (0-20 cm; 20-40 cm and 40-60 cm).
Sampling was performed at the beginning of the vegetation period on April, in 2006.
Determination of the soluble nutrient element content of the soil was based on MSZ
20135:1999. For plant analysis the following apple cultivars were selected (see in Table
2.). Healthy, fully developed leaves were taken from the mid-third portion of extension
shoots current year were collected. Leaf samples were collected 100 days after full
bloom, from 50 uniform trees in 2006, 2007 and 2008, respectively. Leaf N was
determined described by Nagy, 2000. Leaf P and K were determined described by soil
samples.
Results and discussion
Soil analysis: For the characterisation of the soil the most important soil parameters
were determined (Table 1.).
Table 1. Results of soil analysis
Depth
Parameters 0-20 20-40 40-60 0-60
pH (CaCl2) 7.43 7.36 7.54 7.44
H% 2.95 2.83 2.58 2.79
KA 45
CaCO3% 8.3 8.5 12.5 9.77
mg/kg
AL-P 164.11 89.12 42.7 98.64
AL-K 263.93 160.69 88.65 171.09
The pH of soil was near the neutral value. The physical category of soil was clay loam.
The soil P and K was medium, while the soil N was suitable for growing. The values of
easily soluble N form correspond to the type of examined soil and decreased by depth.
Plant analysis: Values and status of leaf N, P and K at different species in 2006, 2007
and 2008 were shown in Table 2-4. In 2006, before frost, leaf N, P and K was sufficient
at most of cultivars and balanced nutrient ratios ruled in the orchard (Table 2-4).
In 2007, leaf N was lower, while leaf P and K was higher at most cultivars than in 2006.
It can be explained by the absence of fruits caused a smaller accumulation of N.

VIII. Alps-Adria Scientific Workshop Neum, Bosnia-Herzegovina, 2009
DOI: 10.1556/CRC.37.2009.Suppl.2 295
Table 2. Leaf N of eight apple cultivars (2006-2008)
2006 2007 2008
N (%) (d.m.) N (%) (d.m.) N (%) (d.m.)
Idared 2.10 1.73 2.11
Topáz 2.44 1.73 2.19
Gála Must 2.14 1.97 2.34
Summerred 2.19 1.70 2.36
Jonagold 1.87 1.89 2.13
Braeburn 2.20 1.91 2.32
Golden Reinders 1.95 1.93 2.15
Mutsu 2.02 2.25 2.30
Average 2.11 1.89 2.24
LSD5% (within year) 0.12 0.12 0.07
LSD5% (without years) 0.08
It was in accordance with plant observations, because higher leaf area was measured in
2007 than in the previous and the next year. It meant that the vegetative processes
became dominant. Increase of leaf P and K explained with the fruit failure also. Falling
down of flowers and fruit sets hindered the translocation of the uptake P and K towards
fruit sets. In the year followed frost reverse changes were observed. In 2008, higher leaf
N was measured at all cultivars than in 2007 and its level reached the earlier N supply
level (Table 2). Leaf P and K deceased in the year after frost, contrary to leaf N (Table
3-4). Dramatic dropping was observed with especial regard to leaf P (Table 3).
Table 3. Leaf P of eight apple cultivars (2006-2008)
2006 2007 2008
P (%) (d.m.) P (%) (d.m.) P (%) (d.m.)
Idared 0.18 0.28 0.10
Topáz 0.16 0.19 0.15
Gála Must 0.18 0.23 0.15
Summerred 0.18 0.38 0.13
Jonagold 0.14 0.14 0.03
Braeburn 0.26 0.34 0.25
Golden Reinders 0.15 0.25 0.02
Mutsu 0.15 0.18 0.04
Average 0.17 0.25 0.11
LSD5% (within year) 0.03 0.06 0.05
LSD5% (without years) 0.04
From results it was clear that measured content of macronutrients was significantly
affected by years and eventually the ensued frost stress.

Vol. 37, 2009, Suppl. Cereal Research Communications
296
Our results confirmed earlier findings (Szőcs and Kállay, 1999) that there is close
relationship between fruit load and nutrient level of leaf.
Table 4. Leaf K of eight apple cultivars (2006-2008)
2006 2007 2008
K (%) (d.m.) K (%) (d.m.) K (%) (d.m.)
Idared 1.11 1.40 1.04
Topáz 0.74 1.26 1.04
Gála Must 1.39 1.68 1.47
Summerred 1.39 1.84 1.31
Jonagold 1.20 1.05 0.98
Braeburn 1.57 1.75 1.53
Golden Reinders 1.57 1.19 1.42
Mutsu 1.67 1.82 1.36
Average 1.33 1.50 1.27
LSD5% (within year) 0.21 0.22 0.15
LSD5% (without years) 0.11
Moreover, leaf N, P and K was affected by cultivars in every year but significant effect
was observed only at few cultivars. Chemical analysis of leaves and plant observations
pointed out that the vegetative and generative balance of trees was significantly shifted
due to the frost stress. Fruit loss caused higher vigor and nutrient disorder of trees. The
damage not only puts at risk the current season’s fruit, but also because of the perennial
nature of fruits, can influence the productivity of fruits for several seasons in the future.
Acknowledgements
Thanks to OM-00042/2008 project for financial assistance.
References
Bramlage, W. .J.: 1993. Interactions of orchard factors and mineral nutrition on quality of pome fruit. Acta
Hort. 326:15-28
Kincses I. – Filep T. – Kremper R. – Sipos M. (2008): Effect of nitrogen fertilization and biofertilization on
element content of parsley. Cereal Research Communications. 36. 571-574. p.
MSZ 20135:1999: Determination of the soluble nutrient element content of the soil. Hungarian Standards
Institution. Budapest (in Hungarian)
Nagy, P.T.: 2000. Application of an element analyser for soil and plant analyses (dry combustion method). (in
Hungarian) Agrokémia és Talajtan 49, 521-534. Rodrigo, E.: 2000. Spring frost in deciduous fruit trees – morphological damage and flower hardiness.
Scientia Hort. 85, 155-173.
Szőcs, E. and Kállay, T. 1999. Data for physiological interpretation of fruit load on storage quality of
‘Jonathan’ apples. Acta Hort. 485: 357-362.
Várallyay G.: 2007. Láng I., Csete L. és Jolánkai M. (szerk): A globális klímaváltozás: hazai hatások és
válaszok (A VAHAVA Jelentés). Agrokémia és Talajtan, Vol. 56 No. 1 pp 199-202.

VIII. Alps-Adria Scientific Workshop Neum, Bosnia-Herzegovina, 2009
DOI: 10.1556/CRC.37.2009.Suppl.2 297
PHYSICAL MAPPING OF THE 7D CHROMOSOME USING A WHEAT/BARLEY TRANSLOCATION LINE (5HS.7DL) PRODUCED IN A MARTONVÁSÁRI WHEAT BACKGROUND USING MICROSATELLITE MARKERS
Adél SEPSI – Julianna BUCSI
Agricultural Research Institute of the Hungarian Academy of Sciences, H-2462 Martonvásár, Brunszvik u. 2. ,
e-mail: [email protected]
Abstract: A wheat/barley translocation line was previously developed in Martonvásár from the Mv9kr1 × Igri
hybrid and was identified as a 5HS.7D translocation using fluorescence in situ hybridization (FISH) and 5H-
specific barley SSR markers. The aim of the present study was to characterize the rearranged wheat
chromosome and to identify the 7D chromosome segment eliminated by the translocated 5HS segment using
7D-specific SSR markers. The elimination of the 7DS terminal region was proved by three of the twenty-four
tested markers. The breakpoint of the 5HS.7DS translocation was considered to be closer to the telomere than
the breakpoint of known deletion lines, which provides a new physical landmark for future deletion mapping
studies. The fine mapping of 7D makes it possible to localize agronomically useful genes to the precise
chromosomal region of the eliminated 7DS segment, opening up the possibility of marker-assisted breeding
and map-based cloning.
Keywords: wheat-barley translocation line, in situ hybridisation, SSR markers, physical mapping
Introduction
Barley (Hordeum vulgare L.), one of the most important crops, carries several genes
involved in biotic and abiotic stress tolerance, which can be transferred to wheat via
wide hybridisation. The production of wheat-barley translocation lines is an important
intermediate step in transferring genes of interest into wheat. Besides their importance
in wheat breeding programmes, translocation lines are excellent genetic materials for
the physical mapping of genes or molecular markers to specific breakpoint intervals
(bins). Using the translocation breakpoint as a physical landmark, genes or molecular
markers can be located to a precise chromosomal region (Nagy et al. 2002). When
comparing genetic and physical maps, discrepancies were found in marker order and in
the distances between markers. Due to the recombination hotspots, which are more
frequent in the gene-rich regions close to the telomeres, genetic maps provide only an
estimate of marker positions (Gustafson et al. 1990; Lukaszewski and Curtis 1993). It is
particularly difficult to assess the marker order using genetic mapping in regions of high
marker density, where genetic distances are very short (Sourdille et al. 2004).
Microsatellite markers are highly polymorphic genetic markers making it possible to
discriminate between closely related species. Translocations and their breakpoint
positions can be visualised using genomic in situ hybridisation (GISH) (Schwarzacher
et al. 1989, Le et al. 1989, Molnár-Láng et al. 2000b) and the rearranged chromosomes
can be identified with fluorescence in situ hybridisation (FISH) using repetitive DNA
sequences (Molnár et al. 2009).
The 5HS.7D translocation line analysed in the present study was developed in
Martonvásár from the ‘Mv9kr1’ × ‘Igri’ hybrid (Molnár-Láng et al. 2000a) and was
identified using fluorescence in situ hybridization (FISH). This genetic material was
previously used for the physical mapping of the 5H barley chromosome (Nagy et al
2002, Molnár-Láng et al. 2005) but it was not completely clarified which region of the

Vol. 37, 2009, Suppl. Cereal Research Communications
298
7D chromosome was substituted by barley chromosome arm 5HS. The aim of the
present study was to describe the precise composition of the translocated chromosome
and to identify the substituted wheat chromosome segment.
Materials and methods
Plant material: The wheat/barley translocation line was developed from the Mv9kr1 × Igri hybrid
produced in Martonvásár, Hungary, as described in detail by Molnár-Láng et al.
(2000a). The 5HS.7D translocation line was selected from the backcrossed progenies of
the hybrid using GISH.
Genomic in situ hybridization: Total genomic DNA from the barley cultivar Igri was
labelled with fluorored (rhodamine-4-dUTP, Amersham) using nick-translation, while
DNA from Mv9kr1 wheat was used as blocking DNA. The in situ hybridization
experiment was carried out as described previously by Szakács and Molnár-Láng
(2008), except that the hybridisation temperature was 65°C.
SSR marker analysis: DNA was isolated from the wheat cultivar Mv9kr1, the barley
cultivar Igri and from the Mv9kr1/Igri translocation line. The DNA extraction was
performed as described by Anderson et al. (1992).
Twenty-four SSRs distributed over the 7D chromosome (7DS-specific SSRs:
Xwmc506, Xgdm130, Xbarc184, Xgwm44, Xgwm295, Xgdm86, Xbarc126,
Xgwm111, Xbarc214 and Xgwm350; 7DL-specific SSRs: Xwmc437, Xwmc94,
Xbarc1046, Xbarc172, Xbarc111, Xgdm46, Xgdm67, Xbarc53, Xgwm428, Xgwm37,
Xcfd69, Xgdm142, Xgdm150 and Xgdm84) were selected from the GrainGenes 2.0
database (http://wheat.pw.usda.gov/GG2/index.shtml). The PCR reactions were
performed in an Eppendorf Mastercycler (Eppendorf-Netheler-Hinc Inc., Hamburg,
Germany) using the PCR mixture described by Schneider and Molnár-Láng. (2008).
The 45 cycles were performed with 30 sec at 94 °C, 30 sec at either 50°C, 55°C or 60°C
(depending on the annealing temperature of the microsatellite markers), 30 sec at 72 °C,
and a final extension step of 10 min at 72 °C. The PCR products were separated on 2%
agarose gels. The bands were stained using ethidium bromide, and DNA was visualised
using a SynGene GelDoc system (SynGene, Cambridge, England).
Results and discussion
Twenty-four microsatellites distributed over the 7D chromosome were used to
determine the 7D chromosome segment eliminated by the barley chromosome arm 5HS.
Polymorphism was detected for all the markers between PCR products amplified by
wheat and barley DNA, so all the markers could be used to characterise the rearranged
chromosome. All the 7DL-specific markers produced PCR products of the expected size
on wheat and on the translocation DNA, revealing the presence of the complete 7DL. In
the case of three 7DS-specific markers (Xbarc184, Xwmc506 and Xgdm130) the
Mv9kr1/Igri translocation line failed to amplify the 7DS-specific fragments given by
wheat DNA, signaling the elimination of a short chromosome segment carrying these
markers. None of these three markers were previously mapped physically within 7DS
but genetic mapping studies located them close to the telomere of 7DS. The other seven
7DS-specific markers were present on the translocation chromosome. Four of these
markers (Xbarc126, Xgwm44, Xgwm295, Xbarc214) were mapped previously to the

VIII. Alps-Adria Scientific Workshop Neum, Bosnia-Herzegovina, 2009
DOI: 10.1556/CRC.37.2009.Suppl.2 299
terminal bin of 7DS, between fraction lengths (FL) 0.61-1.00 (Sourdille et al. 2004). As
the FISH experiment detected the absence of a strong Afa family signal characteristic of
the terminal 7DS region, it was concluded that this region had been deleted. The 7DS-
specific markers absent from this genetic material were thus located on the deleted,
most distal region of 7DS. Obviously, the three missing markers (Xbarc184, Xwmc506,
Xgdm130) were situated distally to the four markers present on the translocation
chromosome (Xbarc126, Xgwm44, Xgwm295, Xbarc214) and mapped previously to
the terminal bin of 7DS. The present study physically mapped Xbarc184, Xwmc506 and
Xgdm130 to FL 0.61-1.00, but distally to markers Xbarc126, Xgwm44, Xgwm295 and
Xbarc214.
Figure 1 A: Agarose gel electrophoresis pattern of the 7DS-specific markers on wheat line Mv9kr1 (1), barley
cultivar Igri (2) and on the Mv9kr1/Igri 5HS.7DS.7DL translocation line (3). The translocation line lacked
fragments amplified by markers Xwmc506, Xgdm130 and Xbarc184.
B: Physical mapping of the tested 7DS-specific markers on the 5HS.7DS.7DL translocation chromosome. The
positions of the markers are indicated by arrows. The markers previously mapped physically to the 7DS
terminal region are in italics, while markers mapped physically in the present study to the deleted 7DS
chromosome segment are visualised in red.
C: GISH pattern of the 5HS.7DS.7DL translocation chromosome using barley DNA as probe. The barley
chromosome segment is visualised in green and the 7D chromosome in blue.
The marker order revealed in the present study showed good accordance with the wheat
microsatellite consensus map established by Somers et al. (2004), except for the marker
Xgwm350, which was mapped genetically as the most distal marker within 7DS. The
analysis of the 5HS.7DS.7DL translocation clarified the position of this marker and
placed it proximally to Xbarc184, Xwmc506 and Xgdm130.
The 5HS.7DS.7DL translocation provides a new breakpoint interval within FL 0.61-
1.00 characterised by three microsatellites, making it possible to construct more detailed
physical maps involving the terminal 7DS region.

Vol. 37, 2009, Suppl. Cereal Research Communications
300
Conclusions
A new breakpoint interval within 7DS was detected by means of the fine mapping of
7DS, involving the in situ hybridisation of the 5HS.7DS.7DL translocation line,
combined with microsatellite marker analysis. More detailed physical mapping analysis
of the terminal regions of 7DS is thus possible, opening up the way for map-based
cloning and marker-assisted selection.
Acknowledgements
This work was supported by the Generation Challenge Programme (CGIAR GCP SP3,
G4007, 23), the Hungarian National Research Fund (K 75 381) and by the Agrisafe
Programme (EU-FP7-REGPOT-2007-1, grant agreement no: 203288). The authors
gratefully acknowledge the technical assistance of Mrs J Havasi. Thanks are due to B
Harasztos for revising the manuscript linguistically.
References
Anderson, J.A., Ogihara, Y., Sorrells, M.E., Tanksley, S.D. 1992. Development of chromosomal arm map for
wheat based on RFLP markers. Theor. Appl. Genet. 83: 1035-1043.
Gustafson, J.P., Butler, E., McIntyre, C.L. 1990. Physical mapping of low-copy DNA sequence in rye (Secale
cereale L). Proc. Natl. Acad. Sci. USA. 87: 1899-1902.
Le, H.T., Armstrong, K.C., Miki, B. 1989. Detection of rye DNA in wheat–rye hybrids and wheat
translocation stocks using total genomic DNA as a probe. Plant. Mol. Biol. Rep. 7:150–158.
Lukaszewski, A.J., and Curtis, C.A. 1993. Physical distribution of recombination in B-genome chromosomes
of tetraploid wheat. Theor. Appl. Genet. 86: 121-127.
Molnár, I., Benavente, E., Molnár-Láng, M. 2009. Detection of intergenomic chromosome rearrangements in
irradiated Triticum aestivum-Aegilops biuncialis amphiploids by multicolour genomic in situ
hybridization. Genome, 52: 156-165.
Molnár-Láng, M., Novotny, C., Linc, G., D. Nagy, E. 2005. Changes in the meiotic pairing behaviour of a
winter wheat-winter barley hybrid maintained for a long term in tissue culture, and tracing the barley
chromatin in the progenies using GISH and SSR markers. Plant Breed. 124: 247-252.
Molnár-Láng, M., Linc, G., Logojan, A., Sutka, J.: 2000a. Production and meiotic pairing behaviour of new
hybrids of winter wheat (Triticum aestivum) × winter barley (Hordeum vulgare). Genome, 43: 1045-
1054.
Molnár-Láng, M., Linc, G., Friebe, R. B., Sutka, J. 2000b. Detection of wheat-barley translocations by
genomic in situ hybridization in derivatives of hybrids multiplied in vitro. Euphytica 112: 117-123.
Nagy, E.D., Molnár-Láng, M., Linc, G., Láng, L. 2002. Identification of wheat-barley translocations by
sequential GISH and two-colour FISH in combination with the use of genetically mapped barley SSR
markers. Genome 45:1238-1247.
Röder, M.S., Korzun, V., Gill, B.S., Ganal, M.W. 1998. The physical mapping of microsatellite markers in
wheat. Genome 41: 278–283.
Schneider, A., Molnár-Láng, M. 2008. Polymorphism analysis using 1RS-specific molecular markers in rye
cultivars (Secale cereale L.) of various origin. Cereal Res. Commun. 36: 11-19.
Schwarzacher, T., Leitch, A.R., Bennett, M.D., Heslop-Harrison J.S. 1989. In situ localization of parental
genomes in a wide hybrid. Ann. Bot. 64:315–324.
Somers, D.J., Isaak, P., Edwards, K. 2004. A high-density microsatellite consensus map for bread wheat
(Triticum aestivum L.). Theor. Appl. Genet. 109: 1005-1014.
Sourdille, P., Singh, S., Cadalen, T., Brown-Guedira, G.L., Gay, G., Qi, L., Gill, B.S., Dufour, P., Murigneux,
A., Bernard, M. 2004. Microsatellite-based deletion bin system for the establishment of genetic-physical
map relationships in wheat (Triticum aestivum L.). Funct. Integr. Genomics 4: 12-25.
Szakács É. - Molnár-Láng M. 2008. Fluorescent in situ hybridization polymorphism on the 1RS chromosome
arms of cultivated Secale cereale species. Cereal Res. Commun. 36: 247-255

VIII. Alps-Adria Scientific Workshop Neum, Bosnia-Herzegovina, 2009
DOI: 10.1556/CRC.37.2009.Suppl.2 301
THE IMPACT OF WATER DEFICIT ON SELECTED PHYSIOLOGICAL CHARACTERISTICS OF JUVENILE HOP PLANTS (Humulus lupulus L.)
Helena HNILIČKOVÁ 1 – František HNILIČKA 1 – Petr SVOBODA 2 – Jiří KOŘEN 2 – Jaroslava MARTINKOVÁ 1
1 Department of Botany and Plant Physiology, Faculty of Agrobiology, Food and Natural Resources, Czech
University of Life Sciences Prague, Kamýcká 129, 165 21 Prague 6 – Suchdol, Czech Republic, e-mail:
[email protected] 2 Hop Research institute, Co., Ltd., Kadaňská 2525, Žatec, Czech Republic
Abstract: Hop plants are very demanding as concerns sufficient amount of water, and therefore the aim of the
experiments was to monitor the impact of water deficit on the exchange of gases in the juvenile hop plants.
The impact of water deficit was observed in controlled greenhouse conditions where the plants of Žatecký
poloraný červeňák (SAAZ)“Osvaldův klon 72” were cultivated in 15 l containers in two groups – the control
group and the stressed group. In the stressed group, irrigation was interrupted for a period of nine days and
then seven-day rehydration followed. It is apparent from the obtained results that after irrigation is interrupted,
the levels of stomatal conductivity, transpiration and photosynthesis rate significantly decrease. After nine
days of stress, the stomatal conductivity reached almost a zero level and the photosynthesis rate was 5.320
µmol CO2 m-2 s-1 and the transpiration rate was 0.987 mol H2O m-2 s-1. When irrigation was resumed, the
stomatal conductivity, transpiration rate and photosynthesis rate increased. At the end of the experiment, the
photosynthesis rate reached 55.64 % of the pre-stress level and the stomatal conductivity and transpiration rate
reached 49,54 % and 38 % of the pre-stress level, respectively.
Keywords: hop plants, Humulus lupulus L., water stress, photosynthesis rate, transpiration rate, stomatal
conductivity
Introduction
The most frequent factor limiting the growing of field crops is the uneven distribution
of precipitation during their vegetation and subsequent drought because the works by
Várallyay (2008) suggest possible changes of climate in Central Europe. With regard to
these facts, it is necessary to study wild and cultural plants as concerns their resistance
to abiotic stressors (Vegh and Rajkai, 2006, Kuklová and Kukla, 2008). However, from
this point of view, cultivating plants to make them resistant to abiotic stressors,
especially drought, is very complicated, time-consuming and the assessment of this
resistance is a long-term problem (Vegh and Rajkai, 2006). According to Hniličková et
al. (2007, 2008), studying the physiological characteristics of hop and the resistance of
hop to stresses is very complicated because it reaches the height of up to 8 m and the
most significant cultivation area is situated in the territory of the rain shadow of Krušné
Mountains. Since there is a lack of more detailed data on the physiology of the
cultivated hops, our objective was to identify the selected physiological characteristics
of a classical hop clone with respect to water deficit.
Materials and methods
In the greenhouse of the Czech University of Life Sciences Prague, an experiment
concentrated on studying the effect of water deficit on the selected physiological
characteristics of young hop plants was carried out. The experiment was designed as a
vessel-based experiment, in which the experimental plants were grown in vessels with a
volume of 15 l, filled with homogenized garden substrate. The experimental material

Vol. 37, 2009, Suppl. Cereal Research Communications
302
was Žatecký poloraný červeňák (SAAZ) "Osvaldův klon 72". The plan of the experiment
contained two groups: the control group (irrigated up to full saturation) and the stressed
group where irrigation was limited to 35 % of the field capacity. In this group, irrigation
was interrupted for a period of nine days (d). Then the irrigation of the stressed plants
was resumed for a period of seven days (r).
In the hop plants, at the development stages 12.BBCH through 25.BBCH, selected
physiological parameters [photosynthesis rate (PN), transpiration rate (E) and stomatal
conductivity (gs)] were measured by means of an infrared gas analyser LCpro+. The
physiological characteristics were measured under constant illumination at 740 µmol
and temperature of 25 °C.
The levels of physiological characteristics obtained in the measurement were
statistically processed in the STATISTICA Cz software, version 7.0.
Results and discussion
The levels of the monitored physiological parameters of the stressed hop plants obtained
in the measurement are stated in figure 1-3. After the irrigation was interrupted and
gradual dehydration was induced, all the monitored physiological characteristics
decreased. As early as on the second day after limitation of the irrigation (dehydration),
a statistically conclusive decrease of stomatal conductivity and transpiration rate was
recorded. These results are in accordance with the works, for example, by Živčák et al.
(2008), Ahmadi, Siosemardeh (2005), Lia et al (2005), who mention a decrease of
stomatal conductivity in common wheat after exposure to water deficit.
On the ninth day of dehydration, the stomatal conductivity reached the order of
thousandths (0.003 mol m-2
s-1
) and the photosynthesis rate (5.32 µmol CO2 m-2
s-1
) and
the transpiration rate (0.987 mmol H2O m-2
s-1
) were also hovering at very low levels in
comparison with the plants in the control group, as shown in figure 1-3. The decrease of
transpiration rate after exposure of wheat plants to water deficit is mentioned, for
example, by Meng et al. (2006), Lu et al. (2005).
As compared with the stressed plants, in the plants from the control group, a gradual
increase of the photosynthesis rate was observed in the monitored period because the
photosynthesis rate was 12.603 µmol CO2 m-2
s-1
at the beginning of the experiment and
13.612 µmol CO2 m-2
s-1
at the end of the experiment. The photosynthesis rate levels
were oscillating within the range of the levels, which are stated for hop plants by
Hniličková et al. (2007, 2008) in her work. The transpiration rate of the plants from the
control group did not show any increase or decrease during the experiment. The
transpiration rate hovered within the range from 2.987 mmol H2O m-2
s-1
(the 8th
day of
dehydration) to 3.698 mmol H2O m-2
s-1
(the 2nd
day of rehydration). The transpiration
rate levels of the hop plants from the control group were higher than the ones stated, for
example, by Hniličková et al. (2008).
A decrease of the photosynthesis and transpiration rates, depending on water deficit, is
confirmed, for example, by Bodi and Pepo (2007), Csajbók et al. (2007, 2008) for maize
plants, by Hniličková et al. (2008) for hop plants.
After irrigation of the stressed plants had been resemed, we monitored the regeneration
of the individual physiological functions for a period of seven days. The stomatal
conductivity, the transpiration rate and the photosynthesis rate were increasing in the

VIII. Alps-Adria Scientific Workshop Neum, Bosnia-Herzegovina, 2009
DOI: 10.1556/CRC.37.2009.Suppl.2 303
0
2
4
6
8
10
12
14
16
0 1d 2d 6d 7d 8d 9d 2r 4r 6r
day
PN (
µµ µµm
ol
CO
2.m
-2.s
-1)
control stress
stressed plants but did not reach pre-stress levels during the monitored period because at
the beginning of the experiment, the following levels were identified in the
measurement: gs was 0.218 mol m-2
s-1
; E was 3.381 mmol H2O m-2
s-1
; and PN was
12.603 µmol CO2 m-2
s-1
. The most significant increase was observed in photosynthesis,
the rate of which reached 55.64% as compared to the photosynthesis rate before the
stress. The gs and E were hovering at 49.54% and 38% of the initial level, respectively.
0.000
0.050
0.100
0.150
0.200
0.250
0.300
0 1d 2d 6d 7d 8d 9d 2r 4r 6r
day
gs
(mo
l.m
-2.s
-1)
control stress
Figure 1. The measurement readings of the Figure 2. The measurement readings of the
photosynthesis rate stomatal conductivity
(the day of dehy dration and rehydration) (the day of dehydration and rehydration).
0
1
1
2
2
3
3
4
4
5
0 1d 2d 6d 7d 8d 9d 2r 4r 6r
day
E (
mm
ol
H2O
.m-2
.s-1
)
control stress
Figure 3. The measurement readings of the transpiration (the day of dehydration and rehydration).
From the set of readings, we used a regression and correlation analysis to establish the
correlation between the PN and E in the stressed and control plants and the gs. Both
parameters of the stressed plants show a very strong correlation. The correlation
coefficients were 97% and 98% for the photosynthesis rate and the transpiration rate,
respectively. Similar correlation was also identified in the plants from the control group.
The results of Xu et al. (2007) show a significantly positive correlation between
photosynthesis and stomatal conductivity. This conclusion was confirmed according to
the calculated correlation coefficient not only for photosynthesis rate but also for
transpiration rate. In conclusion, it is possible to state in agreement with Strauss,
Agenbag (2000) that measuring the gas exchange rate is a useful parameter for
identifying the water stress in plants.

Vol. 37, 2009, Suppl. Cereal Research Communications
304
Conclusions
It is apparent from the obtained results that after irrigation is interrupted, the levels of
gs, E and PN significantly decrease. After nine days of stress, gs reached almost a zero
level and PN was 5.320 µmol CO2 m-2
s-1
and E was 0.987 mol H2O m-2
s-1
. When
irrigation was resumed, gs, E and PN increased. At the end of the experiment, the
photosynthesis rate reached 62 % of the pre-stress level and the stomatal conductivity
and transpiration rate reached 38 % of the pre-stress level. The measuring the gas
exchange rate is a useful parameter for identifying the water stress in plants.
Acknowledgements
The article was supported by the project of the MEYS Czech Republic no. 6046070901.
References
Ahmadi A.- Siosemardeh A.: 2005: Investigation on the physiological basis of grain yield and drought
resistance in wheat: leaf photosynthetic rate, stomatal conductance, and non-stomatal limitations.
International Journal of Agriculture and Biology, 7: 5. 807-811.
Bodi Z. - Pepo P.: 2007: Trends of pollen production and tassel area index in yellow lines- hybrids and blue
corn landraces. Cereal Research Communication, 35: 2. 277-280.
Csajbók J. - Kutaly E. - Borbéry Hunyady E.- Lesznyák M.: 2007: Comparing the photosynthetic aktivity of
maize- winter wheat- potato and some significant weed. Cereal Research Communications, 35: 2. 325-
328.
Csajbók J.- Kutasy E.- Borbély Hunyadi É.- Lesznyák M.: 2008: Effect of soil moisture on the photosynthetic
activity and transpiration of plants. Cereal Research Communications, 36: Suppl. S. 603-606. Hniličková H.- Hnilička F.- Krofta K.: 2007: Determining the saturation irradiance and photosynthetic
capacity for new perspective varieties of hop (Humulus lupulus L.). Cereal Research Communication, 35: 2. 461-464
Hniličková H.- Hnilička F.- Krofta K.: 2008: The effect of weather on the hops´s photosynthesis and
transpiration rate. Cereal Research Communications, 36: Suppl. S. 887-890.
Kuklová M.- Kukla J.: 2008: Accumulation of macronutrients in soils and some herb species of spruce
ecosystems. Cereal Research Communications, 36: Suppl. S. 1319-1322.
Liao J.X.- Chány J.- Wang G.X.: 2005: Stomatal density and gas exchange in six wheat cultivars. Cereal
Research Communications, 33: 4. 719-726.
Lu L.H.- Li Y.M.- Hu Y.K.: 2005. Effect of water stress on photosynthetic characteristics and yield
characters of two wheat cultivars with different resistances to drought. Journal of Agricultural University
of Hebei, 28: 3. 15-30.
Meng Z.J.- Bian X.M.- Liu A.N.- Pang H.B.- Wang H.Z.: 2006. Effect of regulated deficit irrigation on
physiological and photosynthetic characteristics of winter wheat and its optimized combination with
agronomic techniques. Journal of Triticeae Crops, 26: 2. 86-92.
Straus J.A.- Agenbag G.A.: 2000. The use of physiological parameters to identify drought tolerance in spring
wheat cultivars. South African Journal of Plant and Soil, 17: 1. 20-29.
Várallyay G.: 2008: Extreme soil moisture regime as limiting factor of the plants´ water uptake. Cereal
Research Communications, 36: Suppl. S. 3-6.
Vegh K.R.- Rajkai K.: 2006: Root growth and nitrogen use efficiency of spring barley in drying soil. Cereal
Research Communications, 34: 1. 267-270.
Xu Ch.- Jing R.- Mao X.- Jia X.- Chang- X.: 2007: A wheat (Triticum aestivum) protein phosphatase 2A
catalytic subunit gene provides enhanced drought tolerance in tobacco. Annals of Botany, 99: 3. 439-450
Zivcak M.- Brestic M.- Olsovska K.: 2008: Assessment of physiological parameters useful in screening for
tolerance to soil drought in winter wheat (Triticum aestivum L.) genotypes. Cereal Research
Communications, 36: Suppl. S. 1943-1946.

VIII. Alps-Adria Scientific Workshop Neum, Bosnia-Herzegovina, 2009
DOI: 10.1556/CRC.37.2009.Suppl.2 305
MANAGEMENT OF PLANT-BENEFICIAL MICROBES TO BALANCE FERTILISER INPUTS IN MAIZE (Zea mays L.)
Zoltán BERZSENYI – Györgyi MICSKEI – Eszter SUGÁR
Crop Production Department Agricultural Research Institute of the Hungarian Academy of Sciences,
2462 Martonvásár, Hungary
Abstract: The effect of three microbial consortia (comprise of Azospirillum, Pseudomonas and Glomus strains) was studied on the growth, physiological parameters and yield of maize under different fertilisation
conditions in a long-term experiment within an international research project. Fertilisation had a significant
effect on the shoot and root growth and the root/shoot ratio. The microbial consortia affected the root/shoot
ratio. The effect of the fertilisation treatments was characterised by the nutrient stress parameter based on the
mean absolute growth rate (AGR). Among physiological parameters, only the fertilisation treatments had
significant effect on the leaf area and the chlorophyll content. Fertilisation had significant effect on the grain
yield of maize and its protein content. Only the grain protein content was affected significantly by microbial
consortia.
Keywords: maize, long-term experiment, fertilisation, microbial consortia, dry matter, nutrient stress
Introduction
The objective of the international research project was to develop and validate
integrated farming practices based on the management of indigenous and inoculated
plant-beneficial microbes in the maize rhizosphere, so as to reduce chemical fertiliser
usage in maize monoculture. The project was focused on synergistic consortia of
multifunction microbes comprising the two PGPR Azospirillum and Pseudomonas, and
mycorrhizal fungus Glomus. The research included the development of a plant-microbe
interaction toolbox, selection of synergistic microbial consortia, identification of
inoculant-friendly maize genotypes. Our task in the project was the implementation of
field trials and agronomic monitoring of crop quality and yield.
Materials and methods
The effect of microbial consortia on maize growth and grain yield was studied in 2008
at Martonvásár in a long-term experiment established by Gyırffy in 1961. The soil of
the experimental area is a humus-rich loam of the chernozem type with forest residues,
poorly supplied with available phosphorus, but well supplied of potassium. The
experiment was set up in a split-plot design, the main plot was the fertilisation and the
sub-plot was the microbial consortia. The long-term experiment included 5 fertilisation
treatments: A: control, without fertilisation (N0P0K0), B: N50P24K43, C: N100P48K87, D:
N200P96K174, E: N300P144K261. Three microbial inoculation treatments were studied: C0:
control, no microbial consortia, but non-inoculated carriers (peat and zeolite) were used,
C1: A. lipoferum CRT1 + P.fluorescens Pf153 + G. intraradices JJ129, C2: A. lipoferum
CRT1 + P.fluorescens F113 + G. intraradices JJ129. Sowing date was April 25 and
inoculant-friendly PR37Y15 maize hybrid was sown with a plant density of 70 000
plants ha-1
. The weather conditions were favourable for maize production in 2008.
During the vegetation period the amount of rainfall was 483 mm, the average
temperature was 18.0°C, and the cumulated global radiation was 329 MJ m-2
. The shoot
and root weight was measured in five sampling dates and the main phonological phases
were recorded. Leaf area was measured by a portable leaf area meter (LA 300A) and the
chlorophyll content with a SPAD 502 chlorophyll meter on the leaf under the ear after

Vol. 37, 2009, Suppl. Cereal Research Communications
306
flowering, while the grain yield and protein content of the yield was determined at
harvest.
The data at each sampling dates were analysed by the two-factorial variance analysis,
and the measurements combined over time were evaluated with the three-factorial
variance analysis. Mean values of absolute growth rate (AGR) were calculated from the
shoot and root dry weight data according to Hunt (1982). Nutrient stress is a
quantitative estimate of the intensity of current nutrient deficiency in a plant (Izsáki
2007, Sárvári et al. 2007, Berzsenyi - Dang 2008). The relative shortfall can be
expressed as a percentage (Greenwood 1976): 100∗[(AGR at maximum NPK response)
– (AGR at deficiency)]/(AGR at maximum NPK response).
Results and discussion
The effect of fertilisation was significant on the dry weight of the shoot, on the
root/shoot ratio and, with the exception of the first sampling date, on the dry weight of
the roots as well. The values of these parameters increased significantly at the higher
fertilisation rates (D-E treatments) at every sampling times (Table 1.). The effect of the
microbial consortia was only significant for the root/shoot ratio in the third and fourth
sampling dates. The seasonal dynamics of shoot and root dry weight accumulation
according to fertilisation and microbial consortia are shown on Figure 1. It is clear that
shoot- and root weights increased constantly throughout the investigated period in every
treatment. The three-factorial variance analysis showed that the effect of fertilisation,
sampling date and their interaction was significant. As a result of fertilisation, from the
third sampling date the shoot and root dry weight was significantly higher in D-E
treatments, comparing with the other treatments. The effect of microbial consortia was
not significant (Figure 1).
Table 1. The effect of fertilisation levels and microbial consortia on the shoot and root weight (g plant-1), the
root-shoot ratio (R/S) and grain dry weight (g plant-1) in the long-term experiment in 2008
1st sampling (13-14 May)
2nd sampling (2-3 June)
3rd sampling (23-24 June)
4th sampling (21-22 July)
5th sampling (6 -7Sept)
Treat- ments Shoot
DM Root DM R/S
Shoot DM
Root DM R/S
Shoot DM
Root DM R/S
Shoot DM
Root DM R/S
Shoot DM
Grain DM
Fertility levels
A 0.15b 0.22 1.60a 4.8b 1.06c 0.23a 47.5c 8.6c 0.18b 156.8c 28.6c 0.18b 281.8 148.4
B 0.14b 0.21 1.59a 5.1b 1.19c 0.23a 53.7c 10.4bc 0.19ab 177.4bc 29.3c 0.17b 273.5 148.3
C 0.16b 0.22 1.58a 6.5b 1.40bc 0.22a 58.5c 12.3b 0.21a 234.8a 40.3bc 0.17b 329.5 175.8
D 0.20a 0.22 1.17b 9.0a 1.67b 0.19b 83.8b 17.5a 0.21a 221.7ab 45.1ab 0.20ab 330.7 173.8
E 0.21a 0.22 1.10b 10.3a 2.09a 0.20b 97.2a 18.0a 0.19b 239.8a 56.5a 0.23a 341.1 179.6
F test *** NS *** *** *** * *** *** * ** ** ** * *
Microbial consortia
C0 0.18a 0.22 1.41 7.2 1.5 0.21 66.4 13.8 0.21a 199.3 44.6 0.22a 311.1 162.4
C1 0.16a 0.21 1.42 7.2 1.5 0.22 67.6 13.1 0.19b 213.4 39.3 0.18b 314.1 170.0
C2 0.17ab 0.22 1.39 7.0 1.4 0.21 70.4 13.2 0.19b 205.6 36.0 0.18b 308.9 163.2
F test NS NS NS NS NS NS NS NS * NS NS * NS NS Means followed by the same letter do not differ significantly at P = 0.05 within the same treatments.
***, **, * Significant at the P=0.1%, P=1% and P=5% levels, respectively; NS=non-significant.

VIII. Alps-Adria Scientific Workshop Neum, Bosnia-Herzegovina, 2009
DOI: 10.1556/CRC.37.2009.Suppl.2 307
The mean absolute growth rate (AGR) in each fertilisation treatment was calculated
based on the shoot and root dry matter accumulation. The AGR was the lowest in the A-
B treatments and the highest in the C-E treatments in each sampling periods. The values
of AGR for the shoot growth were the followings (g plant-1
day-1
): A: 2.88, B: 2.94, C:
3.61, D: 3.62 and E: 3.81. Nutrient stress parameters were calculated from the AGR
values according to Greenwood (1976) as a comparison of all the other fertilisation
levels to fertilisation level E (%): A: 52.5, B: 47.1, C: 38.1, D: 13.0. The AGR values of
dry matter accumulation in roots were lower (g plant-1
day-1
): A: 0.54, B: 0.56, C: 0.76,
D: 0.87 and E: 1.07. The nutrient stress values indicating root growth impair, compared
to level E were the followings (%): A: 51.9, B: 47.0, C: 32.1, D: 25.4.
150
100
50
24.0 6
0
14.05 22.07
3 50
250
3 00
200
03.06 06. 09
E
ABCD
3 50
14. 05 24.06 06. 09
3 00
0
03.06
50
100
22.07
150
200
250
C1C0
C2
30
50
03.0614.05
10
22.07
40
0
24.06
20
60
A
EDCB
40
50
14.05 03.06 24.06
20
30
22.07
10
0
C1C2
C0
Figure 1. Effect of fertilisation levels (A – E) and microbial consortia (C0, C1, C2) on the dynamics of shoot
and root dry matter accumulation in 2008. Vertical bars indicate the standard errors of the means.
Figure 2. shows the effect of fertilisation and microbial consortia on the leaf area and
chlorophyll content of the leaf under the ear, as well as the grain yield and grain protein
content. The fertilisation had a significant effect on the leaf area and the values in the
different treatments were the followings (cm2): A: 598.4, B: 620.6, C: 671.2, D: 711.5
and E: 731.1. The SPAD values presenting the chlorophyll content of maize plants
increased steadily until fertilisation level D and the values were the followings: A: 45.2,
B: 53.2, C: 56.0, D: 57.9 and E: 56.9. The microbial consortia did not have significant
effect neither on the leaf area under the ear, nor on the chlorophyll content. Fertilisation
had a significant effect on the maize grain yield (Figure 2). The grain yield of maize
increased until the fertilisation level C and was the followings in the different treatments
(t ha-1
): A: 10.45, B: 12.11, C: 13.71, D: 13.51 and E: 12.27 (LSD5%=1.24). The
microbial consortia had no significant effect on the grain yield (t ha-1
): C0: 12.09, C1:
12.76, C2: 12.39 (LSD5%= 0.934). Both fertilisation and microbial consortia had a
Sho
ot d
ry m
atte
r (g
pla
nt-1
)
Sampling date
Sampling date
Sho
ot d
ry m
atte
r (g
pla
nt-1
) R
oot d
ry m
atte
r (g
pla
nt-1
)
Roo
t dry
mat
ter
(g p
lant
-1)
Sampling date
Sampling date

Vol. 37, 2009, Suppl. Cereal Research Communications
308
significant effect on the protein content of the grain. Grain protein content of the
different fertilisation levels were the followings (%): A: 6.08, B: 7.22, C: 8.10, D: 8.51,
E: 8.84, whereas in case of microbial consortia the following values were measured
(%): C0: 7.60, C1: 7.61, C2: 8.04.
CB E0
4
8
D
12
A
6
10
14
2
C0C1C2
A C E
6
8
10
2
4
0B D
C0C1C2
CB D0
200
4 00
E
6 00
A
3 00
500
700
100
C0C1C2
CB E
0
20
40
D
60
A
30
50
70
10
C0C1C2
Figure 2. Effect of fertilisation levels and microbial consortia (C0, C1, C2) on the leaf area under ear, the
chlorophyll content (SPAD values), grain yield and grain protein content in 2008
Conclusions
The long-term fertilisation experiments provided a unique possibility for the
investigation of the effect of microbial consortia under different nutrient conditions. In
order to estimate the effect of microbial consortia on the productivity and nutrient
supply of maize plants, further productivity investigations and eco-physiological
measurements are needed in field experiments over several years.
Acknowledgements
A specific Targeted Research Project (N°036314) supported through the Six Framework
Programme for Research and Technical Development and by OTKA (K61957).
References
Berzsenyi Z. – Dang Q.L.: 2008. Effect os sowing date and N fertilisation on the yield and yield stability of
maize (zea mays L.) hybrids in a long-term experiment. Acta Agronomica Hungarica, 56: 247-264.
Greenwood E.A.N.: 1976. Nitrogen stress in plants. Advances in Agronomy, 28: 1-36.
Izsáki Z. : 2007. N and P impact on the yield of maize in a long-term trial. Cereal Research Communications,
35: 4. 1701-1711. Hunt, R.: 1982. Plant growth curves: The functional approach to plant growth analysis. Edward Arnold,
London.
Sárvári M. – El Hallof N. – Molnár Zs.: 2007. Effect of determining factors on maize yield with special
regards to plant density. Cereal Research Communications, 35: 1. 1037-1040.
Pro
tein
con
tent
(%
)
Gra
in y
ield
(t h
a-1)
Leaf
are
a (c
m2 )
SP
AD
val
ues
Fertilisation levels Fertilisation levels

VIII. Alps-Adria Scientific Workshop Neum, Bosnia-Herzegovina, 2009
DOI: 10.1556/CRC.37.2009.Suppl.2 309
EFFECT OF DROUGHTY CLIMATIC CONDITIONS ON THE FORMATION OF QUALITY PARAMETERS OF WINTER WHEAT FLOUR
Zsuzsanna TARJÁN – Norbert BOROS – Irma GYİRINÉ MILE
Institute of Food Science, Quality Assurance and Microbiology, Agricultural Center, University of Debrecen;
138. Böszörményi út, Debrecen, Hungary, e-mail: [email protected]
Abstract: Nowadays high yield, good baking quality, suitability for intensive production and good adaptation
ability to non optimal conditions are generally required for winter wheat varieties. The more than 130
registered varieties offer a wide range of opportunities to select the right genetic basis being the most suitable
for the cropping location and agronomy. The expression of genetic potential both in yield and quality is highly
influenced by ecological conditions, and under the Hungarian weather conditions, the low level of
precipitation, and this way, the plant available soil moisture is a significant stress factor of production in
almost half of the cropping years. Kosutány (1907) says that quality of wheat is determined first of all by
precipitation and temperature and in the changeable weather conditions of nowadays more and more verify his
findings.
In our study we have analysed the connection between the weather parameters (precipitation, daily average
temperature), as stress factors and protein characteristics quality parameters of winter wheat (protein content,
wet gluten content, gluten index, gluten expansiveness and Zeleny sedimentation volume) to find the weather
parameters and critical periods that had proved effect on the quality of winter wheat flour. Our data are from a
long term field experiment at Látókép, what gives us the possibility to compare years with extreme weather
conditions (as 2006 and 2007) to normal and optimal cropping years for the winter wheat production.
Keywords: weather conditions, protein characteristics, gluten content, glutenindex
Introduction
Qualitative and quantitative success of the chosen species is influenced considerably by
ecological conditions. According to Ragasits quality of wheat is determined decisively
by the habitat and success of good quality is facilitated by advantageous year.
Accordingly adaptability to the variable ecological, mainly weather conditions is a
measure of value characteristics of the individual species (Balogh and Pepó, 2008).
Hornok M. (2008) has made similar observations. Gyıri and Gyıriné (1998) have found
that the year essentially influence the uptake and utilization of elements.
Lelley and Rajtháthy think, that northern boundary of wheat growing is the latitude
where the from May to September the monthly average temperature is above 14 ºC,
while on the southern boundary it doesn’t exceed 23-25 ºC during graining. Kosutány
(1907) says quality of wheat is determined first of all by precipitation and temperature,
while according to Vida and Jolánkai (1995) the appropriate supply of precipitate is the
most important parameter (copious rainfall in April and May, moderate in June and
July). On the basis of the results of a species-comparative analysis carried out on
chernozem we looked for connection between the annual trend of weather parameters
(total precipitation, average temperature) as stress factors and some quality parameters
(wet gluten content, gluten index, gluten expansiveness and Zeleny-number) to find
weather parameters and critical periods that have proved effect on the quality of winter
wheat flour.

Vol. 37, 2009, Suppl. Cereal Research Communications
310
Materials and methods
Samples are from the Látókép Experimental Station of University of Debrecen, Centre
of Agricultural Sciences. It has calcareous chernozem soil with a 70-90 cm deep humic
layer, the humus content 2,8-3 %.
Considering the weather conditions of the examined periods, significant differences
were between the quality of two examined periods (Table 1. and 2.)
Table 1. Amount of precipitation in the year
Precipitation (mm)
Okt Nov Dec Jan Febr Marc Apr May Jun Jul
2005-2006 7.0 12.6 83.5 22.5 44.2 79.0 92.3 58.3 77.1 31.0
2006-2007 22.9 9.2 5.0 23.9 53.2 14.0 3.6 54.0 22.8 40.0
Table 2. Daily average temperature in the year
Daily average temperature (0C)
Okt Nov Dec Jan Febr Mar
c Apr May Jun Jul
2005-2006 10.8 3.5 0.2 -3.4 -1.4 3.2 12.1 15.4 18.6 23.2
2006-2007 11.3 6.2 2.2 3.7 4.1 9.1 12.6 18.4 22.2 23.3
Regarding the autumn-winter period of the production 2005-2006 the amount of
precipitation was significant, the highest amount fell in December: 83.5 mm, while in
the production year 2006-2007 only 5.0 mm fell in this month. In the spring and
summer months there is a more significant deviation between the two production years.
In 2005-2006 the amount of precipitation was square, in all months there was a lot
precipitation, the highest amount fell in April: 92.3 mm. In the spring-summer months
of 2006-2007 the amount of precipitation was low, the highest amount fell in May: 54.0
mm. The studied plots were treated with optimal fertilizer dosages: 120 kg ha-1
N, 90 kg
ha-1
P2O5, 106 kg ha-1
K2O.
The samples of wheat flour were prepared on laboratory mill Metefém QC-109 using a
250 µm large sieve. The wet gluten and the gluten expansiveness was determined upon
the standard MSZ-ISO-5531:1993 by LABOR-MIM and Glutomatic Perten 2200 gluten
washers and 2015 centrifuge, while the Zeleny sedimentation volume was measured
upon the standard MSZ ISO-5529:1993 in the lab of the University of Debrecen, Centre
of Agricultural Sciences and Engineering, Institute of Food Science, Quality Assurance
and Microbiology. We measured all variants in four replications.
The evaluation of the results was done with the basic methods of descriptive statistics
(average, standard deviation) and with ANOVA. The figures about averages and
standard deviations were made by Microsoft Excel 2003.

VIII. Alps-Adria Scientific Workshop Neum, Bosnia-Herzegovina, 2009
DOI: 10.1556/CRC.37.2009.Suppl.2 311
Results and discussion
The annual effect on wet gluten content of measured species is shown in Figure 1. Under wet conditions the wet gluten content of winter wheat is higher than under dry,
milder climatic circumstances. In case of the studied species this tendency can be
observed, except for MV Suba that wet gluten content wasn’t affected by the weather.
We found the highest difference in case of the GK Békés: it was 24 % between the two
years. We observed significant deviation also in case of GK Kapos. The change of
Zeleny sedimentation volume (Figure 3.) was similar to the change of wet gluten
content. In humid production year 2005-2006 the Zeleny sedimentation volume of every
species was higher than in 2007. The difference between the two production years was
the highest in case of species GK Kapos. The Zeleny sedimentation volume in 2005-
2006 was 63.75 ml, while this value was only 39.75 ml in 2006-2007. The difference
was significant at P<0.05. In Figure 2. the gluten index is shown depending on the
production years and studied species. The more humid wetter increased the gluten
content (Figure 1.), in contrast the quality of gluten decreased (Figure 2.). In case of the
studied species the gluten index was higher in 2006-2007 than in 2005-2006. We found
a significant difference between species MV Suba, MV Mazurka, GK Békés and GK
Kapos in the two years (P<0,05). The gluten expansiveness (Figure 4.) is an important
quality parameter as well. There was a significant difference in the gluten expansiveness
of species GK Békés, GK Kapos, MV Mazurka and Lupus (P<0.05). Regarding the GK
Kapos this difference is 39 %.
0
5
10
15
20
25
30
35
40
45
50
Lupus Gk Kapos Gk Békés MV
Mazurka
MV Suba
varieties
wet
glu
ten
co
nte
nt,
%
2006
2007
Figure 1. Effect of weather conditions on the wet
gluten content of winter wheat varieties
0
20
40
60
80
100
120
Lupus Gk Kapos Gk Békés MVMazurka
MV Suba
varieties
gluten inde
x
2006
2007
Figure 2. Effect of weather conditions on the
glutenindex of winter wheat varieties
0
10
20
30
40
50
60
70
Lupus Gk Kapos Gk Békés MV
Mazurka
MV Suba
varieties
Zele
ny
's v
olu
me
, m
l 2006
2007
Figure 3. Effect of weather conditions on the
Zeleny’s volume of winter wheat varieties
0
1
2
3
4
5
6
7
Lupus Gk Kapos Gk Békés MV
Mazurka
MV Suba
varieties
glu
ten
ex
pan
siv
eness
, m
m
2006
2007
Figure 4. Effect of weather conditions on the gluten
expansiveness of winter wheat varieties

Vol. 37, 2009, Suppl. Cereal Research Communications
312
Conclusions
This study showed that the weather conditions are able to influence the gluten properties
of winter wheat samples. However, we have observed that various varieties very much
distinctly react to change of mean yearly rainfall and average daily temperature.
In 2006, wet gluten content and Zeleny sedimentation volume of the investigated flours
improved due to the wetter and cooler weather conditions, but the quality of gluten
decreased. While, in the year with dry and hot weather, the quantity of wet gluten was
less, but the quality properties of gluten were excellent.
References
Balogh Á., Pepó P. (2008): Crop year effects on the fertilizer responses of winter wheat (Triticum aestivum
L.) genotypes, Cereal Research Communications Vol. 36 pp.: 731-734
Gyıri Z.-Gyıriné Mile I. (1998): Quality and qualification of winter wheat. Mezıgazdasági Szaktudás Kiadó,
Budapest
Hornok M. (2008): Effects of the most important agrotechnical elements on the yield of winter wheat, Cereal
Research Communications Vol. 36 pp.:1243-1246
Kosutány T. (1907): The Hungarian winter wheat and Hungarian flour in aspect of farmer, miller and baker.
Molnárok Lapja Könyvnyomdája, Budapest
Lelley J.-Rajháthy T. (1955): The winter wheat and cross breeding . Akadémiai Kiadó. Budapest.
Ragasits I. (1997): Agrotechnical elements and the quality of winter wheat. Gyakorlati Agrofórum 13. 4-7.
Vida Gy.-Jolánkai M. (1995): Study of different winter wheat varieties with various baking qualities by
different wheater conditions and cropping parameters. Növénytermelés. 44.1. 43-54.

VIII. Alps-Adria Scientific Workshop Neum, Bosnia-Herzegovina, 2009
DOI: 10.1556/CRC.37.2009.Suppl.2 313
EFFECTS OF SOME STRESS FACTORS ON ALLELOPATHY István DÁVID
1 – Mária BORBÉLY
2
1 Department of Plant Protection, Faculty of Agronomy, University of Debrecen, H-4015, Debrecen, POB 36,
Hungary, e-mail: [email protected] 2 Institute of Food Processing, Quality Control and Microbiology, Faculty of Agronomy, University of
Debrecen
Abstract: Allelopathy of three spreading, noxious weed species (velvetleaf – Abutilon theophrasti Medic.,
jimsonweed – Datura stramonium L., cocklebur – Xanthium italicum Mor.) were studied in 2008. These
species can impose their allelopathy on other plants, but in many cases investigators can their different effects
in several experiments, so their real allelopathic effects are questionable. Some investigators suggested that
several environmental (abiotic and biotic) factors may play role in allelopathic relationships, and can modify it
significantly. Effect of drought stress and temperature were studied on allelopathy of the three weeds imposed
on test plants (cress – Lepidium sativum). Germination and growth of test plant were evaluated, and
concentrations of some allelochemicals were measured in donor plants. It was found that all examined
environmental factors had significant effect on allelopathy of velvetleaf, jimsonweed and cocklebur appeared
in responses of test plant and amounts of allelochemicals.
Keywords: allelopathy, environmental factor, stress, velvetleaf, jimsonweed, cocklebur
Introduction
Allelopathy of several weeds was identified in biotests, and it was observed under
natural conditions in agroecosystems in many cases. Allelopathy of noxious weeds, i. e.
velvetleaf (Abutilon theophrasti Medik.), cocklebur (Xanthium italicum Mor.),
jimsonweed (Datura stramonium L.) was proved long time ago, and it supposed to play
determinant role in competitiveness of them. However, real role of allelopathy is
controversial in competition of plants and in non-herbicidal weed management methods.
One of main reason of antinomic estimation of allelopathy is its changeability:
allelopathy of plants or microorganisms expresses in different degree and manner in
several experimets.
Rice (1964) called attention to several factors which can modify allelopathical
relationship of plants and microorganisms. He found that age of plant parts influence
their allelophatic effects depending on species. He observed differences in allelopathy
of plants falling within the same species depending on phenological stages, and found
differences when there was no inequality in maturity. In these cases he supposed that
environmental factors can modify allelopathy.
According to Kazinczi et al. (1991) main factors which can influence effect of
allelopathy are used plant parts (leaf, stem or root), maturity of plant parts, examined
live process, plant species (perhaps cultivars). Allelopathic plants contain mixtures of
several types of allelochemicals (flavonoids, polyphenols, phenoloids, etc.) (Kazinczi et
al. 2007.), so final effect depends on their ratio and interactions.
Dias and Dias (2000) examined the effect of drought stress on expressing of allelopathy
in case of jimsonweed as donor and cucumber as test plant. Differences were found
among effect of plants grown under different water supply levels, furthermore age of
plant parts proved to be determinant in amounts of several allelochemicals. Effects of
stress factors was found by several authors (El-Tayeb, 2006; Farooq and Azam, 2007)
Casini (2004) examined allelopathic effect of cocklebur extracts on several maize
hybrids, which had different responses to the same treatments.

Vol. 37, 2009, Suppl. Cereal Research Communications
314
Szabó (2000) proposed to unify experimental methods to decrease methodical
differences and make better reproducibility of experiments.
An uniform methodology may make better reproducibility of experiments, but it must
be based on knowledge of main factors which can effect on allelopathy.
Materials and methods
Allelopathy of Xanthium italicum, Abutilon theophrasti and Datura stramonium was
examined in bioassays. Donor plants were grown in greenhouse in plots on sandy soil in
2008. Soil of plant was kept on 70% ( treatment 1, 5, 9, 13, 17, 21), 50% (treatment 2,
6, 10, 14, 18, 22), 30% (treatment3, 7, 11, 15, 19, 23) of minimum water capacity or
dried to unavailable water content of soil in case of treatment 4, 8, 12, 16, 20, 24 (table
1.). Shoots and roots were collected separately at 4 or 5 leaves stage of plants. Collected
plant samples were stored frozen until drying at 40o C then samples were stored cooled
until use. Extracts were made of 2,5g dried and ground shoot or root in 100 ml water.
Extraction lasted 24 hours at 21o C in darkness. Bioassays were conducted in Petri
dishes (diameter 9cm) with cress (Lepidium sativum) (50 seeds in a dish) under 12
hours light/12 hours dark light regime. Temperature of germination was 20o C in one
case or 10o C in other case.
Root and shoot growth of test plants were measured after 3 and 6 day the establishment
of biotests. Table 1. Treatments
Abbr. of
treatments
Treatments
0 Control Water
1 XS70 Shoot extract of cocklebur grown at 70% of minimum water capacity
2 XS50 Shoot extract of cocklebur grown at 50% of minimum water capacity
3 XS30 Shoot extract of cocklebur grown at 30% of minimum water capacity
4 XSuw Shoot extract of cocklebur grown in soil dried near to unavailable water content
5 XR70 Root extract of cocklebur grown at 70% of minimum water capacity
6 XR50 Root extract of cocklebur grown at 50% of minimum water capacity
7 XR30 Root extract of cocklebur grown at 30% of minimum water capacity
8 XRuw Root extract of cocklebur grown in soil dried near to unavailable water content
9 AS70 Shoot extract of velvetleaf grown at 70% of minimum water capacity
10 AS50 Shoot extract of velvetleaf grown at 50% of minimum water capacity
11 AS30 Shoot extract of velvetleaf grown at 30% of minimum water capacity
12 ASuw Shoot extract of velvetleaf grown in soil dried near to unavailable water content
13 AR70 Root extract of velvetleaf grown at 70% of minimum water capacity
14 AR50 Root extract of velvetleaf grown at 50% of minimum water capacity
15 AR30 Root extract of velvetleaf grown at 30% of minimum water capacity
16 ARuw Root extract of velvetleaf grown in soil dried near to unavailable water content
17 DS70 Shoot extract of jimsonweed grown at 70% of minimum water capacity
18 DS50 Shoot extract of jimsonweed grown at 50% of minimum water capacity
19 DS30 Shoot extract of jimsonweed grown at 30% of minimum water capacity
20 DSuw Shoot extract of jimsonweed grown in soil dried near to unavailable water content
21 DR70 Root extract of jimsonweed grown at 70% of minimum water capacity
22 DR50 Root extract of jimsonweed grown at 50% of minimum water capacity
23 DR30 Root extract of jimsonweed grown at 30% of minimum water capacity
24 DRuw Root extract of jimsonweed grown in soil dried near to unavailable water content

VIII. Alps-Adria Scientific Workshop Neum, Bosnia-Herzegovina, 2009
DOI: 10.1556/CRC.37.2009.Suppl.2 315
Allelochemicals were separated and determined using Merck-Hitachi HPLC (column:
Lichrospher 100RP-18, 125x 4mm, eluent: Methanol: Acetic acid: Acetonitrile 46:2:52,
flow: 0,5 cm3/min, L-4500 Diode Array Detector at 256 nm.
Results and discussion
Extracts had several effects on cress depending on species of donor plants and drought
stress. Shoot extracts had the strongest inhibitory effect when donor plants were grown
in soil dried until unavailable water content. Root extracts did not reduce root length as
much as shoot extracts, and in some cases they stimulated the growth of cress. Some
extracts had contrary effects on test plants germinated at low (10o C) and higher (20
o C)
temperature. (Figure 1)
0%
50%
100%
150%
200%
250%
300%
350%
Ro
ot
len
gth
in %
of
con
tro
l
0 1 2 3 4 5 6 7 8 9 10 11 12 13 14 15 16 17 18 19 20 21 22 23 24 LSD5%
Treatments
Root length (20C)
Root length (10C)
Figure 1. Effect of cocklebur, velvetleaf and jinsonweed extracts on growth of cress.
Amount of several allelochemicals (trans-cinnamic acid, coumarin, p-coumaric,
chlorogenic acid, 2-phenylpropionic acid, 4-hydroxybenzoic acid, trans-4-hidroxy-3-
metoxycinnamic acid) were measured. P-coumaric acid was the most frequently
occuring compound of them (Figure 2). Its concentration ranged from 0.19 to 1.53 mg
g-1
in cocklebur shoots but in other cases concentrations seemed to depend on species
and plant parts not on water supply of plants.

Vol. 37, 2009, Suppl. Cereal Research Communications
316
0,0
0,5
1,0
1,5
2,0
2,5
3,0
3,5
4,0
Co
nce
ntr
atio
n (
mg
/g)
1 2 3 4 5 6 7 8 9 10 11 12 13 14 15 16 17 18 19 20 21 22 23 24
Treatments
p-coumaric acid
Figure 2. Concentration of p-coumaric acid in several plant samples
Conclusions
Significant differences were found in effects of extracts of plants grown under different
water regime, and drought stress seems to make stronger inhibitory effects in case of
shoot extracts. Temperature of bioassays could modify allelopathy, as well.
P-coumaric acid were found in every sample, but other examined compounds were
detectable only in few samples. In this experiment no significant correlations were
found between amounts of compounds and water supply or results of bioassays.
Acknowledgements
This experiments was supported by Hungarian Scientific Research Found (OTKA
F67849)
References
Casini, P. 2004. Allelopathic influences of common cocklebur (Xanthium italicum Moretti) on maize.
Allelopathy Journal 13: 189-199.
Dias, A. S., Dias, L. S. 2000. Effects of drought on allelopathic activity of Datura stramonium L. Allelopathy
Journal 7: 273-278.
El-Tayeb, M. A. 2006. Differential response of two Vicia faba cultivars to drought: Growth, pigments, lipid
peroxidation, organic solutes, catalase and peroxidase activity. Acta Agronomica Hungarica 54: 1, 25-37.
Farooq S., Azam F.: 2007. Differences in behavior of salt tolerant and salt and water deficiency tolerant wheat
genotypes when subjected to various salinity levels. Cereal Research Communications 35, 1, 63-70.
Kazinczi G., Béres I., Hunyadi K., Mikulás J., Pölös E. 1991. A selyemmályva (Abutilon theophrasti Medic.)
allelopatikus hatásának és kompetitív képességének vizsgálata. Növénytermelés, 40: 321-331.
Kazinczi G., Onorfi A., Szabó L., Béres I., Horváth J., Takács A.P. 2007. Phytotoxic effects of Convolvulus
arvensis weed on crops. Allelopathy Journal 20. 179-194.
Rice, E. L. 1964. Inhibition of nitrogen-fixing and nitrifying bacteria by seed plants. Ecology 45: 824-837.
Szabó L. GY. 2000. Juglone index - a possibility for expressing allelopathic potential of plant taxa with
various life strategies. Acta Botanica Hungarica 42: 295-305

VIII. Alps-Adria Scientific Workshop Neum, Bosnia-Herzegovina, 2009
DOI: 10.1556/CRC.37.2009.Suppl.2 317
THE PERFORMANCE OF SELECTED WINTER WHEAT VARIETIES UNDER WATER DEFICIENT CONDITIONS
Pavlína HRSTKOVÁ
Department of Crop Science, Plant Breeding and Plant Medicine, Faculty of Agronomy,
Mendel University of Agriculture and Forestry in Brno, Czech Republic
Abstract: Commercially grown varieties of winter wheat were evaluated for their tolerance to low-rainfall
cropping environments in South Moravia (Czech Republic) with the aim to provide farmers with reliable
information for variety selection. This region is specific with highly variable rainfall distribution that in most
years causes strong reduction of yield, particularly on well-drained sandy soils. In the years 2006-2008 the
plot trials were conducted at two sites differing significantly in water availability during vegetation period.
Applying incomplete-block design the performance of more than 40 registered varieties was assessed. At site
with high soil and sub-soil moisture average grain yield reached 8.7 t.ha-1. At the second site characterised
with sandy soil the average yield was approx. 3.5 t.ha-1. Several distinctive groups of varieties were identified,
i.e. high yielding varieties suitable for normal conditions, varieties superior on soils with restricted water
availability and also varieties with over average yields in both environments.
Keywords: Triticum aestivum, abiotic stress, drought, varietal response
Introduction
Wheat (Triticum aestivum L.) is the most important crop in the Czech Republic, it
covers more than a half of the production area of cereals (2008 year: 802 324 ha,
average yield 5.60 t.ha-1
). In some areas the productivity of this crop is heavily
influenced by the presence of abiotic stresses, particularly by lack of available water. In
contrast to other semiarid regions, the drought periods in Central Europe fluctuate and
can induce rather sudden stress in some crucial stages of plant development. Hlavinka
et al. (2008) demonstrated that at least in some areas of the CR drought is one of the key
causes of interannual yield variability and has a quantifiable negative effect even within
more humid regions. Under drought, grain yield is determined by the amount of water
the crop extracts from the soil, the efficiency with which this water is converted into
biomass and the fraction of this, which is partitioned to grains. All of these processes
are genetically controlled (Foulkes et al., 2002). Study of varietal response to different
environmental conditions is in general complicated by the genotype by environment
interactions, thus it is a problem to select varieties adapted to less favourable
environments (Farshadfar, Sutka, 2006). Different statistical approaches have been
adapted for identification of superior genotypes (Hill et al, 1998; Mohammadi, Amri,
2008).
Materials and methods
The experiments were located at the Field Research Station of Mendel University of
Agriculture and Forestry in Brno, Žabčice, Czech Republic (longitude 49°01´ N, 16°37´
E; altitude 179 m. s. l.; annual average temperature 9.2 °C; annual precipitation
480 mm). This locality is unique due to presence of heavy loamy soils (gleyic fluvisol,
51 % of clayey particles) with good water retention near to exceedingly permeable
sandy soils of chernozem type formed on a gravel terrace (20 – 28 % of clayey
particles). Each year two parallel plot trials were established on both loamy (A) and
sandy (B) sites. According to regular soil analyses (Mehlich III.) the level of
macronutrients (P; K; Ca and Mg) was characterised as optimum or high in all

Vol. 37, 2009, Suppl. Cereal Research Communications
318
experimental years on both sites, pH (KCl) varied from 6.5 to 7.3 at A site and 5.7 – 5.9
at B site. The availability of nitrogen in soil was also tested. An incomplete block
design (Alpha-design) was used for randomisation within three replicate blocks, the
harvested area of one plot was 10.5 m2. Each year from 42 to 47 current winter wheat
varieties were selected so as to provide information about the response of most grown
commercial varieties. Commonly those comparative trials are done with the use of
irrigation (e.g. Foulkes et al., 2002; Baser et al., 2004), but conditions at our station
allowed us to get significant results naturally. Weather observations included air
temperature, precipitation and the measurement of soil moisture. Plot management
followed the rules of experimental practice, fertilizer application and chemical
treatments were adjusted according to growing conditions and disease occurrence. The
amount of added nitrogen was about 100 kg N.ha-1
at A site and about 70 kg N.ha-1
at B
(sandy) site. An optimum rate for low-cropping environments is considered 40 kg N.ha-1
(Limon-Ortega, 2008). During vegetation period the observation of important
agronomic traits were recorded (earliness, lodging, height of plants, no. of ears per m2),
and after harvest grain yield (kg.m-2
at 14 % of moisture), thousand grain weight (g) and
specific weight (g.l-1
). For statistical analysis Statistica 7 (StatSoft) was used.
Results and discussion
Varietal trials in the years 2006 – 2008 were established on two different sites to test the
response of winter wheat varieties to stress conditions. The chosen fields differed
mostly in the water availability during vegetation; the site A with high level of sub soil
water provided the plants with sufficient moisture even in the periods without rainfall,
the water availability on sandy soil (site B) was restricted mainly from the stage of stem
elongation to harvest. The data provided by the continuous monitoring of soil moisture
confirmed the occurrence of water deficiency on sandy soils (data not given here).
Table 1. Average yield characters for all varieties from trials 2006 - 2008
Character Year No. Site A (normal) Site B (dry)
varieties Mean sd min max Mean sd min max
Yield (kg.m-2) 2006 41 8.6 0.7 6.7 10.1 4.8 0.6 3.6 6.0
Specific weight (g.l-1) 776 25 713 809 723 31 646 778
TSW (g) 42.5 2.8 35.5 48.1 35.7 3.1 30.0 42.0
No.ears (m-2) 639 81 473 788 572 87 398 775
Yield (kg.m-2) 2007 41 8.2 0.5 7.4 9.0 2.6 0.3 1.7 3.3
Specific weight (g.l-1) 794 19 744 840 772 19 722.4 809.2
TSW (g) 42.2 3.1 34.2 47.4 35.2 2.6 30.0 40.9
No.ears (m-2) 695 113 497 975 * * * *
Yield (kg.m-2) 2008 46 9.4 0.4 8.6 10.1 3.1 0.4 1.5 3.9
Specific weight (g.l-1) 791 21 725.8 819.1 763 18 717.6 795.2
TSW (g) 45.2 3.9 36.6 52.3 36.8 3.1 29.7 43.0
No.ears (m-2) 605 70 463 777 386 43 305 522
sd – standard deviation; * not evaluated

VIII. Alps-Adria Scientific Workshop Neum, Bosnia-Herzegovina, 2009
DOI: 10.1556/CRC.37.2009.Suppl.2 319
All yield characters were affected by drought as can be seen from Table 1, average grain
yield from B sites (3.5 kg.m-2
) was only 40 % of the yield from A sites (8.7 kg.m-2
), the
thousand seed weight 83 % (A sites 43,3 g; B sites 35,9 g) and the number of ears per
square meter 74 % (A sites 646; B sites 479). The small differences were detected in
specific weight, only 4 % (A sites 787 g.l-1
; B sites 752 g.l-1
). The observed yield
reduction in dry conditions corresponded with results from similar experiments, e.g.
Márton (2008).
Effects on components of yield depended on the timing of drought. Foulkes et al. (2002)
stated that drought mainly after flowering did not affect the number of ears per area, but
individual grain weight and no. of grain per ear were significantly decreased. More
prolonged drought affected all yield components.
Table 2. Average yield for 20 varieties (2006 – 2008)
Year 2006 Year 2007 Year 2008
Mean sd Mean sd Mean sd
A Site 8.63 0.79 8.33 0.52 9.46 0.38
B Site 4.84 0.51 2.65 0.32 3.12 0.31
sd – standard deviation
The performance of 20 varieties (Table 2), which were included in all three
experimental years, was evaluated by standardised relative yields (SRY). The SRY
describes genetic performance of varieties as relative varietal yields standardised to
equal variance of varietal means within the trial groups. This method was proved as a
simple tool to evaluate trial series and to provide straightforward information on varietal
response to different environments (Schwarzbach, 2007).
Figure 1. Standardised relative yield of 10 varieties in normal (A) and dry (B) conditions
According to SRY, varieties with superior performance in all environments were
identified, e.g. Meritto (aver. SRY 114 %) and Dromos (aver. SRY 112 %); varieties
more suitable to favourable conditions, e.g. Hedvika (A site SRY 125 %, B site SRY
96 %) and Etela (A site SRY 109 %, B site SRY 98 %), and also a few varieties
performing better under stress conditions, particularly Biscay (A site SRY 97 %, B site
0
20
40
60
80
100
120
140
A 2006 A 2007 A 2008 B 2006 B 2007 B 2008
Sta
ndar
dise
d re
lativ
e yi
eld
(%)
Akteur Alacris Arida Biscay Cubus
Dromos Etela Hedvika Meritto Simila

Vol. 37, 2009, Suppl. Cereal Research Communications
320
SRY 107 %) and Cubus (A site SRY 100 %, B site SRY 107 %). The SRY of the 10
most distinctive varieties is given in Figure 1.
Conclusions
The performance of commercial winter wheat varieties grown under stress conditions
was studied and compared with their performance in more favourable environment. The
stress was induced mainly by the limited water availability during crucial stages of the
plant development important for the yield formation. The most affected characters were
grain yield, no. of ears per area and individual grain size. This indicates that the stress
was present even before flowering (lower no. ear.m-2
) and mainly during grain filling
(low TSW). Some varieties with different response were identified using standardised
relative yields, e.g. Hedvika which was well adapted to favourable environments,
Meritto which shoved superior in both environments, and Biscay which might have
specific adaptation to harsh conditions. With predicted climate changes and more
frequent periods of drought not only high yielding varieties, but also those with a
pattern of drought tolerance should be recommended to farmers.
Acknowledgement
Author gratefully acknowledges the financial support of the Grant Agency of Czech
Ministry of Agriculture, project QH 91192.
References
Baser I., Erdem T., Sehirali S., Erdem Y., Orta H., Yorgancilar O. 2004: Effect of different water stresses on
the yield and yield components of winter wheat. Cereal Research Communications, 32 (2): 217-223.
Farshadfar E., Sutka J. 2006: Biplot Analysis of genotype-environment interaction in Durum wheat using the
AMMI model. Acta Agronomica Hungarica, 54 (4): 459–467.
Foulkes M.J., Scott R.K., Sylvester-Bradley R. 2002: The ability of wheat cultivars to withstand drought in
UK conditions: formation of grain yield. Journal of Agricultural Science, 138: 153-169.
Hill J., Becker H.C., Tigerstedt P.M.A. 1998: Quantitative and ecological aspects of plant breeding. Chapman
and Hall, London, UK, p. 275.
Hlavinka P., Trnka M., Semerádová D., Dubrovský M., Žalud Z., Možný M. 2008: Effect of drought on yield
variability of key crops in Czech Republic. Agricultural and Forest Meteorology.
doi:10.1016/j.agrtformet.2008.09.004. (article in press).
Limon-Ortega A., Villaseñor-Mir E., Espitia-Rangel E. 2008: Nitrogen management and wheat genotype
performance in a planting system on narrow raised beds. Cereal Research Communications, 36 (2):
343-352.
Márton L. 2008: Long-term study of precipitation and fertilization interactions on winter wheat (Triticum
aestivum L.) yield in the Nyírlugos Field Trial in Hungary between 1973 and 1990. Cereal Research
Communications, 36 (3): 511-522.
Mohammadi R., Amri A. 2008: Comparison of parametric and non-parametric methods for selecting stable
and adapted durum wheat genotypes in variable environments. Euphytica, 159: 419-432.
Schwarzbach E., Hartmann J., Piepho H.P. 2007: Multiplicative main cultivar effects in Czech official winter
wheat trials 1976-2005. Czech Journal of Genetics and Plant Breeding, 43 (4): 117-124.

VIII. Alps-Adria Scientific Workshop Neum, Bosnia-Herzegovina, 2009
DOI: 10.1556/CRC.37.2009.Suppl.2 321
INCORPORATION OF A WINTER BARLEY CHROMOSOME SEGMENT INTO CULTIVATED WHEAT AND ITS CHARACTERIZATION WITH GISH, FISH AND SSR MARKERS
András CSEH – Klaudia KRUPPA – István MOLNÁR
Agricultural Research Institute of the Hungarian Academy of Sciences, H-2462 Martonvásár, Brunszvik u. 2.,
e-mail: [email protected]
Abstract: Spontaneous wheat-barley translocation chromosomes were detected by genomic in situ
hybridisation (GISH) in the progenies of wheat/barley addition lines produced from the wheat cultivar
Asakaze komugi and the Ukrainan six-rowed barley cultivar Manas. The homozygous translocation line was
selected from a heterozygous translocation line with the help of molecular markers and fluorescence in situ
hybridisation (FISH) using repetitive DNA probes. The wheat chromosome arm involved in the translocation
was identified by FISH as 4BS. The barley chromosome segment could not be unequivocally determined with
the hybridisation of the repetitive DNA sequences used in the present work (Afa family, pSc119.2, pTa71).
The microsatellite marker analysis revealed the presence of an almost complete 7HL chromosome arm, but
the centromeric region of 7HL was missing from this translocation line. The rearranged chromosome,
identified as 4BS.7HL with a centromeric deletion of 7HL, represents a unique genetic material which can be
used for the physical mapping of genes or genetic markers within 7HL. As the barley chromosome 7H is
considered to be the most important chromosome for drought tolerance, the translocation line will make it
possible to reveal the effect of the abiotic stress-related genes situated on the incorporated 7HL segment in the
genetic background of wheat.
Keywords: wheat, barley, 7H chromosome, translocation, microsatellite markers
Introduction
The wide hybridisation of common wheat (Triticum aestivum L.) opens up the
possibility to transfer agronomically useful genes from related species into bread wheat.
Barley (Hordeum vulgare L.), which is tolerant of various abiotic stresses and has good
nutritional parameters, represents a potential gene source for wheat improvement. In
order to transfer agronomically useful traits from barley into wheat a new wheat-barley
hybrid was developed in Martonvásár (Hungary) by crossing the Ukrainan six-rowed
barley cultivar Manas with the Japanese wheat cultivar Asakaze komugi (Molnár-Láng
et al. 2000). After several backcrosses, wheat/barley addition lines were selected from
the progenies. Wheat/alien addition lines are excellent genetic materials for studying the
effect of alien chromosomes in the genetic background of wheat and they can be used as
a starting point for gene transfer from an alien chromosome. Translocation lines can be
selected from the progenies of addition lines. A spontaneous translocation was detected
in progenies of the 7H wheat/barley addition line using GISH. The translocation line
carries 42 chromosomes. The importance of the translocation line is that the long arm of
the 7H chromosome is considered to be the most important genomic region for drought
tolerance (Cattivelli et al. 2002). The objective of the present work was to identify the
chromosomal regions involved in the translocation, and to detect which chromosome
segments have been deleted from the Asakaze komugi/Manas translocation line using
GISH, FISH and SSR markers.
Materials and methods
Plant material: A wheat×barley hybrid was developed previously in Martonvásár
(Hungary) by crossing the Japanese wheat cultivar Asakaze komugi (Triticum aestivum
L.) with the Ukrainian six-rowed winter barley cultivar Manas (Hordeum vulgare L.)

Vol. 37, 2009, Suppl. Cereal Research Communications
322
(Molnár-Láng et al. 2000). The hybrids were backcrossed twice with Chinese Spring
wheat, and the translocation line was selected from the BC2 progenies (Molnár-Láng et
al. 2005).
GISH (Genomic in situ hybridisation): Total genomic DNA from the barley cultivar
Manas and the wheat cultivar Asakaze komugi was isolated using the phenol-
chloroform method described by Sharp et al. (1988). Barley DNA was labelled with
Fluorored (rhodamine-4-dUTP, Amersham) using nick translation. Wheat DNA was
used as blocking DNA at a ratio of 30:1. The in situ hybridisation was carried out
according to Molnár-Láng et al. (2000).
FISH (Fluorescence in situ hybridisation): The GISH hybridisation signals were
washed off the slides in 4×SSC Tween at 25 ºC overnight. The Afa family, pSc119.2
and pTa71 repetitive DNA sequences were used for three-colour FISH. The probe
labelling was carried out as described by Sepsi et al. (2008) and the in situ hybridisation
experiment was performed according to Szakács and Molnár (2008).
SSR marker analysis: Genomic DNA was isolated from three BC2 plants, from
Chinese Spring and from Manas according to Anderson et al. (1992). PCR reactions
were performed in a final volume of 25µl. The reaction mixture contained 25ng of
template DNA, 2× GoTaq Green Master Mix (Promega, USA) and 0.2 µM of both
primers. Amplification was carried out in an Eppendorf Mastercycler (Eppendorf,
Germany), with the corresponding profile described previously for each primer pair.
The following microsatellites were tested: 4BS-specific markers: Xgwm368, Xgwm113
(Roder et al. 1998) and Xbarc1045 (Sourdille et al. 2004); 4BL-specific markers:
Xgwm149, Xgwm165 and Xgwm251 (Röder et al. 1998); 7HS-specific markers: HvM4
(Liu et al. 1996) and Bmag0021 (Ramsay et al. 2000); and 7HL-specific markers: HvID,
Bmag0120, Bmac 0156 (Ramsay et al. 2000), EBmac0827, EBmac0785 (Rostoks et al.
2005) and GBM1102 (Varshney et al. 2006, Hearnden et al. 2007). The PCR products
were separated using 2.5% SeaKem agarose (Cambrex, USA) gels and the fragments
were stained with ethidium bromide. A 50bp DNA ladder (Fermentas, Lithuania) was
used to estimate molecular weights. The patterns were documented and analysed using a
GeneGenius gel documentation system (Syngene, UK).
Results and discussion
A wheat/barley translocation was detected by GISH using barley DNA as a probe (Fig.
1). Using three repetitive DNA probes, FISH identified the wheat chromosome segment
involved in the translocation as 4BS. The presence of 4BS was confirmed with the 4BS
specific markers (Xgwm368, Xgwm113 and Xbarc1045) and the lack of signals for
markers mapped to 4BL (Xgwm149, Xgwm165, Xgwm251) proved the absence of
4BL.
The barley chromosome segment could not be clearly identified using FISH, but the
presence of an almost complete 7HL was proved by the signals given by four 7HL-
specific microsatellites. The elimination of the centromeric region of 7HL was
suggested by the absence of the Afa family signal characteristic of the 7HL centromere
(Fig. 1). The 7HS-specific markers (HvM4, Bmag0021) gave no signals, indicating the
elimination of 7HS.
As a physical map of the 7H-specific SSR markers was not available, the position of the
translocation breakpoint could not be compared to the breakpoint of known deletion

VIII. Alps-Adria Scientific Workshop Neum, Bosnia-Herzegovina, 2009
DOI: 10.1556/CRC.37.2009.Suppl.2 323
lines. The 7HL-specific SSR markers were selected from three genetic maps (Rostoks et
al. 2005, Hearnden et al. 2007, Ramsay et al. 2000). Some of the markers were included
in more then one genetic map, making it possible to compare their positions within
different mapping populations. In the centromeric regions several markers were mapped
genetically within a small distance of each other. Greater distances were found between
markers in the middle of the chromosome arm, while in the telomeric region the
markers were situated closer to each other. The FISH pattern of the translocation
chromosome suggested the absence of the centromeric region of 7HL. Six 7HL-specific
microsatellites were tested in order to identify the eliminated 7HL segment. Two of
these markers (EBmac0785, Ebmac0827) were mapped to the centromeric region
(Rostoks et al. 2005, Hearnden et al. 2007), a third marker (GBM1102) was positioned
near the centromeric region (Varshney et al. 2006, Hearnden et al. 2007), two markers
(Bmag0120, Bmac0156) were mapped near the middle of the chromosome arm
(Ramsay et al. 2000, Hearnden et al. 2007, Karsai et al. 2007), and the sixth marker
(HvID) was the most distal marker on 7HL (Ramsay 2000, Rostoks 2005).
The SSR marker analysis confirmed the results obtained using FISH and proved the
presence of an almost complete 7HL. The absence of two 7HL-specific markers from
the translocation line (EBmac0785 and Ebmac0827), which were previously mapped
genetically close to the centromere, revealed the absence of the 7HL centromeric region.
The translocation breakpoint could be placed between markers Ebmac0827 and
GBM1102 (Fig. 1).
Figure 1: Physical map of SSR markers within the 4BS.7HL translocation, including the centromeric deletion
of 7HL (A) The electrophoretic patterns of the 7HL-specific markers are indicated on the left of the schematic
chromosome while the electrophoretic patterns of the 4BS-specific markers are indicated on the right (1: size
marker 50bp, 2: Chinese Spring wheat DNA, 3: Manas barley DNA, 4, 5, 6: DNAs from the translocation
line). The 4BS.7HL translocation with the centromeric deletion of 7HL was identified by GISH(B) and FISH
(C). The Afa family, pSc119.2 and pTa71 repetitive DNA sequences were used for three-colour FISH.

Vol. 37, 2009, Suppl. Cereal Research Communications
324
Conclusions
The 4BS/7HL translocation line described in the present study makes it possible to
study the effects of genes situated on 7HL. Moreover, this is an excellent genetic
material for the physical mapping of genes or molecular markers in the centromeric
region of 7HL, which plays an important role in drought tolerance. It is planned to test
the drought tolerance of the 4BS/7HL translocation line in order to study the effect of
QTLs involved in drought tolerance in the genetic background of wheat.
Acknowledgements
This work was supported by the Generation Challenge Programme (CGIAR GCP SP3,
G4007, 23), the Hungarian National Research Fund (K 75 381) and Agrisafe 203288
EU-FP7-REGPOT 2007-1. The authors gratefully acknowledge the technical assistance
of Mrs J. Bucsi. Thanks are due to B. Harasztos for revising the manuscript
linguistically.
References
Anderson, J.A., Ogihara, Y., Sorrells, M.E., and Tanksley, S.D. 1992. Development of chromosomal arm map
for wheat based on RFLP markers. Theor. Appl. Genet. 83(8): 1035-1043.
Cattivelli, L., Baldi, P., Crosatti, C., Di Fonzo, N., Faccioli, P., Grossi, M., Mastrangelo, A. M., Pecchioni, N.,
Stanca, A. M. 2002. Chromosome regions and stress-related sequences involved in resistance to abiotic
stress in Triticeae. Plant Molecular Biology 48: 649-665
Hearnden, P. R., Eckermann, P. J., McMichael, G. L., Hayden, M. J., Eglinton, J. K., Chalmers, K. J. 2007. A
genetic map of 1,000 SSR and DArT markers in a wide barley cross. Theoretical and Applied Genetics
115(3): 383-91.
Karsai, I., Szőcs, P., Mészáros, K., Puskás, K., Bedı, Z., Veisz, O. 2007. Barley (Hordeum vulgare L.) marker
linkage map: a case study of various marker types and of mapping population structure. Cereal Research
Communications 35(4): 1551-1562.
Liu, Z. W., Biyashev, R. M., Saghai Maroof, M. A. 1996. Development of simple sequence repeat DNA
markers and their integration into a barley linkage map. Theoretical and Applied Genetics 93: 869-876.
Molnár-Láng, M., Novotny, C., Linc, G., D. Nagy, E. 2005. Changes in the meiotic pairing behaviour of a
winter wheat-winter barley hybrid maintained for a long term in tissue culture, and tracing the barley
chromatin in the progenies using GISH and SSR markers. Plant Breeding, 124: 247-252.
Molnár-Láng, M., Linc, G., Logojan, A., Sutka, J. 2000. Production and meiotic pairing behaviour of new
hybrids of winter wheat (Triticum aestivum) × winter barley (Hordeum vulgare). Genome, 43: 1045-
1054.
Ramsay, L., Macaulay, M., degli Ivanissevich, S., MacLean, K., Cardle, L., Fuller, J., Edwards, K.J.,
Tuvesson, S., Morgante, M., Massari, A., Maestri, E., Marmiroli, N., Sjakste, T., Ganal, M., Powell, W.,
Waugh, R. 2000. A simple sequence repeat-based linkage map of barley. Genetics 156:1997–2005.
Rostoks, N., Mudie, S., Cardle, L., Russell, J., Ramsay, L., Booth, A., Svensson, J. T., Wanamaker, S.
I.,Walia, H., Rodriguez, E. M., Hedley, P.E., Liu, H., Morris, J., Close, T. J., Marshall, D. F., Waugh, R.
2005. Genome-wide SNP discovery and linkage analysis in barley based on genes responsive to abiotic
stress. Molecular Genetics and Genomics 274: 515-527.
Röder, M. S., Korzun, V., Wendehake, K., Plaschke, J., Tixier, M-H., Leroy, P., Ganal, M. W. 1998. A
microsatellite map of wheat. Genetics 149: 2007-2023.
Sepsi, A., Molnár, I., Szalay, D., and Molnár-Láng, M. 2008. Characterization of a leaf-rust resistant wheat-
Thinopyrum ponticum partial amphiploid BE-1 using sequential multicolor GISH and FISH. Theor. Appl.
Genet. 116(6): 825-834.
Sourdille, P., Singh, S., Cadalen, T. G. L., Brown-Guedira, G., Gay, L., Qi, B. S., Gill, P., Dufour, A. M.,
Bernard, M. 2004. Microsatellite-based deletion bin system for the establishment of genetic-physical map
relationships in wheat (Triticum aestivum L.). Functional and Integrative Genomics 4: 12-25.
Szakács, É., Molnár-Láng, M. 2008. Fluorescent in situ hybridisation polymorphism on the 1RS chromosome
arms of cultivated Secale cereale species. Cereal Research Communications 36: 247-255

VIII. Alps-Adria Scientific Workshop Neum, Bosnia-Herzegovina, 2009
DOI: 10.1556/CRC.37.2009.Suppl.2 325
STRESS BY NON-SELECTIVE HERBICIDES: GERMINATING CAPACITY AND STRUCTURAL CHANGES IN THE WEED BEET PLANTS (BETA VULGARIS L.)
Milan SKALICKY
Department of Botany and Plant Physiology, Czech University of Life Sciences Prague, Kamycka 129,
Prague 165 21, Czech Republic, e-mail: [email protected]
Abstract: Weed beet has a negative effect on the sugar beet crop, especially as concerns competition for
nutrients, water and light, which are the factors that significantly influence the yield. Chemical protection
features the highest effectiveness on strongly weeded land (more than 1,000 individuals/ha); the application of
non-selective herbicides (such as Roundup) during the period of blooming is most effective. The germinating
capacity of the weed beet glomeruli exposed to total herbicides was tested. Provable differences in the
germinating capacity were identified between the glomeruli exposed to the non-selective herbicides and the
glomeruli that were not exposed to the herbicides (correlation to the herbicide application/BBCH phase). The
differences in the germinating capacity within one BBCH phase can be explained by the varying size of the
glomeruli. The big glomeruli (more than 4 mm) had the highest germinating capacity; there is a direct
correlation to a higher content of reserve substances. The significantly different specifications of the
morphological signs (shoot length, root length, root form) in weed beets exposed to a total herbicide (in the
phase BBCH 65-69), with the consequence of being stressed, prove its significant influence on the growth and
development of these plants. A high percentage of seeds (glomeruli) exposed to the herbicide survive even
after repeated application of the herbicide (the effect of sclerenchyma pericarp in mature glomeruli) and
maintain their high germinating capacity.
Keywords: Beta vulgaris, glomerulus, herbicide Roundup, BBCH
Introduction
Weed beet can be determined by many physiological and morphological features,
which, however, may not become manifest during its development all at the same time
(e.g. Ungai and Sipos, 2008). Weed beet produces a great amount of seeds with various
dormancy periods. Seed bank dynamics constitute a key process of the annual life-cycle
because they determine not only infestation during the on-going year, but also the
residual risk for subsequent years. As concerns cultivated beets, the germination
capacity of their seeds was examined in many studies (e.g. Gummerson, 1986), but very
little is known about the structure of the glomerulus and the germination capacity of
weed beet. The main difference between cultivated seeds and weed beet seeds is the
presence of primary dormancy in the latter, leading to the emergence of a permanent
seed bank, with seeds being able to survive for several years. The standard included
among the Czech State Standards does not permit any presence of weed beets. The
Ministry of Agriculture of the Czech Republic permitted an exception to this standard
up to the level of 0.05% of weed beet seeds. This means 13 plants per hectare.
According to researches undertaken in the United Kingdom, these 13 plants can produce
up to 20,000 viable seeds; their annual mortality is 30% of the seeds (Longden and
Breay, 1995). As opposed to cultivated beets, the weed beet seeds germinate in a large
range of soil structure and climate conditions (Diprose et al., 1980). The objective of the
experiment was to find out whether the glomeruli of weed beet, stressed by non-
selective herbicides, have a significantly lower germination capacity than the glomeruli
not exposed to herbicides. The objective was also to assess the changes of selected
morphological features in the late stages of development with regard to the stress
generated by total herbicides.

Vol. 37, 2009, Suppl. Cereal Research Communications
326
Materials and methods
The defined issue was addressed experimentally. Weed beet (a form of the species Beta vulgaris L.) was the experimental plant. Its glomeruli were collected from the beet
growing areas in the Czech Republic in the years 2005 and 2006. A glomerulus (also
called “seedball”) is a cluster formed with two to six flowers aggregated during their
maturation. Each flower forms a cavity called cell, which contain one seed if pollination
is successful.
Group A consisted of the glomeruli of weed beet. In BBCH 65-69 (full flowering – end
of flowering, fruit set visible; Meier, 1993), they were treated by a spray of a total
herbicide (Roundup Klasik, 480 g l-1
Glyphosate-IPA) and they were collected at the
stage of BBCH 89 (fully ripe, seed coat final colour, perisperm hard). Group B (the
control group) consisted of the weed beet glomeruli not exposed to total herbicides and
collected at the same BBCH stage. The germination capacity was being identified in the
glomeruli of weed beet under the controlled conditions in climate boxes by means of the
standard methods defined in the ISTA rules (Don, 2006). The laboratory-stored
glomeruli were tested after dormancy ended (8 months – in April 2006 and 2007). For
germination test in the dark, glomeruli were laid directly on pleated paper (pleated
strips, 113 g m-2
, double folds, 2,000 mm × 110 mm, 50S) in a plastic box with 30 ml of
water to ensure non-limiting water conditions (50 glomeruli in one box). The boxes
were closed hermetically to avoid water loss and placed in an incubator at 20 °C. All the
handling actions were carried out in a dark room illuminated by a green inactinic lamp
without any stimulating effect on germination as shown by Colbach et al. (2002). Every
sample was prepared in 4 repetitions and within each taken sample (one plant), the
glomeruli were divided into three size categories (category I – larger than 4.5 mm;
category II – up to 4.5 mm; category III – up to 3 mm). Seed germination in the boxes
in darkness was assessed every 7 days. The final count was carried out after 1 month.
Germination assessment consisted in counting the newly protruding roots.
From each monitored location, 30 weed beet plants exposed to non-selective herbicides
and 30 weed beet plants not exposed to non-selective herbicides were taken at random
for the purpose of phenotype observation. In each plant, its shoot length, root length and
root form were identified. The features were sorted into categories and statistically
assessed depending on the frequency in the given category of the feature, according to
Skalický et al. (2007). A statistical evaluation was carried out by the analysis of
variance with α = 0.05 in the Statistica software (8.0), using the ANOVA module.
Results and discussion
The germination capacity of the glomeruli of the weed beet exposed to non-selective
herbicides was significantly lower than that of the unexposed glomeruli only in one size
category (Figure 1). The germination capacity in group A I and B I was 56% and 73 %,
respectively. In spite of the application of the Roundup herbicide, the weed beet
retained its high germination capacity, especially in the glomeruli larger than 3 mm,
which is probably related to the non-permeability of sclerenchymized pericarp of the
glomeruli. In field conditions, this can be influenced by the method of applying non-
selective herbicides and by other factors (climatic conditions, the height of the sugar
beet plants, the experience of the persons operating the applicator, etc.). The

VIII. Alps-Adria Scientific Workshop Neum, Bosnia-Herzegovina, 2009
DOI: 10.1556/CRC.37.2009.Suppl.2 327
germination capacity levels of the weed beet glomeruli not exposed to herbicides
correspond to the results of Sester et al. (2006). Even the glomeruli (group B) with a
diameter of up to 4.5 mm retain high germination capacity (42 %). The glomerulus size
cat. III had the lowest germination capacity in both groups (8 % in group A and 19 % in
group B). Undoubtedly, the lower content of the reserve substances in the glomeruli has
a significant influence.
var. A - glomerules exposed to Roundup var. B - glomerules not exposed to Roundup0
20
40
60
80
100 size I size II size IIIgerminating capacity%
Figure 1. Comparison of the germination capacity in the weed beet exposed to non-selective herbicides
(Roundup) and not exposed to non-selective herbicides (symbols: size I – III; see Materials and Methods).
shoot lenght root lenght root form
Parameters
0
20
40
60
80
100 cat. I cat. II cat. III R cat. I R cat. II R cat. III
frequency%
Figure 2. Frequency of weed beet individuals monitored in the given trait categories (symbol: R – application
of Roundup). Shoot lenght (cm): cat I. < 99, cat II. 100 – 129, cat III. > 130. Root length (cm): cat I. < 19, cat
II. 20 – 24, cat III. > 25. Root form: cat I. pencil-shaped, cat II. fusiform with distinct horizontal branching,
cat III. beet shaped.
In the plants exposed to non-selective herbicides, significant structural changes,
especially phenotype changes, occurred (Figure 2). Roundup affected the height of the
plants, which is most often up to 100 cm (mean: 78 cm); conversely, the plants not

Vol. 37, 2009, Suppl. Cereal Research Communications
328
exposed to the herbicide have most often stems 100-130 cm long (mean: 118 cm). There
are similar differences in root length where the plants exposed to the herbicides most
often have a root up to 19 cm long (mean: 15 cm) and in the plants not exposed to the
herbicide, the root length oscillates between 19 and 25 cm (mean: 21 cm). The pencil-
shaped form of the root (very long and thin) was observed most often (in both groups).
In all the plants exposed to the herbicide, at least a part of their stems was yellowish or
almost black.
Conclusions
Provable differences were identified between the germination capacities of the
glomeruli exposed and unexposed to non-selective herbicides. The differences in the
germination capacity within the same BBCH stage can be explained by the different
size of glomeruli. Large glomeruli (more than 4 mm) displayed the highest germination
capacity; there is a direct connection with the higher content of reserve substances. The
significantly different levels of selected morphological features in weed beets exposed
to a total herbicide (at the stage BBCH 65-69) and to the subsequent stress confirm its
strong influence on the growth and development of these plants. Chemical protection,
due to its high effectiveness, can be recommended for strongly weeded plots of land
(more than 1,000 individual plants/ha); application of non-selective herbicides (such as
Roundup) during the flowering period seems to be highly effective. A high percentage
of the seeds (glomeruli) exposed to the herbicide survive even after repeated herbicide
treatment (due to the effect of the sclerenchyma pericarp of the mature glomeruli) and
retain a high germination capacity.
Acknowledgements
The article was financially supported by the grant of the GA CR no. 521/05/P078 and
research grant of the Ministry of Education, Youth and Sports of the Czech Republic
no. 6046070901.
References
Colbach N. – Chauvel B. – Dürr C. – Richard G.: 2002. Effect of environmental conditions on Alopecurus myosuroides germination. Part I. Effect of temperature and light. Weed Research, 42: 210-221.
Diprose, M.F. – Benson, F.A. – Hackam, R.: 1980. Electrothermal control of weed beet and bolting sugar
beet. Weed Research, 20: 311-322.
Don, R.: 2006. ISTA Handbook on Seedling Evaluation. 3rd ed., ISTA, Zurich.
Gummerson, R.J.: 1986. The effect of constant temperatures and osmotic potentials on the germination of
sugar beet. Journal of Experimental Botany, 37: 179. 729-741.
Longden, P. – Breay, T.: 1995. Weed beet - the future. British Sugar Beet Review, 63: 4. 16-18.
Meier, U. – Bachmann, L. – Buhtz, H. – Hack, H. – Klose, R. – Märländer B. – Weber E.: 1993.
Phänologische Entwick-lungsstadien der Beta-Rüben (Beta vulgaris L. ssp.). Codierung und
Beschreibung nach der erweiterten BBCH-Skala (mit Abbildungen). Nachrichtenbl. Deut.
Pflanzenschutzd, 45: 37-41.
Sester, M. – Dürr, C. – Darmency, H. – Colbach, N.: 2006. Evolution of weed beet (Beta vulgaris L.) seed
bank: Quantification of seed survival, dormancy, germination and pre-emergence growth. European
Journal of Agronomy, 24: 19-25.
Skalicky, M. – Tuma, J. – Novak, J. – Pulkrabek, J. – Steklova, J.: 2007. Phenotype variability of weed beet
(Beta vulgaris L.). Cereal Research Communications, 35: 2. 1077-1080.
Ungai, D. – Sipos, P.: 2008. Leaf analysis of fertilized sugar beet of two research years with good soil
conditions. Cereal Research Communications, 36: 2. Suppl. S 1387-1390.

VIII. Alps-Adria Scientific Workshop Neum, Bosnia-Herzegovina, 2009
DOI: 10.1556/CRC.37.2009.Suppl.2 329
BIOTIC AND ABIOTIC STRESS FACTORS INFLUENCE ON WALNUT FRUIT VARIETIES BRED IN CENTRAL EUROPE
Zsolt SZANI
1 Central Agricultural Office, Hungary
Abstract: Walnut trees located in closed monoculture may suffer stress either from their own density-
dependant self-regulating reproduction system or from other kind of well-known environmental factors,
mainly late frosts and diseases. Their cumulative effects are expressed as a crop failure. However, the
monoecious unisexual, wind-pollinated flower buds indicate high variability on phenology and fructification
within the different varieties. The detailed variety examination opens potentialities for reducing the
disadvantageous influence of the main stress factors.
Keywords: walnut, stress factor, PSA, fertilization, productivity
Introduction
In the previous period the expectation has been increasing for higher-level intensity in
the walnut growing. A major trend has been developed to enlarge the productivity by
new varieties. Numerous breeding programmes have been started worldwide to improve
the VCU (Value for Commercial Use) characteristics, using distant gen-source or
imported (Martino 1994) the varieties directly. Although it was taken less into
consideration that the walnut belongs to the botanical taxon Juglandaceae despite the
fact that the majority of temperate zone fruit species are included in the Rosaceae. The
taxonomical distance is accompanied by special characteristics influencing directly the
productivity of the species (Soltész, 2003).
Walnut trees are located in closed monoculture may suffer stress either from their own
density-dependant self-regulating reproduction system (Szentiványi, 1990), or from
other kind of well-known environmental factors, mainly diseases and late frosts (Simon,
2007), (Ripka, 2007). Their cumulative effects are expressed as a crop failure. The
detailed variety examination opens potentialities for reducing the disadvantageous
influence of the main stress factors (Szani, 2007). The objectives of this study are 1) to
observe the adaptation of new varieties in a Central European walnut producer region,
and 2) to present varietal differences under same biotic and abiotic stress, and 3) to
discuss possibilities of reducing the stress-affect.
Materials and methods
We performed our walnut variety researches in Pölöske (Hungary), in the Trial Station
of the Central Agricultural Office Hungary. The trial was planted in 1988. The plot
design was a randomized complete block with 4 replications of 3 trees. All the trees
were one-year-old grafted plants on walnut seedling rootstock. Each of them was spaced
8 m apart in 10 m rows. The training system was a minimum pruning. The impact of
biotic and abiotic stress factors were observed on 11 walnut varieties bred in Central
Europe and in the USA. The observation started in 1998, after trees came into bearing.
The first step was testing varieties (VCU) between 1998 and 2005. From 2006 to 2008
the second step focused on detailed examination to clarify its flower-biological
background. The flower-biological observation was made on 45 shoots, taken 5 parts
from each tree of 3 replications. Diseases, as Walnut blight (Xanthomonas campestris pv. juglandis) and Anthracnose (Gnomonia leptostyla) attack on leaves were observed

Vol. 37, 2009, Suppl. Cereal Research Communications
330
in a spontaneous infection years. The data were evaluated with analysis of variance,
based on an 11-year period. Observed varieties originated from different walnut
producer regions of the world. It was tested and compared to the well-adopted native
varieties (‘Alsószentiványi 117’ ‘Alsószentiványi 118 ’and ‘Milotai 10’), the imported
high-fruiting varieties from the USA (‘Pedro’ and ‘Hartley’) with the new hybrids from
crossing them (‘Milotai bıtermı’, ‘Milotai kései’, ‘M 10-25’, ‘Milotai intenzív’,
‘Bonifác’, ‘Alsószentiváni kései’). In the margin were collected dates from some further
Central European walnut (‘Seifersdorfer runde’, ‘Jupiter’ and ‘Apollo’).
Results and discussion
Comparative analysis shows considerable varietal differences regarding production
(Table 1). Within the new genotypes the increased fertility appeared accompanied by
reduced vigour. The imported varieties and the hybrids are characterised by medium or
even weaker vigor, however the growths are acceptable. In addition both of their total
yield and the yield efficiency in relation to different vegetative attributes are
significantly higher. On average the vegetative production has decreased with 30%, the
generative production has increased with 100%. Although it has to allow for the realized
production as a result of an extreme biotic stress factors.
Table 1. Production biological description of walnut varieties. Pölöske 1998-2005.
Variety
denomination
Vegetative production Generative production Diseases (Infected leaf
area, %)
Tree
volume
(m3)
Trunk cross-
section
(dm2)
Yield
(t ha-1)
Yield
efficiency II.x
(kg m-3)
Yield
efficiency III.y
(kg dm-2)
Xanthomonas camp.pv.jugl.
(7 years)
Gnomonia leptostyla
(6 years)
Milotai 10 63.6 2.4 0.4 0.06 1.6 23.2 32.1
Milotai bıtermı 39.7 1.9 0.9 0.21 4.2 14.1 31.5
Milotai kései 51.7 1.9 1.4 0.23 6.3 32.2 8.2
M 10-25 46.0 1.7 0.8 0.17 4.2 28.3 14.9
Milotai intenzív 52.6 2.1 1.0 0.18 4.4 22.7 32.8
Pedro 48.2 1.8 1.2 0.21 5.3 20.2 9.5
Bonifác 56.5 3.0 1.2 0.18 3.3 19.5 14.2
Alsószentiváni kései 60.4 2.3 0.8 0.11 2.8 10.2 4.2
Alsószentiváni 117 65.3 2.9 0.6 0.09 1.8 21.7 15.2
A 118 76.9 3.7 0.5 0.06 1.2 15.3 47.1
Hartley 43.4 2.4 0.8 0.14 2.5 19.6 14.3
LSD0,05 17.90 0.51 0.3 0.06 0.9 - 14.68
Mean 55.00 2.37 0.9 0.15 3.4 20.3 20.6
CV % 19.10 12.64 18.2 22.45 15 85.76 63.75
Probabilityz * *** *** *** *** - *** x yiled on tree volume, y yield on trunk cross-section, z *** P=0,1%, * P=1%, ’-’= not significant
The observed main biotic stress factors were diseases and pollen- density. Walnut blight
(Xanthomonas campestris pv. juglandis) and Anthracnose (Gnomonia leptostyla)
infection were evaluated on leaves (table 1). Examination has revealed that
‘Alsószentiványi 117’ and their progeny (‘Bonifác’, ‘Alsószentiváni kései’) suffer less

VIII. Alps-Adria Scientific Workshop Neum, Bosnia-Herzegovina, 2009
DOI: 10.1556/CRC.37.2009.Suppl.2 331
from Gnomonia. Conversely ‘Milotai bıtermı’ and ‘Milotai kései’ have inherited
susceptibility to it from ‘Milotai 10’. It has not proved any significant differences
between susceptibility to Xanthomonas, although various courses of disease were
noticed. Both of two pathogenic take obvious effect later on after flowering, destroying
the thriving fruits. In our trial the disadvantageous high pollen-density had the definitive
impact on realized production. Its stress expresses as PFA (pistillate flower abortion).
Over the structural conditions of the trial, the PFA depends on the flower-biological
characteristics of varieties (table 2). The varieties were grouped into 3 bearing-types
based on predominant location of fruit buds according to UPOV (International Union
for the Protection of New Varieties of Plants) Guideline (TG/125/6). To the type 1
belong ‘Milotai 10’’ and ‘Alsószentiványi 117’, fruiting at tip of one-year old shoot. The
type 2 contains ‘Hartley’, ‘Alsószentiványi 118’ and ‘Milotai kései’, fruiting in clusters.
To the type 3 belong ‘Milotai bıtermı’, ‘M10-25’, ‘Milotai intenzív’, ‘Pedro’, ‘Bonifác’ and ‘Alsószentiváni kései’, fruiting on lateral brindles. The other Central
European varieties, like ‘Seifersdorfer runde’, ‘Jupiter’ and ‘Apollo’ seems to belong to
type 2. The time of male and of female flowering separated from each other on the same
tree at the following proterandry hybrids: ‘Milotai kései’, ‘M10-25’, ‘Milotai intenzív’,
‘Pedro’ and ‘Bonifác’. Late-flowering helps to avoid the late frost, like in the case of
‘Bonifác’. (Average date of latest frost between 1998-2005 in Pölöske: 4.04.)
Table 2. Flower-biological characteristics of walnut varieties. Pölöske, 2007-2008.
Time of floweringz Fruiting on lateral budsx
(present fruiting lateral
buds per shoot) Female flowering Male flowering
Denomination Mean Homogeneous
Subsets
Beginning Length
(number of
days)
Beginning Length
(number of
days)
Milotai 10 0.31 a 25.04. 17.8 02.05. 6.7
Milotai bıtermı 1.10 bcdef 26.04. 14.9 03.05. 8.0
Milotai kései 0.79 bc 06.05. 14.5 29.04. 5.7
M 10-25 1.10 bcdef 01.05. 15.9 26.04. 6.7
Milotai intenzív 0.89 bcde 03.05. 16.3 27.04. 7.6
Pedro 1.00 bcde 05.05. 15.9 29.04. 6.9
Bonifác 1.16 bcdefg 08.05. 12.6 02.05. 7.4
Alsószentiváni kései
1.12 bcdef 05.05. 14.0 09.05. 8.3
Alsószentiváni 117 0.39 a 25.04. 16.4 02.05. 8.8
A 118 0.62 b 03.05. 12.0 25.04. 7.7
Hartley 0.64 bc 05.05. 13.6 30.04. 5.6
LSD0,05 0.24
Mean 0.83 02.05 14.9 30.04. 7.2
CV % 99.16
Probability *** X Average of years 2007-2008., y Means within a column are shared by the same letter are not significantly different by a t test (P≤0,05), z Average of years 1998-2005.
The levels of PSA is shown on the Figure1. The columns represent the average number
and distribution of female flowers on a shoot, up the fruit builder (LSD0.05=0,41) and

Vol. 37, 2009, Suppl. Cereal Research Communications
332
down the accessioned (LSD0.05=0,30) ones. The genetic potentials are strongly modified
by self- and cross-pollicisation. Rate of abscission varies from 0,20 up to 0,89.
3,0
2,0
1,0
0,0
1,0
2,0
3,0
4,0
M.1
0
M.bıte
rmı
M.k
ései
M10
-25
M.in
tenz
ív
Ped
ro
Bon
ifác
A. k
ései
A.1
17
A.1
18
Har
tley
Walnut varieties
Nu
mb
er o
f fe
mal
e fl
ow
ers
(flo
wer
s p
er s
ho
ot)
Fruitbuilding on top bud Fruitbuilding on lateral buds Abcission on top bud Abcission on lateral buds
x Denomination A=Alsószentiváni, M.=Milotai
Figure 1. Fruitbuilding and abcission on top and lateral buds. Pölöske, 2007-2008.
Conclusions
The breeder’s purpose of introducing higher fertility by distant gene source had been
achieved. These have adapted well to the Central European climate. Phenological
synchrony of female flowering with self male flowering, rate and distance from cross-
pollinator influenced basically the fertilization. However, the monoecious unisexual
flower buds indicate high variability on phenology and fructification within the different
varieties. The ideal pollen count should be the result of different varieties combining.
This opens potentialities for reducing PFA and other stress factors.
Acknowledgements
I would like to express my gratitude to my former and current colleagues.
References
Martino, I. – Radicati, L. – Me, G.: 1994: Comportamento vegeto-produttivo di alcune cultivar di noce
(Juglans regia L.) in Piemonte. Rivista di Frutticoltura, 56: 4. 65-68.
Simon, F - Nádasy, M - Marczali, Zs - Nádasy E - Keszthelyi, S..: 2007: The effect of walnut cultivation on
pest insects. Cereal Research Communications, 35: 2. 1057-1060.
Soltész M. – Nyéki J. – Szabó Z.: 2003. Walnut. In: Kozma, P. (et al.), Floral Biology, Pollination and
Fertilization in Temperate Zone Fruit Spesies and Grape. Akadémiai kiadó, Budapest. 451-466.
Szani, Zs.- Döme, Sz.- Tóth, M.: 2007: Research of the fertilisation of walnut varieties. Abstracts of the LOV
Scientific Conference. Inkart, Budapest.
Szentiványi, P.: 1990: Effect of fertility auto-regulation on productivity of walnut. Acta Hort. (ISHS)
284:251-252
Ripka, G.: 2007: Checklist of the eriophyoid mite fauna of Hungary (Acari: Prostigmata: Eriophyoidea). Acta
Phytopathologica et Entomologica Hungarica, 42: 1. 59-142.

VIII. Alps-Adria Scientific Workshop Neum, Bosnia-Herzegovina, 2009
DOI: 10.1556/CRC.37.2009.Suppl.2 333
MOLECULAR CHARACTERISATION OF FUSARIUM HEAD BLIGHT RESISTANCE IN THE BKT9086-95/MV MAGVAS WHEAT POPULATION
Emese LÁSZLÓ – Katalin PUSKÁS – Andrea UHRIN
Agricultural Research Institute of the Hungarian Academy of Sciences, Brunszvik u. 2, Hungary, e-mail:
Abstract: The aim of the experiments was to detect and analyse the genetic factors responsible for the FHB
resistance of old Hungarian wheat varieties. The resistant ‘BKT9086-95’ line developed from the variety
‘Bánkúti 1201’ was crossed with the moderately FHB-resistant variety ‘Mv Magvas’ to create a single seed
descent population for the purpose of studying the genetic background of resistance. Based on the results of
artificial inoculation, 15 resistant and 15 susceptible genotypes were selected for the purpose of bulked
segregant analysis (BSA). The bulk samples and the parents were analysed using the amplified fragment
length polymorphism (AFLP) method. The two bulk samples and the parents were tested with a total of 81
primer combinations, and an average of 5.02 deviations per reaction was found between the parents. AFLP
patterns similar to that of the resistant parent were found in a further 16 cases. On the basis of the BSA results
the testing of the whole population using the AFLP and simple sequence repeat methods has been
commenced.
Keywords: Fusarium head blight, QTL
Introduction
Wheat (Triticum aestivum) is the most important staple crop world-wide, with a total
production of over 600 million tons annually. Since the green revolution in the 1960s
the total yield quantity has increased by around 40%. However, consumption is also
increasing at an accelerating rate, so the fight against biotic stress factors endangering
yield quantity and quality is of key importance. Fusarium head blight (FHB) is one of
the most important wheat diseases, leading to yield reduction and poor grain quality as
well as contamination with deoxynivalenol (DON), which poses serious health risks
when inhaled as dust or ingested as food by humans and livestock (Hornok et al. 2005,
Reddy et al. 2008, Szabó-Fodor et al. 2008). Recent studies have demonstrated that the
prevalence of F. graminearum is increasing in Central Europe and is now responsible
for 90% of the losses, followed in importance by F. culmorum (Tóth et al. 2005). The
presence of pathogenic fungus species is indicated by the discoloration of the spikelets
and the spindle and by the whitening of the spikes. In infected spikes the grains are
typically white or pink and have lower thousand kernel weight compared with healthy
grains, leading to substantial yield losses.
The efficiency of chemical control depends greatly on the time of application
(Prigozliev et al. 2008) and the technology (Lehoczki-Krsjak et al. 2008). The greatest
level of resistance is possessed by varieties from Asia (‘Sumai 3’ and its derivatives)
and South America (e.g. ‘Frontana’; Bai and Shanner 2004). The agronomic properties
of these resistance sources differ considerably from those of Hungarian varieties (thus
lengthening the time required to breed resistant commercial varieties), while the
European sources reported as resistant have proved to belong to at most the moderately
resistant category (e.g. Arina; Ruckenbauer et al. 2001).
Fusarium head blight (FHB) was first detected in Hungary in the 1920s, but the first
nation-wide epidemic did not occur until 1970. This could be attributed not only to the
introduction of more intensive cultivation techniques (soil cultivation, forecrops,

Vol. 37, 2009, Suppl. Cereal Research Communications
334
nutrient supplies, sowing date, seed quantity) and to weather conditions favourable for
infection, but also to the susceptibility of the varieties (Kükedi 1988). The variety
‘Bezostaya 1’ was registered in Hungary in 1960, after which its sowing area increased
rapidly until it occupied almost 80% of the total area (Koltay and Balla 1982).
‘Bezostaya 1’ is susceptible to FHB (Mesterházy 1986) and many scientists held this
variety responsible for the epidemic in 1970 (Szunics and Szunics 1992). It was partly
this that later caused the variety to disappear rapidly from general cultivation (Bedı et
al. 2001). It was impossible to determine, however, what role the change of variety
played in the spread of FHB. As the old Hungarian wheat varieties did not become
infected in farmers’ fields, the question arises of whether this was due simply to a
favourable constellation of various factors, or whether they had genetically coded
resistance. The resistance of ‘Bánkúti 1201’ has been investigated in artificially
inoculated trials for several decades and the variety is consistently one of the most
resistant genotypes to this disease (Szunics and Szunics 1992).
The homogeneity within populations of old Hungarian varieties is characterised by the
fact that while they can be distinguished more or less on the basis of morphology, they
are more heterogeneous for quality traits than modern plant varieties, on the basis of
both biochemical and molecular markers (Vida et al. 1998, Rakszegi et al. 2000, Juhász
et al. 2000).
Materials and methods
In the course of field testing, detailed examinations were made on several lines of
‘Bánkúti 1201’ origin. Known resistance sources and a susceptible control variety were
also sown in the experiment and given the same treatment as the ‘Bánkúti 1201’ lines.
Testing was carried out with single isolates of F. graminearum or F. culmorum in three
replications. Bunches of spikes in the same stage of development were inoculated at
flowering using a spore suspension with a concentration of 5*105 macroconidia/ml.
Inoculation was repeated two days later. The degree of spike infection was evaluated on
the 26th
day.
Among the ‘Bánkúti 1201’ lines included in the experiment, ‘B9086-95’ proved to be
the most resistant, with an FHB infection level of 10–20%. By comparison, the level
was 1% for the resistant genotype ‘Sumai 3’ and 70–80% for the susceptible control.
This line was crossed with several Martonvásár varieties. Among the combinations the
FHB resistance of the parental genotypes differed to the greatest extent for ‘B9086-
95’/’Mv Magvas’, so this combination was chosen for further analysis. Uniform lines
developed from the progeny population using the SSD method were used to identify
chromosome regions connected with the FHB resistance of ‘Bánkúti 1201’.
The resistance of 250 SSD lines derived from this combination was tested in the
greenhouse and field for the spread of Fusarium within the spike (Type II resistance).
The ‘IFA-104’ F. culmorum isolate was used for artificial inoculation. Conidia were
washed off the surface of infected seeds, after which the spore concentration was
adjusted to 1 million/ml. Spikelets on the upper 2/3 of the spike were inoculated with
5µl conidium suspension on four plants of each line. The extent of Fusarium spike
infection (severity %) was determined on the 21st day after inoculation.

VIII. Alps-Adria Scientific Workshop Neum, Bosnia-Herzegovina, 2009
DOI: 10.1556/CRC.37.2009.Suppl.2 335
Results and discussion
The level of spike cover was 36.7% in 2005 and 31.7% in 2006, averaged over the lines.
Averaged over these two years, the infection levels of the lines, parents and control
varieties ranged from 5.0 to 72.3%. Based on the mean data for 2005 and 2006 the
‘BKT9086-95’ parent had the lowest rate of infection (5.0%), followed by the resistance
source ‘Sumai 3’ (6.37%). The infection severity of 36 lines did not differ significantly
from that of the better parent (LSD5%=16.8). The difference between the rate of
infection of ‘Mv Magvas’ and that of the resistant parent was more than double the
significant difference (44.8%). Spike cover significantly greater than that of the
susceptible parent was observed for six lines (Fig 1). The distribution of the lines in
terms of spike infection did not differ from normal distribution (Kolmogorov-Smirnov
test, D = 0.048ns
). As there was a large interval between the lines with the best and
worst FHB resistance and the population exhibited normal distribution, this line
population was suitable for analysis at the molecular level, aimed at identifying DNA
sequences related to FHB resistance.
DNA was isolated from the plants examined in the greenhouse (Qiagen DNeasy Plant
Mini kit), after which bulk samples were made from the DNA solutions of plants with
extreme values. Based on the ratio of infected spikelets and the Xu-Fan scale (field data
for 2005 and 2006, greenhouse data for 2007), 15 resistant and 15 susceptible plants
were selected for bulk segregant analysis. The bulk samples and the parents were
analysed using the amplified fragment length
polymorphism (AFLP) method. The reaction
products were separated on 6%
polyacrylamide gel using the Li-Cor 4300
DNA sequencing gel documentation system.
The DNA of the four bulked samples and the
parents was tested using a total of 81 primer
combinations. An average of 5.02 diverse
patterns per reaction was observed between the
0
10
20
30
40
50
60
70
0-1
0 %
10
-20
%
20
-30
%
30
-40
%
40
-50
%
50
-60
%
60
-70
%
70
-80
%
Spike cover do not differ significantly from the better parent
Spike cover significantly greater than that of the susceptible parent
FHB severity
No.
of
gen
otyp
es
Figure 1. Distribution of FHB infection in’BKT9086-95’/’Mv Magvas’ lines
(Martonvásár, 2005–2006)
‘BKT9086-95’ type polymorphism
‘Mv Magvas’ type polymorphism
Figure 2. Polymorphic AFLP products

Vol. 37, 2009, Suppl. Cereal Research Communications
336
parents. In the better parent and the samples formed from resistant plants, reaction
products of the same size were found in 16 cases, which could indicate that Fusarium
resistance has a genetic background. Averaged over the population, 8.7 different
products per reaction were identified with markers giving patterns of the maternal type,
and 40% of the polymorphisms observed were of this type (Fig 2.). The results confirm
the presence of the genetic markers detected by BSA at the level of the whole
population.
Acknowledgements
This work was funded by the projects OTKA T49080 and AGRISAFE 203288 (EU-
FP7-REGPOT 2007-1).
References
Bai G. H. - Shanner G.: 2004. Management and resistance in wheat and barley to Fusarium head blight. Annu.
Rev. Phytopathol., 42: 135-161.
Bedı Z. - Láng L. - Sutka J. - Molnár-Láng M.: 2001. Hungarian Wheat Pool. In: A. P. Bonjean, W. J. Angus.
(eds): The World Wheat Book. A history of wheat breeding Lavoisier Publishing. 193-218.
Hornok L.- Békési G.- Giczey G.- Jeney A.- Nicholson D.- Parry A.- Ritieni A.- Xu X.: 2005. Occurence of
Fusarium ear blight pathogens and mycotoxin accumulation in winter wheat in Hungary between 2001
and 2004. Növénytermelés, 54: 4. 217-235.
Juhász A.- Kárpáti M.- Vida Gy.- Rakszegi M.- Láng L.- F. J. Zeller- S. L. K. Hsam- Bedı Z.: 2000. Régi
magyar búzafajták populációinak elemzése új genetikai források elıállítására. Az agrobiodiverzitás
megırzése és hasznosítása – szimpózium Jánossy Andor emlékére, 2000. május 4-5. Budapest, 67-71.
Koltay Á- Balla L.: 1982. Búzatermesztés és -nemesítés. Mezıgazdasági Kiadó Budapest.
Kükedi E.: 1988. Az ıszi búza fuzariózisairól, különös tekintettel az idıjárásra és a termesztéstechnikára.
Növénytermelés, 37: 1. 83-89.
Lehoczki-Krsjak Sz.- Tóth B.- Kótai Cs.- Martonosi I.- Farády L.- Kondrák L.- Szabó-Hevér Á.- Mesterházy
Á.: 2008. Chemical control of FHB in the wheat with different nozzle types and fungicides. Cereal Res.
Comm., 36: Suppl B. 677-681
Mesterházy Á.: 1986. Kalászfuzáriózissal szembeni ellenállóság ıszi búzában. Növénytermelés, 35: 5. 407-
417.
Prigozliev S. R.- Ray R. V.- Edwards S. G.- Hare M. C.- Jenkinson P.: 2008. Effect of timing of fungicide
application on the development of Fusarium head blight and the accumulation of deoxynivalenol (DON)
in winter wheat grain. Cereal Res. Comm., 36: 2. 289-299
Rakszegi M.- Scholz É.- Kárpáti M.- Ganzler K.- Lásztity R.- Bedı Z.: 2000. Study of the LMW glutenin
composition of some old Hungarian wheat cultivars using capillary electrophoresis. Cereal Res. Comm.,
28: 417-424.
Ruckenbauer P.- Buerstmayr H.- Lemmes M.: 2001. Present strategies in resistance breeding aginst scab
(Fusarium spp.). Euphytica, 119: 121-127
Szunics Lu.- Szunics L.: 1992. Búza kalászfuzárium fertızési módszerek és a fajták fogékonysága.
Növénytermelés, 41: 3. 201-210.
Tóth B.- Mesterhazy A.- Horvath Z., Bartok T.- Varga M.- Varga J.: 2005. Genetic variability of Central
European isolates of the Fusarium graminearum species complex. Eur. J. Plant. Pathol., 113: 35-45
Vida Gy.- Bedı Z.- Láng L.- Juhász A.: 1998. Analysis of the quality traits of a ‘Bánkúti 1201’ population.
Cereal Res. Comm., 26: 313-320.
Reddy B.- Raghavender C.: 2008. Outbreaks of fusarial toxicoses in India. 2008.: Cereal Res. Comm., 36: Suppl B. 321-326
Szabó-Fodor J.- Kametler L.- Pósa R.- Mamet R.- Rajli V.- Bauer J.- Horn P.- Kovács F.- Kovács M.: 2008.
Kinetics of fumonisin B1 in pigs and persistence in tissues after ingestion of a diet containing a high
fumonisin concentration. Cereal Res. Comm. 36: Suppl B. 331-336

VIII. Alps-Adria Scientific Workshop Neum, Bosnia-Herzegovina, 2009
DOI: 10.1556/CRC.37.2009.Suppl.2 337
FUSARIUM STALK ROT: A BIOTIC STRESS FACTOR
DECISIVE FOR MAIZE STALK STRENGTH
Csaba SZİKE1 – Tamás ÁRENDÁS1 – Péter BÓNIS1 – Árpád SZÉCSI2
1 Agricultural Research Institute of the Hungarian Academy of Sciences, H-2462 Martonvásár, Brunszvik 2.
e-mail: [email protected] 2 Plant Protection Institute of the Hungarian Academy of Sciences, H-1525 Budapest, Herman Ottó 15.
e-mail: [email protected]
Abstract: Maize stalk strength is determined by two main factors: the mechanical structure of the stalk and a
biotic stress factor, fusarium stalk rot. The degree of infection of three hybrids and their parental lines to
fusarium stalk rot was tested by artificial inoculation with two Fusarium isolates (FG36, FGH4) over three
years (2006–2008). The greatest level of infection was recorded in 2007, and FGH4 proved to be the more
pathogenic isolate. When testing for resistance to fusarium stalk rot it is not sufficient to observe only natural
infection levels, but testing with a single Fusarium isolate may be enough, if it is wisely chosen. The
resistance level of the female parent is probably decisive in the inheritance of fusarium stalk rot resistance.
Keywords: Fusarium spp., maize, corn stalk rot
Introduction
It is essential for Hungarian agriculture to prepare for the effects of current climate
change, as all living organisms respond sensitively to a changed ecological
environment. Experiments have shown that climate change will influence both the crops
that can be grown and the yields of all major field crops (Harnos et al., 2007). Plant
protection will also be affected. In addition to the appearance of new pests and
pathogens, serious problems will also be caused by the resurgence of biotic stress
factors for which the changed ecological environment is favourable. The dry weather of
2007 again drew attention to the importance of maize stalk strength, which is
determined by two main factors: the mechanical structure of the stalk and fusarium stalk
rot, which is caused by various species of Fusarium and Macrophomina (Koehler 1960,
Christensen, Wilcoxson 1966). The degree of fusarium stalk rot infection depends
greatly on environmental factors, the genotype × environment interaction and the
resistance of the given maize genotype to the pathogens (Kommedahl and Windels
1981, Mesterházy 1983, Todd and Kommedahl 1994, Buhinicek et al. 2005, Palaversic
et al. 2007, Szıke et al. 2007, Mesterházy et al. 2008, Reinprecht 2008). The present
paper will discuss the importance of fusarium stalk rot in influencing maize stalk
strength.
Materials and methods
Three single-cross hybrids and their six parental lines were inoculated with two
Fusarium graminearum isolates (FG36, FGH4) in 2006–2008. The two isolates were
selected as being the most aggressive on the basis of preliminary pathogenicity studies
in the phytotron. The genotypes were sown in a split-plot design in four replications,
with the maize genotypes in the main plots and the treatments (FG36, FGH4, sterile,
natural infection) in the subplots. Inoculation was carried out on the 12th
day after
flowering by placing infected wheat grains in the second internode from the roots on six
plants per plot. The wheat grains were soaked in a 1 g/l N-chlorobenzenesulfonamide

Vol. 37, 2009, Suppl. Cereal Research Communications
338
sodium salt solution for 3 min and then rinsed twice with distilled water. The grains
were then sterilised in a 60°C water bath for 2×5 min, after which they were placed in
test tubes with 2 ml of a 106 conidia/ml suspension of the above isolates at 27°C for 14
days. Sterile wheat grains were placed in the maize stalks as a control, and natural
infection was scored on the fourth plot. After placing the grains in holes made in the
stalks with a 2 mm hand-drill, the holes were sealed with sticking plaster to prevent
external infection. The collection and processing of samples was begun on October 10th
.
The stalk samples were cut in half lengthwise and all the samples were photographed
with a digital camera to determine the area of the lesions on the pith using the Colim 4.0
image analysing program. Percentage values were calculated from the complete area of
the internode and the infected area. The data were evaluated using analysis of variance
(Sváb 1981).
Results and discussion
In response to artificial inoculation both the hybrids and lines suffered considerable
infection from the two Fusarium graminearum isolates, of which FGH4 proved to be
more pathogenic at the LSD5% level of probability averaged over the whole experiment
in the case of both hybrids (LSD5% = 5.034%) and lines (LSD5% = 3.203%). It is clear
from Figure 1, however, that in 2008 isolate FG36 caused greater infection in both
hybrids and lines, the difference being significant for the latter (LSD5% = 5.54%). The
lines were more severely infected than the hybrids, the level of infection being 10%
greater for the lines in 2006 and 2008, though in 2007 the level of infection was similar
for lines and hybrids. A relatively high rate of infection was also recorded in both
hybrids and lines after treatment with sterile grains (figure 1). This could be attributed
to the fact that the experiment was set up on an area used as a pathological nursery for
several decades (until the appearance of the corn rootworm), so the soil was heavily
infected with conidia and chlamydospores. In addition European corn borer caused
considerable damage, especially in 2007 (data not shown). The extent of natural
infection in untreated subplots was 1.6%, averaged over genotypes and years. The
greatest natural infection was recorded in 2007.
020406080
Hy
bri
d
Lin
e
Hy
bri
d
Lin
e
Hy
bri
d
Lin
e
FG36 FGH4 STER
(%)
2006
20072008
-10
10
30
50
70
2006 2007 2008
(%)
Hybrid
Line
Figure 1. Effect of treatments on hybrids and lines,
2006–2008 (LSD5%=5.54% for lines, 8.72% for
hybrids)
Figure 2. Degree of infection of hybrids and lines,
2006–2008 (LSD5%=3.20% for lines, 5.03% for
hybrids)
Of the three years, the hybrids suffered the greatest infection (63.55%) in 2007, when
the weather was extremely hot and dry at flowering, while rainfall quantities in

VIII. Alps-Adria Scientific Workshop Neum, Bosnia-Herzegovina, 2009
DOI: 10.1556/CRC.37.2009.Suppl.2 339
September and October were close to the long-term mean. Due to the heat and drought
stress at flowering there was a reduction in the carbohydrate content of the stalk tissues,
which were destroyed to a great extent by the cell wall-decomposing enzymes of the
Fusarium species playing a major role in the course of the disease (Szécsi 1985). In
2006 and 2008 the hybrids exhibited similar extents of infection (42.68%). The year
effects were greater for the lines than for the hybrids, with infection levels of around
65% in 2007 and 2008 and 51.42% in 2006 (figure 2).
An analysis of the infection of the hybrids and their parental partners (figure 3) revealed
that, over the grand average of the treatments, the MV3 hybrid exhibited the greatest
infection, followed by MV1 and MV2, but the difference between the hybrids was only
significant between MV3 and the other two hybrids (LSD5% = 5.03%). More
pronounced differences were observed between the lines. In the case of the most
sensitive hybrid, the infection level of the parental lines was also the highest of all the
lines. Lines E and F, which were the female and male parents of this hybrid, had the
highest level of infection in all three years. A comparison between the natural infection
and artificial inoculation data showed that these three genotypes tended to have a
similar response to spontaneous infection with stalk rot.
0
20
40
60
80
MV
3 E F
MV
1 A B
MV
2 C D(%) 0
2
4
6
8
MV
3 E F
MV
1 A B
MV
2 C D(%)
Figure 3. Level of infection of hybrids (green) and their parental components (female: red, male: yellow)
averaged over treatments (left) and natural infection (right). For artificial inoculation, LSD5%=4.53% for lines
and 5.03% for hybrids; for natural infection: LSD5%=2.54% for lines and 1.78% for hybrids.
The parental components of hybrid MV1 (A and B) exhibited a sensitive response to
artificial inoculation, but not to natural infection. Hybrid MV2 had the lowest level of
infection, but again considerable differences were recorded for the response of the
hybrid and its parental components to artificial inoculation and natural infection. These
data draw attention to the fact that exact information on the resistance or susceptibility
of a given population to stalk rot can only be obtained from artificial inoculation data.
Due to the small sample number the present data are not suitable for drawing far-
reaching conclusions on the inheritance of stalk rot, but they suggest that the resistance
level of the female parent is of prime importance. For hybrids MV3 and MV2 the
female suffered greater infection than the male parent at the LSD5% level of probability.
Conclusions
Due to the increasing frequency of extreme weather conditions, renewed attention must
be paid to the development of maize lines and hybrids with resistance to stalk rot. The
present results indicated that both natural infection and artificial inoculation produced

Vol. 37, 2009, Suppl. Cereal Research Communications
340
the greatest level of infection in 2007, among the years tested. This year was ideal for
the development of stalk rot (little rainfall at flowering, wet weather in the autumn
months). Of the two F. graminearum isolates used for the artificial inoculation,
although FG36 caused significantly greater infection to the lines in 2008, in 2006 and
2007 the FGH4 isolate was more pathogenic to both hybrids and lines. It is suggested
that, it may be enough a single Fusarium isolate for the testing of breeding materials
and hybrids, if it is wisely chosen. The high infection rate observed in the sterile grain
treatment draws attention to the fact that the development of fusarium stalk rot is greatly
facilitated by any type of injury to the stalk (pests, cultivation tools, hail), so the
mechanical parameters of the stalk (thickness, strong outer layer) should also be
considered in the course of selection. Natural infection data are not sufficient for
successful selection for stalk rot resistance. The genotypes examined had different
levels of resistance to fusarium stalk rot. The data suggest that the resistance level of the
female parent could be decisive in the inheritance of fusarium stalk rot resistance, but
further tests will be required to confirm this conclusion.
Acknowledgements
This research was funded from the AGRISAFE Project (EU-FP7-REGPOT 2007-1 No.
203288).
References
Buhiniček I. - Palaveršić B. - Vragolović A. - Šimić D. - Šarčević H. - Kozumplik V. (2005): Improvement of
stalk rot resistance and grain yield in the maize synthetic FAOSYNFR1B by recurrent selection. Cereal
Research Communications 33 (2-3) 517-524
Christensen J.J. - Wilcoxson R. D. (1966): Stalk rot of corn. Am. Phytopath. Soc., Mon. 3. 59 p.
Harnos Zs. - Jolánkai M. - Láng I. (2007): Preparation for Climate Change: a Hungarian Case Study Act on
Climate Change. Now or Never International Conference on Climate Change, Hong Kong
Koehler B. (1960): Cornstalk rots in Illinois. Ill. Agr. Exp. Sta. Bul. 658. 90p.
Kommedahl T. - Windels C.E. (1981): Root-, stalk- and ear-infecting Fusarium species on corn in the USA.
In: Nelson P.E. - Toussoun T.A. (editors) Fusarium Diseases, Biology and Taxonomy. The
Pennsylvania State University Press, University Park, pp. 94–103.
Mesterházy, Á (1983): Relatinship between resistance to stalk rot and ear rot of corn influenced by rind
resistance, premature death and the rate of drying of the ear. Maydica, 28:425-437
Mesterházy Á. - Tóth B. - Szabó-Hevér Á. - Varga J. - Lehoczki-Krsjak S. (2008): Node infection caused by
Fusarium graminearum in wheat. Cereal Research Communications 36 (3) 471-475
Palaversic B. - Kozic Z. - Jukic M. - Sabljo A. - Buhinicek I. (2007): Evaluation of inoculation techniques for
testing maize hybrids for resistance to stalk anthracnose. Cereal Research Communications 35 (2) 881-
884
Reinprecht Y. - Wu X. - Yan S. - Labey L. - Dasilva E. - Martin J. C. - Pauls K. P. (2008): A microarray-
based approach for identifying genes for resistance to Fusarium graminearum in maize (Zea Mays L.)
Cereal Research Communications 36 (6) 253-259
Sváb, J. (1981): Biometriai módszerek a mezıgazdasági kutatásban. (Biometrical Methods in Agricultural
Research.) Mezıgazdasági Kiadó, Budapest, 490 p.
Szécsi, Á (1985): Sejtfalbontó gombaenzimek. in Érsek T. - Hornok L. 1985 Kórokozók és a fertızött növény.
(Cell wall-decomposing fungal enzymes. In: Pathogens and the infected plant.) Budapest, Akadémiai
Kiadó, 209 p.
Szıke Cs. - Árendás T. - Rácz F. - Pintér J. - Nagy E. - Marton L. Cs. (2007): Correlation between maize
genotypes and the stalk rot caused by maize Fusarium. Acta Agronomica Hungarica 55(4) 447-452
Todd L. R. - Kommedahl T. (1994): Image analysis and visual estimates for evaluating disease reactions of
corn to Fusarium stalk rot. Plant Dis. 78:876-878

VIII. Alps-Adria Scientific Workshop Neum, Bosnia-Herzegovina, 2009
DOI: 10.1556/CRC.37.2009.Suppl.2 341
STRESS CAUSED BY HIGH DOSES OF COPPER-TETRAMINE COMPLEX APPLIED AT DIFFERENT PHENOLOGICAL PHASES OF WHEAT
Pál SZAKÁL1 – Margit BARKÓCZI 1– László MATUS2 1 Department of Chemistry, Institute of Environmental Sciences, Faculty of Agricultural and Food Sciences,
University of West-Hungary, H-9200 Mosonmagyaróvár Vár 2., e-mail: [email protected] 2 Department of Soil management, Institute of Crop Sciences, Faculty of Agricultural and Food Sciences,
University of West-Hungary, H-9200 Mosonmagyaróvár Vár 2.
Abstract: We carried out foliar fertilization trials with copper-tetramine-hydroxide complex compounds on
small plots with alluvial Danube soils of high CaCO3 content, alkaline pH and copper deficiency. Copper
treatments were applied in the phenological phases of shooting and flowering. Applied copper doses
amounted 0.1, 0.3, 0.5, 1.0 and 2.0 kg/ha. In our investigations we searched for the symptoms of stress
induced by higher copper doses on yield, gluten and raw protein content. Testing the yields we observed that
higher doses at booting treatments resulted in gradually increasing yields. In treatments at flowering copper
doses of 0.5kg/ha still increased yields but higher doses induced stress that produced a decrease in yields.
Gluten content shows maximum curve as an effect of copper treatments at both booting and flowering.
Maximum gluten content could be achieved at copper doses of 1.0 kg/ha at phenological phase of booting, and
of 0.5 kg/ha at flowering. Raw protein content shows maximum curve similarly to the changes of gluten
content in copper fertilization trials after treatments at booting and flowering. While a decrease in raw protein
content was produced as a result of stress after treatments of 1.0 kg/ha at booting, lower copper doses of
0.5kg/ha reduced protein content after treatments at flowering.
Keywords: wheat, copper, complex, yield, raw protein, gluten, stress
Introduction
Since the 30s many elements in plant tissues being present in small quantities proved to
be essential besides macro-elements (NPK). Such an element is copper.
Based on FAO testing soils in Hungary show a great level of copper deficiency, but
even in soils of good copper supply can copper deficiency occur due to hindered
transportation in winter wheat (Sillanpää 1982, Szakál et al., 2008). Copper deficiency
result in hindering nitrogen up-take of winter wheat, which again result in minor quality
and yield (Kádár and Shalaby., 1984). Copper has a very important role in plant
biochemical processes therefore we need to consider an adequate copper supply of the
plants. Copper can be replaced through soil or leaves.
In foliar fertilisation nutrient uptake follows a similar mechanism to that of the roots.
Ions and molecules get through the micro-pores of the cuticle. If we wet the waxen
cuticle it will widen and open up lack of continuity and pores. Nutrients can get through
the intercellular ways to the place of usage. Protoplasm selectively binds cations by
passing down H+. Nutrient up-taking surface of the roots with root hairs are many
thousand times bigger than leaves surface so leaf fertilization can only have a
supplementary role in most cases. In foliar fertilization plants take up nutrients
selectively according to their needs (Schmidt and Szakal 2007, Schmidt et al. 2008)
Considerable effect could be attained through direct contact to metabolism. Both
antagonism and synergism could be observed in nutrient uptake through the leaves
(Pecznik, 1976). Radioactive test prove that substances put on leaves can spread very
quickly in the leaves. Their uptake is greatly influenced by the form of compound and

Vol. 37, 2009, Suppl. Cereal Research Communications
342
ligand-effect (Hornik et al., 2008, Pipiska et al., 2008). The main problem of foliar
fertilization is the sensitivity of leaves and possible stress effect. Stress effect is higher
by metal salts (osmotic pressure) than by metal chelates, where metal is in organic bond.
Metal chelates dissolve in the cells metal ions untie and build in. Stress can be reduced
if we treat leaves with copper-ion-exchanged synthesised zeolite (Schmidt et al. 2008).
Stress is a state of burden, where after an initial destabilization through a normalisation
the resistance strengthens, but if exceeding the tolerance limit plants suffer from
permanent damage or die.
Weak antropogen stress on plants can activate cell metabolism, i.e. foliar treatments of
low concentration have stimulating effects, but in larger quantities they damage the
metabolic processes, reduce plant activities and a state of distress develops.
Stress causes morphological, physiological and biochemical changes in plants.
Responses induced by defensive mechanisms depend on the type and time of stressors
and reproduction capacity of the plants (Lang 2002, Lichtentaler 1996). Stressors can
change the red-oxy status within the plant cells and push metabolism into oxidative
direction (Sies, 1991). The developed organic peroxides e.g. copper-, and ferro-, will be
reduced to alcoxyl radical, which is able to start radical series of reactions.
Materials and methods
Trials were launched on 10m2
plots of Danube calcareous alluvial soil in four repetitions
in a randomised block design on winter wheat in Darnózseli in 2008. Table 1 shows the
average composition of soil of high calcium content, alkaline pH and shallow tilth
(40cm). The soil is poorly supplied with copper so the available copper content is
around 0.6 mg/kg. We used copper tetramine hydroxide complex compound to replace
copper. Copper complex was applied on the foliage in doses of 0.1, 0.3, 0.5 1.0 and 2.0
kg/ha. Copper complex of 0.6 litres was sprayed on the leaf surface per plot. Plants on
the control plots were sprayed with water of the same quantity. Trials were carried out
in two phenological phases at the end of booting and at the beginning of flowering. At
harvest we measured the yield and the raw protein and gluten content among parameters
characterizing flour quality. The results were evaluated by analysis of variance.
Table 1. Soil analysis results, Darnózseli
pH AL-soluble mg/kg-1 EDTA-soluble mg/kg-1
P2O5 K2O Na Mg
Zn Cu Mn Fe H2O KCl
KA
CaCO3
%
Humus %
mg · kg-1
8.21 7.87 32 9.7 2.1 175.0 196.0 58.0 73.4 0.8 0.6 40.6 30.5
Results and discussion
According to the results as a complex compound copper ion can be introduced into cell
tissues only by foliar treatment quickly. We investigated the efficiency of copper

VIII. Alps-Adria Scientific Workshop Neum, Bosnia-Herzegovina, 2009
DOI: 10.1556/CRC.37.2009.Suppl.2 343
replacement based on changes in yield and chemical components. Our measurements
covered the stress effects of increased copper doses.
Yields
Higher rate of copper doses applied in the phenological phase of shooting produced
higher yields. The highest yield (4.62 t/ha) could be achieved by applying the highest
copper doses (2.0 kg/ha). Higher copper doses did not show any damaging stress
effects. The applications at flowering showed the stress effects of higher copper doses.
As a result of higher copper doses yields (4.92 t/ha) increased up to copper doses of 0.5
kg/ha according to maximum curve. Higher doses of 1.0 and 2.0 kg/ha induced stress
and reduced the yields. At copper doses of 2.0 kg/ha resulted in stress effects that
produced yields (4.22 t/ha) lower than the control (Table 2).
Table 2. Effect of copper doses on the yield and quality parameters of winter wheat
Yield
t/ha
Raw protein
%
Gluten
%
Cu
kg/ha
Booting Flowering Booting Flowering Booting Flowering
Control 4.25 4.42 12.65 13.05 31.40 31.15
0.1 4.25 4.62 12.85 13.12 32.70 31.15
0.3 4.32 4.57 13.00 13.25 32.32 33.27
0.5 4.30 4.92 13.22 13.42 33.35 33.47
1.0 4.52 4.80 13.25 13.40 33.37 32.87
2.0 4.62 4.22 13.10 13.10 32.87 31.55
LSD5% 0.41 0.55 0.48 0.51 1.43 1.20
Raw protein content
Copper has a favourable effect on N-metabolism of plants. Data in Table 2 show
changes in raw protein content due to copper doses applied at shooting and flowering.
Raw protein changed according to a maximum curve due to copper doses applied at
booting. Copper doses of 1.0 kg/ha produced the highest raw protein content (13.25 %)
then as a result of stress raw protein content decreased at higher copper doses. Copper
doses of 0.5 kg/ha applied at flowering produced the maximum rate of raw protein
increase. Stress due to copper doses of 1.0 and 2.0 kg/ha resulted in gradual raw protein
decrease.
Gluten content
Gluten content is of outstanding importance among the parameters determining flour
quality. Table 2 shows the changes due to copper-tetramine-hydroxide foliar treatments
in two phenological phases.
After foliar treatments applied at booting higher doses increased the gluten content (1.0
kg/ha) gradually. Due to copper doses of 1.0 kg/ha gluten content achieved a value of
33.37 % compared to the value of 31.4 % measured on the control plot. As a result of
the treatment with 2.0 kg/ha copper doses the gluten content reduced. More efficient

Vol. 37, 2009, Suppl. Cereal Research Communications
344
increase could be achieved with copper-complex treatments in the phenological phase
of flowering. Maximum gluten content could be achieved by 0.5 kg/ha copper doses,
where the rate of increase in gluten reached 7.5 % compared to the control. Wheat
plants respond to higher copper doses very sensitively, the resulted stress induces a
gradual decrease in gluten content.
Conclusions
Comparing the effect of applications of copper on the yield in the two phenological
phases we can conclude that the treatment applied in the phenological phase of
flowering was more efficient than the treatment applied at booting. Lower copper doses
resulted in higher yields, but higher doses of copper treatment caused stress that resulted
in gradually decreasing yields.
Copper doses applied at flowering produced a much higher increase in raw protein
content than lower doses applied at booting. Treatments at flowering resulted in stress
effects at lower copper doses than treatments at booting.
Regarding the gluten content, in both phenological phases we measured the highest
value at the 0.5 kg/ha copper dose which was statistically significant as well. The 2
kg/ha copper dose due to stress effects reduced the gluten content already.
References
Hornik M. – Pipiska M. – Vrtoch L – Sekácová J –Augustin J –Lesny J.: 2008. Influence of complexing
ligands on Zn uptake and translocation in tobacco and celery plants. Acta Agronomica Óváriensis, 50: 65-71.
Kádár I. – Shalaby M.H.:1984. A nitrogén és a réztrágyázás közötti kölcsönhatások vizsgálata meszes
homoktalajon. Agrokémia és Talajtan, 3: 268-274.
Láng F. szerk.: 2002. Növényéletttan. ELTE Eötvös Kiadó, Budapest
Lichtenthaler H. K.: 1996.Vegetation Stress: an Introduction to the Stress Concept in Plants, J. Plant Physiol.
148: 4-14.
Pecznik J.: 1976. Levéltrágyázás. Mezıgazdasági Kiadó, Budapest.
Pipiska M. – Hornik M. – Sekácová J. – Augustin J. –Lesny J.: 2008. Influence of complexing ligands and
mineral nutrients on zinc foliar uptake and translocation in vascular plants Cereal Research
Communications. 36: 415-419 Schmidt R. – Szakál P. – Barkóczi M –. Matus L.: 2008. Controlled supply of nutrients, microelements
provided by ion-exchanged systhesised zeolite. Cereal Research Communications, 36: 1919-1922
Schmidt R. – Szakál P.: 2007. Zn fertilisation of wheat. Higher protein, lower carbohydrate content. Cereal
Research Communications, 35: 1041 – 1045.
Sies H.: 1991.Oxidative Stress II. Oxidants and Antioxidants. Academic Press, London.
Sillanpää M.: 1982.Micronutrients and the nutrient status of soils. A global study. FAO Soils Bulletin, Róma,
48.
Szakál P. – Barkóczi M. – Schmidt R. – Beke D. – Tóásó Gy. – Matus L.: 2008. Hulladékból elıállított réz-
tetramin komplex hatása az ıszi búza beltartalmára. Acta Agronomica Óváriensis, 50: 103-109

VIII. Alps-Adria Scientific Workshop Neum, Bosnia-Herzegovina, 2009
DOI: 10.1556/CRC.37.2009.Suppl.2 345
BIODIVERSITY CHANGES UNDER STRESS OF CUT IN PARK TYPE TURF
Balázs György KULIN 1 – George HADDAD
2
1 Department of Grassland Management, Crop Science Institute, Szent István University, Gödöllı Páter K. u.
1. e-mail: [email protected] 2 Institute of Economic Analyse and Methodology, Faculty of Economic and Social Sciences Szent István
University, Gödöllı Páter K. u. 1
Abstract: The subject of the dissertation: examination of monocotyledonous and dicotyledonous species
coverage under systematic mowing. Every times when we mow the turf we cut down from the plant and it is
becomes a lost assimilative surface of leaf what the plant try to compensate to grow new shoots as a result of
this the needs a larger amount of nutrient supply which means stress for the roots and in totality for the whole
plant.
Keywords: turf, cut, fertiliser, weed, biodiversity
Introduction
In our interpretation the turf is a type of grassland what we maintain with regular and
professional mowing. The beautiful green turf is a determinative element in the garden
(Hessayon, 2002). The topsoil is one of the most important components in grassland and
sustains the sward physically, chemically and biologically (Szemán, 2007). The lawn
needs to be fertilized to maintain colour, density and vigor. The healthier and more
vigorous a lawn is, the better it can withstand stress from heat, drought, traffic and pets.
We often try to achieve a dark green lawn, but the darkest green lawn is not always the
healthiest lawn. The nitrogen is the most important element what is responsible for
green colour and the vegetative growth. At each mowing we have to count with 1g/m2
nitrogen agent need (Gruber, 1964). The most important element of the intensively used
sport fields sports grass is the nutrient supply of the soil of the pitch (N:P:K), which
greatly adds to the colour, density, solid of the grass, as well as to the stress caused by
drought and cold (Németh, 2006). Though all three elements are important in
maintaining the healthy turf stand nitrogen will result the greatest response (Szemán,
2007). With the help of a computer model, the potential grass yield gets easily
calculable depending on the changing climatic factors (Antal, 2007). The other
important question is the weeds. The control of weeds is an essential aspect of
productive agriculture. Weeds compete with grass for moisture, light and nutrients.
(Velkoska et al. 2008) We can install the grass with seed or sod. Seedling establishment
should be managed in field situations to avoid or minimize the negative effect of light
competition on RWR seedlings. For example, the use of companion crops to reduce
weeds, hold erodible soil against wind erosion, or produce an economic return during
the establishment year should be avoided due to competition and light quality effects on
seedling growth. Weed control through herbicide application or tillage should be
practised so that competition is minimized even where there are generally open
canopies. (Jefferson and Muri 2007)

Vol. 37, 2009, Suppl. Cereal Research Communications
346
Materials and methods
The experiment took place in the botanical garden of Szent István University. It has
sited in fall 2000 from a “park” type mixture (40g/m2) which contains: rye-grass
(Lolium perenne):20%, red fescue (Festuca rubra) + (Festuca heteophilla Lam.):70%,
meadow-grass (Poa pratensis) 10%. The experiment placed on fourteen parcels, seven
were cut by rotary mower and seven were cut by push reel mower. The Turf was
sustained by regular mowing in the rhythm of growing grass. The height of turf in case
of rotary mower was 50 mm, while in case of reel mower it was 27 mm. Mowing below
the optimum height restricts root growth and increases susceptibility to damage from
insects, disease, drought, and traffic (Reicher Bigelow, 2006). Mowing of turf started in
the middle of April. Only 30 % of the vegetation was removed by mowing so at least 2-
3 of the leaves were always left on the blades of grass. We call this the rule of one third.
Every time in each parcel mowing was performed by a grass collecting mower. Yield
was measured in every parcel at times and regularity listed in the table while weight of
green mass was indicated in the table and illustrated in the diagram. The first fertilization was made in 7
th of May with all types of fertilizers, than 2 more
times with Ammonium-nitrate 25th
of June and 18th
of August.
Watering happened occasionally when the stress of droop appeared.
Weighting of green mass for data collection and color measurement happened 16 times.
Count of shoots and separate to monocotyledon and dicotyledonous happened 3 times.
Results and discussion
We examined the effect of mowing and the fertilizers onto weeds practised. We
indicated the results in the cover percentage of the parcel.(Figure 1,Figure2) when we
fertilized with ammonium-nitrate. It is manifest from the results, those parcels where
AN. treated and deeper (27mm) cut the crab grass (Digitaria sanguinalis) reaches 10%
cover while on the rest of the parcels 5% cover it significantly shows a value. Similarly
the taller one cut (50mm) case.
Plantago, appearance because of a mowing altitude independently the Sb. 8-9 were
frequent on handled areas.
The examination aims the annual graminaceous received emphasized importance weeds
(Poa annua) and the allergen weeds (Ambrosia artemisiifolia/elatior) the watch of these
spreading in the lawn. In the deeper cut lawn the soil warms up much more easily so
rising one-year biological cycle weeds so called technological weeds break out from the
seed in this manner. If the lawn thick enough oppresses these races, then in this manner
on the area (Ambrosia aremisiifolia/elatior) and (Poa annua) did not appear. The
density of the lawn was expected and positive phenomenon for us for peoples. But in
terms of grass races forming lawn the mowing is a continuous stress against, what they
have to defend themselves. They have to live and multiply, their genetics dictates this.
Offspring are pushed because of this by what it is increased the cover of the soil and a
flower tries to be yielded because of this even under the lawnmower.
As a result of the decay of the condition of the useful grass races the perennial
multypling root ones (Convolulus arvensis, Achillea millefolium) and sarmentous races
(Trifolium repens) could gain ground. Against them only with agricultural engineering
without herbicides only, we were not able to protect the useful grass in the turf. Because

VIII. Alps-Adria Scientific Workshop Neum, Bosnia-Herzegovina, 2009
DOI: 10.1556/CRC.37.2009.Suppl.2 347
they adapted to the circumstances, but the change of their cover the nitrogen showed a
significant difference in the function of portions.
Appeared in more considerable races: Taraxacum officinale, Leontodon spp., Bellis perennis, Ballota nigra, Rumex acetosella, Holcus lanatus.
Figure 1 Changes of plant cower fertilized AN cut under rotational mower, Figure 2 Changes of plant cover
fertilized AN cut under reel mower
Table 1 shows the numbers of shoot changes under the two mowers at the different
fertilized parcels. The Figure 3 exemplify the results below, where visible from the
arithmetic average of the three different fertilizers formed columns.
Table 1. Changes the number of shoots and the number of different types lawn components in the turf from 10
cm2 area.
FERTILISER sb89 sb56 sb89 an sb56 sb89 sb56 sb56 an sb89 sb56 sb89 sb56 sb89
monocot 243 164 175 183 360 187 158 390 267 396 197 220 252 372
dicot 7 0 0 0 8 12 9 1 3 14 7 15 16 5
Trifolium 6 9 0 6 3 25 3 1 0 0 4 3 1 0
shoot with leaves 43 147 132 57 69 127 170 125 86 66 64 140 127 100
2008.09.18
monocot 301 390 422 453 313 299 196 171 231 302 177 94 240 237
dicot 11 4 5 0 3 0 1 0 5 3 25 12 4 0
trifolium 7 0 0 2 0 3 0 0 2 10 0 0 1 0
shoot with leaves 143 67 116 66 70 111 67 37 111 97 65 72 98 200
Achillea 0 0 0 6 0 0 15 0 0 0 34 0 0 0
2008.10.01
monocot 290 371 235 350 314 404 185 360 328 319 196 352 412 281
dicot 17 0 5 19 1 0 0 1 0 21 5 16 0 14
Trifolium 5 1 4 0 3 23 0 7 1 0 3 6 3 2
shoot with leaves 97 109 63 61 40 106 144 93 112 28 91 48 70 101
Achillea 0 0 0 0 0 0 6 0 0 0 0 0 0 0
2008.10.15
monocot 296 318 261 306 308 227 136 285 216 235 230 284 242 343

Vol. 37, 2009, Suppl. Cereal Research Communications
348
dicot 7 1 4 0 2 0 0 12 6 1 4 0 10 4
Trifolium 11 0 3 2 3 12 1 0 3 29 0 2 2 4
shoot with leaves 44 31 87 51 79 61 64 67 97 170 46 47 79 89
Achillea 0 0 0 0 0 31 0 0 2 0 14 0 7 0
Figure 3 Changes the numbers of shoots at the treatment of the three different fertilizer: AN, SB89, SB56
Conclusions
It is manifest from the results, those parcels where AN. treated and deeper (27mm) cut
the crab grass (Digitaria sanguinalis) reaches 10% cover while on the rest of the parcels
5% cover it significantly shows a value. Similarly the taller one cut (50mm) case.
Because of the right maintenance technology allergen weeds did not appear in the
experimental parcels. The deficiency of the nutrients primarily the nitrogen, Trifolium repens breaking out was growing in a big measure visibly on the roads between the
parcels. The other “newcomer” races appearance those places where the turf opened
caused by mole digging and therefore the seeds of these species can germinate.
The nitrogen from the ammonium-nitrate was able to be released soon than the resin
coated from artificial fertiliser with a husk. The nitrogen was released due to the
moisture more quickly and washed into the deeper layers of the soil, where the
graminaceous grasses were not able to assimilate it. The symptoms of turning yellow
appeared because of this. The 90% of the roots of the grasses grows in the soil top 0-
20cm zone. Even the three times spread ammonium-nitrate were not able to provide
constant enough nitrogen, so the Digitaria sanguinalis and Echinochloa crus-galli weeds could appeared in the turf.
References
Antal Zs. - Huzsvai L.2007. Grass production model based grazing as the sustainable utilization of protected
grassland. Cereal Research communications, Vol.35 1.pp 191.
Gruber F. 1964. Pázsitok és gyepszınyegek, Mezıgazda Kiadó, Budapest.
Hessayon, D. G. 2005. The Lawn Expert, Transworld Publishers, London.
P.G. Jefferson, R. Muri 2007. Competition, light quality and seedling growth of Russian wildrye grass. (Psathyrostachys juncea) Acta Agronomica Hungarica 55(1), pp. 49-60.
Németh T. 2006. Nitrogen in the soil-plant system, nitrogen balances. Cereal Research Communications, Vol.
34 No. 1. pp. 61-65.
Reicher, Z. A. Patton, C. Bigelow, T. Voigt 2006 Turfgrass science Mowing, Dethatching, Aerifying and
rolling turf Vol. 5.AY-8 – 21

VIII. Alps-Adria Scientific Workshop Neum, Bosnia-Herzegovina, 2009
DOI: 10.1556/CRC.37.2009.Suppl.2 349
EFFECT OF UV-RADIATION ON THE POLLEN VIABILITY OF SOME PARENTAL LINES OF HYBRID MAIZE
Szilvia HIDVÉGI 1 – Ferenc RÁCZ
2 – Géza HADI
2 – László GESZTESI
3 – Zoltán
TÓTH 4
1 Institute of Crop Production, Szent István University, H-2100, Hungary, Gödöllı, Páter K. u. 1.
[email protected] 2 Agricultural Research Institute of the Hungarian Academy of Sciences 3 Pioneer Hi-bred Zrt. Hungary 4 Hungarian Meteorological Service
Abstract: The UV-radiation is especially high in the flowering period of the maize, in June, July and August.
It can be considered as a very significant abiotic effect from the point of view of the longevity of pollens. The
big amount of the vital pollens is the precondition of the suitable quantity and quality of the produced seeds.
Our researches were carried out in the years 2003-2005 in Martonvásár, in the Agricultural Research Institute
of the Hungarian Academy of Sciences. In the course of our laboratory surveys we have experienced that the
viability of pollen of the six surveyed parental lines decreased heavily owing to UV-radiation. But the
measure of this is highly dependant on the crop-year effect, furthermore the weather sensitivity of the parental
lines was very different.
Keywords: maize pollen viability, UV-radiation, drought stress, in-bred lines
Introduction
Pollen is an important vector of gene flow in maize (Zea mays L.). The maize pollen is
desiccation intolerant and has a high settling rate. (Luna et al, 2001)
Maize is one of the most important cultivated crop plant species in our country and in
the world considering the role it plays in human consumption and in animal feeding as
well, moreover it is getting more and more significant as a source of energy nowadays.
The most favourable dry matter production and leaf area index dynamics were recorded
for high rates of NPK fertiliser in wet years and for farmyard manure in dry years.
(Micskei et al, 2008) Good nitrogen and water supplies promote a rapid initial growth in
the leaf area index of maize, allowing optimum LAI values to be maintained with good
biomass duration. This is favourable for the flow of assimilates into the grain
(Berzsenyi et al., 2007).
Hybrids are produced today on a major part of the sown area due to their high crop yield
and other favourable features. Due to this fact there is a great demand on seeds. Seed
production in general and hybrid maize seed production in particular, as well as
breeding and production of maize have a significant impact on crop production of
Hungary.
In case of Hungarian climatic conditions, rainfall and temperature are the two essential
factors determining near the corn growth the average yield mass development (Izsáki,
2007; Surányi, 1957 in Pál-Fám et al, 2008.)
Flowering is a critical phase of seed production regarding the quality as well as the
quantity of the crop. In the literary review the phases of seed and hybrid production and
the biology of corn plant especially the inflorescence and pollen have been discussed.
Since flowering is a very significant phase of hybrid production as well as seed
production a brief review of the subject has been compiled. A more specific survey of
the biology of pollen provides a tool to the evaluation of the experiments.

Vol. 37, 2009, Suppl. Cereal Research Communications
350
Materials and methods
Experiments were conducted to investigate the duration of pollen viability and the
effectiveness of UV-radiation.
The experiments have been carried out in Martonvásár, in the research area of MTA-
MGKI and in Gödöllı, in the laboratory of SZIE-NTTI. The parental lines of three wide
spread maize hybrids have been studied. Four of them are inbreed lines and two are
single-cross lines. The pollen production ability of the lines and the exfoliation of them
have been measured and the duration of pollen vitality under laboratory circumstances
has been observed in the years 2003-2005. The pollen production and the duration of
vitality have been evaluated considering the weather effects, using data of UV-radiation.
We used TTC (triphenyle-tetrazonium-chloride) to dye the viable pollen grains, every
30 minutes, for two hours. We counted the number of viable pollens under microscope,
with the help of a Bürker-chamber.
Results and discussion
The year 2003 was the most droughty in the three years period of the examination. It
has been stated, that the lines named B022 (inbred parental line) and F066 (single
crossed parent) produced the biggest quantity of pollen in these year. We measured the
number of pollen sin 1 mg pollen, and we can say that the highest number of pollen
grains was in the case of lines B022 and F066. Line B022 produced 17500 pieces/mg,
the F066 15417 pieces/mg. These values were significantly higher than the pieces / mg
pollen of the other parental lines.
Decreasing of the pollen viability
04.07.2003.
UV=15,8 MED
0
20
40
60
80
100
0 30 60 90 120idı/time (min)
%
A011
B022
C033
E055
F066
Figure 1.
In Figure 1 the process of decreasing of the pollen viability can be seen. It can be
assumed, that at the beginning of measuring the difference of the quantity of viable
pollens was considerably high. In this dry year the pollen grains lost their viability very
fast, when 30 minutes have passed. Only in the pollen-sample of lines B022 and E055
were some viable pollen grains to be found.

VIII. Alps-Adria Scientific Workshop Neum, Bosnia-Herzegovina, 2009
DOI: 10.1556/CRC.37.2009.Suppl.2 351
Decreasing of the pollen viability
06.08.2004.
UV=16,4 MED
0
20
40
60
80
100
120
0 30 60 90 120idı/time (min)
%
A011
B022
C033
D044
E055
F066
Figure 2.
In Figure 2 the process of pollen viability could be observed. This year showed
optimum values because of the amount of rainfall, and this year was also warm enough.
This year Line 055 and Line B022 demonstrated the longest time of pollen viability.
Decreasing of the pollen viability
29.07.2005.
UV=17,3 MED
0
5
10
15
20
25
30
0 30 60 90 120idı/time (min)
%
A011
B022
C033D044
E055
F066
Figure 3.
The last year of the research, 2005 was the coldest year during the research. In Figure 3
it can be observed that in the beginning of the measuring pollen viability was very low,
and the pollen grains lost their viability within 60 minutes. Only in the pollen samples
of Lines E055 and A011 there were some viable pollen grains detectable.

Vol. 37, 2009, Suppl. Cereal Research Communications
352
Based on our three figures it can be concluded that UV radiation has significant effect
on pollen viability. When comparing the three years’ measures, it can be seen, that the
level of UV radiation was the lowest in the first year at the time of measurement (4 July
2003, Figure 1). The highest radiation level has been observed in the third year (29 July
2005, figure 3). With medium level radiation in the second year the pollen viability was
favourable (6 August 2004, Figure 2). This can be explained by the fact that in this year
the weather conditions provided nearly ideal performance for maize pollination
processes.
Conclusions
Based on the results of our studies, we can conclude that from the line studies that the
pollens of Line B022 and Line E055 are the most resistant against drought. In all three
years of the study these lines were the most resistant against weather conditions, both in
respect of the drought and the UV radiation. These lines are worth to be considered as
subjects of future studies, and breeding works.
Acknowledgement
The authors are indebted to Szent István University Crop Production Institute and the
Agricultural Research Institute of the Hungarian Academy of Sciences regarding the
support received for the research work accomplished.
References
Luna, S. – Figueroa, M. – Baltazar, B. – Gomez, R. – Townsend, R. – Schoper J. B.: 2001. Maize Pollen
Longevity and Distance Isolation Requirements for Effective Pollen Control. Crop Science, Volume 44,
335-342.
Pál-Fám, F. – Kerepesi, I. – Keszthelyi, S. – Pozsgai, J. : 2008. Germination, enzyme activity and nutrient
contents of hail stormed corn in the case of corn smut fungus [Ustilago maydis (DC.)Corda], Cereal
Research Communications, vol. 36. Suppl 1: 195-198.
Berzsenyi, Z. – Dang, Q. L. – Micskei, Gy. – Sugár, E. – Takács, N.: 2007. Effect of maize stalks and N
fertilisation on the yield and yield stability of maize (Zea mays L.) grown in a monoculture in a long-term
experiment. Cereal Research Communications, 35: 2. 249-252.
Micskei, Gy. – Takács, N. – Dang, Q. L. – Berzsenyi, Z. : 2008. Comparative studies on the effect of
farmyard manure and mineral fertiliser on the growth parameters of maize in different years, Cereal
Research Communications, vol 36. suppl. 1. : 227-230.

VIII. Alps-Adria Scientific Workshop Neum, Bosnia-Herzegovina, 2009
DOI: 10.1556/CRC.37.2009.Suppl.2 353
EFFECT OF CLIMATIC FACTORS ON WHEAT GRAIN QUALITY
Balázs P. SZABÓ – Antal VÉHA
University of Szeged, Faculty of Engineering, 6725 Szeged, Moszkvai krt. 5-7., e-mail: [email protected]
szeged.hu
Abstract: Quality in general is the sum of characteristics. In this work factors of complex quality have been
examined. The factors, which determine the wheat quality, can be sorted into two groups, the natural factors
and the growing factors. The natural factor (rainfall, temperature, air) determines the varieties and the growing
technology. The growing factor (variety, seed, sowing-time, nutrients etc.) determines the profit. The wheat was harvested at two different times, and was grown by the same agro-technological treatments.
Before the harvest we examined the kernel, we get information about the possible injury. After harvest we
examined the gluten characteristics, the alveograph and valorigraph performances. The effects of varieties
were dominating, but there was a strong influence of the weather, since the harvest was delayed and so the
plants were exposed to a lot of rain. Yield is an economic index and it is a connection with the kernel
hardness, the order of the varieties shows it. In this study we examined these parameters, and the connection
among these factors. Both natural and growing factors proved to be stressors influencing wheat performance.
Keywords: harvest time, climate factor, wheat
Introduction
In Hungary there is a one phase harvest, so we have to determine the optimum harvest
time. This time is, when there is a beginning of the whole ripening. In this time the
biological value of the wheat is good. In USA, GB, Canada, there are two phase
harvests. In the first step they harvest the wheat in a wax ripening and after 3-5 day,
when it is dried, they are threshing. The advantages are the dried weeds and the good
quality. But if it is raining the grain quality and quantity may get worse and it needs
more work, because you have to go to the land twice and it causes more cost.
We have to choose the right harvest time; it has to fit the variety in favour of good
quality and quantity.
We need to plan the harvest, but the weather may change that. Some research examines
the harvest time and its effects to the wet gluten, the hectolitre and the baking
parameters. Hectolitre weight and baking parameters are worst in the overripen phase.
The different consumption habits do require diverse quality, and thus the quality
behaviour must be permanent. To maintain this permanency in biological system is far
too difficult, since different conditions, i.e. the agricultural land use, the weather, etc
have all significant role in variance of quality factors (Szabó 1986). Pollhamerné (1981)
sorted the agricultural impacts into two groups. In the first group is the agro technical
factors (sowing time, artificial fertilizer, seed grain amount, etc.), in the second group is
the effect of the land. The differences between the two groups are that the effect of land
is given. The agro technical factors are changed by us, so the quality of wheat is
influenced. The natural factors and the growing factors determine the quality of the
wheat. The natural factor determines the varieties and the growing technology. The
growing factor determines the profit. Natural factor determines the yield. The chemical
reaction of the soil is an important thing. Rain full determines the yield and the results
of the fertilizer. If there isn’t water in the beginning of the growing, the plants will be
residual. The temperature determines develop of the plant. The light gives energy and

Vol. 37, 2009, Suppl. Cereal Research Communications
354
determines the growing of the plants. The air content is permanent. Near the soil the air
content is changing.
The growing factors are as follows: variety, seed, soil tillage, seedbed, precrop, sowing-
time, nutrients, fertilizer, care of plants, etc.
Materials and methods
Eleven different registered bread wheat varieties with diverse technological qualities
were used in this study. The samples were provided by the Cereal Research NPC,
Szeged, in Hungary, and included the following varieties: GK Garaboly, GK Békés, GK
Kalász, GK Verecke,GK Holló, GK Ati, GK Petur, GK Nap, GK Élet, GK Csongrád,
GK Hattyú.
We examined the Hardness index with the Perten SKCS 4100 (Perten Instruments,
Sprinfield, Illinois, USA) instrument is one of the well know machines, which examine
the kernel hardness. Brabender ® Quadrumat ® Senior (Brabender GmbH & Co. KG,
Duisburg, Germany) laboratory mill was used to determine the milling properties and
the flour yield of the different types of wheat. Ash content refers to the mineral content
of flour. It depends on many factors, such as the variety of wheat, the fertilization, the
climate, etc. The gluten index (GI) was examined by Glutomatic 2200 (Perten
Instruments AB Huddinge, Sweden). The farinograph determines dough and gluten
properties of a flour sample by measuring the resistance of dough against the mixing
action of blades. Absorption is the amount of water required to center the farinograph
curve on the 500-Brabender unit line. We used the Brabender ® farinograph (Brabender
GmbH & Co. KG, Duisburg, Germany). We used Chopin Alveorgraph NG (CHOPIN
Technologies, Villeneuve-la-Garenne Cedex, France) the alveograph test were
determined according to the EU-Standards. The alveograph determines the gluten
strength of dough. It is measuring the force required to blow and break a bubble of
dough. The results include P Value, L Value, P/L Value and W Value. Statistica 8.0
(StatSoft, Inc. Tulsa, USA ) and Microsoft © Office 2003 Excel software for Windows
were used to perform statistical analyses. The wheat was tested for significance using
analysis of variance techniques (ANOVA). A level of significance of P < 0:05 is used
throughout the analysis.
Results and discussion
The crop land was: 6729 Szeged, Alsóváros’s black soil 39. The soil type was loam font
soil, the thickness of the topsoil was 30-35 cm, and there was P and K supply. The fore
crop was oil radish.
The wheat was harvested at two different times:
o Bemutató 2 (Bem 2): 7th
July 2005.
o Bemutató 3 (Bem 3): 18th
July 2005.
The physical, physicochemical and baking characteristics of the 11 varieties in research
have been evaluated. Table 1 shows the Hardness Index and other technological traits of
the wheat samples.

VIII. Alps-Adria Scientific Workshop Neum, Bosnia-Herzegovina, 2009
DOI: 10.1556/CRC.37.2009.Suppl.2 355
Table 1. Selected technology parameters of the entries in the study
Harvest
time Variety
Flour
yield
(%)
Ash content
(%/d.m..)
Gluten
index (%)
Alveograph W
(x10-4 J)
Falling
number (s)
SKCS
HI
Bem.2. GK ATI 72.19 0.68 83 385.9 361 67.68
Bem.2. GK BÉKÉS 73.37 0.71 84 443.4 442 71.57
Bem.2. GKCSONGRÁD 70.55 0.68 76 258.3 394 49.54
Bem.2. GK ÉLET 75.41 0.56 93 378.1 433 75.29
Bem.2. GKGARABOLY 69.06 0.52 65 234.0 348 46.58
Bem.2. GK HATTYÚ 67.32 0.49 80 194.2 320 78.68
Bem.2. GK HOLLÓ 63.33 0.52 74 241.5 396 32.56
Bem.2. GK KALÁSZ 66.89 0.62 91 453.1 406 62.41
Bem.2. GK NAP 70.91 0.51 71 254.3 352 49.15
Bem.2. GK PETUR 76.43 0.52 98 256.1 381 70.21
Bem.2. GK VERECKE 75.89 0.53 98 311.8 417 44.29
Bem.3. GK ATI 75.86 0.66 56 272.0 372 62.4
Bem.3. GK BÉKÉS 74.28 0.72 73 401.5 437 63.27
Bem.3. GKCSONGRÁD 68.60 0.63 68 240.7 432 41.39
Bem.3. GK ÉLET 74.19 0.54 92 359.6 449 68.69
Bem.3. GKGARABOLY 69.74 0.53 61 222.8 322 71.99
Bem.3. GK HATTYÚ 67.56 0.48 67 194.1 338 25.32
Bem.3. GK HOLLÓ 68.73 0.61 60 188.3 409 58.21
Bem.3. GK KALÁSZ 77.29 0.74 93 415.1 453 42.15
Bem.3. GK PETUR 75.24 0.59 95 284.8 394 66.95
Bem.3. GK VERECKE 76.89 0.56 96 265.1 450 47.16
The SKCS 4100 classifies the results in two groups. Under 50, the wheat samples
belong to Soft Wheat-, while samples above values 50 considered as Hard Wheat
category. The samples were tested for significance using analysis of variance techniques
(ANOVA). A level of significance of P < 0.05 is used throughout the analysis. The
Table 2 shows the results. Table 2. Results of ANOVA
Methods Connection
Flour Yield (%) N.S., ↑ Gluten Index (%) N.S., ↓
Thousand kernel weight (g) N.S., ↑ Falling Number (s) N.S., ↑
Water Absorption Capacity (%) N.S., ↓ Hardness Index S., ↓
Alveograph, P (mm) N.S., ↓ Alveograph, L (mm) N.S., ↓
Alveograph, P/L N.S., ↑ Alveograph, W (x10-4 J) S., ↓ S.- Significant; N.S.- Non Significant; ↑ - Increase; ↓ - Decrease

Vol. 37, 2009, Suppl. Cereal Research Communications
356
In our study the flour yield and the thousand kernel weight increased, but they weren’t
significant. The gluten index decreased and it wasn’t significant also. The P, L values of
the alveograph decreased and they weren’t significant.
The changing of Hardness Index was significant. Figure 1 shows, that the samples had
different Hardness Index, and it was significant.
aratási idı; LS Means
Current effect: F(1, 29)=61,221, p=,00000
Effective hypothesis decomposition
Vertical bars denote 0,95 confidence intervals
Bem.2. Bem.3.
aratási idı
52
53
54
55
56
57
58
59
60
61
SK
CS
HI
aratási idı; LS Means
Wilks lambda=,56594, F(7, 23)=2,5200, p=,04440
Effective hypothesis decomposition
Vertical bars denote 0,95 confidence intervals
Bem.2. Bem.3.
aratási idı
280
285
290
295
300
305
310
315
320
325
330
W
(x1
0-4 J)
Figure 1. Hardness Index confidential interval Figure 2. W value of alveograph confidential interval
Different weathers existed at the different harvest time. The rainwater was 24,8 mm, it
caused the decrease of Hardness Index (Figure 1.). The other significant change was the
W value of alveograph (Figure 2.).
Conclusions
The wheat was harvested at two different times. Agro-technological treatments were
identical in the experiment. Varietal impacts were proven to be dominant, but there
were effects caused by rain that occurred betweenthe two harvest dates.
Hardness Index, the gluten characteristic, the alveograph and valorigraph (water
absorption capacity) performances have been evaluated.
There were two significant correlations between impacting factors and quality; the
Hardness Index decreased and W value of alveograph performed similarly.
References
Bedı Z.: 2003. Development of crop production technologies for multifunctional agriculture, Acta
Agronomica Hungarica, 51: 1. 83-90
Matuz J. – Krisch J. – Véha J. – Petróczi I.M. – Tanács L: 2007. Effect of the fertilization and the fungicide
treatment on the alveographic quality of winter wheat., Cereal Research Communications. 35: 2. 1193 –
1197. Pollhamer E-né.: 1981. A búza és a liszt minısége. Mezıgazdasági Kiadó, Budapest
Szabó, M.: 1986. Fajtakérdés, fajtarotáció, fajtavédelem. (in szerk. Barabás Z. 1987. Búzanemesítés
kézikönyve, Mezıgazdasági Kiadó Budapest, p. 237-252)
Véha A. – Szabó P. B. – Gyimes E.: 2008. Étkezési búzák fizikomechanikai és beltartalmi paramétereinek
kapcsolata, MTA AMB K+F Tanácskozás, 13. p.

VIII. Alps-Adria Scientific Workshop Neum, Bosnia-Herzegovina, 2009
DOI: 10.1556/CRC.37.2009.Suppl.2 357
STRESS EFFECT OF FERTILIZATION AND PRECIPITATION ON THE BIODIVERSITY OF RANGELAND
László SZEMÁN
Department of Grassland Management, Institute of Crop Production Science, Szent István University, H-2103
Gödöllı, Páter K. út 1., e-mail: [email protected]
Abstract: Grass yield and sward compositions of rangelands are determined by soil nutrient status, summer
rainfall (potential moisture deficit). There are two very important concepts of sward composition. One is that
pasture composition moves toward equilibrium with the environment. The second is that botanical
composition is a dependent variable and not a driving variable in the climate – soil – plant - animal system.
Sward composition reflects what happening to the system. With financial support from the “GAK,
JUHFETA4” an experimental trial has been carried out at the grassland of AWASSI Rt. The objective was to
investigate the relative effectiveness of fast-acting fertilizers and farm manure treatment to control the
changes of rangeland sward composition by the effect of summer rainfall. There were control, and five
fertilizer 100kg N ha-1, 100kg P ha-1, 100kg K ha-1, 100kg NP ha-1, 100kg NPK ha-1 and one farmyard manure
10 t ha-1 year-3 treatments. The botanical composition and the biodiversity components of the plots were
recorded three times every experimental year. The diversity of the flora was reduced by the introduction of
grassland fertilization, and was improved by the farmyard manure application.
Keywords: rangeland, stress effects, diversity, precipitation, fertilization
Introduction
The botanical composition of natural grasslands is a result of several ecological effects.
(Frame, 1992, Szemán, 2007). Factors determining the diversity of species are
characteristics of the soil, nutrient and water supplies, (Stekauerová, et.al. 2007) the
terrain and precipitation. (Centeri et.al. 2007, Szabó et.al.,2007, Várallyay, 2007,
Haynes, et.al.1993, Tasi, 2007, As the plant stand reaches its climax, the botanical
composition of the grassland can be considered permanent, because it reaches
equilibrium with its environment. This stabile state changes due to external
interventions. Gradual changes result in an even reaction. Occasional (Szemán,
et.al.2007, Penksza, et.al.2007) yearly changes, however, can develop stress in the
botanical composition and diversity of the plant stand. The strongest environmental
effect is represented by grassland management (Benyovszky, et al. 2007) as an activity
of agricultural production. Grassland management is a process based on grassland plants
as biological bases, utilizing the crop produced through grass production (Rutkoviene,
et.al. 2007, Haynes, et.al 993) by farm animals.
Of all procedures of production technology, manuring changes (Kádár, 2007) the
ecological nutrient level of the soil and through this the botanical composition and
biodiversity of grasslands. (Herczeg, et.al. 2006, Pajor, et.al. 2007) Nutrient supplies
can either be artificial fertilizers or manure. The yearly changing dose of nutrient
supplies (Csatho, et.al. 2007) presents a stress for the plant stand, but original plant
composition returns as fertilizing is discontinued. Among the active agents, nitrogen,
phosphorus and potassium play major roles in the change of biodiversity determined by
precipitation (Ľubomír – Hallett, et.al. 2007) conditions.

Vol. 37, 2009, Suppl. Cereal Research Communications
358
Materials and methods
Diversity and cover of grass species were determined on species rich natural grasslands in Bakonszeg which neighbour the Hortobágy, during two growing seasons
characterising different summer precipitations (rainy summer of 2006 and dry summer
of 2007: 570 mm and 370 mm of annual rainfall, respectively). The top layer of the
meadow solonetz soil was of clay texture, with a humus content of 4-5%.
Seven fertilization treatments (Table 1) were used. The basic plot size of fertilization
was 5x5 m and was replicated three times.
The botanical composition and the biodiversity of the plots were recorded three times in
each experimental year.
The effects of nutrients have been influenced by precipitation. Depending on the
weather, we can talk about rainy, rainfall deficient and dry (arid) years. Years when the
amount of rainfall deviates from the average either in a positive or a negative direction,
impose an abiotic stress effect on the biodiversity of grasslands, this is why we
examined the effect of the 2006 rainy summer (570 mm) and 2007 year dry summer
(370mm) on the effect of artificial fertilizers and manure.
Results and discussion
The botanical composition of the grassland included first rate bottom and top grasses,
secondary Festuca species, perennial and annual forage legumes, as well as valuable
dicotyledons and weeds.
Table 1. The growing season and annual precipitation and fertilizer treatment on Sward composition changes
The botanical composition (table 1.) of control plots consisted of 12 grass species, 3
perennial legumes, 8 annual legumes, 7 other dicotyledons (forbs) and 3 weed species.
As a result of nutrient applications, the number of species in the grassland changed.
Species number under fertilization treatments*
Species Groups 0 N P K NP NPK SM
The 2006 growing season (570 mm annual precipitation) Grasses 12 12 12 12 12 12 12
Forage legumes 3 1 3 2 2 1 3
Salt-loving annul legumes 8 0 8 8 3 0 8
Forbs 7 5 7 7 6 3 7
Weeds 3 4 2 2 4 4 4
33 22 32 31 27 20 34
The 2007 growing season (370 annual precipitation ) Grasses 12 12 12 12 12 12 12
Forage legumes 3 0 2 2 3 3 3
Salt-loving annul legumes 0 0 0 0 0 0 0
Forbs 2 2 3 2 3 3 5
Weeds 1 2 2 1 3 3 4
18 16 19 17 21 21 24
0 = unfertilized; 100 kg ha-1 of nitrogen (N), phosphorus (P), potassium (K), both N
and P; NPK = 100 N + 100 P + 200 K; SM = sheep manure 10 t ha-1x3year-1 ; P and
K were calculated as P2O5 and K2O.

VIII. Alps-Adria Scientific Workshop Neum, Bosnia-Herzegovina, 2009
DOI: 10.1556/CRC.37.2009.Suppl.2 359
On the control plots, precipitation caused an increase in the number of species, while the
lack of precipitation caused a decrease. This change has been indicated primarily by
annual leguminous species.
The number of grass species was not influenced by either nutrient supply or the
precipitation in a given year. The botanical cover of some species increased by the use
of nitrogen, while potassium and phosphorus did not have the similar effect. The effect
of fertilizers was enhanced by rainy years, and reduced by dry years. In dry years, the
decrease in the botanical cover of primary grass species was significant, while the cover
of secondary grass species did not increase significantly in rainy years either.
The use of nitrogen resulted in a decrease in the number of perennial leguminous
species. The application of different fertilizers caused a change in the number of annual
legumes only in rainy weather. When using nitrogen, the number leguminous species
decreased or they disappeared. Applying manure, phosphorous or potassium promoted
their appearance in grasslands. In dry weather, legumes disappeared from all plots.
The use of artificial fertilizers decreased the number of dicotyledonous species in the
grassland. This change was reinforced by the lack of precipitation. Some species
disappeared, while some species appeared. Rainy periods caused an increase, while
deficiencies in the rainfall caused a decrease in the number of species of dicotyledons
on the treated plots.
The number of weed species decreased on plots where artificial fertilizers were applied,
while it increased on plots where manure was applied. Convulus arvensis could only be
identified on plots where nitrogen fertilizers or manure was applied. The change of
precipitation had no effect on the number of weed species.
Conclusions
Results ( table 1.) of our research clearly identify stress effects on plants. The
application of fertilizers did not have an effect on the number of grass species, therefore
the nutrient supplies with the doses and active ingredients applied in our trial cause no
stress effect for grasses. The change in the precipitation of each year caused no changes
to the number of grass species either, so it can be concluded that grassland species
tolerate the abiotic stress caused by the changes of weather. This proves the fact that
extreme weather effects can regularly occur in the area.
The stress tolerance of perennial legumes towards nitrogenous fertilizers is enhanced by
surplus precipitation.
Annual leguminous species do not tolerate stress caused by artificial fertilizers.
Abundant precipitation causes no stress for legumes, while dry weather is not tolerated
by these species.
The number of weed species remained unchanged in grasslands, but their botanical
composition changed as a result of stress caused by nitrogenous fertilizers. Depending
on the type of active ingredient used, certain weed species disappeared, while others
appeared.
The application of manure improved the number of species, therefore it did not have as
strong a stress effect as active ingredients applied in the form of artificial fertilizers.

Vol. 37, 2009, Suppl. Cereal Research Communications
360
Acknowledgements
The author is grateful to Imre Kádár, Research Institute for Soil Science and
Agricultural Chemistry of the Hungarian Academy of Sciences (RISSAC), and Péter
Kovács AWASSI Rt. for their good co-operation and assistance in carrying out the
experiments. This research was supported by “GAK, JUHFETA4” ALAP1-00101/2004
Project.
References
Benyovszky B. M., Hausenblasz J., Szemán L., Penksza K.: 2007. Lovak takarmányainak kedveltségi
vizsgálataiból. A magyar gyepgazdálkodás 50 éve – tanulságai a mai gyakorlat számára –
Gyepgazdálkodási ankét SZIE, Gödöllı, pp. 153-159.
Centeri, Cs. , Á. Malatinszky, M. Vona, Á. Bodnár, K. Penksza: 2007. State and sustainability of grasslands
and their soils established in the Atlantic-Montane zone of Hungary. Cereal Research Communications
35(2): 309-312.
Frame J.: 1992. Improved Grassland Management. Farming Press 181-185
Haynes R. J. Williams P.H.: 1993 Nutrient cycling and soil fertility in the grazed pasture ecosystem. Advances in Agronomy, 49. 119-199
Herczeg, E., Á. Malatinszky, T. Kiss, Á. Balogh, K. Penksza: 2006. Biomonitoring studies on salty pastures
and meadows in South-East Hungary. Tájökológiai Lapok 4(1): 211-220.
Kádár, I.: 2007. Sustainability of soil fertility nutrient levels. Cereal Research Communications, Vol. 35, No.
2 pp 573-576
Ľubomír - Hallett, P.D. - Feeney, D.S - Ďugová, O. - Šír, Miloslav - Tesar, M.: 2007. Field measurement of
soil water repellency and its impact on water flow under different vegetation. Biologia, vol. 62, no. 5, pp.
537-541.
Pajor, F. – Laco, E. – Póti, P: 2007. Sustainable sheep production: Evaluation of effect of temperament on
lamb production. Cereal Reseach communications, vol. 35, no. 2, pp 873-876
Penksza K., Tasi J., Szentes Sz.: 2007. Eltérı hasznosítású Dunántúli középhegységi gyepek
takarmányértékeinek változása. Gyepgazd. Közlem. 5: 1-8.
Péter Csathó - Tamás Árendás - Nándor Fodor - Tamás Németh: 2007. A legelterjedtebb hazai trágyázási
szaktanácsadási rendszerek tesztelése szabadföldi kísérletekben. Agrokémia és Talajtan, Vol. 56 No. 1 pp
173-190
Stekauerová Vlasta - Nagy Viliam: 2007. The influence of extreme meteorological phenomena on soil water
regime of lowlands. Cereal Research Communications, vol. 35, no. 2, pp 1097-1100
Szabó, M., Á. Kenéz, D. Saláta, L. Szemán, Á. Malatinszky: 2007. Studies on botany and environmental
management relations on a wooded pasture between Pénzesgyır and Hárskút villages. Cereal Research
Communications 35(2): 1133-1136.
Szemán L.: 2007. Environmental conseqvences of sustainability on grassland Cereal Research communikation
35 (2): 1157 – 1160 Part II.
Szemán, L. –Kádár, I.- Kovács, P.: 2007. The effect of „gyímesi racka” sheep grazing on permanent grassland
biodiversity, In A. De Vliegher, - L. Carlier (edited by) Permanent and temporary grassland, Proceedings
of the 14th Symposium of the European Grassland Federation, Ghent, Belgium, 153-157p
Tasi J.: 2007. Diverse impacts of nature conservation grassland management. Cereal Research
Communications Vol.35. No. 2. 1205-1209. p.
Várallyay, Gy.: 2007. Soil resilience (Is soil a renewable natural resource?) Cereal Research Communications.
35. (2) 1277-1280.
Vida Rutkoviene - Laima Cesoniene - Dainius Steponavicius: 2007. Nitrogen losses from organic and mineral
fertilizers in model soil system. Cereal Research Communications, Vol. 35, No. 2 pp 313-316

VIII. Alps-Adria Scientific Workshop Neum, Bosnia-Herzegovina, 2009
DOI: 10.1556/CRC.37.2009.Suppl.2 361
WATER AVAILABILITY – A STRESSOR INFLUENCING QUANTITY AND QUALITY OF WINTER WHEAT Triticum
aestivum L. YIELD
Helga KLUPÁCS – Ferenc H. NYÁRAI – István BALLA – Márton JOLÁNKAI
Crop Production Institute, Szent István University, Gödöllı, Hungary and HAS-SIU Agronomy Research
Group, Gödöllı, Hungary
Abstract: Moisture availability is a major stressor in relation with yield quality and quantity performance of
winter wheat. In a 12 years experimental series of winter wheat agronomic trials run at the Szent István
University’s Nagygombos experimental site effect of water availability has been evaluated. Various crop
years have had different impact on crop yield quantity. Yield figures were in positive correlation with annual
precipitation in general. Water availability had diverse influence on quality manifestation. High precipitation
has often resulted in poorer quality, especially gluten and Hagberg values have been affected by that. Drought
stress reducing the amount of yield has induced quality improvement in a few cases.
Keywords: water availability, wheat yield, quality, quantity, drought stress
Introduction
Availability of water is a major stressor in relation with yield quality and quantity
performance of winter wheat. Cereals represent a most plausible source of human
alimentation in the World. Wheat provides a basic staple for mankind. This crop is one
of the most important cereals in Hungary with a high economic value. Utility, market
and alimentation value of the crop is highly affected by climatic conditions and within
that annual weather performances, as well as soil moisture conditions (Ács et al., 2008;
Koltai et al, 2008; Skalová et al, 2008; Várallyay 2008). The aim of wheat production is
twofold; to provide quantity and quality. Milling and baking quality of wheat is mainly
determined by the genetic basis, however it can be influenced by management
techniques (Pollhamerné, 1981; Nagy et al., 2006, Varga et al., 2007; Vida et al., 1996).
The aim of this study was to determine the role of water availability impacts on wheat
quantity and quality. Since main quality indicators - protein, farinographic value, gluten
content, Hagberg falling number - have a rather diverse manifestation, there is a need to
gain more information concerning the behaviour of them.
Materials and methods
In long term field trials a wide range high quality winter wheat Triticum aestivum L.
varieties were examined under identical agronomic conditions in the experimental years
of 1996-2007. The small plot trials were run at the Nagygombos experimental field of
the SZIU Crop Production Institute. Soil type of the experimental field is chernozem
(calciustoll). Experiments were conducted in split-plot design with four replications.
The size of each plot was 10 m2. Plots were sown and harvested by plot machines.
Various agronomic treatments were applied to plots. Weed control (fluroxipir,
bromoxynil, dicamba and MCPA a.i.), the rate and application time of nitrogen top
dressing (ammonium nitrate 0-40-80 kgha-1
in direct and split applications), fungicides
and insecticides (triadimefon, tebukonazol+triadimefon, bensultap a.i.) were applied in
single and combined treatments. Precipitation records have been evaluated in relation
with yield quantity and quality. Protein, farinographic value, wet gluten content and

Vol. 37, 2009, Suppl. Cereal Research Communications
362
Hagberg falling number were correlated with water availability. Analyses were done by
Microsoft Office 2003 statistical programmes.
Results and discussion
Annual amounts of precipitation and winter wheat yields have been examined in a 12
years time range at the Nagygombos experimental field of the Szent István University,
Gödöllı. Figure 1 illustrates annual changes of yield and precipitation mean values.
Yields have been correlated with water availability.
4,08
2,88
6,21
2,873,32
5,28
4,34
3,47
6,065,72
7,11
5,21
0
100
200
300
400
500
600
700
800
900
1996 1997 1998 1999 2000 2001 2002 2003 2004 2005 2006 2007
mm
0
1
2
3
4
5
6
7
8
t/ha
precipitation, mm wheat yield, t/ha
Figure 1. Annual amount of precipitation and winter wheat grain yields
Nagygombos, 1996-2007
Yield figures were in accordance with annual precipitation patterns with an exception of
some years when the distribution was irregular eg. In 1999 year, when 837 mm rainfall,
the highest in the period examined was recorded, however a sever drought spring was
followed by an extreme moist summer obstructing yield formation and ripening as well
as harvest.
Figure 2 provides examples regarding interactions between annual precipitation and
nitrogen supply. Drought versus moist conditions have resulted in low, but increasing
yield manifestation in accordance with increasing N supply (57, 58 and 63 %
respectively). Ascending doses of nitrogen supply have buffered water efficieny gap
caused by drought conditions.

VIII. Alps-Adria Scientific Workshop Neum, Bosnia-Herzegovina, 2009
DOI: 10.1556/CRC.37.2009.Suppl.2 363
2,66
3,323,87
5,03
5,726,11
0
1
2
3
4
5
6
7
t/ha
2000, 344 mm 2005, 705 mm
kontrollN 80 kg/haN 120 kg/ha
Figure 2. Interaction of annual precipitation and nitrogen supply on winter wheat grain yields in dry and moist
years. Nagygombos, 2000 and 2005
Quality manifestation of winter wheat yields have been impacted by annual
precipitation. Table 1 provides a summary of changes in yield quality characteristics.
Protein, farinographic value, wet gluten and Hagberg falling number records have been
evaluated.
Table 1. Annual amount of precipitation and grain yield quality characteristics
Nagygombos, 1996-2007
1996 1997 1998 1999 2000 2001 2002 2003 2004 2005 2006 2007
1 544 407 725 837 344 706 426 442 463 705 593 545
2 4,08 2,88 6,21 2,87 3,32 5,28 4,34 3,47 6,06 5,72 7,11 5,21
3 15,8 13,2 11,5 14,3 11,6 12,0 17,2 17,6 15,3 14,3 15,4 18,1
4 89,7 50,4 70,7 47,4 44,4 51,6 62,4 63,3 58,8 50,9 54,8 62,6
5 37,8 30,5 27,4 32,2 28,3 27,5 38,4 36,8 29,9 30,1 33,7 38,8
6 339 213 278 - 188 295 362 370 296 282 346 420
1-precipitation, mm, 2-yield, t/ha, 3-protein, %, 4-farinographic value, 5-wet gluten, %, 6-Hagberg falling
number.
LSD5%: 0,97 t/ha yield, 0,73 % protein, 11,6 farinographic value, 4,54 % wet gluten, 64 Hagberg.

Vol. 37, 2009, Suppl. Cereal Research Communications
364
Wet gluten content of grain samples proved to be a most stable quality characteristic.
Annual changes of protein figures were significant. Farninographic values and Hagberg
falling number figures were highly affected by precipitation. In some dry years like
2002 and 2003 baking quality was far better than in moist years, however it was
escorted by low yield figures as well.
Conclusions
Water availability can be sconsidered as a major stressor in relation with yield quality
and quantity performance of winter wheat. In a winter wheat agronomic long term trial
run at the Szent István University’s Nagygombos experimental site effect of water
availability has been evaluated. Various crop years have had different impact on crop
yield quantity. Yield figures were in positive correlation with annual precipitation in
general. Nitrogen applications had a positive effect on reducing yield gaps induced by
drought. Moisture availability had diverse influence on quality manifestation. High
precipitation has often resulted in poorer quality, especially gluten and Hagberg values
have been affected by that. Protein and gluten values proved to be the most stable
quality characteristics in this study. Drought stress reducing the amount of yield has
induced quality improvement in a few cases.
Acknowledgements
Authors are indebted regarding the financial support recieved from NKTH and from the
HAS.
References
Ács F. – Horváth Á. – Breuer H.: 2008. The role of soil in variations of the weather. Agrokémia és Talajtan.
57: 2. 225-238.
Koltai G. – Milics G. – Neményi M. – Nagy V. – Rajkai K.: 2008: Plant water supply of layered alluvial soils
under different weather conditions. Cereal Research Communications, 36: Suppl. 167-171.
Nagy V. – Ján H.: 2006. Method to estimate the critical soil water content of limited availability for plants.
Biologia. 61, suppl. 19,. 289-293 pp.
Pollhamer, E.: 1981. A búza és a liszt minısége. (Quality of wheat and flour). Mezıgazdasági Kiadó,
Budapest.
Skalová J. – Jaros B.: 2008: Soil water regime assessment in Morava basin. Cereal Research
Communications, 36: Suppl. 243-246.
Várallyay G.: 2008: Extreme soil moisture regime as limiting factor of the plants’ water uptake. Cereal
Research Communications, 36: Suppl. 3-6.
Varga B. – Svečnjak Z. – Jurković Z. – Pospišil M.: 2007. Quality responses of winter wheat cultivars to
nitrogen and fungicide applications in Croatia. Acta Agronomica Hungarica, Vol. 55: 1. 37-48.
Vida Gy. – Bedı Z. - Jolánkai M.: 1996. Agronómiai kezeléskombinációk ıszi búzafajták sütıipari
minıségére gyakorolt hatásának elemzése fıkomponens-analízissel. (Impacts of various agronomic
methods on baking quality of wheat evaluated with factor analysis). Növénytermelés, 45. 6. 453-462.
Copyright © 2022 FDOKUMEN


![Bosna Hersek’te Türk Varlığının Sözlü Kültür Ortamındaki İzleri [The Traces of Turks in the Oral Culture of Bosnia-Herzegovina]](https://static.fdokumen.com/doc/165x107/6317734db6c3e3926d0de20f/bosna-hersekte-tuerk-varliginin-soezlue-kueltuer-ortamindaki-izleri-the.jpg)