2 3 New highlights on degradation process of verdigris from easel paintings
11
1 23 Applied Physics A Materials Science & Processing ISSN 0947-8396 Appl. Phys. A DOI 10.1007/s00339-014-8253-2 New highlights on degradation process of verdigris from easel paintings Carlotta Santoro, Karim Zarkout, Anne- Solenn Le Hô, François Mirambet, Didier Gourier, Laurent Binet, Sandrine Pagès-Camagna, et al.
Transcript of 2 3 New highlights on degradation process of verdigris from easel paintings
1 23
Applied Physics AMaterials Science & Processing ISSN 0947-8396 Appl. Phys. ADOI 10.1007/s00339-014-8253-2
New highlights on degradation process ofverdigris from easel paintings
Carlotta Santoro, Karim Zarkout, Anne-Solenn Le Hô, François Mirambet,Didier Gourier, Laurent Binet, SandrinePagès-Camagna, et al.
1 23
Your article is protected by copyright and
all rights are held exclusively by Springer-
Verlag Berlin Heidelberg. This e-offprint is
for personal use only and shall not be self-
archived in electronic repositories. If you wish
to self-archive your article, please use the
accepted manuscript version for posting on
your own website. You may further deposit
the accepted manuscript version in any
repository, provided it is only made publicly
available 12 months after official publication
or later and provided acknowledgement is
given to the original source of publication
and a link is inserted to the published article
on Springer's website. The link must be
accompanied by the following text: "The final
publication is available at link.springer.com”.
INVITED PAPER
New highlights on degradation process of verdigris from easelpaintings
Carlotta Santoro • Karim Zarkout • Anne-Solenn Le Ho • Francois Mirambet • Didier Gourier •
Laurent Binet • Sandrine Pages-Camagna • Solenn Reguer • Sigrid Mirabaud • Yann Le Du •
Pascal Griesmar • Nadege Lubin-Germain • Michel Menu
Received: 19 December 2013 / Accepted: 13 January 2014
� Springer-Verlag Berlin Heidelberg 2014
Abstract Verdigris is a green copper organometallic
pigment, widely used in paintings during the fifteenth and
sixteenth centuries. With ageing, chromatic modifications
like browning or darkening can be observed on those green
painted layers. An original but crucial approach has been
developed based on the characterization of a reference
neutral verdigris pigment—anhydrous copper acetate—and
model samples, made of verdigris and linseed oil. Samples
have undergone artificial ageing (temperature, light) to
reproduce the color change effect. They were analysed
before and after accelerated ageing tests by a comple-
mentary set of classical techniques: colorimetry, electron
paramagnetic resonance, X-ray absorption spectroscopy,
and UV–visible absorption. Our experiments revealed that
the incorporation of the verdigris pigment in linseed oil
induces a transformation of the copper acetate bimetallic
structure, with the formation of monomeric species. These
monomers, however, are not directly responsible for the
darkening. The chromatic alteration seems instead linked
to the transient formation of Cu(I) in the copper complexes
of the pigment/oil system. This formation could be initiated
by ambient light absorption through ligand-to-metal charge
transfer, which favors the decarboxylation of the copper
complexes leading to the reduction of Cu(II) into Cu(I).
Moreover, dioxygen can react with partially decarboxyl-
ated dimers to form peroxy-Cu dimer complexes that can
be responsible for the darkening.
1 Introduction
Verdigris is a green copper organometallic pigment widely
used in paintings during the fifteenth and sixteenth centu-
ries for its transparency and brilliance. Verdigris is a
mixture of blue–green copper acetates with different
degrees of basicity and hydration [1, 2], obtained by the
reaction of pure copper, or copper alloys¸ with the acetic
acid contained in vinegar.
With ageing, chromatic alterations of this pigment,
namely browning, are often observed, modifying the visual
appearance of the paintings in a non-esthetic and irre-
versible way [3, 4].
Browning is, however, not systematic. As it has been
observed in some older paintings, like some from the
Middle-Ages [5], or in the presence of tempera as binder,
the pigment can keep its original color. Moreover, altered
and not altered areas can coexist in the same painting.
C. Santoro � K. Zarkout � A.-S. Le Ho (&) � F. Mirambet �D. Gourier � L. Binet � S. Pages-Camagna � Y. Le Du �M. Menu
C2RMF, Centre de Recherche et Restauration des Musees de
France, Palais du Louvre, Paris, France
e-mail: [email protected]
C. Santoro � N. Lubin-Germain
SOSCO, Laboratoire de Synthese Organique Selective et de
Chimie bioOrganique, EA 4505 CNRS-Universite de
Cergy-Pontoise, Cergy-Pontoise Cedex, France
K. Zarkout � A.-S. Le Ho � F. Mirambet � D. Gourier �L. Binet � S. Pages-Camagna � Y. Le Du � M. Menu
Chimie-ParisTech, Institut de Recherche de Chimie-Paris-IRCP,
UMR8247 CNRS, Paris Cedex 05, France
S. Reguer
Ligne DiffAbs, Synchrotron SOLEIL, Saint-Aubin, France
S. Mirabaud
INP, Institut national du patrimoine, Saint-Denis, France
P. Griesmar
SATIE, laboratoire Systeme de l’Application des Technologies
de l’Information et de l’Energie UMR 8029 CNRS, ENS,
Universite de Cergy-Pontoise, Cergy-Pontoise Cedex, France
123
Appl. Phys. A
DOI 10.1007/s00339-014-8253-2
Author's personal copy
Due to the complexity of this issue and despite several
studies [6–8] the mechanism involved in the color change
is still not fully understood.
Several hypotheses have been formulated. Gunn et al.
[6] correlates the color changes with reactions between the
oil binder, composed of terpenoid and/or poly-unsaturated
fatty acids, and the pigment, leading to the formation of
copper soaps. The formation of these copper organome-
tallic complexes could be responsible for a local molecular
rearrangement of the metal ion coordination structure (due
to hydration or a change in symmetry), which could induce
changes of the chromatic properties, as also observed by
Cartechini et al. [7].
Verdigris is very reactive with fatty and resinic acids
and can catalyze the oxidative degradation of linseed oil
films [8]. This reaction involves copper in Cu(I) and Cu(II)
oxidation states during redox cycles [8, 9]. Recent studies
seem to exclude the presence of copper(I) at the end of the
drying process [7, 10].
Other complementary and sometimes contradictory
hypotheses were formulated, such as poor stability with
other pigments, formation of inorganic copper oxides [11]
and effects of outer SO2 and NO2 pollutants [3, 4, 6, 12].
It is fundamental to unravel the different hypotheses
regarding the degradation process. Understanding the
reactivity of verdigris is in fact the key factor to evaluate
potential evolution of the damages through time and also to
propose new adapted conservation strategies, especially
when dealing with the question of the removal of those
altered layers.
In the present work an original but crucial approach was
developed, based on systems of increasing complexity. The
evolution of a reference neutral verdigris, anhydrous cop-
per acetate, has been studied during the different steps of a
painting’s life.
The analytical methodology is based on the combination
of different complementary techniques. XANES (X-ray
absorption near edge structure), EPR (electron paramagnetic
resonance), UV–Vis (ultraviolet–visible) absorption spec-
troscopy and colorimetric measurements have been per-
formed on pigment before and after mixing with the binder,
and on the samples before and after accelerated ageing.
These analytical steps allowed to relate chromatic variations
of the pigment with changes in the molecular structure.
2 Experimental
2.1 Sample description
The anhydrous acetate used to simulate verdigris (neutral
acetate) was supplied by Strem Chemicals [2]. Linseed oil
was provided by Laverdure (Paris, France).
The pure initial pigment has been mixed with oil (2 %
w/w, 100 mg of pigment in 4.9 g of binder) and the mixture
was spread on pre-polished glass slides using a Spin coater
(SPIN-150) to obtain 100–300 lm thickness samples. The oil
binder and pigment mixture was spread directly on the glass
support. The preparation layer was not simulated. This
choice was motivated by the detailed observation and anal-
yses by scanning electron microscopy with energy-dispersive
(SEM–EDS) of easel paintings from the twelfth to seven-
teenth century museum collections containing altered or not
altered acetate copper pigments. The alteration is localized
only near the surface of the cross sections obtained from
paintings, suggesting that the chemical composition of the
preparation layer does not directly influence the process. The
glass provides a solid and inert surface to work as a support.
However, to check the effect of the support, colorimetric and
UV–Vis measurements have also been performed on sample
spread on canvas (preparation layer made of glue and plas-
ter), naturally aged for 15 years. This sample will be named
‘‘15-year-old model sample’’.
The model samples spread over the glass slide have been
dried in air for 2 weeks before starting the ageing process.
Freshly prepared samples, before drying, will be referred to
as ‘‘Freshly prepared samples’’, 2 weeks dried samples will
be referred to as ‘‘Dried samples’’.
The thermal ageing was carried out for 21 days in an
oven (Bioblock Scientific 45001) at 60 �C and 1 atm, to
prevent or at least greatly reduce the presence of oxygen
and moisture. As the color changed after 3 days of artificial
ageing, XAS and EPR analysis were performed after this
time. The ‘‘Thermally aged’’ samples were dried for
14 days and then thermally aged for only 3 days. Never-
theless, the color measurements were collected at various
times (0, 2, 4, 9, 13 and 21 days) during the artificial
ageing to follow the evolution of the hue angle.
A light-induced ageing was also performed. The sam-
ples were exposed for 600 h in a chamber ageing test XLS
Sun ? Atlas, using four xenon lamps without filter to
irradiate between 300 and 800 nm with a total power of
765 W/m2. Despite the cooling system of the apparatus, the
temperature reached 35 �C, adding a potential partial effect
of thermal degradation.
As for thermal ageing, colorimetric measurements were
performed at different times (0, 3, 11, 19 and 25 days). The
sample called ‘‘Light aged’’ corresponds to a sample dried
for 14 days and then aged under light for 25 days.
2.2 Analytical techniques
2.2.1 UV–Vis absorption and colorimetry
The samples were analyzed with an Ocean Optics USB-
4000 spectrometer, using a quartz optical fiber and a xenon
C. Santoro et al.
123
Author's personal copy
lamp HPX 2000. Colorimetric measurements were per-
formed at room temperature with illuminant D65 and CIE
2� observer, using a 5-mm-diameter spot, with a 45�geometry (angle between light and sample) and recording
of 10 acquisitions of 50 ms (the measure is the average of
the 10 acquisitions). The distance between the light source
and the sample is approximately 1.5 cm. The analyses were
performed directly on the glass slides. For each sample, at
least four different points were analyzed. The color coor-
dinates L* a* b*, were collected with the Spectra Suite
software. To quantify the color change, the variation of hue
angle was calculated on a graph reporting the a* as
abscissa and the b* as ordinate. We consider browning as
soon as the a* parameter is positive. The hue corresponds
to the angle between the axes of abscissas and the line that
connects the measured points to the origin. The distance
from the origin corresponds to the saturation. A color
change becomes meaningful if the difference between the
angles before and after ageing is at least of 10–15�.
2.2.2 Electron paramagnetic resonance (EPR)
EPR spectra were measured using an EPR Bruker Elexsys
E500 spectrometer in the continuous wave mode at X-band
(&9.4 GHz) and at Q-band (&34.1 GHz) on a Bruker
Elexsys E500 EPR spectrometer. The acquisitions were
performed at room temperature, using a microwave power
of 20 mW. The EPR spectra were lock-in detected using a
modulation of the magnetic field at 100 kHz so that the
spectra represent the derivative of the EPR absorption.
Fresh samples were liquid, while dried and thermally aged
ones were scratched from glass slide and put in the quartz
sampler.
2.2.3 XANES (X-ray absorption near edge structure)
X-ray absorption spectroscopy experiments were per-
formed on the DiffAbs beamline at SOLEIL synchrotron
using a beam size of about 340 lm2. XANES spectra were
collected at the copper K-edge from 8.95 to 9.6 keV with
0.5 eV steps in the edge region, using an Si(111) double
crystal monochromator. A reference metallic copper foil
was measured to calibrate absolute energy of the spectra
(position of the first peak of the spectrum derivative at
8,979 eV). The samples were analyzed both in fluores-
cence and transmission modes using a 4-element SDD and
an AXUV diode, respectively. The intensity of the incident
beam onto the sample was monitored using a thin Si
photodiode. At least two energy scans were collected and
averaged for each sample. The spectra were background-
corrected and edge-normalized using the software Horae
package (Athena, [13]). Normalized XANES and EXAFS
spectra were extracted by subtracting a first-order
polynomial fit to the pre-edge region and using a spline for
the post-edge region.
3 Results
3.1 Colorimetric measurements
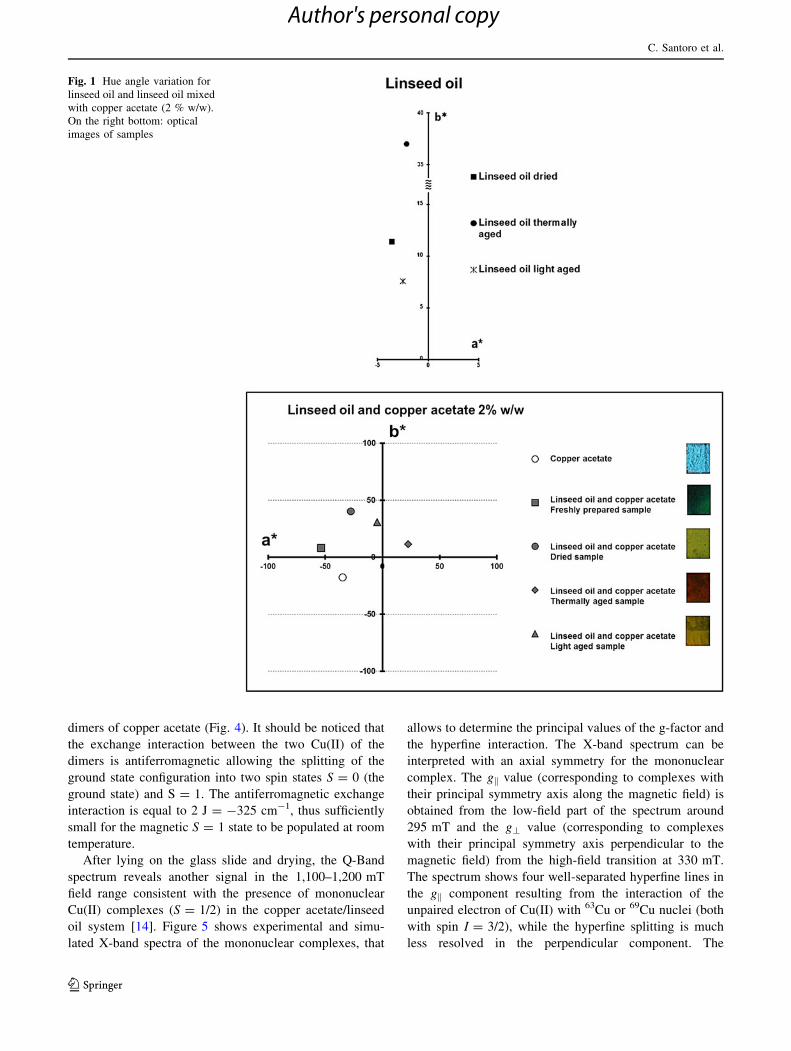
Colorimetric measurements clearly show evidence of
browning and allow us to compare the color change at
different evolution stages. A significant color change, but
not a darkening, is observed between the freshly prepared
copper acetate in linseed oil and the same sample at the
beginning of the ageing process (2 weeks of drying in the
air) (Fig. 1). For the thermally aged sample a shift of a*
from negative to positive values was observed, corre-
sponding to darkening (Table 1). A color change is visible
also for light-aged sample, but in our condition a* did not
reach positive values. The hue angle variation for copper
acetate in linseed oil light-aged samples is 75�, passing
from 171� for the fresh sample to 96� (Table 1). This
variation is about half of the one measured on the thermally
aged sample, that shows a hue angle variation of 144�,
ranging from 171� to 27� (Table 1).
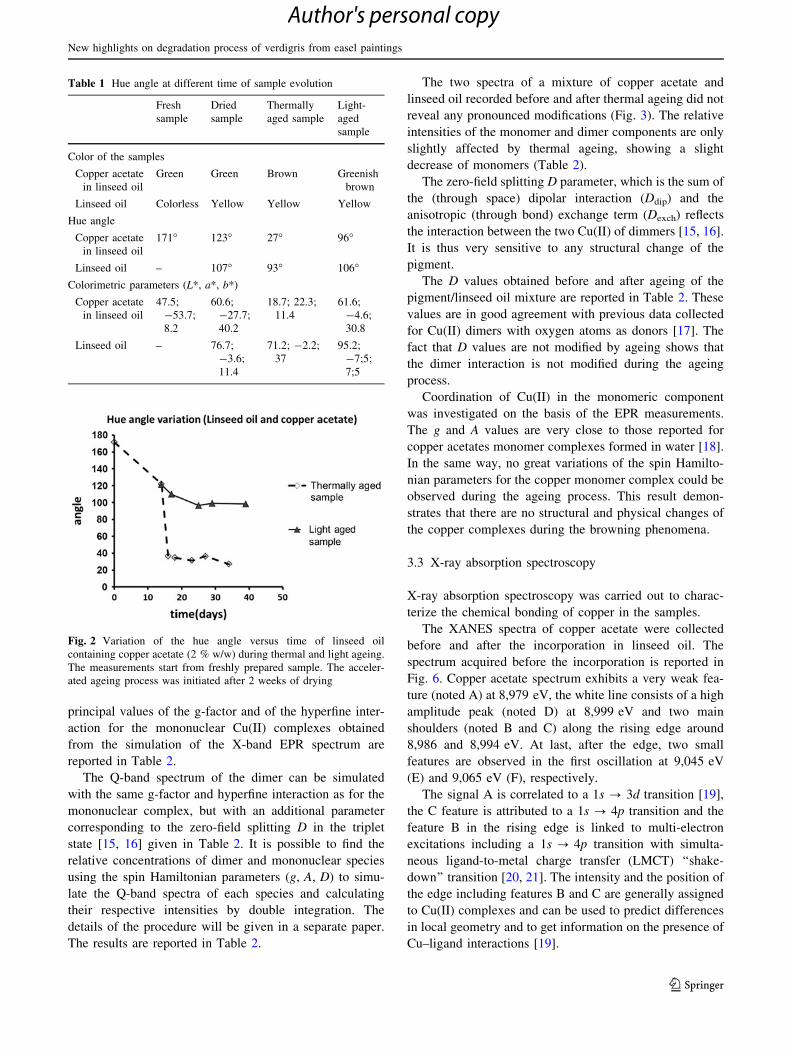
Differences are visible also in the kinetics of alteration
between light and thermally aged samples. If we consider
the hue angle variation as a function of time, we can notice
that the browning process is extremely rapid in the case of
thermal ageing (Fig. 2). The main changes are already
visible after 2 days, as shown by an abrupt change of slope.
The color change for light-aged sample is instead less
pronounced and more gradual than the one encountered in
the thermally aged samples. So light ageing seems to
induce an intermediate color variation between the varia-
tion observed during natural and thermal ageing. For this
reason the results in the next part of this article are mainly
presented on the thermally aged samples, where the
mechanism of color change is more advanced and stronger,
so easier to point out.
It is important to notice that there is no browning in the
absence of copper. The linseed oil alone is substantially
stable. Only a slight yellowing is visible with a hue angle
variation of 14� (Fig. 1; Table 1).
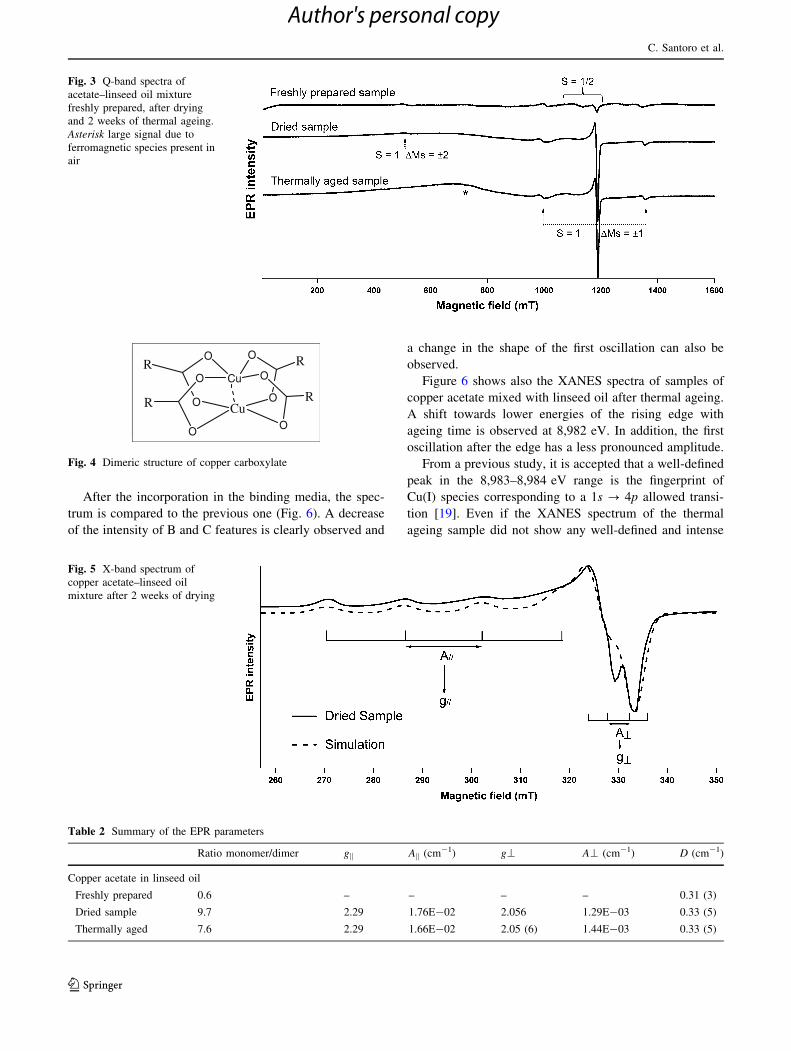
3.2 Electron paramagnetic resonance
The Q-Band spectrum of copper acetate after incorporation
in the linseed oil binder is presented in Fig. 3. The EPR
spectrum shows three transitions at 500, 1,000 and
1,350 mT. They are typical of the transitions DMs = ±1
(1,000 and 1,350 mT) and DMs = ±2 (500 mT) of an
S = 1 system formed by two interacting S = 1/2 systems.
These three lines thus correspond to the Cu(II)–Cu(II)
New highlights on degradation process of verdigris from easel paintings
123
Author's personal copy
dimers of copper acetate (Fig. 4). It should be noticed that
the exchange interaction between the two Cu(II) of the
dimers is antiferromagnetic allowing the splitting of the
ground state configuration into two spin states S = 0 (the
ground state) and S = 1. The antiferromagnetic exchange
interaction is equal to 2 J = -325 cm-1, thus sufficiently
small for the magnetic S = 1 state to be populated at room
temperature.
After lying on the glass slide and drying, the Q-Band
spectrum reveals another signal in the 1,100–1,200 mT
field range consistent with the presence of mononuclear
Cu(II) complexes (S = 1/2) in the copper acetate/linseed
oil system [14]. Figure 5 shows experimental and simu-
lated X-band spectra of the mononuclear complexes, that
allows to determine the principal values of the g-factor and
the hyperfine interaction. The X-band spectrum can be
interpreted with an axial symmetry for the mononuclear
complex. The gk value (corresponding to complexes with
their principal symmetry axis along the magnetic field) is
obtained from the low-field part of the spectrum around
295 mT and the g\ value (corresponding to complexes
with their principal symmetry axis perpendicular to the
magnetic field) from the high-field transition at 330 mT.
The spectrum shows four well-separated hyperfine lines in
the gk component resulting from the interaction of the
unpaired electron of Cu(II) with 63Cu or 69Cu nuclei (both
with spin I = 3/2), while the hyperfine splitting is much
less resolved in the perpendicular component. The
Fig. 1 Hue angle variation for
linseed oil and linseed oil mixed
with copper acetate (2 % w/w).
On the right bottom: optical
images of samples
C. Santoro et al.
123
Author's personal copy
principal values of the g-factor and of the hyperfine inter-
action for the mononuclear Cu(II) complexes obtained
from the simulation of the X-band EPR spectrum are
reported in Table 2.
The Q-band spectrum of the dimer can be simulated
with the same g-factor and hyperfine interaction as for the
mononuclear complex, but with an additional parameter
corresponding to the zero-field splitting D in the triplet
state [15, 16] given in Table 2. It is possible to find the
relative concentrations of dimer and mononuclear species
using the spin Hamiltonian parameters (g, A, D) to simu-
late the Q-band spectra of each species and calculating
their respective intensities by double integration. The
details of the procedure will be given in a separate paper.
The results are reported in Table 2.
The two spectra of a mixture of copper acetate and
linseed oil recorded before and after thermal ageing did not
reveal any pronounced modifications (Fig. 3). The relative
intensities of the monomer and dimer components are only
slightly affected by thermal ageing, showing a slight
decrease of monomers (Table 2).
The zero-field splitting D parameter, which is the sum of
the (through space) dipolar interaction (Ddip) and the
anisotropic (through bond) exchange term (Dexch) reflects
the interaction between the two Cu(II) of dimmers [15, 16].
It is thus very sensitive to any structural change of the
pigment.
The D values obtained before and after ageing of the
pigment/linseed oil mixture are reported in Table 2. These
values are in good agreement with previous data collected
for Cu(II) dimers with oxygen atoms as donors [17]. The
fact that D values are not modified by ageing shows that
the dimer interaction is not modified during the ageing
process.
Coordination of Cu(II) in the monomeric component
was investigated on the basis of the EPR measurements.
The g and A values are very close to those reported for
copper acetates monomer complexes formed in water [18].
In the same way, no great variations of the spin Hamilto-
nian parameters for the copper monomer complex could be
observed during the ageing process. This result demon-
strates that there are no structural and physical changes of
the copper complexes during the browning phenomena.
3.3 X-ray absorption spectroscopy
X-ray absorption spectroscopy was carried out to charac-
terize the chemical bonding of copper in the samples.
The XANES spectra of copper acetate were collected
before and after the incorporation in linseed oil. The
spectrum acquired before the incorporation is reported in
Fig. 6. Copper acetate spectrum exhibits a very weak fea-
ture (noted A) at 8,979 eV, the white line consists of a high
amplitude peak (noted D) at 8,999 eV and two main
shoulders (noted B and C) along the rising edge around
8,986 and 8,994 eV. At last, after the edge, two small
features are observed in the first oscillation at 9,045 eV
(E) and 9,065 eV (F), respectively.
The signal A is correlated to a 1s ? 3d transition [19],
the C feature is attributed to a 1s ? 4p transition and the
feature B in the rising edge is linked to multi-electron
excitations including a 1s ? 4p transition with simulta-
neous ligand-to-metal charge transfer (LMCT) ‘‘shake-
down’’ transition [20, 21]. The intensity and the position of
the edge including features B and C are generally assigned
to Cu(II) complexes and can be used to predict differences
in local geometry and to get information on the presence of
Cu–ligand interactions [19].
Table 1 Hue angle at different time of sample evolution
Fresh
sample
Dried
sample
Thermally
aged sample
Light-
aged
sample
Color of the samples
Copper acetate
in linseed oil
Green Green Brown Greenish
brown
Linseed oil Colorless Yellow Yellow Yellow
Hue angle
Copper acetate
in linseed oil
171� 123� 27� 96�
Linseed oil – 107� 93� 106�Colorimetric parameters (L*, a*, b*)
Copper acetate
in linseed oil
47.5;
-53.7;
8.2
60.6;
-27.7;
40.2
18.7; 22.3;
11.4
61.6;
-4.6;
30.8
Linseed oil – 76.7;
-3.6;
11.4
71.2; -2.2;
37
95.2;
-7;5;
7;5
Fig. 2 Variation of the hue angle versus time of linseed oil
containing copper acetate (2 % w/w) during thermal and light ageing.
The measurements start from freshly prepared sample. The acceler-
ated ageing process was initiated after 2 weeks of drying
New highlights on degradation process of verdigris from easel paintings
123
Author's personal copy
After the incorporation in the binding media, the spec-
trum is compared to the previous one (Fig. 6). A decrease
of the intensity of B and C features is clearly observed and
a change in the shape of the first oscillation can also be
observed.
Figure 6 shows also the XANES spectra of samples of
copper acetate mixed with linseed oil after thermal ageing.
A shift towards lower energies of the rising edge with
ageing time is observed at 8,982 eV. In addition, the first
oscillation after the edge has a less pronounced amplitude.
From a previous study, it is accepted that a well-defined
peak in the 8,983–8,984 eV range is the fingerprint of
Cu(I) species corresponding to a 1s ? 4p allowed transi-
tion [19]. Even if the XANES spectrum of the thermal
ageing sample did not show any well-defined and intense
Fig. 3 Q-band spectra of
acetate–linseed oil mixture
freshly prepared, after drying
and 2 weeks of thermal ageing.
Asterisk large signal due to
ferromagnetic species present in
air
RO
Cu
OR
O
O
RO
O R
O
OCu
Fig. 4 Dimeric structure of copper carboxylate
Fig. 5 X-band spectrum of
copper acetate–linseed oil
mixture after 2 weeks of drying
Table 2 Summary of the EPR parameters
Ratio monomer/dimer gk Ak (cm-1) g\ A\ (cm-1) D (cm-1)
Copper acetate in linseed oil
Freshly prepared 0.6 – – – – 0.31 (3)
Dried sample 9.7 2.29 1.76E-02 2.056 1.29E-03 0.33 (5)
Thermally aged 7.6 2.29 1.66E-02 2.05 (6) 1.44E-03 0.33 (5)
C. Santoro et al.
123
Author's personal copy
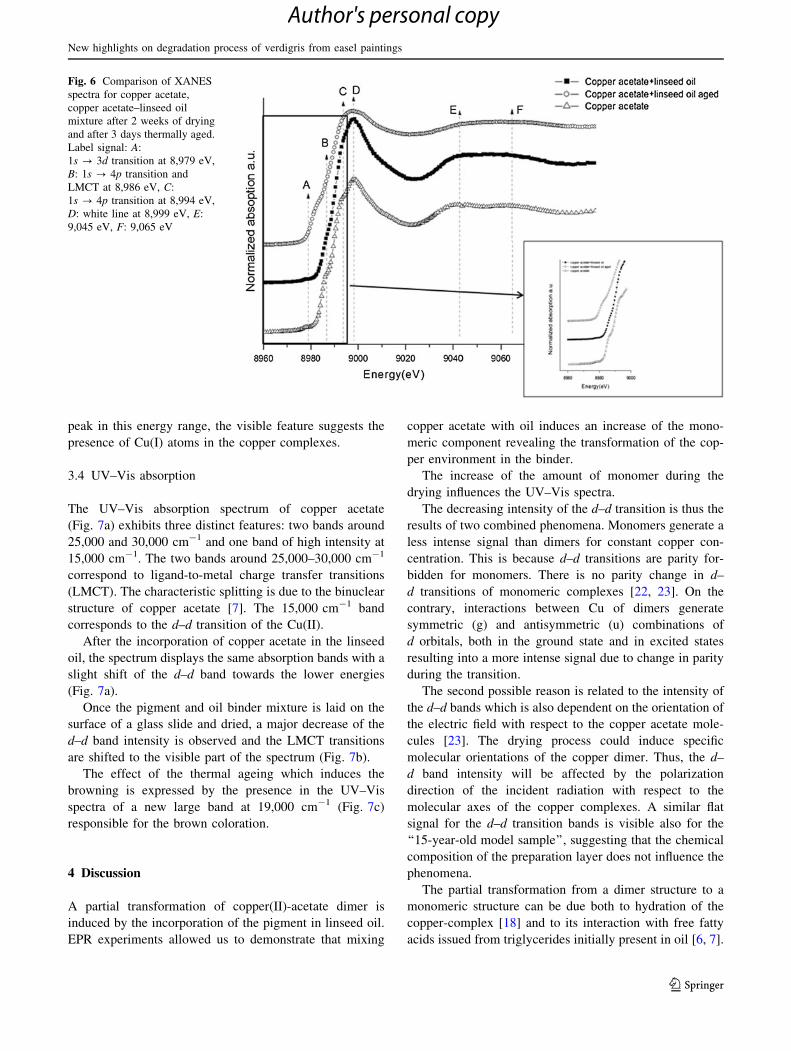
peak in this energy range, the visible feature suggests the
presence of Cu(I) atoms in the copper complexes.
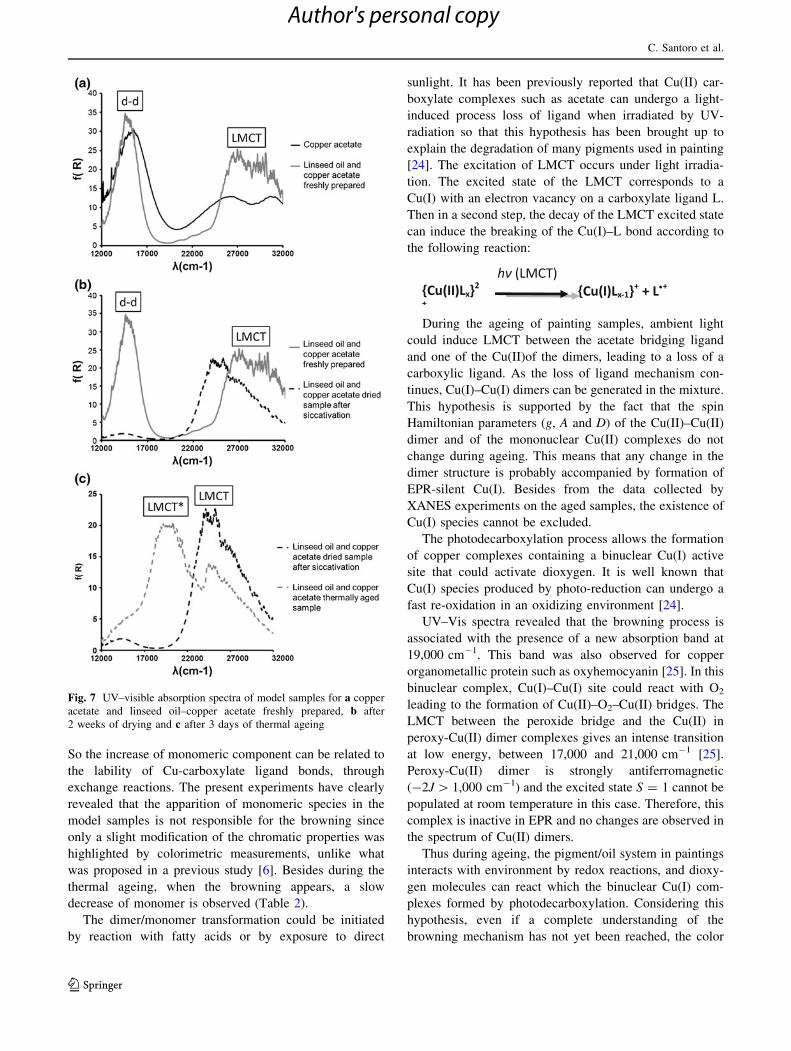
3.4 UV–Vis absorption
The UV–Vis absorption spectrum of copper acetate
(Fig. 7a) exhibits three distinct features: two bands around
25,000 and 30,000 cm-1 and one band of high intensity at
15,000 cm-1. The two bands around 25,000–30,000 cm-1
correspond to ligand-to-metal charge transfer transitions
(LMCT). The characteristic splitting is due to the binuclear
structure of copper acetate [7]. The 15,000 cm-1 band
corresponds to the d–d transition of the Cu(II).
After the incorporation of copper acetate in the linseed
oil, the spectrum displays the same absorption bands with a
slight shift of the d–d band towards the lower energies
(Fig. 7a).
Once the pigment and oil binder mixture is laid on the
surface of a glass slide and dried, a major decrease of the
d–d band intensity is observed and the LMCT transitions
are shifted to the visible part of the spectrum (Fig. 7b).
The effect of the thermal ageing which induces the
browning is expressed by the presence in the UV–Vis
spectra of a new large band at 19,000 cm-1 (Fig. 7c)
responsible for the brown coloration.
4 Discussion
A partial transformation of copper(II)-acetate dimer is
induced by the incorporation of the pigment in linseed oil.
EPR experiments allowed us to demonstrate that mixing
copper acetate with oil induces an increase of the mono-
meric component revealing the transformation of the cop-
per environment in the binder.
The increase of the amount of monomer during the
drying influences the UV–Vis spectra.
The decreasing intensity of the d–d transition is thus the
results of two combined phenomena. Monomers generate a
less intense signal than dimers for constant copper con-
centration. This is because d–d transitions are parity for-
bidden for monomers. There is no parity change in d–
d transitions of monomeric complexes [22, 23]. On the
contrary, interactions between Cu of dimers generate
symmetric (g) and antisymmetric (u) combinations of
d orbitals, both in the ground state and in excited states
resulting into a more intense signal due to change in parity
during the transition.
The second possible reason is related to the intensity of
the d–d bands which is also dependent on the orientation of
the electric field with respect to the copper acetate mole-
cules [23]. The drying process could induce specific
molecular orientations of the copper dimer. Thus, the d–
d band intensity will be affected by the polarization
direction of the incident radiation with respect to the
molecular axes of the copper complexes. A similar flat
signal for the d–d transition bands is visible also for the
‘‘15-year-old model sample’’, suggesting that the chemical
composition of the preparation layer does not influence the
phenomena.
The partial transformation from a dimer structure to a
monomeric structure can be due both to hydration of the
copper-complex [18] and to its interaction with free fatty
acids issued from triglycerides initially present in oil [6, 7].
Fig. 6 Comparison of XANES
spectra for copper acetate,
copper acetate–linseed oil
mixture after 2 weeks of drying
and after 3 days thermally aged.
Label signal: A:
1s ? 3d transition at 8,979 eV,
B: 1s ? 4p transition and
LMCT at 8,986 eV, C:
1s ? 4p transition at 8,994 eV,
D: white line at 8,999 eV, E:
9,045 eV, F: 9,065 eV
New highlights on degradation process of verdigris from easel paintings
123
Author's personal copy
So the increase of monomeric component can be related to
the lability of Cu-carboxylate ligand bonds, through
exchange reactions. The present experiments have clearly
revealed that the apparition of monomeric species in the
model samples is not responsible for the browning since
only a slight modification of the chromatic properties was
highlighted by colorimetric measurements, unlike what
was proposed in a previous study [6]. Besides during the
thermal ageing, when the browning appears, a slow
decrease of monomer is observed (Table 2).
The dimer/monomer transformation could be initiated
by reaction with fatty acids or by exposure to direct
sunlight. It has been previously reported that Cu(II) car-
boxylate complexes such as acetate can undergo a light-
induced process loss of ligand when irradiated by UV-
radiation so that this hypothesis has been brought up to
explain the degradation of many pigments used in painting
[24]. The excitation of LMCT occurs under light irradia-
tion. The excited state of the LMCT corresponds to a
Cu(I) with an electron vacancy on a carboxylate ligand L.
Then in a second step, the decay of the LMCT excited state
can induce the breaking of the Cu(I)–L bond according to
the following reaction:
During the ageing of painting samples, ambient light
could induce LMCT between the acetate bridging ligand
and one of the Cu(II)of the dimers, leading to a loss of a
carboxylic ligand. As the loss of ligand mechanism con-
tinues, Cu(I)–Cu(I) dimers can be generated in the mixture.
This hypothesis is supported by the fact that the spin
Hamiltonian parameters (g, A and D) of the Cu(II)–Cu(II)
dimer and of the mononuclear Cu(II) complexes do not
change during ageing. This means that any change in the
dimer structure is probably accompanied by formation of
EPR-silent Cu(I). Besides from the data collected by
XANES experiments on the aged samples, the existence of
Cu(I) species cannot be excluded.
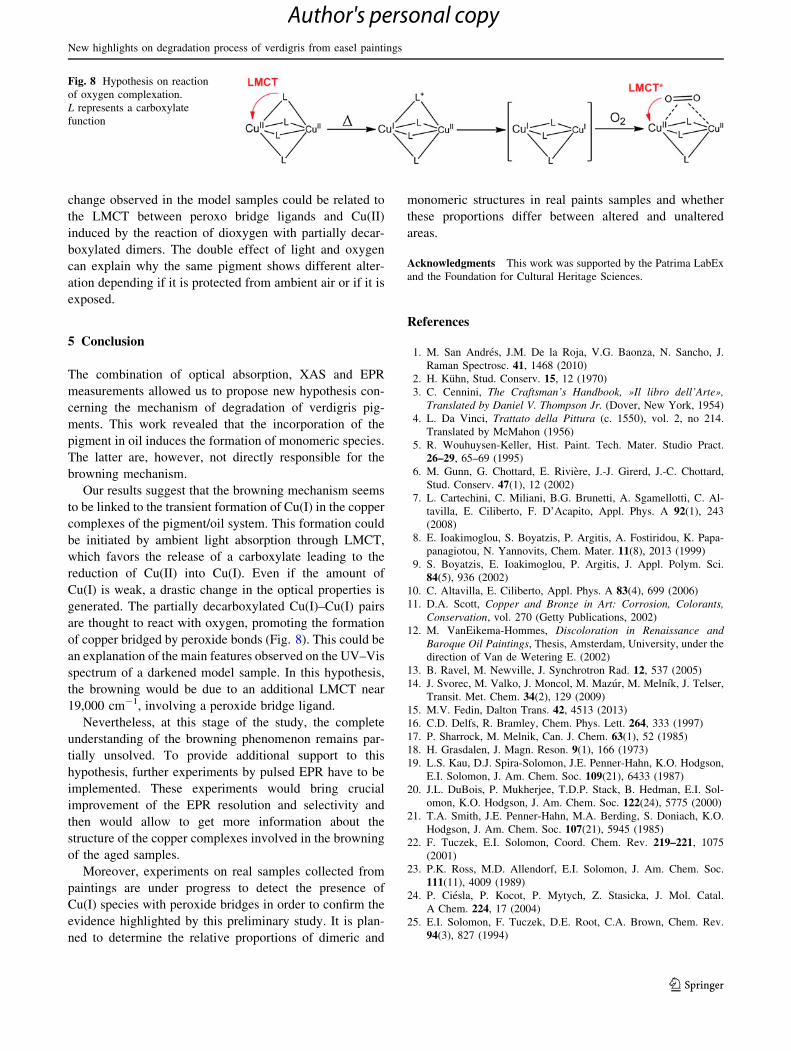
The photodecarboxylation process allows the formation
of copper complexes containing a binuclear Cu(I) active
site that could activate dioxygen. It is well known that
Cu(I) species produced by photo-reduction can undergo a
fast re-oxidation in an oxidizing environment [24].
UV–Vis spectra revealed that the browning process is
associated with the presence of a new absorption band at
19,000 cm-1. This band was also observed for copper
organometallic protein such as oxyhemocyanin [25]. In this
binuclear complex, Cu(I)–Cu(I) site could react with O2
leading to the formation of Cu(II)–O2–Cu(II) bridges. The
LMCT between the peroxide bridge and the Cu(II) in
peroxy-Cu(II) dimer complexes gives an intense transition
at low energy, between 17,000 and 21,000 cm-1 [25].
Peroxy-Cu(II) dimer is strongly antiferromagnetic
(-2J [ 1,000 cm-1) and the excited state S = 1 cannot be
populated at room temperature in this case. Therefore, this
complex is inactive in EPR and no changes are observed in
the spectrum of Cu(II) dimers.
Thus during ageing, the pigment/oil system in paintings
interacts with environment by redox reactions, and dioxy-
gen molecules can react which the binuclear Cu(I) com-
plexes formed by photodecarboxylation. Considering this
hypothesis, even if a complete understanding of the
browning mechanism has not yet been reached, the color
Fig. 7 UV–visible absorption spectra of model samples for a copper
acetate and linseed oil–copper acetate freshly prepared, b after
2 weeks of drying and c after 3 days of thermal ageing
C. Santoro et al.
123
Author's personal copy
change observed in the model samples could be related to
the LMCT between peroxo bridge ligands and Cu(II)
induced by the reaction of dioxygen with partially decar-
boxylated dimers. The double effect of light and oxygen
can explain why the same pigment shows different alter-
ation depending if it is protected from ambient air or if it is
exposed.
5 Conclusion
The combination of optical absorption, XAS and EPR
measurements allowed us to propose new hypothesis con-
cerning the mechanism of degradation of verdigris pig-
ments. This work revealed that the incorporation of the
pigment in oil induces the formation of monomeric species.
The latter are, however, not directly responsible for the
browning mechanism.
Our results suggest that the browning mechanism seems
to be linked to the transient formation of Cu(I) in the copper
complexes of the pigment/oil system. This formation could
be initiated by ambient light absorption through LMCT,
which favors the release of a carboxylate leading to the
reduction of Cu(II) into Cu(I). Even if the amount of
Cu(I) is weak, a drastic change in the optical properties is
generated. The partially decarboxylated Cu(I)–Cu(I) pairs
are thought to react with oxygen, promoting the formation
of copper bridged by peroxide bonds (Fig. 8). This could be
an explanation of the main features observed on the UV–Vis
spectrum of a darkened model sample. In this hypothesis,
the browning would be due to an additional LMCT near
19,000 cm-1, involving a peroxide bridge ligand.
Nevertheless, at this stage of the study, the complete
understanding of the browning phenomenon remains par-
tially unsolved. To provide additional support to this
hypothesis, further experiments by pulsed EPR have to be
implemented. These experiments would bring crucial
improvement of the EPR resolution and selectivity and
then would allow to get more information about the
structure of the copper complexes involved in the browning
of the aged samples.
Moreover, experiments on real samples collected from
paintings are under progress to detect the presence of
Cu(I) species with peroxide bridges in order to confirm the
evidence highlighted by this preliminary study. It is plan-
ned to determine the relative proportions of dimeric and
monomeric structures in real paints samples and whether
these proportions differ between altered and unaltered
areas.
Acknowledgments This work was supported by the Patrima LabEx
and the Foundation for Cultural Heritage Sciences.
References
1. M. San Andres, J.M. De la Roja, V.G. Baonza, N. Sancho, J.
Raman Spectrosc. 41, 1468 (2010)
2. H. Kuhn, Stud. Conserv. 15, 12 (1970)
3. C. Cennini, The Craftsman’s Handbook, »Il libro dell’Arte»,
Translated by Daniel V. Thompson Jr. (Dover, New York, 1954)
4. L. Da Vinci, Trattato della Pittura (c. 1550), vol. 2, no 214.
Translated by McMahon (1956)
5. R. Wouhuysen-Keller, Hist. Paint. Tech. Mater. Studio Pract.
26–29, 65–69 (1995)
6. M. Gunn, G. Chottard, E. Riviere, J.-J. Girerd, J.-C. Chottard,
Stud. Conserv. 47(1), 12 (2002)
7. L. Cartechini, C. Miliani, B.G. Brunetti, A. Sgamellotti, C. Al-
tavilla, E. Ciliberto, F. D’Acapito, Appl. Phys. A 92(1), 243
(2008)
8. E. Ioakimoglou, S. Boyatzis, P. Argitis, A. Fostiridou, K. Papa-
panagiotou, N. Yannovits, Chem. Mater. 11(8), 2013 (1999)
9. S. Boyatzis, E. Ioakimoglou, P. Argitis, J. Appl. Polym. Sci.
84(5), 936 (2002)
10. C. Altavilla, E. Ciliberto, Appl. Phys. A 83(4), 699 (2006)
11. D.A. Scott, Copper and Bronze in Art: Corrosion, Colorants,
Conservation, vol. 270 (Getty Publications, 2002)
12. M. VanEikema-Hommes, Discoloration in Renaissance and
Baroque Oil Paintings, Thesis, Amsterdam, University, under the
direction of Van de Wetering E. (2002)
13. B. Ravel, M. Newville, J. Synchrotron Rad. 12, 537 (2005)
14. J. Svorec, M. Valko, J. Moncol, M. Mazur, M. Melnık, J. Telser,
Transit. Met. Chem. 34(2), 129 (2009)
15. M.V. Fedin, Dalton Trans. 42, 4513 (2013)
16. C.D. Delfs, R. Bramley, Chem. Phys. Lett. 264, 333 (1997)
17. P. Sharrock, M. Melnik, Can. J. Chem. 63(1), 52 (1985)
18. H. Grasdalen, J. Magn. Reson. 9(1), 166 (1973)
19. L.S. Kau, D.J. Spira-Solomon, J.E. Penner-Hahn, K.O. Hodgson,
E.I. Solomon, J. Am. Chem. Soc. 109(21), 6433 (1987)
20. J.L. DuBois, P. Mukherjee, T.D.P. Stack, B. Hedman, E.I. Sol-
omon, K.O. Hodgson, J. Am. Chem. Soc. 122(24), 5775 (2000)
21. T.A. Smith, J.E. Penner-Hahn, M.A. Berding, S. Doniach, K.O.
Hodgson, J. Am. Chem. Soc. 107(21), 5945 (1985)
22. F. Tuczek, E.I. Solomon, Coord. Chem. Rev. 219–221, 1075
(2001)
23. P.K. Ross, M.D. Allendorf, E.I. Solomon, J. Am. Chem. Soc.
111(11), 4009 (1989)
24. P. Ciesla, P. Kocot, P. Mytych, Z. Stasicka, J. Mol. Catal.
A Chem. 224, 17 (2004)
25. E.I. Solomon, F. Tuczek, D.E. Root, C.A. Brown, Chem. Rev.
94(3), 827 (1994)
Fig. 8 Hypothesis on reaction
of oxygen complexation.
L represents a carboxylate
function
New highlights on degradation process of verdigris from easel paintings
123
Author's personal copy