
1st PI Annual Research Partnership Workshop - EERC, Clark ...
330
1st PI Annual Research Partnership Workshop Petroleum Institute Abu Dhabi, UAE January, 6 & 7, 2010
-
Upload
khangminh22 -
Category
Documents
-
view
1 -
download
0
Transcript of 1st PI Annual Research Partnership Workshop - EERC, Clark ...
1st PI Annual Research Partnership Workshop
Pet r o l eum I ns t i tu t e A bu D habi , U A E
J anuar y , 6 & 7 , 2010
Table of Contents Page Workshop Agenda 1 Overview of the Collaborative Activities 5 Dr. N. Middleton, Senior Vice President for Strategic Enterprises, Colorado School of Mines 6 Dr. A. Bar-Cohen, Chairman, Department of Mechanical Engineering, University of Maryland, College Park 8 Dr. J. Derby, Executive Officer, Department of Chemical Engineering and Materials Science, University of Minnesota 18
Energy Recovery and Conversions – I 23 Waste Heat Utilization in the Petroleum Industry 24 R. Radermacher (UMD), Y. Hwang (UMD), S. Al Hashimi (PI), P. Rodgers (PI) Hybrid Solar Cooling/Heating System 38 R. Radermacher (UMD), Y. Hwang (UMD), I. Kubo (PI) Synthesis and Catalytic Performance of Hierarchically Ordered Micro/Mesoporous Catalysts 51 A. Bhan (UMN), S. Al Hashimi (PI), M. Tsapatsis (UMN), R. Vladea (PI), P. Lee (UMN), D. Liu (UMN), A. Malek (PI-UMN), O. Muraza (PI), X. Zhang (UMN)
Energy Recovery and Conversions – II 65 Understanding of Chemical Kinetics in the Thermal Stage of Claus Process 66 A.K. Gupta (UMD), A. Al Shoaibi (PI), N. Al Amoodi (PI) Selection and Optimization of Miscible and Immiscible Displacement to Improve Production from Fractured Carbonate Reservoirs of Abu Dhabi 75 R. Graves (CSM), H. Kazemi (CSM), E. Ozkan (CSM), S. Ghedan (PI) Solid Oxide Fuel Cells for CO2 Capture and Enhanced Oil Recovery 87 G. Jackson (UMD), B. Eichhorn (UMD), A. Almansoori (PI), K. Nandakumar, V. Eveloy
Process Intensification and Advanced Heat / Mass Transfer 94 Multidisciplinary Design and Characterization of Polymer Composite Seawater Heat Exchanger Module 95 P. Rodgers (PI), A. Bar-Cohen (UMD), S.K. Gupta (UMD), D. Bigio (UMD) Study on Microchannel-Based Absorber/Stripper and Electrostatic Precipitators for CO2 Separation from Flue Gas 117 S. Dessiatoun (UMD), A. Shooshtari (UMD), M. Ohadi (PI), A. Goharzadeh, M. Al Shehhi (PI) 130
Microreactors for Oil and Gas Processes Using Microchannel Technologies S. Dessiatoun (UMD), A. Shooshtari (UMD), M. Ohadi (PI), A. Goharzadeh (PI), E. Al-Hajri (PI)
Mathematical Modeling and Optimization in Oil and Gas Industry 140 Assessment of the Integrity of Pipelines subject to corrosion-Fatigue, Pitting Corrosion, Creep and Stress Corrosion 141 M. Modarres (UMD), A. Seibi (PI) Robust Optimization of Engineering-Business Decisions for Petrochemical Systems 160 S. Azarm (UMD), P.K. Kannan (UMD), A. Almansoori (PI), S. Al Hashimi (PI) Simulation, Optimization and Control of Solid Oxide Fuel Cell System 172 P. Daoutidis (UMN), J. Derby (UMN), A. Almansoori (PI)
Management and Control of Energy Systems 185 Dynamics and Control of Drill Strings 186 B. Balachandran (UMD), H. Karki (PI), Y. Abdelmagid (PI) Studies on Mobile Sensor Platforms 199 B. Balachandran (UMD), N. Chopra (UMD), H. Karki (PI), S. Fok (PI) Use of Horizontal Wells to Improve Pattern Waterfloods In Fractured Carbonate Reservoirs 210 R. Graves (CSM), H. Kazemi (CSM), E. Ozkan (CSM), S. Ghedan (PI)
Catalytic Processes 216 Development of I. Zeolite Catalysts for Alkane Metathesis and II. Adsorbents for H2S Removal 217
A. Bhan (UMN), M. Cococcioni (UMN), S. Al Hashimi (PI), M. Tsapatsis (UMN), R. Vladea (PI), P. Kumar (UMN), A. McCormick (UMN), N. Katabathini (PI), C.-Y. Sung (UMN)
Coatings for Catalytic and Separation Processes 239
L. Francis (UMN), S. Al Hashimi (PI), M. Tsapatsis (UMN), R. Vladea (PI), O. Muraza (PI), W.J. Suszynski (UMN), K. Varoon (UMN), H. Zhang (UMN)
Atomic-Resolution Quantitative Electron Microscopy 253
K.A. Mkhoyan (UMN), J. Derby (UMN), W. Gerberich (UMN), C. Macosko (UMN), K. Liao (UMN), A. Mittal (UMN), A. Wagner (UMN)
Materials Development and Characterization for Upstream Processes 262 Development of High Interstitial Stainless Steel for Use in Down Hole Drilling Applications 263 D. Olson (CSM), B. Mishra (CSM) 267
SCC Susceptibility for High Strength Low Alloy Steels in CO2 Containing Corrosive Oil and Gas Well Environments D. Olson (CSM), B. Mishra (CSM), A.B. Gavanluei (CSM) Investigation of Microbiologically Influenced Corrosion (MIC) in Ethanol Fuel Environments 271
D. Olson (CSM), B. Mishra (CSM), J. Spear (CSM), L. Jain (CSM),S. Bhola (CSM), C. Williamson (CSM)
Understanding the Role of Alternating Current on Corrosion of Pipeline Steels Under Sacrificial Anode Cathotic Protection 275 D. Olson (CSM), B. Mishra (CSM), T. Reyes (CSM), S. Bhola (CSM)
Advanced Materials for Industrial Applications 279 Synthesis and Processing of Functionalized Polyolefins 280 C. Macosko (UMN), M. Hillmyer (UMN), A. Abdala (PI), S. Vukusic (PI) Graphene Reinforced Polyolefin Nanocomposites 289 C. Macosko (UMN), F. Bates (UMN), A. Abdala (PI), H. Kim (UMN) Polymeric Membranes for Advanced Process Engineering 301
F. Bates (UMN), E. Cussler (UMN), M. Hillmyer (UMN), T. Lodge (UMN), A. Abdala (PI), I. Economou (PI), S. Vukusic (PI)
Reservoir Characterization and Simulation 310 Characterization and Simulation of Abu Dhabi Fractured Carbonate Reservoirs 311
H. Kazemi (CSM), E. Ozkan (CSM), R. Graves (CSM), J. Miskimins (CSM), S. Ghedan (PI)
Fluid Sensitivity of Seismic Properties in Carbonate Reservoirs 317 R. Graves (CSM), M. Batzle (CSM), M. Prasad (CSM), S. Vega (PI) Integrated Carbonate Reservoir Characterization 323 R. Graves (CSM), Sarg (CSM), S. Lokier (PI), T. Steuber (PI), S. Vega (PI)

1st PI Annual Research Partnership Workshop
The Petroleum Institute, Abu Dhabi, United Arab Emirates January 6 – 7, 2010
Agenda Wednesday, January 6, 2010 8:00 – 8:30 Registration and refreshments 8:30 – 8:40 Welcome and Opening Remarks Dr. M. Ohadi, Provost and Acting President, The Petroleum Institute Dr. K. Berteussen, Director of Research, The Petroleum Institute Dr. I. Economou, Associate Provost for Graduate Studies, The Petroleum Institute 8:40 – 9:00 Opening Remarks by ADNOC Group Representative (Name to be confirmed) Representation of ADNOC group, Oil subcommittee, Gas subcommittee 9:00 – 9:30 Overview of the Collaborative Activities
Dr. N. Middleton, Senior Vice President for Strategic Enterprises, Colorado School of Mines Dr. A. Bar‐Cohen, Chairman, Department of Mechanical Engineering, University of Maryland, College Park Dr. J. Derby, Executive Officer, Department of Chemical Engineering and Materials Science, University of Minnesota
9:30 – 11:00 Energy Recovery and Conversions – I Chair: E. Al Hajri (PI), A. Nazeri (UMD) 9:30 – 10:00 Waste Heat Utilization in the Petroleum Industry R. Radermacher (UMD), Y. Hwang (UMD), S. Al Hashimi (PI), P. Rodgers (PI) 10:00 – 10:30 Hybrid Solar Cooling/Heating System R. Radermacher (UMD), Y. Hwang (UMD), I. Kubo (PI) 10:30 – 11:00 Synthesis and Catalytic Performance of Hierarchically Ordered Micro/Mesoporous Catalysts
A. Bhan (UMN), S. Al Hashimi (PI), M. Tsapatsis (UMN), R. Vladea (PI), P. Lee (UMN), D. Liu (UMN), A. Malek (PI‐UMN), O. Muraza (PI), X. Zhang (UMN)
11:00 – 11:30 Coffee break
1

11:30 – 13:00 Energy Recovery and Conversions – II (Parallel Session I) Chair: A. Abdala (PI), Y. Hwang (UMD) 11:30 – 12:00 Understanding of Chemical Kinetics in the Thermal Stage of Claus Process A.K. Gupta (UMD), A. Al Shoaibi (PI), N. Al Amoodi (PI) 12:00 – 12:30 Selection and Optimization of Miscible and Immiscible Displacement to Improve Production from
Fractured Carbonate Reservoirs of Abu Dhabi R. Graves (CSM), H. Kazemi (CSM), E. Ozkan (CSM), S. Ghedan (PI) 12:30 – 13:00 Solid Oxide Fuel Cells for CO2 Capture and Enhanced Oil Recovery
G. Jackson (UMD), B. Eichhorn (UMD), A. Almansoori (PI), K. Nandakumar, V. Eveloy 11:30 – 13:00 Process Intensification and Advanced Heat / Mass Transfer (Parallel Session II) Chair: M. Haroun (PI), M. Tsapatsis (UMN) 11:30 – 12:00 Multidisciplinary Design and Characterization of Polymer Composite Seawater Heat Exchanger
Module P. Rodgers (PI), A. Bar‐Cohen (UMD), S.K. Gupta (UMD), D. Bigio (UMD) 12:00 – 12:30 Study on Microchannel‐Based Absorber/Stripper and Electrostatic Precipitators for CO2
Separation from Flue Gas S. Dessiatoun (UMD), A. Shooshtari (UMD), M. Ohadi (PI), A. Goharzadeh, M. Al Shehhi (PI)
12:30 – 13:00 Microreactors for Oil and Gas Processes Using Microchannel Technologies S. Dessiatoun (UMD), A. Shooshtari (UMD), M. Ohadi (PI), A. Goharzadeh (PI), E. Al‐Hajri (PI)
13:00 – 14:00 Lunch break 14:00 – 15:30 Mathematical Modeling and Optimization in Oil and Gas Industry (Parallel Session I) Chair: P. Rogers (PI), M. Hillmyer (UMN) 14:00 – 14:30 Assessment of the Integrity of Pipelines subject to corrosion‐Fatigue, Pitting Corrosion, Creep and
Stress Corrosion M. Modarres (UMD), A. Seibi (PI) 14:30 – 15:00 Robust Optimization of Engineering‐Business Decisions for Petrochemical Systems S. Azarm (UMD), P.K. Kannan (UMD), A. Almansoori (PI), S. Al Hashimi (PI) 15:00 – 15:30 Simulation, Optimization and Control of Solid Oxide Fuel Cell System P. Daoutidis (UMN), J. Derby (UMN), A. Almansoori (PI)
14:00 – 15:30 Management and Control of Energy Systems (Parallel Session II) Chair: G. Bassioni (PI), S. Ainane (UMD/PI)
14:00 – 14:30 Dynamics and Control of Drill Strings B. Balachandran (UMD), H. Karki (PI), Y. Abdelmagid (PI) 14:30 – 15:00 Studies on Mobile Sensor Platforms B. Balachandran (UMD), N. Chopra (UMD), H. Karki (PI), S. Fok (PI) 15:00 – 15:30 Use of Horizontal Wells to Improve Pattern Waterfloods In Fractured Carbonate Reservoirs
R. Graves (CSM), H. Kazemi (CSM), E. Ozkan (CSM), S. Ghedan (PI)
2
15:30 – 16:00 Coffee break 16:00 – 17:00 Meetings with PI Senior and Graduate Students 19:00 Dinner Thursday, January 7, 2010 8:30 – 10:00 Catalytic Processes (Parallel Session I) Chair: H. Karki (PI), J. Derby (UMN) 8:30 – 9:00 Development of I. Zeolite Catalysts for Alkane Metathesis and II. Adsorbents for H2S Removal
A. Bhan (UMN), M. Cococcioni (UMN), S. Al Hashimi (PI), M. Tsapatsis (UMN), R. Vladea (PI), P. Kumar (UMN), A. McCormick (UMN), N. Katabathini (PI), C.‐Y. Sung (UMN)
9:00 – 9:30 Coatings for Catalytic and Separation Processes L. Francis (UMN), S. Al Hashimi (PI), M. Tsapatsis (UMN), R. Vladea (PI), O. Muraza (PI), W.J. Suszynski (UMN), K. Varoon (UMN), H. Zhang (UMN)
9:30 – 10:00 Atomic‐Resolution Quantitative Electron Microscopy K.A. Mkhoyan (UMN), J. Derby (UMN), W. Gerberich (UMN), C. Macosko (UMN), K. Liao (UMN), A. Mittal (UMN), A. Wagner (UMN)
8:30 – 10:00 Materials Development and Characterization for Upstream Processes (Parallel Session II) Chair: I. Economou (PI), M. Modarres (UMD) 8:30 – 8:45 Development of High Interstitial Stainless Steel for Use in Down Hole Drilling Applications D. Olson (CSM), B. Mishra (CSM) 8:45 – 9:00 SCC Susceptibility for High Strength Low Alloy Steels in CO2 Containing Corrosive Oil and Gas Well
Environments D. Olson (CSM), B. Mishra (CSM), A.B. Gavanluei (CSM) 9:00 – 9:15 Investigation of Microbiologically Influenced Corrosion (MIC) in Ethanol Fuel Environments D. Olson (CSM), B. Mishra (CSM), J. Spear (CSM), L. Jain (CSM),S. Bhola (CSM), C. Williamson (CSM) 9:15 – 9:30 Understanding the Role of Alternating Current on Corrosion of Pipeline Steels Under Sacrificial
Anode Cathotic Protection D. Olson (CSM), B. Mishra (CSM), T. Reyes (CSM), S. Bhola (CSM) 10:00 – 10:30 Coffee break
3

10:30 – 12:00 Advanced Materials for Industrial Applications (Parallel Session I) Chair: S. Vukušić (PI), A. Bar‐Cohen (UMD) 10:30 – 11:00 Synthesis and Processing of Functionalized Polyolefins C. Macosko (UMN), M. Hillmyer (UMN), A. Abdala (PI), S. Vukusic (PI) 11:00 – 11:30 Graphene Reinforced Polyolefin Nanocomposites
C. Macosko (UMN), F. Bates (UMN), A. Abdala (PI), H. Kim (UMN) 11:30 – 12:00 Polymeric Membranes for Advanced Process Engineering
F. Bates (UMN), E. Cussler (UMN), M. Hillmyer (UMN), T. Lodge (UMN), A. Abdala (PI), I. Economou (PI), S. Vukusic (PI)
10:30 – 12:00 Reservoir Characterization and Simulation (Parallel Session II) Chair: S. Ghedan (PI), M. Haroun (PI) 10:30 – 11:00 Characterization and Simulation of Abu Dhabi Fractured Carbonate Reservoirs H. Kazemi (CSM), E. Ozkan (CSM), R. Graves (CSM), J. Miskimins (CSM), S. Ghedan (PI) 11:00 – 11:30 Fluid Sensitivity of Seismic Properties in Carbonate Reservoirs
R. Graves (CSM), M. Batzle (CSM), M. Prasad (CSM), S. Vega (PI) 11:30 – 12:00 Integrated Carbonate Reservoir Characterization
R. Graves (CSM), Sarg (CSM), S. Lokier (PI), T. Steuber (PI), S. Vega (PI) 12:00 – 13:00 Lunch break 13:00 – 15:00 Future Directions in R & D and our Research Collaborations Chair: M. Ohadi (PI), K. Berteussen (PI) Round table discussions between representatives from partner schools, sponsors and the PI faculty
(by invitation) 15:00 Closing remarks – End of the workshop
4

Overview of the Collaborative Activities
5
Overview�of�Collaboration�Activities
Colorado�School�of�MinesDr.�Nigel�T.�Middleton
Senior�VP,�Strategic�Enterprises
1st�Annual�PI�Partner�Schools�Research�WorkshopThe�Petroleum�Institute,�Abu�Dhabi,�U.A.E.
January�6�7,�2010
PI Partners PI Sponsors
CSM�– PI�Chronology
• 1999�– PI�concept�(ADNOC);�solicitation;�RFP
• 2000�– Proposal;�Phase�0,�Phase�1�responses
• 2001�– Construction;�staffing;�students;�long�term�agreement
• 2001�– PI�opening
• 2001�to�2007�– Curriculum;�administration;�initial�hiring;�undergraduate�program�focus
• 2008�to�2009�– Realignment�of�agreement:�research�focus;�amended�agreement
21st Annual PI Partner Schools Research Workshop, January 6-7, 2010
6

Current�CSM�– PI�Partnership�Areas
31st Annual PI Partner Schools Research Workshop, January 6-7, 2010
� Membership�on�PI�Governing�Board
� Research�– upstream�engineering�and�science� Reservoir�characterization�Materials�corrosion� Center�for�Wave�Phenomena
� Education� Undergraduate�engineering�design� Center�for�Teaching�Excellence
� UAE�students�at�CSM
CSM’s Energy Agenda
41st Annual PI Partner Schools Research Workshop, January 6-7, 2010
• Reservoir�simulation�Faculty�expertiseHigh�performance�computing
• Unconventional�reservesNatural�gasOil�shaleHydrates
• GeologyIncludes�upcoming�carbonates�workshop�at�PI
• EnvironmentCarbon�sequestrationWater
• Alternative�energy�technologiesSolar,�biofuels;�wind;�fuel�cells;�nuclear;�materials�…
7
Provost Farvardin, Prof. Bar-Cohen
PI Partners PI Sponsors
1st Annual PI Partner Schools Research Workshop
The Petroleum Institute, Abu Dhabi, U.A.E.
January 6-7, 2010
Securing the Path, Achieving the Promise
Presentation Outline
• History• Goals• Education• Research• Achievements
21st Annual PI Partner Schools Research Workshop, January 6-7, 2010
8

EERC History
� March 2006: His Excellency Mr. Yousef Omeir Bin Yousef, visited the University of Maryland to meet with administrators and faculty
� March 2006: Petroleum Institute and UMD sign MOU on Education and Research in Energy Sciences and Engineering
� October 2006: PI/UMD sign contract initiating energy research and education effort
� Jan 2008: EERC 1st Workshop & Commencement Participation
� Nov 2008: EERC 2nd Workshop & President Mote asCommencement speaker
� April 2009: Phase II EERC contract is signed
31st Annual PI Partner Schools Research Workshop, January 6-7, 2010
Long Term EERC Goals
� Joint UMD-PI EERC Center of Excellence inenergy systems research and education.
� PI-UMD Co-Leadership of joint EERC.� Administrative and technical infrastructure for
world-class research and education.� Broadly based academic excellence in energy
systems engineering.� Regional, later international, leadership in
conventional and alternative energy research.
41st Annual PI Partner Schools Research Workshop, January 6-7, 2010
9
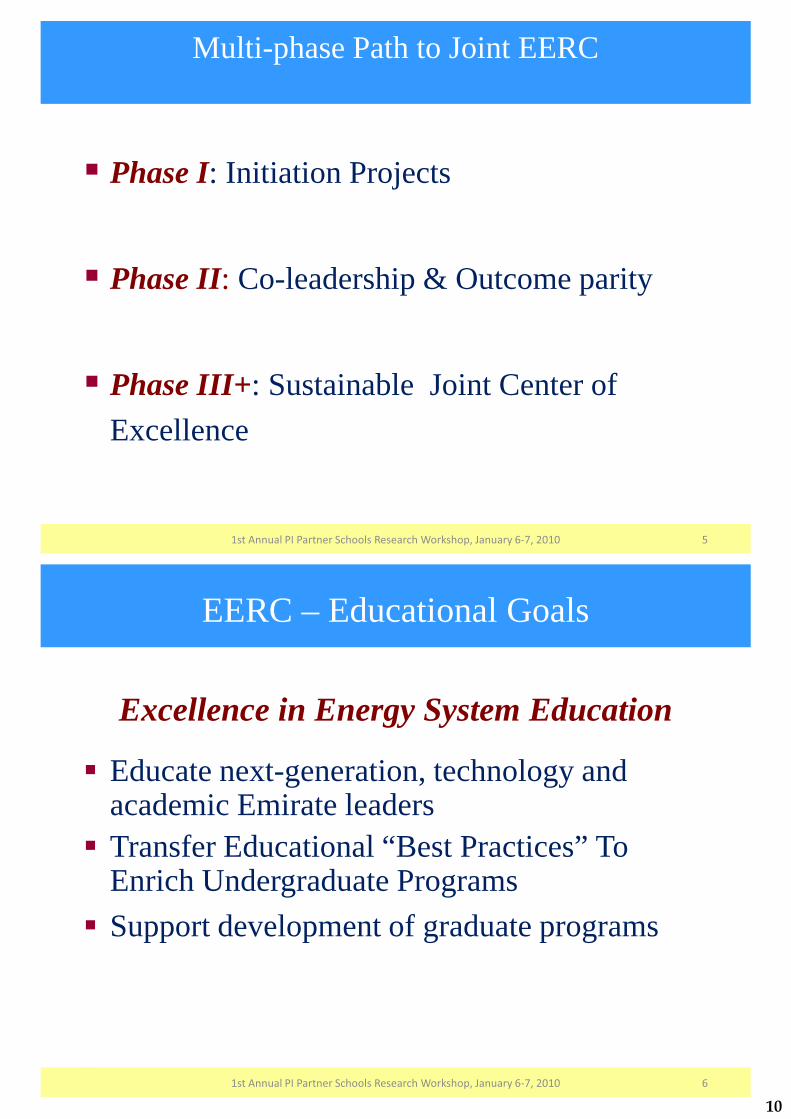
Multi-phase Path to Joint EERC
� Phase I: Initiation Projects
� Phase II: Co-leadership & Outcome parity
� Phase III+: Sustainable Joint Center of Excellence
51st Annual PI Partner Schools Research Workshop, January 6-7, 2010
EERC – Educational Goals
Excellence in Energy System Education
� Educate next-generation, technology and academic Emirate leaders
� Transfer Educational “Best Practices” To Enrich Undergraduate Programs
� Support development of graduate programs
61st Annual PI Partner Schools Research Workshop, January 6-7, 2010
10

ADNOC Scholars and New PI Faculty • Dr. Mohamed Al Shehhi• Ph D Topic: Electrostatic Gas-Liquid
Separation-Application to Advanced On-Line/On-Demand Separation Techniques
• Joined ME Department at PI: Spring 2010
• Dr. Ebrahim Al –Hajri• PhD Topic: Prediction of Heat
transfer and Pressure Drop of Condensing Refrigerant Flow in a High Aspect Ratio Microchannels
• Joined ME Department at PI : Fall 2009
1st Annual PI Partner Schools Research Workshop, January 6-7, 2010 7
ADNOC Scholars and New PI Faculty • Dr. Mohamed Chooka• PhD Topic: Structuring a
Probabilistic Model for Reliability Evaluation of Piping Subject to Corrosion Fatigue Degradation
• Current Position: Director of Licensing, Emirates Nuclear Energy Corporation.
1st Annual PI Partner Schools Research Workshop, January 6-7, 2010 8
11
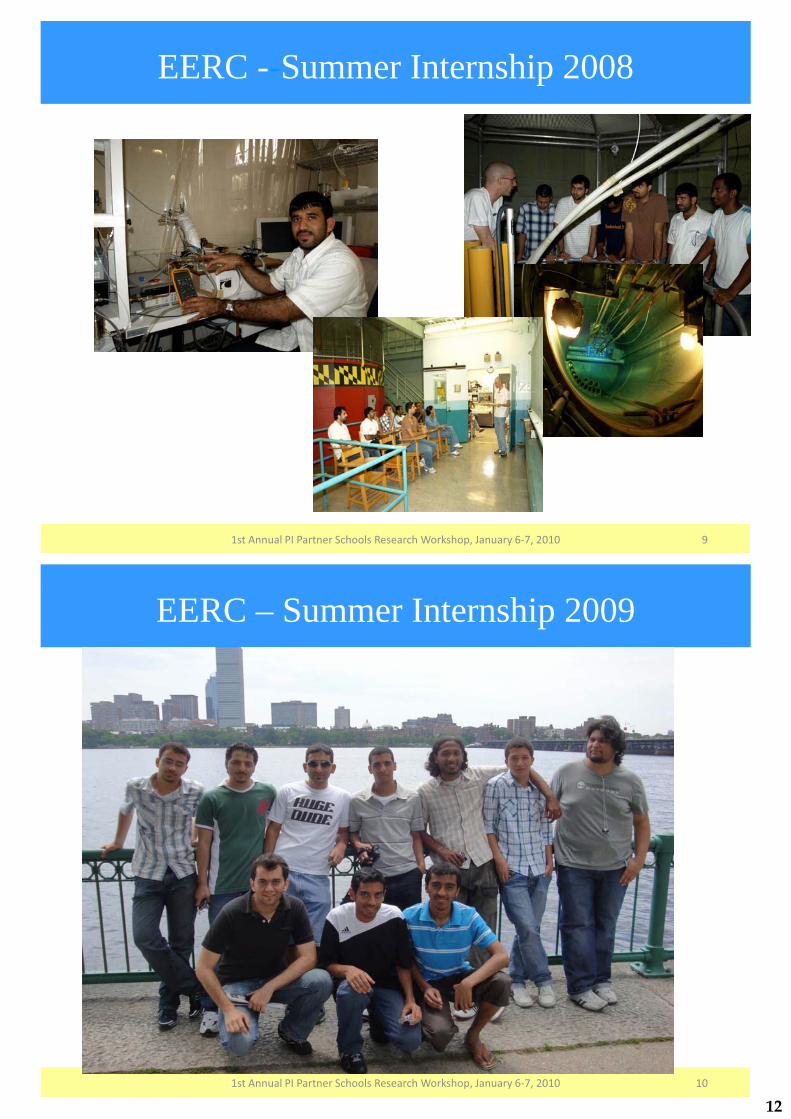
EERC --Summer Internship 2008
1st Annual PI Partner Schools Research Workshop, January 6-7, 2010 9
EERC – Summer Internship 2009
1st Annual PI Partner Schools Research Workshop, January 6-7, 2010 10
12

� Dr. Ohadi as Director of ME, Provost and
Acting President at PI
111st Annual PI Partner Schools Research Workshop, January 6-7, 2010
• ABET
Dr. Sami Ainane
• Director of ME Student Affairs at UMD
• Assigned to PI for one year to help with the ABET accreditation process.
121st Annual PI Partner Schools Research Workshop, January 6-7, 2010
� Sabbatical
Prof. Mikahel Anisimov
� Professor of Chemical Engineering UMD
� Built a state-of-the-art dynamic light scattering lab
� Taught 3 courses, Served on two committees
13
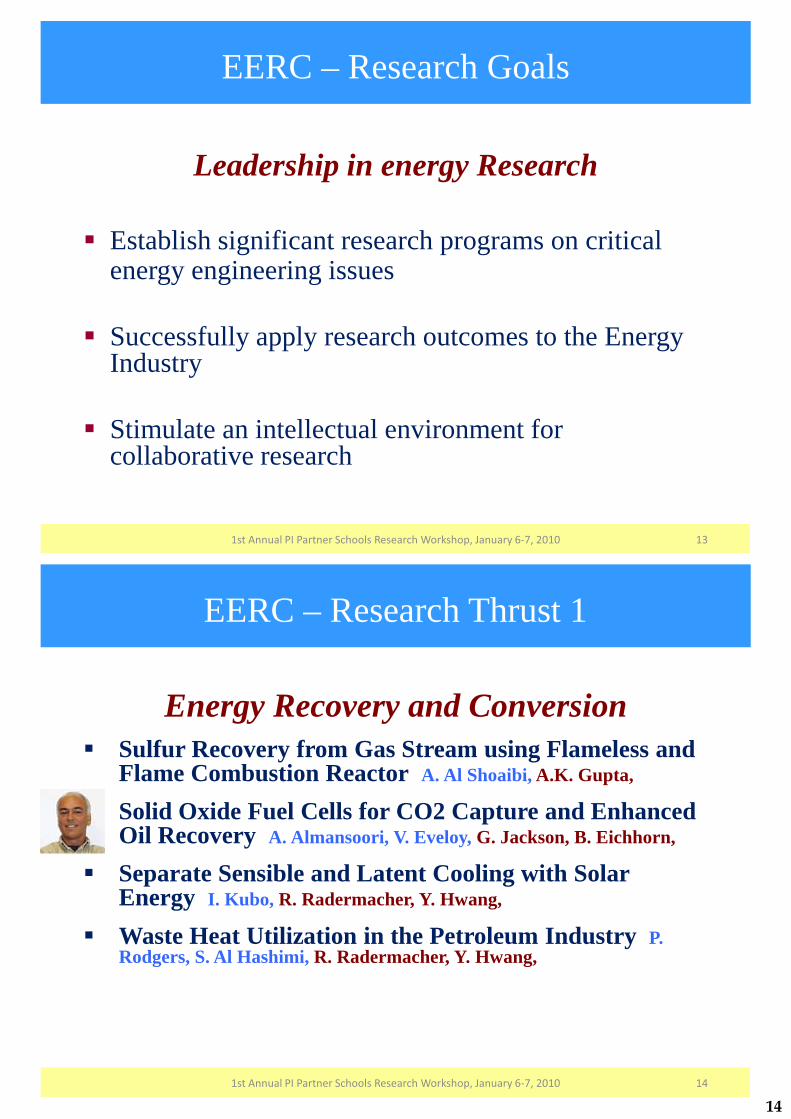
EERC – Research Goals
Leadership in energy Research
� Establish significant research programs on critical energy engineering issues
� Successfully apply research outcomes to the Energy Industry
� Stimulate an intellectual environment for collaborative research
131st Annual PI Partner Schools Research Workshop, January 6-7, 2010
EERC – Research Thrust 1
Energy Recovery and Conversion � Sulfur Recovery from Gas Stream using Flameless and
Flame Combustion Reactor A. Al Shoaibi, A.K. Gupta,
� Solid Oxide Fuel Cells for CO2 Capture and Enhanced Oil Recovery A. Almansoori, V. Eveloy, G. Jackson, B. Eichhorn,
� Separate Sensible and Latent Cooling with Solar Energy I. Kubo, R. Radermacher, Y. Hwang,
� Waste Heat Utilization in the Petroleum Industry P. Rodgers, S. Al Hashimi, R. Radermacher, Y. Hwang,
141st Annual PI Partner Schools Research Workshop, January 6-7, 2010
�������������������������������������������������
14
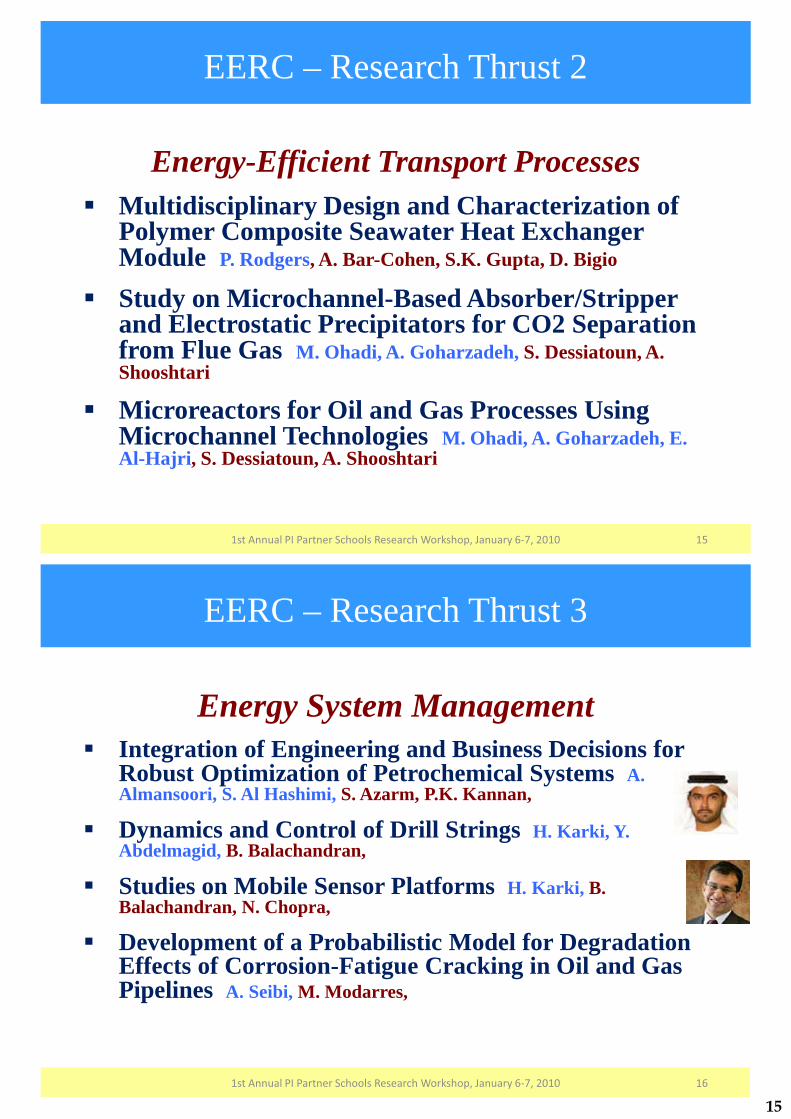
EERC – Research Thrust 2
Energy-Efficient Transport Processes� Multidisciplinary Design and Characterization of
Polymer Composite Seawater Heat Exchanger Module P. Rodgers, A. Bar-Cohen, S.K. Gupta, D. Bigio
� Study on Microchannel-Based Absorber/Stripper and Electrostatic Precipitators for CO2 Separation from Flue Gas M. Ohadi, A. Goharzadeh, S. Dessiatoun, A. Shooshtari
� Microreactors for Oil and Gas Processes Using Microchannel Technologies M. Ohadi, A. Goharzadeh, E. Al-Hajri, S. Dessiatoun, A. Shooshtari
151st Annual PI Partner Schools Research Workshop, January 6-7, 2010
EERC – Research Thrust 3
Energy System Management� Integration of Engineering and Business Decisions for
Robust Optimization of Petrochemical Systems A. Almansoori, S. Al Hashimi, S. Azarm, P.K. Kannan,
� Dynamics and Control of Drill Strings H. Karki, Y. Abdelmagid, B. Balachandran,
� Studies on Mobile Sensor Platforms H. Karki, B. Balachandran, N. Chopra,
� Development of a Probabilistic Model for Degradation Effects of Corrosion-Fatigue Cracking in Oil and Gas Pipelines A. Seibi, M. Modarres,
161st Annual PI Partner Schools Research Workshop, January 6-7, 2010
15
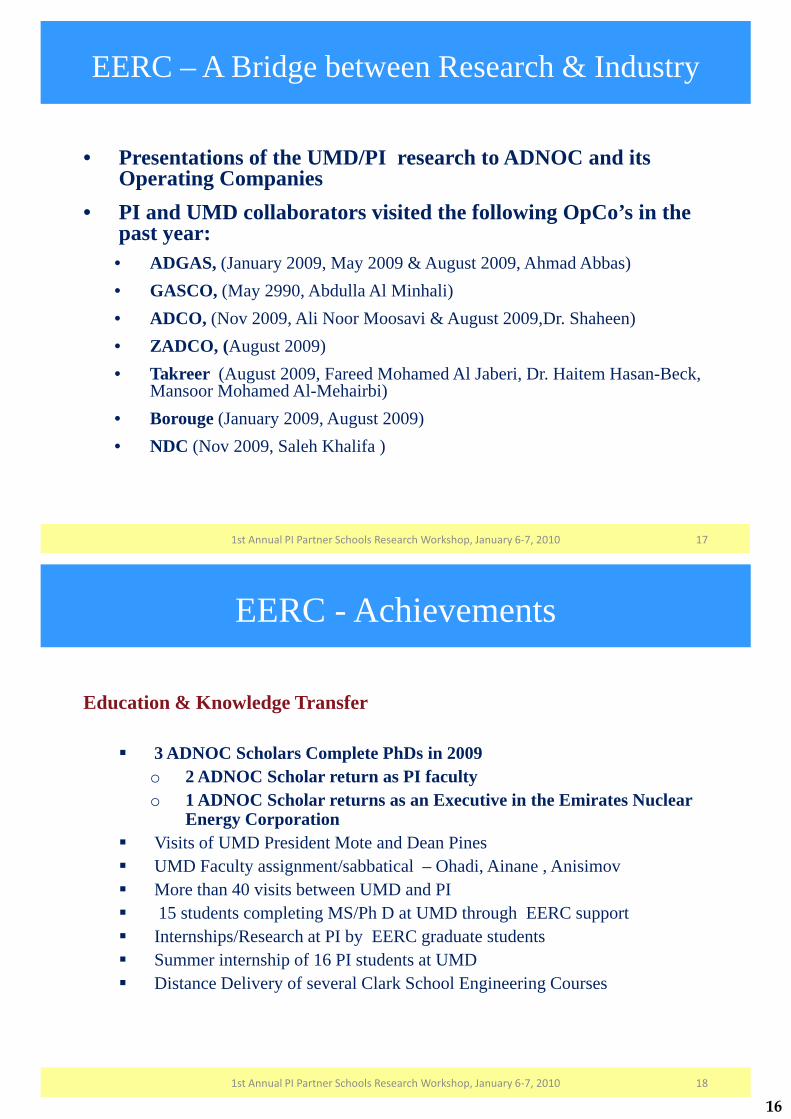
EERC – A Bridge between Research & Industry
• Presentations of the UMD/PI research to ADNOC and its Operating Companies
• PI and UMD collaborators visited the following OpCo’s in the past year:• ADGAS, (January 2009, May 2009 & August 2009, Ahmad Abbas)• GASCO, (May 2990, Abdulla Al Minhali)• ADCO, (Nov 2009, Ali Noor Moosavi & August 2009,Dr. Shaheen) • ZADCO, (August 2009) • Takreer (August 2009, Fareed Mohamed Al Jaberi, Dr. Haitem Hasan-Beck,
Mansoor Mohamed Al-Mehairbi)• Borouge (January 2009, August 2009)• NDC (Nov 2009, Saleh Khalifa )
171st Annual PI Partner Schools Research Workshop, January 6-7, 2010
EERC - Achievements
Education & Knowledge Transfer
� 3 ADNOC Scholars Complete PhDs in 2009o 2 ADNOC Scholar return as PI facultyo 1 ADNOC Scholar returns as an Executive in the Emirates Nuclear
Energy Corporation� Visits of UMD President Mote and Dean Pines� UMD Faculty assignment/sabbatical – Ohadi, Ainane , Anisimov� More than 40 visits between UMD and PI� 15 students completing MS/Ph D at UMD through EERC support � Internships/Research at PI by EERC graduate students � Summer internship of 16 PI students at UMD� Distance Delivery of several Clark School Engineering Courses
181st Annual PI Partner Schools Research Workshop, January 6-7, 2010
16

EERC - AchievementsAchieving Project’s Milestones
� Significant progress in 3 Research Thrusts (10 research projects in Phase I, and 11 in Phase II)
� Organizing two EERC Workshops, Jan 2008, Nov 2008
Publications (2007-2009 )� More than 60 publications in Archival journals and Conference Proceedings
International Visibility� Organized two Energy 2030 International Conferences� UMD President Mote – 2008 PI Commencement Speaker� UMD Provost Farvardin – PI Institutional Advisory Board Member� UMD Faculty attend 2 PI Commencements
Meeting ADNOC’s Needs� Visiting and Presenting PI/UMD collaborative research to OpCos � Research initiated/modified to meet ADNOC needs� Professor Amir Riaz hired in Reservoir Modeling at UMD
191st Annual PI Partner Schools Research Workshop, January 6-7, 2010
EERC – Work in Progress
� Continue 11Research Projects
� Develop Joint UMD-PI Ph D Program� Work with Dr. Economou to recruit students for MS and PhD at PI
who are jointly advised by UMD and PI faculty
� Help Develop the Graduate Program of Health, Safety and Environmental (HSE) at PI� Work with Dr. Clarence Rodrigues at PI on developing a graduate
program with help from Fire Protection, and Civil Engineering at UMD
201st Annual PI Partner Schools Research Workshop, January 6-7, 2010
17
������������ ����������������������� ������������ ������������
���������������������� ����� �� �
����� ��� �� � � � � ��������� �
������������� ��� ������������ ����� ������������ ������������� �!"�����"� ��#!#�#
$���� %�&'( �)*+*
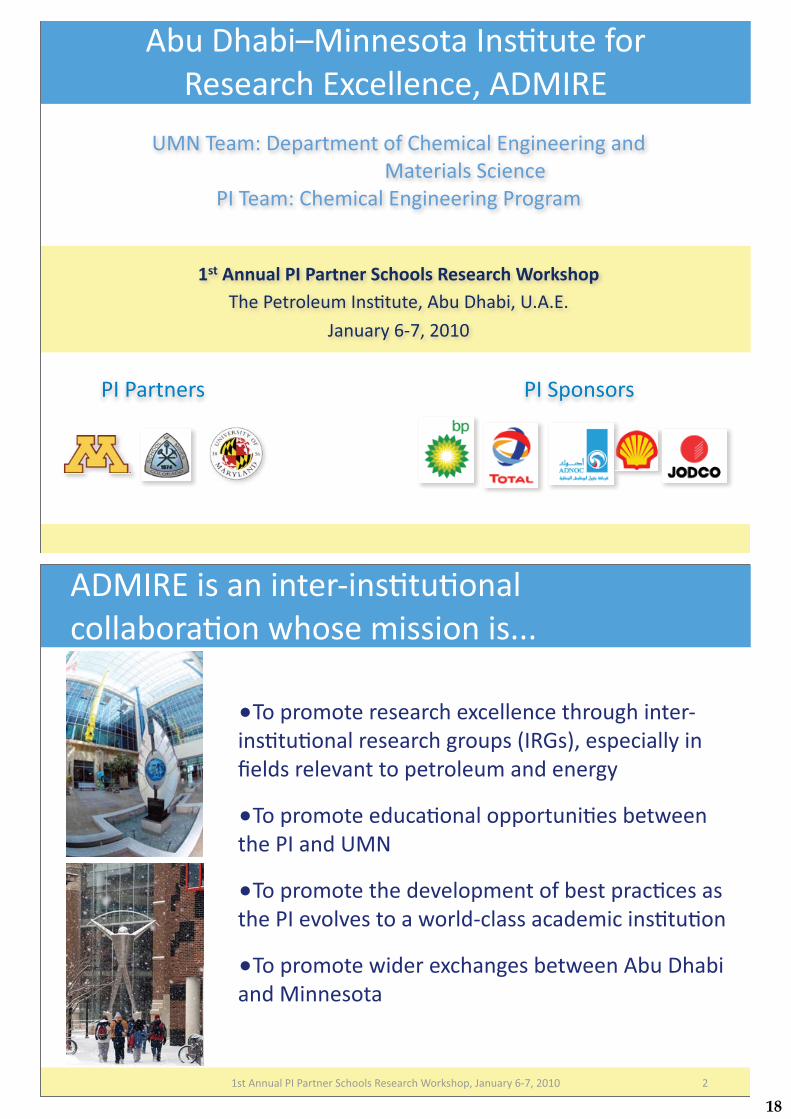
!"�����"�,��������������������� �-���� ����.�������� �!���-�
!���-������������ '�����������������"� �����/��������������###
)+���!����������� ��� ���������-���� ���0� 1���� �$���� %�&'( �)*+*
2���� ����� ���� ����.����������� ��������� '������������ ���� ���� �����3�-4�5 ����������%����6����� ���7���������� ������������ �%
2���� �������������������� ��������"��/������������������
2���� �����������7�����������"����� ������������������7��7��������/� ��'�����������������������
2���� �����/��� ��.��������"��/����!"�����"���������������
18
8+���!����������� ��� ���������-���� ���0� 1���� �$���� %�&'( �)*+*
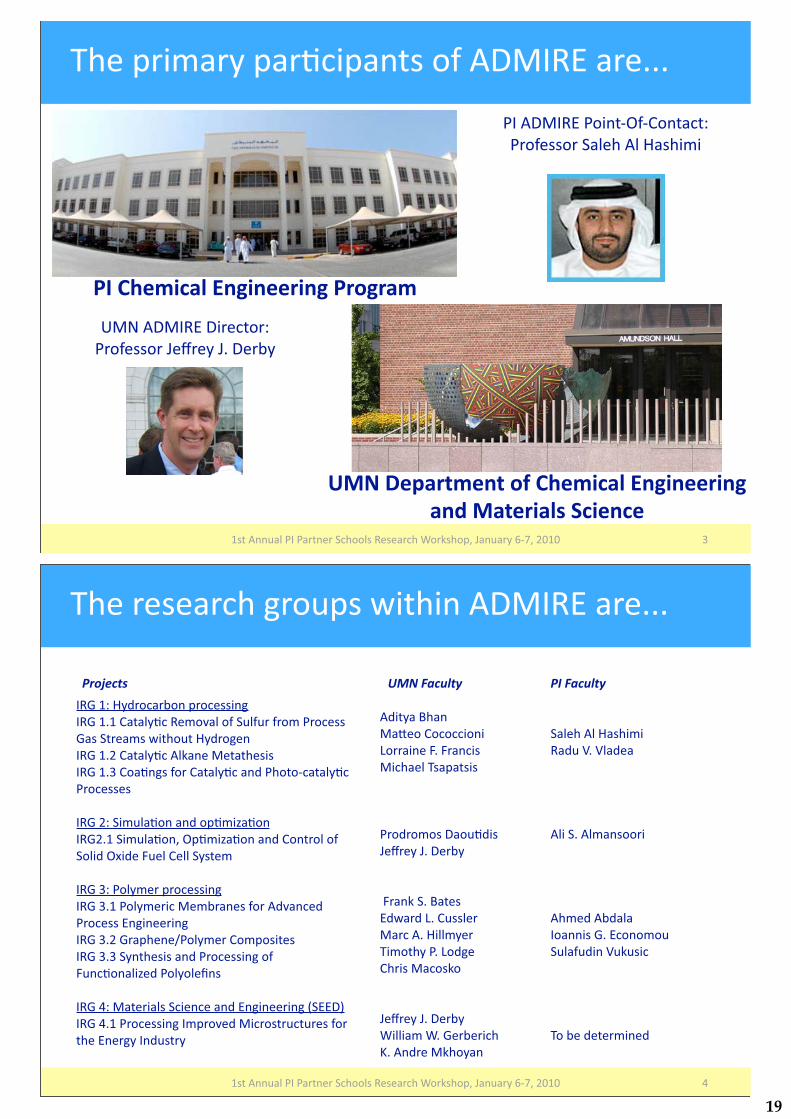
����� �� %��� ������������!���-��� �###
�������������������������������
���� ��!���!��"������������������������#��!�����$��������
���!���-�������'9�'��������� ������ �������!��:�����
����!���-���� ���� �� ������ �$�; �%�$#��� "%
<+���!����������� ��� ���������-���� ���0� 1���� �$���� %�&'( �)*+*
���� ���� ���� �����/������!���-��� �###
�-4�+�:%� ��� "���� ���������-4�+#+������%���-��7����������� �� ��� ������4����� ����/�������:%� �����-4�+#)������%���!�1���������������-4�+#8����������� ������%������������'�����%���� �������
�-4�)������������������=�����-4)#+��������� �9���=������������� ������������9.����>����������%���
�-4�8����%� �� ���������-4�8#+����%� �����" ������� �!�7������� ������������� ����-4�8#)�4 ������?���%� �����������-4�8#8��%������������� ������������>���������=������%���6��
�-4�<����� ������������������������ ����3����5�-4�<#+�� ����������� �7������ ��� ���� ����� �������� �%������� %
!���%��@�����A�������������B� �����>#�> ����������������������
� �� ������������$�; �%�$#��� "%
�> ��1��#�@������/� ��B#������� �� ��!#�:���%� �����%��#�B������ ��������1�
$�; �%�$#��� "%0������0#�4� "� ���C#�!�� ���1��%��
������!��:�����-����D#�D�����
!����#�!������ �
!����!"������������4#������������������D�1����
���"������ ����
��������� ������� �������
19

E+���!����������� ��� ���������-���� ���0� 1���� �$���� %�&'( �)*+*
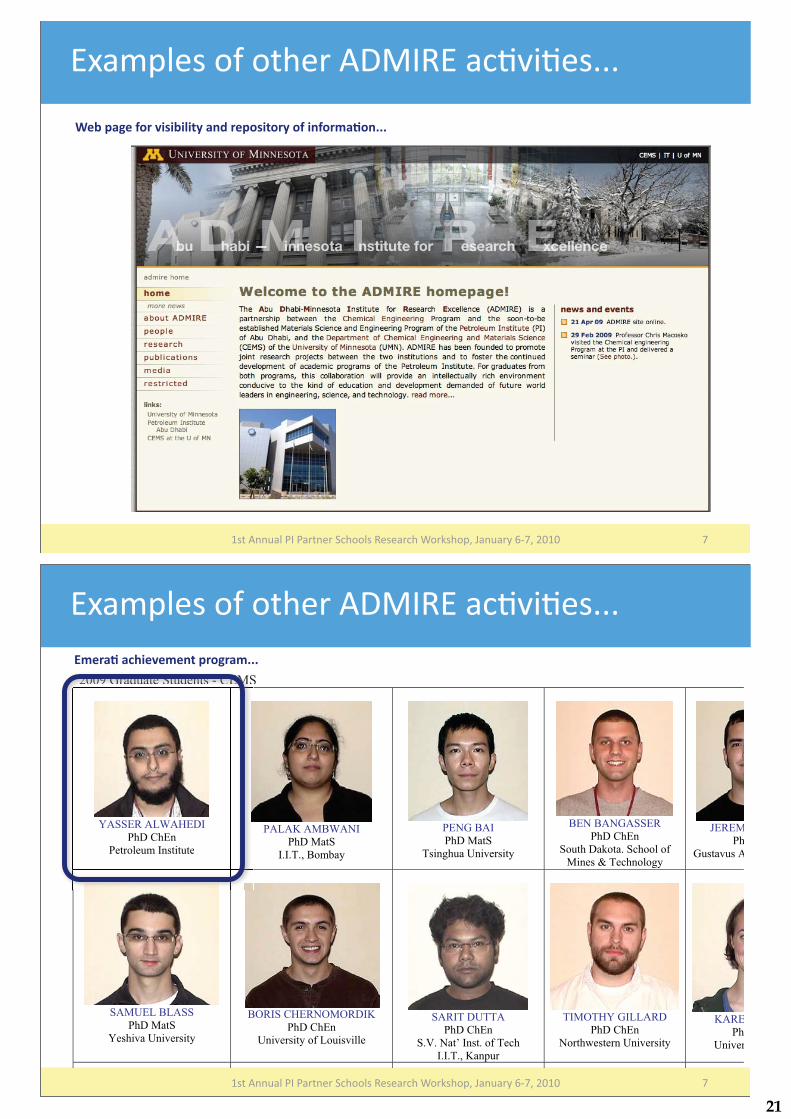
��%�������� ��#����&�$!���#���'������$�#��!
���"%�����(���!�$�������#
���"%��!�&������)���������
���"%���������$� �!$�$���������
���"%��#��)$$������������
!���-������� ���� ������ ����7��������� ����7� ���%������� ���###
+���!����������� ��� ���������-���� ���0� 1���� �$���� %�&'( �)*+* &
!���������!���-�����7������������###
2�����"� ������������ ����������7���� �������������7��� %�"�� ���"� ���� ��� ��������7������� ���� ��������#
2�.�������� �� �� ��������������� � ���������� ����� ����������������� '�" ����� �� �� �� ������� ���� �� �������%���""������#�
20� 1����� ���� ����� ��� ������ ����.�������#
2�� � �������� ��������� ������������7��###
20
+���!����������� ��� ���������-���� ���0� 1���� �$���� %�&'( �)*+* (
�.������������� �!���-�����7����###
���� ����"���&�$�����!*���#��� �$�!��*��"���"����'��%%%
+���!����������� ��� ���������-���� ���0� 1���� �$���� %�&'( �)*+* (
�.������������� �!���-�����7����###
2009 Graduate Students - CEMS
YASSER ALWAHEDI
PhD ChEn
Petroleum Institute
PALAK AMBWANI
PhD MatS
I.I.T., Bombay
PENG BAI
PhD MatS
Tsinghua University
BEN BANGASSER
PhD ChEn
South Dakota. School of
Mines & Technology
JEREM
Ph
Gustavus A
SAMUEL BLASS
PhD MatS
Yeshiva University
BORIS CHERNOMORDIK
PhD ChEn
University of Louisville
SARIT DUTTA
PhD ChEn
S.V. Nat’ Inst. of Tech
I.I.T., Kanpur
TIMOTHY GILLARD
PhD ChEn
Northwestern University
KARE
Ph
Univer
2020202202020202020202200909090909090909090909 GGGGGGGGGG Grararararararararararaddudududududdudududuatatatatatatatatatatateeeeeeeeeee SStStStStStStStStStSt dudududududdududududenenenenenenenenenenentststststststststststs ---- CCCCCCCCCC CEMEMEMEMEMMEMEMEMEMEMEMEMMSS
YASSER ALWAHEDI
PhD ChEn
Petroleum Institute
�����'������&����!� ������%%%
21

+���!����������� ��� ���������-���� ���0� 1���� �$���� %�&'( �)*+* F
�.��������� �� ��������� �/����� ����������� ������ ������G-���� ��
� �H�������I��
��� ' �7��/�����"����������)������ �������"������ ������������������������������������������������������7� ������� ��� �������� �"�����������7������ ������������J+*
��������
>�� ���������������������� ���� ����� ������9�����������������A����� ������ �����������%� ���'����������������������7������� � �7��/
4 ��������������� ����'����� �������������
���� ����� @������� �� ��� @������� �� ���
�-4+�:%� ��� "�������������� ��������
8 <K < +
�-4)��������������������������������
+ )K *#E *
�-48����%� ������������ ��������
8 (KK + +
�-4<����� �����3����5 ) + + *KKK
K!�������������������������������������������'����#��KK�������������� ����������������� ������ �L���������������������������/�#KKK��/��� ��������� �����#
� ������
� ��#���������� ��� 7������������������������� �������� �����!�7��� %�@�� �
������� �7������� �������� ��������������� �����
9��� ����� ������
D���������� ��#�����������1� �� ��#�!���%��@��� ���7� ���� ���������������
C��1'�;�7�����/������������7���� ���� �� ��#�> ��1�@���� �� ��#������������������ �� ��#�$�;��� "% �+F')*���% �)**M
22

Energy Recovery and Conversions I
23

Waste�Heat�Utilization�in the Oil & Gas Industryin�the�Oil�&�Gas�Industry
UMD�Team:�Amir�Mortazavi,�Abdullah�Alabdulkarem,Yunho�Hwang,��Reinhard�Radermacher
PI�Team:������Peter�Rodgers,�Saleh�Al�Hashimi,�S hil P li Al ALSh hhi
1st Annual�PI�Partner�Schools�Research�Workshop1st Annual�PI�Partner�Schools�Research�Workshop
Sahil�Popli,�Alyas�ALShehhi
p
The�Petroleum�Institute,�Abu�Dhabi,�U.A.E.
January�6�7,�2010
p
The�Petroleum�Institute,�Abu�Dhabi,�U.A.E.
January�6�7,�2010
PI�Partners PI�SponsorsPI�Partners PI�Sponsors
y ,y ,
Outline
• Introduction
• Project overview and approach
• Investigation of potential sources of waste heatInvestigation of potential sources of waste heat
and utilization at GASCO ASAB LNG site
APCI LNG l d li d h• APCI LNG plant modeling and enhancement:
– Integrating gas turbine drivers to LNG plant
ASPEN model
– Utilizing LNG plant gas turbine driver waste heat g p g
by absorption chillers
• Current status and future workCurrent status and future work
1st�Annual�PI�Partner�Schools�Research�Workshop,�January�6�7,�2010 2
24

IntroductionIntroduction
31st�Annual�PI�Partner�Schools�Research�Workshop,�January�6�7,�2010
Motivation
• Oil and Gas industry is a
big energy consumer.
• Opportunities for energy
usage improvement areusage improvement are
abundant:
E ffi i dit- Energy efficiency audit
- Improved plant design
through system
integration
41st�Annual�PI�Partner�Schools�Research�Workshop,�January�6�7,�2010
25
Objectives
• Maximize energy efficiency in oil and gas
plantsplants
• Reduce particulate and greenhouse gas
emissions
• De-bottleneck oil and gas productionDe bottleneck oil and gas production
• Increase production capacity
51st�Annual�PI�Partner�Schools�Research�Workshop,�January�6�7,�2010
Project Overview and ApproachProject Overview and Approach
61st�Annual�PI�Partner�Schools�Research�Workshop,�January�6�7,�2010
26
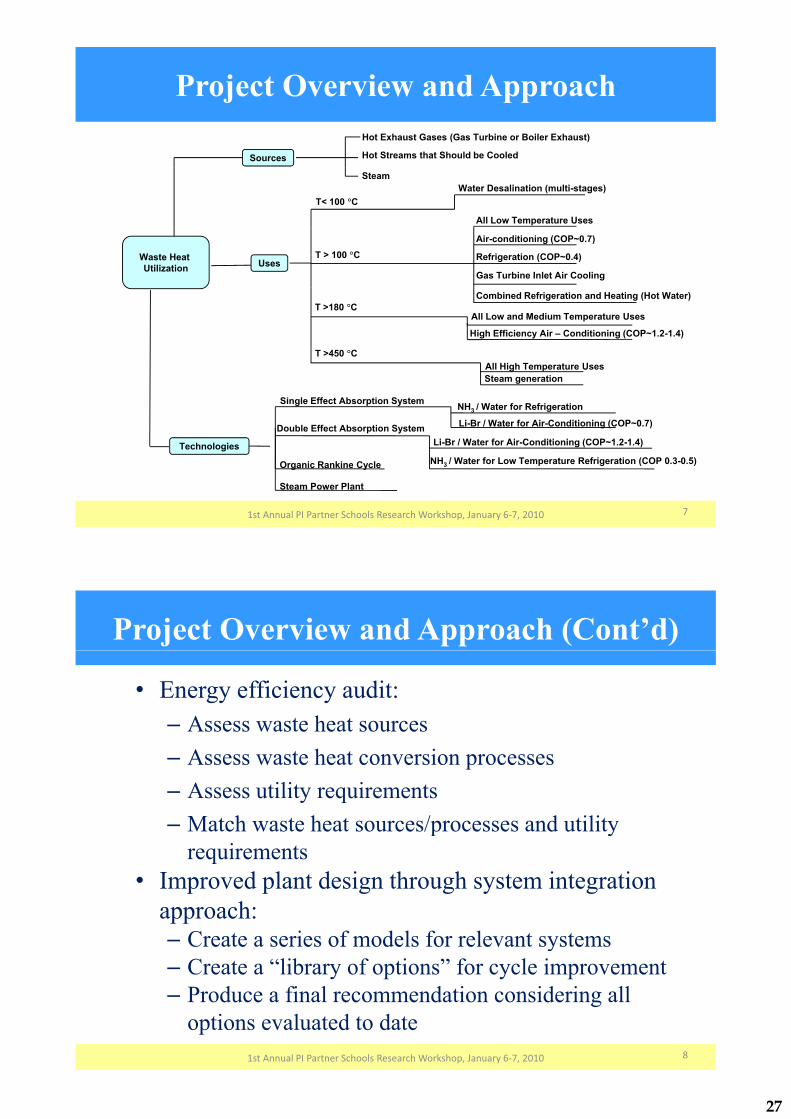
Project Overview and Approach
Sources
Hot Exhaust Gases (Gas Turbine or Boiler Exhaust)
Hot Streams that Should be Cooled
Steam
T< 100 �CWater Desalination (multi-stages)
All Low Temperature Uses
Waste Heat Utilization Uses
T > 100 �CAir-conditioning (COP~0.7)
Refrigeration (COP~0.4)
Gas Turbine Inlet Air Cooling
T >180 �CCombined Refrigeration and Heating (Hot Water)
All Low and Medium Temperature Uses
High Efficiency Air – Conditioning (COP~1.2-1.4)
NH / Water for RefrigerationSingle Effect Absorption System
T >450 �CAll High Temperature UsesSteam generation
Technologies
Double Effect Absorption System Li-Br / Water for Air-Conditioning (COP~0.7)
NH3 / Water for Refrigeration
Li-Br / Water for Air-Conditioning (COP~1.2-1.4)
NH3 / Water for Low Temperature Refrigeration (COP 0.3-0.5)Organic Rankine CycleOrganic Rankine Cycle
Steam Power Plant
71st�Annual�PI�Partner�Schools�Research�Workshop,�January�6�7,�2010
Project Overview and Approach (Cont’d)
• Energy efficiency audit:
– Assess waste heat sources
– Assess waste heat conversion processes
– Assess utility requirements
– Match waste heat sources/processes and utilityMatch waste heat sources/processes and utility
requirements
• Improved plant design through system integration p p g g y g
approach:– Create a series of models for relevant systemsy
– Create a “library of options” for cycle improvement
– Produce a final recommendation considering all
options evaluated to date
81st�Annual�PI�Partner�Schools�Research�Workshop,�January�6�7,�2010
27
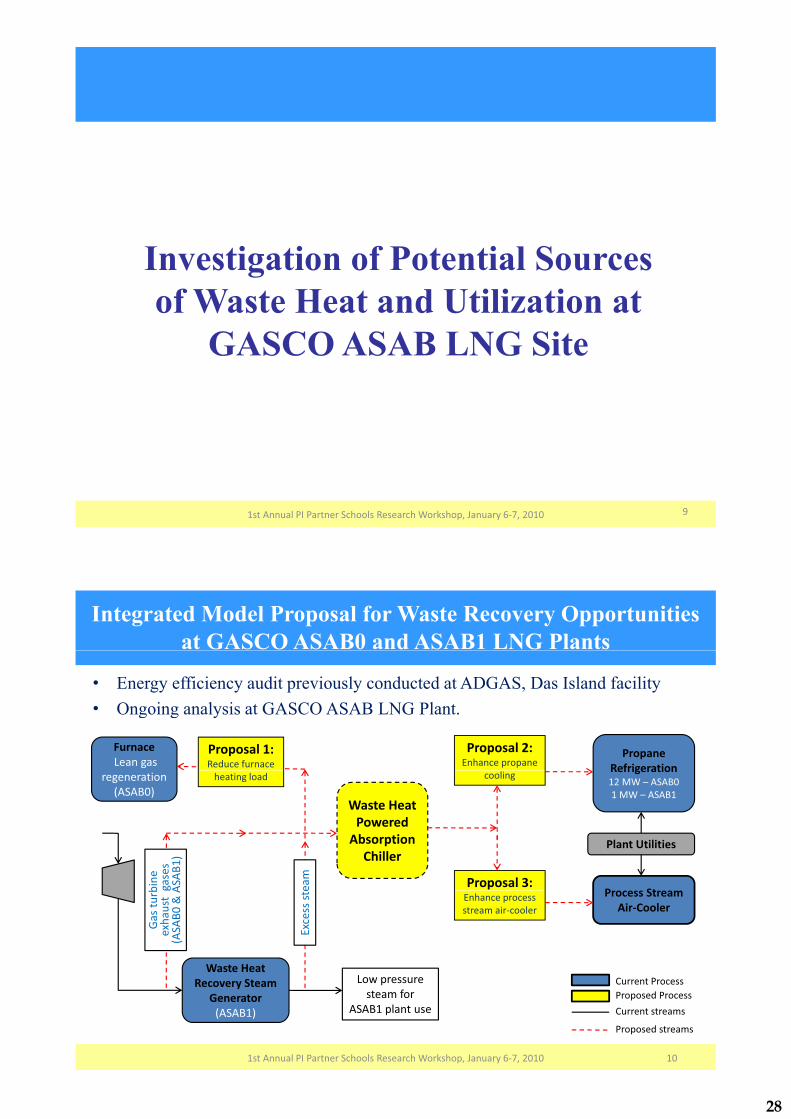
Investigation of Potential Sources of Waste Heat and Utilization at
GASCO ASAB LNG SiteGASCO ASAB LNG Site
91st�Annual�PI�Partner�Schools�Research�Workshop,�January�6�7,�2010
Integrated Model Proposal for Waste Recovery Opportunities at GASCO ASAB0 and ASAB1 LNG Plants
• Energy efficiency audit previously conducted at ADGAS, Das Island facility
• Ongoing analysis at GASCO ASAB LNG Plant
Propane�Refrigeration
FurnaceLean�gas�
Proposal�2:�Enhance�propane�
Proposal�1:Reduce�furnace�
Ongoing analysis at GASCO ASAB LNG Plant.
Refrigeration��12�MW�– ASAB01�MW�– ASAB1
regeneration�(ASAB0)
Waste�Heat�Powered�
coolingheating�load�
Absorption�Chiller
eam
bine
�gases��
ASA
B1)
Process StreamProposal�3:
Plant�Utilities
Excess�ste
Gas�tu
rbexha
ust��g
(ASA
B0�&�A Process�Stream�����������
Air�CoolerEnhance�process�stream�air�cooler
Low�pressure�steam�for�
ASAB1 plant use
Waste�Heat�Recovery�Steam�
Generator�(ASAB1) Current streams
Proposed�ProcessCurrent�Process
1st�Annual�PI�Partner�Schools�Research�Workshop,�January�6�7,�2010 10
ASAB1�plant�use(ASAB1)Proposed�streams
Current�streams
28

Integrated Model Proposal for Waste Recovery Opportunities at GASCO ASAB0 and ASAB1 LNG Plants (Cont’d)
Reduce Furnace Heating Load:
( )
• Proposal 1: Utilization of waste heat from both turbineexhaust gases (ASAB0 & ASAB1) and excess low pressureg ( ) pprocess steam (ASAB1) for lean gas regeneration atASAB0.
Absorption Chillers for Enhanced Cooling:• Proposal 2: Enhance propane cooling using waste heat from
both turbine exhaust gases (ASAB0 & ASAB1) and excess low pressure process steam (ASAB1).p p ( )
• Proposal 3: Enhance process stream air-cooling using waste heat from both turbine exhaust gases (ASAB0 & ASAB1) and g ( )excess low pressure process steam (ASAB1).
1st�Annual�PI�Partner�Schools�Research�Workshop,�January�6�7,�2010 11
APCI LNG Plant Modeling gand Enhancement
121st�Annual�PI�Partner�Schools�Research�Workshop,�January�6�7,�2010
29

Project Overview and Approach
Using�expanders
Two�phase�expanders
Liquid expanders�
��
Enhancing�cycle�efficiency
Liquid�expanders
Gas�expanders�(if�applicable)
Optimizing��refrigerant�composition�and��mass flow rate
��
Enhancing LNG
mass�flow�rate
Optimizing�the�cycle�cooling�stages
Steam power plants
Gas�turbine�and�steam�cycle
Fuel�cell�and�gas�turbine
Designing�new�Enhancing�LNG�
plant�efficiency
Enhancing�the�driver�cycle
Steam�power�plants
Gas�turbines
Double G t bi d b ti
Fuel�cell�and�steam�cycle
g gcycle
�Fuel�cells
Combined
Double Gas�turbine�and�absorption�chillers
Steam�and�absorption�chillers
�
Combined�cycle Triple
Gas�turbine�steam�and�absorption�
Fuel�cell�steam�turbine�and�absorption�chillersWaste��heat�
utilization
chillers
131st�Annual�PI�Partner�Schools�Research�Workshop,�January�6�7,�2010
APCI Liquefaction Cycle
141st�Annual�PI�Partner�Schools�Research�Workshop,�January�6�7,�2010
30
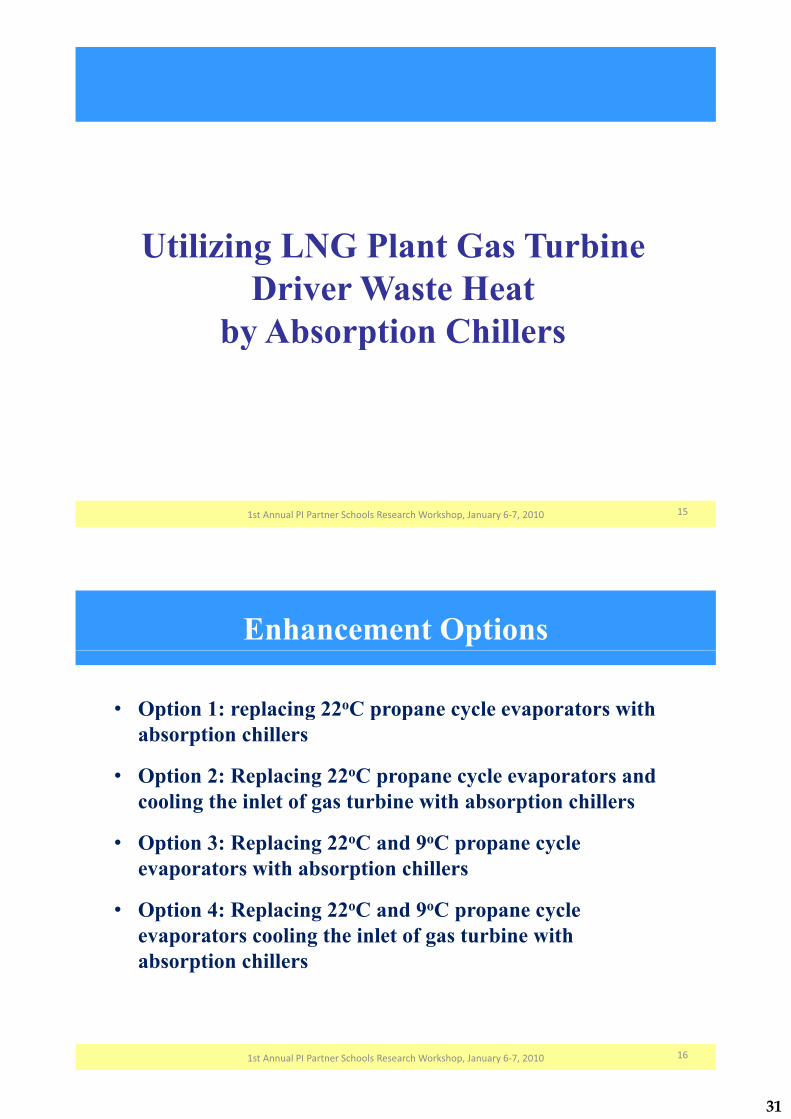
Utilizing LNG Plant Gas Turbine Driver Waste HeatDriver Waste Heat
by Absorption Chillersy p
151st�Annual�PI�Partner�Schools�Research�Workshop,�January�6�7,�2010
Enhancement Options
• Option 1: replacing 22oC propane cycle evaporators with• Option 1: replacing 22 C propane cycle evaporators with absorption chillers
O ti 2 R l i 22oC l t d• Option 2: Replacing 22oC propane cycle evaporators and cooling the inlet of gas turbine with absorption chillers
• Option 3: Replacing 22oC and 9oC propane cycle evaporators with absorption chillers
• Option 4: Replacing 22oC and 9oC propane cycle evaporators cooling the inlet of gas turbine with absorption chillers
161st�Annual�PI�Partner�Schools�Research�Workshop,�January�6�7,�2010
31
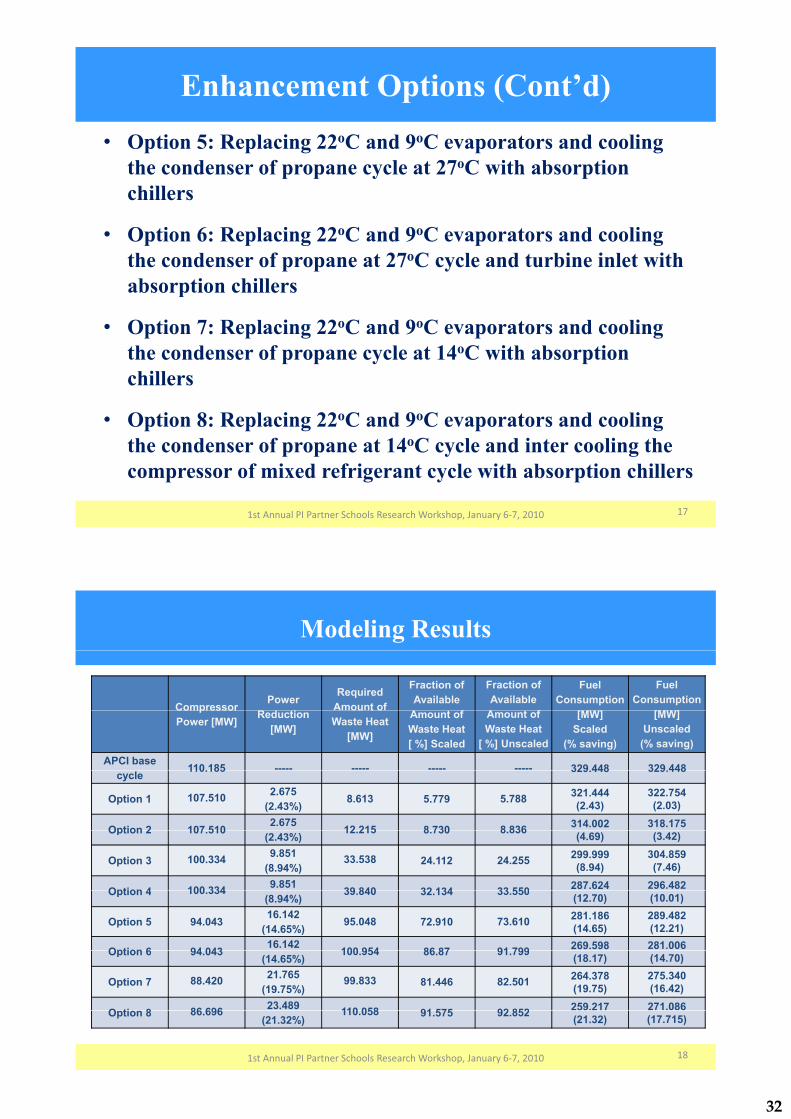
Enhancement Options (Cont’d)• Option 5: Replacing 22oC and 9oC evaporators and cooling
the condenser of propane cycle at 27oC with absorptionthe condenser of propane cycle at 27oC with absorption chillers
O i 6 i 22 C 9 C i• Option 6: Replacing 22oC and 9oC evaporators and cooling the condenser of propane at 27oC cycle and turbine inlet with absorption chillersabsorption chillers
• Option 7: Replacing 22oC and 9oC evaporators and cooling th d f l t 14oC ith b tithe condenser of propane cycle at 14oC with absorption chillers
• Option 8: Replacing 22oC and 9oC evaporators and cooling the condenser of propane at 14oC cycle and inter cooling the
f i d f i t l ith b ti hillcompressor of mixed refrigerant cycle with absorption chillers
171st�Annual�PI�Partner�Schools�Research�Workshop,�January�6�7,�2010
Modeling Results
Compressor Power R d ti
Required Amount of
Fraction of Available
A t f
Fraction of Available
A t f
Fuel Consumption
[MW]
Fuel Consumption
[MW]Compressor Power [MW] Reduction
[MW]
ou t oWaste Heat
[MW]
Amount of Waste Heat[ %] Scaled
Amount of Waste Heat
[ %] Unscaled
[MW]Scaled
(% saving)
[MW]Unscaled
(% saving)APCI base 110.185 ----- ----- ----- ----- 329.448 329.448cycle 110.185 329.448 329.448
Option 1 107.510 2.675(2.43%)
8.613 5.779 5.788 321.444(2.43)
322.754(2.03)
Option 2 107 510 2.675 12 215 8 730 8 836 314.002 318.175Option 2 107.510 (2.43%)12.215 8.730 8.836 (4.69) (3.42)
Option 3 100.334 9.851(8.94%)
33.538 24.112 24.255 299.999(8.94)
304.859(7.46)
Option 4 100 334 9.851 39 840 32 134 33 550 287.624 296.482Option 4 100.334(8.94%)
39.840 32.134 33.550 (12.70) (10.01)
Option 5 94.043 16.142 (14.65%)
95.048 72.910 73.610 281.186(14.65)
289.482(12.21)
Option 6 94 043 16.142 100 954 86 87 91 799 269.598 281.006Option 6 94.043 (14.65%)100.954 86.87 91.799 (18.17) (14.70)
Option 7 88.420 21.765(19.75%)
99.833 81.446 82.501 264.378(19.75)
275.340(16.42)
O ti 8 86 696 23.489 110 058 91 575 92 852 259.217 271.086Option 8 86.696(21.32%)
110.058 91.575 92.852 (21.32) (17.715)
181st�Annual�PI�Partner�Schools�Research�Workshop,�January�6�7,�2010
32
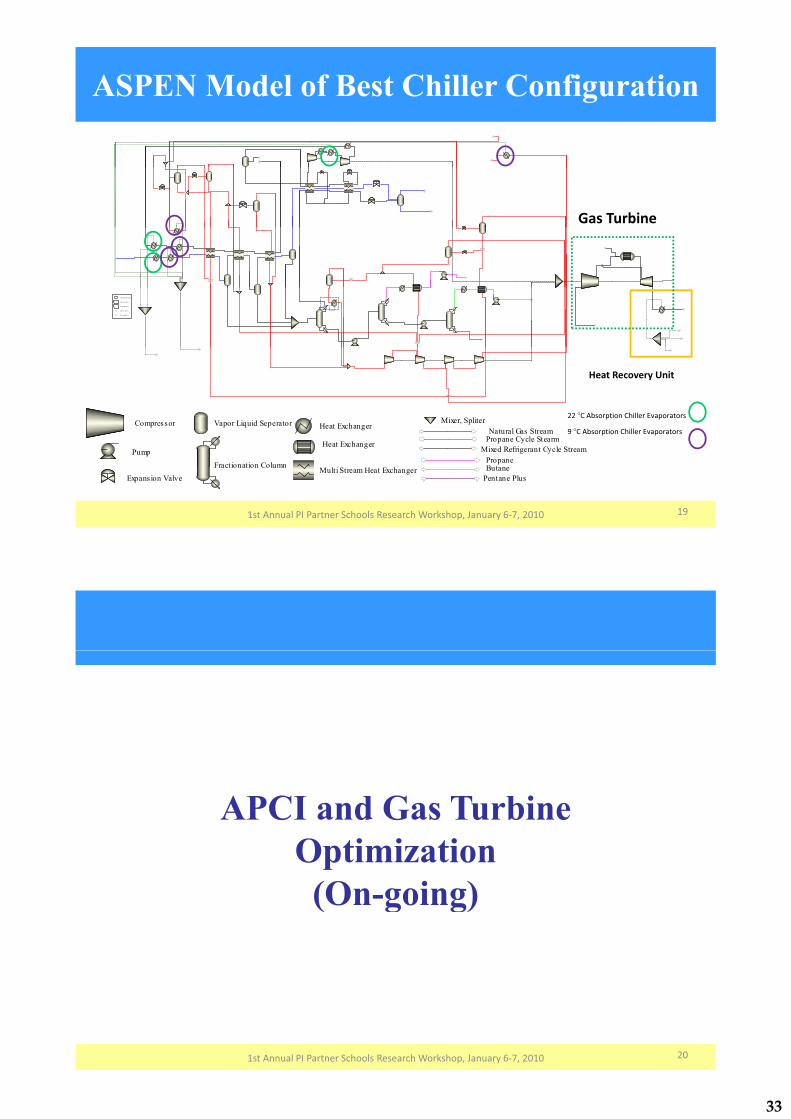
ASPEN Model of Best Chiller Configuration
Gas�Turbine
Tem p eratu r e (C)
Du t y (k W )
Po w er(k W )
Q Du t y (k W )
W Po w er(k W )
Heat�Recovery�Unit
22�°C�Absorption�Chiller�Evaporators
9�°C�Absorption�Chiller�EvaporatorsCompressor
Pump
Vapor Liquid Seperator
Heat Exchanger
Fractionation Column
Heat ExchangerNatural Gas Stream
Propane
Propane Cycle Stearm
Butane
Mixed Refrigerant Cycle Stream
Mixer, Spliter
Expans ion ValveMulti Stream Heat Exchanger
Fractionation Column Butane
Pentane Plus
191st�Annual�PI�Partner�Schools�Research�Workshop,�January�6�7,�2010
APCI and Gas Turbine Optimization(On going)(On-going)
201st�Annual�PI�Partner�Schools�Research�Workshop,�January�6�7,�2010
33
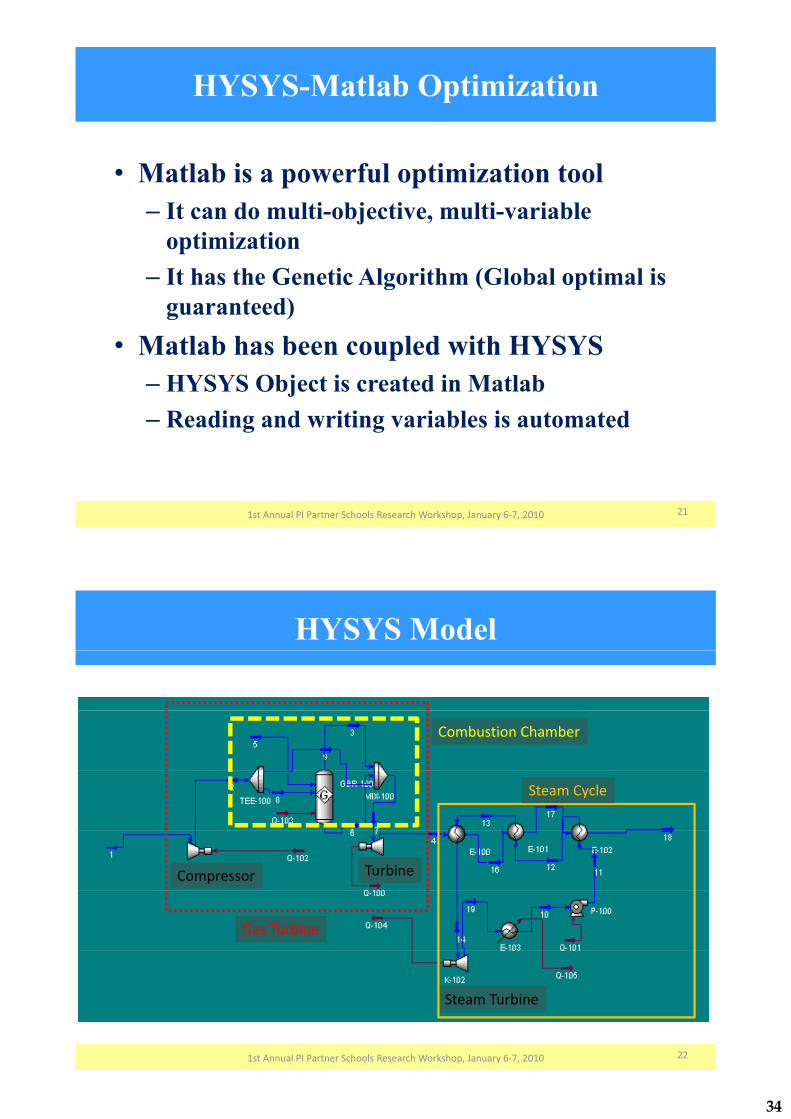
HYSYS-Matlab Optimization
M tl b i f l ti i ti t l• Matlab is a powerful optimization tool– It can do multi-objective, multi-variable
optimization– It has the Genetic Algorithm (Global optimal is g ( p
guaranteed)• Matlab has been coupled with HYSYS• Matlab has been coupled with HYSYS
– HYSYS Object is created in Matlab– Reading and writing variables is automated
211st�Annual�PI�Partner�Schools�Research�Workshop,�January�6�7,�2010
HYSYS Model
Combustion�Chamber
Steam�Cycle
Compressor Turbine
Gas�Turbine
Steam�Turbine
221st�Annual�PI�Partner�Schools�Research�Workshop,�January�6�7,�2010
34

Results
Steam Mass Flow Rate [kg/s] Steam Boiler Pressure [kPa] Super Heater Temperature [C] Total Power [kW]
54.44 8969 552.0 18180554.44 8969 552.0 18180555.65 6190 506.5 17872654.44 8969 552.0 18180554.44 8969 552.0 18180554.44 8969 552.0 18180554.44 8969 552.0 18180554.44 8969 552.0 18180554.44 8969 552.0 18180554.12 7383 551.9 18077954.44 8969 552.0 18180554.44 8969 552.0 18180554.44 8969 552.0 18180554.44 8969 552.0 18180554.44 8969 552.0 18180554.44 8969 552.0 18180554.44 8969 552.0 18180554 44 8969 552 0 18180554.44 8969 552.0 18180554.44 8969 552.0 18180554.44 8969 552.0 18180554.44 8969 552.0 18180554 44 8969 552 0 18180554.44 8969 552.0 181805
231st�Annual�PI�Partner�Schools�Research�Workshop,�January�6�7,�2010
C rrent Stat s and F t re WorkCurrent Status and Future Work
241st�Annual�PI�Partner�Schools�Research�Workshop,�January�6�7,�2010
35

Current Status
Th f ll i ti h b d l d i ASPENThe following options have been modeled in ASPEN:• APCI base plants• Enhanced APCI LNG plants• Ammonia/water absorption chillersAmmonia/water absorption chillers• Water/LiBr absorption chillers
LNG l t t bi d i• LNG plant gas turbine driver• LNG plant gas turbine driver waste heat
utilization with water/LiBr absorption chillers
251st�Annual�PI�Partner�Schools�Research�Workshop,�January�6�7,�2010
Current Status (Cont’d)
The following options were modeled in HYSYS:• The base APCI LNG plant cycle• Gas turbine driver cycle• APCI enhanced by combined gas turbineAPCI enhanced by combined gas turbine
absorption chiller cycle• Coupling Matlab with HYSYS to optimize the• Coupling Matlab with HYSYS to optimize the
cycle
261st�Annual�PI�Partner�Schools�Research�Workshop,�January�6�7,�2010
36

Future Work
• Modeling gas turbine combined cycles for wasteModeling gas turbine combined cycles for waste heat utilizationM d li t bi t l d b ti• Modeling gas turbine, steam cycle and absorption chiller-triple combined cycle for waste heat utilizationutilization
• Using Matlab optimization package for the l ti f th b t d i fi tiselection of the best driver configuration
• Optimizing the mixed refrigerant composition by Matlab
271st�Annual�PI�Partner�Schools�Research�Workshop,�January�6�7,�2010
Publications
• Published Paper:– Application of Waste Heat Powered Absorption Refrigeration System
to the LNG Recovery Process, P. Kalinowski, Y. Hwang, R. Radermacher, S.A. Hashimi, P. Rogers, Int. J. Refrigeration, 2009
• Submitted Papers:– Mortazavi, A., Hwang, Y., Radermacher, R., S. Al-Hashimi, and P.
Rodgers , Performance Enhancement of APCI LNG Plant, APEN, 2009.g , f f , ,– Mortazavi, A., Hwang, Y., Radermacher, R., S. Al-Hashimi, and P.
Rodgers, Enhancement of LNG Propane Cycle through Waste Heat Powered Absorption Cooling APEN 2009Powered Absorption Cooling, APEN, 2009.
– Somers, C., Mortazavi, A., Hwang, Y., Radermacher, R., Al-Hashimi, S., and Rodgers, P., Modeling Absorption Chillers in ASPEN, APEN, 20092009.
– Mortazavi, A., Alabdulkarem, A., Somers, C., Hwang, Y., Radermacher, R., Al-Hashimi, S., and Rodgers, P., Enhancement of APCI Cycle Effi i ith Ab ti Chill E J l 2009Efficiency with Absorption Chillers, Energy Journal, 2009.
281st�Annual�PI�Partner�Schools�Research�Workshop,�January�6�7,�2010
37

UMD Team: Ali Al-Alili, Yunho Hwang, Reinhard RadermacherPI Team: Isoroku Kubo
1st Annual PI Partner Schools Research Workshop
The Petroleum Institute, Abu Dhabi, U.A.E.
January 6-7, 2010
Hybrid Solar Cooling/Heating System
PI Partners PI Sponsors
Presentation Outline
• Background• Objectives• Experimental Setup• Results and Discussions• Project Status• Conclusions and Summary
21st Annual PI Partner Schools Research Workshop, January 6-7, 2010
38

Background
• In hot and humid regions, removal of moisture from the air represents a major portion of the air conditioning load.
• Flat solar collectors require large fields
• The current available solar cooling cycles have low overall efficiency, less than unity.
31st Annual PI Partner Schools Research Workshop, January 6-7, 2010
Project Objectives
• Design and fabricate a solar cooling/heating system with the highest overall COP value.
• Fabricate and test the solar cooling system at UMD.
• Perform a field test in the UAE.
41st Annual PI Partner Schools Research Workshop, January 6-7, 2010
39

Weather Data
Phoenix, AZLat: 33.43 oNLong: 112.02 oWEle = 339 m
Madison, WILat: 43.13 oNLong: 89.33 oWEle = 262 m
Baltimore, MDLat: 39.18 oNLong: 76.67 oWEle = 47 m
Tampa, FLLat: 27.97 oNLong: 82.53 oWEle = 3 m
5
Sub-Systems Schematics
Solar Sub-System
[1]
[1] http://www.power-spar.com
6
40

Sub-Systems Schematics
Cooling Sub-System
7
Complete System Schematic
8
41
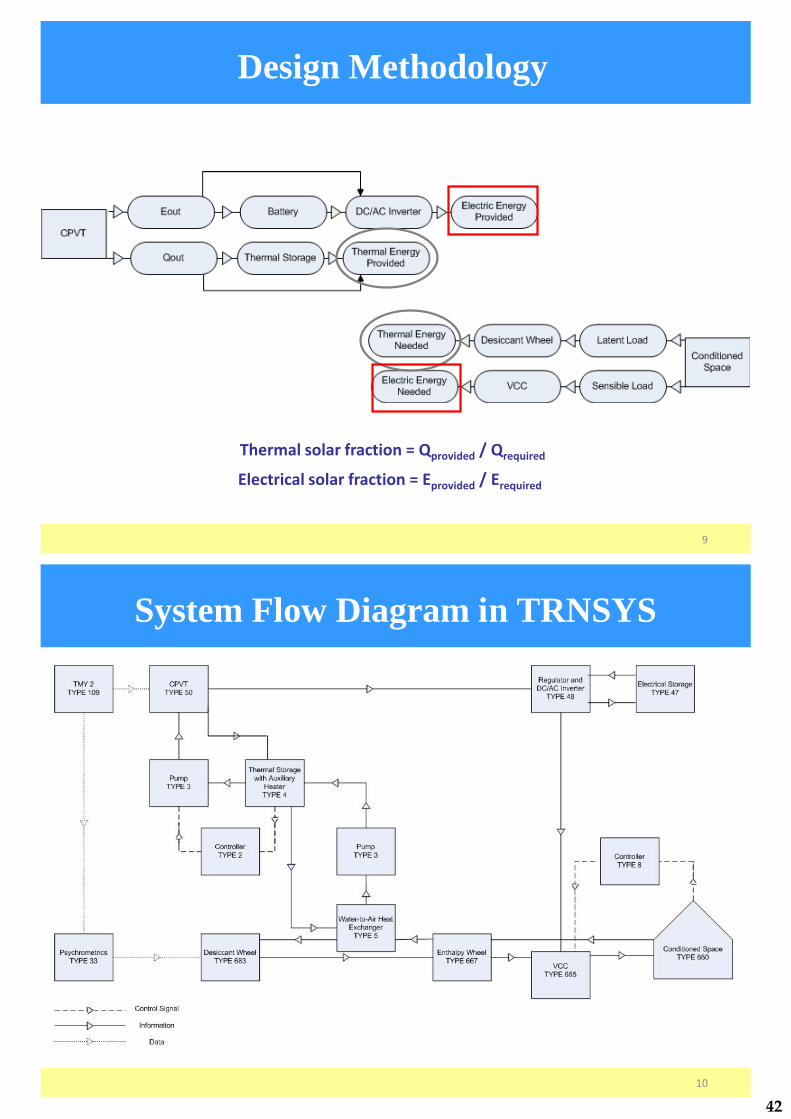
Design Methodology
Thermal solar fraction = Qprovided / Qrequired
Electrical solar fraction = Eprovided / Erequired
9
System Flow Diagram in TRNSYS
10
42
11
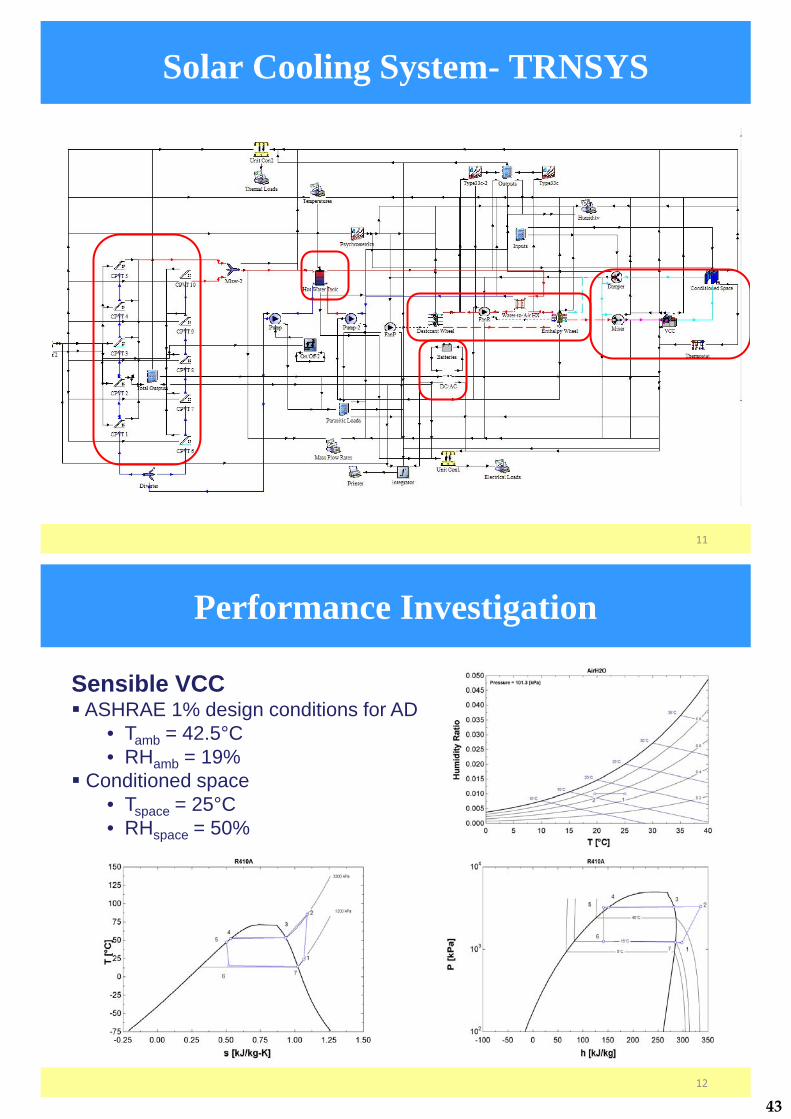
Solar Cooling System- TRNSYS
Performance Investigation
Sensible VCC� ASHRAE 1% design conditions for AD
• Tamb = 42.5°C• RHamb = 19%
� Conditioned space • Tspace = 25°C• RHspace = 50%
12
43

Performance Investigation
Abu Dhabi, UAE
13
Performance Investigation
Abu Dhabi, UAE
14
44

Performance Investigation
Tampa, Florida
15
Performance Investigation
Tampa, Florida
16
45

Performance Investigation
17
• The hybrid solar cooling system performance is compared to:• PV + electrically driven VCC• Evacuated tube thermal collector + Absorption cycle
Performance Investigation
1st Annual PI Partner Schools Research Workshop, January 6-7, 2010 18
• The simulated system performance using 1% ASHRAE design conditions for Abu Dhabi.
46

Optimization Approach
GenOpt TRNOPT TRNSYS
MATLAB Tool Box
Interface TRNSYS
ApproximationAssisted Optimization
Interface TRNSYS
19
Optimization Example
A test problem, minimizing the electric heater consumption for a solar absorption cycle, was used to compare various optimization algorithms.
20
47
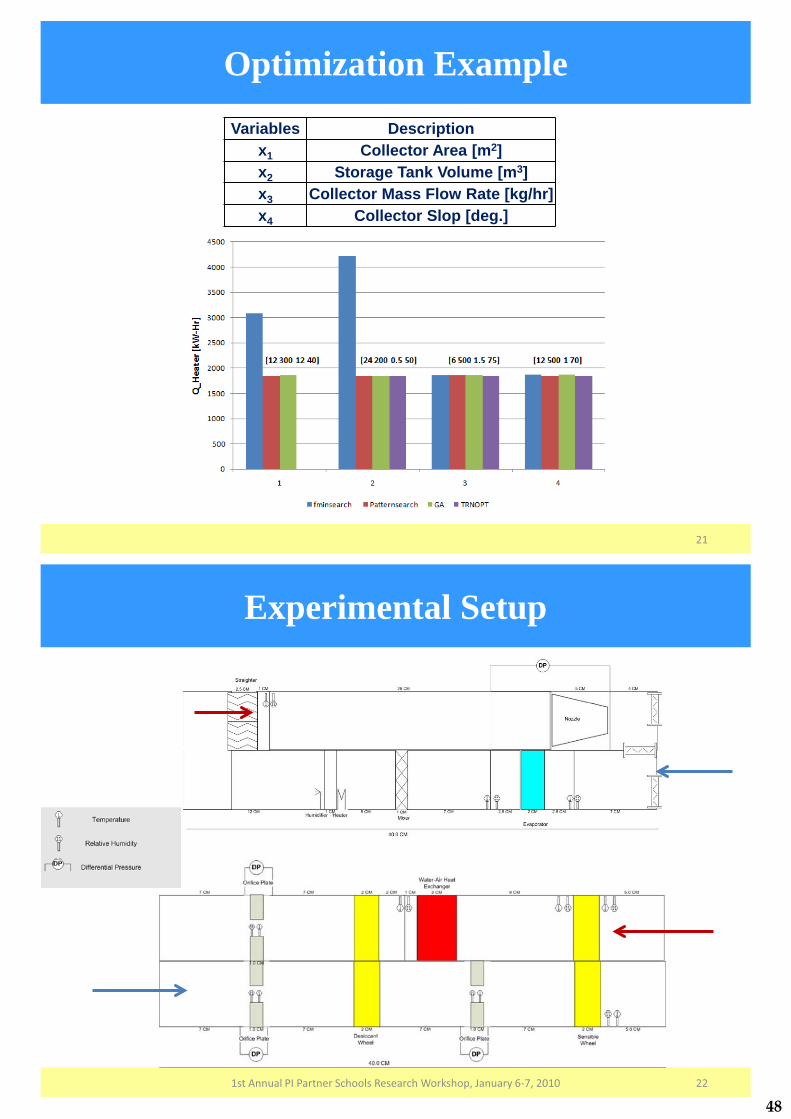
Optimization Example Variables Description
x1 Collector Area [m2]x2 Storage Tank Volume [m3]x3 Collector Mass Flow Rate [kg/hr]x4 Collector Slop [deg.]
21
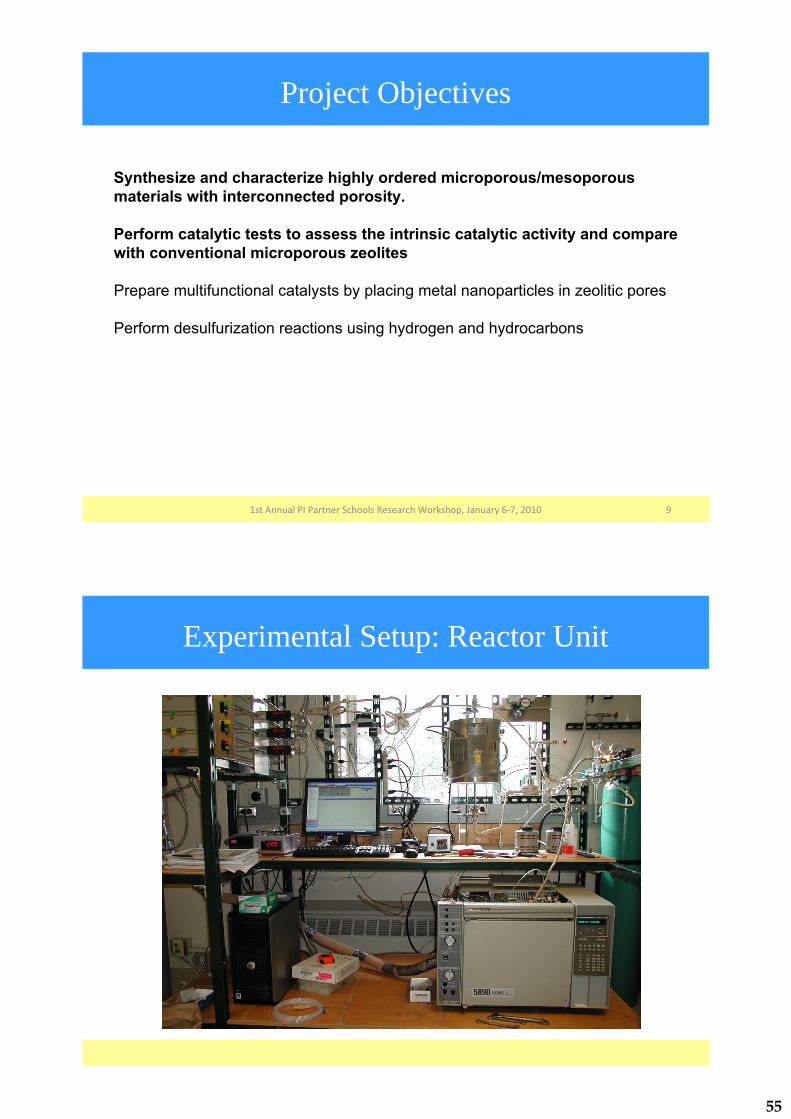
Experimental Setup
221st Annual PI Partner Schools Research Workshop, January 6-7, 2010
48

Conclusions
� A novel application for a hybrid photovoltaic/thermal (CPVT) collector was investigated.
� The system performance was modeled using Transient Systems Simulation (TRNSYS) program.
� The system performance was also compared to the performance of the standalone VCC which is widely used in the UAE .
� To provide the same cooling capacity, the proposed system reduces the electrical energy required to drive the standalone VCC by 50%.
23
Conclusions
� Simulation results show that decoupling of latent and sensible load is very effective in meeting the humidity and temperature requirements of buildings.
� TRNSYS program was successfully linked to MATLAB in order to expand its optimization capabilities.
� The design of experimental set up was finalized.
1st Annual PI Partner Schools Research Workshop, January 6-7, 2010 24
49

Future Work
� Experimentally evaluate the performance of the desiccant subsystem to ensure its operation at low regeneration temperature.
� Build the complete system in the laboratory andrecord all relevant operating parameters.
� Verify the TRNSYS model based on the measured data.
� Optimize the system and its controls based on measured data.
� Develop installation and operation guidelines for the hybrid solar cooling/heating system.
25
Publications
• Published Paper:– Y. Hwang, R. Radermacher, A. Al-Alili, and I. Kubo,
Review of Solar Cooling Technologies, Int. Journal of HVAC&R Research, Vol. 14, No. 3, pp. 507-528, 2008.,
• Submitted Papers:– A. Al-Alili, Y. Hwang, R. Radermacher, and I. Kubo, A
High Efficiency Solar Cooling Technique, APEN, 2009.– A. Mortazavi, Y. Hwang, R. Radermacher, and I. Kubo,
Optimization of a Solar Powered Absorption Cycle under Abu Dhabi’s Weather Conditions, Solar Energy, 2009.
26
50

PI�Partners PI�SponsorsPI�Partners PI�Sponsors
1st Annual�PI�Partner�Schools�Research�Workshop
The�Petroleum�Institute,�Abu�Dhabi,�U.A.E.
January�6�7,�2010
1st Annual�PI�Partner�Schools�Research�Workshop
The�Petroleum�Institute,�Abu�Dhabi,�U.A.E.
January�6�7,�2010
Synthesis�and�Catalytic�Performance�of�Hierarchically�Ordered�Micro/Mesoporous�Catalysts
1st�Annual�PI�Partner�Schools�Research�Workshop,�January�6�7,�2010
UMN Team: Aditya Bhan M. Tsapatsis, Pyoongsoo Lee, Dongxia Liu, Xueyi ZhangPI Team: S. Al Hashimi, Radu Vladea, Abdulla Malek, Oki Muraza
Presentation Outline
• Background• Objectives• Experimental Setup• Results and Discussion• Project Status• Conclusions and Summary
21st�Annual�PI�Partner�Schools�Research�Workshop,�January�6�7,�2010
51

Objectives: ADMIRE IRG 1.1.
One of the objectives of ADMIRE IRG1.1 is to develop new catalyst designs for hydrodefurization (HDS) over noble metals supported on zeolites.A design currently investigated is based on micro/mesoporous zeolites.
H2H+
H+H+
HH
H
H
Properties:�1.Bimodal�zeolite�support2.Shape�selective�exclusion3.Hydrogen�spillover4.Sulfur�tolerant�catalyst
The�SEM�and�TEM�images�show�a�typical�micrometer�sized��ZSM�5�catalyst�particle�with�uniform�5.5Angstrom�pores
Background: typical miroporous molecular sieves (zeolites)
41st�Annual�PI�Partner�Schools�Research�Workshop,�January�6�7,�2010
2nma
c
52

Recent�Progress�on�Synthesis�of�Micro/Mesoporous�Zeolites� I.�Pillaring�of�Layered�Zeolites
Background
51st�Annual�PI�Partner�Schools�Research�Workshop,�January�6�7,�2010
AlPO: Gao et al., J. Solid State Chem 129, 37 (1997)
MCM-22: Corma et al., Nature 396, 353-356 (1998)Leonowicz et al.Science 264, 1910-1913 (1994)
AMH-3: Jeong et al., Nature Materials 2:(1), 53-58 (2003)
Tsapatsis et al. U.S. Patent 6,863,983 B2 (2006) U.S. Patent 7,087,288 B2 (2006)
� Layered�Zeolites � Pillaring�of�Layered�Zeolites
Hydrolysis
Calcination
Swollen�Structure MCM�36:�Material�
Pillared�with�silica
Si(OEt)4
Rubin and Chu, US Patent 4954325, 1990
BackgroundRecent�Progress�on�Synthesis�of�Micro/Mesoporous�Zeolites
�I.�Pillaring�of�Layered�Zeolites:�Preserving�the�structure�of�the�zeolite�layer�during�pillaring�is�very�important�for�ensuring�high�catalytic�activity�(Maheshwari�et.�al.,�Journal�of�the�American�Chemical�Society,�2008,�230,�p1507;�“Layered�Zeolite�materials�and�Methods�Related�Thereto” Tsapatsis,�M.,�Maheshwari�S.,�Koros�W.�and�Bates�F.S.�PCT/US2008/012455;�WO2009108166)
preserved
Not
preserved
New�Material�(UMN)
MCM�36�(ExxonMobil)
Cracking�of�gasoil
Xylene�isomerization
•
53

Background
71st�Annual�PI�Partner�Schools�Research�Workshop,�January�6�7,�2010
Recent�Progress�on�Synthesis�of�Micro/Mesoporous�Zeolites� II. Three-Dimensionally Ordered Zeolites (W. Fan, M.A. Snyder, S. Kumar, PS Lee, W. C. Yoo, A. V. McCormick, R. L. Penn, A. Stein and M. Tsapatsis, Nature Materials, 7(12), 984-991(2008))
Zeolite with mesoporosity
silica nanoparticles Order packing silica
Carbon + zeolite
3DOm carbon(10 nm – 40 nm)
Background: 3DOm Silicalite-1: nm and Angstrom resolution
54
1st�Annual�PI�Partner�Schools�Research�Workshop,�January�6�7,�2010 9
Project Objectives
Synthesize and characterize highly ordered microporous/mesoporous materials with interconnected porosity.
Perform catalytic tests to assess the intrinsic catalytic activity and compare with conventional microporous zeolites
Prepare multifunctional catalysts by placing metal nanoparticles in zeolitic pores
Perform desulfurization reactions using hydrogen and hydrocarbons
Experimental Setup: Reactor Unit
55
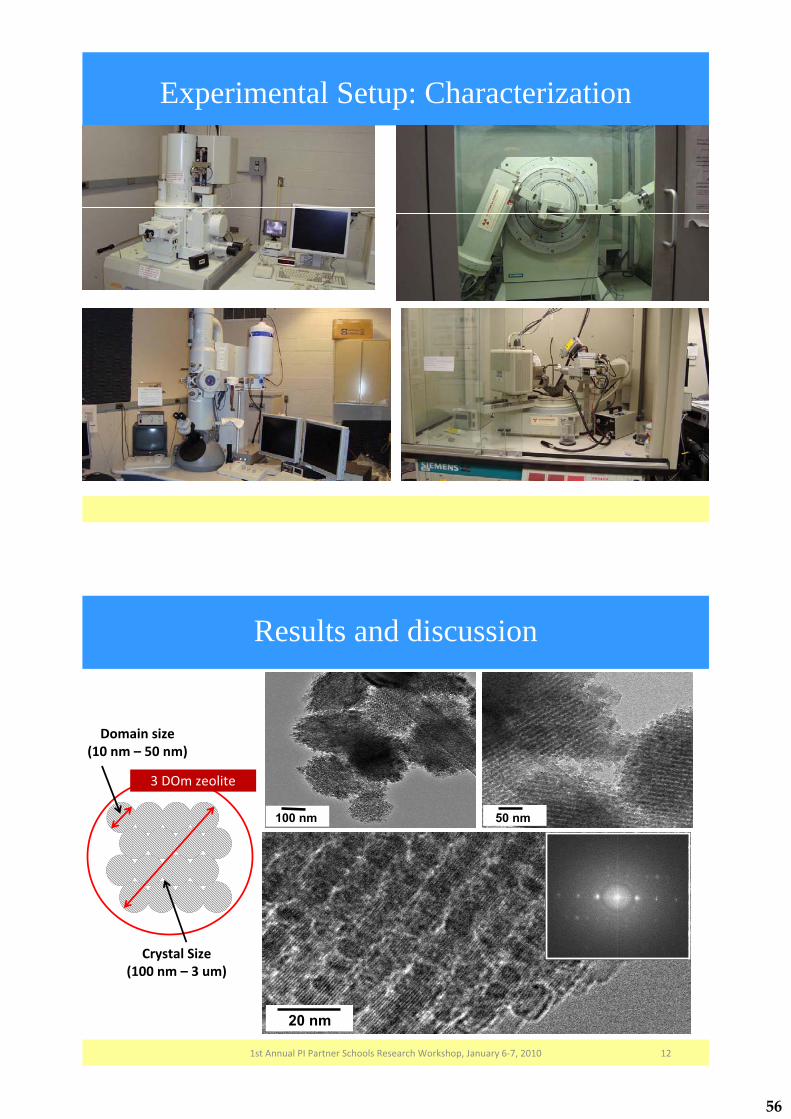
Experimental Setup: Characterization
100 nm 50 nm
20 nm
3�DOm�zeolite
Domain�size(10�nm�– 50�nm)
Crystal�Size(100�nm�– 3�um)
Results and discussion
121st�Annual�PI�Partner�Schools�Research�Workshop,�January�6�7,�2010
56

300�nm 600�nm 3��m
3�DOm�zeolite�of�20�nm�domains�with�different�crystal�size
Results and discussion
131st�Annual�PI�Partner�Schools�Research�Workshop,�January�6�7,�2010
2�μm 2�μm200�nm 300 nm200�nm
600�nm 600�nm 20�nm20�nm
3�DOm�zeolite�of�similar�crystal�size�with�different�domains
Results and discussion
141st�Annual�PI�Partner�Schools�Research�Workshop,�January�6�7,�2010
57

��
5 10 15 20 25 300.2 0.4 0.6 0.8 1.0 5 10 15 20 25 30
24 nm
13 nm
32 nm
42 nm
2�0.2 0.4 0.6 0.8
3�DOm�zeolite�of�similar�crystal�size�with�different�domains
X�ray�diffraction�pattrens�of�3�DOm�zeolites
Results and discussion
151st�Annual�PI�Partner�Schools�Research�Workshop,�January�6�7,�2010
0.0 0.2 0.4 0.6 0.8 1.0
100
200
300
400
500
P/P0
cc/g
24 nm13 nm
42 nm
domaindia.
Crystalsize
Microporearea(m2/g)
BET surf.
Area(m2
/g)
Ext. surf. Area
(m2/g)
Mesoporedia.(nm)
13 nm200-300
nm153.4 508.4 354.9 5.5
24 nm200-300
nm186.8 459.7 272.9 6.5
32 nm500-600
nm206.4 406.3 214.4 8.0
42 nm300-400
nm193.3 406.3 213.0 15.5
Texture�properties�of�3�DOm�zeolites
Tunable�mesoporosity�by�changing�domain�sizes�of�3�DOm�zeolite
Nitrogen�adsorption�isotherm
Results and discussions
161st�Annual�PI�Partner�Schools�Research�Workshop,�January�6�7,�2010
58
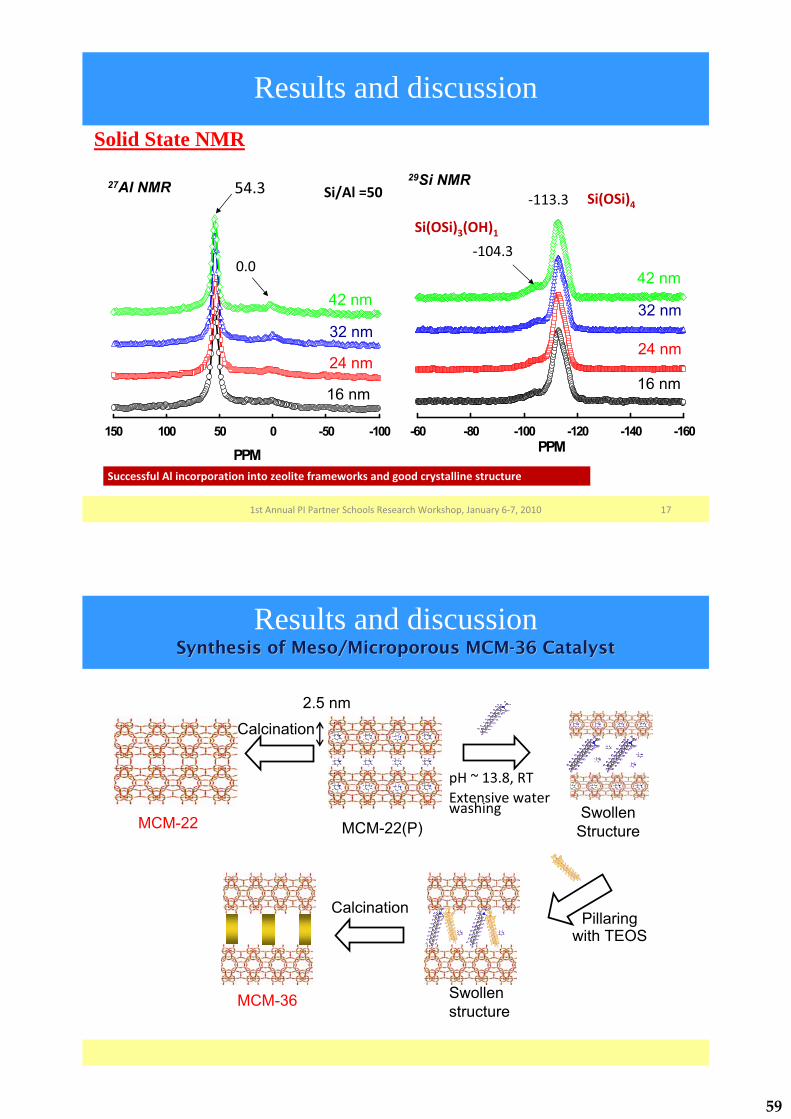
Solid State NMR
PPM-160-140-120-100-80-60
29Si NMR
PPM-100-50050100150
27Al NMR
24 nm
16 nm
32 nm
42 nm
24 nm
16 nm
32 nm
42 nm
54.3
0.0
�113.3
�104.3
Successful�Al�incorporation�into�zeolite�frameworks�and�good�crystalline�structure
Si/Al�=50 Si(OSi)4
Si(OSi)3(OH)1
Results and discussion
171st�Annual�PI�Partner�Schools�Research�Workshop,�January�6�7,�2010
Results and discussionSynthesis of Meso/Microporous MCMSynthesis of Meso/Microporous MCM--36 Catalyst 36 Catalyst
Calcination
MCM-22(P)MCM-22
2.5 nm
Swollen Structure
pH�~�13.8,�RTExtensive�water�washing
Swollen structure
Pillaring with TEOS
MCM-36
Calcination
59
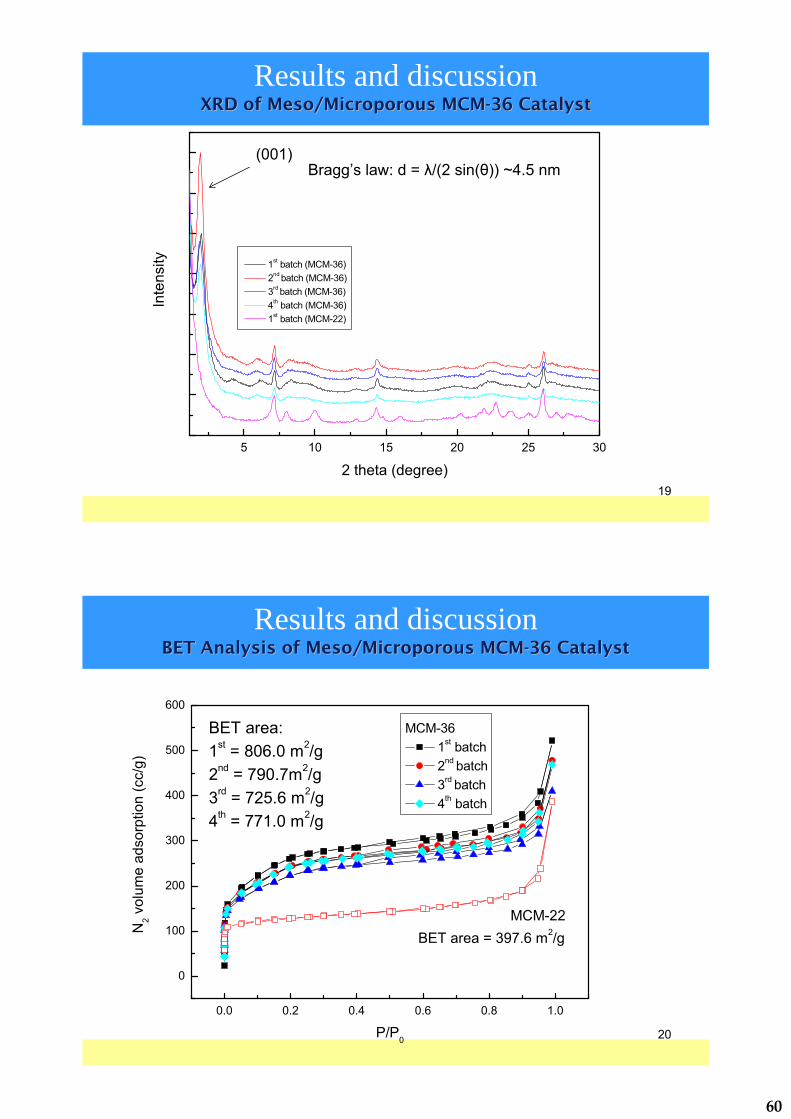
5 10 15 20 25 30
Inte
nsity
2 theta (degree)
1st batch (MCM-36) 2nd batch (MCM-36) 3rd batch (MCM-36) 4th batch (MCM-36) 1st batch (MCM-22)
(001)
19
Bragg’s law: d = �/(2 sin(�)) ~4.5 nm
Results and discussionXRD of Meso/Microporous MCMXRD of Meso/Microporous MCM--36 Catalyst 36 Catalyst
0.0 0.2 0.4 0.6 0.8 1.0
0
100
200
300
400
500
600
BET area = 397.6 m2/g
MCM-36 1st batch 2nd batch 3rd batch 4th batch
N2 v
olum
e ad
sorp
tion
(cc/
g)
P/P0
BET area:1st = 806.0 m2/g2nd = 790.7m2/g3rd = 725.6 m2/g4th = 771.0 m2/g
MCM-22
20
Results and discussionBET Analysis of Meso/Microporous MCMBET Analysis of Meso/Microporous MCM--36 Catalyst 36 Catalyst
60

Mechanism of Ethanol Activation on Zeolites
21
Ethanol Activation over Synthesized Zeolites
2.4 2.5 2.6 2.71
10
100
1000 Mesoporous MFI MFI Mesoporous MWW MWW
Rat
e C
onst
ant
(/ 10
-5 m
ol D
EE
(mol
H+ )-1
s-1)
1/T (10-3 K-1)
420 410 400 390 380 370T (K)
22
61

Mechanism of Propane Activation on Zeolites
23
SiO
AlO
Si
H
H2C CH2
H3C
SiO
AlO
Si
CH2 H2
CH2H3C
SiO
AlO
Si
CH2
CHH3C
H
Dehydrogenation
SiO
AlO
Si
CH2 CH4
H3C
SiO
AlO
Si
CH2
H2C
H
CrackingH
Cracking:
Dehydrogenation:
C3H8 CH4 + C2H4
C3H8 H2 + C3H6
Conversion of Propane over MFI
24
1.24 1.26 1.28 1.30 1.32 1.340.1
1
10
100
T (K)
R
ate
Con
stan
t(/
10-3
mol
(mol
H+ )-1
s-1 b
ar-1
)
1000/T (K-1)
Cracking Dehydrogenation
810 800 790 780 770 760 750 740
1.20 1.22 1.24 1.26 1.28 1.30 1.32 1.340.1
1
10
100
Rat
e C
onst
ant
(/ 10
-3 m
ol (m
ol H
+ )-1s-1
bar
-1)
1000/T (K-1)
Cracking Dehydrogenation
825 810 795 780 765 750T (K)
MFI Mesoporous MFI
62

Cracking/Dehydrogenation Ratio
25
1.20 1.22 1.24 1.26 1.28 1.30 1.32 1.34
0.6
0.9
1.2
1.5
1.8
T (K)
Cra
king
-to-
Deh
ydro
gena
tion
Rat
io
1000/T (K-1)
MFI Mesoporous MFI
825 810 795 780 765 750
Project Status
1st�Annual�PI�Partner�Schools�Research�Workshop,�January�6�7,�2010 261st Annual PI Partner Schools Research Workshop January 6�7 2010
The project progresses as planned
Experimental set up was completed
Microporous/mesoporous zeolites were synthesized and characterized bySEM, TEM, NMR, porosimetry and catalytic activity for ethanol dehydration and propane activation
Metal supported catalysts and bifunctional catalysis are the next target
A new graduate student from PI joined the team at UMN:Mr. Yasser AlWahedi will be jointly advised by Tsapatsis and Bhan
An undergraduate student from PI (Mr. A. Malek) worked with the UMN team last summer.
Several publications and conference presentations are in preparation
63

Conclusions and Summary
• Micro/mesoporous zeolites with precisely controlled micro and mesoporosity at the Angstrom and nanometer levels respectively can be prepared
• The materials exhibit high intrinsic catalytic activity comparable to that of microporous zeolites
• They will be further developed for hydrodesulfurization and for diffusion limited reactions:
H2H+
H+ H+
HH
H
H
64

Energy Recovery and Conversions II
65
Understanding of Chemical Kinetics in the Thermal Stage of Claus Process
UMD Team: Prof. Ashwani Gupta, Hatem Selim
PI Team: Dr. Ahmed Al Shoaibi, Nahla Al Amoodi
1st Annual PI Partner Schools Research WorkshopThe Petroleum Institute, Abu Dhabi, U.A.E.
January 6-7, 2010
PI Partners PI Sponsors
Presentation Outline
• Background• Objectives• Approach• Results and Discussions• Project Status• Conclusions
21st�Annual�PI�Partner�Schools�Research�Workshop,�January�6�7,�2010
66
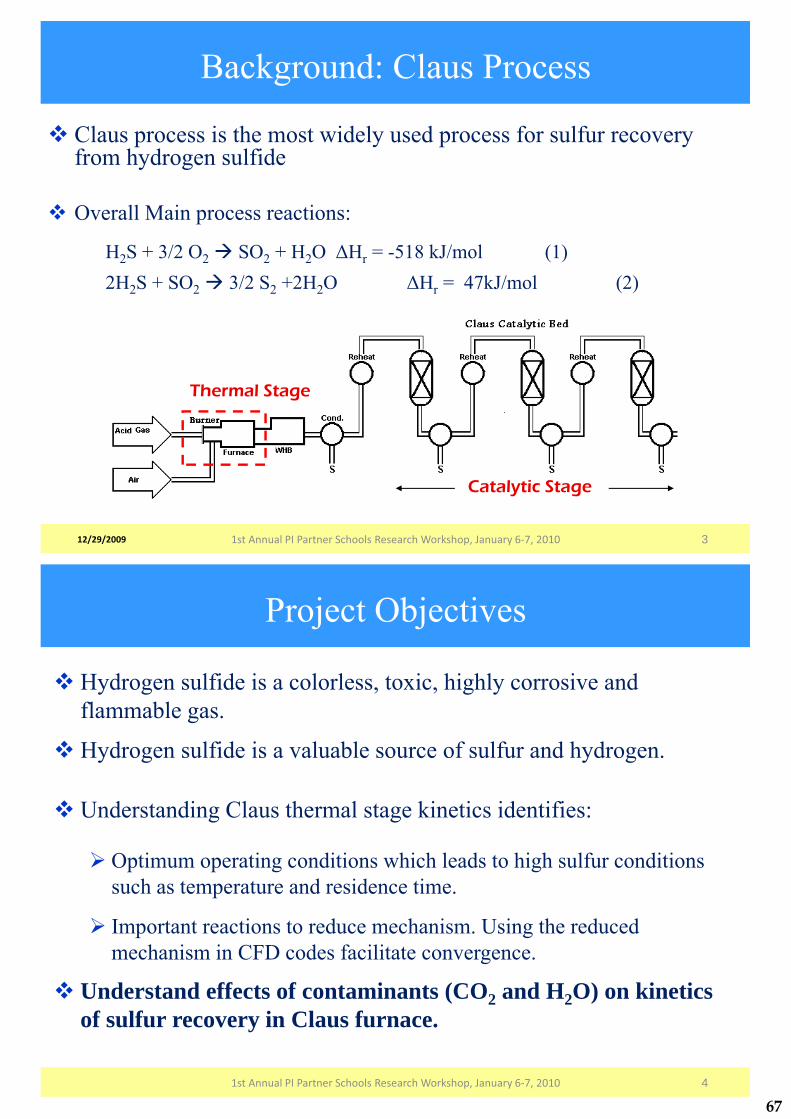
Background: Claus Process
31st�Annual�PI�Partner�Schools�Research�Workshop,�January�6�7,�201012/29/2009
� Claus process is the most widely used process for sulfur recovery from hydrogen sulfide
� Overall Main process reactions:
H2S + 3/2 O2� SO2 + H2O �Hr = -518 kJ/mol (1)2H2S + SO2� 3/2 S2 +2H2O �Hr = 47kJ/mol (2)
Thermal Stage
Catalytic Stage
Project Objectives
41st�Annual�PI�Partner�Schools�Research�Workshop,�January�6�7,�2010
� Hydrogen sulfide is a colorless, toxic, highly corrosive and flammable gas.
� Hydrogen sulfide is a valuable source of sulfur and hydrogen.
� Understanding Claus thermal stage kinetics identifies:
� Optimum operating conditions which leads to high sulfur conditions such as temperature and residence time.
� Important reactions to reduce mechanism. Using the reduced mechanism in CFD codes facilitate convergence.
� Understand effects of contaminants (CO2 and H2O) on kinetics of sulfur recovery in Claus furnace.
67
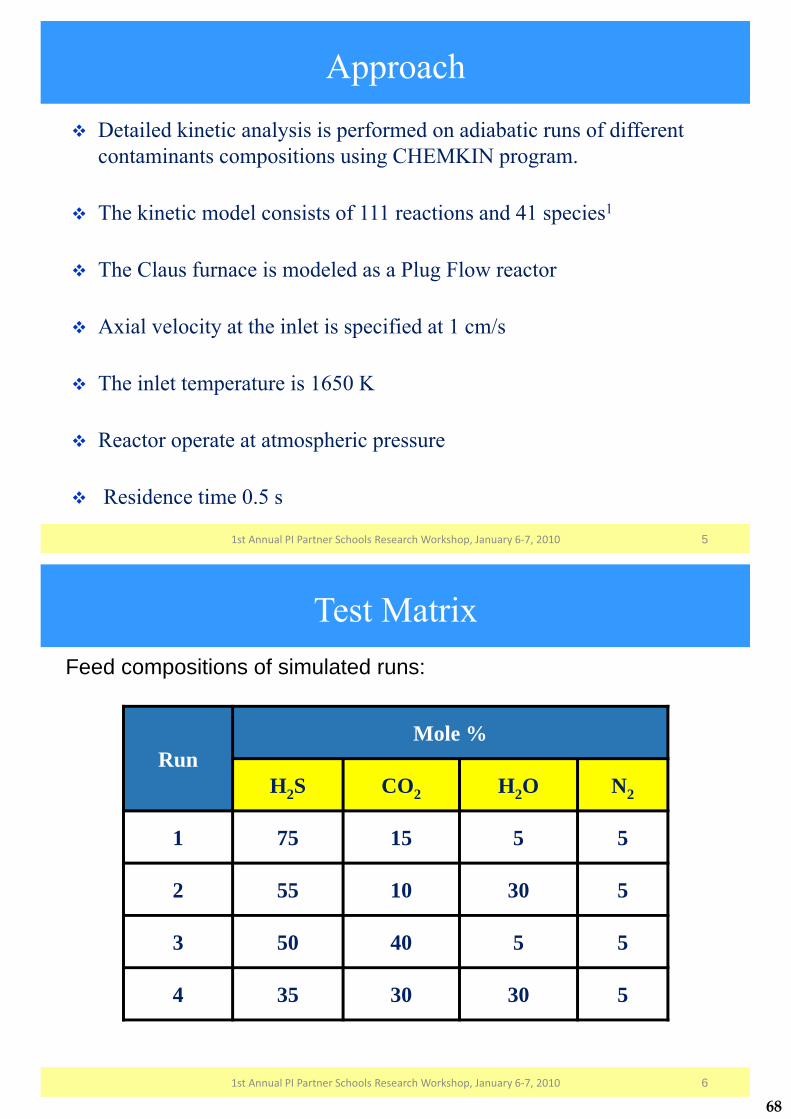
Approach
51st�Annual�PI�Partner�Schools�Research�Workshop,�January�6�7,�2010
� Detailed kinetic analysis is performed on adiabatic runs of different contaminants compositions using CHEMKIN program.
� The kinetic model consists of 111 reactions and 41 species1
� The Claus furnace is modeled as a Plug Flow reactor
� Axial velocity at the inlet is specified at 1 cm/s
� The inlet temperature is 1650 K
� Reactor operate at atmospheric pressure
� Residence time 0.5 s
Test Matrix
RunMole %
H2S CO2 H2O N2
1 75 15 5 5
2 55 10 30 5
3 50 40 5 5
4 35 30 30 5
Feed compositions of simulated runs:
1st�Annual�PI�Partner�Schools�Research�Workshop,�January�6�7,�2010 6
68

Results and Discussions
1st�Annual�PI�Partner�Schools�Research�Workshop,�January�6�7,�2010 7
RunTotal Contaminants Feed Composition
(%)
Exit Composition (%)
S2 SO2
1 20 15.5 13.72 40 13.3 15.43 45 10.9 16.94 60 8.7 17.5
� Sulfur composition decreases by 45% as the contaminants composition increase from 20 to 60 mol %.
� To explain the decrease of S2, analyzing competing reactions to the production of S2 is essential.
Thus, the focus of the analysis will be on pathways which produce byproducts, mainly SO2.
SO2 Production/Consumption profileSO2 composition evolution along the reaction zone
S2
SO2
Mas
s Fr
acti
on
A - B B - C C - DLength of reactor
Run A-B B-C C-D1 + -2 + +3 + - +4 + +
RunMole %
H2S CO2 H2O N2
1 75 15 5 5
2 55 10 30 5
3 50 40 5 5
4 35 30 30 5
SO2 production in each region of the reactor
SO2+H�SO+OH CO2+SO �SO2+CO
Test Matrix
1st�Annual�PI�Partner�Schools�Research�Workshop,�January�6�7,�2010 8
69

OH Effect
� The most significant reaction for dissociation of SO2 is SO2+H�SO+OH
� SO2 dissociation in runs 1 and 3 is more significant compared to that of runs 2 and 4. Thus the excess availability of OH in runs 2 and 4 prevents the dissociation of SO2.
Mas
s Fr
actio
n
Region B-C
Run 2Run 4 Run 1
Run 3
SO2 dissociation for all runs
Run H2O Feed Composition (%) SO2 Production
1 5 -
2 30
3 5 -
4 30
Length of reactor
1st�Annual�PI�Partner�Schools�Research�Workshop,�January�6�7,�2010 9
CO2 Effect
Mas
s Fr
actio
n
Length of reactor
Region C-DSO2 production for runs 1 and 3
Run 1
Run 3
� The comparison is made between run 1 and 3� The most significant reaction for production of SO2 is CO2+SO�SO2+CO� SO2 production in runs 3 is more significant compared to that of run 1. Thus the excess availability of CO2 in runs 3 promotes the production of SO2.
Run CO2 FeedComposition (%) SO2 Production
1 15
3 40 +
1st�Annual�PI�Partner�Schools�Research�Workshop,�January�6�7,�2010 10
70
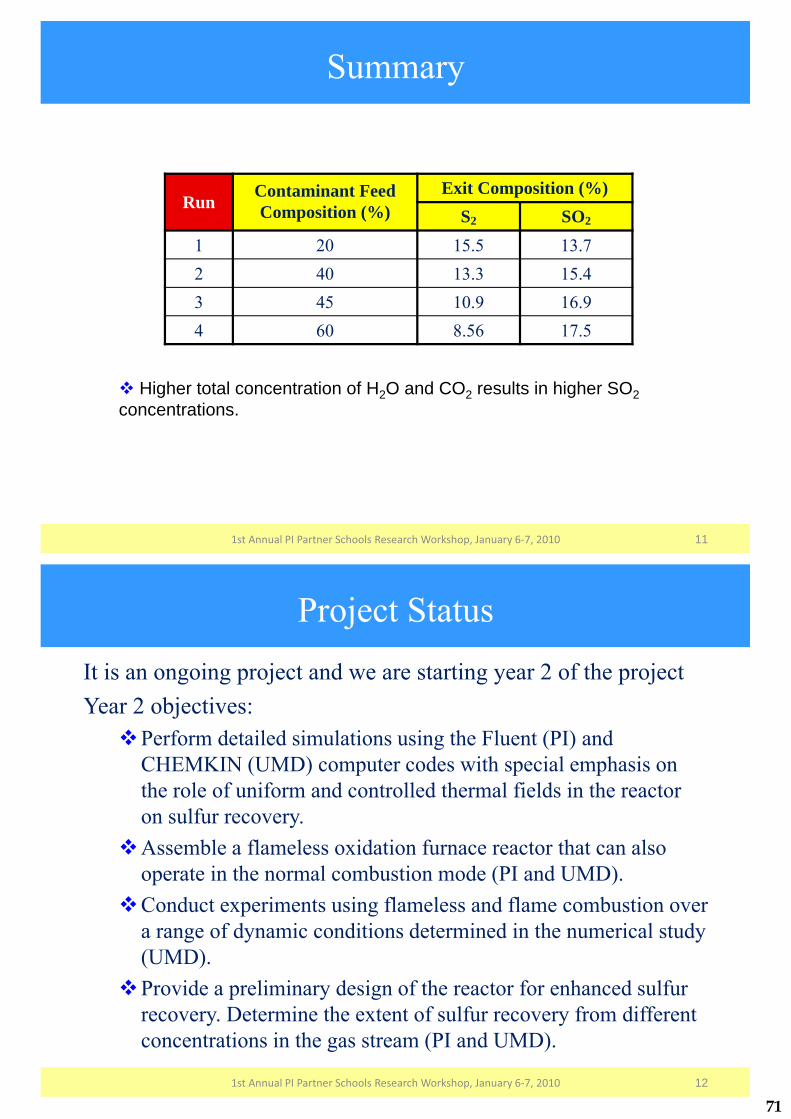
Summary
Run Contaminant Feed Composition (%)
Exit Composition (%)S2 SO2
1 20 15.5 13.72 40 13.3 15.43 45 10.9 16.94 60 8.56 17.5
� Higher total concentration of H2O and CO2 results in higher SO2concentrations.
1st�Annual�PI�Partner�Schools�Research�Workshop,�January�6�7,�2010 11
Project StatusIt is an ongoing project and we are starting year 2 of the projectYear 2 objectives:�Perform detailed simulations using the Fluent (PI) and
CHEMKIN (UMD) computer codes with special emphasis on the role of uniform and controlled thermal fields in the reactor on sulfur recovery.
�Assemble a flameless oxidation furnace reactor that can also operate in the normal combustion mode (PI and UMD).
�Conduct experiments using flameless and flame combustion over a range of dynamic conditions determined in the numerical study (UMD).
�Provide a preliminary design of the reactor for enhanced sulfur recovery. Determine the extent of sulfur recovery from different concentrations in the gas stream (PI and UMD).
1st�Annual�PI�Partner�Schools�Research�Workshop,�January�6�7,�2010 12
71
Conclusions
1st�Annual�PI�Partner�Schools�Research�Workshop,�January�6�7,�2010 13
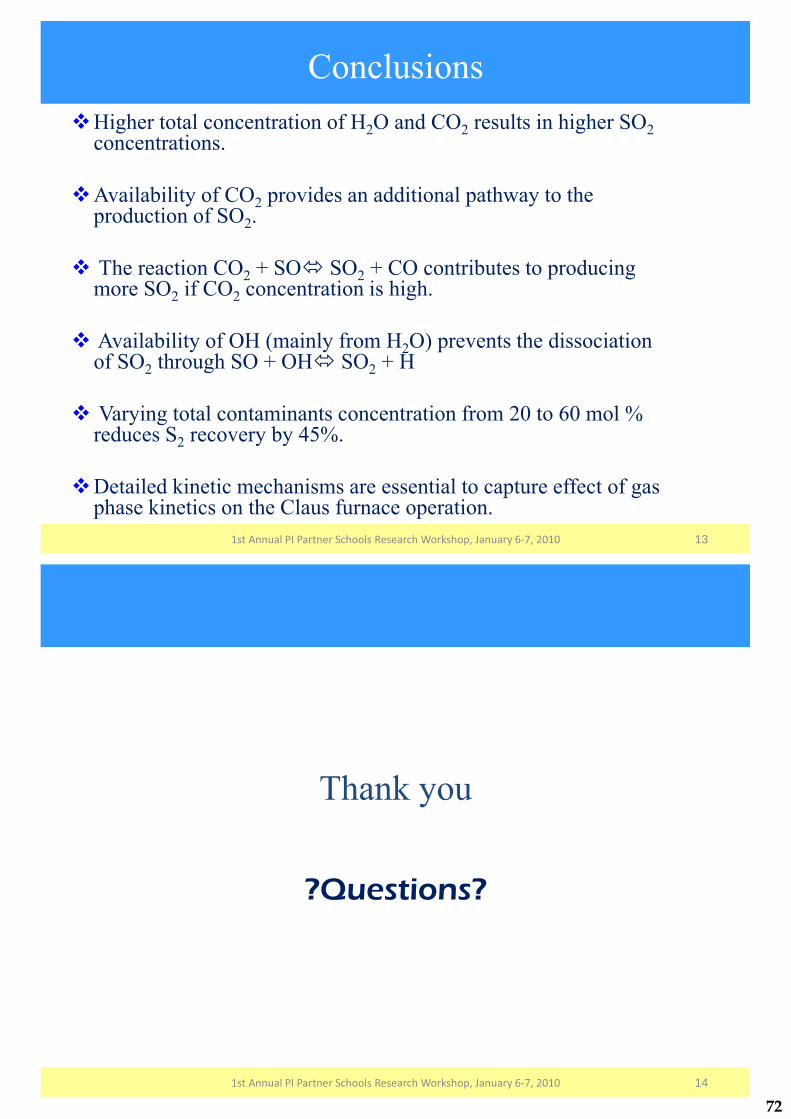
�Higher total concentration of H2O and CO2 results in higher SO2concentrations.
�Availability of CO2 provides an additional pathway to the production of SO2.
� The reaction CO2 + SO� SO2 + CO contributes to producing more SO2 if CO2 concentration is high.
� Availability of OH (mainly from H2O) prevents the dissociation of SO2 through SO + OH� SO2 + H
� Varying total contaminants concentration from 20 to 60 mol % reduces S2 recovery by 45%.
�Detailed kinetic mechanisms are essential to capture effect of gas phase kinetics on the Claus furnace operation.
Thank you
?Questions?
1st�Annual�PI�Partner�Schools�Research�Workshop,�January�6�7,�2010 14
72
Additional Slides
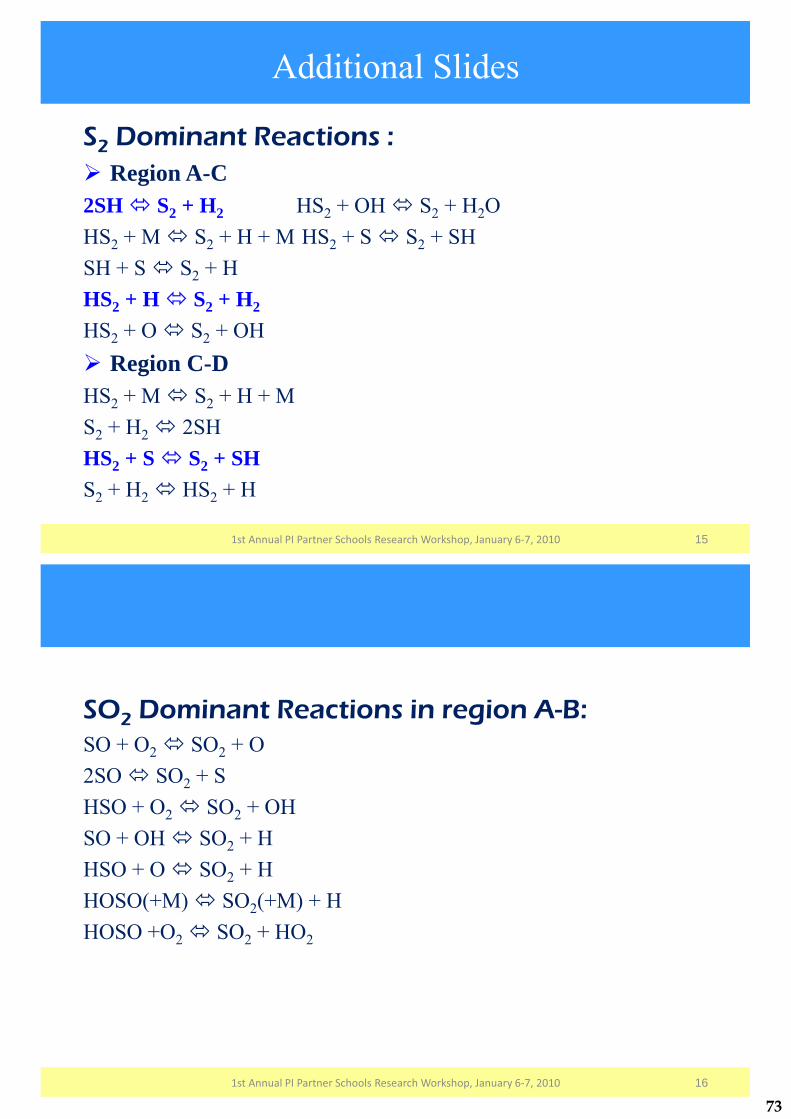
S2 Dominant Reactions :� Region A-C2SH� S2 + H2 HS2 + OH � S2 + H2OHS2 + M � S2 + H + M HS2 + S � S2 + SHSH + S � S2 + HHS2 + H � S2 + H2
HS2 + O � S2 + OH� Region C-DHS2 + M � S2 + H + MS2 + H2� 2SHHS2 + S � S2 + SHS2 + H2� HS2 + H
1st�Annual�PI�Partner�Schools�Research�Workshop,�January�6�7,�2010 15
SO2 Dominant Reactions in region A-B:SO + O2� SO2 + O2SO � SO2 + SHSO + O2� SO2 + OHSO + OH � SO2 + HHSO + O � SO2 + HHOSO(+M) � SO2(+M) + HHOSO +O2� SO2 + HO2
1st�Annual�PI�Partner�Schools�Research�Workshop,�January�6�7,�2010 16
73
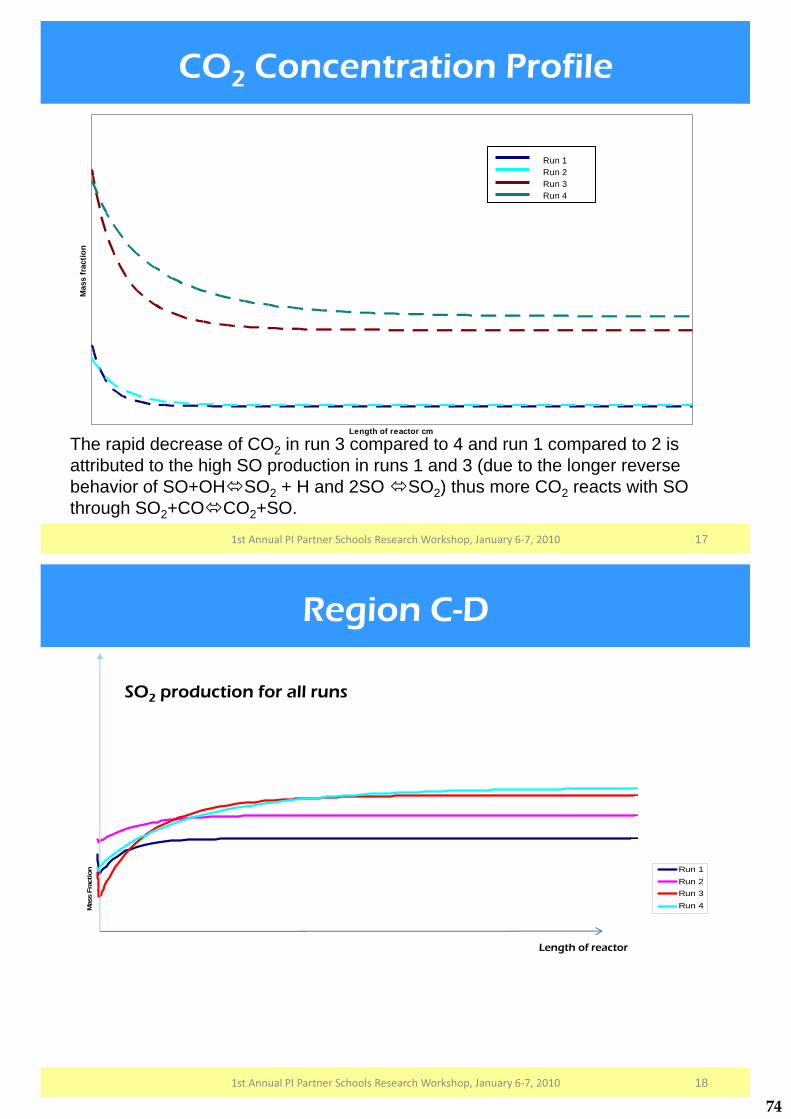
CO2 Concentration Profile
Length of reactor cm
Mas
s fr
actio
n
Run 1Run 2Run 3Run 4
The rapid decrease of CO2 in run 3 compared to 4 and run 1 compared to 2 is attributed to the high SO production in runs 1 and 3 (due to the longer reverse behavior of SO+OH�SO2 + H and 2SO �SO2) thus more CO2 reacts with SO through SO2+CO�CO2+SO.
1st�Annual�PI�Partner�Schools�Research�Workshop,�January�6�7,�2010 17
Region C-D
Mas
s Fr
actio
n Run 1Run 2Run 3Run 4
Length of reactor
SO2 production for all runs
1st�Annual�PI�Partner�Schools�Research�Workshop,�January�6�7,�2010 18
74
CSM�Team:�Jeff�Brown,�PhD�CandidateDr.�M.�Kazemi &�Dr.�E.�Ozkan
PI�Team:�Dr.�Ghedan
PI�Partners PI�Sponsors
1st Annual�PI�Partner�Schools�Research�Workshop
The�Petroleum�Institute,�Abu�Dhabi,�U.A.E.
January�6�7,�2010
Selection�and�Optimization�of�Miscible�and�Immiscible�Displacement�to�Improve�Production�from�Fractured�
Carbonate�Reservoirs�of�Abu�Dhabi�
Dr.�Rick�Sarg (GE)
Dr.�Mike�Batzle(GP)
Dr.�Manika Prasad�(PE)
Dr.�Hossein Kazemi (PE)
Dr.�Ramona�Graves(PE)
Dr.�Erdal Ozkan (PE)
CSM�GEOSCIENCE/ENGINEERING�
TEAM
1st�Annual�PI�Partner�Schools�Research�Workshop,�January�6�7,�2010
75

MISSION
• The research projects reported in the following slides were designed to produce the greatest amount of oil from Zakum field.
• In addition, these projects were designed as part of an educational process for the UAE graduate students studying at CSM, and a means for collaboration and technology transfer to the Petroleum Institute.
1st�Annual�PI�Partner�Schools�Research�Workshop,�January�6�7,�2010
Background
• Thamama 1A Research Program consists ofFIVE CSM/PI projects.
• The research group is an integrated team ofpetroleum engineers, geologists,
petrophysicists, and geophysicists from CSM and PI.
1st�Annual�PI�Partner�Schools�Research�Workshop,�January�6�7,�2010
76

Presentation Outline
• Background• Objectives• Results and Discussions• Project Status• Conclusions and Summary
1st�Annual�PI�Partner�Schools�Research�Workshop,�January�6�7,�2010
Project Objectives
Selection and Optimization of Miscible and Immiscible Displacement to Improve
Production from Fractured Carbonate Reservoirs of Abu Dhabi
(Kazemi, Ozkan, Ghedan)Primary graduate studentJeff Brown, PhD Candidate
“A physically based compositional simulation model for CO2 flooding”
1st�Annual�PI�Partner�Schools�Research�Workshop,�January�6�7,�2010
77

Results and Discussions
• Numerical modeling - computer code being developed for compositional CO2.
• Finalized literature search and methodology. • Working with Aramco’s technology reservoir
modeling team on developing new computer code.
1st�Annual�PI�Partner�Schools�Research�Workshop,�January�6�7,�2010
Project Status
• Code is being developed.• Simulations cases are being developed.
1st�Annual�PI�Partner�Schools�Research�Workshop,�January�6�7,�2010
78
Project Objectives
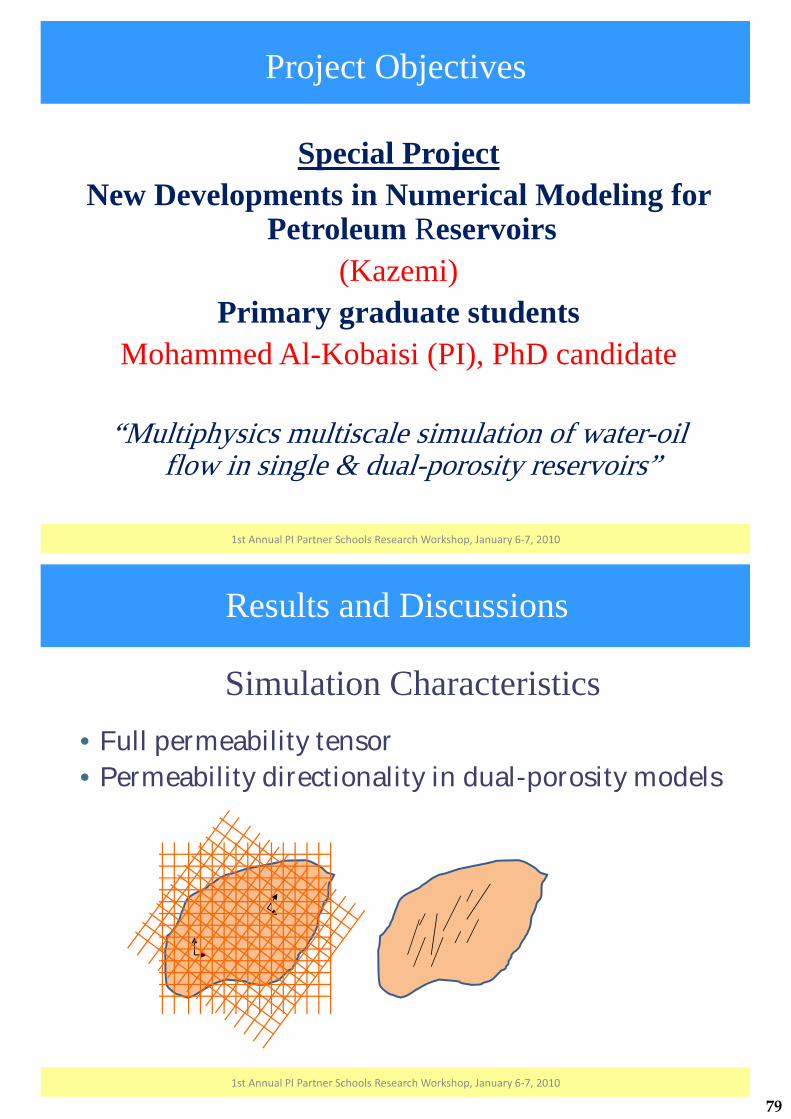
Special ProjectNew Developments in Numerical Modeling for
Petroleum Reservoirs(Kazemi)
Primary graduate studentsMohammed Al-Kobaisi (PI), PhD candidate
“Multiphysics multiscale simulation of water-oil flow in single & dual-porosity reservoirs”
1st�Annual�PI�Partner�Schools�Research�Workshop,�January�6�7,�2010
Simulation Characteristics • Full permeability tensor• Permeability directionality in dual-porosity models
Results and Discussions
1st�Annual�PI�Partner�Schools�Research�Workshop,�January�6�7,�2010
79

Finite-Difference : K� Approach
9-point Cartesian pebi grid
2 2
max min
1 cos sink k k�
� �� �
Results and Discussions
1st�Annual�PI�Partner�Schools�Research�Workshop,�January�6�7,�2010
p equation
u equation
v equation
Results and Discussions
Control Volume Mixed Finite-Element
1st�Annual�PI�Partner�Schools�Research�Workshop,�January�6�7,�2010
80

Incident Matrices
Results and Discussions
1st�Annual�PI�Partner�Schools�Research�Workshop,�January�6�7,�2010
kmaxkmin
Waterflood in�a�homogeneous�anisotropic�reservoir:�kmax=1000�md,�kmin=10�md
FD�K� CVMFEM
Results and Discussions
1st�Annual�PI�Partner�Schools�Research�Workshop,�January�6�7,�2010
81
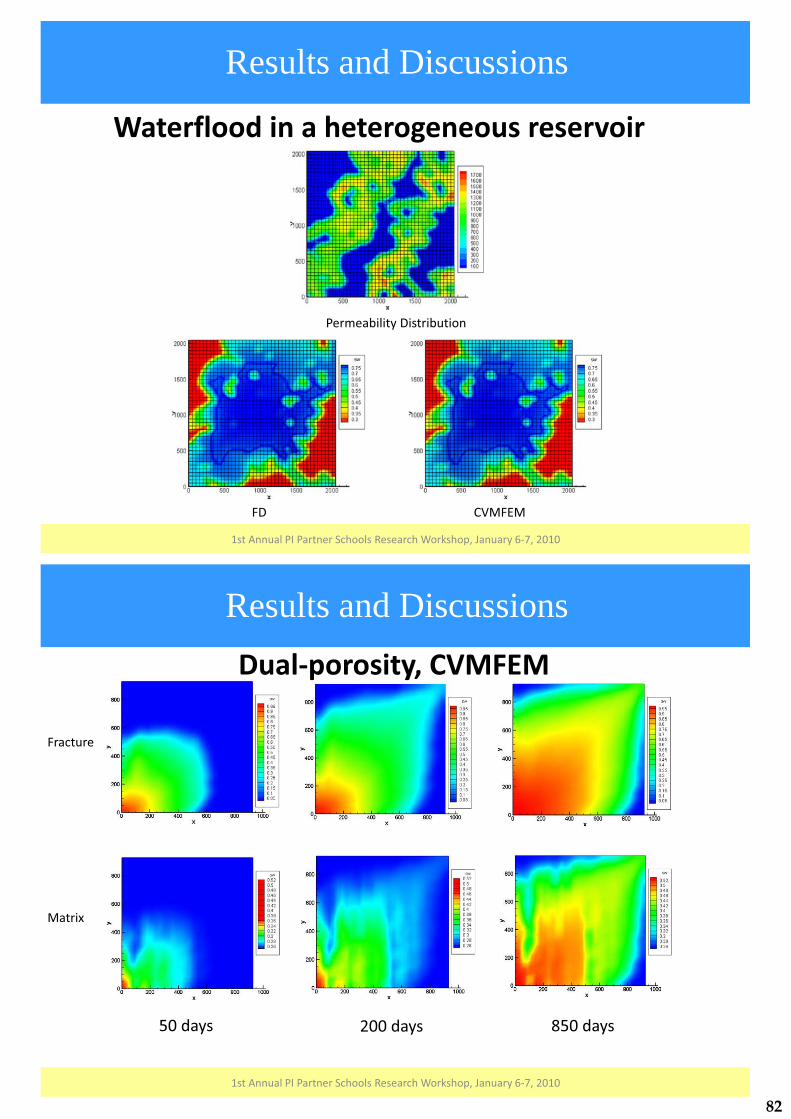
Waterflood in�a�heterogeneous�reservoir
Permeability�Distribution
FD CVMFEM
Results and Discussions
1st�Annual�PI�Partner�Schools�Research�Workshop,�January�6�7,�2010
50�days 200�days 850�days
Dual�porosity,�CVMFEM
Matrix
Fracture
Results and Discussions
1st�Annual�PI�Partner�Schools�Research�Workshop,�January�6�7,�2010
82
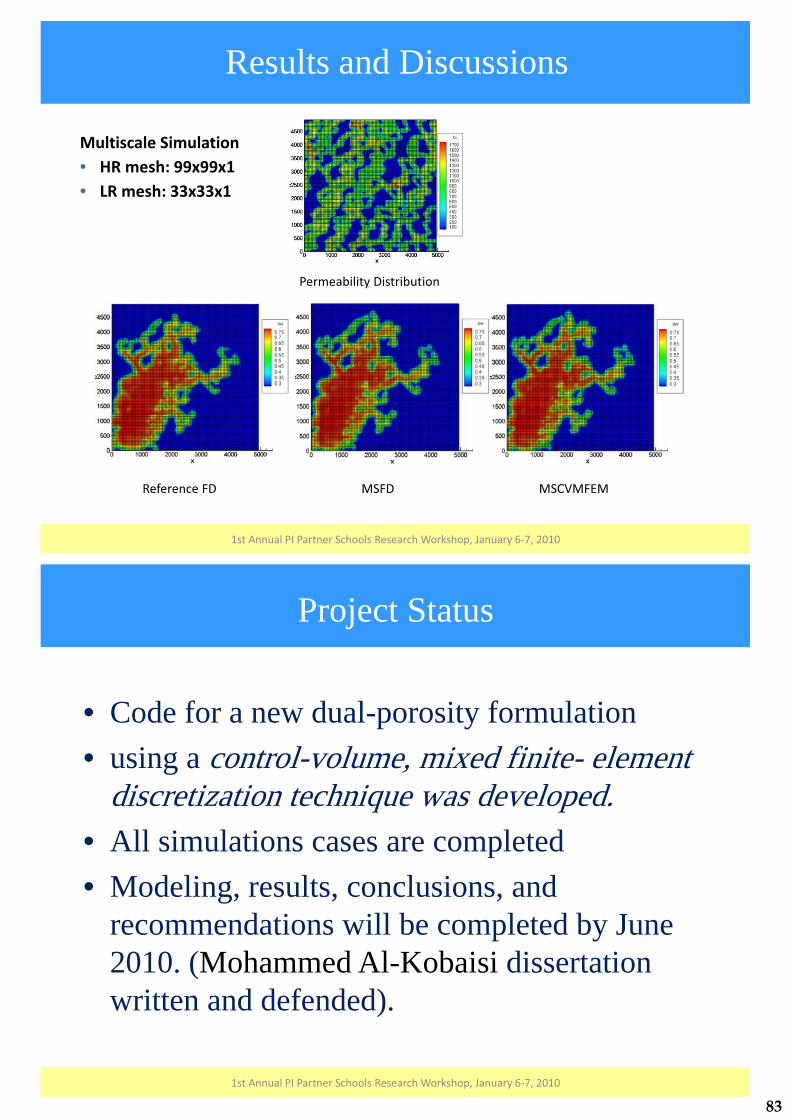
Multiscale�Simulation• HR�mesh:�99x99x1• LR�mesh:�33x33x1
Permeability�Distribution
Reference�FD� MSFD� MSCVMFEM�
Results and Discussions
1st�Annual�PI�Partner�Schools�Research�Workshop,�January�6�7,�2010
Project Status
• Code for a new dual-porosity formulation• using a control-volume, mixed finite- element
discretization technique was developed.• All simulations cases are completed• Modeling, results, conclusions, and
recommendations will be completed by June 2010. (Mohammed Al-Kobaisi dissertationwritten and defended).
1st�Annual�PI�Partner�Schools�Research�Workshop,�January�6�7,�2010
83

Conclusions and Summary
The formulation is unique in the sense that it is capable of accurately computing flow at two scales —one at the fracture-matrix scale, and the second at the reservoir interwell scale. The computing requirement for this mixed finite-element technique is much greater than in an analogous control-volume finite-difference formulation using directional permeability concept to account for the permeability tensor anisotropy.
1st�Annual�PI�Partner�Schools�Research�Workshop,�January�6�7,�2010 19
84
UMD�Team:�Prof.�Greg�Jackson,�Prof.�Bryan�Eichhorn,�Siddharth�Patel, and�Lei�Wang�
PI�Team: Prof.�Ali�Almansoori�and�Ahmed�Nafees
PI�Partners PI�Sponsors
1st Annual�PI�Partner�Schools�Research�Workshop
The�Petroleum�Institute,�Abu�Dhabi,�U.A.E.
January�6�7, 2010
Solid�Oxide�Fuel�Cells�for�CO2 Capture�and�Enhanced�Oil�Recovery
Presentation Outline
• Background• Objectives• Experimental Setup• Results and Discussions• Project Status• Conclusions and Summary
21st�Annual�PI�Partner�Schools�Research�Workshop,�January�6�7,�2010
85

Background• Solid oxide fuel cells (SOFCs) can produce
concentrated CO2/H2O in anode exhaust – Potential integration of carbon capture in large
stationary plants• Can SOFCs be developed for operating on
hydrocarbon off-gases from petroleum processing for CO2 capture and/or EOR?
• Current commercial SOFCs employ porous Ni/YSZ anodes which can provide steam reforming of carbon-based fuels– Carbonaceous and sulfur-containing fuels in Ni/YSZ
anodes can lead to carbon deposition and/or irreversible loss in performance
• Ceria (CeO2)-based anodes have potential to minimize carbon deposition and to operate stably with some sulfur in fuels (Gorte et al.)
• Can CeO2-based SOFC anodes and SOFC stacks be developed for applications in petroleum processing for off-gas utilization?
31st�Annual�PI�Partner�Schools�Research�Workshop,�January�6�7,�2010
from Kee, Zhu, Sukeshini, and Jackson 2008
Project Objectives
• Establish single-cell SOFC performance to enhance and validate existing single-cell SOFC models to incorporate the effects of hydrocarbon composition and H2S on SOFC performance.
• Translate single cell models to full stack evaluations in higher dimensions and incorporate into process-level plant models.
• Explore the impact of petroleum off-gas composition (direct hydrocarbon feeds vs. externally reformed feeds) and contaminants (H2S and HCl) on SOFC performance/design.
• Evaluate the effectiveness of SOFC’s for capturing energy from petroleum gases and for providing a means for possible CO2capture within a plant context.
• Garner interest from ADNOC partners to explore with the team possible design and challenges for a future SOFC systems operating on relevant petroleum gas streams.
41st�Annual�PI�Partner�Schools�Research�Workshop,�January�6�7,�2010
86
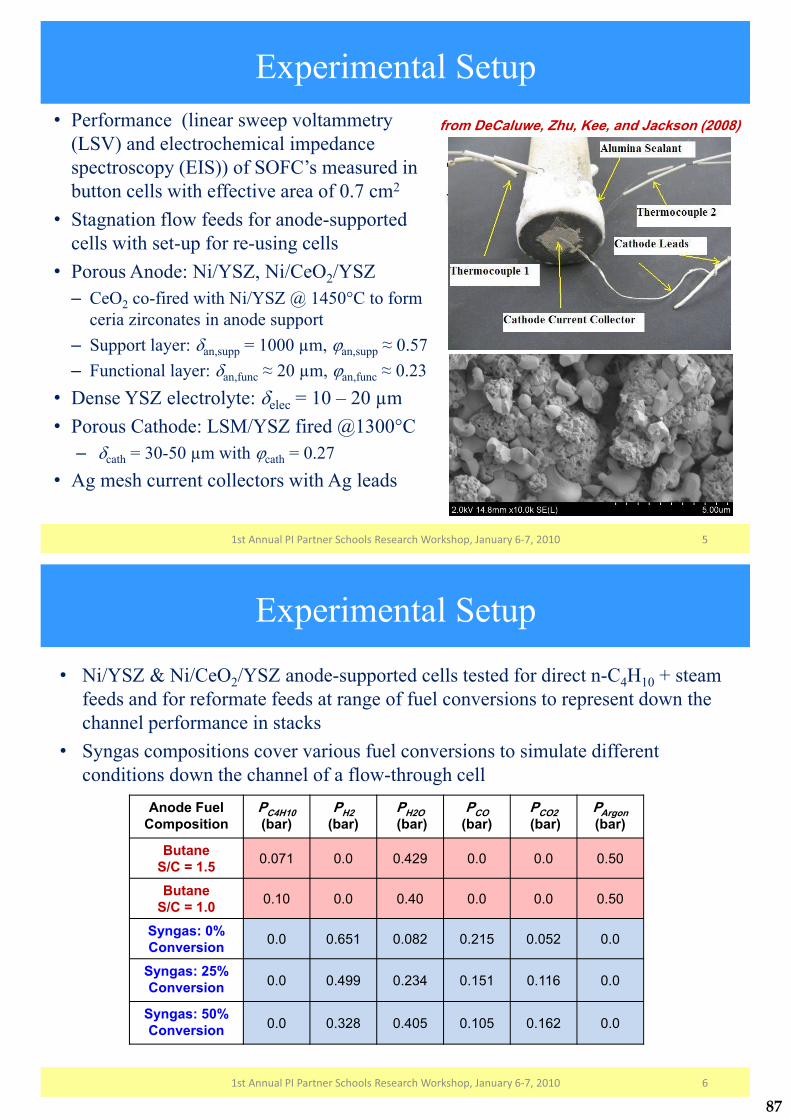
Experimental Setup• Performance (linear sweep voltammetry
(LSV) and electrochemical impedance spectroscopy (EIS)) of SOFC’s measured in button cells with effective area of 0.7 cm2
• Stagnation flow feeds for anode-supported cells with set-up for re-using cells
• Porous Anode: Ni/YSZ, Ni/CeO2/YSZ– CeO2 co-fired with Ni/YSZ @ 1450°C to form
ceria zirconates in anode support– Support layer: �an,supp = 1000 μm, �an,supp � 0.57– Functional layer: �an,func � 20 μm, �an,func � 0.23
• Dense YSZ electrolyte: �elec = 10 – 20 μm• Porous Cathode: LSM/YSZ fired @1300°C
– �cath = 30-50 μm with �cath = 0.27• Ag mesh current collectors with Ag leads
1st�Annual�PI�Partner�Schools�Research�Workshop,�January�6�7,�2010
from DeCaluwe, Zhu, Kee, and Jackson (2008)
CathodeElectrolyte
Anode Funct. Layer
Anode Support Layer
5
Experimental Setup
• Ni/YSZ & Ni/CeO2/YSZ anode-supported cells tested for direct n-C4H10 + steam feeds and for reformate feeds at range of fuel conversions to represent down the channel performance in stacks
• Syngas compositions cover various fuel conversions to simulate different conditions down the channel of a flow-through cell
1st�Annual�PI�Partner�Schools�Research�Workshop,�January�6�7,�2010
Anode Fuel Composition
PC4H10(bar)
PH2(bar)
PH2O(bar)
PCO(bar)
PCO2(bar)
PArgon(bar)
Butane S/C = 1.5 0.071 0.0 0.429 0.0 0.0 0.50
Butane S/C = 1.0 0.10 0.0 0.40 0.0 0.0 0.50
Syngas: 0% Conversion 0.0 0.651 0.082 0.215 0.052 0.0
Syngas: 25% Conversion 0.0 0.499 0.234 0.151 0.116 0.0
Syngas: 50% Conversion 0.0 0.328 0.405 0.105 0.162 0.0
6
87

Material Characterization: Ni/CeO2/YSZ Anodes• Formation of NiO due to leakage through electrolyte pinholes leading to
irreversible cracking at high current densities (Menzler et al. 2007)• Cerium zirconates (likely Ce2Zr2O7) has thermo-mechanical stability in in redox
cycles at temperatures in excess of 800 K (Trovarelli, 2002)• XRD reveals formation of cerium zirconates in the anode after sintering• Ceria addition reduces carbon buildup and cracking with hydrocarbon feeds
CeO
2
ZrO
2
CexZ
r yO2
NiON
iO
NiO
NiO
NiO
CexZ
r yO2
CexZ
r yO2
CexZ
r yO2
CeO
2
ZrO
2XRD of Ni/CeO2/YSZ co-fired anodes
Ni/CeO2/YSZ Ni/YSZ
Images of button cell anodes after testing for days with C4H10/H2O feeds
1st�Annual�PI�Partner�Schools�Research�Workshop,�January�6�7,�2010 7
Electrochemical Characterization• Linear sweep voltammetry (LSV) used to compare anodes to assess impact of
ceria addition on cell performance– Initial testing of cells with 97% H2/3% H2O anode feeds followed by testing in syngas and then
longer-term testing with direct C4H10/H2O feeds– Evaluation of cathode and electrolyte overpotentials (�) to isotate �anode due to carbonaceous feeds.
• Electrochemical impedance spectroscopy (EIS) shows impact of anodes and fuels– Low frequency process (associated with anode transport grows significantly with C4H10/H2O feeds
1st�Annual�PI�Partner�Schools�Research�Workshop,�January�6�7,�2010 8
Electrochemical impedance spectra at 100 mV total cell overpotential for
different anode/fuel compositionsTcell = 800 °CSyngas @ 0% conv.
Linear sweep voltammetry for Ni/YSZ and Ni/CeO2/YSZ anodes
V @ 0 A � OCV�tot
Rbulk Rpolarization
88
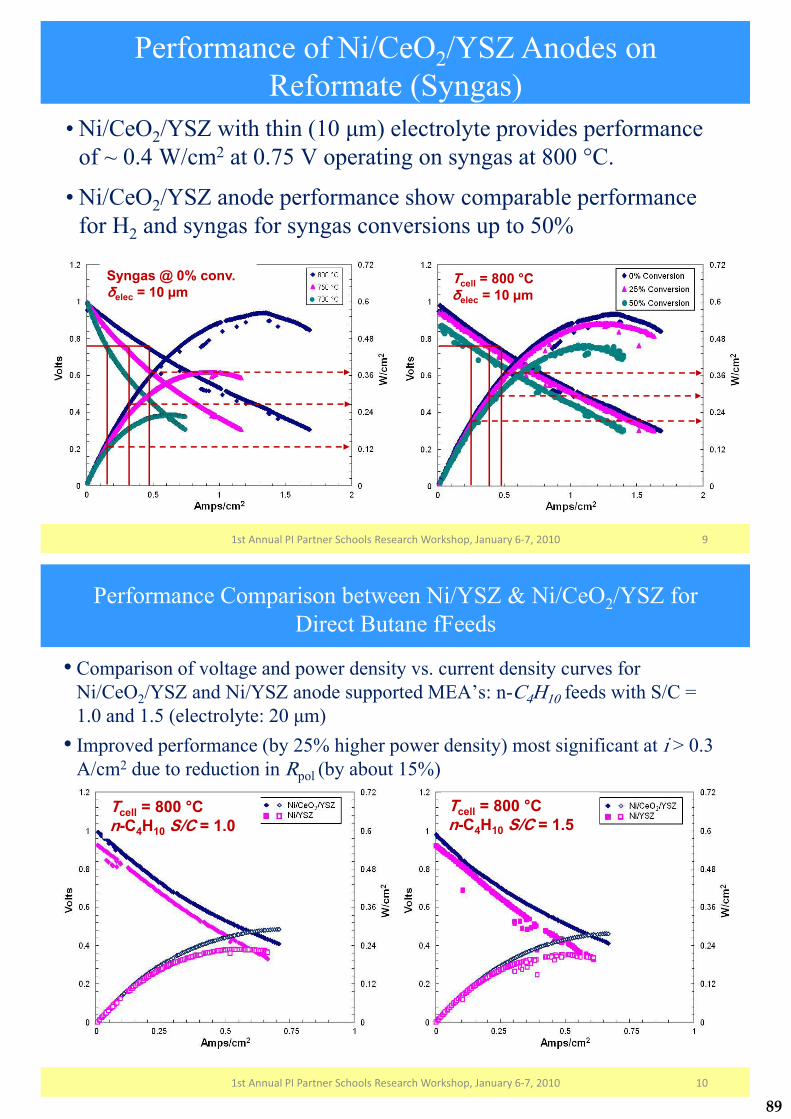
Performance of Ni/CeO2/YSZ Anodes on Reformate (Syngas)
• Ni/CeO2/YSZ with thin (10 �m) electrolyte provides performance of ~ 0.4 W/cm2 at 0.75 V operating on syngas at 800 °C.
• Ni/CeO2/YSZ anode performance show comparable performance for H2 and syngas for syngas conversions up to 50%
Syngas @ 0% conv.�elec = 10 μm
Tcell = 800 °C�elec = 10 μm
1st�Annual�PI�Partner�Schools�Research�Workshop,�January�6�7,�2010 9
Performance Comparison between Ni/YSZ & Ni/CeO2/YSZ for Direct Butane fFeeds
• Comparison of voltage and power density vs. current density curves for Ni/CeO2/YSZ and Ni/YSZ anode supported MEA’s: n-C4H10 feeds with S/C = 1.0 and 1.5 (electrolyte: 20 �m)
• Improved performance (by 25% higher power density) most significant at i > 0.3 A/cm2 due to reduction in Rpol (by about 15%)
Tcell = 800 °Cn-C4H10 S/C = 1.0
Tcell = 800 °Cn-C4H10 S/C = 1.5
1st�Annual�PI�Partner�Schools�Research�Workshop,�January�6�7,�2010 10
89

Stability of Ni/CeO2/YSZ Operating with Butane
• Direct C4H10 feeds doubles area-specific polarization resistance relative to H2 feeds• With �elec = 20 �m, stable ASR for operation with direct C4H10 feeds at total
overpotential (0.1-0.3 V) continuously for up to 6 days
97% H2, 3% H2O
0.5
0
0.5
1
1.5
Z" (O
hms*
cm2 )
Z' (Ohms*cm2)
�tot 0.0 V0.1 V0.3 V
0 0.5 1 1.5 2 2.5 3 3.5 4
C4H 10: S/C = 1.5Day 2
0.5
0
0.5
1
1.5
Z" (O
hms*
cm2 )
Z' (Ohms*cm2)
�tot 0.0 V0.1 V0.3 V
0 0.5 1 1.5 2 2.5 3 3.5 4
C4H 10: S/C = 1.5Day 4
0.5
0
0.5
1
1.5
Z" (O
hms*
cm2 )
Z' (Ohms*cm2)
�tot 0.0 V0.1 V0.3 V
0 0.5 1 1.5 2 2.5 3 3.5 4
C4H 10: S/C = 1.5Day 6
0.5
0
0.5
1
1.5
Z" (O
hms*
cm2 )
Z' (Ohms*cm2)
�tot 0.0 V0.1 V0.3 V
0 0.5 1 1.5 2 2.5 3 3.5 4
1st�Annual�PI�Partner�Schools�Research�Workshop,�January�6�7,�2010 11
Stability of Ni/CeO2/YSZ Operating with Butane
• Ex-situ Raman spectroscopy on Ni/YSZ & Ni/CeO2/YSZ anode cross sections after multiple days of operating on direct C4H10 feeds at 3 locations� Peak intensities are relative to NiO at 1122.5 cm-1
• Graphite growth suppressed for Ni/CeO2/YSZ at ‘top’ surface layer to the functional layerp y y
Ni/YSZ
Anode Surface
YSZ
NiO
Graphite “G”
Graphite “D”
Ni/CeO2/YSZ
Anode Surface
YSZNiO
Graphite “D”
Graphite “G”
1st�Annual�PI�Partner�Schools�Research�Workshop,�January�6�7,�2010
CathodeElectrolyte
Anode Func. Layer
Anode Support Layer
12
90
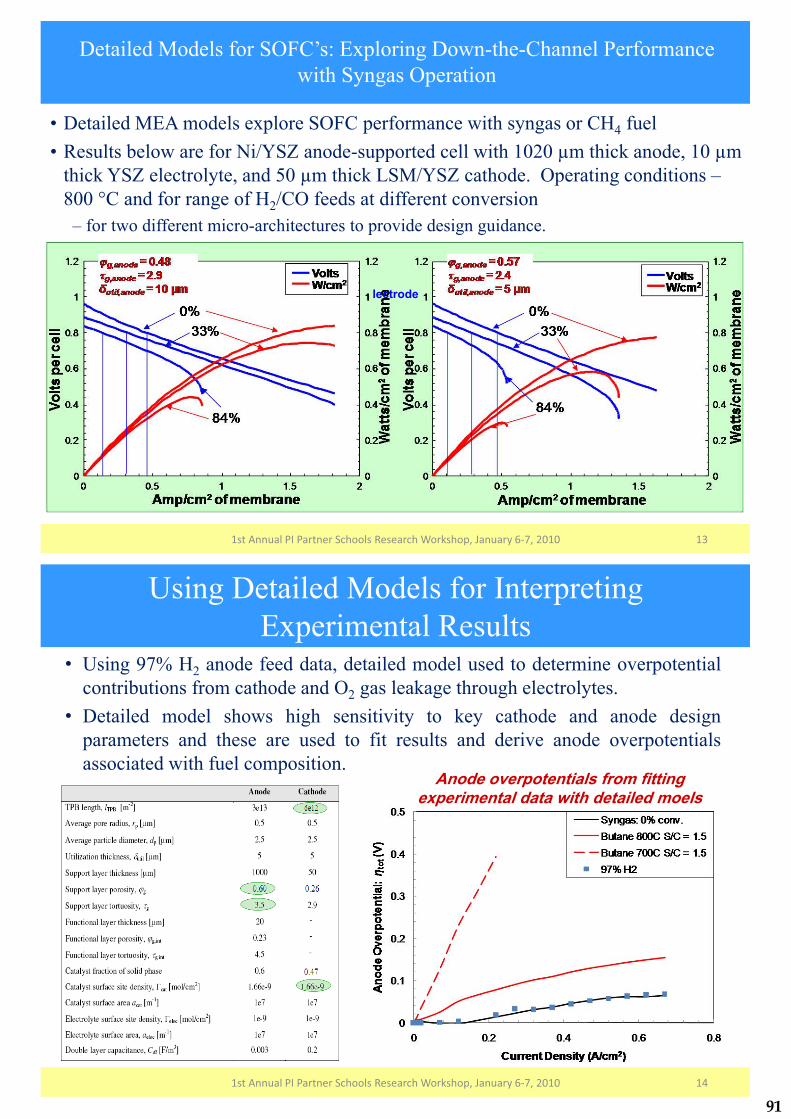
Detailed Models for SOFC’s: Exploring Down-the-Channel Performance with Syngas Operation
• Detailed MEA models explore SOFC performance with syngas or CH4 fuel• Results below are for Ni/YSZ anode-supported cell with 1020 μm thick anode, 10 μm
thick YSZ electrolyte, and 50 μm thick LSM/YSZ cathode. Operating conditions –800 °C and for range of H2/CO feeds at different conversion– for two different micro-architectures to provide design guidance.
lectrode
1st�Annual�PI�Partner�Schools�Research�Workshop,�January�6�7,�2010 13
Using Detailed Models for Interpreting Experimental Results
• Using 97% H2 anode feed data, detailed model used to determine overpotentialcontributions from cathode and O2 gas leakage through electrolytes.
• Detailed model shows high sensitivity to key cathode and anode designparameters and these are used to fit results and derive anode overpotentialsassociated with fuel composition.
1st�Annual�PI�Partner�Schools�Research�Workshop,�January�6�7,�2010 14
Anode overpotentials from fitting experimental data with detailed moels
91
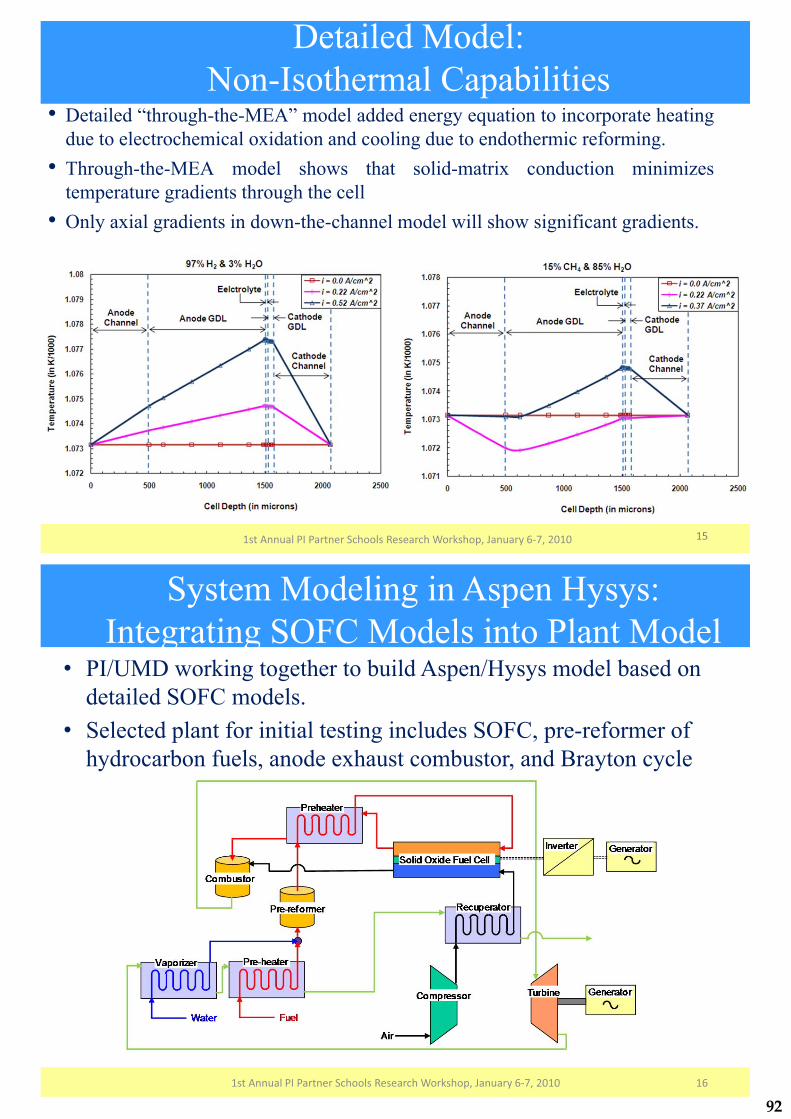
Detailed Model:Non-Isothermal Capabilities
• Detailed “through-the-MEA” model added energy equation to incorporate heatingdue to electrochemical oxidation and cooling due to endothermic reforming.
• Through-the-MEA model shows that solid-matrix conduction minimizestemperature gradients through the cell
• Only axial gradients in down-the-channel model will show significant gradients.
1st�Annual�PI�Partner�Schools�Research�Workshop,�January�6�7,�2010 15
System Modeling in Aspen Hysys:Integrating SOFC Models into Plant Model
• PI/UMD working together to build Aspen/Hysys model based on detailed SOFC models.
• Selected plant for initial testing includes SOFC, pre-reformer of hydrocarbon fuels, anode exhaust combustor, and Brayton cycle
1st�Annual�PI�Partner�Schools�Research�Workshop,�January�6�7,�2010 16
92
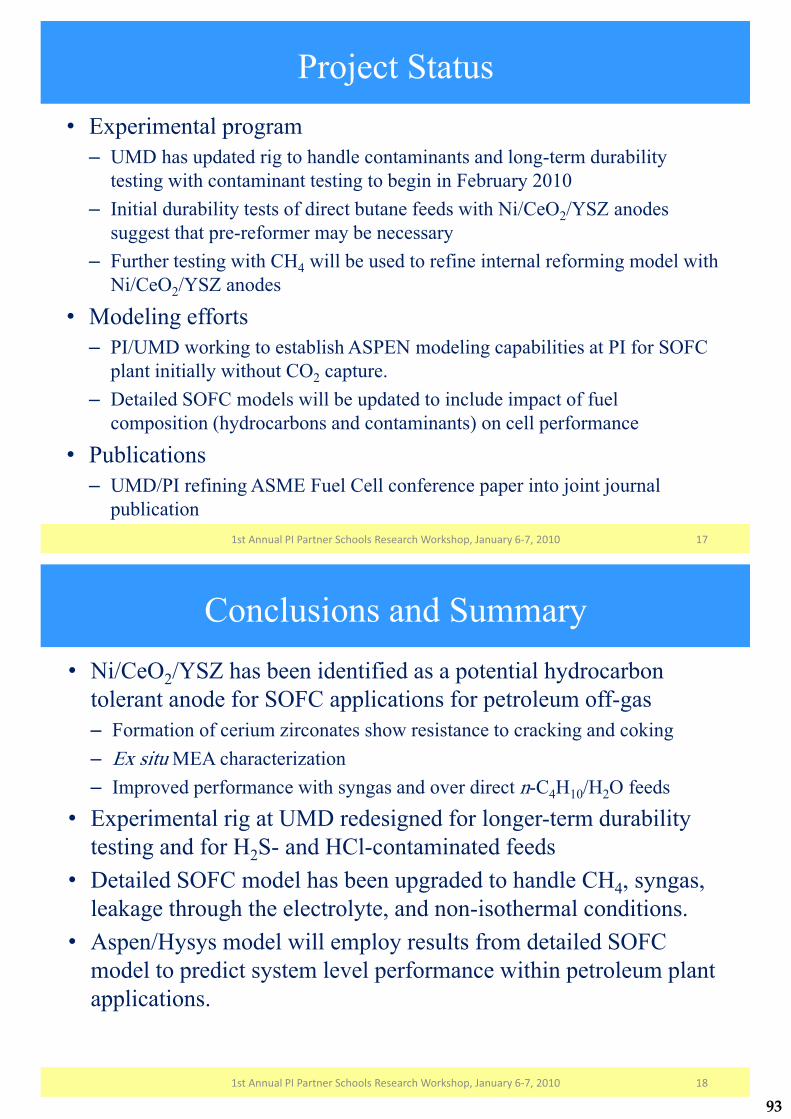
Project Status• Experimental program
– UMD has updated rig to handle contaminants and long-term durability testing with contaminant testing to begin in February 2010
– Initial durability tests of direct butane feeds with Ni/CeO2/YSZ anodes suggest that pre-reformer may be necessary
– Further testing with CH4 will be used to refine internal reforming model with Ni/CeO2/YSZ anodes
• Modeling efforts– PI/UMD working to establish ASPEN modeling capabilities at PI for SOFC
plant initially without CO2 capture.– Detailed SOFC models will be updated to include impact of fuel
composition (hydrocarbons and contaminants) on cell performance
• Publications– UMD/PI refining ASME Fuel Cell conference paper into joint journal
publication1st�Annual�PI�Partner�Schools�Research�Workshop,�January�6�7,�2010 17
Conclusions and Summary• Ni/CeO2/YSZ has been identified as a potential hydrocarbon
tolerant anode for SOFC applications for petroleum off-gas– Formation of cerium zirconates show resistance to cracking and coking– Ex situ MEA characterization – Improved performance with syngas and over direct n-C4H10/H2O feeds
• Experimental rig at UMD redesigned for longer-term durability testing and for H2S- and HCl-contaminated feeds
• Detailed SOFC model has been upgraded to handle CH4, syngas, leakage through the electrolyte, and non-isothermal conditions.
• Aspen/Hysys model will employ results from detailed SOFC model to predict system level performance within petroleum plant applications.
1st�Annual�PI�Partner�Schools�Research�Workshop,�January�6�7,�2010 18
93

Process Intensification and Advanced Heat / Mass Transfer
94

Multidisciplinary�Design�and�Characterization�of�Polymer�Composite�Seawater�Heat�Exchanger�Module
UMD�Team:�Avram�Bar�Cohen,�David�Bigio,�Hugh�Bruck,�S.K.�G J C ll Ti H ll P i k L k Willi
y p g
Gupta,�Juan�Cevallos,�Tim�Hall,�Patrick�Luckow,�William�Pappas,�and�Frank�Robinson�
PI Team: Peter Rodgers and Mohammad ChowdhuryPI�Team:�Peter�Rodgers�and�Mohammad�Chowdhury
1st Annual�PI�Partner�Schools�Research�Workshop
The�Petroleum�Institute,�Abu�Dhabi,�U.A.E.
January�6�7,�2010
PI�Partners PI�Sponsors
Presentation Outline
• IntroductionIntroduction • Task #1: Study thermal characteristics of polymer
composite HXcomposite HX • Task #2: Study manufacturability of injection molded
l it HXpolymer composite HX• Task #3: Study seawater effects on structural properties
of polymer composite HX• Task #4: Create and experimentally characterize a large p y g
polymer composite HX module • ConclusionsConclusions
21st�Annual�PI�Partner�Schools�Research�Workshop,�January�6�7,�20101st�Annual�PI�Partner�Schools�Research�Workshop,�January�6�7,�2010 2
95

Motivation• Heat exchangers in seawater applications
require use of exotic metals due torequire use of exotic metals due to corrosion, scaling, and biofouling concerns
– Usually Titanium alloys (Thermal conductivity around 20 W/m-K) Company Resin
ThermalCond.(W/m K)around 20 W/m K)
– Require frequent maintenance due to scaling problems
• Advances in polymer composites have resulted
Company Resin (W/m-K)Cool Polymers PPS 20
S bi SAdvances in polymer composites have resulted in polymers with high thermal conductivities
• The cost of polymer heat exchangers and the energy investment in fabrication are expected to
Sabic IP PPS 7
PolyOne PPS 10-11
PolyOne LCP 18-20energy investment in fabrication are expected to be considerably lower than their metal counterparts
• Polymer heat exchangers can be used in
PolyOne PA 12 10
RTP LCP 18
O tiPolymer heat exchangers can be used in seawater applications
• Designing long lasting cost effective polymer heat exchangers presents many new challenges
OvationPolymers PC 6.10
heat exchangers presents many new challenges
1st�Annual�PI�Partner�Schools�Research�Workshop,�January�6�7,�2010 3
Goal
D l t ti h• Develop a systematic approach for designing polymer heat
h th t t f
SystemRequirements
exchangers that accounts for all life cycle considerations:
Th l P f
Design Tool for PolymerHeat Exchangers
– Thermal Performance– Structural Performance– Manufacturability– Life Cycle Cost
( M f t i I t ll ti Polymer(e.g., Manufacturing, Installation, Operation, Maintenance)
PolymerHeat Exchanger
with Optimal Geometry
and Materialand Material
1st�Annual�PI�Partner�Schools�Research�Workshop,�January�6�7,�2010 4
96

Approach
Moldability Heat Transfer StructuralMoldabilityAnalysis
Heat TransferAnalysis
StructuralAnalysis
Parametric Material
Integrated Product/Process Design Tool for Polymer
Basis Shape Library
Material Library
Tool for PolymerHeat Exchangers
Heat Transfer Enhancement
Feature Library
Strength Enhancement
Feature LibraryFeature Library Feature LibrarySystem
RequirementsPolymer
Heat Exchanger ith O ti lwith Optimal Geometry
and Material
Designer
1st�Annual�PI�Partner�Schools�Research�Workshop,�January�6�7,�2010 5
Task #1: Study thermal characteristics of l it HXpolymer composite HX
1st�Annual�PI�Partner�Schools�Research�Workshop,�January�6�7,�2010 6
97

Background
• Mechanical and thermal 45
properties of fiber-filled composites can be highly
30
35
40
Parallel
anisotropic• Fiber orientation in a part 20
25
30
c(W
/m�K) Perpendicular
varies spatially depending on molding parameters 10
15
k c
• Thermal conductivity of a composite varies according 0
5
0 0.1 0.2 0.3 0.4 0.5 0.6 0.7 0.8
to orientation, leading to anisotropy
Volume�fraction��2
Uniaxially oriented fibers (Nielsen model 2002)k2 = 700 W/mK, k1 = 0.25 W/mK, �m=0.82
1st�Annual�PI�Partner�Schools�Research�Workshop,�January�6�7,�2010 71st�Annual�PI�Partner�Schools�Research�Workshop,�January�6�7,�2010 7
Task Objectives
• Study thermal characteristics of polymer-composite geometries through an integrated p g g gmolding-heat transfer modeling methodology
• Investigate the effect of fiber orientation on• Investigate the effect of fiber orientation on thermal conductivity
• Study the differences in heat transfer performance of anisotropic and isotropicperformance of anisotropic and isotropic materials in a representative heat exchanger geometrygeometry
81st�Annual�PI�Partner�Schools�Research�Workshop,�January�6�7,�20101st�Annual�PI�Partner�Schools�Research�Workshop,�January�6�7,�2010 8
98

Approach
• Numerical predictions of the fiber orientation in a representativeorientation in a representative geometry were obtained using a popular injection-molding software (M ldfl ®) b d h F l
5�mm
(Moldflow®) based on the Folgar-Tucker model
• These predictions are used, via the
50�mm
1
0.75p ,classic Nielsen model, to determine the anisotropic variation of thermal conductivity in the fin
0.5
0.25conductivity in the fin• Thermal simulations are then
performed to determine the effect of b th l b l d l l th l Flow Direction
0.25
0
both global and local thermal anisotropy on the temperature distribution and heat transfer rate of
Flow�Direction
Axx Fiber orientation in the x-direction (across the fin thickness)
Material used in study: Nylon 12 filled with the fin
1st�Annual�PI�Partner�Schools�Research�Workshop,�January�6�7,�2010 9
y ycarob fibers
1st�Annual�PI�Partner�Schools�Research�Workshop,�January�6�7,�2010 9
Results: Converting Fiber Orientation Tensors to Thermal ConductivityThermal Conductivity
Orientation tensor values inOrientation tensor values in x and y directions
(as predicted by Moldflow®)Anisotropic thermal conductivity values
Using Nielsen’s equations for
thermalthermal conductivity of
composites
1st�Annual�PI�Partner�Schools�Research�Workshop,�January�6�7,�2010 101st�Annual�PI�Partner�Schools�Research�Workshop,�January�6�7,�2010 10
99
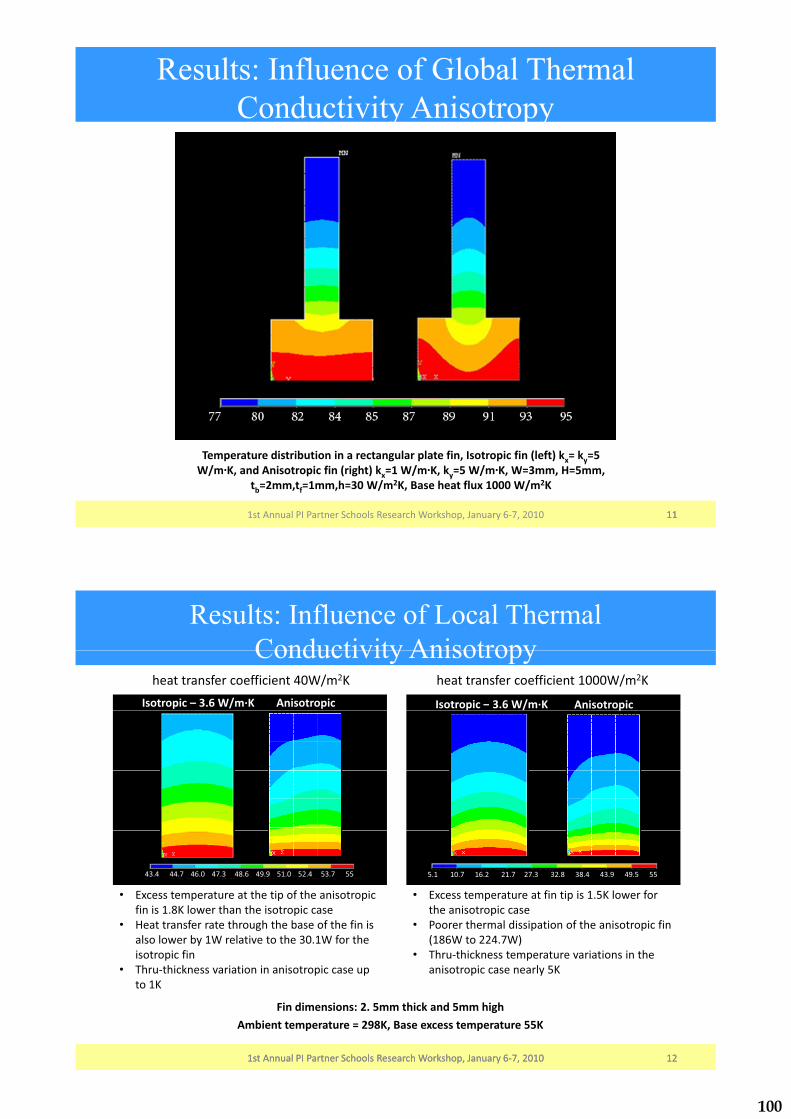
Results: Influence of Global Thermal Conductivity AnisotropyConductivity Anisotropy
Temperature�distribution�in�a�rectangular�plate�fin,�Isotropic�fin�(left)�kx=�ky=5�W/ K d A i t i fi ( i ht) k 1 W/ K k 5 W/ K W 3 H 5W/m·K,�and�Anisotropic�fin�(right)�kx=1�W/m·K,�ky=5�W/m·K,�W=3mm,�H=5mm,�
tb=2mm,tf=1mm,h=30�W/m2K,�Base�heat�flux�1000�W/m2K
1st�Annual�PI�Partner�Schools�Research�Workshop,�January�6�7,�2010 1111
Results: Influence of Local Thermal Conductivity AnisotropyConductivity Anisotropy
heat�transfer�coefficient�40W/m2K heat�transfer�coefficient�1000W/m2K
Isotropic�– 3.6�W/m�K Isotropic�– 3.6�W/m�KAnisotropic Anisotropicp
43.4������44.7����46.0����47.3�����48.6����49.9����51.0����52.4�����53.7������55���� 5.1�������10.7������16.2�������21.7�����27.3�������32.8������38.4������43.9������49.5������55�
h f h f l f• Excess�temperature�at�the�tip�of�the�anisotropic�fin�is�1.8K�lower�than�the�isotropic�case
• Heat�transfer�rate�through�the�base�of�the�fin�is�also�lower�by�1W�relative�to�the�30.1W�for�the�i i fi
• Excess�temperature�at�fin�tip�is�1.5K�lower�for�the�anisotropic�case
• Poorer�thermal�dissipation�of�the�anisotropic�fin�(186W�to�224.7W)h hi k i i i h
Fin dimensions: 2. 5mm thick and 5mm high
isotropic�fin• Thru�thickness�variation�in�anisotropic�case�up�
to�1K
• Thru�thickness�temperature�variations�in�the�anisotropic�case�nearly�5K
1st�Annual�PI�Partner�Schools�Research�Workshop,�January�6�7,�2010 12
Fin�dimensions:�2.�5mm�thick�and�5mm�high
Ambient�temperature�=�298K,�Base�excess�temperature�55K�
1st�Annual�PI�Partner�Schools�Research�Workshop,�January�6�7,�2010 12
100

Results: Effective Isotropic Thermal ConductivityConductivity
Ways to determine a single, effective “isotropic” thermal conductivity to represent heat transfer in an anisotropic fin were explored using different “averages”
30%
40%
Error
ropic�solution
)
Isotropic
Anisotropic Arithmetic Geometric RMS ky Harmonic
10%
20%
Percen
t��(relative�to�anisotr Arithmetic�Mean
Geometric�MeanRMSHarmonic�Mean
Solution Mean of ky Mean of ky Mean of ky
50
W/m2k
q (W/m) 29.1 30.1 29.7 30.5 29.3
Error - 3.6% 2.2% 4.8% 0.9%
0%
0 250 500 750 1000Heat�transfer�coefficient�(W/m2K)
200
W/m2k
q (W/m) 81.6 90.0 87.0 92.8 84.1
Error - 10.3% 6.6% 13.7% 3.0%
400
W/m2k
q (W/m) 121.0 139.1 133.0 145.0 127.2
Error 14 9% 9 9% 19 8% 5 1%
• Errors are small at low h values because the thermal resistance in the fluid dominates the heat
W/m2k Error - 14.9% 9.9% 19.8% 5.1%
800
W/m2k
q (W/m) 168.6 201.4 191.0 211.5 181.4
Error - 19.5% 13.3% 25.5% 7.70%
1000 q (W/m) 186.0 224.7 212.7 236.4 201.7
dissipation rate• Errors increase at high h because
the conduction in the fin dominates the thermal performanceW/m2k Error - 20.8% 14.4% 27.1% 8.5%
1st�Annual�PI�Partner�Schools�Research�Workshop,�January�6�7,�2010 13
the thermal performance
1st�Annual�PI�Partner�Schools�Research�Workshop,�January�6�7,�2010 13
Summary
• Fiber orientation tensors can be successfully used to predict i t i th l d ti iti i h t h t ianisotropic thermal conductivities in heat exchanger geometries
• Global thermal anisotropy resulting from the flow direction can affect the temperature distribution and heat transfer rates from theaffect the temperature distribution and heat transfer rates from the fins
• Local anisotropy resulting from local variations in the fiber orientation can affect the heat transfer rate in the fins
• The harmonic mean performed best as a candidate for an effective i t i d ti itisotropic conductivity
• Errors incurred by estimating an effective thermal conductivity increase whenever the relative magnitude of the thermal resistanceincrease whenever the relative magnitude of the thermal resistance due to conduction increases
1st�Annual�PI�Partner�Schools�Research�Workshop,�January�6�7,�2010 141st�Annual�PI�Partner�Schools�Research�Workshop,�January�6�7,�2010 14
101

Future Plans
• Study the thermal characteristics of other heat exchanger surface features (e.g. pin fins, plate coil heat exchangers) and compare the relative merits of each using the same heat transfer-molding modeling methodology
• Directly import information from Moldflow®
simulations into ANSYS simulations to predict local anisotropic thermal conductivity in selected geometries and study thermal performance
1st�Annual�PI�Partner�Schools�Research�Workshop,�January�6�7,�2010 15
Task #2: Study manufacturability of i j ti ld d l it HXinjection molded polymer composite HX
1st�Annual�PI�Partner�Schools�Research�Workshop,�January�6�7,�2010 16
102
Task Objectives
• Characterize manufacturability of injection molded• Characterize manufacturability of injection molded polymer composite HX geometries Ch t i th i fl f ldi• Characterize the influence of molding process parameters on fiber orientation
• Develop meta models for mold filling and fiber orientation for use in the heat exchanger design framework
1st�Annual�PI�Partner�Schools�Research�Workshop,�January�6�7,�2010 17
Approach
• Characterize Moldflow® fiber orientation predictions as a f i f ldifunction of molding process parameters
• Characterize manufacturability of typical HX features by conducting Moldflow® simulationsconducting Moldflow simulations
• Validate Moldflow® mold filling simulations using experimental data
• Validate Moldflow® fiber orientation predictions using experimental data
l d l f fib i i di i d• Develop a meta model for fiber orientation predictions and integrate it with the PHX design framework
• Characterize manufacturability of typical HX features by• Characterize manufacturability of typical HX features by conducting Moldflow® simulations
1st�Annual�PI�Partner�Schools�Research�Workshop,�January�6�7,�2010 18
103
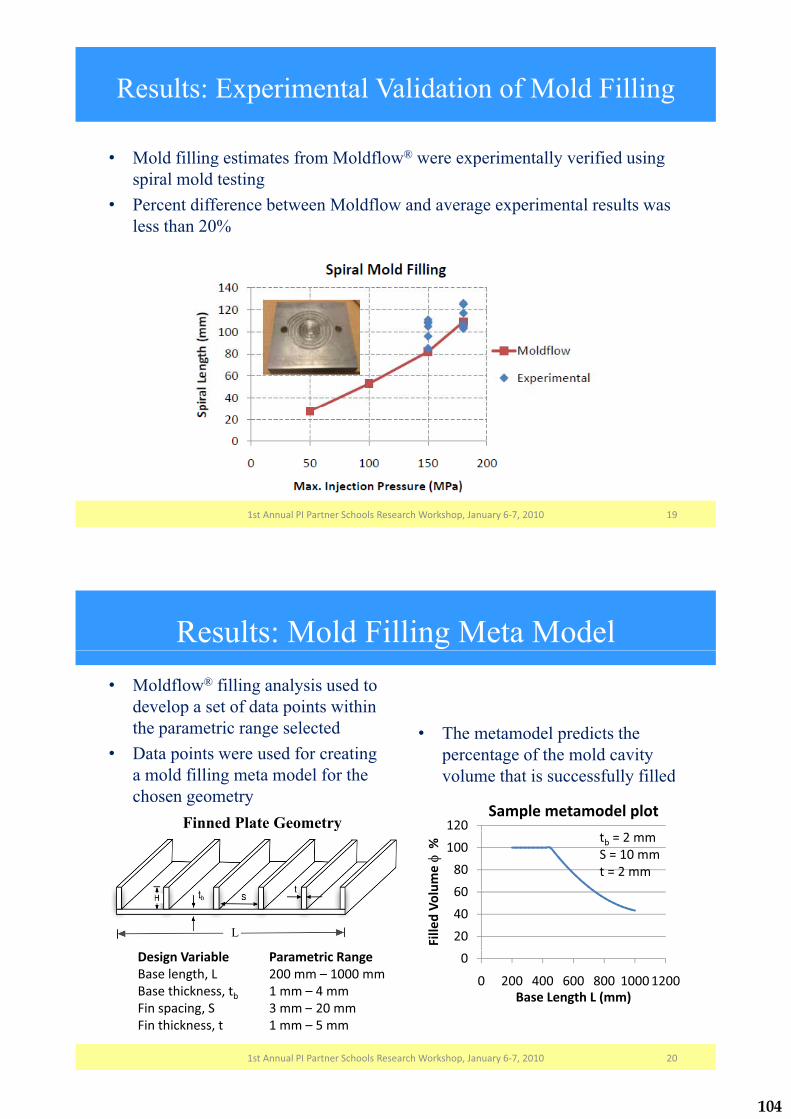
Results: Experimental Validation of Mold Filling
• Mold filling estimates from Moldflow® were experimentally verified using g p y gspiral mold testing
• Percent difference between Moldflow and average experimental results was less than 20%less than 20%
1st�Annual�PI�Partner�Schools�Research�Workshop,�January�6�7,�2010 19
Results: Mold Filling Meta Model• Moldflow® filling analysis used to
develop a set of data points withindevelop a set of data points within the parametric range selected
• Data points were used for creating ld filli t d l f th
• The metamodel predicts the percentage of the mold cavity
l h i f ll fill da mold filling meta model for the chosen geometry
Finned Plate Geometry
volume that is successfully filled
120Sample�metamodel�plot
y
60
80
100
ume��% tb =�2�mm
S�=�10�mmt�=�2�mm
L 20
40
60
Fille
d�Vo
lu
Design�Variable Parametric�RangeBase�length,�L 200�mm�– 1000�mmBase�thickness,�tb 1�mm�– 4�mmFin spacing S 3 mm – 20 mm
0
0 200 400 600 800 10001200Base�Length�L�(mm)
1st�Annual�PI�Partner�Schools�Research�Workshop,�January�6�7,�2010
Fin�spacing,�S 3�mm� 20�mmFin�thickness,�t 1�mm�– 5�mm
20
104

Results: Integrated Life-Cycle Cost Model
6
q�
Heat�Transfer�Performance
t 2
Integrated�Cost�Model
2
3
4
5
Tran
sfer�Rate�q
kW/plate)
tb =�2�mmS�=�10�mmt�=�2�mm
0
1
2
0 200 400 600 800 1000 1200
Heat�T (k
Base�Length�L�(mm)
Optimum�Heat�Exchanger�Plate�Geometry
Scenario L (mm)
tb(mm)
S (mm)
t (mm)
No. of plates
HX Cost ($)
Material price: $10/lbAssembly cost: $60/hr 382.4 1.9 3 1 62 3,800Assembly cost: $60/hrMaterial price: $20/lbAssembly cost: $60/hr 313.6 1.7 3 1 78 5,060
Material price: $10/lbAssembly cost: $120/hr 454.4 2.2 3 1.2 52 5,500
Material price: $10/lb
21
Material price: $10/lbAssembly cost: $60/hr
Lifetime:1 year (9.78 c/kWh)649.6 3.0 3.5 1 42 8,180
1st�Annual�PI�Partner�Schools�Research�Workshop,�January�6�7,�2010
Results: Fiber Orientation Prediction Using Moldflow SimulationsMoldflow Simulations
• Fiber orientationFiber orientation affects thermal and structural properties ofstructural properties of the heat exchanger
• Study the effects of varying injection
Spiral Mold
y g jmolding parameters and heat exchangerand heat exchanger geometry
L-Channel Mold
1st�Annual�PI�Partner�Schools�Research�Workshop,�January�6�7,�2010 22
105

Results: Influence of Fiber Concentration on Fiber OrientationFiber Orientation
The effect of varying fiber concentration with slow-changing velocity field
13% 60%Fiber Concentration
Zytel 70G13L NC010 Zytel 70G30 HSLR BK039 Zytel 70G43L NC010 Zytel 70G60Zytel 70G13L NC010 Zytel 70G30 HSLR BK039 Zytel 70G43L NC010 Zytel 70G60
Note: Variations in % filled could be a result of additives used to decrease theviscosity for highly filled polymers
1st�Annual�PI�Partner�Schools�Research�Workshop,�January�6�7,�2010 23
Results: Influence of Process Parameters on Fiber Orientation and Mold FillingFiber Orientation and Mold Filling
ntAlignm
en
Filling
Fibe
r�
Mold�
Fib C t tiFiber�Concentration
Injection�Pressure
Injection�Flow Rate
Note: Open arrow represents a weak correlation
As the fiber concentration increases the material viscosity generally increases causing mold filling to decrease but manufacturers often use additives with highly-filledmold filling to decrease but manufacturers often use additives with highly filled polymers to decrease viscosity so the correlation is weak
1st�Annual�PI�Partner�Schools�Research�Workshop,�January�6�7,�2010 24
106

Summary
• The moldability analysis meta model y yis successfully integrated with a heat transfer model for a system-level yoptimization model
• Moldability considerationsMoldability considerations significantly influence the final solutionsolution
• The optimum heat exchanger is highly dependent on the values of
A prototype fabricated in the Advanced
Manufacturing Labhighly dependent on the values of material price and energy costs
1st�Annual�PI�Partner�Schools�Research�Workshop,�January�6�7,�2010 25
Future Plans
• Refine mold filling meta model to account for different failure modes
• Experimentally validate fiber orientation• Experimentally validate fiber orientation prediction results
• Develop fiber orientation meta models• Develop manufacturability rules for typicalDevelop manufacturability rules for typical
features found in HX • Develop new material formulations• Explore use of extrusion processExplore use of extrusion process
1st�Annual�PI�Partner�Schools�Research�Workshop,�January�6�7,�2010 26
107

Task #3: Study seawater effects onTask #3: Study seawater effects on structural properties of polymer
icomposite HX
1st�Annual�PI�Partner�Schools�Research�Workshop,�January�6�7,�2010 27
Background
• Seawater reduces the usable life of exotic metal heat exchangers g
• Fiber reinforcement improves mechanical and thermal properties of polymersthermal properties of polymers
• Polymer composite heat exchangers must be carefully designed to reflect the possible effects on thermo-mechanical propertieseffects on thermo mechanical properties associated with hygrothermal aging
281st�Annual�PI�Partner�Schools�Research�Workshop,�January�6�7,�20101st�Annual�PI�Partner�Schools�Research�Workshop,�January�6�7,�2010 28
108

Task Objectives
• Characterize the influence of the seawater on• Characterize the influence of the seawater on the mechanical properties of polymer compositescomposites
• Characterize the influence of the water h h i l i ftemperature on the mechanical properties of
polymer composites• Determine how hygrothermally-aged
mechanical properties influence the structural p pdesign of HX
1st�Annual�PI�Partner�Schools�Research�Workshop,�January�6�7,�2010 29
Approach
• Design and mold test samples• Immerse test samples in saltwater tanks atImmerse test samples in saltwater tanks at
different temperatures and concentrations for pre determined periodspre-determined periods
• Measure mechanical properties before and after immersion
• Analyze and correlate the effects of• Analyze and correlate the effects of temperature and salt concentration
1st�Annual�PI�Partner�Schools�Research�Workshop,�January�6�7,�2010 30
109
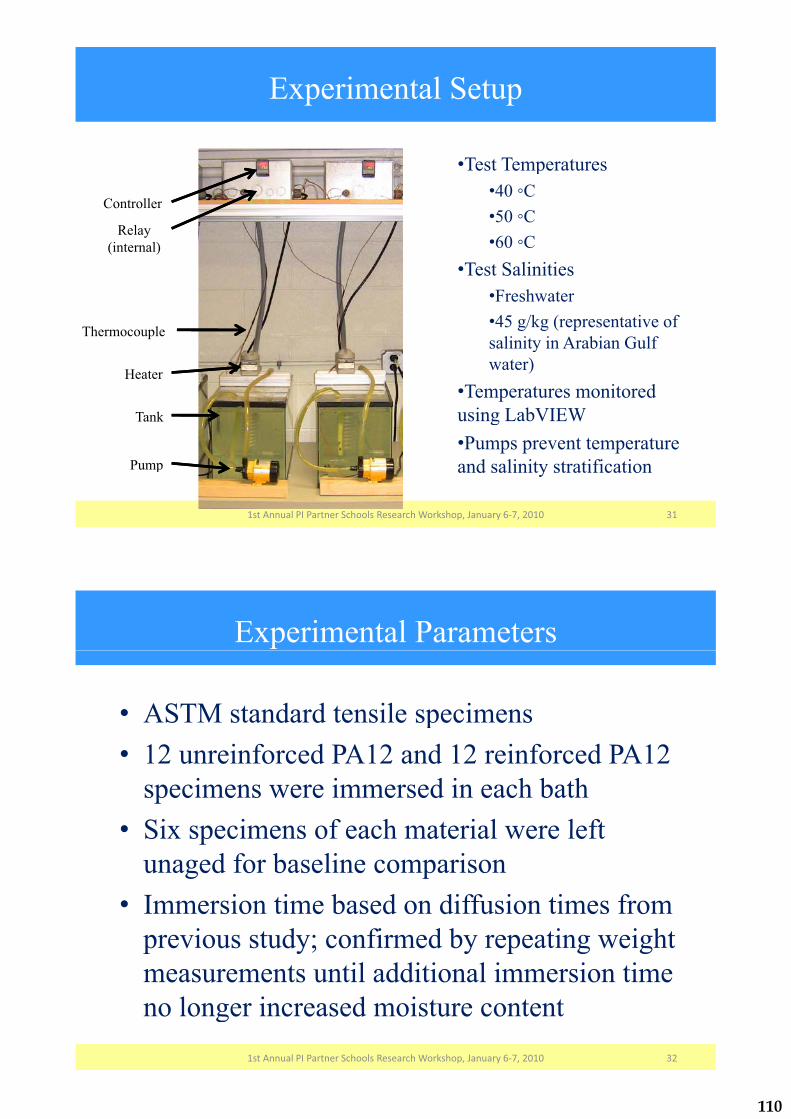
Experimental Setup
•Test TemperaturesTest Temperatures•40 �C•50 �C
Controller
R l•60 �C
•Test Salinities
Relay(internal)
•Freshwater•45 g/kg (representative of salinity in Arabian Gulf
Thermocouplesalinity in Arabian Gulf water)
•Temperatures monitored Heater
using LabVIEW•Pumps prevent temperature and salinity stratification
Tank
Pump and salinity stratificationPump
1st�Annual�PI�Partner�Schools�Research�Workshop,�January�6�7,�2010 31
Experimental Parameters
• ASTM standard tensile specimens• ASTM standard tensile specimens• 12 unreinforced PA12 and 12 reinforced PA12
specimens were immersed in each bath• Six specimens of each material were left• Six specimens of each material were left
unaged for baseline comparison• Immersion time based on diffusion times from
previous study; confirmed by repeating weight p y; y p g gmeasurements until additional immersion time no longer increased moisture contentno longer increased moisture content
1st�Annual�PI�Partner�Schools�Research�Workshop,�January�6�7,�2010 32
110

Results: Effect of Aging Temperature on Unreinforced PA12Unreinforced PA12
Temperature�� Elastic�Modulus� Yield�Strength� Elongation�at� Ultimate�(°C) (GPa) (MPa) Yield�(%) Strength�(MPa)40 0.73 19.9 3.0 43.6
Percent�50 7% 50 0% 100% 105%
Retention50.7% 50.0% 100% 105%
50 0.69 18.7 2.9 42.3PercentPercent�Retention
49.3% 46.9% 99.3% 101%
60 0.69 17.9 2.8 38.3Per entPercent�Retention
49.3% 45.0% 96.6% 91.7%
1st�Annual�PI�Partner�Schools�Research�Workshop,�January�6�7,�2010 33
Results: Effect of Aging Temperature on Reinforced PA12Reinforced PA12
TemperatureElastic�
Yield Strength Elongation atUltimate�
Elongation atTemperature�(°C)
Modulus�(GPa)
Yield�Strength�(MPa)
Elongation�at�Yield�(%)
Strength�(MPa)
Elongation�at�Failure�(%)
40 14.0 55.6 0.62 84.5 2.8Percent�Retention
66.4% 69.0% 105% 82.0% 192%
50 16.0 53.2 0.56 84.9 3.0Percent�Retention
75.8% 66.0% 94.9% 82.3% 205%
60 11 6 54 4 0 70 84 8 3 160 11.6 54.4 0.70 84.8 3.1Percent�Retention
54.9% 67.5% 119% 82.3% 212%
1st�Annual�PI�Partner�Schools�Research�Workshop,�January�6�7,�2010 34
111
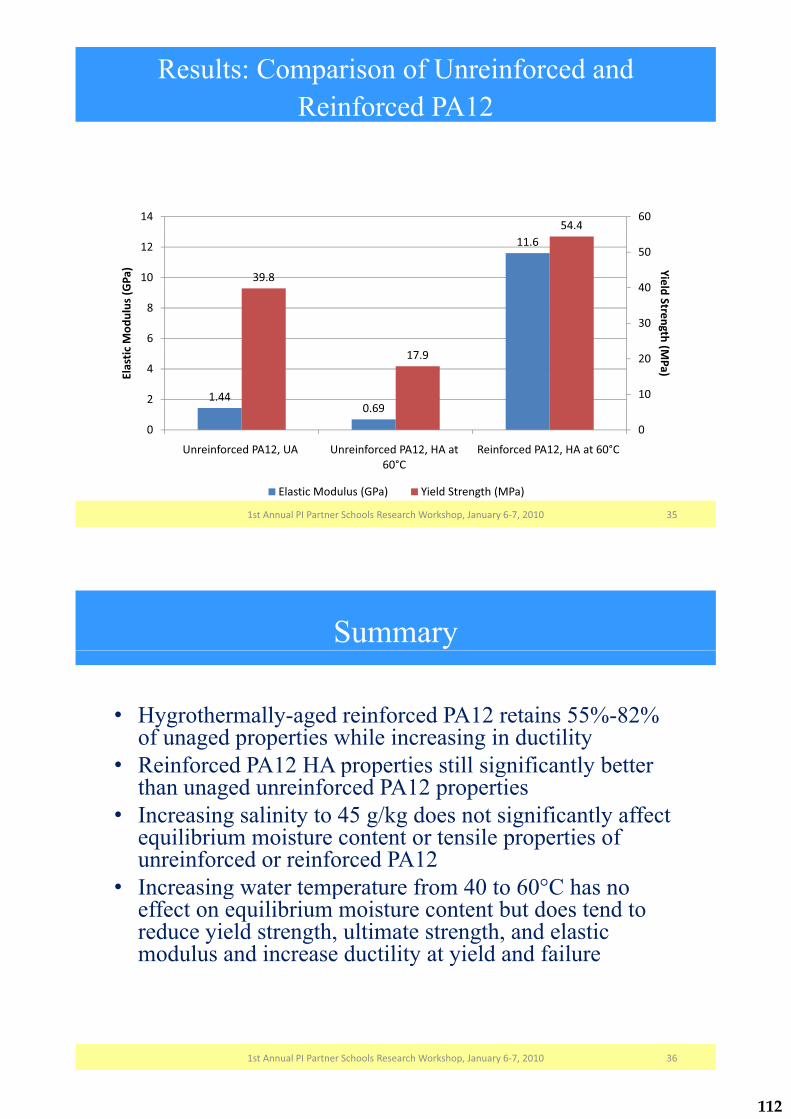
Results: Comparison of Unreinforced and Reinforced PA12Reinforced PA12
54 46014
11.6
39.8
54.4
40
50
10
12
YielGPa
)
30
40
6
8
ld�Strength�(c�Mod
ulus�(G
1.440 69
17.9
10
20
2
4
(MPa)El
astic
0.69
00
Unreinforced�PA12,�UA� Unreinforced�PA12,�HA�at�60°C
Reinforced�PA12,�HA�at�60°C�60 C�
Elastic�Modulus�(GPa)� Yield�Strength�(MPa)�
1st�Annual�PI�Partner�Schools�Research�Workshop,�January�6�7,�2010 35
Summary
H th ll d i f d PA12 t i 55% 82%• Hygrothermally-aged reinforced PA12 retains 55%-82% of unaged properties while increasing in ductility
• Reinforced PA12 HA properties still significantly betterReinforced PA12 HA properties still significantly better than unaged unreinforced PA12 properties
• Increasing salinity to 45 g/kg does not significantly affect ilib i i il i fequilibrium moisture content or tensile properties of
unreinforced or reinforced PA12• Increasing water temperature from 40 to 60°C has noIncreasing water temperature from 40 to 60 C has no
effect on equilibrium moisture content but does tend to reduce yield strength, ultimate strength, and elastic mod l s and increase d ctilit at ield and fail remodulus and increase ductility at yield and failure
1st�Annual�PI�Partner�Schools�Research�Workshop,�January�6�7,�2010 36
112

Future Plans
• Hygrothermally-age specimens at 25°C to determine whether absorbed moisture or temperature is responsible for deterioration of mechanical propertiesmechanical properties
• Investigate deterioration of polymer fiber interface
• Develop structural analysis model usingDevelop structural analysis model using hygrothermally-aged mechanical properties
1st�Annual�PI�Partner�Schools�Research�Workshop,�January�6�7,�2010 37
T k #4 C t d i t llTask #4: Create and experimentally characterize a large polymer composite g p y p
HX module
1st�Annual�PI�Partner�Schools�Research�Workshop,�January�6�7,�2010 38
113

Polymer Composite HX Module Prototype
Inlet Conditions: Fin recess
Uair = 10 m/s at 90 °CUwater= 0.5 m/s at 35 °C
PI Injection molding machine (ENGEL Victory 70)
Cooling water lines
Moving injection mold part (air side module)
180
Water Water
98Air
18079
98
104
Ai
180
Dimensions in mm
1st�Annual�PI�Partner�Schools�Research�Workshop,�January�6�7,�2010 39
Air
Single fin module Double fin module
Air Dimensions in mm
Polymer HX Test Facility Concept Design
• Air Side:
Inlet Conditions:Uair = 10 m/s at 90 °CU = 0 5 m/s at 35 °C
• Water Side:
Uwater= 0.5 m/s at 35 C
Single fin module:Qtotal = 443 W� P = 211 Pa� Pair 211 Pa� Pwater= 148 Pa
Double fin module:Q l = 725WQtotal 725 W� Pair = 168 Pa� Pwater= 148 Pa
1st�Annual�PI�Partner�Schools�Research�Workshop,�January�6�7,�2010 40
114

Future Plans• Manufacture of prototype HX injection molds
i PI CNC f ilitiusing PI CNC facilities.• Polymer HX injection molding process to be
developed using polyethylene and thermally enhanced polymer composite (Poly One: p y p ( yEM1000631360).
• Construction and commissioning of HX thermal• Construction and commissioning of HX thermal characterization test facility.
• Thermal performance of prototype polymer HX modules to be characterized and assessed against numerical and empirical predictions.
1st�Annual�PI�Partner�Schools�Research�Workshop,�January�6�7,�2010 41
Conclusions
1st�Annual�PI�Partner�Schools�Research�Workshop,�January�6�7,�2010 42
115
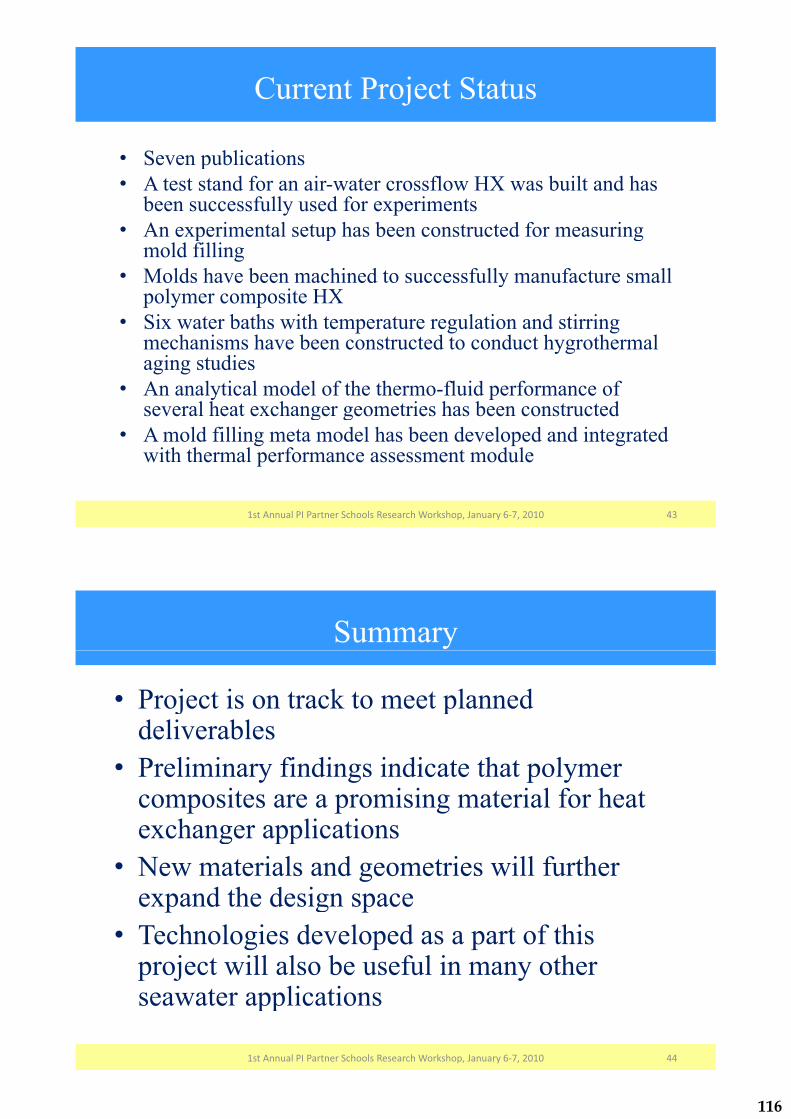
Current Project Status
• Seven publicationsp• A test stand for an air-water crossflow HX was built and has
been successfully used for experiments• An e perimental set p has been constr cted for meas ring• An experimental setup has been constructed for measuring
mold filling• Molds have been machined to successfully manufacture small y
polymer composite HX • Six water baths with temperature regulation and stirring
mechanisms have been constructed to conduct hygrothermalmechanisms have been constructed to conduct hygrothermal aging studies
• An analytical model of the thermo-fluid performance of several heat exchanger geometries has been constructedseveral heat exchanger geometries has been constructed
• A mold filling meta model has been developed and integrated with thermal performance assessment module
1st�Annual�PI�Partner�Schools�Research�Workshop,�January�6�7,�2010 43
Summary
• Project is on track to meet planned j pdeliverables
• Preliminary findings indicate that polymerPreliminary findings indicate that polymer composites are a promising material for heat exchanger applicationsexchanger applications
• New materials and geometries will further d th d iexpand the design space
• Technologies developed as a part of this project will also be useful in many other seawater applications pp
1st�Annual�PI�Partner�Schools�Research�Workshop,�January�6�7,�2010 44
116
UMD or UMN Team: Dr. S. Dessiatoun, Dr. A. ShooshtariPI Team: Dr. M. Ohadi, Dr. M. Alshehhi, Dr. A. Goharzadeh
PI Partners PI Sponsors
1st Annual PI Partner Schools Research Workshop
The Petroleum Institute, Abu Dhabi, U.A.E.
January 6-7, 2010
Electrostatic Gas-Liquid Separation from High Speed Streams—Application to Advanced On-Line/On-
Demand Separation Techniques
Presentation Outline
• Background• Objectives• Experimental Setup• Results and Discussions• Project Status• Conclusions and Summary
21st Annual PI Partner Schools Research Workshop, January 6-7, 2010
117
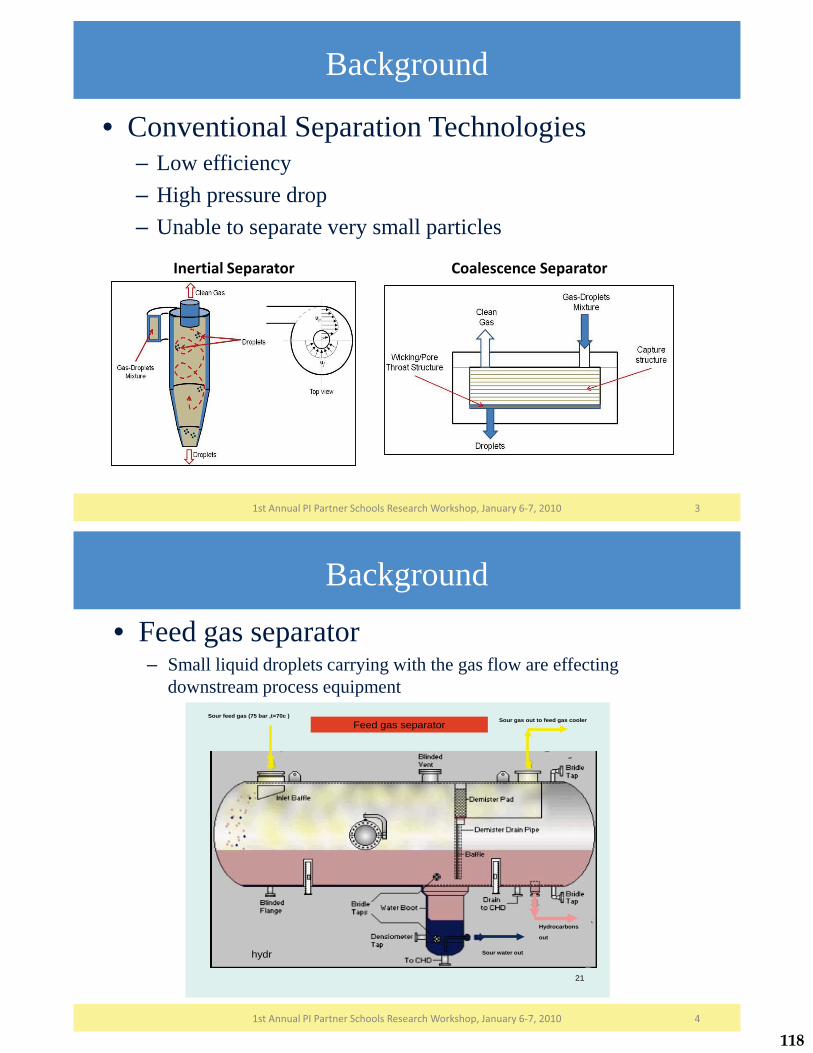
Background
31st Annual PI Partner Schools Research Workshop, January 6-7, 2010
• Conventional Separation Technologies– Low efficiency– High pressure drop– Unable to separate very small particles
Coalescence SeparatorInertial Separator
Background
41st Annual PI Partner Schools Research Workshop, January 6-7, 2010
• Feed gas separator– Small liquid droplets carrying with the gas flow are effecting
downstream process equipment
21
Feed gas separator Sour feed gas (75 bar ,t=70c )
Sour gas out to feed gas cooler
hydr Sour water out
Hydrocarbons
out
118
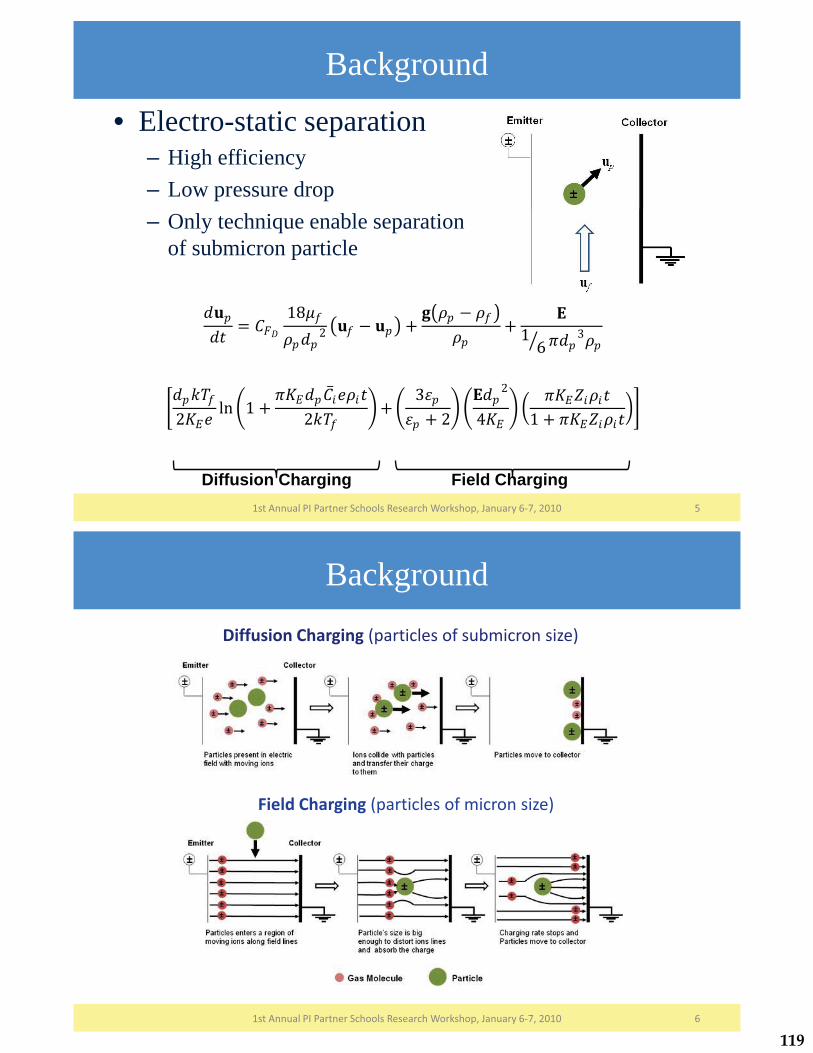
Background
51st Annual PI Partner Schools Research Workshop, January 6-7, 2010
• Electro-static separation– High efficiency– Low pressure drop– Only technique enable separation
of submicron particle
����� = ���18�� �� 2 �� �� � + ���� � �
�� + �1 6� ��� 3��
��� ��2��� ln �1 + ����� ��� ��� �2�� � + � 3���� + 2� ���� 2
4�� � � ����� ���1 + ����� ��� !
Field ChargingDiffusion Charging
Background
61st Annual PI Partner Schools Research Workshop, January 6-7, 2010
Diffusion Charging (particles of submicron size)
Field Charging (particles of micron size)
119

Background
71st Annual PI Partner Schools Research Workshop, January 6-7, 2010
• Effective Separation requires– Ionization of gas molecules based on corona
discharge (ionic wind)– Charging of liquid droplets suspended in gas flow– Collecting of charged droplets– Removal of collected droplets (drainage)
Project Objectives
81st Annual PI Partner Schools Research Workshop, January 6-7, 2010
• Study the feasibility of using electrostatic force to separate fine suspended liquid droplets from a gas stream
• Study the separation performance on two different aerosols droplets with low and high relative permittivities
• Conduct a parametric study on the effect of electric field and flow conditions on the separation performance
• Develop a numerical modeling technique to predict the separation performance
• Design a laboratory-scale novel gas-oil and gas-water electrostatic separator to demonstrate the concept
120
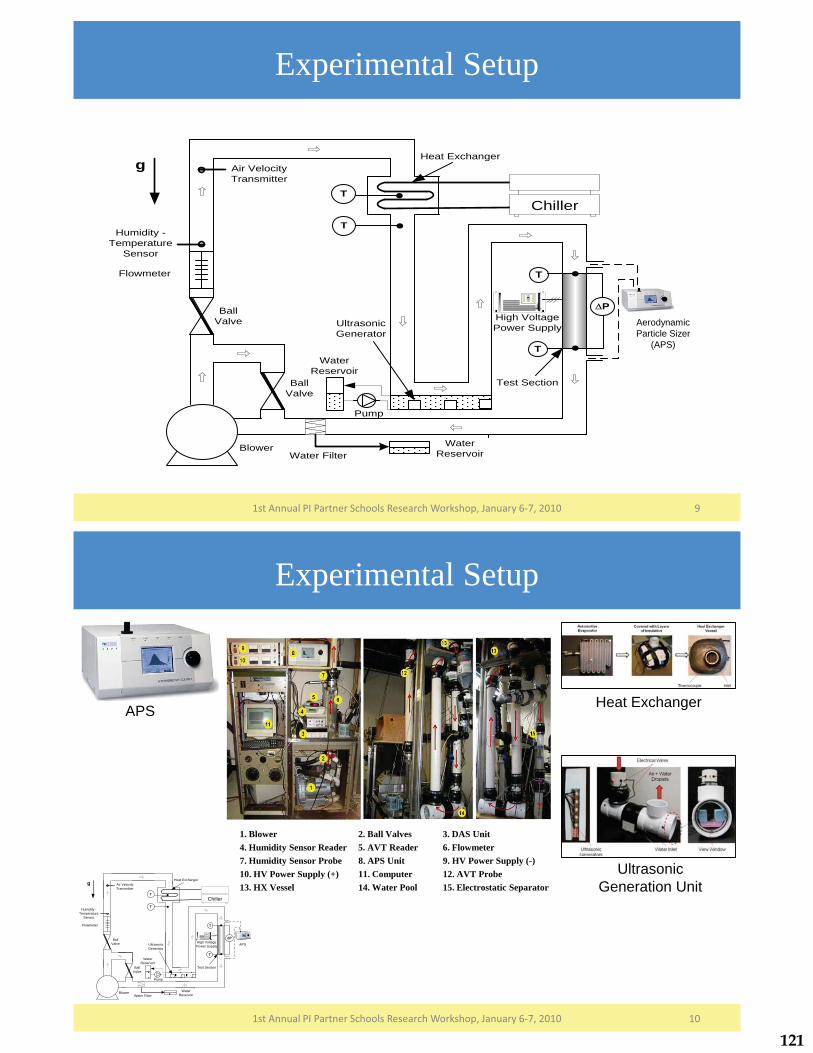
Experimental Setup
91st Annual PI Partner Schools Research Workshop, January 6-7, 2010
Flowmeter
Blower
BallValve
Heat Exchanger
�P
BallValve
T
T
Test Section
Humidity -Temperature
Sensor
APSHigh VoltagePower Supply
WaterReservoir
g
Pump
UltrasonicGenerator
T
Air VelocityTransmitter
T
Chiller
Water FilterWater
Reservoir
Aerodynamic Particle Sizer
(APS)
Experimental Setup
101st Annual PI Partner Schools Research Workshop, January 6-7, 2010
1. Blower 2. Ball Valves 3. DAS Unit4. Humidity Sensor Reader 5. AVT Reader 6. Flowmeter7. Humidity Sensor Probe 8. APS Unit 9. HV Power Supply (-)10. HV Power Supply (+) 11. Computer 12. AVT Probe13. HX Vessel 14. Water Pool 15. Electrostatic Separator
APS Heat Exchanger
Ultrasonic Generation Unit
Flowmeter
Blower
BallValve
Heat Exchanger
�P
BallValve
T
T
Test Section
Humidity -Temperature
Sensor
APSHigh VoltagePower Supply
WaterReservoir
g
Pump
UltrasonicGenerator
T
Air VelocityTransmitter
T
Chiller
Water FilterWater
Reservoir
121

Results and Discussions
• Effect of Electrostatic Separation
1st Annual PI Partner Schools Research Workshop, January 6-7, 2010 11
Inlet Outlet (7.0 kV)
" = # %&. '( �)*,-/0 5,7&9*:/)%&. '( ;<>/*&/0 5,7&9*:/)
Results and Discussions
• Water droplets separation
1st Annual PI Partner Schools Research Workshop, January 6-7, 2010 12
Negative Polarity
� Efficiency decreases as velocity increases
� �max = 99.999 % for 0.3 m/s & 99.912 % for 7.5 m/s @ Øe = 7 kV
122
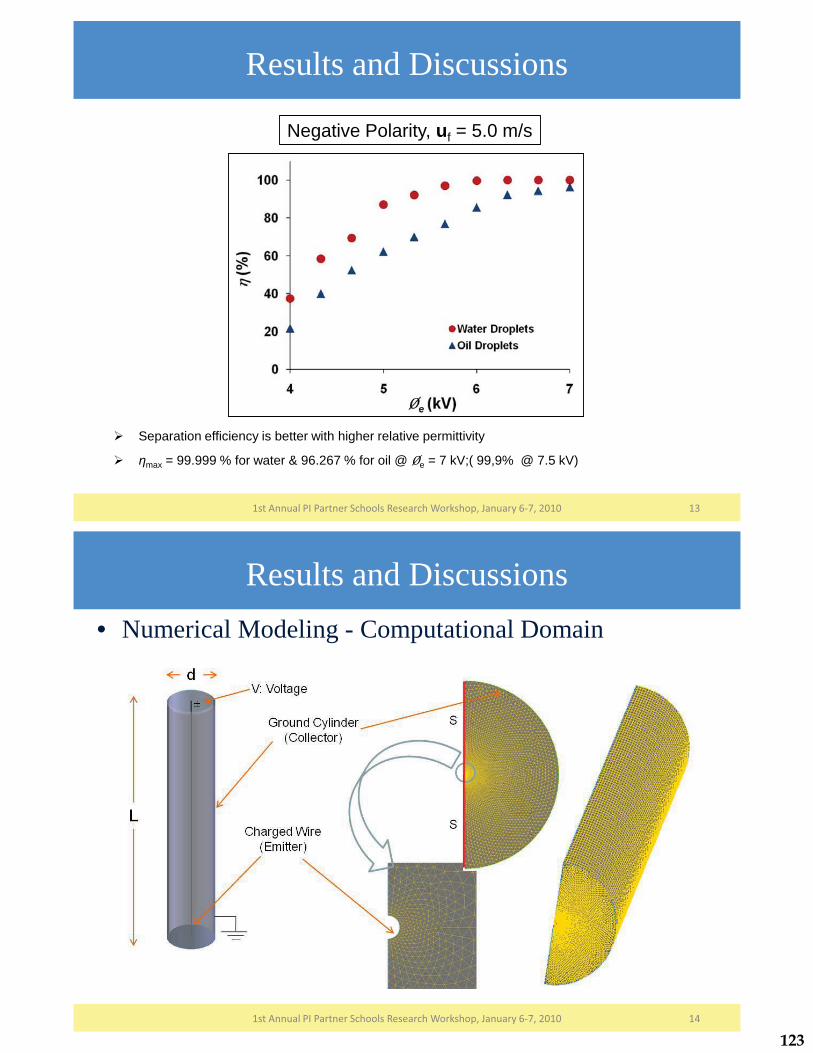
Results and Discussions
1st Annual PI Partner Schools Research Workshop, January 6-7, 2010 13
� Separation efficiency is better with higher relative permittivity
� �max = 99.999 % for water & 96.267 % for oil @ Øe = 7 kV;( 99,9% @ 7.5 kV)
Negative Polarity, uf = 5.0 m/s
Results and Discussions• Numerical Modeling - Computational Domain
1st Annual PI Partner Schools Research Workshop, January 6-7, 2010 14
123
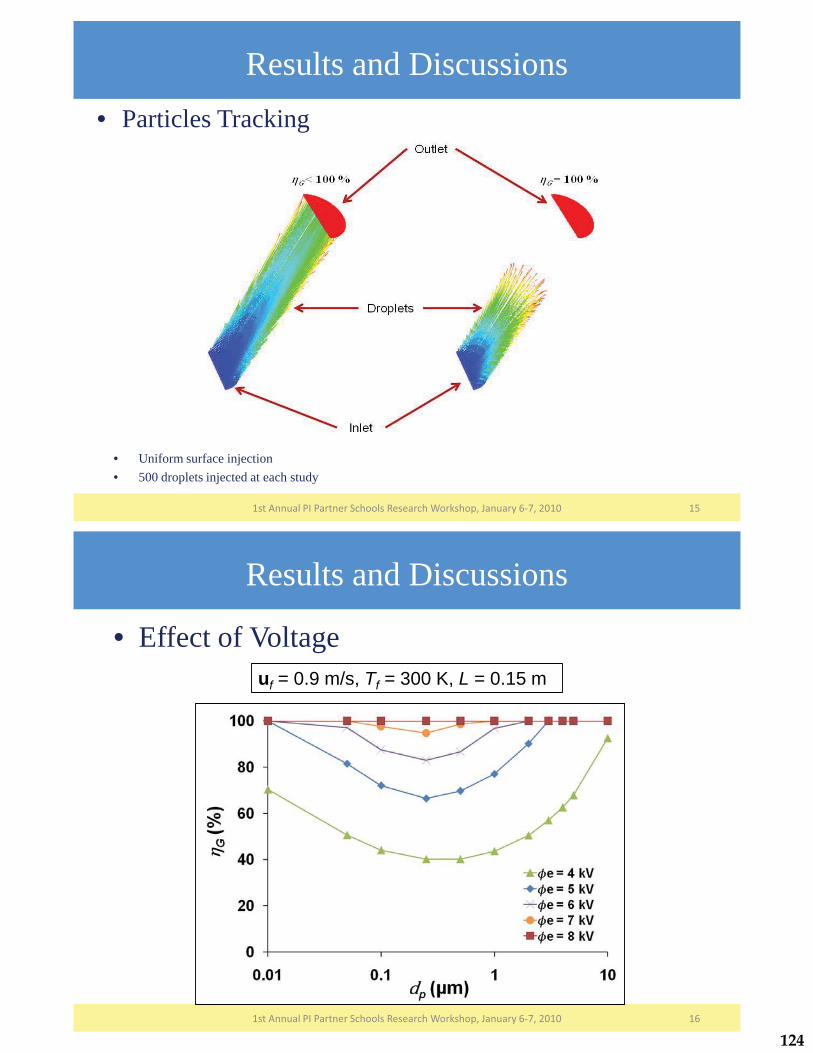
Results and Discussions• Particles Tracking
1st Annual PI Partner Schools Research Workshop, January 6-7, 2010 15
• Uniform surface injection• 500 droplets injected at each study
Results and Discussions
• Effect of Voltage
1st Annual PI Partner Schools Research Workshop, January 6-7, 2010 16
uf = 0.9 m/s, Tf = 300 K, L = 0.15 m
124
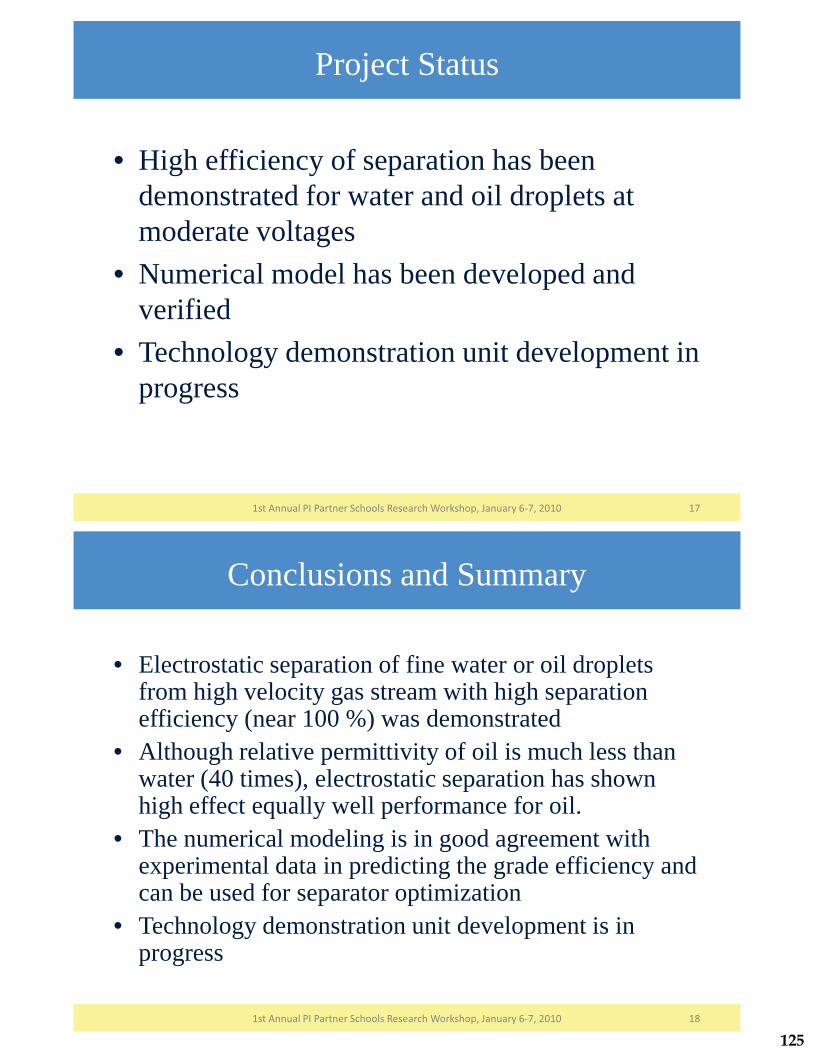
Project Status
• High efficiency of separation has been demonstrated for water and oil droplets at moderate voltages
• Numerical model has been developed and verified
• Technology demonstration unit development in progress
1st Annual PI Partner Schools Research Workshop, January 6-7, 2010 17
Conclusions and Summary
1st Annual PI Partner Schools Research Workshop, January 6-7, 2010 18
• Electrostatic separation of fine water or oil droplets from high velocity gas stream with high separation efficiency (near 100 %) was demonstrated
• Although relative permittivity of oil is much less than water (40 times), electrostatic separation has shown high effect equally well performance for oil.
• The numerical modeling is in good agreement with experimental data in predicting the grade efficiency and can be used for separator optimization
• Technology demonstration unit development is in progress
125
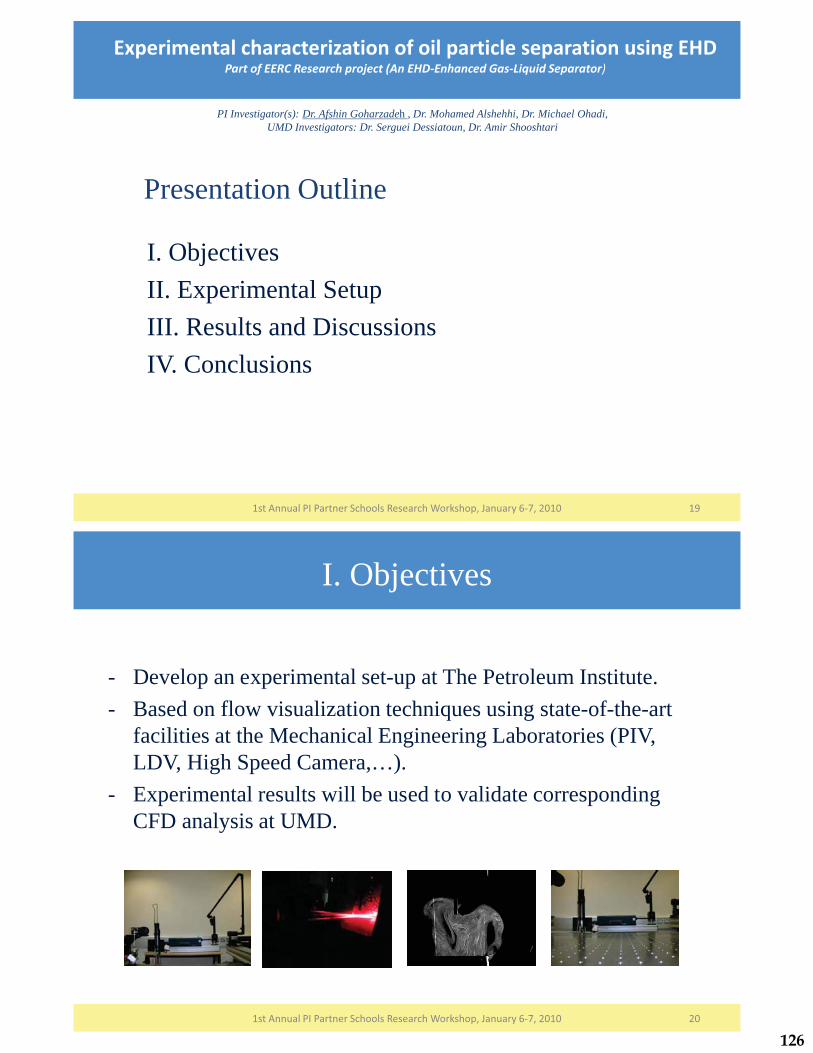
Experimental characterization of oil particle separation using EHDPart of EERC Research project (An EHD-Enhanced Gas-Liquid Separator)
1st Annual PI Partner Schools Research Workshop, January 6-7, 2010 19
PI Investigator(s): Dr. Afshin Goharzadeh , Dr. Mohamed Alshehhi, Dr. Michael Ohadi, UMD Investigators: Dr. Serguei Dessiatoun, Dr. Amir Shooshtari
I. ObjectivesII. Experimental SetupIII. Results and DiscussionsIV. Conclusions
Presentation Outline
I. Objectives
- Develop an experimental set-up at The Petroleum Institute.- Based on flow visualization techniques using state-of-the-art
facilities at the Mechanical Engineering Laboratories (PIV, LDV, High Speed Camera,…).
- Experimental results will be used to validate corresponding CFD analysis at UMD.
1st Annual PI Partner Schools Research Workshop, January 6-7, 2010 20
126
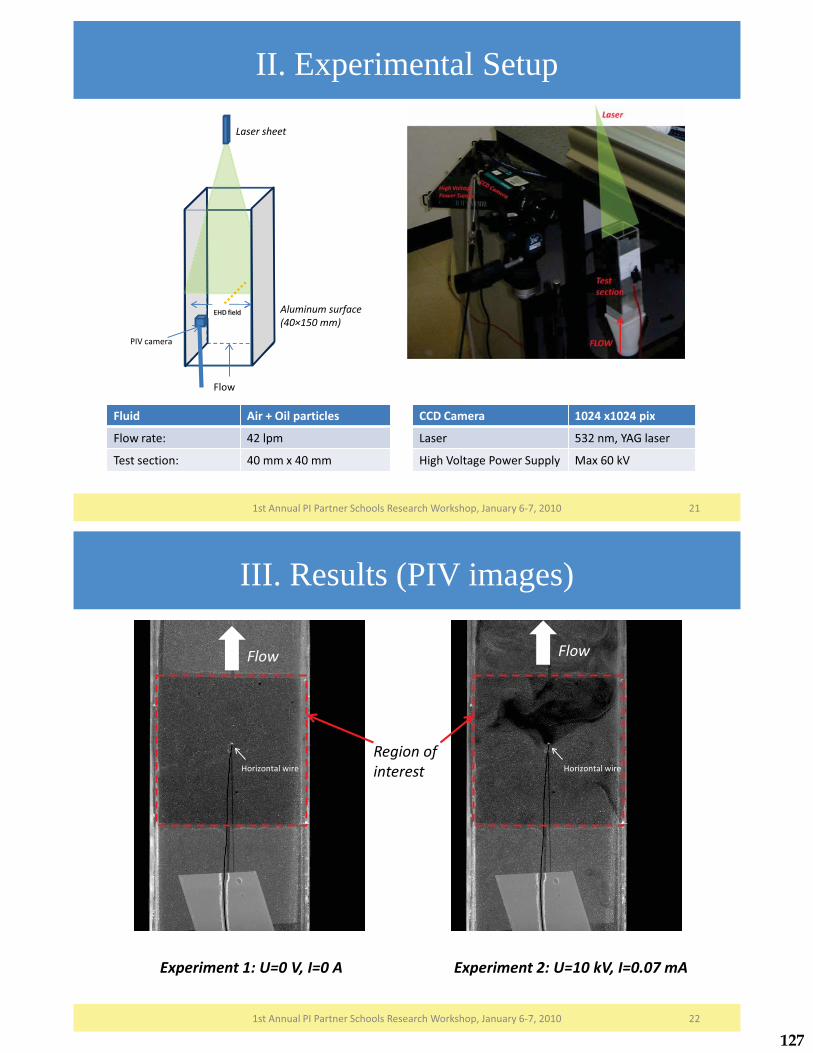
II. Experimental Setup
1st Annual PI Partner Schools Research Workshop, January 6-7, 2010 21
Aluminum surface (40×150 mm)
EHD field
Flow
Laser sheet
PIV camera
Fluid Air + Oil particles
Flow rate: 42 lpm
Test section: 40 mm x 40 mm
CCD Camera 1024 x1024 pix
Laser 532 nm, YAG laser
High Voltage Power Supply Max 60 kV
III. Results (PIV images)
1st Annual PI Partner Schools Research Workshop, January 6-7, 2010 22
Flow Flow
Region of interestHorizontal wire
Experiment 1: U=0 V, I=0 A Experiment 2: U=10 kV, I=0.07 mA
Horizontal wire
127
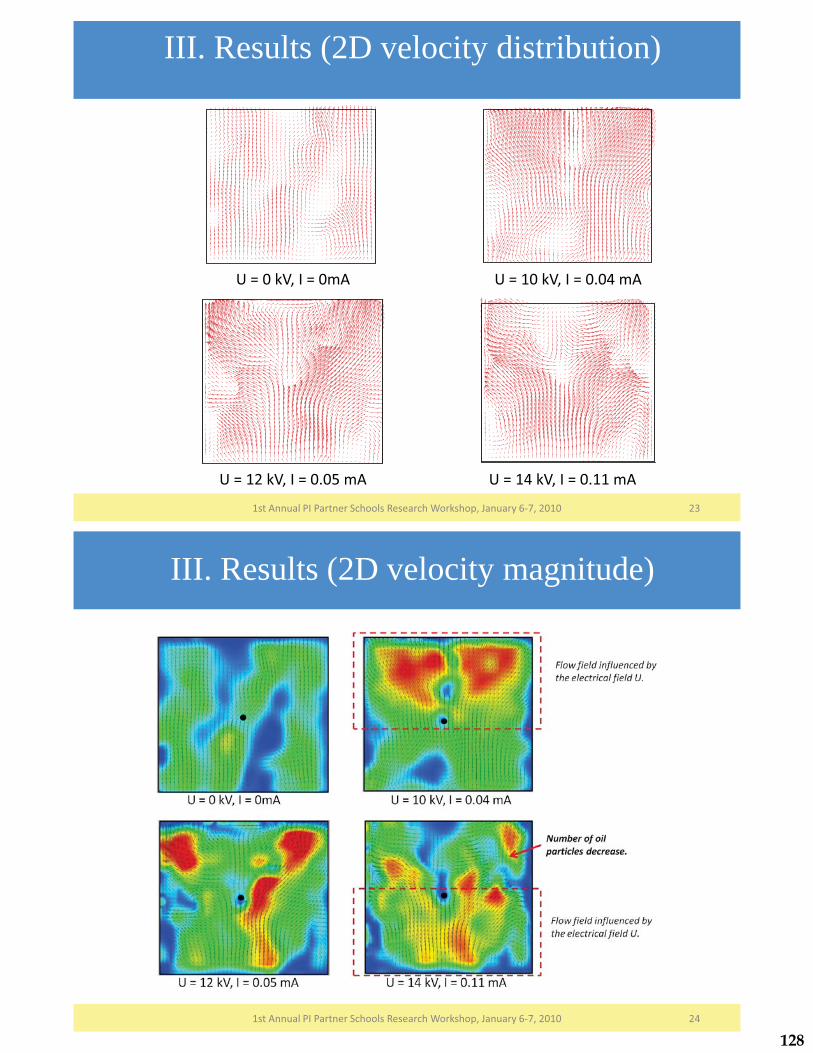
1st Annual PI Partner Schools Research Workshop, January 6-7, 2010 23
III. Results (2D velocity distribution)
U = 0 kV, I = 0mA U = 10 kV, I = 0.04 mA
U = 12 kV, I = 0.05 mA U = 14 kV, I = 0.11 mA
1st Annual PI Partner Schools Research Workshop, January 6-7, 2010 24
III. Results (2D velocity magnitude)
128

1st Annual PI Partner Schools Research Workshop, January 6-7, 2010 25
III. Results (velocity profiles)
IV. Conclusions
Application of High Voltage potential disturbs the flow field:
- Particle trajectories are deviated- Velocity magnitude increase- Particle density decrease
Future experiments:
- Influence of the flowrate Q.- Detail analysis of the velocity distribution.- Comparison with CFD predictions from UMD partners.
1st Annual PI Partner Schools Research Workshop, January 6-7, 2010 26
129
UMD Team: Dr. S. Dessiatoun & Dr. A. Shooshtari
PI Team: P. Singh (GRD), Dr. E. Al-Hajri, Dr. A. Goharzadeh, Dr. M. Ohadi
PI Partners PI Sponsors
1st Annual PI Partner Schools Research Workshop
The Petroleum Institute, Abu Dhabi, U.A.E.
January 6-7, 2010
Microreactors for Oil and Gas Processes Using Microchannel Technologies
Presentation Outline
• Background• Objectives• Summary of Accomplishments • Literature Review• Redesign Experiments • Project Status• Future Work
21st Annual PI Partner Schools Research Workshop, January 6-7, 2010
130
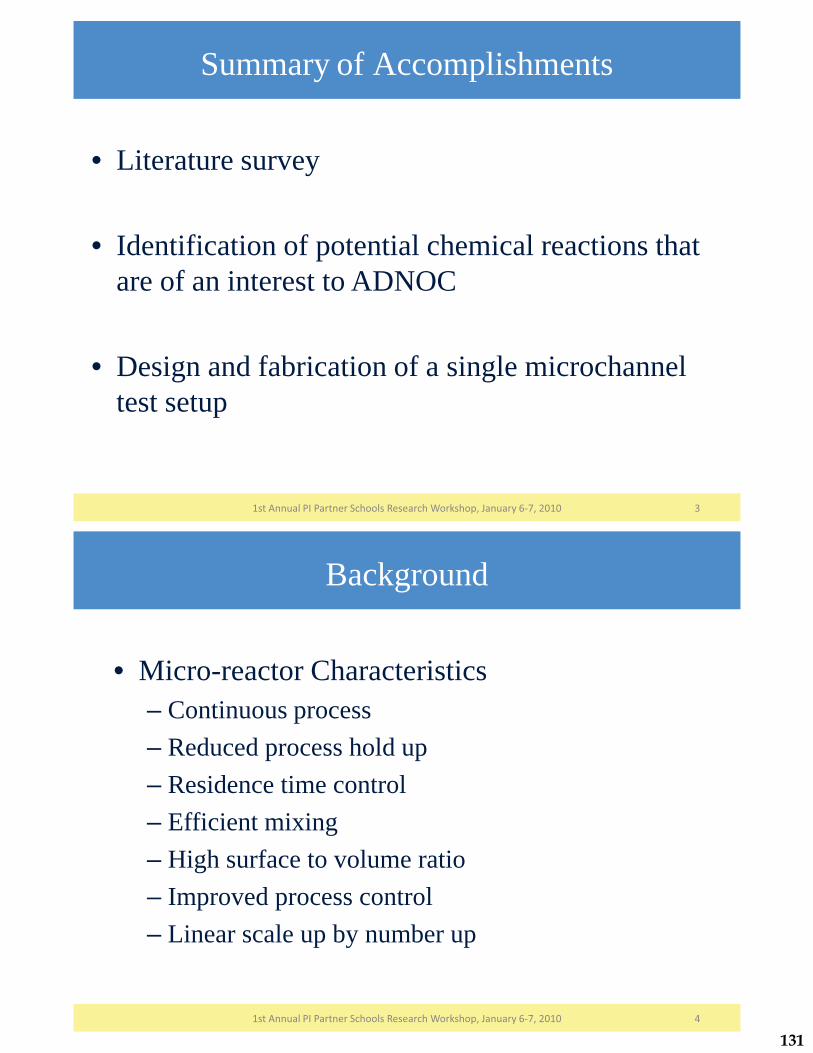
Summary of Accomplishments
• Literature survey
• Identification of potential chemical reactions that are of an interest to ADNOC
• Design and fabrication of a single microchanneltest setup
1st Annual PI Partner Schools Research Workshop, January 6-7, 2010 3
Background
• Micro-reactor Characteristics– Continuous process– Reduced process hold up– Residence time control– Efficient mixing– High surface to volume ratio– Improved process control– Linear scale up by number up
41st Annual PI Partner Schools Research Workshop, January 6-7, 2010
131

• Safety Benefits– Enhanced safety; new reactions possible– No scale up risks associated– No unstable intermediates accumulation– Elimination of batch critical process
• Chemistry Benefits– Improved yield and selectivity– Increased reaction rate– Expanded temperature range
1st Annual PI Partner Schools Research Workshop, January 6-7, 2010 5
Background
• Economic Benefits– Less capital risk– Lower manufacturing and operating cost– Less raw material, solvent, waste and energy– Less work up– Improved production management
1st Annual PI Partner Schools Research Workshop, January 6-7, 2010 6
Background
132
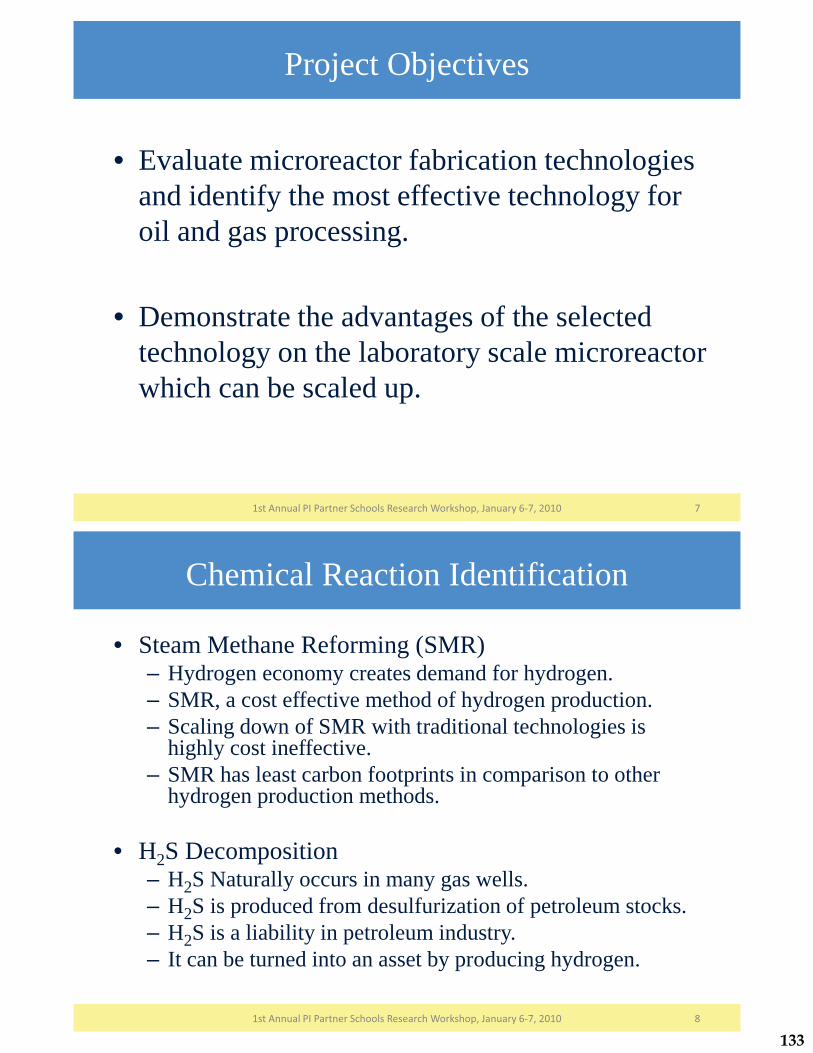
Project Objectives
• Evaluate microreactor fabrication technologies and identify the most effective technology for oil and gas processing.
• Demonstrate the advantages of the selected technology on the laboratory scale microreactorwhich can be scaled up.
71st Annual PI Partner Schools Research Workshop, January 6-7, 2010
Chemical Reaction Identification
• Steam Methane Reforming (SMR) – Hydrogen economy creates demand for hydrogen.– SMR, a cost effective method of hydrogen production.– Scaling down of SMR with traditional technologies is
highly cost ineffective.– SMR has least carbon footprints in comparison to other
hydrogen production methods.
• H2S Decomposition– H2S Naturally occurs in many gas wells.– H2S is produced from desulfurization of petroleum stocks. – H2S is a liability in petroleum industry.– It can be turned into an asset by producing hydrogen.
81st Annual PI Partner Schools Research Workshop, January 6-7, 2010
133

Literature Review
• SMR Reactions • Reaction Rates (Zanfir et al )
1st Annual PI Partner Schools Research Workshop, January 6-7, 2010 9
Literature Review
• Reaction kinetics by Zanfir et al
1st Annual PI Partner Schools Research Workshop, January 6-7, 2010 10
134

Literature Review
• Microreactor Design by A.Y.Tonkovich et al.– Parallel SMR & Methane
combustion reactions– Heat recuperation system integrated– Fabrication: combination of
conventional machining, wire electro-discharge machining, and laser cutting.
– Catalyst loading: Reforming catalyst deposited on FeCrAlYsubstrate. Combustion catalyst washcoated
1st Annual PI Partner Schools Research Workshop, January 6-7, 2010 11
– Methane conversion ~ 91.7%– Volumetric heat transfer flux
was 65 W/cm3
– Contact time of 6 ms– For commercial scale up
reactor thermal losses <5%
• H2S decomposition (2H2S��2H2 +S2)– Catalytic or noncatalytic thermal decomposition– Thermochemical decomposition– Electrochemical decomposition– Photochemical decomposition– Plasma method of decomposition
• H2S decomposition not yet tried in microreactors
1st Annual PI Partner Schools Research Workshop, January 6-7, 2010 12
Literature Review
135

13
Shell and Tube 500 W heat exchanger
UMD 600 W evaporator
Technology Comparison
Experimental Work
1st Annual PI Partner Schools Research Workshop, January 6-7, 2010 14
• LiBr/Water absorption system– Enhance two-phase mixing in microchannels– Heat/Mass transfer investigation – Flow visualization
136

Experimental Work
1st Annual PI Partner Schools Research Workshop, January 6-7, 2010 15
• Components of Adsorber
Water Cooling
Vapor inlet
Rich LiBr inlet
Lean LiBr/WaterSolution outlet
Aluminum Clamp(top)
Microchannel sheet
G10 Clamp(bottom)
Glass housing
Experimental Work
1st Annual PI Partner Schools Research Workshop, January 6-7, 2010 16
• Components of DesorberRich LiBr outlet
Vapor outlet
Electrical heaters housing
LiBr/Water solution inlet
Electrical heater
Cover glass
Microchannel
Aluminum clamp(top)
137

Experimental Work
• Recently fabricated microchannel using Rapid Prototyping machine. – Channel dimensions: thickness ~ 400 �m and width 2.8 mm
(aspect ratio ~ 7)
1st Annual PI Partner Schools Research Workshop, January 6-7, 2010 17
Experimental Setup
1st Annual PI Partner Schools Research Workshop, January 6-7, 2010 18
138

Project Status
• Literature review continues – Reaction kinetics of H2S decomposition.– Catalyst selection study for both reactions.
• CFD simulation using COMSOL for both the SMR and H2S decomposition processes.– Simulations with different catalytic conditions– Simulations with different reaction kinetics
1st Annual PI Partner Schools Research Workshop, January 6-7, 2010 19
Future Scope
• Find design parameters for microreactor– Simulation– Mathematical calculations
• Fabrication of microreactor.• Test setup design and construction.• Experimental study and analysis of results. • Aid of simulation in remodeling and
redesigning experimental setup.
1st Annual PI Partner Schools Research Workshop, January 6-7, 2010 20
139

Mathematical Modeling and Optimization in Oil and Gas
Industry
140

UMD Team: M. Modarres, M. NuhiPI Team: A. Seibi
PI Partners PI Sponsors
1st Annual PI Partner Schools Research Workshop
The Petroleum Institute, Abu Dhabi, U.A.E.
January 6-7, 2010
ASSESSMENT OF THE INTEGRITY OF PIPELINES SUBJECT TO CORROSION-FATIGUE, PITTING CORROSION, CREEP
AND STRESS CORROSSION CARCKING
Presentation Outline
• Background• Objectives• Failure Mechanism Modeling and Applications
– Corrosion-Fatigue– Pitting Corrosion– Creep– Stress Corrosion Cracking
• Conclusions
21st Annual PI Partner Schools Research Workshop, January 6-7, 2010
141
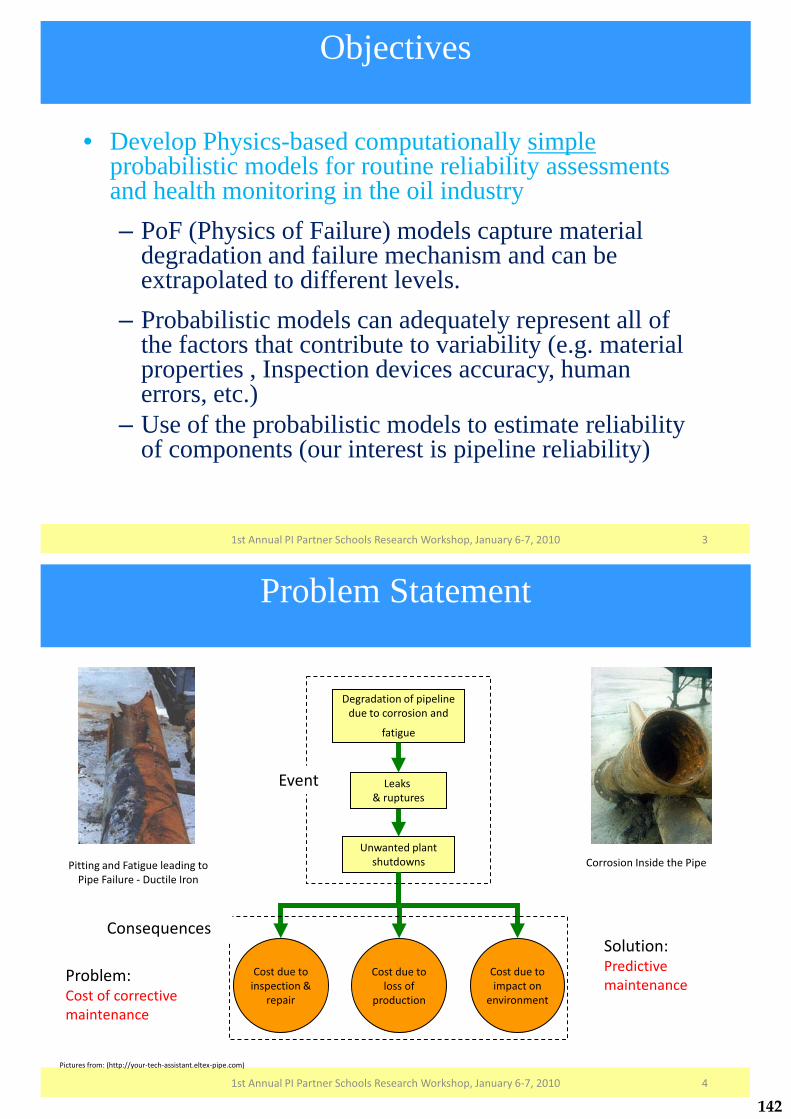
• Develop Physics-based computationally simpleprobabilistic models for routine reliability assessments and health monitoring in the oil industry– PoF (Physics of Failure) models capture material
degradation and failure mechanism and can be extrapolated to different levels.
– Probabilistic models can adequately represent all of the factors that contribute to variability (e.g. material properties , Inspection devices accuracy, human errors, etc.)
– Use of the probabilistic models to estimate reliability of components (our interest is pipeline reliability)
Objectives
1st Annual PI Partner Schools Research Workshop, January 6-7, 2010 3
Problem Statement
Pitting and Fatigue leading to Pipe Failure - Ductile Iron
Corrosion Inside the Pipe
Pictures from: (http://your-tech-assistant.eltex-pipe.com)
Degradation of pipeline due to corrosion and
fatigue
Unwanted plantshutdowns
Cost due toinspection &
repair
Cost due to loss of
production
Cost due to impact on
environment
Problem:Cost of corrective maintenance
Solution:Predictive maintenance
Event
Consequences
Leaks & ruptures
1st Annual PI Partner Schools Research Workshop, January 6-7, 2010 4
142

5
Corrosion-Fatigue in Pipes
PP
t
Pmean
Pmax
Pmin
�
t
�mean
�max
�min
�� t
ticknesstdiameterDDt
tPD
����� ;;1;2
�
1st Annual PI Partner Schools Research Workshop, January 6-7, 2010 5
Corrosion-Fatigue Modeling Approach
1st Annual PI Partner Schools Research Workshop, January 6-7, 2010 6
pitcrack dtda
dtda
���
���
��
�
The criterion for transition :
Corrosion is Dominant Fatigue is Dominant
143

Damage-Endurance Reliability Models
P(Damage Endurance) � g(x)dx0
s
�������
������
f (s)ds0
�
�
DistributionOf Endurance
g(s)
Distribution Of Damage
f(s)
AgingAging
Possibility of Failure
s
1st Annual PI Partner Schools Research Workshop, January 6-7, 2010 7
Probabilistic Fracture Mechanics Approach to Fatigue Reliability
Critical Crack size
Crac
k Si
ze
Life (Cycles)
InitialCrack size
TTF Distribution
N1 N2NALT
ALT
Damage-Endurance Model
1st Annual PI Partner Schools Research Workshop, January 6-7, 2010 8
144
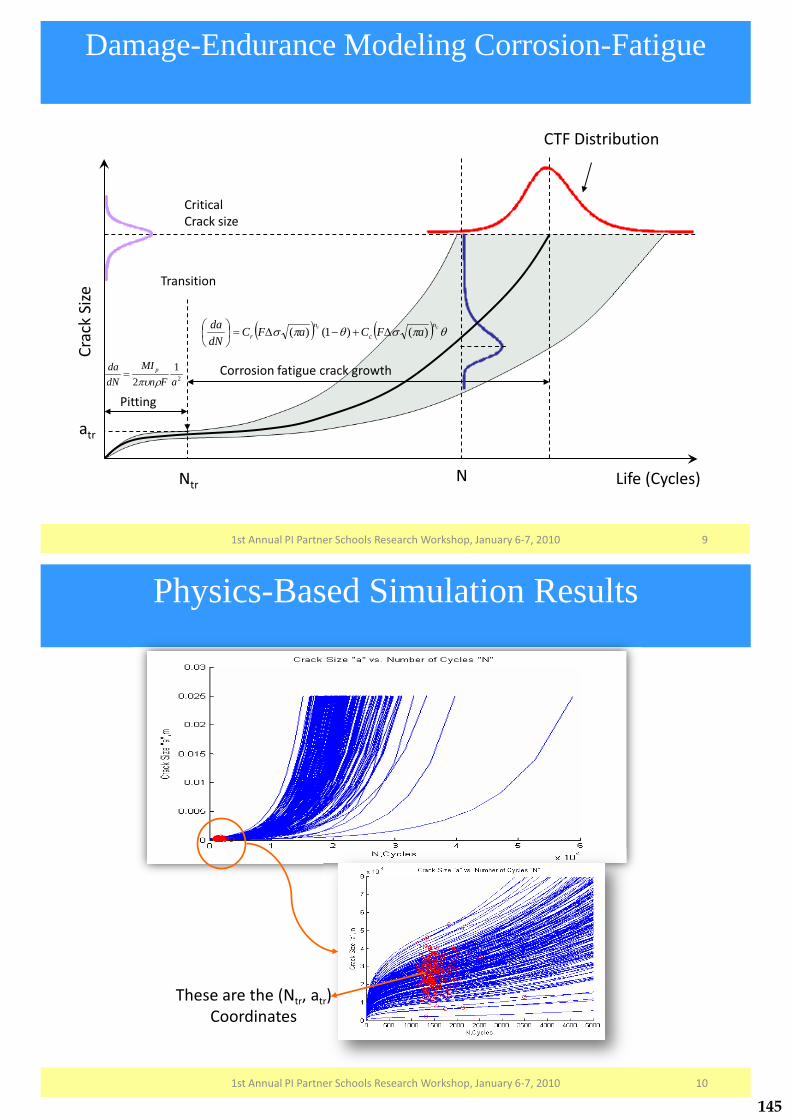
Damage-Endurance Modeling Corrosion-Fatigue
2
12 aFn
MIdNda p
����
Critical Crack size
Crac
k Si
ze
Life (Cycles)
Transition
Pitting
Corrosion fatigue crack growth
CTF Distribution
N
� � � � ������ cr n
c
n
r aFCaFCdNda )()1()( ������
��
�
Ntr
atr
1st Annual PI Partner Schools Research Workshop, January 6-7, 2010 9
Physics-Based Simulation Results
These are the (Ntr, atr)Coordinates
1st Annual PI Partner Schools Research Workshop, January 6-7, 2010 10
145

Semi-Empirical Simplified Model Development
Find the correlation of A & B with the physical parameters of the pipeline:
� Loading Stress “�”
� Loading Frequency “�”
� Temperature “T”
� Flow Characteristic “C” (e.g., Ip, [Cl-], pH, …)
,...),,(e.g.constantsmodelof vector N,...)(e.g. timeofindex
],...)[Cl,,T,(e.g.variablesasize,crack e.g.
),(,
i
-
BAtvD
tvfDDamage
i
i
ii
�
�
!"!!
!
"�
1st Annual PI Partner Schools Research Workshop, January 6-7, 2010 11
L(ai) = LN(�i,�i)�i= ln[f(si, Ti���i, Ipi, Ni)]
ai � A# si0.182 # vi
�0.288 # Ipi0.248 # Ni
1/ 3 � B # si3.24 # vi
�0.377 # Ipi0.421 # Ni
2 # e(4$10�10 #si2.062 #vi
0.024 #Ni )% &where a � crack size, � load frequency, s � stress amplitude ,Ip � Current int ensity, N � cycle No.
'()
*+, #####�####��
#�� ###�$�� 2)024.0062.210104(2421.0377.024.33/1248.0288.0182.0
2 ))ln((ln2
1exp2
1)()( NvseNIpvsBNIpvsAaa
afaL���
N,Cycles
Cra
ck S
ize
"a",m
Harsh Conditions
Moderate Conditions
Use-Level Conditions
Proposed Simple PoF-Based Corrosion-Fatigue Semi-Empirical Model
crack size vs. stress, cycle, etc.
1st Annual PI Partner Schools Research Workshop, January 6-7, 2010 12
146

Data Collection: Experimental Validation
Corrosion-Fatigue Testing
Set-Up (Cortest Test Facility)
Recirculating Fluid Tank
Autoclave
Motro Assembly Data
Acquisition Tower
1st Annual PI Partner Schools Research Workshop, January 6-7, 2010 13
Cortest Corrosion-Fatigue Testing Results• Crack length vs. number of cycle from Cortest corrosion-fatigue testing:
– in sea water of 250 ppm Na2S2O3 -5H2O at 383 K, and 100 and150-MPa, – at different frequencies of 0.004 Hz and 0.00165 Hz. – Pictures from broken specimen with connected screws(for applied current and voltage) are shown at the bottom.
1st Annual PI Partner Schools Research Workshop, January 6-7, 2010 14
147

Broken specimen from Cortestcorrosion-fatigue testing
• Broken specimen (two side views plus broken surface parts)
voltage - current - connections
1st Annual PI Partner Schools Research Workshop, January 6-7, 2010 15
Model Parameter Estimation
Evidence Ni & ai
From Experiment
Likelihood function
L(ai) = LN (�i,�i)
A , B, �Prior Dist.
(Unifrom Non Informative)
WinBUGSProgram
Posterior Dist.A , B, �
A sample: 27000
8.20E-5 8.40E-5 8.60E-5 8.80E-5
0.05.00E+51.00E+61.50E+6
B sample: 27000
0.0 2.0E-15 4.0E-15 6.0E-15
0.02.5E+145.0E+147.5E+141.0E+15
s2 sample: 27000
4.0 4.5
0.0 1.0 2.0 3.0 4.0
�A = -9.34A
�A = 7.41� 10-3
�B = -34.524B
�B = 0.4686
Posterior Marginal Lognormal Distributions and s, A & B
�s2 = 4.468s2
�s2 = 1188
Bayesian Inference Framework using Markov ChainMonte Carlo Simulation Approach
1st Annual PI Partner Schools Research Workshop, January 6-7, 2010 16
148

Reliability and Health Monitoring Application
Frequency of Exceedance for Each Observed Number of Pits in the Refinery Pipeline.
The new frequency of exceedance for the bulk pipeline is estimated to be 548 pits/25 yrs life of pipeline!!!! �Drastically Increased
A harsh pipeline environment:
� Higher Loading Stress
of Pits in the Refinery Pipeline.
1 2 3 4 5 6 7 8 9 100
0.2
0.4
0.6
0.8
1
1.2x 10
-3
# of Pits
Freq
uenc
y
1st Annual PI Partner Schools Research Workshop, January 6-7, 2010 17
Reliability and Health Monitoring Application (Cont.)
Run simulation
Using proposed Empirical Model
� “ai” Lognormal distribution:
�= -5.47 ; �=0.06
� “ai” Lognormal distribution:
3.5 4 4.5 5 5.5 6 6.5 7 7.5
x 10-3
0
0.01
0.02
0.03
0.04
0.05
0.06
0.07
Crack Size,a (m)
PD
F
1st Annual PI Partner Schools Research Workshop, January 6-7, 2010 18
149

Pitting Corrosion (Phase II)
• With Collaboration from PI Summer Interns Abdullah M. Al Tamimi & Mohammed MousaMohamed Abu Daqa
1st Annual PI Partner Schools Research Workshop, January 6-7, 2010 19
Background
Pitting Corrosion (X70Carbon Steel)• Pitting Corrosion: An electrochemical oxidation reduction process, which
occurs within localized holes on the surface of metals coated with a passive film.
• It might be accelerated by chloride, sulphate or bromide ions in the electrolyte solution.
• Pitting corrosion has a great impact on the oil and gas industry. • There are three main stages for the pitting corrosion to occur:
1-Pit Initiation
2- Pit Propagation
3-Fracture:
201st Annual PI Partner Schools Research Workshop, January 6-7, 2010
150

Objectives of Pitting Corrosion • Objectives
1. Measuring pits depth, 2. Measuring pits density, and 3. Measuring the mass loss.
• Two Corroding Environments (X70 Carbon Steel at 323 K) :- H2S = Na2S2O3-5H2O with 100
100ppm, 150ppm, 200ppm, 300ppm and 400ppm concentration, in 5,10, 24 hours time period;- Chloride(Sea Water) with 100
100ppm, 150ppm, 200ppm, 300ppm and 400ppm concentration, in 5, 10, 24 hours time period.
211st Annual PI Partner Schools Research Workshop, January 6-7, 2010
Experimental Setup/1• The scheme of the experimental setup:
221st Annual PI Partner Schools Research Workshop, January 6-7, 2010
151
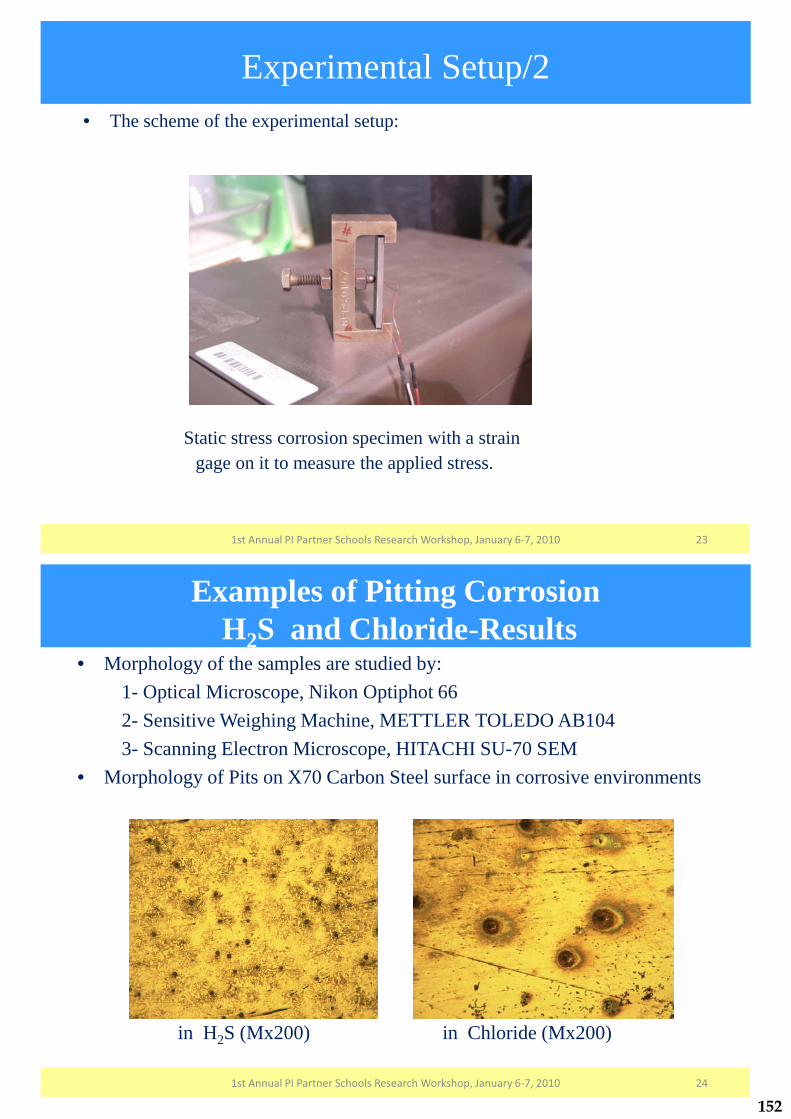
Experimental Setup/2• The scheme of the experimental setup:
Static stress corrosion specimen with a strain gage on it to measure the applied stress.
1st Annual PI Partner Schools Research Workshop, January 6-7, 2010 23
Examples of Pitting CorrosionH2S and Chloride-Results
• Morphology of the samples are studied by: 1- Optical Microscope, Nikon Optiphot 662- Sensitive Weighing Machine, METTLER TOLEDO AB1043- Scanning Electron Microscope, HITACHI SU-70 SEM
• Morphology of Pits on X70 Carbon Steel surface in corrosive environments
in H2S (Mx200) in Chloride (Mx200)
1st Annual PI Partner Schools Research Workshop, January 6-7, 2010 24
152

Pitting Depth of X70 Carbon Steel (H2S and Chloride-Results)
• Pit depths for unstressed samples (left for H2S, right for Chloride) followed Weibull distributions.
Pit Depth Distribution 400 ppm
1st Annual PI Partner Schools Research Workshop, January 6-7, 2010 25
)99.11,55.6(~2
mWeibD SH -./ �� )68.57,32.1(~][ mWeibD Cl -./ ���
Pitting Density of X70 Carbon Steel (H2S and Chloride-Results)
• Pit densities followed the lognormal distributions.
• Pit Density distribution 400ppm, 5hours are given in [pits/cm2]The actual mean: [8 pits/cm2] (left), [9 pits/cm2] right
1st Annual PI Partner Schools Research Workshop, January 6-7, 2010 26
)30.0,18.2(~][ ��� �-LNPD Cl)39.0,06.3(~][ 2�� �-LNPD Sh
153
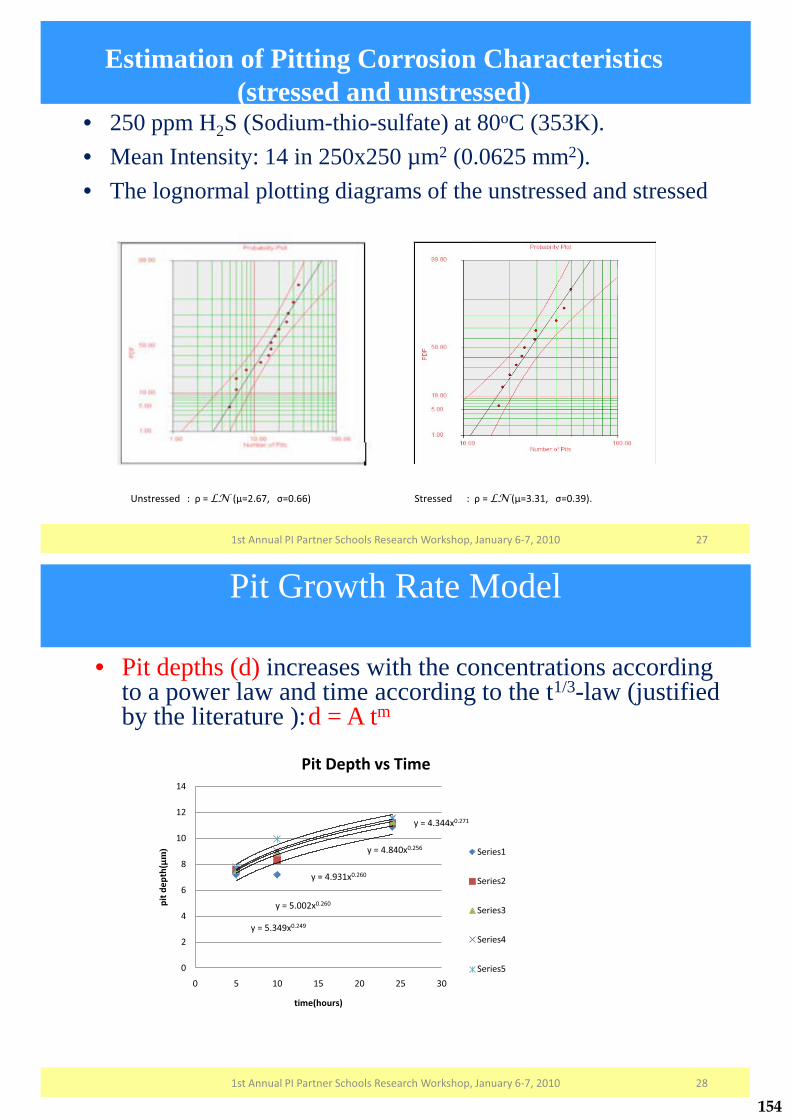
Estimation of Pitting Corrosion Characteristics (stressed and unstressed)
• 250 ppm H2S (Sodium-thio-sulfate) at 80oC (353K). • Mean Intensity: 14 in 250x250 µm2 (0.0625 mm2). • The lognormal plotting diagrams of the unstressed and stressed
1st Annual PI Partner Schools Research Workshop, January 6-7, 2010 27
�� ����������������LN ������������������ Stressed : � = LN (μ=3.31, �=0.39).
Pit Growth Rate Model
• Pit depths (d) increases with the concentrations according to a power law and time according to the t1/3-law (justified by the literature ):d = A tm
1st Annual PI Partner Schools Research Workshop, January 6-7, 2010 28
y = 4.344x0.271
y = 4.840x0.256
y = 4.931x0.260
y = 5.002x0.260
y = 5.349x0.249
0
2
4
6
8
10
12
14
0 5 10 15 20 25 30
pit d
epth
(μm
)
time(hours)
Pit Depth vs Time
Series1
Series2
Series3
Series4
Series5
154
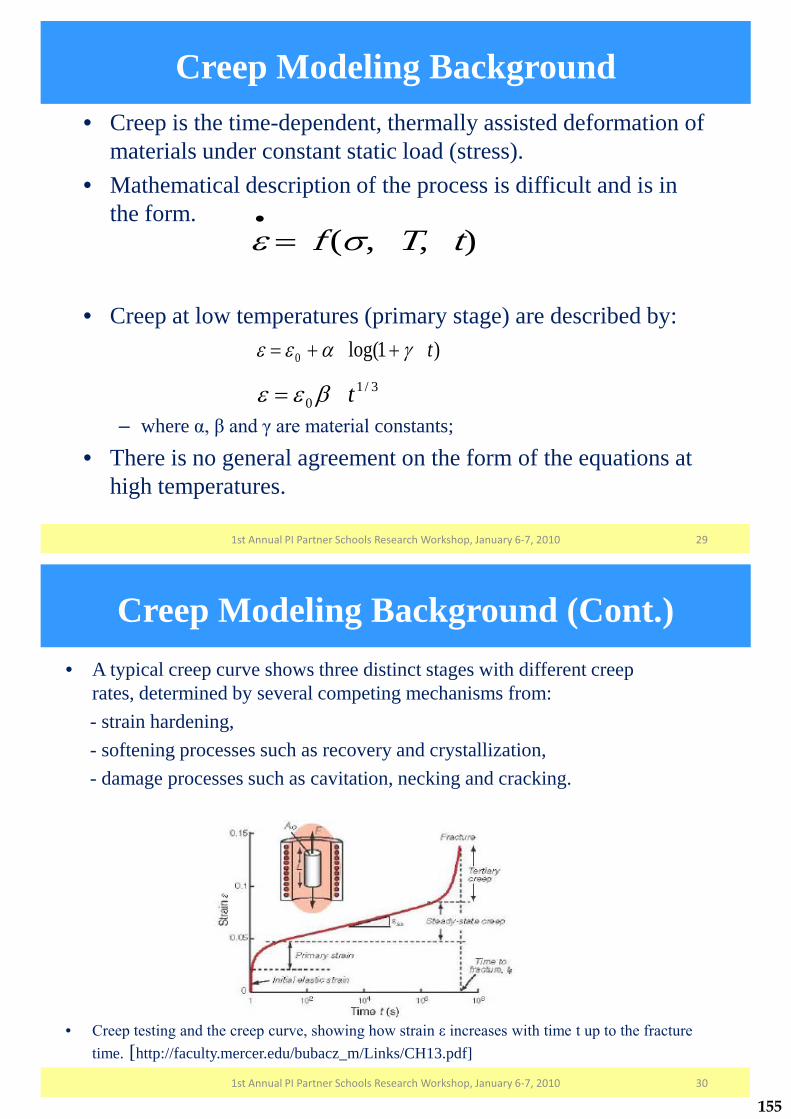
Creep Modeling Background
1st Annual PI Partner Schools Research Workshop, January 6-7, 2010 29
• Creep is the time-dependent, thermally assisted deformation of materials under constant static load (stress).
• Mathematical description of the process is difficult and is in the form.
• Creep at low temperatures (primary stage) are described by:
– where ��������������� �����constants;
• There is no general agreement on the form of the equations at high temperatures.
�0
� f (�, T, t)
)1log(0 t1.�� ���
3/10 t/�� �
Creep Modeling Background (Cont.)• A typical creep curve shows three distinct stages with different creep
rates, determined by several competing mechanisms from:- strain hardening,- softening processes such as recovery and crystallization, - damage processes such as cavitation, necking and cracking.
• ����� �� �������� ��������������������������� ����������������� �� ���� ���� �� ������ ���time. [http://faculty.mercer.edu/bubacz_m/Links/CH13.pdf]
1st Annual PI Partner Schools Research Workshop, January 6-7, 2010 30
155

Creep Approach Modeling
• Only literature search completed with some preliminary experimental preparations. The approach includes 1. Using simulation of detailed models propose an
empirical model.2. Perform accelerated creep tests. 3. Use experimental results to assess parameters and
uncertainties of the proposed empirical model accelerated life testing.
1st Annual PI Partner Schools Research Workshop, January 6-7, 2010 31
Creep Accelerated Test Set up• The creep test is carried out by applying a constant load to a
tensile specimen maintained at a constant temperature, (according to ASTM E139-70).
[http://www.sut.ac.th/engineering/Metal/pdf/MechMet]
1st Annual PI Partner Schools Research Workshop, January 6-7, 2010 32
156

Creep and SCC Experimental Setup
• Two chambers designed for creep and SCC tests under different environmental conditions and applied stress:
• Left: chamber for Dog-bone• Right: chamber for CT-specimen (The prototypes specimens at work, installed on MTS-
machine).
Dog-bone –specimen CT-specimen
1st Annual PI Partner Schools Research Workshop, January 6-7, 2010 33
Stress Corrosion Cracking (SCC)
• SCC is a combination of static tensile stress below yield and corrosive environment.• Tensile stresses may be external forces, thermal stresses, or residual stresses. • The kinetics of SCC depends on three necessary conditions:
1. The chemical and metallurgical state of the material (chemical composition , thermal conditions, grain size, presence of secondary phases and precipitate, etc.)
2. The environmental conditions (environmental composition, temperature, pressure, pH, electrochemical potential, solution viscosity etc.)
3. Stress state ( uniaxial, triaxial, etc.) and on crack geometry of the material.
1st Annual PI Partner Schools Research Workshop, January 6-7, 2010 34
157
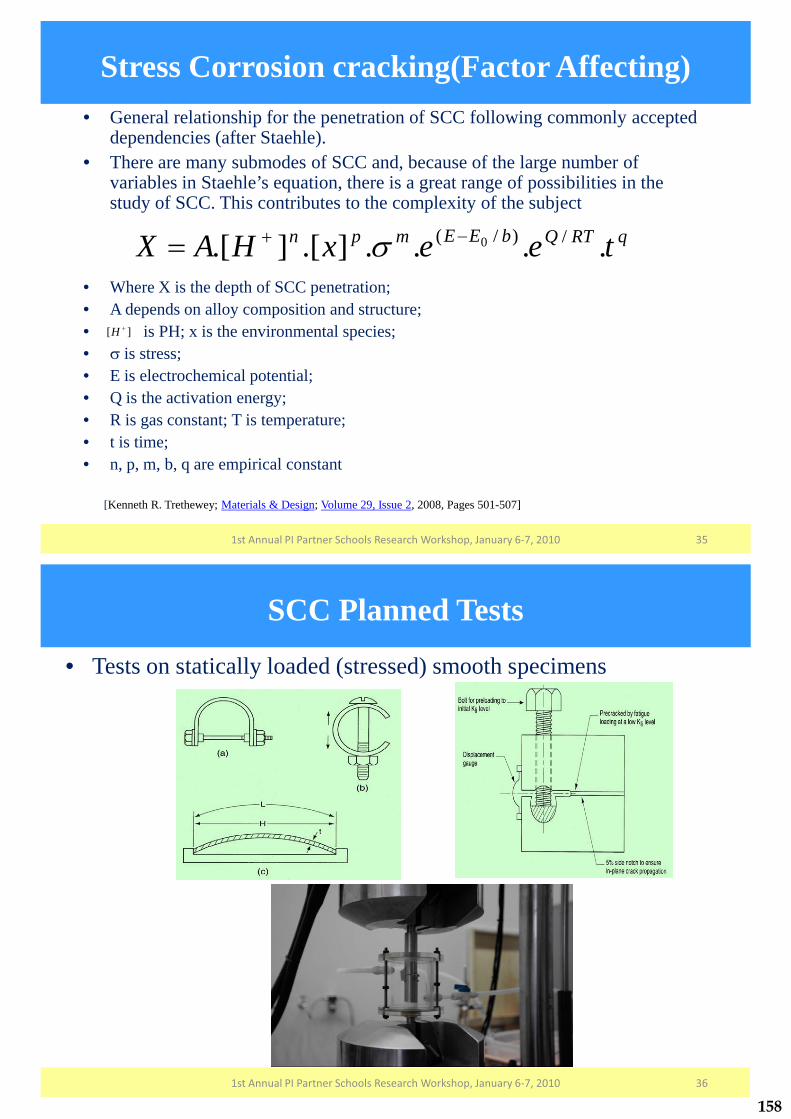
Stress Corrosion cracking(Factor Affecting)• General relationship for the penetration of SCC following commonly accepted
dependencies (after Staehle).• There are many submodes of SCC and, because of the large number of
variables in Staehle’s equation, there is a great range of possibilities in the study of SCC. This contributes to the complexity of the subject
• Where X is the depth of SCC penetration; • A depends on alloy composition and structure; • is PH; x is the environmental species; • � is stress; • E is electrochemical potential; • Q is the activation energy; • R is gas constant; T is temperature; • t is time; • n, p, m, b, q are empirical constant
[Kenneth R. Trethewey; Materials & Design; Volume 29, Issue 2, 2008, Pages 501-507]
1st Annual PI Partner Schools Research Workshop, January 6-7, 2010 35
qRTQbEEmpn teexHAX ....].[].[ /)/( 0��� �
][ �H
SCC Planned Tests
• Tests on statically loaded (stressed) smooth specimens
1st Annual PI Partner Schools Research Workshop, January 6-7, 2010 36
158

Planned Tests on statically loaded pre-cracked samples
• Fracture mechanics testing for SCC conducted with either :– a constant load or – with a fixed crack opening displacement,
• the da/dt is measured.• The crack depth is determined as a function of time and the stress intensity. • K1SCC is the min. stress intensity below which SCC does not occur.
CT- specimen for fracture- mechanic-type testing where crack velocity vs. stress Schematic plot of data from fracture- fracture-intensity is obtained type Testing. KISCC is shown to
1st Annual PI Partner Schools Research Workshop, January 6-7, 2010 37
Conclusions
• Reliability models for Corrosion-Fatigue has been developed, verified and demonstrated
• Pitting corrosion is nearly completed with models developed for pitting depth and density
• Literature search for creep models is completed, model developed and validation to follow
• SCC modeling will start in the future--Preliminary test planning is performed
1st Annual PI Partner Schools Research Workshop, January 6-7, 2010 38
159

PI Team: A. Almansoori, S. Al Hashimi and N. Al QasasUMD Team: W. Hu, S. Azarm and P.K. Kannan
Acknowledgement: P. Kamaha, M. Li
PI Partners PI Sponsors
1st Annual PI Partner Schools Research Workshop
The Petroleum Institute, Abu Dhabi, U.A.E.
January 6-7, 2010
Robust Optimization of Engineering-Business Decisions for Petrochemical Systems
Presentation Outline
• Objective and Tasks• Integrating Engineering and Business Decisions
– Roadmap– Dashboard
• Multi-Objective Robust Optimization (MORO)– Developed approaches– Timeline of improvements
• Case study and other test results• Conclusions
21st Annual PI Partner Schools Research Workshop, January 6-7, 2010
160

Project Objective
Objective: To provide a roadmap for integration of engineering and businessdecisions and an approach for obtaining multi-objective optimum and robustsolutions under uncertainty for petrochemical systems
Market, e.g., price and operations uncertaintyBusiness
decisions
Multi-Objective Robust
Optimization (MORO)
Maximize Profit (business)
and purity (engineering)
Engineeringdecisions
Tasks:1. Integrate engineering and business decisions2. Obtain multi-objectively optimum and robust solutions -- solutions that
are “insensitive” to uncertainty
31st Annual PI Partner Schools Research Workshop, January 6-7, 2010
Integrate engineering and business decisionsTask 1:
41st Annual PI Partner Schools Research Workshop, January 6-7, 2010
161

Integration Roadmap
Integration
Dashboard
Engineering Decisions Business Decisions
Business Analysis Model
Engineering Analysis Model
Robust Optimization
GoalsManagement
Decision Flow
Info
rmat
ion
Flow
Uncertainty
51st Annual PI Partner Schools Research Workshop, January 6-7, 2010
Engineering and Business Analysis Models
Decision variables
x1 Daily crude oil purchase (bbl/d)
x2 Percentage of crude oil sold to external market
x3 Percentage of finished product for inventory
x4 Percentage of finished product sent to external market
x5 Percentage of inventory released to external market
x6 Flow rate of recycled stream
x7 Phthalic anhydride column minimum reflux ratio
Assumptions
Case study is based on only one product
Yield of naphtha is 4%
Cost associated with inventories and stock out
Integration
Dashboard
Engineering Decisions Business Decisions
Business Analysis Model
Engineering Analysis Model
Robust Optimization
GoalsManagement
Decision Flow
Info
rmat
ion
Flow
Uncertainty
Inventory
External Market
Local Market Murban
Oil
Crude External Market x5
x3
x4
x2
x1
Other products 100-x3-x4
Phthalineanhydride
Crude Distillation
Aromatic Complex
Naphtha
Reactor-Distillation
oxylene
Business Analysis Model
Engineering Analysis Model
Switc
h co
nden
ser
Reactor
Phth
alic
anhy
drid
e
colu
mn
Mal
ice
anhy
drid
eco
lum
n
Phthalic anhydride product
Malice anhydride product
O-xylene
Air
Distillated steam recycle
Water, CO2 and O2
DSrct
Phthalic anhydrideMalice anhydride O-xylene unreactedOthers…
DSdis
x6
x7
Busi
ness
Eng.
Engineering variables
Parameters
feed flow rate
Market data
Business variables
Profit
Product purity
Operating cost & product flow rate
Feed flow rate
61st Annual PI Partner Schools Research Workshop, January 6-7, 2010
Operating cost & product flow rate
162

Robust Optimization of Engineering-Business Model
Robust Optimization Problemobjectives: maximize profit
maximize product purityby changing: engineering and business variablessubject to: constraints on inventory, production capacity, with
price and parameter uncertainty
NetLogo Matlab
Integration
Dashboard
Engineering Decisions Business Decisions
Business Analysis Model
Engineering Analysis Model
Robust Optimization
GoalsManagement
Decision Flow
Info
rmat
ion
Flow
Uncertainty
71st Annual PI Partner Schools Research Workshop, January 6-7, 2010
Robust OptimizationEngineering
Analysis ModelBusiness
Analysis ModelMarket
data
Business variables
Engrg.variables
Parameters
Feed flow rate
operating cost &
Product flow rate
Profit Product purity
Reactor model
Phthalic anhydridedist. column
model
Malice anhydride dist. column
model
Reactor model
anhydridedist. column
model
anhydride dist. column
model
haalic
alice a
Decision Support Role of Dashboard
Dashboard is an interface between management and engineering-business decision model
Dashboard
Integration
Dashboard
Engineering Decisions Business Decisions
Business Analysis Model
Engineering Analysis Model
Robust Optimization
GoalsManagement
Decision Flow
Info
rmat
ion
Flow
Uncertainty
Simulation
Real firm-marketinteractions
Difference
Management
Decision Maker
Dashboard
Optimization
Adjustments
Expected value of performance
Current value of performance
Dec
isio
ns
mememememememememememmm ntntntntntntttntntntntntn
81st Annual PI Partner Schools Research Workshop, January 6-7, 2010
163

Dashboard’s Main Functions“Firm Performance”: shows real-time (actual) data/figures
“Simulation Result”: shows estimates based on analysis models
“Recommended Decisions”: shows optimal decisions obtained from analysis models
Management uses “Decision Control Panel” to implement actual decisions
“Real Data”: updates firm performance
“Simulation”: run business and engineering analysis models
“Optimization”: obtain optimal decisions
Previous Dashboard interface (old version,
August 2009)
Enhanced Dashboard interface (new version)
Preliminary integration of business and engineering decision-making modules in the “Decision Control Panel”
91st Annual PI Partner Schools Research Workshop, January 6-7, 2010
Obtain multi-objectively optimum and robust solutions
Task 2:
101st Annual PI Partner Schools Research Workshop, January 6-7, 2010
164
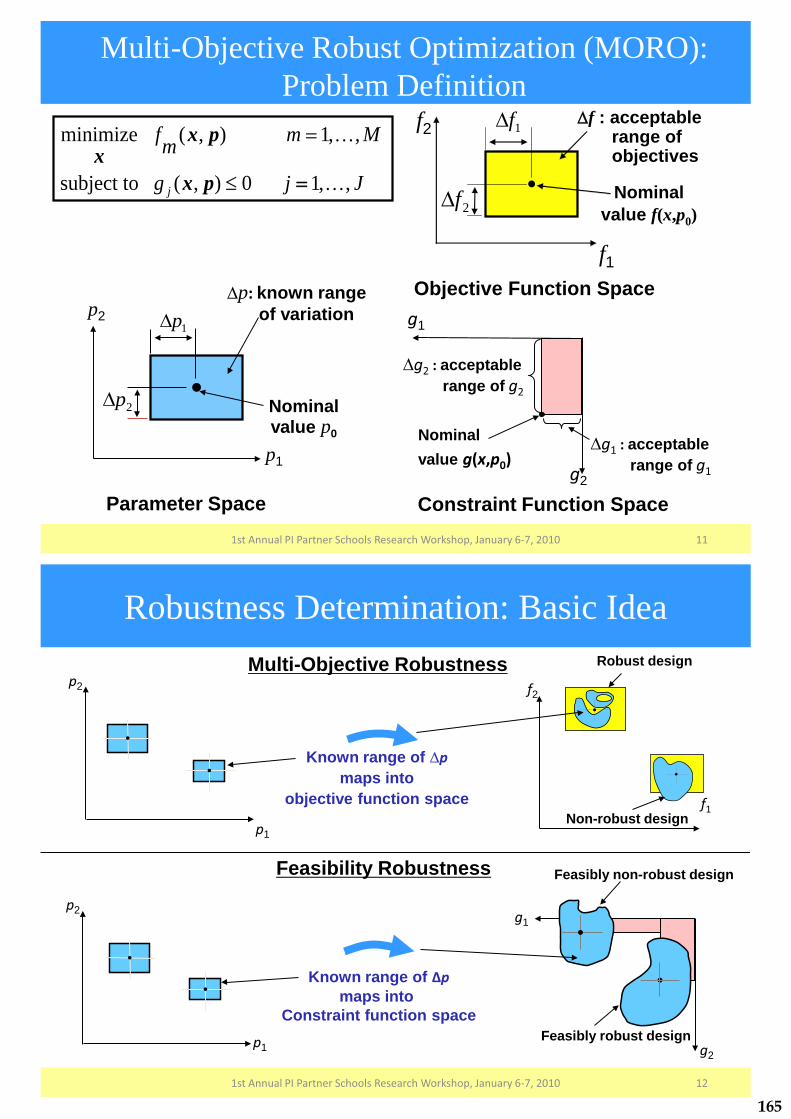
Multi-Objective Robust Optimization (MORO): Problem Definition
Jjg
Mmmf
j ,,10),(subject to
,,1),(minimize
�
�
���
�
px
pxx
�p: known rangeof variation
Nominal value p0
1p�
p1
p2
Parameter Space
2p�
g2
g1
�g2 : acceptable range of g2
Nominal value g(x,p0)
�g1 : acceptable range of g1
Constraint Function Space
���f : acceptable � range of � objectives
f1
f2
Nominal value f(x,p0)
Objective Function Space
1f�
2f�
111st Annual PI Partner Schools Research Workshop, January 6-7, 2010
Multi-Objective Robustness
Known range of �pmaps into
objective function space
Robust design
Non-robust designp1
p2
f1
f2
Feasibly robust design
Feasibly non-robust design
g2
g1
p1
p2
Known range of �pmaps into
Constraint function space
Feasibility Robustness
Robustness Determination: Basic Idea
121st Annual PI Partner Schools Research Workshop, January 6-7, 2010
165

Multi-Objective Robust Optimization (MORO): Approaches
• Three approaches have been developed/implemented with improvements since Jan 2008:
– Previous MORO approach (developed before the start of this project – implemented for PI project in Jan 2008)
– Improved MORO approach (developed and implemented during mid 2008 until August 2009)
– Approximation assisted improved MORO approach (developed and implemented since Aug 2009)
131st Annual PI Partner Schools Research Workshop, January 6-7, 2010
f1
f2
Previous MORO Approach*
LL
i MJir
ppp
ppxpxp
���s.t.
,...,1)�,(max),WCV(
��
������
JjMmfm
,...,1,0),( WCVs.t.,...,1),,(min
���
pxpx
Upper Level
Lower Level
intermediate design
robustness information
lower level evaluates robustness for each trial design from upper level
upper level subproblem searches for trial designs
�
�
�
�����
��� ���
M,...,JJifff
,...,Jigr JiJiJi
i
i
1;�),(-)�,(
1);�,(pxppx
ppx
trial designs
f1
f2
lower level subproblem requires a large # of function calls
141st Annual PI Partner Schools Research Workshop, January 6-7, 2010
* Li, M., Azarm, S., and Boyars, A., 2006, “A New Deterministic Approach Using Sensitivity Region Measures for Multi-Objective Robust and Feasibility Robust Design Optimization,” Journal of Mechanical Design, 128(4), 874-883
166

Upper Level
Lower Level
RPPCollection
Improved MORO Approach
LL
i MJir
ppp
ppxp
���s.t.
,...,1)�,(maxWCV
��
������
Mmfff
JjgMmf
mmm
j
m
,...,1,0),(),(
,...,1,0),(s.t.,...,1),,(min
�������
�����
pxppx
ppxpx
f1
f2
f1
f2
upper level obtains Pareto optimal solutions
lower level evaluates robustness for optimal solutions
optimal solutions
collects Robust Pareto Points (RPPs)
lower level subproblemrequires fewer # of function calls compared to “Previous MORO Approach”
151st Annual PI Partner Schools Research Workshop, January 6-7, 2010
Approximation Assisted Improved MORO Approach
Kriging meta-model predicts f for an “unobserved” point, given actual value for “observed” points
upper and lower level subproblems require much less # of function calls because they are approximated!
RPPs collection is used as “observed points” to improve
accuracy of metamodel
161st Annual PI Partner Schools Research Workshop, January 6-7, 2010
f
xobserved points
unobserved points
Meta Model
Upper Level
Lower Level
RPPs Collection
Compact models replace (expensive) functions in the upper and lower level
subproblems
167

MORO Approaches:Timeline of Improvements
Jan 2008 Nov 2008 Aug 2009 Jan 2010
Order of magnitude faster
Several orders of magnitude faster
Slow
Upper Level
Lower Level
intermediate design
robustness information
Previous MORO
Improved MORO
Approximation AssistedImproved MORO
e n
Time
Improvement
Upper Level
Lower Level
RPPCollection
171st Annual PI Partner Schools Research Workshop, January 6-7, 2010
Meta Model
Upper Level
Lower Level
RPPs Collection
Case Study
x6: Target DSTgt(kmol/h) [100 400]
x1: Crude Input (bbl/d) [50,000 100,000]
Dec
isio
n Va
riab
le
x2: Percentage of crude export [0 100%]
x7: Phthalic anhydride column Minimum reflux ratio Rmin in “phthalic colum” [0.1 5]
Engineering-Business Model
Uncertainty
p3: Price of Phthalic$1000/ton [±5%]
p1: Recycled stream [±8%]
p2: Phthalicanhydride column pressure 0.5 bar
[±0.5%]
Robust System Performance
Optim
ization
Maximize Profit
Maximize purity
Approximation Assisted Improved MORO
Deterministic Optimization
el
x3: Percentage of product inventory [0 100%]
x4: Direct sale to external market [0 100%]
x5: Inventory sale to external market [0 100%]
Engineering Analysis Model
BusinessAnalysis Model
Reactor model
Phthalic anhydridedist. column
model
Malice anhydride dist. column
model
Reactor model
anhydridedist. column
model
anhydride dist. column
model
haalic
alice a
E
Previous MORO
Improved MORO
181st Annual PI Partner Schools Research Workshop, January 6-7, 2010
168

Case Study:Results
Previous Approach Improved Approach Approximation Assisted Improved Approach
Reactor-distillation example 897,104 57,368 178
Computational cost (# of function calls) for the reactor-distillation example:
• Robust Pareto solutions obtained by different approaches compares well
• Computational cost by the approximation assisted approach is orders of magnitude less than the previous and improved approaches
Negative Profit ($)
Neg
ativ
e Pu
rity
(Pht
halic
)-0.9698
-0.9696
-0.9694
-0.9692
-0.969
-0.9688
-0.9686
-0.9684
-0.9682
-5,000,000 -4,500,000 -4,000,000 -3,500,000 -3,000,000 -2,500,000
Determisticprevious MOROImproved MOROApproximation assisted improved MORO
x1 : 99950(bbl/d)x2 : 66%x3 : 47%x4 : 13%x5 : 82%x6 : 329 (kmol/h)x7 : 3.97
x1 : 99805 (bbl/d)x2 : 71%x3 : 31%x4 : 57%x5 : 54%x6 : 247(kmol/h)x7 : 2.76
191st Annual PI Partner Schools Research Workshop, January 6-7, 2010
Other Test Examples:Results
f1
f2
0.4 0.5 0.6 0.7 0.8 0.9 10
1
2
3
4
5
6
7
8
)6.0,3.0(]3.0,3.0[],5,0[],1,1.0[
0)(91)(0)(96)(s.t.
/)()(min
)(min
21
212
211
122
11
�� ������������
��
�
AOVRpxx
xppxxgxppxxg
xxpxf
pxxf
x
x
f1
f2
0 0.2 0.4 0.6 0.8 10
0.2
0.4
0.6
0.8
1
1.2
1.4
)15.0,1.0(]2.0,2.0[],1,0[
4/)(9)(1)(:..
)(/)(1)(()(min
)(min
21
5
2
12
11
�� �
������
��
�
��
AOVRpx
xxppxgts
xgxfxgxf
xxf
i
ii
f1
f2
0 0.2 0.4 0.6 0.80.2
0.4
0.6
0.8
1
1.2
1.4
1.6
)3.0,1.0(]2.0,2.0[],1,0[
4/))((91)(:..
))(/)(1)(()(min)(min
21
5
2
212
11
��
����
��
�
��
AOVRpx
xxpxgts
xgxfxgxfxxf
i
ii
f1
f2
0 0.2 0.4 0.6 0.8 10
0.5
1
1.5
2
2.5
)15.0,3.0(]2.0,2.0[],1,0[
4/))((91)(:..
]))(/)((1)[(()(min
)()(min
21
5
2
2
212
11
�� �
���
��
����
��
AOVRpx
xxxgts
xgxfxgxf
ppxxf
i
ii
Deterministic previous MORO improved MORO Approximation assisted improved MORO
# Previous MORO approach Improved MORO approach Approximation assisted improved MORO approach
max min mean max min mean max min mean1 1,779,343 2,343,413 2,021,219 223,437 287,661 257,209 251 560 457
2 3,051,525 3,752,498 3,355,853 198,524 236,391 220,588 375 502 466
3 3,233,346 3,843,556 3,499,124 137,727 268,945 186,358 458 864 657
4 3,893,237 4,445,568 4,279,752 175,441 257,744 193,740 474 741 614
201st Annual PI Partner Schools Research Workshop, January 6-7, 2010
169

Project Status
• Met with our PI partners on a monthly (or more) basis by MSN
• Almansoori (PI) visited University of Maryland (UMD) during July 2009:– Worked and interacted with UMD students/faculty on the
research project– Explored possibility of a joint graduate level course in
engineering-business decision making• Azarm and Kannan visited PI in August 2009 and met and
presented an update of PI-UMD work to ADONC OP CO: ADGAS, ADCO, ZADCO, Takreer, and Borouge– Several companies indicated interests. Work is ongoing with
Takreer for problem definition and exchange of data in “Optimizing of Carbon emission in a refinery”
211st Annual PI Partner Schools Research Workshop, January 6-7, 2010
Project Status (cont’d)
• Work Accomplished– Developed an integrated engineering-business decision support
framework with dashboard that can help enhance the effectiveness and quality of decisions for petrochemical system problems
– Significantly improved the computational effort in multi-objective simulation-based optimization under uncertainty
• Work Remaining– Extend Approximation Assisted Robust optimization (AARO) to
handle petrochemical system problems with multiple subsystems, each having multiple objectives
– Apply AARO to problems in carbon emissions (w/ Takreer)
221st Annual PI Partner Schools Research Workshop, January 6-7, 2010
170

Summary• Interim Conclusions
– Engineering-business optimization is crucial in efficient and cost-effective energy system management
– Approximation assisted robust optimization technique enables handling a broad class of energy system problems with significantly less computational efforts
• Expected Benefit to ADNOC/PI– Optimization models and methods that can be used for
optimizing specific systems that are in use at ADNOC facilities
– Business and engineering decisions can be ranked not only based on cost but also robustness (or “insensitivity” to uncertainty) as ADNOC plants are very integrated, will grow in the future and subject to uncertainty
231st Annual PI Partner Schools Research Workshop, January 6-7, 2010
2009 Publications that Acknowledged PI-UMD Collaboration
1. Li, G., M. Li, S. Azarm, S. Al Hashimi, T. Al Ameri and N. Al Qasas, 2009, “Improving Multi-Objective Genetic Algorithms with Adaptive Design of Experiments and Online Metamodeling,” Structural and Multidisciplinary Optimization , 37(5), 447-461.
2. W. Hu, M. L., S. Azarm, S. Al Hashimi, A. Almansoori, and N. Al-Qasas, 2009, “Improving Multi-Objective Robust Optimization under Interval Uncertainty Using Worst Possible Point Constraint Cuts,” Proceedings of the ASME International Design Engineering Technical Conferences, San Diego, CA, paper No. DETC2009-87312.
3. Li, M., S. Azarm, N. Williams, S. Al Hashimi, A. Almansoori, and N. Al Qasas, 2009, “Integrated Multi-Objective Robust Optimization and Sensitivity Analysis with Irreducible and Reducible Interval Uncertainty,” Engineering Optimization, 41(10), 889–908
4. Hu, W, M. Li, S. Azarm, A. Almansoori, , S. Al Hashimi and N. Al-Qasas, 2009, “Improving Multi-Objective Robust Optimization under Interval Uncertainty Using Approximation and Constraint Cuts”, Journal of Mechanical Design (submitted/under revision).
5. Kamaha, P., W. Hu, A. Almansoori, S. Al Hashimi, P. K. Kannan, and S. Azarm, 2009, “Corporate Dashboards for Integrated Business and Engineering Decisions in Oil Refineries: An Agent-Based Approach,” Decision Support Systems (under preparation).
241st Annual PI Partner Schools Research Workshop, January 6-7, 2010
The following statement included in our publications listed below:“The work presented in this paper was supported in part by The Petroleum Institute (PI), Abu Dhabi, United Arab Emirates, as part of the Education and Energy Research Collaboration (EERC) agreement
between the PI and University of Maryland, College Park.”
171

���������� �����������������������������������������������������������������
� �����!"�����!"�#�����
� �����#���� � � � � � ��$�#����
������������� ��� ������������ ����� ������%�������"��� #��������!����%�������!�&�
��#�����'()��*+,+
���"���#��-$��.���#���#��/�#���"��0���"���-1����2��"�/�""������
Motivation Modeling Dynamics Control Simulation Results Future Work
Fuel Cells
Fuel cells (FCs): William Grove (1839)“A fuel cell is an electrochemical ‘device’ that continuouslyconverts chemical energy into electric energy (and some heat) foras long as fuel and oxidant are supplied”
Various types of fuel cellsAFC Low T Military and space applications
PEMFC Low T Automotive applicationsPAFC Intermediate T Combined energy & power generationMCFC High T Stand alone power systemSOFC High T Stationary power production
Typical fuel for FC is H2
Challenges with H2 storage and transportation⇒ in situ H2 production
2��"�3�""��������$�����#����#���0��43��#�"��$����3�#���"�3���3���
*,���!##��"�� �����#����3%��"��5�����3%�6��7�%�$����#�����'()��*+,+
172
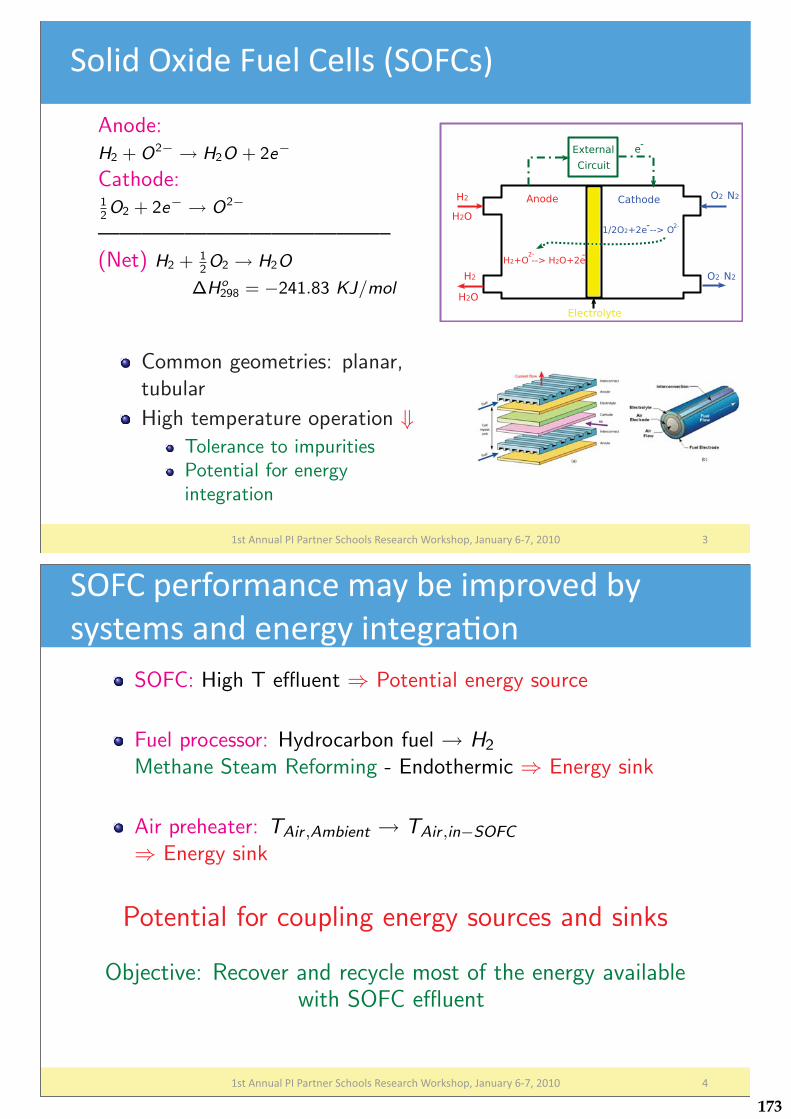
Motivation Modeling Dynamics Control Simulation Results Future Wo
Solid Oxide Fuel Cells (SOFCs)
Anode:H2 + O2− → H2O + 2e−
Cathode:12O2 + 2e− → O2−
—————————————–(Net) H2 + 1
2O2 → H2O
ΔHo298 = −241.83 KJ/mol
Common geometries: planar,tubular
High temperature operation ⇓Tolerance to impuritiesPotential for energyintegration
8,���!##��"�� �����#����3%��"��5�����3%�6��7�%�$����#�����'()��*+,+
��"���-1����2��"�/�""��9�-2/�:
Motivation Modeling Dynamics Control Simulation Results Future Work
SOFC and Energy Integration
SOFC: High T effluent ⇒ Potential energy source
Fuel processor: Hydrocarbon fuel → H2
Methane Steam Reforming - Endothermic ⇒ Energy sink
Air preheater: TAir ,Ambient → TAir ,in−SOFC
⇒ Energy sink
Potential for coupling energy sources and sinks
Objective: Recover and recycle most of the energy availablewith SOFC effluent
;,���!##��"�� �����#����3%��"��5�����3%�6��7�%�$����#�����'()��*+,+
�-2/�$��0���#3���������$��<��������������#���#������#�������#
173
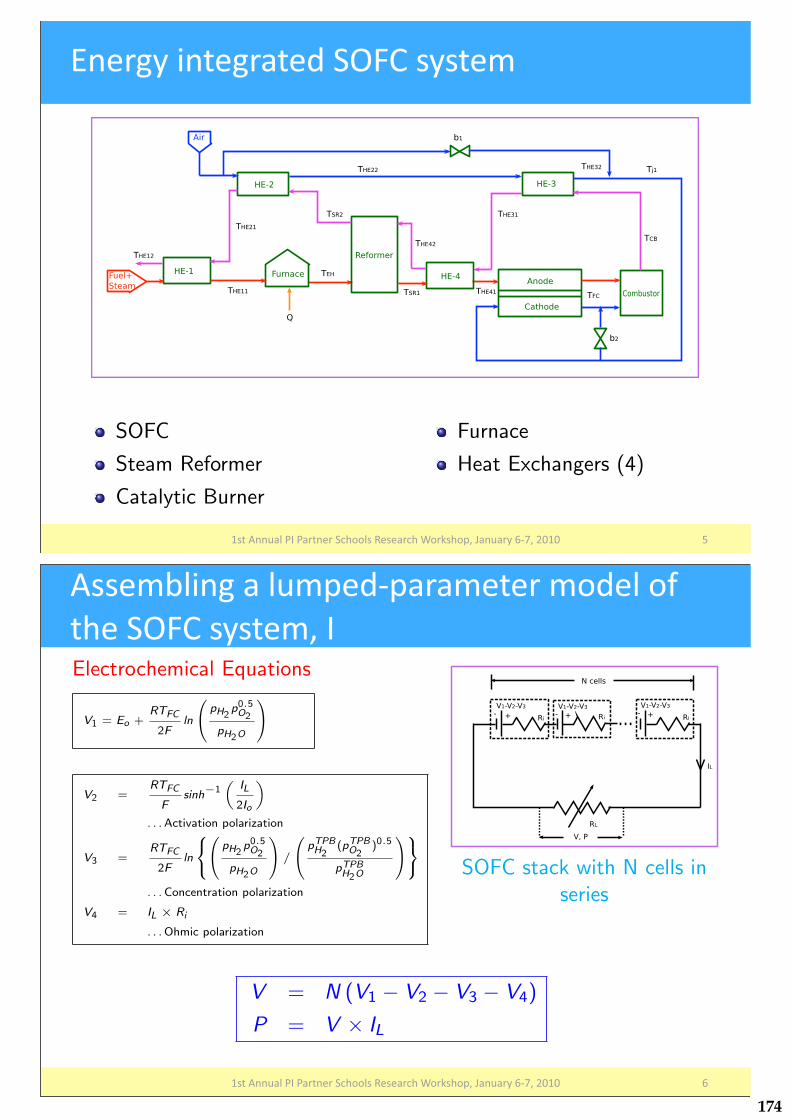
Motivation Modeling Dynamics Control Simulation Results Future Work
Energy Integrated SOFC system
SOFC
Steam Reformer
Catalytic Burner
Furnace
Heat Exchangers (4)
=,���!##��"�� �����#����3%��"��5�����3%�6��7�%�$����#�����'()��*+,+
&#������#����������-2/������
Motivation Modeling Dynamics Control Simulation Results Future Work
SOFC
Electrochemical Equations
V1 = Eo +RTFC
2Fln
0@ pH2
p0.5O2
pH2O
1A
V2 =RTFC
Fsinh−1
„IL
2Io
«
. . . Activation polarization
V3 =RTFC
2Fln
8<:
0@ pH2
p0.5O2
pH2O
1A /
0@ pTPB
H2(pTPB
O2)0.5
pTPBH2O
1A
9=;
. . . Concentration polarization
V4 = IL × Ri
. . . Ohmic polarization
SOFC stack with N cells inseries
V = N (V1 − V2 − V3 − V4)
P = V × IL
,���!##��"�� �����#����3%��"��5�����3%�6��7�%�$����#�����'()��*+,+ '
!����"�#����"�$��($�����������"��0��%���-2/��������
174

Motivation Modeling Dynamics Control Simulation Results Future Work
SOFC (contd.)
Material and energy balance equationsdpH2
dt=
nfuelRTFC
VanPFC(pH2,in − pH2) −
NRTFC
Van
IL2F
dpO2
dt=
nairRTFC
VcaPFCpO2,in − nair,outRTFC
VcaPFCpO2 −
NRTFC
Van
IL4F
dpH2O
dt=
nfuelRTFC
VanPFC(pH2O,in − pH2O) +
NRTFC
Van
IL2F
dTFC
dt=
1
ρcCp,cVc
»Qfuel,in + Qair,in − Qfuel,out − Qair,out − ΔH(TFC )
IL2F
− VIL
–
Enthalpy flow: Q(T ) =X
i
ni
Z T
Tref
Cp,i (T )dT
Cathode side exit flow: nair,out = nair − IL/4F
,���!##��"�� �����#����3%��"��5�����3%�6��7�%�$����#�����'()��*+,+ )
!����"�#����"�$��($�����������"��0��%���-2/��������
Motivation Modeling Dynamics Control Simulation Results Future Work
Steam Reformer
CH4 + H2O � CO + 3H2 ΔHo298 = +246KJ/mol
CO + H2O � CO2 + H2 ΔHo298 = −41KJ/mol
dpSRCH4
dt=
ninRTSR1
VSRPSR
pSRCH4,in − noutRTSR1
VSRPSR
pSRCH4
− mcatRTSR1
VSR
r1a
dpSRH2O
dt=
ninRTSR1
VSRPSR
pSRH2O,in − noutRTSR1
VSRPSR
pSRH2O − mcatRTSR1
VSR
(r1 + r2)
dpSRCO2
dt=
ninRTSR1
VSRPSR
pSRCO2,in − noutRTSR1
VSRPSR
pSRCO2
+mcatRTSR1
VSR
r2
dpSRCO
dt=
ninRTSR1
VSRPSR
pSRCO,in − noutRTSR1
VSRPSR
pSRCO +
mcatRTSR1
VSR
(r1 − r2)
dpSRH2
dt=
ninRTSR1
VSRPSR
pSRH2,in − noutRTSR1
VSRPSR
pSRH2
+mcatRTSR1
VSR
(3r1 + r2)
dTSR1
dt=
Qfuel,in − Qfuel,out + UASRΔTLM − mcat (r1ΔH1(TSR1) + r2ΔH2(TSR1))
ερg (TSR1)Cp,g (TSR1) + (1 − ε)ρcatCp,cat
dTSR2
dt=
1
VSR2CPM(TSR2)
`Qhot,in − Qhot,out − UASRΔTLM
´
ar1, r2 taken from Xu & Froment AIChE J 1989
,���!##��"�� �����#����3%��"��5�����3%�6��7�%�$����#�����'()��*+,+ >
?�$��($�����������"��0��%���������0����
175

Motivation Modeling Dynamics Control Simulation Results Future Work
Heat Exchangers
Heat exchangers HE1, HE2, HE3 and HE4
dTHEi1
dt=
1
VHEi1CPM(THEi1)(QHEi1,in − QHEi1,out − UAHEiΔTLM)
dTHEi2
dt=
1
VHEi2CPM(THEi2)(QHEi2,in − QHEi2,out + UAHEiΔTLM)
Furnace
dTEH
dt=
1
VEHCPM(TEH)(QEH,in − QEH,out + QEH)
Burner
dTCB
dt=
1
VCBCPM(TCB)
Qin − Qout −
5Xi=3
riΔHi
!
,���!##��"�� �����#����3%��"��5�����3%�6��7�%�$����#�����'()��*+,+ @
?�$��($�����������"��0��%��%�����13%�#����
Motivation Modeling Dynamics Control Simulation Results Future Work
Characteristic Curves
,���!##��"�� �����#����3%��"��5�����3%�6��7�%�$����#�����'()��*+,+ ,+
��������$����#��3��<��
176
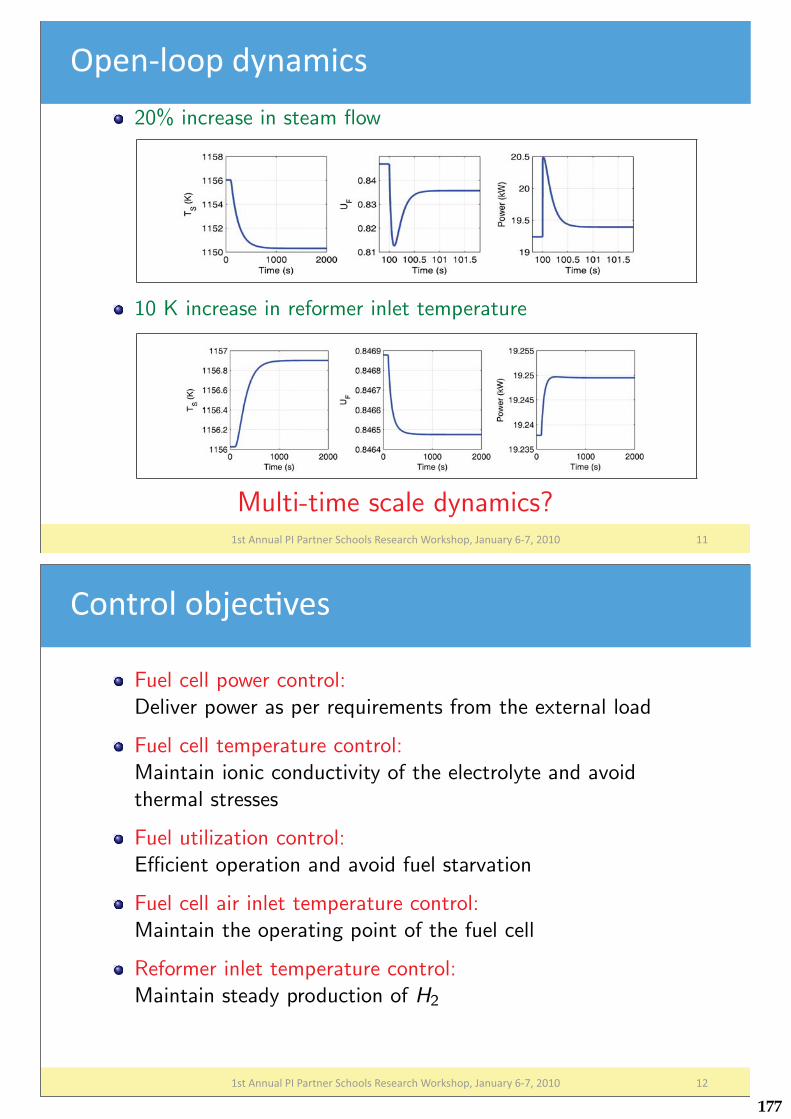
Motivation Modeling Dynamics Control Simulation Results Future Work
Open Loop Analysis
20% increase in steam flow
10 K increase in reformer inlet temperature
Multi-time scale dynamics?,���!##��"�� �����#����3%��"��5�����3%�6��7�%�$����#�����'()��*+,+ ,,
-$�#("��$���#��3�
Motivation Modeling Dynamics Control Simulation Results Future Work
Control Objectives
Fuel cell power control:Deliver power as per requirements from the external load
Fuel cell temperature control:Maintain ionic conductivity of the electrolyte and avoidthermal stresses
Fuel utilization control:Efficient operation and avoid fuel starvation
Fuel cell air inlet temperature control:Maintain the operating point of the fuel cell
Reformer inlet temperature control:Maintain steady production of H2
,���!##��"�� �����#����3%��"��5�����3%�6��7�%�$����#�����'()��*+,+ ,*
/�#���"��� �3�<��
177

Motivation Modeling Dynamics Control Simulation Results Future Work
Fuel Cell Power Control
Electrical side vs Chemical sideFaster response throughelectrical side
Natural choice for manipulatedinput: RL
PI controller
RL = RL,nom − KP
((Pset − P) +
1
τI ,P
∫ t
0(Pset − P)d τ
)
KP = 1 × 10⁻⁴WΩ−1
τI ,P = 0.5s
,���!##��"�� �����#����3%��"��5�����3%�6��7�%�$����#�����'()��*+,+ ,8
2��"�3�""�$�����3�#���"
Motivation Modeling Dynamics Control Simulation Results Future Work
Fuel Cell Temperature Control
Potential manipulated input: Cathode-side air flow rate
Control relevant model:
dTFC
dt=
1
ρcCp,cVc
»nfuel cp,f (THE41 − TFC ) + nair cp,a(Tj1 − TFC ) − ΔH(TFC )
IL
2F− VIL
–
Inversion based nonlinear controller
βFCdTFC
dt+ TFC = v βFC = 10min
External integral action for offset-free response
v = TFC ,set + KFC
„(TFC ,set − TFC ) +
1
τI ,FC
Z t
0(TFC ,set − TFC )dt
«
KFC = 1.67 × 10⁻³, τI ,FC = 10min
,���!##��"�� �����#����3%��"��5�����3%�6��7�%�$����#�����'()��*+,+ ,;
2��"�3�""���$��������3�#���"
178
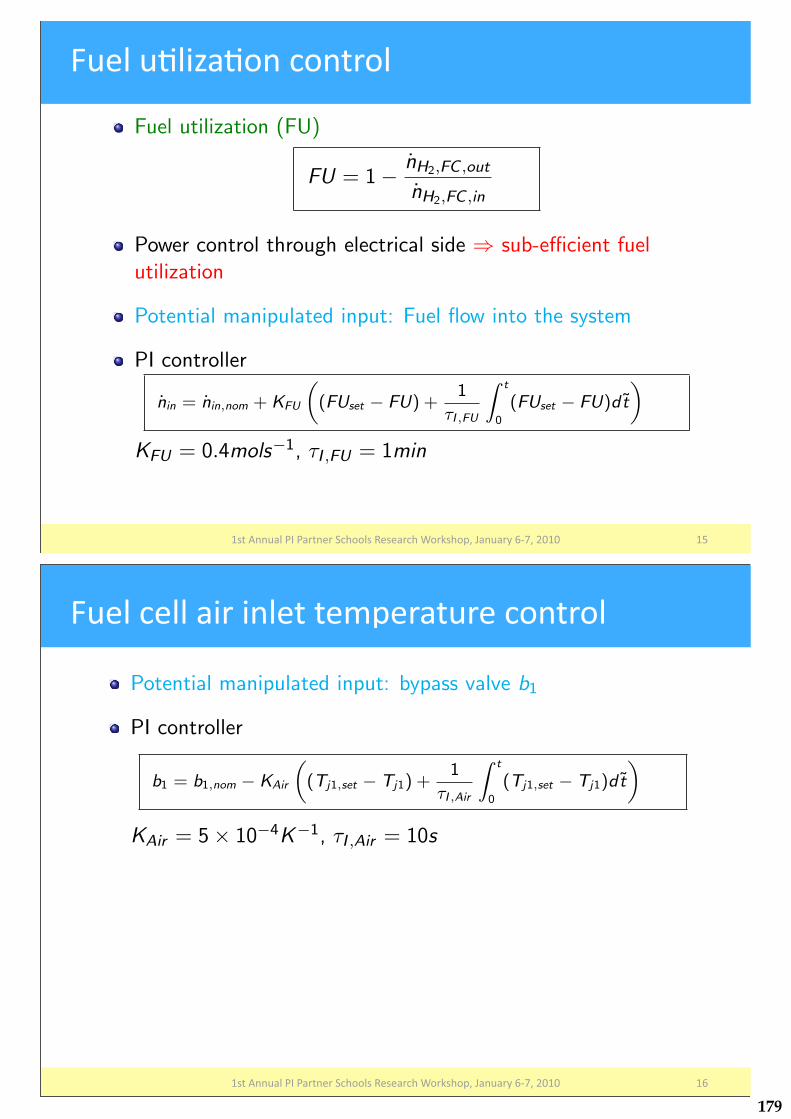
Motivation Modeling Dynamics Control Simulation Results Future Work
Fuel Utilization Control
Fuel utilization (FU)
FU = 1 − nH2,FC ,out
nH2,FC ,in
Power control through electrical side ⇒ sub-efficient fuelutilization
Potential manipulated input: Fuel flow into the system
PI controller
nin = nin,nom + KFU
„(FUset − FU) +
1
τI ,FU
Z t
0
(FUset − FU)dt
«
KFU = 0.4mols−1, τI ,FU = 1min
,���!##��"�� �����#����3%��"��5�����3%�6��7�%�$����#�����'()��*+,+ ,=
2��"���"�.���#�3�#���"
Motivation Modeling Dynamics Control Simulation Results Future Work
Fuel Cell Air Inlet Temperature Control
Potential manipulated input: bypass valve b1
PI controller
b1 = b1,nom − KAir
„(Tj1,set − Tj1) +
1
τI ,Air
Z t
0
(Tj1,set − Tj1)dt
«
KAir = 5 × 10⁻⁴K−1, τI ,Air = 10s
,���!##��"�� �����#����3%��"��5�����3%�6��7�%�$����#�����'()��*+,+ ,'
2��"�3�""������#"�����$��������3�#���"
179
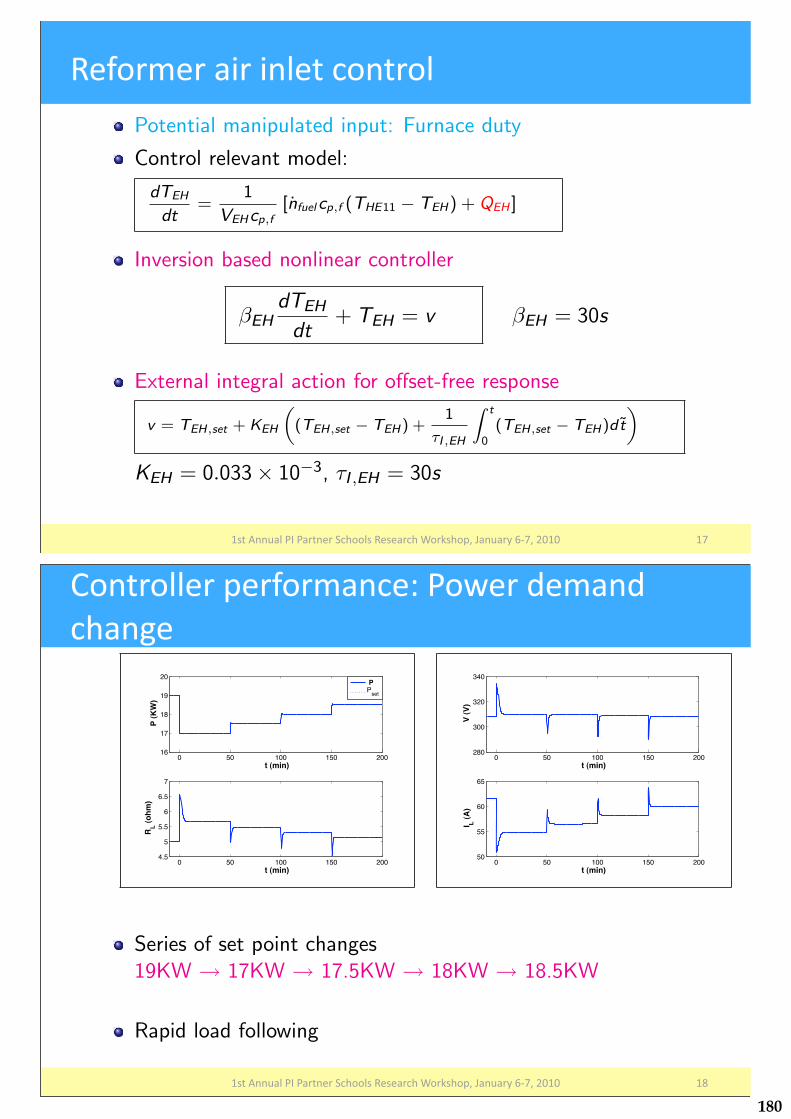
Motivation Modeling Dynamics Control Simulation Results Future Work
Reformer Air Inlet Control
Potential manipulated input: Furnace duty
Control relevant model:
dTEH
dt=
1
VEHcp,f[nfuelcp,f (THE11 − TEH) + QEH ]
Inversion based nonlinear controller
βEHdTEH
dt+ TEH = v βEH = 30s
External integral action for offset-free response
v = TEH,set + KEH
„(TEH,set − TEH) +
1
τI ,EH
Z t
0(TEH,set − TEH)dt
«
KEH = 0.033 × 10⁻³, τI ,EH = 30s
,���!##��"�� �����#����3%��"��5�����3%�6��7�%�$����#�����'()��*+,+ ,)
5�0����������#"���3�#���"
Controller Performance: Power Demand Change
0 50 100 150 20016
17
18
19
20
t (min)
P (
KW
)
PP
set
0 50 100 150 2004.5
5
5.5
6
6.5
7
t (min)
RL (
oh
m)
0 50 100 150 200280
300
320
340
t (min)
V (
V)
0 50 100 150 20050
55
60
65
t (min)
I L (
A)
Series of set point changes19KW → 17KW → 17.5KW → 18KW → 18.5KW
Rapid load following
,���!##��"�� �����#����3%��"��5�����3%�6��7�%�$����#�����'()��*+,+ ,>
/�#���""���$��0���#3�����������#��3%�#��
180

Motivation Modeling Dynamics Control Simulation Results Future Work
Controller Performance: Power Demand Change
0 50 100 150 2001155
1156
1157
1158
1159
1160
t (min)
TF
C (
K)
T
FC
TFC,set
0 50 100 150 2000
0.1
0.2
0.3
0.4
t (min)
b2
0 50 100 150 2000.7
0.75
0.8
0.85
t (min)
FU
FUFU
set
0 50 100 150 2000.19
0.195
0.2
0.205
0.21
0.215
t (min)
nin
(m
ol/s
)
Excellent performance of model based controller for TFC
FU controller maintaining fuel efficiency
,���!##��"�� �����#����3%��"��5�����3%�6��7�%�$����#�����'()��*+,+ ,@
/�#���""���$��0���#3�����������#��3%�#��
Motivation Modeling Dynamics Control Simulation Results Future Work
Controller Performance: Power Demand Change
0 50 100 150 200822
824
826
828
830
832
t (min)
TE
H (
K)
T
EH
TEH,set
0 50 100 150 2001.5
1.55
1.6
1.65
1.7
t (min)
QE
H (
KW
)
0 50 100 150 200965
970
975
980
985
990
t (min)
Tj1
(K
)
T
j1
Tj1,set
0 50 100 150 200
0
0.02
0.04
0.06
0.08
0.1
t (min)
b1
Interactions leading to disturbances in other loops
,���!##��"�� �����#����3%��"��5�����3%�6��7�%�$����#�����'()��*+,+ *+
/�#���""���$��0���#3�����������#��3%�#��
181

Motivation Modeling Dynamics Control Simulation Results Future Work
Concluding Remarks
Fuel Cell + Reformer ⇒ Promising approach for stationarypower production
High T SOFC ⇒ Potential for energy integration
Energy integrated SOFC system
Dynamic modeling
Open-loop studies
Controller design
Simulation case demonstrating feasibility and flexibility ofoperation
,���!##��"�� �����#����3%��"��5�����3%�6��7�%�$����#�����'()��*+,+ *,
/�#3"���#������7�
Motivation Modeling Dynamics Control Simulation Results Future Work
Future Research Directions
Short term:
Flowsheet optimization
Energy flow and time scale analysis
Long term:
Distributed modeling
Internal reforming
,���!##��"�� �����#����3%��"��5�����3%�6��7�%�$����#�����'()��*+,+ **
2������������3%�����3��#�
182

g y
Short Term Goals
Flowsheet Optimization
Finding optimal operating point
Analysis of alternate configurations
Pinch analysis for optimal coupling of energy sources/sinks
Time Scale Analysis
Presence of small and large energy flows: order of magnitudeanalysis
Large energy recycle ⇒ Multi-time scale dynamicsa
Hierarchical control
aJogwar et al. IECR 2009
,���!##��"�� �����#����3%��"��5�����3%�6��7�%�$����#�����'()��*+,+ *8
�%���(�������"�
Motivation Modeling Dynamics Control Simulation Results Future Work
Long Term Goals
Distributed Modeling
Modeling transport processes
Identification and control of hot spots
Use of detailed model for simulations
Internal Reforming
Reforming and electrochemicalreactions in the same unit
Capability to process wide varieties offuelsa
Analysis and comparison with externalreforming
aLi et al. J. Power Sources 2007
,���!##��"�� �����#����3%��"��5�����3%�6��7�%�$����#�����'()��*+,+ *;
?�#�(�������"�
183
Motivation Modeling Dynamics Control Simulation Results Future Work
Acknowledgments
Abu Dhabi - Minnesota Institute for Research Excellence
Thank You
,���!##��"�� �����#����3%��"��5�����3%�6��7�%�$����#�����'()��*+,+ *=
!37#��"����#��
184

Management and Control of Energy Systems
185

UMD Team:Bala Balachandran and Chien-Min LiaoPI Team: Hamad Karki and Youssef Abdel-Magid
PI Partners PI Sponsors
1st Annual PI Partner Schools Research Workshop
The Petroleum Institute, Abu Dhabi, U.A.E.
January 6-7, 2010
DYNAMICS AND CONTROL OF DRILL STINGS
Presentation Outline
• Introduction and Motivation• Project Objectives and Background• Modeling, Simulations, & Results• Experimental Arrangement & Results• Comparisons • Control Scheme• Summary and Future Work
Source: www.spe.org
1st Annual PI Partner Schools Research Workshop, January 6-7, 2010 2
186
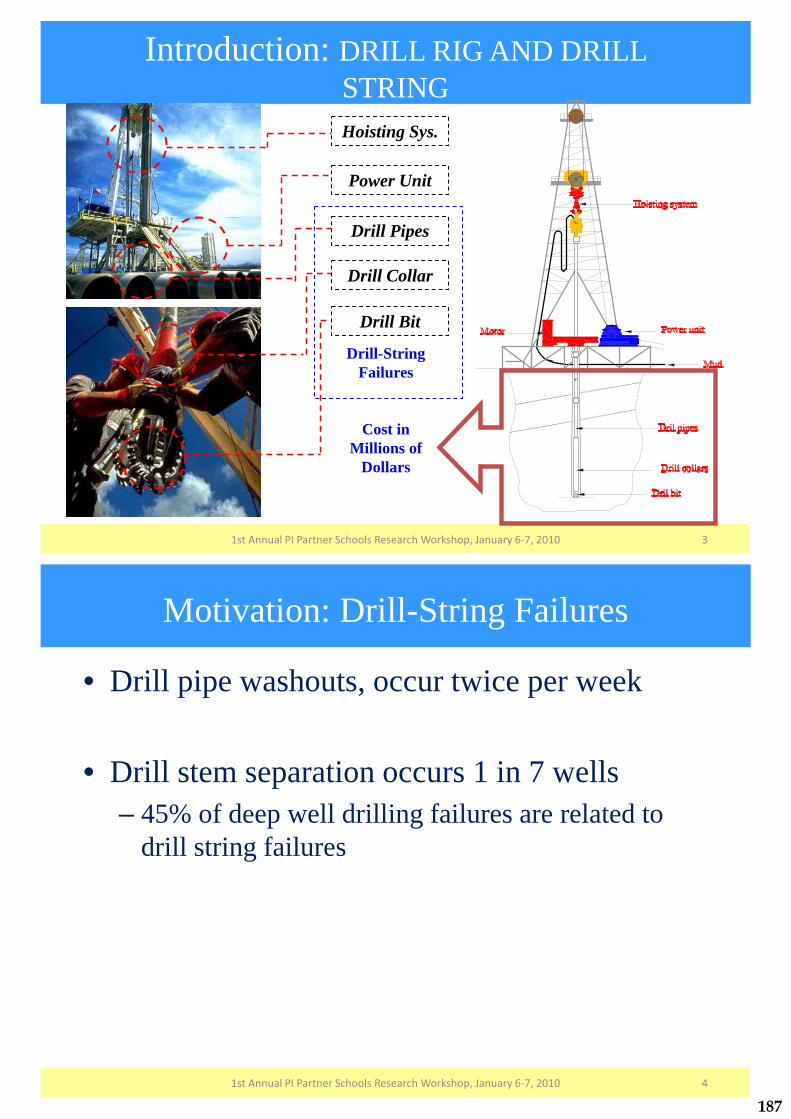
Introduction: DRILL RIG AND DRILL STRINGHoisting Sys.
Power Unit
Drill Pipes
Drill Collar
Drill Bit
Drill-String Failures
Cost in Millions of
Dollars
1st Annual PI Partner Schools Research Workshop, January 6-7, 2010 3
• Drill pipe washouts, occur twice per week
• Drill stem separation occurs 1 in 7 wells– 45% of deep well drilling failures are related to
drill string failures
Motivation: Drill-String Failures
1st Annual PI Partner Schools Research Workshop, January 6-7, 2010 4
187
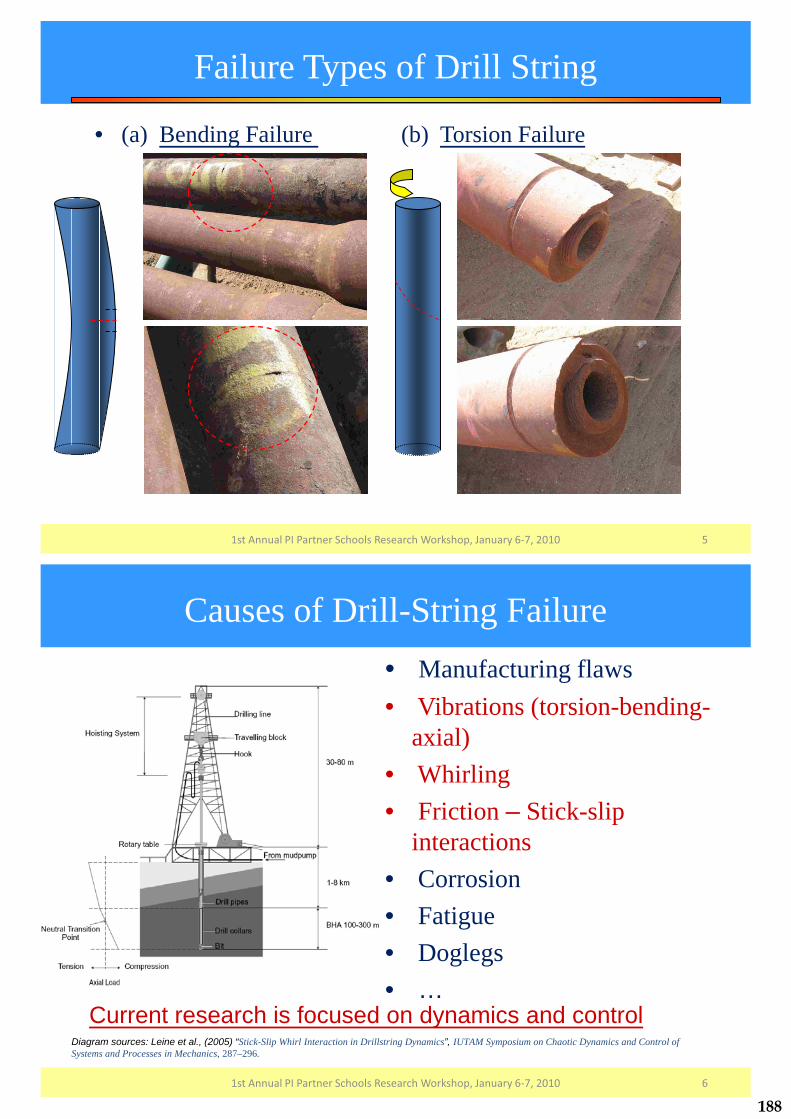
• (a) Bending Failure (b) Torsion Failure
Failure Types of Drill String
1st Annual PI Partner Schools Research Workshop, January 6-7, 2010 5
• Manufacturing flaws• Vibrations (torsion-bending-
axial)• Whirling• Friction – Stick-slip
interactions• Corrosion• Fatigue• Doglegs • …
Current research is focused on dynamics and control
Causes of Drill-String Failure
Diagram sources: Leine et al., (2005) “Stick-Slip Whirl Interaction in Drillstring Dynamics”, IUTAM Symposium on Chaotic Dynamics and Control of Systems and Processes in Mechanics, 287–296.
1st Annual PI Partner Schools Research Workshop, January 6-7, 2010 6
188

Project Objectives
•Understand the current state-of-the-art and identify gaps that need to be filled
•Develop and analytically and numerically study control-oriented models for drill strings
•Investigate control of an under-actuated nonlinear system (drill string) with complex interactions with the environment
•Build complimentary drill-string testbeds at PI and UMD to validate models and refine them
1st Annual PI Partner Schools Research Workshop, January 6-7, 2010 7
Background: Drill-String Vibrations
Sources: Tucker, R,.“Engineering Technology", April 2000; Leine et al. (2002).
Type of Vibrations
Description
Axial(Longitudinal)
Due to interaction between drill bit and the rock. Also called as “bit bounce” to describe the contact / non-contact aspects
Bending(Lateral)
Caused by pipe eccentricity, leading to centripetal force during rotation
Torsion(rotational)
Caused by interactions between the bit and the rock or the drill string with the borehole; stick-slip vibration
Hydraulic In circulation system, stemming from pump pulsations
1st Annual PI Partner Schools Research Workshop, January 6-7, 2010 8
189
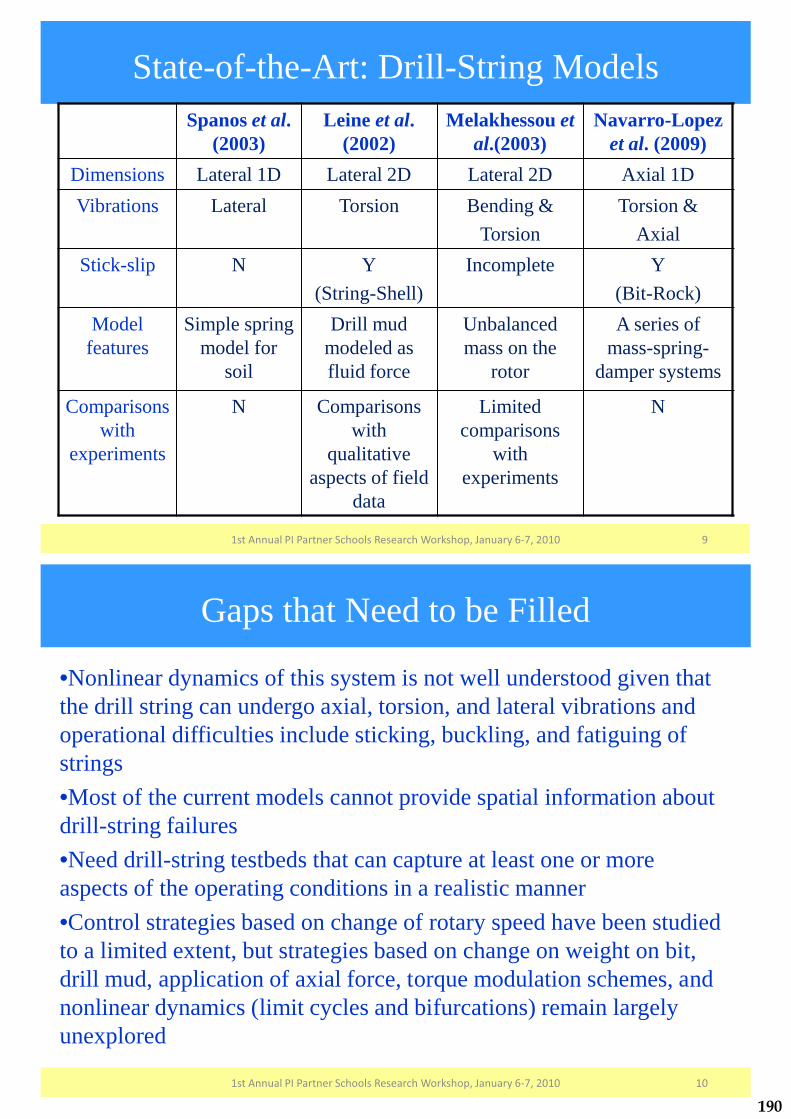
State-of-the-Art: Drill-String ModelsSpanos et al.
(2003)Leine et al.
(2002)Melakhessou et
al.(2003)Navarro-Lopez
et al. (2009)Dimensions Lateral 1D Lateral 2D Lateral 2D Axial 1DVibrations Lateral Torsion Bending &
TorsionTorsion &
AxialStick-slip N Y
(String-Shell)Incomplete Y
(Bit-Rock)Model
featuresSimple spring
model for soil
Drill mud modeled as fluid force
Unbalanced mass on the
rotor
A series of mass-spring-
damper systems
Comparisons with
experiments
N Comparisons with
qualitative aspects of field
data
Limited comparisons
with experiments
N
1st Annual PI Partner Schools Research Workshop, January 6-7, 2010 9
Gaps that Need to be Filled
•Nonlinear dynamics of this system is not well understood given that the drill string can undergo axial, torsion, and lateral vibrations and operational difficulties include sticking, buckling, and fatiguing of strings•Most of the current models cannot provide spatial information about drill-string failures•Need drill-string testbeds that can capture at least one or more aspects of the operating conditions in a realistic manner•Control strategies based on change of rotary speed have been studied to a limited extent, but strategies based on change on weight on bit, drill mud, application of axial force, torque modulation schemes, and nonlinear dynamics (limit cycles and bifurcations) remain largely unexplored
1st Annual PI Partner Schools Research Workshop, January 6-7, 2010 10
190

Goals of Current Research• Understand the axial, torsional, and lateral vibrations of
drill-string system
• Examine coupling amongst different modes of vibration in drill-string system such as axial and torsion coupling and torsion and bending coupling
• Model and characterize stick-slip interactions between drill string and outer shell as well as between drill string and well bottom
• Validate reduced-order models through experiments1st Annual PI Partner Schools Research Workshop, January 6-7, 2010 11
mb
X
YO
Z
Section II
i
j
k
Illustration of 4DOF Model
Current Research: Reduced-Order Models
Hoisting system
Drill Pipe
Drill String
Drill Bit
Drill Collar
Electric drive
Mud Cycling System
mb
X
YO
Z
Section II
i
j
k
Illustration of 5DOF Model
1st Annual PI Partner Schools Research Workshop, January 6-7, 2010 12
191
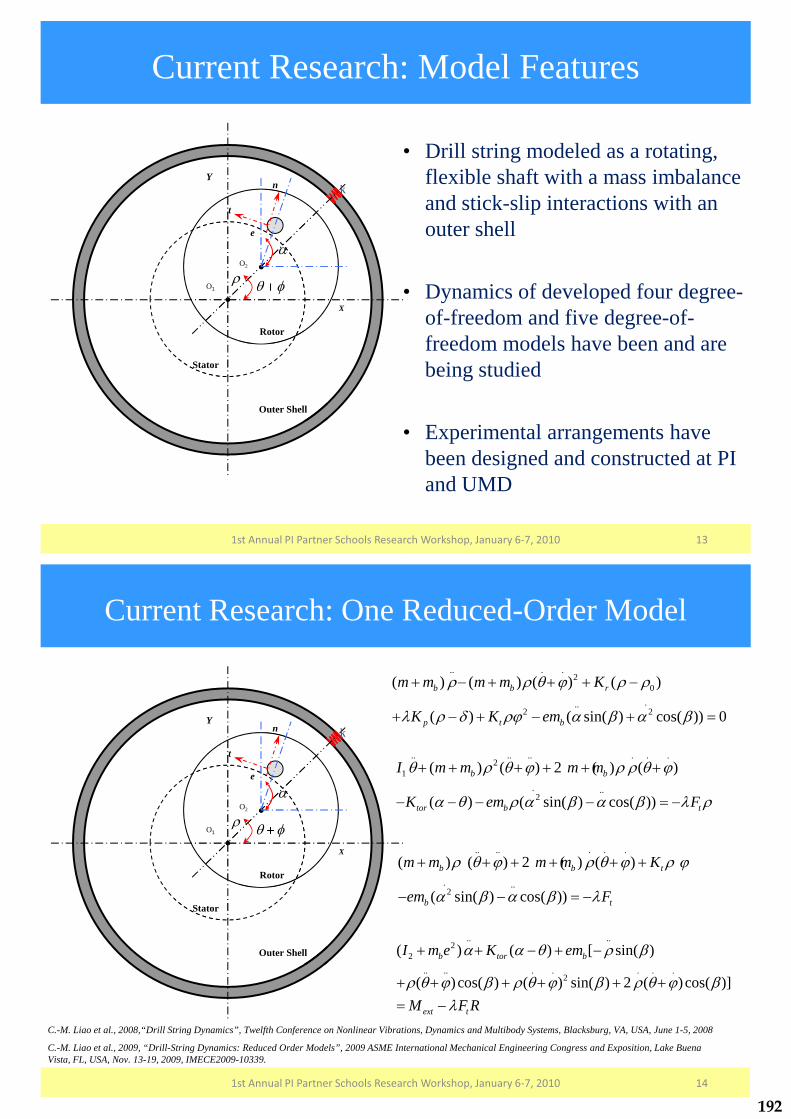
Current Research: Model Features
X
Y
O1 � ��� � ���O2
n
t
�e
k
Stator
Rotor
Outer Shell
• Drill string modeled as a rotating, flexible shaft with a mass imbalance and stick-slip interactions with an outer shell
• Dynamics of developed four degree-of-freedom and five degree-of-freedom models have been and are being studied
• Experimental arrangements have been designed and constructed at PI and UMD
1st Annual PI Partner Schools Research Workshop, January 6-7, 2010 13
Current Research: One Reduced-Order Model
X
Y
O1 � ��� � ���O2
n
t
�e
k
Stator
Rotor
Outer Shell
.. . .2
0...
2 2
( ) ( ) ( ) ( )
( ) ( sin( ) cos( )) 0
b b r
p t b
m m m m K
K K em
� � � � � �
� � �� � �
� � � � � �
� � � � � �
.. .. .. . . .2
1. ..2
( ) ( ) 2 ( ) ( )
( ) ( sin( ) cos( ))
b b
tor b t
I m m m m
K em F
� � � � � � � �
� � � � � � �
� � � � � �
� � � � � �
.. .. . . .
. ..2
( ) ( ) 2 ( ) ( )
( sin( ) cos( ))
b b t
b t
m m m m K
em F
� � � � � � � �
� � �
� � � � � �
� � � �
.. ..2
2.. .. . . . . .
2
( ) ( ) [ sin( )
( ) cos( ) ( ) sin( ) 2 ( )cos( )]
b tor b
ext t
I m e K em
M F R
� � � �
� � � � � � � � � �
� � � � �
� � � � � �� �
C.-M. Liao et al., 2008,“Drill String Dynamics”, Twelfth Conference on Nonlinear Vibrations, Dynamics and Multibody Systems, Blacksburg, VA, USA, June 1-5, 2008
C.-M. Liao et al., 2009, “Drill-String Dynamics: Reduced Order Models”, 2009 ASME International Mechanical Engineering Congress and Exposition, Lake Buena Vista, FL, USA, Nov. 13-19, 2009, IMECE2009-10339.
1st Annual PI Partner Schools Research Workshop, January 6-7, 2010 14
192
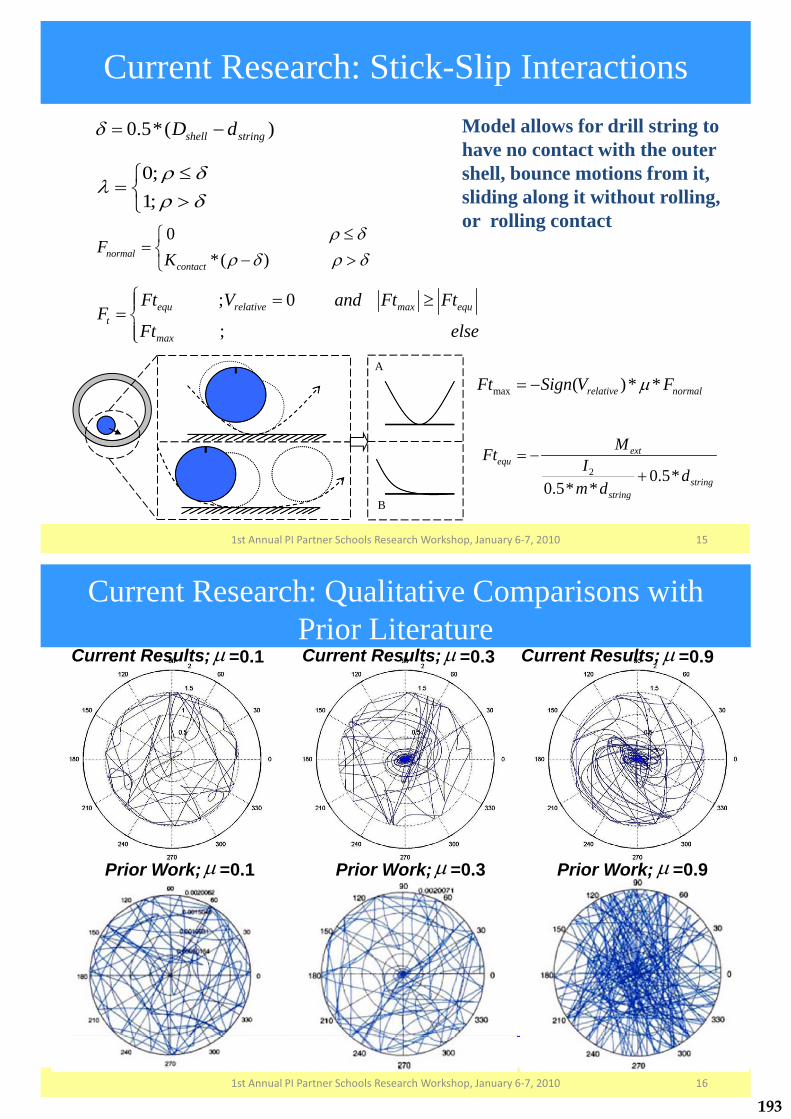
Current Research: Stick-Slip Interactions0.5*( )shell stringD d � �
0;1;�
�� �
� � ��0
*( )normalcontact
FK
� � �
�� � � ��
; 0
;equ relative max equ
t
max
Ft V and Ft FtF
Ft else
� � ��� ���
max ( )* *relative normalFt Sign V F�� �
2 0.5*0.5* *
extequ
stringstring
MFt I dm d
� ��
A
B
Model allows for drill string to have no contact with the outer shell, bounce motions from it, sliding along it without rolling, or rolling contact
1st Annual PI Partner Schools Research Workshop, January 6-7, 2010 15
=0.1�Current Results;
Prior Work; =0.1� Prior Work; =0.9�Prior Work; =0.3�
=0.9�Current Results;=0.3�Current Results;
Current Research: Qualitative Comparisons with Prior Literature
1st Annual PI Partner Schools Research Workshop, January 6-7, 2010 16
193
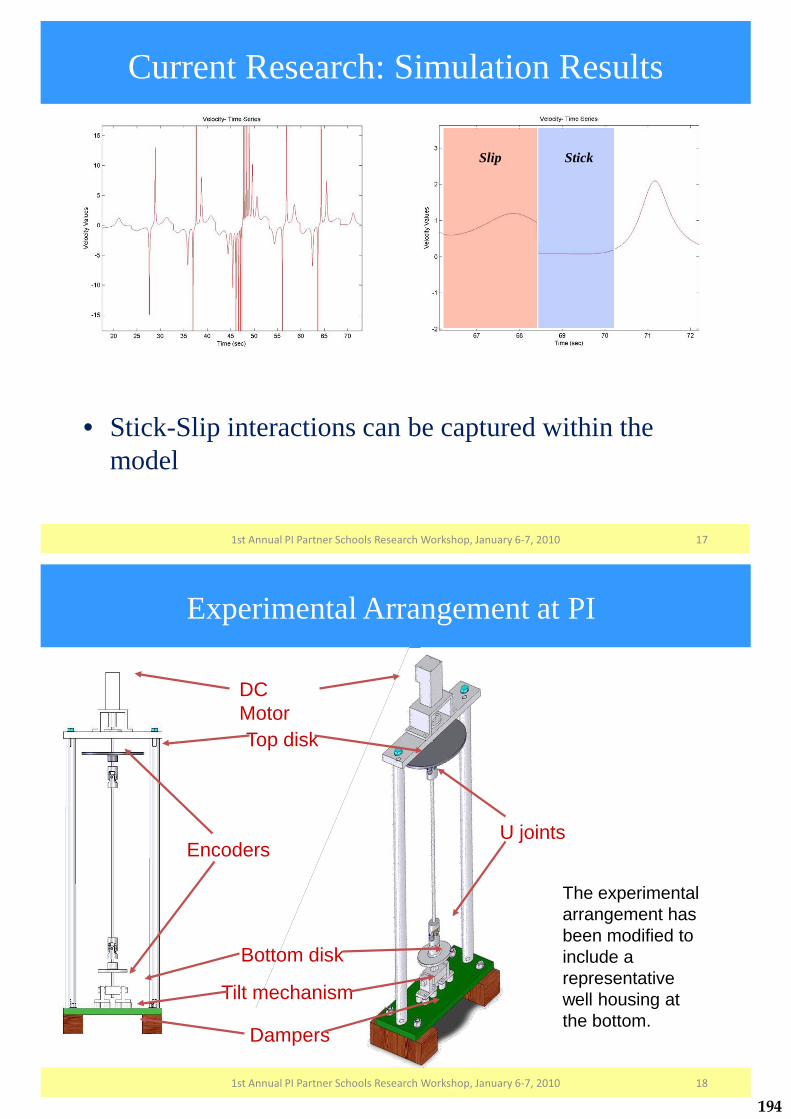
Current Research: Simulation Results
• Stick-Slip interactions can be captured within the model
Slip Stick
1st Annual PI Partner Schools Research Workshop, January 6-7, 2010 17
DC MotorTop disk
Bottom disk
Tilt mechanism
Dampers
EncodersU joints
Experimental Arrangement at PI
1st Annual PI Partner Schools Research Workshop, January 6-7, 2010 18
The experimental arrangement has been modified to include a representative well housing at the bottom.
194
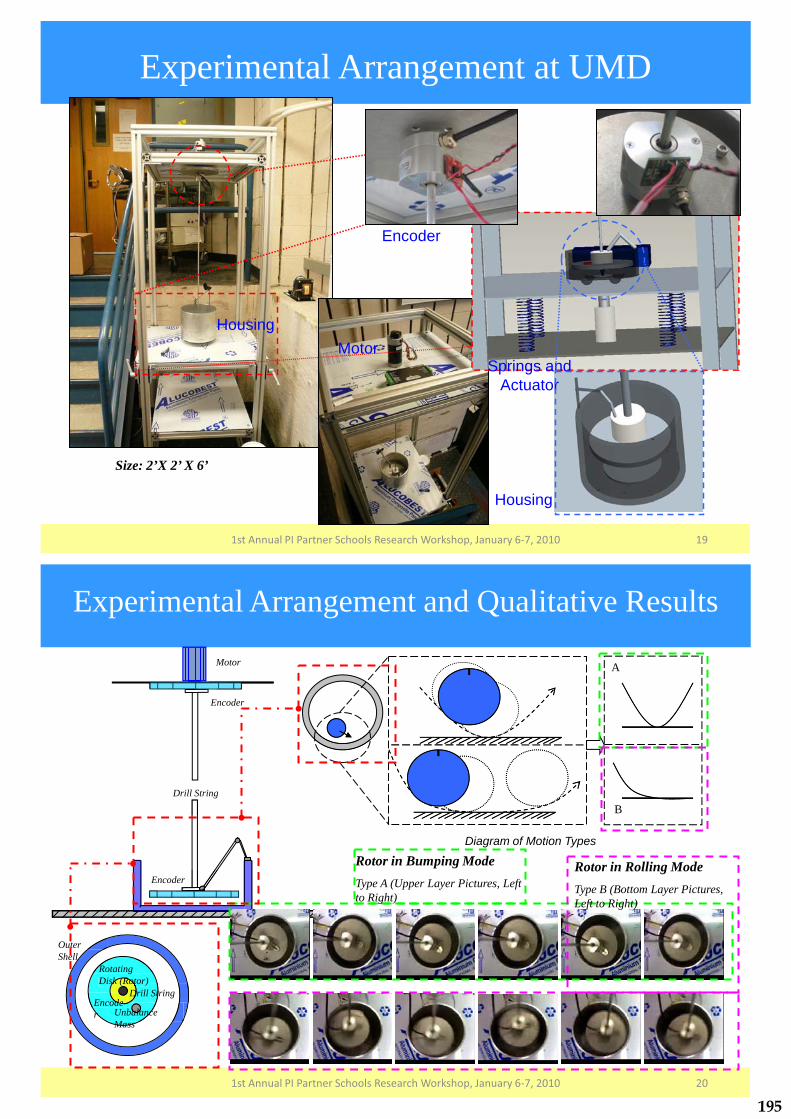
Housing
Springs and Actuator
Housing
Motor
Encoder
Experimental Arrangement at UMD
Size: 2’X 2’ X 6’
1st Annual PI Partner Schools Research Workshop, January 6-7, 2010 19
1st Annual PI Partner Schools Research Workshop, January 6-7, 2010
Drill String
Encoder
Encoder
Motor
Encoder
Rotating Disk (Rotor)
e
tor)(RototDrill String
Outer Shell
codededeUnbalance Mass
A
B
Rotor in Bumping ModeType A (Upper Layer Pictures, Left to Right)
Rotor in Rolling ModeType B (Bottom Layer Pictures, Left to Right)
Diagram of Motion Types
Experimental Arrangement and Qualitative Results
20
195

Qualitative Comparisons with Experiments
Bumping MotionRolling Motion
Predicted Rotor Trajectory
Table of Parameter Values
1st Annual PI Partner Schools Research Workshop, January 6-7, 2010 21
• Have examined suppression of torsion oscillations by using Genetic Algorithms
Current Research: Control Scheme
Karkoub, M., Abdel-Magid, Y., and Balachandran, B.,(2008) “Drill String Torsional Vibration Suppression Using GA Optimized Controllers,” Canadian Journal of Petroleum Technology, accepted for publication
1st Annual PI Partner Schools Research Workshop, January 6-7, 2010 22
196

Project Status and Summary: Progress, Accomplishments, and Inferences
•Drill string has been modeled as a flexible rotating shaft with mass imbalance and stick-slip interactions with outer shell – Four degree-of-freedom and five degree-of-freedom models have been developed; five degree-of-freedom model helps capture tilt angle effects not previously studied.
•Numerical investigations indicate that the string bounces off the outer shell for low values of friction coefficient and sticks and slips along the outer shell as the friction coefficient is increased; present model provides a reasonable description of the interactions with the outer shell compared to previous models.
•Experimental arrangements have been tailored to better understand coupling amongst different modes of vibration, stick-slip interactions, and explore control of them.
•Reduced-order models validated and extended through comparisons with experiments
1st Annual PI Partner Schools Research Workshop, January 6-7, 2010 23
Related Research at UMD: Horizontal Drilling
Experimental arrangement for horizontal drilling studies (N. Vlajic and B. Balachandran, 2009)Source: Horizontal Drilling, Short, J.A.
Onshore and Offshore Drilling
1st Annual PI Partner Schools Research Workshop, January 6-7, 2010 24
197

Related Research at UMD: Rub-Roll Interactions
�rr
O
�ext
Q
k
QQQP
�
Fs
x
Fext
Simultaneous Rub and Roll of Flexibly Connected Disk(S. P. Singh and B. Balachandran, 2009)
Response of the Disk Subjected to Ramp Excitation: (a) total travel distance of the disc, (b) rotation of the disc, and (c) sliding of the disc.
Solid lines are used to depict the displacement responses and dashed lines are used to represent the velocity responses
1st Annual PI Partner Schools Research Workshop, January 6-7, 2010 25
Project Status: Interactions and Impact•Impact on Industry: PI and UMD investigators have been interacting with the National Drilling Company since 2007 (with a recent visit in October 2009) and one example of the impact the collaborative research can have on the industry is the following: Guide the choice of optimal mud parameters for keeping the motions of the drill string close to the center of the oil well.
•Impact on Research and Education: Experimental testbeds have been established at PI and UMD, and these testbeds are being used to carry out research as well as educate students: Two undergraduate students from PI visited UMD in Summer 2009 to work on drill string dynamics and control along with the doctoral student at UMD. A doctoral researcher from England is visiting PI to carry out experiments on the PI testbed.
1st Annual PI Partner Schools Research Workshop, January 6-7, 2010 26
PI undergraduate students Alawi Abdulla and Waled Saeed visiting UMD in Summer 2009
198
UMD Team: Bala Balachandran and Nikhil ChopraPI Team: Hamad Karki and Sai Cheong Fok
PI Partners PI Sponsors
1st Annual PI Partner Schools Research Workshop
The Petroleum Institute, Abu Dhabi, U.A.E.
January 6-7, 2010
Studies on Mobile Sensor Platforms
Presentation Outline
• Introduction and Motivation• Project Objectives • Research Approach and Considerations• Numerical Studies, Results, and Discussion• Summary and Future Work
21st Annual PI Partner Schools Research Workshop, January 6-7, 2010
199
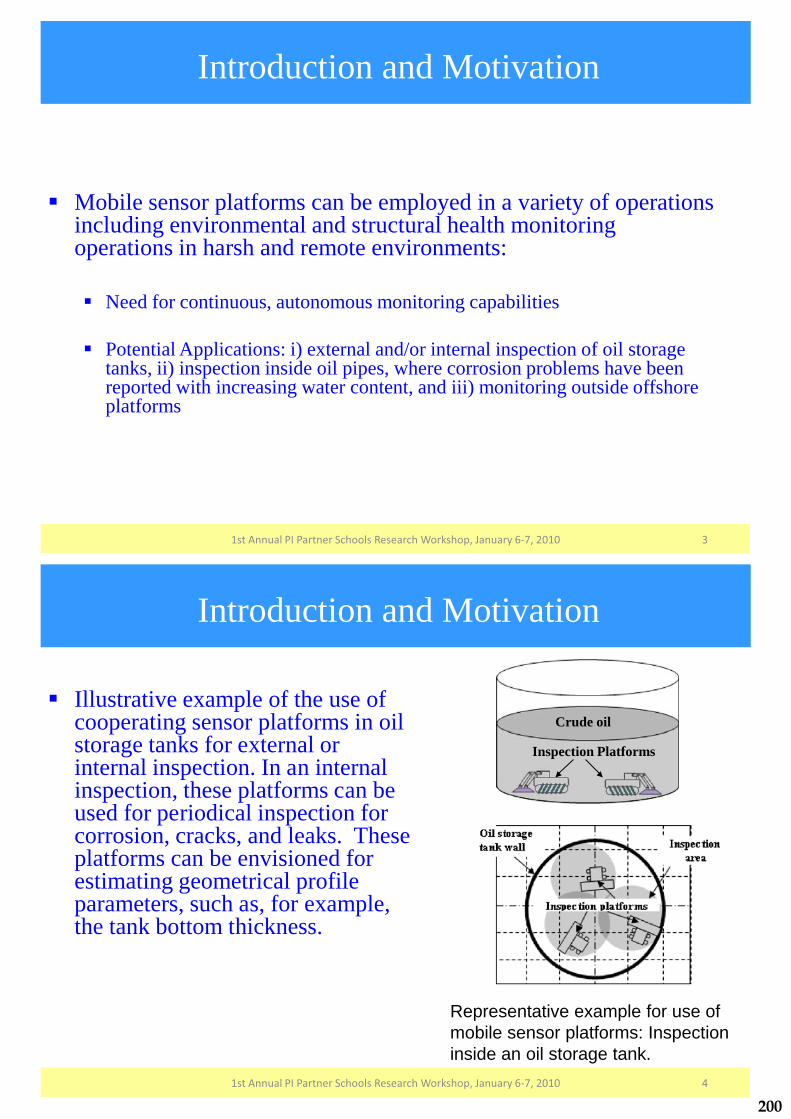
Introduction and Motivation
� Mobile sensor platforms can be employed in a variety of operations including environmental and structural health monitoring operations in harsh and remote environments:
� Need for continuous, autonomous monitoring capabilities
� Potential Applications: i) external and/or internal inspection of oil storage tanks, ii) inspection inside oil pipes, where corrosion problems have been reported with increasing water content, and iii) monitoring outside offshore platforms
31st Annual PI Partner Schools Research Workshop, January 6-7, 2010
Introduction and Motivation
� Illustrative example of the use of cooperating sensor platforms in oil storage tanks for external or internal inspection. In an internal inspection, these platforms can be used for periodical inspection for corrosion, cracks, and leaks. These platforms can be envisioned for estimating geometrical profile parameters, such as, for example, the tank bottom thickness.
41st Annual PI Partner Schools Research Workshop, January 6-7, 2010
Inspection Platforms
Crude oil
Representative example for use of mobile sensor platforms: Inspection inside an oil storage tank.
200

Introduction and Motivation
� Basic Building Blocks of Mobile Sensor Platforms
� Sensors � Actuators and Mechanisms� Power� Motion Planning
Algorithms
51st Annual PI Partner Schools Research Workshop, January 6-7, 2010
Acoustic emission sensors
Representative example of sensors that can be used in mobile sensor platforms for structural inspection.
Sensing ArmMobile Sensor PlatformActuation through Screw
Propulsion
Representative mobile sensor platform.
Project Objectives
•Understand the current state-of-the-art and identify gaps that need to be filled with the overall goal of carrying out a combined analytical, numerical, and experimental effort to develop mobile sensor platforms and appropriate simultaneous localization and mapping (SLAM) algorithms for cooperative sensor platforms to operate in a harsh environment
•Develop SLAM algorithms based platforms taking into account system constraints such as constrained communication, the type of sensors considered, allowable dynamics, and factors such as sensor failures and reliability of the considered sensors
•Build complimentary experimental test platforms at the University of Maryland and the Petroleum Institute to validate models and refine them as well as to examine sensors, actuators, and power schemes – some of the experimental work is to be carried out as a part of senior design courses in Mechanical Engineering at the Petroleum Institute
1st Annual PI Partner Schools Research Workshop, January 6-7, 2010 6
201

Research Approach and Considerations
� Simultaneous localization and mapping (SLAM) algorithms (also known in the literature as concurrent mapping and localization (CML) algorithms) for cooperating sensor platforms operating in harsh environments are being investigated
� Although, one can use a single sensor system to carry out a geometrical profile measurement inside a storage tank or a pipe, or carry out external monitoring outside an offshore platform, cooperating platforms can provide redundancy to sensor failures as well as superior localization and mapping capabilities.
71st Annual PI Partner Schools Research Workshop, January 6-7, 2010
• Although the SLAM problem has been studied in open terrestrial and aerial environments (e.g., Thrun, 2002; Durrant-Whyte and Bailey, 2006), the same is not true for environments such as those encountered in an oil tank or pipe (e. g., Sogi et al., 2000). These submerged environments pose a significant challenge due to complex dynamics of the sensor platforms, as well as related issues of motion control, cooperative path planning, and information fusion.
Research Approach and Considerations
1st Annual PI Partner Schools Research Workshop, January 6-7, 2010 8
202
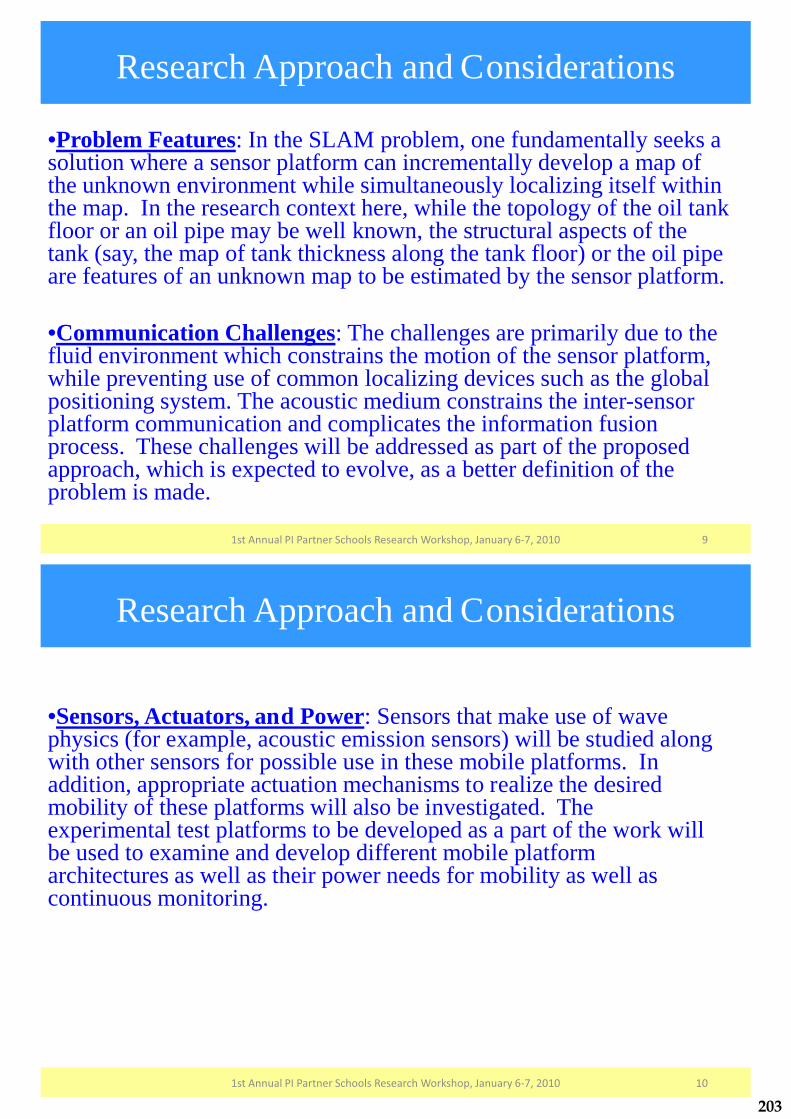
Research Approach and Considerations
•Problem Features: In the SLAM problem, one fundamentally seeks a solution where a sensor platform can incrementally develop a map of the unknown environment while simultaneously localizing itself within the map. In the research context here, while the topology of the oil tank floor or an oil pipe may be well known, the structural aspects of the tank (say, the map of tank thickness along the tank floor) or the oil pipe are features of an unknown map to be estimated by the sensor platform.
•Communication Challenges: The challenges are primarily due to the fluid environment which constrains the motion of the sensor platform, while preventing use of common localizing devices such as the global positioning system. The acoustic medium constrains the inter-sensor platform communication and complicates the information fusion process. These challenges will be addressed as part of the proposed approach, which is expected to evolve, as a better definition of the problem is made.
91st Annual PI Partner Schools Research Workshop, January 6-7, 2010
Research Approach and Considerations
•Sensors, Actuators, and Power: Sensors that make use of wave physics (for example, acoustic emission sensors) will be studied along with other sensors for possible use in these mobile platforms. In addition, appropriate actuation mechanisms to realize the desired mobility of these platforms will also be investigated. The experimental test platforms to be developed as a part of the work will be used to examine and develop different mobile platform architectures as well as their power needs for mobility as well as continuous monitoring.
1st Annual PI Partner Schools Research Workshop, January 6-7, 2010 10
203

Research Approach and Considerations
•SLAM Problem: Obtain a simultaneous estimate of both mobile sensor platform (so called vehicle) and key marker locations (could be structural features) in a oil pipe or storage tank (so called landmark locations)
At any time instant k, the following quantities are defined:
� xk: State vector describing the location and orientation of the vehicle inside the oil pipe or relative to the storage tank� uk: Control applied at time k-1 to drive the mobile sensor platform to a state xk at time k� mi: Vector describing the location of the ith time invariant landmark or marker location� zik: Observation of the ith landmark at time k
Define the sets:
� U0:k: The history of control inputs� Z0:k: The set of all landmark observations� m: The set of all landmarks
In the SLAM problem, one is essentially estimating the probability distribution
P(xk,m| Z0:k, U0:k, x0)
111st Annual PI Partner Schools Research Workshop, January 6-7, 2010
Representative mobile sensor platform
Research Approach and ConsiderationsExtended Kalman Filter (EKF) SLAM
• The motion model is xk=f(xk-1, uk)+ wk , where f(.) denotes the mobile sensor platform (so called vehicle) kinematics and wk are the additive Gaussian motion disturbances.
• The observation model is given by zk=h(xk, m)+ vk where h(.) is the observation model and vk are the additive Gaussian noise components.
• By using the observations and the control inputs, the standard Extended Kalman Filter (EKF) time and observation update are employed to estimate the joint posterior density of the landmark locations and the vehicle state.
• The solution has the benefits and the pitfalls as the standard EKF solution. The computational effort grows quadratically with the number of landmarks.
• The algorithm, by definition requires linear models for the motion update and also for the observations. Linearization can help accomplish the above goals. However, it can potentially lead to drastic inconsistencies in the solutions.
1st Annual PI Partner Schools Research Workshop, January 6-7, 2010 12
204

Research Approach and ConsiderationsFASTSLAM
• This algorithm has its origins in recursive Monte Carlo sampling or particle filtering. This approach can handle nonlinear motion and observation models.
• Rao-Blackwellization filter is used in the sample space where the joint state is partitioned as P(x1,x2)= P(x2|x1)P(x1). If the conditional P(x2|x1) can be calculated analytically, sampling is only required for P(x1).
• In context of the SLAM problem, the SLAM state can be factored as P(X0:k, m| Z0:k, U0:k, x0)= P(m| X0:k, Z0:k) P(X0:k| Z0:k, U0:k, x0)
where the probability distribution is on the trajectory X0:k rather than a particular position xk. This is due to the fact that the when conditioned on the trajectory, the landmarks become independent.
• Recursive estimation is performed by particle filtering for the position states and the EKF is used for the map states.
131st Annual PI Partner Schools Research Workshop, January 6-7, 2010
Numerical Studies, Results, and Discussion
cossin
tan
x vy v
vL
��
� �
� �� � � �� � � ��� � � � � � � � � �
�
�
�
zr
z
��
����
��
�����
(xi � x)2 � (yi � y)2
tan�1 yi � yxi � x
��
����
��
����� � �
�2
��
��
������
��
��
������
•Extended Kalman Filter SLAM Study
Conceptual illustration of mobile sensor platform moving with a speed v on the plane.
1st Annual PI Partner Schools Research Workshop, January 6-7, 2010 14
System Kinematics
Observation or Sensor Model
205
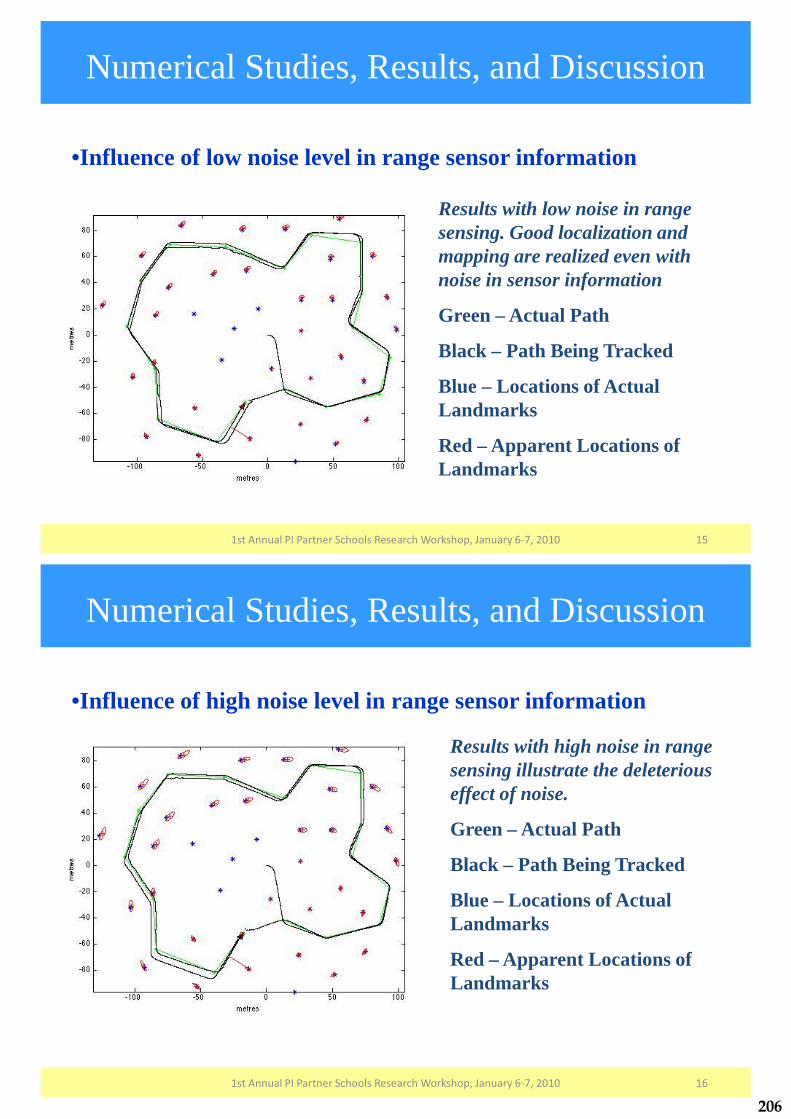
Numerical Studies, Results, and Discussion
•Influence of low noise level in range sensor information
Results with low noise in range sensing. Good localization and mapping are realized even with noise in sensor information
Green – Actual Path
Black – Path Being Tracked
Blue – Locations of Actual Landmarks
Red – Apparent Locations of Landmarks
151st Annual PI Partner Schools Research Workshop, January 6-7, 2010
Numerical Studies, Results, and Discussion
•Influence of high noise level in range sensor information
Results with high noise in range sensing illustrate the deleterious effect of noise.
Green – Actual Path
Black – Path Being Tracked
Blue – Locations of Actual Landmarks
Red – Apparent Locations of Landmarks
161st Annual PI Partner Schools Research Workshop, January 6-7, 2010
206

Numerical Studies, Results, and Discussion
•Influence of high noise level in kinematics and low noise level in sensor information
Illustration of deleterious effects of noise
Green – Actual Path
Black – Path Being Tracked
Blue – Locations of Actual Landmarks
Red – Apparent Locations of Landmarks
171st Annual PI Partner Schools Research Workshop, January 6-7, 2010
Numerical Studies, Results, and Discussion• FASTSLAM Study• Allows efficient computation when compared to EKF SLAM
Results with high noise in range sensing. Relatively good localization and mapping are realized even with noise in sensor information
Blue – Path Being Tracked
Green – Locations of Actual Landmarks
Red – Apparent Locations of Landmarks
181st Annual PI Partner Schools Research Workshop, January 6-7, 2010
207

Numerical Studies, Results, and Discussion
• Influence of high noise level in kinematics and low noise level in sensor information• Noise in the kinematics appears to play a dominant role in influencing the estimation process
Blue – Path Being Tracked
Green – Locations of Actual Landmarks
Red – Apparent Locations of Landmarks
191st Annual PI Partner Schools Research Workshop, January 6-7, 2010
Project Status and Summary: Progress, Accomplishments, and Inferences
Schedule
•April 1, 2009 to December 31, 2009: Carry out analytical and numerical investigations into SLAM algorithm based mobile platforms as a representative exploration into mobile sensor platforms for application in oil storage tanks or oil pipes. Investigate experimental test platforms.
•January 1, 2010 to December 31, 2010: Continuation of analytical, experimental, and numerical efforts, with focus to be on development of basic building blocks for mobile sensor platforms (mapping algorithms, sensors, actuators and power).
•January 1, 2011 to December 31, 2011: Continuation of experimental and numerical studies and formulation of recommendations for appropriate sensor and mobile platform configurations for use in oil pipes and oil storage tanks and other applications recommended by ADNOC Industries.
201st Annual PI Partner Schools Research Workshop, January 6-7, 2010
208
Project Status and Summary: Progress, Accomplishments, and Inferences
•Numerical studies on SLAM algorithms have been initiated and they are to be continued in 2010; ADNOC Fellow Mr. Hesham Ishmail (started in Fall 2009) to be involved in these efforts and a new doctoral student (Ms. Jai Rubyca) to join in Spring 2010:
� Limitations in the presence of noise have been studied� Strengths and weakness of various algorithms and suitability for use in fluid
environments to be addressed� Common localizing devices such as GPS based devices cannot be used� Acoustic sensors could be used, but issues still be resolved� Prior SLAM studies have focused on single platforms; extension to cooperating sensor
platforms being carried out in this work� Preliminary results to be reported in a conference manuscript, which has been accepted
for a March 2010 SPIE Conference in San Diego, CA� Senior design projects on cooperative mobile sensor platforms initiated at PI
•With guidance from industry (visited the Abu Dhabi Company for Onshore Oil Operations (ADCO) in Summer 2009 and October 2009), during 2010, scaled experimental test platforms are to be constructed at UMD and PI to evaluate sensors, actuators, and mapping schemes
211st Annual PI Partner Schools Research Workshop, January 6-7, 2010
Project Status: Interactions and ImpactImpact on Research and Education:
�Experimental testbeds are being planned at PI and UMD, and these testbeds can be used to carry out research as well as educate students. One ADNOC Fellow, who started at PI, is currently working at UMD under the guidance of Professors Balachandran and Chopra. Senior project design teams at PI have worked on internal inspection of oil storage tank structures under the guidance of Professors Karki and Fok. It is anticipated that future summer interns from PI will benefit from the experimental testbed to be constructed at UMD.
�In a broader context, the drill-string dynamics and control work and the current work on mobile sensor platforms are expected to be critical components of Professor Karki’s research program at PI in the area of dynamics and control.
Impact on Industry: PI and UMD investigators have been interacting with the Abu Dhabi Company for Onshore Oil Operations (with a recent visit in October 2009) and one example of the impact the collaborative research can have on the industry is the following: Guide the choice of mobile sensor platforms to carry out continuous and autonomous monitoring operations in harsh environments (e.g., oil pipes).
221st Annual PI Partner Schools Research Workshop, January 6-7, 2010
209
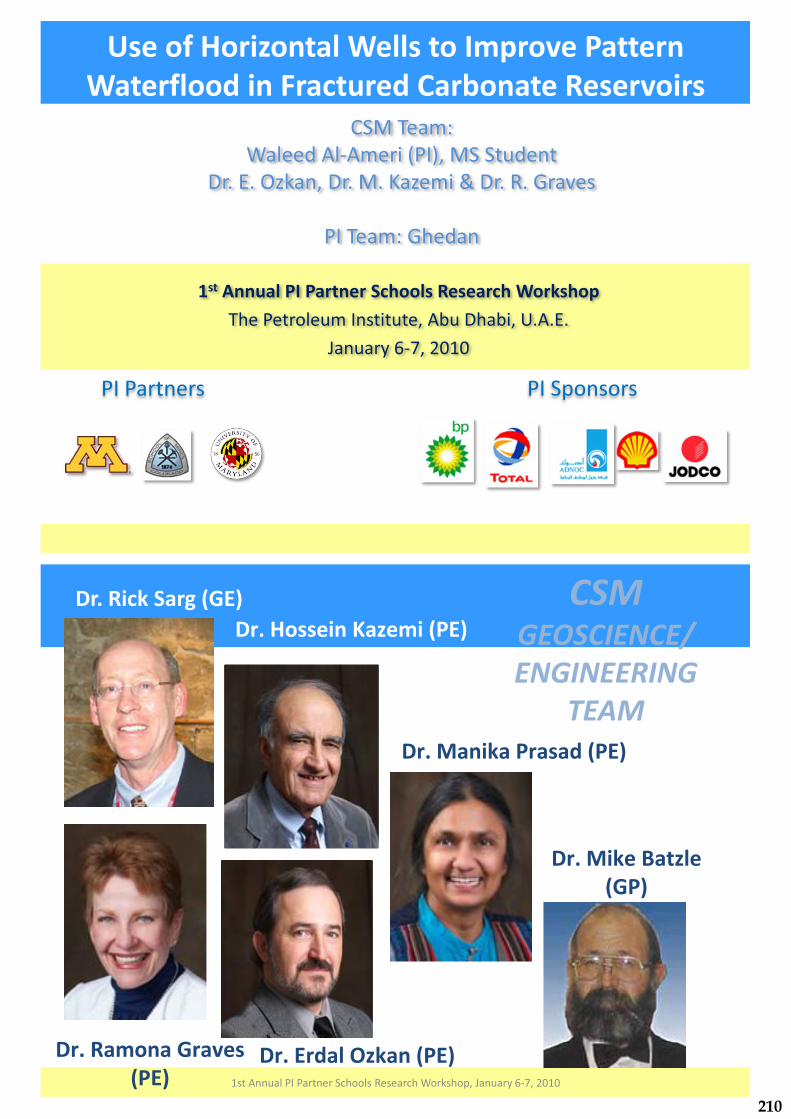
CSM�Team:�Waleed Al�Ameri (PI),�MS�Student�
Dr.�E.�Ozkan,�Dr.�M.�Kazemi &�Dr.�R.�Graves�
PI�Team:�Ghedan
PI�Partners PI�Sponsors
1st Annual�PI�Partner�Schools�Research�Workshop
The�Petroleum�Institute,�Abu�Dhabi,�U.A.E.
January�6�7,�2010
Use�of�Horizontal�Wells�to�Improve�Pattern�Waterflood in�Fractured�Carbonate�Reservoirs�
Dr.�Rick�Sarg (GE)
Dr.�Mike�Batzle(GP)
Dr.�Manika Prasad�(PE)
Dr.�Hossein Kazemi (PE)
Dr.�Ramona�Graves(PE)
Dr.�Erdal Ozkan (PE)
CSM�GEOSCIENCE/ENGINEERING�
TEAM
1st�Annual�PI�Partner�Schools�Research�Workshop,�January�6�7,�2010
210

MISSION
• The research projects reported in the following slides were designed to produce the greatest amount of oil from Zakum field.
• In addition, these projects were designed as part of an educational process for the UAE graduate students studying at CSM, and a means for collaboration and technology transfer to the Petroleum Institute.
Background
• Thamama 1A Research Program consists ofFIVE CSM/PI projects.
• The research group is an integrated team ofpetroleum engineers, geologists,
petrophysicists, and geophysicists from CSM and PI.
41st�Annual�PI�Partner�Schools�Research�Workshop,�January�6�7,�2010
211
Presentation Outline
• Background• Objectives• Results and Discussions• Project Status• Conclusions and Summary
51st�Annual�PI�Partner�Schools�Research�Workshop,�January�6�7,�2010
Project Objectives
Use of Horizontal Wells to Improve Pattern Waterflood in Fractured Carbonate
Reservoirs(Ozkan, Kazemi, Graves and Ghedan)
Primary graduate studentWaleed Al-Ameri (PI), MS Student
Research topic - “Evaluation and numerical/analytical modeling of efficacy of
horizontal wells in the Thamama 1A in the Upper Zakum field”
61st�Annual�PI�Partner�Schools�Research�Workshop,�January�6�7,�2010
212

Results and Discussions
1st�Annual�PI�Partner�Schools�Research�Workshop,�January�6�7,�2010 7
Case 1:* Single porosity* 2 vertical producers* Vertical injectors and producers are
perforated all 15 layers* RF= 23.5%
Case 2:* Single porosity* 2 horizontal injectors and 2 horizontal
producers* Horizontal well length = 500 ft (In the x axis)* Horizontal injectors are completed in layer 3* Horizontal producers are completed in layer
12* RF= 25.2%
Case 3:* Dual porosity* 2 horizontal injectors and 2
horizontal producers* Horizontal well length is 500 ft
(in the x axis)* Horizontal injectors are
completed in layer 18* Horizontal producers are
completed in layer 27* RF= 17.7%
Case 4:* Dual porosity* 2 horizontal injectors and 2 horizontal
producers* Horizontal injectors are completed in layer 18* Horizontal producers are completed in layer
27* RF= 17.4%
Results and Discussions
81st�Annual�PI�Partner�Schools�Research�Workshop,�January�6�7,�2010
Base�Case Case�1 Case�2
Case�4Case�3
213
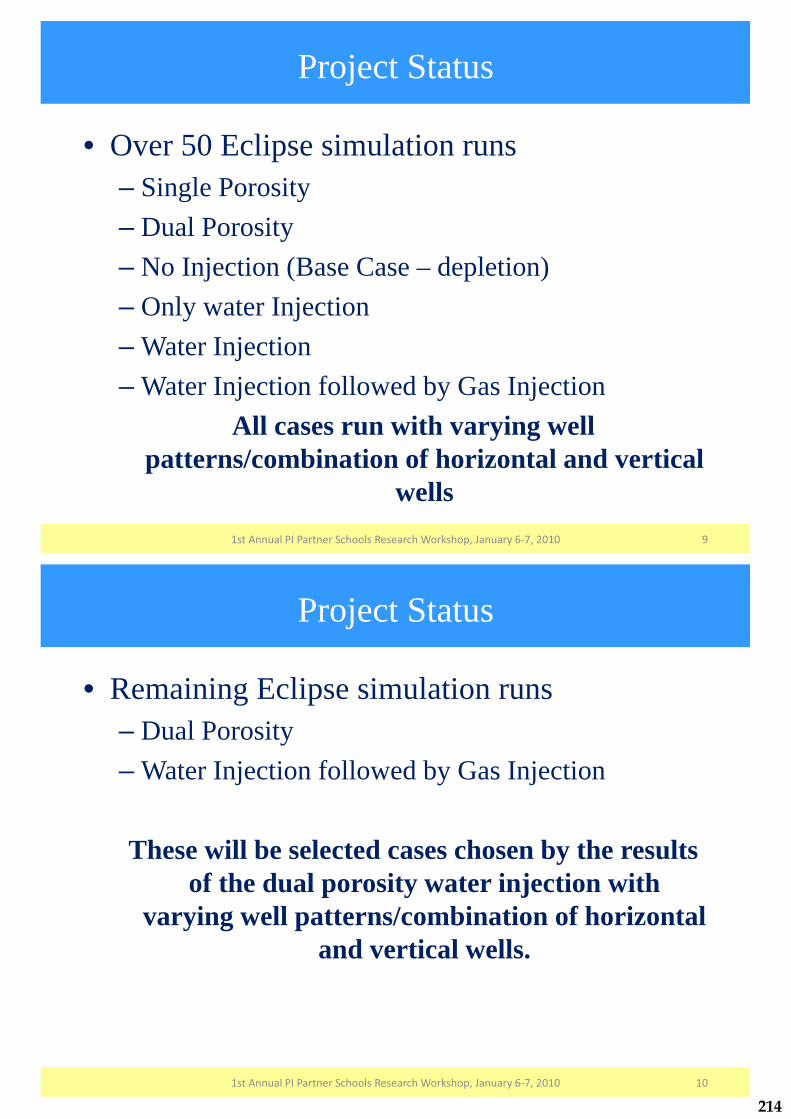
Project Status
• Over 50 Eclipse simulation runs– Single Porosity– Dual Porosity– No Injection (Base Case – depletion)– Only water Injection– Water Injection – Water Injection followed by Gas Injection
All cases run with varying well patterns/combination of horizontal and vertical
wells1st�Annual�PI�Partner�Schools�Research�Workshop,�January�6�7,�2010 9
Project Status
• Remaining Eclipse simulation runs– Dual Porosity– Water Injection followed by Gas Injection
These will be selected cases chosen by the results of the dual porosity water injection with
varying well patterns/combination of horizontal and vertical wells.
1st�Annual�PI�Partner�Schools�Research�Workshop,�January�6�7,�2010 10
214

Conclusions and Summary
• Final Simulations Cases to be completed in January.
• Eclipse modeling, results, conclusions, and recommendations will be completed by June 2010. (Waleed Al-Ameri thesis written and defended).
• These cases will be the starting point for the simulation in Project 8.
1st�Annual�PI�Partner�Schools�Research�Workshop,�January�6�7,�2010 11
215

Catalytic Processes
216
PI�Partners PI�SponsorsPI�Partners PI�Sponsors
1st Annual�PI�Partner�Schools�Research�Workshop
The�Petroleum�Institute,�Abu�Dhabi,�U.A.E.
January�6�7,�2010
1st Annual�PI�Partner�Schools�Research�Workshop
The�Petroleum�Institute,�Abu�Dhabi,�U.A.E.
January�6�7,�2010
Development�of�1.�Zeolite�Catalysts�for�Alkane�Metathesis�and�2.�Adsorbents�for�H2S�Removal
UMN�Team:�Aditya Bhan,�Matteo Cococcioni,�Michael�Tsapatsis,�Alon McCormick,�Parveen Kumar,�Ian�Hill,�Mark�Mazar
PI�Team:�Saleh Al�Hashimi,�Radu Vladea,�Narasimaharao Katabathini
Presentation Outline of Metathesis Experiments
• Alkane metathesis overview• Alkane activation• Reactor setup and characterization tools• H+�Ga3+�Ta5+ effects on alkane activation • Project Status• Conclusions and Summary• Future Work
21st�Annual�PI�Partner�Schools�Research�Workshop,�January�6�7,�2010
217

Alkane metathesis interconverts alkanes at low temperatures and pressures
31st�Annual�PI�Partner�Schools�Research�Workshop,�January�6�7,�2010
2C3H8� C2H6 + C4H10
Ra Rb Ra’ Rb
’Ra Rb Ra’ Rb
’
Olefin MetathesisDehydrogenation Hydrogenation
H2
Swaps side groups betweenTwo olefins
• Non-oxidative alkane chain length redistribution at 523 K and 1 bar
• Reported catalysts consist of high-valentmetal clusters or hydrides on amorphous silica or alumina surfaces
(O)y
M(x+y)+
(H)x
M MM
SiO2 or Al2O3
SiO2 or Al2O3
Taoufik, M. et al. Topics in Catalysis 2006, 40, 65.Nemana, S. et al. Chem. Commun. 2006, 38, 3996
Project Objectives
41st�Annual�PI�Partner�Schools�Research�Workshop,�January�6�7,�2010
Exchange of high-valent cations into zeolites• Site isolated cations in constrained (<1 nm) environments
• Follow the “elementary steps” of catalyst synthesis and reactions experimentally and theoretically
• Electrophillic metal cations with high reactivity for C-C and C-H bond cleavage
Ra Rb Ra’ Rb
’Ra Rb Ra’ Rb
’
Olefin MetathesisDehydrogenation Hydrogenation
H2
Initial objective: Study alkane activation as a function of cation valence
218
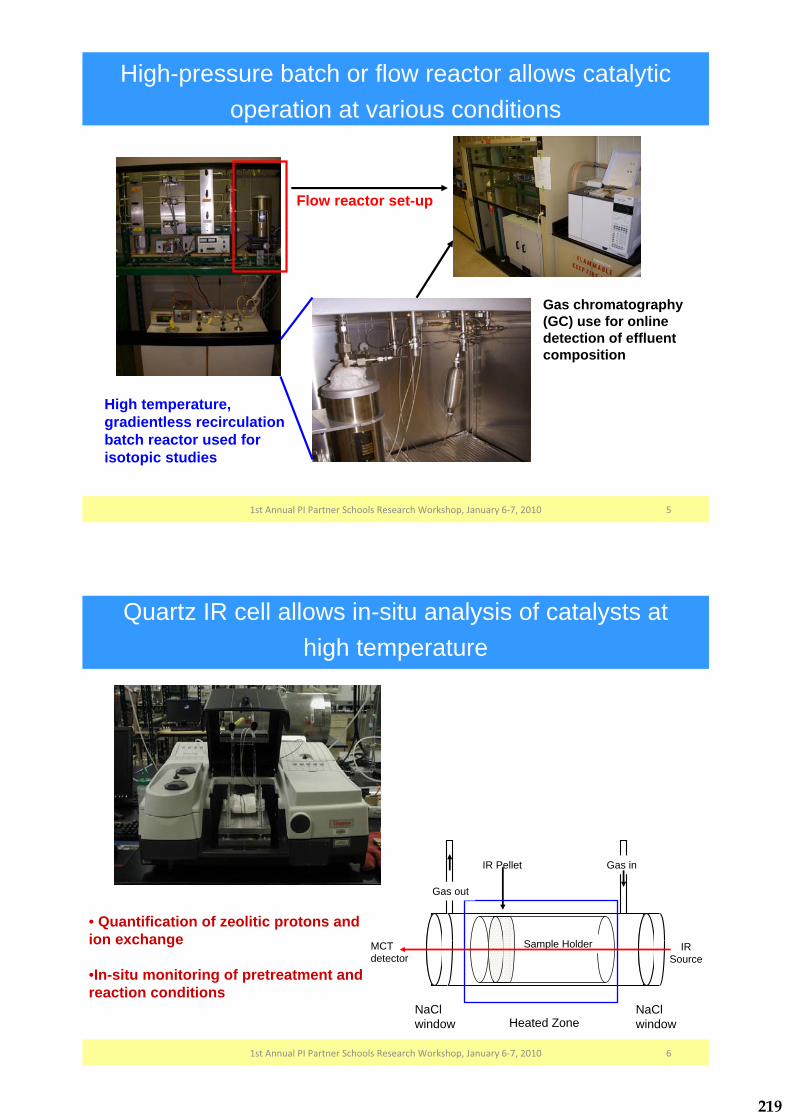
High-pressure batch or flow reactor allows catalytic operation at various conditions
51st�Annual�PI�Partner�Schools�Research�Workshop,�January�6�7,�2010
Flow reactor set-up
High temperature, gradientless recirculation batch reactor used for isotopic studies
Gas chromatography (GC) use for online detection of effluent composition
Quartz IR cell allows in-situ analysis of catalysts at high temperature
61st�Annual�PI�Partner�Schools�Research�Workshop,�January�6�7,�2010
IR Pellet
Sample Holder
Heated Zone
Gas in
Gas out
NaClwindow
NaClwindow
MCTdetector
IRSource
• Quantification of zeolitic protons and ion exchange
•In-situ monitoring of pretreatment and reaction conditions
219

Proton-form zeolites can crack or dehydrogenate propane
1st�Annual�PI�Partner�Schools�Research�Workshop,�January�6�7,�2010 7
SiO
AlO
Si
H
H2C CH2
H3C
SiO
AlO
Si
CH2 H2
CH2H3C
SiO
AlO
Si
CH2
CHH3C
H
Dehydrogenation
SiO
AlO
Si
CH2 CH4
H3C
SiO
AlO
Si
CH2
H2C
H
CrackingH
Activation via dehydrogenation is preferred for chemical applications as cracking loses carbon via methane
2 C3H8� CH4 + C2H4
2 C3H8� H2 + C3H6
Propane activation over proton-form zeolites
1st�Annual�PI�Partner�Schools�Research�Workshop,�January�6�7,�2010 8
T (K)
k app
([C3H
8][H
+ ]-1 h
-1ba
r-1)
1
10
100
758
k app
([C3H
8][H
+ ]-1 h
-1ba
r-1)
1
10
100
705730788820T (K)
758 705730788820
2 C3H8� CH4 + C2H4 2 C3H8� H2 + C3H6
H-FER
H-MFI
H-MOR
H-BEA
H-FER
H-MFI
H-MOR
H-BEA
Time on stream (h)0 10 20 30
Flow
rate
(mol
x 1
06m
in-1
)
0.4
1.9
3.4MethaneEthylenePropylene • Stable, stoichiometric cracking
(CH4/C2H4 = 1)
• kcracking > kdehydrogenation overproton-form zeolites
H-MFI
714 K
714 K
728 K
699 K
220
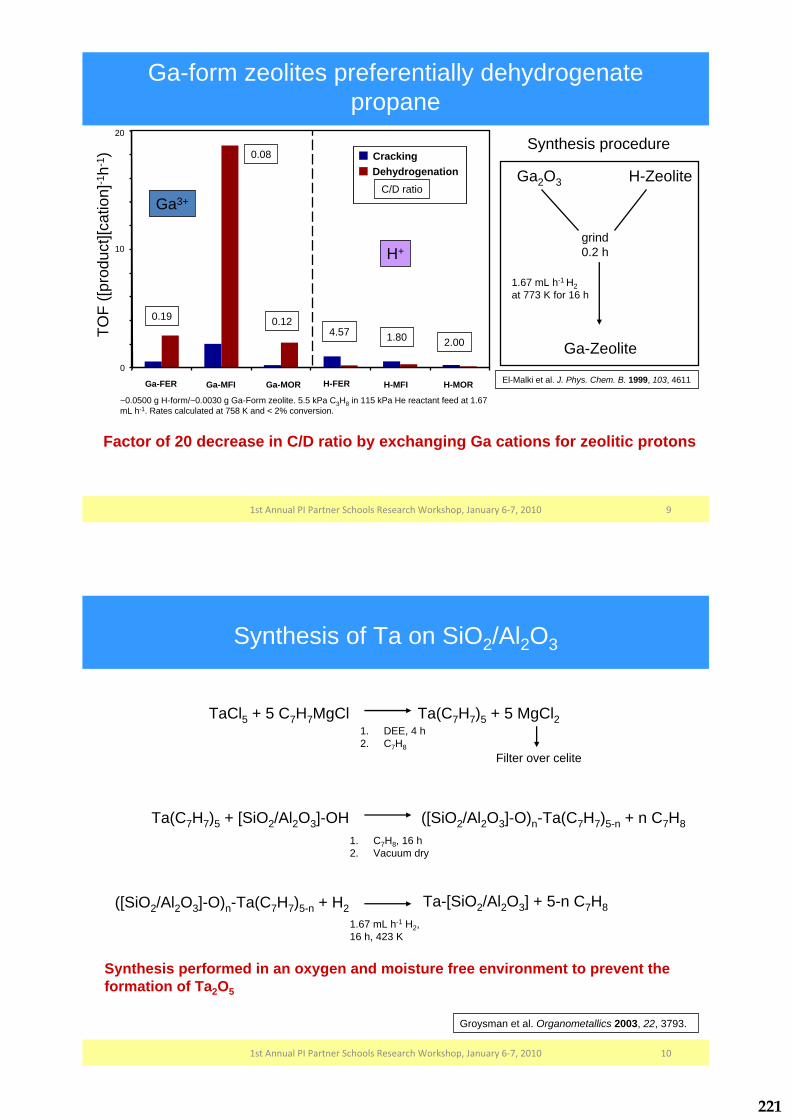
Ga-form zeolites preferentially dehydrogenate propane
1st�Annual�PI�Partner�Schools�Research�Workshop,�January�6�7,�2010 9
Ga2O3 H-Zeolite
grind0.2 h
1.67 mL h-1 H2at 773 K for 16 h
Ga-Zeolite
TOF
([pro
duct
][cat
ion]
-1h-
1 )
0
20
10
Ga-FER Ga-MFI Ga-MOR H-FER H-MFI H-MOR
0.19
0.08
0.124.57 1.80 2.00
CrackingDehydrogenation
Synthesis procedure
Factor of 20 decrease in C/D ratio by exchanging Ga cations for zeolitic protons
~0.0500 g H-form/~0.0030 g Ga-Form zeolite. 5.5 kPa C3H8 in 115 kPa He reactant feed at 1.67 mL h-1. Rates calculated at 758 K and < 2% conversion.
C/D ratio
El-Malki et al. J. Phys. Chem. B. 1999, 103, 4611
Ga3+
H+
Synthesis of Ta on SiO2/Al2O3
1st�Annual�PI�Partner�Schools�Research�Workshop,�January�6�7,�2010 10
Synthesis performed in an oxygen and moisture free environment to prevent the formation of Ta2O5
Ta(C7H7)5 + 5 MgCl21. DEE, 4 h2. C7H8
TaCl5 + 5 C7H7MgCl
Filter over celite
Ta(C7H7)5 + [SiO2/Al2O3]-OH ([SiO2/Al2O3]-O)n-Ta(C7H7)5-n + n C7H81. C7H8, 16 h2. Vacuum dry
([SiO2/Al2O3]-O)n-Ta(C7H7)5-n + H21.67 mL h-1 H2,16 h, 423 K
Ta-[SiO2/Al2O3] + 5-n C7H8
Groysman et al. Organometallics 2003, 22, 3793.
221
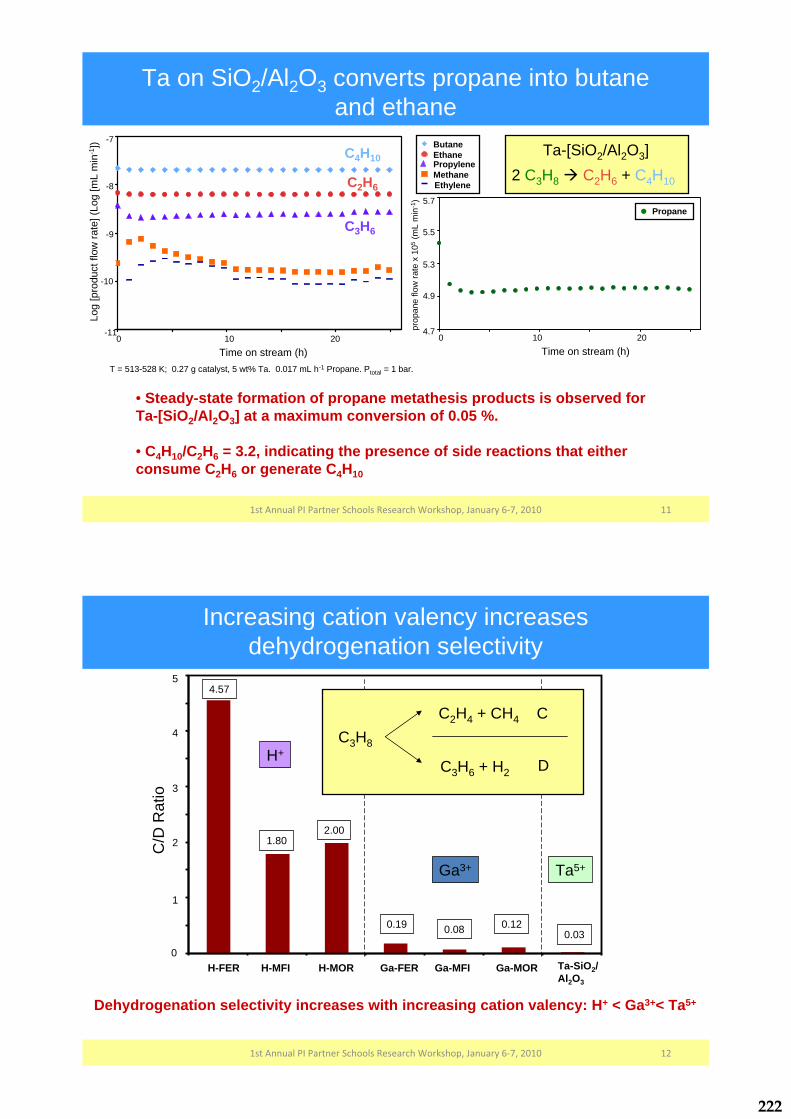
Ta on SiO2/Al2O3 converts propane into butane and ethane
1st�Annual�PI�Partner�Schools�Research�Workshop,�January�6�7,�2010 11
• Steady-state formation of propane metathesis products is observed for Ta-[SiO2/Al2O3] at a maximum conversion of 0.05 %.
• C4H10/C2H6 = 3.2, indicating the presence of side reactions that either consume C2H6 or generate C4H10
Ta-[SiO2/Al2O3]
Log
[pro
duct
flow
rate
] (Lo
g [m
Lm
in-1
])
-11
-10
-9
-8
-7
Time on stream (h) 0 10 20
MethaneEthylene
PropyleneEthaneButane
2 C3H8� C2H6 + C4H10
Propane
prop
ane
flow
rate
x 1
05(m
Lm
in-1
)
4.7
4.9
5.3
5.5
5.7
Time on stream (h) 0 10 20
T = 513-528 K; 0.27 g catalyst, 5 wt% Ta. 0.017 mL h-1 Propane. Ptotal = 1 bar.
C4H10
C2H6
C3H6
Increasing cation valency increases dehydrogenation selectivity
1st�Annual�PI�Partner�Schools�Research�Workshop,�January�6�7,�2010 12
Dehydrogenation selectivity increases with increasing cation valency: H+ < Ga3+< Ta5+
C/D
Rat
io
H-FER H-MFI H-MOR Ga-FER Ga-MFI Ga-MOR Ta-SiO2/Al2O3
0
4
3
2
1
5
C3H8
C2H4 + CH4
C3H6 + H2
C
D
0.19 0.08 0.12
4.57
1.802.00
0.03
H+
Ga3+ Ta5+
222
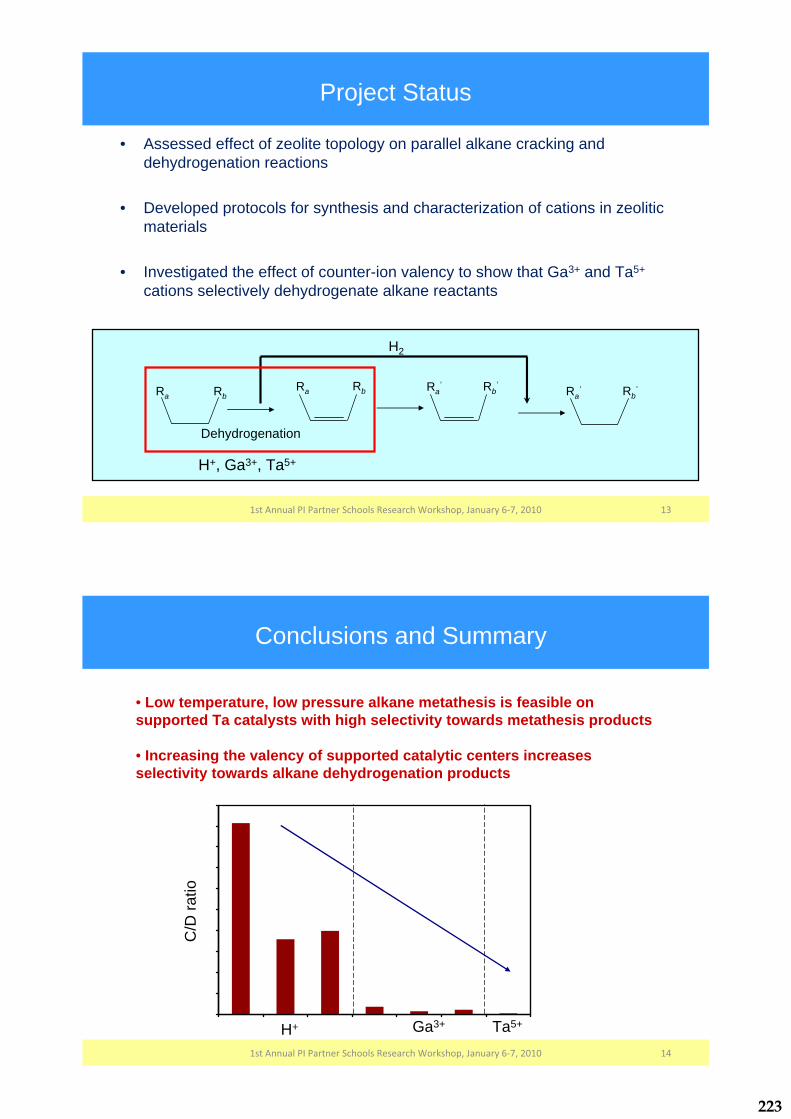
Project Status
• Assessed effect of zeolite topology on parallel alkane cracking and dehydrogenation reactions
• Developed protocols for synthesis and characterization of cations in zeoliticmaterials
• Investigated the effect of counter-ion valency to show that Ga3+ and Ta5+
cations selectively dehydrogenate alkane reactants
1st�Annual�PI�Partner�Schools�Research�Workshop,�January�6�7,�2010 13
Ra Rb Ra’ Rb
’Ra Rb Ra’ Rb
’
H2
Dehydrogenation
H+, Ga3+, Ta5+
Conclusions and Summary
1st�Annual�PI�Partner�Schools�Research�Workshop,�January�6�7,�2010 14
• Low temperature, low pressure alkane metathesis is feasible on supported Ta catalysts with high selectivity towards metathesis products
• Increasing the valency of supported catalytic centers increasesselectivity towards alkane dehydrogenation products
H+ Ga3+ Ta5+
C/D
ratio
223
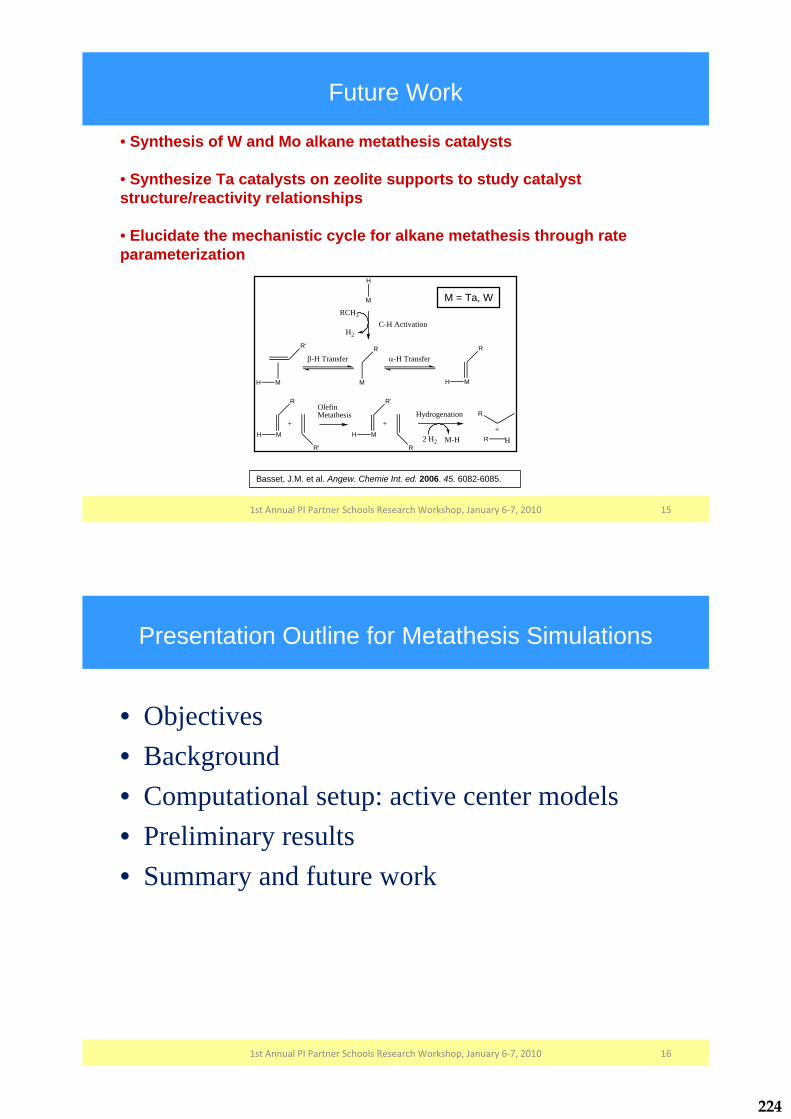
Future Work
1st�Annual�PI�Partner�Schools�Research�Workshop,�January�6�7,�2010 15
• Synthesis of W and Mo alkane metathesis catalysts
• Synthesize Ta catalysts on zeolite supports to study catalyst structure/reactivity relationships
• Elucidate the mechanistic cycle for alkane metathesis through rate parameterization
Basset, J.M. et al. Angew. Chemie Int. ed. 2006. 45. 6082-6085.
Olefin metathesis
M
H
RCH3
H2
C-H Activation
M
R�-H Transfer
H M
R
MH
R'
�-H Transfer
H M
R
R'
+
OlefinMetathesis
H M
R'
R
+
2 H2 M-H
R
R H+
Hydrogenation
M = Ta, W
Presentation Outline for Metathesis Simulations
161st�Annual�PI�Partner�Schools�Research�Workshop,�January�6�7,�2010
• Objectives• Background• Computational setup: active center models• Preliminary results• Summary and future work
224

Objectives
171st�Annual�PI�Partner�Schools�Research�Workshop,�January�6�7,�2010
We want to to design a zeolite-supported catalyst that is able to perform the conversion of alkane molecules.
We need to:
• identify good candidate systems (support and active centers)
• assess and compare their reactivity in critical steps of the reaction
Background
Quantistic (DFT) calculations will be used to assess the kinetics of important reactions steps on various metal active centers
We need to:
• Construct a model for the active center
• Define a computational protocol to evaluate the reactivity of different species (e.g., calculate activation barriers)
• Study the chemical evolution of the system during critical steps of the catalytic process
225

Computational setup: definition of the active center
191st�Annual�PI�Partner�Schools�Research�Workshop,�January�6�7,�2010
Substitutional Al charge center
Al
Pristine silaceous zeolite
Ta-hydride active centerTaH2 active centerSubstitutional Al defect creates a charge deficiency in the system
Charge deficiency induces a high oxidation state in Ta and makes the metal center able to activate strong C-H bonds
Cluster models around the active center will be used to speed up calculations
Ta
Modeling the chemistry
• Calculations of reactions in the periodic support (zeolite) are too expensive
• Idea: model the chemistry on small clusters of atoms around the active center and refine the kinetics (e.g., activation barrier) with single-point calculations in the periodic systems
• Ideal cluster size: 17T alkyl group• Calculations on 17T clusters are quite expensive too
• Initial screening performed on 5T clusters (NEB)
• Refinement of energetics will be performed on bigger cluster and on zeolite
226

Preliminary results: dehydrogenation of the alkyl group
1st�Annual�PI�Partner�Schools�Research�Workshop,�January�6�7,�2010 21
alkyl
carbene
olefin
•Calculations on 17T clusters are quite expensive
•Initial screening performed on 5T clusters (NEB)
•Refinement of energetics will be performed on bigger cluster and on zeolite
alpha-H elimination to ethene
1 9653
image 5 is the transition state
forward reaction energy barrier:2.15 eV
backward reaction energy barrier: 0.6 eV
227
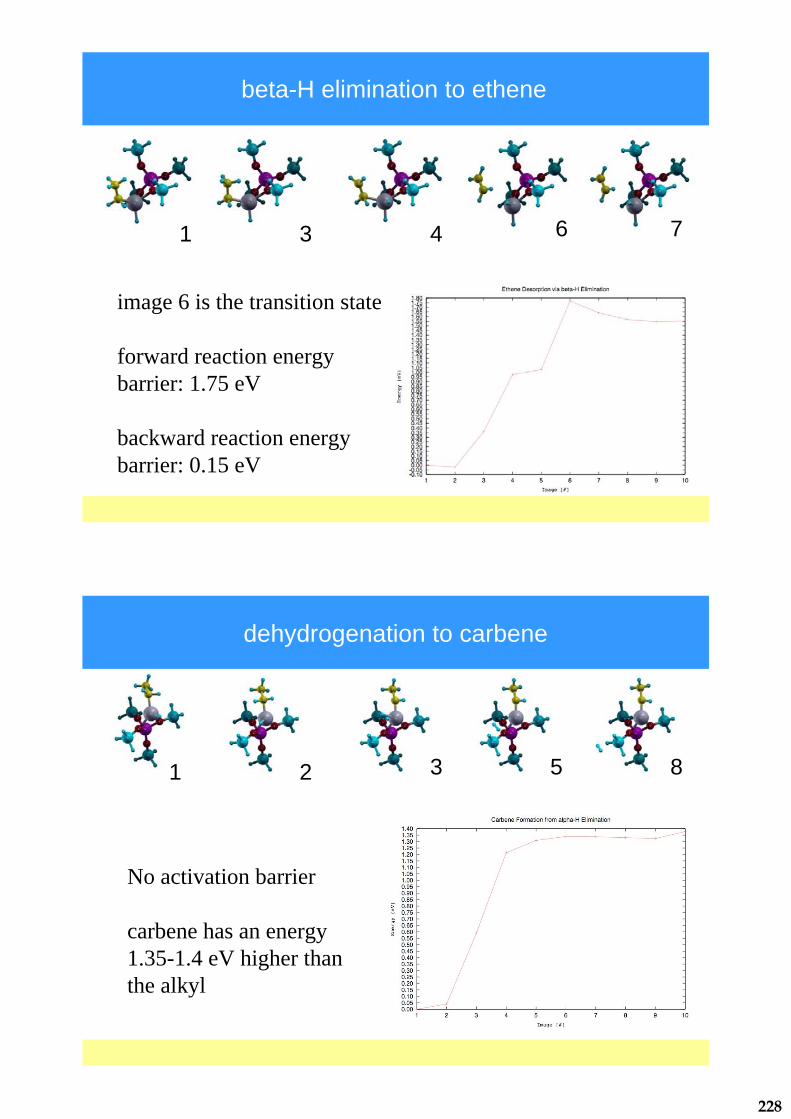
beta-H elimination to ethene
1 7643
image 6 is the transition state
forward reaction energy barrier: 1.75 eV
backward reaction energy barrier: 0.15 eV
dehydrogenation to carbene
1 8532
No activation barrier
carbene has an energy1.35-1.4 eV higher than the alkyl
228

Conclusions and future work
• beta-H elimination to ethene has lower activation energy than alpha-H elimination
• Carbene is unstable towards hydrogenation to alkyl
Future developments:
• Screening of other TM centers (W, Mo)
• Study of other chemical steps (e.g. metathesis)
• Refinement of energetics in 17T clusters and zeolite
Part 2:Adsorbents for H2S Removal
• Problem Description: Demonstrate the feasibility of using molecular sieve adsorbents and membranes to concentrate streams that are dilute in H2S.
• Benefits: New environmental separation method(s) to separate and concentrate dilute H2S. Develop in-house technical expertise to address sulfur emission issues.
229
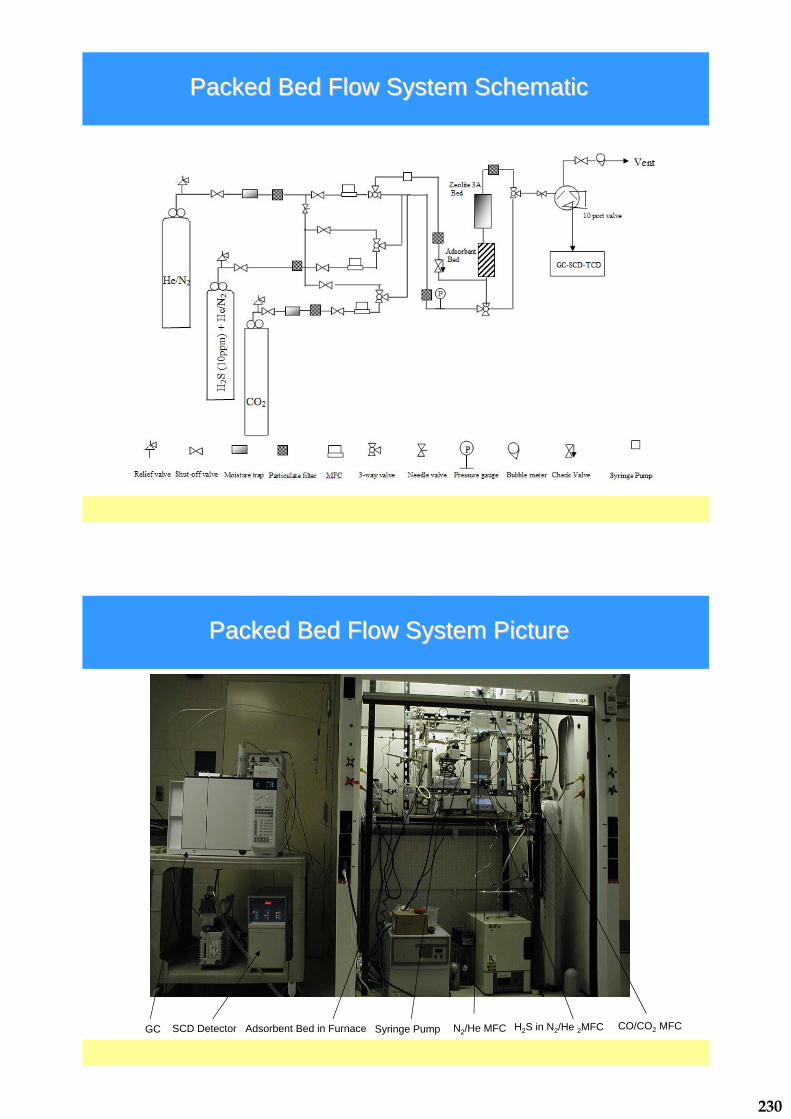
Packed Bed Flow System SchematicPacked Bed Flow System Schematic
GC SCD Detector Adsorbent Bed in Furnace Syringe Pump N2/He MFC H2S in N2/He 2MFC CO/CO2 MFC
Packed Bed Flow System PicturePacked Bed Flow System Picture
230
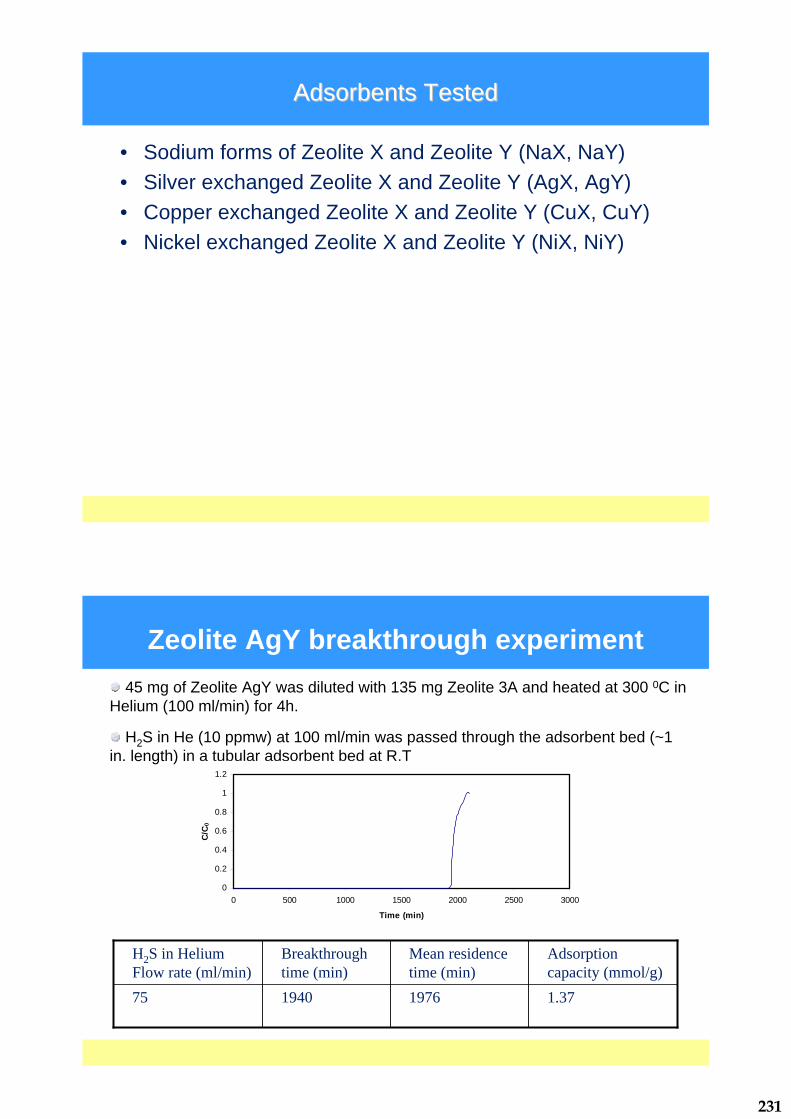
Adsorbents TestedAdsorbents Tested
• Sodium forms of Zeolite X and Zeolite Y (NaX, NaY)• Silver exchanged Zeolite X and Zeolite Y (AgX, AgY)• Copper exchanged Zeolite X and Zeolite Y (CuX, CuY)• Nickel exchanged Zeolite X and Zeolite Y (NiX, NiY)
Zeolite AgY breakthrough experiment
1.371976194075
Adsorptioncapacity (mmol/g)
Mean residence time (min)
Breakthroughtime (min)
H2S in Helium Flow rate (ml/min)
45 mg of Zeolite AgY was diluted with 135 mg Zeolite 3A and heated at 300 0C in Helium (100 ml/min) for 4h.
H2S in He (10 ppmw) at 100 ml/min was passed through the adsorbent bed (~1 in. length) in a tubular adsorbent bed at R.T
0
0.2
0.4
0.6
0.8
1
1.2
0 500 1000 1500 2000 2500 3000
Time (min)
C/C
0
231

H2S
Cap
acity
(mm
ol/g
)
10 ppm H2Sin Helium
0.5
1.0
1.5
2.0
NaX
NaY
AgY
AgX
NiYNiX
CuY
10 ppm H2Sin Nitrogen
AgX
AgY
NaX
CuY
10 ppm H2Sin Nitrogen + 2 % CO
AgX
AgY
CuY
H2S (10 ppm) Breakthrough Experiments (R.T.)
H2S (10 ppm) Breakthrough Experiments at 1500C
H2S
Cap
acity
(mm
ol/g
)
10 ppm H2Sin Helium
0.5
1.0
1.5
2.0
NaX
NaY
AgY, CuY
AgX, CuX, NiX
10 ppm H2Sin Nitrogen
AgX
AgY
NaX
10 ppm H2Sin Helium +2 % CO
AgX
AgY
CuY, NiY
NiY
10 ppm H2Sin Nitrogen +2 % CO
CuX, NiX
AgX
AgY
232
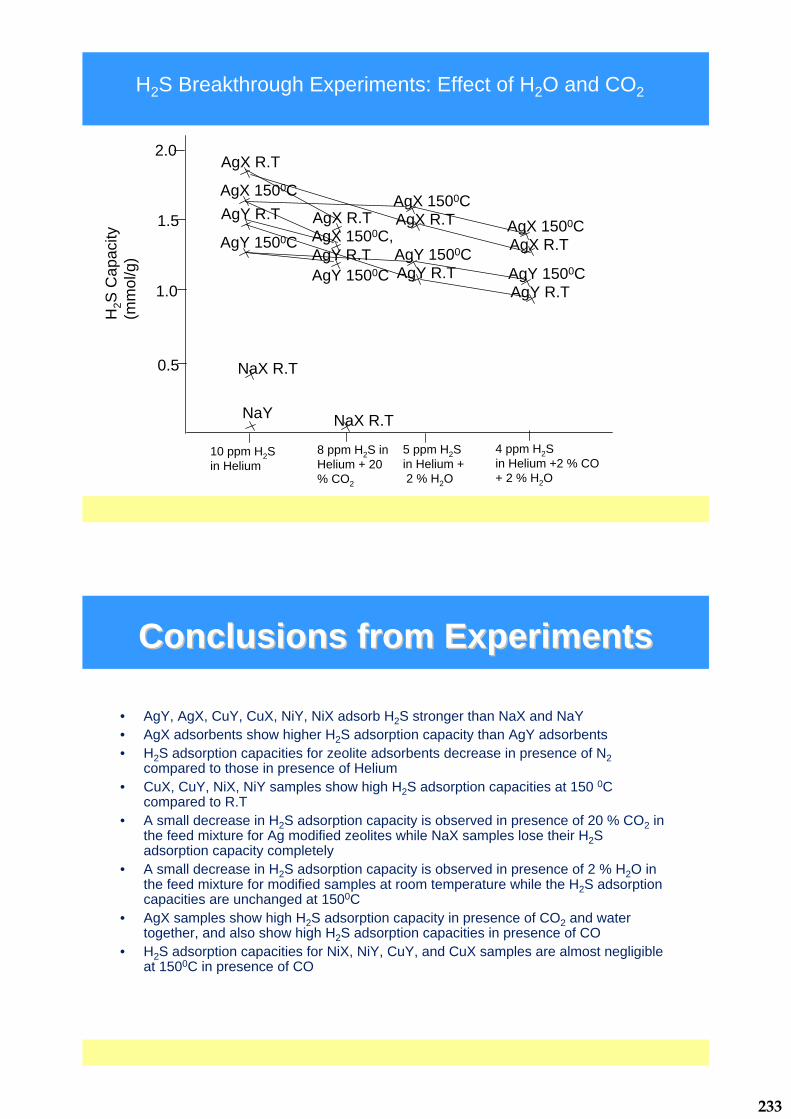
H2S Breakthrough Experiments: Effect of H2O and CO2H
2S C
apac
ity(m
mol
/g)
10 ppm H2Sin Helium
0.5
1.0
1.5
2.0
NaX R.T
NaY
AgX R.T
8 ppm H2S in Helium + 20 % CO2
5 ppm H2Sin Helium +2 % H2O
4 ppm H2Sin Helium +2 % CO + 2 % H2O
AgX 1500C
AgX R.TAgX 1500C,AgY R.T
AgY R.T
AgY 1500C
AgY 1500C
NaX R.T
AgX R.TAgX 1500C
AgY R.TAgY 1500C AgX R.T
AgX 1500C
AgY R.TAgY 1500C
Conclusions from ExperimentsConclusions from Experiments
• AgY, AgX, CuY, CuX, NiY, NiX adsorb H2S stronger than NaX and NaY• AgX adsorbents show higher H2S adsorption capacity than AgY adsorbents • H2S adsorption capacities for zeolite adsorbents decrease in presence of N2
compared to those in presence of Helium• CuX, CuY, NiX, NiY samples show high H2S adsorption capacities at 150 0C
compared to R.T• A small decrease in H2S adsorption capacity is observed in presence of 20 % CO2 in
the feed mixture for Ag modified zeolites while NaX samples lose their H2Sadsorption capacity completely
• A small decrease in H2S adsorption capacity is observed in presence of 2 % H2O in the feed mixture for modified samples at room temperature while the H2S adsorption capacities are unchanged at 1500C
• AgX samples show high H2S adsorption capacity in presence of CO2 and water together, and also show high H2S adsorption capacities in presence of CO
• H2S adsorption capacities for NiX, NiY, CuY, and CuX samples are almost negligible at 1500C in presence of CO
233

Unit cell of Y zeolite, 576 atoms
crystallographic data
a region (site II) of the zeoliteframework is extracted and terminated by H atoms
site II
1. One Si atom is substituted by Al with M+ (M=Cu or Ag or Na) as the charge balancing cation
2. Terminating OH groups are fixed
Cluster model of Y Zeolites
six ring
Quantum Chemical Calculations
SchrÖdinger Equation: ��� EH
DFT (Density Functional Theory):• The fundamental variable is the electron density �(r)
in place of the wavefunction• The energy functional E[�] is a minimum for the true
electron density
Software: Gaussian 03Level of Theory: B3LYPBasis set: SDD for M+, and 631+G(d) for all other atoms
�E : wavefunction
234

Bare Zeolite Cluster Model
CuIY NaY AgIY
Ionic radii* : Cu+ (77 pm) < Na+ (102 pm) < Ag+ (115 pm)M+ to the six-ring plane : Cu+ (0.02 Å) < Na+ (1.05 Å) < Ag+ (1.34 Å)
*Acta Cryst. A32 751-767 (1976)
1.05Å 1.34Å
Charge Electron configurationCu+ 0.76 [Ar]4S0.193d9.904p0.13
Na+ 0.86 [Ne]3S0.043p0.10
Ag+ 0.83 [Kr]5S0.084d9.985p0.10
Electronic properties of cation on zeolite cluster:
Transition metal given up 4s electron instead of 3d electronsgiven up 3s electrongiven up 5s electron instead of 4d electrons
Adsorption of Small Molecules
+
side view:
�E = E(Z+X) - E(Z) -E(X)Z: zeolite clusterX: adsorbate
1.38Å
235
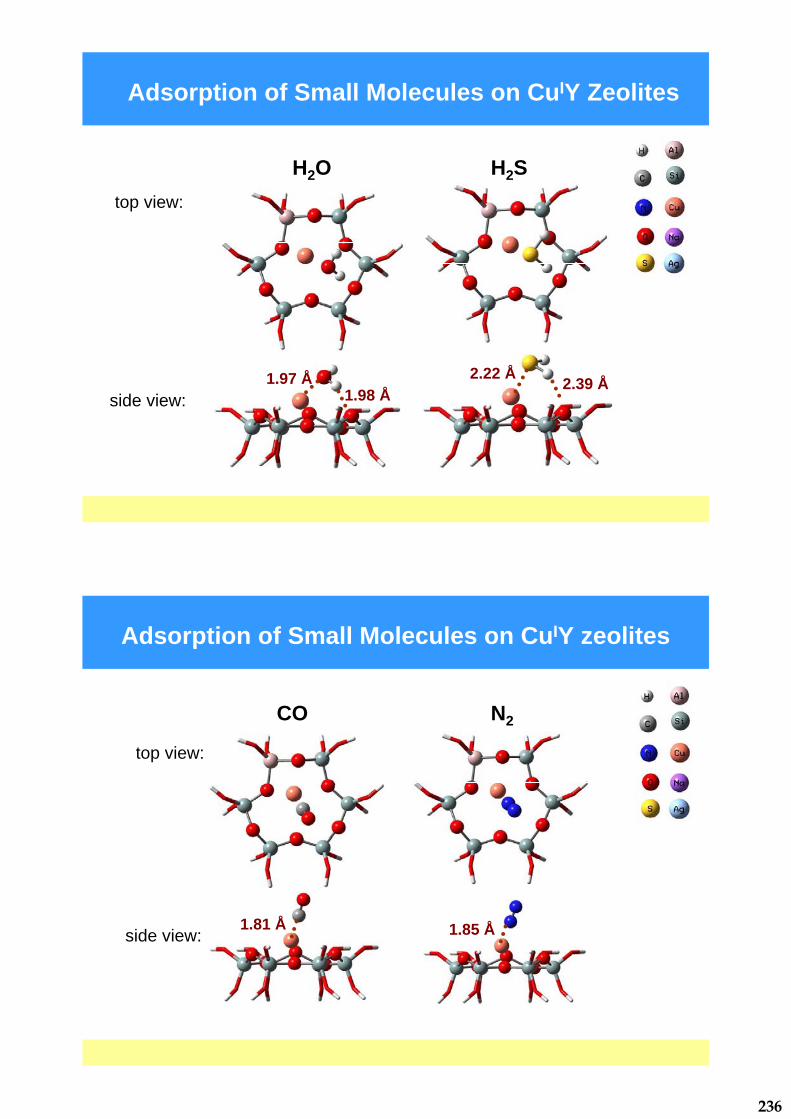
Adsorption of Small Molecules on CuIY Zeolites
H2O H2S
side view:
top view:
1.97 Å 2.22 Å1.98 Å
2.39 Å
Adsorption of Small Molecules on CuIY zeolites
CO N2
side view:
top view:
1.81 Å 1.85 Å
236

�Q of Cations upon Adsorption
Change of number of electrons
CO H2O H2S N2
Cu+ �4s +0.16 +0.10 +0.13 +0.06
�3d -0.17 -0.05 -0.03 -0.13
Na+ �3s +0.06 +0.01 +0.03 +0.04
�3p -0.1 -0.1 -0.1 -0.1
Ag+ �5s +0.23 +0.07 +0.17 +0.09
�4d -0.18 -0.03 -0.05 -0.07
invariant
invariant
accepting e’s
donating e’s
donating e’s
accepting e’s
-120
-100
-80
-60
-40
-20
0
Ads
orpt
ion
Ener
gy
CuYAgYNaY
CO H2O H2S N2
Energetics of Small Molecules adsorbed on CuIYand AgIY
237

Remarks on the Computational Work
• On zeolite cluster, Cu+, Na+, and Ag+ exhibit different properties (locations and electron configurations) due to their nature (ionic radii and transition metal characteristics).
• Upon adsorption, CO and N2 undertake end-on configurations, whereas H2O and H2S coordinate to metals with O atom and S atom, respectively.
• The trend for electrons exchanged between Cu+ and Ag+ and adsorbateis different from that between Na+ and adsorbate. This indicates that the adsorption mechanism is different for transition metal exchangedzeolites.
• Competitive adsorption need to be further studied by optimizing more than single adsorbate molecules on the zeolite cluster.
238

�������������� ���������������������������������
���������� ��!��""��
#$��������%&���������'��!&�(����)��������*��
#$�#������� � � � � �#$�� "��"���
������������� ��� ������������ ����� ������
����#���"&���$��+������%,��-��,�����%�.��
/�������012��3454�
6"�+����7"��6���&�+����(��� ���+"��#�"�������
Presentation Outline
•� Background and Objectives •� Dip Coating Process •� Coatings for Catalytic Processes
–� Gamma Alumina –� Carbon
•� Zeolite Coatings for Separation Processes •� Project Status •� Conclusions and Summary
3�5���%����&�#$�#����������""&��'���������"����" ��/�������012��3454�
239

Background
•� Coatings for Catalytic Processes –� Coated foams have applications as catalyst supports for
hydrotreating/hydrocracking of crude oils –� Catalytic coatings are comprised of a mesoporous support
(or catalytic) layer and catalytic particles –� Rotating catalytic bed reactors are the basis for more
efficient reactor designs incorporating the foams •� Coatings for Separation Processes
–� Zeolites have high selectivity for gas separations –� Zeolite coatings for separation processes must have a
controlled, defect-free structure
8�5���%����&�#$�#����������""&��'���������"����" ��/�������012��3454�
Project Objectives
•� Prepare catalytic coatings with controlled porosity and distribution of catalytic particles
•� Explore support coating chemistries and structures as well as coating processes
•� Characterize coatings before and after hydrotreating /hydrocracking reactions
•� Prepare and characterize zeolite coatings for gas separation processes
9�5���%����&�#$�#����������""&��'���������"����" ��/�������012��3454�
240
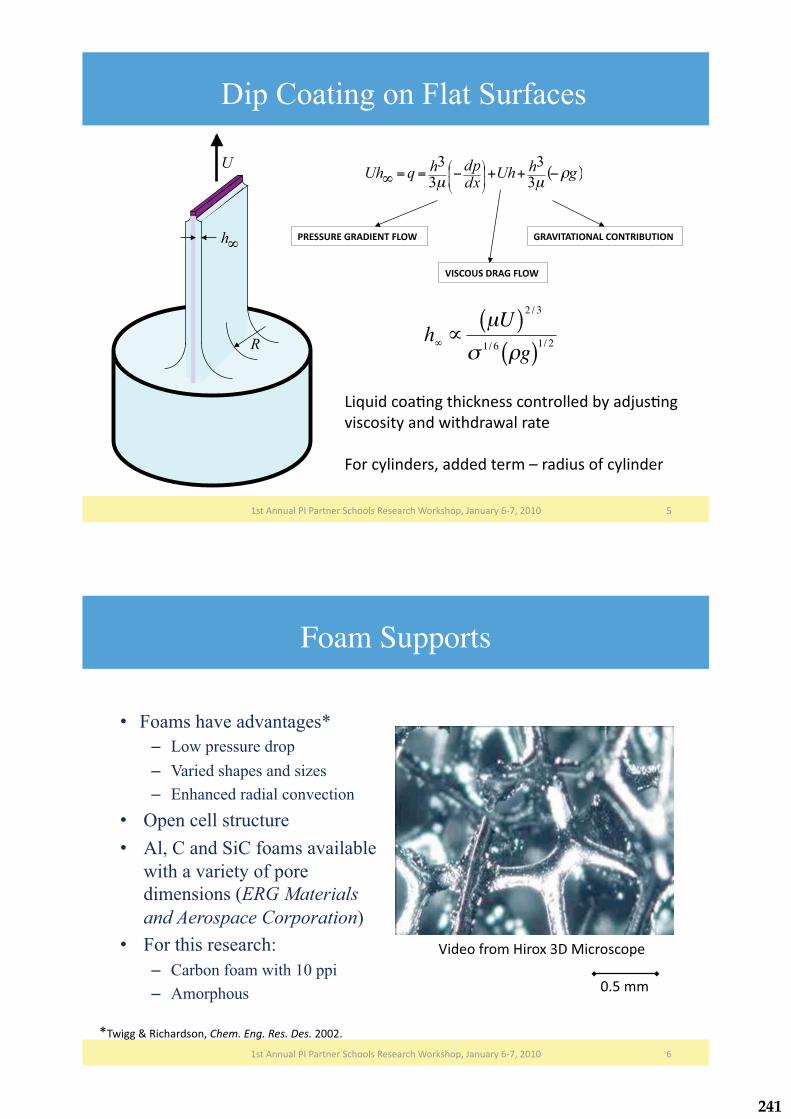
Dip Coating on Flat Surfaces
:�5���%����&�#$�#����������""&��'���������"����" ��/�������012��3454�
U
R
�����������������������
��!��������������
��� ����������!�����"������
��;��(��"�+��������������"���"&&�(�,���(<��+���
=���"�������(�*���(��*�&������
�"����&��(������((�(�����>���(����"7���&��(���
h�
�μU( )
2 / 3
� 1/ 6 �g( )1/ 2
Foam Supports�
•� Foams have advantages* –� Low pressure drop –� Varied shapes and sizes –� Enhanced radial convection
•� Open cell structure •� Al, C and SiC foams available
with a variety of pore dimensions (ERG Materials and Aerospace Corporation)
•� For this research: –� Carbon foam with 10 ppi –� Amorphous
5���%����&�#$�#����������""&��'���������"����" ��/�������012��3454� 0�
!�(�"�7�"����"?�8-�����"��" ��
@�*����A�'�����(�"����������������� ����3443��
4�:��
241

Dip Coating of Foams
2�5���%����&�#$�#����������""&��'���������"����" ��/�������012��3454�
•���Complex foam structure affects coating, drainage�•� Surface tension traps liquid in cell openings�•� Requires removal by air knife or centrifuge�
!��"����
���#�
��������������
�"&�(�B&� �����������"�����,"��
7"����&&���C���(������
�������������
������
!�������
��$����
!�(�"�7�"����"?�8-�����"��" ��
�-Alumina Coatings
•� Mesoporous catalyst and catalyst support layer •� Applied to a variety of supports, including ceramic
monoliths (structured supports), metals •� Route:
D�5���%����&�#$�#����������""&��'���������"����" ��/�������012��3454�
%&))��
EF"�����G�
%;��"����"&�-� "����
-���
����H6�&�����
�1%&3)8�
��" "�"���
�"�+���
#"&����,��(���"���1%&3)8� ��+�&������,���((�(��"������"&��
242
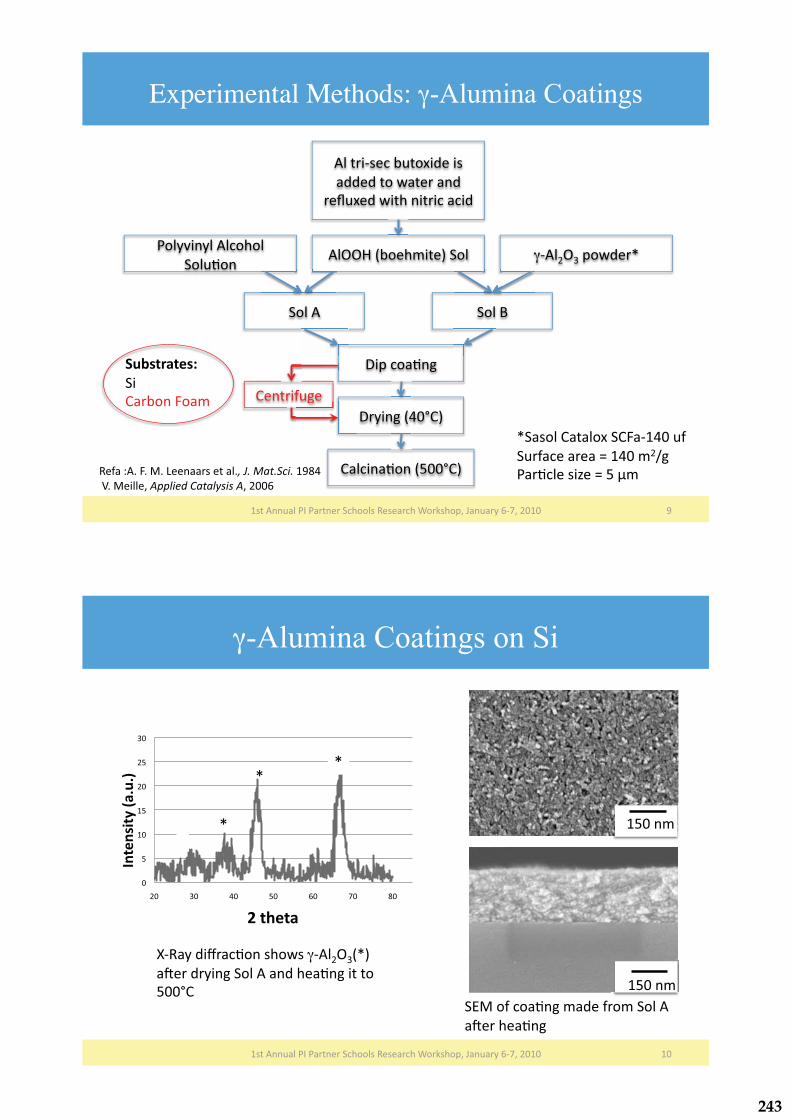
Experimental Methods: �-Alumina Coatings
5���%����&�#$�#����������""&��'���������"����" ��/�������012��3454� I�
%&����1����,��"?�(�����
�((�(��"�*�������(�
��J�?�(�*��������������(�
%&))��E,"�����G��"&�#"&�=���&�%&�"�"&�
�"&�+"��
�"&�%�
�1%&3)8� "*(��@�
�"&�F�
-� ��"�+���
-������E94K6G�
6�&����+"��E:44K6G�
��%�� ���&�
���
6��,"���"��
��%�� ���&�
���
6��,"���"�� 6�����7����� �7 �
@���"&�6���&"?��6��1594��7�
���7���������L�594�3H��
#��+�&�������L�:�M�'�7��%���������������������&���������������5ID9��!�����&&������������������������3440���
�-Alumina Coatings on Si
5���%����&�#$�#����������""&��'���������"����" ��/�������012��3454� 54�
�.��"7��"�+����(��7�"��"&�%�
�C������+���
4�
:�
54�
5:�
34�
3:�
84�
34� 84� 94� :4� 04� 24� D4�
������'�(�)*�*+�
,������
@�
N1'���(�O���+"����"*���1%&3)8E@G�
�C���(�������"&�%���(����+�������"�
:44K6�
5:4���
5:4���
@�
@�
243

Coating Sol A Deposited on Foam
5���%����&�#$�#����������""&��'���������"����" ��/�������012��3454� 55�
����"���6�����7������������� �����6�����7�������������
:��
4�:��
:��
5��
�-Alumina Coatings on Foam
•� Coatings from Sol A (AlOOH + PVA) are about 100-200 nm per deposition after heating
•� Many depositions would be needed to build coating thickness
5���%����&�#$�#����������""&��'���������"����" ��/�������012��3454� 53�
344���
:44���
244
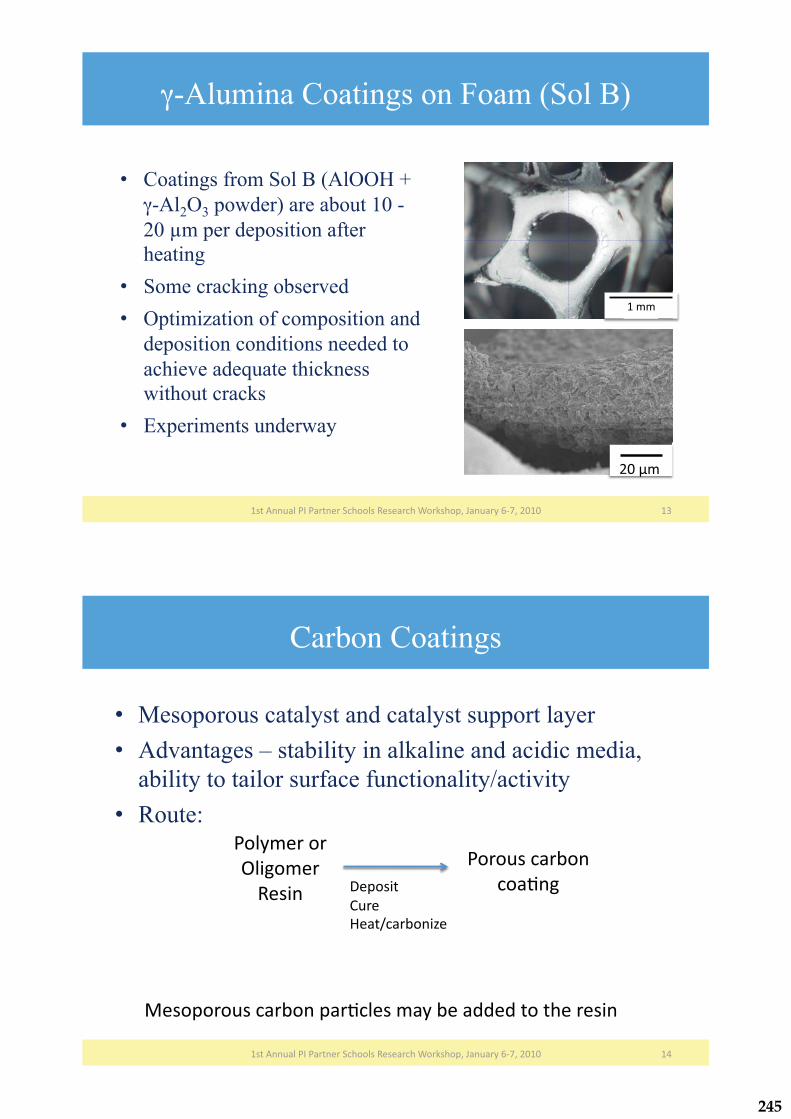
�-Alumina Coatings on Foam (Sol B)
•� Coatings from Sol B (AlOOH + �-Al2O3 powder) are about 10 - 20 �m per deposition after heating
•� Some cracking observed •� Optimization of composition and
deposition conditions needed to achieve adequate thickness without cracks
•� Experiments underway
5���%����&�#$�#����������""&��'���������"����" ��/�������012��3454� 58�
5��
34�M�
Carbon Coatings
•� Mesoporous catalyst and catalyst support layer •� Advantages – stability in alkaline and acidic media,
ability to tailor surface functionality/activity •� Route:
59�5���%����&�#$�#����������""&��'���������"����" ��/�������012��3454�
#"&����"��
)&��"���
'����� -� "����
6����
����H���,"�����
#"�"������,"��
�"�+���
���" "�"������,"�� ��+�&������,���((�(��"������������
245

Experimental Methods: Carbon Coatings
5���%����&�#$�#����������""&��'���������"����" ��/�������012��3454� 5:�
������'�����
6"�+����������%� 6"�+���������F�
-� ��"�+���
6������ED4K6G�
6��,"����+"��EI44K6G�
���%��"��
��%�� ��&�
6��,"���"��
�+"�
��%�� ��&�
6��,"���"�6�����7����� �7 �
)?�&���%��(� %���"��� ���" "�"���
6��,"��
#��+�&��@�
@6�,"��!�&���N23'�
���7���������P�334�3H��
#��+�&�������P�54����
%��������������P�844��'�7�.��Q�����1F"�(�<�������&����������3443���
Carbon Coatings on Foam – Coating A
5���%����&�#$�#����������""&��'���������"����" ��/�������012��3454� 50�
%C���6������ %C���6��,"����+"��
5�
3�� 3��
:44�M� �55�� :�M�
:44���
246
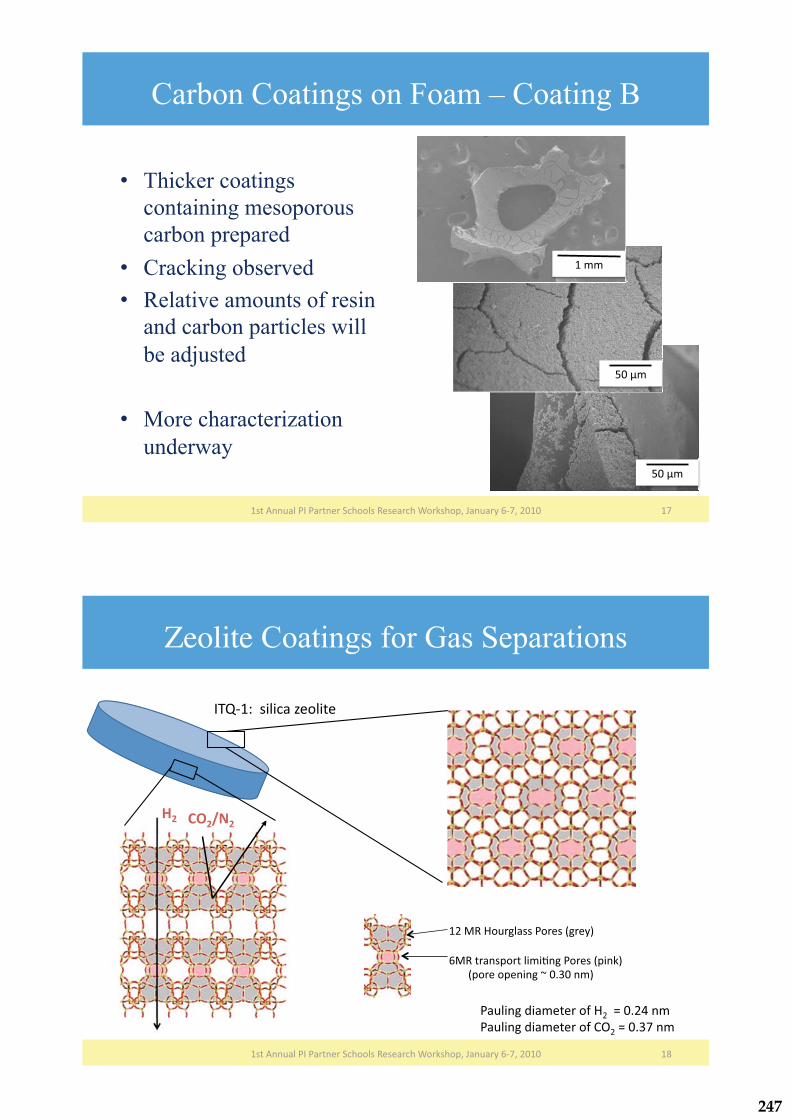
Carbon Coatings on Foam – Coating B
•� Thicker coatings containing mesoporous carbon prepared
•� Cracking observed •� Relative amounts of resin
and carbon particles will be adjusted
•� More characterization underway
5���%����&�#$�#����������""&��'���������"����" ��/�������012��3454� 52�
:4�M�
:4�M�
5��
Zeolite Coatings for Gas Separations
5D�5���%����&�#$�#����������""&��'���������"����" ��/�������012��3454�
-,� !�,.�,�
53��'��"���&����#"����E����G�
0�'������ "���&��+���#"����E ���G�
�������E "���" ������P�4�84��G�
#��&����(�������"7��3��L�4�39���
#��&����(�������"7�6)3�L�4�82���
$�R15����&������"&����
247

Hydrothermally Synthesized Zeolite Particles
5I�5���%����&�#$�#����������""&��'���������"����" ��/�������012��3454�
�� Thin circular disc with diameter 1-2 μm and thickness 30-40 nm��� Each disc consists of 2.5 nm thin sheets stacked on top of each other�
5�M�54���
Experimental Methods – Zeolite Coatings
5���%����&�#$�#����������""&��'���������"����" ��/�������012��3454� 34�
��"&����
��� ����"�����
*�����
-� ��"�+���
6�&����+"��
E:94K6G�
��%�� ��&�
�����&��������&�
��,����
E#�&&�6"� G�
��%�� ��&
�����&��������&�
��,����
E#�&&�6"� G
-������ED4K6G�
����
5�M�
248
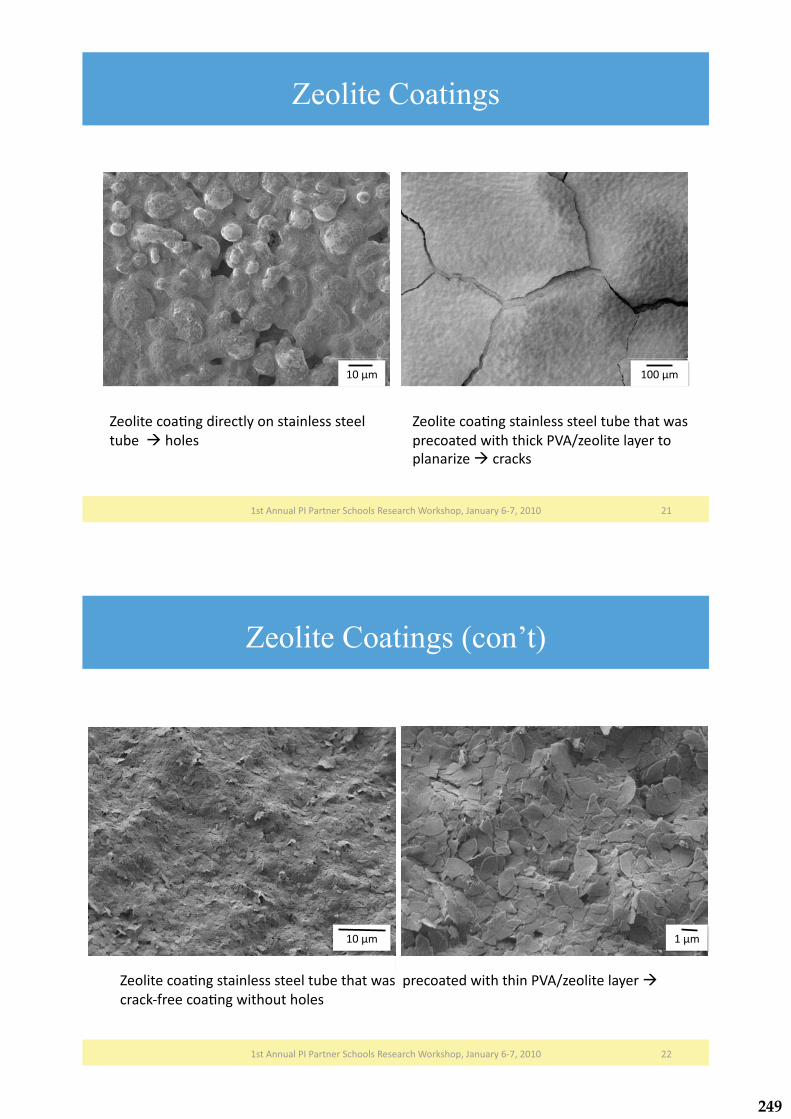
Zeolite Coatings
5���%����&�#$�#����������""&��'���������"����" ��/�������012��3454� 35�
��"&�����"�+���(�����&��"�������&��������&�
��,������"&���
��"&�����"�+��������&��������&���,�������*����
���"���(�*����������#!%H��"&����&������"�
&�����������������
54�M� 544�M�
Zeolite Coatings (con’t)
5���%����&�#$�#����������""&��'���������"����" ��/�������012��3454� 33�
54�M� 5�M�
��"&�����"�+��������&��������&���,�������*���� ���"���(�*���������#!%H��"&����&�������
�����17�����"�+���*���"����"&���
249

Zeolite Coatings – Separations Results
5���%����&�#$�#����������""&��'���������"����" ��/�������012��3454� 38�
�� /�����)/�./,*�*�+� ����01'�(�
��)2!+� -�� -,� !�,� �,� -,.-�� -,.!�,� -,.�,� !�,.�,�
22 C 9.09E-06 1.37E-05 3.58E-06 4.42E-06 1.50 3.81 3.09 0.81
400 C 2.76E-06 3.71E-06 9.69E-07 1.26E-06 1.34 3.83 2.95 0.77
640 C 1.89E-06 2.68E-06 6.77E-07 8.58E-07 1.42 3.96 3.12 0.79
•� Knudson diffusion due to loose assembly of zeolite nanoparticles�
•� Experiments with CVD to fix these gaps/defects underway�•� Zeolite coatings suitable for catalytic applications �
Project Status and Next Steps
•� Methods for producing �-alumina, carbon and zeolite coatings established
•� More characterization and refinement needed •� Fundamental processing issues identified:
–� Control of liquid quantity and distribution (foams) –� Prevention of cracks, removal of defects (zeolites)
•� Next steps: –� Processing studies, implementation of “dip and spin” –� Surface functionalization of carbon coatings –� Catalytic performance studies –� Improving microstructure of zeolite layer
5���%����&�#$�#����������""&��'���������"����" ��/�������012��3454� 39�
250

Dip Coating of Foams
•� Methods to remove excess liquid –� Gravity –� Air knife –� Centrifuge
•� New method for better control –� Spin coater with custom made
sample holder
•� Planned experiment
5���%����&�#$�#����������""&��'���������"����" ��/�������012��3454� 3:�
�%'Q.'��%�#�.��
���#��)�::�?�::�?�34��
�#..-��.���6)��')��.-�
����#��)�54�444�� �
�"�(���&&��((�(�7"��*����������������
(��������(��C����"�+���
“Dip and Spin”
5���%����&�#$�#����������""&��'���������"����" ��/�������012��3454� 30�
!�(�"�
251

Conclusions and Summary
•� Coatings for catalysis and separations prepared using dip coating and thermal treatments
•� “Dip and spin” has promise for controlling deposition on complex 3D foams
•� Research directions include process improvements and characterization of performance
5���%����&�#$�#����������""&��'���������"����" ��/�������012��3454� 32�
252

����������� ������������������������������������������������������� !�"�������� ����������#����� �$������%������
����&���'���
()�(��!��� ()�*"�� ��
������������� ��� ������������ ����� �����
����(�!����$�)� +!$!��� �$���������� �,�
���$����-./��0121
Atomic-Resolution QuantitativeElectron Microscopy
0Drawing is from http://www.mih.unibas.ch/Booklet/Booklet96/Chapter4/Chapter4.html.
���
�����
�����
GaN [0001]
Scanning Transmission Electron Microscope (STEM)
Se L
C K-edge
O K
Cu L
P KS K Cd Lá & Lâ
Cu Ká
Cu Kâ
Zn K
Se L
C K-edge
O K
Cu L
P KS K Cd Lá & Lâ
Cu Ká
Cu Kâ
Zn K
From SilcoxGroup
���
� ��!"��
#�
$%���
$%���
From SilcoxGroup
� ��
&���'( �)���� �*+���
+�,*+���
253
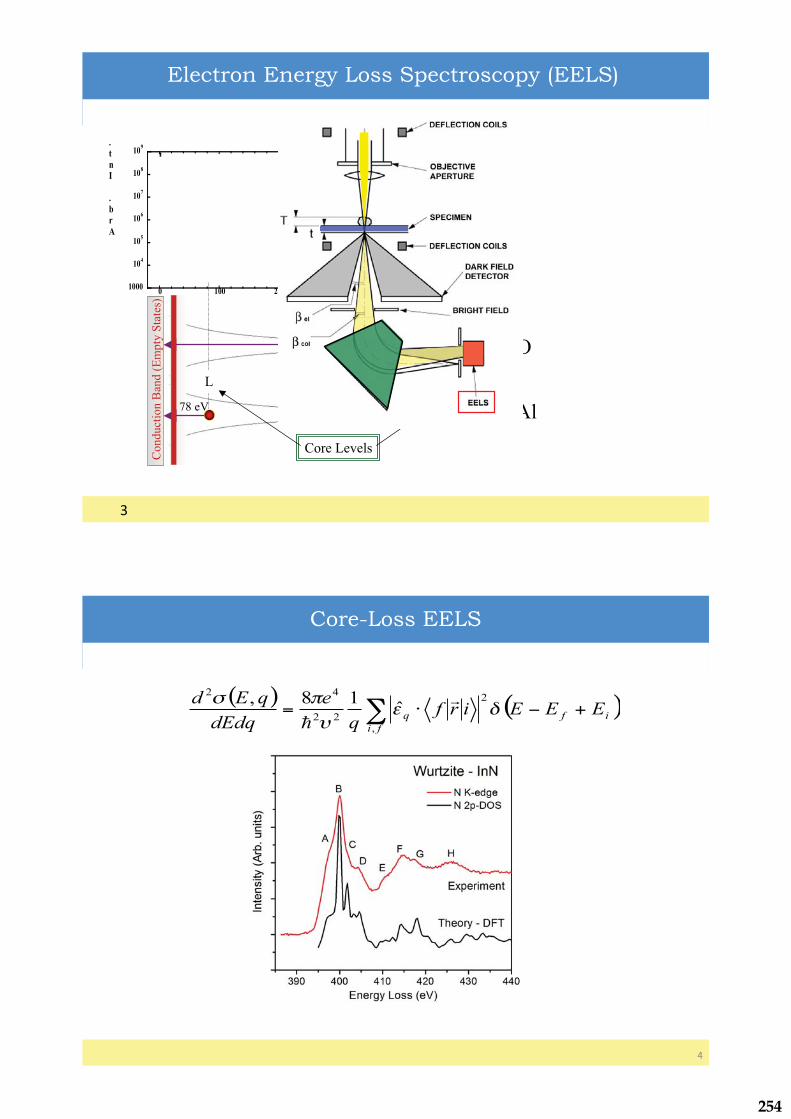
3
1000
104
105
106
107
108
109
0 100 200 300 400 500 600
Arb. Int.
Energy Loss (eV)
�043�*"��!�$
O K-edge
Plasmon Loss
Al L2,3-edge
78 eV
Con
duct
ion
Ban
d (E
mpt
y St
ates
)
O
Al
KL
Core Levels
532 eV
Electron Energy Loss Spectroscopy (EELS)
�043
5
( ) ( )∑ +−⋅=fi
ifq EEEirfq
edEdq
qEd,
2
22
42
ˆ18,δε
υ
πσ r
h
• Element Specific
• Dipole Selection Rules
• Site Specific
• Chemical Shift
• Local
• Compositional Analysis
Defined by Probe Size
Effect of Environment
O K-edge
Core-Loss EELS
Al L2,3-edge
D. Bouchet and C. Colliex,Ultranicroscopy (2003).
254
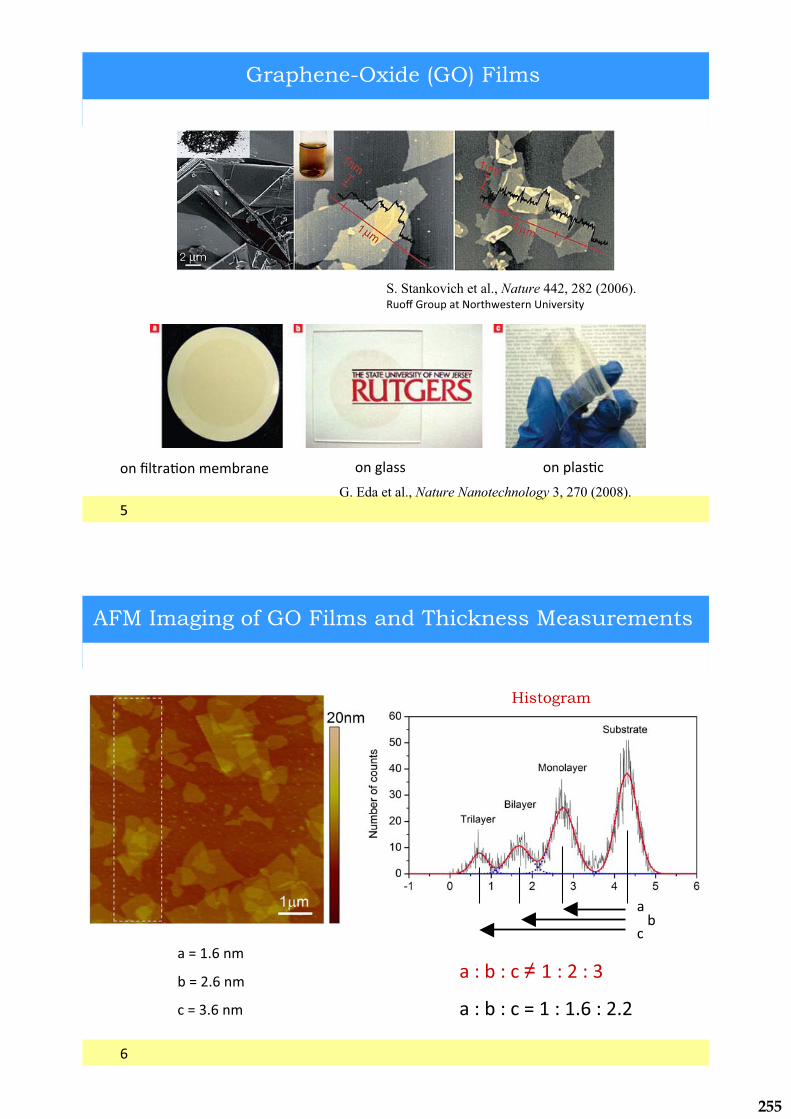
6
���"�� +����'�� ���7�!��+���������
G. Eda et al., Nature Nanotechnology 3, 270 (2008).
S. Stankovich et al., Nature 442, 282 (2006).8$������$"��!����!�&� !�������9�� �!�
Graphene-Oxide (GO) Films
-
AFM Imaging of GO Films and Thickness Measurements
��������≠ 2��0��3
��������:�2��2�-��0�0
�
��
��:�2�-��
��:�0�-��
��:�3�-��
Histogram
255

/
Quantitative ADF-STEM Imaging of GO Films with SingleElectron Counting
;���
���������
<��������������
=�*!���'����!�� !�9����+��
>
��������≠ 2��0��3
��������:�2��2�6��0�1
;���
Quantitative ADF-STEM Imaging of GO Films with SingleElectron Counting
Histogram
256
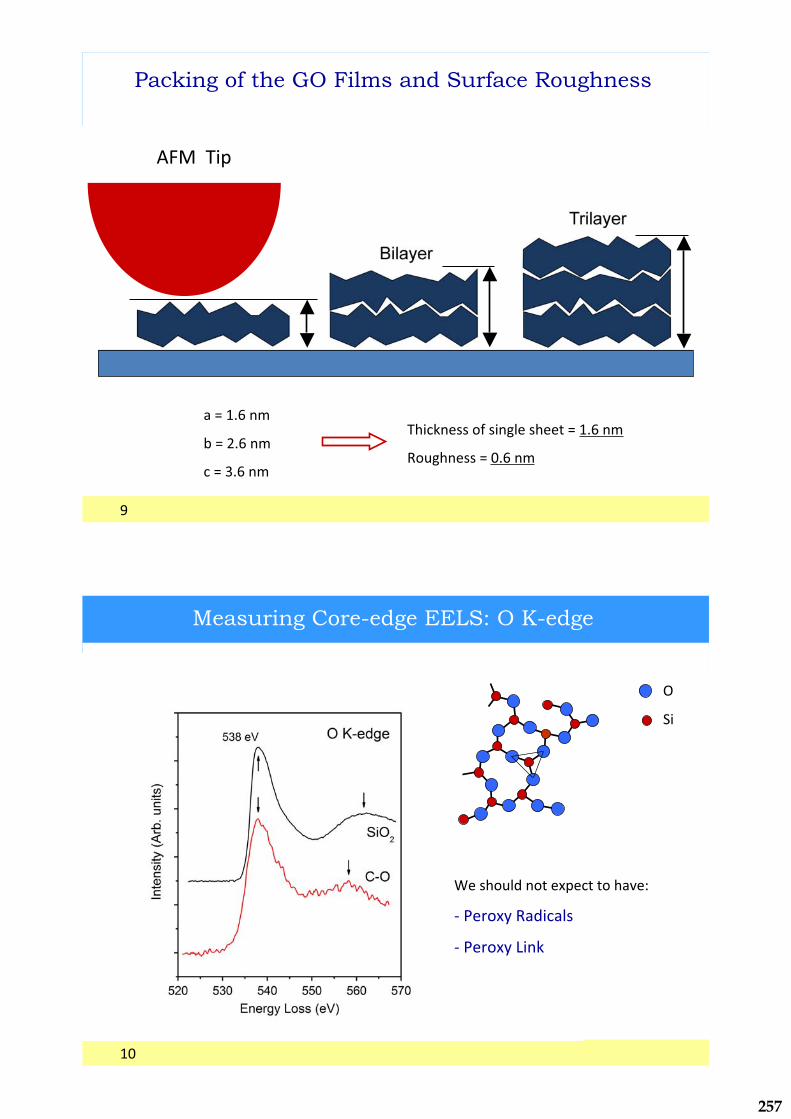
?
@�����"
Packing of the GO Films and Surface Roughness
��:�2�-��
��:�0�-��
��:�3�-��
������� ��A� ��'��� ���!�:�2�-��
8�$'��� �:�1�-��
21
Measuring Core-edge EELS: O K-edge
��� ��$�����!��B"��!�!����9�
.�(���B��8������
.�(���B��#���
4
*�
257

22
Measuring Core-edge EELS: C K-edge
sp2
sp2+sp3
20
Determination of sp2 and sp3 Fractions in GO
.�*"��!�$�A������"��!�
.�*"��!�$�A����.�
������ !�7!����$� ��!
α2�:�1�26���C���α0�:�1�>6
Linear least-square curve fitting
Fraction of sp3 is ~ 40%
258
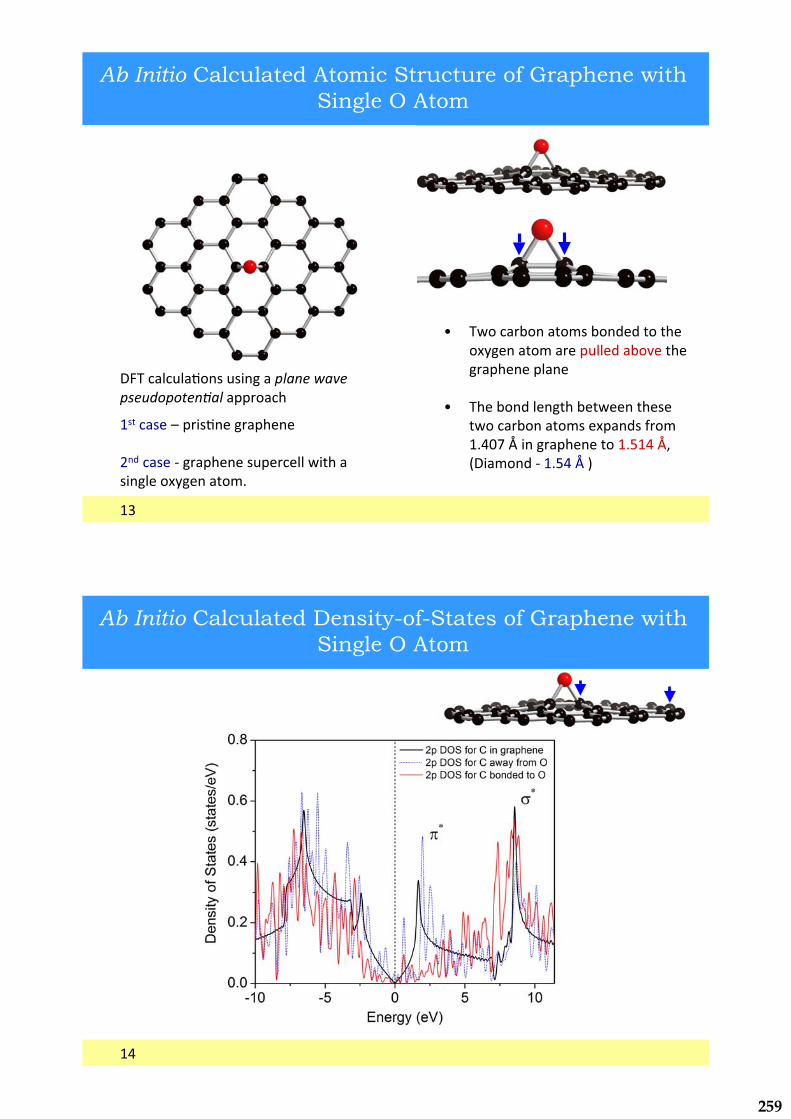
23
Ab Initio Calculated Atomic Structure of Graphene withSingle O Atom
�@������$��+�� �$ ��'���������������� � ��������""�����
2 !��� ��D�"�� +���'��"����
0����� ��.�'��"����� $"�������&�!��������� ��'����B�'����!��
= �&����������!� ��������!��!���B�'����!������"$��������9��!��'��"�����"����
= ������������'!����!&����!�� �!&����������!� ��B"��� �A��2�51/�E����'��"�����!��2�625�E�F�������.�2�65�E�G
25
Ab Initio Calculated Density-of-States of Graphene withSingle O Atom
259

26
Aqueous Only Route to Graphene from Graphite Oxide
2-
Si Nanoparticles and Mechanical Properties
��������
2�?20�E
2�?5/�E
23�E�*�40
23�E�*�40
F222G25�������
260

2/
Acknowledgements
Silcox Group Members (Cornell)
���������
(��A�������*����B
��B����!����
Chhowalla Group Members (Rutgers)
(��A������ ������&����
��������������%�9�
�����,��
����*!�9��������
Theory Group (Cornell)
����������*!�&��!
261

Materials Development and Characterization for Upstream
Processes
262
CSM: David Olson & Brajendra Mishra
PI Partners PI Sponsors
1st Annual PI Partner Schools Research Workshop
The Petroleum Institute, Abu Dhabi, U.A.E.
January 6-7, 2010
Development of HIGH INTERSTITIAL STAINLESS TEELS for Use in DOWNHOLE DRILLING APPLICATIONS
Presentation Outline
• Background• Objectives• Experimental Setup• Results and Discussions• Project Status• Conclusions and Summary
21st Annual PI Partner Schools Research Workshop, January 6-7, 2010
263

Background
High Nitrogen Steels (HNS)• C+N ������������
– Advantages• �� �������������� �� �����
– strength AND toughness– Longer time to fatigue failure
• ���������� ���������������– �� �����������������������– �� ����������������
– � ������• !���"� ������������������� �� ���# ����$$�#��• %���� ���# ���������������&�������� �����• ��$$�#���������'��������
31st Annual PI Partner Schools Research Workshop, January 6-7, 2010
*����� and ,������-� , 1993
/��0"2�4/���5�6� 27�76'�27806"26�42:��06'�406"26�4-�<6'��
Project ObjectivesHigh Nitrogen Steels (HNS)• C+N ������������
– Advantages• �� �������������� �� �����
– strength AND toughness– Longer time to fatigue failure
• ���������� ���������������– �� �����������������������– �� ����������������
– � ������• !���"� ������������������� �� ���# ����$$�#��• %���� ���# ���������������&�������� �����• ��$$�#���������'��������
41st Annual PI Partner Schools Research Workshop, January 6-7, 2010
=��� >�?���
264

Experimental Setup
Over 20 Heats Conducted (2007-2009)• ALLOYING
– @ �����������– B# �������������– Ladle additions– In-mold additions
• SPARGING– N? 0���4���E����������������
• CASTING– Sand mold– �� ����$����
• RIMMING– "�0��F#��4���� – �������������$�� �������– � ����������� ���# ��"����� ������
Pitting corrosion testPRE (N+C)PRE= Cr + 3.3%Mo +37(%N+%C) +4.5(%Mo)(%N+%C)-0.6%Mn
51st Annual PI Partner Schools Research Workshop, January 6-7, 2010
Results and Discussions
1st Annual PI Partner Schools Research Workshop, January 6-7, 2010 6
Sample B
Sample C
Sample E
?<�<�
%��
131 ���
(UTS)
:G�<�
%��
?7J����
(UTS)
?8�G�
%��
J7:����
(UTS)
���� �����K�������#�������������������������07�?�������NaCl
solution)
Initial Weight (g)
End Weight (g)
Weight Loss (mg)
Weight Loss 064
Corrosion �����
(mg/mm?/d��4
Penetratio����������������
0Q��� ���� 4
Penetrati�����������������0������ �
��� 4
Final Rank
*�����@ G��J<9 G��J ?�: ���7 �����RG� :8�7J8 J�G< 6
*�����= :��:J9 :��: ��� ���J �����?�G R�R8? ��7R 3
*������ 8�<�R< 8�<J ��7 ���� �����?�: R�G�J ��7R 2
*������� :�:<78 :�:< ��G ���? �����<J? ?R�7G7 J�J< 5
*������� 7��8G� 7��G ��? ���J �����J7R <�<<J ��?< 1
%����"�'� ������� J:��<� J:��� J7�G ��J� ����8�?� 7�<�<G7 J:��: 13
%����/�V��X�"� J?�7J: J?�7� J��G ���R �����:�< ?J�<7G ��G� 4
NPD-"����?����Y#���� J�RG: J�RG ��8 ��?R ����:7�: ?�<�:J7 G�J7 10
*#� �J7� ��GJJ ��GJ :�< ���G ����J:J< <8�J7: ?�<: 7
J8-:�/% :�G: :�G? J8�< ��7< ����87�? 7:G�:R� J7�8? 12
7R80?�� -J�"�4 ���G< ���< 7��J ���R ���J�?G8 :G8�<7: JR�?� 15
�#��&�?�� �0?��84 :�R: :�R7 ��G ��J? ����???8 J����G? :�J< 9
�#��&�7?� �07?�84 R�<<� R�<< R�7 ��J� ����:�GJ ?J8�J<� G��� 11
�*R��X�" <�G<: <�G: ?7�8 ��7� ����J:RG 8J��J: ?�G� 8
Sample E is the best than any of the commercial downhole materials studied
265

Project Status• To Continue Casting Production
– Z����-�����������������– ���������������$ �[ ������$��������@��������
• To Continue Corrosion Resistance Assessment– ���� �����������������K��� ��# ���0\�?���oC) – Aggressive Environments
• CO? ����0� ��������4• Sour (H?*� �����4
• To perform Mechanical Performance Evaluation– Tensile Strength– �����K�#������
• To perform Wear Rate Evaluation
1st Annual PI Partner Schools Research Workshop, January 6-7, 2010 7
Conclusions and Summary*���������*�����@�����$� �� ��������� �����������������$����
���������������– ���#��������'��� ���
• '� ������"�• @� ������������������$ �%����/ ���# ��/ ����• '��������/ �� ����������#��B� ����
– Z#������������ ����������������
– � ��������#��• �� ��������������������� ���������� ��������• @�����������$ ���� � ��������>��� �����>���#������
1st Annual PI Partner Schools Research Workshop, January 6-7, 2010 8
266
CSM: Arshad Bajvani GavanlueiBrajendra Mishra & David L. Olson
PI Partners PI Sponsors
1st Annual PI Partner Schools Research Workshop
The Petroleum Institute, Abu Dhabi, U.A.E.
January 6-7, 2010
SCC Susceptibility of High Strength Low Alloy Steels in CO2-Containing Corrosive Oil and Gas Wells
Environments
Presentation Outline
• Background• Objectives• Experimental Setup• Results and Discussions• Project Status• Conclusions and Summary
21st Annual PI Partner Schools Research Workshop, January 6-7, 2010
267

Background
• Bare steel corrosion rate, R is:
• With a quick calculation of corrosion rateAt T= 65 �C, and PCO2 =10 atm, R=25mm/yr, At T=82 �C, andPCO2 =160 atm, R=250mm/yr
31st Annual PI Partner Schools Research Workshop, January 6-7, 2010
[C. Dewaard and D.E. Milliams 1975]
In practice, buildup of corrosion product scale on the surface take place, and
Passivating effect of scales decreases corrosion rate, R, significantly
Fe2++ CO22- ������3 (s)
Fe-CO2-H2O
Project Objectives
Establish an analytical expression for CO2 –SCC Corrosion Prediction of Downhole Materials
– Determine the SCC susceptibility behavior based on our matrix of experiments determine the activation energy of the environmental enhanced fracture mechanism
– Perform weight loss experiments inside the autoclave to obtain corrosion rate at higher temperature and pressure (determine the find the corrosion rate and nature of the corrosion products)
– Perform electrochemical study of these material (to achieve insight of the atomic processes at corroding interface)
– To analyze these interdisciplinary results to offer a better insight into the selection of the downhole materials
41st Annual PI Partner Schools Research Workshop, January 6-7, 2010
268
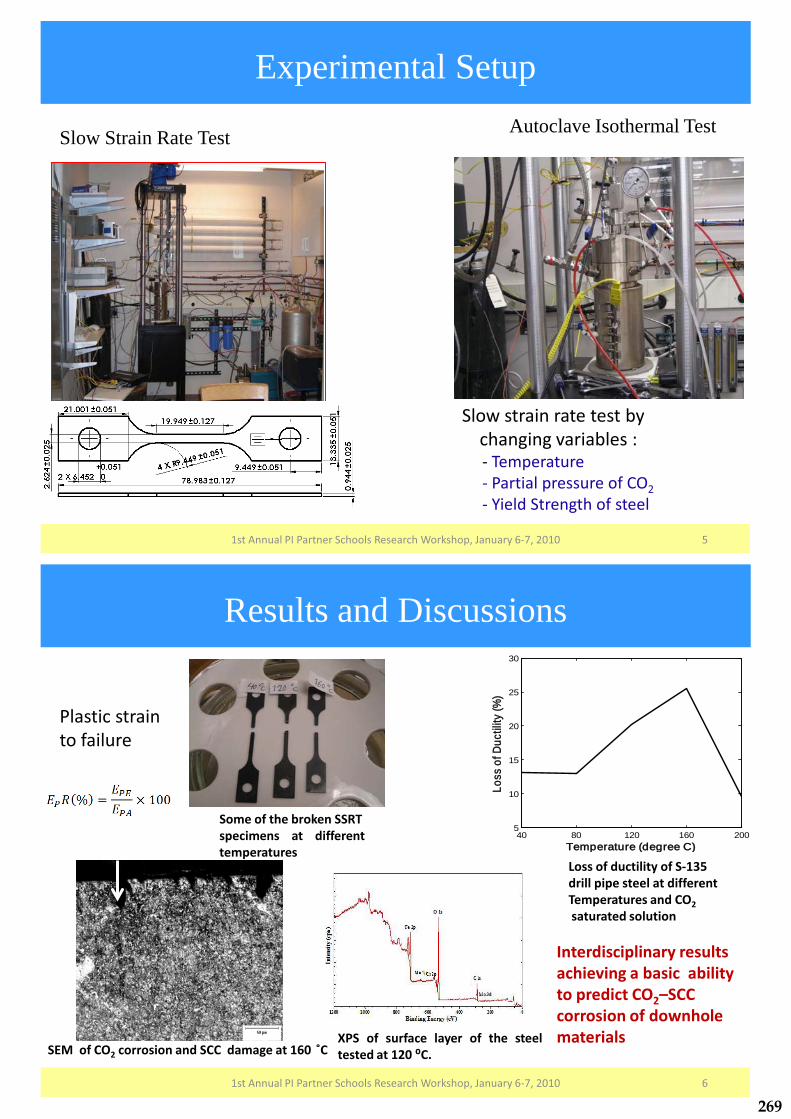
Experimental Setup
51st Annual PI Partner Schools Research Workshop, January 6-7, 2010
Autoclave Isothermal TestSlow Strain Rate Test
Slow strain rate test bychanging variables :- Temperature- Partial pressure of CO2- Yield Strength of steel
Results and Discussions
1st Annual PI Partner Schools Research Workshop, January 6-7, 2010 6
Some of the broken SSRTspecimens at differenttemperatures
Plastic strain to failure
40 80 120 160 2005
10
15
20
25
30
Temperature (degree C)
Loss
of D
uctil
ity (%
)
Loss of ductility of S-135drill pipe steel at differentTemperatures and CO2
saturated solution
SEM of CO2 corrosion and SCC damage at 160 ��XPS of surface layer of the steeltested at 120 �C.
Interdisciplinary results achieving a basic ability to predict CO2–SCC corrosion of downhole materials
269

Project Status
• Continuing the SCC susceptibility measurements based on our matrix of experiments (attempts to obtain activation energy of fracture)
• Weight loss experiments inside the autoclave to obtain corrosion rate at higher temperature and pressure (attempts to find the corrosion rate and nature of the corrosion products)
• Electrochemical study including impedance measurements of these material
1st Annual PI Partner Schools Research Workshop, January 6-7, 2010 7
Conclusions and Summary
• Interdisciplinary results achieving a basic ability to predict CO2–SCC corrosion of downhole materials are being obtained
• Experimental and analytical practice to achieve a quantitative understanding rate controlling mechanism of CO2 – SCC.
• Results will achieve a rate expression which will allow comparison and selection of downhole materials.
1st Annual PI Partner Schools Research Workshop, January 6-7, 2010 8
270

CSM: David L. Olson, Brajendra Mishra, John R. Spear, Shaily Bhola, Luke Jain, Chase Williamson
PI Partners PI Sponsors
1st Annual PI Partner Schools Research Workshop
The Petroleum Institute, Abu Dhabi, U.A.E.
January 6-7, 2010
Investigation of Microbiologically Influenced Corrosion (MIC) in Ethanol Fuel Environments
Presentation Outline
• Background• Objectives• Experimental Setup• Results and Discussions• Project Status• Conclusions and Summary
21st Annual PI Partner Schools Research Workshop, January 6-7, 2010
271

Background
31st Annual PI Partner Schools Research Workshop, January 6-7, 2010
Corroded pipe from an ethanol contact water system
Light micrograph of ethanol contact water tank bottoms indicating the presence of microbes
E10 fuel
Separated water
The highly corrodedportion of the couponwith visible slime was in theaqueous Layer that formsunder the organic(gasoline) layer. The lesscorroded portion of the
Coupon remained in the
gasoline layer.
ASTM A36 steel coupon after exposure to a mixture of 1 pct water and 99 pct E10 fuel
Source ofmicrobes
Project Objectives
• Determine whether microorganisms can exist in ethanol and ethanol gasoline mixtures
• Determine the type of microbes • Determining the electrochemical nature to
ethanol water corrosion of linepipe steel • Determine whether microbiological corrosion
can assist ethanol cracking of linepipe steel• Determine mitigation methods for
microbiologically enhanced corrosion and cracking of linepipe steel
41st Annual PI Partner Schools Research Workshop, January 6-7, 2010
272

Experimental Setup
• DNAFuel grade
ethanol filter
51st Annual PI Partner Schools Research Workshop, January 6-7, 2010
Four point bend fatigue testing arrangement for assessing susceptibility of ethanol cracking
3-electrode system usedA36 steel U-bend specimen-W.E.Ag/AgCl/EtOH/LiCl Electrode-R.E. (Potential: 0.097 V w.r.t. SHE)Platinum wire- C.E.
Bacillus Spore-formers, Mn Oxidation
Actinobacteria Common in soils, various metabolisms
Gammaproteobacteria Ethanol metabolism, iron reduction
Test frame infuel tank
Results and Discussions
1st Annual PI Partner Schools Research Workshop, January 6-7, 2010 6
Steel coupon in water-
gasoline environment
Solution Survival?E10 YesE50 YesE85 YesE100 Yes70% Ethanol Yes50% Ethanol Yes10% Ethanol Yes
Microbes cultivated after exposure
to a range of ethanol fuel blends
~20 nm layer
of iron on a glass microscope slide
Avrami equations
for kinetics
Mechanical testing for ethanolcracking during cyclic loading
273

Project Status• Continue the microbiological experiments to
characterize the role of microbes on ethanol corrosion and cracking of the linepipe steels.
• Apply advanced analytical tools (DNA, potentiostatic, impedance, microscopic analysis) to offer deeper insight to the nature of microbes in alcohol associated with linepipe steel.
• Perform low frequency fatigue loading on four point bend linepipe steel specimens to assess the susceptibility of ethanol cracking in ethanol-gasoline fuels
1st Annual PI Partner Schools Research Workshop, January 6-7, 2010 7
Conclusions and Summary
• Microbes can exist in ethanol-gasoline-water mixtures
• Microbes are spore formers and attack iron • Ethanol related damage is found in the field at the
facilities that process ethanol at the beginning (tanks to pipe) and the end (pipe to truck) of pipeline
• Mechanical system to assess the ethanol cracking susceptibility has been built and will soon initiate testing
1st Annual PI Partner Schools Research Workshop, January 6-7, 2010 8
274
CSM: Tatiana Reyes, Shaily BholaDavid Olson & Brajendra Mishra
Colorado School of Mines
PI Partners PI Sponsors
1st Annual PI Partner Schools Research Workshop
The Petroleum Institute, Abu Dhabi, U.A.E.
January 6-7, 2010
Understanding the Role of Alternating Current on Corrosion of Pipeline Steels under Sacrificial
Anode Cathodic Protection
Presentation Outline
• Background• Objectives• Experimental Setup• Results and Discussions• Project Status• Conclusions and Summary
21st Annual PI Partner Schools Research Workshop, January 6-7, 2010
275
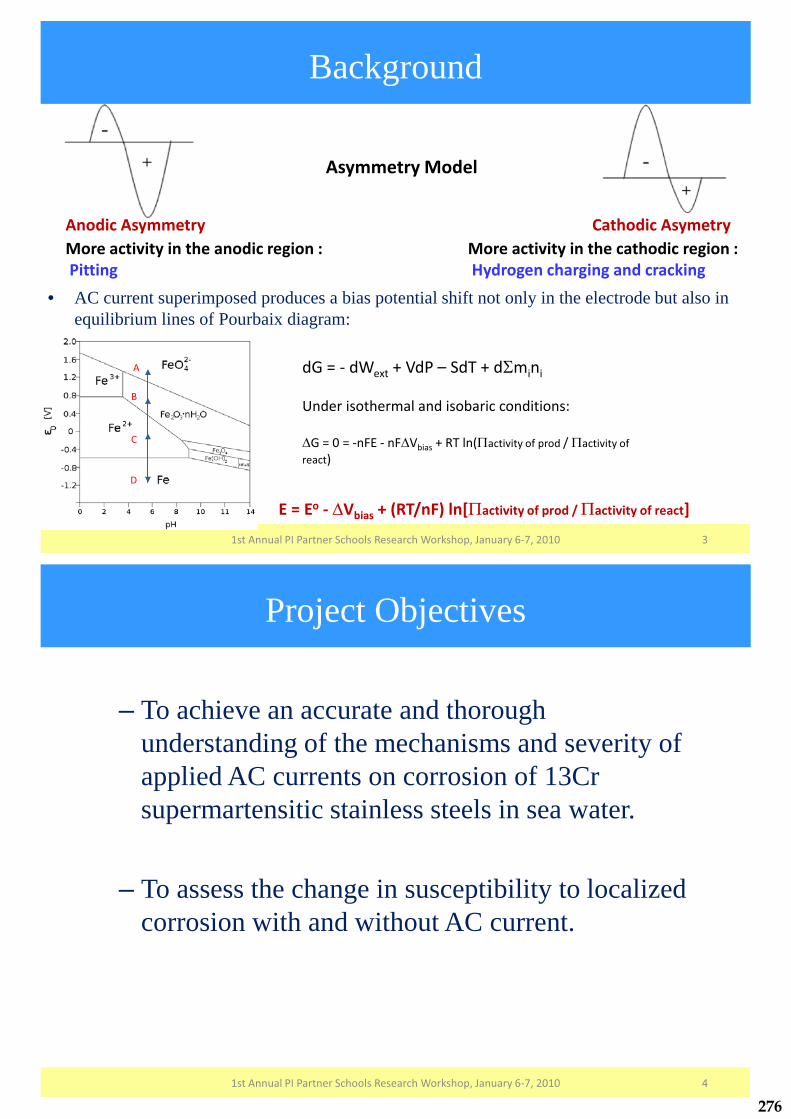
Background
• AC current superimposed produces a bias potential shift not only in the electrode but also in equilibrium lines of Pourbaix diagram:
31st Annual PI Partner Schools Research Workshop, January 6-7, 2010
A
B
C
D
dG = - dWext + VdP – SdT + d�mini
Under isothermal and isobaric conditions:
�G = 0 = -nFE - nF�Vbias + RT ln(�activity of prod / �activity of react)
E = Eo - �Vbias + (RT/nF) ln[�activity of prod / �activity of react]
Asymmetry Model
Anodic Asymmetry Cathodic AsymetryMore activity in the anodic region :Pitting
More activity in the cathodic region :Hydrogen charging and cracking
Project Objectives
– To achieve an accurate and thorough understanding of the mechanisms and severity of applied AC currents on corrosion of 13Cr supermartensitic stainless steels in sea water.
– To assess the change in susceptibility to localized corrosion with and without AC current.
41st Annual PI Partner Schools Research Workshop, January 6-7, 2010
276

Experimental Setup
51st Annual PI Partner Schools Research Workshop, January 6-7, 2010
A
B
C
D
A. AC current in conduction, B. AC current with induction, C. AC current through metal (conduction) and through the water (stray current)D. AC current through water in presence of induction (conduction is optional)
No.
Arrangement
(C = conduction,L = induction &
W = through water)
Induction current density (iL)
(A/m2)
Conduction current density
(iC) (A/m2)
Current density through water
(iW)(A/m2)Pitting
1C, L (done
before)1900 3860 - Pits in 10 days
2 C - 40 - No Pits in 30 days
3 C - 3860 - No Pits in 30 days
4C, L (repeated exactly as 1)
1900 3860 - No Pits in 30 days
5 C, W - 2584 478 Pits in 5 hrs.
6 W, L 222 - 42 Pits in 5hrs.
6 and on
W, LStudy of combined effect and different current
ratiosIn progress
Results and Discussions
1st Annual PI Partner Schools Research Workshop, January 6-7, 2010 6
Rs (ohms) Rp (ohms cm2) Cdl (F cm-2)
Fresh material 0.5248 13,141 3.33x10⁻⁴
After 5 days AC - ic= 240A/m2 ( C ) 0.5426 49,809 2.62x10⁻⁴
After 5 days AC - ic= 240A/m2 ( C + L) 0.6842 37,866 2.77x10⁻⁴
After 1day AC - iw = 42 A/m2 (W + L) 1.161 8137 4.56x10⁻⁴
277
Project Status
1st Annual PI Partner Schools Research Workshop, January 6-7, 2010 7
• Study of asymmetry corrosion is in progress model with – AC/DC circuit – Wave form function generator– SEM: characterization of surface (pitting)– Leco: hydrogen charging
• Asymmetry model will continue be verified to explain the observed behavior of AC corrosion
Conclusions and Summary
• Evidence of asymmetrical current during AC corrosion has been obtained.
• Thorough characterization of AC corrosion will continue.
• Use of waveform generator to alter the AC current will be used to quantify the observed behavior.
• Electrochemical potentiostatic measurements and impedance spectroscopy will be used to assess the atomic processes at the corroding interface.
1st Annual PI Partner Schools Research Workshop, January 6-7, 2010 8
278

Advanced Materials for Industrial Applications
279
������������� ��������������������������������������������
������������������������ ��! ����" � �����
������#���� � � � � �����$�������
������������� ��� ������������ ����� ������
������#���� ����%# #����� �&�������'�'('�
)�� ����*+,��-./.�
���#����������������������!�0 ��%�����1����������2����
Presentation Outline
•� Background •� Objectives •� Results and Discussions •� Conclusions and Summary •� Future Plans
-�/�#���� ���������#������������3��������4������$��)�� ����*+,��-./.�
280
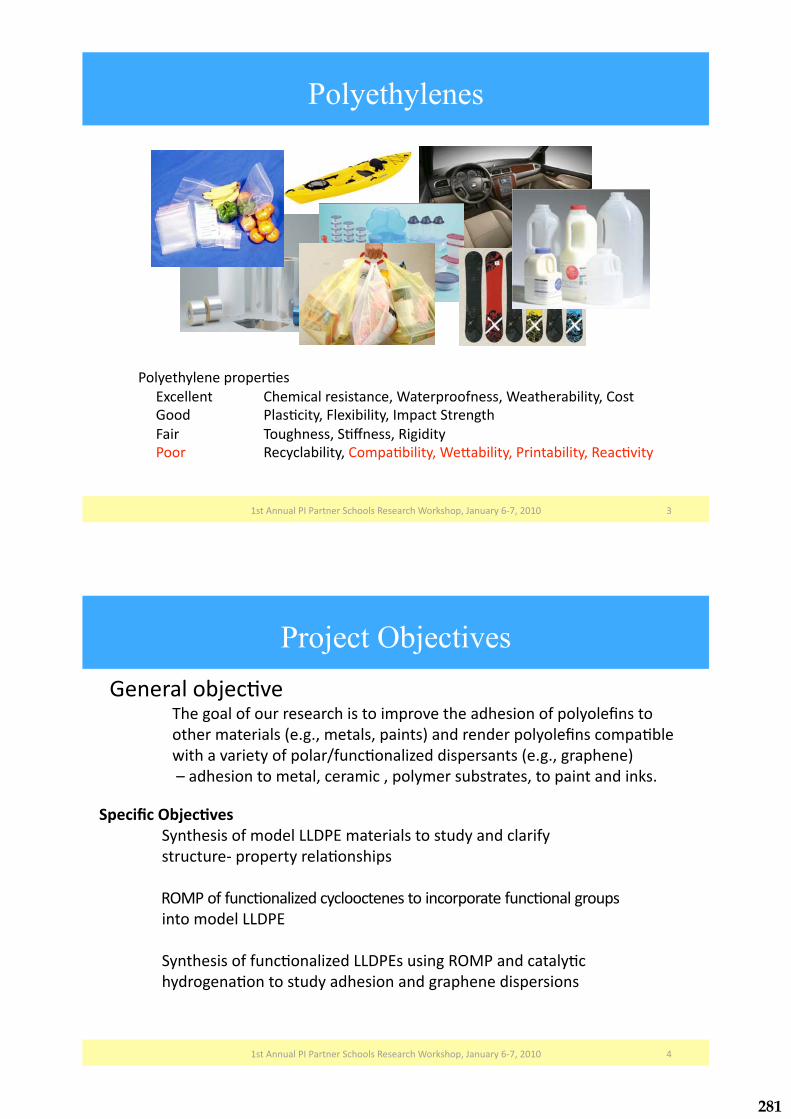
Polyethylenes
5�/�#���� ���������#������������3��������4������$��)�� ����*+,��-./.�
�����#�������$��$��%����
�����(6������# ��������������#������4�#��$���!������4��#��������#������#�
�����7��� � �����%��#���0��6�����#����$��#��#����#��
�����0��� � ��� ���������%8������3�����#���
��������� � �3����������#�����$�%����#���4�9�����#�������#�����#���3���%:�#��
Project Objectives
;�/�#���� ���������#������������3��������4������$��)�� ����*+,��-./.�
�������������������
���� ����#�������!������<<&�(��#�������#���# ������������!��
��#� �# ��+�$��$��#������%�����$��
�3=����!�! ��%�����1����������#�����#�������$���#��! ��%�������� $��
���#�������<<&�(�
����#�������!�! ��%�����1���<<&�(�� �����3=���������#���%�
����������%���#���# �������������������$��������$��������
7���������>��%:�������������!�� ��������������#���$��:��#�������������!�$������2���#��
��#�����#�������?�'�'���#�����$���#�@������������$������2�����$�%����
�A�#����:����#���!�$����B! ��%�����1������$�����#��?�'�'�����$����@�
��C����������#���#�������������$������� ��#��#����#��$���#���������'�
281

Synthesis of LLDPE
/�#���� ���������#������������3��������4������$��)�� ����*+,��-./.� D�
���������#������
E�
��#���������
F+����#'�
�&�(��$������1�%���
��������$������1�%���
$������1�%��� ���������%���
3�>����7'G�4���������'�H'����������������� ��� ��/I5;C/I;,'��A������)'��'G�4���������'�H'�����������������!������;;/;C;;-5'�
$������1�%��� ���������%���
���������
This Study
/�#���� ���������#������������3��������4������$��)�� ����*+,��-./.� *�
"#$%%&�'�
E E
���#�������!�! ��%�����1����J+<<&�(�:���3=���
E E E
(�������)�*"#$%%&�'�
���#�������!��J+<<&�(�:���3���+=$��������#�#�������������1�%���?3=��@�
A�#�����#������� ����� ����A����#�
� �� �����!� �6����������
A�#�����#������� ����� ����A����#�
� �� �����!�! ��%�������� $��
� �� �����!� �6����������
(K�! ��%�������� $��
282
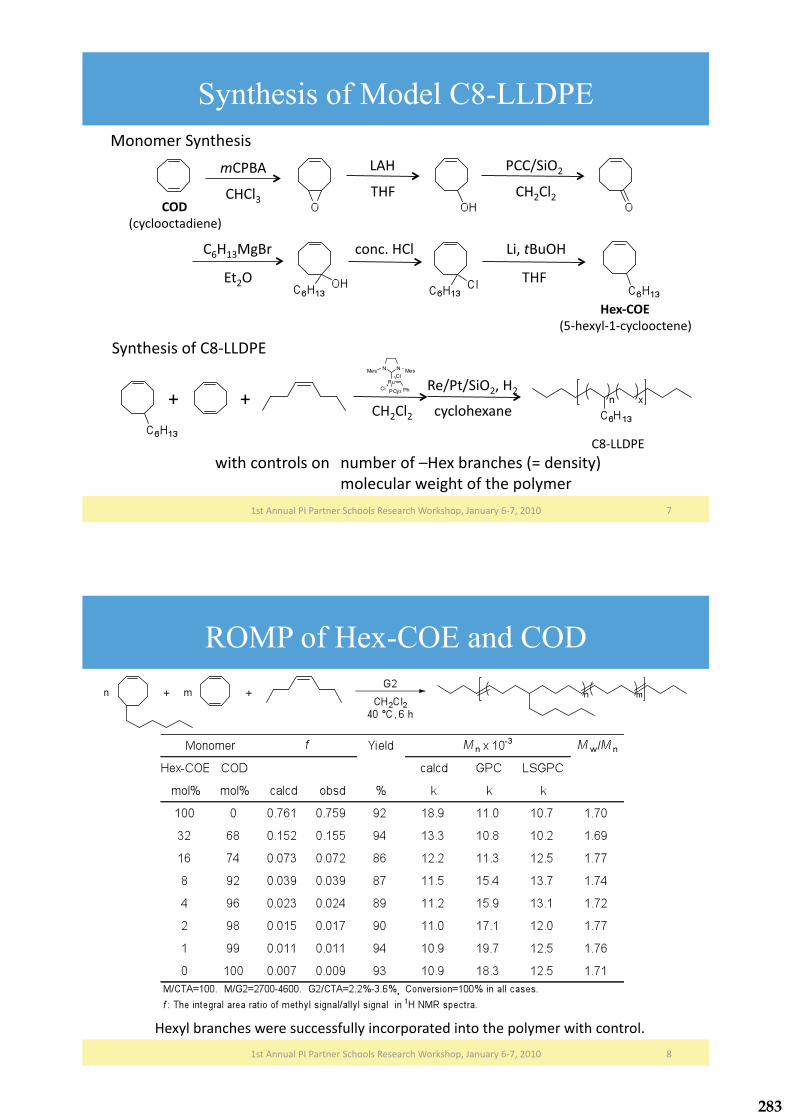
Synthesis of Model C8-LLDPE
/�#���� ���������#������������3��������4������$��)�� ����*+,��-./.� ,�
� ��5�
���H��
� 0�
<� �
� -��-�
���B��=-�
(#-=�
�* /5��H�� ����'� ���
� 0�
<����H = �
����������#������
���#�������!��J+<<&�(�
E E � -��-� �������6����
3�B�#B��=-�� -�
�J+<<&�(�
+�,$"�'�
?D+��6��+/+�������#���@�
"�&�
?�������#������@�
A�#�����#������� �� �����!�C �6����������?K������#�@�
� ����� ����A����#��!�#���$������
ROMP of Hex-COE and COD
/�#���� ���������#������������3��������4������$��)�� ����*+,��-./.� J�
�6������������A����� �����! ���������$���#�����#��#���$������A�#�����#���'�
283

13C NMR Spectrum of C8-LLDPE
/�#���� ���������#������������3��������4������$��)�� ����*+,��-./.� I�
/;�/5�
/.�
D�
/-� //�
;�*�
I��+5�
�+J� �+5�
,�
�+J�
/��-�
/;�/5�5��,�
/.�D�
;���
*��
I�
/-� //�
/�
-���
J�
����? �6+�=(@�
�J+<<&�(�
�J+<<&�(�A�����#������:���3=����!� �6+�=(��!����A���������������%��'�
Physical Properties of C8-LLDPE
/�#���� ���������#������������3��������4������$��)�� ����*+,��-./.� /.�
�������$��$��%������������#��A����# ������������������#������#��#��!� �6+�=('�
284

Physical Properties of Model C8-LLDPE
/�#���� ���������#������������3��������4������$��)�� ����*+,��-./.� //�
���%���#�$���# ������������#������# ������
������������#���!�����������%���!�������'�
�������J+<<&�(�A���� �����! �������#����1����
���3=����!� �6+�=(������=(��!����A�������
���������%����!�$��������������'��
&���$��2�����!��J+<<&�(� &���$��2�����!��J+<<&�(�
/.�º�B���
-100 100 150 -50 0 50
°C
Synthesis of Functionalized C8-LLDPE
/�#���� ���������#������������3��������4������$��)�� ����*+,��-./.� /-�
�J+<<&�(+(��
3=���
���������%���
A�#�����#������� �� �����!�! ��%�������� $��
� �� �����!���6������������
� ����� ����A����#��!�#���$������
E E E
���#�������!�! ��%�����1����J+<<&�(� �����3=����$������1�%���
0 ��%�������� $��?(@�
������ �����6�����
�����
$������
�����
����������
�����
#��%����
�����
285
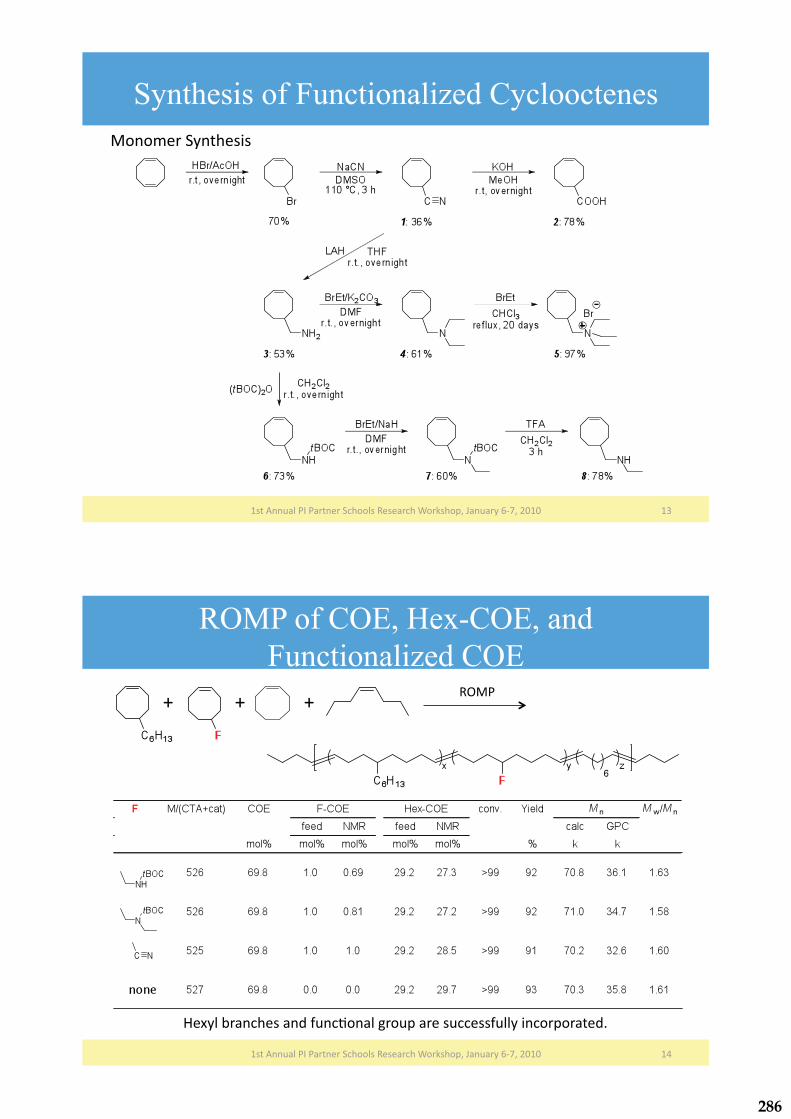
Synthesis of Functionalized Cyclooctenes
/�#���� ���������#������������3��������4������$��)�� ����*+,��-./.� /5�
����������#������
ROMP of COE, Hex-COE, and Functionalized COE
/�#���� ���������#������������3��������4������$��)�� ����*+,��-./.� /;�
3=���E E E
�6����������������! ��%�������� $������ �����! ���������$���#��'�
286

Hydrogenation of Polymer Backbone
/�#���� ���������#������������3��������4������$��)�� ����*+,��-./.� /D�
�J+<<&�(+(��
3�B�#������� -�
(��
+��+�+�+��-+�
+�+��-+�
+��?3@+���
����������������A������������#���A�#�� #�����$���%����!�! ��%�������� $�'�
�������6����
����*&*��#�J.�º��
����*&*��#�J.�º��
����-&-��;��#�/..�º��
Deprotection of tBOC
/�#���� ���������#������������3��������4������$��)�� ����*+,��-./.� /*�
�0��
��� ��+� -� 5�
���1����
+�+��-+�+�+��-+�
+�+��-+�
��$��#��%���
+��-+� -�
+��+�
�H=��$��#��#������ $��A����� �����! �������:��#������#��$�������������������������'�
����*&*��#�J.�º��
287

Conclusions and Summary
/�#���� ���������#������������3��������4������$��)�� ����*+,��-./.� /,�
"#$%%&�'�
E
A�#�����#������� ����� ����A����#�
� �� �����!�! ��%�������� $��
� �� �����!���6������������
E
���#�������!�! ��%�����1����J+<<&�(�
E E E
(�������)�*"#$%%&�'�
(�K�
���#�������!��J+<<&�(�
A�#�����#������� ����� ����A����#�
� �� �����!� �6����������
Future Plans
/�#���� ���������#������������3��������4������$��)�� ����*+,��-./.� /J�
���#�������!��J+<<&�(+(��
���:��#������������!��J+<<&�(+(B07��
(�K�
E E E
�J.�ºC�
�J+<<&�(+(�
�%������
!����:������#�
�'#�
�%������
!���-���
J.�º�� ���#����������$��#��
������#���1�%����!��J+<<&�(+(B07����������2���
�����������$��$��%����#������$��$��%����07�����$���������#�'�
07�E�&�H�
288
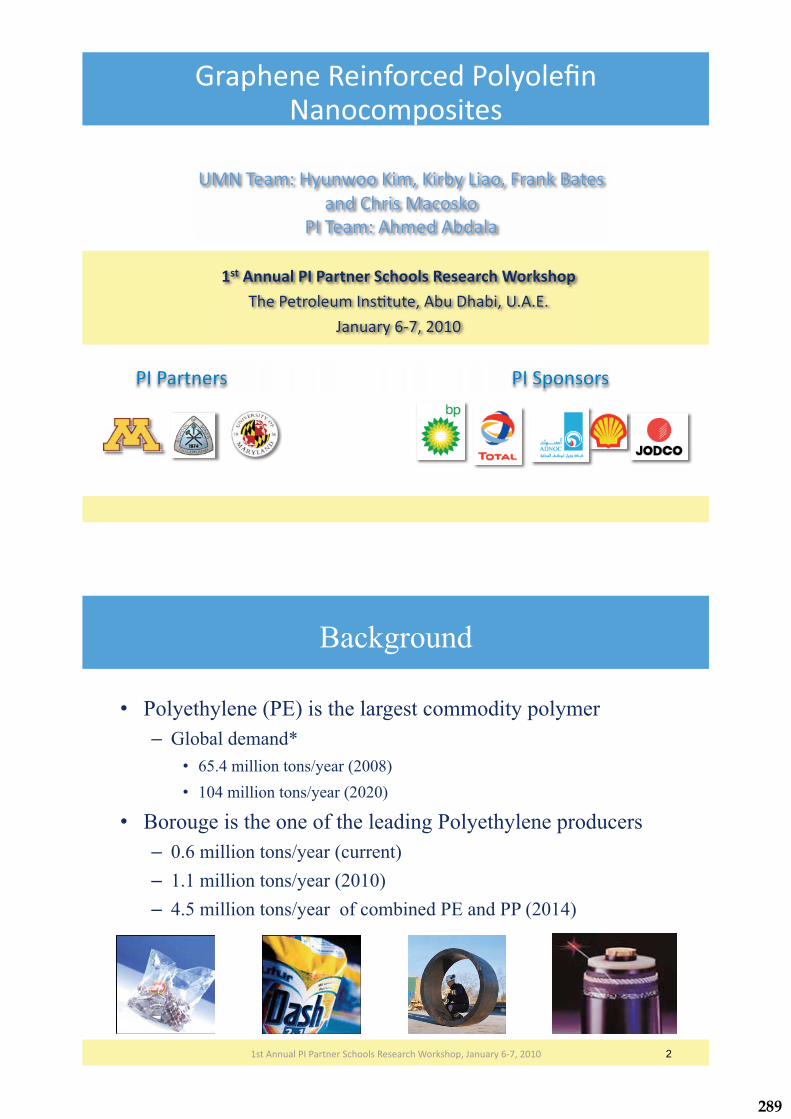
���������� ����������������������������������
������������������
!�����"����"���#��
!� ������� � � � � � !�$%�������
������������� ��� ������������ ����� ������
���� ����#� �!��&� ����"� �'�������("()(�
*�� ����+,-��./0/�
1��%�����2���3������ �#��#�4��������%�������
Background
•� Polyethylene (PE) is the largest commodity polymer
–� Global demand*
•� 65.4 million tons/year (2008)
•� 104 million tons/year (2020)
•� Borouge is the one of the leading Polyethylene producers
–� 0.6 million tons/year (current)
–� 1.1 million tons/year (2010)
–� 4.5 million tons/year of combined PE and PP (2014)
0���"�� �#� !� �������$����#��2��������5������%��*�� ����+,-��./0/� 2
289

Project Objectives and Approach
•� Objective
–�Production of electrically conductive PE with
improved mechanical properties
•� Approach
–�Reinforcing PE with electrically conductive filler
(Functionalized Graphene Sheets) using different
dispersion processes
0���"�� �#� !� �������$����#��2��������5������%��*�� ����+,-��./0/� 6�
Applications of Electrically Conductive PE
•� Semiconductor layers for high-voltage cables
•� Electrostatic dissipation (ESD) material
•� Electromagnetic shielding
•� Automotive parts
0���"�� �#� !� �������$����#��2��������5������%��*�� ����+,-��./0/� 7�
HDPE�Corrugated metal�Semiconductor�Insulator�Conductor�
290

Challenges
•� Dispersing fillers into hydrophobic PE is more
challenging than mixing other (polar) polymers
•� PE is a semicrystalline polymer
–�Crystallinity could be affected by the filler
•� Fillers may act as nucleating agent
•� PE is very chemically resistant and therefore
few solvents are available for solution mixing
0���"�� �#� !� �������$����#��2��������5������%��*�� ����+,-��./0/� 8�
Rewards
0���"�� �#� !� �������$����#��2��������5������%��*�� ����+,-��./0/� +�
•� Mixing of PE with graphene sheets can lead to:
–� Increase the electrical conductivity
–� Increased stiffness
–�Decrease the coefficient of thermal expansion
–�Reduce gas/water permeability
–�Reduce UV degradation
291

Graphene
•� A 2-D honeycomb lattice of carbon
•� The “Mother” of all carbon based
materials
•� The basic building block of carbon
based materials
1����"(��(�������9���#�9���(�$(�:.//-;(���
�����������������:6;�0<6,0=0�
/,'�� ������##��0=<+�
0,'������������� ����0==0�
6,'�1��%������08//�
�����1��%������.//7�
Graphene Properties
Modulus, GPa 103
Strength, MPa 140x103
Electrical
Conductivity, S/cm
104
Thermal Conductivity,
W/m.°K
3000
Graphene Production
•� 2004: Manchester University1
–� Mechanical cleavage of graphene sheets from synthetic graphite
•� 2006: Northwestern University2
–� Solution based exfoliation of graphite oxides treated with organic isocyanate
•� 2006: Princeton University3
–� “Mass” production of functionalized graphene sheets (FGS) based on thermal exfoliation of graphite oxide
•� 2008- 2009: Other methods
–� CVD, spatial growth of SiC, electrolytic, supercritical fluid, liquid phase exfoliation
0���"�� �#� !� �������$����#��2��������5������%��*�� ����+,-��./0/� 8
0(� ��9���#�9���� ���(�� Science, 306, 666–669 (2004)
.(� $�����9������ ���(��Nature, 442, 282–286 (2006) 3.� Schniepp �� ��� ��Chemistry of Materials, 19(18), 4396-4404 (2007)
292
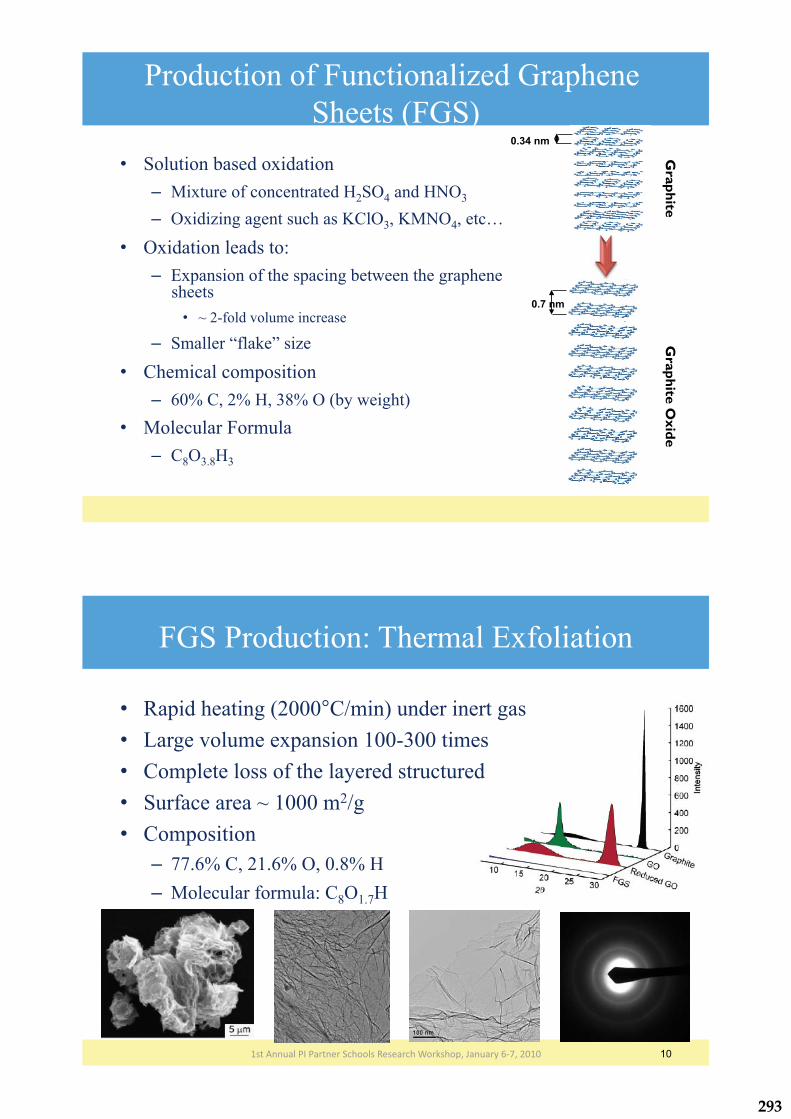
Production of Functionalized Graphene
Sheets (FGS)
•� Solution based oxidation
–� Mixture of concentrated H2SO4 and HNO3
–� Oxidizing agent such as KClO3, KMNO4, etc…
•� Oxidation leads to:
–� Expansion of the spacing between the graphene sheets
•� ~ 2-fold volume increase
–� Smaller “flake” size
•� Chemical composition
–� 60% C, 2% H, 38% O (by weight)
•� Molecular Formula
–� C8O3.8H3
Gra
ph
ite
Gra
ph
ite O
xid
e
0.34 nm
0.7 nm
FGS Production: Thermal Exfoliation
0���"�� �#� !� �������$����#��2��������5������%��*�� ����+,-��./0/� 10
•� Rapid heating (2000°C/min) under inert gas
•� Large volume expansion 100-300 times
•� Complete loss of the layered structured
•� Surface area ~ 1000 m2/g
•� Composition
–� 77.6% C, 21.6% O, 0.8% H
–� Molecular formula: C8O1.7H
293

Composite Properties versus Processing Conditions
for Polyurethane Composite
•� Thermoplastic polyurethane composites
1st Annual PI Partner Schools Research Workshop, January 6-7, 2010 11
Melt Blending
Solvent Blending
In-situ Polymerization
•� Stirring in dimethylformamide
•� Film casting at 50 °C
•� Solution polymerization in DMF
•� Surface functionalization by TPU
•� DACA Micro Compounder
•� 180 °C, 6 min, 360 rpm
Electrical Conductivity sample
FGS:
solvent blend > in-situ polymerization > melt blend
Dispersion of FGS in PEN
•� Poly(ethylene-2,6-naphthalate) (PEN) composites
12 1st Annual PI Partner Schools Research Workshop, January 6-7, 2010
Size distribution from TEM
Average Af of graphite: 21
FGS : 88
~ 100 particles
PEN/graphite
PEN/FGS
294

Experimental Setup: Blending Methods
Melt blending
13 1st Annual PI Partner Schools Research Workshop, January 6-7, 2010
feed
108 mm
screws
recirculation
channel
die
bolts
exit valve
•� DACA Micro Compounder
: 180 °C, 8 min, 200 rpm
Solvent blending •� Toluene (reflux) at 110 °C
or 1,2-dichlorobenzene (DCB) at 70-80 °C
•� Cast films on heated glass plate
Matrix: LLDPE, Dow Affinity EG-8200 (Mw = 201k, Mn = 67k) and EG-8200-MA (PE-f-0.8 wt% MA)
Dispersion of FGS: Melt Blending
1st Annual PI Partner Schools Research Workshop, January 6-7, 2010 14
P.I.
as
dis
per
sed
Vorb
eck
1 wt% FGS EG8200
Melt blend
TEM
295
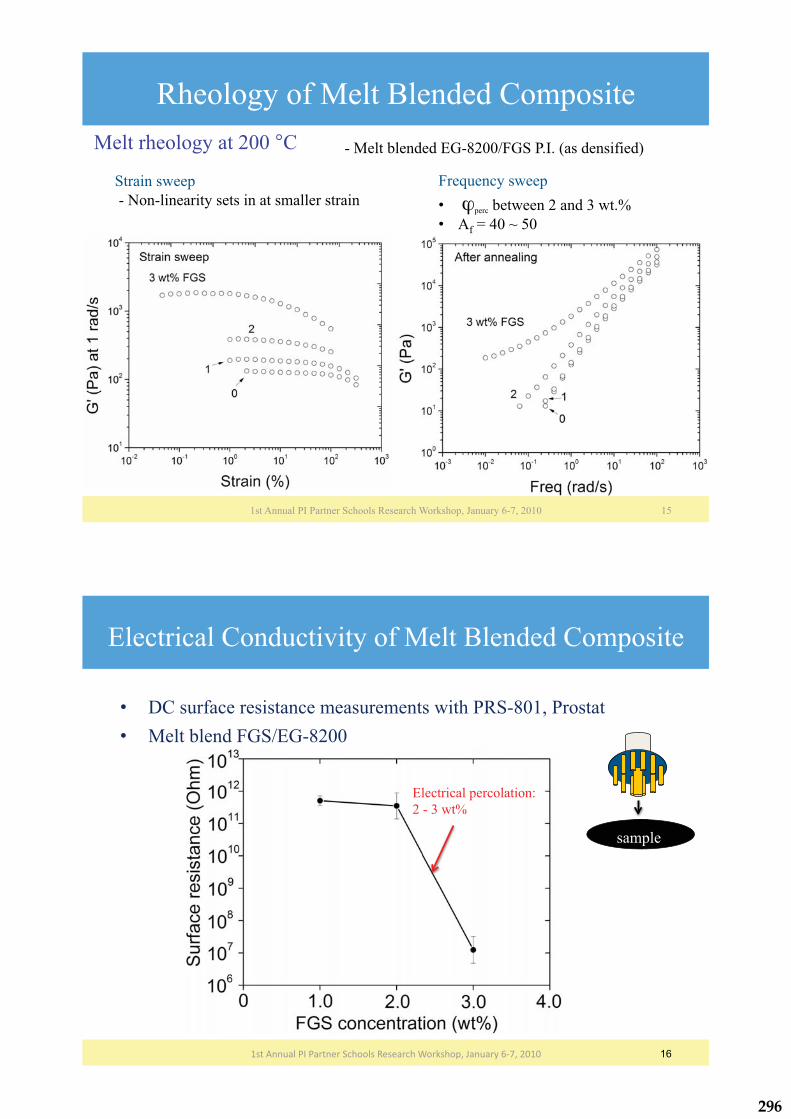
Rheology of Melt Blended Composite
1st Annual PI Partner Schools Research Workshop, January 6-7, 2010 15
- Melt blended EG-8200/FGS P.I. (as densified)
Strain sweep
- Non-linearity sets in at smaller strain
Frequency sweep
•� �perc between 2 and 3 wt.%
•� Af = 40 ~ 50
Melt rheology at 200 °C
Electrical Conductivity of Melt Blended Composite
•� DC surface resistance measurements with PRS-801, Prostat
•� Melt blend FGS/EG-8200
0���"�� �#� !� �������$����#��2��������5������%��*�� ����+,-��./0/� 16
sample
Electrical percolation:
2 - 3 wt%
296

LLDPE-FGS: Mechanical Properties
•� FGS loading
–� 1.0, 1.5, 2.0, 3.0 wt.%
•� Ultimate strength and toughness with Minmat tensile tester
•� Modulus measured using DMA (RSA1)
–� 4 specimens per sample
1st Annual PI Partner Schools Research Workshop, January 6-7, 2010 17
FGS-LDPE: Mechanical Properties
•� With FGS loading
–�Modulus increases
–�Ultimate stress
decreases
–�No significant change
in toughness
� ��� �������������� ��
��� # ���� �� +(7/�
�#&�����
$����>����� ��
00(7�±�0(-�
�� >�������*?6� +/(6�±�-(8�1st Annual PI Partner Schools Research Workshop, January 6-7, 2010 18
297

FGS-LLDPE: Functionalized PE
�� Samples remain non-conductive with 1% FGS
•� LLDPE functionalized with 0.8% maleic anhydride
•� Moderate modulus increase (25%)
•� Increased ultimate strength (31%)
•� 98% Increase in toughness
1st Annual PI Partner Schools Research Workshop, January 6-7, 2010 19
20 1st Annual PI Partner Schools Research Workshop, January 6-7, 2010
�!��� "���� !�����#��$ � �
�' )� 0=(/�
0���@��1$��' )� ./(-�
0���@��1$�,�' ),�"� ./(.�
0���@��1$��' )�
Barrier Properties
298
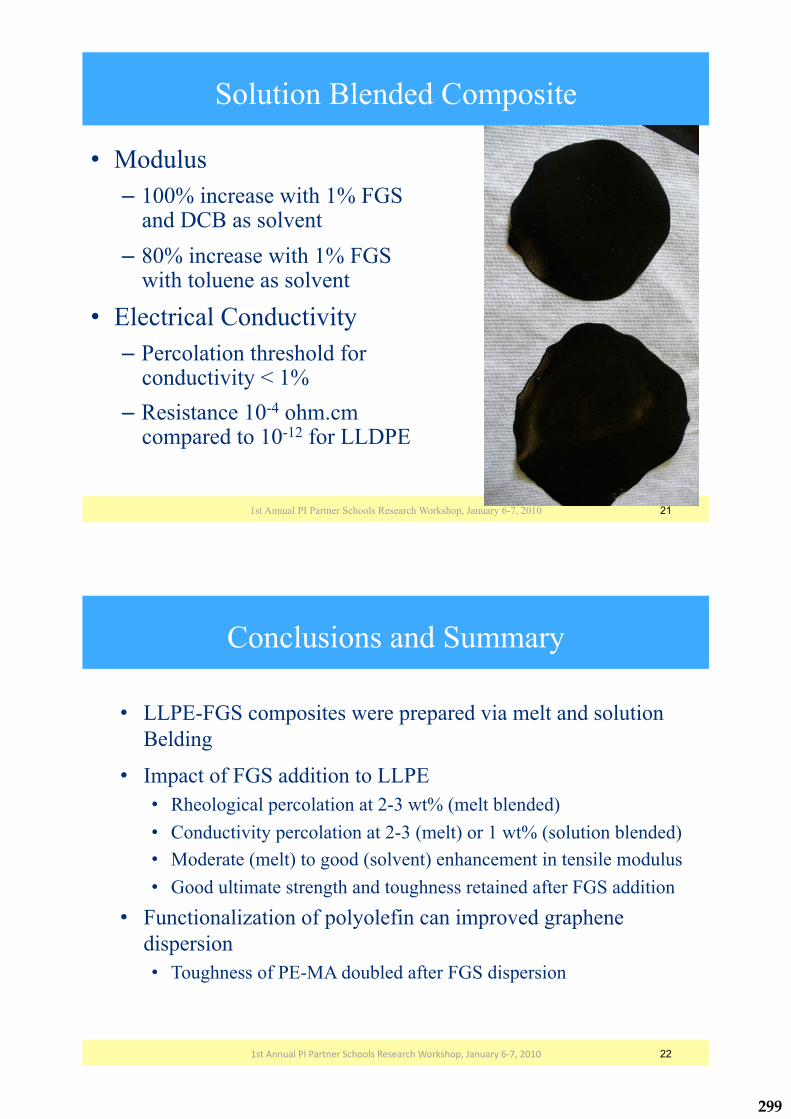
Solution Blended Composite
•� Modulus
–� 100% increase with 1% FGS and DCB as solvent
–� 80% increase with 1% FGS with toluene as solvent
•� Electrical Conductivity
–� Percolation threshold for conductivity < 1%
–�Resistance 10-4 ohm.cm compared to 10-12 for LLDPE
1st Annual PI Partner Schools Research Workshop, January 6-7, 2010 21
Conclusions and Summary
•� LLPE-FGS composites were prepared via melt and solution
Belding
•� Impact of FGS addition to LLPE
•� Rheological percolation at 2-3 wt% (melt blended)
•� Conductivity percolation at 2-3 (melt) or 1 wt% (solution blended)
•� Moderate (melt) to good (solvent) enhancement in tensile modulus
•� Good ultimate strength and toughness retained after FGS addition
•� Functionalization of polyolefin can improved graphene
dispersion
•� Toughness of PE-MA doubled after FGS dispersion
0���"�� �#� !� �������$����#��2��������5������%��*�� ����+,-��./0/� 22
299

Project Status
•� Progress
–� Results presented at the AICHE Annual Meeting, Nov 2009
–� 2 publications underway:
•� Review paper on graphene/polymer nanocomposites
•� Graphene reinforced polyethylene
•� Interaction
–� Weekly conference call
–� Visits:
•� UMN: Macosko (Feb 09), Kim (Jan 10)
•� PI: Abdala (Jul and Nov 09), Adnan (Jul 09)
0���"�� �#� !� �������$����#��2��������5������%��*�� ����+,-��./0/� 23
300
������������ ������������������������ �� ��������� ���������������
���������������� �!��" ������ ��"��� ���� �
#$�����%!���%�������$ � ����� ���&���'��� �(��������
#$�#��� ��� � � � � �#$�&) � ���
������������� ��� ������������ ����� ������
�!��#��� ����$ �*������%���+!������,%,�,�
-� �����./0��1232�
# ������������ ���' ��%�4� ����#� ������ �� ���� ��
Presentation Outline
•� Vision •� Project 1: Ionic liquid membranes •� Project 2: Nanoporous polymeric membranes •� Conclusions and Summary
1�3���% ����#$�#��� ���&�! ���5������!�6 ���! )��-� �����./0��1232�
301

Vision
•� We aim to design, prepare and develop next generation gas and liquid separation membranes through precision macromolecular engineering
•� Main application targets –�Water purification –�Gas separations (emphasis on CO2/CH4) –�Polymer electrolytes for fuel cells
3���% ����#$�#��� ���&�! ���5������!�6 ���! )��-� �����./0��1232� 7�
Background: Ionic Liquids
8�3���% ����#$�#��� ���&�! ���5������!�6 ���! )��-� �����./0��1232�
�����������
#�./��������8
/�������97
/��������/������:;��7&91<1�=
/�
�� �� �������������� ��������
����������
•���������������������•�������� ����•������ ����������������
����� ������� � ���������
•�������� ������ � ���! �•��"����������������#��� ������ �����
•��������������! �����•��!�� ����������� ��� ���•�$������������!������•�%�������� ���������&����&�
302

Polymer Membranes for Gas Separation
>�3���% ����#$�#��� ���&�! ���5������!�6 ���! )��-� �����./0��1232�
Robeson Plot •� Polymer membranes represent an
inexpensive, low energy route to gas separation;
•� Almost all systems exhibit the “Robeson Upper Bound”: a trade-off of selectivity vs. flux;
•� Ionic liquids show excellent selectivity in terms of solubility and high diffusivity;
–� Bara, et al., Ind. Eng. Chem. Res. (2009) 48, 2739
•� Ionic liquids might overcome “real” vs “ideal” selectivity bottleneck and lack the necessary mechanical integrity
L. M. Robeson, J. Membr. Sci. (2008) 320, 390
Polymeric Ionic Liquid Materials
.�3���% ����#$�#��� ���&�! ���5������!�6 ���! )��-� �����./0��1232�
Ion gels: polymer networks swollen with ionic liquids�
•� Low polymer fraction: 5-10% •� Large mesh size: 10-100 nm •� Tunable mechanical properties�
Polymerized ionic liquids: synthesized by polymerization of ionic liquid monomers
•� Strong interaction between immobilized cations and free anions •� Membrane robustness to sustain higher pressure drop�He, et al., J. Phys. Chem. B (2007) 111, 4645
He and Lodge, Chem. Commun. (2007), 2732
303

Project Objectives
•� Develop controlled polymerization routes to polymerized ionic liquids (PILs) and PIL-containing block copolymers
•� Compare gas separation performance of ion gels, polymerized ionic liquids, and PIL-ion gels
•� Optimize system performance for CO2 based separations
•� Extend to other systems such as alkanes/olefins via ionic doping
0�3���% ����#$�#��� ���&�! ���5������!�6 ���! )��-� �����./0��1232�
Recent Experimental Progress: PIL by RAFT
?�3���% ����#$�#��� ���&�! ���5������!�6 ���! )��-� �����./0��1232�
��� ��� �
#&/��%/#&� ?�822� 3,38�
#&/#$"/#&� 328�222� 3,18�
304

Thermal Properties
3���% ����#$�#��� ���&�! ���5������!�6 ���! )��-� �����./0��1232� @�
Nanoporous polymeric membranes
3���% ����#$�#��� ���&�! ���5������!�6 ���! )��-� �����./0��1232� 32�
•� 1011 pores cm–2
•� Simple etching chemistry
•� Various systems demonstrated
Tremendous untapped potential in separation technologies
Philip et al. J. Membrane. Sci. 2006 Mehta et al. J. Membrane Sci. 2005
Ultrafiltration membranes
Block polymer membranes
Grand challenges: Avoid alignment: Networks Mechanically integrity: Multiblocks
305

33�3���% ����#$�#��� ���&�! ���5������!�6 ���! )��-� �����./0��1232�
Nanoporous Membranes from Bicontinuous Microemulsions
Zhou, N. et al. Nano Letters 2006, 6, 2354-2357.
•� Controlled pore structure 50 < d < 300 nm
•� 3-dimensionally connected pores
•� Versatile design
•� Generally brittle
31�3���% ����#$�#��� ���&�! ���5������!�6 ���! )��-� �����./0��1232�
•� Equal volume fractions of each homopolymer reduces the system to two variables
•� Ordered at low �H, phase separated at high �H
•� Bicontinuous microemulsion in a narrow channel between these regions
L PS
BμE
Cool Selective Solvent
Tm and/or Tg
AB diblock + polyA + polyB Generalized Phase Diagram
306

Towards mechanically tough bicontinuous membranes
37�3���% ����#$�#��� ���&�! ���5������!�6 ���! )��-� �����./0��1232�
d1*
semicrystaline PE
glassy PCHE
rubbery PEP
tough CEC core extractable P
Hierarchical heptablock copolymer
3���% ����#$�#��� ���&�! ���5������!�6 ���! )��-� �����./0��1232� 38�
CECEC-P
Symmetric and asymmetric: 25% C, 25% E, 50% P
Combine anionic polymerization and catalytic hydrogenation
307
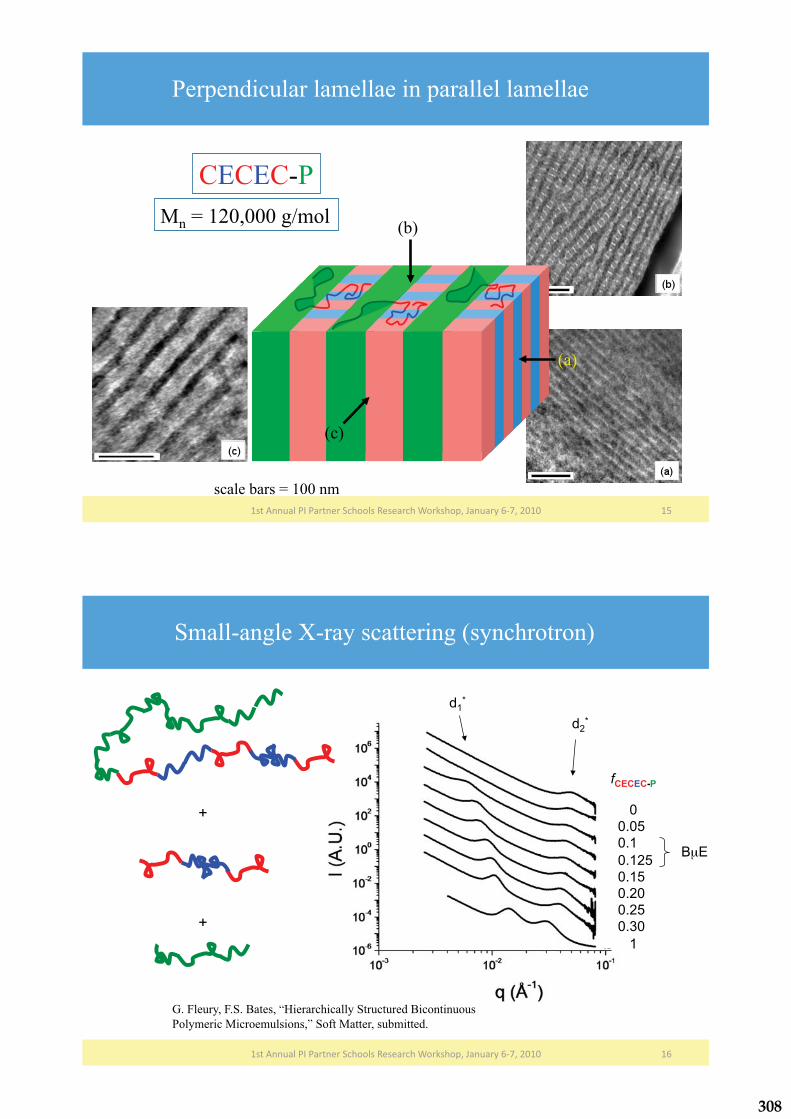
3���% ����#$�#��� ���&�! ���5������!�6 ���! )��-� �����./0��1232� 3>�
(b)
(c)
(a)
Perpendicular lamellae in parallel lamellae
Mn = 120,000 g/mol
CECEC-P
scale bars = 100 nm
3���% ����#$�#��� ���&�! ���5������!�6 ���! )��-� �����./0��1232� 3.�
Small-angle X-ray scattering (synchrotron)
0 0.05 0.1 0.125 0.15 0.20 0.25 0.30 1
fCECEC-P
d1*
d2*
BμE
+
+
G. Fleury, F.S. Bates, �Hierarchically Structured Bicontinuous Polymeric Microemulsions,� Soft Matter, submitted.
308
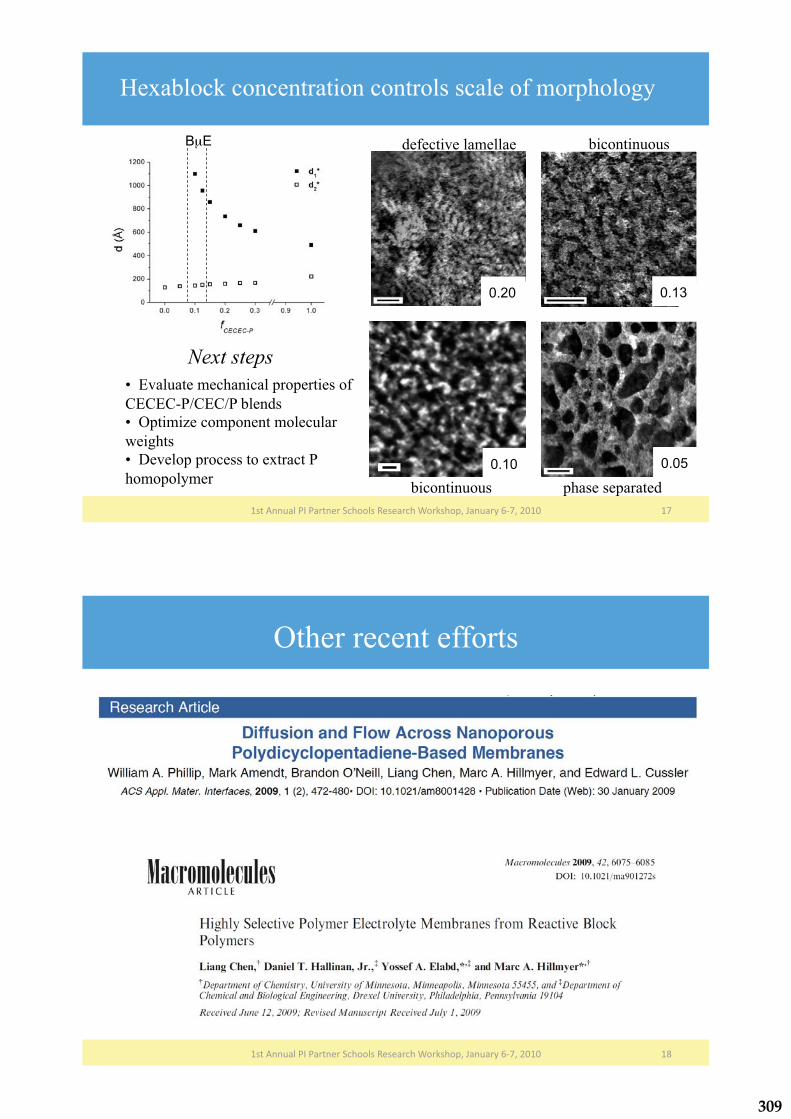
3���% ����#$�#��� ���&�! ���5������!�6 ���! )��-� �����./0��1232� 30�
Hexablock concentration controls scale of morphology
BμE
a b
c d
0.20 0.13
0.10 0.05
bicontinuous phase separated
defective lamellae bicontinuous
•� Evaluate mechanical properties of CECEC-P/CEC/P blends •� Optimize component molecular weights •� Develop process to extract P homopolymer
Next steps
Other recent efforts
3���% ����#$�#��� ���&�! ���5������!�6 ���! )��-� �����./0��1232� 3?�
309
Reservoir Characterization and Simulation
310

CSM�Team:�A.�Al�Sumaiti (PI), PhD�candidate,�B.�Barzegar,�PhD�studentDr.�M.�Kazemi,�Dr. E.�Ozkan,�Dr. E.�Graves�and�Dr.�Miskimins
PI�Team: Dr.�Ghedan
PI�Partners PI�Sponsors
1st Annual�PI�Partner�Schools�Research�Workshop
The�Petroleum�Institute,�Abu�Dhabi,�U.A.E.
January�6�7, 2010
Characterization�and�Simulation�of�Abu�Dhabi�Fractured�Carbonate�Reservoirs
Dr.�Rick�Sarg (GE)
Dr.�Mike�Batzle(GP)
Dr.�Manika Prasad�(PE)
Dr.�Hossein Kazemi (PE)
Dr.�Ramona�Graves(PE)
Dr.�Erdal Ozkan (PE)
CSM�GEOSCIENCE/ENGINEERING�
TEAM
1st�Annual�PI�Partner�Schools�Research�Workshop,�January�6�7,�2010
311

MISSION
• The research projects reported in the following slides were designed to produce the greatest amount of oil from Zakum field.
• In addition, these projects were designed as part of an educational process for the UAE graduate students studying at CSM, and a means for collaboration and technology transfer to the Petroleum Institute.
1st�Annual�PI�Partner�Schools�Research�Workshop,�January�6�7,�2010
Background
• Thamama 1A Research Program consists ofFIVE CSM/PI projects.
• The research group is an integrated team ofpetroleum engineers, geologists,
petrophysicists, and geophysicists from CSM and PI.
1st�Annual�PI�Partner�Schools�Research�Workshop,�January�6�7,�2010
312
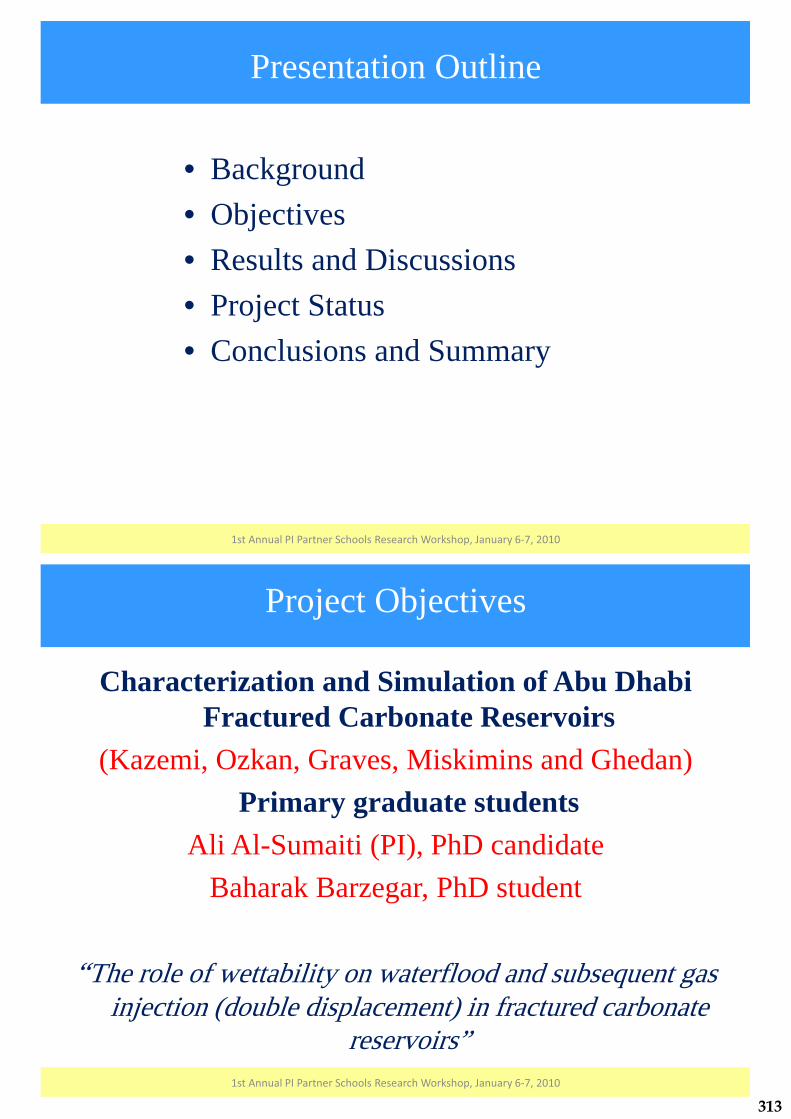
Presentation Outline
• Background• Objectives• Results and Discussions• Project Status• Conclusions and Summary
1st�Annual�PI�Partner�Schools�Research�Workshop,�January�6�7,�2010
Project Objectives
Characterization and Simulation of Abu Dhabi Fractured Carbonate Reservoirs
(Kazemi, Ozkan, Graves, Miskimins and Ghedan)Primary graduate students
Ali Al-Sumaiti (PI), PhD candidateBaharak Barzegar, PhD student
“The role of wettability on waterflood and subsequent gas injection (double displacement) in fractured carbonate
reservoirs”1st�Annual�PI�Partner�Schools�Research�Workshop,�January�6�7,�2010
313
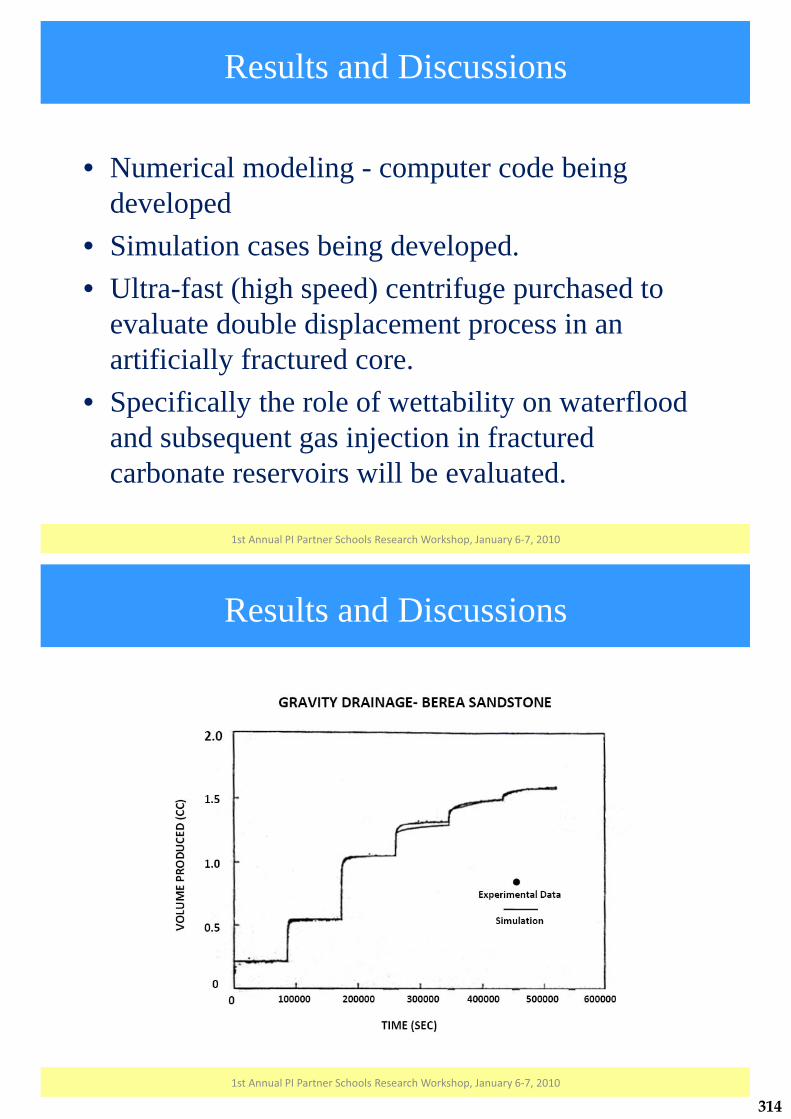
Results and Discussions
• Numerical modeling - computer code being developed
• Simulation cases being developed.• Ultra-fast (high speed) centrifuge purchased to
evaluate double displacement process in an artificially fractured core.
• Specifically the role of wettability on waterfloodand subsequent gas injection in fractured carbonate reservoirs will be evaluated.
1st�Annual�PI�Partner�Schools�Research�Workshop,�January�6�7,�2010
Results and Discussions
1st�Annual�PI�Partner�Schools�Research�Workshop,�January�6�7,�2010
314

Exponential� Fit� to� Long� Time� Production� Data�(M.�J.�King,�et�al,�1990�SCA�9011)
Results and Discussions
1st�Annual�PI�Partner�Schools�Research�Workshop,�January�6�7,�2010
Conclusions and Summary
• From the results of the centrifuge experiments – examples shown in previous slides –capillary pressure, wettability, and relative permeability can be calculated for the zones of study in Thamama 1A.
• These results will be used in the simulation study. Sensitivity analysis will be done to determine next phase of experimental testing.
1st�Annual�PI�Partner�Schools�Research�Workshop,�January�6�7,�2010
315

Project Status
• Ultra-high speed centifuge to be delivered in early January
• Centifuge training completed by Al-Sumaiti, Barak, Al-Ameri, and CSM Laboratory Coordinator at Core Lab facilities in Houston.
• Awaiting Thamama 1A core plugs to begin testing.
1st�Annual�PI�Partner�Schools�Research�Workshop,�January�6�7,�2010
Questions and Discussion
1st�Annual�PI�Partner�Schools�Research�Workshop,�January�6�7,�2010
316
CSM�Team:�Ravi�Sharma�(PhD�candidate),�Dr.�Batzle,�&�Dr.�Prasad
PI�Team:�Dr.�Vega
PI�Partners PI�Sponsors
1st Annual�PI�Partner�Schools�Research�Workshop
The�Petroleum�Institute,�Abu�Dhabi,�U.A.E.
January�6�7,�2010
Fluid�Sensitivity�of�Seismic�Properties�in�Carbonate�Reservoirs�
Project Objectives
Fluid Sensitivity of Seismic Properties in Carbonate Reservoirs (Batzle, Prasad, Vaga)
Primary graduate studentRavi Sharma, PhD student
“Low frequency seismic experiments to quantify the variation in texture and heterogeneity in organic
rich shale (ORS)”1st�Annual�PI�Partner�Schools�Research�Workshop,�January�6�7,�2010
317
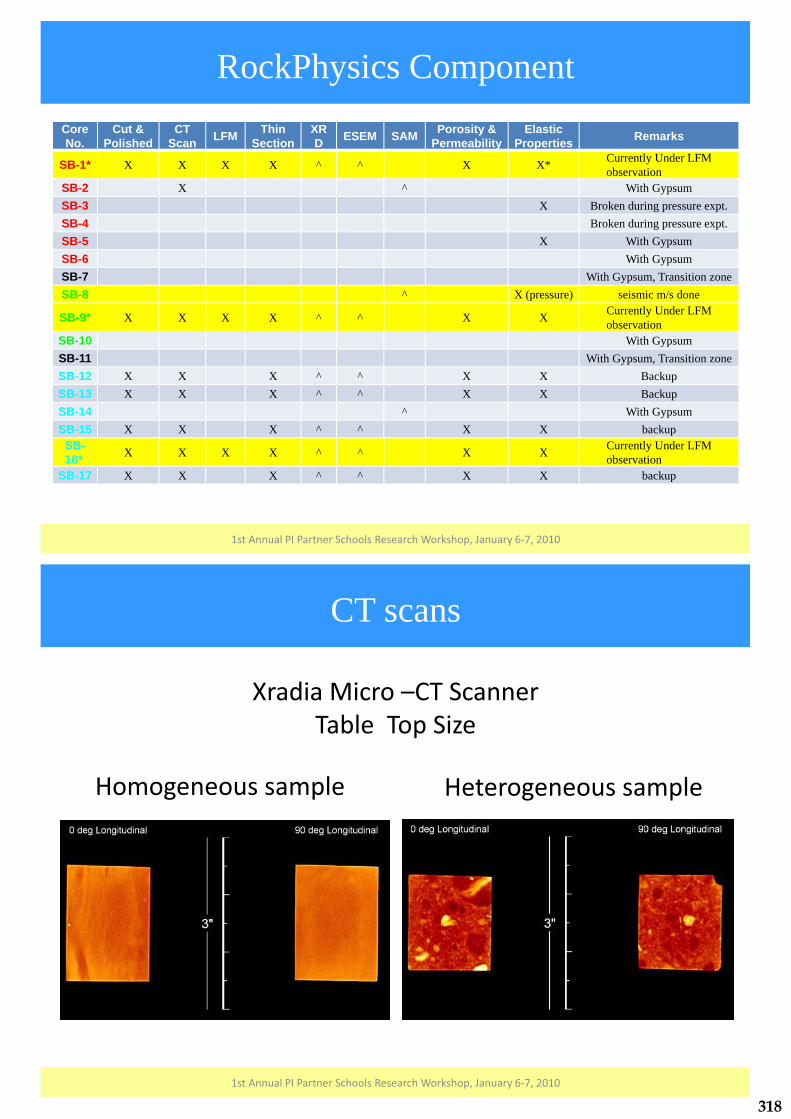
RockPhysics ComponentCoreNo.
Cut & Polished
CTScan LFM Thin
SectionXRD ESEM SAM Porosity &
PermeabilityElastic
Properties Remarks
SB-1* X X X X ^ ^ X X* Currently Under LFM observation
SB-2 X ^ With GypsumSB-3 X Broken during pressure expt.SB-4 Broken during pressure expt.SB-5 X With GypsumSB-6 With GypsumSB-7 With Gypsum, Transition zoneSB-8 ^ X (pressure) seismic m/s done
SB-9* X X X X ^ ^ X X Currently Under LFM observation
SB-10 With GypsumSB-11 With Gypsum, Transition zoneSB-12 X X X ^ ^ X X BackupSB-13 X X X ^ ^ X X BackupSB-14 ^ With GypsumSB-15 X X X ^ ^ X X backupSB-16* X X X X ^ ^ X X Currently Under LFM
observationSB-17 X X X ^ ^ X X backup
1st�Annual�PI�Partner�Schools�Research�Workshop,�January�6�7,�2010
CT scans
Homogeneous�sample Heterogeneous�sample
Xradia�Micro�–CT�ScannerTable��Top�Size
1st�Annual�PI�Partner�Schools�Research�Workshop,�January�6�7,�2010
318
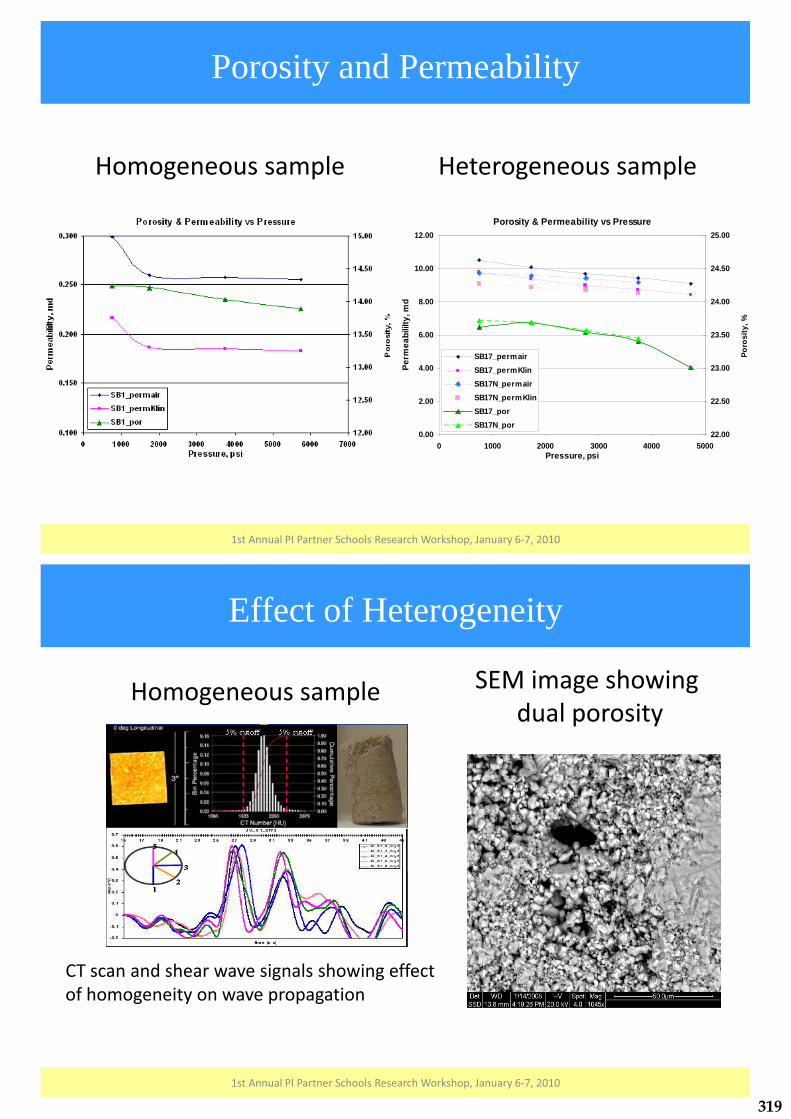
Porosity and Permeability
Homogeneous�sample Heterogeneous�sample
Porosity & Permeability vs Pressure
0.00
2.00
4.00
6.00
8.00
10.00
12.00
0 1000 2000 3000 4000 5000Pressure, psi
Perm
eabi
lilty
, md
22.00
22.50
23.00
23.50
24.00
24.50
25.00
Poro
sity
, %
SB17_permairSB17_permKlinSB17N_permairSB17N_permKlinSB17_porSB17N_por
1st�Annual�PI�Partner�Schools�Research�Workshop,�January�6�7,�2010
Effect of Heterogeneity
SEM�image�showing�dual�porosity
CT�scan�and�shear�wave�signals�showing�effect�of�homogeneity�on�wave�propagation
1st�Annual�PI�Partner�Schools�Research�Workshop,�January�6�7,�2010
Homogeneous�sample
319
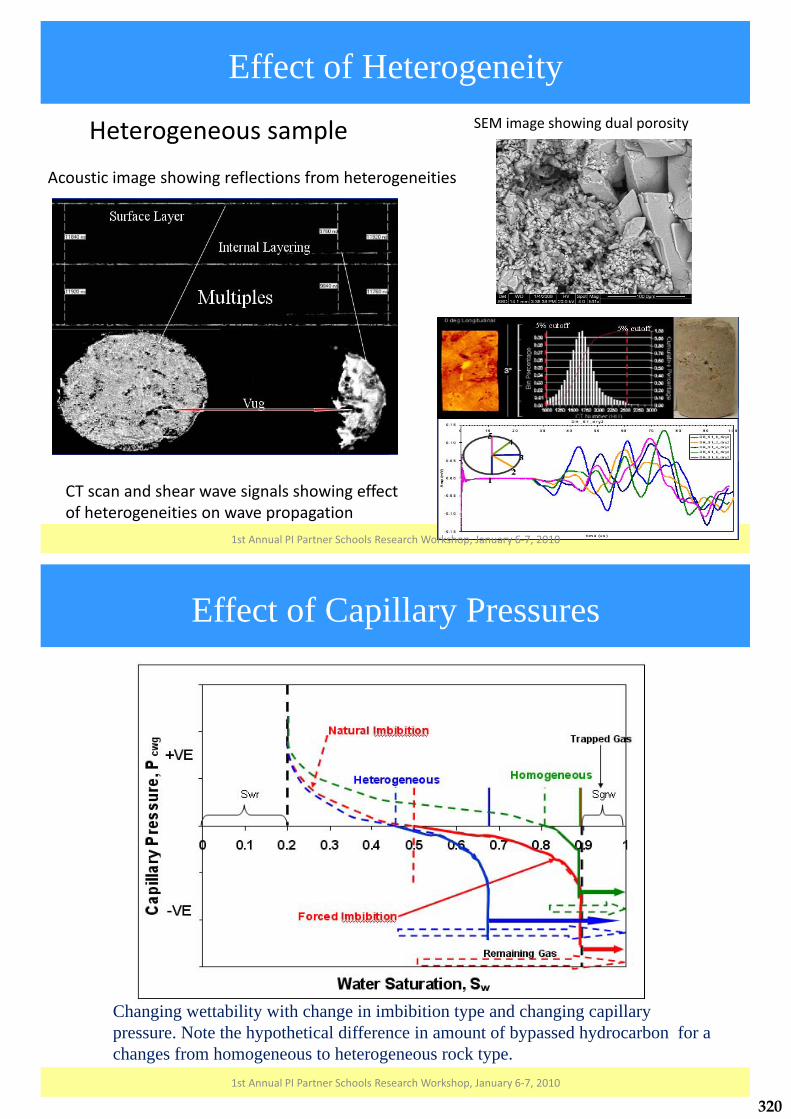
Effect of Heterogeneity
Acoustic�image�showing�reflections�from�heterogeneities
SEM�image�showing�dual�porosity
CT�scan�and�shear�wave�signals�showing�effect�of�heterogeneities�on�wave�propagation
1st�Annual�PI�Partner�Schools�Research�Workshop,�January�6�7,�2010
Heterogeneous�sample
Effect of Capillary Pressures
Changing wettability with change in imbibition type and changing capillary pressure. Note the hypothetical difference in amount of bypassed hydrocarbon for a changes from homogeneous to heterogeneous rock type.
1st�Annual�PI�Partner�Schools�Research�Workshop,�January�6�7,�2010
320
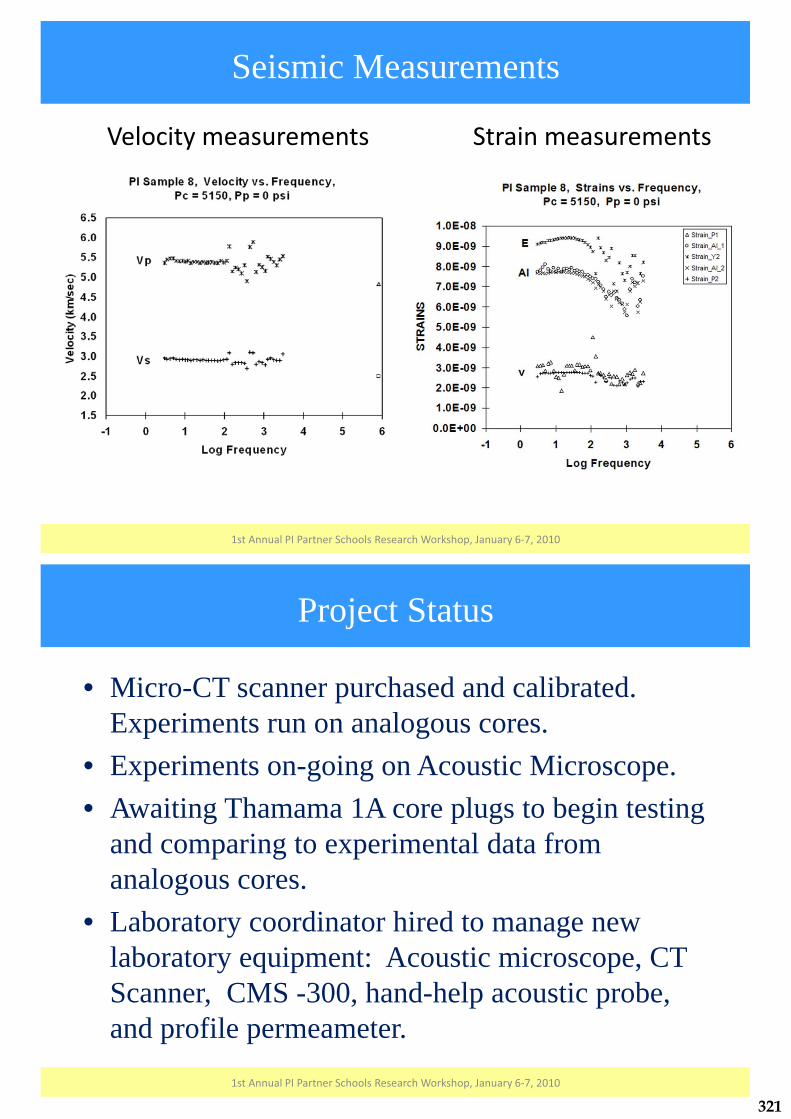
Seismic Measurements
Velocity�measurements Strain�measurements
1st�Annual�PI�Partner�Schools�Research�Workshop,�January�6�7,�2010
Project Status
• Micro-CT scanner purchased and calibrated. Experiments run on analogous cores.
• Experiments on-going on Acoustic Microscope.• Awaiting Thamama 1A core plugs to begin testing
and comparing to experimental data from analogous cores.
• Laboratory coordinator hired to manage new laboratory equipment: Acoustic microscope, CT Scanner, CMS -300, hand-help acoustic probe, and profile permeameter.
1st�Annual�PI�Partner�Schools�Research�Workshop,�January�6�7,�2010
321

Questions and Discussion
1st�Annual�PI�Partner�Schools�Research�Workshop,�January�6�7,�2010
322
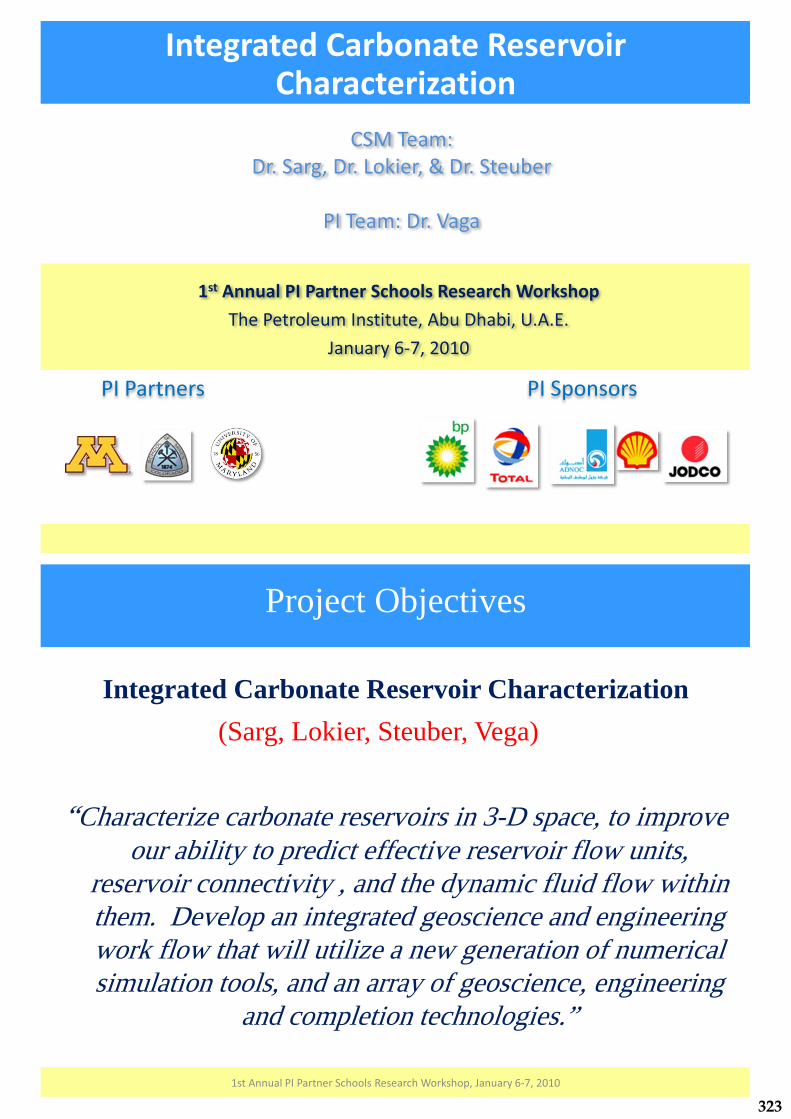
CSM�Team:�Dr.�Sarg,�Dr.�Lokier,�&�Dr.�Steuber
PI�Team:�Dr.�Vaga
PI�Partners PI�Sponsors
1st Annual�PI�Partner�Schools�Research�Workshop
The�Petroleum�Institute,�Abu�Dhabi,�U.A.E.
January�6�7,�2010
Integrated�Carbonate�Reservoir�Characterization�
Project Objectives
Integrated Carbonate Reservoir Characterization (Sarg, Lokier, Steuber, Vega)
“Characterize carbonate reservoirs in 3-D space, to improve our ability to predict effective reservoir flow units,
reservoir connectivity , and the dynamic fluid flow within them. Develop an integrated geoscience and engineering work flow that will utilize a new generation of numerical simulation tools, and an array of geoscience, engineering
and completion technologies.”
1st�Annual�PI�Partner�Schools�Research�Workshop,�January�6�7,�2010
323

Current�Research�– 3D�Natih E�Reservoir�
ModelJebel�Madar �salt�cored�dome
Radial�&�Concentric�Fracture�System�
Lime�Mudstone�micro�porosity�dominant�matrix�porosity
Three�Shallowing Upward,�Outer�Ramp�Cycles
3D�Gocad�model�draped�on�DEM
Gocad�model�will�be�populated�with�
outcrop�based�fracture,�
lithofacies�and�porosity�data�to�construct�Petrel�
reservoir�geomodel
Project Status
• Selected test reservoir – Thamama 1A reservoir at Upper Zakum.
• Joint CSM-PI planning workshop.• Identified test area within Upper Zakum field
& requested subsurface data.• Identifying a list of cored wells in the central
study area• Continued “proof of concept” work with Natih
E reservoir study in Oman outcrop.
1st�Annual�PI�Partner�Schools�Research�Workshop,�January�6�7,�2010 4
324
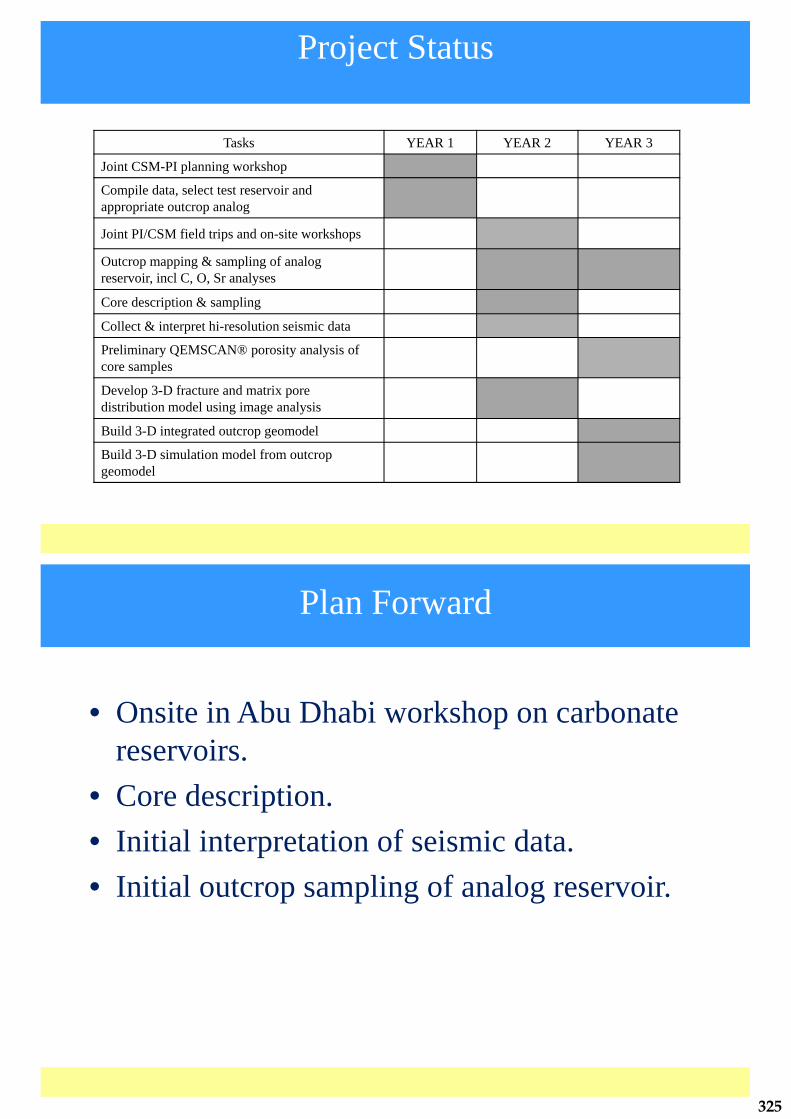
Tasks YEAR 1 YEAR 2 YEAR 3
Joint CSM-PI planning workshop
Compile data, select test reservoir and appropriate outcrop analog
Joint PI/CSM field trips and on-site workshops
Outcrop mapping & sampling of analog reservoir, incl C, O, Sr analyses
Core description & sampling
Collect & interpret hi-resolution seismic data
Preliminary QEMSCAN® porosity analysis of core samples
Develop 3-D fracture and matrix pore distribution model using image analysis
Build 3-D integrated outcrop geomodel
Build 3-D simulation model from outcrop geomodel
Project Status
Plan Forward
• Onsite in Abu Dhabi workshop on carbonate reservoirs.
• Core description.• Initial interpretation of seismic data.• Initial outcrop sampling of analog reservoir.
325

Questions and Discussion
1st�Annual�PI�Partner�Schools�Research�Workshop,�January�6�7,�2010
326


![[5]S4 Clark olmec](https://static.fdokumen.com/doc/165x107/631a7d74bb40f9952b020797/5s4-clark-olmec.jpg)