18009.pdf - Durham Research Online
14
• • •
-
Upload
khangminh22 -
Category
Documents
-
view
0 -
download
0
Transcript of 18009.pdf - Durham Research Online
Durham Research Online
Deposited in DRO:
23 March 2016
Version of attached �le:
Published Version
Peer-review status of attached �le:
Peer-reviewed
Citation for published item:
Simm, Anthony and Wang, Qing and Huang, Songling and Zhao, Wei (2016) 'Laser based measurement forthe monitoring of shaft misalignment.', Measurement., 87 . pp. 104-116.
Further information on publisher's website:
http://dx.doi.org/10.1016/j.measurement.2016.02.034
Publisher's copyright statement:
c© 2016 The Authors. Published by Elsevier Ltd. This is an open access article under the CC-BY license(http://creativecommons.org/licenses/by/4.0/).
Additional information:
Use policy
The full-text may be used and/or reproduced, and given to third parties in any format or medium, without prior permission or charge, forpersonal research or study, educational, or not-for-pro�t purposes provided that:
• a full bibliographic reference is made to the original source
• a link is made to the metadata record in DRO
• the full-text is not changed in any way
The full-text must not be sold in any format or medium without the formal permission of the copyright holders.
Please consult the full DRO policy for further details.
Durham University Library, Stockton Road, Durham DH1 3LY, United KingdomTel : +44 (0)191 334 3042 | Fax : +44 (0)191 334 2971
https://dro.dur.ac.uk
Laser based measurement for the monitoring of shaftmisalignment
Anthony Simma, Qing Wang a,⇑, Songling Huang b, Wei Zhao b
a School of Engineering and Computing Sciences, Durham University, United Kingdomb State Key Laboratory of Power Systems, Department of Electrical Engineering, Tsinghua University, Beijing, China
a r t i c l e i n f o
Article history:Received 8 January 2016Received in revised form 14 February 2016Accepted 19 February 2016Available online 5 March 2016
Keywords:Condition monitoringShaft misalignmentLaser distance measurement
a b s t r a c t
This paper presents a method for real-time online monitoring of shaft misalignment, whichis a common problem in rotating machinery, such as the drive train of wind turbines. Anon-contact laser based measurement method is used to monitor positional changes of arotating shaft in real time while in operation. The results are then used to detect the pres-ence of shaft misalignment. An experimental test rig is designed to measure shaft misalign-ment and the results from the work show that the technique can be used for themonitoring of both offset and angular shaft misalignment, which will have applicationsin the condition monitoring and maintenance of various types of rotating machinery.� 2016 The Authors. Published by Elsevier Ltd. This is an open access article under the CC
BY-NC-ND license (http://creativecommons.org/licenses/by-nc-nd/4.0/).
1. Introduction
When performing maintenance on machinery, the fol-lowing techniques are common: (1) run to failure wherea piece of equipment must fail before any maintenance isperformed; (2) preventative (or periodic) maintenancewhere maintenance is based on the length of the operatingperiod, using criteria such as the mean time to failure(MTTF) measurement for the machine; (3) predictivemaintenance where the operating condition of themachine is monitored to identify the need for repairsthrough data analysis and diagnosis [1].
Predictive maintenance strategies have led to the needfor machinery condition monitoring. Condition monitoringcan be defined as monitoring the physical parameters asso-ciated with the operation of the machine, such as vibration,temperature or pressure, to determine the operational con-dition of the machine. Improvements in maintenancestrategies have economic benefits through improved pro-
duction and less downtime, as well as indirect benefitsthrough the need for fewer spare parts [2]. Examples ofprevious research on condition monitoring for rotatingmachines use vibration sensors for the monitoring of bear-ings to identify shaft rub and shaft misalignment [3], faultdiagnosis using the empirical mode decomposition method[4] and acoustic noise measurements to predict theremaining useful life of a machine [5].
A typical application of condition monitoring for rotat-ing machines is in wind turbines [6], specifically in off-shore wind turbines, due to inaccessible locations [7],which may be expensive or difficult to access, with vari-able operating conditions. The drive train of the wind tur-bine consists of typically, a low speed shaft (on the rotorside), a gearbox, and a high-speed shaft (on the generatorside) as well as support bearings, one or more couplings(between the shaft and the gearbox) and a mechanicalbrake [8]. A study [9] showed that 25% of the operationalexpenditure for an offshore wind farm is for operationand maintenance activities so any improvement in moni-toring, leading to a reduction in maintenance costs, couldeventually drive down the cost of energy.
http://dx.doi.org/10.1016/j.measurement.2016.02.0340263-2241/� 2016 The Authors. Published by Elsevier Ltd.This is an open access article under the CC BY-NC-ND license (http://creativecommons.org/licenses/by-nc-nd/4.0/).
⇑ Corresponding author. Tel.: +44 191 334 2381; fax: +44 191 3344208.
E-mail address: [email protected] (Q. Wang).
Measurement 87 (2016) 104–116
Contents lists available at ScienceDirect
Measurement
journal homepage: www.elsevier .com/ locate /measurement
2. Shaft misalignment
A shaft is an essential part of the rotating machine; it isused to transmit power and motion. A common problem(estimated to cause over 70% of vibration problems [10])in rotating machinery is shaft misalignment. Shaftmisalignment occurs when the centre lines of rotation oftwo (or more) machinery shafts are not in line with eachother [11]. This increases axial and radial forces on bear-ings, seals and couplings, increasing the amount of wearin these components, leading to an increase in vibrationin the machine and bearings, it also increases bending ofthe shaft, increasing the risk of shaft failure and reducingthe amount of power transmitted through the shaft [12].Even if initially, or after adjustment, the shaft is aligned,during operation various factors such as thermal growth,piping pressure and foundation movements will alter thealignment [13].
Previous work on shaft misalignment monitoring hasmainly been focused on looking at the vibration response.Arebi et al. [14] developed an on-line misalignment moni-toring system using a wireless accelerometer mounteddirectly to the shaft, to measure the acceleration due tovibration. Work in rotor-dynamics shows that shaftmisalignment caused by rotor imbalance leads to syn-chronous vibrations (frequency of vibration at twice theshaft speed) [15]. Dewell and Mitchell showed that theresponse to a misaligned coupling contained vibration fre-quencies of two times and four times the rotation speed[16], Xu and Marangoni also showed vibration frequenciesat multiples of rotation speed [17,18]. Patel and Darpe [10]describe a drawback in using vibration monitoring to mon-itor for shaft alignment, as shaft damage, shaft stiffnessand the type of coupling used can also affect vibrationresponse. Shaft misalignment should cause vibration inboth the connected machines, if it is only on a singlemachine, this could indicate other problems such as acracked case [19]. As well as using vibration measure-ments, analysis of the motor current has been applied toshaft misalignment monitoring, Chaudhury and Gupta[20] and Verma et al. [21] used spectral characteristics ofthe stator current to identify shaft misalignment, Thomsonand Fenger used motor current signature analysis to iden-tify faults such as misalignment [22]. Similarly to the workon vibration measurements, Bossio et al. showed thatangular misalignment has an effect on current at frequen-cies of two times the rotation frequency [23].
As well as measuring the response of the motor (cur-rent) or shaft (vibration) directly, indirect methods have
been used to identify shaft misalignment. Rameshkumaret al. investigated the effect of misalignment on ‘‘coastdown time” (time between the power cut off and themachine stopping rotating). They found that as shaftmisalignment increased, the coast down time decreased,due to the increased power loss caused by the shaftmisalignment and increased torque on the bearings [24].Strain gauges have also been used to measure the presenceof misalignment on turbine rotors [25] and to measure theincreased gear loading caused by shaft misalignment [26].Fulzele et al. used an optical sensor to measure shaftvibration by measuring the fluctuation of reflected lightfrom the shaft [27]. Various methods have been developedto model or predict shaft misalignment; Sekhar andPrabhu used Finite Element Method (FEM) modelling toinvestigate the effect of coupling misalignment on thevibration response of a rotor-bearing system [28]. Choand Jeong [29] and Fang et al. [12] used principal compo-nent regression (PCR) and partial least squares (PLS) to pre-dict shaft parallel and angular misalignment. Yang andTavner used empirical mode decomposition to reconstructshaft orbit measurements to identify shaft misalignment[30].
Monitoring of shaft alignment during operation isneeded as an effective tool in maintenance. A survey onrotating machinery in industry [31] showed that fewerthan 10% of 160 machines examined were within accept-able shaft alignment, also 30% of a machine’s down timeis due to poor alignment [32]. Shaft misalignment consistsof three types [33]:
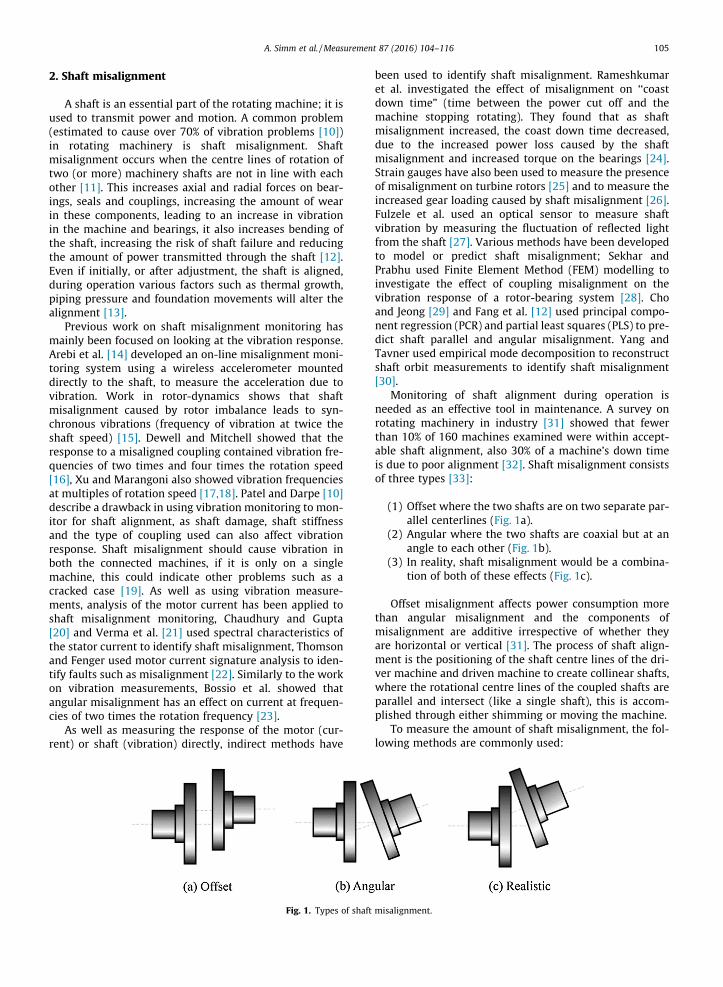
(1) Offset where the two shafts are on two separate par-allel centerlines (Fig. 1a).
(2) Angular where the two shafts are coaxial but at anangle to each other (Fig. 1b).
(3) In reality, shaft misalignment would be a combina-tion of both of these effects (Fig. 1c).
Offset misalignment affects power consumption morethan angular misalignment and the components ofmisalignment are additive irrespective of whether theyare horizontal or vertical [31]. The process of shaft align-ment is the positioning of the shaft centre lines of the dri-ver machine and driven machine to create collinear shafts,where the rotational centre lines of the coupled shafts areparallel and intersect (like a single shaft), this is accom-plished through either shimming or moving the machine.
To measure the amount of shaft misalignment, the fol-lowing methods are commonly used:
Fig. 1. Types of shaft misalignment.
A. Simm et al. /Measurement 87 (2016) 104–116 105

(1) Straight edge (Fig. 2a).(2) Dial indicator (reverse indicator method shown in
Fig. 2b).(3) Laser indicator (Fig. 2c).
The straight edge is usually the first stage of inspectionto get an approximate reading before moving onto themore accurate methods. The commonmethod is to use dialindicators. Recently, these have been replaced by laserbased misalignment measurement methods, which aremore accurate and can be automated to calculate theamount of shaft misalignment automatically.
Monitoring and predicting the shaft alignment condi-tion is important for making decisions on when to performmaintenance of the rotating machine, by countingmisalignment events or using the measurements to iden-tify other fault types such as bearing damage. This workproposes an alternative to the previously mentioned shaftmisalignment measurement methods: a non-contact laserbased measurement technique to capture the on-line posi-tional changes of a shaft, for improved shaft misalignmentmonitoring.
3. Experimental study
The most common method to counteract the presenceof shaft misalignment is to use a coupling, where the cou-pling is inserted between the driving and driven shafts.Couplings are chosen based on various factors such asenvironment, vibration and stiffness [34]. The two maintypes of coupling are: (1) metallic, such as, chain, gearand disc couplings, which have high stiffness and toleranceto extreme environments and (2) elastomeric, such as, pinand bushing, jaw and sleeve couplings, which are torsion-ally soft and have vibration damping/shock absorbingqualities. In this work a set of huco elastomeric d-loop cou-plings are used, due to a large range of permissible operat-ing misalignment (10� angular misalignment and 2.6 mmoffset misalignment) [35], allowing for a range of shaftmisalignment to be examined.
3.1. Test rig design
To simulate a rotating drive train, an experimental testrig has been designed, as shown in Fig. 3. The laser basedmeasuring method is designed to be non-contact, so itcan be easily applied to various types of rotating machin-ery. Laser distance measurements have engineering appli-cations in areas such as vibrometry [36], coordinatemeasurement systems [37] and micro displacement mea-surement [38]. Laser mouse sensors have also been usedfor non-contact shaft speed measurements [39], as analternative to electromagnetic sensors.
A Baumer photoelectric distance measuring sensor witha measuring range of 30 mm to 130 mm, a resolution of0.06 mm and a response time of less than 10 ms, is usedto measure the amount of shaft misalignment present bymeasuring shaft positional changes (the distance fromthe laser to the shaft). The laser uses optical triangulation,where a pulsed red laser line is projected onto the surfaceof the shaft and part of the reflected light is measuredusing a photodiode detector, where the angle of incidenceis used to calculate the distance.
The motor is used to rotate the shaft (�37 rpm) and anoptoelectronic trigger is used to measure shaft rotation forensemble averaging. The 6 mm diameter steel shaft is sup-ported by support bearings that are attached to leadscrews (�1.25 mm pitch) to give adjustable amounts ofshaft misalignment (both offset and angular). Note thatP1–P5 are shaft misalignment measuring positions.
The first stage in a condition monitoring system is toacquire and process the data related to the condition ofthe machine [40]. The data acquisition is performed usinga National Instruments USB-6218 card. The data acquisi-tion software is developed using DAQmx drivers built intoLabVIEW 2012. This software allows control of the motorspeed and acquisition of the trigger signal and output fromthe two measurement lasers. Data from these measure-ments will allow the monitoring of any ongoing shaftmisalignment from the changes in the distance measure-ment over time, an improvement over existing offlinemaintenance methods to monitor shaft misalignment
Fig. 2. Misalignment measurement methods.
106 A. Simm et al. /Measurement 87 (2016) 104–116
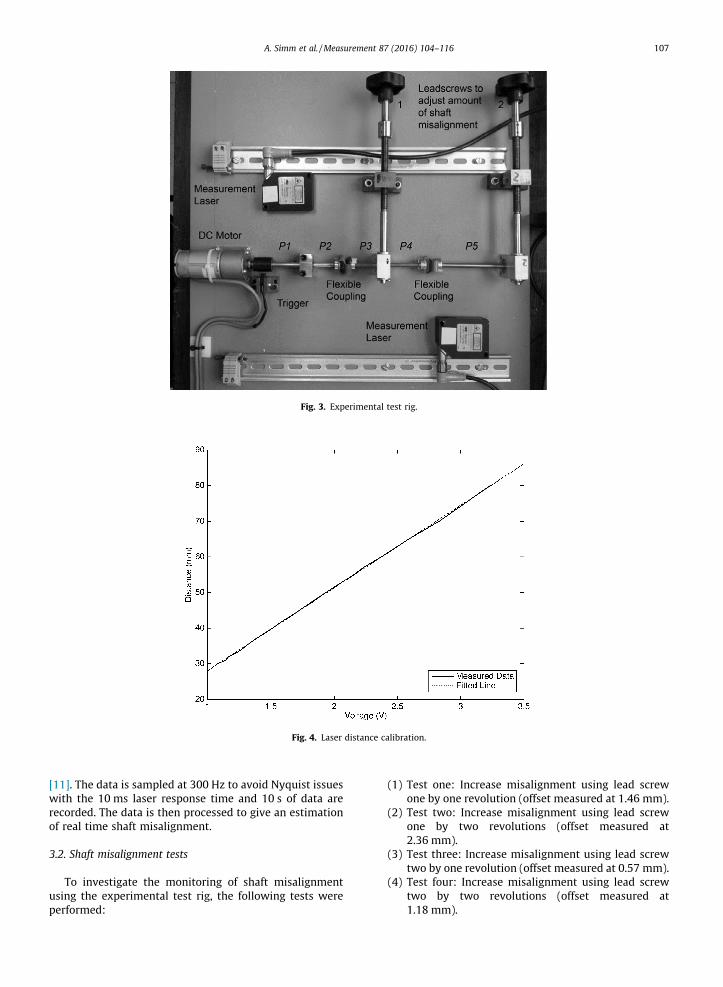
[11]. The data is sampled at 300 Hz to avoid Nyquist issueswith the 10 ms laser response time and 10 s of data arerecorded. The data is then processed to give an estimationof real time shaft misalignment.
3.2. Shaft misalignment tests
To investigate the monitoring of shaft misalignmentusing the experimental test rig, the following tests wereperformed:
(1) Test one: Increase misalignment using lead screwone by one revolution (offset measured at 1.46 mm).
(2) Test two: Increase misalignment using lead screwone by two revolutions (offset measured at2.36 mm).
(3) Test three: Increase misalignment using lead screwtwo by one revolution (offset measured at 0.57 mm).
(4) Test four: Increase misalignment using lead screwtwo by two revolutions (offset measured at1.18 mm).
Fig. 3. Experimental test rig.
Fig. 4. Laser distance calibration.
A. Simm et al. /Measurement 87 (2016) 104–116 107
(5) Test five: Increase misalignment using both leadscrew one and lead screw two both by onerevolution.
(6) Test six: Increase misalignment using both leadscrew one and lead screw two both by tworevolutions.
(7) Test seven: Continuously increase the amount ofmisalignment using lead screw one and measure asit changes dynamically over time.
3.3. Data processing
The data is acquired as a voltage measurement from thelasers. It is converted to a distance using the relationship,Distance (mm) = 23.2 � Voltage (V) + 4.92, from the line fit-
ted to the measurement data shown in Fig. 4. For example,a laser output of 1.5 V equates to a distance of 39.72 mm.
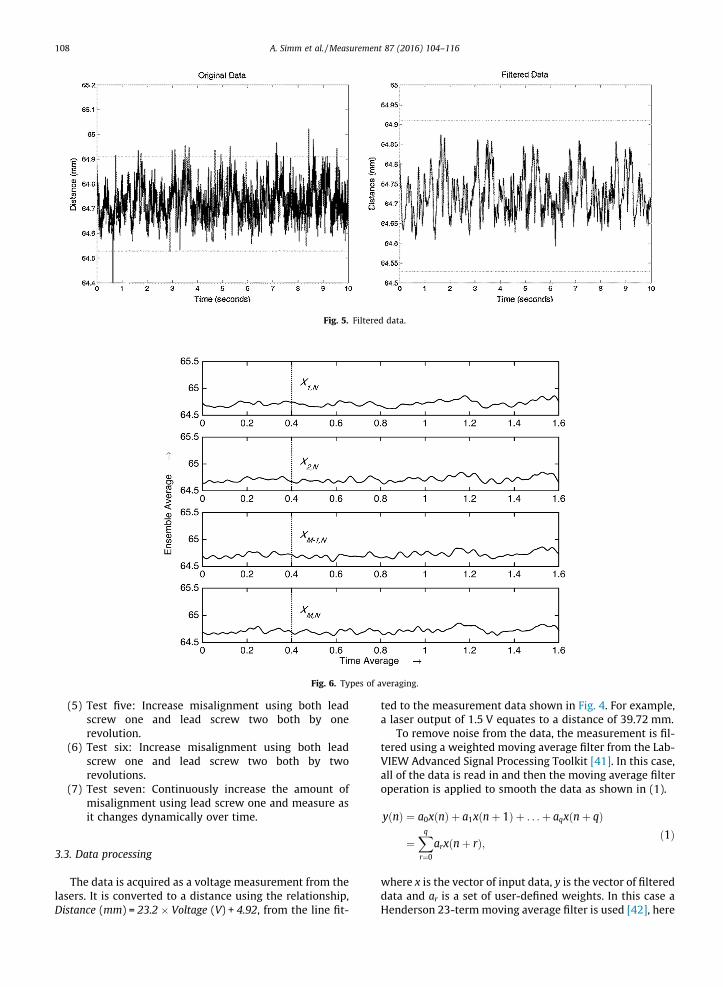
To remove noise from the data, the measurement is fil-tered using a weighted moving average filter from the Lab-VIEW Advanced Signal Processing Toolkit [41]. In this case,all of the data is read in and then the moving average filteroperation is applied to smooth the data as shown in (1).
yðnÞ ¼ a0xðnÞ þ a1xðnþ 1Þ þ . . .þ aqxðnþ qÞ
¼Xq
r¼0
arxðnþ rÞ; ð1Þ
where x is the vector of input data, y is the vector of filtereddata and ar is a set of user-defined weights. In this case aHenderson 23-termmoving average filter is used [42], here
Fig. 5. Filtered data.
Fig. 6. Types of averaging.
108 A. Simm et al. /Measurement 87 (2016) 104–116

the number of weights must be odd, the weight array mustbe symmetric and
Par ¼ 1 as shown in (2).
yðnÞ ¼ �0:00428xðnÞ � 0:01092xðnþ 1Þ � 0:01569xðnþ2Þ� 0:01453xðnþ3Þ � 0:00495xðnþ4Þþ 0:01343xðnþ5Þ þ 0:03893xðnþ 6Þþ 0:06830xðnþ7Þ þ 0:09740xðnþ8Þþ 0:12195xðnþ 9Þ þ 0:13832xðnþ 10Þþ 0:14406xðnþ11Þ þ 0:13832xðnþ 12Þþ 0:12195xðnþ 13Þ þ 0:09740xðnþ14Þþ 0:06830xðnþ15Þ þ 0:03893xðnþ 16Þþ 0:01343xðnþ17Þ � 0:00495xðnþ 18Þ� 0:01453xðnþ19Þ � 0:01569xðnþ20Þ� 0:01092xðnþ21Þ � 0:00428xðnþ22Þ ð2Þ
The result of filtering the measurement data to smooththe data and remove outliers is shown in Fig. 5. The dottedlines show the limit for outlier data (unusual values ofdata), in this case 1.5 times the interquartile range (middle50% of the values in the data) [43].
The mean value will then be used for distance calcula-tions, in the example in Fig. 5, the mean of both the originaldata and filtered data is 64.72 mm, showing that in thiscase filtering removes extreme values with no change tothe mean.
When the data has been processed the mean over theperiodic results (the revolutions of the shaft) can be calcu-lated using the ensemble average. The difference betweentime average and ensemble average is shown in Fig. 6.
If Xi,j is the jth time element in the ith revolution theensemble can be represented using the matrix in (3) [44].
time!
X1;1 X1;2 � � � X1;N�1 X1;N
X2;1 X2;2 � � � X2;N�1 X2;N
revs # ... ..
. . .. ..
. ...
XM�1;1 XM�1;2 � � � XM�1;N�1 XM�1;N
XM;1 XM;2 � � � XM;N�1 XM;N
ð3Þ
With N columns of evenly spaced time samples(300 Hz = 3.33 ms) andM rows of time series for each shaftrevolution. For the ith revolution it is possible to computethe time average denoted by X, given by (4) [44].
Xi;j ¼ 1N
XN
j¼1
Xi;j ð4Þ
Similarly for the jth sample, the ensemble average,denoted by hXi, can be calculated over all rotations givenby (5) [44].
hXi;ji ¼ 1M
XM
i¼1
Xi;j ð5Þ
To identify the start of each shaft revolution, a triggersignal is used as shown in Fig. 7, where the start and endof each rotation is denoted with an ‘‘X”.
The triggering is based on an optoelectronic sensormeasuring the change from a dark area to a light area onthe shaft as it rotates. In this case, each shaft rotation takes1.6 s (37.5 rpm). The data for each of the shaft revolutions
Fig. 7. Trigger signals.
A. Simm et al. /Measurement 87 (2016) 104–116 109
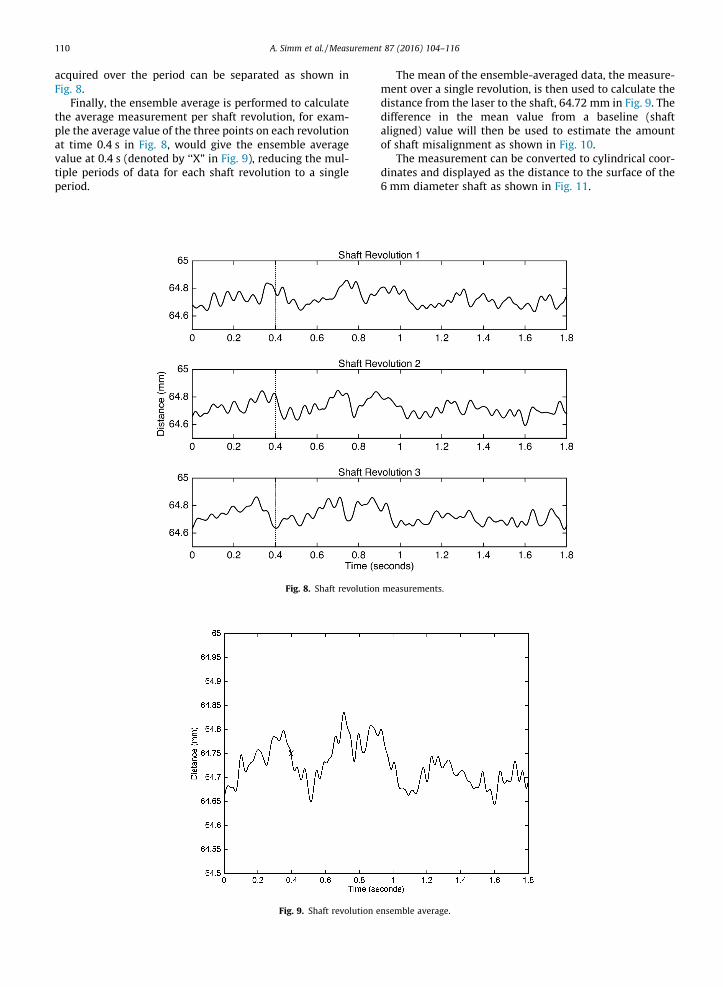
acquired over the period can be separated as shown inFig. 8.
Finally, the ensemble average is performed to calculatethe average measurement per shaft revolution, for exam-ple the average value of the three points on each revolutionat time 0.4 s in Fig. 8, would give the ensemble averagevalue at 0.4 s (denoted by ‘‘X” in Fig. 9), reducing the mul-tiple periods of data for each shaft revolution to a singleperiod.
The mean of the ensemble-averaged data, the measure-ment over a single revolution, is then used to calculate thedistance from the laser to the shaft, 64.72 mm in Fig. 9. Thedifference in the mean value from a baseline (shaftaligned) value will then be used to estimate the amountof shaft misalignment as shown in Fig. 10.
The measurement can be converted to cylindrical coor-dinates and displayed as the distance to the surface of the6 mm diameter shaft as shown in Fig. 11.
Fig. 8. Shaft revolution measurements.
Fig. 9. Shaft revolution ensemble average.
110 A. Simm et al. /Measurement 87 (2016) 104–116
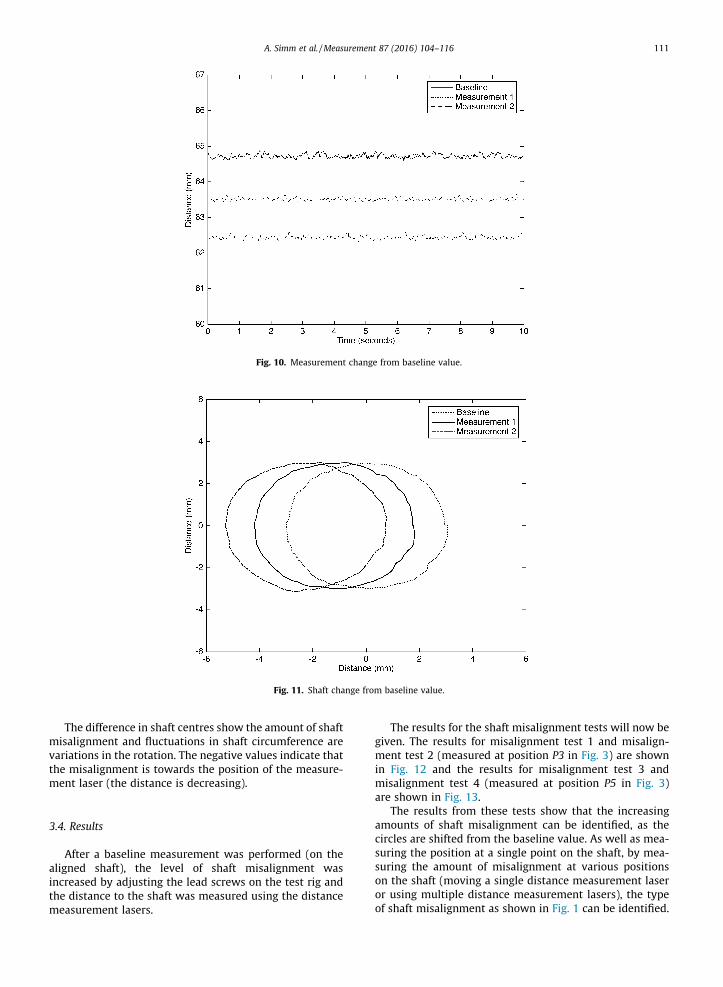
The difference in shaft centres show the amount of shaftmisalignment and fluctuations in shaft circumference arevariations in the rotation. The negative values indicate thatthe misalignment is towards the position of the measure-ment laser (the distance is decreasing).
3.4. Results
After a baseline measurement was performed (on thealigned shaft), the level of shaft misalignment wasincreased by adjusting the lead screws on the test rig andthe distance to the shaft was measured using the distancemeasurement lasers.
The results for the shaft misalignment tests will now begiven. The results for misalignment test 1 and misalign-ment test 2 (measured at position P3 in Fig. 3) are shownin Fig. 12 and the results for misalignment test 3 andmisalignment test 4 (measured at position P5 in Fig. 3)are shown in Fig. 13.
The results from these tests show that the increasingamounts of shaft misalignment can be identified, as thecircles are shifted from the baseline value. As well as mea-suring the position at a single point on the shaft, by mea-suring the amount of misalignment at various positionson the shaft (moving a single distance measurement laseror using multiple distance measurement lasers), the typeof shaft misalignment as shown in Fig. 1 can be identified.
Fig. 10. Measurement change from baseline value.
Fig. 11. Shaft change from baseline value.
A. Simm et al. /Measurement 87 (2016) 104–116 111
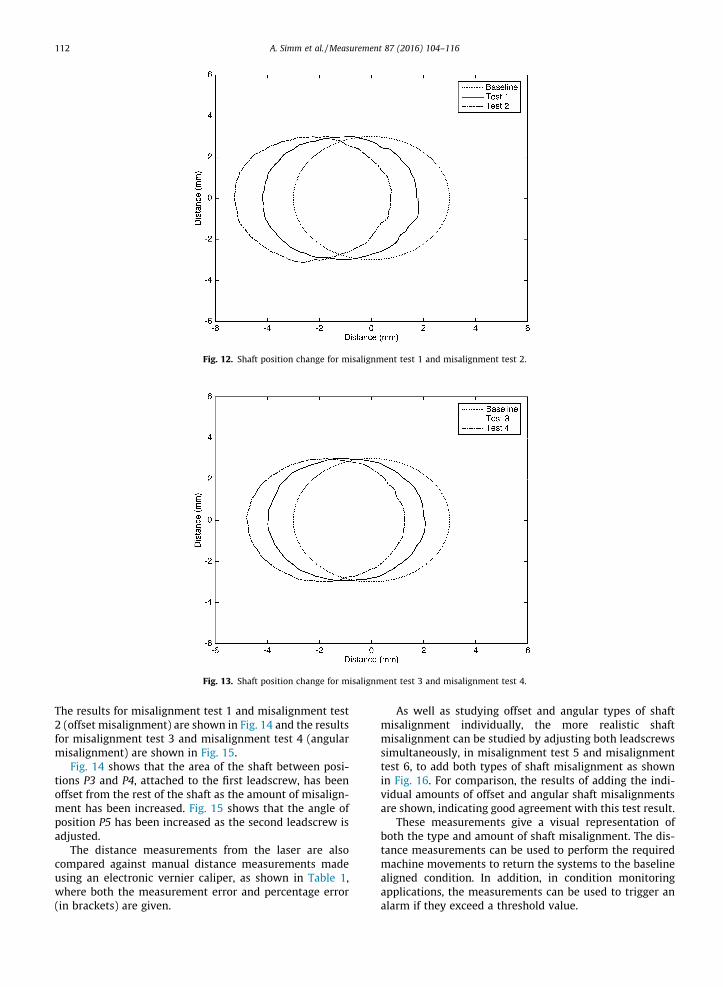
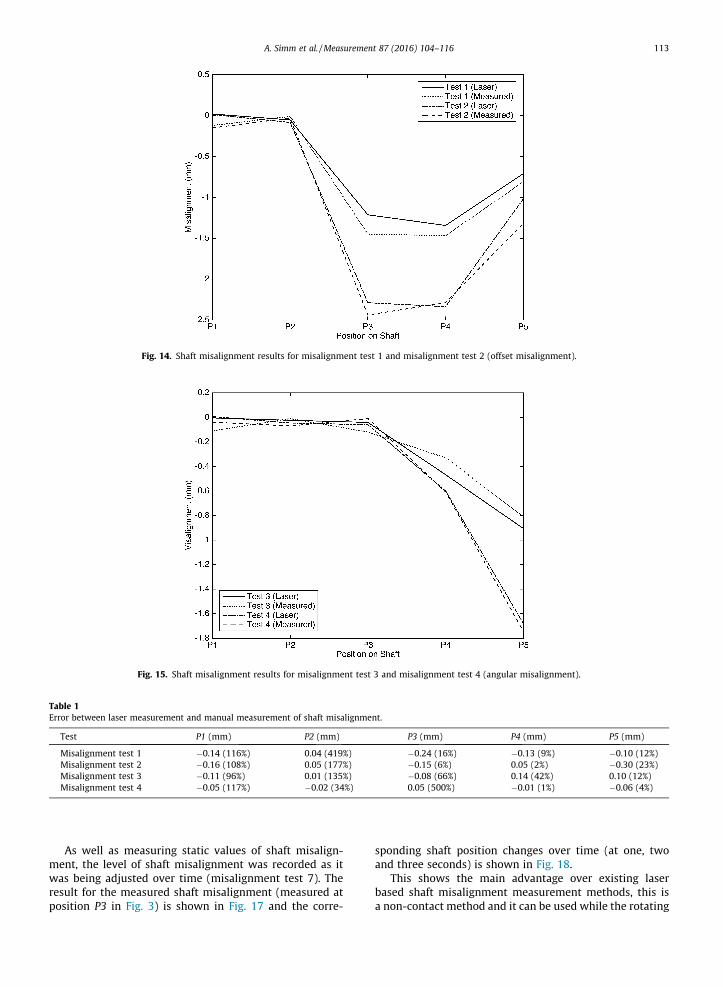
The results for misalignment test 1 and misalignment test2 (offset misalignment) are shown in Fig. 14 and the resultsfor misalignment test 3 and misalignment test 4 (angularmisalignment) are shown in Fig. 15.
Fig. 14 shows that the area of the shaft between posi-tions P3 and P4, attached to the first leadscrew, has beenoffset from the rest of the shaft as the amount of misalign-ment has been increased. Fig. 15 shows that the angle ofposition P5 has been increased as the second leadscrew isadjusted.
The distance measurements from the laser are alsocompared against manual distance measurements madeusing an electronic vernier caliper, as shown in Table 1,where both the measurement error and percentage error(in brackets) are given.
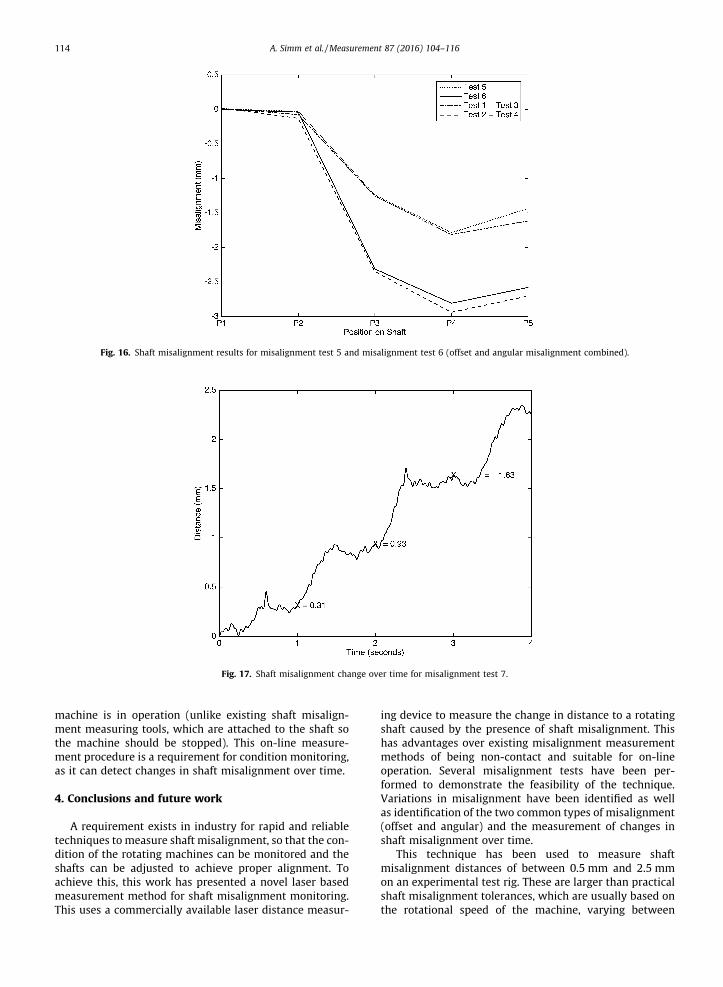
As well as studying offset and angular types of shaftmisalignment individually, the more realistic shaftmisalignment can be studied by adjusting both leadscrewssimultaneously, in misalignment test 5 and misalignmenttest 6, to add both types of shaft misalignment as shownin Fig. 16. For comparison, the results of adding the indi-vidual amounts of offset and angular shaft misalignmentsare shown, indicating good agreement with this test result.
These measurements give a visual representation ofboth the type and amount of shaft misalignment. The dis-tance measurements can be used to perform the requiredmachine movements to return the systems to the baselinealigned condition. In addition, in condition monitoringapplications, the measurements can be used to trigger analarm if they exceed a threshold value.
Fig. 12. Shaft position change for misalignment test 1 and misalignment test 2.
Fig. 13. Shaft position change for misalignment test 3 and misalignment test 4.
112 A. Simm et al. /Measurement 87 (2016) 104–116
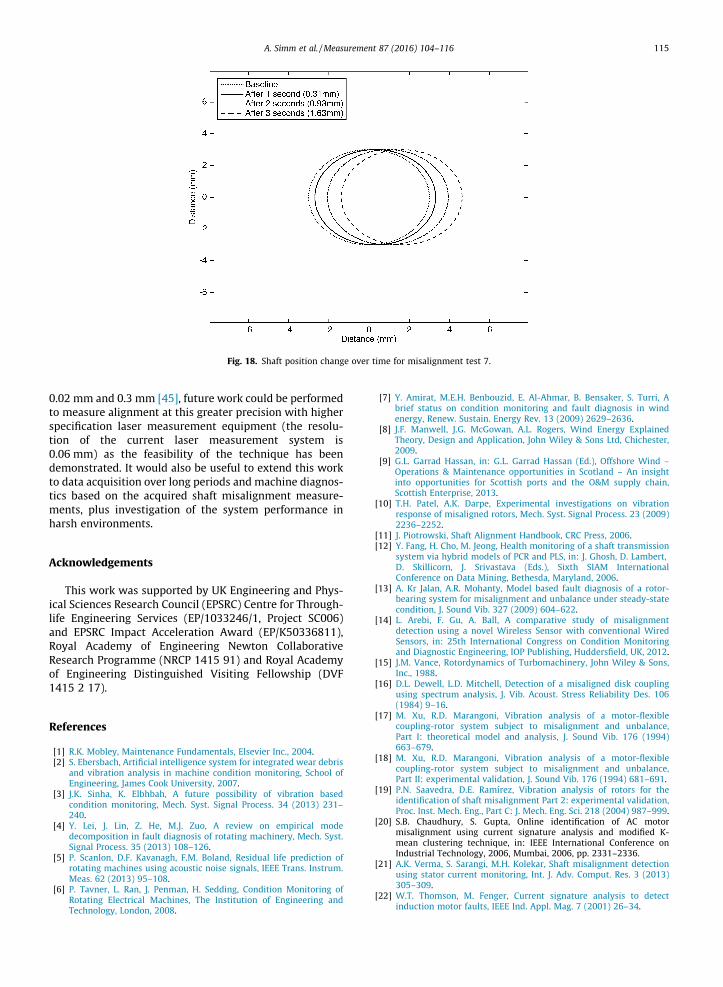
As well as measuring static values of shaft misalign-ment, the level of shaft misalignment was recorded as itwas being adjusted over time (misalignment test 7). Theresult for the measured shaft misalignment (measured atposition P3 in Fig. 3) is shown in Fig. 17 and the corre-
sponding shaft position changes over time (at one, twoand three seconds) is shown in Fig. 18.
This shows the main advantage over existing laserbased shaft misalignment measurement methods, this isa non-contact method and it can be used while the rotating
Fig. 14. Shaft misalignment results for misalignment test 1 and misalignment test 2 (offset misalignment).
Fig. 15. Shaft misalignment results for misalignment test 3 and misalignment test 4 (angular misalignment).
Table 1Error between laser measurement and manual measurement of shaft misalignment.
Test P1 (mm) P2 (mm) P3 (mm) P4 (mm) P5 (mm)
Misalignment test 1 �0.14 (116%) 0.04 (419%) �0.24 (16%) �0.13 (9%) �0.10 (12%)Misalignment test 2 �0.16 (108%) 0.05 (177%) �0.15 (6%) 0.05 (2%) �0.30 (23%)Misalignment test 3 �0.11 (96%) 0.01 (135%) �0.08 (66%) 0.14 (42%) 0.10 (12%)Misalignment test 4 �0.05 (117%) �0.02 (34%) 0.05 (500%) �0.01 (1%) �0.06 (4%)
A. Simm et al. /Measurement 87 (2016) 104–116 113
machine is in operation (unlike existing shaft misalign-ment measuring tools, which are attached to the shaft sothe machine should be stopped). This on-line measure-ment procedure is a requirement for condition monitoring,as it can detect changes in shaft misalignment over time.
4. Conclusions and future work
A requirement exists in industry for rapid and reliabletechniques to measure shaft misalignment, so that the con-dition of the rotating machines can be monitored and theshafts can be adjusted to achieve proper alignment. Toachieve this, this work has presented a novel laser basedmeasurement method for shaft misalignment monitoring.This uses a commercially available laser distance measur-
ing device to measure the change in distance to a rotatingshaft caused by the presence of shaft misalignment. Thishas advantages over existing misalignment measurementmethods of being non-contact and suitable for on-lineoperation. Several misalignment tests have been per-formed to demonstrate the feasibility of the technique.Variations in misalignment have been identified as wellas identification of the two common types of misalignment(offset and angular) and the measurement of changes inshaft misalignment over time.
This technique has been used to measure shaftmisalignment distances of between 0.5 mm and 2.5 mmon an experimental test rig. These are larger than practicalshaft misalignment tolerances, which are usually based onthe rotational speed of the machine, varying between
Fig. 16. Shaft misalignment results for misalignment test 5 and misalignment test 6 (offset and angular misalignment combined).
Fig. 17. Shaft misalignment change over time for misalignment test 7.
114 A. Simm et al. /Measurement 87 (2016) 104–116
0.02 mm and 0.3 mm [45], future work could be performedto measure alignment at this greater precision with higherspecification laser measurement equipment (the resolu-tion of the current laser measurement system is0.06 mm) as the feasibility of the technique has beendemonstrated. It would also be useful to extend this workto data acquisition over long periods and machine diagnos-tics based on the acquired shaft misalignment measure-ments, plus investigation of the system performance inharsh environments.
Acknowledgements
This work was supported by UK Engineering and Phys-ical Sciences Research Council (EPSRC) Centre for Through-life Engineering Services (EP/1033246/1, Project SC006)and EPSRC Impact Acceleration Award (EP/K50336811),Royal Academy of Engineering Newton CollaborativeResearch Programme (NRCP 1415 91) and Royal Academyof Engineering Distinguished Visiting Fellowship (DVF1415 2 17).
References
[1] R.K. Mobley, Maintenance Fundamentals, Elsevier Inc., 2004.[2] S. Ebersbach, Artificial intelligence system for integrated wear debris
and vibration analysis in machine condition monitoring, School ofEngineering, James Cook University, 2007.
[3] J.K. Sinha, K. Elbhbah, A future possibility of vibration basedcondition monitoring, Mech. Syst. Signal Process. 34 (2013) 231–240.
[4] Y. Lei, J. Lin, Z. He, M.J. Zuo, A review on empirical modedecomposition in fault diagnosis of rotating machinery, Mech. Syst.Signal Process. 35 (2013) 108–126.
[5] P. Scanlon, D.F. Kavanagh, F.M. Boland, Residual life prediction ofrotating machines using acoustic noise signals, IEEE Trans. Instrum.Meas. 62 (2013) 95–108.
[6] P. Tavner, L. Ran, J. Penman, H. Sedding, Condition Monitoring ofRotating Electrical Machines, The Institution of Engineering andTechnology, London, 2008.
[7] Y. Amirat, M.E.H. Benbouzid, E. Al-Ahmar, B. Bensaker, S. Turri, Abrief status on condition monitoring and fault diagnosis in windenergy, Renew. Sustain. Energy Rev. 13 (2009) 2629–2636.
[8] J.F. Manwell, J.G. McGowan, A.L. Rogers, Wind Energy ExplainedTheory, Design and Application, John Wiley & Sons Ltd, Chichester,2009.
[9] G.L. Garrad Hassan, in: G.L. Garrad Hassan (Ed.), Offshore Wind –Operations & Maintenance opportunities in Scotland – An insightinto opportunities for Scottish ports and the O&M supply chain,Scottish Enterprise, 2013.
[10] T.H. Patel, A.K. Darpe, Experimental investigations on vibrationresponse of misaligned rotors, Mech. Syst. Signal Process. 23 (2009)2236–2252.
[11] J. Piotrowski, Shaft Alignment Handbook, CRC Press, 2006.[12] Y. Fang, H. Cho, M. Jeong, Health monitoring of a shaft transmission
system via hybrid models of PCR and PLS, in: J. Ghosh, D. Lambert,D. Skillicorn, J. Srivastava (Eds.), Sixth SIAM InternationalConference on Data Mining, Bethesda, Maryland, 2006.
[13] A. Kr Jalan, A.R. Mohanty, Model based fault diagnosis of a rotor-bearing system for misalignment and unbalance under steady-statecondition, J. Sound Vib. 327 (2009) 604–622.
[14] L. Arebi, F. Gu, A. Ball, A comparative study of misalignmentdetection using a novel Wireless Sensor with conventional WiredSensors, in: 25th International Congress on Condition Monitoringand Diagnostic Engineering, IOP Publishing, Huddersfield, UK, 2012.
[15] J.M. Vance, Rotordynamics of Turbomachinery, John Wiley & Sons,Inc., 1988.
[16] D.L. Dewell, L.D. Mitchell, Detection of a misaligned disk couplingusing spectrum analysis, J. Vib. Acoust. Stress Reliability Des. 106(1984) 9–16.
[17] M. Xu, R.D. Marangoni, Vibration analysis of a motor-flexiblecoupling-rotor system subject to misalignment and unbalance,Part I: theoretical model and analysis, J. Sound Vib. 176 (1994)663–679.
[18] M. Xu, R.D. Marangoni, Vibration analysis of a motor-flexiblecoupling-rotor system subject to misalignment and unbalance,Part II: experimental validation, J. Sound Vib. 176 (1994) 681–691.
[19] P.N. Saavedra, D.E. Ramírez, Vibration analysis of rotors for theidentification of shaft misalignment Part 2: experimental validation,Proc. Inst. Mech. Eng., Part C: J. Mech. Eng. Sci. 218 (2004) 987–999.
[20] S.B. Chaudhury, S. Gupta, Online identification of AC motormisalignment using current signature analysis and modified K-mean clustering technique, in: IEEE International Conference onIndustrial Technology, 2006, Mumbai, 2006, pp. 2331–2336.
[21] A.K. Verma, S. Sarangi, M.H. Kolekar, Shaft misalignment detectionusing stator current monitoring, Int. J. Adv. Comput. Res. 3 (2013)305–309.
[22] W.T. Thomson, M. Fenger, Current signature analysis to detectinduction motor faults, IEEE Ind. Appl. Mag. 7 (2001) 26–34.
Fig. 18. Shaft position change over time for misalignment test 7.
A. Simm et al. /Measurement 87 (2016) 104–116 115
[23] J.M. Bossio, G.R. Bossio, C.H. De Angelo, Angular misalignment ininduction motors with flexible coupling, in: 35th Annual Conferenceof IEEE Industrial Electronics, 2009, Porto, 2009, pp. 1033–1038.
[24] G.R. Rameshkumar, B.V.A. Rao, K.P. Ramachandran, Coast down timeanalysis to analyze the effect of misalignment in rotating machinery,Int. J. Eng. Adv. Technol. 1 (2012) 149–156.
[25] S.M. Kim, J.H. Suh, J.S. Im, S.B. Kim, S.B. Kim, A smart memory type ofdata acquisition system for shaft misalignment maintenance, J.Mech. Sci. Technol. 19 (2005) 15–27.
[26] M.A. Hotait, D. Talbot, A. Kahraman, An investigation of the influenceof shaft misalignment on bending stresses of helical gears with leadcrown, Gear Technol. (2008) 54–62.
[27] A.G. Fulzele, V.G. Arajpure, P.P. Holay, N.M. Patil, Conditionmonitoring of shaft of single-phase induction motor using opticalsensor, Mech. Syst. Signal Process. 29 (2012) 428–435.
[28] A.S. Sekhar, B.S. Prabhu, Effects of coupling misalignment onvibrations of rotating machinery, J. Sound Vib. 185 (1995) 655–671.
[29] H.-W. Cho, M.K. Jeong, Enhanced prediction of misalignmentconditions from spectral data using feature selection and filtering,Expert Syst. Appl. 35 (2008) 451–458.
[30] W. Yang, P.J. Tavner, Empirical mode decomposition, an adaptiveapproach for interpreting shaft vibratory signals of large rotatingmachinery, J. Sound Vib. 321 (2009) 1144–1170.
[31] J. Giannone, Laser-optical shaft alignment cuts energy costs, WorldPumps 1995 (1995) 22–24.
[32] V. Hariharan, P.S.S. Srinivasan, Vibration analysis of misalignedshaft-ball bearing system, Indian J. Sci. Technol. 2 (2009) 45–50.
[33] R.B. McMillan, Rotating Machinery: Practical Solutions to Unbalanceand Misalignment, The Fairmont Press, Inc., 2004.
[34] M.M. Hodowanec, Effects of coupling installation on motorperformance, IEEE Ind. Appl. Mag. (1997) 70–77.
[35] Huco Engineering Industries Ltd, Flex-P Double Loop Couplings withStainless Steel Hubs.
[36] M.-A. Beeck, W. Hentschel, Laser metrology – a diagnostic tool inautomotive development processes, Opt. Lasers Eng. 34 (2000) 101–120.
[37] I. Besic, N. van Gestel, J.-P. Kruth, P. Bleys, J. Hodolic, Accuracyimprovement of laser line scanning for feature measurements onCMM, Opt. Lasers Eng. 49 (2011) 1274–1280.
[38] S.H. Wang, C.J. Jin, C.J. Tay, C. Quan, H.M. Shang, Design of an opticalprobe for testing surface roughness and micro-displacement, Precis.Eng. 25 (2001) 258–265.
[39] P. Cheng, M.S.M. Mustafa, B. Oelmann, Contactless rotor RPMmeasurement using laser mouse sensors, IEEE Trans. Instrum.Meas. 61 (2012) 740–748.
[40] A.K.S. Jardine, D. Lin, D. Banjevic, A review on machinery diagnosticsand prognostics implementing condition-based maintenance, Mech.Syst. Signal Process. 20 (2006) 1483–1510.
[41] National Instruments Corporation, TSA Moving Average VI, LabVIEWAdvanced Signal Processing Toolkit, 2015.
[42] R. Henderson, Note on graduation by adjusted average, Trans.Actuarial Soc. Am. 17 (1916) 43–48.
[43] S. Boslaugh, P.A. Watters, Statistics in a Nutshell, O’Reilly Media, Inc.,Sebastopol, CA, 2008.
[44] R.M. Chervin, Estimates of first- and second-moment climatestatistics in GCM simulated climate ensembles, J. Atmos. Sci. 37(1980) 1889–1902.
[45] Pruftechnik Ltd, A Practical Guide to Shaft Misalignment,Pruftechnik, 2002.
116 A. Simm et al. /Measurement 87 (2016) 104–116