16904907.pdf - SRUC, Scotland's Rural College
13
Scotland's Rural College Performance evaluation of highly admixed Tanzanian smallholder dairy cattle using SNP derived kinship matrix Mujibi, Fidalis DN; Rao, James; Agaba, Morris; Nyambo, Devotha; Cheruiyot, Evans Kiptoo; Kihara, Absolomon; Zgang, Yi; Mrode, RA Published in: Frontiers in Genetics DOI: 10.3389/fgene.2019.00375 Print publication: 26/04/2019 Document Version Publisher's PDF, also known as Version of record Link to publication Citation for pulished version (APA): Mujibi, F. DN., Rao, J., Agaba, M., Nyambo, D., Cheruiyot, E. K., Kihara, A., Zgang, Y., & Mrode, RA. (2019). Performance evaluation of highly admixed Tanzanian smallholder dairy cattle using SNP derived kinship matrix. Frontiers in Genetics, 10, [375]. https://doi.org/10.3389/fgene.2019.00375 General rights Copyright and moral rights for the publications made accessible in the public portal are retained by the authors and/or other copyright owners and it is a condition of accessing publications that users recognise and abide by the legal requirements associated with these rights. • Users may download and print one copy of any publication from the public portal for the purpose of private study or research. • You may not further distribute the material or use it for any profit-making activity or commercial gain • You may freely distribute the URL identifying the publication in the public portal ? Take down policy If you believe that this document breaches copyright please contact us providing details, and we will remove access to the work immediately and investigate your claim. Download date: 25. May. 2022
-
Upload
khangminh22 -
Category
Documents
-
view
1 -
download
0
Transcript of 16904907.pdf - SRUC, Scotland's Rural College
Scotland's Rural College
Performance evaluation of highly admixed Tanzanian smallholder dairy cattle usingSNP derived kinship matrixMujibi, Fidalis DN; Rao, James; Agaba, Morris; Nyambo, Devotha; Cheruiyot, Evans Kiptoo;Kihara, Absolomon; Zgang, Yi; Mrode, RAPublished in:Frontiers in Genetics
DOI:10.3389/fgene.2019.00375
Print publication: 26/04/2019
Document VersionPublisher's PDF, also known as Version of record
Link to publication
Citation for pulished version (APA):Mujibi, F. DN., Rao, J., Agaba, M., Nyambo, D., Cheruiyot, E. K., Kihara, A., Zgang, Y., & Mrode, RA. (2019).Performance evaluation of highly admixed Tanzanian smallholder dairy cattle using SNP derived kinship matrix.Frontiers in Genetics, 10, [375]. https://doi.org/10.3389/fgene.2019.00375
General rightsCopyright and moral rights for the publications made accessible in the public portal are retained by the authors and/or other copyright ownersand it is a condition of accessing publications that users recognise and abide by the legal requirements associated with these rights.
• Users may download and print one copy of any publication from the public portal for the purpose of private study or research. • You may not further distribute the material or use it for any profit-making activity or commercial gain • You may freely distribute the URL identifying the publication in the public portal ?
Take down policyIf you believe that this document breaches copyright please contact us providing details, and we will remove access to the work immediatelyand investigate your claim.
Download date: 25. May. 2022
fgene-10-00375 April 25, 2019 Time: 16:15 # 1
ORIGINAL RESEARCHpublished: 26 April 2019
doi: 10.3389/fgene.2019.00375
Edited by:Eveline M. Ibeagha-Awemu,
Agriculture and Agri-Food Canada(AAFC), Canada
Reviewed by:Michael Schutz,
Purdue University, United StatesSunday O. Peters,
Berry College, United States
*Correspondence:Fidalis D. N. Mujibi
Specialty section:This article was submitted to
Livestock Genomics,a section of the journal
Frontiers in Genetics
Received: 25 April 2018Accepted: 09 April 2019Published: 26 April 2019
Citation:Mujibi FDN, Rao J, Agaba M,
Nyambo D, Cheruiyot EK, Kihara A,Zhang Y and Mrode R (2019)
Performance Evaluation of HighlyAdmixed Tanzanian Smallholder Dairy
Cattle Using SNP Derived KinshipMatrix. Front. Genet. 10:375.
doi: 10.3389/fgene.2019.00375
Performance Evaluation of HighlyAdmixed Tanzanian SmallholderDairy Cattle Using SNP DerivedKinship MatrixFidalis D. N. Mujibi1,2* , James Rao3, Morris Agaba2, Devotha Nyambo2,Evans K. Cheruiyot1,4, Absolomon Kihara3,5, Yi Zhang6 and Raphael Mrode3,7
1 USOMI Limited, Nairobi, Kenya, 2 Nelson Mandela African Institution of Science and Technology, Arusha, Tanzania,3 International Livestock Research Institute, Nairobi, Kenya, 4 Department of Animal Production, College of Agricultureand Veterinary Sciences, University of Nairobi, Nairobi, Kenya, 5 Badili Innovations Limited, Nairobi, Kenya, 6 Collegeof Animal Science and Technology, China Agricultural University, Beijing, China, 7 Scotland’s Rural College, Edinburgh,United Kingdom
The main purpose of this study was to understand the type of dairy cattle that canbe optimally used by smallholder farmers in various production environments suchthat they will maximize their yields without increasing the level of inputs. Anecdotalevidence and previous research suggests that the optimal level of taurine inheritancein crossbred animals lies between 50 and 75% when considering total productivity intropical management clusters. We set out to assess the relationship between breedcomposition and productivity for various smallholder production systems in Tanzania.We surveyed 654 smallholder dairy households over a 1-year period and groupedthem into production clusters. Based on supplementary feeding, milk productivity andsale as well as household wealth status four clusters were described: low-feed–low-output subsistence, medium-feed–low-output subsistence, maize germ intensive semi-commercial and feed intensive commercial management clusters. About 839 crossbredcows were genotyped at approximately 150,000 single nucleotide polymorphism (SNP)loci and their breed composition determined. Percentage dairyness (proportion ofgenes from international dairy breeds) was estimated through admixture analysis withHolstein, Friesian, Norwegian Red, Jersey, Guernsey, N’Dama, Gir, and Zebu asreferences. Four breed types were defined as RED–GUE (Norwegian Red/Friesian–Guernsey; Norwegian Red/Friesian–Jersey), RED–HOL (Norwegian Red/Friesian–Holstein), RED–Zebu (Norwegian Red/Friesian–Zebu), Zebu–RED (Zebu–NorwegianRed/Friesian) based on the combination of breeds that make up the top 76% breedcomposition. A fixed regression model using a genomic kinship matrix was used toanalyze milk yield records. The fitted model accounted for year-month-test-date, parity,age, breed type and the production clusters as fixed effects in the model in additionto random effects of animal and permanent environment effect. Results suggested thatRED–Zebu breed type with dairyness between 75 and 85% is the most appropriatefor a majority of smallholder management clusters. Additionally, for farmers in the feed
Frontiers in Genetics | www.frontiersin.org 1 April 2019 | Volume 10 | Article 375

fgene-10-00375 April 25, 2019 Time: 16:15 # 2
Mujibi et al. Performance Evaluation of Admixed Cattle
intensive management group, animals with a Holstein genetic background with at least75% dairy composition were the best performing. These results indicate that matchingbreed type to production management group is central to maximizing productivity insmallholder systems. The findings from this study can serve as a basis to inform thedevelopment of the dairy sector in Tanzania and beyond.
Keywords: SNP, dairy, performance, cluster, smallholder, admixture, EBV, BLUP
INTRODUCTION
The use of crossbred animals continues to be the basisfor most dairy enterprises in Eastern Africa. However, theindiscriminate crossbreeding practiced in these systems produceshighly admixed animals with large variability in productivity(Ojango et al., 2014). Additionally, since the breed compositionof the animals is unknown, there is often a mismatch betweenproduction environment and animal breed type, which oftenreduces productivity. This situation cannot sustain the growthand expansion of the local dairy sector in many of thecountries in the region. With the increased demand for livestockproducts and the need to bridge productivity gaps in developingcountries, poorly planned crossbreeding of locally adaptedbreeds with imported exotic breeds have been widely adoptedyielding animals with unknown breed composition (Weerasingheet al., 2013). Suitability of these crosses to various productionenvironments is largely unknown.
Anecdotal evidence and previous research suggests that theoptimal level of taurine inheritance in crossbred animals liesbetween 50 and 75% when considering total productivity interms of fertility, survival, growth rate and milk yield (Beeet al., 2006). However, the mismatch between genotype andenvironment as a result of unplanned crossbreeding contributesto depress performance mimicking indigenous cattle production(∼1.6 l/day; Mwacharo and Rege, 2002). Even though it is clearthat increasing the exotic percentage of cattle results in moremilk, the cumulative benefits relative to farmer socio-economicstatus, input level and production environment are not clear.This study sought to assess the incremental benefit from useof crossbred cattle, given the two sites with varying marketorientations and markedly different improved cattle populations.
The study was undertaken in Tanzania, being an emergingdairy region where significant crossbreeding efforts are takingplace. The country has a small population of improved dairyanimals, (about 800,000) such that the demand for milk currentlyoutstrips available supply. Most dairies and milk processingfacilities are running below capacity. According to FAO dataseries, the quantity of dairy output (milk and butter) in Tanzaniahas grown by 4.4% per annum, barely keeping up with thepopulation growth rate of about 4.5% since 1980. This has ledto stagnation in per capita milk consumption at 39 kg/year(National Bureau of Statistics [NBS], 2007). The supply scenariopoints to low productivity with a modest annual growth in milkproductivity of 1.1% from 160 kg in 1965 to 239 kg/cow in2010. In view of the above, the government of Tanzania hasembarked on developing a national dairy strategic plan with a
view of increasing milk production from the current 1.6 billionliters of milk to 8 billion liters. It is estimated that three millionhead of improved cattle will be required to achieve this targetin 12 years, starting from 2014. This will be a tall order giventhe modest increases of about 400,000 head of improved cattlebetween 1984 and 2005 (Swai et al., 1992; Kurwijila and Bennett,2011). Such massive increase in the herd can only be achievedby increasing crossbreeding, especially through innovative useof estrus synchronization and artificial insemination, followedby improved calf management to enable rapid multiplicationand increased survival of the desired cattle. Understandingthe implications of breed by environment interactions, as thisproject seeks to do, will modulate the speed at which themilk production target is achieved. Smallholder farmers are thebackbone of the dairy sector in Tanzania. It is generally agreedthat a successful dairy operation should utilize improved breedtypes given the low productivity of local zebu cattle. This desirefor increased production drives farmers into crossbreeding, thegeneral sense being that a purebred exotic animal isn’t suitableeither for a majority of smallholder farmers. However, there islittle information or evidence to support what should be theideal grade cattle for various smallholder production situations(Msanga, 1994). Because there are no planned programs toaid farmers in this grading up process, the resulting animalsconstitute a mixture of breeds whose composition is unknown;animals that require much more intensive management are asa consequence managed similarly with animals of low geneticpotential, which naturally make do with minimum care. Sincenot all breed types are well adapted to extant productionenvironments, milk yields continue to be low. Knowledge ofbreed composition is therefore critical in matching breeds to theproduction environment as well as predicting genetic effects ofheterosis (VanRaden and Sanders, 2003).
Pedigree data has been the main source of informationfor determining breed composition. However, the availabilityof dense genome-wide single nucleotide polymorphism (SNP)arrays has enabled accurate establishment of kinship andgenetic composition of animals in a herd and in their nativeenvironments (in situ). The use of genetic markers, and especiallySNPs in determining breed composition of cattle has attractedgreat interest in recent years especially in developing countrieswhich are mostly characterized by lack of or incomplete pedigreerecords (Rege et al., 2001; Gorbach et al., 2010). Previousstudies have demonstrated the utility of SNP markers inproviding highly reliable estimates of kinship and relationshipsbetween animals (Strucken et al., 2017). Additionally, applicationof SNP markers in deciphering the breed composition of
Frontiers in Genetics | www.frontiersin.org 2 April 2019 | Volume 10 | Article 375
fgene-10-00375 April 25, 2019 Time: 16:15 # 3
Mujibi et al. Performance Evaluation of Admixed Cattle
crossbred animals is increasingly gaining popularity. Knowledgeon breed composition will be important for farmers who canthen start planned crossbreeding since they will know thelevel of exotic ‘blood’ in their animals. By identifying theexact breed composition of animals and associating this withindividual animal productivity, it is envisaged that appropriaterecommendations can be made for farmers and others intendingto maximize productivity of their enterprises.
The purpose of this study was to determine the differentialperformance of various dairy genotypes and grade levels undervarying resource bases and management clusters in two regionsof Tanzania. The results from this study can serve as a basisto inform the development of the dairy sector in Tanzania andEastern Africa in general.
MATERIALS AND METHODS
Ethics StatementThis study was performed following the International LivestockResearch Institute (ILRI) Institutional Animal Care and UseCommittee (IACUC) guidelines, with approval reference number2014.35. Animals were handled by experienced animal healthprofessionals to minimize discomfort and injury.
Sampling Site Selection andInclusion CriteriaData used in this study was obtained from a baseline surveyof smallholder dairy farmers in the Northern and Southernhighlands of Tanzania. The project covered two sites namely:Rungwe district in Southern highlands and Lushoto district inthe Northern highlands that were selected through a stakeholderengagement process. Within each of these sites, wards wereselected based on the dairy cattle density data obtained fromthe regional government offices. Villages were then randomlyselected within each selected ward (12 wards in Lushoto and16 wards in Rungwe). From each of the villages, households werepurposively recruited depending on whether they met certaininclusion criteria.
Inclusion Criteria and Sample SizeTo qualify for inclusion in the study, target dairy farmers had tobe smallholders rearing between 2 and 10 dairy cows. Qualifyinghouseholds had to have at least two cows, one of which hadto be lactating having calved recently. Additionally, based onfarmer knowledge, unrelated animals were recruited to maximizeobservable breed diversity within the household. Additionalcriteria for target animals required selected cows to be eitherpregnant heifers, cows in the third trimester of pregnancy or bea cow that had calved within 3 months of the recruitment date.This increased the chances that recruited cows would be in milkwithin a significant portion of the study period to allow collectionof data on milk yield, calving and reproductive performance. Thisselection process yielded 654 households which were interviewedby way of a baseline survey regarding general farm and householdsocioeconomic conditions, animal husbandry and management
practices as well as breeding practices among others. In total,1,255 animals were recruited for the study.
Production Cluster CharacterizationIn order to classify and characterize smallholder dairy farmersacross the two project sites, we undertook cluster analysis.Farms were grouped based on common characteristics usingagglomerative hierarchical clustering. The method groups farmssuch that individual farms in the same clusters are more alike thanthey are to farms in other clusters. Cluster analysis was precededby an exploratory factor analysis (EFA) of all the variables thatrepresented the various themes in the baseline survey. Variablesrelated to livestock feeding and management as well as wealthindicators were considered as relevant variables for inclusion incluster analysis. We also included variables linked to householdendowment with livestock, particularly ownership of lactatingcows. Sampling adequacy and data suitability for clustering wasmeasured using the Kaiser–Meyer–Olkin (KMO) statistic. Factorextraction was achieved through principal axis factoring (PAF),to characterize interrelationships between respective variablesrelated to smallholder dairy farming systems. Parallel analysis wasused to determine the exact number of factors to be retained.Varimax rotation with Kaiser normalization was used to increasethe interpretability of the retained factors. Extracted factorswere then subjected to an agglomerative hierarchical clusteringprocedure using the squared Euclidean distance criterion inconjunction with Ward’s linkage method. The Duda-Hart indexand its associated pseudo-T-squared as well as inspection ofthe clustering dendrogram were used to decide on the optimalnumber of clusters to retain. Clustering was done using SPSSsoftware (SPSS Inc., Chicago, IL, United States).
Blood SamplingQualified veterinary and animal health personnel undertookblood sampling through jugular venipuncture using approvedprocedures. Hair samples were collected from the tail switch ofthe animals. Samples were collected from all animals in the study.
Genotyping and Quality ControlAbout 839 animals (490 from Rungwe and 349 from Lushoto)were genotyped using the Geneseek Genomic Profiler (GGP)High Density (HD) SNP array consisting of 150,000 SNPs, whilegenotypes for the reference breeds were derived from samplesets genotyped using the Illumina HD Bovine Chip (777K SNPs).Since pedigree records were not available for these animals, andin order to aid in breed composition determination, a panel ofreference genotypes consisting of Friesian (28 animals), Holstein(63), Norwegian Red (17), Jersey (36), and Guernsey (21),N’Dama (24), East African Zebu (50), and Gir (30) were includedin the analysis. A total of 134,295 SNPs were common acrossstudy and reference datasets. Data quality control was undertakenusing PLINK v 1.9 (Purcell et al., 2007) and included removalof SNPs with less than 90% call rate, less than 5% minor allelefrequency (MAF) and samples with more than 10% missinggenotypes. A total of 4,324 SNPs were removed, leaving 129,971SNPs available for analysis. Similarly, eight samples did not meetthe above quality thresholds and were removed from the final
Frontiers in Genetics | www.frontiersin.org 3 April 2019 | Volume 10 | Article 375

fgene-10-00375 April 25, 2019 Time: 16:15 # 4
Mujibi et al. Performance Evaluation of Admixed Cattle
dataset. The average genotyping rate in the remaining sampleswas 0.9964. For the purposes of developing a kinship matrix,the SNP data were further validated, excluding SNPs with GCscore of less than 60% and those in the sex and mitochondrialchromosomes. Computation of the genomic kinship matrix(G matrix) was based on 112,856 SNPs after validation usingmethod one of VanRaden (2008).
Admixture Analysis and DairynessBreed composition of individual animals was estimated usingthe unsupervised model-based clustering method implementedby the program ADMIXTURE v. 1.3.0 (Alexander et al., 2009).The number of distinct breeds was set to a minimum of 2 andmaximum of 9 to reflect the basic cross (indicine and taurinecross) and total number of the populations in the analysis,respectively, given the eight reference breeds. Ten-fold cross-validation (CV = 10) was used, with the error profile subsequentlyused to determine the most appropriate number of distinctclusters (K), as described by Alexander et al. (2009).
Daily Milk Yield DataA total of 539 cows had records on milk yield. About 300 animalseither were sold, had dried up or were from farmers who didnot collect milk records at all. The data was obtained fromindividual animals over a period of 7 months. Each animal wasvisited approximately every 1.5 months for a test day record to beobtained. The analysis of daily milk yield data was undertakenusing about 1328 test day records from 539 cows. Test daydata ranged between one to six records per animal, with amajority of animals (80%) having less than four records (Table 1).A fixed regression animal model was fitted as shown below(Brown et al., 2016):
ytij = Fixedi +
3∑k=0
φtjkmβkm + uj + pej + etij
where ytij is the test day record of cow j made on day t;Fixedi are the ith fixed effects consisting, year-month of test-day, lactation number (eight levels), and age at calving asa covariate nested within the lactation number, βkm are kth
fixed regressions coefficients of breed type nested within a herdmanagement group; uj and pej are vectors of animal additivegenetic and permanent environmental effects, respectively, foranimal j; φtjk is the vector of the kth Legendre polynomials
TABLE 1 | Distribution of the number of test records available for analysis.
Number of Number Proportion of
test records of cows population
1 118 21.89
2 171 31.73
3 142 26.35
4 99 18.37
5 8 1.48
6 1 0.19
of order three, for the test day record of cow j made onday t and etij is the random residual. The relationship amonganimals was taken into account in the analysis by fitting a Gmatrix, thus the variance of u was assumed to be equal tovar(u) = Gσ2
u. The analysis was carried out using ASREML(Gilmour et al., 2009).
Breed Type Suitability AssessmentThe suitability of breed types for each of the four managementclusters characterized was first determined by computing themean of the raw daily milk yield for each breed type ineach management group as well as mean milk productioncorrected for the fixed effects affecting milk yield fitted in themodel. Additionally, the ranking of animals based on theirEBVs and breed composition for each management systemwas also used to determine the best breed type in eachmanagement system.
RESULTS
Cluster Analysis and Farm TypologiesSampling adequacy analysis yielded a KMO statistic valueof 0.661 indicating that the data was suitable for EFA(Kaiser, 1970). After eliminating variables exhibiting lowvariation, 11 variables were entered into EFA. Factor analysisresulted in five factors, accounting for 66% of the totalvariability being retained (Table 2), while cluster analysisyielded a 4-cluster solution (Table 3). Table 3 indicatesthat from the p-value of the F-test, the clusters differed
TABLE 2 | Varimax-rotated factor matrix of determinants of smallholder dairyfarming systems.
Extracted factors
1 2 3 4 5
Total off-farm income 0.036 0.085 −0.037 0.358 0.086
Total land area owned 0.066 0.027 0.012 0.344 −0.075
Milk productivity per cow/year 0.455 0.552 −0.066 0.089 −0.031
Proportion of milk output sold 0.002 0.513 0.038 0.077 0.084
Number of deworming exerciseper year
−0.125 −0.014 0.280 0.174 0.206
Number of tick control exercisesper year
0.350 0.074 0.070 0.075 0.053
Proportion of months in a year whenNapier grass was purchased
0.066 0.040 0.016 −0.011 0.284
Proportion of months in a year whenoil seed by-product was used
0.656 0.121 −0.160 0.009 0.073
Proportion of months in a year whenbran was used
0.633 0.197 −0.435 0.131 0.041
Proportion of months in a year whenmaize germ was used
−0.014 0.031 0.423 −0.050 −0.001
Number of lactating cows owned 0.300 0.513 −0.004 0.070 0.025
Extraction method: principal axis factoring. Rotation method: varimax withKaiser normalization. Bolded values are the highest for each extracted factor andrepresent the determinants with the highest loading.
Frontiers in Genetics | www.frontiersin.org 4 April 2019 | Volume 10 | Article 375
fgene-10-00375 April 25, 2019 Time: 16:15 # 5
Mujibi et al. Performance Evaluation of Admixed Cattle
significantly with respect to the weights assigned for theextracted factors.
Cluster one contained about 27% of households consistingof “medium-feed-low-output subsistence oriented dairy farmers,”characterized by low productivity and sale of milk as well aslow use of maize germ supplement. Majority of householdswere grouped in cluster two, which had 33% of householdsthat were “feed intensive commercially oriented dairy farmers.”Households in this cluster used a diversity of supplements suchas maize bran and oil seed by-products. These households werealso characterized by higher milk sales. Cluster three, whichaccounted for about 24% of the sampled households consistedof “low-feed low-output subsistence oriented dairy farmers”being characterized by low diversity and intensity of supplementuse. Cluster four accounted for 17% of the households whichexhibited higher intensity in the use of maize germ butless diversity and intensity of usage for other supplements.These “Maize germ intensive semi-commercial dairy farmers”also had moderate milk productivity and sale.
Households from Rungwe district in the Southern highlandswere grouped in clusters one and two, while households fromLushoto district in the Northern highlands were grouped inclusters three and four. The more intensive and commerciallyoriented farmers in Rungwe also recorded higher overall milkproduction as did the more intensive and semi-commercial dairyfarmers in Lushoto. The disparate classification of householdsfor the two sites in distinct clusters was largely related to thefeeding plane and commercial orientation differences betweenthese two sites.
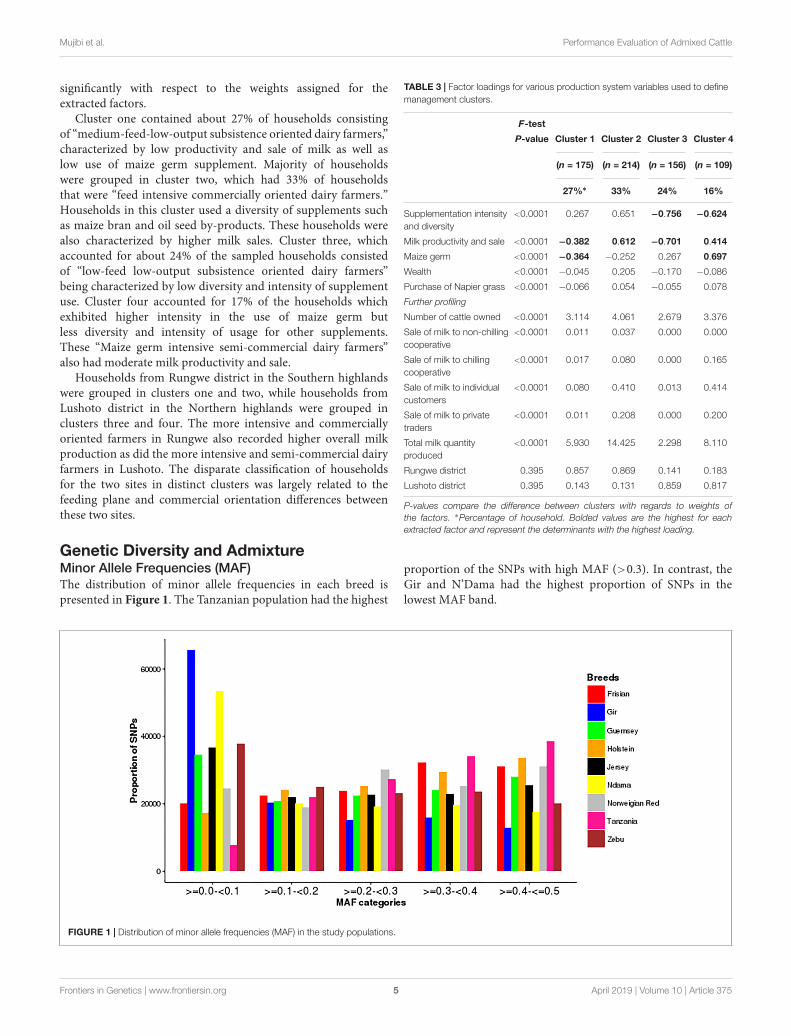
Genetic Diversity and AdmixtureMinor Allele Frequencies (MAF)The distribution of minor allele frequencies in each breed ispresented in Figure 1. The Tanzanian population had the highest
TABLE 3 | Factor loadings for various production system variables used to definemanagement clusters.
F-test
P-value Cluster 1 Cluster 2 Cluster 3 Cluster 4
(n = 175) (n = 214) (n = 156) (n = 109)
27%∗ 33% 24% 16%
Supplementation intensityand diversity
<0.0001 0.267 0.651 −0.756 −0.624
Milk productivity and sale <0.0001 −0.382 0.612 −0.701 0.414
Maize germ <0.0001 −0.364 −0.252 0.267 0.697
Wealth <0.0001 −0.045 0.205 −0.170 −0.086
Purchase of Napier grass <0.0001 −0.066 0.054 −0.055 0.078
Further profiling
Number of cattle owned <0.0001 3.114 4.061 2.679 3.376
Sale of milk to non-chillingcooperative
<0.0001 0.011 0.037 0.000 0.000
Sale of milk to chillingcooperative
<0.0001 0.017 0.080 0.000 0.165
Sale of milk to individualcustomers
<0.0001 0.080 0.410 0.013 0.414
Sale of milk to privatetraders
<0.0001 0.011 0.208 0.000 0.200
Total milk quantityproduced
<0.0001 5.930 14.425 2.298 8.110
Rungwe district 0.395 0.857 0.869 0.141 0.183
Lushoto district 0.395 0.143 0.131 0.859 0.817
P-values compare the difference between clusters with regards to weights ofthe factors. ∗Percentage of household. Bolded values are the highest for eachextracted factor and represent the determinants with the highest loading.
proportion of the SNPs with high MAF (>0.3). In contrast, theGir and N’Dama had the highest proportion of SNPs in thelowest MAF band.
FIGURE 1 | Distribution of minor allele frequencies (MAF) in the study populations.
Frontiers in Genetics | www.frontiersin.org 5 April 2019 | Volume 10 | Article 375
fgene-10-00375 April 25, 2019 Time: 16:15 # 6
Mujibi et al. Performance Evaluation of Admixed Cattle
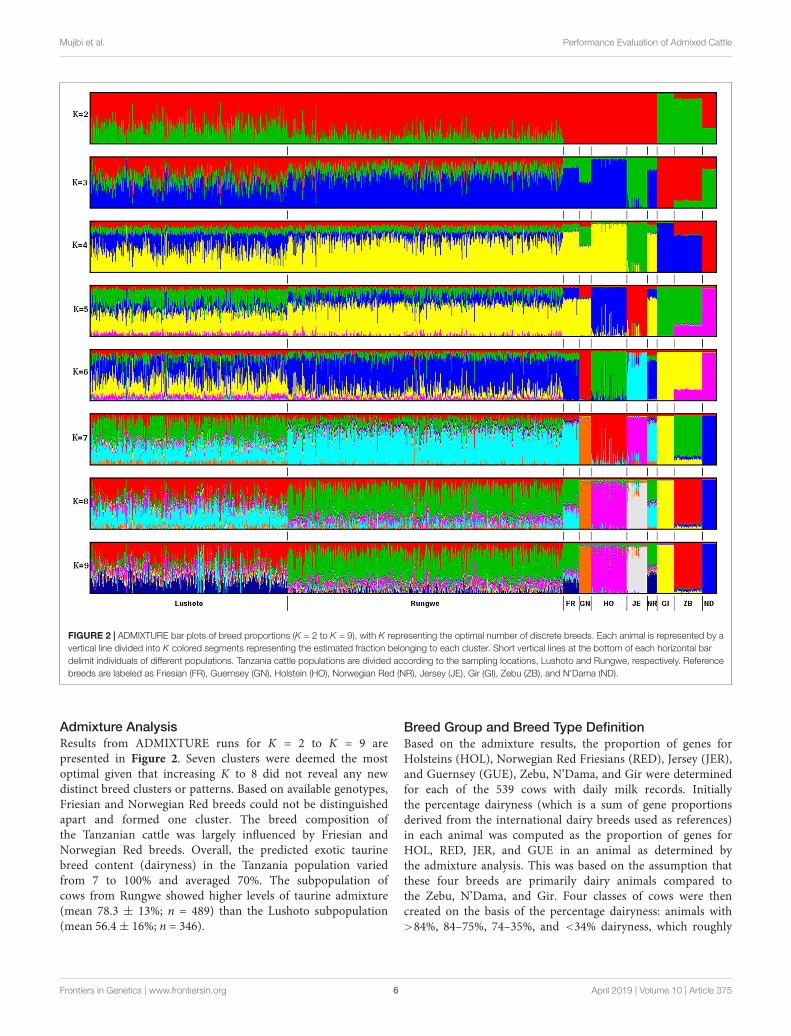
FIGURE 2 | ADMIXTURE bar plots of breed proportions (K = 2 to K = 9), with K representing the optimal number of discrete breeds. Each animal is represented by avertical line divided into K colored segments representing the estimated fraction belonging to each cluster. Short vertical lines at the bottom of each horizontal bardelimit individuals of different populations. Tanzania cattle populations are divided according to the sampling locations, Lushoto and Rungwe, respectively. Referencebreeds are labeled as Friesian (FR), Guernsey (GN), Holstein (HO), Norwegian Red (NR), Jersey (JE), Gir (GI), Zebu (ZB), and N’Dama (ND).
Admixture AnalysisResults from ADMIXTURE runs for K = 2 to K = 9 arepresented in Figure 2. Seven clusters were deemed the mostoptimal given that increasing K to 8 did not reveal any newdistinct breed clusters or patterns. Based on available genotypes,Friesian and Norwegian Red breeds could not be distinguishedapart and formed one cluster. The breed composition ofthe Tanzanian cattle was largely influenced by Friesian andNorwegian Red breeds. Overall, the predicted exotic taurinebreed content (dairyness) in the Tanzania population variedfrom 7 to 100% and averaged 70%. The subpopulation ofcows from Rungwe showed higher levels of taurine admixture(mean 78.3 ± 13%; n = 489) than the Lushoto subpopulation(mean 56.4± 16%; n = 346).
Breed Group and Breed Type DefinitionBased on the admixture results, the proportion of genes forHolsteins (HOL), Norwegian Red Friesians (RED), Jersey (JER),and Guernsey (GUE), Zebu, N’Dama, and Gir were determinedfor each of the 539 cows with daily milk records. Initiallythe percentage dairyness (which is a sum of gene proportionsderived from the international dairy breeds used as references)in each animal was computed as the proportion of genes forHOL, RED, JER, and GUE in an animal as determined bythe admixture analysis. This was based on the assumption thatthese four breeds are primarily dairy animals compared tothe Zebu, N’Dama, and Gir. Four classes of cows were thencreated on the basis of the percentage dairyness: animals with>84%, 84–75%, 74–35%, and <34% dairyness, which roughly
Frontiers in Genetics | www.frontiersin.org 6 April 2019 | Volume 10 | Article 375

fgene-10-00375 April 25, 2019 Time: 16:15 # 7
Mujibi et al. Performance Evaluation of Admixed Cattle
corresponds to pedigree animal, F2 cross, F1 cross and abackcross or indicine animal, respectively. Within each of thefour classes, animals were then grouped on the basis of theorder of the breed or breeds with accounted for 76% of thegenes in each animal (Table 4). For instance, considering animalswith >84% dairyness in Table 4, animals classified as group 1(RED–GUE) implies the genes from RED or genes from theRED and then GUE or genes from the RED and then Jerseyaccounted for more than 76% of genes in the animal with thehighest proportion coming from the RED. Whereas for animalsclassified as group 4 (Zebu–RED), genes for the Zebu or genesfrom the Zebu and then Gir or genes from the Zebu andthen the RED or genes from the Zebu and then HOL breedaccounted for more than 76% of genes in the animal but withthe Zebu accounting for the highest proportion of genes. Notethat the choice of 76% genes as the proportion contributedby one or more breeds in classifying animals to breed typeswas arrived after trying several values so as to get an optimaldistribution of genotypes. On the basis of the results in Table 4,nine breed types were defined based on the percentage of thedairyness and the order of breeds accounting for most of thegenes in the animal.
Performance and Breed Suitability AssessmentThe determination of performance for each breed type and theirsuitability in the four management clusters was based on themean values for milk yield computed using the solutions ofmanagement clusters nested within the breed types from thefixed regression model as well as the mean breeding values andsolutions of permanent environmental effects of each cow in themanagement system. The distribution of cows based on theirdairyness and breed composition is shown in Table 4. Given theaverage dairyness of 70%, majority of the animals had a breedcomposition in the 74–35% dairyness range. Most animals werepredominantly crosses between Friesian-Norwegian Red breedsand local Zebu cattle.
Generally, the milk yield obtained from the study cows waslow averaging 5.90 l per day. The mean daily milk yield for cows inLushoto was 4.69 l while that of Rungwe was 6.61 l. Cows in breedgroup 4 (Zebu–RED crosses) had the lowest milk yields rangingbetween 1.4 and 3.5 l per day (Table 5). Given that this group
TABLE 4 | Number of cows included in the analysis, grouped based on acombination of breed composition and percent dairyness.
Dairyness class (%)
Breed group >84% 84–75% 74–35% 34–0%
1. RED–GUE: [Norwegian Red–Friesian(RED), RED–Guernsey, RED–Jersey]
35 7 – –
2. RED–HOL (Holstein–RED,RED–Holstein)
65 33 –
3. RED–Zebu (RED–Zebu,RED–N’Dama)
13 94 148 –
4. Zebu–RED (Zebu, Zebu–Gir,Zebu–RED, Zebu–Holstein)
– – 136 21
Total 113 134 284 21 TAB
LE5
|The
mea
nda
ilym
ilkyi
elds
(±S
D)o
fvar
ious
bree
dgr
oups
ofva
ryin
gda
iryne
ssin
diffe
rent
man
agem
entc
lust
ers.
Bre
ed
gro
upM
anag
emen
tcl
uste
r1
Man
agem
ent
clus
ter
2M
anag
emen
tcl
uste
r3
Man
agem
ent
clus
ter
4
Mea
nav
erag
esfr
om
raw
dai
lym
ilkyi
eld
Dai
ryne
sscl
ass
III
IIIIV
III
IIIIV
III
IIIIV
III
IIIIV
RG
5.75±
3.15
––
–8.
35±
3.29
––
––
––
–8.
192±
2.56
––
–
RH
5.75±
2.14
7.06±
4.21
––
7.31±
3.36
7.83±
2.79
––
–5.
040±
1.80
––
–7.
784±
4.42
–
RZ
7.14±
3.21
6.00±
3.23
5.62±
2.66
–9.
29±
3.67
6.83±
2.97
6.18±
3.01
––
4.77±
2.44
4.03±
2.51
–6.
93±
2.83
5.96±
2.88
–
ZR–
–4.
03±
2.51
––
–5.
53±
2.60
––
–3.
36±
1.49
2.79
7±
1.28
––
4.38±
202
–
Mea
nav
erag
esfo
rad
just
edd
aily
milk
yiel
d
RG
4.76±
1.33
––
–6.
88±
1.29
––
––
––
–5.
892±
1.22
––
–
RH
3.92±
1.15
4.85±
1.33
–5.
70±
1.29
6.05±
1.25
––
–3.
942±
1.10
–6.
79±
1.36
––
RZ
7.28±
1.19
4.15±
1.27
4.03±
1.19
–7.
10±
1.30
5.48±
1.28
4.44±
1.26
––
2.19±
1.06
2.70±
1.25
–4.
97±
1.28
4.08±
1.22
–
ZR–
–2.
49±
1.19
––
–3.
58±
1.17
––
1.95±
1.13
1.48±
1.13
––
2.78±
1.16
–
I=
>84
%,
II=
84–7
5%,
III=
74–3
5%,
and
IV=
<35
%;
man
agem
ent
clus
ters
1,2,
3,4
corr
espo
nds
to“m
ediu
m-f
eed–
low
-out
put
subs
iste
nce
orie
nted
dairy
farm
ers,
”“f
eed-
inte
nsiv
eco
mm
erci
ally
-orie
nted
dairy
farm
ers”
;“lo
w-f
eed–
low
-out
puts
ubsi
sten
ceor
ient
edda
iryfa
rmer
s”an
d“m
aize
-ger
m-in
tens
ive
sem
i-com
mer
cial
dairy
farm
ers.
”B
reed
grou
p(th
eco
mbi
natio
nof
bree
dsth
atco
ntrib
ute
76%
ofth
ebr
eed
mak
eup)
.RG
,R
ED–G
uern
sey;
RH
,RED
–Hol
stei
n;R
Z,R
ED–Z
ebu
cros
s;ZR
,Zeb
u–R
ED.M
eans
wer
ead
just
edba
sed
onth
efit
ted
G-B
LUP
mod
el.
Frontiers in Genetics | www.frontiersin.org 7 April 2019 | Volume 10 | Article 375

fgene-10-00375 April 25, 2019 Time: 16:15 # 8
Mujibi et al. Performance Evaluation of Admixed Cattle
consisted of cows with the highest proportion of Zebu genes andthat the East African Zebu is not improved for milk yield, thelow milk yield conforms to expectations. Additionally, majorityof low dairyness cows (43% of all Zebu–RED crosses) werekept in the low-feed–low-output management system. Farmerspracticing low-feed–low-output subsistence dairy farming werealso the only ones who kept animals with dairyness <34% aswell as not having animals in the >84% dairyness category.The RED–GUE crosses tended to be the best performing with anarrower range of performance (4.7–6.8). However, these crosseswere very few and were not well represented in all managementclusters. The RED–HOL group were second highest with ayield range of 3.9–6.7 l per day. The third best group wasthe RED–Zebu, which had the widest range of performance at2.1–7.2 l per day. This group also had the highest yields forthe medium-feed–low-output subsistence-oriented managementsystem. Raw means and means corrected for fixed effects areprovided in Table 3.
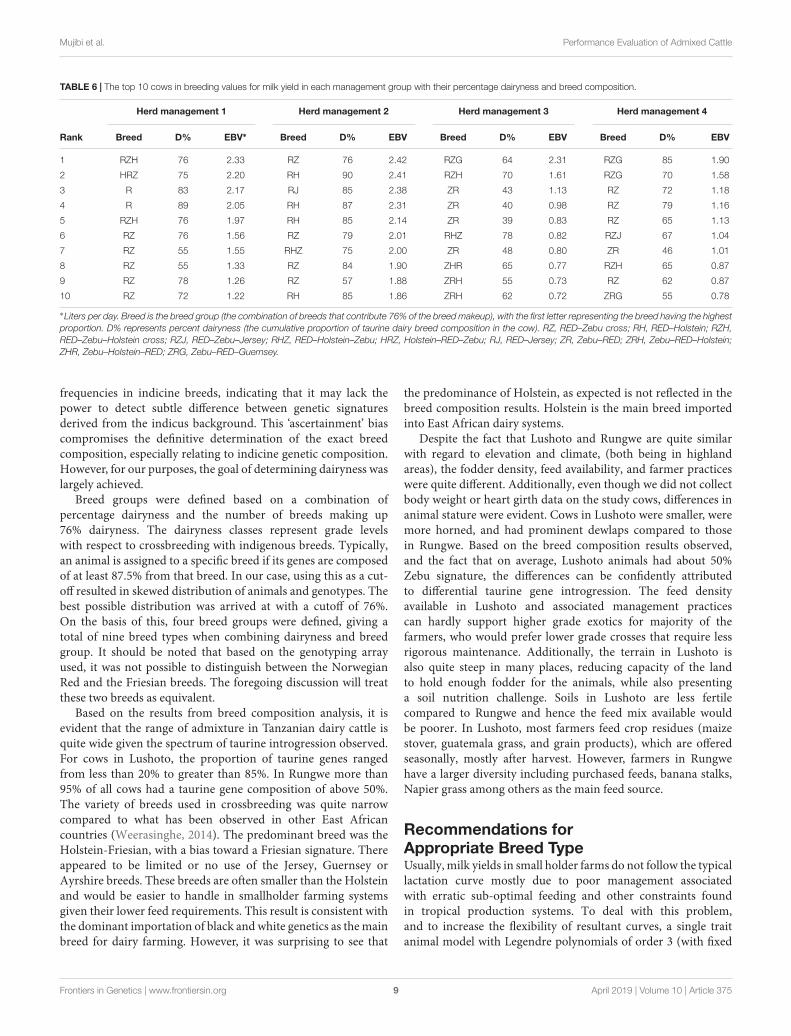
Table 6 indicates the breed composition of the top 10 cowsin terms of EBVs in each management group. Each of the fourmanagement clusters had a total of 130, 203, 105, and 101 cows,respectively, such that the top 10 cows represented the top 8, 5, 10,and 10%, respectively, in each group. For all management clusters(except the feed-intensive commercially-oriented managementgroup), cows whose composition was dominated by crosses of theFriesian-Norwegian Red and Zebu (RED–Zebu, either as ZR orRZ genotypes) dominated the list of top 10 animals based on EBVranking (Table 6). Conversely, crosses of Friesian-NorwegianRed and Holstein (RHZ, RH, RZH) featured mostly in the feed-intensive commercially-oriented and maize-germ-intensive semi-commercial management clusters.
Genetic ParametersFollowing variance component analysis, the direct additiveheritability estimate obtained for milk yield was 0.24 ± 0.13while repeatability was 0.32 ± 0.04. The heritability estimatesfell within the range (0.18–0.51) estimated for taurine cattle(Van Tassell et al., 1999). The genetic parameter estimates werewell within values obtained from tropical smallholder systems(Msanga et al., 2000).
DISCUSSION
The purpose of the project was to characterize the smallholderdairy system and identify how various breed types performedunder varying management clusters. By identifying the exactbreed composition of target cows and associating the observedprofile with individual animal productivity, it is envisaged thatappropriate recommendations can be made for farmers andothers intending to maximize productivity of these systems.
Management Group ClusteringCentral to matching breed types to production environments isthe need to characterize the production environments. This iscritical because most smallholder dairy farmers have smallherd sizes averaging two to three animals. Additionally, the
management practices in these farms are very divergent, makingevaluation of performance potentially difficult. A strategy toovercome such heterogeneity in management practices is tofind commonalities in practices between households. Theseclusters would then represent some fairly homogenous groups ofhouseholds (ostensibly undertake somewhat similar managementpractices) within which the performance of extant cohorts ofanimals can be evaluated. Each cluster would then be considereda management group. This was achieved through first a factoranalysis of various variables collected in the baseline surveysuch as farm income, land area owned, and type of feed used,among others followed by a cluster analysis of the five extractedfactors. Given the four management clusters defined, manysubliminal factors are implied and contribute to the observeddifferences in the productivity of households therein. The varietyand intensity of supplementation characterized in the feed-intensive commercially oriented management system and themaize germ intensive semi-commercial dairy farmers impliedmore labor input, in the search and preparation of the materials.Additionally, given that most of these materials are mostly notpurchased but sourced from own farms, variable sources andtypes of supplements would reflect a larger land area planted andpotentially higher household income obtained from the sale of adiverse crop base.
Classification based on inter-farm differences can potentiallyenable identification of farms with similar practices andcircumstances for which a given recommendation would bebroadly appropriate (Byerlee and Collinson, 1980). Similarityamong households within a management system is no doubtdetermined by constraints and opportunities faced by thefarmers and these are expected to vary according to agro-ecological and socioeconomic conditions under which farmersoperate. Even within the same agro-ecological conditions,individual households may still differ due to socio-economicconditions and inherent knowledge. There will often thereforebe need for targeted solutions that take into account diversityin farm resource endowment and farm practices in spiteof similarities in agro-ecological conditions. This fact isdemonstrated by farmers in the same geographic regions beingclassified in disparate management clusters. Membership ineach of these four management clusters was driven by feedingpractices, productivity and commercial orientation of dairyfarm households.
Admixture and Breed CompositionIn order to establish the breed composition of the animals, wecollected blood and hair samples from a total of 839 cows fromLushoto and Rungwe in Northern and Southern highlands ofTanzania, respectively. The choice of the genotyping platformused (the Geneseek Genomic Profiler Dairy) was informedby the need to minimize the cost of genotyping, as well asaccess genotypes that can be pooled with available referencegenotypes, which were genotyped by the Illumina 700K SNParray. However, the SNP array that was used to genotype theanimals had no power to discriminate between Norwegian Redand Friesian breeds. Additionally, the panel had a significantnumber of polymorphisms that had very low minor allele
Frontiers in Genetics | www.frontiersin.org 8 April 2019 | Volume 10 | Article 375
fgene-10-00375 April 25, 2019 Time: 16:15 # 9
Mujibi et al. Performance Evaluation of Admixed Cattle
TABLE 6 | The top 10 cows in breeding values for milk yield in each management group with their percentage dairyness and breed composition.
Herd management 1 Herd management 2 Herd management 3 Herd management 4
Rank Breed D% EBV∗ Breed D% EBV Breed D% EBV Breed D% EBV
1 RZH 76 2.33 RZ 76 2.42 RZG 64 2.31 RZG 85 1.90
2 HRZ 75 2.20 RH 90 2.41 RZH 70 1.61 RZG 70 1.58
3 R 83 2.17 RJ 85 2.38 ZR 43 1.13 RZ 72 1.18
4 R 89 2.05 RH 87 2.31 ZR 40 0.98 RZ 79 1.16
5 RZH 76 1.97 RH 85 2.14 ZR 39 0.83 RZ 65 1.13
6 RZ 76 1.56 RZ 79 2.01 RHZ 78 0.82 RZJ 67 1.04
7 RZ 55 1.55 RHZ 75 2.00 ZR 48 0.80 ZR 46 1.01
8 RZ 55 1.33 RZ 84 1.90 ZHR 65 0.77 RZH 65 0.87
9 RZ 78 1.26 RZ 57 1.88 ZRH 55 0.73 RZ 62 0.87
10 RZ 72 1.22 RH 85 1.86 ZRH 62 0.72 ZRG 55 0.78
∗Liters per day. Breed is the breed group (the combination of breeds that contribute 76% of the breed makeup), with the first letter representing the breed having the highestproportion. D% represents percent dairyness (the cumulative proportion of taurine dairy breed composition in the cow). RZ, RED–Zebu cross; RH, RED–Holstein; RZH,RED–Zebu–Holstein cross; RZJ, RED–Zebu–Jersey; RHZ, RED–Holstein–Zebu; HRZ, Holstein–RED–Zebu; RJ, RED–Jersey; ZR, Zebu–RED; ZRH, Zebu–RED–Holstein;ZHR, Zebu–Holstein–RED; ZRG, Zebu–RED–Guernsey.
frequencies in indicine breeds, indicating that it may lack thepower to detect subtle difference between genetic signaturesderived from the indicus background. This ‘ascertainment’ biascompromises the definitive determination of the exact breedcomposition, especially relating to indicine genetic composition.However, for our purposes, the goal of determining dairyness waslargely achieved.
Breed groups were defined based on a combination ofpercentage dairyness and the number of breeds making up76% dairyness. The dairyness classes represent grade levelswith respect to crossbreeding with indigenous breeds. Typically,an animal is assigned to a specific breed if its genes are composedof at least 87.5% from that breed. In our case, using this as a cut-off resulted in skewed distribution of animals and genotypes. Thebest possible distribution was arrived at with a cutoff of 76%.On the basis of this, four breed groups were defined, giving atotal of nine breed types when combining dairyness and breedgroup. It should be noted that based on the genotyping arrayused, it was not possible to distinguish between the NorwegianRed and the Friesian breeds. The foregoing discussion will treatthese two breeds as equivalent.
Based on the results from breed composition analysis, it isevident that the range of admixture in Tanzanian dairy cattle isquite wide given the spectrum of taurine introgression observed.For cows in Lushoto, the proportion of taurine genes rangedfrom less than 20% to greater than 85%. In Rungwe more than95% of all cows had a taurine gene composition of above 50%.The variety of breeds used in crossbreeding was quite narrowcompared to what has been observed in other East Africancountries (Weerasinghe, 2014). The predominant breed was theHolstein-Friesian, with a bias toward a Friesian signature. Thereappeared to be limited or no use of the Jersey, Guernsey orAyrshire breeds. These breeds are often smaller than the Holsteinand would be easier to handle in smallholder farming systemsgiven their lower feed requirements. This result is consistent withthe dominant importation of black and white genetics as the mainbreed for dairy farming. However, it was surprising to see that
the predominance of Holstein, as expected is not reflected in thebreed composition results. Holstein is the main breed importedinto East African dairy systems.
Despite the fact that Lushoto and Rungwe are quite similarwith regard to elevation and climate, (both being in highlandareas), the fodder density, feed availability, and farmer practiceswere quite different. Additionally, even though we did not collectbody weight or heart girth data on the study cows, differences inanimal stature were evident. Cows in Lushoto were smaller, weremore horned, and had prominent dewlaps compared to thosein Rungwe. Based on the breed composition results observed,and the fact that on average, Lushoto animals had about 50%Zebu signature, the differences can be confidently attributedto differential taurine gene introgression. The feed densityavailable in Lushoto and associated management practicescan hardly support higher grade exotics for majority of thefarmers, who would prefer lower grade crosses that require lessrigorous maintenance. Additionally, the terrain in Lushoto isalso quite steep in many places, reducing capacity of the landto hold enough fodder for the animals, while also presentinga soil nutrition challenge. Soils in Lushoto are less fertilecompared to Rungwe and hence the feed mix available wouldbe poorer. In Lushoto, most farmers feed crop residues (maizestover, guatemala grass, and grain products), which are offeredseasonally, mostly after harvest. However, farmers in Rungwehave a larger diversity including purchased feeds, banana stalks,Napier grass among others as the main feed source.
Recommendations forAppropriate Breed TypeUsually, milk yields in small holder farms do not follow the typicallactation curve mostly due to poor management associatedwith erratic sub-optimal feeding and other constraints foundin tropical production systems. To deal with this problem,and to increase the flexibility of resultant curves, a single traitanimal model with Legendre polynomials of order 3 (with fixed
Frontiers in Genetics | www.frontiersin.org 9 April 2019 | Volume 10 | Article 375

fgene-10-00375 April 25, 2019 Time: 16:15 # 10
Mujibi et al. Performance Evaluation of Admixed Cattle
curves nested within breed types) was fitted (SupplementaryFigure S1). Legendre polynomials have been shown to performwell in such situations (Eva Strucken, personal communication).The mean production seen in Tanzania (5.9 l per day) isvery similar to what has been recorded in Kenya and Uganda.A similar study carried out over a 2-year period in Kenya andUganda (and with 39,000 milk yield records) resulted in verysimilar performance in smallholder systems, averaging 5.39 and5.62 l, respectively (Unpublished). Smallholder farmers are thebackbone of the dairy sector in Tanzania and East Africa. It isgenerally agreed that a successful dairy operation should utilizeimproved breed types given the low productivity of local zebucattle. This desire for increased production drives farmers intocrossbreeding, the general sense being that a pure bred exoticanimal isn’t suitable either for a majority of smallholder farmers.However, there is little information or evidence to support whatshould be the ideal breed type for various smallholder productionsituations. By evaluating the performance of various breed typeswithin diverse management clusters, it is possible to providegeneral recommendations of the breed type most effective foreach circumstance.
Given the estimated breeding values obtained in this studyand the top 10 ranked animals, it is clear that Holsteingenetics are not well suited for the smallholder system of thekind profiled in this study. It is difficult to say whether thealternative is Friesian or Norwegian Red given the ineffectualseparation of these two breeds in the study. However, we expectthat since there is significant representation of Friesian in theNorwegian Red breed, hence the lack of differentiation with thenumber of markers on the GGP SNP array. However, basedon the breed utilization pattern in the region, the breed inquestion would mostly be Friesian, since most farmers eitherprefer or have easy access to the black and white cattle.A similar phenomenon was observed by Weerasinghe (2014),where exclusion of Ayrshire as a reference breed resulted inAyrshire animals having higher Jersey or Guernsey composition.However, that animals with substantial Holstein backgroundwere performing inferior to smaller bodied alternatives isnot surprising. Anecdotal evidence and common sense woulddictate that in the face of limiting feed resources, sub-optimalmanagement practices and extant disease pressure in smallholdersystems, cows that are smaller framed would be preferred, notleast because of the lower feeding requirements. However, asfarmers chase larger milk yields, preference has fast shiftedto Holsteins and their promise of huge milk production. Oneof the most illuminating outcomes in this analysis was thefact that some of the Zebu–RED cows, those of the lowdairyness class, were ranked amongst the best performers insome management clusters. These animals, with dairyness lessthan 60%, typify the benefits that may be derived throughregular performance recording and evaluation. It would beinteresting to identify the genetic signature of such animals,because they would best exemplify the model cow for smallholdersystems – resistant to diseases, hardy enough to withstand poorfeeds and ravages of the tropical smallholder system, but stillcompetitive in terms of milk yield. However, because farmersdo not routinely collect performance records, nor is there a
consistent mechanism for performance evaluation, any hiddengem in the national herd is soon lost in pursuit of higher yieldsthrough inappropriate upgrading.
The results obtained in this study seem to suggest thatthe RED–Zebu with exotic genes between 75 and 85% arethe most appropriate genotype for these systems followed bythe RED–GUE. For farmers in the feed-intensive-commerciallyoriented dairy management group, the RED–HOL or RED–GUEcrosses with at least 75% exotic genes were the best performingcows. Farmers in the low-feed–low-output subsistence orienteddairy farming would be best served with animals with breedcomposition of no more than 65% RED genes. This means thatdairy farmers who are able to provide the feeding plane andmanagement inputs for the Holstein, can still be well served bythat breed type. However, this group does not represent the vastmajority of smallholder farmers.
Collecting data from smallholder dairy systems is anenormously expensive and tasking exercise. Typically, routinecollection of test day milk yield records does not happen andsuch data is the preserve of research institutions. There isno incentive for collecting such data for smallholder farmersbecause genetic evaluation programs are lacking. Where thesesystems exists, they are only done for large scale commercialfarmers with large herd sizes. The extremely small number ofanimals kept by smallholder farmers (most farmers keep twodairy cows), the cohort sizes are too small for meaningful geneticevaluation to be undertaken. Additionally, smallholder farmersdo not raise their own animals for replacement, being contentto buy replacement stock from established farms when needed.These limitations contributed greatly to the low data volumesexperienced in this study. With the limited data available, wewere able to demonstrate that combining genomic data withlactation and other production records can be a powerful wayof identifying appropriate genotypes for farmers given theirextant management system. The results obtained in this studycan serve as a basis to inform the development of the dairysector in Tanzania. This is particularly important because theTanzanian government has resolved to increase the number ofimproved dairy cattle to three million head and milk productionfrom 1.6 billion to 6 billion liters annually in the next 10 years.Knowledge of what breed combinations are best suited for whichproduction systems is critical and will determine the success ofthis ambitious goal.
The recommendations of breed types most suitable for themanagement clusters described in this study reflects only thesample set which was surveyed and highly related systemsand cannot be generalized across the diversity of smallholderfarming enterprises. These are variable and are immenselyinfluenced by socio-economic parameters, market orientation,available feed resources as well as other agro-ecological factors.Additionally, data for this study was collected over a 7-monthperiod, and not a full lactation for each animal. The studyduration was short and sample size limited. These results wouldgain tremendously from increasing the number of lactations,the number of test day records as well as larger sample sizesto solidify the recommendations proffered herein. However,such a study would be very costly. In practice, milk yield
Frontiers in Genetics | www.frontiersin.org 10 April 2019 | Volume 10 | Article 375

fgene-10-00375 April 25, 2019 Time: 16:15 # 11
Mujibi et al. Performance Evaluation of Admixed Cattle
recording is not an entrenched practice in smallholder dairysystems. Such data collection would primarily be driven byhired enumerators, making the cost very high. Owing to limitedfunding and competing needs for available resources, data canonly be collected for limited durations of time.
The recommendations made in this study are based solely onperformance in terms of daily milk yield and do not accountfor other important issues such as cost of health treatment,reproductive management or feed provision. An economicanalysis that accounts for all these additional variables will beuseful in defining the most profitable genotype for each system.
CONCLUSION
The use of SNP data and genomic relationships for the animalsunder study enabled performance evaluation of milk yield datain smallholder dairy farms without the need for pedigree records.The breeding values estimates so obtained were instrumental indetermining that the RED–Zebu breed type with exotic genesbetween 75 and 85% was the most appropriate genotype formajority of the management clusters except the high inputclusters. Given that majority of smallholder farmers operatein circumstances where the intensity of input (especially feed)provision is quite limited, the recommended breed type wouldbe the most applicable on a wide scale. These results indicate thatmatching breed type to production management group is centralto sustainable intensification and maximizing productivity. Theobservations made in this study will serve as a basis to informthe development of the dairy sector in Tanzania and EasternAfrica at large.
ETHICS STATEMENT
This study was performed following the International LivestockResearch Institute (ILRI) Institutional Animal Care and Use
Committee (IACUC) guidelines, with approval reference number2014.35. Animals were handled by experienced animal healthprofessionals to minimize discomfort and injury.
AUTHOR CONTRIBUTIONS
FM conceived the project, designed the study, and obtainedfunding. AK, DN, and MA were involved in collection of fielddata. JR, EC, FM, and RM analyzed the data and contributed todrafting individual segments for the analyses. FM consolidatedinputs and drafted the manuscript. JR, YZ, MA, and RM madesuggestions and corrections. All authors read and approved thefinal manuscript.
FUNDING
This study was made possible with funding obtainedthrough AgriTT Research Challenge Fund from theDFID, United Kingdom.
ACKNOWLEDGMENTS
Genotypes for the reference breeds were thankfully obtainedfrom Olivier Hanotte (East African Shorthorn Zebu), TadSonstegard (Norwegian Red, Holstein, Guernsey, Jersey,N’Dama, Gir), and Edinburgh Genetic Evaluation Services(EGENES), Scotland’s Rural College, Edinburgh (Friesian).
SUPPLEMENTARY MATERIAL
The Supplementary Material for this article can be foundonline at: https://www.frontiersin.org/articles/10.3389/fgene.2019.00375/full#supplementary-material
REFERENCESAlexander, D. H., Novembre, J., and Lange, K. (2009). Fast model-based estimation
of ancestry in unrelated individuals. Genome Res. 19:165564. doi: 10.1101/gr.094052.109
Bee, J. K. A., Msanga, Y. N., and Kavana, P. Y. (2006). Lactation yield of crossbreddairy cattle under farmer management in Eastern coast of Tanzania. Livest. Res.Rural Dev. 18:23.
Brown, A., Ojango, J., Gibson, J., Coffey, M., Okeyo, M., and Mrode, R. (2016).Genomic selection in a crossbred cattle population using data from the dairygenetics East Africa project. J. Dairy Sci. 99, 1–5. doi: 10.3168/jds.2016-11083
Byerlee, D., and Collinson, M. (eds). (1980). Planning Technologies Appropriate toFarmers: Concepts and Procedures. Mexico, DF: CIMMYT, 71.
Gilmour, A., Gogel, B., Cullis, B., and Thompson, R. (2009). ASReml User GuideRelease 3.0. Hemel Hempstead: VSN International Ltd.
Gorbach, D. M., Makgahlela, M. L., Reecy, J. M., Kemp, S. J., Baltenweck, I.,Ouma, R., et al. (2010). Use of SNP genotyping to determine pedigree andbreed composition of dairy cattle in Kenya. J. Anim. Breed. Genet. 127, 348–351.doi: 10.1111/j.1439-0388.2010.00864.x
Kaiser, H. F. (1970). A second-generation little jiffy. Psychometrika 35, 401–415.Kurwijila, L. R., and Bennett, A. (2011). Dairy Development Institutions in East
Africa — Lessons Learned and Options. Rome: FAO.
Msanga, Y. N. (1994). Comparison of productivity of Zebu andcrosses in the Coastal region of Tanzania. Res. Train. Newslett. 9,10–12.
Msanga, Y. N., Bryant, M. J., Rutam, I. B., Minja, F. N., and Zylstra, L.(2000). Effect of environmental factors and of the proportion of Holsteinblood on the milk yield and lactation length of crossbred dairy cattle onsmallholder farms in north-east Tanzania. Trop. Anim. Health Prod. 32,23–31.
Mwacharo, J. M., and Rege, J. E. O. (2002). On-farm characterization of theindigenons small East African shorthorn zebu cattle (SEAZ) in the southeastrangelands of Kenya. Anim. Genet. Resour. Inform. Bull. 32, 73–86.
National Bureau of Statistics [NBS] (2007). Tanzania, United Republic of –National Household Budget Survey 2007. Tanzania: National Bureau of Statistics.Available at: www.nbs.go.tz
Ojango, J. M., Marete, A. G., Mujibi, F. D. N., Rao, J., Poole, J., Rege, E. O.,et al. (2014). “A novel use of high density SNP assays to optimize choiceof different crossbred dairy cattle genotypes in small-holder systems in EastAfrica,” in Proceedings of the 10th World Congress on Genetics Applied toLivestock Production, Vancouver, BC, 17–22.
Purcell, S., Neale, B., Todd-Brown, K., Thomas, L., Ferreira, M. A., and Bender, D.(2007). PLINK: a tool set for whole-genome association and population-basedlinkage analyses. Amer. J. Hum. Genet. 81, 559–575.
Frontiers in Genetics | www.frontiersin.org 11 April 2019 | Volume 10 | Article 375

fgene-10-00375 April 25, 2019 Time: 16:15 # 12
Mujibi et al. Performance Evaluation of Admixed Cattle
Rege, J. E. O., Kahi, A., Okomo-Adhiambo, M., Mwacharo, J., and Hanotte,O. (2001). Zebu Cattle of Kenya: Uses, Performance, Farmer Preferences andMeasures of Genetic Diversity. Nairobi: ILRI.
Strucken, E. M., Al-Mamun, H. A., Esquivelzeta-Rabell, C., Gondro, C.,Mwai, O. A., and Gibson, J. P. (2017). Genetic tests for estimatingdairy breed proportion and parentage assignment in East Africancrossbred cattle. Genet. Sel. Evol. 49:67. doi: 10.1186/s12711-017-0342-1
Swai, E. S., Minja, F. N., and Zylstra, L. (1992). “Dairy development inTanga, Tanzania,” in Proceeding of a workshop on Future of LivestockIndustries in East and Southern Africa held in Kadoma Motel Ranch,Zimbabwe, eds J. A. Kategile and S. Mubi (Oak Brook, IL: ILCA),157–164.
Van Tassell, C. P., Wiggans, G. R., and Norman, H. D. (1999). Method R estimatesof heritability for milk, fat, and protein yields of United States dairy cattle.J. Dairy Sci. 82, 2231–2237.
VanRaden, P. M. (2008). Efficient methods to compute genomicpredictions. J. Dairy Sci. 91, 4414–4423. doi: 10.3168/jds.2007-0980
VanRaden, P. M., and Sanders, A. H. (2003). Economic merit of crossbred andpurebred US dairy cattle. J. Dairy Sci. 86, 1036–144. doi: 10.3168/jds.S0022-0302(03)73687-X
Weerasinghe, W. M. S. P. (2014). The Accuracy and Bias of Estimates of BreedComposition and Inference About Genetic Structure Using High Density SNPMarkers in Australian Sheep Breeds. Ph.D. thesis, the University of NewEngland, Armidale.
Weerasinghe, W. M. S. P., Gondro, C., Jeyaruban, M. G., Mwai, O., Mujibi, D. F.,and Gibson, J. P. (2013). The prediction of genetic structure of East Africandairy cattle. Proc. Assoc. Advmt. Anim. Breed. Genet. 20, 163–166. doi: 10.3168/jds.2018-14621
Conflict of Interest Statement: FM and EC were employed by USOMI Limited,a private company during manuscript preparation. AK was employed by BadiliInnovations during the manuscript preparation. All the work relating to thisresearch was done prior to their employment by the respective companies. All otherauthors declare no competing interests.
Copyright © 2019 Mujibi, Rao, Agaba, Nyambo, Cheruiyot, Kihara, Zhang andMrode. This is an open-access article distributed under the terms of the CreativeCommons Attribution License (CC BY). The use, distribution or reproduction inother forums is permitted, provided the original author(s) and the copyright owner(s)are credited and that the original publication in this journal is cited, in accordancewith accepted academic practice. No use, distribution or reproduction is permittedwhich does not comply with these terms.
Frontiers in Genetics | www.frontiersin.org 12 April 2019 | Volume 10 | Article 375