16. Noise and Vibration - Vale of Glamorgan Council
131
16-1 © Entec UK Limited 16. Noise and Vibration 16.1 Introduction The proposed development will lead to changes, both positive and negative, in the noise environment and will introduce some new noise sources into the local area. This chapter of the Environmental Statement assesses the magnitude and significance of these effects and should be read in conjunction with the development description presented in Chapter 3, and the detailed description of noise generating activities in section 16.1.1 below. Following a summary of relevant policy and legislation, the chapter outlines the data gathering methodology that was adopted as part of the noise and vibration assessment. This leads on to a description of the overall baseline conditions, the environmental measures that have been incorporated into the scheme, the scope of the assessment, the assessment methodology and, for each category of noise source, an assessment of potential effects. An assessment of the cumulative effects of all noise sources is also presented. The chapter concludes with a summary of the results of the assessment. An explanation of key noise terminology is given at the end of the chapter for reference. 16.1.1 Noise Sources and Assessment Scenarios Throughout this chapter, each section has been subdivided to reflect the different types of noise sources associated with the development, and the different types of assessment required. For operational noise sources, the categorisation used is defined in Table 16.1, along with details of individual noise sources which would be active in the different scenarios assessed. Information is presented for 2014, 2020, and 2028 which correspond with Phases 1, 2 and 3 respectively of the ABP development. Construction noise sources are also considered in this chapter, but require no further categorisation. Table 16.1 presents information regarding the current and future baseline situation, which has been included in the assessment in order to ensure that the changes in the noise environment which are likely to occur in the absence of the development are taken into account. An example of this would be the cessation of the current VC10 engine running activities which will occur by 2013, irrespective of the proposed development. The location of each noise source described in Table 16.1 is marked on Figure 16.1.
-
Upload
khangminh22 -
Category
Documents
-
view
0 -
download
0
Transcript of 16. Noise and Vibration - Vale of Glamorgan Council
16-1
© Entec UK Limited
16. Noise and Vibration
16.1 Introduction
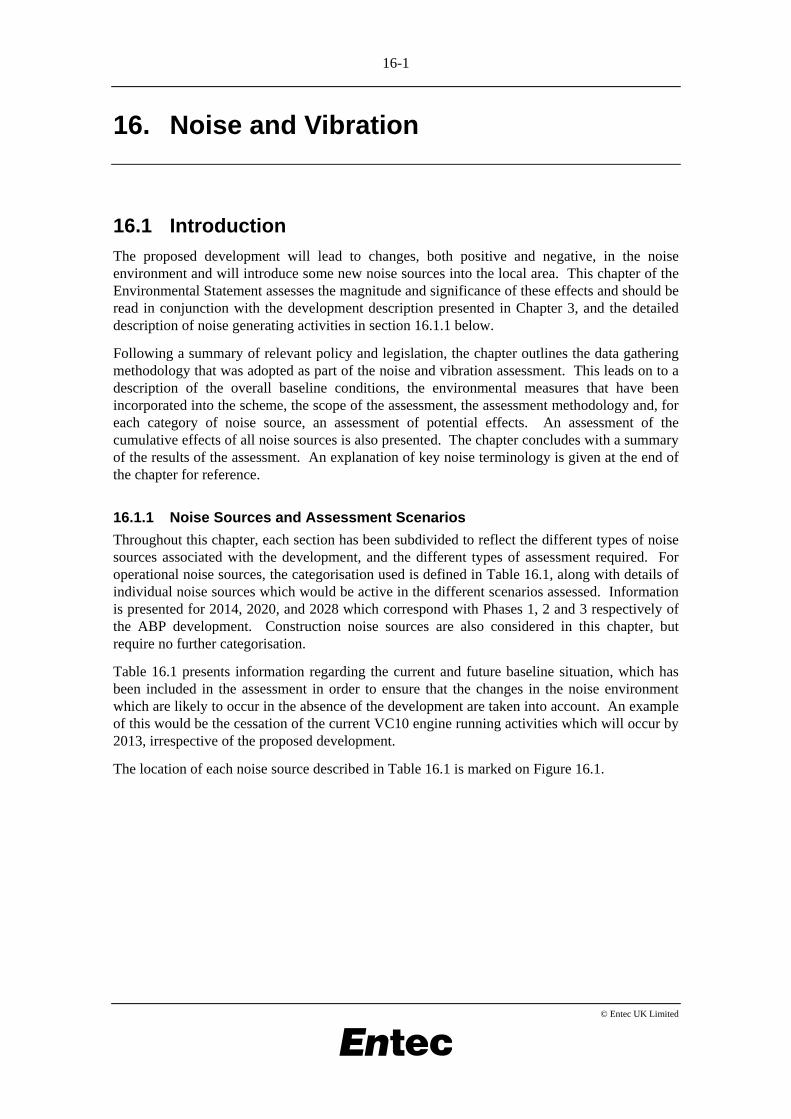
The proposed development will lead to changes, both positive and negative, in the noise environment and will introduce some new noise sources into the local area. This chapter of the Environmental Statement assesses the magnitude and significance of these effects and should be read in conjunction with the development description presented in Chapter 3, and the detailed description of noise generating activities in section 16.1.1 below.
Following a summary of relevant policy and legislation, the chapter outlines the data gathering methodology that was adopted as part of the noise and vibration assessment. This leads on to a description of the overall baseline conditions, the environmental measures that have been incorporated into the scheme, the scope of the assessment, the assessment methodology and, for each category of noise source, an assessment of potential effects. An assessment of the cumulative effects of all noise sources is also presented. The chapter concludes with a summary of the results of the assessment. An explanation of key noise terminology is given at the end of the chapter for reference.
16.1.1 Noise Sources and Assessment Scenarios
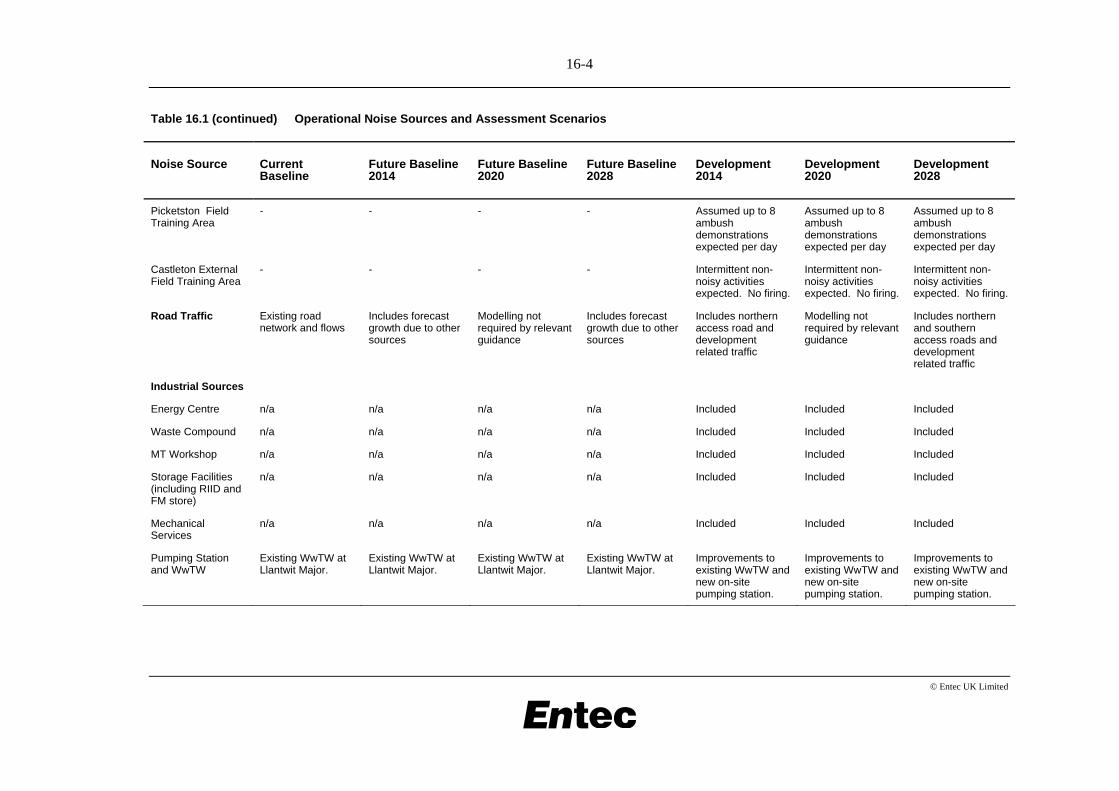
Throughout this chapter, each section has been subdivided to reflect the different types of noise sources associated with the development, and the different types of assessment required. For operational noise sources, the categorisation used is defined in Table 16.1, along with details of individual noise sources which would be active in the different scenarios assessed. Information is presented for 2014, 2020, and 2028 which correspond with Phases 1, 2 and 3 respectively of the ABP development. Construction noise sources are also considered in this chapter, but require no further categorisation.
Table 16.1 presents information regarding the current and future baseline situation, which has been included in the assessment in order to ensure that the changes in the noise environment which are likely to occur in the absence of the development are taken into account. An example of this would be the cessation of the current VC10 engine running activities which will occur by 2013, irrespective of the proposed development.
The location of each noise source described in Table 16.1 is marked on Figure 16.1.
16-2
© Entec UK Limited
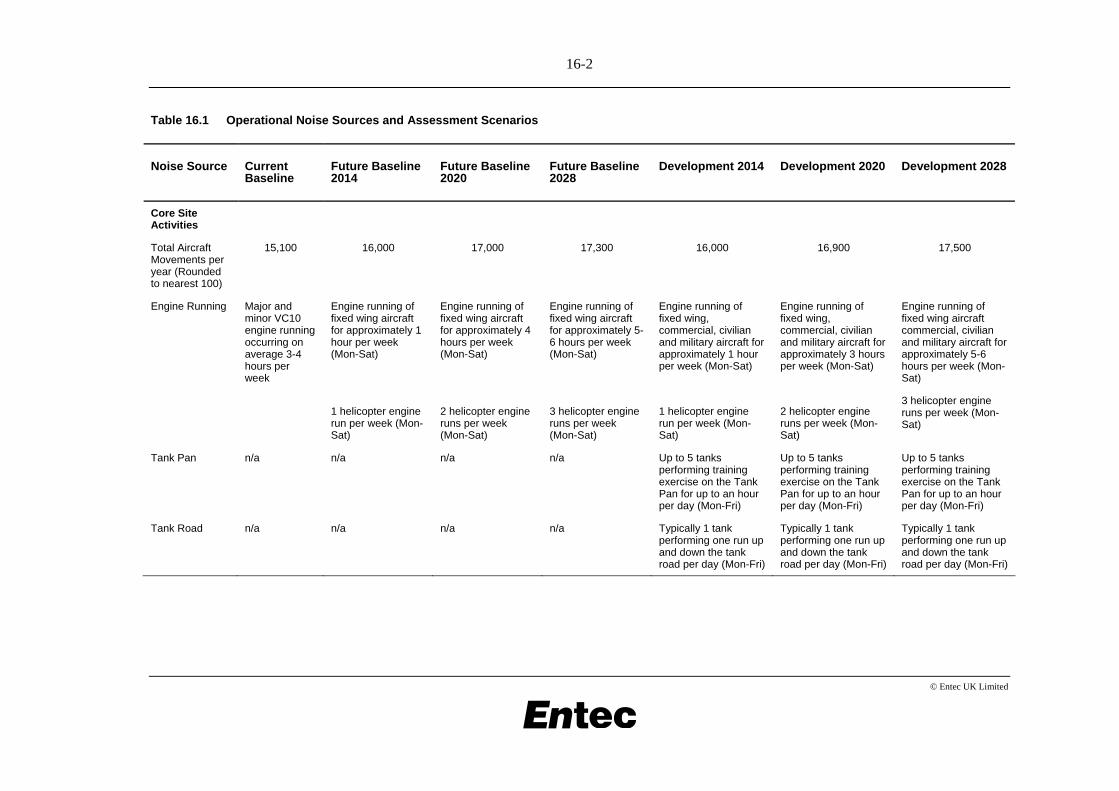
Table 16.1 Operational Noise Sources and Assessment Scenarios
Noise Source Current Baseline
Future Baseline 2014
Future Baseline 2020
Future Baseline 2028
Development 2014 Development 2020 Development 2028
Core Site Activities
Total Aircraft Movements per year (Rounded to nearest 100)
15,100 16,000 17,000 17,300 16,000 16,900 17,500
Engine Running Major and minor VC10 engine running occurring on average 3-4 hours per week
Engine running of fixed wing aircraft for approximately 1 hour per week (Mon-Sat)
1 helicopter engine run per week (Mon-Sat)
Engine running of fixed wing aircraft for approximately 4 hours per week (Mon-Sat)
2 helicopter engine runs per week (Mon-Sat)
Engine running of fixed wing aircraft for approximately 5-6 hours per week (Mon-Sat)
3 helicopter engine runs per week (Mon-Sat)
Engine running of fixed wing, commercial, civilian and military aircraft for approximately 1 hour per week (Mon-Sat)
1 helicopter engine run per week (Mon-Sat)
Engine running of fixed wing, commercial, civilian and military aircraft for approximately 3 hours per week (Mon-Sat)
2 helicopter engine runs per week (Mon-Sat)
Engine running of fixed wing aircraft commercial, civilian and military aircraft for approximately 5-6 hours per week (Mon-Sat)
3 helicopter engine runs per week (Mon-Sat)
Tank Pan n/a n/a n/a n/a Up to 5 tanks performing training exercise on the Tank Pan for up to an hour per day (Mon-Fri)
Up to 5 tanks performing training exercise on the Tank Pan for up to an hour per day (Mon-Fri)
Up to 5 tanks performing training exercise on the Tank Pan for up to an hour per day (Mon-Fri)
Tank Road n/a n/a n/a n/a Typically 1 tank performing one run up and down the tank road per day (Mon-Fri)
Typically 1 tank performing one run up and down the tank road per day (Mon-Fri)
Typically 1 tank performing one run up and down the tank road per day (Mon-Fri)
16-3
© Entec UK Limited
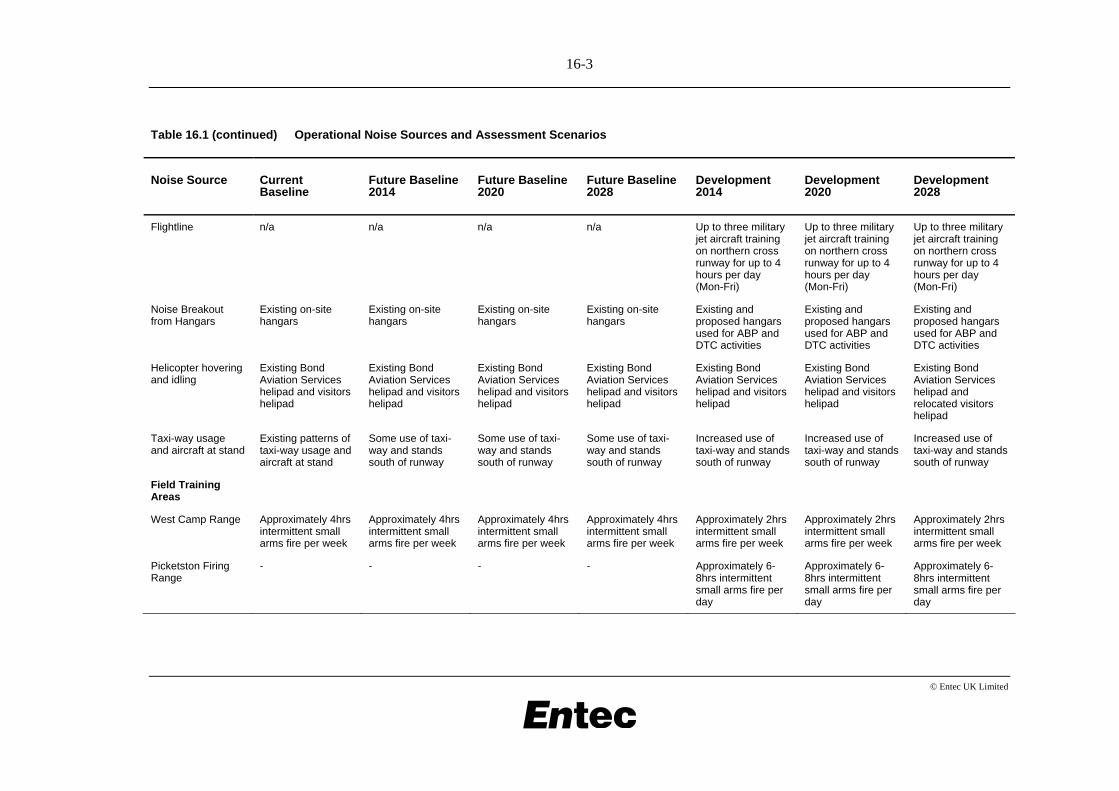
Table 16.1 (continued) Operational Noise Sources and Assessment Scenarios
Noise Source Current Baseline
Future Baseline 2014
Future Baseline 2020
Future Baseline 2028
Development 2014
Development 2020
Development 2028
Flightline n/a n/a n/a n/a Up to three military jet aircraft training on northern cross runway for up to 4 hours per day (Mon-Fri)
Up to three military jet aircraft training on northern cross runway for up to 4 hours per day (Mon-Fri)
Up to three military jet aircraft training on northern cross runway for up to 4 hours per day (Mon-Fri)
Noise Breakout from Hangars
Existing on-site hangars
Existing on-site hangars
Existing on-site hangars
Existing on-site hangars
Existing and proposed hangars used for ABP and DTC activities
Existing and proposed hangars used for ABP and DTC activities
Existing and proposed hangars used for ABP and DTC activities
Helicopter hovering and idling
Existing Bond Aviation Services helipad and visitors helipad
Existing Bond Aviation Services helipad and visitors helipad
Existing Bond Aviation Services helipad and visitors helipad
Existing Bond Aviation Services helipad and visitors helipad
Existing Bond Aviation Services helipad and visitors helipad
Existing Bond Aviation Services helipad and visitors helipad
Existing Bond Aviation Services helipad and relocated visitors helipad
Taxi-way usage and aircraft at stand
Existing patterns of taxi-way usage and aircraft at stand
Some use of taxi-way and stands south of runway
Some use of taxi-way and stands south of runway
Some use of taxi-way and stands south of runway
Increased use of taxi-way and stands south of runway
Increased use of taxi-way and stands south of runway
Increased use of taxi-way and stands south of runway
Field Training Areas
West Camp Range Approximately 4hrs intermittent small arms fire per week
Approximately 4hrs intermittent small arms fire per week
Approximately 4hrs intermittent small arms fire per week
Approximately 4hrs intermittent small arms fire per week
Approximately 2hrs intermittent small arms fire per week
Approximately 2hrs intermittent small arms fire per week
Approximately 2hrs intermittent small arms fire per week
Picketston Firing Range
- - - - Approximately 6-8hrs intermittent small arms fire per day
Approximately 6-8hrs intermittent small arms fire per day
Approximately 6-8hrs intermittent small arms fire per day
16-4
© Entec UK Limited
Table 16.1 (continued) Operational Noise Sources and Assessment Scenarios
Noise Source Current Baseline
Future Baseline 2014
Future Baseline 2020
Future Baseline 2028
Development 2014
Development 2020
Development 2028
Picketston Field Training Area
- - - - Assumed up to 8 ambush demonstrations expected per day
Assumed up to 8 ambush demonstrations expected per day
Assumed up to 8 ambush demonstrations expected per day
Castleton External Field Training Area
- - - - Intermittent non-noisy activities expected. No firing.
Intermittent non-noisy activities expected. No firing.
Intermittent non-noisy activities expected. No firing.
Road Traffic Existing road network and flows
Includes forecast growth due to other sources
Modelling not required by relevant guidance
Includes forecast growth due to other sources
Includes northern access road and development related traffic
Modelling not required by relevant guidance
Includes northern and southern access roads and development related traffic
Industrial Sources
Energy Centre n/a n/a n/a n/a Included Included Included
Waste Compound n/a n/a n/a n/a Included Included Included
MT Workshop n/a n/a n/a n/a Included Included Included
Storage Facilities (including RIID and FM store)
n/a n/a n/a n/a Included Included Included
Mechanical Services
n/a n/a n/a n/a Included Included Included
Pumping Station and WwTW
Existing WwTW at Llantwit Major.
Existing WwTW at Llantwit Major.
Existing WwTW at Llantwit Major.
Existing WwTW at Llantwit Major.
Improvements to existing WwTW and new on-site pumping station.
Improvements to existing WwTW and new on-site pumping station.
Improvements to existing WwTW and new on-site pumping station.
16-5
© Entec UK Limited
16.2 Policy and Legislative Context
16.2.1 Policy Context
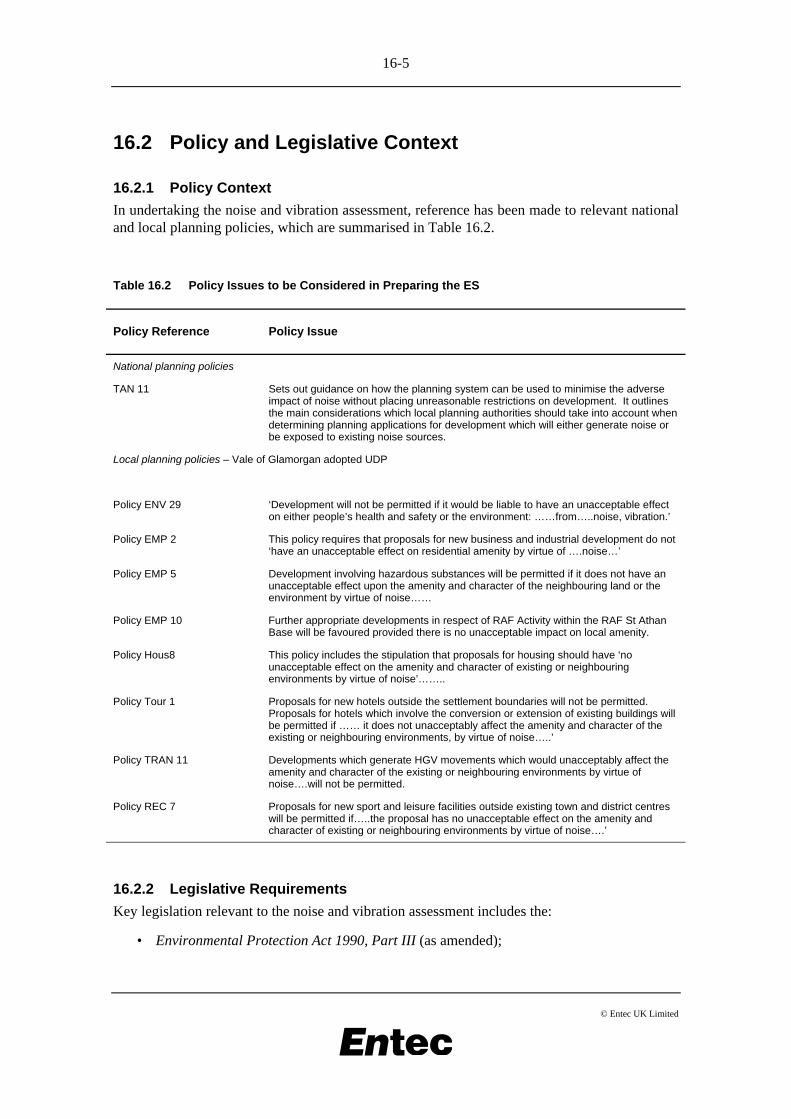
In undertaking the noise and vibration assessment, reference has been made to relevant national and local planning policies, which are summarised in Table 16.2.
Table 16.2 Policy Issues to be Considered in Preparing the ES
Policy Reference Policy Issue
National planning policies
TAN 11 Sets out guidance on how the planning system can be used to minimise the adverse impact of noise without placing unreasonable restrictions on development. It outlines the main considerations which local planning authorities should take into account when determining planning applications for development which will either generate noise or be exposed to existing noise sources.
Local planning policies – Vale of Glamorgan adopted UDP
Policy ENV 29 ‘Development will not be permitted if it would be liable to have an unacceptable effect on either people’s health and safety or the environment: ……from…..noise, vibration.’
Policy EMP 2 This policy requires that proposals for new business and industrial development do not ‘have an unacceptable effect on residential amenity by virtue of ….noise…’
Policy EMP 5 Development involving hazardous substances will be permitted if it does not have an unacceptable effect upon the amenity and character of the neighbouring land or the environment by virtue of noise……
Policy EMP 10 Further appropriate developments in respect of RAF Activity within the RAF St Athan Base will be favoured provided there is no unacceptable impact on local amenity.
Policy Hous8 This policy includes the stipulation that proposals for housing should have ‘no unacceptable effect on the amenity and character of existing or neighbouring environments by virtue of noise’……..
Policy Tour 1 Proposals for new hotels outside the settlement boundaries will not be permitted. Proposals for hotels which involve the conversion or extension of existing buildings will be permitted if …… it does not unacceptably affect the amenity and character of the existing or neighbouring environments, by virtue of noise…..’
Policy TRAN 11 Developments which generate HGV movements which would unacceptably affect the amenity and character of the existing or neighbouring environments by virtue of noise….will not be permitted.
Policy REC 7 Proposals for new sport and leisure facilities outside existing town and district centres will be permitted if…..the proposal has no unacceptable effect on the amenity and character of existing or neighbouring environments by virtue of noise….’
16.2.2 Legislative Requirements
Key legislation relevant to the noise and vibration assessment includes the:
• Environmental Protection Act 1990, Part III (as amended);
16-6
© Entec UK Limited
• Control of Pollution Act 1974;
• Land Compensation Act 1973;
• Noise Insulation Regulations 1975 (as amended); and
• Civil Aviation Act 1982.
16.2.3 Other Guidance
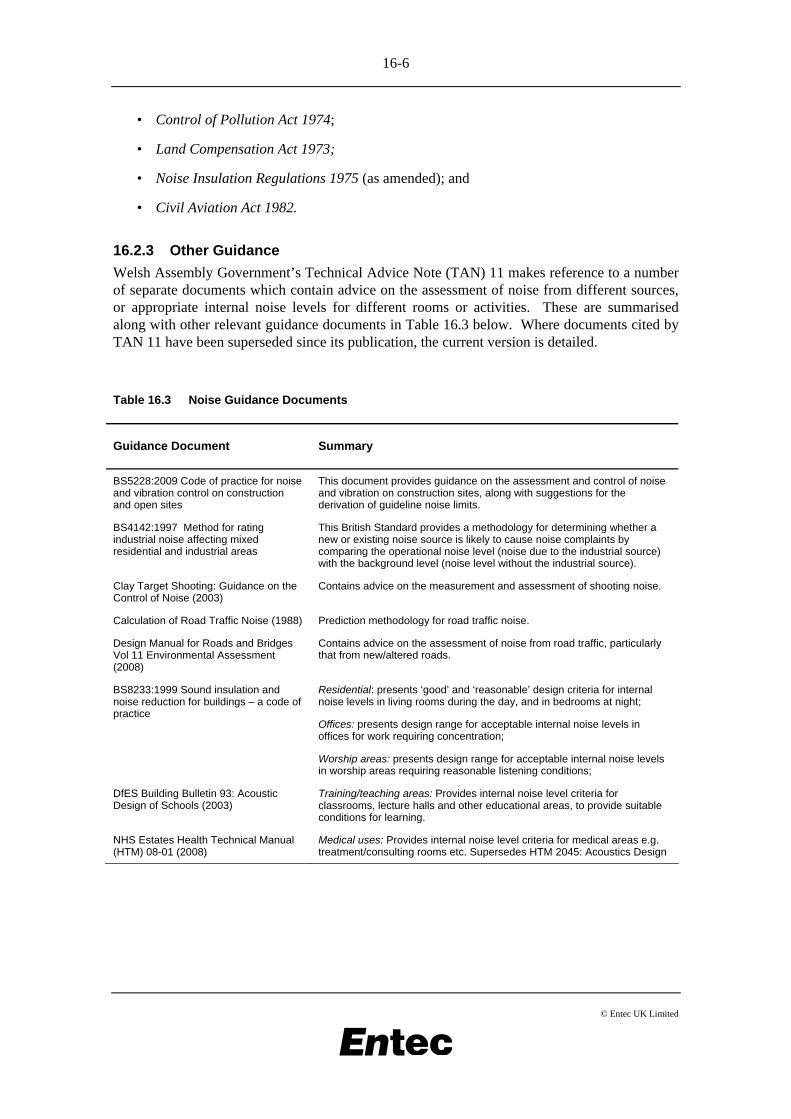
Welsh Assembly Government’s Technical Advice Note (TAN) 11 makes reference to a number of separate documents which contain advice on the assessment of noise from different sources, or appropriate internal noise levels for different rooms or activities. These are summarised along with other relevant guidance documents in Table 16.3 below. Where documents cited by TAN 11 have been superseded since its publication, the current version is detailed.
Table 16.3 Noise Guidance Documents
Guidance Document Summary
BS5228:2009 Code of practice for noise and vibration control on construction and open sites
This document provides guidance on the assessment and control of noise and vibration on construction sites, along with suggestions for the derivation of guideline noise limits.
BS4142:1997 Method for rating industrial noise affecting mixed residential and industrial areas
This British Standard provides a methodology for determining whether a new or existing noise source is likely to cause noise complaints by comparing the operational noise level (noise due to the industrial source) with the background level (noise level without the industrial source).
Clay Target Shooting: Guidance on the Control of Noise (2003)
Contains advice on the measurement and assessment of shooting noise.
Calculation of Road Traffic Noise (1988) Prediction methodology for road traffic noise.
Design Manual for Roads and Bridges Vol 11 Environmental Assessment (2008)
Contains advice on the assessment of noise from road traffic, particularly that from new/altered roads.
BS8233:1999 Sound insulation and noise reduction for buildings – a code of practice
Residential: presents ‘good’ and ‘reasonable’ design criteria for internal noise levels in living rooms during the day, and in bedrooms at night;
Offices: presents design range for acceptable internal noise levels in offices for work requiring concentration;
Worship areas: presents design range for acceptable internal noise levels in worship areas requiring reasonable listening conditions;
DfES Building Bulletin 93: Acoustic Design of Schools (2003)
Training/teaching areas: Provides internal noise level criteria for classrooms, lecture halls and other educational areas, to provide suitable conditions for learning.
NHS Estates Health Technical Manual (HTM) 08-01 (2008)
Medical uses: Provides internal noise level criteria for medical areas e.g. treatment/consulting rooms etc. Supersedes HTM 2045: Acoustics Design
16-7
© Entec UK Limited
Table 16.3 (continued) Noise Guidance Documents
Guidance Document Summary
Bespoke BREEAM Assessment (BRE Environmental Assessment Method) (2006 with revisions ongoing)
A bespoke BREEAM assessment has been devised for this development. Section HW17 of the assessment requires compliance with requirements including consideration of internal noise levels in various spaces, including offices, kitchen/dining areas, teaching/educational spaces, acoustically sensitive spaces e.g. lecture halls, health and leisure area, workshops etc.
The requirements are based on BS8233, BB93 and HTM 08-01, as described above.
World Health Organisation Guidelines for Community Noise (1999)
Presents guideline noise levels for community noise in specific environments e.g. outdoor living areas and outside bedrooms.
16.3 Approach to Data Gathering
This noise and vibration assessment relies on data gathered directly in the field by Entec, but also on data supplied to Entec by a number of other organisations (see Chapter 1). In particular, data concerning the future baseline and development scenarios has been supplied by Walker Beak Mason, acoustic consultants to the Welsh Assembly Government for the Aerospace Business Park, and by Capita Symonds, acoustic consultants to Metrix for certain aspects of the Defence Technical College, and Service Families Accommodation.
Consultation with the Pollution Control Officer (PCO) of the Vale of Glamorgan Council concerning the approach to data gathering has been undertaken at key stages during the EIA process. A meeting was held in August 2007 between Entec and the PCO to discuss the approach to baseline noise monitoring, at which the monitoring locations and methodologies were agreed. Discussions have also been held between Entec and the PCO concerning the sources of desk study information.
16.3.1 Desk Study
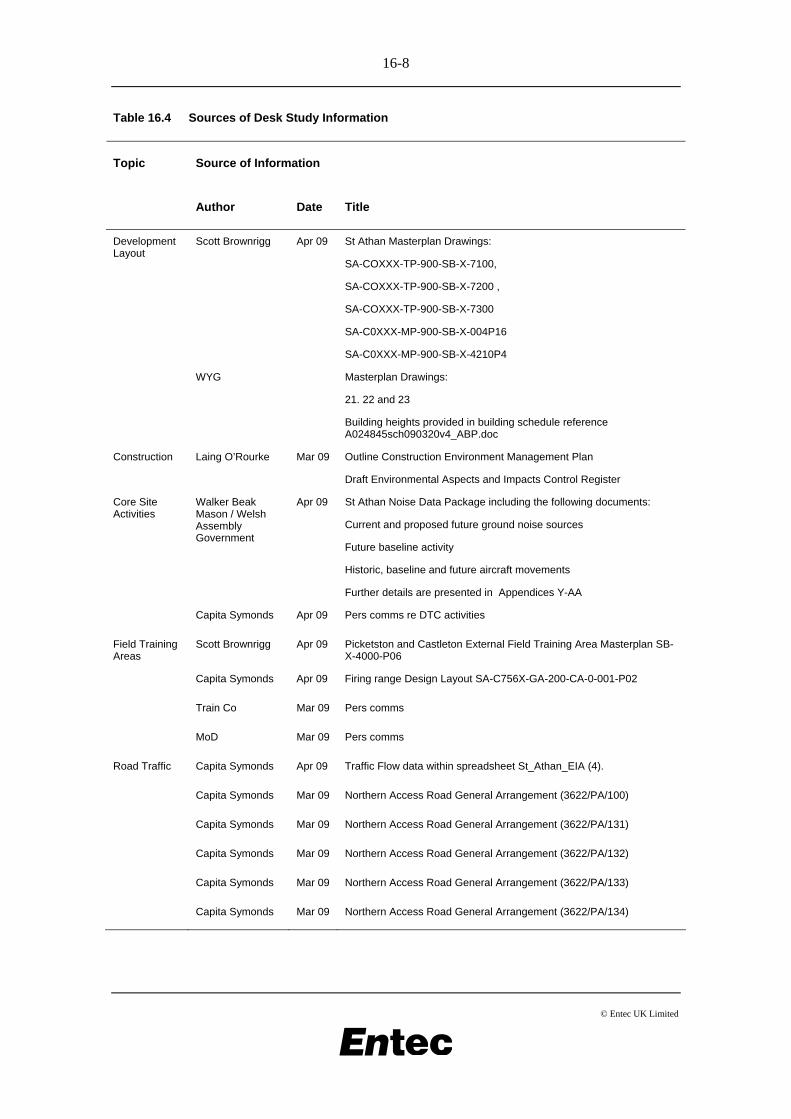
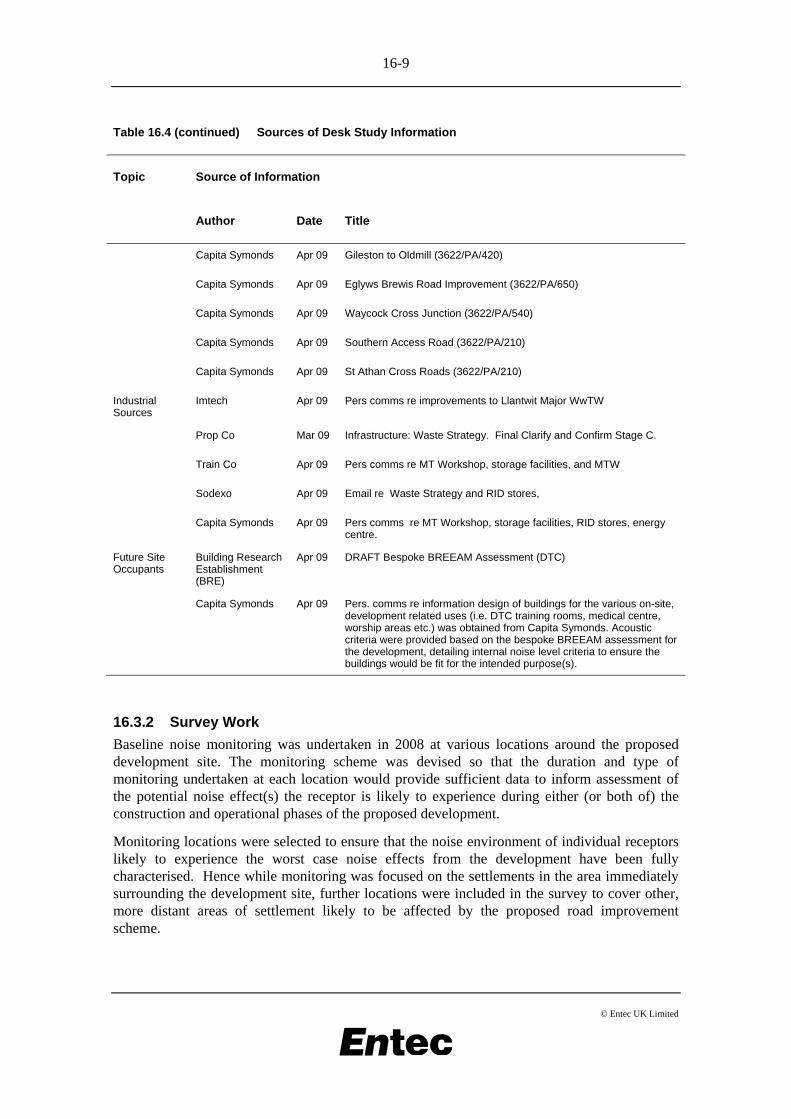
The desk study exercise which commenced during the scoping phase of the EIA, and continued throughout the EIA process has made reference to the sources of information summarised in Table 16.4. The information sources have been grouped by their relevance to the type of noise assessment undertaken. The remaining sections of this chapter continue to use this structure where relevant.
16-8
© Entec UK Limited
Table 16.4 Sources of Desk Study Information
Source of Information Topic
Author Date Title
Development Layout
Scott Brownrigg Apr 09 St Athan Masterplan Drawings:
SA-COXXX-TP-900-SB-X-7100,
SA-COXXX-TP-900-SB-X-7200 ,
SA-COXXX-TP-900-SB-X-7300
SA-C0XXX-MP-900-SB-X-004P16
SA-C0XXX-MP-900-SB-X-4210P4
WYG Masterplan Drawings:
21. 22 and 23
Building heights provided in building schedule reference A024845sch090320v4_ABP.doc
Construction Laing O’Rourke Mar 09 Outline Construction Environment Management Plan
Draft Environmental Aspects and Impacts Control Register
Core Site Activities
Walker Beak Mason / Welsh Assembly Government
Apr 09 St Athan Noise Data Package including the following documents:
Current and proposed future ground noise sources
Future baseline activity
Historic, baseline and future aircraft movements
Further details are presented in Appendices Y-AA
Capita Symonds Apr 09 Pers comms re DTC activities
Field Training Areas
Scott Brownrigg Apr 09 Picketston and Castleton External Field Training Area Masterplan SB-X-4000-P06
Capita Symonds Apr 09 Firing range Design Layout SA-C756X-GA-200-CA-0-001-P02
Train Co Mar 09 Pers comms
MoD Mar 09 Pers comms
Road Traffic Capita Symonds Apr 09 Traffic Flow data within spreadsheet St_Athan_EIA (4).
Capita Symonds Mar 09 Northern Access Road General Arrangement (3622/PA/100)
Capita Symonds Mar 09 Northern Access Road General Arrangement (3622/PA/131)
Capita Symonds Mar 09 Northern Access Road General Arrangement (3622/PA/132)
Capita Symonds Mar 09 Northern Access Road General Arrangement (3622/PA/133)
Capita Symonds Mar 09 Northern Access Road General Arrangement (3622/PA/134)
16-9
© Entec UK Limited
Table 16.4 (continued) Sources of Desk Study Information
Source of Information Topic
Author Date Title
Capita Symonds Apr 09 Gileston to Oldmill (3622/PA/420)
Capita Symonds Apr 09 Eglyws Brewis Road Improvement (3622/PA/650)
Capita Symonds Apr 09 Waycock Cross Junction (3622/PA/540)
Capita Symonds Apr 09 Southern Access Road (3622/PA/210)
Capita Symonds Apr 09 St Athan Cross Roads (3622/PA/210)
Industrial Sources
Imtech Apr 09 Pers comms re improvements to Llantwit Major WwTW
Prop Co Mar 09 Infrastructure: Waste Strategy. Final Clarify and Confirm Stage C.
Train Co Apr 09 Pers comms re MT Workshop, storage facilities, and MTW
Sodexo Apr 09 Email re Waste Strategy and RID stores,
Capita Symonds Apr 09 Pers comms re MT Workshop, storage facilities, RID stores, energy centre.
Future Site Occupants
Building Research Establishment (BRE)
Apr 09 DRAFT Bespoke BREEAM Assessment (DTC)
Capita Symonds Apr 09 Pers. comms re information design of buildings for the various on-site, development related uses (i.e. DTC training rooms, medical centre, worship areas etc.) was obtained from Capita Symonds. Acoustic criteria were provided based on the bespoke BREEAM assessment for the development, detailing internal noise level criteria to ensure the buildings would be fit for the intended purpose(s).
16.3.2 Survey Work
Baseline noise monitoring was undertaken in 2008 at various locations around the proposed development site. The monitoring scheme was devised so that the duration and type of monitoring undertaken at each location would provide sufficient data to inform assessment of the potential noise effect(s) the receptor is likely to experience during either (or both of) the construction and operational phases of the proposed development.
Monitoring locations were selected to ensure that the noise environment of individual receptors likely to experience the worst case noise effects from the development have been fully characterised. Hence while monitoring was focused on the settlements in the area immediately surrounding the development site, further locations were included in the survey to cover other, more distant areas of settlement likely to be affected by the proposed road improvement scheme.
16-10
© Entec UK Limited
The survey consisted of a combination of manned and unmanned measurements of various durations, conducted over a two week period between Tuesday 12th February 2008 and Wednesday 27th of February 2008. The monitoring proposals were developed in consultation with Pollution Control at VoGC, and the proposed scheme was agreed prior to commencement. Measurement positions were fine-tuned at each receptor based on the availability of suitable free-field locations, as well as security and access constraints.
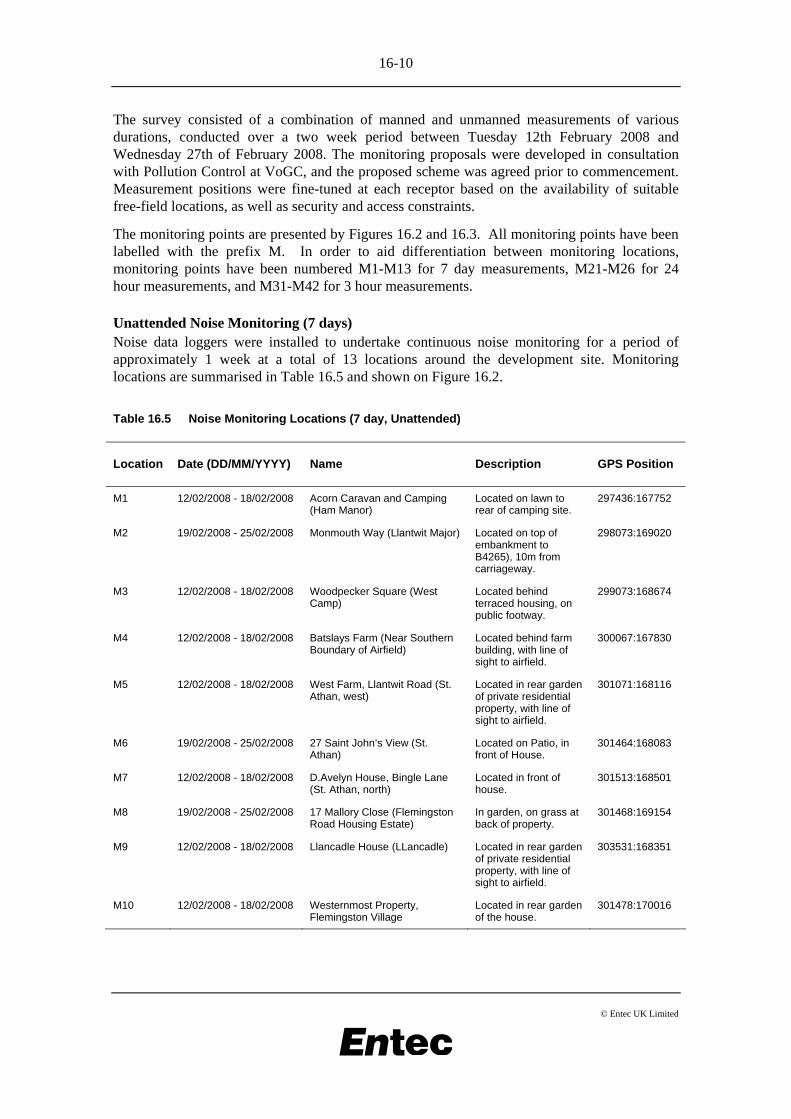
The monitoring points are presented by Figures 16.2 and 16.3. All monitoring points have been labelled with the prefix M. In order to aid differentiation between monitoring locations, monitoring points have been numbered M1-M13 for 7 day measurements, M21-M26 for 24 hour measurements, and M31-M42 for 3 hour measurements.
Unattended Noise Monitoring (7 days) Noise data loggers were installed to undertake continuous noise monitoring for a period of approximately 1 week at a total of 13 locations around the development site. Monitoring locations are summarised in Table 16.5 and shown on Figure 16.2.
Table 16.5 Noise Monitoring Locations (7 day, Unattended)
Location Date (DD/MM/YYYY) Name Description GPS Position
M1 12/02/2008 - 18/02/2008 Acorn Caravan and Camping (Ham Manor)
Located on lawn to rear of camping site.
297436:167752
M2 19/02/2008 - 25/02/2008 Monmouth Way (Llantwit Major) Located on top of embankment to B4265), 10m from carriageway.
298073:169020
M3 12/02/2008 - 18/02/2008 Woodpecker Square (West Camp)
Located behind terraced housing, on public footway.
299073:168674
M4 12/02/2008 - 18/02/2008 Batslays Farm (Near Southern Boundary of Airfield)
Located behind farm building, with line of sight to airfield.
300067:167830
M5 12/02/2008 - 18/02/2008 West Farm, Llantwit Road (St. Athan, west)
Located in rear garden of private residential property, with line of sight to airfield.
301071:168116
M6 19/02/2008 - 25/02/2008 27 Saint John’s View (St. Athan)
Located on Patio, in front of House.
301464:168083
M7 12/02/2008 - 18/02/2008 D.Avelyn House, Bingle Lane (St. Athan, north)
Located in front of house.
301513:168501
M8 19/02/2008 - 25/02/2008 17 Mallory Close (Flemingston Road Housing Estate)
In garden, on grass at back of property.
301468:169154
M9 12/02/2008 - 18/02/2008 Llancadle House (LLancadle) Located in rear garden of private residential property, with line of sight to airfield.
303531:168351
M10 12/02/2008 - 18/02/2008 Westernmost Property, Flemingston Village
Located in rear garden of the house.
301478:170016
16-11
© Entec UK Limited
Table 16.5 (continued) Noise Monitoring Locations (7 day, Unattended)
Location Date (DD/MM/YYYY) Name Description GPS Position
M11 19/02/2008 - 25/02/2008 26 Sycamore Avenue (Eglwys-Brewis, East)
Located at the rear of the house.
300893:169365
M12 12/02/2008 - 18/02/2008 23 Picketston Close (Eglwys-Brewis, west)
Located at the rear of the house, on a patio.
300505:169227
M13 19/02/2008 - 25/02/2008 Picketston Farm (Picketston) Located on farmland, secured to wire fence.
300155:169670
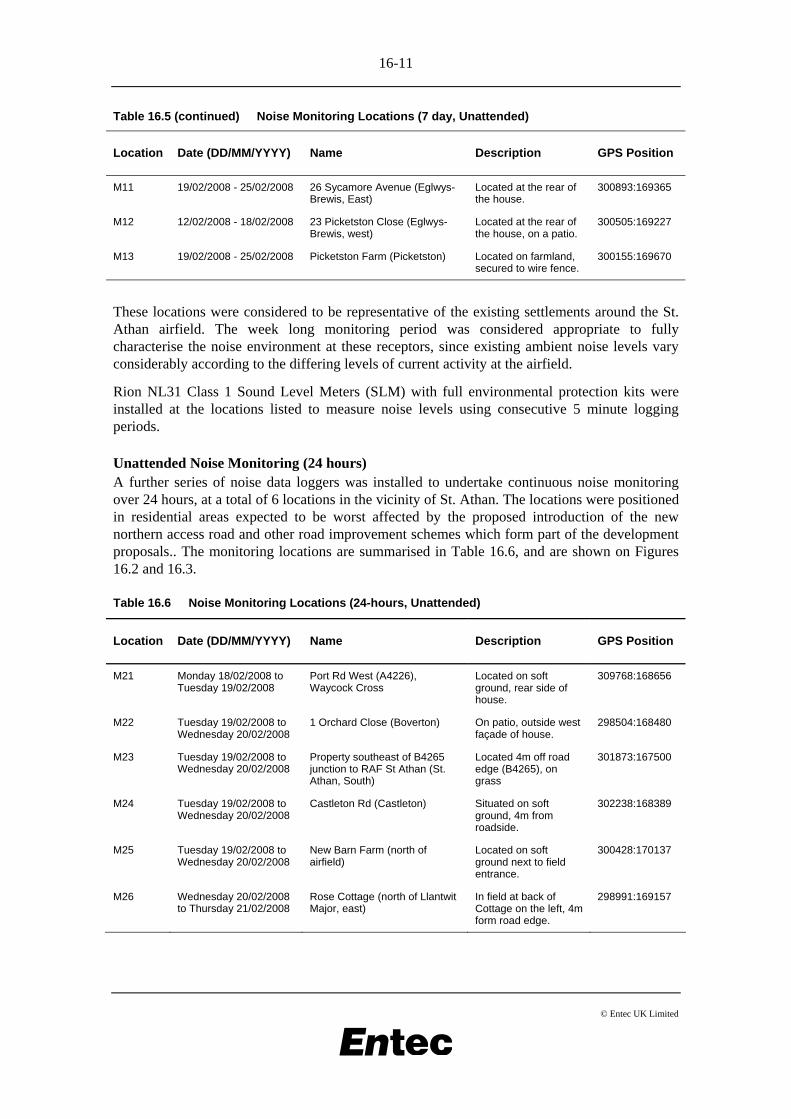
These locations were considered to be representative of the existing settlements around the St. Athan airfield. The week long monitoring period was considered appropriate to fully characterise the noise environment at these receptors, since existing ambient noise levels vary considerably according to the differing levels of current activity at the airfield.
Rion NL31 Class 1 Sound Level Meters (SLM) with full environmental protection kits were installed at the locations listed to measure noise levels using consecutive 5 minute logging periods.
Unattended Noise Monitoring (24 hours) A further series of noise data loggers was installed to undertake continuous noise monitoring over 24 hours, at a total of 6 locations in the vicinity of St. Athan. The locations were positioned in residential areas expected to be worst affected by the proposed introduction of the new northern access road and other road improvement schemes which form part of the development proposals.. The monitoring locations are summarised in Table 16.6, and are shown on Figures 16.2 and 16.3.
Table 16.6 Noise Monitoring Locations (24-hours, Unattended)
Location Date (DD/MM/YYYY) Name Description GPS Position
M21 Monday 18/02/2008 to Tuesday 19/02/2008
Port Rd West (A4226), Waycock Cross
Located on soft ground, rear side of house.
309768:168656
M22 Tuesday 19/02/2008 to Wednesday 20/02/2008
1 Orchard Close (Boverton) On patio, outside west façade of house.
298504:168480
M23 Tuesday 19/02/2008 to Wednesday 20/02/2008
Property southeast of B4265 junction to RAF St Athan (St. Athan, South)
Located 4m off road edge (B4265), on grass
301873:167500
M24 Tuesday 19/02/2008 to Wednesday 20/02/2008
Castleton Rd (Castleton) Situated on soft ground, 4m from roadside.
302238:168389
M25 Tuesday 19/02/2008 to Wednesday 20/02/2008
New Barn Farm (north of airfield)
Located on soft ground next to field entrance.
300428:170137
M26 Wednesday 20/02/2008 to Thursday 21/02/2008
Rose Cottage (north of Llantwit Major, east)
In field at back of Cottage on the left, 4m form road edge.
298991:169157
16-12
© Entec UK Limited
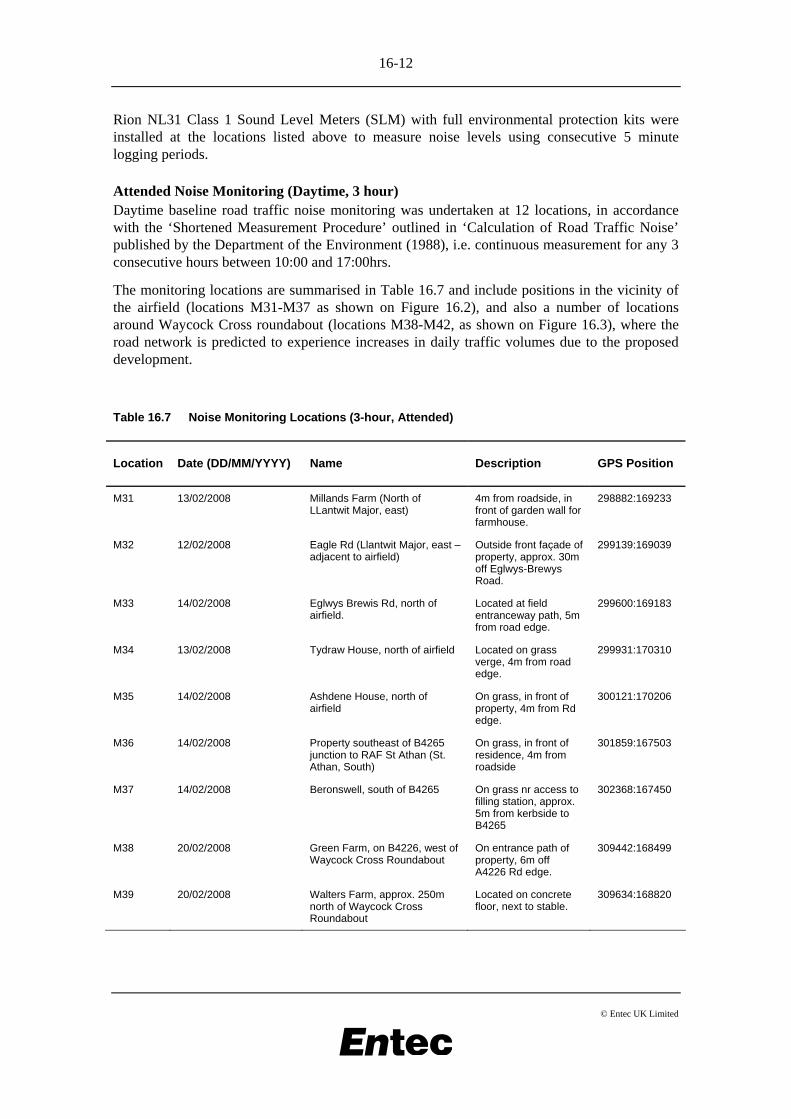
Rion NL31 Class 1 Sound Level Meters (SLM) with full environmental protection kits were installed at the locations listed above to measure noise levels using consecutive 5 minute logging periods.
Attended Noise Monitoring (Daytime, 3 hour) Daytime baseline road traffic noise monitoring was undertaken at 12 locations, in accordance with the ‘Shortened Measurement Procedure’ outlined in ‘Calculation of Road Traffic Noise’ published by the Department of the Environment (1988), i.e. continuous measurement for any 3 consecutive hours between 10:00 and 17:00hrs.
The monitoring locations are summarised in Table 16.7 and include positions in the vicinity of the airfield (locations M31-M37 as shown on Figure 16.2), and also a number of locations around Waycock Cross roundabout (locations M38-M42, as shown on Figure 16.3), where the road network is predicted to experience increases in daily traffic volumes due to the proposed development.
Table 16.7 Noise Monitoring Locations (3-hour, Attended)
Location Date (DD/MM/YYYY) Name Description GPS Position
M31 13/02/2008 Millands Farm (North of LLantwit Major, east)
4m from roadside, in front of garden wall for farmhouse.
298882:169233
M32 12/02/2008 Eagle Rd (Llantwit Major, east – adjacent to airfield)
Outside front façade of property, approx. 30m off Eglwys-Brewys Road.
299139:169039
M33 14/02/2008 Eglwys Brewis Rd, north of airfield.
Located at field entranceway path, 5m from road edge.
299600:169183
M34 13/02/2008 Tydraw House, north of airfield Located on grass verge, 4m from road edge.
299931:170310
M35 14/02/2008 Ashdene House, north of airfield
On grass, in front of property, 4m from Rd edge.
300121:170206
M36 14/02/2008 Property southeast of B4265 junction to RAF St Athan (St. Athan, South)
On grass, in front of residence, 4m from roadside
301859:167503
M37 14/02/2008 Beronswell, south of B4265 On grass nr access to filling station, approx. 5m from kerbside to B4265
302368:167450
M38 20/02/2008 Green Farm, on B4226, west of Waycock Cross Roundabout
On entrance path of property, 6m off A4226 Rd edge.
309442:168499
M39 20/02/2008 Walters Farm, approx. 250m north of Waycock Cross Roundabout
Located on concrete floor, next to stable.
309634:168820
16-13
© Entec UK Limited
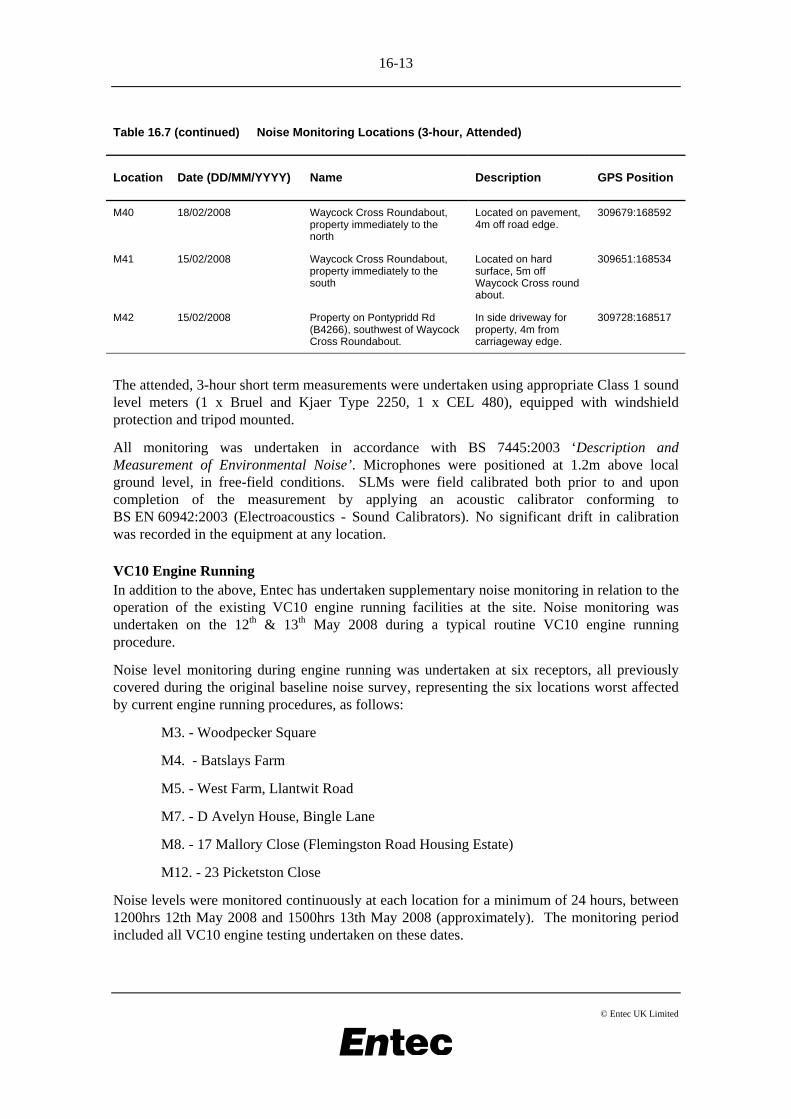
Table 16.7 (continued) Noise Monitoring Locations (3-hour, Attended)
Location Date (DD/MM/YYYY) Name Description GPS Position
M40 18/02/2008 Waycock Cross Roundabout, property immediately to the north
Located on pavement, 4m off road edge.
309679:168592
M41 15/02/2008 Waycock Cross Roundabout, property immediately to the south
Located on hard surface, 5m off Waycock Cross round about.
309651:168534
M42 15/02/2008 Property on Pontypridd Rd (B4266), southwest of Waycock Cross Roundabout.
In side driveway for property, 4m from carriageway edge.
309728:168517
The attended, 3-hour short term measurements were undertaken using appropriate Class 1 sound level meters (1 x Bruel and Kjaer Type 2250, 1 x CEL 480), equipped with windshield protection and tripod mounted.
All monitoring was undertaken in accordance with BS 7445:2003 ‘Description and Measurement of Environmental Noise’. Microphones were positioned at 1.2m above local ground level, in free-field conditions. SLMs were field calibrated both prior to and upon completion of the measurement by applying an acoustic calibrator conforming to BS EN 60942:2003 (Electroacoustics - Sound Calibrators). No significant drift in calibration was recorded in the equipment at any location.
VC10 Engine Running In addition to the above, Entec has undertaken supplementary noise monitoring in relation to the operation of the existing VC10 engine running facilities at the site. Noise monitoring was undertaken on the 12th & 13th May 2008 during a typical routine VC10 engine running procedure.
Noise level monitoring during engine running was undertaken at six receptors, all previously covered during the original baseline noise survey, representing the six locations worst affected by current engine running procedures, as follows:
M3. - Woodpecker Square
M4. - Batslays Farm
M5. - West Farm, Llantwit Road
M7. - D Avelyn House, Bingle Lane
M8. - 17 Mallory Close (Flemingston Road Housing Estate)
M12. - 23 Picketston Close
Noise levels were monitored continuously at each location for a minimum of 24 hours, between 1200hrs 12th May 2008 and 1500hrs 13th May 2008 (approximately). The monitoring period included all VC10 engine testing undertaken on these dates.
16-14
© Entec UK Limited
Noise levels were recorded continuously in 5 minute logging periods using a series of Rion NL-31 Class 1 sound level meters, in full environmental protection apparatus. The measurement methodology was based on that contained within BS 7445:2003 ‘Description and measurement of environmental noise – Part 1: Guide to quantities and procedures”.
Microphones were positioned at 1.2m above local ground level, in free-field conditions. SLMs were field calibrated both prior to and upon completion of the measurement by applying an acoustic calibrator conforming to BS EN 60942:2003 (Electroacoustics - Sound Calibrators). No significant drift in calibration was recorded in the equipment at any location.
It should be noted that the data obtained on the 12-13th May 2008 could, unfortunately, be subject to some adverse influence from weather conditions. Due to circumstances beyond Entec’s control, the VC10 testing was conducted on dates during which relatively high winds, in a predominantly ENE direction, were prevalent across the area. On the 12th May 5 minute average windspeeds reached highs of 11mph, with gusts up to 17mph in an ENE direction. On the 13th May 5 minute average wind speeds reached highs of 11mph, with gusts up to 18mph. However, there was no significant precipitation on either date. Measured noise levels at locations upwind may be quieter than would occur in clam conditions, whilst noise levels measured downwind may be elevated.
16.4 Overall Noise Baseline
The baseline noise environment has been characterised in two ways: monitoring and modelling. The monitored baseline has been established by undertaking an extensive programme of monitoring at selected sensitive receptors in the vicinity of the development site and associated infrastructure improvements. These measurements have been used to assist the development of noise models generated using the computational noise modelling software LimA. The development of current baseline noise models which are tested against the monitoring data has ensured that the models used to predict the noise effects associated with the development are as realistic as possible. Future baseline models have also been developed which reflect changes in the noise environment which can reasonably be foreseen and would occur should the St Athan development not receive planning permission. Examples of this include the cessation of DSG’s activities and the natural increase in road traffic flows. Further detail on the assumptions underlying the future baseline is provided in section 16.4.2.
The results of the noise monitoring are detailed in section 16.4.1 as they are applicable to all of the different types of noise assessment being undertaken. For ease of reference, the modelled current and future baseline results are described in the Assessment of Effects sections (16.8 to 16.14), adjacent to the results of the various assessments.
16.4.1 Current Measured Baseline
The current measured baseline comprises the results of the measurements undertaken at selected locations during February 2008 and the supplementary monitoring carried out during the VC10 engine running in May 2008. The monitoring results are presented in graphical format in Appendix W and are discussed and summarised below.
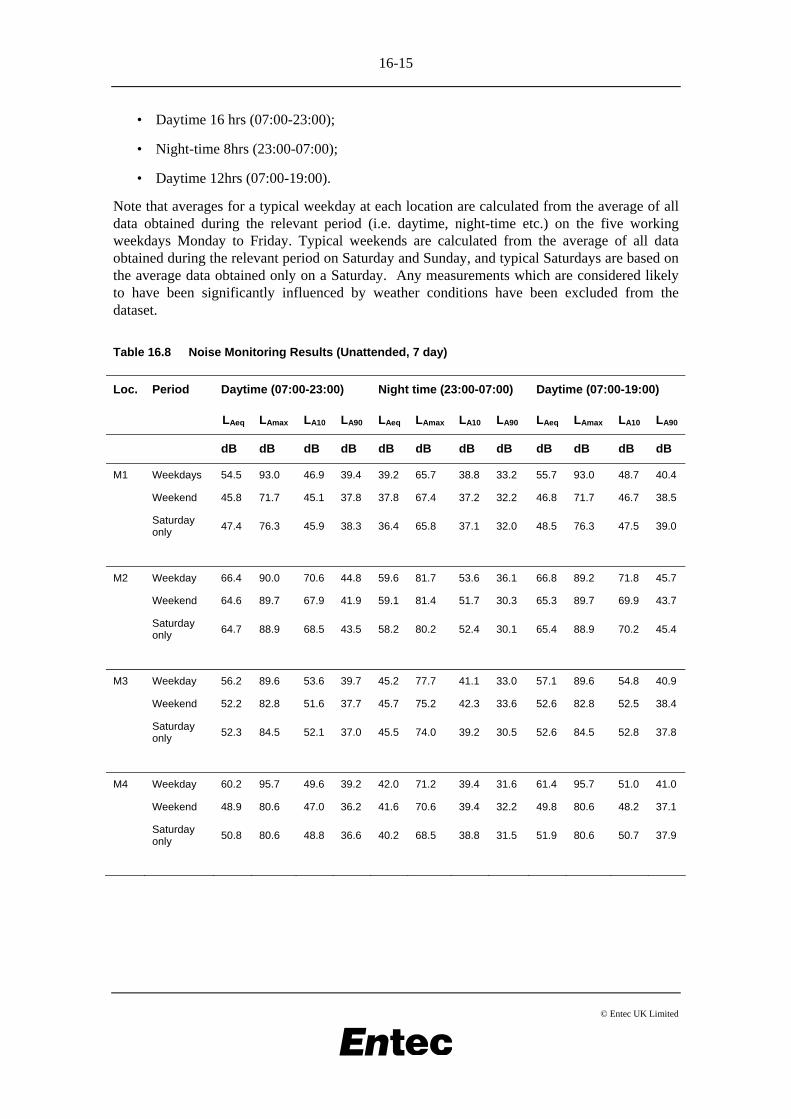
A summary of the results of the 7-day and 24-hour unattended noise monitoring survey are presented in Table 16.8 and Table 16.9 respectively. Average noise levels, in terms of LAeq,, LA10 and LA90, along with the maximum LAmax, are presented for the following periods:
16-15
© Entec UK Limited
• Daytime 16 hrs (07:00-23:00);
• Night-time 8hrs (23:00-07:00);
• Daytime 12hrs (07:00-19:00).
Note that averages for a typical weekday at each location are calculated from the average of all data obtained during the relevant period (i.e. daytime, night-time etc.) on the five working weekdays Monday to Friday. Typical weekends are calculated from the average of all data obtained during the relevant period on Saturday and Sunday, and typical Saturdays are based on the average data obtained only on a Saturday. Any measurements which are considered likely to have been significantly influenced by weather conditions have been excluded from the dataset.
Table 16.8 Noise Monitoring Results (Unattended, 7 day)
Loc. Period Daytime (07:00-23:00) Night time (23:00-07:00) Daytime (07:00-19:00)
LAeq LAmax LA10 LA90 LAeq LAmax LA10 LA90 LAeq LAmax LA10 LA90
dB dB dB dB dB dB dB dB dB dB dB dB
M1 Weekdays 54.5 93.0 46.9 39.4 39.2 65.7 38.8 33.2 55.7 93.0 48.7 40.4
Weekend 45.8 71.7 45.1 37.8 37.8 67.4 37.2 32.2 46.8 71.7 46.7 38.5
Saturday only 47.4 76.3 45.9 38.3 36.4 65.8 37.1 32.0 48.5 76.3 47.5 39.0
M2 Weekday 66.4 90.0 70.6 44.8 59.6 81.7 53.6 36.1 66.8 89.2 71.8 45.7
Weekend 64.6 89.7 67.9 41.9 59.1 81.4 51.7 30.3 65.3 89.7 69.9 43.7
Saturday only 64.7 88.9 68.5 43.5 58.2 80.2 52.4 30.1 65.4 88.9 70.2 45.4
M3 Weekday 56.2 89.6 53.6 39.7 45.2 77.7 41.1 33.0 57.1 89.6 54.8 40.9
Weekend 52.2 82.8 51.6 37.7 45.7 75.2 42.3 33.6 52.6 82.8 52.5 38.4
Saturday only 52.3 84.5 52.1 37.0 45.5 74.0 39.2 30.5 52.6 84.5 52.8 37.8
M4 Weekday 60.2 95.7 49.6 39.2 42.0 71.2 39.4 31.6 61.4 95.7 51.0 41.0
Weekend 48.9 80.6 47.0 36.2 41.6 70.6 39.4 32.2 49.8 80.6 48.2 37.1
Saturday only 50.8 80.6 48.8 36.6 40.2 68.5 38.8 31.5 51.9 80.6 50.7 37.9
16-16
© Entec UK Limited
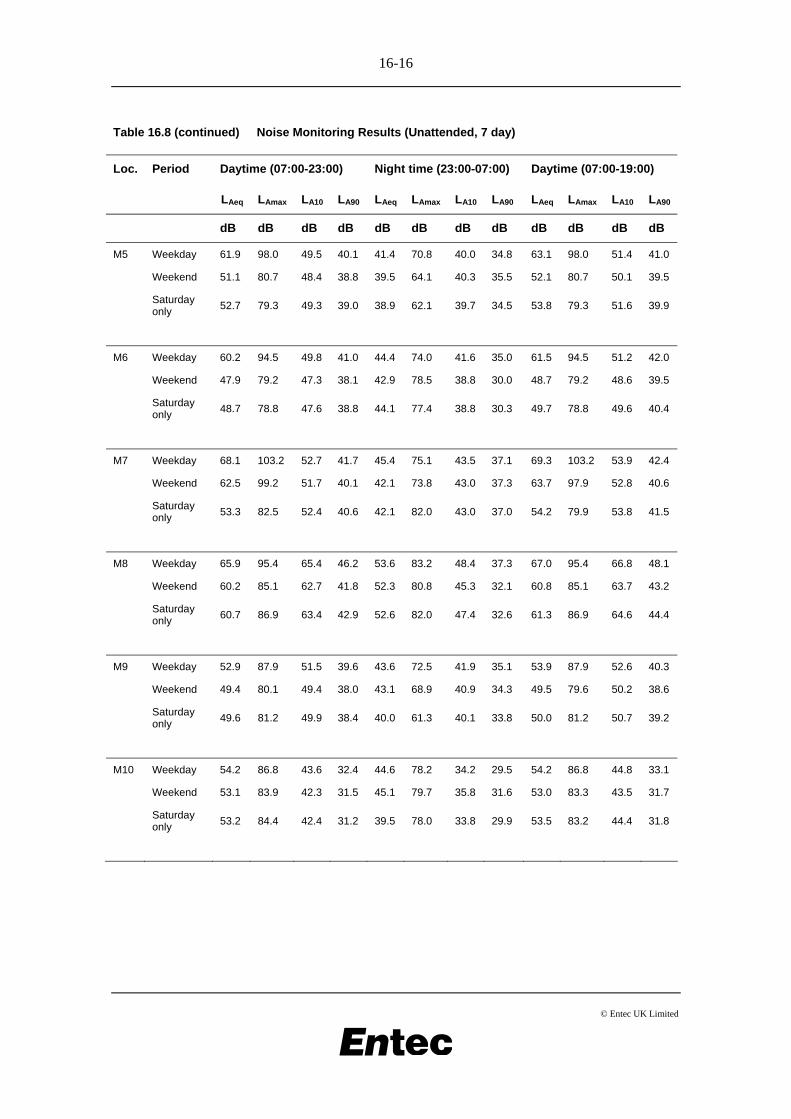
Table 16.8 (continued) Noise Monitoring Results (Unattended, 7 day)
Loc. Period Daytime (07:00-23:00) Night time (23:00-07:00) Daytime (07:00-19:00)
LAeq LAmax LA10 LA90 LAeq LAmax LA10 LA90 LAeq LAmax LA10 LA90
dB dB dB dB dB dB dB dB dB dB dB dB
M5 Weekday 61.9 98.0 49.5 40.1 41.4 70.8 40.0 34.8 63.1 98.0 51.4 41.0
Weekend 51.1 80.7 48.4 38.8 39.5 64.1 40.3 35.5 52.1 80.7 50.1 39.5
Saturday only 52.7 79.3 49.3 39.0 38.9 62.1 39.7 34.5 53.8 79.3 51.6 39.9
M6 Weekday 60.2 94.5 49.8 41.0 44.4 74.0 41.6 35.0 61.5 94.5 51.2 42.0
Weekend 47.9 79.2 47.3 38.1 42.9 78.5 38.8 30.0 48.7 79.2 48.6 39.5
Saturday only 48.7 78.8 47.6 38.8 44.1 77.4 38.8 30.3 49.7 78.8 49.6 40.4
M7 Weekday 68.1 103.2 52.7 41.7 45.4 75.1 43.5 37.1 69.3 103.2 53.9 42.4
Weekend 62.5 99.2 51.7 40.1 42.1 73.8 43.0 37.3 63.7 97.9 52.8 40.6
Saturday only 53.3 82.5 52.4 40.6 42.1 82.0 43.0 37.0 54.2 79.9 53.8 41.5
M8 Weekday 65.9 95.4 65.4 46.2 53.6 83.2 48.4 37.3 67.0 95.4 66.8 48.1
Weekend 60.2 85.1 62.7 41.8 52.3 80.8 45.3 32.1 60.8 85.1 63.7 43.2
Saturday only 60.7 86.9 63.4 42.9 52.6 82.0 47.4 32.6 61.3 86.9 64.6 44.4
M9 Weekday 52.9 87.9 51.5 39.6 43.6 72.5 41.9 35.1 53.9 87.9 52.6 40.3
Weekend 49.4 80.1 49.4 38.0 43.1 68.9 40.9 34.3 49.5 79.6 50.2 38.6
Saturday only 49.6 81.2 49.9 38.4 40.0 61.3 40.1 33.8 50.0 81.2 50.7 39.2
M10 Weekday 54.2 86.8 43.6 32.4 44.6 78.2 34.2 29.5 54.2 86.8 44.8 33.1
Weekend 53.1 83.9 42.3 31.5 45.1 79.7 35.8 31.6 53.0 83.3 43.5 31.7
Saturday only 53.2 84.4 42.4 31.2 39.5 78.0 33.8 29.9 53.5 83.2 44.4 31.8
16-17
© Entec UK Limited
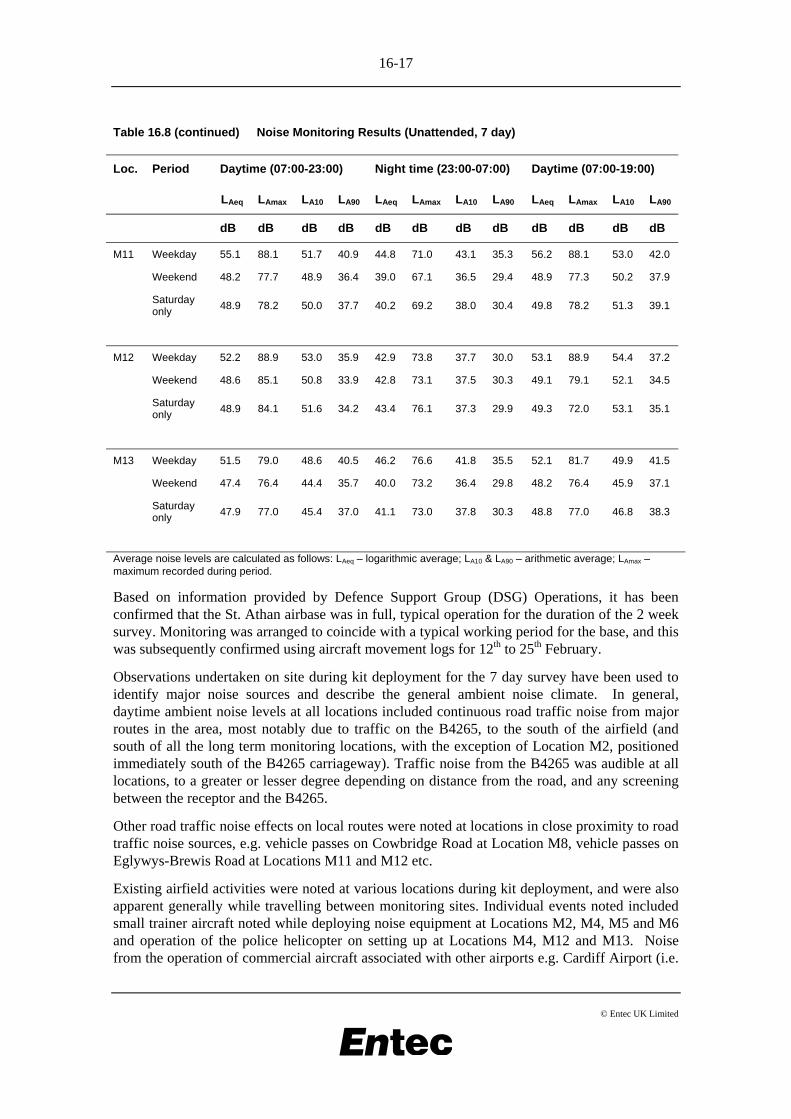
Table 16.8 (continued) Noise Monitoring Results (Unattended, 7 day)
Loc. Period Daytime (07:00-23:00) Night time (23:00-07:00) Daytime (07:00-19:00)
LAeq LAmax LA10 LA90 LAeq LAmax LA10 LA90 LAeq LAmax LA10 LA90
dB dB dB dB dB dB dB dB dB dB dB dB
M11 Weekday 55.1 88.1 51.7 40.9 44.8 71.0 43.1 35.3 56.2 88.1 53.0 42.0
Weekend 48.2 77.7 48.9 36.4 39.0 67.1 36.5 29.4 48.9 77.3 50.2 37.9
Saturday only 48.9 78.2 50.0 37.7 40.2 69.2 38.0 30.4 49.8 78.2 51.3 39.1
M12 Weekday 52.2 88.9 53.0 35.9 42.9 73.8 37.7 30.0 53.1 88.9 54.4 37.2
Weekend 48.6 85.1 50.8 33.9 42.8 73.1 37.5 30.3 49.1 79.1 52.1 34.5
Saturday only 48.9 84.1 51.6 34.2 43.4 76.1 37.3 29.9 49.3 72.0 53.1 35.1
M13 Weekday 51.5 79.0 48.6 40.5 46.2 76.6 41.8 35.5 52.1 81.7 49.9 41.5
Weekend 47.4 76.4 44.4 35.7 40.0 73.2 36.4 29.8 48.2 76.4 45.9 37.1
Saturday only 47.9 77.0 45.4 37.0 41.1 73.0 37.8 30.3 48.8 77.0 46.8 38.3
Average noise levels are calculated as follows: LAeq – logarithmic average; LA10 & LA90 – arithmetic average; LAmax – maximum recorded during period.
Based on information provided by Defence Support Group (DSG) Operations, it has been confirmed that the St. Athan airbase was in full, typical operation for the duration of the 2 week survey. Monitoring was arranged to coincide with a typical working period for the base, and this was subsequently confirmed using aircraft movement logs for 12th to 25th February.
Observations undertaken on site during kit deployment for the 7 day survey have been used to identify major noise sources and describe the general ambient noise climate. In general, daytime ambient noise levels at all locations included continuous road traffic noise from major routes in the area, most notably due to traffic on the B4265, to the south of the airfield (and south of all the long term monitoring locations, with the exception of Location M2, positioned immediately south of the B4265 carriageway). Traffic noise from the B4265 was audible at all locations, to a greater or lesser degree depending on distance from the road, and any screening between the receptor and the B4265.
Other road traffic noise effects on local routes were noted at locations in close proximity to road traffic noise sources, e.g. vehicle passes on Cowbridge Road at Location M8, vehicle passes on Eglywys-Brewis Road at Locations M11 and M12 etc.
Existing airfield activities were noted at various locations during kit deployment, and were also apparent generally while travelling between monitoring sites. Individual events noted included small trainer aircraft noted while deploying noise equipment at Locations M2, M4, M5 and M6 and operation of the police helicopter on setting up at Locations M4, M12 and M13. Noise from the operation of commercial aircraft associated with other airports e.g. Cardiff Airport (i.e.
16-18
© Entec UK Limited
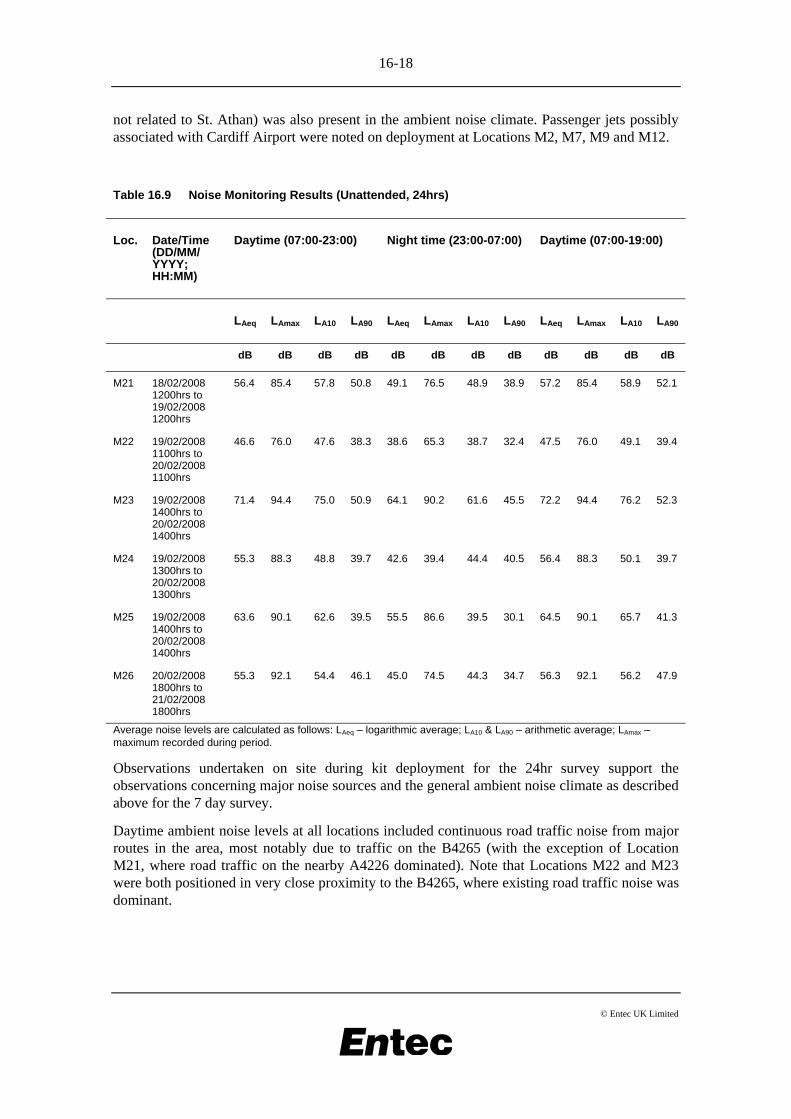
not related to St. Athan) was also present in the ambient noise climate. Passenger jets possibly associated with Cardiff Airport were noted on deployment at Locations M2, M7, M9 and M12.
Table 16.9 Noise Monitoring Results (Unattended, 24hrs)
Loc. Date/Time (DD/MM/ YYYY; HH:MM)
Daytime (07:00-23:00) Night time (23:00-07:00) Daytime (07:00-19:00)
LAeq LAmax LA10 LA90 LAeq LAmax LA10 LA90 LAeq LAmax LA10 LA90
dB dB dB dB dB dB dB dB dB dB dB dB
M21 18/02/2008 1200hrs to 19/02/2008 1200hrs
56.4 85.4 57.8 50.8 49.1 76.5 48.9 38.9 57.2 85.4 58.9 52.1
M22 19/02/2008 1100hrs to 20/02/2008 1100hrs
46.6 76.0 47.6 38.3 38.6 65.3 38.7 32.4 47.5 76.0 49.1 39.4
M23 19/02/2008 1400hrs to 20/02/2008 1400hrs
71.4 94.4 75.0 50.9 64.1 90.2 61.6 45.5 72.2 94.4 76.2 52.3
M24 19/02/2008 1300hrs to 20/02/2008 1300hrs
55.3 88.3 48.8 39.7 42.6 39.4 44.4 40.5 56.4 88.3 50.1 39.7
M25 19/02/2008 1400hrs to 20/02/2008 1400hrs
63.6 90.1 62.6 39.5 55.5 86.6 39.5 30.1 64.5 90.1 65.7 41.3
M26 20/02/2008 1800hrs to 21/02/2008 1800hrs
55.3 92.1 54.4 46.1 45.0 74.5 44.3 34.7 56.3 92.1 56.2 47.9
Average noise levels are calculated as follows: LAeq – logarithmic average; LA10 & LA90 – arithmetic average; LAmax – maximum recorded during period.
Observations undertaken on site during kit deployment for the 24hr survey support the observations concerning major noise sources and the general ambient noise climate as described above for the 7 day survey.
Daytime ambient noise levels at all locations included continuous road traffic noise from major routes in the area, most notably due to traffic on the B4265 (with the exception of Location M21, where road traffic on the nearby A4226 dominated). Note that Locations M22 and M23 were both positioned in very close proximity to the B4265, where existing road traffic noise was dominant.
16-19
© Entec UK Limited
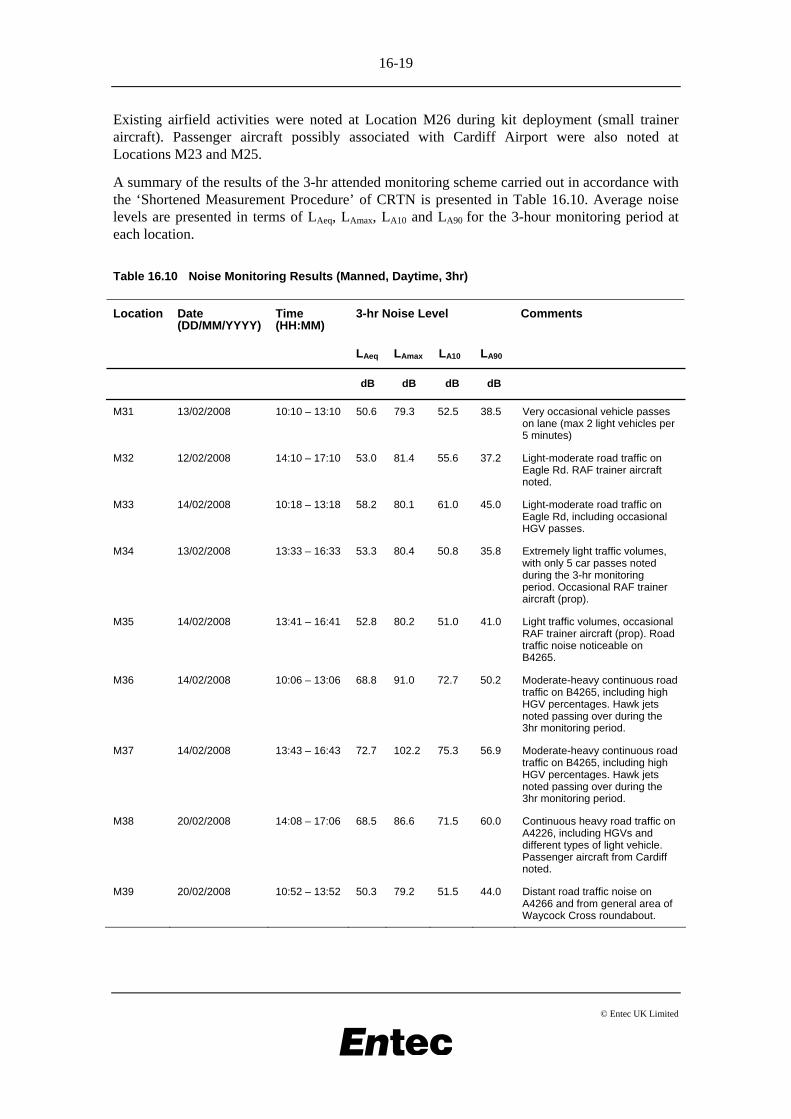
Existing airfield activities were noted at Location M26 during kit deployment (small trainer aircraft). Passenger aircraft possibly associated with Cardiff Airport were also noted at Locations M23 and M25.
A summary of the results of the 3-hr attended monitoring scheme carried out in accordance with the ‘Shortened Measurement Procedure’ of CRTN is presented in Table 16.10. Average noise levels are presented in terms of LAeq, LAmax, LA10 and LA90 for the 3-hour monitoring period at each location.
Table 16.10 Noise Monitoring Results (Manned, Daytime, 3hr)
Time (HH:MM)
3-hr Noise Level Comments Location Date (DD/MM/YYYY)
LAeq LAmax LA10 LA90
dB dB dB dB
M31 13/02/2008 10:10 – 13:10 50.6 79.3 52.5 38.5 Very occasional vehicle passes on lane (max 2 light vehicles per 5 minutes)
M32 12/02/2008 14:10 – 17:10 53.0 81.4 55.6 37.2 Light-moderate road traffic on Eagle Rd. RAF trainer aircraft noted.
M33 14/02/2008 10:18 – 13:18 58.2 80.1 61.0 45.0 Light-moderate road traffic on Eagle Rd, including occasional HGV passes.
M34 13/02/2008 13:33 – 16:33 53.3 80.4 50.8 35.8 Extremely light traffic volumes, with only 5 car passes noted during the 3-hr monitoring period. Occasional RAF trainer aircraft (prop).
M35 14/02/2008 13:41 – 16:41 52.8 80.2 51.0 41.0 Light traffic volumes, occasional RAF trainer aircraft (prop). Road traffic noise noticeable on B4265.
M36 14/02/2008 10:06 – 13:06 68.8 91.0 72.7 50.2 Moderate-heavy continuous road traffic on B4265, including high HGV percentages. Hawk jets noted passing over during the 3hr monitoring period.
M37 14/02/2008 13:43 – 16:43 72.7 102.2 75.3 56.9 Moderate-heavy continuous road traffic on B4265, including high HGV percentages. Hawk jets noted passing over during the 3hr monitoring period.
M38 20/02/2008 14:08 – 17:06 68.5 86.6 71.5 60.0 Continuous heavy road traffic on A4226, including HGVs and different types of light vehicle. Passenger aircraft from Cardiff noted.
M39 20/02/2008 10:52 – 13:52 50.3 79.2 51.5 44.0 Distant road traffic noise on A4266 and from general area of Waycock Cross roundabout.
16-20
© Entec UK Limited
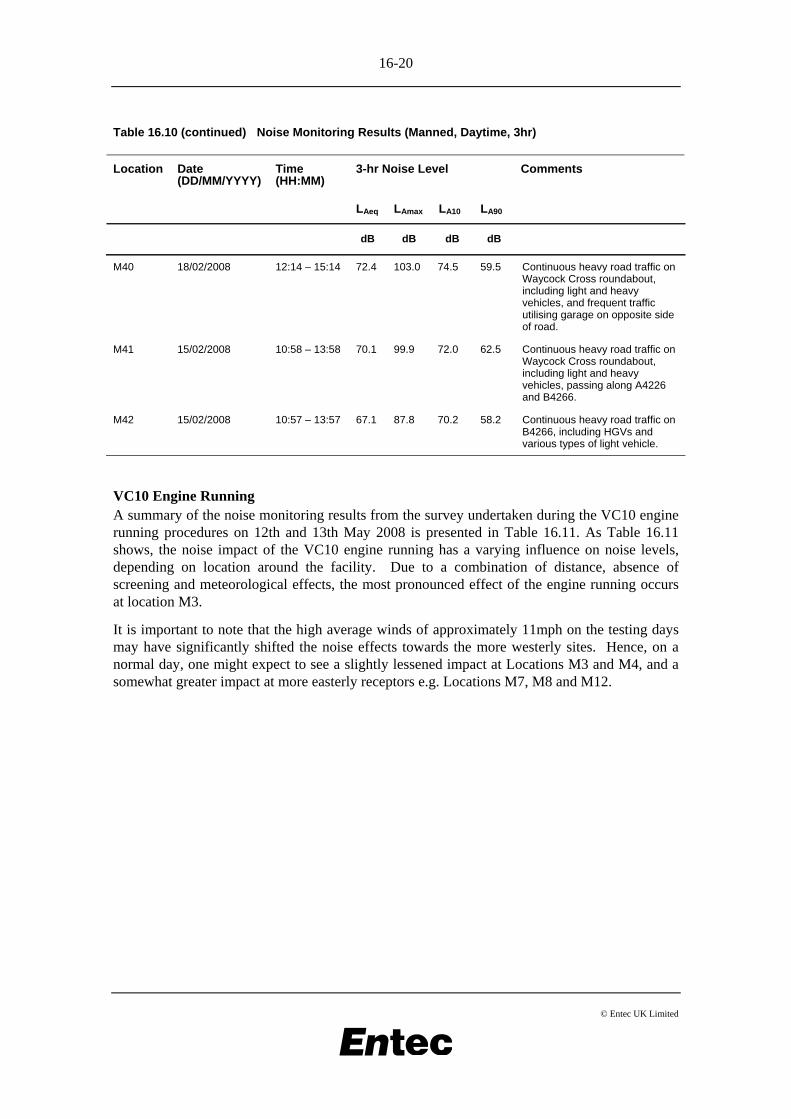
Table 16.10 (continued) Noise Monitoring Results (Manned, Daytime, 3hr)
Time (HH:MM)
3-hr Noise Level Comments Location Date (DD/MM/YYYY)
LAeq LAmax LA10 LA90
dB dB dB dB
M40 18/02/2008 12:14 – 15:14 72.4 103.0 74.5 59.5 Continuous heavy road traffic on Waycock Cross roundabout, including light and heavy vehicles, and frequent traffic utilising garage on opposite side of road.
M41 15/02/2008 10:58 – 13:58 70.1 99.9 72.0 62.5 Continuous heavy road traffic on Waycock Cross roundabout, including light and heavy vehicles, passing along A4226 and B4266.
M42 15/02/2008 10:57 – 13:57 67.1 87.8 70.2 58.2 Continuous heavy road traffic on B4266, including HGVs and various types of light vehicle.
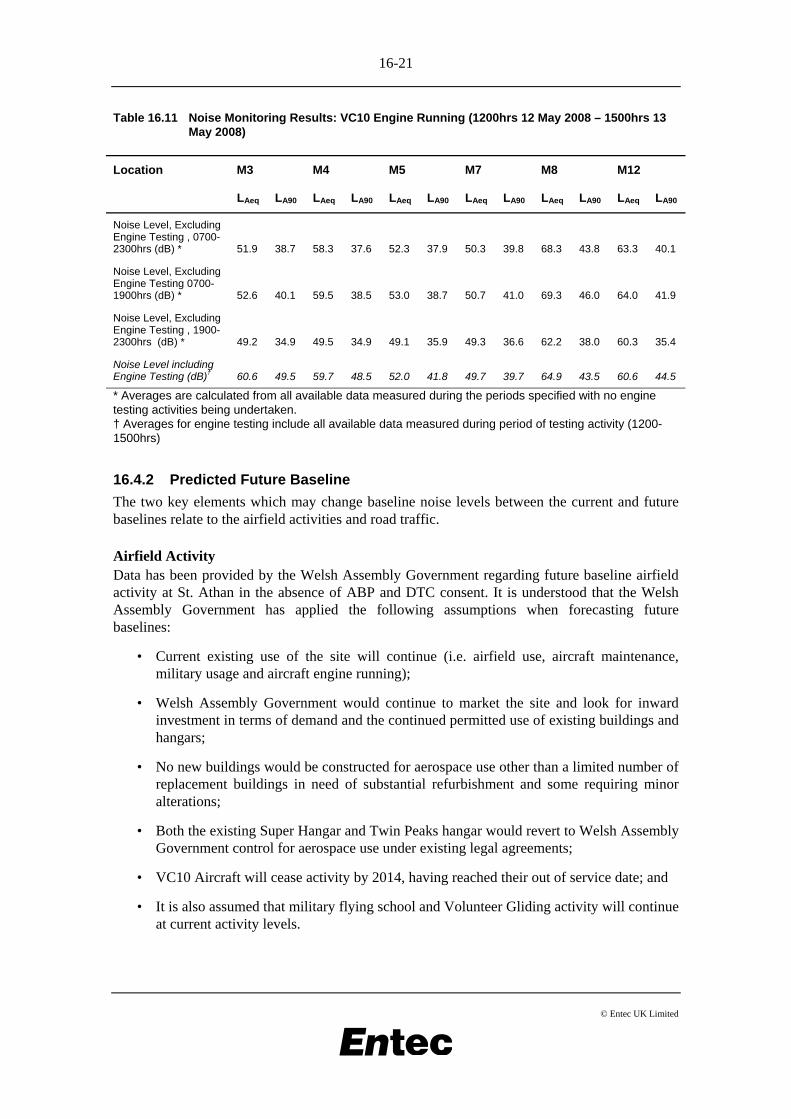
VC10 Engine Running A summary of the noise monitoring results from the survey undertaken during the VC10 engine running procedures on 12th and 13th May 2008 is presented in Table 16.11. As Table 16.11 shows, the noise impact of the VC10 engine running has a varying influence on noise levels, depending on location around the facility. Due to a combination of distance, absence of screening and meteorological effects, the most pronounced effect of the engine running occurs at location M3.
It is important to note that the high average winds of approximately 11mph on the testing days may have significantly shifted the noise effects towards the more westerly sites. Hence, on a normal day, one might expect to see a slightly lessened impact at Locations M3 and M4, and a somewhat greater impact at more easterly receptors e.g. Locations M7, M8 and M12.
16-21
© Entec UK Limited
Table 16.11 Noise Monitoring Results: VC10 Engine Running (1200hrs 12 May 2008 – 1500hrs 13 May 2008)
Location M3 M4 M5 M7 M8 M12
LAeq LA90 LAeq LA90 LAeq LA90 LAeq LA90 LAeq LA90 LAeq LA90
Noise Level, Excluding Engine Testing , 0700-2300hrs (dB) * 51.9 38.7 58.3 37.6 52.3 37.9 50.3 39.8 68.3 43.8 63.3 40.1
Noise Level, Excluding Engine Testing 0700-1900hrs (dB) * 52.6 40.1 59.5 38.5 53.0 38.7 50.7 41.0 69.3 46.0 64.0 41.9
Noise Level, Excluding Engine Testing , 1900-2300hrs (dB) * 49.2 34.9 49.5 34.9 49.1 35.9 49.3 36.6 62.2 38.0 60.3 35.4
Noise Level including Engine Testing (dB)† 60.6 49.5 59.7 48.5 52.0 41.8 49.7 39.7 64.9 43.5 60.6 44.5
* Averages are calculated from all available data measured during the periods specified with no engine testing activities being undertaken. † Averages for engine testing include all available data measured during period of testing activity (1200-1500hrs)
16.4.2 Predicted Future Baseline
The two key elements which may change baseline noise levels between the current and future baselines relate to the airfield activities and road traffic.
Airfield Activity Data has been provided by the Welsh Assembly Government regarding future baseline airfield activity at St. Athan in the absence of ABP and DTC consent. It is understood that the Welsh Assembly Government has applied the following assumptions when forecasting future baselines:
• Current existing use of the site will continue (i.e. airfield use, aircraft maintenance, military usage and aircraft engine running);
• Welsh Assembly Government would continue to market the site and look for inward investment in terms of demand and the continued permitted use of existing buildings and hangars;
• No new buildings would be constructed for aerospace use other than a limited number of replacement buildings in need of substantial refurbishment and some requiring minor alterations;
• Both the existing Super Hangar and Twin Peaks hangar would revert to Welsh Assembly Government control for aerospace use under existing legal agreements;
• VC10 Aircraft will cease activity by 2014, having reached their out of service date; and
• It is also assumed that military flying school and Volunteer Gliding activity will continue at current activity levels.
16-22
© Entec UK Limited
Existing Operations At present existing air movements amount to 15100 per year as set out in Appendix X. These existing operations include a series of uses from a range of aircraft and helicopters. The levels at which Britten–Norman, Bond Helicopters UK, UWAS and VGS operate are predicted to be at a similar rate to those levels in 2007/8.
Other visiting aircraft including helicopters and fixed-wing aircraft are predicted to continue at existing 2007/8 levels. It is also predicted that small turbo-props, small props, military fixed wing and helicopter aircraft, and other jets would continue to occur at 2007/8 levels.
Based on information provided by the Ministry of Defence, future military helicopter movements are predicted to be in the order of 160 movements per annum. Of these movements, all would occur during daytime hours. Future fixed wing movements will be approximately 110 aircraft movements per annum. Of these movements, it has been estimated that 98 would occur during the day and 12 during the night.
As mentioned, VC10 activities and engine running will cease by 2014. Therefore they will be excluded from the future baselines for 2014, 2020 and 2028.
Additional Aircraft Activity The information provided by the Welsh Assembly Government indicates that additional aircraft activity would occur above existing levels in the future. Future activities can be split into three sections; aircraft recycling, maintenance and general aviation. For the predicted future baseline in ABP Phase 1 in 2014, approximately 16,000 aircraft could be accommodated in total i.e. around 1,800 above existing which will continue unchanged. For the predicted future baseline in ABP Phase 2 in 2020, around 17,000 aircraft movement would occur in total i.e. approximately 2,700 additional aircraft. For the predicted future baseline in ABP Phase 3 in 2028, around 17,300 i.e. 3,100 additional aircraft of varying types. A full set of air traffic movements for the future baseline scenarios is presented in Appendix X.
Aircraft recycling, predicted to be predominantly focussed on the Boeing 737 would occur in working hours and would be fixed at daytime only. The recycling would occur in existing buildings. The Welsh Assembly Government predicts that approximately 4 movements associated with aircraft recycling would occur per annum.
The Welsh Assembly Government believes aircraft maintenance would occur on the site and would contribute to additional aircraft movements. The maintenance activities would occur for:
• Base maintenance (Boeing 737 type aircraft);
• Business jets and turboprops (such as Cessna Citation and Bombardier Dash-8 aircraft);
• Regional jets (such as the Bombardier CRJ700); and
• Helicopters (such as the A109).
The Welsh Assembly Government has also predicted additional general aviation (GA) at St Athan would occur, however, whilst this will be slow to start it is envisaged to increase. The information provided suggests that the number of GA using the site’s facilities in 2014 is predicted to be 75% of those in 2020 and 2028. The Welsh Assembly Government estimates that 80% of GA activity would occur between Friday and Sunday, with 20% occurring between Monday and Friday. When split into a weekday and weekend ratio, it is estimated that 47% of
16-23
© Entec UK Limited
GA activity will occur on weekdays and 53% on weekends, with more activity occurring on Friday during weekdays.
Maintenance, Repair and Overhaul and Engine Running In the absence of ABP consent, there will be extensive existing facilities for Maintenance, Repair and Overhaul (MRO) of aircraft particularly including Twin Peaks and the Super Hangar as well as other older hangars on parts of both West and East Camps. This will include the engine running. In April 2009 the Welsh Assembly Government issued through their noise consultants, forecasts for the number of aircraft running checks that would occur in the absence of ABP consent for the three phased design years of the development. The forecasts were produced by the Welsh Assembly Government’s aviation engineering and demand consultants, Atkins and Mott MacDonald. This data is presented in Appendix X.
The Welsh Assembly Government has identified that, in the absence of ABP consent, the MRO test facility would be located to the east of the disused cross runway at the current location of the VC10 engine running. It is predicted that it would be used for large aircraft engine running (including commercial / regional jets). The Welsh Assembly Government also confirmed that engine running of small rotary aircraft and helicopters would occur at the existing Harrier tie-down to the south of the disused cross runway. For both engine running locations, no specific noise screening is proposed for the MRO, although the existing Harrier tie-down area is currently surrounded on three sides by a grass bund.
The Welsh Assembly Government has provided data regarding the nature and duration of the number of engine tests that are predicted to occur at the MRO facility in each of the baseline years. This data is reported in Appendix Y. The MRO facility would be equipped to carry out six different types of fixed wing aircraft engine running and four different types of engine runs for helicopters of varying duration and varying engine power levels.
Road Traffic In the absence of the proposed development, future road traffic noise levels are expected to increase slightly. The baseline road traffic noise levels in the opening year, 2014, are predicted to increase between 0 and 2dB(A). For the future baseline year, 2028, road traffic noise levels are expected to increase by up to 3dB(A) when compared with the current baseline.
16.5 Environmental Measures Incorporated into the Scheme
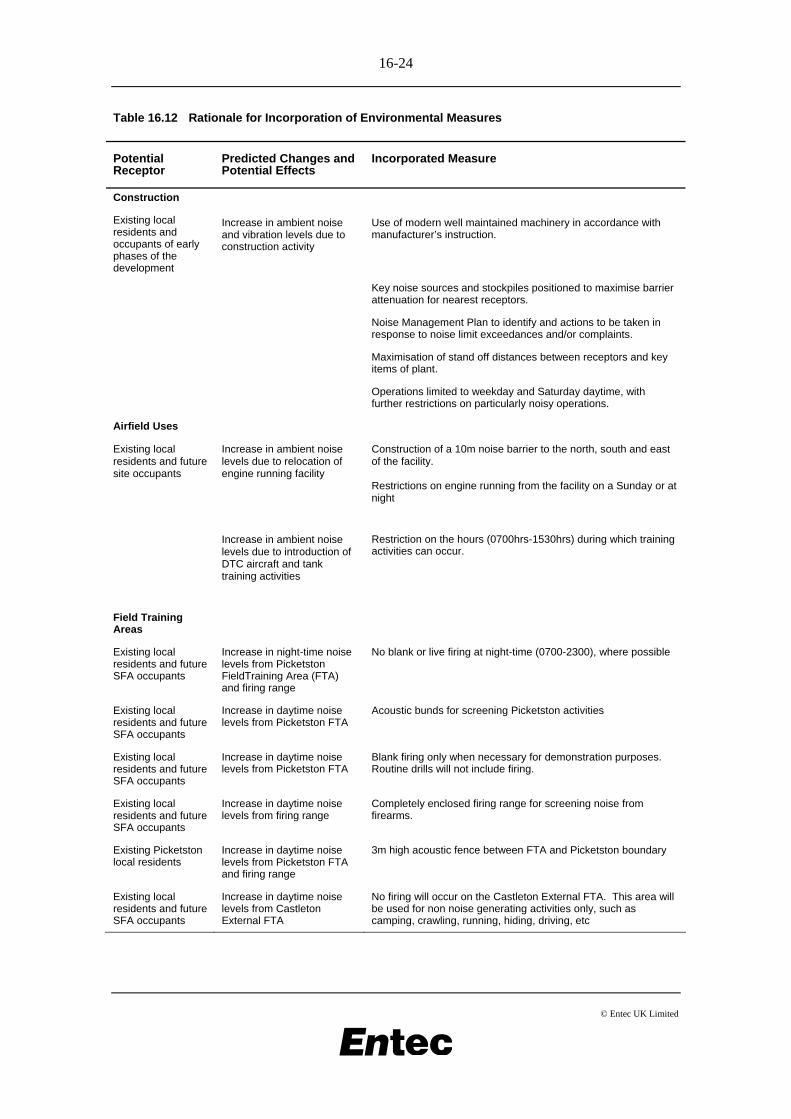
The control of noise and vibration emissions and the management of potential noise and vibration effects on sensitive receptors have been considered throughout the development design process. A number of design iterations have been carried out in order to ensure that potential noise and vibration effects are reduced where practical. This has resulted in a number of environmental measures incorporated into the scheme which are summarised in Table 16.12. Further detail is provided in Sections 16.8-16.14 Assessment of Effects.
16-24
© Entec UK Limited
Table 16.12 Rationale for Incorporation of Environmental Measures
Potential Receptor
Predicted Changes and Potential Effects
Incorporated Measure
Construction
Existing local residents and occupants of early phases of the development
Increase in ambient noise and vibration levels due to construction activity
Use of modern well maintained machinery in accordance with manufacturer’s instruction.
Key noise sources and stockpiles positioned to maximise barrier attenuation for nearest receptors.
Noise Management Plan to identify and actions to be taken in response to noise limit exceedances and/or complaints.
Maximisation of stand off distances between receptors and key items of plant.
Operations limited to weekday and Saturday daytime, with further restrictions on particularly noisy operations.
Airfield Uses
Existing local residents and future site occupants
Increase in ambient noise levels due to relocation of engine running facility
Construction of a 10m noise barrier to the north, south and east of the facility. Restrictions on engine running from the facility on a Sunday or at night
Increase in ambient noise levels due to introduction of DTC aircraft and tank training activities
Restriction on the hours (0700hrs-1530hrs) during which training activities can occur.
Field Training Areas
Existing local residents and future SFA occupants
Increase in night-time noise levels from Picketston FieldTraining Area (FTA) and firing range
No blank or live firing at night-time (0700-2300), where possible
Existing local residents and future SFA occupants
Increase in daytime noise levels from Picketston FTA
Acoustic bunds for screening Picketston activities
Existing local residents and future SFA occupants
Increase in daytime noise levels from Picketston FTA
Blank firing only when necessary for demonstration purposes. Routine drills will not include firing.
Existing local residents and future SFA occupants
Increase in daytime noise levels from firing range
Completely enclosed firing range for screening noise from firearms.
Existing Picketston local residents
Increase in daytime noise levels from Picketston FTA and firing range
3m high acoustic fence between FTA and Picketston boundary
Existing local residents and future SFA occupants
Increase in daytime noise levels from Castleton External FTA
No firing will occur on the Castleton External FTA. This area will be used for non noise generating activities only, such as camping, crawling, running, hiding, driving, etc
16-25
© Entec UK Limited
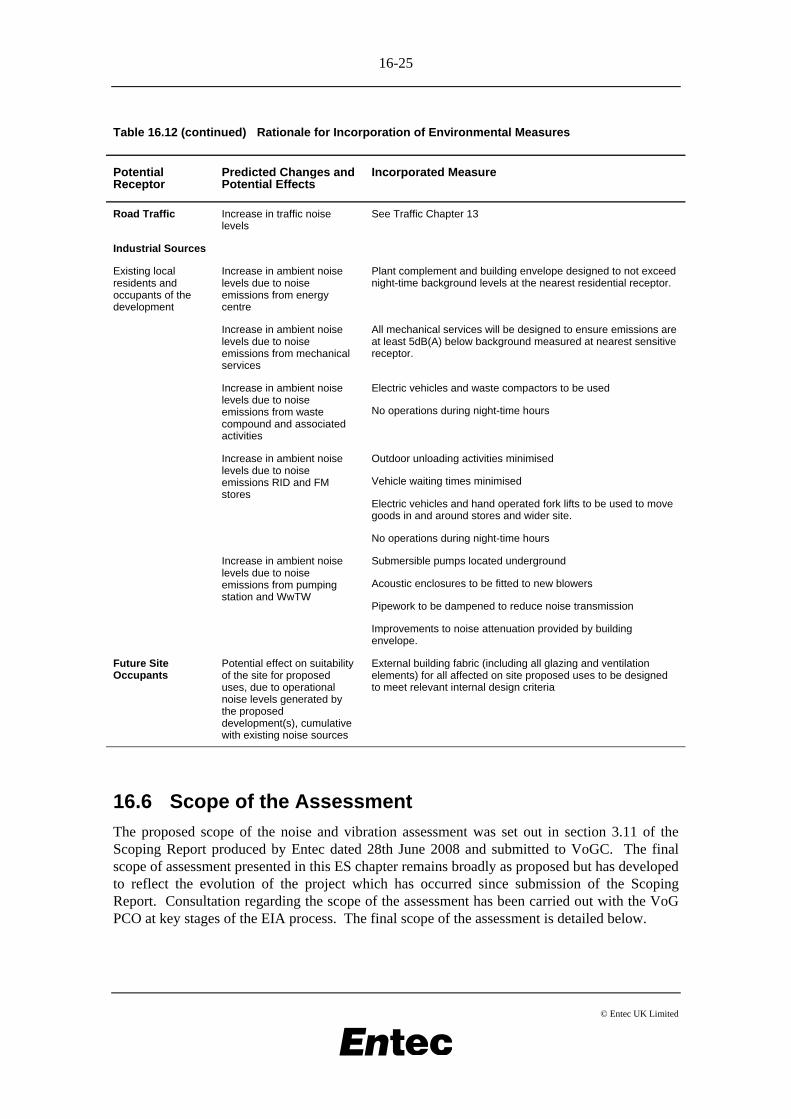
Table 16.12 (continued) Rationale for Incorporation of Environmental Measures
Potential Receptor
Predicted Changes and Potential Effects
Incorporated Measure
Road Traffic Increase in traffic noise levels
See Traffic Chapter 13
Industrial Sources
Existing local residents and occupants of the development
Increase in ambient noise levels due to noise emissions from energy centre
Plant complement and building envelope designed to not exceed night-time background levels at the nearest residential receptor.
Increase in ambient noise levels due to noise emissions from mechanical services
All mechanical services will be designed to ensure emissions are at least 5dB(A) below background measured at nearest sensitive receptor.
Increase in ambient noise levels due to noise emissions from waste compound and associated activities
Electric vehicles and waste compactors to be used
No operations during night-time hours
Increase in ambient noise levels due to noise emissions RID and FM stores
Outdoor unloading activities minimised
Vehicle waiting times minimised
Electric vehicles and hand operated fork lifts to be used to move goods in and around stores and wider site.
No operations during night-time hours
Increase in ambient noise levels due to noise emissions from pumping station and WwTW
Submersible pumps located underground
Acoustic enclosures to be fitted to new blowers
Pipework to be dampened to reduce noise transmission
Improvements to noise attenuation provided by building envelope.
Future Site Occupants
Potential effect on suitability of the site for proposed uses, due to operational noise levels generated by the proposed development(s), cumulative with existing noise sources
External building fabric (including all glazing and ventilation elements) for all affected on site proposed uses to be designed to meet relevant internal design criteria
16.6 Scope of the Assessment
The proposed scope of the noise and vibration assessment was set out in section 3.11 of the Scoping Report produced by Entec dated 28th June 2008 and submitted to VoGC. The final scope of assessment presented in this ES chapter remains broadly as proposed but has developed to reflect the evolution of the project which has occurred since submission of the Scoping Report. Consultation regarding the scope of the assessment has been carried out with the VoG PCO at key stages of the EIA process. The final scope of the assessment is detailed below.
16-26
© Entec UK Limited
16.6.1 Potential Receptors
There are two major groups of receptors which have the potential to be affected by noise and vibration emissions associated with the development:
• Existing noise sensitive receptors – including local residents (military and non-military), occupants of nearby sensitive commercial properties, occupants of nearby military facilities (West Camp), students and staff of schools, users of St Brise church yard (and other places of worship, such as The Gathering Place); and
• Future site occupants – including DTC staff and students, occupants of the ABP, residents of the SFA, occupants of the hotel, users of the community centre and crèche.
The existing noise sensitive receptors which have the potential to experience noise and vibration effects are located not only in close proximity to the main development site, but also to roads proposed for improvement and other sections of the highway network predicted to experience a change in traffic levels due to the scheme. In addition receptors near to the new rising main and Llantiwit Major WwTW may also be affected. The existing noise sensitive receptors are located in the following settlements:
• Picketston;
• Eglwys Brewis;
• Castleton;
• Beggars Pound;
• St Athan Village;
• West Camp;
• Eastern areas of Llantwit Major;
• Boverton;
• Llanmaes;
• Flemingston;
• Flemingston Road Housing Estate;
• Llancadle;
• Gileston Old Mill; and
• Waycock Cross.
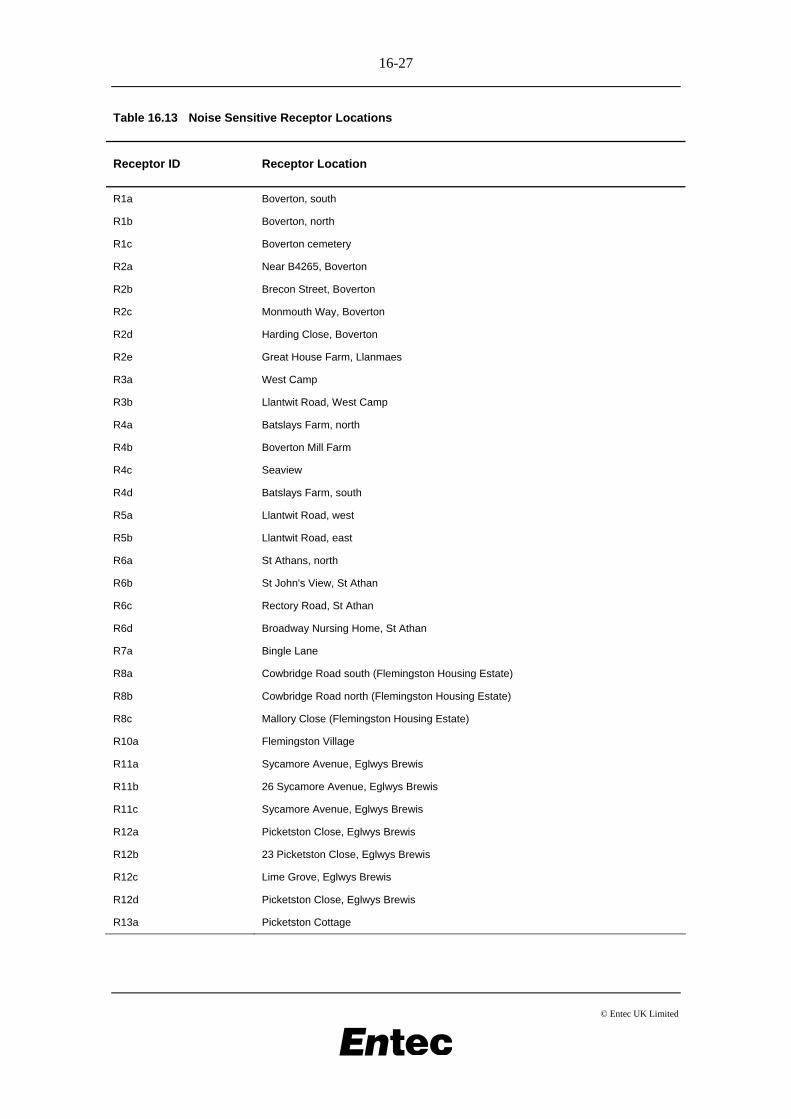
Table 16.13 below present a list of the receptors used in the various assessments of noise. These are also presented in Figure 16.4.
16-27
© Entec UK Limited
Table 16.13 Noise Sensitive Receptor Locations
Receptor ID Receptor Location
R1a Boverton, south
R1b Boverton, north
R1c Boverton cemetery
R2a Near B4265, Boverton
R2b Brecon Street, Boverton
R2c Monmouth Way, Boverton
R2d Harding Close, Boverton
R2e Great House Farm, Llanmaes
R3a West Camp
R3b Llantwit Road, West Camp
R4a Batslays Farm, north
R4b Boverton Mill Farm
R4c Seaview
R4d Batslays Farm, south
R5a Llantwit Road, west
R5b Llantwit Road, east
R6a St Athans, north
R6b St John's View, St Athan
R6c Rectory Road, St Athan
R6d Broadway Nursing Home, St Athan
R7a Bingle Lane
R8a Cowbridge Road south (Flemingston Housing Estate)
R8b Cowbridge Road north (Flemingston Housing Estate)
R8c Mallory Close (Flemingston Housing Estate)
R10a Flemingston Village
R11a Sycamore Avenue, Eglwys Brewis
R11b 26 Sycamore Avenue, Eglwys Brewis
R11c Sycamore Avenue, Eglwys Brewis
R12a Picketston Close, Eglwys Brewis
R12b 23 Picketston Close, Eglwys Brewis
R12c Lime Grove, Eglwys Brewis
R12d Picketston Close, Eglwys Brewis
R13a Picketston Cottage
16-28
© Entec UK Limited
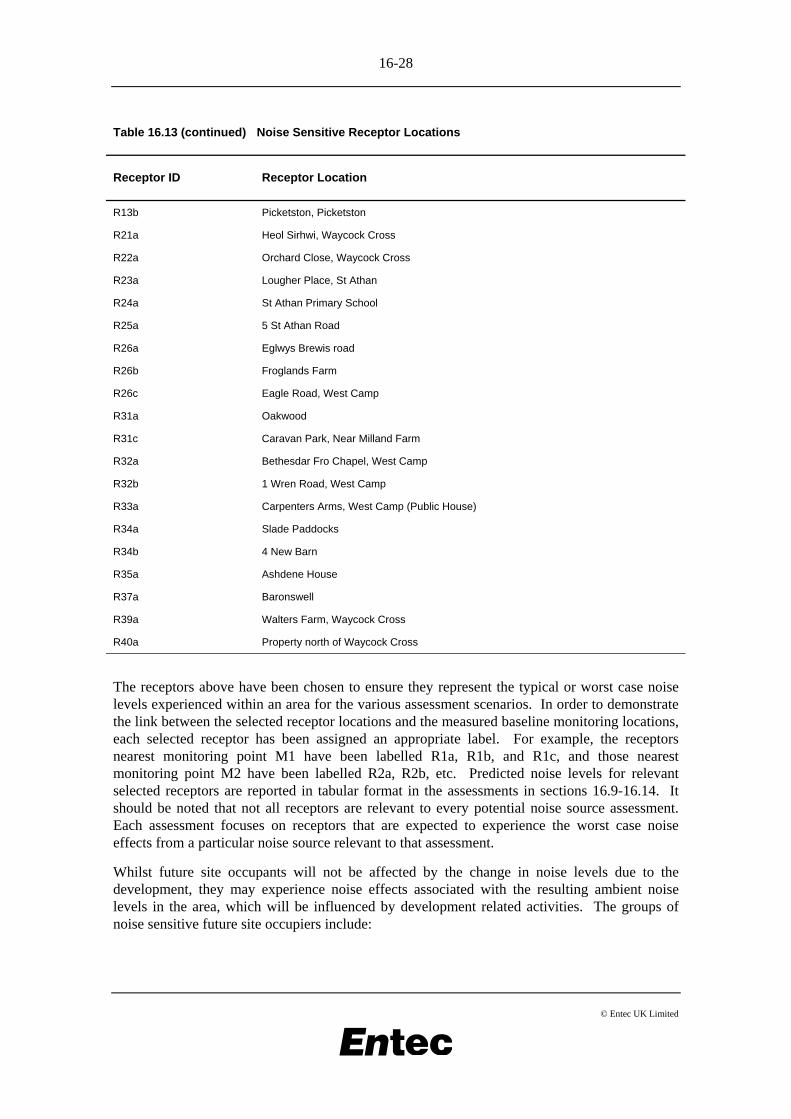
Table 16.13 (continued) Noise Sensitive Receptor Locations
Receptor ID Receptor Location
R13b Picketston, Picketston
R21a Heol Sirhwi, Waycock Cross
R22a Orchard Close, Waycock Cross
R23a Lougher Place, St Athan
R24a St Athan Primary School
R25a 5 St Athan Road
R26a Eglwys Brewis road
R26b Froglands Farm
R26c Eagle Road, West Camp
R31a Oakwood
R31c Caravan Park, Near Milland Farm
R32a Bethesdar Fro Chapel, West Camp
R32b 1 Wren Road, West Camp
R33a Carpenters Arms, West Camp (Public House)
R34a Slade Paddocks
R34b 4 New Barn
R35a Ashdene House
R37a Baronswell
R39a Walters Farm, Waycock Cross
R40a Property north of Waycock Cross
The receptors above have been chosen to ensure they represent the typical or worst case noise levels experienced within an area for the various assessment scenarios. In order to demonstrate the link between the selected receptor locations and the measured baseline monitoring locations, each selected receptor has been assigned an appropriate label. For example, the receptors nearest monitoring point M1 have been labelled R1a, R1b, and R1c, and those nearest monitoring point M2 have been labelled R2a, R2b, etc. Predicted noise levels for relevant selected receptors are reported in tabular format in the assessments in sections 16.9-16.14. It should be noted that not all receptors are relevant to every potential noise source assessment. Each assessment focuses on receptors that are expected to experience the worst case noise effects from a particular noise source relevant to that assessment.
Whilst future site occupants will not be affected by the change in noise levels due to the development, they may experience noise effects associated with the resulting ambient noise levels in the area, which will be influenced by development related activities. The groups of noise sensitive future site occupiers include:
16-29
© Entec UK Limited
Defence Technical College
• Residential Accommodation (Ranks village);
• Training Accommodation (Classrooms);
• Training workshops;
• Medical/dental unit;
• Museum;
• Worship Centres, and
• Offices.
Aerospace Business Park
• Office accommodation.
Service Families Accommodation (SFA)
• Tremains Farm;
• North of West Camp;
• Picketston South West; and
• Stadium/Golf Course.
Other Proposed Uses
• Community and crèche; and
• Hotel.
16.6.2 Potentially Significant Effects
Potentially significant noise and/or vibration effects could result from the construction and/or operation of many of the different land uses proposed as part of the development. Further detail on each land use is provided below.
Construction
• Increases in ambient noise and vibration levels during the construction period have the potential to affect the amenity of existing noise sensitive receptors;
• Increases in ambient noise and vibration levels during later phases of the construction period have the potential to affect the amenity of occupants of early phases of the development.
Core Site Activities
• Increases in ambient ground noise sources such as aircraft holds and taxiing, due to increased aircraft movements during daytime periods, have the potential to affect the amenity of existing noise sensitive receptors throughout each operational phase of the development;
16-30
© Entec UK Limited
• Increases in air noise due to increases in air traffic movements (ATMs) and relocation of the helipad due to the development, could affect the amenity of existing noise sensitive receptors throughout each operational phase of the development;
• Increases in ambient noise levels during aircraft engine running due to increased operations and changes in the location of the MRO engine running facilities could affect the amenity of existing and future noise sensitive receptors;
• Increases in ambient noise levels due to DTC training activities during the daytime could affect the amenity of existing and future noise sensitive receptors;
• Increases in ambient noise levels from combined airfield activity resulting from the development at existing and future noise sensitive receptors.
Field Training and External Training Areas
• Increases in ambient noise from service personnel using Picketston Field Training Area for ambush demonstrations may affect the amenity of existing receptors and future site occupiers, particularly Picketston SFA and Picketston village;
• Increases in ambient noise from service personnel using Picketston firing range may affect the amenity of existing receptors and future site occupiers particularly Picketston SFA and Picketston village;
• Increases in ambient noise from service personnel using Castleton External Field Training Area; may affect the amenity of existing receptors and future site occupiers, particularly those in Castleton (including the SFA), and Flemingston Road Housing Estate.
Road Traffic
• Increases in ambient noise caused by additional development related traffic on existing roads affecting the amenity of existing receptors in close proximity to routes predicted to experience a noticeable change in traffic flows;
• Increases in ambient noise from traffic on new development roads affecting the amenity of existing and future site occupiers in close proximity.
Industrial Sources
• Increases in ambient noise due to activities at the MT Workshop, Wash Down and White Fleet, may have the potential to affect the amenity of nearby existing noise sensitive receptors (approximately 180m to the north east);
• Increases in ambient noise due to activities at the Waste Compound may have the potential to affect the amenity of nearby existing noise sensitive receptors (e.g. Ashdene, approximately 150m to the north).
Future Site Occupants
• Potential cumulative effect on future site occupants, due to elevated ambient noise levels (operational noise levels generated by the proposed development combined with existing noise sources).
16-31
© Entec UK Limited
Cumulative Effects
• Total increase in ambient noise from all sources described above has the potential to affect the amenity of existing noise sensitive receptors.
16.6.3 Scoped-out Effects
A number of effects have been identified during the EIA process which are not considered likely to be significant and hence have been scoped out:
General
• Increases in vibration levels experienced by existing sensitive receptors due to development related activities other than construction – taking into account the relatively large distances to the existing sensitive receptors no sources of vibration have been identified which are considered likely to result in significant vibration effects. With respect to the northern access road, it is understood that there are no inhabited buildings within 10m of the road and therefore vibration from road traffic is not expected to be significant.
Core Site Activities
• Increase in ambient night-time noise experienced by existing noise sensitive receptors due to increased airfield activity – Air traffic movement forecasts for the development provided by the Welsh Assembly Government show no increase in night-time activity as a result of the development. No engine running or DTC training activities will occur during the night-time period. Therefore a change in night-time noise levels is not expected to occur as a result of the development.
Industrial Sources
• Increase in ambient noise experienced by existing noise sensitive receptors due to the improvements to Llantwit Major WwTW – The key noise generating changes comprise the upgrading of the blowers and the installation of a centrifuge to replace a belt thickener. The new blowers will be fitted with acoustic enclosures (the existing ones are not), and will be located within a building. In addition pipework will be lagged or dampened to prevent noise and vibration transmission. The existing belt thickener is located within a building which is commonly left open due to odour issues. The odour control works carried out as part of the improvements will enable the centrifuge to be installed within an enclosed building. The change in noise levels is therefore not expected to result in significant effects;
• Increase in ambient noise experienced by existing noise sensitive receptors and future site occupants due to the pumping station - The submersible pumps will be located within an underground structure. The nearest existing noise sensitive receptors are approximately 440m to the north in Picketston, and the nearest future site occupants are 200m west at the hotel. Taking into account the likely low level of noise emissions from this source and the attenuation due to distance, it is considered that significant effects are unlikely to occur at either the existing noise sensitive receptors or the future site occupants.
• Increase in ambient noise levels due to mechanical and electrical services incorporated into the development – All services such as ventilation, refrigeration, or similar will be
16-32
© Entec UK Limited
designed to ensure that their emissions at the nearest noise sensitive receptor (existing or future site occupants) are at least 5dB(A) below the measured background noise levels (as determined during the baseline noise monitoring survey). Using guidance from BS4142, ‘industrial noise’ at these levels is unlikely to give rise to complaints, and therefore significant effects are considered unlikely.
• Increase in ambient noise levels from activities at Storage Facilities including the RID and FM stores delivery yard – the nearest existing noise sensitive receptors are located approximately 400m to the east-north-east. When the attenuation due to this distance is considered, along with the existing daytime ambient noise levels at existing receptors in Eglwys Brewis, it is considered that noise from this source is unlikely to give rise to significant noise effects. Activities at the Storage Facilities located to the west of the Waste Compound will be during daytime hours only and occur infrequently, and hence are also considered unlikely to result in significant noise effects.
• Increases in ambient noise due to noise emissions from the Energy Centre – the design criterion adopted will ensure that noise emissions from this source do not exceed background noise levels at the nearest existing receptors, in Eglwys Brewis and Picketston (over 375m away), during the sensitive night-time period. Using guidance from BS4142, the likelihood of complaint regarding noise from the energy centre would be unlikely or marginal at worst. It is therefore considered that significant effects are unlikely to occur due to this noise source.
Field Training and External Training Areas
• Increase in ambient noise levels due to Potential Artificers Assessment Board (PAAB) activities – This area is proposed to be used 10 times a year, for 3 days at a time. The activities are not particularly noisy with the main source of noise being verbal instructions between trainees. In addition, a 3m high acoustic fence is proposed to be erected between this area and the nearest residential properties at Picketston. The fence is intended to screen noise from the FTA and firing range but will have the additional benefit of screening any potential noise from the PAAB area.
• Increase in ambient noise levels due to use of obstacle course – Like the PAAB described above, this use is not considered to generate excessive noise, with the main source of noise being verbal instructions. The 3m high acoustic fence proposed at Picketston will ensure any noise that is generated is screened;
• Increase in ambient noise levels due to use of Aerial Farm/Field – This area will simply be used to train service personnel how to erect aerials for communication. A Super Sanger (mobile observation post) approximately 8m high will also be incorporated into the training at this location. It is not considered to be a noisy activity.
• Increase in ambient noise levels due to use of Hilo Pole Field – This area consists of several telegraph poles which trainees will scale to attach and detach communication cables. The work is similar to that of a telephone engineer. It is not considered to be a noisy activity.
• Increase in ambient noise levels due to use of Castleton External Field Training Area – This large and open area will be used for non-noisy activities such as camping, crawling, running, hiding, etc. Wheeled vehicles such as Land Rovers may also be used. No firing or use of thunder flashes will occur here.
16-33
© Entec UK Limited
16.7 Assessment Methodology
This section sets out the methods which have been used to calculate noise levels, both for the future baseline and development scenarios, and then goes on to describe relevant published guidance on assessment methodologies and criteria. The significance evaluation methodology used to determine the significance of the predicted effects is set out which, as required by the EIA regulations, relies on the assessment of receptor sensitivity and magnitude of effect. Separate prediction methodologies, guidance, assessment criteria and definitions of magnitude are detailed for each group of noise sources in order to reflect their individual characteristics.
16.7.1 Methodology for Prediction of Effects
LimA Noise Modelling Software Noise levels have been predicted for the Core Site Activities, Field Training Area and Road Traffic assessments using LimA, a computational noise modelling suite (air noise has been modelled using INM). Alternative methodologies have been used by the Construction and Industrial Sources assessments, as detailed below.
LimA has been widely used in noise modelling and noise mapping projects throughout the UK and Europe, including Wales. Developed by Stapelfeldt Ingenieuresellschaft mbH, LimA can implement a number of methodologies for the calculation of noise levels, including The Calculation of Road Traffic Noise (CRTN) for the calculation of road traffic noise and, ISO9613-2 “Acoustics - Attenuation of Sound During Propagation Outdoors”.
ISO9613-2 is a noise calculation methodology widely used for the calculation of industrial noise emissions. The methodology is one of the most sophisticated noise calculation standards in practical use and considers a series of acoustic features such as barrier attenuation; side diffraction; reflections; meteorological conditions; and ground effects. The methodology is also capable of performing calculations which take into account the spectral content of noise allowing attenuations and levels to be calculated at individual octave band frequencies.
The LimA noise modelling suite allows a 3-dimensional environmental model to be constructed using digital mapping and topographic data. As part of this assessment, 3-dimensional models have been constructed for the current, future baseline years and for each phase of the development using data obtained from Ordnance Survey (OS) and Welsh Assembly Government. This has allowed the assessments to incorporate changes in the topography of the airfield and its surroundings as well as changes in the location, nature and characteristics of noise sources. The noise models also include specific noise mitigation measures such as the 3-sided MRO engine running facility enclosure, and the FTA perimeter bunds.
The noise modelling process is complex, but in simple terms it takes into account the following data:
• Noise source location – based on the Master Plan, with an allowance made for mobile sources (e.g. taxiing aircraft) which move around the site and would be at differing distances from the receptor;
• Noise emission data – sound power levels or sound pressure levels taken from published sources, field measurements or data supplied by others;
16-34
© Entec UK Limited
• Noise source on-time – this reflects the operational hours and duration of intermittently operating noise sources;
• Distance between noise source and receptor – based on the Master Plan and OS digital data;
• Receptor locations – based on OS digital data;
• Ground contours – from OS digital data;
• Building heights;
• Locations and dimensions of barriers between noise source and receptor; and
• Ground attenuation – related to the type of ground cover between the source and the receptor.
LimA allows the calculation of noise levels at specific points (e.g. at selected receptors) or on a grid basis at a 10m intervals. Due to the large number of receptors identified in section 16.6.1, the calculation of noise levels at each one was not considered practical. Particular receptors have been selected in order to characterise the noise effects for receptors in a certain area. These selected receptors have been chosen to ensure they represent the typical or worst case noise levels experienced within an area for the various assessment scenarios. The selected receptor locations are presented in Figure 16.4.
Noise levels calculated on a grid basis have been used to plot noise contours. These are presented as Figures and should be interpreted as presenting indicative noise levels only, due to the potential inaccuracy inherent in any grid calculation which requires interpolation between calculation points.
Further information concerning the noise modelling undertaken in LimA specific to the Core Site Activities, Field Training Areas and Road Traffic assessments is provided below.
Construction It has been agreed with the Pollution Control Officer at Vale of Glamorgan Council that it is not possible to produce robust quantitative predictions of construction noise or vibration at this time. Details of the plant complement, (both in terms of number and types of machines), along with their working locations and likely on-time have not been finalised, and hence accurate predictions of construction noise and vibration cannot be undertaken at this time.
As an alternative means of assessment, the qualitative measures proposed to control construction noise and vibration will be examined.
Core Site Activities The prediction methodology for core site activities considers the following noise sources:
• Air noise – noise generated from aircraft whilst on the runway, during take-off, flight, approach and landing;
• Ground noise – noise generated from aircraft on the ground (whilst taxiing, at stand or at hold prior to departure) and hangar activities;

16-35
© Entec UK Limited
• DTC training activity – noise generated from DTC training activity incorporating tank and aircraft operations. In terms of tank operations, this includes proposed training activities on the ‘tank pan’ and tank road. In terms of aircraft training activities, this includes the DTC ‘flightline’ training course; and
• Aircraft engine running – noise generated from aircraft under going engine running as part of maintenance, repair and overhaul.
Each of these sources requires separate assessment due to the differences in the nature and characteristics of their emissions. For example, ground noise is likely to occur throughout the day however engine tests may occur once a day for a period of around an hour. Other factors such as potential effects to receptors also define the assessment methodology. For example air noise results in aircraft noise occurring above receptors resulting in little or no screening. In the case of ground noise, activity occurs within the boundary of airfield and its infrastructure, and may therefore be screened from receptors by intervening structures. As all activities occur at the airfield, the combined effect of all airfield noise sources must also be considered and as such the assessment methodology has considered combined cumulative noise effects from the core site activities.
The prediction of effects has considered data relating to current and predicted baseline conditions as presented in Section 16.9 and detailed in Appendices Y-BB. These sources of data have been incorporated into the prediction methodology. Data provided by Welsh Assembly Government through their noise consultants Walker Beak Mason (WBM), as presented in Appendices Y-BB, has provided the basis for the prediction of effects relating to airfield use within both modelled current and predicted future baselines, and scenarios for the ABP development. In the case of the predicted future baselines, noise levels have been calculated at each year of the three phases associated with the development of the ABP. The appendices provide much of the data (excluding taxi noise sources) which has been used for the noise modelling. Data provided by Capita Symonds (Acoustics) as presented in Appendix BB, has been used to predict noise effects due to DTC airfield training activities.
Table 16.14 provides a summary of the information used in the noise predictions. Where modelling outputs for the assessment have been provided, these are also listed in the table.
16-36
© Entec UK Limited
Table 16.14 Data Inputs for Modelling of Noise From core site activities
Data Input / Modelling Output Source of Data Available within
Historic Airfield Movements at St. Athan
The Welsh Assembly Government (issued through WBM)
Appendix X
Current and proposed airfield noise sources (ABP)
The Welsh Assembly Government (issued through WBM)
Appendix Z
Future baseline airfield noise sources The Welsh Assembly Government (issued through WBM)
Appendix Y
Aircraft and Helicopter noise emission data
The Welsh Assembly Government (issued through WBM)
Throughout Appendices Y-BB
DTC Airfield Training Activity Emission Data and Assumptions
Capita Acoustics (draft technical reports, email correspondence and telephone conversations)
Appendix BB
Existing building locations OS MasterMap digital mapping -
Terrain Height Information Digital Topographic survey of St. Athan undertaken in 2005
-
ABP Masterplan and Building Heights Masterplan Drawings: 21, 22 and 23 issued by WYG
Building heights provided in building schedule reference A024845sch090320v4_ABP.doc as issued by WYG
-
DTC Masterplan and Building Height Masterplan Drawing: SA-C0XXX-MP-900-SB-X-004P16 as issued by Scott Brownrigg
Building heights provided in drawing SA-C0XXX-MP-900-SB-X-4210P4 as issued by Scott Brownrigg
-
In the case of air noise, evaluation of noise at the airfield has been undertaken using the United States Federal Aviation Authority (FAA) Integrated Noise Model (INM). The INM model works by using the characteristics and routes of the airport or airfield in question, together with information on the numbers and types of aircraft that will use the airport/airfield to calculate noise levels at points or on a 50m grid surrounding the airport. INM does not take into account any screening from local buildings or topographical features. The grid of noise results in then used to plot noise contours which identify locations of equivalent noise exposure. The INM modelling was undertaken by Walker Beak Mason.
Field Training and External Training Areas Guidance on Clay Target Shooting (Clay Target Shooting: Guidance on the Control of Noise, 2003) has been produced by the Chartered Institute of Environmental Health (CIEH). The document describes how noise from clay target shooting can occur and provides advice on minimising annoyance and intrusion.
Although the guidance is specifically aimed at clay target shooting, a lot of the recommendations are general in nature and are equally applicable to other forms of shooting noise.
16-37
© Entec UK Limited
The following excerpt is taken from the guidance document:
“…where a new shooting location is being considered, the guidance can be used to determine what practical noise control measures should be applied. Further, it includes a standardised methodology for the measurement of noise from clay target shooting and suggested criteria that will assist with the assessment of the impact of clay target shooting noise at dwellings”
“Most of the guidance is provided in a general way. This is because local circumstances differ and consequently more or less restrictive controls may be appropriate in certain cases. Where specific criteria (e.g. distances, times or noise levels) are given these have been derived from experience and are not intended as precise rules to be routinely applied to every shooting ground or site.”
Advice on site management to minimise the noise impact is offered, including suggested restriction of shooting to the following times, where justified complaints have been received or are anticipated by the local authority:
• Mondays - Fridays: 09.00 - 18.00 with a maximum cumulative duration of 4 hours;
• Saturdays: 10.00 - 18.00 with a maximum cumulative duration of 3 hours; and
• Sundays: 10.00 - 14.00 with a maximum cumulative duration of 3 hours.
With respect to the calculation methodology used to predict noise levels for this assessment, the computational noise modelling software has utilised the ISO9613-2 methodology.
Road Traffic Noise The methodology used for the prediction of road traffic noise effects is that contained within the Department of Transport publication Design Manual for Roads and Bridges (DMRB). This Design Manual includes detailed guidance and procedures for the assessment of road schemes.
There are four key phases of assessment as detailed below:
• Screening to determine whether the project has the potential to cause a change to the receiving environment which could result in noise and vibration impacts;
• Scoping to determine the likely extent of any assessment and to identify sensitive receptors;
• Simple assessment of noise and vibration impact at dwellings and other sensitive receptors; and
• Detailed assessment of noise and vibration impact at dwellings and other sensitive receptors.
In terms of the requirement of EIA, a simple DMRB assessment is sufficient to determine whether any significant effects will occur. A simple DMRB assessment is included in Appendix FF.
The objective of an assessment is to gain an overall appreciation of the noise and vibration climate with and without the development, referred to as the ‘Do-minimum’ and ‘Do-something’ scenarios. These scenarios need to be assessed for both a baseline year and a future year. The baseline year is taken as the opening year of the project. The future year is typically the 15th year after opening.
16-38
© Entec UK Limited
At the simple stage of assessment the following two comparisons are made:
• Do-minimum scenario in the baseline year against Do-something scenario in the baseline year;
• Do- minimum scenario in the baseline year against Do-something scenario in the future assessment year.
DMRB also makes reference to the Noise Insulation Regulations 1975 (as amended 1988). Regulation 3 imposes a duty on authorities to provide, or make a grant towards the installation of, noise insulation at eligible buildings affected by a new or altered road. An eligible building would need to meet with the following conditions:
• Noise levels at exposed facades are predicted to exceed LA10,18hr 68dB;
• The predicted increase is more than 1dB(A); and
• A straight line can be drawn from any point of the property in question to the carriageway without passing through another building.
The prediction method for road traffic noise required by DMRB is based on the method set out in Calculation of Road Traffic Noise (CRTN). This contains methods for the calculation of road traffic noise levels in most situations, taking into account factors such as distance between the road and receptor, road configuration, ground cover, screening, angle of view, reflection from facades, and traffic flow, speed and composition. The method is suitable for calculating noise levels from free flowing traffic at properties more than 4m from the carriageway, defined as the nearside kerb.
The noise from road traffic is based on the calculated LA10,18hr. In this case predictions have been undertaken for 2014 (the assumed year of opening) and 2028 (the completion year) both with and without the scheme. DMRB normally requires a 15 year gap to assess the long term impact of a development proposal, however, based on the available traffic data, the road traffic noise assessment in this chapter uses a 14 year gap. It is considered that this would not result in noteworthy differences in noise levels compared to using a 15 year gap. The methodology contained within CRTN considers the following variables:
• The number of vehicles using the road and specifically the number of Heavy Goods Vehicles (HGV);
• vehicle speeds, road surface and gradients;
• The distance between the carriageway and the receiving positions and the relative heights of the road and the receiving positions;
• The effect of any intervening barriers between the road and the receptor;
• The angle of view; and
• The effect of intervening ground cover (i.e. reflective or absorbent) between the road and the receptors as well as the reflection from building façades.
Predictions of traffic noise have been undertaken using LimA. LimA uses the CRTN methodology to calculate LA10,18hr noise levels both at specific receptors (façade noise levels), and on a grid basis which enables noise contour plots to be generated.
16-39
© Entec UK Limited
As required for the DMRB assessment, noise levels associated with buildings have been predicted at 2m from the building façade and are free field, i.e. they do not include a façade correction of 2.5dB(A), as per the DMRB guidance for a simple assessment.
The noise levels at key and typical locations presented in section 16.11 have been calculated at 1m from relevant facades and do include a 2.5dB(A) façade correction.
A full description of the proposed road scheme is detailed in Chapter 13. The road traffic data used in the noise model is provided in Appendix EE.
Industrial Sources Predictions of noise from two industrial sources have been undertaken: the Waste Compound and the MT Workshop area. TAN 11 refers to the use of BS5228 in the prediction and assessment of construction noise. Since many of the noise sources at the waste compound and MT workshop area are similar in nature to those found at construction sites (e.g. mobile plant, HGVs, hand held tools etc), the predictions of noise from these sources has been undertaken, based on the BS5228 methodology. A spreadsheet based calculation exercise has been undertaken, rather than modelling using LimA, since the number of both noise sources and receptors is small, allowing the approach to be kept simple.
The following source data have been used in the calculation process:
• Noise emission data: taken from BS5228, manufacturer’s published information or measured data is assigned to each item of plant. The assumed list of plant and associated sound pressure levels is presented in Table 16.15;
• Distance between noise source and receptor – based on the Master Plan;
• Ground attenuation – related to the ground cover between the source and the receptor;
• Barrier attenuation – related to any barriers between the source and the receptor;
• On-time of plant – operations at the MT workshop and Waste Compound will commonly involve the intermittent use of various items of plant, which is determined by the specific task being undertaken; and
• Mobile plant - an allowance is made for mobile plant which moves around the site, and would be at differing distances from the receptor.
Table 16.15 Noise Emission Data for Industrial Sources
Plant Item Sound Pressure Level at 10m (dB(A)
On-time (%)
MT Workshop
Cut off saw 77 10
Grinding Wheel 73 10
Bandsaw 63 10
Nut runner 77 10
16-40
© Entec UK Limited
Plant Item Sound Pressure Level at 10m (dB(A)
On-time (%)
HGV engine 77 10
Carwash 77 10
Waste Compound
RCV 78 2
Bulk Skip loading 79 2
Bulk skip unloading 79 2
glass bottle deposition 78 2
Where uncertainties exist which could affect the outcome of the noise predictions, worst-case assumptions have been used, to ensure that the model over-predicts the noise levels. Examples of these assumptions include:
• Plant location – all plant is assumed to operate at closest approach to the receptor;
• ‘On-time’ of plant - Experience has shown that even when plant items are highly used, the maximum ‘on-time’ is less than around 83%, due to the ‘down time’ associated with plant breakdowns, maintenance and routine servicing. Furthermore a piece of mobile plant will only emit 100% noise power at specific parts of its work cycle. The activities taking place in the waste compound and MT workshop will typically be of very short duration, hence appropriate estimates of on-time have been made, based upon experience of similar facilities;
• Ground attenuation – the nature of the ground intervening between source and receptor is variable. For the purposes of these predictions, it has been assumed that the intervening ground is 100% acoustically soft;
• Barrier attenuation –it has been assumed that no barriers other than buildings shown by the DTC Master plan are present between source and receptor.
Predictions of noise from the MT workshop area and the Waste Compound have been undertaken for only the closest receptors to these noise sources, since these receptors will experience the highest noise levels from these sources.
Future Site Occupants As outlined above, noise models have been developed which predict worst case noise levels due to the various operational activities associated with the proposed development. These individual noise models of the ‘with development’ situation have been aggregated, giving predicted external noise levels for proposed future site users, i.e. at the various receptors described above.
Note that the aggregated noise models include daytime noise levels only (the 16-hour period 0700-2300hrs). Night-time noise level contributions due to development related effects are expected to be minimal and were scoped out of the assessment, and hence no modelling has been undertaken for the night-time period. Future predicted night-time noise levels affecting
16-41
© Entec UK Limited
future site uses are therefore based upon the results of Entec’s baseline noise monitoring, at the nearest relevant monitoring location.
Cumulative Effects The aggregated noise models described above can also be used to assess the cumulative effects of all modelled noise sources on existing sensitive receptors. Cumulative noise models have been developed for both the baseline and ‘with development’ scenarios in the years 2014 and 2028. Comparison between the baseline and ‘with development’ models in each year gives the noise level change expected at each of the existing noise sensitive receptors.
16.7.2 Significance Evaluation Methodology
Overview The determination of significance has largely been based on magnitude and therefore the relevant noise criteria drawn from the guidance documents detailed in section 16.2.3, some of which include reference to existing ambient or background noise levels. These noise criteria are not directly related to the categories of ‘significant’ and ‘not significant’ that underpin EIA.
The determination of significance in EIA is based on the sensitivity of a particular receptor (which depends on local circumstances and the type of receptor), as well as the magnitude of change in noise levels (which is related to existing background or ambient noise levels and predicted noise levels due to the development). The actual noise level (i.e. the predicted future noise level) would also influence the determination of significance, since it may either exceed or comply with relevant guideline noise limits, irrespective of the amount of change predicted.
Noise Sensitivity TAN 11 focuses on residential properties as being noise sensitive, although it does cite developments such as offices, hospitals and schools as containing buildings and activities that are potentially noise sensitive.
For the purposes of this noise assessment, residential properties (both existing and proposed) would be considered to be of medium sensitivity. Occupants of the proposed hotel have also been assigned a sensitivity of medium. Many commercial and industrial premises would normally be considered to be of a low sensitivity. Whilst the occupants of existing and proposed offices are considered to be less sensitive than typical residential properties, a sensitivity of ‘medium-low’ has been assigned to recognise the requirement that occupants would require suitable conditions to undertake work requiring concentration.
The existing St Brise Church yard, along with the proposed Ghurkha temple, Church and World Faith Centre have been assigned a medium sensitivity, although this would only apply to specific daytime periods. Staff and pupils of local schools, the DTC and the crèche would also be considered to be of medium sensitivity, although this would only apply during school/teaching hours. In-patients of the medical and dental centres are considered to be of high sensitivity, due to evidence that those with poor health are more vulnerable to noise effects. The WHO guidelines state that ‘patients have less ability to cope with stress’ and identifies people with particular diseases, medical problems and people in hospitals as ‘vulnerable subgroups’.
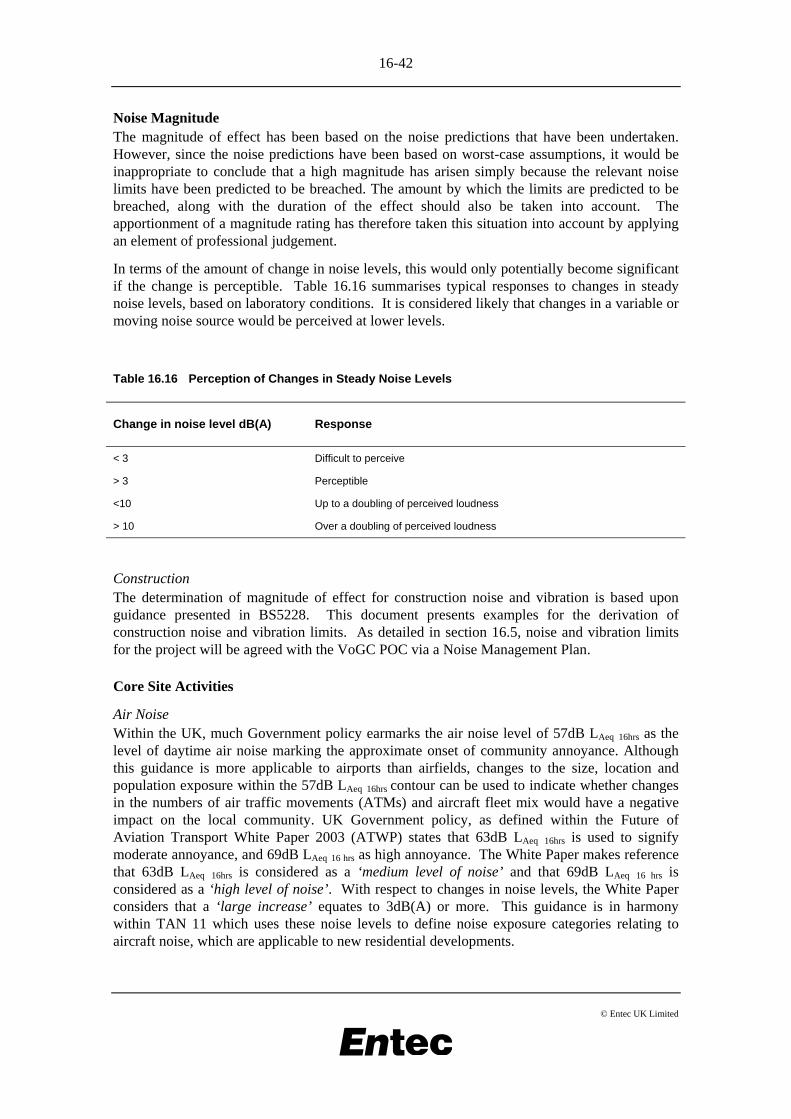
16-42
© Entec UK Limited
Noise Magnitude The magnitude of effect has been based on the noise predictions that have been undertaken. However, since the noise predictions have been based on worst-case assumptions, it would be inappropriate to conclude that a high magnitude has arisen simply because the relevant noise limits have been predicted to be breached. The amount by which the limits are predicted to be breached, along with the duration of the effect should also be taken into account. The apportionment of a magnitude rating has therefore taken this situation into account by applying an element of professional judgement.
In terms of the amount of change in noise levels, this would only potentially become significant if the change is perceptible. Table 16.16 summarises typical responses to changes in steady noise levels, based on laboratory conditions. It is considered likely that changes in a variable or moving noise source would be perceived at lower levels.
Table 16.16 Perception of Changes in Steady Noise Levels
Change in noise level dB(A) Response
< 3 Difficult to perceive
> 3 Perceptible
<10 Up to a doubling of perceived loudness
> 10 Over a doubling of perceived loudness
Construction The determination of magnitude of effect for construction noise and vibration is based upon guidance presented in BS5228. This document presents examples for the derivation of construction noise and vibration limits. As detailed in section 16.5, noise and vibration limits for the project will be agreed with the VoGC POC via a Noise Management Plan.
Core Site Activities
Air Noise Within the UK, much Government policy earmarks the air noise level of 57dB LAeq 16hrs as the level of daytime air noise marking the approximate onset of community annoyance. Although this guidance is more applicable to airports than airfields, changes to the size, location and population exposure within the 57dB LAeq 16hrs contour can be used to indicate whether changes in the numbers of air traffic movements (ATMs) and aircraft fleet mix would have a negative impact on the local community. UK Government policy, as defined within the Future of Aviation Transport White Paper 2003 (ATWP) states that 63dB LAeq 16hrs is used to signify moderate annoyance, and 69dB LAeq 16 hrs as high annoyance. The White Paper makes reference that 63dB LAeq 16hrs is considered as a ‘medium level of noise’ and that 69dB LAeq 16 hrs is considered as a ‘high level of noise’. With respect to changes in noise levels, the White Paper considers that a ‘large increase’ equates to 3dB(A) or more. This guidance is in harmony within TAN 11 which uses these noise levels to define noise exposure categories relating to aircraft noise, which are applicable to new residential developments.
16-43
© Entec UK Limited
The use of air noise contours as a means for assessing the impact of airports and airfields is referred to in TAN 11, which states in paragraph B7:
“Using forecast contours, it should be possible to determine approximately which areas are likely to fall within the different noise exposure categories. For small aerodromes local planning authorities should not rely solely on Leq where this is based on less than about 30 movements a day.”
Despite this statement, TAN 11 and other equivalent UK planning policy do not suggest alternative means of assessing the air noise implications of small aerodromes of less than 30 movements.
St. Athan has historically been and will continue to be associated with military aircraft movements. Some military jet aircraft activity is forecast to continue to occur at St. Athan in the development scenarios. TAN 11 addresses the potential issues of military aircraft activity stating:
“Military jet aircraft can generate very high noise levels particularly during take off, and occasionally the effectiveness of noise abatement flight procedures normally adopted may be limited by operational requirements. Changes in aircraft type and number of movements may also occur over a short period, resulting in unpredictable changes in noise levels. However, military flying is usually concentrated into weekday working hours when the public sensitivity to noise is at its lowest”.
Helicopter movements feature at St. Athan with approximately 4000 movements from Bond Services per annum with additional existing helicopter movements from visiting aircraft. Unlike fixed wing aircraft, helicopters do not necessarily have to comply with the same flight paths as fixed wing aircraft. As a result, this can make the process of determining noise exposure very difficult. TAN 11 states that:
“Helicopter noise has different characteristics from that of fixed wing aircraft, and is often regarded as more intrusive or more annoying by the general public. Noise exposure categories should be applied with caution.”
Furthermore, TAN 11 also states:
“When determining a planning application for a heliport the predicted noise should not be assessed in isolation - account should be taken of local circumstances including the existing level of noise disturbance in the area surrounding the site and factors such as whether the area is already exposed to noise from fixed wing aircraft. Local planning authorities will need to consider the effect of further disturbance resulting from the proposal.”
Finally, there are no accepted guidelines on appropriate aircraft noise levels for areas used for outdoor recreation. The WHO guidelines simply state in parkland and conservation areas, the signal-to-noise-ratio should be kept low. The definition of magnitude for these receptors is therefore based upon the change in noise level only.
The determination of the magnitude of effect for air noise is based on changes in the size of the 57dB(A) air noise contour between the predicted future baseline and development cases. The air noise contour will combine all fixed wing commercial and military aircraft, and helicopter movements.
16-44
© Entec UK Limited
Ground Noise Many ground noise sources could be considered as having some characteristics in common with ‘industrial’ noise sources. In terms of the assessment for St. Athan, the following noise sources have been considered as ‘ground noise’ including noise due to:
• Taxiing aircraft;
• Aircraft at stand and hold;
• Helicopter hovering and idling; and
• Breakout from activity within hangars.
Ground noise can occur throughout the day, therefore changes in noise level due to an increased number of aircraft, relocation and redistribution of hangers and stands, may be perceived and result in annoyance. The development results in a change in the use of taxiways and the relocation of facilities. As such there is potential for ground noise levels in vicinity of the airfield to change as a result of the development.
The determination of the magnitude of effect due to ground noise is therefore based mainly on changes in noise level at receptors surrounding the airfield, however, reference is also made to WHO guidelines for outdoor living areas. These guidelines state that noise levels should be below 55dB(A) LAeq 16 hrs in order to avoid serious annoyance, and below 50dB(A) LAeq 16hrs in order to avoid moderate annoyance.
It could be argued that some ground noise sources have characteristics in common with industrial noise sources. An assessment in accordance with BS4142 ‘Method for Rating Industrial Noise Affecting Mixed Residential and Industrial Areas’ has not been made. This is because the measured baseline background noise levels (as LA90), which are required by a BS4142 assessment, will include a contribution from the existing ground noise sources, and thus an accurate assessment is not possible. Basing the magnitude criteria on change and relevant guidelines is considered a robust assessment methodology.
Aircraft Engine Running Information provided by the Welsh Assembly Government identifies that engine running at St. Athan would occur in the absence of ABP consent, at an existing location or at a location previously used for this purpose. These are at different locations to the proposed future development MRO engine running facility. The methodology for assessing potential noise effects during aircraft engine running has therefore included a comparison of effects for proposed and future baseline engine running activity at St. Athan. As both the duration and operational hours of the engine running must also be considered, the effect on overall 16-hour daytime (as engine running may occur at any time within these hours) ambient noise levels is also incorporated into the assessment.
The determination of the magnitude of effect during aircraft engine running is based on the approach advocated in BS 4142. This British Standard provides a methodology for determining whether a new or existing noise source is likely to cause noise complaints by comparing the operational noise level (noise due to the ‘industrial’ source) with the background level (noise level without the ‘industrial’ source). A difference of more than +10dB(A) indicates that complaints are likely, whilst a difference of -10dB(A) indicates that complaints are unlikely. A difference of around +5dB(A) suggests that the likelihood of complaint is marginal. For the purpose of this assessment the guidance has been interpreted as a difference between -10dB(A)
16-45
© Entec UK Limited
and 0dB(A) indicates complaints are unlikely, a difference of 0 to +10dB(A) suggest likelihood of complaint is marginal, and a difference of over +10dB(A) is a positive indication that complaints are likely.
It should be noted that response to noise is subjective and the likelihood of complaints regarding aircraft engine running depends on a number of additional factors, as well as the overall noise level. For example, the time of day when the noise occurs, a change in the noise environment and also attitude to the noise source. It is important to note that there is a long history of airfield activities at St Athan, and that engine running has been undertaken for some years.
As engine running noise would occur in the future, even in the absence of ABP and DTC consent, the approach also considers whether complaints in the future would be likely in the absence of the development and whether the development increases or decreases the likelihood of complaints. This involves the comparison of predicted engine running noise levels at selected receptors, with and without the development against measured baseline background noise levels (as LA90 , which do not include any contribution from the existing engine running) from the nearest monitoring location (and considered representative of those at the receptor). Through comparison, the approach determines whether complaints due to engine running noise would be likely in the future with and without the development and whether the development would result in an increased or reduced likelihood of complaints. As part of this, the assessment makes a direct comparison between the noise levels due to engine running at each receptor for equivalent baseline and development cases. This approach looks to identify whether engine running noise levels at receptors would increase or decrease as a result of the development and whether any of these changes would be perceived.
Although the approach set out above provides an understanding of the effect of the engine running during each run, it does not consider the number and duration of the engine tests and the potential implications on ambient noise levels. Daytime noise levels (as LAeq 16 hrs) have therefore been predicted for the engine running. These levels can be referenced against the WHO guidelines described in the ground noise assessment above. It is also an important note that should receptors experience noise levels of less than 55dB(A) during each engine run then it may be concluded that noise levels would be less than 55dB(A) due to engine running over the daytime period.
DTC Training DTC training activities include the following:
• Flightline - located to the north of the runway on the disused cross runway. Military type aircraft taxiing and performing manoeuvres on a daily basis on the cross runway. It is anticipated that a detuner would also be used approximately once every two weeks;
• Tank pan - located south of the Super Hangar on an area of hard standing, where typically five tanks would perform manoeuvres such as turning and running up gears for up to an hour a day;
• Tank Road - running parallel and north of the main runway from the tank pan. It has been assumed that the tank road would be used once a day by a single tank performing a return journey along the road.
In terms of the assessment, these training activities are considered as new noise sources with respect to the baselines, despite these sources having similar characteristics to the noise

16-46
© Entec UK Limited
emissions due to aircraft engine running which would occur in the vicinity of these proposed activities in the absence of the development.
Noise levels have been calculated for the duration of the DTC airfield training activity hours. These calculations take into account the frequency and duration of the various activities and noise sources associated with DTC training.
The determination of the magnitude of effect for the DTC training noise sources is based upon the approach outlined in BS4142, and used as described above for the ground noise and engine running noise assessments. In order to provide context to the assessment, the noise level at receptors during equivalent baseline years will also be considered as part of the assessment.
Field Training and External Training Areas
Research by BRE and papers presented at the 1997 Institute of Acoustics (IOA) conference provide a basis for guidance on acceptable noise limits to be applied in the vicinity of residential premises. The BRE research suggests there is no fixed shooting noise level at which annoyance starts to occur, but mean shooting noise levels (mean SNLs) below 55dB(A) are less likely to result in annoyance and mean SNLs above 65dB(A) are highly likely to result in annoyance.
The BRE research indicated a need for further study of the effects of background noise on annoyance due to shooting. BRE found no effect from background noise; however, most of the measurements were undertaken in low background noise environments. Therefore, closer examination of sites with higher background noise levels is necessary before the role of background noise in relation to annoyance can be understood.
Clay Target Shooting states that any limits set will be a matter for local negotiation, but should normally be set according to the following guidelines:
• The limit shall take the form of a mean Shooting Noise Level (SNL) of XdB, not to be exceeded;
• X will depend on local circumstances, but would normally be expected to fall somewhere in the range 55 to 65dB;
• Factors that should be considered in selecting X are:
- The locality and general background noise levels;
- On which days of the week shooting occurs;
- At which times of day, i.e. morning, afternoon, evening;
- The intensity of shooting – e.g. number of shooting days per year;
- The type of shoot – e.g. 28 day or with planning approval; and
- The rate of fire.
Taking each of the above listed factors in turn, average ambient and background noise levels are in the range of LAeq,16hr 47dB – 58dB, and LA90,16hr 34dB – 45dB, with LAmax noise levels in the range 74dB – 95dB. It is considered that this range of noise levels is commensurate with, if not a little higher than, the background noise levels depicted in the guidance, i.e. those associated with rural areas where the overwhelming majority of shoots take place.
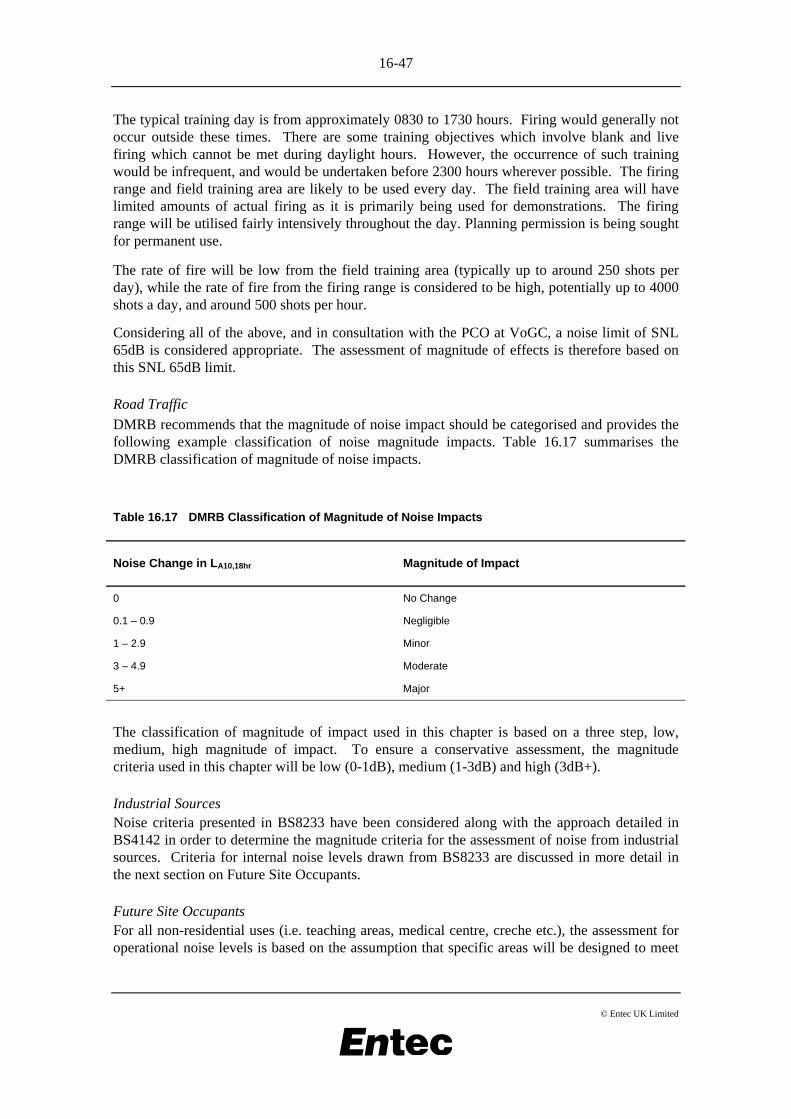
16-47
© Entec UK Limited
The typical training day is from approximately 0830 to 1730 hours. Firing would generally not occur outside these times. There are some training objectives which involve blank and live firing which cannot be met during daylight hours. However, the occurrence of such training would be infrequent, and would be undertaken before 2300 hours wherever possible. The firing range and field training area are likely to be used every day. The field training area will have limited amounts of actual firing as it is primarily being used for demonstrations. The firing range will be utilised fairly intensively throughout the day. Planning permission is being sought for permanent use.
The rate of fire will be low from the field training area (typically up to around 250 shots per day), while the rate of fire from the firing range is considered to be high, potentially up to 4000 shots a day, and around 500 shots per hour.
Considering all of the above, and in consultation with the PCO at VoGC, a noise limit of SNL 65dB is considered appropriate. The assessment of magnitude of effects is therefore based on this SNL 65dB limit.
Road Traffic
DMRB recommends that the magnitude of noise impact should be categorised and provides the following example classification of noise magnitude impacts. Table 16.17 summarises the DMRB classification of magnitude of noise impacts.
Table 16.17 DMRB Classification of Magnitude of Noise Impacts
Noise Change in LA10,18hr Magnitude of Impact
0 No Change
0.1 – 0.9 Negligible
1 – 2.9 Minor
3 – 4.9 Moderate
5+ Major
The classification of magnitude of impact used in this chapter is based on a three step, low, medium, high magnitude of impact. To ensure a conservative assessment, the magnitude criteria used in this chapter will be low (0-1dB), medium (1-3dB) and high (3dB+).
Industrial Sources Noise criteria presented in BS8233 have been considered along with the approach detailed in BS4142 in order to determine the magnitude criteria for the assessment of noise from industrial sources. Criteria for internal noise levels drawn from BS8233 are discussed in more detail in the next section on Future Site Occupants.
Future Site Occupants For all non-residential uses (i.e. teaching areas, medical centre, creche etc.), the assessment for operational noise levels is based on the assumption that specific areas will be designed to meet

16-48
© Entec UK Limited
the appropriate acoustic criteria for internal noise levels to ensure that they are fit for purpose. These are detailed in Table 16.20.
For all residential uses, a more detailed evaluation of predicted noise levels at the residential receptors (i.e. DTC Ranks Village; SFA housing areas) has been undertaken, with respect to TAN11 guidelines on the assessment of environmental noise affecting proposed residential development, and BS8233 guidance on the design of residential building fabric to achieve acceptable internal noise levels in living rooms during the day, and in bedrooms at night.
Determination of site suitability for residential use is based upon the assignment of Noise Exposure Categories (NEC), applied to proposed new dwellings. The categories range from A to D to reflect an increasing level of concern regarding the noise climate, as summarised in Table 16.18.
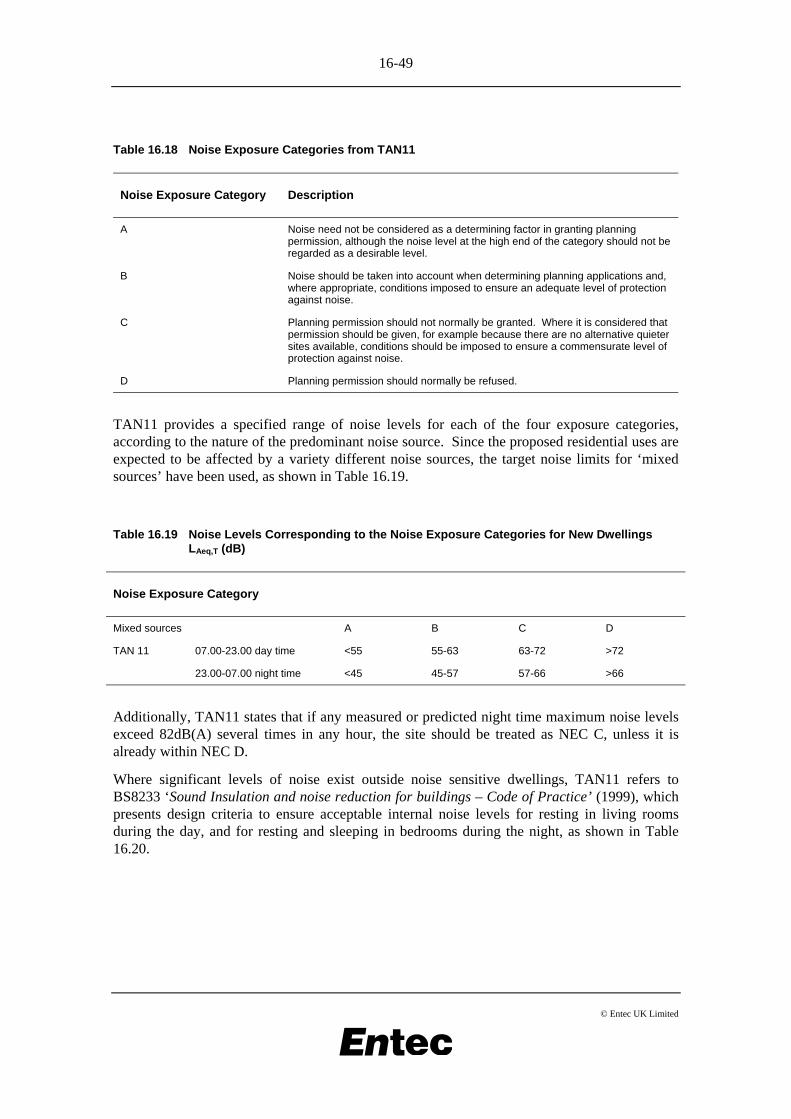
16-49
© Entec UK Limited
Table 16.18 Noise Exposure Categories from TAN11
Noise Exposure Category Description
A Noise need not be considered as a determining factor in granting planning permission, although the noise level at the high end of the category should not be regarded as a desirable level.
B Noise should be taken into account when determining planning applications and, where appropriate, conditions imposed to ensure an adequate level of protection against noise.
C Planning permission should not normally be granted. Where it is considered that permission should be given, for example because there are no alternative quieter sites available, conditions should be imposed to ensure a commensurate level of protection against noise.
D Planning permission should normally be refused.
TAN11 provides a specified range of noise levels for each of the four exposure categories, according to the nature of the predominant noise source. Since the proposed residential uses are expected to be affected by a variety different noise sources, the target noise limits for ‘mixed sources’ have been used, as shown in Table 16.19.
Table 16.19 Noise Levels Corresponding to the Noise Exposure Categories for New Dwellings LAeq,T (dB)
Noise Exposure Category
Mixed sources A B C D
TAN 11 07.00-23.00 day time <55 55-63 63-72 >72
23.00-07.00 night time <45 45-57 57-66 >66
Additionally, TAN11 states that if any measured or predicted night time maximum noise levels exceed 82dB(A) several times in any hour, the site should be treated as NEC C, unless it is already within NEC D.
Where significant levels of noise exist outside noise sensitive dwellings, TAN11 refers to BS8233 ‘Sound Insulation and noise reduction for buildings – Code of Practice’ (1999), which presents design criteria to ensure acceptable internal noise levels for resting in living rooms during the day, and for resting and sleeping in bedrooms during the night, as shown in Table 16.20.

16-50
© Entec UK Limited
Table 16.20 BS 8233 Internal Noise Level Criteria (Residential)
Design Range LAeq,T dB Criterion Typical Situations
Good Reasonable
Living Rooms 30 40 Acceptable Resting / Sleeping Conditions
Bedrooms 30 35
Additionally, BS8233 states that for a reasonable standard in bedrooms at night, individual noise events (measured with fast time-weighting) should not regularly exceed 45 dB LAmax.
For all proposed residential units, the building façade sound reduction requirement to meet the BS8233 reasonable criteria has been determined for the worst affected units in the various areas proposed for residential development.
The evaluation of noise effect magnitude is based on the implementation of sufficient sound reduction measures to achieve, at minimum, the reasonable criteria of BS8233 (where these are met, an effect magnitude of medium is assigned, provided that the NEC category is C or below, see Table 16.20).
Cumulative Effects The assessment of magnitude for cumulative effects is based primarily on the predicted change in noise levels. The criteria take into account that the cumulative change may be comprised of several small changes in noise levels from different sources which may individually be difficult to perceive. Hence the criteria are slightly less stringent than for the individual noise sources. In addition to an assessment of change, however it is important to make reference to relevant noise guideline values, specifically the WHO guidelines for Community Noise, as described above for the core site activities assessment.
Summary
A summary of the noise magnitude criteria used in this assessment is shown in Table 16.21
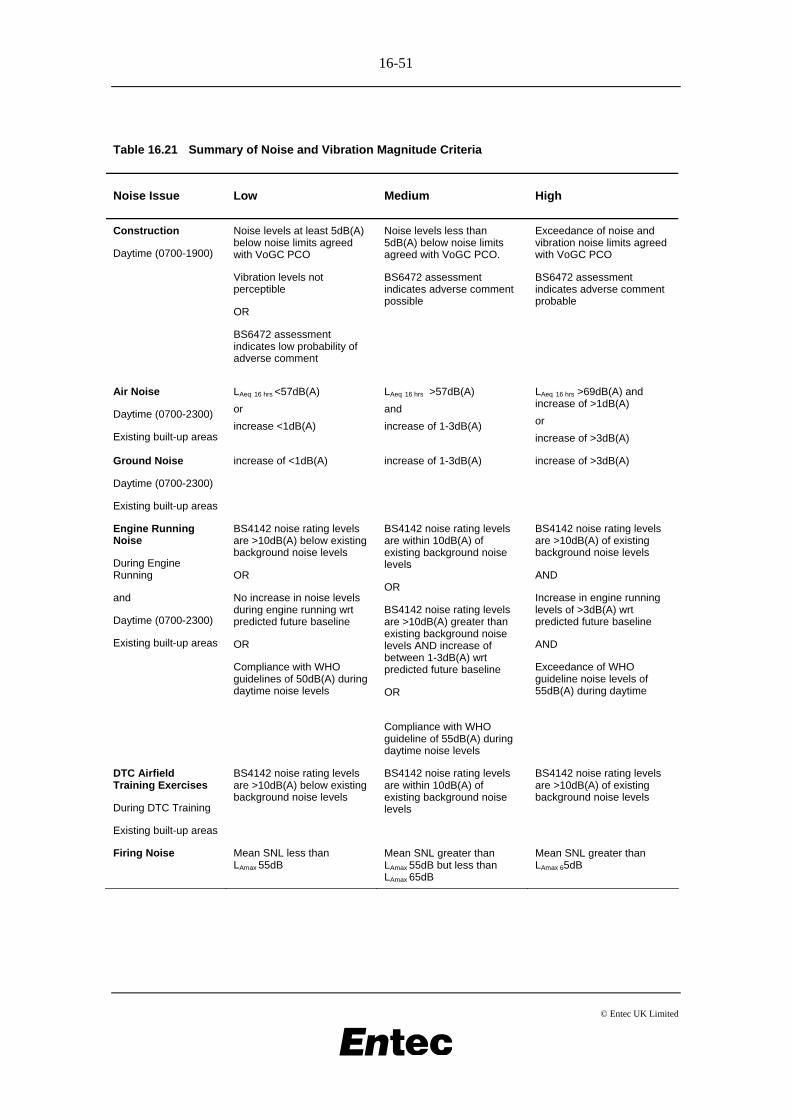
16-51
© Entec UK Limited
Table 16.21 Summary of Noise and Vibration Magnitude Criteria
Noise Issue Low Medium High
Construction
Daytime (0700-1900)
Noise levels at least 5dB(A) below noise limits agreed with VoGC PCO
Noise levels less than 5dB(A) below noise limits agreed with VoGC PCO.
Exceedance of noise and vibration noise limits agreed with VoGC PCO
Vibration levels not perceptible
OR
BS6472 assessment indicates low probability of adverse comment
BS6472 assessment indicates adverse comment possible
BS6472 assessment indicates adverse comment probable
Air Noise
Daytime (0700-2300)
Existing built-up areas
LAeq 16 hrs <57dB(A)
or increase <1dB(A)
LAeq 16 hrs >57dB(A) and increase of 1-3dB(A)
LAeq 16 hrs >69dB(A) and increase of >1dB(A) or increase of >3dB(A)
Ground Noise
Daytime (0700-2300)
Existing built-up areas
increase of <1dB(A)
increase of 1-3dB(A)
increase of >3dB(A)
Engine Running Noise
During Engine Running
and
Daytime (0700-2300)
Existing built-up areas
BS4142 noise rating levels are >10dB(A) below existing background noise levels
OR
No increase in noise levels during engine running wrt predicted future baseline
OR
Compliance with WHO guidelines of 50dB(A) during daytime noise levels
BS4142 noise rating levels are within 10dB(A) of existing background noise levels
OR
BS4142 noise rating levels are >10dB(A) greater than existing background noise levels AND increase of between 1-3dB(A) wrt predicted future baseline
OR
Compliance with WHO guideline of 55dB(A) during daytime noise levels
BS4142 noise rating levels are >10dB(A) of existing background noise levels
AND
Increase in engine running levels of >3dB(A) wrt predicted future baseline
AND
Exceedance of WHO guideline noise levels of 55dB(A) during daytime
DTC Airfield Training Exercises
During DTC Training
Existing built-up areas
BS4142 noise rating levels are >10dB(A) below existing background noise levels
BS4142 noise rating levels are within 10dB(A) of existing background noise levels
BS4142 noise rating levels are >10dB(A) of existing background noise levels
Firing Noise Mean SNL less than LAmax 55dB
Mean SNL greater than LAmax 55dB but less than LAmax 65dB
Mean SNL greater than LAmax 65dB
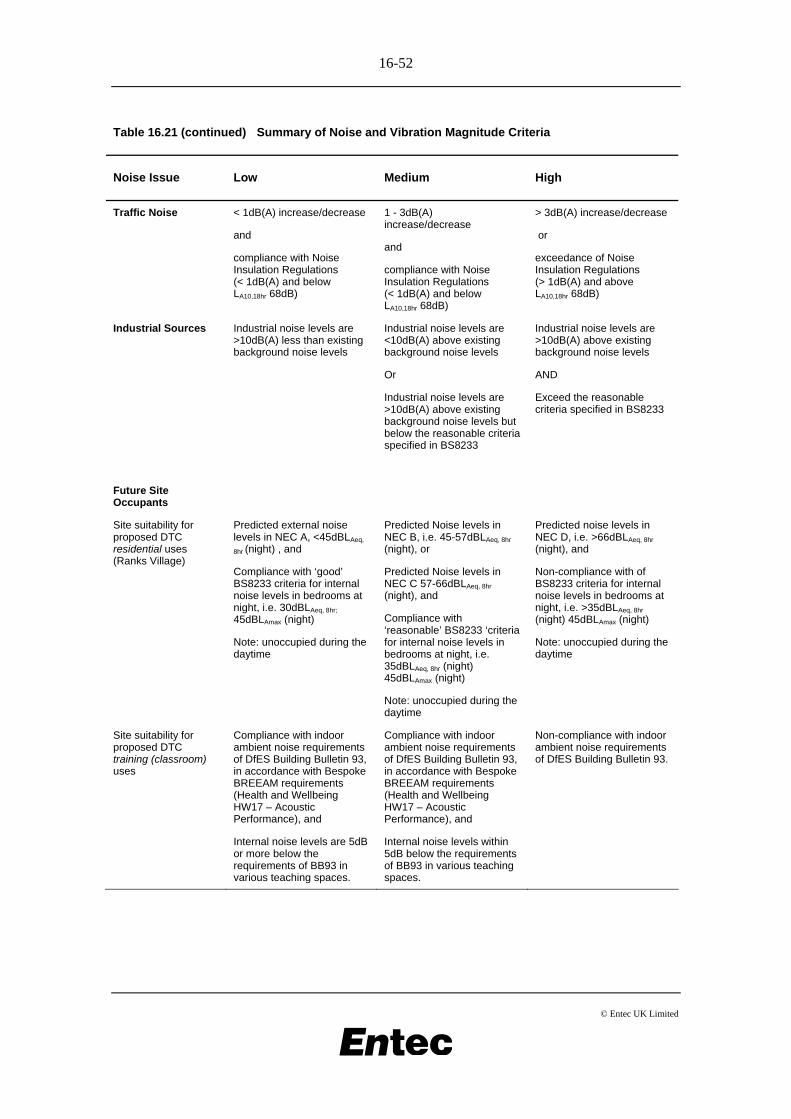
16-52
© Entec UK Limited
Table 16.21 (continued) Summary of Noise and Vibration Magnitude Criteria
Noise Issue Low Medium High
Traffic Noise < 1dB(A) increase/decrease
and
compliance with Noise Insulation Regulations (< 1dB(A) and below LA10,18hr 68dB)
1 - 3dB(A) increase/decrease
and
compliance with Noise Insulation Regulations (< 1dB(A) and below LA10,18hr 68dB)
> 3dB(A) increase/decrease
or
exceedance of Noise Insulation Regulations (> 1dB(A) and above LA10,18hr 68dB)
Industrial Sources Industrial noise levels are >10dB(A) less than existing background noise levels
Industrial noise levels are <10dB(A) above existing background noise levels
Or
Industrial noise levels are >10dB(A) above existing background noise levels but below the reasonable criteria specified in BS8233
Industrial noise levels are >10dB(A) above existing background noise levels
AND
Exceed the reasonable criteria specified in BS8233
Future Site Occupants
Site suitability for proposed DTC residential uses (Ranks Village)
Predicted external noise levels in NEC A, <45dBLAeq,
8hr (night) , and
Compliance with ‘good’ BS8233 criteria for internal noise levels in bedrooms at night, i.e. 30dBLAeq, 8hr; 45dBLAmax (night)
Note: unoccupied during the daytime
Predicted Noise levels in NEC B, i.e. 45-57dBLAeq, 8hr (night), or
Predicted Noise levels in NEC C 57-66dBLAeq, 8hr (night), and
Compliance with ‘reasonable’ BS8233 ‘criteria for internal noise levels in bedrooms at night, i.e. 35dBLAeq, 8hr (night) 45dBLAmax (night)
Note: unoccupied during the daytime
Predicted noise levels in NEC D, i.e. >66dBLAeq, 8hr (night), and
Non-compliance with of BS8233 criteria for internal noise levels in bedrooms at night, i.e. >35dBLAeq, 8hr (night) 45dBLAmax (night)
Note: unoccupied during the daytime
Site suitability for proposed DTC training (classroom) uses
Compliance with indoor ambient noise requirements of DfES Building Bulletin 93, in accordance with Bespoke BREEAM requirements (Health and Wellbeing HW17 – Acoustic Performance), and
Internal noise levels are 5dB or more below the requirements of BB93 in various teaching spaces.
Compliance with indoor ambient noise requirements of DfES Building Bulletin 93, in accordance with Bespoke BREEAM requirements (Health and Wellbeing HW17 – Acoustic Performance), and
Internal noise levels within 5dB below the requirements of BB93 in various teaching spaces.
Non-compliance with indoor ambient noise requirements of DfES Building Bulletin 93.
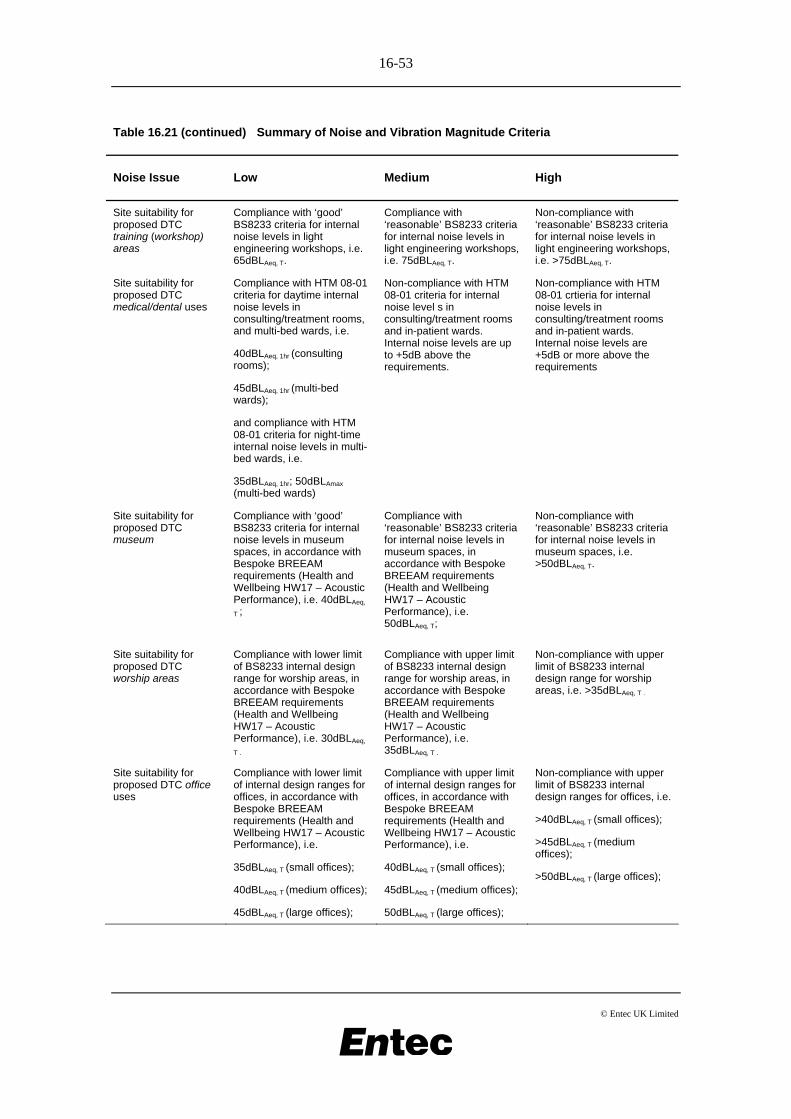
16-53
© Entec UK Limited
Table 16.21 (continued) Summary of Noise and Vibration Magnitude Criteria
Noise Issue Low Medium High
Site suitability for proposed DTC training (workshop) areas
Compliance with ‘good’ BS8233 criteria for internal noise levels in light engineering workshops, i.e. 65dBLAeq, T.
Compliance with ‘reasonable’ BS8233 criteria for internal noise levels in light engineering workshops, i.e. 75dBLAeq, T.
Non-compliance with ‘reasonable’ BS8233 criteria for internal noise levels in light engineering workshops, i.e. >75dBLAeq, T.
Site suitability for proposed DTC medical/dental uses
Compliance with HTM 08-01 criteria for daytime internal noise levels in consulting/treatment rooms, and multi-bed wards, i.e.
40dBLAeq, 1hr (consulting rooms);
45dBLAeq, 1hr (multi-bed wards);
and compliance with HTM 08-01 criteria for night-time internal noise levels in multi-bed wards, i.e.
35dBLAeq, 1hr; 50dBLAmax (multi-bed wards)
Non-compliance with HTM 08-01 criteria for internal noise level s in consulting/treatment rooms and in-patient wards. Internal noise levels are up to +5dB above the requirements.
Non-compliance with HTM 08-01 crtieria for internal noise levels in consulting/treatment rooms and in-patient wards. Internal noise levels are +5dB or more above the requirements
Site suitability for proposed DTC museum
Compliance with ‘good’ BS8233 criteria for internal noise levels in museum spaces, in accordance with Bespoke BREEAM requirements (Health and Wellbeing HW17 – Acoustic Performance), i.e. 40dBLAeq,
T ;
Compliance with ‘reasonable’ BS8233 criteria for internal noise levels in museum spaces, in accordance with Bespoke BREEAM requirements (Health and Wellbeing HW17 – Acoustic Performance), i.e. 50dBLAeq, T;
Non-compliance with ‘reasonable’ BS8233 criteria for internal noise levels in museum spaces, i.e. >50dBLAeq, T.
Site suitability for proposed DTC worship areas
Compliance with lower limit of BS8233 internal design range for worship areas, in accordance with Bespoke BREEAM requirements (Health and Wellbeing HW17 – Acoustic Performance), i.e. 30dBLAeq,
T .
Compliance with upper limit of BS8233 internal design range for worship areas, in accordance with Bespoke BREEAM requirements (Health and Wellbeing HW17 – Acoustic Performance), i.e. 35dBLAeq, T .
Non-compliance with upper limit of BS8233 internal design range for worship areas, i.e. >35dBLAeq, T .
Site suitability for proposed DTC office uses
Compliance with lower limit of internal design ranges for offices, in accordance with Bespoke BREEAM requirements (Health and Wellbeing HW17 – Acoustic Performance), i.e.
35dBLAeq, T (small offices);
40dBLAeq, T (medium offices);
45dBLAeq, T (large offices);
Compliance with upper limit of internal design ranges for offices, in accordance with Bespoke BREEAM requirements (Health and Wellbeing HW17 – Acoustic Performance), i.e.
40dBLAeq, T (small offices);
45dBLAeq, T (medium offices);
50dBLAeq, T (large offices);
Non-compliance with upper limit of BS8233 internal design ranges for offices, i.e.
>40dBLAeq, T (small offices);
>45dBLAeq, T (medium offices);
>50dBLAeq, T (large offices);
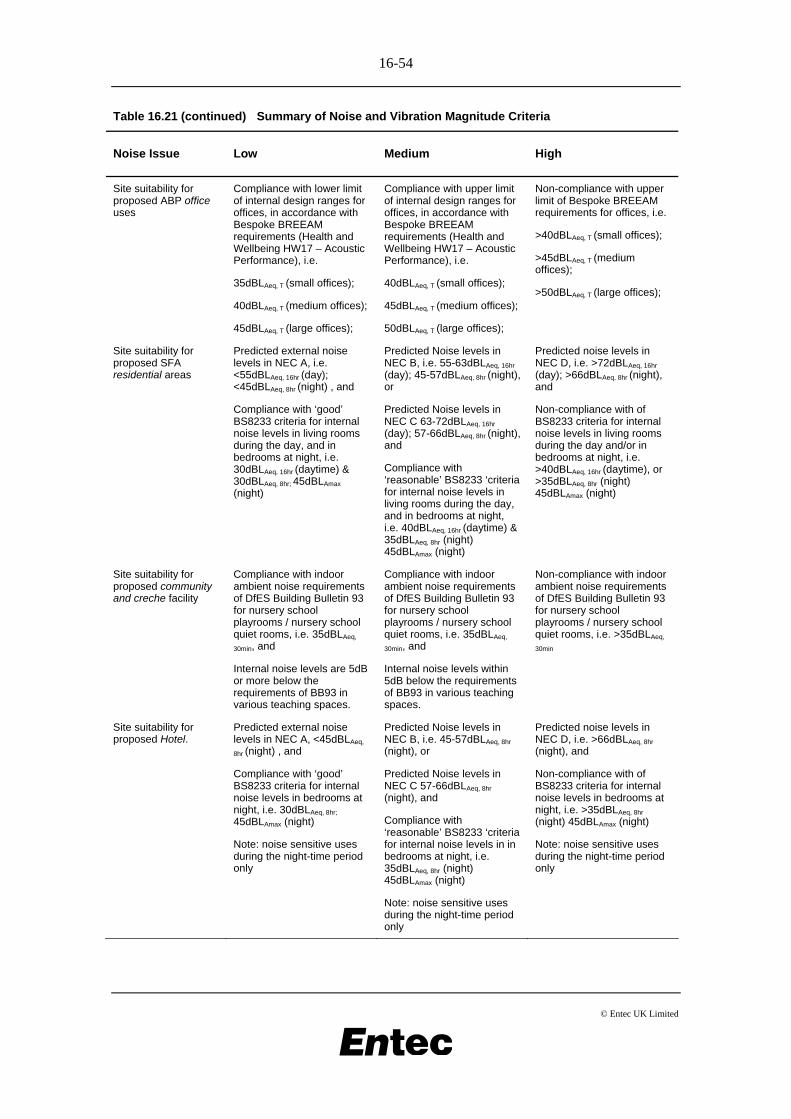
16-54
© Entec UK Limited
Table 16.21 (continued) Summary of Noise and Vibration Magnitude Criteria
Noise Issue Low Medium High
Site suitability for proposed ABP office uses
Compliance with lower limit of internal design ranges for offices, in accordance with Bespoke BREEAM requirements (Health and Wellbeing HW17 – Acoustic Performance), i.e.
35dBLAeq, T (small offices);
40dBLAeq, T (medium offices);
45dBLAeq, T (large offices);
Compliance with upper limit of internal design ranges for offices, in accordance with Bespoke BREEAM requirements (Health and Wellbeing HW17 – Acoustic Performance), i.e.
40dBLAeq, T (small offices);
45dBLAeq, T (medium offices);
50dBLAeq, T (large offices);
Non-compliance with upper limit of Bespoke BREEAM requirements for offices, i.e.
>40dBLAeq, T (small offices);
>45dBLAeq, T (medium offices);
>50dBLAeq, T (large offices);
Site suitability for proposed SFA residential areas
Predicted external noise levels in NEC A, i.e. <55dBLAeq, 16hr (day); <45dBLAeq, 8hr (night) , and
Compliance with ‘good’ BS8233 criteria for internal noise levels in living rooms during the day, and in bedrooms at night, i.e. 30dBLAeq, 16hr (daytime) & 30dBLAeq, 8hr; 45dBLAmax (night)
Predicted Noise levels in NEC B, i.e. 55-63dBLAeq, 16hr (day); 45-57dBLAeq, 8hr (night), or
Predicted Noise levels in NEC C 63-72dBLAeq, 16hr (day); 57-66dBLAeq, 8hr (night), and
Compliance with ‘reasonable’ BS8233 ‘criteria for internal noise levels in living rooms during the day, and in bedrooms at night, i.e. 40dBLAeq, 16hr (daytime) & 35dBLAeq, 8hr (night) 45dBLAmax (night)
Predicted noise levels in NEC D, i.e. >72dBLAeq, 16hr (day); >66dBLAeq, 8hr (night), and
Non-compliance with of BS8233 criteria for internal noise levels in living rooms during the day and/or in bedrooms at night, i.e. >40dBLAeq, 16hr (daytime), or >35dBLAeq, 8hr (night) 45dBLAmax (night)
Site suitability for proposed community and creche facility
Compliance with indoor ambient noise requirements of DfES Building Bulletin 93 for nursery school playrooms / nursery school quiet rooms, i.e. 35dBLAeq,
30min, and
Internal noise levels are 5dB or more below the requirements of BB93 in various teaching spaces.
Compliance with indoor ambient noise requirements of DfES Building Bulletin 93 for nursery school playrooms / nursery school quiet rooms, i.e. 35dBLAeq,
30min, and
Internal noise levels within 5dB below the requirements of BB93 in various teaching spaces.
Non-compliance with indoor ambient noise requirements of DfES Building Bulletin 93 for nursery school playrooms / nursery school quiet rooms, i.e. >35dBLAeq,
30min
Site suitability for proposed Hotel.
Predicted external noise levels in NEC A, <45dBLAeq,
8hr (night) , and
Compliance with ‘good’ BS8233 criteria for internal noise levels in bedrooms at night, i.e. 30dBLAeq, 8hr; 45dBLAmax (night)
Note: noise sensitive uses during the night-time period only
Predicted Noise levels in NEC B, i.e. 45-57dBLAeq, 8hr (night), or
Predicted Noise levels in NEC C 57-66dBLAeq, 8hr (night), and
Compliance with ‘reasonable’ BS8233 ‘criteria for internal noise levels in in bedrooms at night, i.e. 35dBLAeq, 8hr (night) 45dBLAmax (night)
Note: noise sensitive uses during the night-time period only
Predicted noise levels in NEC D, i.e. >66dBLAeq, 8hr (night), and
Non-compliance with of BS8233 criteria for internal noise levels in bedrooms at night, i.e. >35dBLAeq, 8hr (night) 45dBLAmax (night)
Note: noise sensitive uses during the night-time period only
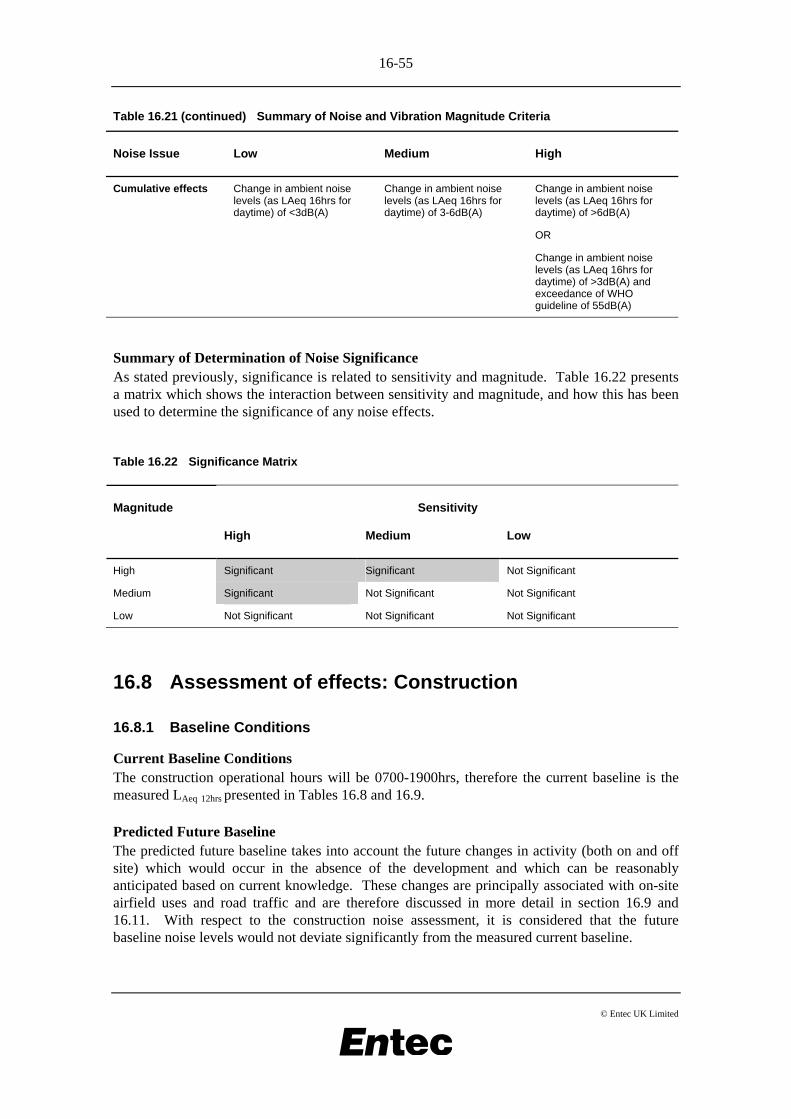
16-55
© Entec UK Limited
Table 16.21 (continued) Summary of Noise and Vibration Magnitude Criteria
Noise Issue Low Medium High
Cumulative effects Change in ambient noise levels (as LAeq 16hrs for daytime) of <3dB(A)
Change in ambient noise levels (as LAeq 16hrs for daytime) of 3-6dB(A)
Change in ambient noise levels (as LAeq 16hrs for daytime) of >6dB(A)
OR
Change in ambient noise levels (as LAeq 16hrs for daytime) of >3dB(A) and exceedance of WHO guideline of 55dB(A)
Summary of Determination of Noise Significance As stated previously, significance is related to sensitivity and magnitude. Table 16.22 presents a matrix which shows the interaction between sensitivity and magnitude, and how this has been used to determine the significance of any noise effects.
Table 16.22 Significance Matrix
Sensitivity Magnitude
High Medium Low
High Significant Significant Not Significant
Medium Significant Not Significant Not Significant
Low Not Significant Not Significant Not Significant
16.8 Assessment of effects: Construction
16.8.1 Baseline Conditions
Current Baseline Conditions The construction operational hours will be 0700-1900hrs, therefore the current baseline is the measured LAeq 12hrs presented in Tables 16.8 and 16.9.
Predicted Future Baseline The predicted future baseline takes into account the future changes in activity (both on and off site) which would occur in the absence of the development and which can be reasonably anticipated based on current knowledge. These changes are principally associated with on-site airfield uses and road traffic and are therefore discussed in more detail in section 16.9 and 16.11. With respect to the construction noise assessment, it is considered that the future baseline noise levels would not deviate significantly from the measured current baseline.
16-56
© Entec UK Limited
16.8.2 Predicted Effects and their Significance
Construction activities, whilst temporary in nature, will take place at certain times over a protracted period (2009-2028) due to the size and complexity of the proposals. The works will comprise numerous different activities at both the main development site, and other satellite sites. Construction activities will not occur in close proximity to any particular receptor for long periods of time.
As stated in Section 16.7.1, quantitative predictions of construction noise and vibration levels have not been undertaken for this assessment. A qualitative assessment has been undertaken, based upon the mitigation measures which have been incorporated into the scheme, as summarised in Section 16.5. Best practice measures will be used to control and manage construction noise and vibration emissions and their effects on existing noise sensitive receptors and future site occupants. These are examined in more detail below.
Standard Measures to Reduce Noise Levels at Source The construction plant complement would be modern machinery designed to minimise noise levels that are generated during operations. The plant would also be properly maintained in accordance with the manufacturers’ instructions to ensure that the occurrence of malfunctions that can give rise to elevated noise levels is reduced, and any malfunctions that do occur are swiftly repaired. ‘Smart’, warbling or broadband reversing alarms would also be fitted to all key mobile plant to reduce the intrusive nature of such sources. All machinery would be switched off or throttled down when not in use. Silencers will be fitted where appropriate, for example where noisy machines are required to be used in close proximity to sensitive receptors.
Barrier Attenuation Most of the development buildings proposed as part of the DTC are sited over 100m from the site boundary for security purposes. It is envisaged that acoustic barriers at the site boundary would therefore not be needed for the majority of construction works in this area. In specific instances where continuous noise (from DTC or other construction activities) is envisaged close to sensitive receptors, then consideration will be given to the use of temporary acoustic hoardings or baffle mounds if appropriate.
Noise Management Plan A Noise Management Plan (NMP) would be submitted to Vale of Glamorgan Council, prior to the commencement of any works on-site. The NMP would detail the locations, frequency and methodology of the routine noise monitoring which would be undertaken by the construction contractors throughout the construction period. It would also present construction noise and vibration limits derived from guidance presented in BS5228. The actions to be undertaken in the event of a breach of the relevant limits will be detailed.
A nominated member of staff would be appointed to co-ordinate liaison with local residents and the VoG Pollution Control Officer regarding noise issues. The NMP would therefore contain their relevant contact details, and specify the actions to be undertaken on receipt of a complaint.
Limitations to Hours of Operations Full construction operations would be restricted to 0700-1900 hrs on weekdays and Saturdays. Particularly noisy construction operations, generating high levels of noise at sensitive receptors, would be further restricted to 0800-1700hrs on a weekday and 0800-1300hrs on a Saturday only. Only non-noise generating works (such as routine maintenance or works within
16-57
© Entec UK Limited
buildings) would be carried out on Sundays. If the need arose for any operations to be carried out outside of these hours, prior consultation would be carried out with both the VoG PCO and the local community.
Location of Plant Items Whilst many of the noise sources would move location within and between the phases of the construction programme, certain plant items will remain relatively static. These plant items, such as generators, compressors and pumps, will be situated in order to minimise the noise effects on sensitive receptors.
Considerate Constructors Scheme The site would be registered with the Considerate Constructors Scheme, which is a Government endorsed scheme which encourages good practice on construction sites. Registered sites provide a commitment to comply with a Code of Practice which details how the construction site should present itself to, and interact with, the general public. In addition to guidance on cleanliness, safety, responsibility and environmental issues, a specific commitment to keep noise from construction operations to a minimum at all times is included in the Code of Practice. Membership of this scheme (or similar scheme) ensures that noise and vibration effects during the construction phase would be effectively managed.
Assessment The best practice measures described above will be used to ensure that noise and vibration levels are kept below the limits which will be detailed in the Noise Management Plan (NMP) to be agreed with the VoG POC prior to the commencement of the works. Noise (and where relevant vibration) limits for all construction works will be specified, including works on the main site (East Camp), ABP, SFA, Picketston, route of the new access road, locations for the road improvement works and route of the new rising main.
Whilst noise and vibration levels at individual specific receptors are likely to be well below these limits for the majority of the construction period, when activities are in closest proximity, noise and vibration levels may be close to these limits. It is therefore considered that a magnitude of medium is appropriate to be assigned to the construction noise and vibration effects, in order to reflect the likely worst case noise levels. This is in accordance with the methodology set out in Section 16.7.2.
The majority of existing noise sensitive receptors and future site occupants have been assigned a sensitivity of medium, as detailed in Section 16.7.2. When the sensitivity of medium is combined with a medium magnitude of effect, it can be concluded that the construction noise and vibration effects will be not significant for these receptors.
The occupants of MoD, commercial or industrial units in the area surrounding the main and satellite development sites have been assigned a sensitivity of low to reflect that their activities are often a source of noise in themselves. This is equally relevant to the majority of occupants of the ABP and some elements of the DTC. When the low sensitivity is combined with a medium magnitude of effect, it is concluded that the effects on these receptors will be not significant.
The in-patients of the medical and dental centre have been assigned a sensitivity of high, in order to reflect their increase vulnerability to the effects of noise (and vibration). It is possible that these receptors will experience noise effects due to construction activities carried out during
16-58
© Entec UK Limited
later phases of the development, i.e. those which occur after occupation of the medical centre. The construction programme will ensure that all works within close proximity to the medical and dental centre will be completed prior to its occupation. It is therefore considered appropriate to assign a magnitude of low to these noise and vibration effects. When this low magnitude of effect is considered along with the high receptor sensitivity, it is concluded that the effects will be not significant.
16.9 Assessment of Effects: Core Site Activities
16.9.1 Baseline Conditions
This section details the current baseline conditions for the various airfield noise sources as well as detailing the overall combined baseline daytime airfield noise climate at St. Athan. The current baseline conditions are based on noise predictions using data issued and provided by Welsh Assembly Government through their noise consultants Walker Beak Mason. All noise data used to establish current baselines is presented in Appendices Y-BB.
Current Baseline Conditions
Air Noise Air noise contours for a calendar year between mid-2007 and mid-2008 have been calculated by Walker Beak Mason (WBM) using INM in order to represent the current baseline conditions. Figure 16.5 presents the air noise contours for the 2007/8 current baseline. The figure shows that the 57dB LAeq 16-hour contour extends as far west as the coast just short of Stout and Pigeon Point. To the east, the contour turns and heads south encompassing areas of Castleton. To the north of the airfield, the 57dB contour runs along the south of West Camp. To the south of the airfield, the contour avoids Higher End and most of St. Athan however encompasses properties to the very north of St. Athan. To the north-east of the airfield, the 57dB contour avoids the Flemingston Road Housing Estate.
Ground Noise Predictions show that daytime ground noise levels at St. Athan in the baseline year are below 50dB(A) for most receptors outside of the site boundary. The highest levels of ground noise at receptors surrounding the airfield occur to the very north of St. Athan on Bingle Lane where ground noise levels are predicted to be 57dB(A) due to the proximity of the receptor to the runway end. To the south of the site at Higher End, ground noise levels are calculated to be approximately 50dB(A). To the north-west of St. Athan village, for properties overlooking the airfield, the predictions indicate ground noise levels of 47dB(A). To the north of the airfield at Eglwys Brewis and Picketston, noise levels are less than 45dB(A). In the centre of West Camp, ground noise levels are approximately 40dB(A). At receptors further west, noise levels are less than 40dB(A).
At other sensitive receptors such as St. Athan Primary School and Boverton Cemetery, ground noise levels are 41dB(A) and 34dB(A) respectively. At receptors further south of the airfield, such as Boverton Mill Farm and Seaview levels are 43dB(A) and 48dB(A) respectively.
16-59
© Entec UK Limited
VC10 Engine Running Figure 16.6 presents the maximum noise level contours for a VC10 engine run. It is understood from conversations with the PCO for VoGC that historically, complaints have been made by residents living in the vicinity of the airfield due to VC10 engine running. Based on information provided by Welsh Assembly Government through WBM (presented in Appendix Z) and confirmed by DSG, VC10 engine tests are usually classified into two separate groups: major and minor tests. Based on data confirmed by DSG, major tests can last approximately five days with engines occasionally throttled to full power for one of these days, which works out at approximately 5 hours. Minor ground running tests last approximately three days with occasional full power for half a day.
When assessing the noise propagation during VC10 engine running, it can be seen that maximum noise levels can reach levels of up to 80dB(A) at Picketston and parts of West Camp. Further to the west, on the outskirts of Boverton, noise levels can reach up to 70dB(A). To the south east at St. Athan village, the figure shows that noise levels can also reach up to 70dB(A). To the east, the noise levels are attenuated significantly by the Super Hangar. This results in maximum noise levels at the Flemingston Road Housing Estate reaching levels of up to 60-65dB(A).
Combined Airfield Activity Daytime noise levels due to combined airfield activity for the current baseline year and are presented in Figure 16.7. The figures show the influence of the VC10 engine testing located to the north of the runway and how this propagates mainly to the north, south and west due to the screening effect from the Super Hangar. When reviewing the noise map presented in Figure 16.7, it should be noted that daytime noise emissions from VC10 engine running are indicative and based on an average of 3.5 hours of engine running during the day. To the north of the airfield, it can be seen that noise from VC10 engine running can propagate through gaps between buildings and hangars to locations at Picketston. Figure 16.7 also shows the locations of the various airfield noise sources such as the Bond helipad to the south of the runway, the visitors’ helipad to the north and the hold points at the end of each runway. Noise due to taxiing aircraft is also visible as a well as breakout noise from various hangars and buildings on site.
In terms of noise levels, the figure shows that given the airfield activity, noise levels at most receptors surrounding the airfield fall within the 55dB(A) contour and thus within WHO guidelines for the avoidance of serious community annoyance. The exceptions to this are areas of West Camp and at Picketston where noise levels are up to 60-65dB(A). For the closest receptors north of the airfield at Eglwys-Brewis, noise levels at properties overlooking the airfield are less than 50-55dB(A).
Predicted future baseline This section details the predicted future baseline, in the event that the development did not proceed, for the various airfield noise sources as well as detailing the overall combined daytime airfield noise at St. Athan.
Air Noise Air noise contours have been calculated for each assessed future baseline year. The weekday air noise contours for both future baseline and development scenarios for 2014, 2020 and 2028 are overlaid and presented in Figures 16.8-16.10. Figures 16.11-16.13 present the weekend equivalent air noise contours for 2014, 2020 and 2028.
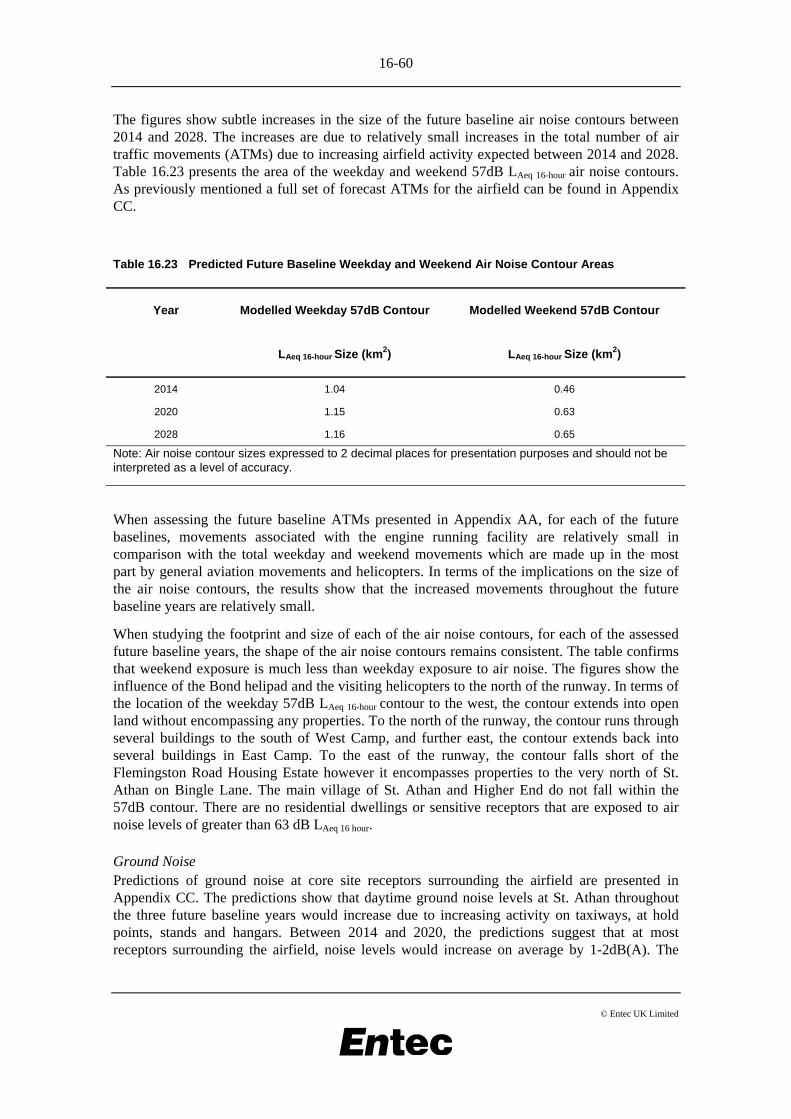
16-60
© Entec UK Limited
The figures show subtle increases in the size of the future baseline air noise contours between 2014 and 2028. The increases are due to relatively small increases in the total number of air traffic movements (ATMs) due to increasing airfield activity expected between 2014 and 2028. Table 16.23 presents the area of the weekday and weekend 57dB LAeq 16-hour air noise contours. As previously mentioned a full set of forecast ATMs for the airfield can be found in Appendix CC.
Table 16.23 Predicted Future Baseline Weekday and Weekend Air Noise Contour Areas
Year Modelled Weekday 57dB Contour
LAeq 16-hour Size (km2)
Modelled Weekend 57dB Contour
LAeq 16-hour Size (km2)
2014 1.04 0.46
2020 1.15 0.63
2028 1.16 0.65
Note: Air noise contour sizes expressed to 2 decimal places for presentation purposes and should not be interpreted as a level of accuracy.
When assessing the future baseline ATMs presented in Appendix AA, for each of the future baselines, movements associated with the engine running facility are relatively small in comparison with the total weekday and weekend movements which are made up in the most part by general aviation movements and helicopters. In terms of the implications on the size of the air noise contours, the results show that the increased movements throughout the future baseline years are relatively small.
When studying the footprint and size of each of the air noise contours, for each of the assessed future baseline years, the shape of the air noise contours remains consistent. The table confirms that weekend exposure is much less than weekday exposure to air noise. The figures show the influence of the Bond helipad and the visiting helicopters to the north of the runway. In terms of the location of the weekday 57dB LAeq 16-hour contour to the west, the contour extends into open land without encompassing any properties. To the north of the runway, the contour runs through several buildings to the south of West Camp, and further east, the contour extends back into several buildings in East Camp. To the east of the runway, the contour falls short of the Flemingston Road Housing Estate however it encompasses properties to the very north of St. Athan on Bingle Lane. The main village of St. Athan and Higher End do not fall within the 57dB contour. There are no residential dwellings or sensitive receptors that are exposed to air noise levels of greater than 63 dB LAeq 16 hour.
Ground Noise Predictions of ground noise at core site receptors surrounding the airfield are presented in Appendix CC. The predictions show that daytime ground noise levels at St. Athan throughout the three future baseline years would increase due to increasing activity on taxiways, at hold points, stands and hangars. Between 2014 and 2020, the predictions suggest that at most receptors surrounding the airfield, noise levels would increase on average by 1-2dB(A). The
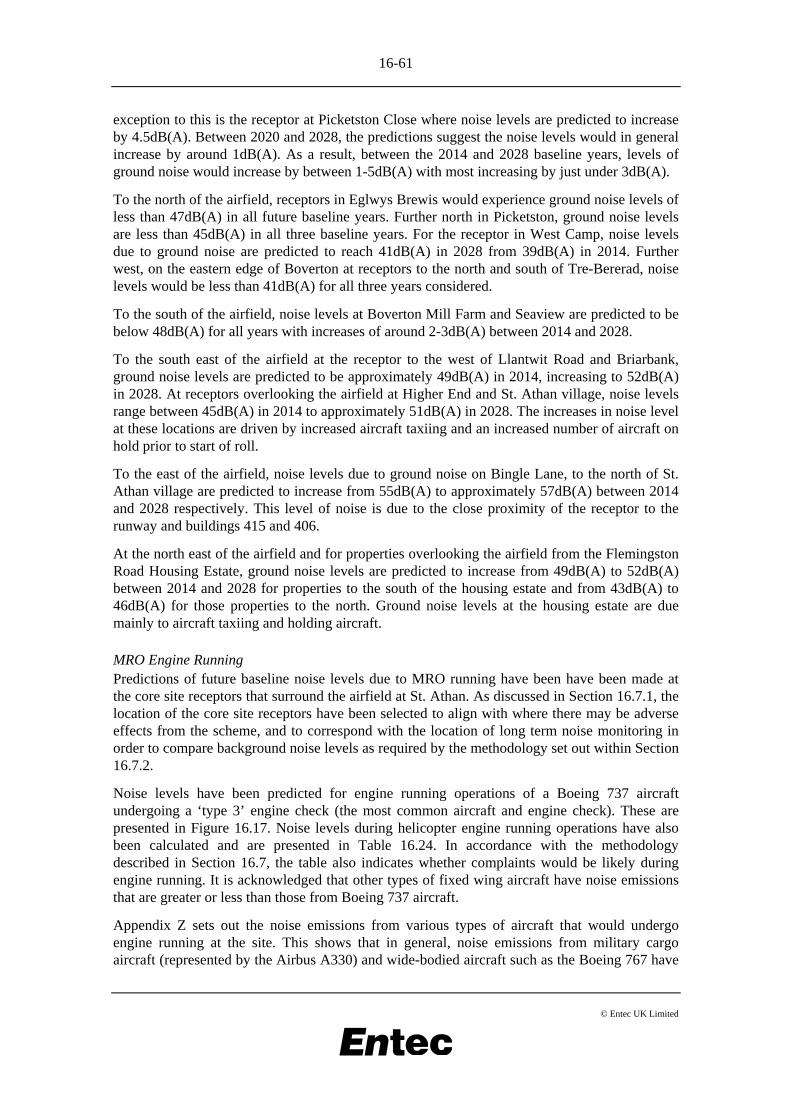
16-61
© Entec UK Limited
exception to this is the receptor at Picketston Close where noise levels are predicted to increase by 4.5dB(A). Between 2020 and 2028, the predictions suggest the noise levels would in general increase by around 1dB(A). As a result, between the 2014 and 2028 baseline years, levels of ground noise would increase by between 1-5dB(A) with most increasing by just under 3dB(A).
To the north of the airfield, receptors in Eglwys Brewis would experience ground noise levels of less than 47dB(A) in all future baseline years. Further north in Picketston, ground noise levels are less than 45dB(A) in all three baseline years. For the receptor in West Camp, noise levels due to ground noise are predicted to reach 41dB(A) in 2028 from 39dB(A) in 2014. Further west, on the eastern edge of Boverton at receptors to the north and south of Tre-Bererad, noise levels would be less than 41dB(A) for all three years considered.
To the south of the airfield, noise levels at Boverton Mill Farm and Seaview are predicted to be below 48dB(A) for all years with increases of around 2-3dB(A) between 2014 and 2028.
To the south east of the airfield at the receptor to the west of Llantwit Road and Briarbank, ground noise levels are predicted to be approximately 49dB(A) in 2014, increasing to 52dB(A) in 2028. At receptors overlooking the airfield at Higher End and St. Athan village, noise levels range between 45dB(A) in 2014 to approximately 51dB(A) in 2028. The increases in noise level at these locations are driven by increased aircraft taxiing and an increased number of aircraft on hold prior to start of roll.
To the east of the airfield, noise levels due to ground noise on Bingle Lane, to the north of St. Athan village are predicted to increase from 55dB(A) to approximately 57dB(A) between 2014 and 2028 respectively. This level of noise is due to the close proximity of the receptor to the runway and buildings 415 and 406.
At the north east of the airfield and for properties overlooking the airfield from the Flemingston Road Housing Estate, ground noise levels are predicted to increase from 49dB(A) to 52dB(A) between 2014 and 2028 for properties to the south of the housing estate and from 43dB(A) to 46dB(A) for those properties to the north. Ground noise levels at the housing estate are due mainly to aircraft taxiing and holding aircraft.
MRO Engine Running Predictions of future baseline noise levels due to MRO running have been have been made at the core site receptors that surround the airfield at St. Athan. As discussed in Section 16.7.1, the location of the core site receptors have been selected to align with where there may be adverse effects from the scheme, and to correspond with the location of long term noise monitoring in order to compare background noise levels as required by the methodology set out within Section 16.7.2.
Noise levels have been predicted for engine running operations of a Boeing 737 aircraft undergoing a ‘type 3’ engine check (the most common aircraft and engine check). These are presented in Figure 16.17. Noise levels during helicopter engine running operations have also been calculated and are presented in Table 16.24. In accordance with the methodology described in Section 16.7, the table also indicates whether complaints would be likely during engine running. It is acknowledged that other types of fixed wing aircraft have noise emissions that are greater or less than those from Boeing 737 aircraft.
Appendix Z sets out the noise emissions from various types of aircraft that would undergo engine running at the site. This shows that in general, noise emissions from military cargo aircraft (represented by the Airbus A330) and wide-bodied aircraft such as the Boeing 767 have
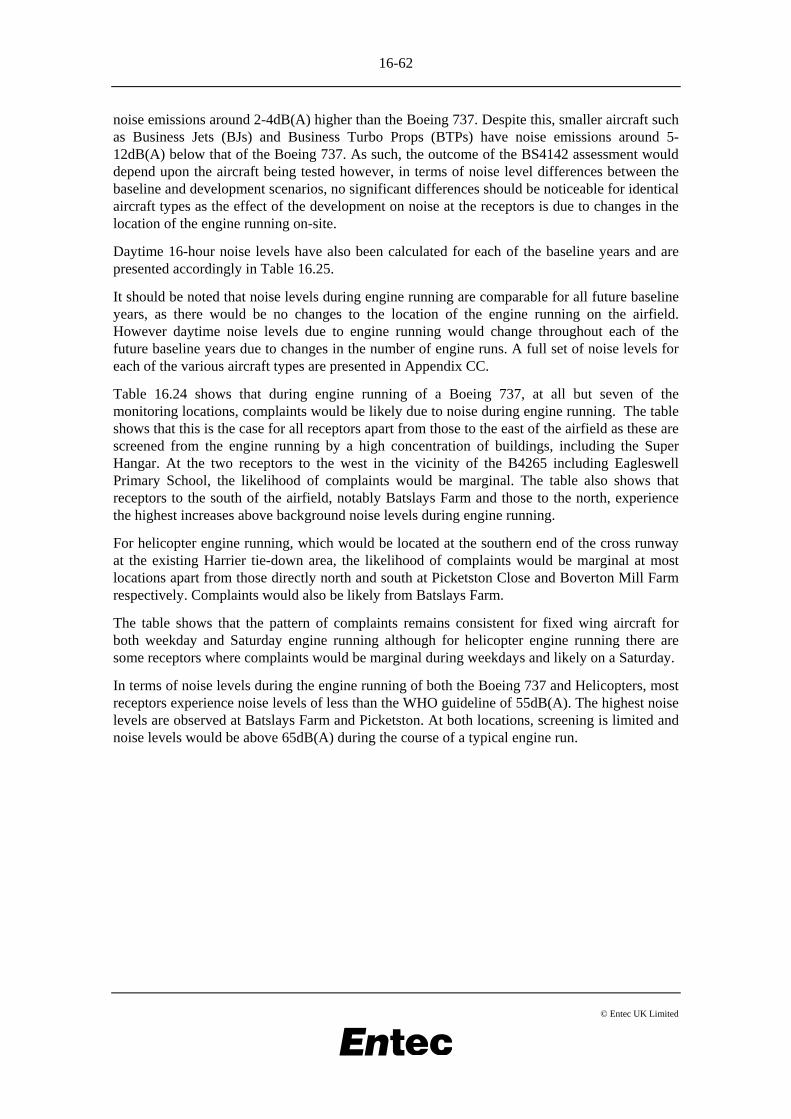
16-62
© Entec UK Limited
noise emissions around 2-4dB(A) higher than the Boeing 737. Despite this, smaller aircraft such as Business Jets (BJs) and Business Turbo Props (BTPs) have noise emissions around 5-12dB(A) below that of the Boeing 737. As such, the outcome of the BS4142 assessment would depend upon the aircraft being tested however, in terms of noise level differences between the baseline and development scenarios, no significant differences should be noticeable for identical aircraft types as the effect of the development on noise at the receptors is due to changes in the location of the engine running on-site.
Daytime 16-hour noise levels have also been calculated for each of the baseline years and are presented accordingly in Table 16.25.
It should be noted that noise levels during engine running are comparable for all future baseline years, as there would be no changes to the location of the engine running on the airfield. However daytime noise levels due to engine running would change throughout each of the future baseline years due to changes in the number of engine runs. A full set of noise levels for each of the various aircraft types are presented in Appendix CC.
Table 16.24 shows that during engine running of a Boeing 737, at all but seven of the monitoring locations, complaints would be likely due to noise during engine running. The table shows that this is the case for all receptors apart from those to the east of the airfield as these are screened from the engine running by a high concentration of buildings, including the Super Hangar. At the two receptors to the west in the vicinity of the B4265 including Eagleswell Primary School, the likelihood of complaints would be marginal. The table also shows that receptors to the south of the airfield, notably Batslays Farm and those to the north, experience the highest increases above background noise levels during engine running.
For helicopter engine running, which would be located at the southern end of the cross runway at the existing Harrier tie-down area, the likelihood of complaints would be marginal at most locations apart from those directly north and south at Picketston Close and Boverton Mill Farm respectively. Complaints would also be likely from Batslays Farm.
The table shows that the pattern of complaints remains consistent for fixed wing aircraft for both weekday and Saturday engine running although for helicopter engine running there are some receptors where complaints would be marginal during weekdays and likely on a Saturday.
In terms of noise levels during the engine running of both the Boeing 737 and Helicopters, most receptors experience noise levels of less than the WHO guideline of 55dB(A). The highest noise levels are observed at Batslays Farm and Picketston. At both locations, screening is limited and noise levels would be above 65dB(A) during the course of a typical engine run.
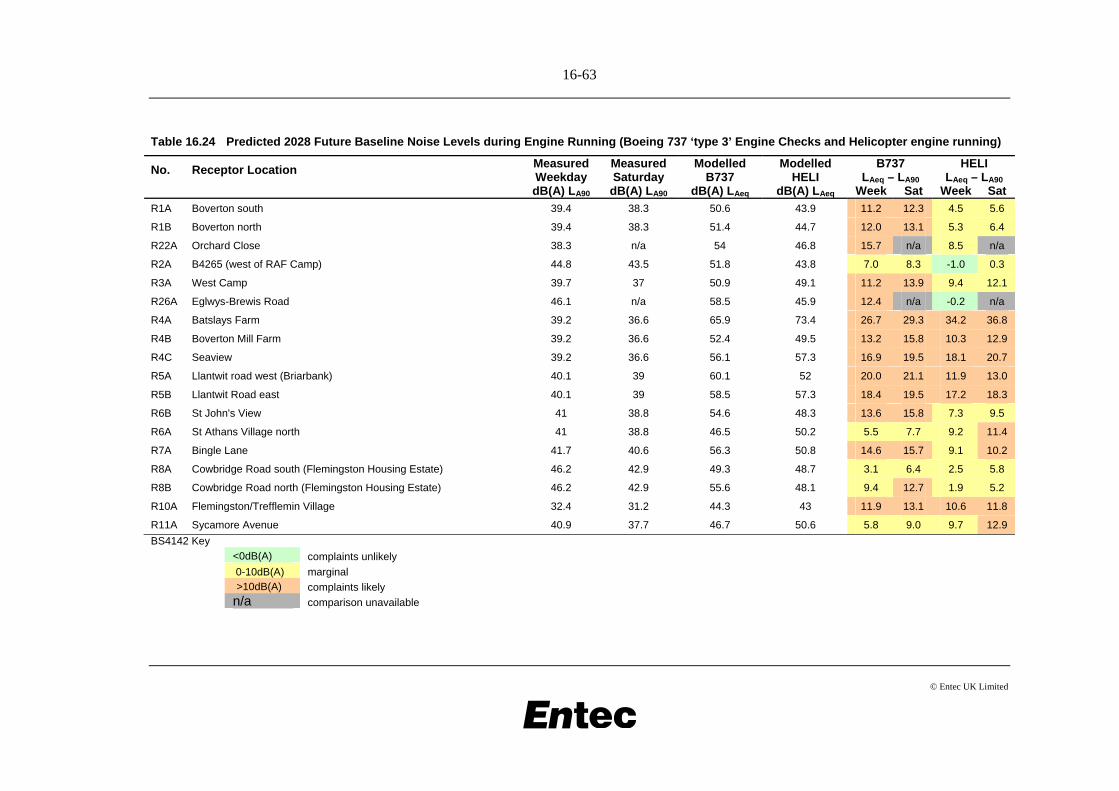
16-63
© Entec UK Limited
Table 16.24 Predicted 2028 Future Baseline Noise Levels during Engine Running (Boeing 737 ‘type 3’ Engine Checks and Helicopter engine running)
B737 LAeq – LA90
HELI LAeq – LA90
No. Receptor Location Measured Weekday dB(A) LA90
Measured Saturday dB(A) LA90
Modelled B737
dB(A) LAeq
Modelled HELI
dB(A) LAeq Week Sat Week Sat
R1A Boverton south 39.4 38.3 50.6 43.9 11.2 12.3 4.5 5.6
R1B Boverton north 39.4 38.3 51.4 44.7 12.0 13.1 5.3 6.4
R22A Orchard Close 38.3 n/a 54 46.8 15.7 n/a 8.5 n/a
R2A B4265 (west of RAF Camp) 44.8 43.5 51.8 43.8 7.0 8.3 -1.0 0.3
R3A West Camp 39.7 37 50.9 49.1 11.2 13.9 9.4 12.1
R26A Eglwys-Brewis Road 46.1 n/a 58.5 45.9 12.4 n/a -0.2 n/a
R4A Batslays Farm 39.2 36.6 65.9 73.4 26.7 29.3 34.2 36.8
R4B Boverton Mill Farm 39.2 36.6 52.4 49.5 13.2 15.8 10.3 12.9
R4C Seaview 39.2 36.6 56.1 57.3 16.9 19.5 18.1 20.7
R5A Llantwit road west (Briarbank) 40.1 39 60.1 52 20.0 21.1 11.9 13.0
R5B Llantwit Road east 40.1 39 58.5 57.3 18.4 19.5 17.2 18.3
R6B St John's View 41 38.8 54.6 48.3 13.6 15.8 7.3 9.5
R6A St Athans Village north 41 38.8 46.5 50.2 5.5 7.7 9.2 11.4
R7A Bingle Lane 41.7 40.6 56.3 50.8 14.6 15.7 9.1 10.2
R8A Cowbridge Road south (Flemingston Housing Estate) 46.2 42.9 49.3 48.7 3.1 6.4 2.5 5.8
R8B Cowbridge Road north (Flemingston Housing Estate) 46.2 42.9 55.6 48.1 9.4 12.7 1.9 5.2
R10A Flemingston/Trefflemin Village 32.4 31.2 44.3 43 11.9 13.1 10.6 11.8
R11A Sycamore Avenue 40.9 37.7 46.7 50.6 5.8 9.0 9.7 12.9 BS4142 Key <0dB(A) complaints unlikely 0-10dB(A) marginal >10dB(A) complaints likely n/a comparison unavailable
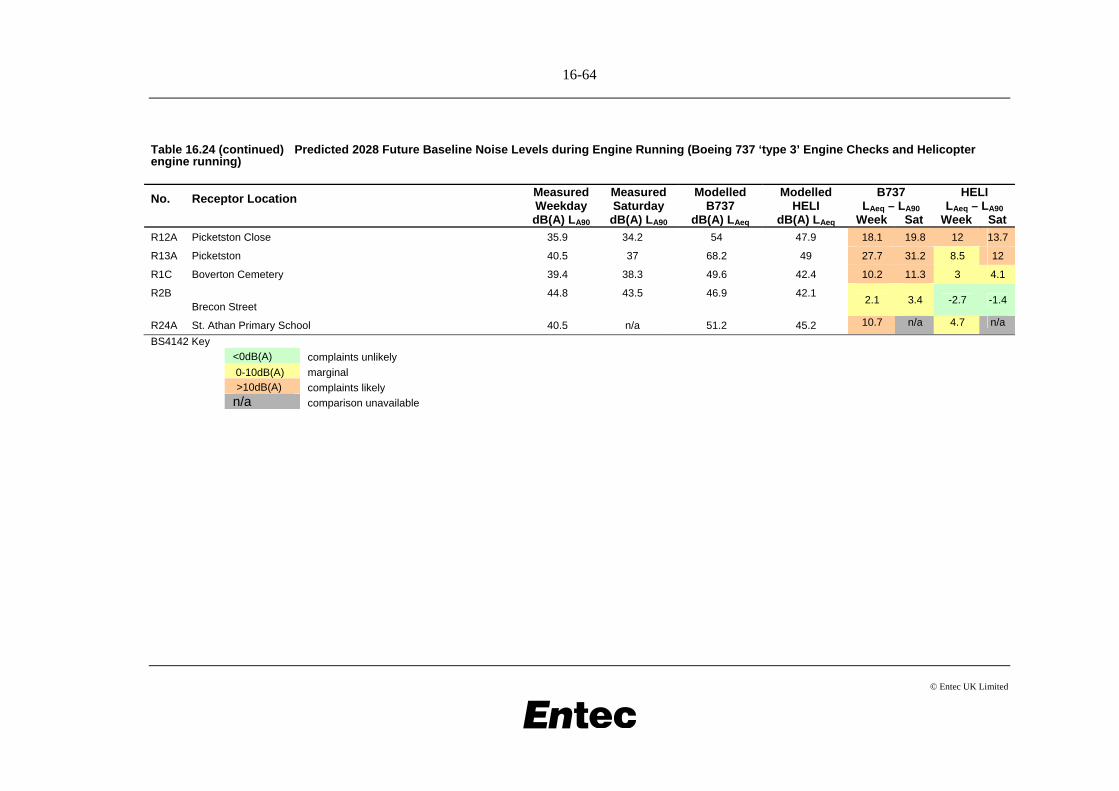
16-64
© Entec UK Limited
Table 16.24 (continued) Predicted 2028 Future Baseline Noise Levels during Engine Running (Boeing 737 ‘type 3’ Engine Checks and Helicopter engine running)
B737 LAeq – LA90
HELI LAeq – LA90
No. Receptor Location Measured Weekday dB(A) LA90
Measured Saturday dB(A) LA90
Modelled B737
dB(A) LAeq
Modelled HELI
dB(A) LAeq Week Sat Week Sat
R12A Picketston Close 35.9 34.2 54 47.9 18.1 19.8 12 13.7
R13A Picketston 40.5 37 68.2 49 27.7 31.2 8.5 12
R1C Boverton Cemetery 39.4 38.3 49.6 42.4 10.2 11.3 3 4.1
R2B Brecon Street
44.8 43.5 46.9 42.1 2.1 3.4 -2.7 -1.4
R24A St. Athan Primary School 40.5 n/a 51.2 45.2 10.7 n/a 4.7 n/a
BS4142 Key <0dB(A) complaints unlikely 0-10dB(A) marginal >10dB(A) complaints likely n/a comparison unavailable

16-65
© Entec UK Limited
Table 16.25 Predicted Future Baseline Daytime 16-hour Noise Levels due to Engine Running
No. Receptor Location Modelled 2014
LAeq 16 hour
dB(A)
Modelled 2020
LAeq 16 hour
dB(A)
Modelled 2028
LAeq 16 hour
dB(A))
2020 – 2014 Difference
dB(A)
2028 - 2020 Difference
dB(A)
2028 – 2014 Difference
dB(A)
R1A Boverton south 33.7 37.7 38.1 4.0 0.4 4.4
R1B Boverton north 34.6 38.6 39.0 4.0 0.4 4.3
R22A Orchard Close 37.1 41.1 41.4 4.0 0.3 4.3
R2A B4265 (west of RAF Camp) 34.8 38.8 39.1 4.0 0.3 4.3
R3A West Camp 35.3 39.3 40.0 4.0 0.7 4.7
R26A Eglwys Brewis road 41.2 45.2 45.4 4.0 0.2 4.2
R4A Batslays Farm 55.6 59.4 60.9 3.7 1.5 5.2
R4B Boverton Mill Farm 36.3 40.3 40.9 4.0 0.6 4.6
R4C Seaview 41.6 45.5 46.4 3.9 1.0 4.9
R5A Llantwit road west 43.2 47.2 47.5 4.0 0.3 4.3
R5B Llantwit road east 42.9 46.9 47.6 3.9 0.8 4.7
R6B St John's View 37.8 41.8 42.2 4.0 0.4 4.4
R6A St Athans Village north 33.6 37.4 38.6 3.9 1.2 5.1
R7A Bingle Lane 39.6 43.6 44.0 4.0 0.4 4.4
R8A Cowbridge Road south (Flemingston Housing Estate) 34.2 38.1 38.8 3.9 0.8 4.7
R8B Cowbridge Road north (Flemingston Housing Estate) 38.7 42.6 43.0 4.0 0.3 4.3
R10A Flemingston Village 28.9 32.9 33.7 4.0 0.7 4.7
R11A Sycamore Avenue 33.8 37.7 38.9 3.9 1.2 5.1
R12A Picketston Close 37.4 41.4 41.8 4.0 0.4 4.4
R13A Picketston 50.7 54.7 54.9 4.0 0.1 4.1
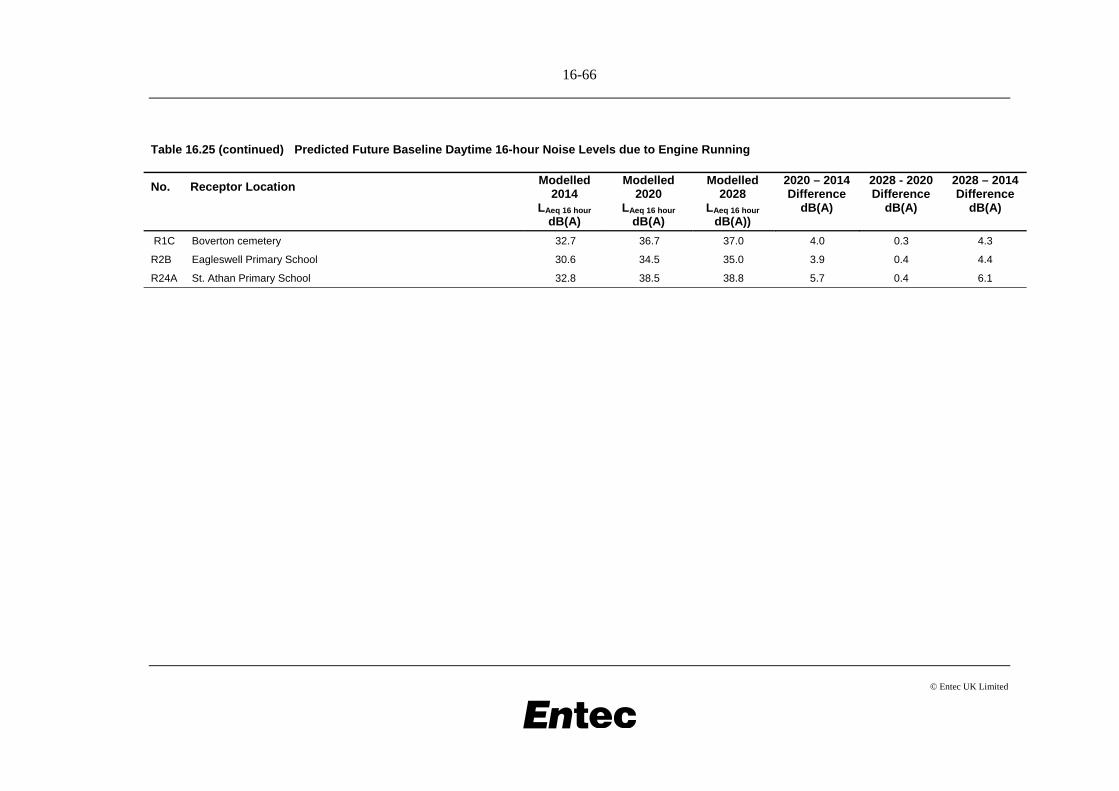
16-66
© Entec UK Limited
Table 16.25 (continued) Predicted Future Baseline Daytime 16-hour Noise Levels due to Engine Running
No. Receptor Location Modelled 2014
LAeq 16 hour
dB(A)
Modelled 2020
LAeq 16 hour
dB(A)
Modelled 2028
LAeq 16 hour
dB(A))
2020 – 2014 Difference
dB(A)
2028 - 2020 Difference
dB(A)
2028 – 2014 Difference
dB(A)
R1C Boverton cemetery 32.7 36.7 37.0 4.0 0.3 4.3
R2B Eagleswell Primary School 30.6 34.5 35.0 3.9 0.4 4.4
R24A St. Athan Primary School 32.8 38.5 38.8 5.7 0.4 6.1
16-67
In terms of daytime noise levels due to engine running, the table shows that the largest increase in daytime noise level due to engine testing is between 2014 and 2020. This is due to fixed wing aircraft engine running increasing from approximately 1 to 4 hours per week with a doubling in the number of helicopter engine runs per week. This results in an increase in daytime noise levels due to engine testing of around 4dB(A) at each receptor. Between 2020 and 2028, Table 16.25 shows that daytime noise levels due to engine running increase by up to and around 1dB(A) at some of the core site receptors. The increases in noise level are relatively small compared to the increases between 2014 and 2020. This is due to an additional business jet and business turbo prop engine running and an additional helicopter engine run per week. Between 2014 and 2028, the table shows that due to increased engine running activity at the site, daytime noise levels would increase by 4-5dB(A).
In terms of noise levels, Table 16.24 shows that although daytime noise levels would increase throughout the future baseline years, engine running noise levels would be less than 45dB(A) at most locations and would therefore be within WHO guideline noise levels. The highest daytime noise level would be at Batslays Farm where engine running would contribute 61dB(A) to overall daytime noise levels at the receptor.
Combined Core Site Activities
Daytime noise levels due to Combined Core Site Activities for the future baseline years are presented in Figures 16.14-16.16 for the baseline years of 2014, 2020 and 2028 respectively. The figures show the location of the engine running to the north of the runway, and to the east of the cross runway. When comparing the noise emission from the fixed wing engine running, it can be seen that noise levels increase between 2014 and 2020 but do not increase as much between 2020 and 2028. Like the VC10 engine running as presented in the current baseline, it can be seen that similar issues of noise propagating through gaps within the buildings would also occur in the future baselines. To the south of the airfield it is possible to see the influence of the helicopter engine running at the bottom of the cross runway. As per the current baseline, air noise has not been included within Combined Core Site Activities.
Noise breakout from the Super Hangar can also be seen in the Figures as well as noise from aircraft at stands, taxiing aircraft and helicopter operations at the Bond and visitors’ helipad. It is also possible to see noise due to holding aircraft at each end of the runway. When comparing the Figures for each of the baseline years, the increased noise emissions from the engine running locations and runway hold points are obvious. It is also noted that the shape of the noise contours do not change significantly despite the increase in levels throughout each of the future baseline years.
In terms of noise levels, the Figures show that given the airfield activity, noise levels at most receptors surrounding the airfield fall within the 55dB(A) contour and thus within WHO guidelines. As with the 2007/8 baseline, the exceptions to this are areas of West Camp and properties to the north of St. Athan where noise levels are up to 60dB(A). In a very isolated case, noise levels at several properties to the south-western corner of the Flemingston Housing Estate are above 55dB(A). For the closest properties north of the airfield at Eglwys Brewis, noise levels at properties overlooking the site are less than 50dB(A). At St. Athan Primary School, noise levels are less than 45dB(A). Properties on the outskirts of Boverton experience noise levels of up to 45dB(A) with properties further into the settlement experiencing daytime noise levels of less than 40dB(A).
16-68
In order to indicate changes in daytime noise levels between the future baseline years, noise levels have been predicted at the core site receptors which overlook and surround the airfield. Table 16.26 indicates the noise levels from combined core site activities for each of the baseline years, and the changes predicted between them.
The table shows that for the majority of the receptors, the greatest increase in noise levels between the future baseline years occur between 2014 and 2020. The increases are approximately 2-3dB(A). At some of the receptors, such as Eglwys Brewis Road and Picketston, the increases are slightly above 3dB(A). Between 2020 and 2028, the results indicate a further increase of approximately 1dB(A) at most of the core site receptors. When comparing the increases in noise levels between 2014 and 2028, increases are generally 2-4dB(A).
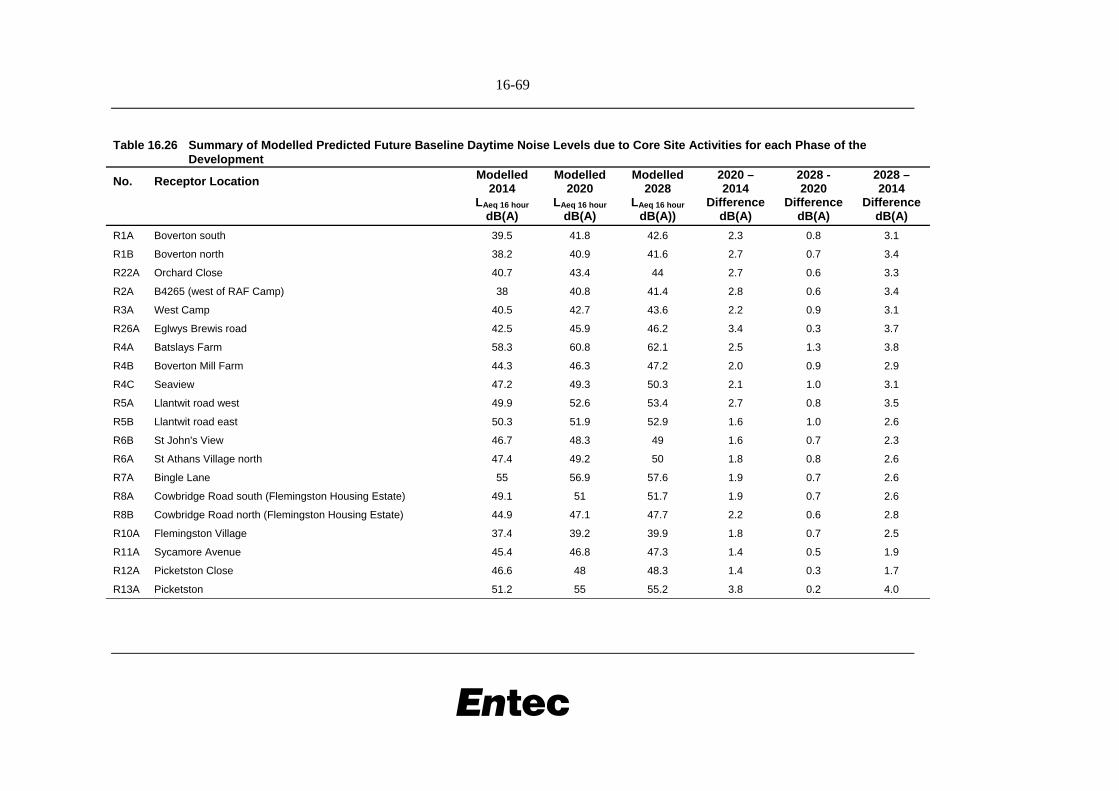
16-69
Table 16.26 Summary of Modelled Predicted Future Baseline Daytime Noise Levels due to Core Site Activities for each Phase of the Development
No. Receptor Location Modelled 2014
LAeq 16 hour
dB(A)
Modelled 2020
LAeq 16 hour
dB(A)
Modelled 2028
LAeq 16 hour
dB(A))
2020 – 2014
Difference dB(A)
2028 - 2020
Difference dB(A)
2028 – 2014
Difference dB(A)
R1A Boverton south 39.5 41.8 42.6 2.3 0.8 3.1
R1B Boverton north 38.2 40.9 41.6 2.7 0.7 3.4
R22A Orchard Close 40.7 43.4 44 2.7 0.6 3.3
R2A B4265 (west of RAF Camp) 38 40.8 41.4 2.8 0.6 3.4
R3A West Camp 40.5 42.7 43.6 2.2 0.9 3.1
R26A Eglwys Brewis road 42.5 45.9 46.2 3.4 0.3 3.7
R4A Batslays Farm 58.3 60.8 62.1 2.5 1.3 3.8
R4B Boverton Mill Farm 44.3 46.3 47.2 2.0 0.9 2.9
R4C Seaview 47.2 49.3 50.3 2.1 1.0 3.1
R5A Llantwit road west 49.9 52.6 53.4 2.7 0.8 3.5
R5B Llantwit road east 50.3 51.9 52.9 1.6 1.0 2.6
R6B St John's View 46.7 48.3 49 1.6 0.7 2.3
R6A St Athans Village north 47.4 49.2 50 1.8 0.8 2.6
R7A Bingle Lane 55 56.9 57.6 1.9 0.7 2.6
R8A Cowbridge Road south (Flemingston Housing Estate) 49.1 51 51.7 1.9 0.7 2.6
R8B Cowbridge Road north (Flemingston Housing Estate) 44.9 47.1 47.7 2.2 0.6 2.8
R10A Flemingston Village 37.4 39.2 39.9 1.8 0.7 2.5
R11A Sycamore Avenue 45.4 46.8 47.3 1.4 0.5 1.9
R12A Picketston Close 46.6 48 48.3 1.4 0.3 1.7
R13A Picketston 51.2 55 55.2 3.8 0.2 4.0
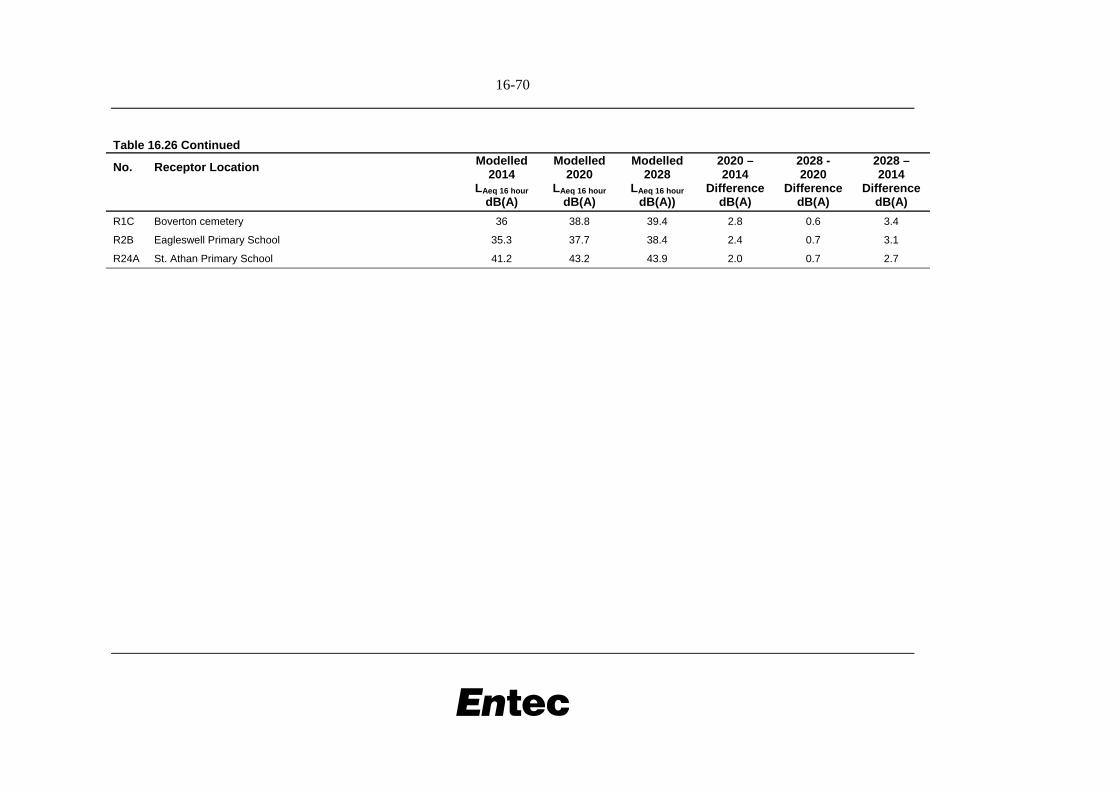
16-70
Table 16.26 Continued
No. Receptor Location Modelled 2014
LAeq 16 hour
dB(A)
Modelled 2020
LAeq 16 hour
dB(A)
Modelled 2028
LAeq 16 hour
dB(A))
2020 – 2014
Difference dB(A)
2028 - 2020
Difference dB(A)
2028 – 2014
Difference dB(A)
R1C Boverton cemetery 36 38.8 39.4 2.8 0.6 3.4
R2B Eagleswell Primary School 35.3 37.7 38.4 2.4 0.7 3.1
R24A St. Athan Primary School 41.2 43.2 43.9 2.0 0.7 2.7
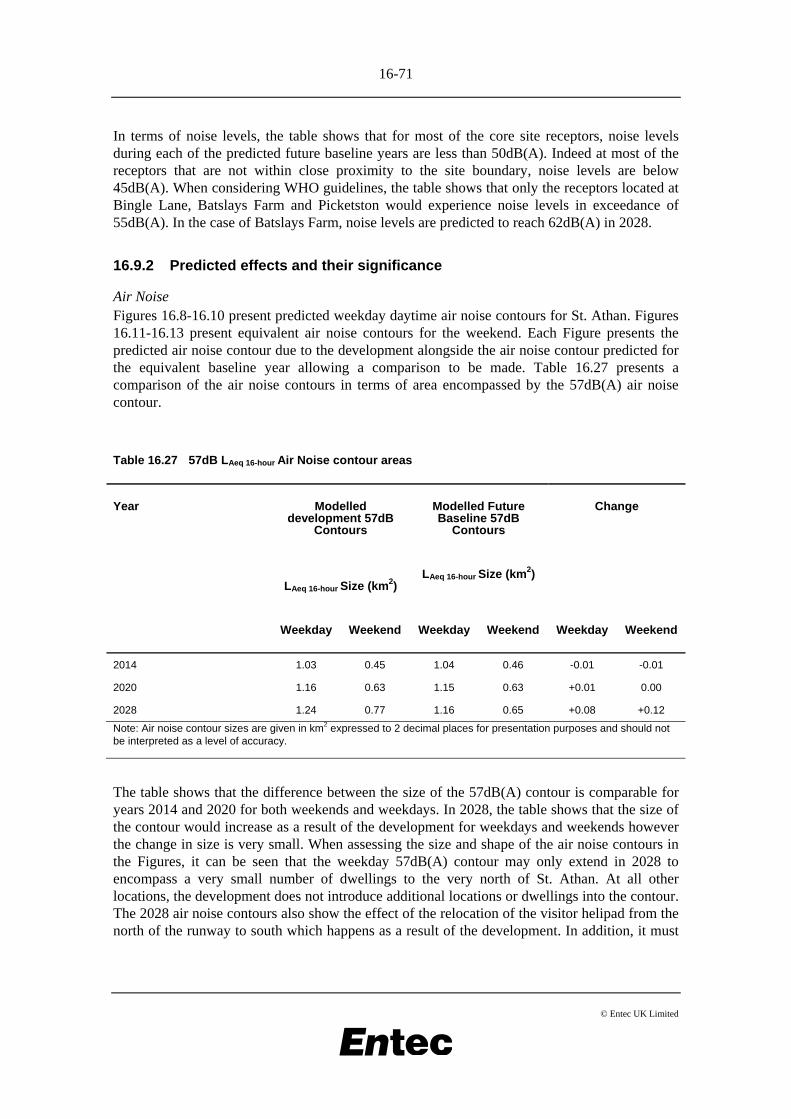
16-71
© Entec UK Limited
In terms of noise levels, the table shows that for most of the core site receptors, noise levels during each of the predicted future baseline years are less than 50dB(A). Indeed at most of the receptors that are not within close proximity to the site boundary, noise levels are below 45dB(A). When considering WHO guidelines, the table shows that only the receptors located at Bingle Lane, Batslays Farm and Picketston would experience noise levels in exceedance of 55dB(A). In the case of Batslays Farm, noise levels are predicted to reach 62dB(A) in 2028.
16.9.2 Predicted effects and their significance
Air Noise Figures 16.8-16.10 present predicted weekday daytime air noise contours for St. Athan. Figures 16.11-16.13 present equivalent air noise contours for the weekend. Each Figure presents the predicted air noise contour due to the development alongside the air noise contour predicted for the equivalent baseline year allowing a comparison to be made. Table 16.27 presents a comparison of the air noise contours in terms of area encompassed by the 57dB(A) air noise contour.
Table 16.27 57dB LAeq 16-hour Air Noise contour areas
Modelled development 57dB
Contours
LAeq 16-hour Size (km2)
Modelled Future Baseline 57dB
Contours
LAeq 16-hour Size (km2)
Change Year
Weekday Weekend Weekday Weekend Weekday Weekend
2014 1.03 0.45 1.04 0.46 -0.01 -0.01
2020 1.16 0.63 1.15 0.63 +0.01 0.00
2028 1.24 0.77 1.16 0.65 +0.08 +0.12
Note: Air noise contour sizes are given in km2 expressed to 2 decimal places for presentation purposes and should not be interpreted as a level of accuracy.
The table shows that the difference between the size of the 57dB(A) contour is comparable for years 2014 and 2020 for both weekends and weekdays. In 2028, the table shows that the size of the contour would increase as a result of the development for weekdays and weekends however the change in size is very small. When assessing the size and shape of the air noise contours in the Figures, it can be seen that the weekday 57dB(A) contour may only extend in 2028 to encompass a very small number of dwellings to the very north of St. Athan. At all other locations, the development does not introduce additional locations or dwellings into the contour. The 2028 air noise contours also show the effect of the relocation of the visitor helipad from the north of the runway to south which happens as a result of the development. In addition, it must
16-72
© Entec UK Limited
be noted that the helicopters hovering prior to arrival and departure are modelled within the ground noise assessment and not under the title of air noise.
When assessing changes in noise level within the air noise contours, changes in level due to the development are less than 1dB(A) for each location assessed. In accordance with the methodology presented in Section 16.7, a ‘low’ magnitude has been assigned to the noise effects at all receptors due to changes in air noise. When combined with the medium sensitivity of the receptors encompassed by the 57dB LAeq 16hour noise contour, it is concluded that the noise effects due to the development are not significant.
Ground Noise Daytime ground noise levels have been calculated at core site receptors surrounding the airfield for each of the development years. The noise levels have been compared to those calculated for each of the equivalent predicted future baseline years. A full set of ground noise levels are presented in Appendix CC.
In general ground noise levels throughout each of the development years increase by between 1-3dB(A). The results indicate that most of the increases occur between 2014 and 2020 with further yet smaller increases occurring between 2020 and 2028. The exceptions to this are the core site receptors located to the north of St. Athan and at St. John’s View where increases in ground noise between 2014 and 2028 are predicted to be around 6dB(A). These increases are due to the relocation of UWAS and VGS to hangars to the east of the site. In terms of noise levels, the results show that the highest ground noise levels are located with a direct view of the airfield, these include Batslays Farm, St. Johns View and the north of St. Athan Village where noise levels are above 50dB(A).
Table 16.28 presents a contextual comparison of predicted ground noise levels at core site receptors for each of the assessment years for the development against predicted future baseline conditions in the same years. The table indicates, in accordance with the methodology set out within Section 16.7, the magnitude classification of the change.
The table shows that at most core site receptors, differences between development and future baseline ground noise levels are below 1dB(A) and therefore ‘low’ in terms of magnitude across all years of the development. Many receptors are predicted to experience a decrease in ground noise levels due to the development.
The table shows that as part of the development noise levels at the receptor to the west of Llantwit Road (including Briarbank) would experience changes in noise level of around 7dB(A) in 2014 and 5dB(A) in 2020 as a result of the development and would therefore be assigned a magnitude of ‘high’. This is due to the temporary relocation of UWAS and VGS from the north of the runway to a nearby hangar to the south. The table does however show that in 2028, noise levels at the receptor would decrease by around 1dB(A) with respect to the predicted future baseline. This is due to the permanent relocation of UWAS and VGS to hangars to the east of the site. This relocation is reflected by changes in ground noise levels at the core site receptors at St. John’s View, to the north of St. Athan and to the south of the Flemingston Housing Estate which are all within 500m of the relocated UWAS and VGS hangar to the east of the main runway. The changes in noise level at these receptors are between 1-3dB(A) and would therefore be assigned a magnitude of ‘medium’.
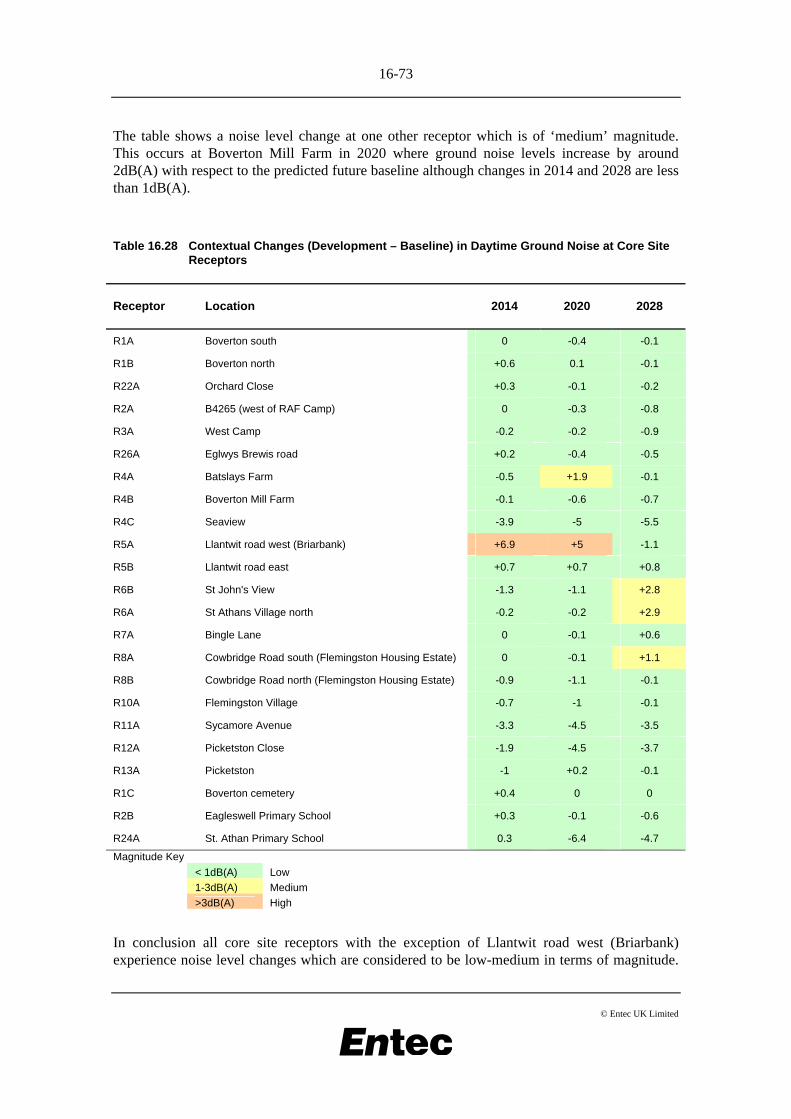
16-73
© Entec UK Limited
The table shows a noise level change at one other receptor which is of ‘medium’ magnitude. This occurs at Boverton Mill Farm in 2020 where ground noise levels increase by around 2dB(A) with respect to the predicted future baseline although changes in 2014 and 2028 are less than 1dB(A).
Table 16.28 Contextual Changes (Development – Baseline) in Daytime Ground Noise at Core Site Receptors
Receptor Location 2014 2020 2028
R1A Boverton south 0 -0.4 -0.1
R1B Boverton north +0.6 0.1 -0.1
R22A Orchard Close +0.3 -0.1 -0.2
R2A B4265 (west of RAF Camp) 0 -0.3 -0.8
R3A West Camp -0.2 -0.2 -0.9
R26A Eglwys Brewis road +0.2 -0.4 -0.5
R4A Batslays Farm -0.5 +1.9 -0.1
R4B Boverton Mill Farm -0.1 -0.6 -0.7
R4C Seaview -3.9 -5 -5.5
R5A Llantwit road west (Briarbank) +6.9 +5 -1.1
R5B Llantwit road east +0.7 +0.7 +0.8
R6B St John's View -1.3 -1.1 +2.8
R6A St Athans Village north -0.2 -0.2 +2.9
R7A Bingle Lane 0 -0.1 +0.6
R8A Cowbridge Road south (Flemingston Housing Estate) 0 -0.1 +1.1
R8B Cowbridge Road north (Flemingston Housing Estate) -0.9 -1.1 -0.1
R10A Flemingston Village -0.7 -1 -0.1
R11A Sycamore Avenue -3.3 -4.5 -3.5
R12A Picketston Close -1.9 -4.5 -3.7
R13A Picketston -1 +0.2 -0.1
R1C Boverton cemetery +0.4 0 0
R2B Eagleswell Primary School +0.3 -0.1 -0.6
R24A St. Athan Primary School 0.3 -6.4 -4.7
Magnitude Key < 1dB(A) Low 1-3dB(A) Medium >3dB(A) High
In conclusion all core site receptors with the exception of Llantwit road west (Briarbank) experience noise level changes which are considered to be low-medium in terms of magnitude.

16-74
© Entec UK Limited
When combined with the ‘medium’ sensitivity of these receptors, it can be concluded that the noise impacts would not be significant.
For the receptor to the west of Llantwit Road at Briarbank noise level changes in 2014 and 2020 are considered of ‘high’ magnitude. When combined with the medium sensitivity of the receptor, the effects would be significant. For phase 3 of the development in 2028, the magnitude is considered to be low and therefore effects would be ‘not significant. As a result it may be concluded that at Briarbank, the development would cause significant effects until 2028 when VGS and UWAS are permanently relocated.
MRO Engine Running Noise predictions have been made for each phase of the ABP development in 2014, 2020 and 2028. The predictions have considered noise levels during the course of an engine run in order to gauge the potential for noise complaints. The total daytime noise level due to engine running has also been calculated in order to establish the implications of the increased numbers of runs.
Table 16.29 presents the noise levels during engine running operations of a Boeing 737 aircraft undergoing a ‘type 3’ engine check (the most common aircraft and engine check). Noise levels during helicopter engine running operations have also been calculated and are presented in Table 16.29. It is noted that although the most common fixed wing aircraft undergoing engine running and the most frequent type of engine check are the same as what would occur in the absence of the development, the location of the engine running facility for fixed wing aircraft moves from the existing VC10 engine running location to the north of the runway to a purpose built facility in the Batslays area of the site. Helicopter engine running would also move from the existing Harrier tie-down area at the south of the cross-runway to the proposed facility. Changes in noise levels at core site receptors surrounding the airfield during engine running are due mainly to changes in noise propagation as a result of this relocation.
Changes in noise levels during engine running as a result of the development are presented in Table 16.30. The table shows whether, as a result of the relocation, the development either increases or reduces the likelihood of complaints during each engine run with respect to the equivalent baseline.
Table 16.30 shows that for eight of the core site receptors surrounding the airfield, complaints during engine running are likely. The predictions show that this would occur to the south-west, on the outskirts of Boverton and to the east Farm where for Boeing 737 engine running on Saturdays, noise levels are around 30dB(A) above background levels. Engine running noise levels are also around 20dB(A) above background levels at Boverton Mill Farm and Seaview. For receptors in the south of Boverton, noise levels are exceed backgrounds more than the receptors to the north due to the orientation of the MRO facility. Receptors on Llantwit Road including Briarbank also show a likelihood of complaints during engine running.
The table shows that for receptors to the north of the site, such as Picketston and Eglwis Brewis, the likelihood of complaints is marginal. This is also the case for the core site receptor in West Camp and Eagleswell Primary School.
For core site receptors to the south-east and east of the site, the results indicate that complaints are unlikely. This is the case for the core site receptors at St. Athan, Bingle Lane and the Flemington Housing Estate. For the core site receptor at Flemingston Village to the north-east,
16-75
© Entec UK Limited
the results indicate that complaints are likely. This is due to the elevated position of the receptor and the relatively low background noise levels measured at the location.
The results show that as a result of relocating engine running of fixed wing aircraft and helicopters to the new engine running facility, the outcome of the BS4142 assessment is comparable for both fixed wing aircraft and helicopters. In addition, the outcome of the BS4142 assessment is also comparable for weekdays and Saturdays.
When assessing the contextual differences between the baseline and development BS4142 assessments (as presented in Table 16.30) it can be seen that the development results in most receptors to the north and east of the site being exposed to lower levels of noise during engine running than if the development was not to happen. For core site receptors to the east of the site, such as those in St. Athan Village and the Flemingston Housing Estate, the development would reduce the likelihood of complaints from likely/marginal to unlikely. For receptors to the north of the site, the table shows that the relocation of the engine running would, in general, not change the outcome of the BS4142 assessment however would reduce noise levels during engine running. The most significant reduction is at the Picketston receptor when noise levels during Boeing 737 engine running would reduce by approximately 20dB(A) due to the relocation.
For receptors to the west of proposed engine running facility, the contextual differences show that noise levels during engine running would increase. At the Boverton south receptors, noise levels during engine running would be around 6dB(A) higher than those in the absence of the development. For the receptor to the north of Boverton, noise levels would increase by around 2dB(A). For both receptors, the table shows that the outcome of the BS4142 assessment would not be affected as a result of the development and complaints during engine running would be likely both with and without the development. The table also shows small increases of around 1dB(A) due to the development at Boverton Cemetery. For the West Camp receptor, noise levels during engine running would reduce with the development. This would have a positive outcome in terms of the BS4142 assessment reducing the likelihood of complaints from likely to marginal.
Table 16.30 shows that receptors to the south of the MRO facility experience the greatest contextual differences in noise levels during engine running. At Boverton Mill Farm, the table shows that noise levels would increase by approximately 12dB(A) during Boeing 737 engine running as a result of the development. Although this change does not alter the outcome of the BS4142 assessment with respect to future baseline engine running, the difference is of a magnitude that would be perceived as a doubling of noise level. At Seaview, noise levels during engine running would increase by just under 3dB(A) during Boeing 737 engine running as a result of the development however reduce by approximately 5dB(A) due to the helicopter engine runs due to the relocation.
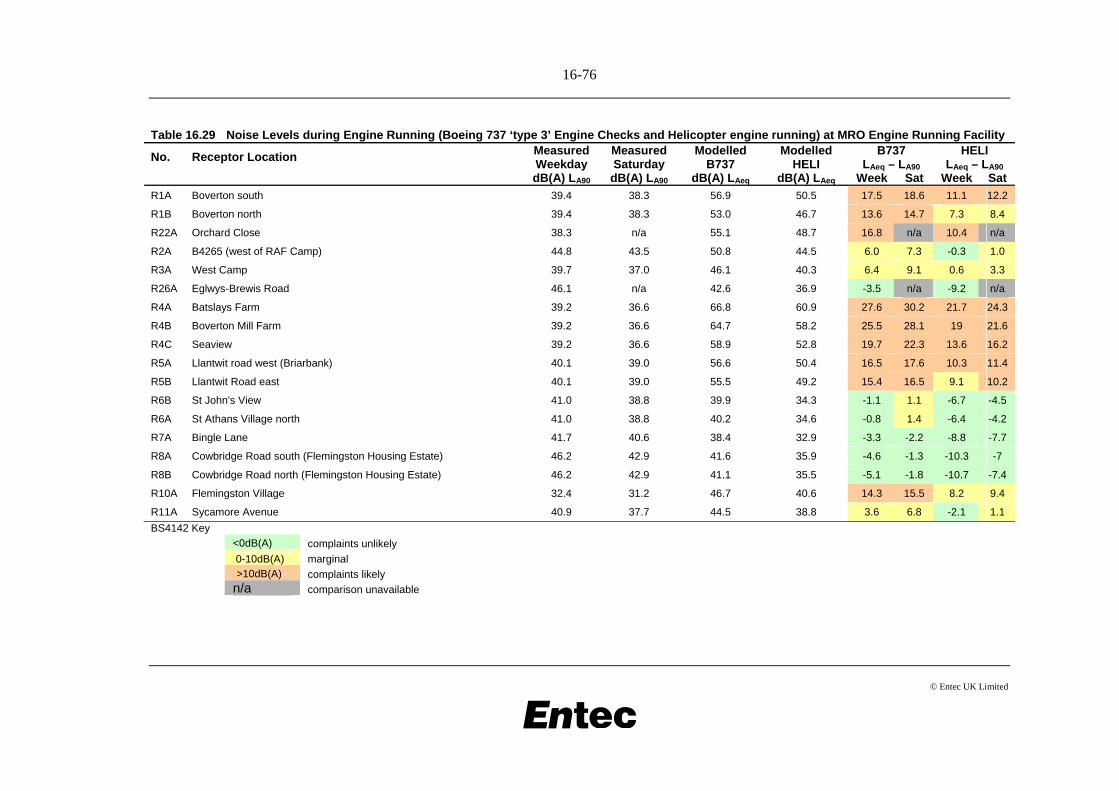
16-76
© Entec UK Limited
Table 16.29 Noise Levels during Engine Running (Boeing 737 ‘type 3’ Engine Checks and Helicopter engine running) at MRO Engine Running Facility B737
LAeq – LA90 HELI
LAeq – LA90 No. Receptor Location Measured
Weekday dB(A) LA90
Measured Saturday dB(A) LA90
Modelled B737
dB(A) LAeq
Modelled HELI
dB(A) LAeq Week Sat Week Sat
R1A Boverton south 39.4 38.3 56.9 50.5 17.5 18.6 11.1 12.2
R1B Boverton north 39.4 38.3 53.0 46.7 13.6 14.7 7.3 8.4
R22A Orchard Close 38.3 n/a 55.1 48.7 16.8 n/a 10.4 n/a
R2A B4265 (west of RAF Camp) 44.8 43.5 50.8 44.5 6.0 7.3 -0.3 1.0
R3A West Camp 39.7 37.0 46.1 40.3 6.4 9.1 0.6 3.3
R26A Eglwys-Brewis Road 46.1 n/a 42.6 36.9 -3.5 n/a -9.2 n/a
R4A Batslays Farm 39.2 36.6 66.8 60.9 27.6 30.2 21.7 24.3
R4B Boverton Mill Farm 39.2 36.6 64.7 58.2 25.5 28.1 19 21.6
R4C Seaview 39.2 36.6 58.9 52.8 19.7 22.3 13.6 16.2
R5A Llantwit road west (Briarbank) 40.1 39.0 56.6 50.4 16.5 17.6 10.3 11.4
R5B Llantwit Road east 40.1 39.0 55.5 49.2 15.4 16.5 9.1 10.2
R6B St John's View 41.0 38.8 39.9 34.3 -1.1 1.1 -6.7 -4.5
R6A St Athans Village north 41.0 38.8 40.2 34.6 -0.8 1.4 -6.4 -4.2
R7A Bingle Lane 41.7 40.6 38.4 32.9 -3.3 -2.2 -8.8 -7.7
R8A Cowbridge Road south (Flemingston Housing Estate) 46.2 42.9 41.6 35.9 -4.6 -1.3 -10.3 -7
R8B Cowbridge Road north (Flemingston Housing Estate) 46.2 42.9 41.1 35.5 -5.1 -1.8 -10.7 -7.4
R10A Flemingston Village 32.4 31.2 46.7 40.6 14.3 15.5 8.2 9.4
R11A Sycamore Avenue 40.9 37.7 44.5 38.8 3.6 6.8 -2.1 1.1 BS4142 Key <0dB(A) complaints unlikely 0-10dB(A) marginal >10dB(A) complaints likely n/a comparison unavailable
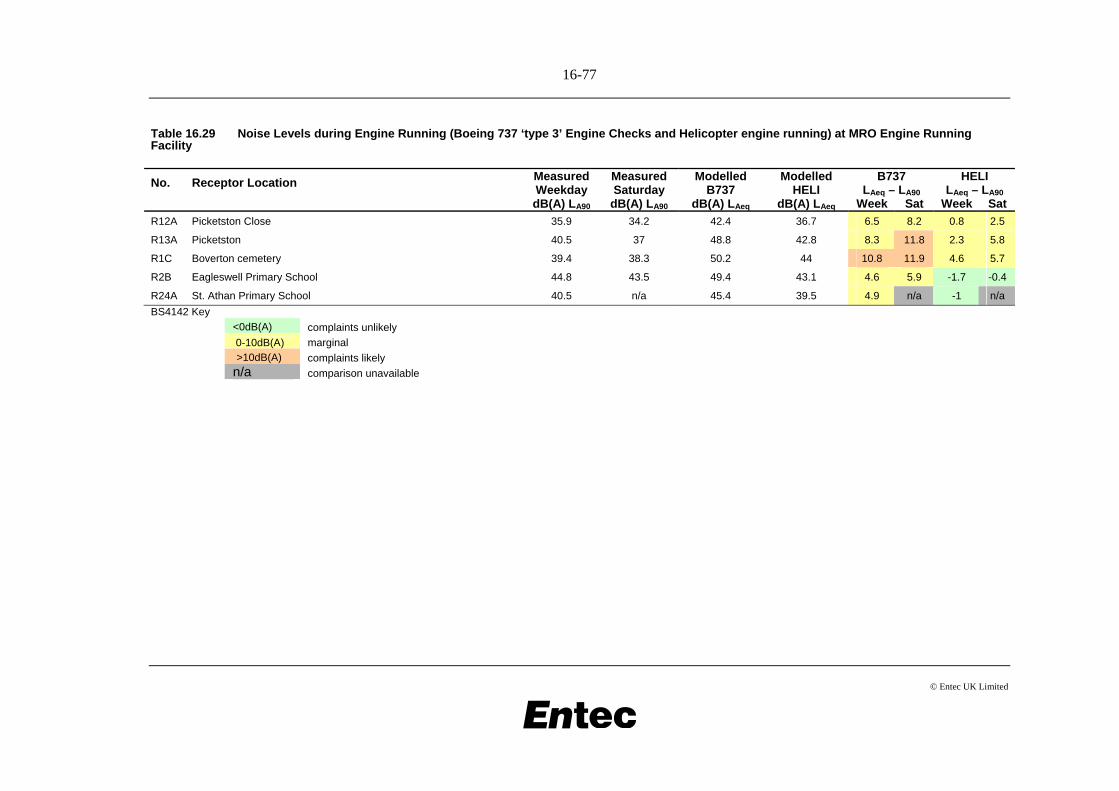
16-77
© Entec UK Limited
Table 16.29 Noise Levels during Engine Running (Boeing 737 ‘type 3’ Engine Checks and Helicopter engine running) at MRO Engine Running Facility
B737 LAeq – LA90
HELI LAeq – LA90
No. Receptor Location Measured Weekday dB(A) LA90
Measured Saturday
dB(A) LA90
Modelled B737
dB(A) LAeq
Modelled HELI
dB(A) LAeq Week Sat Week Sat
R12A Picketston Close 35.9 34.2 42.4 36.7 6.5 8.2 0.8 2.5
R13A Picketston 40.5 37 48.8 42.8 8.3 11.8 2.3 5.8
R1C Boverton cemetery 39.4 38.3 50.2 44 10.8 11.9 4.6 5.7
R2B Eagleswell Primary School 44.8 43.5 49.4 43.1 4.6 5.9 -1.7 -0.4
R24A St. Athan Primary School 40.5 n/a 45.4 39.5 4.9 n/a -1 n/a BS4142 Key <0dB(A) complaints unlikely 0-10dB(A) marginal >10dB(A) complaints likely n/a comparison unavailable
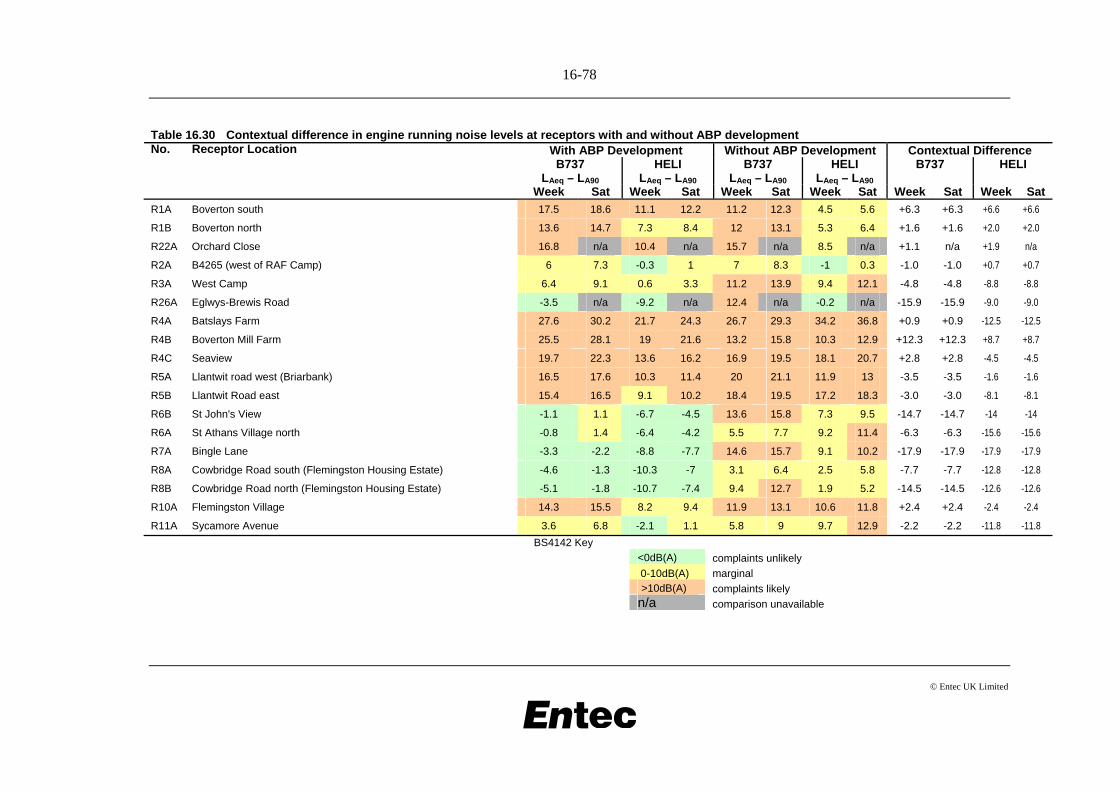
16-78
© Entec UK Limited
Table 16.30 Contextual difference in engine running noise levels at receptors with and without ABP development With ABP Development Without ABP Development Contextual Difference B737
LAeq – LA90 HELI
LAeq – LA90 B737
LAeq – LA90 HELI
LAeq – LA90 B737
HELI
No. Receptor Location
Week Sat Week Sat Week Sat Week Sat Week Sat Week Sat
R1A Boverton south 17.5 18.6 11.1 12.2 11.2 12.3 4.5 5.6 +6.3 +6.3 +6.6 +6.6
R1B Boverton north 13.6 14.7 7.3 8.4 12 13.1 5.3 6.4 +1.6 +1.6 +2.0 +2.0
R22A Orchard Close 16.8 n/a 10.4 n/a 15.7 n/a 8.5 n/a +1.1 n/a +1.9 n/a
R2A B4265 (west of RAF Camp) 6 7.3 -0.3 1 7 8.3 -1 0.3 -1.0 -1.0 +0.7 +0.7
R3A West Camp 6.4 9.1 0.6 3.3 11.2 13.9 9.4 12.1 -4.8 -4.8 -8.8 -8.8
R26A Eglwys-Brewis Road -3.5 n/a -9.2 n/a 12.4 n/a -0.2 n/a -15.9 -15.9 -9.0 -9.0
R4A Batslays Farm 27.6 30.2 21.7 24.3 26.7 29.3 34.2 36.8 +0.9 +0.9 -12.5 -12.5
R4B Boverton Mill Farm 25.5 28.1 19 21.6 13.2 15.8 10.3 12.9 +12.3 +12.3 +8.7 +8.7
R4C Seaview 19.7 22.3 13.6 16.2 16.9 19.5 18.1 20.7 +2.8 +2.8 -4.5 -4.5
R5A Llantwit road west (Briarbank) 16.5 17.6 10.3 11.4 20 21.1 11.9 13 -3.5 -3.5 -1.6 -1.6
R5B Llantwit Road east 15.4 16.5 9.1 10.2 18.4 19.5 17.2 18.3 -3.0 -3.0 -8.1 -8.1
R6B St John's View -1.1 1.1 -6.7 -4.5 13.6 15.8 7.3 9.5 -14.7 -14.7 -14 -14
R6A St Athans Village north -0.8 1.4 -6.4 -4.2 5.5 7.7 9.2 11.4 -6.3 -6.3 -15.6 -15.6
R7A Bingle Lane -3.3 -2.2 -8.8 -7.7 14.6 15.7 9.1 10.2 -17.9 -17.9 -17.9 -17.9
R8A Cowbridge Road south (Flemingston Housing Estate) -4.6 -1.3 -10.3 -7 3.1 6.4 2.5 5.8 -7.7 -7.7 -12.8 -12.8
R8B Cowbridge Road north (Flemingston Housing Estate) -5.1 -1.8 -10.7 -7.4 9.4 12.7 1.9 5.2 -14.5 -14.5 -12.6 -12.6
R10A Flemingston Village 14.3 15.5 8.2 9.4 11.9 13.1 10.6 11.8 +2.4 +2.4 -2.4 -2.4
R11A Sycamore Avenue 3.6 6.8 -2.1 1.1 5.8 9 9.7 12.9 -2.2 -2.2 -11.8 -11.8 BS4142 Key
<0dB(A) complaints unlikely 0-10dB(A) marginal >10dB(A) complaints likely n/a comparison unavailable
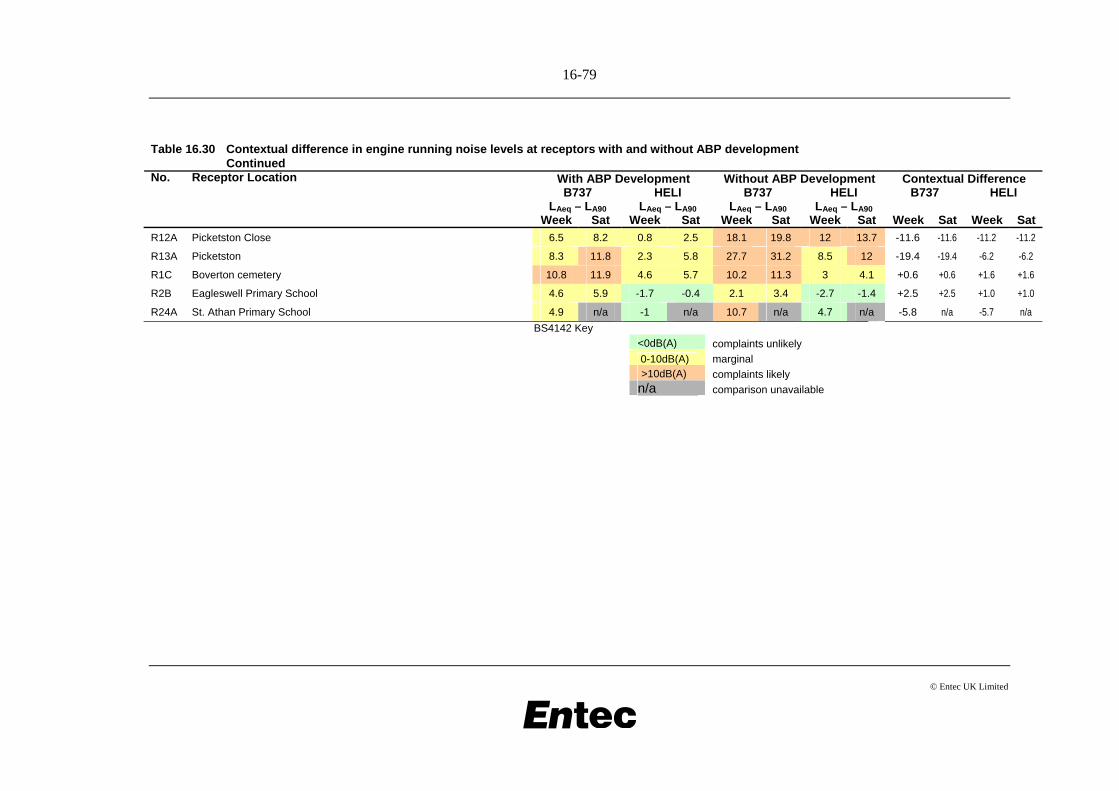
16-79
© Entec UK Limited
Table 16.30 Contextual difference in engine running noise levels at receptors with and without ABP development Continued
With ABP Development Without ABP Development Contextual Difference B737
LAeq – LA90 HELI
LAeq – LA90 B737
LAeq – LA90 HELI
LAeq – LA90 B737
HELI
No. Receptor Location
Week Sat Week Sat Week Sat Week Sat Week Sat Week Sat
R12A Picketston Close 6.5 8.2 0.8 2.5 18.1 19.8 12 13.7 -11.6 -11.6 -11.2 -11.2
R13A Picketston 8.3 11.8 2.3 5.8 27.7 31.2 8.5 12 -19.4 -19.4 -6.2 -6.2
R1C Boverton cemetery 10.8 11.9 4.6 5.7 10.2 11.3 3 4.1 +0.6 +0.6 +1.6 +1.6
R2B Eagleswell Primary School 4.6 5.9 -1.7 -0.4 2.1 3.4 -2.7 -1.4 +2.5 +2.5 +1.0 +1.0
R24A St. Athan Primary School 4.9 n/a -1 n/a 10.7 n/a 4.7 n/a -5.8 n/a -5.7 n/a BS4142 Key
<0dB(A) complaints unlikely 0-10dB(A) marginal >10dB(A) complaints likely n/a comparison unavailable
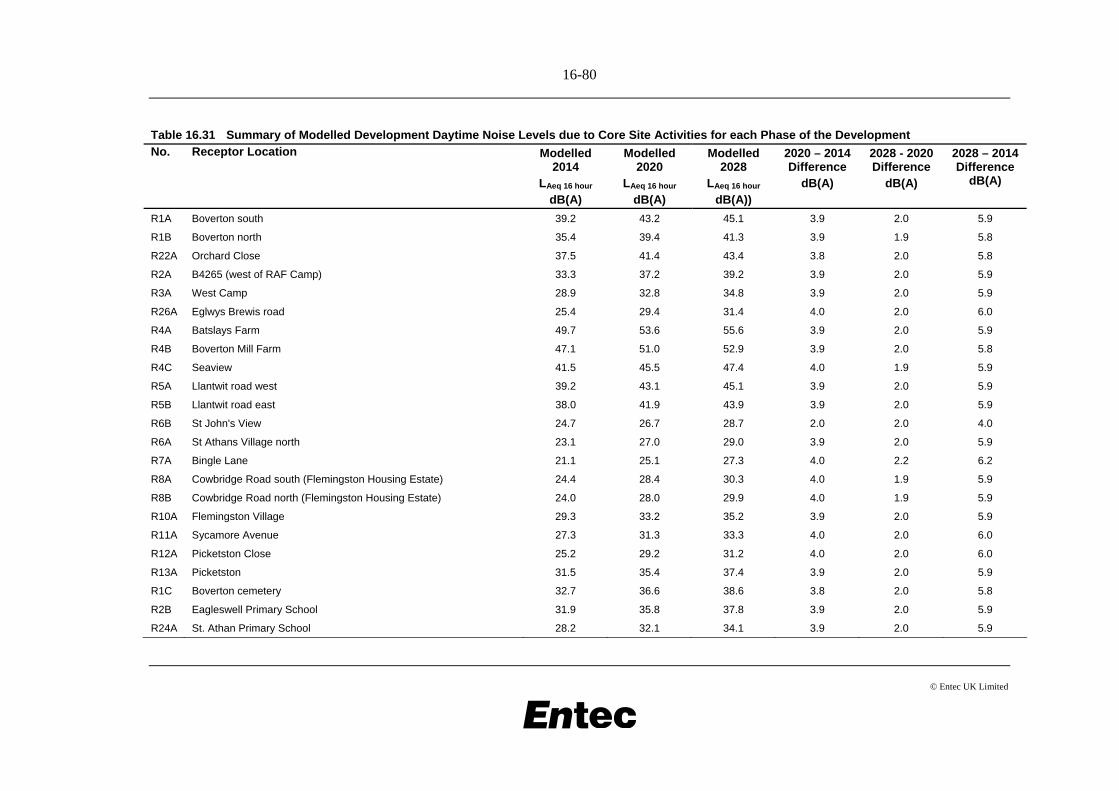
16-80
© Entec UK Limited
Table 16.31 Summary of Modelled Development Daytime Noise Levels due to Core Site Activities for each Phase of the Development No. Receptor Location Modelled
2014 LAeq 16 hour
dB(A)
Modelled 2020
LAeq 16 hour
dB(A)
Modelled 2028
LAeq 16 hour
dB(A))
2020 – 2014 Difference
dB(A)
2028 - 2020 Difference
dB(A)
2028 – 2014 Difference
dB(A)
R1A Boverton south 39.2 43.2 45.1 3.9 2.0 5.9
R1B Boverton north 35.4 39.4 41.3 3.9 1.9 5.8
R22A Orchard Close 37.5 41.4 43.4 3.8 2.0 5.8
R2A B4265 (west of RAF Camp) 33.3 37.2 39.2 3.9 2.0 5.9
R3A West Camp 28.9 32.8 34.8 3.9 2.0 5.9
R26A Eglwys Brewis road 25.4 29.4 31.4 4.0 2.0 6.0
R4A Batslays Farm 49.7 53.6 55.6 3.9 2.0 5.9
R4B Boverton Mill Farm 47.1 51.0 52.9 3.9 2.0 5.8
R4C Seaview 41.5 45.5 47.4 4.0 1.9 5.9
R5A Llantwit road west 39.2 43.1 45.1 3.9 2.0 5.9
R5B Llantwit road east 38.0 41.9 43.9 3.9 2.0 5.9
R6B St John's View 24.7 26.7 28.7 2.0 2.0 4.0
R6A St Athans Village north 23.1 27.0 29.0 3.9 2.0 5.9
R7A Bingle Lane 21.1 25.1 27.3 4.0 2.2 6.2
R8A Cowbridge Road south (Flemingston Housing Estate) 24.4 28.4 30.3 4.0 1.9 5.9
R8B Cowbridge Road north (Flemingston Housing Estate) 24.0 28.0 29.9 4.0 1.9 5.9
R10A Flemingston Village 29.3 33.2 35.2 3.9 2.0 5.9
R11A Sycamore Avenue 27.3 31.3 33.3 4.0 2.0 6.0
R12A Picketston Close 25.2 29.2 31.2 4.0 2.0 6.0
R13A Picketston 31.5 35.4 37.4 3.9 2.0 5.9
R1C Boverton cemetery 32.7 36.6 38.6 3.8 2.0 5.8
R2B Eagleswell Primary School 31.9 35.8 37.8 3.9 2.0 5.9
R24A St. Athan Primary School 28.2 32.1 34.1 3.9 2.0 5.9
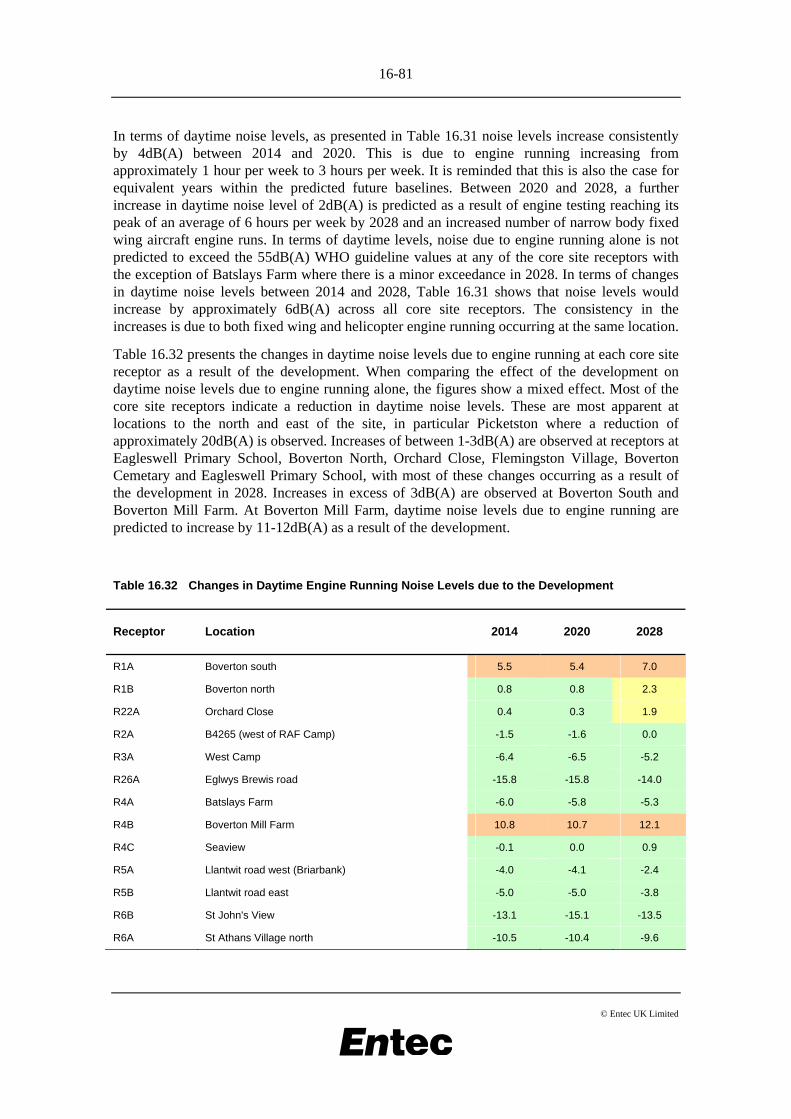
16-81
© Entec UK Limited
In terms of daytime noise levels, as presented in Table 16.31 noise levels increase consistently by 4dB(A) between 2014 and 2020. This is due to engine running increasing from approximately 1 hour per week to 3 hours per week. It is reminded that this is also the case for equivalent years within the predicted future baselines. Between 2020 and 2028, a further increase in daytime noise level of 2dB(A) is predicted as a result of engine testing reaching its peak of an average of 6 hours per week by 2028 and an increased number of narrow body fixed wing aircraft engine runs. In terms of daytime levels, noise due to engine running alone is not predicted to exceed the 55dB(A) WHO guideline values at any of the core site receptors with the exception of Batslays Farm where there is a minor exceedance in 2028. In terms of changes in daytime noise levels between 2014 and 2028, Table 16.31 shows that noise levels would increase by approximately 6dB(A) across all core site receptors. The consistency in the increases is due to both fixed wing and helicopter engine running occurring at the same location.
Table 16.32 presents the changes in daytime noise levels due to engine running at each core site receptor as a result of the development. When comparing the effect of the development on daytime noise levels due to engine running alone, the figures show a mixed effect. Most of the core site receptors indicate a reduction in daytime noise levels. These are most apparent at locations to the north and east of the site, in particular Picketston where a reduction of approximately 20dB(A) is observed. Increases of between 1-3dB(A) are observed at receptors at Eagleswell Primary School, Boverton North, Orchard Close, Flemingston Village, Boverton Cemetary and Eagleswell Primary School, with most of these changes occurring as a result of the development in 2028. Increases in excess of 3dB(A) are observed at Boverton South and Boverton Mill Farm. At Boverton Mill Farm, daytime noise levels due to engine running are predicted to increase by 11-12dB(A) as a result of the development.
Table 16.32 Changes in Daytime Engine Running Noise Levels due to the Development
Receptor Location 2014 2020 2028
R1A Boverton south 5.5 5.4 7.0
R1B Boverton north 0.8 0.8 2.3
R22A Orchard Close 0.4 0.3 1.9
R2A B4265 (west of RAF Camp) -1.5 -1.6 0.0
R3A West Camp -6.4 -6.5 -5.2
R26A Eglwys Brewis road -15.8 -15.8 -14.0
R4A Batslays Farm -6.0 -5.8 -5.3
R4B Boverton Mill Farm 10.8 10.7 12.1
R4C Seaview -0.1 0.0 0.9
R5A Llantwit road west (Briarbank) -4.0 -4.1 -2.4
R5B Llantwit road east -5.0 -5.0 -3.8
R6B St John's View -13.1 -15.1 -13.5
R6A St Athans Village north -10.5 -10.4 -9.6
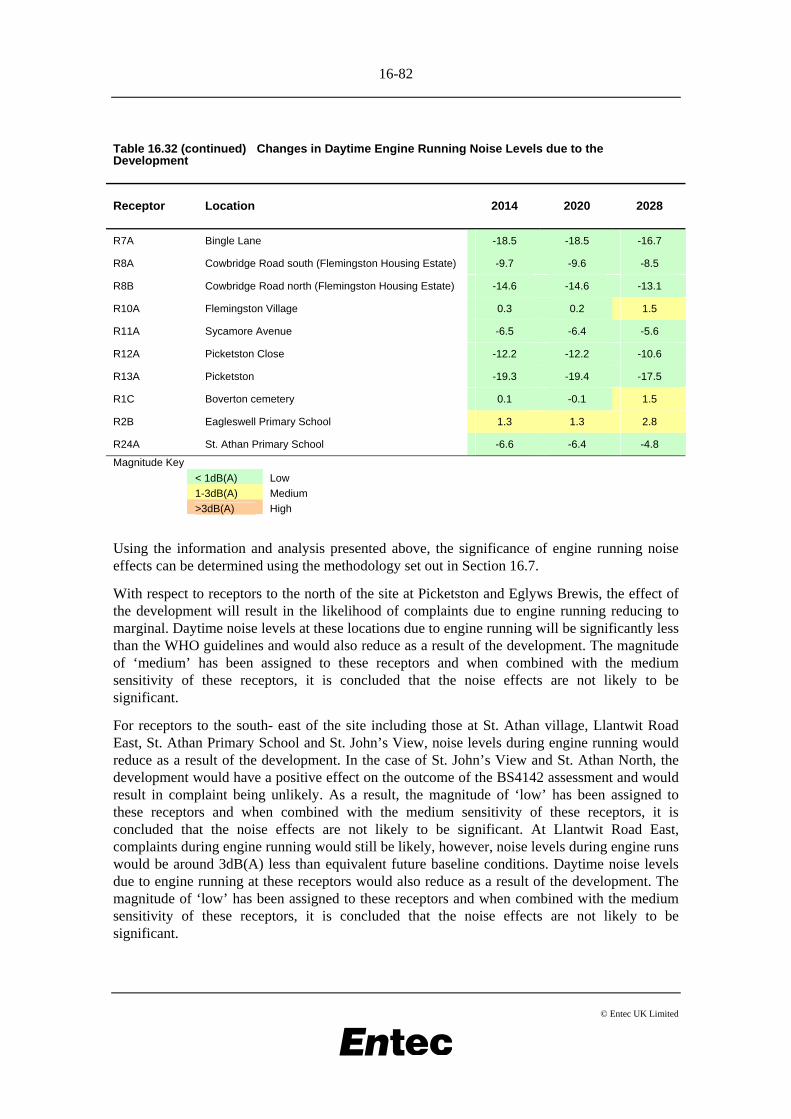
16-82
© Entec UK Limited
Table 16.32 (continued) Changes in Daytime Engine Running Noise Levels due to the Development
Receptor Location 2014 2020 2028
R7A Bingle Lane -18.5 -18.5 -16.7
R8A Cowbridge Road south (Flemingston Housing Estate) -9.7 -9.6 -8.5
R8B Cowbridge Road north (Flemingston Housing Estate) -14.6 -14.6 -13.1
R10A Flemingston Village 0.3 0.2 1.5
R11A Sycamore Avenue -6.5 -6.4 -5.6
R12A Picketston Close -12.2 -12.2 -10.6
R13A Picketston -19.3 -19.4 -17.5
R1C Boverton cemetery 0.1 -0.1 1.5
R2B Eagleswell Primary School 1.3 1.3 2.8
R24A St. Athan Primary School -6.6 -6.4 -4.8
Magnitude Key < 1dB(A) Low 1-3dB(A) Medium >3dB(A) High
Using the information and analysis presented above, the significance of engine running noise effects can be determined using the methodology set out in Section 16.7.
With respect to receptors to the north of the site at Picketston and Eglyws Brewis, the effect of the development will result in the likelihood of complaints due to engine running reducing to marginal. Daytime noise levels at these locations due to engine running will be significantly less than the WHO guidelines and would also reduce as a result of the development. The magnitude of ‘medium’ has been assigned to these receptors and when combined with the medium sensitivity of these receptors, it is concluded that the noise effects are not likely to be significant.
For receptors to the south- east of the site including those at St. Athan village, Llantwit Road East, St. Athan Primary School and St. John’s View, noise levels during engine running would reduce as a result of the development. In the case of St. John’s View and St. Athan North, the development would have a positive effect on the outcome of the BS4142 assessment and would result in complaint being unlikely. As a result, the magnitude of ‘low’ has been assigned to these receptors and when combined with the medium sensitivity of these receptors, it is concluded that the noise effects are not likely to be significant. At Llantwit Road East, complaints during engine running would still be likely, however, noise levels during engine runs would be around 3dB(A) less than equivalent future baseline conditions. Daytime noise levels due to engine running at these receptors would also reduce as a result of the development. The magnitude of ‘low’ has been assigned to these receptors and when combined with the medium sensitivity of these receptors, it is concluded that the noise effects are not likely to be significant.
16-83
© Entec UK Limited
For receptors to the east of the site, including receptors on Bingle Lane and the Flemingston Road Housing Estate, the effect of the development reduces the likelihood of complaints during engine running from marginal/likely to unlikely with reductions of up to 18dB(A) predicted. Daytime noise levels due to engine running would also reduce as a result of the development. A magnitude of ‘low’ has therefore been assigned to these receptors, and when combined with their ‘medium’ sensitivity, it is concluded that noise effects are not likely to be significant.
For receptors at Flemingston Village, the results indicate that noise levels during engine running may increase by approximately 2dB(A) for fixed wing aircraft and reduce by 2dB(A) for helicopters. Daytime noise levels due to engine running are also predicted to increase as a result of the development by 1.5dB(A) by 2028. In terms of the outcome of the BS 4142 assessment, complaints during engine running would be likely for fixed wing aircraft in both the predicted future baselines and as a result of the development. In terms of helicopter engine running, the outcome of the BS 4142 assessment would change from complaints being likely to marginal as a result of the development. Taking into account the effect on noise levels during engine running, a magnitude of ‘medium’ has been assigned to these receptors. When combined with the medium sensitivity of the receptors, it is concluded that noise effects would not be significant.
For receptors at Eglwys Brewis on Sycamore Avenue and Picketston Close, the likelihood of complaints during engine running with the development is marginal. In comparison to equivalent future baseline conditions, the results show that noise levels would reduce by up to 12dB(A). In terms of daytime noise levels due to engine running, the development would result in a reduction. As a result, a magnitude of ‘low’ has been assigned to the receptors, and when combined with the medium sensitivity of the receptors it is concluded that noise effects would not be significant.
For the receptor in West Camp, the outcome of the BS 4142 assessment would reduce from likely to marginal, as is identified for the future baselines. Noise levels during fixed wing engine running would reduce by approximately 5dB(A) as a result of the development. In terms of daytime noise levels due to engine running, reductions of around 6dB(A) have been identified with respect to future baseline conditions. As a result, a magnitude of ‘low’ has been assigned and when combined to the medium sensitivity of the receptor it is concluded that noise effects would not be significant.
For receptors to the west of the airfield, including Boverton North, Eagleswell Primary School, Orchard Close and Boverton Cemetary, noise levels during engine running would increase by 1-3dB(A) as a result of the development. Despite these increases, it has been identified that the outcome of the BS 4142 assessment at these receptors would not change as a result. In terms of daytime noise levels due to engine running, increases are also observed and are in the order of 0-3dB(A). In terms of noise levels during engine running, these are in the region of, or below, the 55dB(A) WHO guideline values. However, when considering the changes in noise levels as a result of the development, a ‘medium’ magnitude has been assigned to these receptors. When combined with the medium sensitivity of the receptors, it is concluded that noise effects would not be significant.
For the receptor to the south of Boverton, the results of the predictions show that noise levels during engine running would increase by around 6-7dB(A) as a result of the development with respect to future baseline conditions. In terms of the outcome of the BS 4142 assessment, for fixed wing aircraft, complaints are likely for both development and future baseline conditions.
16-84
© Entec UK Limited
However, when considering helicopter engine running, the development would result in the likelihood of complaints increasing from marginal to likely. In terms of daytime noise level due to engine running, the predictions indicate an increase of between 5-7dB(A) at the receptor as a result of the development. When considering the assessment methodology set out in Section 16.7, a magnitude of ‘high’ has been assigned to the receptor. When considering the medium sensitivity of the receptor, it is concluded that noise effects would be significant.
For Batslays Farm noise levels during fixed wing aircraft engine running would increase by approximately 1dB(A) as a result of the development with respect to future baseline conditions. In terms of helicopter engine running, noise levels would reduce by around 13dB(A) due to the relocation of the proposed MRO facility. Daytime noise levels due to engine running would decrease by around 5-6dB(A) as a result of the development. This would reduce daytime noise levels from approximately 61dB(A) in the 2028 predicted future baseline to 55dB(A) in 2028 with the development. As such, noise levels would almost comply with WHO guidelines. Despite the reductions in noise level with the development, complaints due to engine running would be likely. When considering the methodology set out in Section 16.7 a magnitude of ‘low’ has been assigned to the receptor. When combined with the medium sensitivity of the receptor, it is concluded that noise effects would not be significant.
For the receptor at Seaview, the predictions indicate that noise levels during engine running would increase by 1-3dB(A) as a result of the development. Daytime noise levels due to engine running would remain comparable with predicted future baseline conditions, with changes ranging between 0-1dB(A) in comparison to predicted future baseline conditions. A magnitude of ‘medium’ has therefore been assigned to the receptor. When combined with the medium sensitivity of the receptor, it is concluded that noise effects would not be significant.
For Llantwit Road West, the predictions indicate that noise levels during engine running would reduce as a result of the development. Daytime engine running noise levels would also reduce. These reductions are due to the relocation of the helicopter engine running to the proposed MRO facility. When considering the methodology set out in Section 16.7 a magnitude of ‘low’ has been assigned to the receptor. When combined with the medium sensitivity of the receptor, it is concluded that noise effects would not be significant.
At Boverton Mill Farm, the BS 4142 assessment indicates that complaints during engine running would be likely with and without development consent. The predictions identify that noise levels during engine running would increase by 9-12dB(A) as a result of the development. These increases are due to the relatively close proximity of the receptor to the proposed MRO facility. In terms of daytime noise levels due to engine running, the predictions indicate that levels would also increase with respect to future baseline conditions by up to 12dB(A) in 2028. The results also show that for the engine running of a Boeing 737 aircraft, noise levels at the receptor would increase from 53dB(A) to 65dB(A). As such, the development would result in noise levels at the receptor exceeding WHO guidelines. When considering the methodology set out in Section 16.7 a magnitude of ‘high’ has been assigned to the receptor. When combined with the medium sensitivity of the receptor, it is concluded that noise effects would be significant.
DTC Training Activities Noise levels due to DTC airfield training activities (including Flightline, tank road, tank pan and breakout from hangars) have been predicted at sensitive receptors surrounding the airfield.
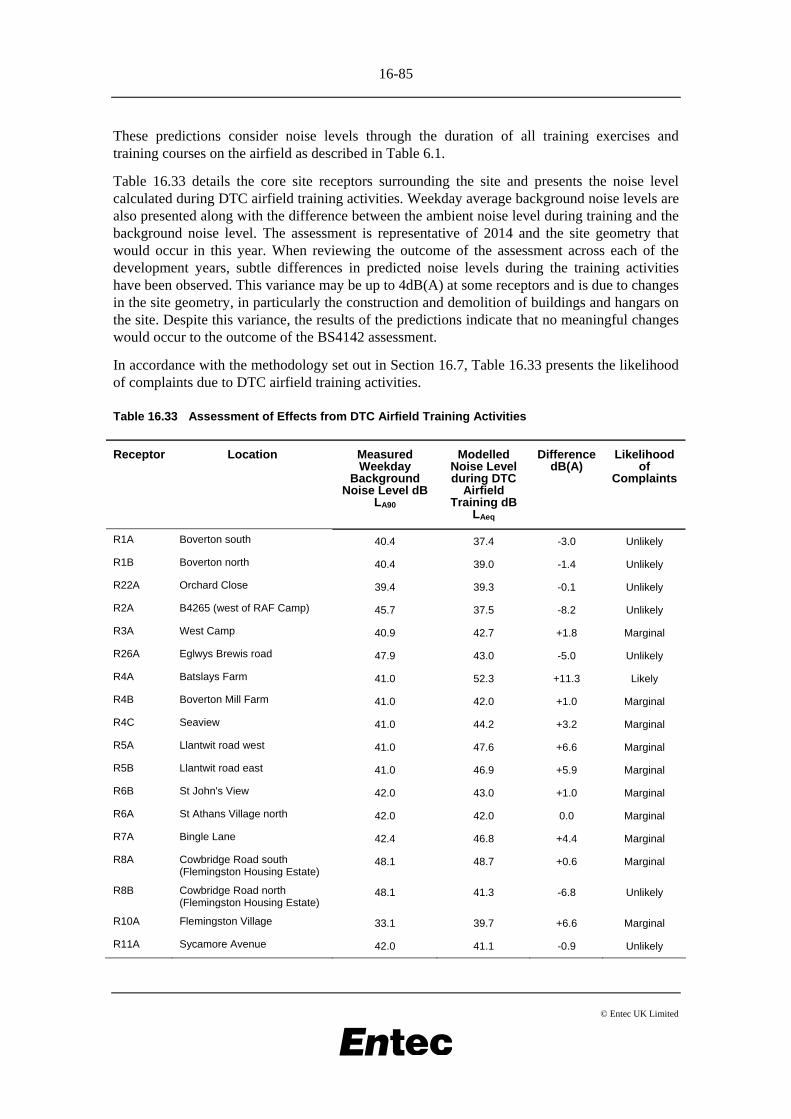
16-85
© Entec UK Limited
These predictions consider noise levels through the duration of all training exercises and training courses on the airfield as described in Table 6.1.
Table 16.33 details the core site receptors surrounding the site and presents the noise level calculated during DTC airfield training activities. Weekday average background noise levels are also presented along with the difference between the ambient noise level during training and the background noise level. The assessment is representative of 2014 and the site geometry that would occur in this year. When reviewing the outcome of the assessment across each of the development years, subtle differences in predicted noise levels during the training activities have been observed. This variance may be up to 4dB(A) at some receptors and is due to changes in the site geometry, in particularly the construction and demolition of buildings and hangars on the site. Despite this variance, the results of the predictions indicate that no meaningful changes would occur to the outcome of the BS4142 assessment.
In accordance with the methodology set out in Section 16.7, Table 16.33 presents the likelihood of complaints due to DTC airfield training activities.
Table 16.33 Assessment of Effects from DTC Airfield Training Activities
Receptor
Location
Measured Weekday
Background Noise Level dB
LA90
Modelled Noise Level during DTC
Airfield Training dB
LAeq
Difference dB(A)
Likelihood of
Complaints
R1A Boverton south 40.4 37.4 -3.0 Unlikely
R1B Boverton north 40.4 39.0 -1.4 Unlikely
R22A Orchard Close 39.4 39.3 -0.1 Unlikely
R2A B4265 (west of RAF Camp) 45.7 37.5 -8.2 Unlikely
R3A West Camp 40.9 42.7 +1.8 Marginal
R26A Eglwys Brewis road 47.9 43.0 -5.0 Unlikely
R4A Batslays Farm 41.0 52.3 +11.3 Likely
R4B Boverton Mill Farm 41.0 42.0 +1.0 Marginal
R4C Seaview 41.0 44.2 +3.2 Marginal
R5A Llantwit road west 41.0 47.6 +6.6 Marginal
R5B Llantwit road east 41.0 46.9 +5.9 Marginal
R6B St John's View 42.0 43.0 +1.0 Marginal
R6A St Athans Village north 42.0 42.0 0.0 Marginal
R7A Bingle Lane 42.4 46.8 +4.4 Marginal
R8A Cowbridge Road south (Flemingston Housing Estate)
48.1 48.7 +0.6 Marginal
R8B Cowbridge Road north (Flemingston Housing Estate)
48.1 41.3 -6.8 Unlikely
R10A Flemingston Village 33.1 39.7 +6.6 Marginal
R11A Sycamore Avenue 42.0 41.1 -0.9 Unlikely
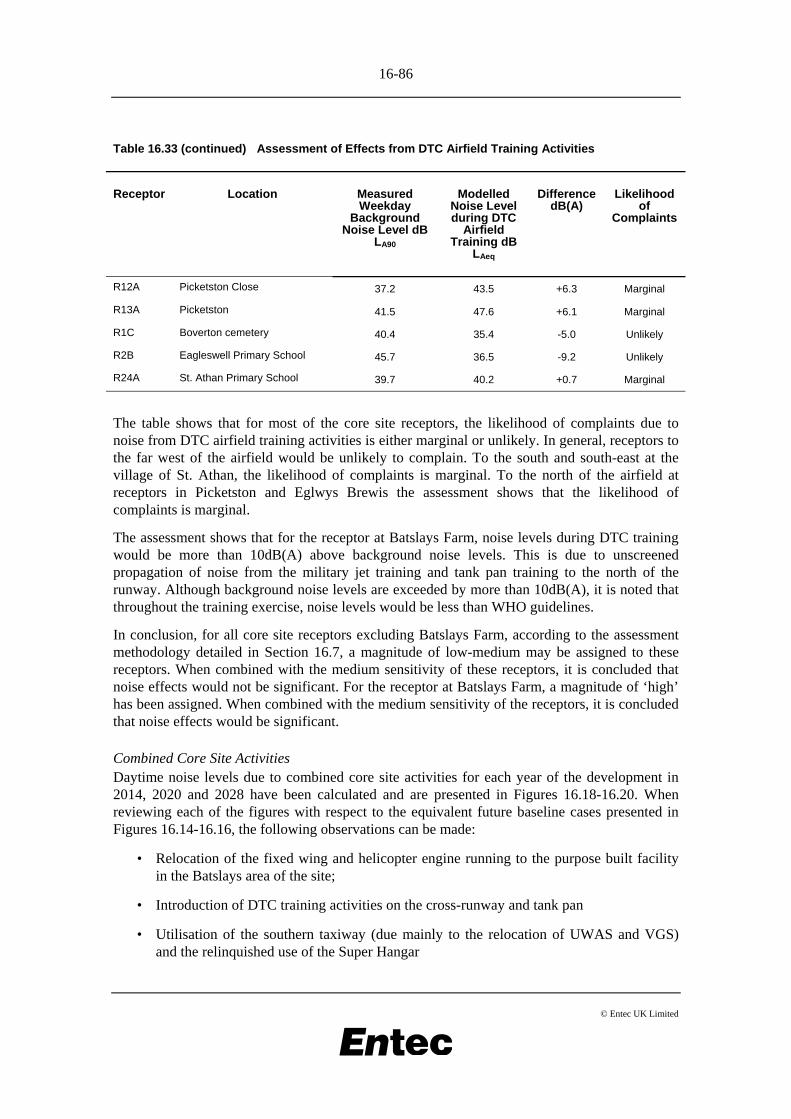
16-86
© Entec UK Limited
Table 16.33 (continued) Assessment of Effects from DTC Airfield Training Activities
Receptor
Location
Measured Weekday
Background Noise Level dB
LA90
Modelled Noise Level during DTC
Airfield Training dB
LAeq
Difference dB(A)
Likelihood of
Complaints
R12A Picketston Close 37.2 43.5 +6.3 Marginal
R13A Picketston 41.5 47.6 +6.1 Marginal
R1C Boverton cemetery 40.4 35.4 -5.0 Unlikely
R2B Eagleswell Primary School 45.7 36.5 -9.2 Unlikely
R24A St. Athan Primary School 39.7 40.2 +0.7 Marginal
The table shows that for most of the core site receptors, the likelihood of complaints due to noise from DTC airfield training activities is either marginal or unlikely. In general, receptors to the far west of the airfield would be unlikely to complain. To the south and south-east at the village of St. Athan, the likelihood of complaints is marginal. To the north of the airfield at receptors in Picketston and Eglwys Brewis the assessment shows that the likelihood of complaints is marginal.
The assessment shows that for the receptor at Batslays Farm, noise levels during DTC training would be more than 10dB(A) above background noise levels. This is due to unscreened propagation of noise from the military jet training and tank pan training to the north of the runway. Although background noise levels are exceeded by more than 10dB(A), it is noted that throughout the training exercise, noise levels would be less than WHO guidelines.
In conclusion, for all core site receptors excluding Batslays Farm, according to the assessment methodology detailed in Section 16.7, a magnitude of low-medium may be assigned to these receptors. When combined with the medium sensitivity of these receptors, it is concluded that noise effects would not be significant. For the receptor at Batslays Farm, a magnitude of ‘high’ has been assigned. When combined with the medium sensitivity of the receptors, it is concluded that noise effects would be significant.
Combined Core Site Activities Daytime noise levels due to combined core site activities for each year of the development in 2014, 2020 and 2028 have been calculated and are presented in Figures 16.18-16.20. When reviewing each of the figures with respect to the equivalent future baseline cases presented in Figures 16.14-16.16, the following observations can be made:
• Relocation of the fixed wing and helicopter engine running to the purpose built facility in the Batslays area of the site;
• Introduction of DTC training activities on the cross-runway and tank pan
• Utilisation of the southern taxiway (due mainly to the relocation of UWAS and VGS) and the relinquished use of the Super Hangar
16-87
© Entec UK Limited
When considering changes in noise levels throughout each phase of the development, the figures show no meaningful changes in the location of the noise sources between 2020 and 2014 although increases in noise levels due to increased ATMs and increased engine running can be observed. When considering changes in noise level between 2020 and 2028, the figures show two noticeable changes: the relocation of the visitors’ helipad from north of the runway to the south; and the relocation of UWAS and VGS from hangars south of the runway to hangars to the east of the airfield. When reviewing Figures 16.18-16.20, the increasing noise emissions from the MRO engine running facility, aircraft taxiing, hold points and stands can also be observed.
In terms of noise levels, the figures show that like the predicted future baselines, the location and extent of the 55dB(A) contour results in few core site receptors being exposed to noise levels beyond WHO guidelines. Table 16.34 presents daytime noise levels due to core site activities at core site receptors. Noise levels are presented for each of the development years along with noise level changes between each of the development years.
The table shows that in general, noise levels between 2014 and 2020 would increase by around 1-3dB(A). This level of change was also observed between the same years within the predicted future baselines. Between 2020 and 2028, the table shows that noise levels would increase at most receptors however the increases appear to be specific to each receptor and not typical of increased core site activity. When reviewing changes at each receptor in isolation, it may be determined that the changes observed between 2020 and 2028 are more akin to changes in the location of certain noise sources and changes to site geometries. Finally, the table shows that when considering changes in noise levels between 2014 and 2028, changes in noise levels range from a reduction of approximately -4dB(A) at Llantwit Road west to an increase of 5dB(A) at St. John’s View.
When considering noise levels due to core site activities, it is noted that noise levels at most receptors are less than 50dB(A). Like the noise levels observed for the predicted future baselines, the highest noise levels due to core site activities occur at Batslays Farm and Bingle Lane where noise levels are approximately 59dB(A) and 58dB(A) respectively. Indeed most receptors fall within the 55dB(A) WHO guidelines.
In order to assess whether the development would introduce significant noise effects, a comparison of predictions made at each core site receptor for equivalent development and future baseline years is presented in Table 16.35. In order to assess the change in noise level at additional locations as a result of the development, noise difference maps have also been prepared and are presented in Figures 16.21-16.23 in 3dB(A) bandings.
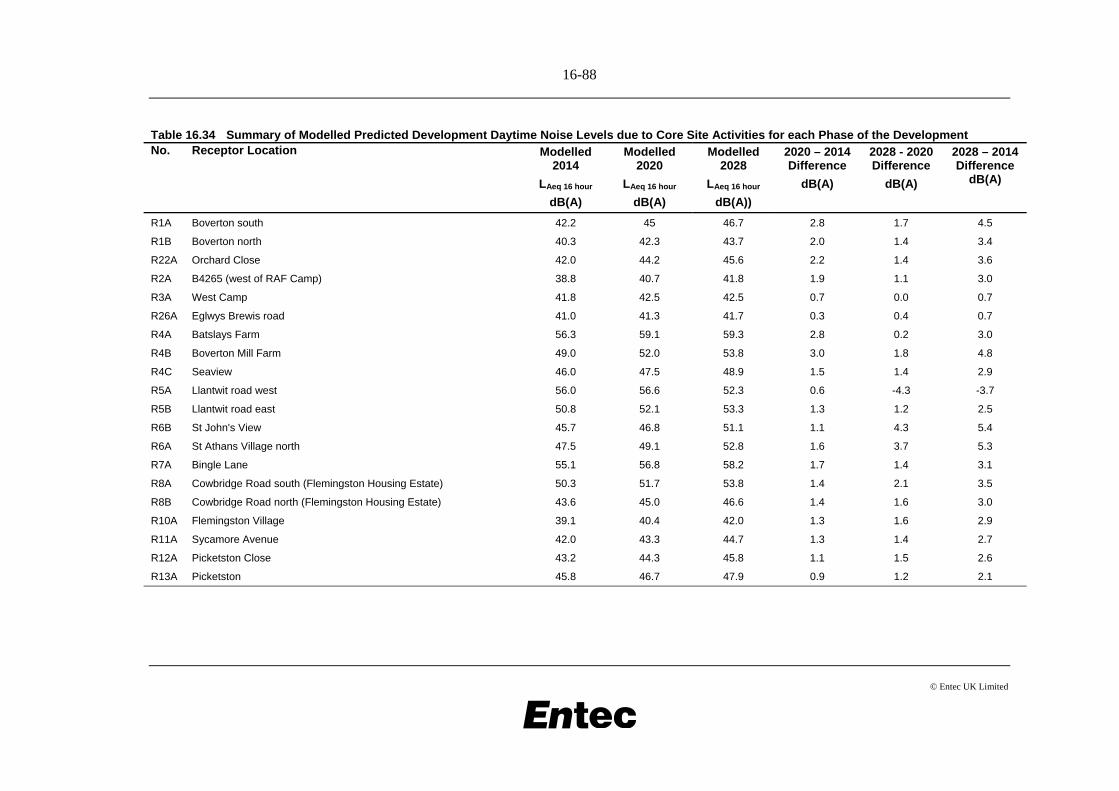
16-88
© Entec UK Limited
Table 16.34 Summary of Modelled Predicted Development Daytime Noise Levels due to Core Site Activities for each Phase of the Development No. Receptor Location Modelled
2014
LAeq 16 hour
dB(A)
Modelled 2020
LAeq 16 hour
dB(A)
Modelled 2028
LAeq 16 hour
dB(A))
2020 – 2014 Difference
dB(A)
2028 - 2020 Difference
dB(A)
2028 – 2014 Difference
dB(A)
R1A Boverton south 42.2 45 46.7 2.8 1.7 4.5
R1B Boverton north 40.3 42.3 43.7 2.0 1.4 3.4
R22A Orchard Close 42.0 44.2 45.6 2.2 1.4 3.6
R2A B4265 (west of RAF Camp) 38.8 40.7 41.8 1.9 1.1 3.0
R3A West Camp 41.8 42.5 42.5 0.7 0.0 0.7
R26A Eglwys Brewis road 41.0 41.3 41.7 0.3 0.4 0.7
R4A Batslays Farm 56.3 59.1 59.3 2.8 0.2 3.0
R4B Boverton Mill Farm 49.0 52.0 53.8 3.0 1.8 4.8
R4C Seaview 46.0 47.5 48.9 1.5 1.4 2.9
R5A Llantwit road west 56.0 56.6 52.3 0.6 -4.3 -3.7
R5B Llantwit road east 50.8 52.1 53.3 1.3 1.2 2.5
R6B St John's View 45.7 46.8 51.1 1.1 4.3 5.4
R6A St Athans Village north 47.5 49.1 52.8 1.6 3.7 5.3
R7A Bingle Lane 55.1 56.8 58.2 1.7 1.4 3.1
R8A Cowbridge Road south (Flemingston Housing Estate) 50.3 51.7 53.8 1.4 2.1 3.5
R8B Cowbridge Road north (Flemingston Housing Estate) 43.6 45.0 46.6 1.4 1.6 3.0
R10A Flemingston Village 39.1 40.4 42.0 1.3 1.6 2.9
R11A Sycamore Avenue 42.0 43.3 44.7 1.3 1.4 2.7
R12A Picketston Close 43.2 44.3 45.8 1.1 1.5 2.6
R13A Picketston 45.8 46.7 47.9 0.9 1.2 2.1
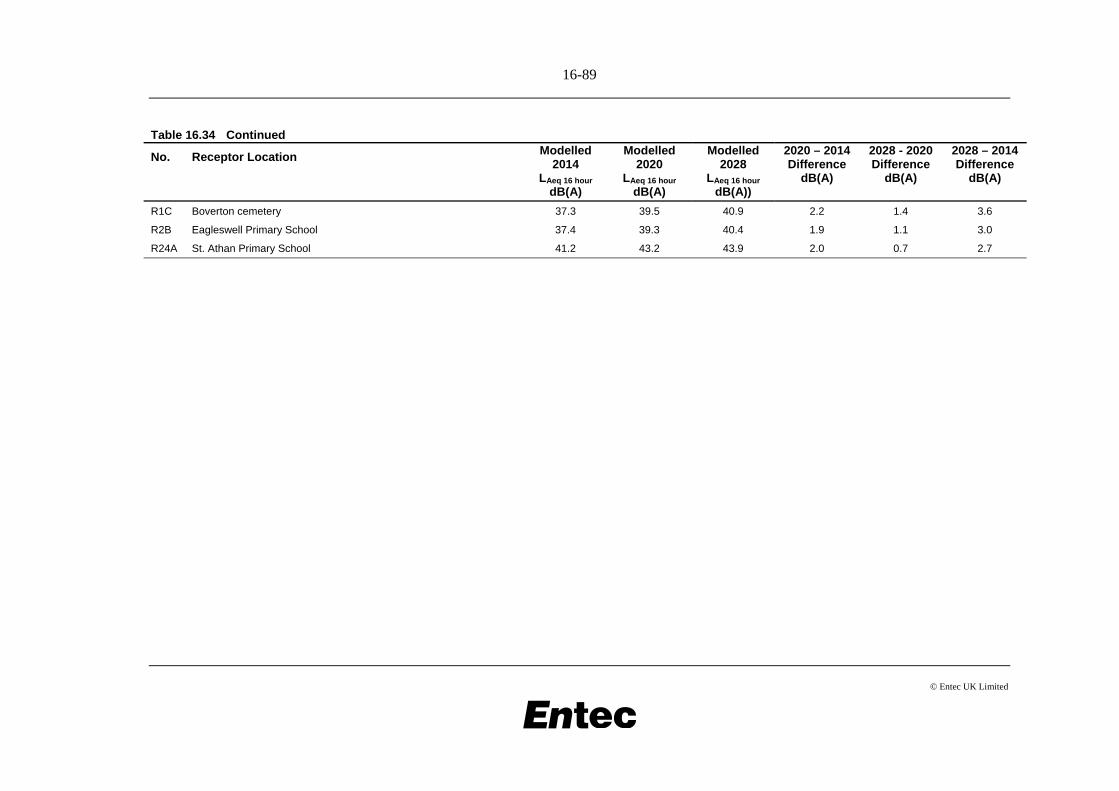
16-89
© Entec UK Limited
Table 16.34 Continued
No. Receptor Location Modelled 2014
LAeq 16 hour
dB(A)
Modelled 2020
LAeq 16 hour
dB(A)
Modelled 2028
LAeq 16 hour
dB(A))
2020 – 2014 Difference
dB(A)
2028 - 2020 Difference
dB(A)
2028 – 2014 Difference
dB(A)
R1C Boverton cemetery 37.3 39.5 40.9 2.2 1.4 3.6
R2B Eagleswell Primary School 37.4 39.3 40.4 1.9 1.1 3.0
R24A St. Athan Primary School 41.2 43.2 43.9 2.0 0.7 2.7
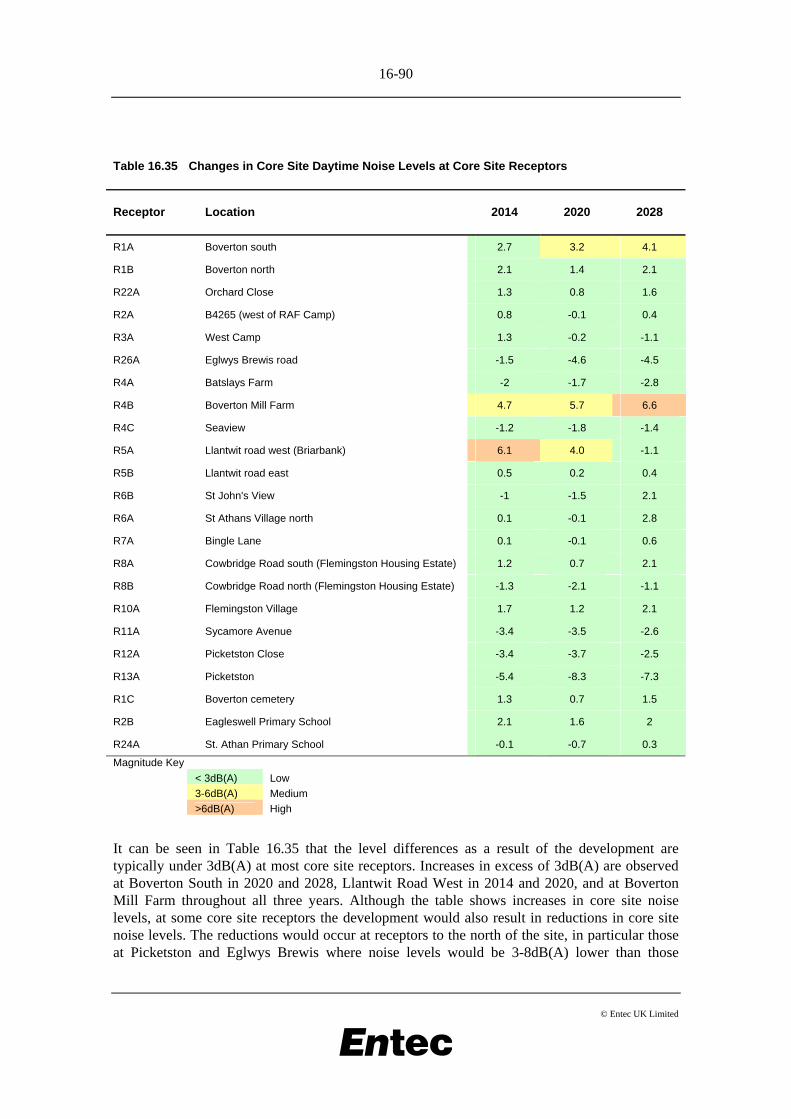
16-90
© Entec UK Limited
Table 16.35 Changes in Core Site Daytime Noise Levels at Core Site Receptors
Receptor Location 2014 2020 2028
R1A Boverton south 2.7 3.2 4.1
R1B Boverton north 2.1 1.4 2.1
R22A Orchard Close 1.3 0.8 1.6
R2A B4265 (west of RAF Camp) 0.8 -0.1 0.4
R3A West Camp 1.3 -0.2 -1.1
R26A Eglwys Brewis road -1.5 -4.6 -4.5
R4A Batslays Farm -2 -1.7 -2.8
R4B Boverton Mill Farm 4.7 5.7 6.6
R4C Seaview -1.2 -1.8 -1.4
R5A Llantwit road west (Briarbank) 6.1 4.0 -1.1
R5B Llantwit road east 0.5 0.2 0.4
R6B St John's View -1 -1.5 2.1
R6A St Athans Village north 0.1 -0.1 2.8
R7A Bingle Lane 0.1 -0.1 0.6
R8A Cowbridge Road south (Flemingston Housing Estate) 1.2 0.7 2.1
R8B Cowbridge Road north (Flemingston Housing Estate) -1.3 -2.1 -1.1
R10A Flemingston Village 1.7 1.2 2.1
R11A Sycamore Avenue -3.4 -3.5 -2.6
R12A Picketston Close -3.4 -3.7 -2.5
R13A Picketston -5.4 -8.3 -7.3
R1C Boverton cemetery 1.3 0.7 1.5
R2B Eagleswell Primary School 2.1 1.6 2
R24A St. Athan Primary School -0.1 -0.7 0.3
Magnitude Key < 3dB(A) Low 3-6dB(A) Medium >6dB(A) High
It can be seen in Table 16.35 that the level differences as a result of the development are typically under 3dB(A) at most core site receptors. Increases in excess of 3dB(A) are observed at Boverton South in 2020 and 2028, Llantwit Road West in 2014 and 2020, and at Boverton Mill Farm throughout all three years. Although the table shows increases in core site noise levels, at some core site receptors the development would also result in reductions in core site noise levels. The reductions would occur at receptors to the north of the site, in particular those at Picketston and Eglwys Brewis where noise levels would be 3-8dB(A) lower than those
16-91
© Entec UK Limited
occurring in the absence of the development. The development would also reduce core site noise levels at Batslays Farm, the north of Flemingston Housing Estate and Seaview.
When considering the noise difference maps presented in Figures 16.21-16.23, it is possible to identify where noise sources are to be either relocated or introduced to the site as a result of the development through large increases and reductions in noise levels. When reviewing the maps it is clear to see where the proposed MRO engine running facility will be located, as well the future baseline location of helicopter engine running to the south of the cross runway. The DTC airfield training noise sources are also clear from the maps and the use of the southern taxiway.
When considering the noise difference map for 2014, most locations surrounding the site would experience noise level increases of up to 3dB(A). To the north of the site, reductions of up to 3dB(A) are observed for most locations with reductions of up to 9dB(A) occurring where noise propagates from the future baseline fixed wing aircraft testing location. To the south-west, it is possible to see noise levels from the engine running facility increase daytime noise levels. However increases of more than 3dB(A) are not identified for properties on the outskirts of Boverton.
When considering the noise difference map for 2020 presented in Figure 16.22, this shows slightly more reductions in noise surrounding the site. When reviewing the detailed results of the noise models, it should be noted that at many locations, noise levels due to core site activities do not change. As such, small changes in buildings surrounding significant noise sources, may result in the development introducing a small increase or reduction. This is the case in 2020 following the construction of Building B4. The increase in daytime noise levels to the south-west of the site, due to the proposed MRO engine running facility, are up to 6dB(A) with respect to the noise difference for 2014. Despite this, changes of up to 6dB(A) do not occur on the outskirts of Boverton.
The noise difference map for 2028 as presented in Figure 16.23 can be used to identify the relocation of several other noise sources with respect to the equivalent predicted future baseline that occurs in 2028 alone. The figure shows the change in daytime noise levels as a result of the relocation of the visitors helipad from its existing location north of the runway to the its proposed location in 2028 south of the main runway in the Batslays area of the site. The figure also shows the relocation of VGS and UWAS to hangars to the east of the site to the north of St. Athan village. The maps shows that most of the properties to the north of St. Athan would experience noise level changes due to the development of up to 6dB(A) however due specifically to the relocation of VGS and UWAS, there are some properties where noise levels may experience increases of up to 9dB(A). In terms of the noise emissions from the MRO engine running facility, it is possible to see that Boverton Mill Farm may experience daytime noise levels of up to 9dB(A) greater than those occurring in the absence of the development. In terms of properties on the outskirts of Boverton, noise level differences are between 3-6dB(A) above the equivalent predicted future baseline.
Using the information and analysis presented above along with the noise difference maps presented in Figures 16.21-16.23, the significance of combined core site activities can be determined using the methodology set out in Section 16.7.
For all core site receptors to the north of the site, including Picketston and Eglwys Brewis noise levels due to core site activities would not increase, and may reduce as a result of the development, and as such a magnitude of ‘low’ has been assigned to these receptors. When
16-92
© Entec UK Limited
combined with the medium sensitivity of the receptors, it is concluded that noise effects due to core site activities are not significant.
For receptors to the east and north-east at Flemingston Village and Flemingston Road Housing Estate, for each of the three assessed years of development, changes in noise levels due to core site activities are predicted to be no greater than 3dB(A). A magnitude of ‘low’ has been assigned to these receptors. When combined to the medium sensitivity of the receptors, it is concluded that noise effects due to core site activities are not significant.
For most receptors overlooking the site in St. Athan village, noise levels due to core site activities are predicted to increase by less than 6dB(A) as a result of the development. A magnitude of ‘medium’ has therefore been assigned to these locations which when combined with the medium sensitivity of the receptors, it is concluded that noise effects are not significant.
The noise difference map presented in Figure 16.23 shows that for some isolated properties on St. David’s Crescent (4 No.) and St. John’s View (4 No.), the development may introduce noise level increases of up to 9dB(A). For these locations, a magnitude of ‘high’ has been assigned. When combined with the medium sensitivity of the receptors, it is concluded that noise effects would be significant. It should however be noted that these significant effects occur in 2028 following the relocation of UWAS and VGS. Up to 2028, no significant effects have been identified at these locations.
For receptors overlooking the site on Llantwit Road, those to the east at Higher End would experience noise level differences in core site activities of no greater than 3dB(A). Indeed the results presented in Table 16.35 show that core site noise levels would increase by no more than approximately 1dB(A) as a result of the development throughout each of the three assessed years.
For those receptors to the west of Llantwit Road (including Briarbank) both the results presented in Table 16.35 and the noise difference maps presented in Figures 16.21-16.23 show that changes in core site activity noise levels as a result of the development are between 3-6dB(A) for 2014 and 2020. For 2028, the table and the figures show that a reduction in noise of approximately 1dB(A) would occur following the relocation of UWAS and VGS. Using the methodology set in Section 16.7, a magnitude of ‘high’ has been assigned to the receptor for the year 2014. When combined with the medium sensitivity of the receptor, it is concluded that noise effects would be significant. For 2020 and 2028, a magnitude of ‘medium’ and ‘low’ has been assigned respectively to the receptor. When both magnitudes are combined with the medium sensitivity of the receptors, it is concluded that noise effects would not be significant.
At Batslays Farm and Seaview, Table 16.35 shows that noise levels due to core site activities would reduce as part of the development. The reduction in noise level would occur through all three assessment years and would be in the region of between 1-3dB(A) with respect to predicted future baselines. As a result, a magnitude of ‘low’ has been assigned to the receptor which when combined with the medium sensitivity of the receptor, it may be concluded that noise effects are not significant.
For Boverton Mill Farm, the noise difference maps and results presented in Table 16.35 identify that noise levels due to core site activities would increase by 5-7dB(A) as a result of the development for the years 2014 through 2028. When considering the increases in noise level due to the development in 2014 and 2020 against the methodology set out in Section 16.7, a
16-93
© Entec UK Limited
magnitude of ‘medium’ has been assigned. When combined with the medium sensitivity of the receptor, it may be concluded that for 2014 and 2020, noise effects due to the development are not significant. However, when considering the noise level changes due to the development in 2028, a magnitude of ‘high’ has been assigned to the receptor. When combined with the medium sensitivity of the receptor, it is concluded that noise effect due to the development would be significant over the long term.
For receptors to the west of the site, on the outskirts of Boverton, changes in core site activity noise levels as a result of the development would increase by no more than 6dB(A) throughout each of the assessed years. The results presented in Table 16.35 show that for the receptor to the south of Boverton, for 2014, core site activity noise levels would increase by less than 3dB(A) with respect to predicted future baselines. For 2020 and 2028, noise levels would increase by 3-4dB(A) as a result of the development. When considering these increases in noise level against the methodology set out in Section 16.7, a magnitudes of ‘low’ and ‘medium’ have been assigned for 2014, and, 2020 and 2028 respectively. When combining these magnitudes with the medium sensitivity of the receptor, it is concluded that noise effects would not be significant.
16.10 Assessment of Effects: Field Training Areas
16.10.1 Baseline Conditions
Current baseline Conditions The measured baseline noise conditions were reported in Section 16.4.1. The existing firing range at West Camp is used during the daytime, therefore the current baseline (based on the results of the noise surveys) are the LAeq,16hrs and LAFmax,16hr presented in Tables 16.8 to 16.10. The range was in normal use during the baseline monitoring period and hence some periods of firing were included. However, the surveys also include all other noise sources that were contributing to the ambient noise levels during the survey. Consequently further modelling work has been carried out to establish the baseline noise levels solely from use of the existing West Camp Firing Range.
The existing West Camp firing range is currently used by the occupants of West Camp and RAF personnel, as well as Cadets. The level of use is approximately 4 hours per week, with 2 hours at weekends by Cadets approximately once every 2 months. Typical use is for ten people to fire about 15 rounds over a half hour period. Weapons fired are SA80 rifles and 9mm pistols. The range is used between 10am and 5pm, with some firing up to 2300 hours in summer, though it is most often used in the afternoon. The bullet catcher wall is approximately 9m high with side walls approximately 1.8m high.
Should the proposed Picketston firing range be built, the RAF and cadet use will cease at West Camp, with just the occupants of West Camp continuing to use it.
Figures 16.24 and 16.25 show the modelled noise contours from use of the existing West Camp firing range in terms of LAeq, 16h and LAFmax, respectively. It should be borne in mind that these are indicative of the noise levels in the vicinity only on days when the range is in use. It is understood that there are many days where this range is not in use at all.
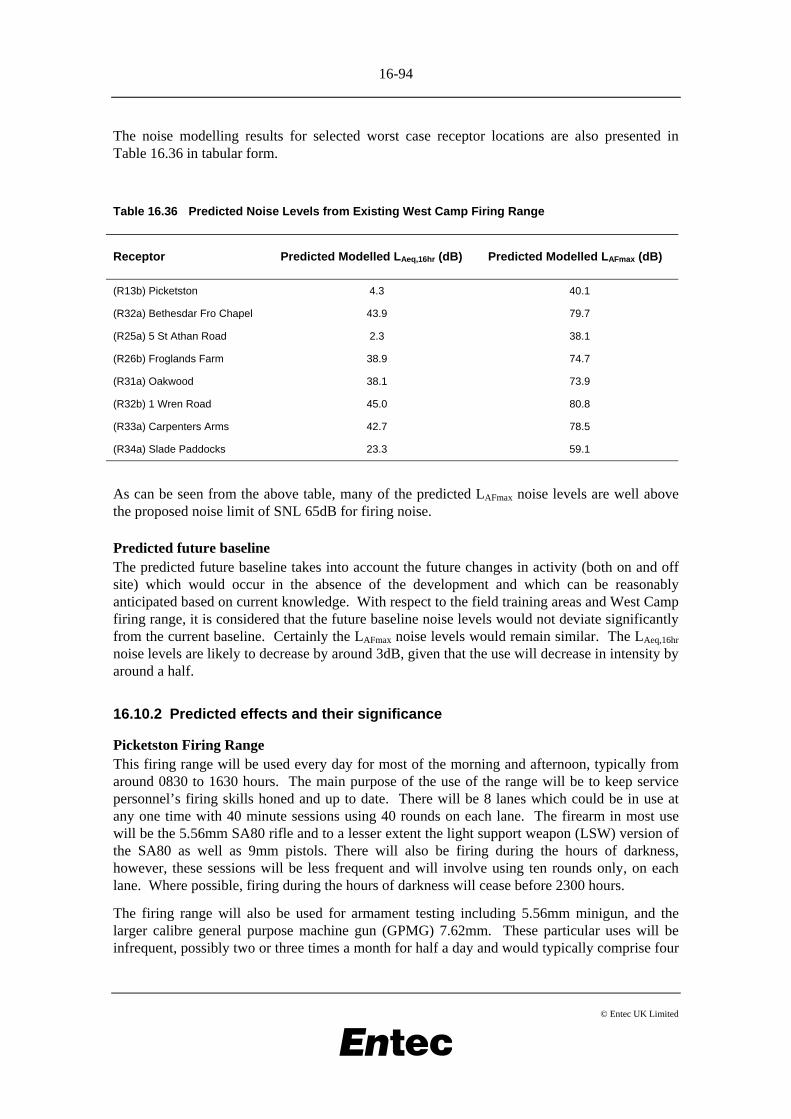
16-94
© Entec UK Limited
The noise modelling results for selected worst case receptor locations are also presented in Table 16.36 in tabular form.
Table 16.36 Predicted Noise Levels from Existing West Camp Firing Range
Receptor Predicted Modelled LAeq,16hr (dB) Predicted Modelled LAFmax (dB)
(R13b) Picketston 4.3 40.1
(R32a) Bethesdar Fro Chapel 43.9 79.7
(R25a) 5 St Athan Road 2.3 38.1
(R26b) Froglands Farm 38.9 74.7
(R31a) Oakwood 38.1 73.9
(R32b) 1 Wren Road 45.0 80.8
(R33a) Carpenters Arms 42.7 78.5
(R34a) Slade Paddocks 23.3 59.1
As can be seen from the above table, many of the predicted LAFmax noise levels are well above the proposed noise limit of SNL 65dB for firing noise.
Predicted future baseline The predicted future baseline takes into account the future changes in activity (both on and off site) which would occur in the absence of the development and which can be reasonably anticipated based on current knowledge. With respect to the field training areas and West Camp firing range, it is considered that the future baseline noise levels would not deviate significantly from the current baseline. Certainly the LAFmax noise levels would remain similar. The LAeq,16hr noise levels are likely to decrease by around 3dB, given that the use will decrease in intensity by around a half.
16.10.2 Predicted effects and their significance
Picketston Firing Range This firing range will be used every day for most of the morning and afternoon, typically from around 0830 to 1630 hours. The main purpose of the use of the range will be to keep service personnel’s firing skills honed and up to date. There will be 8 lanes which could be in use at any one time with 40 minute sessions using 40 rounds on each lane. The firearm in most use will be the 5.56mm SA80 rifle and to a lesser extent the light support weapon (LSW) version of the SA80 as well as 9mm pistols. There will also be firing during the hours of darkness, however, these sessions will be less frequent and will involve using ten rounds only, on each lane. Where possible, firing during the hours of darkness will cease before 2300 hours.
The firing range will also be used for armament testing including 5.56mm minigun, and the larger calibre general purpose machine gun (GPMG) 7.62mm. These particular uses will be infrequent, possibly two or three times a month for half a day and would typically comprise four
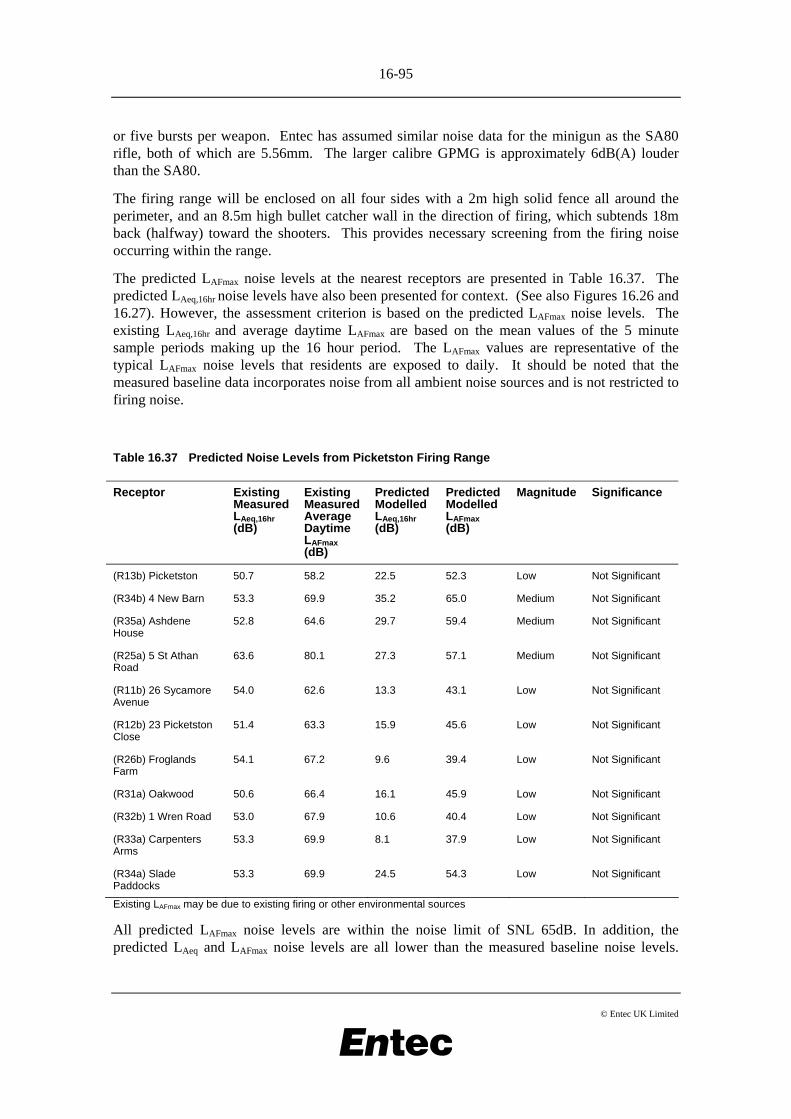
16-95
© Entec UK Limited
or five bursts per weapon. Entec has assumed similar noise data for the minigun as the SA80 rifle, both of which are 5.56mm. The larger calibre GPMG is approximately 6dB(A) louder than the SA80.
The firing range will be enclosed on all four sides with a 2m high solid fence all around the perimeter, and an 8.5m high bullet catcher wall in the direction of firing, which subtends 18m back (halfway) toward the shooters. This provides necessary screening from the firing noise occurring within the range.
The predicted LAFmax noise levels at the nearest receptors are presented in Table 16.37. The predicted LAeq,16hr noise levels have also been presented for context. (See also Figures 16.26 and 16.27). However, the assessment criterion is based on the predicted LAFmax noise levels. The existing LAeq,16hr and average daytime LAFmax are based on the mean values of the 5 minute sample periods making up the 16 hour period. The LAFmax values are representative of the typical LAFmax noise levels that residents are exposed to daily. It should be noted that the measured baseline data incorporates noise from all ambient noise sources and is not restricted to firing noise.
Table 16.37 Predicted Noise Levels from Picketston Firing Range
Receptor Existing Measured LAeq,16hr (dB)
Existing Measured Average Daytime LAFmax (dB)
Predicted Modelled LAeq,16hr (dB)
Predicted Modelled LAFmax (dB)
Magnitude Significance
(R13b) Picketston 50.7 58.2 22.5 52.3 Low Not Significant
(R34b) 4 New Barn 53.3 69.9 35.2 65.0 Medium Not Significant
(R35a) Ashdene House
52.8 64.6 29.7 59.4 Medium Not Significant
(R25a) 5 St Athan Road
63.6 80.1 27.3 57.1 Medium Not Significant
(R11b) 26 Sycamore Avenue
54.0 62.6 13.3 43.1 Low Not Significant
(R12b) 23 Picketston Close
51.4 63.3 15.9 45.6 Low Not Significant
(R26b) Froglands Farm
54.1 67.2 9.6 39.4 Low Not Significant
(R31a) Oakwood 50.6 66.4 16.1 45.9 Low Not Significant
(R32b) 1 Wren Road 53.0 67.9 10.6 40.4 Low Not Significant
(R33a) Carpenters Arms
53.3 69.9 8.1 37.9 Low Not Significant
(R34a) Slade Paddocks
53.3 69.9 24.5 54.3 Low Not Significant
Existing LAFmax may be due to existing firing or other environmental sources
All predicted LAFmax noise levels are within the noise limit of SNL 65dB. In addition, the predicted LAeq and LAFmax noise levels are all lower than the measured baseline noise levels.
16-96
© Entec UK Limited
Taking into account the medium sensitivity of all the receptors, and the low or medium magnitude of effects, it is considered that there are no significant effects associated with noise from the proposed Picketston firing range.
The noise predictions are based on the SA80 rifle being used in the range, as this is by far the most common firearm which will be in use. It is anticipated that during armament testing, which is typically just two or three times a month, noise levels could be 6dB higher than predicted and presented above. Therefore, there is the potential for a high magnitude of effect at New Barn to the north of the range when armament testing of higher calibre weapons occurs. Typically when a high magnitude of effect is combined with a medium receptor sensitivity (as for New Barn), the effect would be considered significant. However, given the infrequency of occurrence of the armament testing this is not considered to be a significant effect.
Picketston Field Training Area (Ambush Training) The typical training day is expected to last from approximately 0830 to 1730 hours. The use of firearms would generally not occur outside these times. There are some training objectives which involve blank firing of weapons which cannot be met during daylight hours. However, the occurrence of such training would be infrequent, and would be undertaken before 2300 hours where possible i.e. outside of the sensitive night-time period.
This area will mainly be used for ambush training comprising of noisy initial demonstrations followed by a few hours of dry drills. Typically, there will be approximately eight demonstrations per day. Each demonstration will consist of 16 students watching two Land Rovers being ambushed with one or two thunder flashes and sometimes, but not always, blank small arms fire from SA80 rifles comprising of potentially up to 30 rounds. The trainees will then carry out drills which involve going through the motions of the demonstrated task but, significantly, without the blank firing or pyrotechnics, therefore reducing the potential noise effects of this type of training.
The field training area will be enclosed on all four sides with a combination of acoustic bunding and/or fencing. The noise model includes a 5m southern bund, 4m western bund and 3m northern and eastern bunds, with some additional baffle mounds within the main area. These will be incorporated into the training where appropriate, which will further screen noise levels from the training activities.
A 3m high acoustic fence will be erected at the eastern perimeter of the Picketston training area, separating the PAAB and the existing Picketston residential dwellings. This will provide additional screening from the field training area, firing range, PAAB and obstacle course.
The predicted LAFmax noise levels at the nearest receptors are presented in Table 16.38. The predicted LAeq,16hr noise levels have also been presented for context. (See also Figures 16.28 and 16.29)
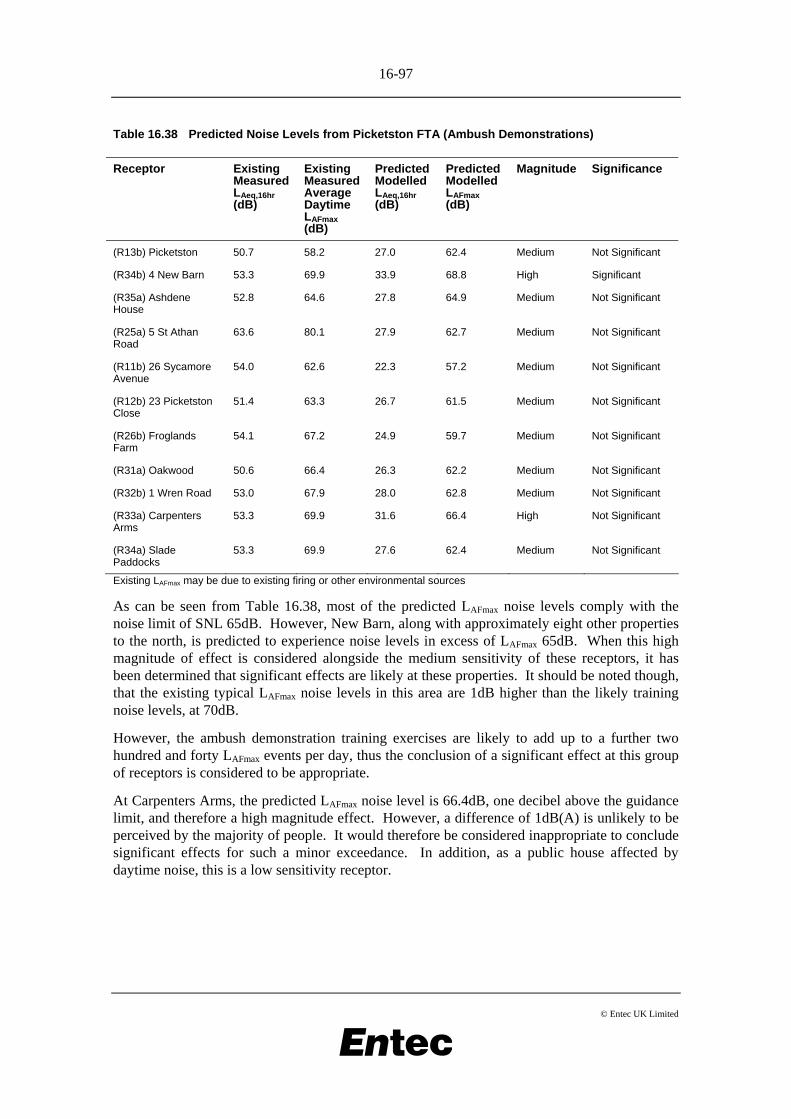
16-97
© Entec UK Limited
Table 16.38 Predicted Noise Levels from Picketston FTA (Ambush Demonstrations)
Receptor Existing Measured LAeq,16hr (dB)
Existing Measured Average Daytime LAFmax (dB)
Predicted Modelled LAeq,16hr (dB)
Predicted Modelled LAFmax (dB)
Magnitude Significance
(R13b) Picketston 50.7 58.2 27.0 62.4 Medium Not Significant
(R34b) 4 New Barn 53.3 69.9 33.9 68.8 High Significant
(R35a) Ashdene House
52.8 64.6 27.8 64.9 Medium Not Significant
(R25a) 5 St Athan Road
63.6 80.1 27.9 62.7 Medium Not Significant
(R11b) 26 Sycamore Avenue
54.0 62.6 22.3 57.2 Medium Not Significant
(R12b) 23 Picketston Close
51.4 63.3 26.7 61.5 Medium Not Significant
(R26b) Froglands Farm
54.1 67.2 24.9 59.7 Medium Not Significant
(R31a) Oakwood 50.6 66.4 26.3 62.2 Medium Not Significant
(R32b) 1 Wren Road 53.0 67.9 28.0 62.8 Medium Not Significant
(R33a) Carpenters Arms
53.3 69.9 31.6 66.4 High Not Significant
(R34a) Slade Paddocks
53.3 69.9 27.6 62.4 Medium Not Significant
Existing LAFmax may be due to existing firing or other environmental sources
As can be seen from Table 16.38, most of the predicted LAFmax noise levels comply with the noise limit of SNL 65dB. However, New Barn, along with approximately eight other properties to the north, is predicted to experience noise levels in excess of LAFmax 65dB. When this high magnitude of effect is considered alongside the medium sensitivity of these receptors, it has been determined that significant effects are likely at these properties. It should be noted though, that the existing typical LAFmax noise levels in this area are 1dB higher than the likely training noise levels, at 70dB.
However, the ambush demonstration training exercises are likely to add up to a further two hundred and forty LAFmax events per day, thus the conclusion of a significant effect at this group of receptors is considered to be appropriate.
At Carpenters Arms, the predicted LAFmax noise level is 66.4dB, one decibel above the guidance limit, and therefore a high magnitude effect. However, a difference of 1dB(A) is unlikely to be perceived by the majority of people. It would therefore be considered inappropriate to conclude significant effects for such a minor exceedance. In addition, as a public house affected by daytime noise, this is a low sensitivity receptor.
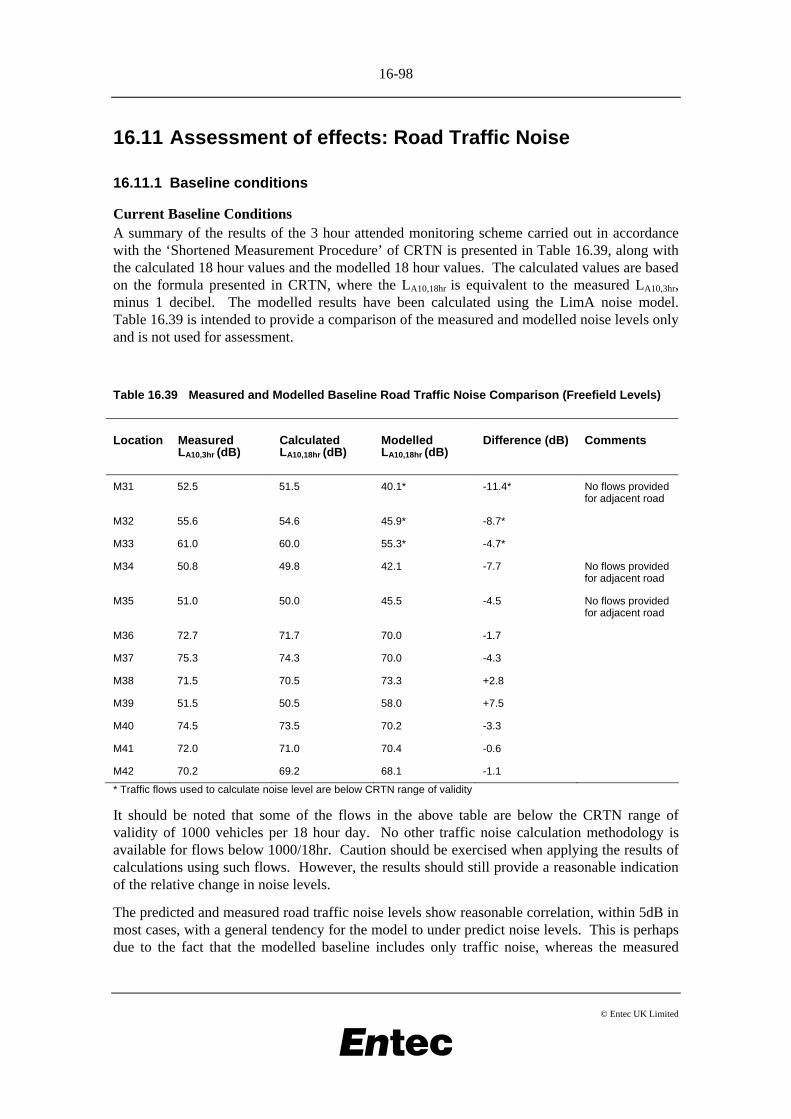
16-98
© Entec UK Limited
16.11 Assessment of effects: Road Traffic Noise
16.11.1 Baseline conditions
Current Baseline Conditions A summary of the results of the 3 hour attended monitoring scheme carried out in accordance with the ‘Shortened Measurement Procedure’ of CRTN is presented in Table 16.39, along with the calculated 18 hour values and the modelled 18 hour values. The calculated values are based on the formula presented in CRTN, where the LA10,18hr is equivalent to the measured LA10,3hr, minus 1 decibel. The modelled results have been calculated using the LimA noise model. Table 16.39 is intended to provide a comparison of the measured and modelled noise levels only and is not used for assessment.
Table 16.39 Measured and Modelled Baseline Road Traffic Noise Comparison (Freefield Levels)
Location Measured LA10,3hr (dB)
Calculated LA10,18hr (dB)
Modelled LA10,18hr (dB)
Difference (dB) Comments
M31 52.5 51.5 40.1* -11.4* No flows provided for adjacent road
M32 55.6 54.6 45.9* -8.7*
M33 61.0 60.0 55.3* -4.7*
M34 50.8 49.8 42.1 -7.7 No flows provided for adjacent road
M35 51.0 50.0 45.5 -4.5 No flows provided for adjacent road
M36 72.7 71.7 70.0 -1.7
M37 75.3 74.3 70.0 -4.3
M38 71.5 70.5 73.3 +2.8
M39 51.5 50.5 58.0 +7.5
M40 74.5 73.5 70.2 -3.3
M41 72.0 71.0 70.4 -0.6
M42 70.2 69.2 68.1 -1.1
* Traffic flows used to calculate noise level are below CRTN range of validity
It should be noted that some of the flows in the above table are below the CRTN range of validity of 1000 vehicles per 18 hour day. No other traffic noise calculation methodology is available for flows below 1000/18hr. Caution should be exercised when applying the results of calculations using such flows. However, the results should still provide a reasonable indication of the relative change in noise levels.
The predicted and measured road traffic noise levels show reasonable correlation, within 5dB in most cases, with a general tendency for the model to under predict noise levels. This is perhaps due to the fact that the modelled baseline includes only traffic noise, whereas the measured

16-99
© Entec UK Limited
baseline is influenced not only by baseline traffic levels, but also noise from other sources such as industry, trains, birdsong, etc.
The modelled baseline has been used as the primary baseline for the traffic noise assessment since comparison of modelled baseline and with development traffic noise levels ensures a ‘like for like’ comparison. Any inaccuracies or uncertainties present in the model will affect both baseline and with development traffic noise levels alike, but the model enables an accurate calculation of the noise change due to the development. The measured baseline is used to set some context.
A noise contour map of the study area presenting the current baseline situation is included as Figure 16.30. Table 16.40 below provides the modelled baseline noise levels in tabular form, at typical and key locations. Note that these are not the same receptors as those presented in Table 16.39.
Table 16.40 Modelled Baseline Road Traffic Noise at Typical and Key Locations (Façade Levels)
Location 2007 Baseline LA10,18hr (dB)
(R2c) Monmouth Way, Boverton 56.0
(R2d) Harding Close, Boverton 62.2
(R26c) Eagle Road, West Camp 52.3*
(R31b) Caravan Park, Nr Milland Farm 44.4*
(R26b) Froglands Farm 42.8*
(R33a) Carpenters Arms, West Camp 54.4*
(R13a). Picketston Cottage, Picketston 42.4*
(R12d) Picketston Close, Eglwys Brewis 53.9*
(R12c) Lime Grove, Eglwys Brewis 53.5*
(R11c) Sycamore Avenue. Eglwys Brewis 60.0
(R8c) Mallory Close, Eglwys Brewis 55.9*
(R6c) Rectory Road, St Athan 56.4*
(R2e) Great House Farm, Llanmaes 44.9
(R3b) Llantwit Road, West Camp 58.3
(R4c) Sea View 70.1
(R23a) Lougher Place, St Athan 66.5
(R37a) Baronswell 62.1
(R39a) Walters Farm, Waycock Cross 59.4
(R40a) Property north of Waycock Cross 70.4
(R21a) Heol Sirhwi 69.2
(R6d) Broadway Nursing Home, St Athan 56.4*
(R4d) Batslays Farm 59.5
* Traffic flows used to calculate noise level are below CRTN range of validity
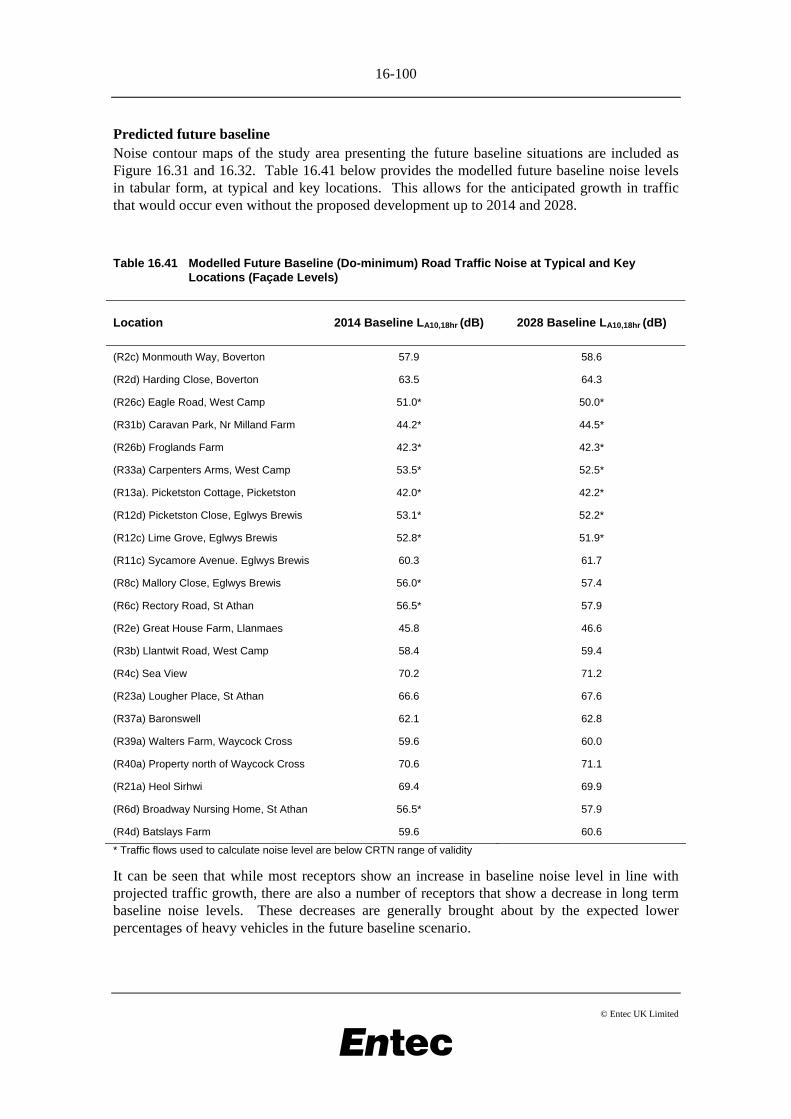
16-100
© Entec UK Limited
Predicted future baseline Noise contour maps of the study area presenting the future baseline situations are included as Figure 16.31 and 16.32. Table 16.41 below provides the modelled future baseline noise levels in tabular form, at typical and key locations. This allows for the anticipated growth in traffic that would occur even without the proposed development up to 2014 and 2028.
Table 16.41 Modelled Future Baseline (Do-minimum) Road Traffic Noise at Typical and Key Locations (Façade Levels)
Location 2014 Baseline LA10,18hr (dB) 2028 Baseline LA10,18hr (dB)
(R2c) Monmouth Way, Boverton 57.9 58.6
(R2d) Harding Close, Boverton 63.5 64.3
(R26c) Eagle Road, West Camp 51.0* 50.0*
(R31b) Caravan Park, Nr Milland Farm 44.2* 44.5*
(R26b) Froglands Farm 42.3* 42.3*
(R33a) Carpenters Arms, West Camp 53.5* 52.5*
(R13a). Picketston Cottage, Picketston 42.0* 42.2*
(R12d) Picketston Close, Eglwys Brewis 53.1* 52.2*
(R12c) Lime Grove, Eglwys Brewis 52.8* 51.9*
(R11c) Sycamore Avenue. Eglwys Brewis 60.3 61.7
(R8c) Mallory Close, Eglwys Brewis 56.0* 57.4
(R6c) Rectory Road, St Athan 56.5* 57.9
(R2e) Great House Farm, Llanmaes 45.8 46.6
(R3b) Llantwit Road, West Camp 58.4 59.4
(R4c) Sea View 70.2 71.2
(R23a) Lougher Place, St Athan 66.6 67.6
(R37a) Baronswell 62.1 62.8
(R39a) Walters Farm, Waycock Cross 59.6 60.0
(R40a) Property north of Waycock Cross 70.6 71.1
(R21a) Heol Sirhwi 69.4 69.9
(R6d) Broadway Nursing Home, St Athan 56.5* 57.9
(R4d) Batslays Farm 59.6 60.6
* Traffic flows used to calculate noise level are below CRTN range of validity
It can be seen that while most receptors show an increase in baseline noise level in line with projected traffic growth, there are also a number of receptors that show a decrease in long term baseline noise levels. These decreases are generally brought about by the expected lower percentages of heavy vehicles in the future baseline scenario.
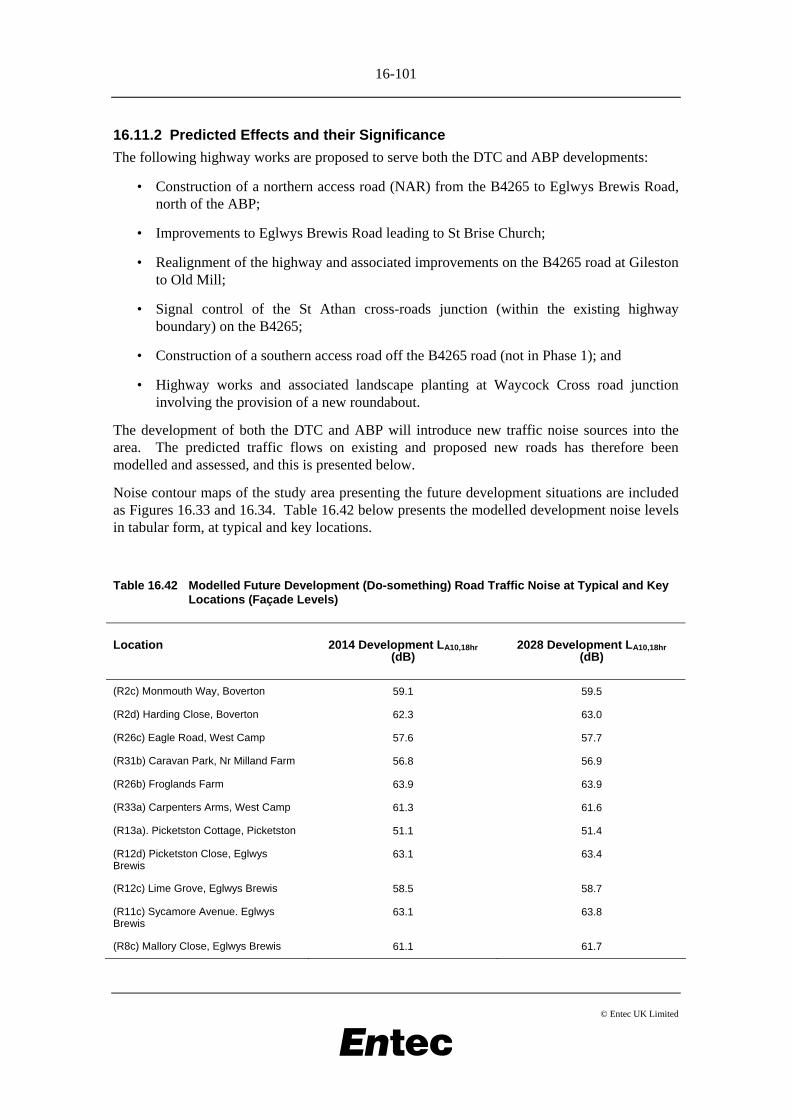
16-101
© Entec UK Limited
16.11.2 Predicted Effects and their Significance
The following highway works are proposed to serve both the DTC and ABP developments:
• Construction of a northern access road (NAR) from the B4265 to Eglwys Brewis Road, north of the ABP;
• Improvements to Eglwys Brewis Road leading to St Brise Church;
• Realignment of the highway and associated improvements on the B4265 road at Gileston to Old Mill;
• Signal control of the St Athan cross-roads junction (within the existing highway boundary) on the B4265;
• Construction of a southern access road off the B4265 road (not in Phase 1); and
• Highway works and associated landscape planting at Waycock Cross road junction involving the provision of a new roundabout.
The development of both the DTC and ABP will introduce new traffic noise sources into the area. The predicted traffic flows on existing and proposed new roads has therefore been modelled and assessed, and this is presented below.
Noise contour maps of the study area presenting the future development situations are included as Figures 16.33 and 16.34. Table 16.42 below presents the modelled development noise levels in tabular form, at typical and key locations.
Table 16.42 Modelled Future Development (Do-something) Road Traffic Noise at Typical and Key Locations (Façade Levels)
Location 2014 Development LA10,18hr (dB)
2028 Development LA10,18hr (dB)
(R2c) Monmouth Way, Boverton 59.1 59.5
(R2d) Harding Close, Boverton 62.3 63.0
(R26c) Eagle Road, West Camp 57.6 57.7
(R31b) Caravan Park, Nr Milland Farm 56.8 56.9
(R26b) Froglands Farm 63.9 63.9
(R33a) Carpenters Arms, West Camp 61.3 61.6
(R13a). Picketston Cottage, Picketston 51.1 51.4
(R12d) Picketston Close, Eglwys Brewis
63.1 63.4
(R12c) Lime Grove, Eglwys Brewis 58.5 58.7
(R11c) Sycamore Avenue. Eglwys Brewis
63.1 63.8
(R8c) Mallory Close, Eglwys Brewis 61.1 61.7
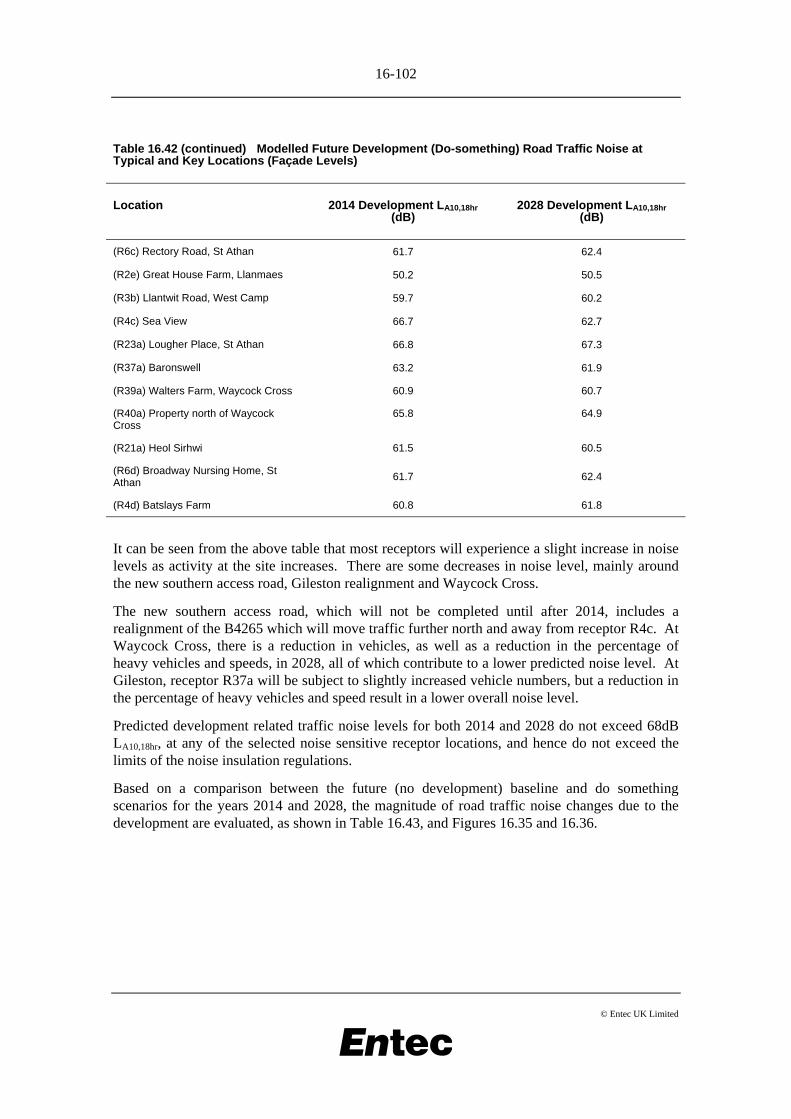
16-102
© Entec UK Limited
Table 16.42 (continued) Modelled Future Development (Do-something) Road Traffic Noise at Typical and Key Locations (Façade Levels)
Location 2014 Development LA10,18hr (dB)
2028 Development LA10,18hr (dB)
(R6c) Rectory Road, St Athan 61.7 62.4
(R2e) Great House Farm, Llanmaes 50.2 50.5
(R3b) Llantwit Road, West Camp 59.7 60.2
(R4c) Sea View 66.7 62.7
(R23a) Lougher Place, St Athan 66.8 67.3
(R37a) Baronswell 63.2 61.9
(R39a) Walters Farm, Waycock Cross 60.9 60.7
(R40a) Property north of Waycock Cross
65.8 64.9
(R21a) Heol Sirhwi 61.5 60.5
(R6d) Broadway Nursing Home, St Athan 61.7 62.4
(R4d) Batslays Farm 60.8 61.8
It can be seen from the above table that most receptors will experience a slight increase in noise levels as activity at the site increases. There are some decreases in noise level, mainly around the new southern access road, Gileston realignment and Waycock Cross.
The new southern access road, which will not be completed until after 2014, includes a realignment of the B4265 which will move traffic further north and away from receptor R4c. At Waycock Cross, there is a reduction in vehicles, as well as a reduction in the percentage of heavy vehicles and speeds, in 2028, all of which contribute to a lower predicted noise level. At Gileston, receptor R37a will be subject to slightly increased vehicle numbers, but a reduction in the percentage of heavy vehicles and speed result in a lower overall noise level.
Predicted development related traffic noise levels for both 2014 and 2028 do not exceed 68dB LA10,18hr, at any of the selected noise sensitive receptor locations, and hence do not exceed the limits of the noise insulation regulations.
Based on a comparison between the future (no development) baseline and do something scenarios for the years 2014 and 2028, the magnitude of road traffic noise changes due to the development are evaluated, as shown in Table 16.43, and Figures 16.35 and 16.36.
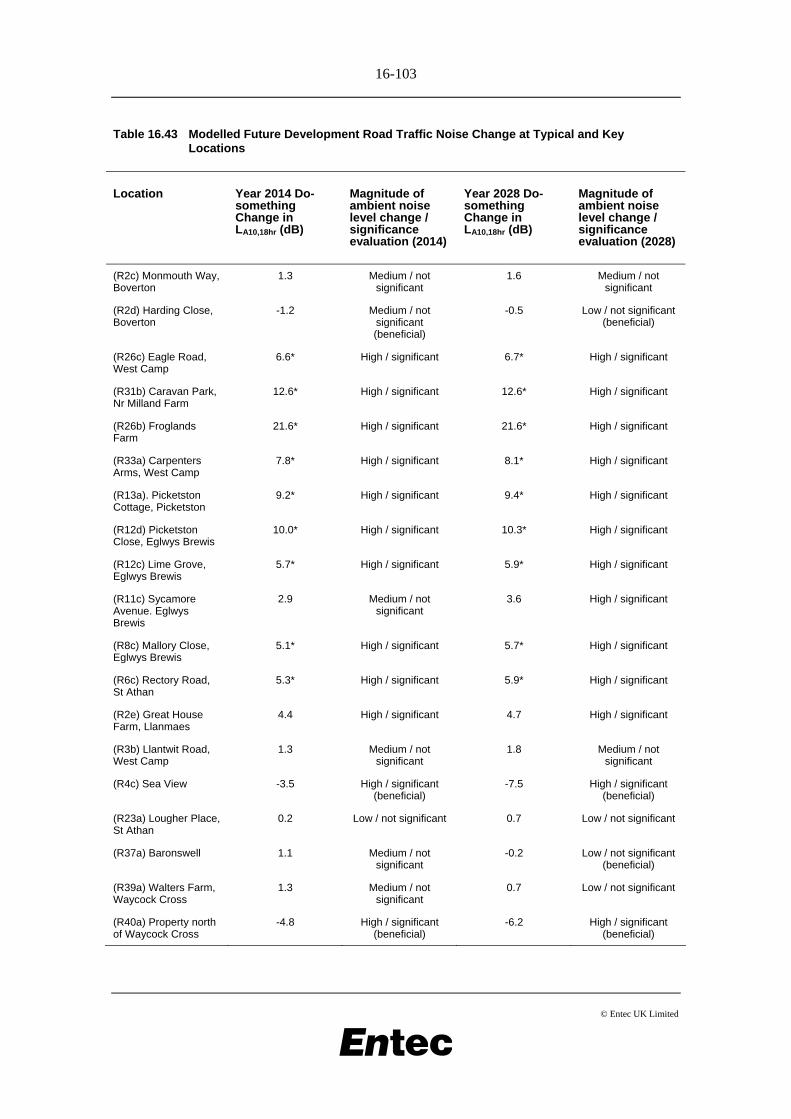
16-103
© Entec UK Limited
Table 16.43 Modelled Future Development Road Traffic Noise Change at Typical and Key Locations
Location Year 2014 Do-something Change in LA10,18hr (dB)
Magnitude of ambient noise level change / significance evaluation (2014)
Year 2028 Do-something Change in LA10,18hr (dB)
Magnitude of ambient noise level change / significance evaluation (2028)
(R2c) Monmouth Way, Boverton
1.3 Medium / not significant
1.6 Medium / not significant
(R2d) Harding Close, Boverton
-1.2 Medium / not significant (beneficial)
-0.5 Low / not significant (beneficial)
(R26c) Eagle Road, West Camp
6.6* High / significant 6.7* High / significant
(R31b) Caravan Park, Nr Milland Farm
12.6* High / significant 12.6* High / significant
(R26b) Froglands Farm
21.6* High / significant 21.6* High / significant
(R33a) Carpenters Arms, West Camp
7.8* High / significant 8.1* High / significant
(R13a). Picketston Cottage, Picketston
9.2* High / significant 9.4* High / significant
(R12d) Picketston Close, Eglwys Brewis
10.0* High / significant 10.3* High / significant
(R12c) Lime Grove, Eglwys Brewis
5.7* High / significant 5.9* High / significant
(R11c) Sycamore Avenue. Eglwys Brewis
2.9 Medium / not significant
3.6 High / significant
(R8c) Mallory Close, Eglwys Brewis
5.1* High / significant 5.7* High / significant
(R6c) Rectory Road, St Athan
5.3* High / significant 5.9* High / significant
(R2e) Great House Farm, Llanmaes
4.4 High / significant 4.7 High / significant
(R3b) Llantwit Road, West Camp
1.3 Medium / not significant
1.8 Medium / not significant
(R4c) Sea View -3.5 High / significant (beneficial)
-7.5 High / significant (beneficial)
(R23a) Lougher Place, St Athan
0.2 Low / not significant 0.7 Low / not significant
(R37a) Baronswell 1.1 Medium / not significant
-0.2 Low / not significant (beneficial)
(R39a) Walters Farm, Waycock Cross
1.3 Medium / not significant
0.7 Low / not significant
(R40a) Property north of Waycock Cross
-4.8 High / significant (beneficial)
-6.2 High / significant (beneficial)
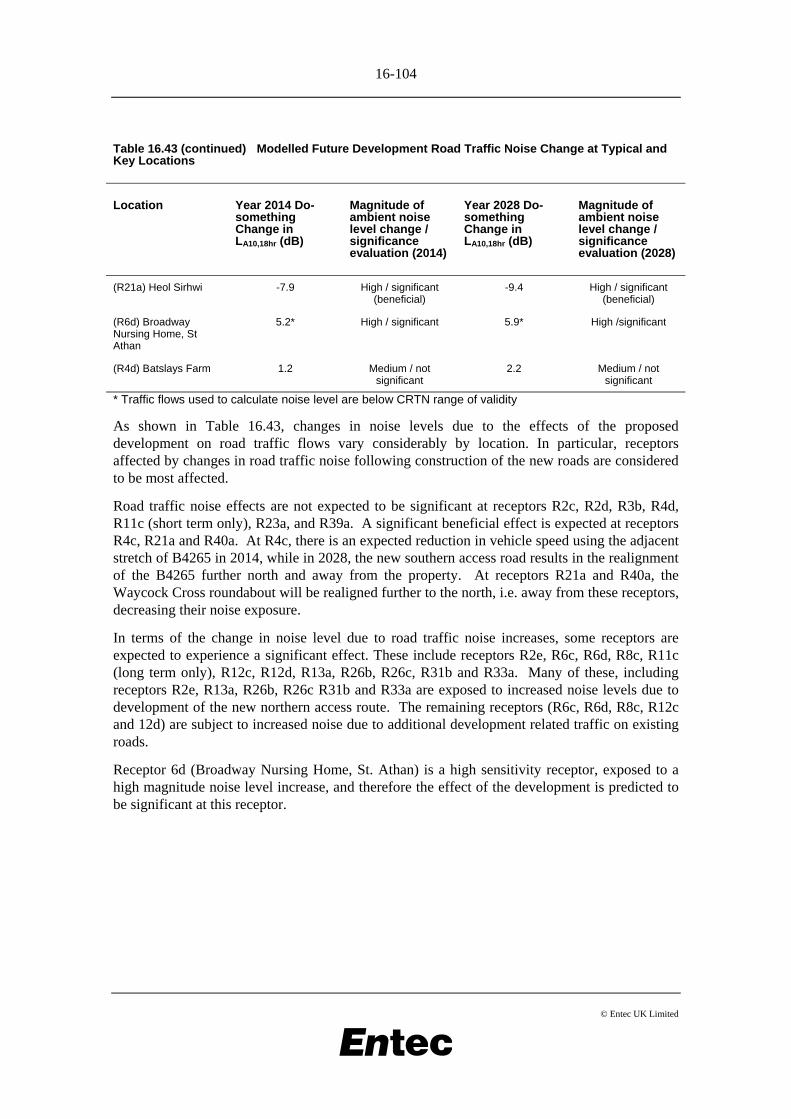
16-104
© Entec UK Limited
Table 16.43 (continued) Modelled Future Development Road Traffic Noise Change at Typical and Key Locations
Location Year 2014 Do-something Change in LA10,18hr (dB)
Magnitude of ambient noise level change / significance evaluation (2014)
Year 2028 Do-something Change in LA10,18hr (dB)
Magnitude of ambient noise level change / significance evaluation (2028)
(R21a) Heol Sirhwi -7.9 High / significant (beneficial)
-9.4 High / significant (beneficial)
(R6d) Broadway Nursing Home, St Athan
5.2* High / significant 5.9* High /significant
(R4d) Batslays Farm 1.2 Medium / not significant
2.2 Medium / not significant
* Traffic flows used to calculate noise level are below CRTN range of validity
As shown in Table 16.43, changes in noise levels due to the effects of the proposed development on road traffic flows vary considerably by location. In particular, receptors affected by changes in road traffic noise following construction of the new roads are considered to be most affected.
Road traffic noise effects are not expected to be significant at receptors R2c, R2d, R3b, R4d, R11c (short term only), R23a, and R39a. A significant beneficial effect is expected at receptors R4c, R21a and R40a. At R4c, there is an expected reduction in vehicle speed using the adjacent stretch of B4265 in 2014, while in 2028, the new southern access road results in the realignment of the B4265 further north and away from the property. At receptors R21a and R40a, the Waycock Cross roundabout will be realigned further to the north, i.e. away from these receptors, decreasing their noise exposure.
In terms of the change in noise level due to road traffic noise increases, some receptors are expected to experience a significant effect. These include receptors R2e, R6c, R6d, R8c, R11c (long term only), R12c, R12d, R13a, R26b, R26c, R31b and R33a. Many of these, including receptors R2e, R13a, R26b, R26c R31b and R33a are exposed to increased noise levels due to development of the new northern access route. The remaining receptors (R6c, R6d, R8c, R12c and 12d) are subject to increased noise due to additional development related traffic on existing roads.
Receptor 6d (Broadway Nursing Home, St. Athan) is a high sensitivity receptor, exposed to a high magnitude noise level increase, and therefore the effect of the development is predicted to be significant at this receptor.
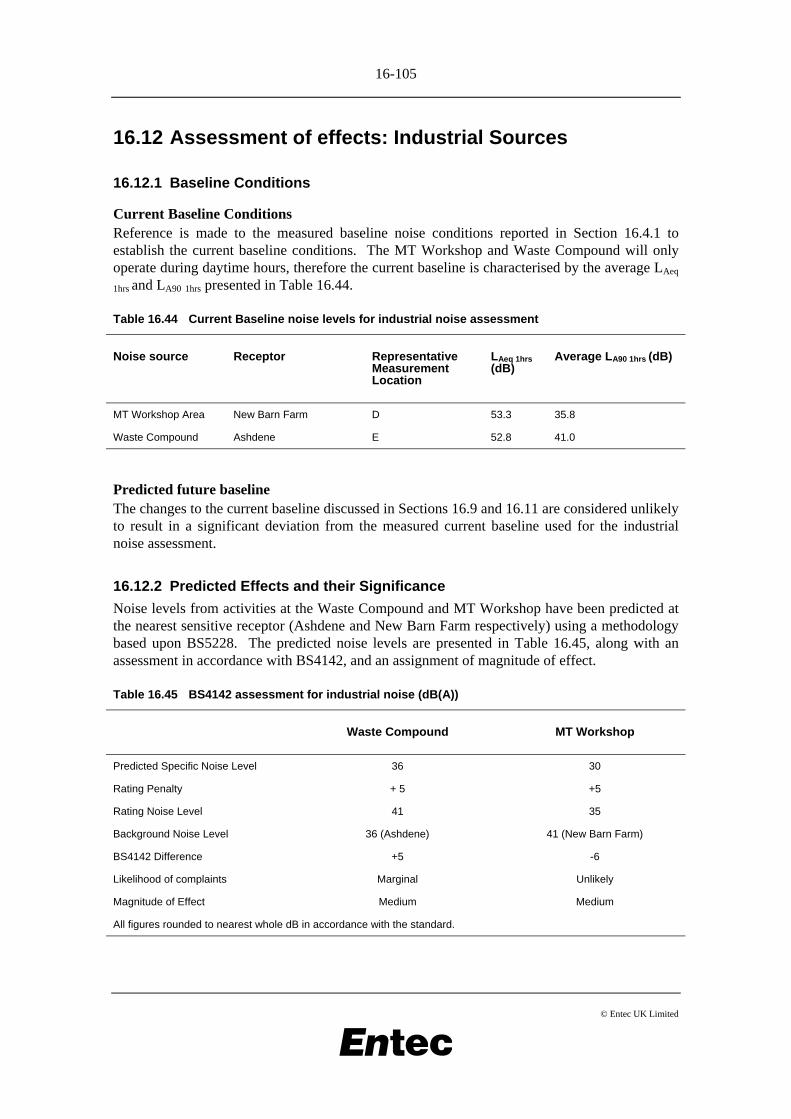
16-105
© Entec UK Limited
16.12 Assessment of effects: Industrial Sources
16.12.1 Baseline Conditions
Current Baseline Conditions Reference is made to the measured baseline noise conditions reported in Section 16.4.1 to establish the current baseline conditions. The MT Workshop and Waste Compound will only operate during daytime hours, therefore the current baseline is characterised by the average LAeq 1hrs and LA90 1hrs presented in Table 16.44.
Table 16.44 Current Baseline noise levels for industrial noise assessment
Noise source Receptor Representative Measurement Location
LAeq 1hrs (dB)
Average LA90 1hrs (dB)
MT Workshop Area New Barn Farm D 53.3 35.8
Waste Compound Ashdene E 52.8 41.0
Predicted future baseline The changes to the current baseline discussed in Sections 16.9 and 16.11 are considered unlikely to result in a significant deviation from the measured current baseline used for the industrial noise assessment.
16.12.2 Predicted Effects and their Significance
Noise levels from activities at the Waste Compound and MT Workshop have been predicted at the nearest sensitive receptor (Ashdene and New Barn Farm respectively) using a methodology based upon BS5228. The predicted noise levels are presented in Table 16.45, along with an assessment in accordance with BS4142, and an assignment of magnitude of effect.
Table 16.45 BS4142 assessment for industrial noise (dB(A))
Waste Compound MT Workshop
Predicted Specific Noise Level 36 30
Rating Penalty + 5 +5
Rating Noise Level 41 35
Background Noise Level 36 (Ashdene) 41 (New Barn Farm)
BS4142 Difference +5 -6
Likelihood of complaints Marginal Unlikely
Magnitude of Effect Medium Medium
All figures rounded to nearest whole dB in accordance with the standard.
16-106
© Entec UK Limited
The rating penalty has been applied to the predicted specific noise level in order to reflect the intermittent nature of these sources.
Table 16.45 above shows that the likelihood of complaint from activities at the Waste Compound is marginal. In accordance with the methodology set out in Section 16.7.2, the potential effects of noise from this source have been assigned a magnitude of medium. The existing residential receptor has been assigned a sensitivity of medium, leading to the conclusion that the noise effects from the Waste Compound will not be significant.
Complaints regarding the activities at the MT Workshop are considered unlikely as the rating level is 6dB(A) below the measured background level. A magnitude of medium has been assigned to these potential effects, which when considered alongside the medium sensitivity of the receptor demonstrates that the effects from this noise source will not be significant.
16.13 Assessment of Effects: Future Site Occupants
16.13.1 Baseline Conditions
Current Baseline Conditions Consideration of the current baseline is not relevant in the assessment of this potential effect.
Predicted future Baseline If the development does not go ahead there will be no occupants of the proposed development, and hence consideration of the predicted future baseline is not relevant in the assessment of this potential effect.
16.13.2 Predicted Effects and Their Significance
Site suitability for proposed DTC residential uses (Ranks Village) As the proposed Ranks Village (single living accommodation) is expected to be unoccupied during the day, no consideration of daytime noise effects has been undertaken for this receptor.
Noise emissions for all on-site development related effects during the night-time period 2300-0700hrs are expected to be minimal, and as there are no significant noise sources expected to be operational in the vicinity of the Ranks Village, it is assumed that night-time noise levels, in terms of LAeq, T would be dominated by road traffic, and hence no worse than the current baseline at the nearest monitoring position on Cowbridge Road (monitoring position M8).
However, night-time maximum noise levels, in terms of LAmax, due to road traffic on Cowbridge Road (running past the east of the site) are likely to be significantly lower than those measured at monitoring position M8, due to the increased distance between source and receptor. Maximum noise levels have therefore been corrected for this additional distance.
Based on the above, expected night-time noise levels at the worst affected units on the eastern boundary are shown in Table 16.46, along with the corresponding noise exposure category, in accordance with TAN11.
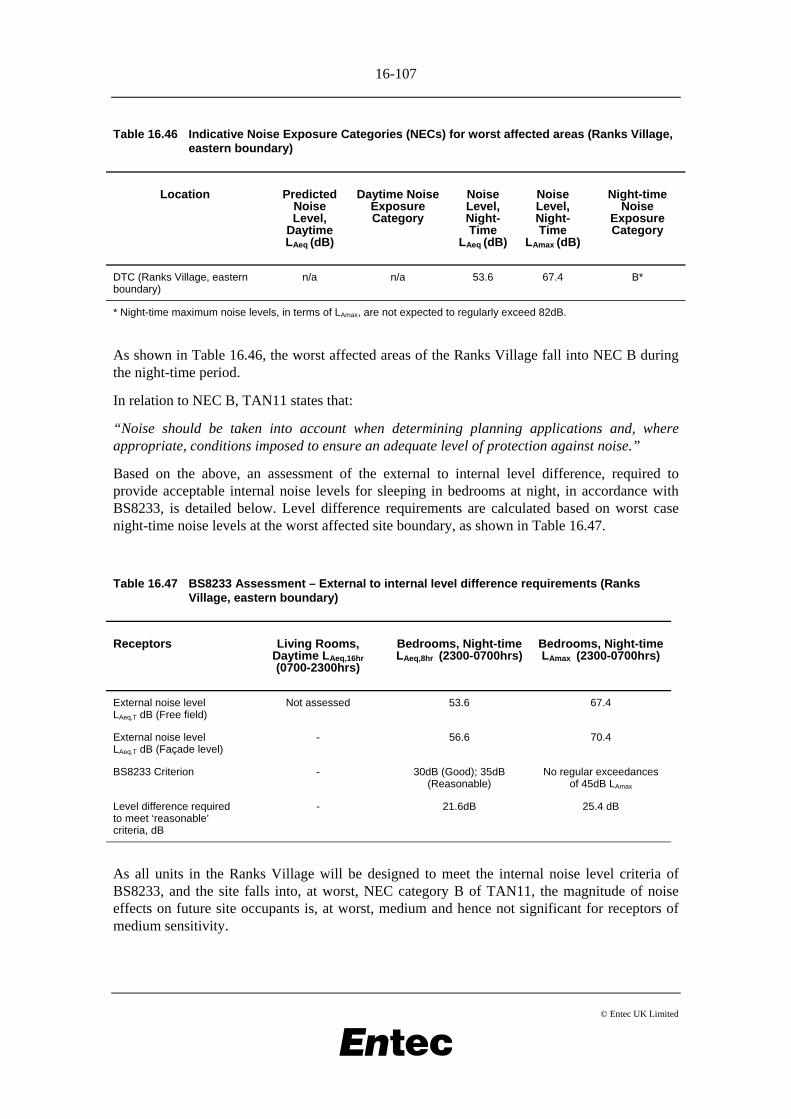
16-107
© Entec UK Limited
Table 16.46 Indicative Noise Exposure Categories (NECs) for worst affected areas (Ranks Village, eastern boundary)
Location Predicted Noise Level,
Daytime LAeq (dB)
Daytime Noise Exposure Category
Noise Level, Night-Time
LAeq (dB)
Noise Level, Night-Time
LAmax (dB)
Night-time Noise
Exposure Category
DTC (Ranks Village, eastern boundary)
n/a n/a 53.6 67.4 B*
* Night-time maximum noise levels, in terms of LAmax, are not expected to regularly exceed 82dB.
As shown in Table 16.46, the worst affected areas of the Ranks Village fall into NEC B during the night-time period.
In relation to NEC B, TAN11 states that:
“Noise should be taken into account when determining planning applications and, where appropriate, conditions imposed to ensure an adequate level of protection against noise.”
Based on the above, an assessment of the external to internal level difference, required to provide acceptable internal noise levels for sleeping in bedrooms at night, in accordance with BS8233, is detailed below. Level difference requirements are calculated based on worst case night-time noise levels at the worst affected site boundary, as shown in Table 16.47.
Table 16.47 BS8233 Assessment – External to internal level difference requirements (Ranks Village, eastern boundary)
Receptors Living Rooms, Daytime LAeq,16hr (0700-2300hrs)
Bedrooms, Night-time LAeq,8hr (2300-0700hrs)
Bedrooms, Night-time LAmax (2300-0700hrs)
External noise level LAeq,T dB (Free field)
Not assessed 53.6 67.4
External noise level LAeq,T dB (Façade level)
- 56.6 70.4
BS8233 Criterion - 30dB (Good); 35dB (Reasonable)
No regular exceedances of 45dB LAmax
Level difference required to meet ‘reasonable’ criteria, dB
- 21.6dB 25.4 dB
As all units in the Ranks Village will be designed to meet the internal noise level criteria of BS8233, and the site falls into, at worst, NEC category B of TAN11, the magnitude of noise effects on future site occupants is, at worst, medium and hence not significant for receptors of medium sensitivity.
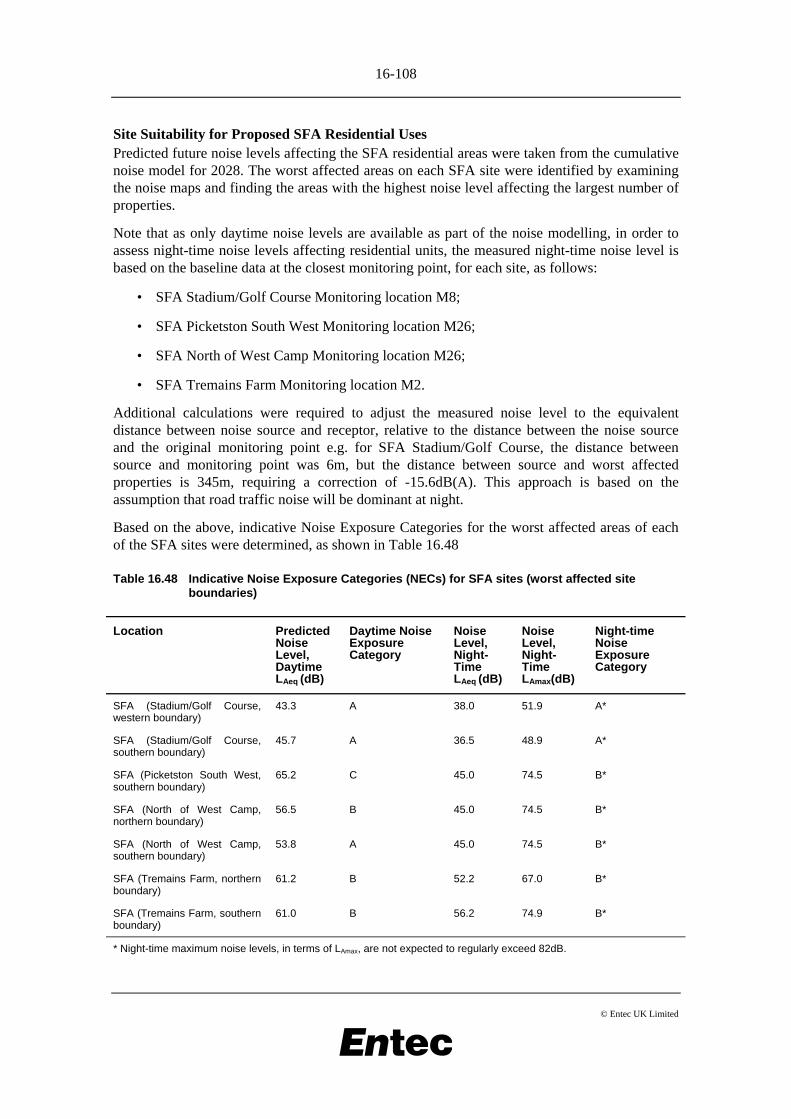
16-108
© Entec UK Limited
Site Suitability for Proposed SFA Residential Uses Predicted future noise levels affecting the SFA residential areas were taken from the cumulative noise model for 2028. The worst affected areas on each SFA site were identified by examining the noise maps and finding the areas with the highest noise level affecting the largest number of properties.
Note that as only daytime noise levels are available as part of the noise modelling, in order to assess night-time noise levels affecting residential units, the measured night-time noise level is based on the baseline data at the closest monitoring point, for each site, as follows:
• SFA Stadium/Golf Course Monitoring location M8;
• SFA Picketston South West Monitoring location M26;
• SFA North of West Camp Monitoring location M26;
• SFA Tremains Farm Monitoring location M2.
Additional calculations were required to adjust the measured noise level to the equivalent distance between noise source and receptor, relative to the distance between the noise source and the original monitoring point e.g. for SFA Stadium/Golf Course, the distance between source and monitoring point was 6m, but the distance between source and worst affected properties is 345m, requiring a correction of -15.6dB(A). This approach is based on the assumption that road traffic noise will be dominant at night.
Based on the above, indicative Noise Exposure Categories for the worst affected areas of each of the SFA sites were determined, as shown in Table 16.48
Table 16.48 Indicative Noise Exposure Categories (NECs) for SFA sites (worst affected site boundaries)
Location Predicted Noise Level, Daytime LAeq (dB)
Daytime Noise Exposure Category
Noise Level, Night-Time LAeq (dB)
Noise Level, Night-Time LAmax(dB)
Night-time Noise Exposure Category
SFA (Stadium/Golf Course, western boundary)
43.3 A 38.0 51.9 A*
SFA (Stadium/Golf Course, southern boundary)
45.7 A 36.5 48.9 A*
SFA (Picketston South West, southern boundary)
65.2 C 45.0 74.5 B*
SFA (North of West Camp, northern boundary)
56.5 B 45.0 74.5 B*
SFA (North of West Camp, southern boundary)
53.8 A 45.0 74.5 B*
SFA (Tremains Farm, northern boundary)
61.2 B 52.2 67.0 B*
SFA (Tremains Farm, southern boundary)
61.0 B 56.2 74.9 B*
* Night-time maximum noise levels, in terms of LAmax, are not expected to regularly exceed 82dB.
16-109
© Entec UK Limited
As shown in Table 16.48, the worst affected areas of the Stadium/Golf Course SFA (i.e. on the western and southern boundaries) fall into NEC A during both the daytime and night-time periods.
In relation to NEC A, TAN11 states that:
“Noise need not be considered as a determining factor in granting planning permission, although the noise level at the high end of the category should not be regarded as a desirable level.”
Worst affected areas of Tremains Farm SFA (northern and southern boundaries) fall into NEC B during both the daytime and night-time periods.
In relation to NEC B, TAN11 states that:
“Noise should be taken into account when determining planning applications and, where appropriate, conditions imposed to ensure an adequate level of protection against noise.”
Worst affected areas of West Camp SFA, on the northern boundary, fall into NEC B during both the daytime and night-time. Worst affected areas on the southern boundary fall into NEC A during the daytime, and NEC B at night.
Worst affected areas of Picketson South West SFA (southern boundary) fall into NEC C during the daytime, and NEC B at night.
In relation to NEC C, TAN11 states that:
“Planning permission should not normally be granted. Where it is considered that planning permission should be given, for example, because there are no alternative quieter sites available, conditions should be imposed to ensure a commensurate level of protection against noise.”
In summary, all SFA areas fall either into NEC A, or NEC’s B/C (medium magnitude of effect). Where road traffic, airfield noise or any other noise sources associated with the development are considered to have a potential adverse effect upon residential amenity in the SFA areas, then adequate levels of noise reduction will be provided at the building façades to meet the internal noise level criteria of BS8233.
An assessment of the external to internal level difference, required to provide acceptable internal noise levels for resting in living rooms during the day, and for resting and sleeping in bedrooms at night, in accordance with BS8233, is detailed below. Level difference requirements are calculated based on worst case predicted daytime and night-time noise levels at each of the affected SFA site boundaries, as shown in Tables 16.49 – 16.55.
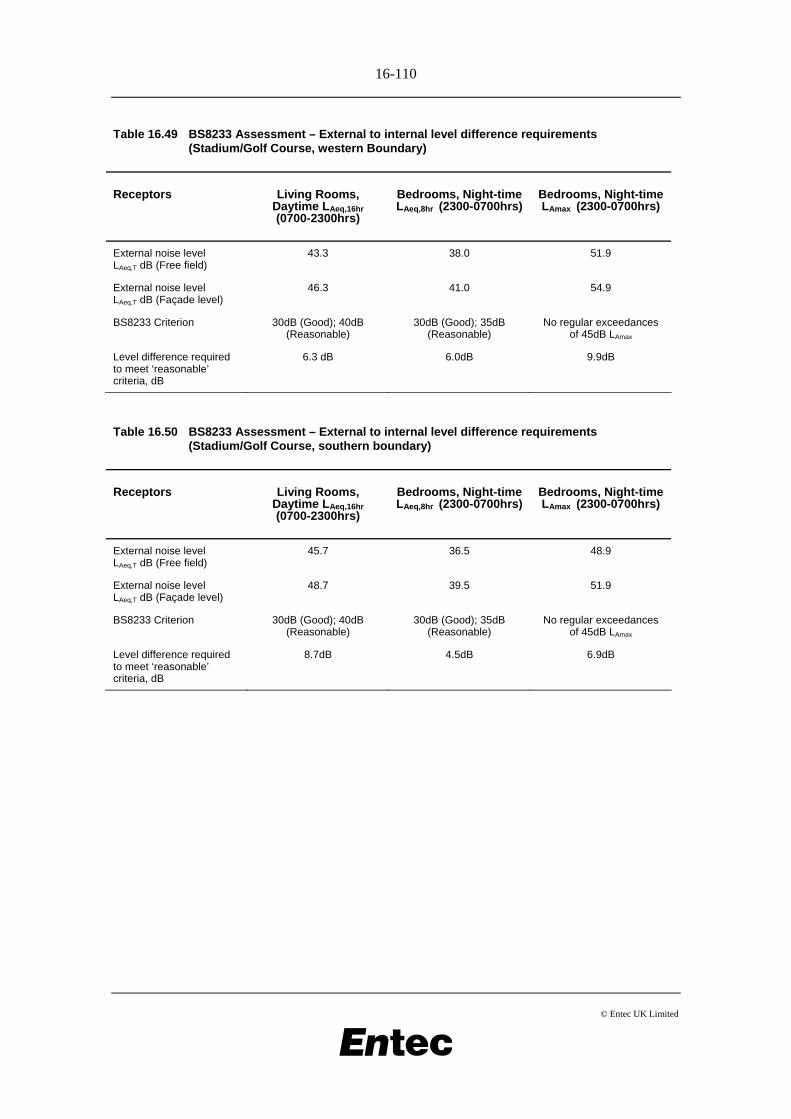
16-110
© Entec UK Limited
Table 16.49 BS8233 Assessment – External to internal level difference requirements (Stadium/Golf Course, western Boundary)
Receptors Living Rooms, Daytime LAeq,16hr (0700-2300hrs)
Bedrooms, Night-time LAeq,8hr (2300-0700hrs)
Bedrooms, Night-time LAmax (2300-0700hrs)
External noise level LAeq,T dB (Free field)
43.3 38.0 51.9
External noise level LAeq,T dB (Façade level)
46.3 41.0 54.9
BS8233 Criterion 30dB (Good); 40dB (Reasonable)
30dB (Good); 35dB (Reasonable)
No regular exceedances of 45dB LAmax
Level difference required to meet ‘reasonable’ criteria, dB
6.3 dB 6.0dB 9.9dB
Table 16.50 BS8233 Assessment – External to internal level difference requirements (Stadium/Golf Course, southern boundary)
Receptors Living Rooms, Daytime LAeq,16hr (0700-2300hrs)
Bedrooms, Night-time LAeq,8hr (2300-0700hrs)
Bedrooms, Night-time LAmax (2300-0700hrs)
External noise level LAeq,T dB (Free field)
45.7 36.5 48.9
External noise level LAeq,T dB (Façade level)
48.7 39.5 51.9
BS8233 Criterion 30dB (Good); 40dB (Reasonable)
30dB (Good); 35dB (Reasonable)
No regular exceedances of 45dB LAmax
Level difference required to meet ‘reasonable’ criteria, dB
8.7dB 4.5dB 6.9dB

16-111
© Entec UK Limited
Table 16.51 BS8233 Assessment – External to internal level difference requirements (Picketston SW, southern boundary)
Receptors Living Rooms, Daytime LAeq,16hr (0700-2300hrs)
Bedrooms, Night-time LAeq,8hr (2300-0700hrs)
Bedrooms, Night-time LAmax (2300-0700hrs)
External noise level LAeq,T dB (Free field)
65.2 45.0 74.5
External noise level LAeq,T dB (Façade level)
68.2 48.0 77.5
BS8233 Criterion 30dB (Good); 40dB (Reasonable)
30dB (Good); 35dB (Reasonable)
No regular exceedances of 45dB LAmax
Level difference required to meet ‘reasonable’ criteria, dB
28.2dB 13.0dB 32.5dB
Table 16.52 BS8233 Assessment – External to internal level difference requirements (West Camp, northern boundary)
Receptors Living Rooms, Daytime LAeq,16hr (0700-2300hrs)
Bedrooms, Night-time LAeq,8hr (2300-0700hrs)
Bedrooms, Night-time LAmax (2300-0700hrs)
External noise level LAeq,T dB (Free field)
56.5 45.0 74.5
External noise level LAeq,T dB (Façade level)
59.5 48.0 77.5
BS8233 Criterion 30dB (Good); 40dB (Reasonable)
30dB (Good); 35dB (Reasonable)
No regular exceedances of 45dB LAmax
Level difference required to meet ‘reasonable’ criteria, dB
19.5dB 13.0dB 32.5dB
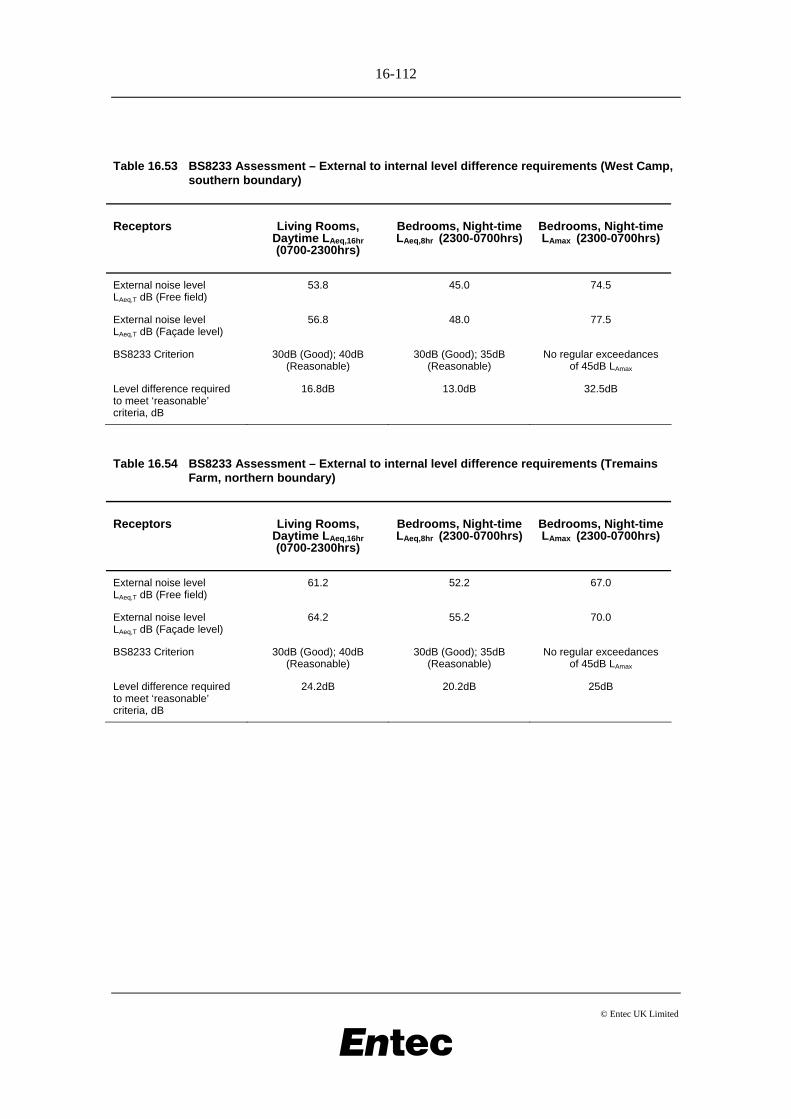
16-112
© Entec UK Limited
Table 16.53 BS8233 Assessment – External to internal level difference requirements (West Camp, southern boundary)
Receptors Living Rooms, Daytime LAeq,16hr (0700-2300hrs)
Bedrooms, Night-time LAeq,8hr (2300-0700hrs)
Bedrooms, Night-time LAmax (2300-0700hrs)
External noise level LAeq,T dB (Free field)
53.8 45.0 74.5
External noise level LAeq,T dB (Façade level)
56.8 48.0 77.5
BS8233 Criterion 30dB (Good); 40dB (Reasonable)
30dB (Good); 35dB (Reasonable)
No regular exceedances of 45dB LAmax
Level difference required to meet ‘reasonable’ criteria, dB
16.8dB 13.0dB 32.5dB
Table 16.54 BS8233 Assessment – External to internal level difference requirements (Tremains Farm, northern boundary)
Receptors Living Rooms, Daytime LAeq,16hr (0700-2300hrs)
Bedrooms, Night-time LAeq,8hr (2300-0700hrs)
Bedrooms, Night-time LAmax (2300-0700hrs)
External noise level LAeq,T dB (Free field)
61.2 52.2 67.0
External noise level LAeq,T dB (Façade level)
64.2 55.2 70.0
BS8233 Criterion 30dB (Good); 40dB (Reasonable)
30dB (Good); 35dB (Reasonable)
No regular exceedances of 45dB LAmax
Level difference required to meet ‘reasonable’ criteria, dB
24.2dB 20.2dB 25dB
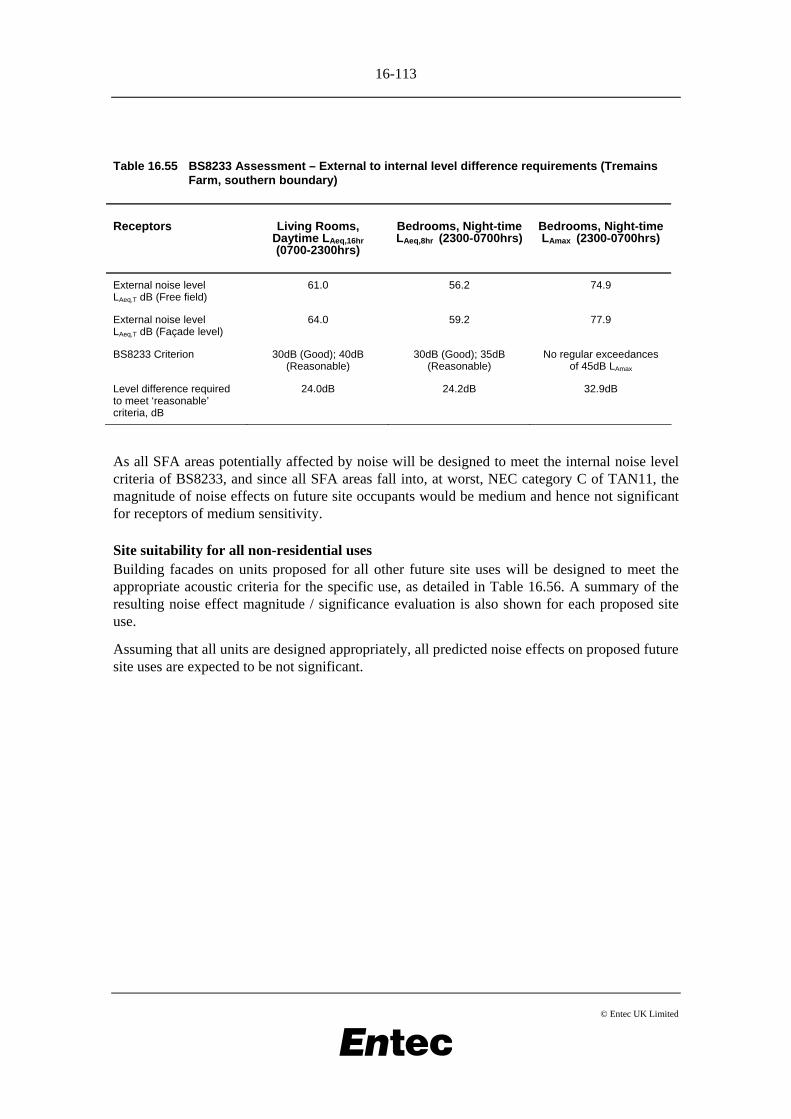
16-113
© Entec UK Limited
Table 16.55 BS8233 Assessment – External to internal level difference requirements (Tremains Farm, southern boundary)
Receptors Living Rooms, Daytime LAeq,16hr (0700-2300hrs)
Bedrooms, Night-time LAeq,8hr (2300-0700hrs)
Bedrooms, Night-time LAmax (2300-0700hrs)
External noise level LAeq,T dB (Free field)
61.0 56.2 74.9
External noise level LAeq,T dB (Façade level)
64.0 59.2 77.9
BS8233 Criterion 30dB (Good); 40dB (Reasonable)
30dB (Good); 35dB (Reasonable)
No regular exceedances of 45dB LAmax
Level difference required to meet ‘reasonable’ criteria, dB
24.0dB 24.2dB 32.9dB
As all SFA areas potentially affected by noise will be designed to meet the internal noise level criteria of BS8233, and since all SFA areas fall into, at worst, NEC category C of TAN11, the magnitude of noise effects on future site occupants would be medium and hence not significant for receptors of medium sensitivity.
Site suitability for all non-residential uses Building facades on units proposed for all other future site uses will be designed to meet the appropriate acoustic criteria for the specific use, as detailed in Table 16.56. A summary of the resulting noise effect magnitude / significance evaluation is also shown for each proposed site use.
Assuming that all units are designed appropriately, all predicted noise effects on proposed future site uses are expected to be not significant.
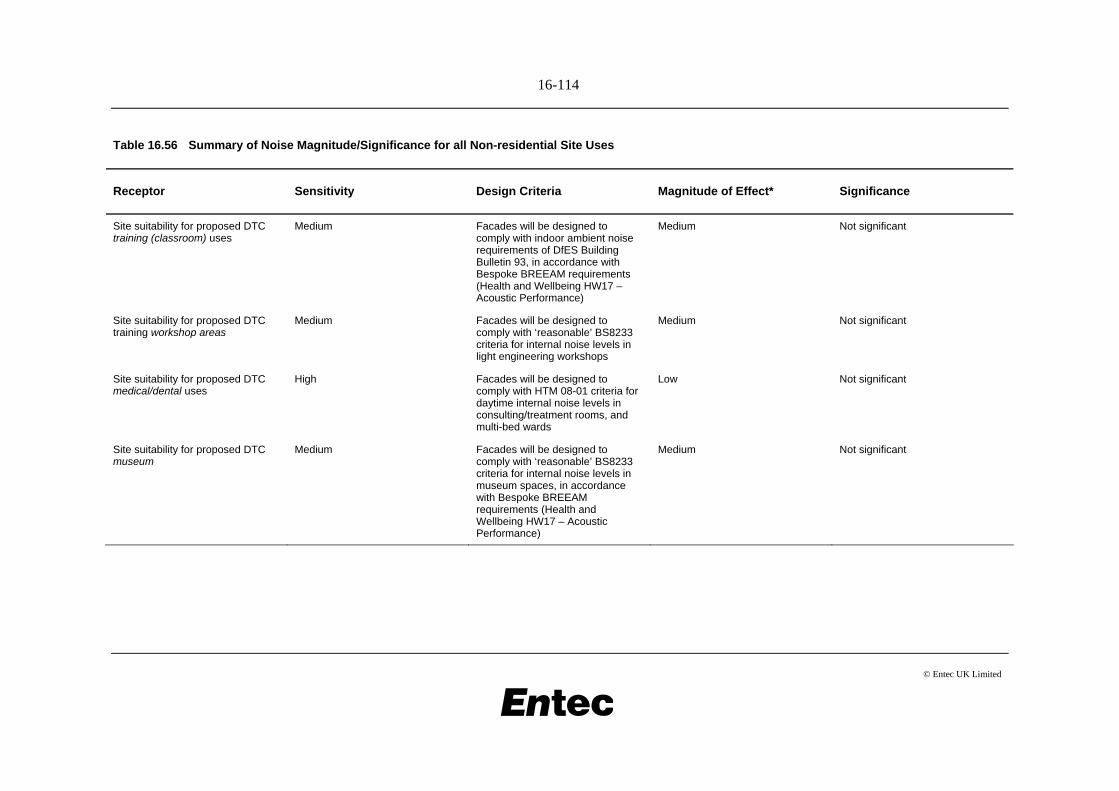
16-114
© Entec UK Limited
Table 16.56 Summary of Noise Magnitude/Significance for all Non-residential Site Uses
Receptor Sensitivity Design Criteria Magnitude of Effect* Significance
Site suitability for proposed DTC training (classroom) uses
Medium Facades will be designed to comply with indoor ambient noise requirements of DfES Building Bulletin 93, in accordance with Bespoke BREEAM requirements (Health and Wellbeing HW17 – Acoustic Performance)
Medium Not significant
Site suitability for proposed DTC training workshop areas
Medium Facades will be designed to comply with ‘reasonable’ BS8233 criteria for internal noise levels in light engineering workshops
Medium Not significant
Site suitability for proposed DTC medical/dental uses
High Facades will be designed to comply with HTM 08-01 criteria for daytime internal noise levels in consulting/treatment rooms, and multi-bed wards
Low Not significant
Site suitability for proposed DTC museum
Medium Facades will be designed to comply with ‘reasonable’ BS8233 criteria for internal noise levels in museum spaces, in accordance with Bespoke BREEAM requirements (Health and Wellbeing HW17 – Acoustic Performance)
Medium Not significant
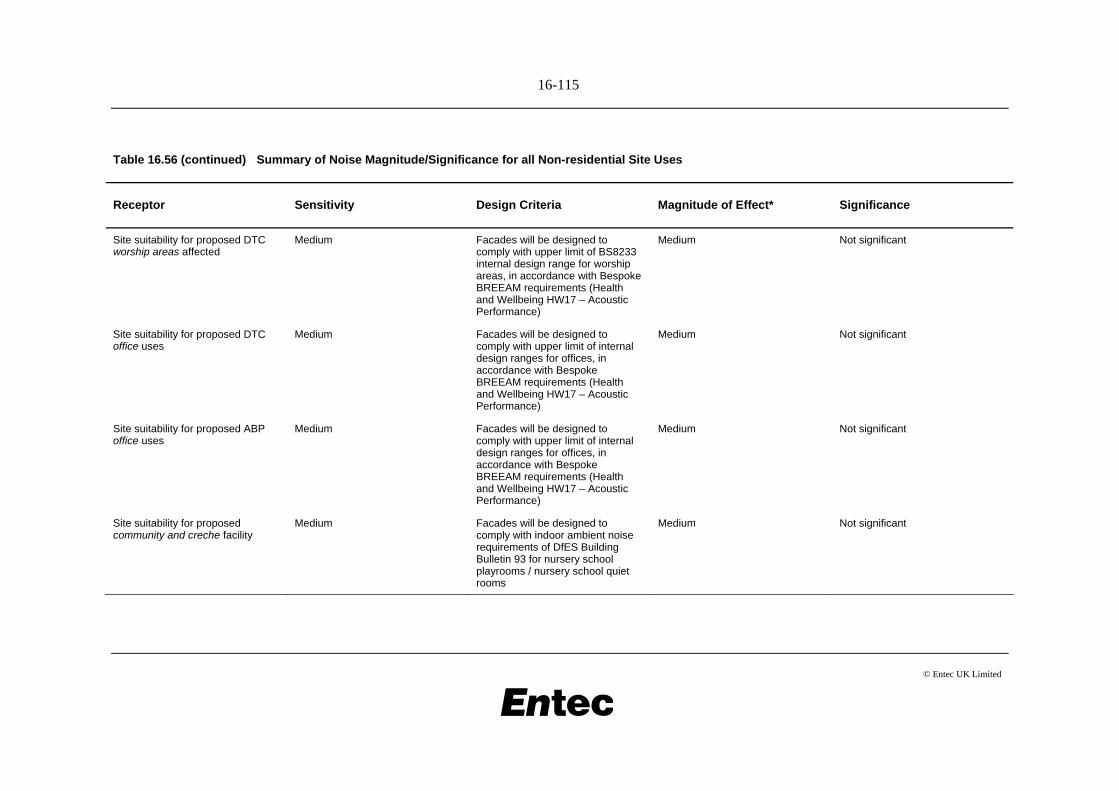
16-115
© Entec UK Limited
Table 16.56 (continued) Summary of Noise Magnitude/Significance for all Non-residential Site Uses
Receptor Sensitivity Design Criteria Magnitude of Effect* Significance
Site suitability for proposed DTC worship areas affected
Medium Facades will be designed to comply with upper limit of BS8233 internal design range for worship areas, in accordance with Bespoke BREEAM requirements (Health and Wellbeing HW17 – Acoustic Performance)
Medium Not significant
Site suitability for proposed DTC office uses
Medium Facades will be designed to comply with upper limit of internal design ranges for offices, in accordance with Bespoke BREEAM requirements (Health and Wellbeing HW17 – Acoustic Performance)
Medium Not significant
Site suitability for proposed ABP office uses
Medium Facades will be designed to comply with upper limit of internal design ranges for offices, in accordance with Bespoke BREEAM requirements (Health and Wellbeing HW17 – Acoustic Performance)
Medium Not significant
Site suitability for proposed community and creche facility
Medium Facades will be designed to comply with indoor ambient noise requirements of DfES Building Bulletin 93 for nursery school playrooms / nursery school quiet rooms
Medium Not significant

16-116
© Entec UK Limited
Table 16.56 (continued) Summary of Noise Magnitude/Significance for all Non-residential Site Uses
Receptor Sensitivity Design Criteria Magnitude of Effect* Significance
Site suitability for proposed Hotel Medium Facades will be designed to comply with ‘reasonable’ BS8233 ‘criteria for internal noise levels in in bedrooms at night
Medium Not significant
* Magnitude of effect, assuming buildings are designed appropriate to meet specified acoustic criteria.
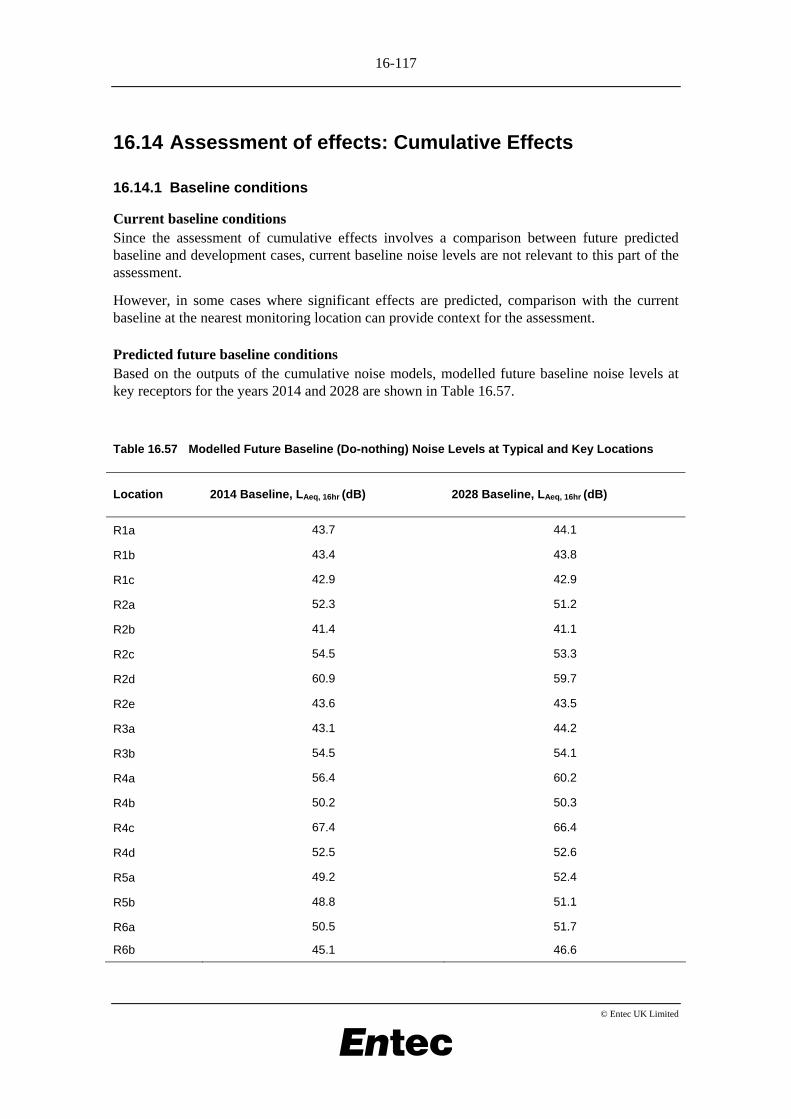
16-117
© Entec UK Limited
16.14 Assessment of effects: Cumulative Effects
16.14.1 Baseline conditions
Current baseline conditions Since the assessment of cumulative effects involves a comparison between future predicted baseline and development cases, current baseline noise levels are not relevant to this part of the assessment.
However, in some cases where significant effects are predicted, comparison with the current baseline at the nearest monitoring location can provide context for the assessment.
Predicted future baseline conditions Based on the outputs of the cumulative noise models, modelled future baseline noise levels at key receptors for the years 2014 and 2028 are shown in Table 16.57.
Table 16.57 Modelled Future Baseline (Do-nothing) Noise Levels at Typical and Key Locations
Location 2014 Baseline, LAeq, 16hr (dB) 2028 Baseline, LAeq, 16hr (dB)
R1a 43.7 44.1
R1b 43.4 43.8
R1c 42.9 42.9
R2a 52.3 51.2
R2b 41.4 41.1
R2c 54.5 53.3
R2d 60.9 59.7
R2e 43.6 43.5
R3a 43.1 44.2
R3b 54.5 54.1
R4a 56.4 60.2
R4b 50.2 50.3
R4c 67.4 66.4
R4d 52.5 52.6
R5a 49.2 52.4
R5b 48.8 51.1
R6a 50.5 51.7
R6b 45.1 46.6
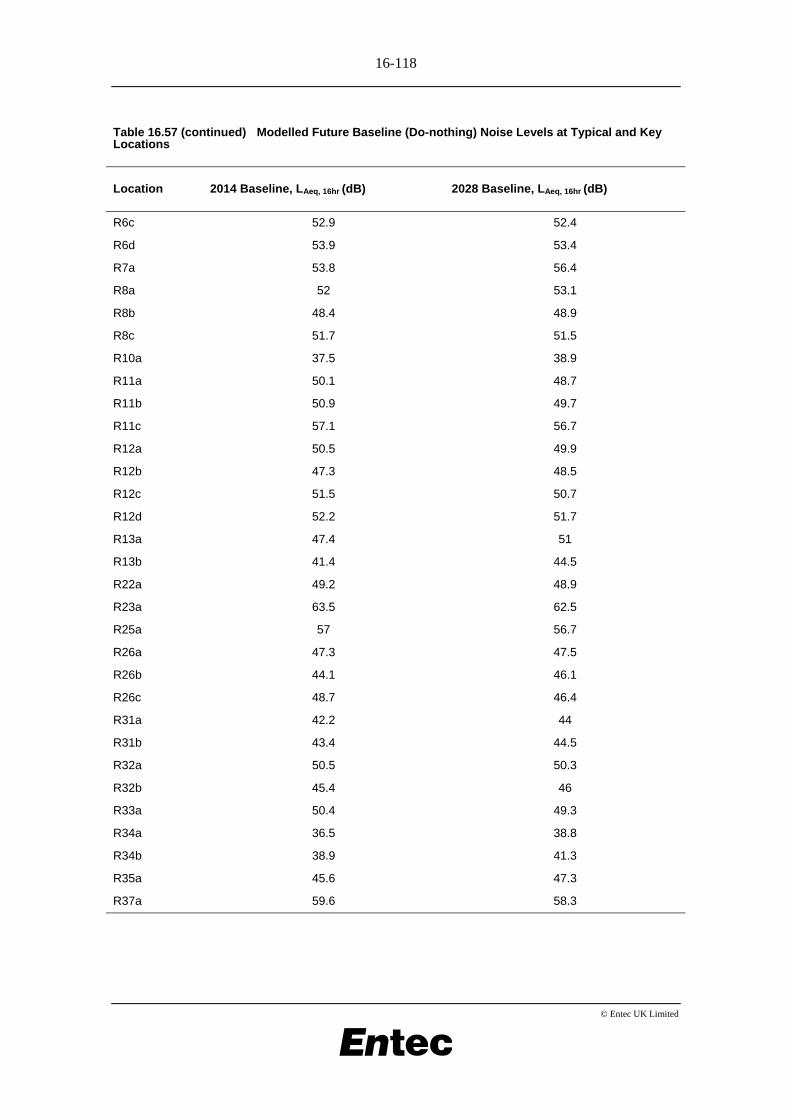
16-118
© Entec UK Limited
Table 16.57 (continued) Modelled Future Baseline (Do-nothing) Noise Levels at Typical and Key Locations
Location 2014 Baseline, LAeq, 16hr (dB) 2028 Baseline, LAeq, 16hr (dB)
R6c 52.9 52.4
R6d 53.9 53.4
R7a 53.8 56.4
R8a 52 53.1
R8b 48.4 48.9
R8c 51.7 51.5
R10a 37.5 38.9
R11a 50.1 48.7
R11b 50.9 49.7
R11c 57.1 56.7
R12a 50.5 49.9
R12b 47.3 48.5
R12c 51.5 50.7
R12d 52.2 51.7
R13a 47.4 51
R13b 41.4 44.5
R22a 49.2 48.9
R23a 63.5 62.5
R25a 57 56.7
R26a 47.3 47.5
R26b 44.1 46.1
R26c 48.7 46.4
R31a 42.2 44
R31b 43.4 44.5
R32a 50.5 50.3
R32b 45.4 46
R33a 50.4 49.3
R34a 36.5 38.8
R34b 38.9 41.3
R35a 45.6 47.3
R37a 59.6 58.3
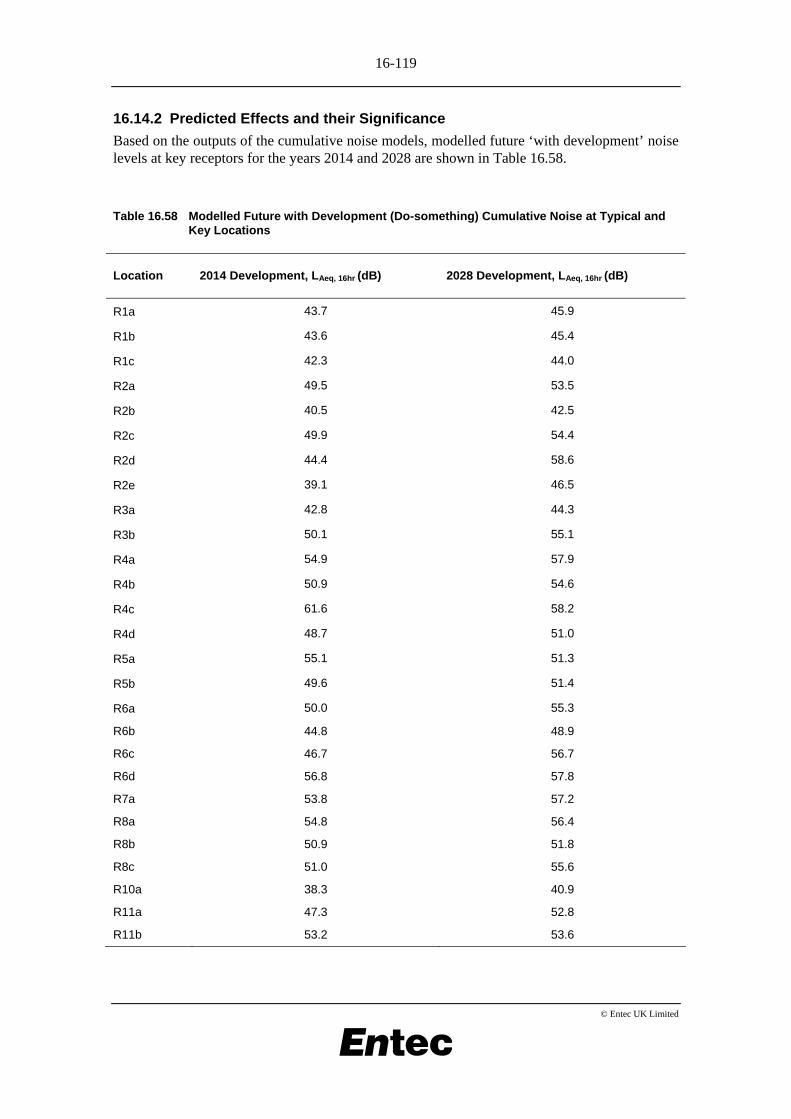
16-119
© Entec UK Limited
16.14.2 Predicted Effects and their Significance
Based on the outputs of the cumulative noise models, modelled future ‘with development’ noise levels at key receptors for the years 2014 and 2028 are shown in Table 16.58.
Table 16.58 Modelled Future with Development (Do-something) Cumulative Noise at Typical and Key Locations
Location 2014 Development, LAeq, 16hr (dB) 2028 Development, LAeq, 16hr (dB)
R1a 43.7 45.9
R1b 43.6 45.4
R1c 42.3 44.0
R2a 49.5 53.5
R2b 40.5 42.5
R2c 49.9 54.4
R2d 44.4 58.6
R2e 39.1 46.5
R3a 42.8 44.3
R3b 50.1 55.1
R4a 54.9 57.9
R4b 50.9 54.6
R4c 61.6 58.2
R4d 48.7 51.0
R5a 55.1 51.3
R5b 49.6 51.4
R6a 50.0 55.3
R6b 44.8 48.9
R6c 46.7 56.7
R6d 56.8 57.8
R7a 53.8 57.2
R8a 54.8 56.4
R8b 50.9 51.8
R8c 51.0 55.6
R10a 38.3 40.9
R11a 47.3 52.8
R11b 53.2 53.6
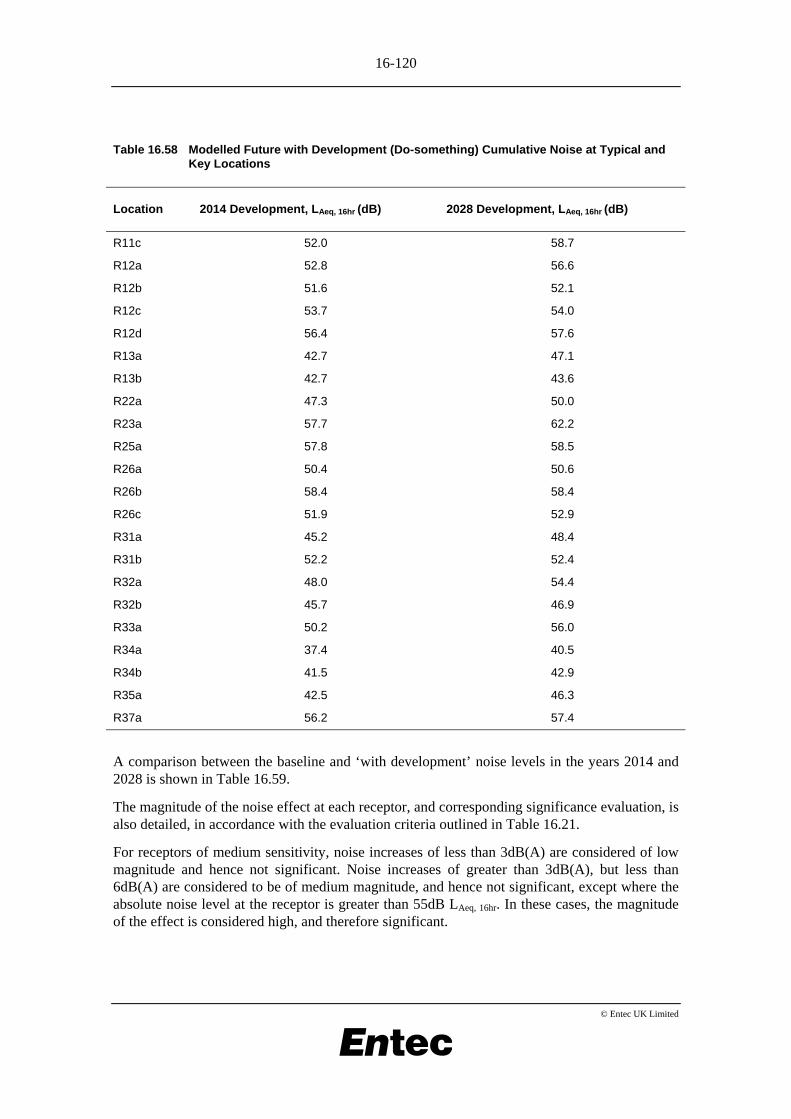
16-120
© Entec UK Limited
Table 16.58 Modelled Future with Development (Do-something) Cumulative Noise at Typical and Key Locations
Location 2014 Development, LAeq, 16hr (dB) 2028 Development, LAeq, 16hr (dB)
R11c 52.0 58.7
R12a 52.8 56.6
R12b 51.6 52.1
R12c 53.7 54.0
R12d 56.4 57.6
R13a 42.7 47.1
R13b 42.7 43.6
R22a 47.3 50.0
R23a 57.7 62.2
R25a 57.8 58.5
R26a 50.4 50.6
R26b 58.4 58.4
R26c 51.9 52.9
R31a 45.2 48.4
R31b 52.2 52.4
R32a 48.0 54.4
R32b 45.7 46.9
R33a 50.2 56.0
R34a 37.4 40.5
R34b 41.5 42.9
R35a 42.5 46.3
R37a 56.2 57.4
A comparison between the baseline and ‘with development’ noise levels in the years 2014 and 2028 is shown in Table 16.59.
The magnitude of the noise effect at each receptor, and corresponding significance evaluation, is also detailed, in accordance with the evaluation criteria outlined in Table 16.21.
For receptors of medium sensitivity, noise increases of less than 3dB(A) are considered of low magnitude and hence not significant. Noise increases of greater than 3dB(A), but less than 6dB(A) are considered to be of medium magnitude, and hence not significant, except where the absolute noise level at the receptor is greater than 55dB LAeq, 16hr. In these cases, the magnitude of the effect is considered high, and therefore significant.
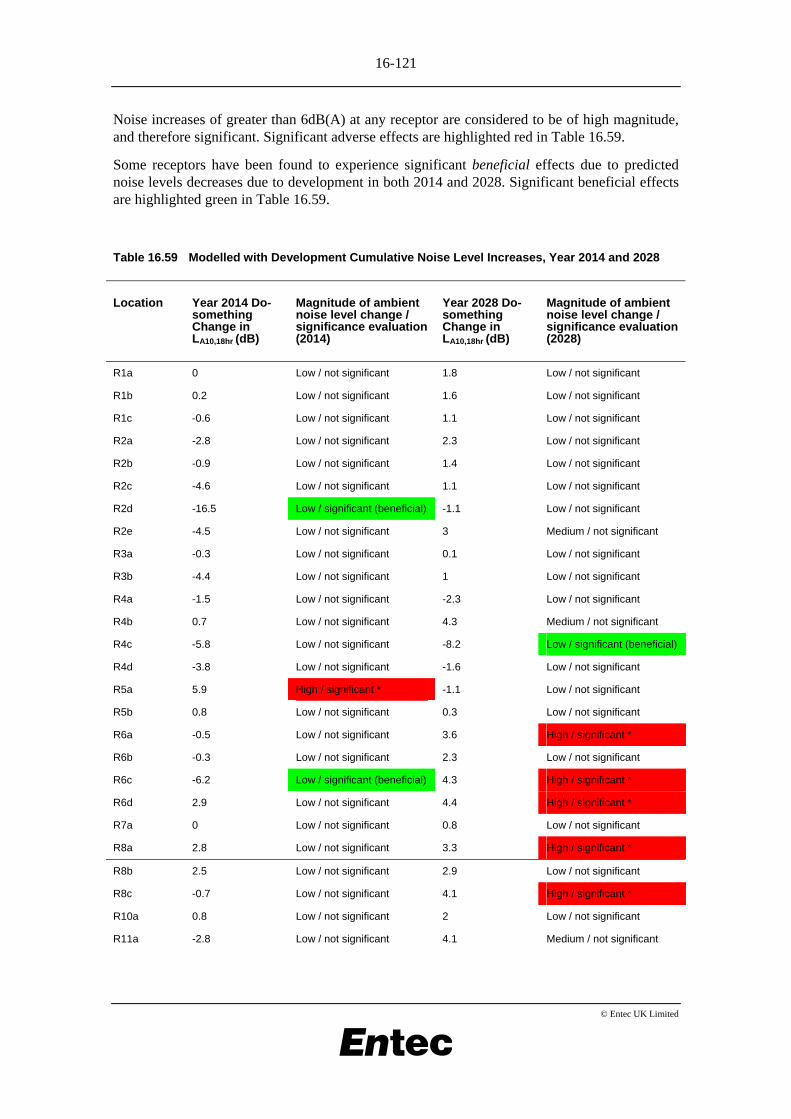
16-121
© Entec UK Limited
Noise increases of greater than 6dB(A) at any receptor are considered to be of high magnitude, and therefore significant. Significant adverse effects are highlighted red in Table 16.59.
Some receptors have been found to experience significant beneficial effects due to predicted noise levels decreases due to development in both 2014 and 2028. Significant beneficial effects are highlighted green in Table 16.59.
Table 16.59 Modelled with Development Cumulative Noise Level Increases, Year 2014 and 2028
Location Year 2014 Do-something Change in LA10,18hr (dB)
Magnitude of ambient noise level change / significance evaluation (2014)
Year 2028 Do-something Change in LA10,18hr (dB)
Magnitude of ambient noise level change / significance evaluation (2028)
R1a 0 Low / not significant 1.8 Low / not significant
R1b 0.2 Low / not significant 1.6 Low / not significant
R1c -0.6 Low / not significant 1.1 Low / not significant
R2a -2.8 Low / not significant 2.3 Low / not significant
R2b -0.9 Low / not significant 1.4 Low / not significant
R2c -4.6 Low / not significant 1.1 Low / not significant
R2d -16.5 Low / significant (beneficial) -1.1 Low / not significant
R2e -4.5 Low / not significant 3 Medium / not significant
R3a -0.3 Low / not significant 0.1 Low / not significant
R3b -4.4 Low / not significant 1 Low / not significant
R4a -1.5 Low / not significant -2.3 Low / not significant
R4b 0.7 Low / not significant 4.3 Medium / not significant
R4c -5.8 Low / not significant -8.2 Low / significant (beneficial)
R4d -3.8 Low / not significant -1.6 Low / not significant
R5a 5.9 High / significant * -1.1 Low / not significant
R5b 0.8 Low / not significant 0.3 Low / not significant
R6a -0.5 Low / not significant 3.6 High / significant *
R6b -0.3 Low / not significant 2.3 Low / not significant
R6c -6.2 Low / significant (beneficial) 4.3 High / significant *
R6d 2.9 Low / not significant 4.4 High / significant *
R7a 0 Low / not significant 0.8 Low / not significant
R8a 2.8 Low / not significant 3.3 High / significant *
R8b 2.5 Low / not significant 2.9 Low / not significant
R8c -0.7 Low / not significant 4.1 High / significant *
R10a 0.8 Low / not significant 2 Low / not significant
R11a -2.8 Low / not significant 4.1 Medium / not significant
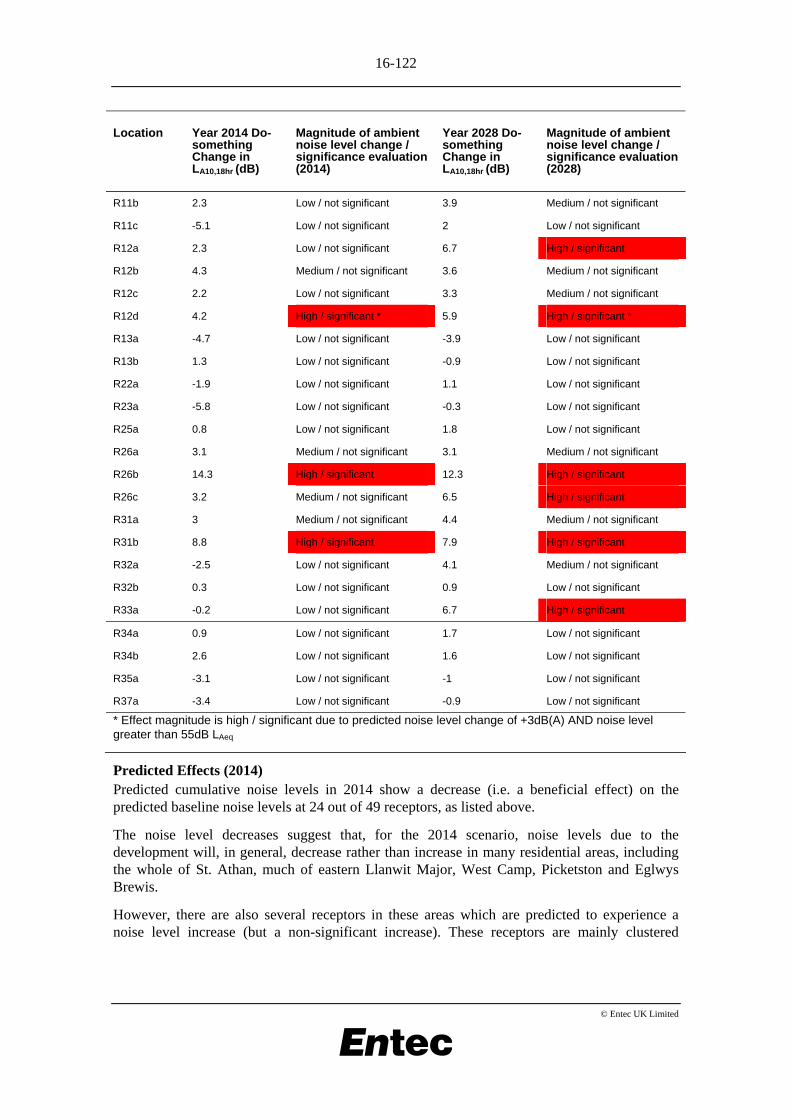
16-122
© Entec UK Limited
Location Year 2014 Do-something Change in LA10,18hr (dB)
Magnitude of ambient noise level change / significance evaluation (2014)
Year 2028 Do-something Change in LA10,18hr (dB)
Magnitude of ambient noise level change / significance evaluation (2028)
R11b 2.3 Low / not significant 3.9 Medium / not significant
R11c -5.1 Low / not significant 2 Low / not significant
R12a 2.3 Low / not significant 6.7 High / significant
R12b 4.3 Medium / not significant 3.6 Medium / not significant
R12c 2.2 Low / not significant 3.3 Medium / not significant
R12d 4.2 High / significant * 5.9 High / significant *
R13a -4.7 Low / not significant -3.9 Low / not significant
R13b 1.3 Low / not significant -0.9 Low / not significant
R22a -1.9 Low / not significant 1.1 Low / not significant
R23a -5.8 Low / not significant -0.3 Low / not significant
R25a 0.8 Low / not significant 1.8 Low / not significant
R26a 3.1 Medium / not significant 3.1 Medium / not significant
R26b 14.3 High / significant 12.3 High / significant
R26c 3.2 Medium / not significant 6.5 High / significant
R31a 3 Medium / not significant 4.4 Medium / not significant
R31b 8.8 High / significant 7.9 High / significant
R32a -2.5 Low / not significant 4.1 Medium / not significant
R32b 0.3 Low / not significant 0.9 Low / not significant
R33a -0.2 Low / not significant 6.7 High / significant
R34a 0.9 Low / not significant 1.7 Low / not significant
R34b 2.6 Low / not significant 1.6 Low / not significant
R35a -3.1 Low / not significant -1 Low / not significant
R37a -3.4 Low / not significant -0.9 Low / not significant
* Effect magnitude is high / significant due to predicted noise level change of +3dB(A) AND noise level greater than 55dB LAeq
Predicted Effects (2014) Predicted cumulative noise levels in 2014 show a decrease (i.e. a beneficial effect) on the predicted baseline noise levels at 24 out of 49 receptors, as listed above.
The noise level decreases suggest that, for the 2014 scenario, noise levels due to the development will, in general, decrease rather than increase in many residential areas, including the whole of St. Athan, much of eastern Llanwit Major, West Camp, Picketston and Eglwys Brewis.
However, there are also several receptors in these areas which are predicted to experience a noise level increase (but a non-significant increase). These receptors are mainly clustered
16-123
© Entec UK Limited
around roads expected to experience a significant increase in road traffic volumes to 2014, particularly those located on or close to Eglwys Brewis Road.
This effect is also seen at more isolated properties to the north of the airfield, e.g. Slade Paddocks (R34a), New Barn (R34b) etc. due to current baseline road traffic levels being very low at these properties.
Road traffic noise effects are particularly pronounced at receptors located close to the new northern access route. Significant effects are predicted at receptors R26b and R31b, suggesting that existing residential properties located close to the new access road are likely to experience adverse noise effects, due to operation of the new route. Changes in other noise sources will not mask these increases.
Other receptors in this vicinity either experience a decrease, or a non-significant increase, but these are generally located at greater horizontal distance from the new access road.
There is also a significant increase for 2014 at receptor R12d, due to road traffic increases on Eglwys Brewis road pushing the ambient noise level above 55dB LAeq, 16hr.
Significant effects are also expected at Briarbank (R5a), where noise level increases due to new airfield operations are particularly high.
Conversely, no significant effects are expected at Batslay’s Farm (R4a/R4d), despite its proximity to the new engine running area. The relocation of other airfield activities, particularly the police helicopter landing zone actually produces a noise level decrease at this location (note that the new engine running area is oriented so that its noise barrier effectively reduces noise at Batslay’s Farm).
Predicted Effects 2028 When comparing the with development case with the future baseline in 2028, generally, fewer receptors in the area experience a decrease in noise level due to development than in the 2014 scenario. There are a greater number of receptors in eastern Llantwit Major in particular where noise levels increase, but these increases are still below the threshold of significance.
Significant adverse effects are predicted at Receptors R6c and R6d, in the centre of St. Athan, indicating that traffic volume increases through St. Athan may lead to significant noise level increases for both residential receptors close to the main road through St. Athan, and at the St. Athan Nursing Home (particular given that this is a high sensitivity receptor).
Other receptors north of West Camp (R26c and R33a), are also expected to experience significant increases in 2028 due to increases in traffic volumes on Eglwys Brewis Road, combining with noise from the new northern access road, and airfield activities.
All areas expected to experience significant negative effects due to development in 2014 are also expected to experience significant adverse effects under the 2028 scenario, with the exception of Briarbank (R5a), where noise levels actually decrease with respect to baseline in 2028. This is due to the relocation of the gliding school away from this receptor in the 2028 scenario (a positive effect).
There are significant adverse effects at some properties on Eglwys Brewis Road (R12a / R12d) due to ambient noise levels being pushed up over 55dB LAeq, 16hr. In the 2028 scenario, this effect also occurs at properties on the western boundary of the Flemingston Road Housing Estate (R8a and R8c).
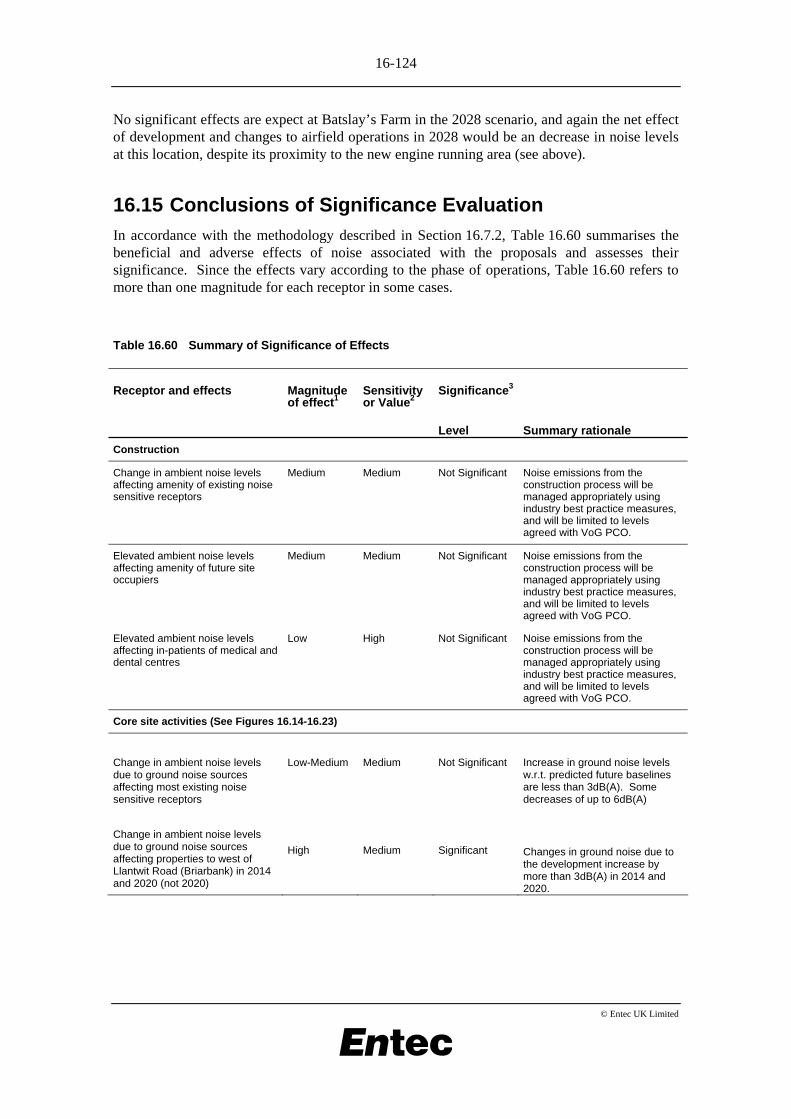
16-124
© Entec UK Limited
No significant effects are expect at Batslay’s Farm in the 2028 scenario, and again the net effect of development and changes to airfield operations in 2028 would be an decrease in noise levels at this location, despite its proximity to the new engine running area (see above).
16.15 Conclusions of Significance Evaluation
In accordance with the methodology described in Section 16.7.2, Table 16.60 summarises the beneficial and adverse effects of noise associated with the proposals and assesses their significance. Since the effects vary according to the phase of operations, Table 16.60 refers to more than one magnitude for each receptor in some cases.
Table 16.60 Summary of Significance of Effects
Receptor and effects Magnitude of effect1
Sensitivity or Value2
Significance3
Level Summary rationale
Construction
Change in ambient noise levels affecting amenity of existing noise sensitive receptors
Medium Medium Not Significant Noise emissions from the construction process will be managed appropriately using industry best practice measures, and will be limited to levels agreed with VoG PCO.
Elevated ambient noise levels affecting amenity of future site occupiers
Medium Medium Not Significant Noise emissions from the construction process will be managed appropriately using industry best practice measures, and will be limited to levels agreed with VoG PCO.
Elevated ambient noise levels affecting in-patients of medical and dental centres
Low High Not Significant Noise emissions from the construction process will be managed appropriately using industry best practice measures, and will be limited to levels agreed with VoG PCO.
Core site activities (See Figures 16.14-16.23)
Change in ambient noise levels due to ground noise sources affecting most existing noise sensitive receptors Change in ambient noise levels due to ground noise sources affecting properties to west of Llantwit Road (Briarbank) in 2014 and 2020 (not 2020)
Low-Medium High
Medium Medium
Not Significant Significant
Increase in ground noise levels w.r.t. predicted future baselines are less than 3dB(A). Some decreases of up to 6dB(A) Changes in ground noise due to the development increase by more than 3dB(A) in 2014 and 2020.
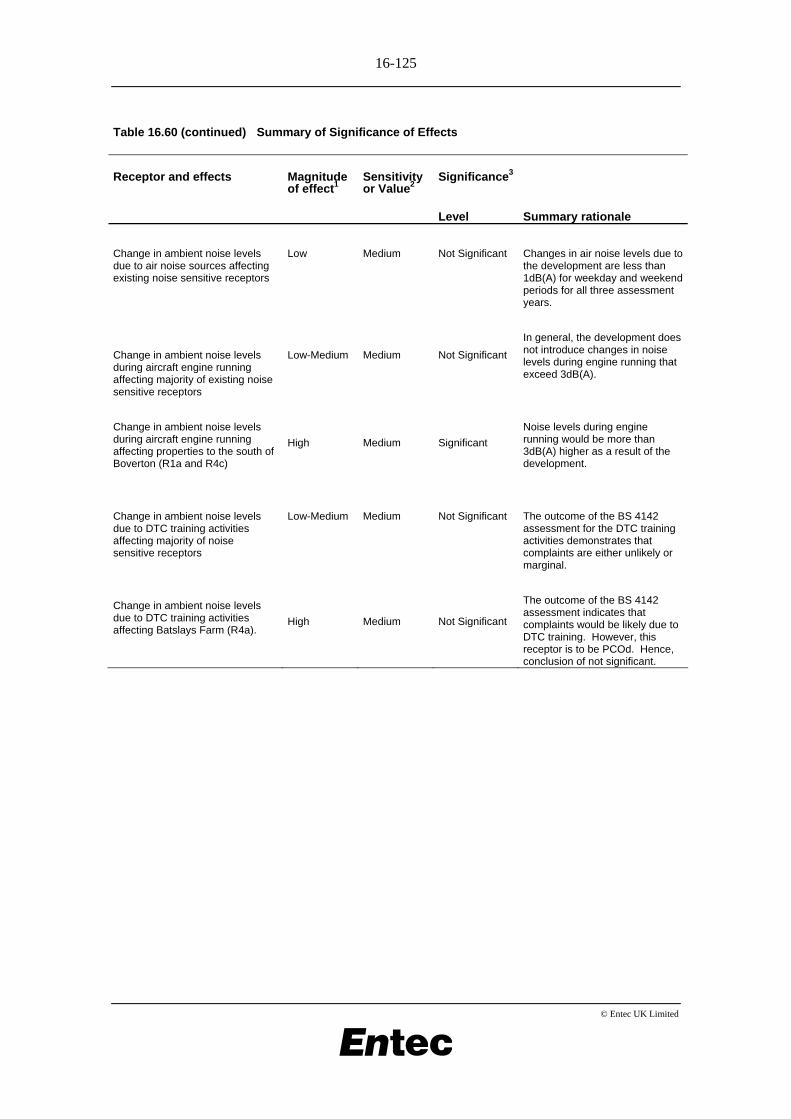
16-125
© Entec UK Limited
Table 16.60 (continued) Summary of Significance of Effects
Receptor and effects Magnitude of effect1
Sensitivity or Value2
Significance3
Level Summary rationale
Change in ambient noise levels due to air noise sources affecting existing noise sensitive receptors
Low
Medium
Not Significant
Changes in air noise levels due to the development are less than 1dB(A) for weekday and weekend periods for all three assessment years.
Change in ambient noise levels during aircraft engine running affecting majority of existing noise sensitive receptors Change in ambient noise levels during aircraft engine running affecting properties to the south of Boverton (R1a and R4c)
Low-Medium High
Medium Medium
Not Significant Significant
In general, the development does not introduce changes in noise levels during engine running that exceed 3dB(A). Noise levels during engine running would be more than 3dB(A) higher as a result of the development.
Change in ambient noise levels due to DTC training activities affecting majority of noise sensitive receptors Change in ambient noise levels due to DTC training activities affecting Batslays Farm (R4a).
Low-Medium High
Medium Medium
Not Significant Not Significant
The outcome of the BS 4142 assessment for the DTC training activities demonstrates that complaints are either unlikely or marginal. The outcome of the BS 4142 assessment indicates that complaints would be likely due to DTC training. However, this receptor is to be PCOd. Hence, conclusion of not significant.
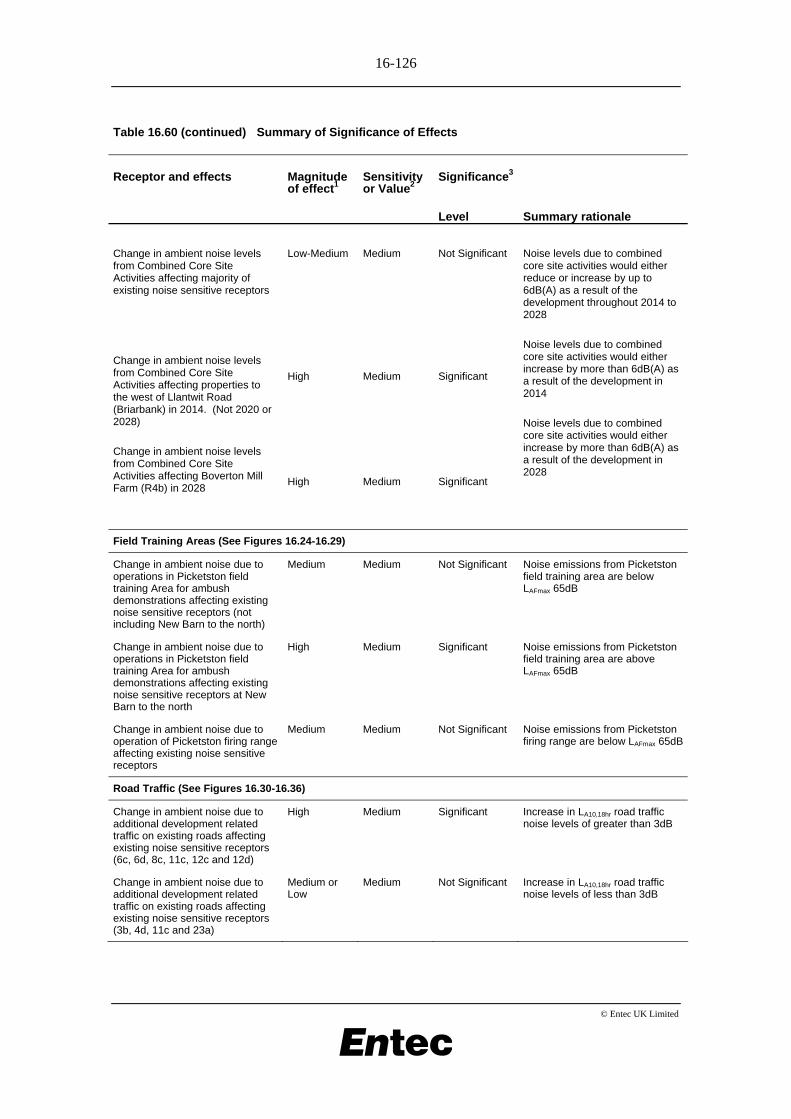
16-126
© Entec UK Limited
Table 16.60 (continued) Summary of Significance of Effects
Receptor and effects Magnitude of effect1
Sensitivity or Value2
Significance3
Level Summary rationale
Change in ambient noise levels from Combined Core Site Activities affecting majority of existing noise sensitive receptors Change in ambient noise levels from Combined Core Site Activities affecting properties to the west of Llantwit Road (Briarbank) in 2014. (Not 2020 or 2028) Change in ambient noise levels from Combined Core Site Activities affecting Boverton Mill Farm (R4b) in 2028
Low-Medium High High
Medium Medium Medium
Not Significant Significant Significant
Noise levels due to combined core site activities would either reduce or increase by up to 6dB(A) as a result of the development throughout 2014 to 2028 Noise levels due to combined core site activities would either increase by more than 6dB(A) as a result of the development in 2014 Noise levels due to combined core site activities would either increase by more than 6dB(A) as a result of the development in 2028
Field Training Areas (See Figures 16.24-16.29)
Change in ambient noise due to operations in Picketston field training Area for ambush demonstrations affecting existing noise sensitive receptors (not including New Barn to the north)
Medium Medium Not Significant Noise emissions from Picketston field training area are below LAFmax 65dB
Change in ambient noise due to operations in Picketston field training Area for ambush demonstrations affecting existing noise sensitive receptors at New Barn to the north
High Medium Significant Noise emissions from Picketston field training area are above LAFmax 65dB
Change in ambient noise due to operation of Picketston firing range affecting existing noise sensitive receptors
Medium Medium Not Significant Noise emissions from Picketston firing range are below LAFmax 65dB
Road Traffic (See Figures 16.30-16.36)
Change in ambient noise due to additional development related traffic on existing roads affecting existing noise sensitive receptors (6c, 6d, 8c, 11c, 12c and 12d)
High Medium Significant Increase in LA10,18hr road traffic noise levels of greater than 3dB
Change in ambient noise due to additional development related traffic on existing roads affecting existing noise sensitive receptors (3b, 4d, 11c and 23a)
Medium or Low
Medium Not Significant Increase in LA10,18hr road traffic noise levels of less than 3dB
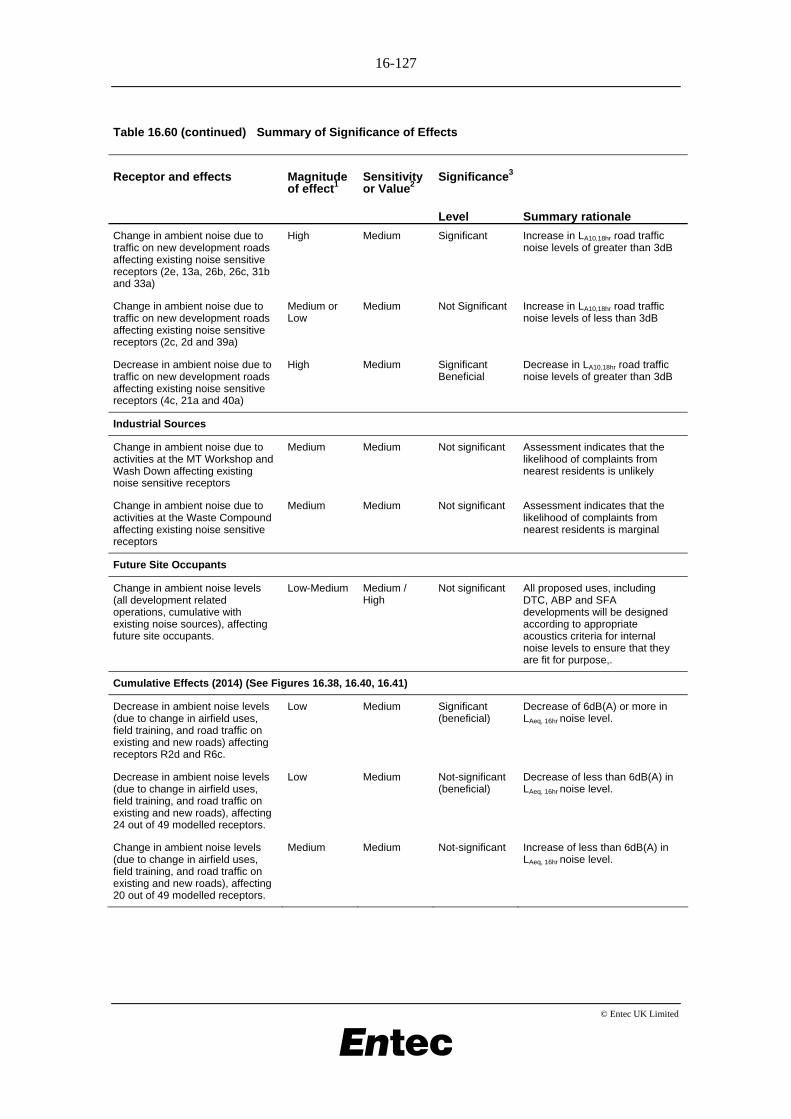
16-127
© Entec UK Limited
Table 16.60 (continued) Summary of Significance of Effects
Receptor and effects Magnitude of effect1
Sensitivity or Value2
Significance3
Level Summary rationale
Change in ambient noise due to traffic on new development roads affecting existing noise sensitive receptors (2e, 13a, 26b, 26c, 31b and 33a)
High Medium Significant Increase in LA10,18hr road traffic noise levels of greater than 3dB
Change in ambient noise due to traffic on new development roads affecting existing noise sensitive receptors (2c, 2d and 39a)
Medium or Low
Medium Not Significant Increase in LA10,18hr road traffic noise levels of less than 3dB
Decrease in ambient noise due to traffic on new development roads affecting existing noise sensitive receptors (4c, 21a and 40a)
High Medium Significant Beneficial
Decrease in LA10,18hr road traffic noise levels of greater than 3dB
Industrial Sources
Change in ambient noise due to activities at the MT Workshop and Wash Down affecting existing noise sensitive receptors
Medium Medium Not significant Assessment indicates that the likelihood of complaints from nearest residents is unlikely
Change in ambient noise due to activities at the Waste Compound affecting existing noise sensitive receptors
Medium Medium Not significant Assessment indicates that the likelihood of complaints from nearest residents is marginal
Future Site Occupants
Change in ambient noise levels (all development related operations, cumulative with existing noise sources), affecting future site occupants.
Low-Medium Medium / High
Not significant All proposed uses, including DTC, ABP and SFA developments will be designed according to appropriate acoustics criteria for internal noise levels to ensure that they are fit for purpose,.
Cumulative Effects (2014) (See Figures 16.38, 16.40, 16.41)
Decrease in ambient noise levels (due to change in airfield uses, field training, and road traffic on existing and new roads) affecting receptors R2d and R6c.
Low Medium Significant (beneficial)
Decrease of 6dB(A) or more in LAeq, 16hr noise level.
Decrease in ambient noise levels (due to change in airfield uses, field training, and road traffic on existing and new roads), affecting 24 out of 49 modelled receptors.
Low Medium Not-significant (beneficial)
Decrease of less than 6dB(A) in LAeq, 16hr noise level.
Change in ambient noise levels (due to change in airfield uses, field training, and road traffic on existing and new roads), affecting 20 out of 49 modelled receptors.
Medium Medium Not-significant Increase of less than 6dB(A) in LAeq, 16hr noise level.

16-128
© Entec UK Limited
Table 16.60 (continued) Summary of Significance of Effects
Receptor and effects Magnitude of effect1
Sensitivity or Value2
Significance3
Level Summary rationale
Change in ambient noise levels (due to change in airfield uses, field training, and road traffic on existing and new roads), affecting Broadway Nursing Home (R6d)
Low High Not-significant Increase of less than 3dB(A) in LAeq, 16hr noise level.
Change in ambient noise levels (due to change in airfield uses, field training, and road traffic), affecting receptors R5a, R12d, R26b, R31b.
High Medium Significant Increase of 6dB(A) or more in LAeq, 16hr noise level, OR
Increase of 3dB(A) or more, AND noise level increased to more than 55dB LAeq, 16hr.
Cumulative Effects (2028) (See Figures 16.39, 16.42, 16.43)
Decrease in ambient noise levels (due to change in airfield uses, field training, and road traffic on existing and new roads), affecting 10 out of 49 modelled receptors.
Low Medium Not-significant (beneficial)
Decrease of less than 6dB(A) in LAeq, 16hr noise level.
Change in ambient noise levels (due to change in airfield uses, field training, and road traffic on existing and new roads), affecting 28 out of 49 modelled receptors.
Medium Medium Not-significant Increase of less than 6dB(A) in LAeq, 16hr noise level.
Change in ambient noise levels (due to change in airfield uses, field training, and road traffic on existing and new roads), affecting Broadway Nursing Home (R6d)
High High Significant Increase of more than 6dB(A) in LAeq, 16hr noise level
Change in ambient noise levels (due to change in airfield uses, field training, and road traffic), affecting receptors R6c, R6d, R8a, R8c, R12a, R12d, R26b, R26c, R31b, R33a
High Medium Significant Increase of 6dB(A) or more in LAeq, 16hr noise level, or
Increase of 3dB(A) or more, AND noise level increased to more than 55dB LAeq, 16hr.
Key/footnotes:
1. [High, Medium, Low ]
2. [High, Medium, Low] 3. S = Significant NS = Not-significant
16.15.1 Implementation of Environmental Measures
Table 16.61 sets out the mitigation measures and proposals for compliance monitoring that have been incorporated into the scheme to mitigate the effects of noise. It also includes details of who would be responsible for the implementation of the measures, and the suggested mechanism of compliance to ensure that the proposals would be carried out as envisaged.

16-129
© Entec UK Limited
Table 16.61 Implementation of environmental measures
Environmental measure Responsibility for implementation
Compliance mechanism
Construction
Use of modern well maintained machinery in accordance with manufacturer’s instruction.
Contractor Construction Noise Management Plan
Key noise sources and stockpiles positioned to maximise barrier attenuation for nearest receptors.
Contractor Construction Noise Management Plan
Noise Management Plan to identify and actions to be taken in response to noise limit exceedances and/or complaints.
Contractor Construction Noise Management Plan
Maximisation of stand off distances between receptors and key items of plant.
Contractor Construction Noise Management Plan
Operations limited to weekday and Saturday daytime, with further restrictions on particularly noisy operations.
Contractor Construction Noise Management Plan
Core Site Activities
Construction of a 10m noise barrier to the north, south and east of the engine running facility.
Restrictions on engine running from the facility on a Sunday or at night
Metrix
Welsh Assembly Government / ABP
Integral to scheme
Operational EMP
Activities focussed on daytime hours MoD Operational EMP
Field Training Areas
No blank or live firing at night-time (2300-0700), where possible
MoD Operational EMP
Acoustic bunds for screening Picketston activities Metrix Integral to scheme
Blank firing only when necessary for demonstration purposes. Routine drills will not include firing.
MoD Operational EMP
Completely enclosed firing range for screening noise from firearms.
Metrix Integral to scheme
3m high acoustic fence between FTA and Picketston boundary
Metrix Integral to scheme
No firing or use of thunder flashes will occur on Castleton External FTA. This area will be used for non noise generating activities only, such as camping, crawling, running, hiding, driving, etc.
MoD Operational EMP
Road Traffic
1m high bund to west of proposed Northern Access Road, adjacent to Millands Farm.
Metrix Integral to scheme
Industrial Sources
Plant complement and building envelope designed to not exceed night-time background levels at the nearest residential receptor.
Metrix Integral to scheme
All mechanical services will be designed to ensure emissions are at least 5dB(A) below background measured at nearest sensitive receptor.
Metrix Integral to scheme
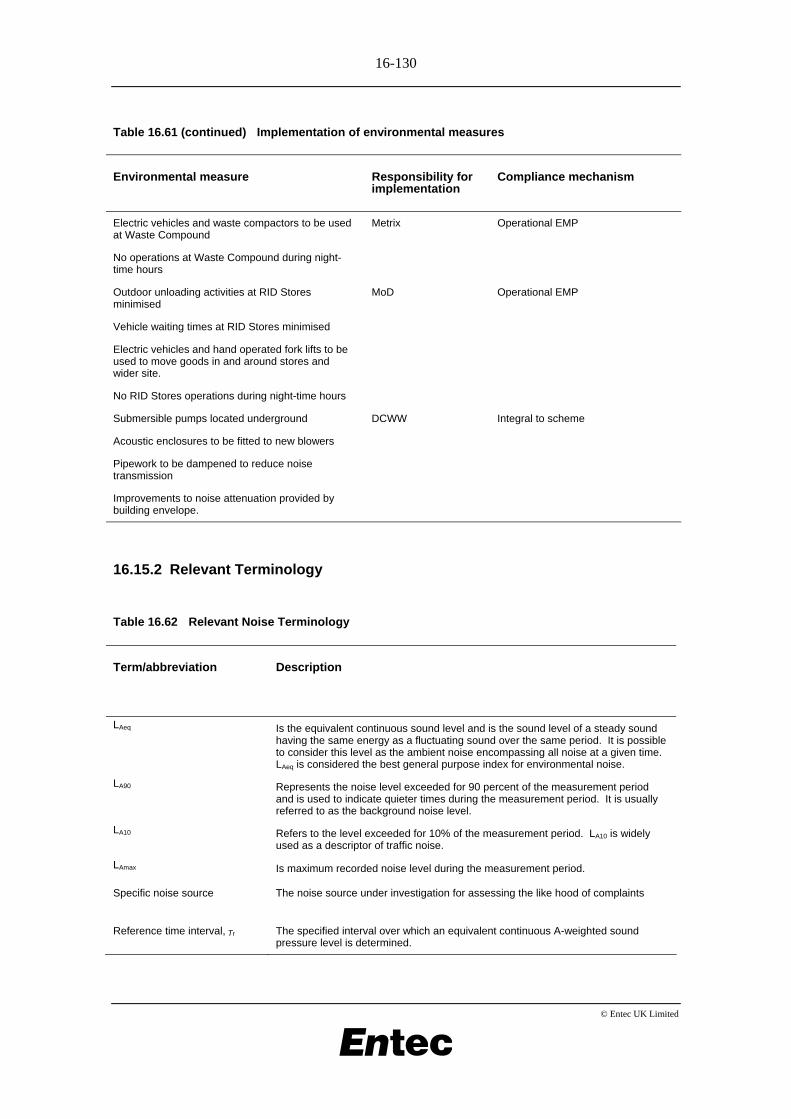
16-130
© Entec UK Limited
Table 16.61 (continued) Implementation of environmental measures
Environmental measure Responsibility for implementation
Compliance mechanism
Electric vehicles and waste compactors to be used at Waste Compound
No operations at Waste Compound during night-time hours
Metrix Operational EMP
Outdoor unloading activities at RID Stores minimised
Vehicle waiting times at RID Stores minimised
Electric vehicles and hand operated fork lifts to be used to move goods in and around stores and wider site.
No RID Stores operations during night-time hours
MoD Operational EMP
Submersible pumps located underground
Acoustic enclosures to be fitted to new blowers
Pipework to be dampened to reduce noise transmission
Improvements to noise attenuation provided by building envelope.
DCWW Integral to scheme
16.15.2 Relevant Terminology
Table 16.62 Relevant Noise Terminology
Term/abbreviation Description
LAeq Is the equivalent continuous sound level and is the sound level of a steady sound having the same energy as a fluctuating sound over the same period. It is possible to consider this level as the ambient noise encompassing all noise at a given time. LAeq is considered the best general purpose index for environmental noise.
LA90 Represents the noise level exceeded for 90 percent of the measurement period and is used to indicate quieter times during the measurement period. It is usually referred to as the background noise level.
LA10 Refers to the level exceeded for 10% of the measurement period. LA10 is widely used as a descriptor of traffic noise.
LAmax Is maximum recorded noise level during the measurement period.
Specific noise source The noise source under investigation for assessing the like hood of complaints
Reference time interval, Tr The specified interval over which an equivalent continuous A-weighted sound pressure level is determined.
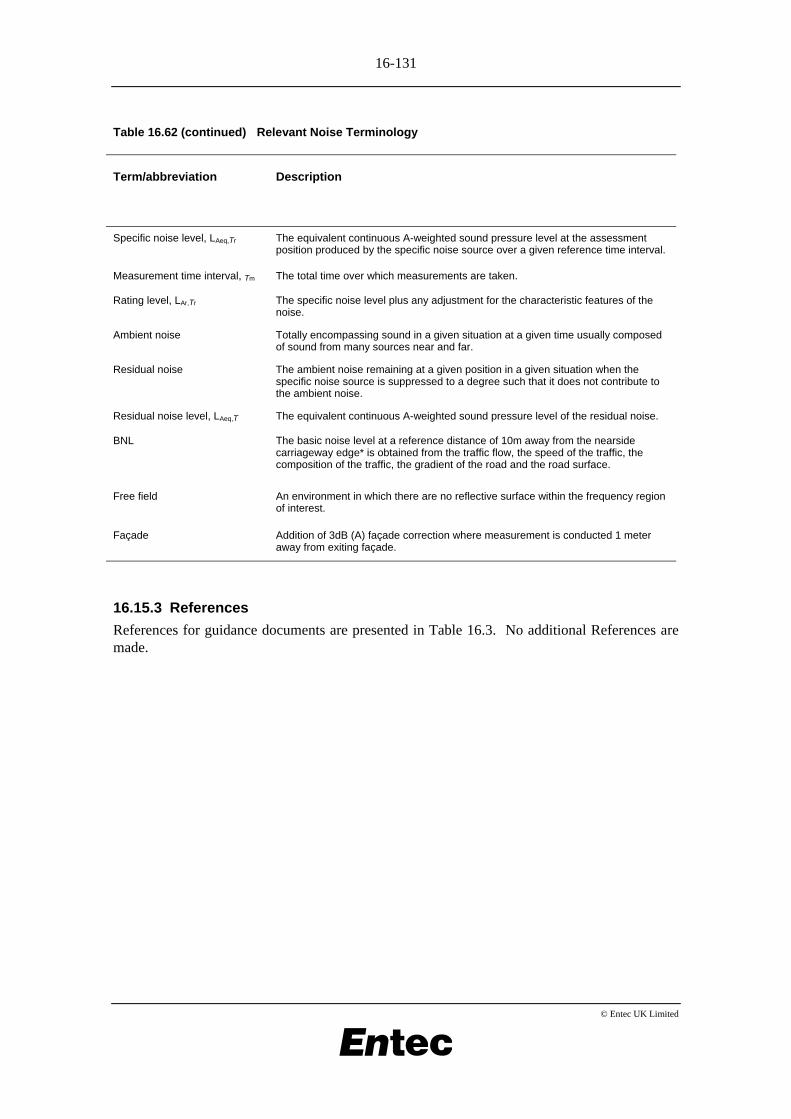
16-131
© Entec UK Limited
Table 16.62 (continued) Relevant Noise Terminology
Term/abbreviation Description
Specific noise level, LAeq,Tr The equivalent continuous A-weighted sound pressure level at the assessment position produced by the specific noise source over a given reference time interval.
Measurement time interval, Tm The total time over which measurements are taken.
Rating level, LAr,Tr The specific noise level plus any adjustment for the characteristic features of the noise.
Ambient noise Totally encompassing sound in a given situation at a given time usually composed of sound from many sources near and far.
Residual noise The ambient noise remaining at a given position in a given situation when the specific noise source is suppressed to a degree such that it does not contribute to the ambient noise.
Residual noise level, LAeq,T The equivalent continuous A-weighted sound pressure level of the residual noise.
BNL The basic noise level at a reference distance of 10m away from the nearside carriageway edge* is obtained from the traffic flow, the speed of the traffic, the composition of the traffic, the gradient of the road and the road surface.
Free field An environment in which there are no reflective surface within the frequency region of interest.
Façade Addition of 3dB (A) façade correction where measurement is conducted 1 meter away from exiting façade.
16.15.3 References
References for guidance documents are presented in Table 16.3. No additional References are made.