
On the X-ray spectra of luminous, inhomogeneous accretion ...
Upload
khangminh22Category
view
3download
0
Shipley, T.H., Ogawa, Y., Blum, P., and Bahr, J.M. (Eds.), 1997Proceedings of the Ocean Drilling Program, Scientific Results, Vol. 156
14. ANALYSIS OF NATURAL GAMMA-RAY SPECTRA OBTAINED FROM SEDIMENT CORESWITH THE SHIPBOARD SCINTILLATION DETECTOR OF THE OCEAN DRILLING PROGRAM:
EXAMPLE FROM LEG 1561
Peter Blum,2 Alain Rabaute,3 Pierre Gaudon,4 and James F. Allan2
ABSTRACT
Natural gamma-ray (NGR) spectrometry allows estimation of the elemental concentrations of K, U, and Th, which can beused to help interpret sediment composition, provenance, and diagenesis. Spectral data obtained with the NGR multichanneldevice installed on the Ocean Drilling Program’s multisensor track in 1993 are presented here for the first time. The spectrawere divided into 16 energy intervals using a minima search algorithm that defined all peaks observed in 79 sample NGR spec-tra. The intervals were further subdivided into peak area and background area segments using a peak baseline algorithm, whichallows optimal assessment of the usefulness of spectral segments to estimate elemental abundance. Linear regression with lab-oratory (X-ray diffraction, inductively coupled plasma-mass spectrometry, and instrumental neutron activation analyses) datawas used to estimate elemental concentrations of K, U, and Th for each spectral segment. Conservative estimation errors for thebest estimator spectral segments are 16%, 30%, and 20% for K, U, and Th, respectively. These errors also reflect analyticalerrors of the reference data, and the true estimation error may be significantly smaller. Our method suggests that the best K esti-mates (± 16%) are obtained using the peak area segment between 1335 and 1580 KeV. In our study, which uses 4-hr countingtimes, the best U and Th estimates are obtained using peak areas between 1695 and 1885 KeV and 550 and 700 KeV, respec-tively. If low counting times are used for routine core logging, however, regressions using the total counts of the entire spec-trum yield more reliable U and Th estimates because of Poisson’s law, with maximum total errors of about 35% and 23%,respectively. Spectral analysis using 2048-channel data has no advantage over 256-channel analyses, even with the extremelyhigh counting times used for our study. The full character of natural gamma-ray spectra, as revealed by scintillation detectors,can be defined and measured in full detail with 16 energy intervals.
etni
pt,ht1
n fw
rgyuced toeo-
nneldataac-erg-a set,n al-
sion
if-dia-ure- un-
inedlysisro-pro-
it- Th,
Rpedrac-
prisenlyg er-d ap-s to
INTRODUCTION
Natural gamma radiation of geological formations has been mea-sured by well logging for more than half a century (Serra, 1984). Pri-or to the 1980s, the total number of counts detected were mostly usedas an indicator of “shaliness”. In the 1970s, natural gamma-ray strometers were introduced to well-logging and airborne surveys (Grasty, 1975; Marett et al., 1976; Serra et al., 1980; Mathis e1984). Natural gamma-ray (NGR) spectrometry allows estimatioelemental concentrations of potassium, uranium, and thorthrough the gamma emission of their radioactive isotopes 40K, the238U series, and the 232Th series. These most important “primevanatural gamma-ray emitters are at secular equilibrium with their ent elements (i.e., radiation at characteristic energies is constantime; Adams and Gaspirini, 1970). The relative abundance of Kand Th estimated from well-logging data has been shown to characterize clay type and abundance, depositional environmendiagenetic processes in sediments (Serra et al., 1980; Serra, 1986).
Because NGR spectrometry provides rapid, continuous, and ipensive lithological parameters in geological formation testing,explored its adaptation to the routine continuous core logging oOcean Drilling Program (ODP). An NGR measurement device installed by the ODP on the JOIDES Resolution in 1993 as part of the
1Shipley, T.H., Ogawa, Y., Blum, P., and Bahr, J.M. (Eds.), 1997. Proc. ODP, Sci.Results, 156: College Station, TX (Ocean Drilling Program).
2Ocean Drilling Program, Texas A&M University, College Station, TX 77845,U.S.A. [email protected]
3I.S.T.E.E.M, Laboratoire de Géochimie Isotopique, UMR 5567-CNRS, CC 0Université Montpellier II, Place E. Bataillon, 34095 Montpellier Cedex 5, France.
4Ecole Nationale Superieure des Mines et Techniques Industrielles, LaboraP3MG, 16 Avenue de Clavieres, 30319 Ales Cedex, France.
3UHYLRXV�&KDSWHU3UHYLRXV�&KDSWHU 7DEOH�RI�&7DEOH�RI�&
pec-.g.,
al., ofum
l”ar-
with U,elp
, and984,
ex-we theas
multisensor track (MST) for continuous core logging. General enecalibration, measurement, and correction procedures were introdby Hoppie et al. (1994). The original intent for the instrument wasmeasure total counts to aid correlation of core and downhole gphysical data. However, the device is equipped with a 2048-chamultichannel analyzer and adequate software to allow spectral acquisition. ODP had introduced the five-window spectral data quisition used by its downhole measurement contractor, Schlumber Services, to provide the scientists with a standard spectral datbut no absolute calibration standards, model spectra, or estimatiogorithms exist to estimate elemental concentrations.
NGR spectra of rocks and soils are composed of one emispeak of 40K, more than a dozen emission peaks of the 238U series(mainly 214Bi), a similar number of 232Th peaks (208Tl, 228Ac), and totalbackground. Total background originates from two completely dferent sources. Zero-background is the combination of cosmic ration, impurities in detector crystal, and contamination in the measment system (e.g., soil deposits inside the lead shielding), and isrelated to the composition of the measured material. It is determseparately and removed from core spectra before spectral ana(Figs. 1, 2). What we will refer to as background from here on is pduced by Compton scattering, photoelectric absorption, and pair duction related to the abundance and distribution of primeval emters, as well as by low-intensity, discrete emission peaks of U andwhich disappear in the scatter.
Background, as well as limited detector efficiency degrade NGspectra; only a few peaks are discernible as individual bell-shapeak areas above background (Figs. 1, 2). In fact, the main, chateristic peaks above background for the three elements only coma few percent of the total counts of the entire spectrum. Using othese characteristic peaks may result in severe statistical countinrors at reasonable counting times. Therefore, the common methoplied by commercial well-logging services and airborne surveys i
66,
toire
183RQWHQWVRQWHQWV 1H[W�&KDSWHU1H[W�&KDSWHU

P. BLUM, A. RABAUTE, P. GAUDON, J.F. ALLAN
wa-fer-gherpec-adi-ctrumore
accu-lim-cut waswere in- and
s ammr
include background in a simple three-standard calibration procedureunder the assumptions that background in a given energy interval var-ies linearly with the abundance of the three elements, and that this re-lationship holds for all element distributions encountered. Elementalconcentrations are then estimated using the method of weighted leastsquares, where the counts vector is the product of the sensitivity ma-trix and the concentration vector. The International Atomic EnergyAgency (1976) suggests that K, U, and Th concentrations are calcu-lated from counts in three discrete windows defined narrowly aroundthe three main characteristic peaks (Fig. 2). The natural gamma-rayspectrometry (NGS) tool of Schlumberger Services uses five win-dows that form a continuous spectrum from 0.2 to 3.0 MeV (Serra etal., 1980) and has recently begun to acquire 256-channel spectra.
Intensity(counts/channel)
Energy
Zero-background-corrected spectrum
Window Wi
Intensity(counts/channel)
Energy interval Ii
Window Wi+1
Calculated minimum
Peak baseline
Selectedwindowboundary
A
B
Peak boundary
Background area Bi
Peak area Pi
Energy
C
Intensity(counts/channel)
Energy
Measured zero-background
Measured counts
Figure 1. Schematic portion of a natural gamma-ray (NGR) spectrum illus-trating the peak definition procedure. A. Zero-background, including cosmicradiation, impurities in sensor, and contamination in measurement area, ismeasured separately and subtracted from measured counts of sample spectra.B. In the zero-background–corrected spectrum, window boundarieselected near energies of characteristic peaks identified from typical sspectra. Minima are then calculated within each window for each saspectrum. C. Peak baseline is defined by two adjacent minima and sepathe integrated count area into peak area and background area.
184
Mathis et al. (1984) presented a window stripping and calibrationstudy for the spectral gamma-ray (SGR) tool of Gearhart Services,which is based on 256 channels and provides either a routine three-window analysis or the raw spectra to the customer. For all thesetools, elemental abundance is calculated using a sensitivity matrixobtained from segments of known concentrations of K, U, and Th ina calibration well.
Because the ODP system is not equipped with absolute calibrationstandards, we extracted core samples from the intervals measuredwith the ODP NGR device and determined reference concentrationsin shore laboratories. We used linear regression to evaluate particularsegments of the spectrum for their significance as elemental concen-tration estimators. The NGR spectra were measured for 4 hr to mini-mize counting errors, which was possible during Leg 156 becausemost of the time was expended for extensive downhole operationsrather than for coring, allowing us to run an unusual number of ded-icated NGR spectral measurements on idle instrumentation.
METHODS
Shipboard Natural Gamma-ray Measurements
During Leg 156, we acquired 79 natural gamma-ray spectra, 53from Hole 948C and 26 from Hole 949B, using the shipboard NGRdevice and a commercial multichannel data acquisition program. TheNGR system and its use are described in Hoppie et al. (1994). TheNGR counts are detected and amplified by four 3 × 3 in, cylindrical,doped sodium iodide (NaI) scintillators and photomultiplier tubesthat are arranged orthogonally around the measurement area and arecollected by a 2048-channel analyzer. The energy spectrum was cal-ibrated once at the beginning of the measurements, which extendedover about four weeks, using K and Th. This calibration providescharacteristic peaks at known energies for certain channel numbers.It does not quantify the spectra in terms of elemental concentrations,a task that would require about 0.5-m-long standards of ODP core ge-ometry composed of homogenous mixtures of known elemental con-centrations. We preferred K and Th over existing europium (Eu) cal-ibration standards, because they provided the best possible linear cal-ibration over the energy range that best represents the elements K, U,and Th. The calibration coefficients from the two-point linear rela-tionship were applied to all spectra. Drift was negligible for our anal-ysis, as discussed later. We counted split-core sections for 4 hr tominimize statistical counting errors. We could not measure unsplitcores, because our measurements would have severely delayed coresplitting, description, and routine split-core measurements. We as-sume that the same results would have been obtained by measuringunsplit cores for 2 hr.
The zero-background was established by measuring air and pure-water spectra for 4 hr. In the first case, nothing was put into the sys-tem at all, whereas in the second case, we placed a core liner filledwith pure water into the sensor’s measurement area. The air andter spectra resemble each other closely, with no discernible difence in the high-energy half of the spectrum, and somewhat hicounts for the air measurements in the low-energy part of the strum. The slight difference is probably due to increased cosmic ration in the air measurements. We chose to use the average speof six water measurements, because they intuitively represent mclosely the zero background during core measurements.
Elemental Analysis
Elemental analyses were conducted on 79 core samples that rately represent the core intervals measured with the NGR. To einate potential sampling error caused by lithologic variation, we thin, 20-cm-long core samples centered at the core depth, whichin the center of the NGR measurement area. The core samples dried, crushed, and split for X-ray fluorescence (XRF) analyses,ductively coupled plasma-mass spectrometer (ICP-MS) analysis,
areple
pleates

NATURAL GAMMA-RAY SPECTRA
0
100
200
300
400
0 500 1000 1500 2000 2500 3000
Calculated peak baselineMeasured zero-background Measured countsSmoothed, corrected countsCalculated minima
Cou
nts/
chan
nel
Energy (KeV)
22
8 Ac
(912
and
966
KeV
)
21
4 Bi (
1120
KeV
)
21
4 Bi (
1764
KeV
)
20
8 Tl (
2615
KeV
)
A
20
8 Tl (
584
KeV
)2
14 B
i (61
0 K
eV)
Interval4
0K
(14
60 K
eV)
2 3 4 5 6 9 1 1 1 4 1 5 1 60 1 2 1 371 8 1 01 2 W3 W4 W5 W6 W108 9 W11 W12 W14 W15 1 6 1 7W0 W13W7
IAEA 1 IAEA 2 IAEA 3
SCHLUM 1 SCHLUM 2 SCHLUM 3 SCHLUM 4 SCHLUM 5
0
10
20
0
1000
2000
3000
0 500 1000 1500 2000 2500 3000
Calculated peak baselineMeasured zero-backgroundMeasured countsSmoothed, corrected countsCalculated minima
Cou
nts/
chan
nel
Energy (KeV)
20
8 Tl (
584
KeV
)2
14 B
i (61
0 K
eV)
22
8 Ac
(912
and
966
KeV
)
21
4 Bi (
1120
KeV
)
21
4 Bi (
1764
KeV
)
20
8 Tl (
2615
KeV
)
B
2 3 4 5 6 9 1 1 1 4 1 51 60 1 2 1 371 8 1 01 2 W3 W4 W5 W6 W108 9 W11 W12 W14 W15 1 6 1 7W0 W13W7
20
8 Tl (
584
KeV
)2
14 B
i (61
0 K
eV)
Interval
IAEA 1 IAEA 2 IAEA 3
SCHLUM 1 SCHLUM 2 SCHLUM 3 SCHLUM 4 SCHLUM 5
40
K (
1460
KeV
)
0
50
100
150
Figure 2. Example spectrum from Hole 948C sample. Insets are enlarged illustrations of the high-energy, low-count part of the spectrum, horizontal scale andpositioning is the same as in main plot. Windows W0 to W17 are selected windows for minima calculations, and intervals 0 to 16 are defined by calculated min-ima (see Fig. 1). Shaded areas are peak areas. Schlum = Schlumberger Services. IAEA = International Atomic Energy Agency. A. 2048-channel data set. Boldline is 30-point smoothed, zero-background corrected. B. Same data as (A) with 256-channel resolution. Bold line is 3-point smoothed, zero-background cor-rected.
185

P. BLUM, A. RABAUTE, P. GAUDON, J.F. ALLAN
ta
eo
fem rh
t w r spot.c
e o
t
G2
aas
Cn
at
W
n
eetieio
orvi- isisys-
useP-yem-t-sy
c-n-o-nds, in-nsa-er-eshess
s.
a-Fig.
instrumental neutron activation analyses (INAA). Precision and ac-curacy are estimated from repeated standard measurements. Preci-sion is expressed as the ratio of the first standard deviation of multiplemeasurements to their mean, in percentage, and represents the ran-dom (instrumental) measurement error. Accuracy is expressed as theratio of the difference between measured mean and known (or accept-ed) value for the standard to the known value, in percentage (Table1). This error may be random or biased, and originate either from theinstrument or from the composition of the particular material mea-sured. A conservative estimate of the total analytical error is the sumof errors due to precision and accuracy.
XRF analyses were carried out at the Ecole Nationale Superieuredes Mines et Techniques Industrielles in Alès, France, on fusion busing a lithium tetraborate + lanthanium oxide flux (0.750 mg samper 6 g flux) to give the concentrations of the 10 major oxides: CSiO2, Al2O3, Fe2O3, K2O, TiO2, MgO, MnO, Na2O, P2O5. We are onlypresenting the K2O data in this study. Replicate analyses of rock sdards show that precision of the major element data is 0.5%–2.5%accuracy is better than 1% for most elements, including K (Tabl
ICP-MS was conducted at the Laboratoire de Géochimie Ispique at the University of Montpellier II, France, for U and Th reence concentrations. One-hundred milligrams of powdered sawere dissolved in a 15-mL autoclavable Teflon threaded screwjar by repeated dissolution/evaporation with perchloric and fluodric acids in an oven. The samples were subsequently wetteddistilled water and dissolved in 1.5 mL of 65% HNO3 solution. Aftercomplete dissolution, the sample was transferred into a 20.6 g sjar with a threaded screw cap, and the jar was filled with distilledter. A 10-ppb In-Bi internal calibration standard was added to 10of this solution prior to ionization by the plasma source and detenation of elemental concentrations by the mass spectrometer.samples could not be dissolved completely because of the preof organic carbon and application of an unsuitable dissolution cess. The data for these samples are omitted in our analyses. Frmultiple standard measurements, precision was determined aand 3%, and accuracy at 3% and 7% for U and Th, respectively
INAA were conducted using a TRIGA reactor and counting faities at the Center for Chemical Characterization at Texas A&M Uversity. Fifty-milligram samples were irradiated for 14 hr and coued for 6 hr after decay periods of 9–12 and 40–43 days, using gnium detectors. Spectral analysis was made using a nuclearprogram and was supplemented with manual U- and Th-series lap and interference corrections. A total of 12 samples of the intetional AGV-1 standard were irradiated at multiple levels within specimen holder during three runs, and were subsequently couPrecision was 11% and 2% for U and Th, respectively. Mean A1 values deviate from the accepted values of Gladney et al. (199+9% and −1% for U and Th, respectively (Table 1).
All results are plotted as a function of depth in Figure 3. All U Th results from ICP-MS and INAA are plotted in Figure 4, illustring the degree of correlation between ICP-MS and INAA analyThe fitted regression line is the reduced major axis (RMA; T1974), which minimizes the product of the deviations in the x (IMS) and y (INAA) directions, without regarding the results of oanalyses as a function of the other. In effect, this minimizes the of the triangles formed by the data points and the fitted RMA, rathan the deviations in y (or x) direction.
Analytical data from Hole 948C specimens correlate relativwell, whereas Hole 949B data exhibit a considerable misfit. therefore used only Hole 948C data for our NGR analysis. Howeeven in Hole 948C data, deviation from the RMA (or the diagooften exceeds the analytical precision range (error bars in Figwhich effectively means that the total analytical error of one orother (or both) data sets is considerably larger. Part of the differis lack of accuracy, which we did not attempt to correct the referfor. Instead, we estimate a maximum uncertainty from the deviabetween values from both measurement methods. Absolute dtions for each data pair (∆U or ∆Th; Table 2) are expressed as rat
186
eadspleaO,
n-, and 1).to-r-ple
capy-
with
erilea-
mLmi-Twoencero-m the 4%
il-ni-nt-rma-dataver-rna-hented.V-) by
ndt-es.ill,P-e
reasher
elye
ver,al). 4),thencenceonsvia-s
of the average values of the pair (UAVERAGE or ThAVERAGE; Table 2).Mean and standard deviation of these ratios are listed in Table 2. FHole 948C data, the uncertainty for U is at least 13% (mean of deations). If the standard error of deviations is added, the uncertainty21%. For Th, the uncertainty is 7%, or up to 12% if standard error added. These numbers are maximum error estimates that include stematic bias and variance of both analytical data sets. We chose toonly the data set with the smaller reported analytical error (i.e., ICMS data for U and INAA data for Th) and therefore the uncertaintof the reference data tends to be smaller. As an example, the systatic bias between U data from ICP-MS and INAA analyses, illustraed by the perfectly parallel offset of the RMA (Fig. 4A) and perhapexplained by the 9% relative overestimate of U concentrations bINAA (Table 2), is eliminated when using ICP-MS data only.
Analysis and Calibration of NGR Spectra
Our primary goal was to evaluate successive intervals of the spetra for their average information content in terms of elemental cocentrations. The first part of the process comprised definition of ptentially useful energy intervals and spectral segments (Figs. 1, 2) aevaluation of their properties from our sample spectra (averagevariances, ranges, etc.; Table 3). The second part of the processvolved linear regression of the reference elemental concentratiowith the counts of defined spectral segments. The following pargraphs describe the steps in more detail. All computations were pformed with custom scripts and macros as well as available routinof a commercial plotting program. The data were processed for tfull 2048-channel resolution (~1.5-KeV energy resolution) as well aa 256-channel resolution (~11.7-KeV energy resolution), which wasimulated by binning the data before carrying out the computation
1. Zero-background correction. An average zero-backgroundspectrum that was obtained from six, 2048-channel water core mesurements was subtracted from all 2048-channel sample spectra (1A).
2. Smoothing zero-background–corrected spectra. After severaltrials with different smoothing parameters, 30-point smoothing wasselected for the 2048-channel spectra, and 3-point smoothing for the256-channel spectra. These values appeared to optimally removespurious fluctuations thought to be the result of counting statistics,while preserving as much spectral information as possible.
3. Finding minima for interval boundary definition. Energy inter-vals associated with peaks are best defined by adjacent minima in thespectra. Minima are easily found by a computer if the spectral win-dow for the search is defined. Visual examination of sample spectrarevealed that fixed-window boundaries could be set near the ten mostdominant peaks (Fig. 1B). A few iterations of calculating and plottingminima showed that some potentially useful peaks were not deter-mined optimally. The window selection was therefore refined and re-sulted in 17 windows between 200 and 3000 KeV (first two columnsin Table 2; W1 to W17 in bar at bottom of plots in Fig. 2). Some ofthese are relatively narrow to accurately target particular peak inter-vals (e.g., windows W7, W8, and W9 between main peaks of the Kand U). The minima found within these windows defined 16 energyintervals. The additional interval 0 spans between the lowermost,fixed limit at 200 KeV and the first calculated minimum.
4. Calculating peak baseline. The peak baseline separates the en-ergy interval into two segments, the peak area and the backgroundarea (Fig. 1C). The peak baseline between adjacent minima is definedby the linear equation
y = A + Bx, (1)
where y is the number of background counts at energy x, and the co-efficients A and B define the baseline in each energy interval.
Based on the assumption that the combined baseline curve of ad-jacent intervals should be rather smooth and continuous, we decided

NATURAL GAMMA-RAY SPECTRA
Table 1. Laboratory analyses of potassium, uranium, and thorium.
XRFK2O(%)
ICP-MS INAA
Core, section,interval (cm)
Depth(mbsf)
U(ppm)
Th(ppm)
U(ppm)
Th(ppm)
156-948C-2X-1, 65−85 421.45 2.87 1.87 11.61 1.99 12.212X-3, 65−85 424.45 2.20 1.58 7.79 1.59 8.292X-5, 65−85 427.45 2.84 2.06 11.85 2.74 12.693X-1, 65−85 431.15 2.38 1.71 9.02 1.97 10.523X-3, 65−85 434.15 2.40 1.89 8.97 2.16 9.23 3X-5, 65−85 437.15 2.19 ? ? 2.41 10.744X-1, 65−85 440.75 2.49 ? ? 1.96 12.184X-3, 65−85 443.75 2.11 1.28 9.56 1.63 9.704X-5, 65−85 446.75 2.34 1.54 11.45 1.72 12.215X-1, 65−85 450.45 2.20 1.49 9.53 1.62 10.605X-3, 65−85 453.45 1.86 1.29 8.86 1.46 8.885X-5, 65−85 456.45 1.62 1.35 7.55 1.43 8.116X-1, 65−85 460.05 1.97 1.44 8.40 1.69 8.926X-3, 65−85 463.05 2.00 1.60 9.48 1.93 10.307X-1, 65−85 469.65 1.63 1.03 6.20 1.36 6.667X-3, 65−85 472.65 2.00 1.18 7.50 1.34 8.767X-5, 65−85 475.65 1.55 0.95 5.29 1.33 6.178X-1, 65−85 479.35 1.74 1.38 7.83 1.47 8.818X-3, 65−85 482.35 1.15 1.10 4.65 1.12 4.848X-5, 65−85 485.35 1.53 1.22 6.91 1.34 7.439X-1, 65−85 489.05 0.81 1.00 3.88 0.92 4.009X-3, 65−85 492.05 1.13 1.68 5.07 2.06 5.149X-5, 65−85 495.05 1.39 1.46 8.00 1.90 9.2010X-1, 65−85 498.75 1.33 1.61 8.41 1.81 8.8710X-3, 65−85 501.75 1.55 1.80 10.40 2.33 11.2510X-5, 65−85 504.15 1.47 1.76 10.28 2.19 11.3011X-1, 65−85 508.35 1.23 1.39 9.90 1.53 10.4311X-3, 65−85 511.35 1.80 2.24 17.71 2.42 17.3711X-5, 93−113 514.63 2.12 2.14 14.64 2.22 15.3712X-1, 65−85 518.05 2.37 2.01 14.60 2.84 14.8012X-3, 65−85 521.05 2.20 2.67 14.87 2.67 13.8912X-5, 65−85 524.05 2.74 4.72 12.88 6.13 13.2013X-1, 65−85 527.45 2.59 2.89 13.89 3.28 14.2813X-3, 95−115 530.75 1.46 5.69 13.82 4.83 11.2613X-5, 65−85 533.45 2.50 3.12 13.89 3.29 13.4914X-1, 65−85 536.75 2.66 2.56 14.90 2.83 15.6014X-3, 65−85 539.75 2.88 2.12 16.62 2.47 17.6214X-5, 65−85 542.75 2.46 3.43 14.28 3.84 15.1015X-1, 65−85 546.05 1.66 1.79 14.63 2.06 15.4815X-3, 65−85 549.05 1.93 3.35 15.78 3.42 14.0415X-5, 65−85 552.05 2.54 1.47 14.29 1.71 14.7616X-1, 65−85 555.45 2.30 2.10 15.23 2.22 16.7016X-3, 65−85 558.45 1.88 1.59 16.34 1.81 16.1316X-5, 65−85 561.45 1.17 3.27 9.39 3.70 9.8917X-1, 65−85 564.75 3.24 2.33 16.91 2.46 18.0117X-3, 65−85 567.75 2.98 2.11 14.85 2.35 15.6017X-5, 65−85 570.75 2.49 3.06 15.00 3.32 13.8518X-1, 65−85 573.95 1.94 4.69 18.63 4.35 15.2018X-3, 65−85 576.95 1.49 2.12 12.31 2.03 12.3818X-5, 65−85 579.95 2.71 2.45 16.45 2.86 17.3619X-1, 65−85 583.45 1.96 1.63 14.01 1.80 14.8819X-3, 65−85 586.45 3.02 2.81 17.19 3.34 16.0119X-5, 65−85 589.45 2.03 2.36 13.62 2.50 14.17
156-949B-2X-4, 65−85 259.05 2.57 1.58 11.48 1.71 12.083X-1, 65−85 264.25 1.82 1.51 3.41 2.24 8.033X-3, 65−85 267.25 1.98 1.42 8.83 1.51 9.853X-6, 75−95 271.85 1.99 1.35 8.01 1.79 8.384X-1, 55−75 273.75 1.99 1.36 8.23 1.37 8.515X-1, 65−85 283.55 1.91 1.19 7.31 1.46 8.095X-3, 65−85 286.55 1.91 1.59 10.69 1.59 11.325X-5, 65−85 289.55 1.79 1.24 7.82 1.19 8.867X-1, 65−85 302.85 1.65 2.26 16.53 1.51 10.897X-3, 65−85 305.85 2.48 2.07 15.14 1.79 12.397X-5, 65−85 308.85 1.93 1.70 12.34 1.63 11.4913X-2, 65−85 352.45 2.35 1.64 11.46 1.48 11.4714X-2, 90−110 357.40 2.18 2.17 15.41 1.86 10.2614X-3, 70−90 358.70 1.96 3.08 8.19 3.36 8.7614X-5, 60−80 361.60 2.21 1.58 10.09 1.80 10.5815X-2, 55−75 362.05 2.24 1.55 10.27 1.50 11.2115X-4, 65−85 365.15 2.28 1.53 8.16 1.42 10.0915X-6, 80−100 368.30 2.30 1.42 8.56 1.93 9.4019X-1, 100−120 399.90 1.55 1.59 9.85 1.68 10.8819X-4, 15−35 403.05 1.44 2.20 8.94 2.53 9.5022X-1, 65−85 428.15 2.17 1.92 3.89 2.32 16.0822X-3, 55−75 431.05 2.22 4.50 23.00 3.87 15.8722X-5, 65−85 434.15 2.39 4.28 14.49 4.68 13.1925H-1, 56−66 459.06 3.12 2.76 19.79 2.11 14.8925H-1, 82−102 459.32 2.98 3.91 18.85 3.43 16.1225H-2, 53−73 460.53 0.73 9.01 18.24 6.35 12.25
Analytical precision: ±2% ±4% ±3% ±11% ±2%Accuracy: 1% 3% 7% +9% −1%
187

P. BLUM, A. RABAUTE, P. GAUDON, J.F. ALLAN
1.0
2.0
3.0
400 450 500 550 600
K2O
(%
)A
1
2
3
4
5
6
400 450 500 550 600
U (
ppm
)
B
5
1 0
1 5
2 0
400 450 500 550 600
Th
(ppm
)
C
1.0
2.0
3.0
250 300 350 400 450 500
K2O
(%
)
D
1
2
3
4
5
6
250 300 350 400 450 500
U (
ppm
)
E
0
5
1 0
1 5
2 0
250 300 350 400 450 500
Th
(ppm
)
Depth (mbsf)
F
Figure 3. Depth plots of K, U, and Th reference concentrations. A−C: Hole948C. D−F: Hole 949B. K concentrations are from XRF analyses. U and Thconcentrations are from ICP-MS (solid circles) and INAA (open circles)analyses. Error bars indicate analytical precision.
188
0
1
2
3
4
5
6
7
0 1 2 3 4 5 6 7
U (
INA
A)
U (ICPMS)
AHole 948C
y = 0.23 + 1.00x, R=0.95
0
5
1 0
1 5
2 0
0 5 1 0 1 5 2 0
Th
(IN
AA
)
Th (ICPMS)
BHole 948C
y = 1.16 + 0.92x, R=0.97
0
1
2
3
4
5
6
7
0 1 2 3 4 5 6 7
U (
INA
A)
U (ICPMS)
CHole 949B
y = 0.55 + 0.73x, R=0.95
0
5
1 0
1 5
2 0
0 5 1 0 1 5 2 0
Th
(IN
AA
)
Th (ICPMS)
DHole 949B
y = 5.43 + 0.50x, R=0.86
Figure 4. Comparison of ICP-MS and INAA analyses for U and Th fromHoles 948C and 949B. Solid line is reduced major axis, a regression linewhich minimizes triangle areas with data points instead of the offsets parallelto one of the plot axes. Dashed lines are diagonals. Error bars are analyticalprecision. Hole 949B data indicate considerable analytical problems and weretherefore not used for the NGR analyses. A–B: Hole 948C. C–D: Hole 949B.
NATURAL GAMMA-RAY SPECTRA
v t
r
T
e
f
a
e
e
R
os
e
r
ergy ofs, at lowle 3).igher partwer
axi-pec-dur-heseding
gnif-ig.
ulara, andts forerage
ativeent ofigh-Holenif- are thel 9)th-
lativeations of (B0ter-ergys the
ncen- de-eak
f totallues,rgerially that
totalndi-hichblepec-n, asend-d B3; P14.l ise in-,im-
eg-t the
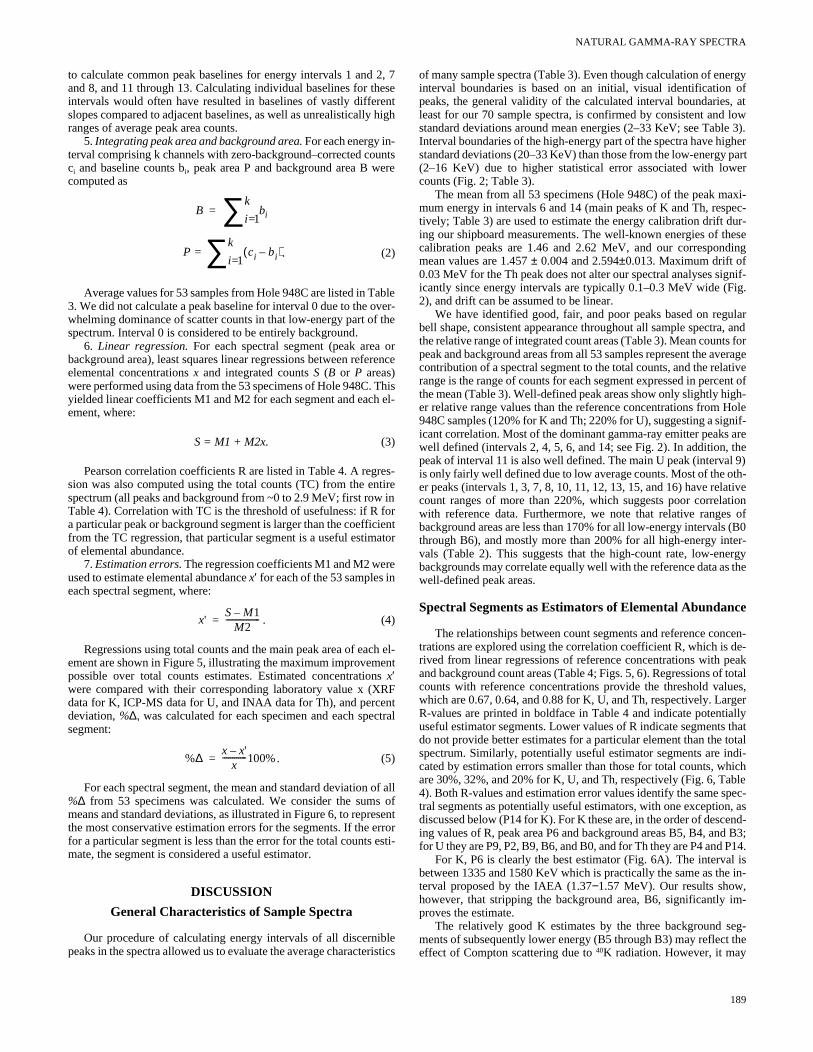
to calculate common peak baselines for energy intervals 1 and 2, 7and 8, and 11 through 13. Calculating individual baselines for theseintervals would often have resulted in baselines of vastly differentslopes compared to adjacent baselines, as well as unrealistically highranges of average peak area counts.
5. Integrating peak area and background area. For each energy in-terval comprising k channels with zero-background–corrected couci and baseline counts bi, peak area P and background area B wecomputed as
.
Average values for 53 samples from Hole 948C are listed in Ta3. We did not calculate a peak baseline for interval 0 due to the owhelming dominance of scatter counts in that low-energy part ofspectrum. Interval 0 is considered to be entirely background.
6. Linear regression. For each spectral segment (peak area background area), least squares linear regressions between refeelemental concentrations x and integrated counts S (B or P areas)were performed using data from the 53 specimens of Hole 948C. yielded linear coefficients M1 and M2 for each segment and eachement, where:
S = M1 + M2x. (3)
Pearson correlation coefficients R are listed in Table 4. A regrsion was also computed using the total counts (TC) from the enspectrum (all peaks and background from ~0 to 2.9 MeV; first rowTable 4). Correlation with TC is the threshold of usefulness: if R a particular peak or background segment is larger than the coefficfrom the TC regression, that particular segment is a useful estimof elemental abundance.
7. Estimation errors. The regression coefficients M1 and M2 werused to estimate elemental abundance x′ for each of the 53 samples ineach spectral segment, where:
. (4)
Regressions using total counts and the main peak area of eacement are shown in Figure 5, illustrating the maximum improvempossible over total counts estimates. Estimated concentrationx′were compared with their corresponding laboratory value x (Xdata for K, ICP-MS data for U, and INAA data for Th), and percedeviation, %∆, was calculated for each specimen and each specsegment:
. (5)
For each spectral segment, the mean and standard deviation %∆ from 53 specimens was calculated. We consider the summeans and standard deviations, as illustrated in Figure 6, to reprethe most conservative estimation errors for the segments. If the efor a particular segment is less than the error for the total counts mate, the segment is considered a useful estimator.
DISCUSSION
General Characteristics of Sample Spectra
Our procedure of calculating energy intervals of all discernibpeaks in the spectra allowed us to evaluate the average characte
Bk
i 1=∑ bi
Pk
i 1=∑ ci bi–( )=
=
x'S M1–
M2-----------------=
%∆x x'–
x------------100%=
ntsre
(2)
bleer-he
orence
his el-
s-tire inorienttor
h el-nt
s F
nttral
f all ofsentrrorsti-
leistics
of many sample spectra (Table 3). Even though calculation of eninterval boundaries is based on an initial, visual identificationpeaks, the general validity of the calculated interval boundarieleast for our 70 sample spectra, is confirmed by consistent andstandard deviations around mean energies (2–33 KeV; see TabInterval boundaries of the high-energy part of the spectra have hstandard deviations (20–33 KeV) than those from the low-energy(2–16 KeV) due to higher statistical error associated with locounts (Fig. 2; Table 3).
The mean from all 53 specimens (Hole 948C) of the peak mmum energy in intervals 6 and 14 (main peaks of K and Th, restively; Table 3) are used to estimate the energy calibration drift ing our shipboard measurements. The well-known energies of tcalibration peaks are 1.46 and 2.62 MeV, and our corresponmean values are 1.457 ± 0.004 and 2.594±0.013. Maximum drift of0.03 MeV for the Th peak does not alter our spectral analyses siicantly since energy intervals are typically 0.1–0.3 MeV wide (F2), and drift can be assumed to be linear.
We have identified good, fair, and poor peaks based on regbell shape, consistent appearance throughout all sample spectrthe relative range of integrated count areas (Table 3). Mean counpeak and background areas from all 53 samples represent the avcontribution of a spectral segment to the total counts, and the relrange is the range of counts for each segment expressed in percthe mean (Table 3). Well-defined peak areas show only slightly her relative range values than the reference concentrations from 948C samples (120% for K and Th; 220% for U), suggesting a sigicant correlation. Most of the dominant gamma-ray emitter peakswell defined (intervals 2, 4, 5, 6, and 14; see Fig. 2). In addition,peak of interval 11 is also well defined. The main U peak (intervais only fairly well defined due to low average counts. Most of the oer peaks (intervals 1, 3, 7, 8, 10, 11, 12, 13, 15, and 16) have recount ranges of more than 220%, which suggests poor correlwith reference data. Furthermore, we note that relative rangebackground areas are less than 170% for all low-energy intervalsthrough B6), and mostly more than 200% for all high-energy invals (Table 2). This suggests that the high-count rate, low-enbackgrounds may correlate equally well with the reference data awell-defined peak areas.
Spectral Segments as Estimators of Elemental Abundance
The relationships between count segments and reference cotrations are explored using the correlation coefficient R, which isrived from linear regressions of reference concentrations with pand background count areas (Table 4; Figs. 5, 6). Regressions ocounts with reference concentrations provide the threshold vawhich are 0.67, 0.64, and 0.88 for K, U, and Th, respectively. LaR-values are printed in boldface in Table 4 and indicate potentuseful estimator segments. Lower values of R indicate segmentsdo not provide better estimates for a particular element than thespectrum. Similarly, potentially useful estimator segments are icated by estimation errors smaller than those for total counts, ware 30%, 32%, and 20% for K, U, and Th, respectively (Fig. 6, Ta4). Both R-values and estimation error values identify the same stral segments as potentially useful estimators, with one exceptiodiscussed below (P14 for K). For K these are, in the order of descing values of R, peak area P6 and background areas B5, B4, anfor U they are P9, P2, B9, B6, and B0, and for Th they are P4 and
For K, P6 is clearly the best estimator (Fig. 6A). The intervabetween 1335 and 1580 KeV which is practically the same as thterval proposed by the IAEA (1.37−1.57 MeV). Our results showhowever, that stripping the background area, B6, significantly proves the estimate.
The relatively good K estimates by the three background sments of subsequently lower energy (B5 through B3) may refleceffect of Compton scattering due to 40K radiation. However, it may
189

P. BLUM, A. RABAUTE, P. GAUDON, J.F. ALLAN
Table 2. Summary of uncertainties associated with laboratory analyses of Uranium and Thorium.
Note: SD = standard deviation
Calculated for each data pair
Hole 948C Hole 949B
Mean SD Mean SD
Uranium2.22 2.28
0.29 0.25 0.39 0.52
13% 8% 15% 12%
Thorium11.81 11.34
0.78 0.61 2.47 2.89
7% 5% 22% 27%
UAVERAGE
UICPMS UINAA+
2--------------------------------------------=
∆U U( ICPMS UINAA )– 2=
Relative deviationsU∆
UAVERAGE-----------------------------=
ThAVERAGE
ThICPMS ThINAA+
2-------------------------------------------------=
Th∆ ThICPMS( ThINAA )–2
=
Relative deviationsTh∆
ThAVERAGE--------------------------------=
inee f
wrs
s y o
Ourdardde-t fortheseef-0%
rel foring thatea-
ois-
onss.lllly
nts.ail-orecon-a-v-
~10
ateci-
urcallly
also be an effect of the relatively good correlation between K and Thabundance in our samples (compare Figs. 3A and 3C), which causesour K regression to respond to good estimators of Th. Segment P14,which has a lower estimation error than total counts for K (Fig. 6A),shows this effect very clearly. We know a priori that it is impossiblefor K emissions to occur at such a high energy and that this intervalis an excellent estimator of Th. Similarly, Th estimation errors in Fig-ure 6C show a suspicious valley for P6, the main estimator of K. Thisstatistical effect cannot be avoided unless downhole variations of thethree elemental concentrations are completely uncorrelated, which israrely the case in a natural system. Correlation between the threecomponents does affect our R and estimation error values to some de-gree, but it is unlikely to alter the main results of our spectral analysis.
Our data suggest that only peak area P6 should be used for K es-timates. This may be practical in most cases, because this is the larg-est peak area in the spectrum, and sufficient counts should accumu-late to determine K concentration.
For U and Th, use of multiple segments for estimating elementalabundance may be advised. For uranium, P2 (214Bi emissions at 610KeV) and B9 (214Bi emissions in background at 1720 KeV) are al-most equally efficient estimators as the main peak area P9, and B6and B0 are very good estimators too. For Th the best estimator in ourstudy is P4 (228Ac emissions) and not the well-known main P14 (208Tlemissions), which ranks second. Several low-energy intervals showgenerally good correlation with Th abundance due to numerous emit-ters as well as their scatter products, which disappear into the back-ground. Using them, however, would clearly degrade the estimate.
Our results show that for U and Th, total errors are not significant-ly reduced by using the best estimator segments (P9 and P4, respec-tively) rather than total counts. The spectra’s worst estimators, cated by large errors in Figure 6 (e.g., P7, P8, P10, and P13), arlow count intervals, and their weight is negligible in the total sptrum. Relatively good additional estimators (e.g., B2 through B6Th) are caused by numerous emission peaks of lower energy, contribute significantly to the background. This is not the case foand that is why a background-free spectral component providebest concentration estimate for potassium.
Errors of concentration estimates from NGR measurementrarely reported, and if numbers are presented they are rarelplained. This is unfortunate because results from different meth
190
di- veryc-orhich K, the
areex-ds,
instruments, or companies cannot be compared (Hurst, 1990). sum of mean (equivalent to the accuracy of the estimate) and standeviations (equivalent to the precision of the estimate) of percent viations, as explained earlier, is a conservative error assessmenour 53 sample spectra. Using spectral segments P6, P9, and P4, total estimation errors, which also reflect analytical errors of the rerence data obtained in the laboratory, amount to 16%, 30% and 2for K, U, and Th, respectively.
Counting Time and Precision
If our calculated estimation errors would apply to routine cologging, spectral gamma-ray measurements would be quite usefuestimating K, U, and Th abundance. Unfortunately, reduced counttimes increase statistical counting errors, or noise, due to the factgamma-ray emissions are random events. Precision of NGR msurements is proportional to the number of counts according to Pson’s law, or:
, (6)
where P is the probable error in percent, and N is the number ofcounts. Typical routine measurements of 20 s on full-core sectiare 360× shorter than our 4 hr measurements on split-core section
Counting time is usually limited for practical purposes. In welogging, the constraint is logging speed, which must be commerciajustifiable and compatible with other, simultaneous measuremeIn the case of continuous coring carried out by ODP, the time avable to log a unit length of core is mostly dictated by the rate of crecovery. Leg 156 was a special case where most ship time was sumed by downhole operations, which left us plenty of time to mesure the relatively few cores on idle instrumentation. On high-recoery legs, however, cores must usually be processed at a rate ofm/ hr. This constrains practical NGR counting times to 20−40 s atdepth intervals of 10–20 cm. If a NGR core logging device existeda core repository, these constraints would not exist, and high-prsion NGR spectra would be very affordable.
Table 5 demonstrates how the negligible counting errors for o4-hr counting times, which are smaller than the laboratory analytierrors, increase dramatically for 20-s counting times. All potentia
P0.67 N
N-------------------100=

NA
TU
RA
L G
AM
MA
-RA
Y S
PE
CT
RA
191
rom Hole 948C.
Notes: Data from 204 omic Energy Agency. Schlum = Schlumberger Services. SD = standard deviation. Win-dow 0 to Window
S
bo
Peak area Background area
Peakdefinition
Meancounts)
Range(% of mean)
Mean(counts)
Range(% of mean)
Window 0N/A N/A 103,823;98,721 139;139 N/A
Window 1213;308 353;300 5,977;7,129 158;152 Poor
Window 214;3,299 149;152 12,195;11,990 148;130 Good
Window 3596;617 225;199 8,548;8,505 149;178 Fair
Window 451;3,482 146;142 8,952;8,999 154;146 Good
Window 577;1,407 149;154 6,653;6,795 166;166 Good
Window 692;7,798 138;138 3,013;2,982 146;150 Good
Window 776;81 296;309 744;768 227;202 Poor
Window 87;6 2,294;2,968 199;228 293;270 Poor
Window 9296;295 246;130 987;971 189;168 Fair
Window 1042;45 346;165 337;375 243;270 Poor
Window 11544;503 140;136 665;628 247;212 Good
Window 12248;274 189;224 349;360 227;296 Fair
Window 1345;63 290;320 141;171 242;326 Poor
Window 1431;1,128 150;144 476;480 194;214 Good
Window 1543;38 221;274 68;68 370;286 Poor
Window 1631;30 434;130 32;38 594;490 Poor
Window 17
Table 3. Summary of spectral segment calculations from 53 spectra f
8- and 256-channel analyses are given in each column as uvw;xyz respectively. Counting time was 4 hr. IAEA = International At 17 were defined to constrain calculation of interval boundaries. N/A = not applicable.
elected window undaries(KeV)
Calculated interval boundariesSome standard interval
boundaries Peak max. energy
Mean(KeV)
SD(KeV)
IAEA(KeV)
Schlum(KeV)
Mean(KeV)
SD(KeV) (
N/A N/A 200200 Interval 0 251;259 7;0
510;504 12;11 500520 Interval 1 522;520 10;15
566;569 3;2600 Interval 2 616;617 3;3 3,2
714;714 13;12750 Interval 3 752;751 10;9
859;858 8;10950 Interval 4 937;938 5;5 3,4
1,065;1,063 14;14 1,1001150 Interval 5 1,128;1,126 15;14 1,3
1,333;1,333 13;16 1,3701450 Interval 6 1,457;1,456 3;5 7,7
1,574;1,570 10;9 1,570 1,5901590 Interval 7 1,596;1,597 12;12
1,662;1,658 14;151670 Interval 8 1,671;1,669 7;8
1,694;1,694 13;13 1,6601720 Interval 9 1,756;1,760 16;17
1,887;1,879 14;21 1,8601900 Interval 10 1,912;1,911 20;28
1,988;1,987 34;39 2,0002100 Interval 11 2,126;2,124 22;18
2,229;2,217 19;242250 Interval 12 2,266;2,264 29;33
2,381;2,369 27;342400 Interval 13 2,403;2,399 18;25
2,452;2,454 25;23 2,4102600 Interval 14 2,594;2,594 12;13 1,1
2,775;2,777 20;20 2,8102800 Interval 15 2,812;2,810 24;18
2,873;2,867 28;212900 Interval 16 2,903;2,897 25;22
2,857;2,950 33;33 3,0003000

P. BLUM, A. RABAUTE, P. GAUDON, J.F. ALLAN
Table 4. Correlation coefficients R used to evaluate potentially useful estimator segments.
Notes: R values are derived from linear regressions between K, U, and Th reference concentrations and count rates in each peak and background spectral segment, obtained from 53specimens from Hole 948C. K, U, and Th reference data are from XRF, ICPMS, and INAA analyses, respectively. Peak and background values that are larger than total counts val-ues shown in top row (potentially useful estimators, printed in italic face) are printed in bold face. Interval = calculated energy interval. Peak = integrated peak area of an interval.Bkg. = integrated background area of an interval.
Interval
K U Th
Peak Bkg. Peak Bkg. Peak Bkg.
Total counts 0.670 0.639 0.882
Interval 0 - 0.643 - 0.657 - 0.877Interval 1 −0.003 0.592 −0.071 0.422 0.073 0.758Interval 2 0.470 0.650 0.758 0.614 0.816 0.847Interval 3 0.463 0.673 0.492 0.629 0.786 0.863Interval 4 0.617 0.720 0.517 0.583 0.925 0.857Interval 5 0.645 0.749 0.564 0.605 0.691 0.850Interval 6 0.889 0.654 0.421 0.662 0.789 0.860Interval 7 0.259 0.551 −0.061 0.576 0.319 0.814Interval 8 −0.090 0.272 −0.247 0.231 −0.253 0.448Interval 9 0.257 0.485 0.782 0.742 0.492 0.772Interval 10 −0.110 0.456 −0.195 0.499 −0.112 0.703Interval 11 0.518 0.571 0.474 0.580 0.726 0.821Interval 12 0.340 0.441 0.423 0.607 0.662 0.824Interval 13 0.231 0.398 −0.095 0.344 −0.012 0.537Interval 14 0.664 0.521 0.495 0.594 0.899 0.845Interval 15 −0.229 0.275 −0.105 0.294 −0.137 0.591Interval 16 0.185 0.401 0.394 0.366 0.253 0.589
l
pa
s
ln
andowesult-na-owThe that
cen- ared do onlylity topec-n ofn of
ellgy2 and fur-, U,stedwsclose-h 4, 16.ourble.inede-
au-s in-ments use-
xed waswin- and
useful spectral segments for K, U, and Th are listed in the order of de-creasing significance, with their count values and estimation errors.Next, we have computed cumulative count values by adding thecounts of the subsequent segment for each element, cumulative esti-mation errors weighted by the relative number of counts, and count-ing errors calculated according to Equation 6 and using the cumula-tive counts. All computations are made for the original 4-hr (14,400s) counts on split cores and for hypothetical 20-s counts on full cores.The results may have implications for the choice of spectral segmentsto be used for elemental estimates when counting times are low. ForK, using the main peak area P6 is still the best solution, because esti-mation errors increase faster than counting errors decrease when add-ing background areas B5, B4, and B3. The reason is the single emis-sion energy of 40K, which makes peak area P6 an overwhelminglygood estimator. For U and Th, however, adding certain spectral seg-ments decreases the counting error dramatically, whereas the estima-tion error is not increased significantly. The reason is that multipleemitters across the spectrum contribute to the background, whereasrelatively few counts accumulate in the best estimator segments.
Effect of Energy Resolution
All 79 sample spectra were analyzed for 2048-channel (~1.5KeV) and a simulated 256-channel (~11.7 KeV) energy resolution.Table 3 shows that calculated interval boundaries as well as peakmaxima energies differ by 2–12 KeV between the 2048- and 2channel data sets. Standard deviations for these parameters frosample spectra range from 2 to 39 KeV. They are very similarhigher and lower resolution data sets for a given energy interVariations in peak parameters related to the difference in energyolution are therefore less significant than variations due to variain the sample spectra. Furthermore, standard errors of interval boary and peak maxima energies are close to the resolution of thechannel data sets (i.e., the higher resolution of the 2048-channedoes not improve overall spectral analysis).
All linear regressions and estimation error analyses were formed for both energy resolutions. Both data sets yield the suseful estimator segments. The R and estimation error values ouseful estimator segments vary less than 1% between the 2048256-channel data sets. Therefore only the 256-channel resultpresented in Table 4.
Grasty et al. (1985) analyzed airborne gamma-ray spectra coled with a 256-channel analyzer. They compared errors in conce
192
56-m 53forval.res-nceund-256-data
er-me
f the- and are
ect-tra-
tion estimates for window sizes of 12, 48, 96, and 192 KeV, found that Th and U errors from the 12 and 48 KeV wide-windanalysis were reduced by up to 25% when compared to those ring from the three-window method proposed by the IAEA (Intertional Atomic Energy Agency, 1976). The 96- and 192-KeV windtests had a slightly higher error than the 12- and 48-KeV runs. authors were in agreement with other studies of airborne spectra50 KeV wide windows were more than adequate to minimize contration errors. As service companies, including Schlumberger,moving towards acquisition of 256-channel data, the ODP shoulthe same. Our study shows that 2048-channel acquisition wouldcause excessive data storage requirements, without adding quaspectral analysis. Given the nature of the natural gamma-ray strum as resolved by scintillation detectors, an energy resolutioabout 10 KeV (256 channels) is more than sufficient for estimatioK, U, and Th.
Standard Energy Windows
Many of our calculated energy interval boundaries conform wwith intervals proposed by the IAEA (International Atomic EnerAgency, 1976) and used by Schlumberger Services (see Table Fig. 2 for energy intervals), but our analysis divides the spectrumther. Our intervals 6, 9, and 14, including the main peaks for Kand Th, respectively, cover practically the same intervals suggeby the IAEA for estimation of these elements. The five windoSchlumberger Services have been using for more than a decade ly correspond, respectively, to our intervals 0, intervals 1 througintervals 5 and 6, intervals 7 through 10, and intervals 11 through
Even though the method of Grasty et al. (1985) differs from method, some results of their window optimization are comparaIn an attempt to improve U estimates, Grasty et al. (1985) examtwo windows in addition to the three IAEA windows. One corrsponds approximately to our interval 5, including the 214Bi peak at1120 KeV, and the other to our combined intervals 5 and 9. Thethors concluded that errors in estimated U and K concentrationcreased. This is consistent with our assessment that spectral segother than P6 degrade the K estimate, and that interval 5 is not aful estimator for U.
Grasty et al. (1985) also optimized positions for 10 adjacent, fiwindows between 0.77 and 2.83 MeV so that the uranium errorminimized. They found that estimates from using 10 selected dows was a good compromise between the three-window method

NATURAL GAMMA-RAY SPECTRA
0
1
2
3
4
0 1 2 3 4
y = 1.13 + 0.45x R= 0.67
K-e
stim
ate
(%)
K-XRF (%)
ATC estimate
0
1
2
3
4
0 1 2 3 4
y = 0.43 + 0.79x R= 0.89
K-e
stim
ate
(%)
K-XRF (%)
BP6 estimate
0
1
2
3
4
0 1 2 3 4
y = 0.87 + 0.54x R= 0.70
U-e
stim
ate
(ppm
)
U-ICPMS (ppm)
CTC estimate
0
1
2
3
4
0 1 2 3 4
y = 0.58 + 0.70x R= 0.82
U-e
stim
ate
(ppm
)
U-ICPMS (ppm)
DP9 estimate
0
5
1 0
1 5
2 0
0 5 1 0 1 5 2 0
y = 1.28 + 0.88x R= 0.93
Th-
estim
ate
(ppm
)
Th-INAA (ppm)
ETC estimate
0
5
1 0
1 5
2 0
0 5 1 0 1 5 2 0
y = 1.11 + 0.89x R= 0.94
Th-
estim
ate
(ppm
)
Th-INAA (ppm)
FP14 estimate
Figure 5. Reference concentrations vs. concentrations estimated from NGR counts. For each of the three elements K, U, and Th, estimates from total counts (A,C, E) and estimates from the best estimator spectral segment (B, D, F) are shown, illustrating the maximum improvement achieved by the spectral analysis pre-sented here. Linear coefficients are for least squares regression (dashed line). Solid line is diagonal. Error bars are maximum analytical error of reference data(sum of absolute precision and accuracy in percent).
dataths),valstinee-
a more elaborate full-spectrum analysis, giving almost the same accu-racy as estimates from full spectra with 12 KeV resolution. Our studyidentifies 11 potentially useful segments in seven energy intervals,with interval boundaries consistently different from the 10-windowboundaries of Grasty et al. (1985). The discrepancy may be related tothe difference between the strictly statistical, maximum-likelihoodmethod used by Grasty et al. (1985) and our peak identification meth-od, which ties interval boundaries to minima between peaks.
Our study suggests that for routine logging with the NGR (10- to30-s counting time), total counts for U and Th estimates and interval
6 (or better, peak area P6) for K estimates is all that is needed. Nev-ertheless, it seems reasonable that the ODP core logger provide thecapability of 256-channel acquisition and archiving. This ensures thatcalibrations and quality control can be performed later by any inves-tigator’s preferred method. If routine 256-channel spectra pose amanagement problem (hundreds of megabytes every two monacquisition and archiving of a set of three to ten fixed energy inter(regions of interest) should also be considered for normal, roucore logging where counting time is insufficiently long to yield usful 256-channel spectra.
193

P. BLUM, A. RABAUTE, P. GAUDON, J.F. ALLAN
hp of
gh-hin X-nd%,curogyavyt.
s itsrelyo-ing be
0
1 0
2 0
3 0
4 0
5 0
6 0
7 0
0 2 4 6 8 1 0 1 2 1 4 1 6
APotassium
Est
imat
ion
erro
r (%
)
Energy interval no.
0
1 0
2 0
3 0
4 0
5 0
6 0
7 0
0 2 4 6 8 1 0 1 2 1 4 1 6
BUranium
Est
imat
ion
erro
r (%
)
Energy interval no.
0
1 0
2 0
3 0
4 0
5 0
6 0
7 0
0 2 4 6 8 1 0 1 2 1 4 1 6
Est
imat
ion
erro
r (%
)
Energy interval no.
CThorium
Figure 6. Estimation errors for spectral segments. A. Potassium. B. Uranium.C. Thorium. Triangles are values for peak areas and circles are values forbackground areas in any given energy interval. Deviation of estimated con-centration from reference concentration, expressed as percentage of the refer-ence concentration, is defined as percent deviation. Empty symbols aremeans of all percent deviations from 53 samples. Vertical lines are standarddeviations of all percent deviations from 53 samples. Solid symbols representthe sum and therefore a conservative, maximum estimation error. This errorincludes analytical errors of reference data and the true estimation error maytherefore be significantly smaller. Dashed lines are estimation errors usingtotal counts as estimator. Only errors below that line indicate potentially use-ful estimator segments.
194
Eventually, standard reporting of elemental estimates could beprovided using the best calibration and inversion method available. Ifthe results of this study were to be used, integrated counts SP6 for peakarea P6 would be computed according to our method, and elementalconcentrations could be calculated using the following linear coeffi-cients:
, (7)
Where all integrated counts S are normalized to counts per second(cps) and full-core measurement, STC is total count rate, x′K is inwt%, x′U and x′Th are in ppm, and the error term includes our maxi-mum estimation error and the counting (Poisson) error. The linearrelationships with TC are dependent on the ratio of elemental con-centrations contributing to TC. Our estimation error accounts at leastfor variations in these ratios represented by our reference data, andthe relationships should hold fairly well for common rocks and sedi-ments measured in the NGR system of ODP. More sophisticated cal-ibration matrices will be developed and better estimates achievedonce customized calibration standards are available.
Geological Application of Elemental Estimates
A detailed analyses and interpretation of K, U, and Th elementaldata in their local geological context is best done in conjunction withother data, such as bulk and clay mineralogy, porosity, and other ma-jor and minor elemental data obtained from the same samples. Suchan analysis is beyond the scope of this study, which focused on thepotential use of the NGR device to obtain meaningful data from nat-ural gamma-ray spectra. We therefore limit ourselves to a few gener-al comments.
Well-logging services have established a vast number of con-cepts, algorithms, and programs to interpret K, U, and Th concentra-tions from NGR acquisition, along with other physical and chemicallog parameters for different environments (see Serra, 1984, 1986, foran overview and references). Some of the concepts have also beencriticized because they are often applied without consideration of ad-ditional, pertinent data, and with the lack of rigorous error estimates(Hurst, 1990). Some applications potentially useful for the Barbadosaccretionary wedge are estimation of clay volume and type, whichexert a significant control on the structural evolution and fluid-flowpaths, and leaching and precipitation of uranium as a direct conse-quence of fluid flow. Relative changes in the abundance of the threeelements, together with other data, will allow testing of hypotheses inregard to the evolution of the décollement zone.
A quick look at our data shows that in Hole 948C, K, U, and Tdecrease downhole at constant rates from 420 to 495 mbsf, the tothe décollement, from which their concentrations increase throuout the décollement (Fig. 3). Clay content increases downhole witthe décollement from ~60 to 70 wt%, as estimated from shipboardray diffraction analyses (Shipley, Ogawa, Blum, et al., 1995). K aTh, potential indicators of shaliness, both increase by about 100which means that a significant change in mineralogy must also ocat this level. Potential interpretations are a change in clay mineral(e.g., illite vs. smectite), or a change in concentration of certain heminerals. U increases only very slightly within the décollemenHowever, it continues to increase below the décollement and hamaximum between 520 and 530 mbsf. The U spikes are not enticompatible with lithologic units described on Leg 156, and their psition near the bottom of the décollement may suggest that leachor precipitation is involved. However, such a hypothesis needs tocarefully tested with additional data and analyses.
x'k 0.506 1.43SP6+ 160.67 S
S------------------100+
%
x'U 0.279 0.0762STC+ 300.67 S
S------------------100+
%
x'Th 1.66 0.389TC+ 200.67 S
S------------------100+
%±=
±=
±=

NATURAL GAMMA-RAY SPECTRA
Table 5. Comparison of estimation error and counting error at two different counting times.
Notes: Cumul. = cumulative over the spectral segments (peak and background areas) listed for each element, except Total = total counts. Only spectral segments are listed, becausespectral segments have decreased estimation errors when compared to total counts. Cumulative counting errors are based on cumulative counts. The 20 s counts were calculated bydividing the 4 hr counts by 360, which includes the factor of two correction for equivalent measurements.
Segmentestimation
error(%)
4 hr counting time (split-core) 20 s counting time (full-core)
Segmentaveragecounts
Cumul.counts
Cumul.estimation
error(%)
Cumul.counting
error(%)
Segmentaveragecounts
Cumul.counts
Cumul.estimation
error(%)
Cumul.counting
error(%)
K P6 16.3 7,792 7,792 16.3 0.76 22 22 16.3 14.50B5 26.3 6,653 14,445 20.9 0.56 18 40 20.9 10.65B4 27.7 8,952 23,397 23.5 0.44 25 65 23.5 8.37B3 29.9 8,548 31,945 25.2 0.38 24 89 25.2 7.16
Total 30.1 172,263 172,263 30.1 0.16 479 479 30.1 3.08
U P9 29.5 296 296 29.5 3.92 1 1 29.5 74.39P2 29.9 3,214 3,510 29.9 1.14 9 10 29.9 21.60B9 30.0 987 4,497 29.9 1.01 3 12 29.9 19.08B0 31.3 3,013 7,510 30.5 0.78 8 21 30.5 14.77B6 31.9 103,823 111,333 31.8 0.20 288 309 31.8 3.84
Total 32.0 172,263 172,263 32.0 0.16 479 479 32.0 3.08
Th P4 18.1 3,451 3,451 18.1 1.15 10 10 18.1 21.79P14 19.9 1,131 4,582 18.5 1.00 3 13 18.5 18.91
Total 20.2 172,263 172,263 20.2 0.16 479 479 20.2 3.08
e
n
,
n2
o
e
g
s
lua-ic.
a
ti-
From 520 mbsf downhole, concentration of all three elementsfluctuates strongly, reflecting the interlayering of quite different sed-iment types. It will be possible to characterize the composition ofeach lithotype with the NGR and other elemental data to draw con-clusions in regard to provenance and depositional process of the se-quence.
Hole 949B is represented by scarce data because of low core re-covery. We are able to observe spikes in U and Th concentrations attwo or three levels that are probably related to thrust faults. A generalincrease in abundance of all three elements is associated with thcollement zone below 400 mbsf.
CONCLUSIONS
NGR spectra between 0.2 to 3.0 MeV are optimally resolved16 energy intervals divided into peak and background segments.gression using five peak areas and six background areas gives belemental estimates than regression using total counts of the espectrum. Potassium abundance should be estimated using thpeak area only, because other segments significantly increase thtimation error. Taking into account the error of counting statisticsappears advantageous to estimate Th and U from total counts wlow counting times are used. Lowest estimation errors from our ayses are 16% for K using peak area P6, 30% for U using P9, and for Th using P4.
Acquisition of 2048-channel data is not warranted. In our expement, we obtained more than sufficient spectral resolution using 2channel binning, and the estimation error did not increase. Oshould implement 256-channel NGR data acquisition for their clogging system, which is becoming the standard in well logging aairborne survey as well.
ACKNOWLEDGMENTS
Reviews by Carlos Pirmez, Bill Bush, and Christian Bückhelped clarify the manuscript. This study was supported by USSaward no. 156-20853b.
3UHYLRXV�&KDSWHU3UHYLRXV�&KDSWHU 7DEOH�RI�&7DEOH�RI�&
dé-
byRe-ettertire
e P6e es- ithenal-0%
ri-56-DPrend
rSP
REFERENCES
Adams, J.A.S., and Gaspirini, P., 1970. Gamma ray spectrometry of rocks.Meth. Geochem. Geophys., 10: Amsterdam (Elsevier).
Gladney, E.S., Jones, E.A., Nickell, E.J., and Roelandts, I., 1992. 1988 com-pilation of elemental concentration data for USGS AGV-1, GSP-1, andG-2. Geostand. Newsl., 16:111−300.
Grasty, R.L., 1975. Uranium measurement by airborne gamma-ray spectrom-etry. Geophysics, 40:503−519.
Grasty, R.L., Glynn, J.E., and Grant, J.A., 1985. The analysis of multichan-nel airborne gamma ray spectra. Geophysics, 50:2611−2620.
Hoppie, B.W., Blum, P., and the Shipboard Scientific Party, 1994. Naturalgamma-ray measurements on ODP cores: introduction to procedureswith examples from Leg 150. In Mountain, G.S., Miller, K.G., Blum, P.,et al., 1994. Proc. ODP, Init. Repts., 150: College Station, TX (OceanDrilling Program), 51–59.
Hurst, A., 1990. Natural gamma-ray spectrometry in hydrocarbon-bearinsandstones from the Norwegian Continental Shelf. In Hurst, A., Lovell,M.A., and Morton, A.C. (Eds.), Geological Applications of WirelineLogs. Geol. Soc. Spec. Publ. London, 48:211−222.
International Atomic Energy Agency, 1976. Radiometric reporting methodand calibration in uranium exploration. Tech. Rep. Ser.- I. A. E. A, 174.
Marett, G., Chevalier, P., Souhaite, P. and Suau, J., 1976. Shaly sand evation using gamma ray spectrometry, applied to the North Sea JurassSPWLA 17th Ann. Logging Symp., 1–20.
Mathis, G.L., Rutledge, D.R., and Ferguson, W.E., 1984. A spectral gammray (SGR) tool. SPWLA 25th Ann. Logging Symp., 1–21.
Serra, O., 1984. Fundamentals of Well-Log Interpretation (Vol. 1): TheAcquisition of Logging Data: Dev. Pet. Sci., 15A: Amsterdam (Elsevier).
————, 1986. Fundamentals of Well-Log Interpretation (Vol. 2): TheInterpretation of Logging Data: Dev. Pet. Sci., 15B: Amsterdam(Elsevier).
Serra, O., Baldwin, J. and Quirein, J., 1980. Theory, interpretation and praccal applications of natural gamma ray spectroscopy. Trans. SPWLA 21stAnnu. Logging Symp., 27:Q1–Q30.
Shipley, T.H., Ogawa, Y., Blum, P., et al., 1995. Proc. ODP, Init. Repts., 156:College Station, TX (Ocean Drilling Program).
Till, R., 1974. Statistical methods for earth sciences. New York (John Wiley& Sons).
Date of initial receipt: 19 February 1996Date of acceptance: 3 September 1996Ms 156SR-024
195RQWHQWVRQWHQWV 1H[W�&KDSWHU1H[W�&KDSWHU
Copyright © 2022 FDOKUMEN