1256-notes.pdf - Health Services Research & Development
42
Limited Dependent Variables Ciaran S. Phibbs April 5, 2017
-
Upload
khangminh22 -
Category
Documents
-
view
5 -
download
0
Transcript of 1256-notes.pdf - Health Services Research & Development

Limited Dependent Variables
Ciaran S. Phibbs April 5, 2017

Limited Dependent Variables
0-1, small number of options, small counts, etc.
The dependent variable is not continuous, or even close to continuous.

Outline
Binary Choice Multinomial Choice Counts Most models in general framework of
probability models – Prob (event/occurs)
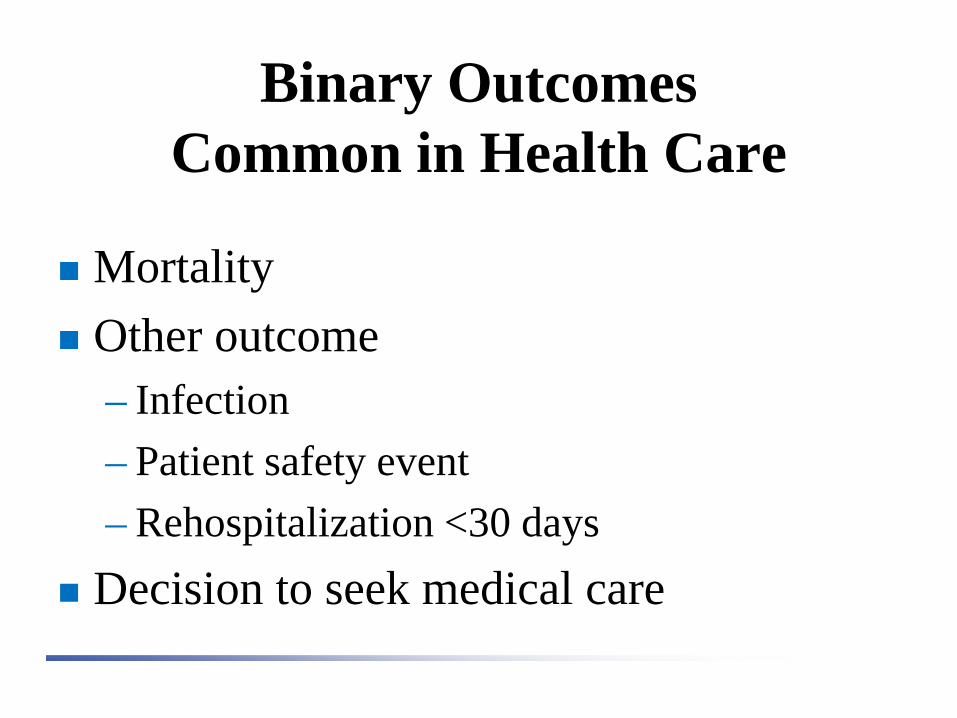
Binary Outcomes Common in Health Care
Mortality Other outcome
– Infection – Patient safety event – Rehospitalization <30 days
Decision to seek medical care

Yi = βo + βX + εi Yi=0 if lived, Yi=1 if died
Prob (Yi=1) = F(X, β) Prob (Yi=0) = 1 – F(X,β) OLS, also called a linear probability model εi is heteroscedastic, depends on βX
Predictions not constrained to match actual outcome (0,1) and can get negative predicted values

Standard Approaches to Binary Choice-1
Logistic regression

Advantages of Logistic Regression
Designed for relatively rare events Commonly used in health care; most
readers familiar with odds ratios

Standard Approaches to Binary Choice-2
Probit regression (classic example is decision to make a large purchase) y* = βX + ε y=1 if y* >0 y=0 if y* ≤0

Binary Choice
There are other methods, using other distributions.
In general, logistic and probit give aboutthe same answer.
It used to be a lot easier to calculate marginal effects with probit, not so any more

Odds Ratios vs. Relative Risks
Standard method of interpreting logistic regression is odds ratios.
Convert to % effect, really relative risk This approximation starts to break down
at 10% outcome incidence


Can Convert OR to RR
Zhang J, Yu KF. What’s the Relative Risk? A Method of Correcting the Odds Ratio in Cohort Studies of Common Outcomes. JAMA 1998;280(19):1690-1691.
RR = OR (1-P0) + (P0 x OR) Where P0 is the sample probability of the
outcome

Effect of Correction for RR From Phibbs et al., NEJM 5/24/2007, ≈20% mortality
Odds Ratio Calculated RR
2.72 2.08
2.39 1.91
1.78 1.56
1.51 1.38
1.08 1.06

OR vs. RR
Zhang is an approximation, not exact. Many journals, especially epidemiology
journals, now want direct estimation of RR One option, Poisson with robust error variance
– For binary outcome, IRR is a RR – Can run in most statistical packages; Stata has a
Poisson command, or SAS w/ Proc GENMOD

OR vs. RR
Except for very large OR, and when incidence rate is large, effects of correct estimation of RR are relatively modest.
But, better to do it correctly, then know that you won’t be over-estimating the effect.

Extensions for Binary Data There are a lot of variations
– Panel data – Grouped data
For panel data, can now estimate both random effects and fixed effects models.
The Stata manual lists over 30 related estimation commands for binary outcomes

Extensions Goodness of fit tests. Several tests. Probably the most commonly reported
statistics are: – Area under ROC curve, c-statistic in SAS
output. Range 0.50 to 1.0. Intuitively, how well does model predict compared to random assignment
– Hosmer-Lemeshow test of goodness of fit

More on Hosmer-Lemeshow Test The H-L test breaks the sample up into n (usually 10,
some programs (Stata) let you vary this) equal groups and compares the number of observed and expected events in each group.
If your model predicts well, the events will be concentrated in the highest risk groups; most can be in the highest risk group.
Alternate specification, divide the sample so that the events are split into equal groups. Not a valid formal test, but useful to learn more about how well you are actually predicting outcome in the tail.

Estimation Note for Very Large Samples
If you have very large samples; millions, it takes a lotlonger to estimate a maximum likelihood model than OLS
But, same X matrix, so the p-values for OLS are approximately the same as a logit model. Can use OLS for model development, test RHS variables as discussed last week, and only estimate the final models with logit or other maximum likelihood model.

Multinomial or Discrete Choice
What if more than one choice or outcome?
Options are more limited – Multivariable Probit (multiple decisions,
each with two alternatives) – Two different logit models (single decision,
multiple alternatives)

Examples of Health Care Uses for Multiple Choice Models
Choice of what hospital to use, among those in market area (or chose VA vs. several other options)
Choice of treatment among several options
Ordered vs. unordered choices

Logit Models for Multiple Choices
Conditional Logit Model (McFadden)
– Unordered choices Multinomial Logit Model
– Choices can be ordered.

Conditional Logit Model

Conditional logit model Also known as the random utility model Is derived from consumer theory How consumers choose from a set of options Model driven by the characteristics of the
choices. Individual characteristics “cancel out” but can
be included indirectly. For example, in hospital choice, can interact individual characteristic with distance to hospital
Can express the results as odds ratios.

Estimation of McFadden’s Model Some software packages (e.g. SAS)
require that the number of choices be equal across all observations.
LIMDEP, allows a “NCHOICES” options that lets you set the number of choices for each observation. This is a very useful feature. May be able to do this in Stata (clogit) with “group”

Multinomial Logit Model

Multinomial Logit Model Must identify a reference choice, model
yields set of parameter estimates for each of the other choices, relative to the reference choice
Allows direct estimation of parameters for individual characteristics. Model can (should) also include parameters for choice characteristics

Examples of Application of Multinomial Choice
NICUs have formal levels of care that define patients that they can treat
Compare outcomes of infants born in lower level NICUs, compared to outcomes of infants born in highest level.
Full example in clinical jouranl, Haberland et al., Pediatrics 2006;118(6):1667-1675.

Independence of Irrelevant Alternatives
Results should be robust to varying the number of alternative choices – Can re-estimate model after deleting some of
the choices. – McFadden, regression based test. Regression-
Based Specification Tests for the Multinomial Logit Model. J Econometrics 1987;34(1/2):63-82.
If fail IIA, may need to estimate a nested logit model

Count Data (integers)
Continuation of the same problem; dependent variable can only assume specific values and can’t be <zero
Problem diminishes as counts increase Rule of Thumb. Need to use count data
models for counts under 30

Independence of Irrelevant Alternatives - 2
McFadden test can also be used to test for omitted variables.
For many health applications, doesn’t matter, the models are very robust (e.g. hospital choice models driven by distance).

Count Data
Some examples of where count data models are needed in health care – Dependent variable is number of outpatient
visits by each patient – Number of times a prescription for a chronic
disease medication is refilled in a year – Number of adverse events in a unit (or
hospital) over a period of time

Count Data Poisson distribution. A distribution for
counts. – Problem: very restrictive assumption that mean
and variance are equal

Count Data In general, negative binomial is a better choice.
Stata (nbreg), test for what distribution is part of the package. Other distributions can also be used.

Interpreting Count Data Models
lnE(event rate) = Bx Incidence Rate Ratio = eB, like on odds
ratio, with a similar interpretation

Notes for Count Data Models More common to see OLS used for
counts than for binary or very limited choices.
Real problem with OLS when there are lots of zeros. Will result in reduced statistical significance. Can go in opposite direction when counts are larger.
Can have meaningful effects of coefficients

Notes for Count Data Models-2
30 is a rule of thumb, but should still consider a count model if most are small counts
Need to consider distribution and data generating process. If mixed process, may need to split sample

Example of Mixed Data Generating Processes
Predicting LOS for newborns – Well babies, all with LOS<= 5 days, about
90% of all newborns, clearly a count – Sick newborns, can have very long LOS
Solution, separate models for well babies and for sick babies.

Other Models
New models are being introduced all of the time. More and better ways to address the problems of limited dependent variables.
Includes semi-parametric and non-parameteric methods.

Reference Texts
Greene. Econometric Analysis
Wooldridge. Econometric Analysis of C
Maddala. Limited-Dependent and Qualitative Variables in Econometrics
ross Section and Panel Data

Journal References
McFadden D. Specification Tests for the Multinomial Logit Model. J Econometrics 1987;34(1/2):63-82.
Zhang J, Yu KF. What’s the Relative Risk? A Method of Correctingthe Odds Ratio in Cohort Studies of Common Outcomes. JAMA 1998;280(19):1690-1691.

42
Next lecture
Cost as the Dependent Variable (Part 1) Paul Barnett
April 12, 2017