10th Anniversary Annual Conference 2007 - Asian ...
212
-
Upload
khangminh22 -
Category
Documents
-
view
0 -
download
0
Transcript of 10th Anniversary Annual Conference 2007 - Asian ...


A Decade of Developments10th Anniversary Annual Conference 2007
Edited by Masahiro Kawai and Susan F. Stone
Asian Development Bank Institute

Kasumigaseki Building, 8th Floor
3-2-5 Kasumigaseki, Chiyoda-ku
Tokyo 100-6008, Japan
www.adbi.org
©2008 Asian Development Bank Institute
ISBN: 978-4-89974-026-1
Freely available electronically at:
http://www.adbi.org/book/2008/11/20/2755.decade.dev.2007/.
The views expressed in this work are the views of the authors and do not necessarily reflect
the views or policies of the Asian Development Bank Institute (ADBI), the Asian Development
Bank (ADB), its Board of Directors, or the governments they represent. ADBI does not
guarantee the accuracy of the data included in this work and accepts no responsibility for
any consequences of their use. Terminology used may not necessarily be consistent with ADB
official terms.
Foreword ivPreface viContributors viiAbbreviations xiii
I. Overview 1 Masahiro Kawai Susan F. Stone
II. Financing Asian Growth 23 Peter A. PetriIII. Asian Crisis Ten Years On: Policy Perspectives 45 Mohamed Ariff Azidin Wan Abdul KadirComments 70 Akira Ariyoshi Chia Siow Yue
IV. Poverty Reduction, Inclusive Growth, and Development Strategies 79 Justin Yifu Lin V. Rising Inequalities in Asia: An Imperative for Inclusive Growth 109 Ifzal Ali Comments 128 Iwan Azis Yasuyuki Sawada
VI. State of Integration in the Asia-Pacific Region: Current Patterns and Future Scenarios 135 Antoni Estevadeordal Kati SuominenVII. A Composite Index of Economic Integration in the Asia-Pacific Region 163 Chen Bo Yuen Pau WooComments 181 Shinji Takagi David Kruger VIII. Summary 185

The Asian Development Bank Institute (ADBI) was established in 1997 as a subsidiary of the Asian Development Bank to respond to two needs of developing member countries: identification of effective development strategies and improvement of capacity for sound management of agencies and organizations in those countries. As the chapters in this volume demonstrate, ADBI has indeed helped foster “A Decade of Developments.”
Asia has shown the way to regain economic buoyancy and vibrancy after the 1997/98 Asian financial crisis as demonstrated by its remarkable growth and development over the past decade. Reforms have put the previously affected countries in a good position to face any potential future turbulence. The lessons of the last crisis, and the need for reform to make economies competitive and resilient, are lessons that are just as relevant today. The spread across Asia of such reform more than 10 years ago raised the standard of performance across the region. However, as the current situation illustrates and is further shown in the chapters contained in this volume, much work still needs to be done—especially in the field of governance and institutional strengthening if the region, and indeed the world, are to face up to the challenges of globalization.
Asia’s rapid growth has contributed to a remarkable decline in the incidence of poverty throughout the region. Yet the chapters in this volume show that this growth has not been enjoyed equally among all Asia’s inhabitants. Indeed, a compelling case has been made that rising inequalities in Asia pose a “clear and present danger” to social and political stability. The work presented suggests that governments can help alleviate these concerns by ensuring broad access to economic opportunities, by providing a social safety net to those at most risk, and by equipping the poor with the tools necessary to become productive in the economy.
A by-product of the Asian financial crisis has been the increasing move by countries in the region toward enhanced economic cooperation and integration. Driven by the private sector, market-led regional economic integration has deepened as value and production networks have grown. Regional cooperation can nourish it further.
However, as the chapters on growth through regional cooperation and integration argue, increasing integration may have its downsides. One is the exposure of each country’s domestic sectors to greater regional competition and the possible dislocation of workers in such sectors. Another is the rising

number of regional agreements that may lead to an increasing complexity and a “noodle bowl” in the regional trading system, rather than the transparency such a system needs to maintain efficiency. It is important that governments in the region be given the support and tools, through research and capacity building such as those offered by ADBI, needed to meet these challenges.
It is somewhat ironic that as ADBI observed the anniversary of its founding in the wake of the Asian financial crisis, the seeds were being sown for another financial crisis. The current global financial crisis, starting in the US and having spread to Europe, is on a scale not seen in many decades. Indeed, in the wake of the collapse of some of the world’s leading investment banks there is growing concern over the specter of a deep and prolonged recession in the developed economies. While impact on the Asian economies has so far been relatively limited, deep and prolonged recession in the developed economies can eventually adversely affect Asian economies which for more than two decades have banked on export-oriented development strategies. Moreover, there is always concern that a decline in global growth may disproportionately affect the world’s most vulnerable, many of whom are in Asia.
As a development institution, ADB faces formidable challenges in the decades to come as Asia and the Pacific deals with the looming global economic slowdown and transforms itself rapidly. These challenges will test ADB’s ability to be more relevant at a time when a number of its traditional borrowers are developing quickly. ADB must rise to these challenges and adapt with the times to demonstrate that it is well equipped to effectively meet the emerging needs of its clients. In this regard, ADBI has an important role to play in providing the knowledge inputs to help strengthen the relevance of ADB.
So, on the occasion of its tenth anniversary, I congratulate ADBI on its achievements. I encourage the Institute to continue in its efforts to remain prescient and forward looking and hope to see the Institute become one of the leading knowledge centers in the region.
Haruhiko KurodaPresident, Asian Development Bank

This volume celebrates and revisits development issues in Asia and the Pacific highlighted by the Asian Development Bank Institute (ADBI) over the last ten years. A Decade of Developments covers a lot of ground, thanks to the distinguished scholars who addressed questions covering broad topics and the equally distinguished discussants who objectively commented on the key issues raised by the scholars. We are fortunate to have had honorable chairpersons with extensive knowledge who were able to guide us in an interesting set of intellectual debates on some specific issues. The conference did not dwell on the past but instead looked to the future regarding each of the topics, answering the key questions of:
(i) How the legacy of the Asian financial crisis of 1997–1998 impacts future economic and financial initiatives at the national and regional levels;
(ii) What analytical and policy implications are drawn by moving from the single objective of poverty reduction to including concerns about inclusive and sustainable growth; and
(iii) What will come as the region embarks on even greater regional cooperation and integration.
We are most grateful to these distinguished participants, as well as the attendees’ high-caliber questions and discussions, for providing an insightful and meaningful body of work.
Finally, I wish to acknowledge the talented and dedicated staff of ADBI, both past and present, without whose hard work and dedication ADBI could not fulfill its role.
Masahiro KawaiDean, Asian Development Bank Institute

Ifzal Ali is Chief Economist, Economics and Research Department, ADB. Over his career in ADB he has assumed various key positions including Senior Strategic Planning Officer, Assistant Treasurer, and Deputy Treasurer. Prior to ADB, he was Professor/Chairman of the Economics Area in the Indian Institute of Management Ahmedabad. His research interests include the role of macro and microeconomic policy reforms in the context of globalization and competitiveness for the developing countries of Asia. His research focus in the past two years has been on inclusive growth. He holds a PhD in economics from John Hopkins University.
Mohamed Ariff is the Executive Director of the Malaysian Institute of Economic Research (MIER). He was the Chair of Analytical Economics at the University of Malaya, where he also served as Dean of the Faculty of Economics and Administration. He was conferred emeritus professorship by the University of Malaya in 2004 and “Datukship” by His Majesty the King in 2007. He has authored, co-authored, and edited many books and monographs, in addition to publishing numerous articles in academic journals and mass media. His work deals with international trade, foreign direct investments, and regional economic integration. He obtained his PhD in 1970 at the University of Lancaster, England, as a Commonwealth Scholar.
Akira Ariyoshi is the Director of the International Monetary Fund (IMF) Regional Office for Asia and the Pacific, monitoring regional economic and financial developments in the region. He joined Japan’s Ministry of Finance as a career civil servant in 1976 and held a variety of positions, most recently Deputy Director-General of the International Bureau. He also has worked at the IMF in Washington, DC on two occasions, most recently from 1998 to 2000 as Assistant Director of the Monetary and Exchange Affairs Department (now Monetary and Financial Systems Department). He holds a PhD in economics from the University of Oxford.
Iwan Azis is a Professor and Director of Graduate Study in Regional Science at Cornell University. He was the Chair of the economics department at the University of Indonesia and Director of the Inter-University Center for Economics. He has conducted research and consulting work for various international organizations, universities, and governments. He has addressed topics of financial economics, regional economic modeling, and linkages
between macro-financial policy and social issues. During the last five years, he has published numerous articles, and is currently working on two books. In 2006, he received a “Distinguished Scholar in Regional Science, Financial Economics, and Economic Modeling” award (in Lisbon, Portugal). He is a regular Visiting Fellow at ADBI.
Thanong Bidaya is a Visiting Fellow at ADBI. He served as Associate Researcher at the World Bank, and later as Assistant Professor at the National Institute of Development Administration (NIDA) in Thailand. His private sector experience includes the Thai Military Bank (TMB) and the Shinnawatra group developing project finance for telecommunications systems. In 1993, he became President of TMB. In 1997, he was appointed Finance Minister to manage Thailand’s economic crisis. He was appointed Chairman of the National Economic and Social Development Board as well as Thai Airways International before joining the Thai cabinet as Commerce Minister. He later served again as Finance Minister from 2005 to 2006. He received a PhD in management and a master’s degree in economics from Northwestern University.
Siow Yue Chia is a Senior Research Fellow at Singapore Institute of International Affairs. She was previously a professor of economics at the National University of Singapore and retired as Director of the Institute of Southeast Asian Studies in 2002. She was the Regional Coordinator of the East Asian Development Network and has also been a consultant to several international and regional organizations. She has published extensively, with over 150 books and journal and professional articles. Her research interests include the Singaporean economy; economic integration and regional trading agreements in the Association of Southeast Asian Nations (ASEAN) and Asia-Pacific Economic Cooperation (APEC); international trade and foreign direct investment in Asia and the Pacific region; and poverty, economic development, and labor migration in East Asia. She has a PhD in economics from McGill University.
Antoni Estevadeordal is Manager of the Integration and Trade Sector at the Inter-American Development Bank (IADB). He has expertise in trade policy, economic integration, and regional cooperation in Latin America and the Caribbean, Asia, and Europe. He is responsible for IADB operational support, technical assistance, and the policy research program on trade development issues and regional integration initiatives. He coordinates several joint initiatives with partner agencies. Before joining IADB, he taught at the University of Barcelona and Harvard University.

He has published in major journals and contributed to several books. He has coordinated several IADB reports and is currently preparing a report on Latin America and India. He has a PhD in economics from Harvard University.
Azidin Wan Abdul Kadir is a fellow in the macroeconomic trends and forecasting section of the Malaysian Institute of Economic Research (MIER). His section produces the quarterly outlook report for the Malaysian economy and the quarterly survey reports on consumer and business confidence. He has been involved in projects for the public and private sectors, such as studies for the national industrial master plans, the auto industry, and the wood industry. He holds a MSc in statistics from the University of Iowa, United States.
Masahiro Kawai became Dean of ADBI in 2007 after serving as Head of ADB’s Office of Regional Economic Integration. Previously, he was a professor of economics at the University of Tokyo’s Institute of Social Science. He also served as Deputy Vice Minister of Finance for International Affairs of Japan’s Ministry of Finance and Chief Economist for the World Bank’s East Asia and the Pacific region. He has published numerous books and academic articles on economic globalization and regionalization, and regional financial integration and cooperation in East Asia. He earned his PhD in economics from Stanford University.
Justin Yifu Lin is Professor and Founding Director of the China Center for Economic Research (CCER) at Peking University and a professor of economics at Hong Kong University of Science and Technology. He is also a Senior Advisor to the Drafting Committee of China’s Tenth Five-year Plan, the State Leading Group of IT Development, and the mayors of Beijing, Shanghai, Tianjin, and Liaoning Provinces. He is a member of the National Committee, China People’s Political Consultation Conference. He is the author of eight books, including The China Miracle: Development Strategy and Economic Reform and State-owned Enterprise Reform. He has published over 100 articles in refereed international journals and other publications on history, development, and transition. He received his PhD in economics from the University of Chicago.
Peter McCawley is a former Dean of ADBI and Visiting Fellow at the Australian National University. He has worked as an adviser to the Australian Government, Indonesian Ministry of Finance, and various international agencies on foreign aid and international economic issues. He is a former Deputy Director General of AusAID, where he served on

the Executive Committee until 2002, and was a member of ADB’s Board of Directors from 1992 to 1996. He has regularly been involved in the negotiations for the replenishment of ADB’s Asian Development Fund. He has published numerous articles in academic journals and the media. He graduated from the Australian National University with a PhD in economics.
Peter A. Petri is Dean of the International Business School and the Carl J. Shapiro Professor of International Finance at Brandeis University. He has served as Visiting Scholar at the Organisation for Economic Co-operation and Development (OECD) Development Centre, as a Fulbright Research Scholar at Keio University, and as a Brookings Policy Fellow. He has consulted for the World Bank, OECD, and United Nations. He is a member of the Board of the United States Asia Pacific Council, the International Advisory Group of the Pacific Economic Cooperation Council’s Trade Policy Forum, and the Pacific Trade and Development Forum (PAFTAD) International Steering Committee, and is a former Chair of the US APEC Study Center Consortium. He received his PhD in economics from Harvard University.
Yasuyuki Sawada is an Associate Professor of Economics at the Graduate School of Economics, Tokyo University. His field of expertise includes development economics, applied micro-econometrics, and field surveys. He has worked on both micro-econometric studies of household poverty and community participation and on macroeconomic analyses of debt and currency crises of middle- and low-income countries. His current interests include natural and manmade disasters, official development assistance, economic analysis of suicide, dualistic development, and intra-household resource allocation in Japan. He has a PhD in economics from Stanford University.
Aftab Seth is Chairman of the International Advisory Committee and a professor of the Global Security Research Institute, Keio University. He is a former Ambassador of India to Japan, Greece, Viet Nam, and Federated States of Micronesia. He is a member of the Advisory Board of the Global Indian International School of Tokyo and the Board of Management of the Indian Institute of Foreign Trade. He is also Chairman of the International Advisory Board of the World Peace and Development Association, People’s Republic of China, and Director to the Japan–India Association. He was a Rhodes Scholar at Oxford and received his law degree from the American College of Greece.

Kati Suominen has served since 2003 as International Trade Specialist at the Inter-American Development Bank in Washington, where she leads team research projects on global trade issues and coordinates several inter-institutional initiatives. She has spoken at such venues as the World Bank, World Trade Organization, US International Trade Commission, United Nations, Organization of American States, European Commission, and Asia-Pacific Economic Cooperation conferences. She is currently co-authoring and editing six books, among them Regional Rules in the Global Trading System Trade Agreements (IDB-WTO book to be published by the Cambridge University Press, 2009) and Sovereign Remedy? Leveraging Trade Agreements in Globalization (Oxford University Press, 2008). She is a candidate at the Wharton School’s MBA Program for Executives Class of 2009. She holds a PhD in political economy from the University of California, San Diego (2004).
Shinji Takagi is a Visiting Fellow at ADBI and professor of economics at the Graduate School of Economics, Osaka University. His numerous professional appointments have included Economist, IMF; Senior Economist, Japanese Ministry of Finance; Visiting Professor of Economics, Yale University; and Advisor, IMF Independent Evaluation Office. He is a specialist in international monetary economics and is the author of over 70 publications, including four books. His recent work has dealt with exchange rate policy, emerging market crises, capital market development, and regional policy cooperation. His textbook on international monetary economics is currently in its third edition. He holds a PhD in economics from the University of Rochester.
Hiroshi Watanabe is Special Advisor to the President of the Japan Center for International Finance (JCIF), and is Japan’s former Vice Minister of Finance for International Affairs. He joined the Ministry of Finance in 1972 and served in many areas, including taxation policy formulation. From 1998 to 2001, he served as the personal secretary to then Finance Minister Kiichi Miyazawa and took the leadership in the discussion on the New Miyazawa Initiative to assist crisis-affected Asian countries. In addition, as a senior official of the International Bureau of Japan’s Ministry of Finance from 2001 to 2003, he focused on promoting Asian monetary cooperation and bilateral assistance. He graduated with a law degree from the University of Tokyo and holds a master’s degree in economics from Brown University.
Yuen Pau Woo is President and Co-CEO of the Asia Pacific Foundation of Canada. He is Canada’s representative on the Standing Committee of

the Pacific Economic Cooperation Council (PECC), chairing the Pacific Economic Outlook forecasting panel, and he coordinates the annual State of the Region report. He is Director of the APEC Study Centre in Canada and is on the management boards of the National Centres of Excellence in Immigration (University of British Columbia and Simon Fraser University) and Emerging Markets (University of Ottawa). He is also an advisor to the Centre for Asia-Pacific Initiatives at the University of Victoria, the Shanghai WTO Affairs Consultation Centre, and the Asian Development Bank. He was educated at the University of Cambridge and the University of London.

ADB Asian Development Bank
ADBI Asian Development Bank Institute
AFTA Association of Southeast Asian Nations Free Trade Agreement
AKFTA Association of Southeast Asian Nations–Republic of Korea Free Trade Agreement
AP Asia-Pacific
APEC Asia-Pacific Economic Cooperation
ASA Association of Southeast Asian Nations Swap Arrangement
ASEAN Association of Southeast Asian Nations
BIT bilateral investment treaty
CAD comparative advantage-defying
CAF comparative advantage-following
CAFTA Central America Free Trade Agreement
CER closer economic relations
CF common factor
CFA common factor analysis
CI convergence index
CMI Chiang Mai Initiative
ECAFE Economic Commission for Asia and the Far East
EPA economic partnership agreement
ESCAP Economic and Social Commission for Asia and the Pacific
EU European Union
FDI foreign direct investment
FTA free trade agreement
FTAAP Free Trade Area of the Asia-Pacific
GDP gross domestic product
HDI Human Development Index
IADB Inter-American Development Bank
ICOR incremental capital-output ratio
IMF International Monetary Fund

KORUS Republic of Korea–United States Free Trade Agreement
LSI Lisbon Strategy Indices
M&A merger and acquisition
MFN Most Favored Nation
NAFTA North American Free Trade Agreement
NEER nominal effective exchange rate
NIE newly industrializing economy
NPL non-performing loan
OECD Organisation for Economic Co-operation and Development
OLS ordinary least squares
PC principal component
PCA principal component analysis
PRC People’s Republic of China
PTA preferential trade agreement
R&D research and development
REER real effective exchange rate
ROOs rules of origin
RTA regional trade agreement
SWF sovereign wealth funds
TCI technology choice index
UNCTAD United Nations Conference on Trade and Development
UNDP United Nations Development Programme
US United States
WCO World Customs Organization
WTO World Trade Organization

Masahiro Kawai
Susan F. Stone
This volume represents the first in a series of publications of the Asian Development Bank Institute (ADBI) Annual Conference. The 2007 conference, entitled “A Decade of Developments,” marked the tenth anniversary of ADBI and, as such, attempted to combine a retrospection of its history along with an anticipatory look at potential issues for its future. Asia and the Pacific region has seen many developments since the Institute’s inception in 1997 and the diversity of chapters contained herein reflects this.
When ADBI was founded, several East Asian economies were in the midst of a financial crisis. Over the ten years since that time, Asia has seen not only a remarkable economic renewal, but also substantial growth based on a solid foundation of financial and governance reforms. East Asia has re-emerged as the most dynamic region of the world economy, demonstrating its resilience and robustness. ADBI’s own growth has mirrored this dynamism and robustness.
Since the 1997–1998 crisis, there have been numerous studies identifying its causes and effects. Now, ten years later, it is time to take stock of the region’s progress in post-crisis reform and assess its adaptation to the new global and regional landscapes. The first session of the conference dealt with these issues. Specifically, the session asked: What are the lessons from the crisis? How can Asian policymakers strengthen their economic and financial conditions to sustain growth and stability? How will this growth be financed?
Ariff and Kadir, in Chapter III, “Asian Crisis Ten Years On: Policy Perspectives,” argue that crisis-hit countries have recovered, but not to the level of their past performance. On the positive side, significant reforms have been carried out in the banking and corporate sectors. However, the crisis has precipitated a precautionary move by many governments to self-insure by amassing large amounts of foreign reserves as protection against another precipitous outflow of funds. This strategy highlights continued weakness in the area of capital flow management and the fragility of financial institutions. Asian countries should adopt a flexible exchange

rate regime that is in line with clearly stated monetary policy objectives. A stronger regulatory and supervisory framework for financial institutions, sound risk management tools, and greater competition in the financial markets are needed. Regulations have been improved and lending practices made more prudent, but more work needs to be done.
The rigidity of exchange rates has been identified as a key cause of the crisis. Today, there is little evidence that the level of flexibility has changed much, measured in terms of volatility. The “fear of floating,” or the fear of volatility, is still present in Asian countries, as is the fear of overvalued currencies, which could potentially undermine the export competitiveness that was a key engine for the rapid emergence from the crisis. Thus, there is little incentive for crisis-hit countries to adopt fully flexible exchange rate regimes despite the strong evidence to the contrary (see, for example, Shatz and Tarr 2006; Yu 2007).
The large stocks of foreign exchange reserves accumulated to guard against adverse capital movements are not optimal and involve costs. This is especially true when the returns on these stocks are less than debt servicing, which is the case for a number of Asian economies. In addition, it is not even clear whether such large stocks would alleviate or exacerbate another crisis, depending on the source of the crisis.
The case for a regionally cooperative approach to these matters is strengthened by the rise in intra-Asian trade as well as growing integration of the financial sector. While such regional economic cooperation would provide support during bad times, it can also mean that countries are more exposed to external shocks and destabilizing capital movements. Balancing these two opposing forces requires consistent policy frameworks across the region. While there are no policies that can totally insulate a country from the threat of destabilizing capital movements, consistently prudent and transparent macroeconomic policies can reduce the chances of reversals in capital flows.
These foreign exchange reserves have traditionally been channeled almost exclusively to Western nations such as the United States (US) in the form of Treasury bonds. The wisdom of this approach is being questioned, especially given Asia’s continued growth, the emergence of the People’s Republic of China (PRC) and India as large economic agents, and the fact that the need for investment within the region is at an all-time high. The estimated need for investment in infrastructure alone is expected to exceed US$250 billion annually for the next ten years (Sharan et al. 2007). Part of Asia’s foreign exchange reserves could be invested abroad in such

infrastructure projects through newly established Sovereign Wealth Funds. In Chapter II, “Financing Asian Growth,” Petri examines the micro and macro aspects of funding a region that is expected to grow faster than the rest of the world over the next decade.
It is estimated that between 2005 and 2025, PRC, Viet Nam, India, and Bangladesh will experience some of the highest economic growth rates in the region, as measured by per capita gross domestic product (GDP). This growth is projected to be matched by the highest population growth. Figure 1.1 shows the effect of population growth on per capita GDP. Population growth follows the GDP per capita projections.
The key macro question is whether world savings will be large enough to finance global growth, let alone Asia’s rapid expansion. The figures in Table 1.1 show that the rapid productivity improvements and capital accumulation are driving forces of future Asian growth (Roland-Holst, Verbiest, and Zhai 2005). Some of the highest growth due to capital growth can be seen in developing Asia. These have important implications for Asia’s investment environment and its large pool of savings.
-1% 0% 1% 2% 3% 4% 5% 6% 7% 8%
Japan
Rest of the world
Europe 17
Hong Kong, China
Singapore
Latin America
United States
Australia, NZ
Taipei,China
Republic of Korea
Philippines
Sri Lanka
Malaysia
Indonesia
Thailand
Bangladesh
India
Viet Nam
PRC
Per capita GDP
Population

In his estimation of future savings rates for Asia, Petri uses growth rates that are slightly higher than those reported in Roland-Holst, Verbiest, and Zhai (2005). However, Petri argues that the numbers reported in Roland-Holst et al. were prepared some time ago and appear “... to have underestimated what appears to be the accelerating dynamism of Asian economies” (35).
While the current high level of optimism cannot be expected to continue for another 15 years, Asian economies appear to be creating enough independent regional engines of growth to sustain significant expansion. Deepening regional ties should reinforce this dynamism and lead to faster growth than appeared possible even a few years ago. Several scenarios are built on three basic components: savings rates, capital/output ratios, and growth rates.
Petri uses incremental capital output ratios at levels consistent with, or slightly below, the 1999–2005 average for the region. Historically, these levels change little and, indeed, do not vary much across countries. Thus, the assumptions have limited impact on the overall results and play only a modest role in distinguishing scenarios in Petri’s work.

All countries in the region are shown to be major capital exporters in the next 15 years, with the exceptions of Japan and Singapore. These two countries will experience declining savings rates in the face of expected demographic changes and will converge toward developed-country norms. The overall range of outcomes, however, shows that Asian savings are very likely to remain positive and that the region will be an exporter of capital.
The chapter goes on to deal with issues of risk sharing and allocational efficiency. How does the difference between Asia’s deepening intra-regional trade and its much less regionalized pattern of asset holdings affect its ability to fund future growth? Asia generates over 30% of world savings and yet absorbs about 20% of world investment and produces only 22% of world output. How does such a pattern affect Asia’s ability to fund its growth?
According to Petri’s forecasts, based in part on the distribution of current portfolio holdings and taking into account differentials in projected growth and savings rates, real global portfolio assets are expected to grow by 4.5%. However, the structure of these investments is shown to change less dramatically. While the most rapidly growing cross-border investment occurs for Asia’s investment in Asian assets, these holdings total only about 2% of global assets. Thus, while Asia is expected to produce more than a quarter of world output by 2020, Asian assets will comprise only 13% of the global portfolio. This implies the risks of Asian economic fluctuations will remain disproportionately held by Asians and the region will not benefit from the diversification that full participation in capital markets would bring.
This finding points to a generally accepted axiom: the key to financing Asia’s future is in the efficient handling of the region’s savings and investment. Inefficiencies may arise in the form of excess savings but equally important is an insufficient stock of internally traded assets and thus an inadequate sharing of investment risk. Petri suggests an answer could come in the form of increased consumption, which would develop regional demand and help offset potential declines in international demand for investment opportunities. He argues that measures needed to combat these potential pitfalls would be to reduce uncertainty faced by individuals (suggesting social insurance); relax constraints of inconsistent income and consumption streams by reforming financial markets, allowing for greater latitude in investment instruments; and keep inflation rates low through exchange rate and other policies.
These policies would need to consider not only the impact of aggregate flows of savings and investment, but the distribution of those flows. The next

session of the conference turns to this question: how can Asians share in the tremendous growth of the region? How do policymakers maintain diligence in poverty reduction efforts while assuring equitable growth opportunities for all?
The same substantial growth that has led to financial market dilemmas has also helped achieve significant and dramatic poverty reduction in the region (see Table 1.2). Each of the subregions shown has experienced large declines in extreme poverty while overall Asia has gone from 35% of the population living on US$1 per day to 18%: an almost 50% decline. However, poverty incidence measured at the US$2 per day level remains high. Between 1990 and 2005, this measure fell only 30%, from 75% to 52%. While this is not an insubstantial amount, it means that over half of the population of developing Asia is still living in very poor conditions.

At the same time, the report of ADB’s Eminent Persons Group pointed out that only four of the ten developing economies in the region—accounting for the vast majority of the region’s population, GDP, trade, and savings—are estimated to have per capita incomes close to the internationally accepted threshold for low-income countries (ADB 2007). In addition, the World Bank projects that by 2020, 95% of East Asians will live in middle-income countries and fewer than 25 million of the two billion East Asians will live below the poverty line (World Bank 2007).
So, while Asia continues to be home to low-income and small economies where development challenges persist, a significant number of economies are dealing with the issues of strong growth and rapid expansion. The support needs and policy responses to these two distinct trends are quite different. The Asian Development Bank, and ADBI as a key provider of a long-term strategic perspective, needs to grapple with the challenge of remaining relevant and serving the needs of the fast growing members of the region without forgetting about those still mired in poverty and stuck in a pattern of underperformance.
While rising disparities in income are not unusual during periods of rapid growth, structural changes need to ensure that the majority of people benefit from the growth. Unless the rising disparities between and within countries are addressed immediately, they could ultimately threaten the social cohesion and political stability of many countries. This, in turn, could lead to a political backlash bringing to power political leaders opposed to economic liberalization. Were this to happen, economic growth and private capital flows to Asia and the Pacific region would suffer major setbacks. In Chapter IV, “Poverty Reduction, Inclusive Growth, and Development Strategies,” Lin asks what the appropriate development strategy should be to lead a nation out of poverty in an equitable way. In Chapter V, “Rising Inequalities in Asia: An Imperative for Inclusive Growth,” Ali argues that growth strategies have to be broadened beyond simply “pro-poor” to encompass increased opportunities for all economic agents.
Development strategy is a key determinant of a developing country’s ability to achieve sustainable, dynamic, inclusive, and equitable growth, according to Lin. Distortions in a developing country are endogenous to the degree that policies are adopted that protect and subsidize nonviable firms. He refers to this as the comparative advantage-defying (CAD) strategy. Under this approach, governments implement industrial policies based on “catching up” with developed countries through the rapid adoption of technologies used in these economies.

On the other side is the comparative advantage-following (CAF) strategy. Under this approach, governments encourage firms to enter industries for which the country has a comparative advantage and to adopt production technologies based on this comparative advantage. Lin argues that this strategy leads to the development of viable firms. A developing country that adopts this strategy has no need to provide subsidies or protections to firms, thus reducing a firm’s potential rent seeking activities and the drain on government finances.
Much has been written on the ability of a developing country to “catch up” with the developed world by importing technology and therefore effectively skipping a stage of development. However, as has been shown elsewhere (Rodrik 1998; Acemoglu, Johnson, and Robinson 2001; Acemoglu and Robinson 2002, for example), developing countries often fail to catch up due to bad institutions and inappropriate government intervention. This stems from a basic conflict between the government’s development strategy and the country’s endowment structure. By promoting the development of modern, capital-intensive industries to the exclusion of other industries that may be more conducive to the country’s natural resource endowment, a country sets itself on an untenable path.
Governments that believe that supporting capital-intensive heavy industries will lead to greater growth, in the face of an incompatible factor endowment structure, will find themselves with unsustainable industries requiring constant subsidies. This will then lead to a lack of resources available to develop more “endowment-consistent” industries.
The CAD approach engenders a reinforcing cycle as these capital-intensive sectors’ incentives are to use their viability problem as an excuse, increasing the resources used to lobby government officials for preferential loans, tax credits, etc. The more the government follows this misguided policy and succumbs to these lobbying efforts, the more hampered is its ability to spend on programs in areas such as health and education. Further, this strategy leads a country to become more inward-looking as it attempts to substitute imports of capital-intensive manufactured goods for domestic production.
These CAD strategies are most detrimental to the poor, most of whom are living on agricultural incomes in rural areas not supported by any consistent government policies. The most important asset of the poor is their labor, which is helped little by the promotion of capital-intensive industries. In addition, the farm products they produce, such as grains, have low income and price elasticities. Because of the low elasticity of income,

overall economic growth will have minimum effects on the demand for farm produce. Because of the low price elasticity, production increases of an individual rural household may increase its income. However, when most households increase their production, the resulting downturn in prices will have a detrimental effect on farm income.
To study the effect empirically, Lin developed a technology choice index (TCI), which is a proxy for the development strategy followed by a country. The TCI measures the relative relationship between manufacturer and labor value added in total value added. Each of a group of developing countries was then assigned a TCI. If a country adopted a CAD strategy, the TCI was expected to be larger than if it did not. Lin then examined the relationship of the index with various income distribution measures, including Gini coefficients.
The results strongly support the hypothesis that the more a country pursues a CAD strategy the more severe will be the income disparity in that country. Lin argues that his results hold regardless of the initial income distribution. From these findings, the development strategy is an important determinant of income distribution in a country. When a country follows a CAF strategy, income distribution tends to become more equal over time even if the country’s initial income distribution is unequal.
When a country follows a CAD strategy, the existing distortions become endogenous to the needs of protecting and subsidizing the nonviable firms. To achieve inclusive and equitable growth, the government should stop investing in these industries and invest in education so that the labor in the rural and traditional sectors will have the ability to adapt to the job requirements in the modern, urban sectors.
In his chapter, Ali echoes Lin’s argument that governments have neglected the agricultural sector. He argues that while economic development entails a move away from the farm to industry and services, deficiencies in public investments in agriculture and the rural economy more generally have been problematic precisely because the productivity of agriculture determines the living standards of many people in Asia. Thus, a major factor affecting poverty alleviation efforts—agriculture—remains underexploited.
The 2006 World Development Report (World Bank 2005) also argued for the importance of the pursuit of equal opportunity while avoiding extreme deprivation. Achieving inclusive growth hinges on the ability to create economic opportunities through sustainable growth and to make those opportunities available to all, including the poor.

The chapter’s key message is that rising inequalities and the persistence of unacceptably high levels of non-income inequalities pose a serious challenge to Asia’s sustained progress. Inclusive growth that focuses on creating opportunities rapidly and making them accessible to all, including the disadvantaged, is a necessary but not sufficient condition for reducing inequality. Broader measures need to be taken.
Uneven growth in Asia has occurred over three dimensions. Growth has been uneven geographically, between rural and urban sectors, and across households, such that incomes at the top of the distribution have grown faster than those in the middle or bottom.
While there has been significant post-crisis improvement in some areas, a broad deterioration of public ethics, public institutions, and public administration has resulted in significant leakages in public expenditures, preventing them from reaching the target groups. Not only is there unequal access to the opportunities brought about by strong economic growth, there is a basic inequality in access to public services, which perpetuates this unequal access and undermines the potential of the region’s poor. The lack, or misspecification, of public expenditures contributes to social pressures, as indicated by higher poverty rates or lower literacy rates, and has been found to be significantly associated with a higher intensity of violent crime.
Both chapters explore the validity of the Kuznets curve in the Asian context. Lin rejects the inverted-U hypothesis of income distribution. Ali also finds problems with this theory, noting weak empirical evidence. The examples of the Republic of Korea and Taipei,China, where Gini coefficients actually declined over some periods of rapid growth, go some way to substantiate this skepticism. Ali’s chapter argues that the causality may even run in the opposite direction, meaning that great inequality can actually hinder future growth.
If inclusive growth has to do with opportunities and the distribution of opportunities throughout the population, policymakers need to look beyond traditional income redistribution schemes to correct the problem. Ali argues that inclusive growth needs to be built around three pillars: maximizing economic opportunities; ensuring a minimum economic well-being with social protections; and ensuring equal access to economic opportunities through education and health programs as well as basic infrastructure, keeping in mind the distinction between the equality of opportunities and the equality of outcomes. The equality of opportunities is a necessary but not sufficient condition to ensure equality of outcomes.

When taking a regional perspective, however, is equality of outcomes a practical goal? The region needs to strive for equal opportunities and this can be achieved through a transparent and integrated economic community in which opportunities can be accessed region-wide. Regional integration in Asia has been underway for some time through market-driven trade, foreign direct investment and finance, and the formation of regional production clusters and supply chains. However, it is only since the 1997–1998 crisis that Asian policymakers have begun to join forces in a more systematic way to strengthen regional economic and financial cooperation.
East Asian economies have grown rapidly over the last four decades. This growth has been driven by the expansion of production networks and supply chains, formed initially by global multinational corporations and later by East Asian business firms. More recently, East Asian governments have embarked on policy initiatives for formal economic integration through a series of bilateral and plurilateral free trade agreements (FTAs). The Association of Southeast Asian Nations (ASEAN) is emerging as the integration hub for FTA activities in East Asia, with PRC, Japan, and Republic of Korea all making formal economic ties with ASEAN. More recently, India and Australia have joined the rush to be part of the FTAs with East Asia.
There is a view, however, that the proliferation of multiple, overlapping FTAs and regional trade agreements (RTAs) may work against the World Trade Organization (WTO) Doha round. As Estevadeordal and Suominen point out in Chapter VI, “State of Integration in the Asia-Pacific Region: Current Patterns and Future Scenarios,” the number of RTAs has grown to such an extent that today some 200 agreements have been notified to the WTO. That number is expected to double by 2010. While Asia has been a relative newcomer to this trend, it has caught up fast (see Table 1.3). The Asian financial crisis has been a significant force in propelling Asia toward RTAs in recent years. This event increased awareness of the importance of regional economic policy coordination.
As the region deepens its economic and financial interdependence, an increasing acknowledgement has emerged among the region’s national authorities that they cannot achieve financial stability by acting independently—that they need to work together (Baldwin 2006). Along these lines, the region has developed several cooperative initiatives other

than RTAs, including the Chiang Mai Initiative and the Asian Bond Markets Initiative.

But these agreements, as some may worry, are not part of a drive to isolate Asia from the rest of the world. If designed properly, economic regionalism can lead to deeper global integration (Kawai 2007). A particularly strong motivation for those signing up to RTAs, argue Estevadeordal and Suominen, is the concern about remaining outside the proliferating network of RTAs around the world as well as in the region. Asian countries do not want to be excluded from potential markets and growth opportunities. But there continue to be concerns that the proliferation of agreements will lead to a “noodle bowl” effect, reducing efficiency, creating trade diversion, and unnecessarily complicating regional business dealings.

On the other hand, Estevadeordal and Suominen point out that the rise of RTAs can also act as a catalyst for greater regional cooperation as countries work together against potential negative externalities or the possible transmission of “crises” across borders. Positive externalities from RTAs can engender trust and institutionalization of cooperation, stimulating further cooperation.
In Estevadeordal and Suominen’s view, Asian agreements have some of the least restrictive concessions, including rules of origin (ROO) regimes. Unlike the “straitjacket” ROO model that the European Union (EU) uses, agreements in Asia and the Americas are marked by diversity, allowing for the accommodation of RTA-specific idiosyncrasies. The regional agreements have also employed such measures as short supply clauses to help producers adjust to shocks in availability of interregional inputs.
Estevadeordal and Suominen go on to compare customs procedures, investment service provisions, and other aspects of RTAs. They conclude that Asian agreements are somewhat less encompassing in some of the major trade-related provisions explored. These types of agreements imply that the region may be better placed than other RTAs in allowing participants to take advantage of changing global trends. History teaches us that it is important to embed regional groupings in a broader geographic context to avoid the risk of becoming closed blocs (Bergsten 2007). By taking this approach, Asia could sweep under one umbrella the exploding proliferation of bilateral and subregional preferential trade agreements throughout the region. It would eliminate, in whole or in part, the increasing discrimination that such pacts are introducing to the region.
The pulling together of agreements in Asia could follow a precedent set by other megaregional trade negotiations that have proceeded in an area with a number of preexisting RTAs. In these cases, the new agreement builds on those already in existence, the EU being the most obvious example. While Asia’s “noodle bowl” of agreements can be quite messy, the reality is that regionalism is here to stay and policymakers must work within its confines. Indeed, in Chapter VII by Bo and Woo, “A Composite Index of Economic Integration in the Asia-Pacific Region,” the authors show that regionalism and economic integration over and above that driven by RTAs have steadily strengthened in the region over the past 15 years. Indeed, they argue, this steady integration has created a need for consistent and reliable measures of integration.
A useful approach to resolve this proliferation of regionalism is to multilateralize regionalism and make the process as multilateral-friendly

as possible (Bergsten 2007). One direction along this line is the creation of an East Asia-wide FTA based on ASEAN+3 countries (East Asian FTA) or ASEAN+6 countries (Comprehensive Economic Partnership in East Asia) by consolidating bilateral and plurilateral FTAs in the region (Kawai and Wignaraja 2008).1 Another direction is the formation of an FTA among Asia-Pacific Economic Cooperation (APEC) members, i.e., an FTA of the Asia-Pacific (Bergsten 2007). Under the latter direction, the need for such transpacific institutions as APEC is only strengthened, according to Bo and Woo. The challenge for such institutions is not so much the complications that arise from the proliferation of East Asian RTAs but rather, as Bo and Woo state, from the lack of institutional commitment to the regional approach these organizations have at times displayed.
Thus, the main challenge for the region in the near term is to define a future integration strategy that leverages the wave of reforms and RTAs while retaining Asia’s already important gains from liberal global trade and investment regimes. To build on this regionalism, it is important to determine the exact nature of the integration Asia has been undergoing and whether this level is sufficient to move into a multilaterization of regionalism such as that called for above. Bo and Woo attempt to go beyond conventional measures of integration by taking a spectrum of indicators to arrive at a composite index. They point out that although there are many single variable measures of regional economic integration, relatively little work has been done on a composite index. To derive an index of integration, Bo and Woo apply a method similar to that used by the United Nations Conference on Trade and Development in determining their Trade and Development Index.
To include as much information as possible, Bo and Woo use a multi-dimensional dataset. Given the diversity of the dataset, determining the weights becomes a key element in the process. A good index carries the essential information of the underlying data without bias toward one or a handful of indicators. The authors argue that by using a two-stage principle components analysis (PCA) to obtain the weights, such bias is minimized. The first stage measures the dispersion of the sample countries’ main macroeconomic indicators while the second stage applies indicators of trade,
1 ASEAN countries consist of Brunei Darussalam, Cambodia, Indonesia, Lao People’s Democratic Republic, Malaysia, Myanmar, Philippines, Singapore, Thailand, and Viet Nam. The “plus six” includes Japan, People’s Republic of China, Rep. of Korea, India, Australia, and New Zealand.

foreign direct investment, and tourism, as well as the convergence index to compute the final composite index.
Seven measures are collected for a range of countries covering East Asia, North America, Southeast Asia, and Oceania from the period 1990 through 2005. An important variation in this index is the exclusion of flows between Asia-Pacific economies that are already part of a subregional unit. Bo and Woo argue that the shortcoming of previous integration measures is that they ignore the effects of such agreements and, as such, are an overstatement of the level of integration in the region. Since most of the studies measuring integration ignore the effects of these regional agreements on an economy’s broader integration with the world, the chapter argues that they provide an inaccurate reading of globalization.
Using their composite index, Bo and Woo find results consistent with the anecdotal evidence that the level of economic integration in the region is growing. From a broad view, the relative ranking of the level of economic integration in the Asia-Pacific region has remained remarkably steady over the time period examined. Individual economies like Singapore and Hong Kong, China are shown to be most integrated with the region, while the US and Canada are the least integrated with Asia and the Pacific.
The ASEAN economies are the most integrated in the Asia-Pacific region (that is, they rely most heavily on the Asia-Pacific regional market), followed by Australia, whose level of integration is close to the regional average. The PRC is next but its level has been declining in the past five years as it increases its links with Hong Kong, China; Macau; and Taipei,China as well as expands its markets in the EU.
The authors point out that while there may be some issues with the PCA measure, such as the overreliance on sample-dependent weights, the problems can be overcome using different permutations such as a “chained index.” In the end, the importance of accurately measuring the state of integration in the Asia and Pacific region is too important not to try.
So it would appear that several metrics show the Asia and Pacific region to be highly integrated. It remains a challenge to find a clear path through the proliferating approaches to this integration—whether it be through RTAs or subregional “cooperatives”—to join together under a transparent and effective policy framework in promoting an inclusive, equitable, sustainable future.

The final session of the conference was a lively panel discussion on the future directions for the Asia and Pacific region as well as the identification of the most pressing issues that will confront the region in the next decade. Seven panelists—Mohamed Ariff, Iwan Azis, Thanong Bidaya, Siow Yue Chia, Justin Yifu Lin, Aftab Seth, and Hiroshi Watanabe—were asked to identify challenges and issues that should be the focus for research, in-depth study, and capacity building for the public sector.
The major issues can be loosely grouped into four areas of concern (although there is considerable overlap):
(i) Needs for improved management, such as the serious challenges of exchange rate management and managing domestic debt in a region whose experience is mostly with foreign debt.
(ii) Needs related to institutional structures, such as the need for financial restructuring through the development of a bond market and the need to identify the best institutional framework to deal with the twin concerns of poverty reduction and economic competitiveness.
(iii) The importance of understanding interactions between issues and the special challenges they pose, such as the link between macro policies and poverty; the invasive economic implications of high levels of liquidity and excess savings, requiring a study on flows of funds; and the interaction between environmental sustainability and demographic change and their profound impacts on economic productivity.
(iv) The changing dynamics of the region, including the impact of the rise of India and PRC in comparative advantage and labor markets; the need to generate and then retain intellectual capacity in the region; and the impact of the rise of capital-intensive industries, especially in PRC and India, and its implications for social and economic policy.
Having recovered from the 1997–1998 financial crisis, Asia and the Pacific region is again the most dynamic growth center of the world economy. This growth has led to significant poverty reduction throughout the region. It has also stemmed from and benefited from the strong economic interdependence through market-driven integration the region has achieved.

ADBI looks forward to addressing the next decade of challenges that lie ahead for Asia and the Pacific to help the region reach its full potential.
Many of the major themes identified fit in well with ADB’s new Long-Term Strategic Framework, which was being formulated at the time of the conference. This document, which outlines ADB’s strategic priorities until 2020, states that in pursuing a vision of a poverty-free Asia and Pacific, ADB must achieve inclusive economic growth, environmentally sustainable growth, and regional integration. And it can achieve these objectives through five key drivers of change: the private sector, good governance and capacity development, gender equity, knowledge, and partnerships. Each of these drivers is covered in the pressing issues identified above.
This volume consists of the chapters outlined above as well as comments provided by chapter discussants and the panel discussion.

Acemoglu, D., S. Johnson, and J. Robinson. 2001. The Colonial Origins of Comparative Development: An Empirical Investigation. American Economic Review 91 (5): 1,369–1,401.
Acemoglu, D., and J. Robinson. 2002. Economic Backwardness in Political Perspective. Massachusetts Institute of Technology Department of Economics Working Paper No. 02-13.
Asian Development Bank (ADB). 2007. Toward a New Asian Development Bank in a New Asia: Report of the Eminent Persons Group to the President of the Asian Development Bank. Manila: ADB.
Ali, I., and J. Zhuang. 2007. Inclusive Growth toward a Prosperous Asia: Policy Implications. ERD Working Paper No. 97. Manila: ADB.
Baldwin, R. 2006. Multilateralising Regionalism: Spaghetti Bowls as Building Blocs on the Path to Global Free Trade. Centre for Economic Policy Research Discussion Paper No. 5,775. London: Centre for Economic Policy Research. Retrieved from http://www.cepr.org/pubs/dps/DP5775.asp.
Bergsten, C.F. 2007. Toward a Free Trade Area of the Asia Pacific. Presented at the Japan Economic Foundation and Peterson Institute for International Economics New Asia-Pacific Trade Initiatives, Washington, DC.
Kawai, M. 2007. Evolving Economic Architecture in East Asia. Kyoto Economic Review 76 (1, June): 9–52.
Kawai, M., and G. Wignaraja. 2008. Regionalism as an Engine of Multilateralism: A Case for a Single East Asian FTA. Working Paper Series on Regional Economic Integration, No. 14 (February). Manila: ADB.
Rodrik, D. 1998. Where did all the Growth Go? External Shocks, Social Conflict and Growth Collapse. NBER Working Paper W6350.
Roland-Holst, D., J.P. Verbiest, and F. Zhai. 2005. Growth and Trade Horizons for Asia: Long-term Forecasts for Regional Integration. Asian Development Review 22 (2): 76–107.
Sharan, D., B.N. Lohani, M. Kawai, and R. Nag. 2007. ADB’s Infrastructure Operations: Responding to the Client Needs. Manila: ADB.

Shatz, H.J., and D. Tarr. 2006. Exchange Rate Overvaluation and Trade Protection: Lessons from Experience. In Trade Policy and WTO Accession for Economic Development in Russia and the CIS: A Handbook, edited by David Tarr. Washington, DC: World Bank Institute.
Yu, Y.D. 2007. PRC’s Macroeconomic Management: Issues and Solutions. Presentation as part of ADBI Distinguished Seminar Series, post-event statement retrieved from http://www.adbi.org/event/2252.yu.distinguished.speaker/.
World Bank. 2005. World Development Report 2006. Washington, DC: World Bank.
World Bank. 2007. East Asia Update. Washington, DC: World Bank.


Peter A. Petri
Asia already produces more than one fifth of world output, and is likely to grow much faster than the rest of the world over the next decade or so. How will its growth be financed?
More specifically, we examine whether world savings will be large enough—at roughly constant cost—to finance global growth including Asia’s continued expansion. If savings turn out to be insufficient, Asia’s—and the world’s—investment or consumption trajectory would have to adjust downward, under the pressure of rising capital costs. If savings turn out to be excessive, world demand could turn sluggish, and would need to adjust (or be adjusted through policy measures) upward under the pressure of falling capital costs. Even relatively small variations in world savings could lead to significant adjustment pressures; at times the world is thought to be short on savings, and at times to be awash in liquidity. In the early 1990s, for example, the global savings rate dropped to 21.6% and a substantial economic literature emerged concerning the global “capital shortage.” In 2006, with world savings up to 23.6% (the highest in a decade), discussion turned to a world “savings glut.” In fact, world savings rates have remained within a two percent range for two decades.
This chapter explores the financing requirements of Asian economies,1
looking ahead to 2020. Because the global financial environment more than a decade from now will be shaped by economic and political developments that cannot be foreseen, this kind of analysis is inherently speculative. We therefore use a scenario approach, rather than specific projections, to explore potential growth trajectories and their associated capital requirements. The purpose of the exercise is to shed light on the evolution of the components of the world’s savings balance, and in the process, to form some judgment about what pressures are likely to build on financial markets and policies.
To look ahead, our principal conclusions are that Asia’s robust propensity for savings and its growing weight in the world economy will tend to generate high global savings. When added to tighter budget constraints in the United States and potentially high savings from primary-goods exporters, global capital markets are likely to face conditions usually associated with a “savings glut.” In other words, the challenge will be to sustain demand, rather than to finance investment. From a policy 1 The study deals with 12 Asian economies that produce 97% of total Asian gross domestic
product (GDP). The economies are identified in subsequent tables.

perspective, these pressures argue for vigorous initiatives to build demand in Asia—for example, in consumption in the People’s Republic of China (PRC), and in investment in Southeast Asia.
Section 1 introduces the chapter’s scenario methodology. Section 2 develops scenario estimates of Asian savings and investment. Section 3 places these in a global context, developing scenario estimates of the evolution of global net savings. Section 4 offers brief conclusions.
Asia is important in global savings and investment and will become more so by 2020. In 2005, Asia generated one third of world savings and absorbed 29% of world investment, yet produced only 22% of world output. In other words, Asia used more than its share of capital, but saved still more—in effect financing significant investment elsewhere. We will examine the evolution of this equation by breaking it into parts and analyzing its components. Specifically, global net savings will be “dissected” by country and by analytical component. We will then project these pieces forward under several different assumptions (or scenarios).
In 2005, world capital flowed “uphill” in the sense that it moved from low- to high-income economies (Figure 2.1). The advanced economies of the world (especially the United States) imported about US$0.7 trillion in capital, with US$0.4 trillion coming from Asia, and another US$0.3 trillion from emerging markets outside Asia (principally the Middle East).

While Asian savings were generally high, there was considerable dispersion in savings performance across the region (Table 2.1), with Japan and PRC contributing approximately two thirds of the region’s overall net savings. Singapore; Malaysia; and Hong Kong, China were the region’s biggest net savers relative to income. India, Thailand, and Viet Nam were net borrowers, but borrowed relatively little. Asia overall had net savings equal to nearly 4% of income. Nearly all Asian economies (except for the Philippines) had savings rates above the world average. PRC’s and Singapore’s savings rates were no less than twice as high.
Savings, investment, and growth are linked by accounting identities and the equations of growth for the world as a whole; they are not so constrained for any country or region in the modern global economy. High savings rates can coexist with low investment rates, and vice versa. For example, in 2005, Singapore’s national savings rate was 49% while its domestic investment rate was 19%—so a full 30% of Singaporean national income was invested abroad. The relationship between investment and growth is tighter, but evidence provided below suggests that it, too, is variable when evaluated over short time periods.
We use scenarios to identify plausible future outcomes rather than attempting a specific projection. We build these scenarios for each Asian

economy from three components: savings rates, capital/output ratios, and growth rates (and specifically low, medium, and high assumptions for each). The potential number of alternatives (324 = 3 × 3 × 3 × 12 countries) is large, so we will analyze only the “all-medium” scenario and some extreme outcomes, such as the aggregate scenario (over all countries and factors) that leads to the highest net savings for Asia. Ranges constructed this way are generously wide. For example, if scenarios were combined randomly instead of selected to produce extreme outcomes, factors favorable to net savings would be paired with others that are not, and countries with positive savings outcomes would be combined with others that have negative ones. If factors and countries do not move in parallel, the aggregates fall well within the extreme range, as opposing effects offset each other.
After projecting net savings for Asian countries, we turn to explore their viability in the global context (Section 2). Whether Asian projections are feasible depends on the balances in the rest of the world. Even in 2020, Asia will represent only one quarter of world output, so it could run a significant net surplus or deficit—if the rest of the world is willing. But if Asia’s projected net savings are inconsistent with rest-of-the-world borrowings, then the scenarios will not be realized—some combination of market and policy adjustments will have to “restore” the global savings and investment balance.
More formally, we construct net savings projections for Asia using the equation:
NS = (s−i)Y0(1+g)15, (1) where: NS = net national (regional) savings, s = savings rate, i = investment rate, g = growth rate, Y = national (regional) income, and subscript 0 indicates initial level (no subscript indicates 2020 level).
The variables of this equation are the building blocks of the analysis that follows. Considerable theoretical and empirical literature exists on the determinants of these variables. That, in turn, provides a strategy for “pushing back” the level of explanation to a deeper layer of (hopefully) exogenous determinants, and thus for developing forecasts. This task is taken up in Section 2.

We now implement the scenario approach by computing alternative values for the three major components of Equation 1—namely savings rates, investment rates, and growth rates—for the 12 Asian economies examined in this chapter. Our strategy is to review the theoretical determinants of each component and collect information on the likely evolution of these deeper factors. At the end of this section, the results of the analysis are then combined using Equation 1 to develop scenarios of net savings.
Savings rates are predictable and well researched. Extensive applied work in this area was recently reviewed in a World Bank “meta study” (Loayza, Schmidt-Hebbel, and Servén 2000), which also filled gaps with new research. That study identified the following factors as critical determinants of savings rates:
• Persistence. Savings rates stay put over time. The inertial component may reflect cultural or institutional factors. For example, in our Asian dataset, the standard deviation of savings rates among economies was approximately nine percentage points, while the standard deviation of changes in the savings rate over a decade was only two percentage points.
• Income. Higher incomes lead to higher savings for low-income economies. The relationship appears to plateau at higher incomes, and is generally stronger for lower-income economies than for those at middle incomes. In developing countries, a doubling of per capita income generally leads to a 10-percentage-point increase in savings from disposable income.
• Growth. More rapid growth increases savings. This is not predicted by theory; consumption smoothing, for example, suggests higher consumption from income (and hence lower savings rates) if incomes are rising rapidly. The observed result more likely reflects consumption inertia—people take time to regard higher incomes as permanent and to adopt higher consumption levels. The World Bank survey concluded that, on average, a one-percentage-point increase in the growth rate leads to a one-percentage-point increase in the national savings rate.
• Demographics. Several channels connect the population structure with savings, including lifecycle effects and changes in productivity and dependency ratios. The effects also depend on how society supports the

aged, and on other behavioral characteristics, such as the desire to leave bequests. The World Bank survey concluded that a one-percentage-point increase in the young-dependency ratio reduces savings by 0.3 percentage points, and a one-percentage-point increase in the aged-dependency ratio reduces savings by 0.6 percentage points.
• Uncertainty. General economic uncertainty, including income volatility and inflation, contributes to higher savings rates. Uncertainty at the individual level, due a lack of health or social insurance and other safety nets, does so as well.
In addition to private savings (as discussed above), national savings also include public savings. However, the latter may be offset by opposite changes in private savings, to the extent that the population anticipates the collective cost of servicing public debt. But this “Ricardian equivalence” holds strictly only if individuals have infinite planning horizons, that is, value the welfare of their children as much as their own. Empirical studies find that public savings are offset partially, at rates varying from 30% to 80%.
These theoretical determinants of savings rates can be summarized in the equation:
s = so0+ α (y − y0 ) /y0 + β (g − g0 ) + γ (d − d0 ) + δ (s0* − s0 ), (2)where: s = savings rate,y = per capita income,g = growth rate,d = dependency ratio,α , β , γ , δ = constants,subscript 0 indicates initial level (no subscript indicates 2020 level), andsuperscript * indicates a convergence target.
The terms of the equation account for (i) persistence, through the effect of the initial savings rate for 1999–2005, (ii) income changes, (iii) growth changes, and (iv) changes in the dependency ratio. In addition, we include a term that assumes some gradual “regression to the mean” of international norms, as reflected in the region’s average savings rate. (We do not include government savings because we know how to project them, and because they may be offset by changes in private savings.)
Values for the parameters of Equation 2 can be derived from the World Bank’s meta estimates. We assume: α = 0.1 for y < US$3,000, 0.05 for

US$3,000 < y < US$6,000, and 0 for y > US$6,000; β = 1; γ = -0.5; and δ = 0.5. The value of δ is arbitrary, and assumes that half of the difference between the nation’s initial savings rate and the target will disappear by 2020.
Values for independent variables are based on the following assumptions:
• Income levels (y). Assumptions about income growth rates are described below. In each projection scenario, savings rates are used in conjunction with a particular income growth assumption, which is then used to calculate the term (y – y0 )/y0.
• Growth rates (g). As above, this term reflects the growth assumption incorporated into a particular scenario.
• Dependency ratios (d). Asian demographic change is explored in detail by Mason, Lee, and Lee (2007). They calculate an “economic support ratio” (Figure 2.2) as the effective labor power of a population divided by its effective consumption requirements. Both the labor power and consumption requirements constructs are weighted averages of the age distribution; labor power uses incomes as weights and consumption requirements use consumption by age as weights. A rising index means that labor power is increasing relative to consumption requirements.
Most of Asia’s demographic drama will unfold beyond the time horizon of this study, sometime between 2020 and 2050 (Figure 2.2). Japan is an exception: its economic support ratio peaked early in the 1980s and will fall by a further 7% by 2020. The support ratios for Republic of Korea and PRC are near their peak, but will not change significantly between 2005 and 2020. The support ratios for Association of Southeast Asian Nations (ASEAN) members and India are still rising, and will increase by about 10% by 2020.
Total dependency ratios (as used in the World Bank estimates) move inversely with the support ratios calculated by Mason, Lee, and Lee and are typically around 40%. For purposes of scenario analysis, we thus calculate that over the next 15 years, demographic factors will (i) reduce Japan’s average savings rate by 1.4 percentage points (=0.07*0.40/2), (ii) increase ASEAN and Indian savings rates by 2 percentage points (=0.10*0.40/2), and (iii) leave other Asian savings rates unaffected.

• Target savings rates (s*) National savings rates are assumed to converge to international norms, defined in terms of the savings rates of peer countries. We specify low, medium, and high convergence targets in terms of the distributions of peer savings rates, as follows:
slow* = 25th percentile of peer countries = 15% for Japan, 26% for others
smedium* = 50th percentile of peer countries = 19% for Japan, 30% for others
shigh* = 75th percentile of peer countries = 23% for Japan, 38% for others
Japan’s peer group is the G7 countries, while the 11 other Asian economies comprise each other’s peer group. By these scenarios, savings rates will fall to the lower quartile of the peer distribution, regress to its mean, or rise to its upper quartile. Convergence to these different targets provides a range of possible future rates.
These values for the parameters and independent variables of Equation 2 are then used to calculate three alternative savings rate scenarios, as reported in Table 2.2.

The scenarios suggest that Asian savings rates will change relatively little, overall, between now and 2020. But this constancy is the result of substantial offsetting changes in the savings of different economies; there will be substantial change in the composition of Asian savings (Table 2.2). Japan’s savings rates, and to a lesser extent those of the PRC, are likely to fall, while those of India and ASEAN are likely to rise. The assumptions that lead to these results will be further discussed when overall regional net savings are derived in Table 2.5.
The other side of the net savings “scissor” consists of the investment rate, which is in turn related to the productivity of capital and the country’s growth rate. A simple accounting identity defines this relationship: the investment rate (capital formation divided by gross domestic product [GDP]) is equal to a country’s expected growth rate multiplied by its incremental capital-output ratio (ICOR, or capital per unit of additional output):
i = g * ICOR, (3)where:i = investment rate = dK/Y,g = growth rate = dY/Y, andICOR = incremental capital-output ratio = dK/dY.
Although ICORs vary substantially from year to year (the connection between output and capital is subject to short-term variations in the

utilization of capital), they tend to be much more stable over longer periods of time and across countries. For example, the standard deviation of ICORs across the 11 emerging Asian economies for the 1999–2005 period was only 0.4, but standard deviations for shorter sub-periods within this overall period (e.g., for 1999–2001 and 2002–2005) were two to three times as high.
The determinants of ICORs can be derived from the production function:
dK/dY = (1 - fL dL/dY) / fK, (4)where:L = labor,fL = marginal product of labor,fK = marginal product of capital, anddK/dY =ICOR.
The numerator is the marginal income share of capital and the denominator is the rental rate of capital. If global capital markets are integrated and the rental rate is equalized, then ICORs will vary across countries only with the marginal income share of capital. With a Cobb-Douglas production function they would be constant. With imperfect capital markets and less elastic production functions, ICORs would tend to be higher in countries with lower rates of return. For scenario analysis, we assumed that ICORs would converge to the low (25th percentile), medium (50th percentile), or high (75th percentile) in the distribution of ICORs of peer countries. The values of these calculations are reported in Table 2.3. These values are later used together with growth assumptions in Equation 3 to derive alternative investment scenarios.

The message of Table 2.3 is that ICORs do not vary much across countries or scenarios, reflecting their stability in the historical data. The only ICOR projected to change substantially is Japan’s, which was very high due to the underutilization of Japanese capital during the “lost decade.” Aside from Japan, ICORs play a modest role in distinguishing scenarios’outcomes from each other.
In autarky, savings rates and ICORs would play an important role in determining growth rates. In an open economy, however, a country’s growth rate is freed from this constraint, since capital flows permit investment and growth rates to diverge. Thus growth is rather determined by perceived investment opportunities—what John Maynard Keynes called the “animal spirits” of investors, or what in current terminology is sometimes called economic dynamism. This vague concept reflects the availability of resources complementary to capital (including labor and know-how) and the investment climate, which includes elements such as the macroeconomic environment and the regulatory framework. Factors that will play an especially important role in defining Asia’s investment opportunities in the next decade will include:
• Dynamism of consumption demand (to take up potential slack in export demand);
• Stability of financial and social conditions;

• Manageability of environmental constraints;
• Investments in skills, knowledge, and innovation; and
• Sustained open global trading system.
These factors are captured in the equation:
g = go +α (p - p0 ) +δ (g0* - g0 ), (5)
where: g = growth rate,p = population growth rate,α , δ = constants,subscript 0 indicates initial level (no subscript indicates 2020 level), andsuperscript * indicates a convergence target.
The target growth rate variable acts as a proxy for the “normal”investment environment, and we assume that each country in the region will approach it over time. As discussed below, the concept is operationalized by selecting growth rates from the distribution of growth rates currently observed in the region.
Values for the parameters and variables of Equation 5 are based on the stylized facts of production functions and other estimates. We used α = 2/3 (labor’s share of output) for the newly industrializing economies (NIEs) and Japan, and α = 1/3 for lower income economies. We set δ = 0.5. Population growth rates were derived from ADB projections. The low, medium, and high target growth rates—the tool used to differentiate the pessimistic, median, and optimistic scenarios about the regional investment climate—were set to the growth rates of the 25th, 50th, and 75th percentiles of the distribution of the current growth rates of peer countries. These assumptions were combined using Equation 5 and are presented in Table 2.4.

Overall Asian growth will be more rapid—under all scenarios—than it was in 1999–2005.2 This is so partly because Japan, the region’s largest economy, is expected to recover, and because PRC and India, the region’s fastest growing economies, are rapidly increasing their weight in the Asian total. Of course, the current high level of optimism about the region’s prospects is not likely to continue for another 15 years—there are bound to be slowdowns and setbacks in Asia’s development as elsewhere. Nevertheless, the fundamentals of Asian growth, as reflected in the several parameter estimates in this study, appear to be strong, and the region is increasingly relying on independent, regional engines of growth. Deepening regional ties can be expected to reinforce this dynamism, further helping to sustain the region’s exceptional growth in the intermediate future.
The building blocks of Asian net savings (Tables 2.2, 2.3, and 2.4) provide a basis for constructing region-wide net savings estimates using Equation 2. The results are shown in Table 2.5. This table highlights a central finding of this study, namely that Asia’s savings picture is likely to remain positive through 2020. In the “all-medium” scenario, for example, every Asian economy becomes a capital exporter by 2020. Even those scenarios that
2 Asian Development Bank also developed growth projections for a recent study. Its scenario is very similar to the “low” growth scenario of this study, but since it was prepared some time ago, ADB appears to have underestimated what appears to be the accelerating dynamism of Asian economies.

include assumptions biased against savings generate positive net savings for the region as a whole.
The PRC remains the region’s top capital supplier, but other countries change places. India and the Republic of Korea, in particular, replace Japan and Singapore as second and third top savers. India’s savings increase for two reasons. First, at its low income, rapid growth and high per capita income have a positive effect on savings. Second, India’s demographics—with the country’s economic support ratio still rising—positively affect savings, in contrast to middle- and high-income Asian countries, where demographic changes have a neutral or negative impact. Coupled with India’s large size, these factors help to make India an important source of capital by 2020. Similar factors also operate in the lower income countries of ASEAN, which also emerge as capital exporters.
At the other extreme, Japan’s net savings decline. This is partly because Japan’s growth rate is projected to accelerate slightly (from the recent 1.3% to 1.7% in the 2005–2020 period) and hence domestic investment grows, and partly because its savings rate will be reduced by demographic changes and by an assumed convergence toward developed-country norms (which would imply a decline in the savings rate in Japan’s case). Singapore’s net savings rate will also diminish for similar reasons, but in this case from very high initial levels.

The range of outcomes is shown in Figure 2.3. The highest net savings—US$1.7 trillion—are obtained when scenarios that yield high savings (based on a high savings rate and a low ICOR) are combined with relatively low growth rates. The lowest net savings are obtained when high growth rates are combined with the low savings scenarios, but even in this case the region’s overall net savings hover around zero rather than becoming negative.
Interestingly, the “extreme” scenarios of Figure 2.3 are more likely than some intermediate combinations. Consider, for example, the low growth/high savings scenario. If Asian savings indeed remain high, then the region is likely to lack the demand stimulus that would tend to drive a high growth rate—in other words, high savings rates are likely to be associated with low growth rates. And similarly, if Asian savings rates are low, then regional consumption will likely stimulate more rapid growth. But regardless of the detail, the analysis suggests that Asian savings are very likely to remain positive (and substantially so under most assumptions); it would take an unusual combination of assumptions, or put another way, a dramatic change in policies or economic structure, to yield outcomes in which Asia has low net savings.

Asia emerged as an exporter of capital under all but one scenario examined in the previous section. But will the rest of the world absorb its savings? And if so, what interregional capital flows will result? To answer these questions, one would ideally need an analysis similar to that of Section 1 for the rest of the world. That is beyond the scope of this chapter, but this section nevertheless tries to marry the Asian projections with at least rough estimates for the savings position of other countries.
For the world outside Asia, we constructed scenarios using a simpler, less information-intensive framework. We divided the world into four regions (outside Asia) and assume that these (i) follow the Asian Development Bank’s growth scenario, and (ii) will have net savings rates consistent with their historical distribution of rates as observed since 1980. We then defined the medium scenario for other regions as their historical mean net savings rate; the low scenarios as the mean rate less one standard deviation; and the high scenario as the mean rate plus one standard deviation. From these assumptions net savings levels were derived and compared to the Asian net savings brackets developed in Section 2 (Table 2.6). Note that the low and high scenarios constructed this way are extreme: they envision all four regions experiencing relatively low (or high) savings compared to their historical experiences, rather than the more probable mix of low, medium, and high rates.
Savings and investment tend to be equal in Europe and emerging countries (excluding Asia), and essentially fluctuate near zero. The net savings rates of other advanced economies are usually positive, but their relatively small scale limits their impact. The United States and Asia aside, world net savings would be within plus or minus US$0.5 trillion, or within plus or minus 1% of global income.

The United States runs potentially large deficits of US$0.3–0.9 trillion. But this is derived from historical data that may not be predictive. Recent US deficits are not sustainable indefinitely, so the low end of the historical range represents the most likely future outcome. With the US included, global net savings (excluding Asia) would range from negative US$1.4 to positive US$0.3 trillion, with the upper end being more probable.
The Emerging group includes most oil-exporting economies, and might be expected to have high savings. The scenarios do not fully capture this, except in the “high” case, since the historical period from which the savings rate scenarios are drawn covers a period when oil prices were generally low. Thus the Emerging group, like the US, is more likely to be on the “high” savings end of its alternatives, assuming, as is likely, that oil prices will remain at current high levels.
What combinations of Asian and rest-of-the-world scenarios add up to a rough balance for the world as whole? Of all combinations reported in Table 2.7, world savings are roughly balanced along the diagonal that runs from the lower-left to the upper-right corner of the table, in which each combination generates a relatively small US$0.3 trillion notional world surplus. (A surplus on this scale can be avoided with modest market-driven adjustments.)
Major global adjustments would be required if some combinations of scenarios materialized, including especially the upper-left and lower-right corners. In the lower-right corner, high Asian savings are paired with high rest-of-the-world savings (say, because the United States reduces its deficit and high oil prices lead Emerging economies to relative high savings), and the result is a notional world surplus of US$2 trillion, or 3% of world income. By historical standards, this is a “savings glut” three times as large as the one the world is experiencing today. Similarly, the low-low scenario would represent a capital shortage of US$1.4 trillion, or 50% larger than the savings decline of the 1990s.
The outcomes of various scenario combinations are, of course, not equally probable. For example, the low and high rows and columns are less likely than the middle ones, since different countries in each group are likely

to have offsetting savings results. All else equal, the right-hand column (high rest-of-the-world savings scenarios) is also more likely than others, given the probable reduction of the US deficit and continued high oil and other raw material prices. Using such impressionistic judgments, subjective probabilities can be assigned to each cell—as shown, for example, in Table 2.8. With this particular set of probability assignments, Asia would have an expected savings surplus of US$0.8 trillion, and the rest of the world would have an expected savings deficit of US$0.5 trillion, yielding a net global surplus of around US$0.3 trillion. This is an increase in notional global savings—and so should be considered additive to the “balance” reflected in current conditions—over what is already widely regarded as a situation of a “savings glut.”
The outcomes also differ in terms of the economic and political adjustments they would require. For example, scenario combinations toward the lower-left corner of the table involve much larger cross-regional transfers (high Asian savings financing rest-of-the-world deficits) and therefore greater economic and political tensions. The lower-left corner, for example, although globally balanced, implies cross-regional capital flows of US$1.6 trillion, or 2% of world income. Such flows would dwarf current Asian investments, which already generate ample tension on issues such as the accumulation of foreign reserves, investments in “strategic” corporate assets, and the regulation of sovereign wealth funds.
This chapter has attempted to put the financial requirements of sustained, rapid Asian growth into global perspective. Its innovation was to bring disparate data sources on savings and investment together into a common global framework, and to project the resulting dataset with parameters based on previous research and past distributions of various parameters. The scenarios derived in this process do not identify a single outcome, but present a range of plausible outcomes, and thus highlight the market pressures that are likely to emerge in 2020. The following conclusions stand out:

(i) The savings needed for optimistic scenarios of Asian economic growth are likely to be available. High Asian savings, coupled with improvements in the net savings of the United States and other countries, will lead to relatively ample global supplies of capital.
(ii) Even with fast growth, Asian net savings will remain high, implying substantial resource flows to other regions. This will have complex economic and political consequences. Will Asian investors remain confident enough in other economies to make those investments? Will other economies continue to accept increasing Asian ownership of their assets?
(iii) A significant part of the demand for Asian output will have to originate elsewhere. Because other regions also need to improve net savings, these pressures could also lead to tensions in trade and macroeconomic policies. Ideally, the necessary adjustments will happen gradually, and not as sudden, crisis-driven transitions.
(iv) The country composition of savings within Asia will shift toward the region’s “newly accelerating” economies. Countries like Japan and Singapore will save less (due to demographic and other changes), while PRC, India, and ASEAN will save more (due to growth, higher incomes, and more positive demographics).
Taken together, these findings suggest that the problem of “financing Asia’s future” is not one of finding sufficient resources to meet investment needs. Rather, it revolves around the implications of sustained excess savings, or capital exports. In the macroeconomic realm, this raises the question of whether world demand can be sustained. In the policy realm, it suggests growing tensions about trade balances and increased Asian ownership of assets in other regions.
If these speculations turn out to be accurate, policymakers in Asia will face very different problems from those they faced in the past, and from those that policymakers face in other regions. Their macroeconomic challenge will be to raise consumption in order to create “regional” engines of growth—that is, to develop regional consumption and investment in order to offset declines in demand and investment in other regions. Policy measures that could accomplish this include reducing the uncertainty faced by individuals (e.g., through social insurance), improving financial markets (e.g., relaxing the constraint of inconsistent income and consumption streams), and keeping prices low through exchange rate appreciation and other policies.

Asia will need sophisticated new policies to manage its growth and the consequences of its increased role in the global economy. While Asia has ample resources for financing its growth, its institutions for investing its savings and managing its relations with the rest of the world are in their early stages of development. These will need to improve rapidly, lest they become the binding constraint on Asian development.

ADB (Asian Development Bank). 2007. Key Indicators. Manila.
IMF (International Monetary Fund). 2007. World Economic Outlook Database. Washington, DC.
Loayza, N., K. Schmidt-Hebbel, and L. Servén. 2000. Saving in Developing Countries: An Overview. World Bank Economic Review 14 (3): 393–414.
Mason, A., S-H. Lee, and R. Lee. 2007. Asian Demographic Change: Its Economic and Social Implications. Processed. Asian Development Bank.


Mohamed Ariff
Azidin Wan Abdul Kadir
It has been ten years since the Asian crisis occurred in 1997–1998, and the countries severely affected by the crisis have recovered, though not to the past level of performance. The four Asian countries most adversely hit by the crisis, namely Thailand, Indonesia, Republic of Korea, and Malaysia, have all bounced back to a more moderate economic growth closer to potential growth rates. Griffith-Jones and Gottschalk (2006) estimated that the foregone output in these four countries collectively reached US$917 billion between 1997 and 2002, or US$150 billion per year. If indirect effects are accounted for, the costs of the crisis would be even larger.
There have been small or mini crises since the 1998 crisis, such as the speculative pressures on the Thai baht in late 2006, and the market volatility caused by the United States (US) subprime mortgage turmoil. The US dollar continues to weaken against major currencies, including Asian currencies, and there are concerns that this will have an impact on export competitiveness. This could also be the adjustment process taking place to correct the huge global imbalances.
Reforms have been carried out in the banking and corporate sectors, changing the financial landscape in these four crisis-hit countries. It is hard to judge the extent and effectiveness of these reforms, as the glass can be seen as half-full or half-empty, but there is undoubtedly room for further improvement. Distressed companies had to seek new partners or close down, while smaller banks were taken over by stronger and larger banks or even by foreign investors through mergers and acquisitions (M&As). Exposure to foreign debts has been pared down and foreign borrowing is managed more prudently, with greater risk management and prudential regulations being practiced.
With the sizeable trade surpluses and the resumption in inflows of foreign direct investment (FDI), these countries have amassed an increasing amount of foreign reserves. This is seen as a precautionary move to self-insure or protect against another crisis whenever there is a large outflow
1 The authors wish to thank Akira Ariyoshi and Chia Siow Yue for their helpful comments.

of portfolio funds. As they are highly open economies, Asian countries continue to face the scary possibility of massive capital reversals.
This section reviews some interesting studies that have discussed lessons from the 1997–1998 crisis. Kawai, Newfarmer, and Schmukler (2005) derived some lessons and prescriptions for policy guidance from the crisis. To reduce the risk of a crisis, one obvious lesson pointed out by Kawai (2005) was to adopt sound macroeconomic management, which may not always be an easy task. This involves pursuing non-inflationary monetary policy, maintaining sound fiscal policy, reducing cycles of boom and busts, and managing public and foreign debt more prudently. Generally, Asian countries have fared fairly well in terms of broad macroeconomic management, but the main concerns are in the areas of managing capital flows and strengthening fragile financial institutions (Grenville 2006).
Kawai et al. (2005) pointed out the need to strengthen the monitoring of short-term capital flows while securing adequate foreign reserves and avoiding an overvaluation of the currency. His crisis-prevention advice included an orderly capital account liberalization. Asian countries should also adopt a viable exchange rate regime that is in line with monetary policy objectives. There is a need to build a resilient financial system and improve corporate governance. This calls for, among other things, stronger regulatory and supervisory frameworks of financial institutions, sound risk management tools, and greater competition in the financial markets. Progress has been made in the crisis-hit countries regarding these areas, but there are grounds for further improvement. Kawai et al. (2005) noted that the crisis-hit countries have moved quickly to implement mechanisms to remove bad loans and recapitalize the banking sector. This has partly contributed to faster recovery in the banking sector by allowing the resumption of lending activities. There was also a sense of urgency in sorting out corporate insolvencies. In managing the crisis, except for Malaysia, whose problems were considerably smaller, the other three crisis-hit countries were forced to seek assistance from the International Monetary Fund (IMF) and had to comply with strict and painful conditionality, which was seen as excessive at times.
One lesson learned is that capital flows are very different from trade flows. Capital flows are more volatile and less predictable. Therefore, the liberalization of capital flows has to be done with greater care than trade liberalization; it needs to be carried out based on the financial readiness and robustness of the financial system. Proper regulations and monitoring are

also required to prevent excessive borrowing and imprudent use of foreign capital.
In broad terms, in all four countries, excessive and imprudent corporate activities have been seen as one of the key causes of the crisis. This was compounded by the government’s support of these excesses. Thailand was the center of the crisis, but Indonesia suffered the worst hit due to the political crisis that followed. After a brief period of tight fiscal and monetary policies that strangled their economies, all four economies reverted to expansionary policies. Malaysia was not forced to seek IMF assistance owing to its relatively smaller external debt exposure and sufficient external reserves. Malaysia opted for the fixed exchange but this was seen as really unnecessary and redundant due to its late timing, executed 15 months after the breakout, when regional currencies were already stabilizing (Ariff 2007a).
The difficult question to answer is whether the exchange rates of Asian countries have become more flexible. There are some indications of more flexibility in the exchange rates, but as Asian countries are mainly export-oriented countries, the active management of the exchange rate is still considered an important thrust of their macroeconomic policies. In most cases, the level of flexibility has shown very little change, as measured in terms of volatility.
The “fear of floating,” or the fear of volatility in exchange rates, is still present in Asian countries because there is concern that the currency may become overvalued and undermine export competitiveness. In the cases of People’s Republic of China (PRC) and Malaysia, the fixed exchange rate regime was converted to a managed float system on a tight leash. What is more important is to monitor and deter a currency from becoming overvalued. Asian currencies had become overvalued prior to the crisis due to informal pegging to the US dollar, reminiscent of exchange rate targeting. The recent weakening in the US dollar has posed a different challenge in that Asian currencies have appreciated against the greenback. Coupled with the faltering US economy in late 2007, there is worry that this may affect export competitiveness and affect future growth rates.
As a precautionary move to protect against speculative attacks, Asian countries have been accumulating large amounts of foreign reserves. The large reserves are not optimal and involve some costs if the returns on them are less than debt servicing. After experiencing the pain of strict conditionality of the IMF and the limited regional assistance during the crisis, Asian countries resorted to storing reserves as self-insurance against

large exchange rate swings. Most of these reserves are investment in US treasury papers. There are calls for central banks to diversify their reserve holdings and to invest in higher return ventures.
Does having larger reserves reduce the vulnerability of these countries to another crisis? The answer is yes and no. Much would depend on the nature of the next crisis. Large reserves would help if the next crisis were to witness large capital outflows. But large reserves could be a problem rather than a solution, to the extent that such reserves attract speculative attacks that can drain them (Ariff 2007b).
One of the causes of the 1997–1998 crisis was the rapid liberalization of capital accounts and financial markets, when the local financial sector had not developed sufficiently to handle large inflows of foreign money. Asian countries have consented to and benefited from trade and investment liberalization with open arms, but having an open capital account would pose different kinds of challenges and risks. The capital accounts of East Asian countries were liberalized without having proper prudential regulations and effective supervision in place. This led to imprudent foreign currency borrowing by local banks to fund excessive investment in property, which is seen as a less productive investment than manufacturing. This exercise was encouraged by the fact that currencies were largely tied to the US dollar, which was riding high prior to the crisis. Large inflows of funds through the capital accounts had also led to appreciation of the currencies and overvaluation. The misalignment in currencies and the large exposure to short-term foreign borrowing made these countries vulnerable to crisis.
In this section, we review the trends of some of the major indicators, which mainly reflect the macroeconomic conditions in these countries. It is easier to conduct analysis on macro data, which are readily available across the crisis-affected countries. We also look at indicators of banking and corporate reforms whenever they are available.
Some of the questions discussed in the chapter are:
• The quasi-peg to the US dollar was said to have led to overvalued currencies. Have the exchange rates become more flexible ten years after the crisis?
• Asian economies have accumulated large amounts of reserves. What is the motivation behind this buildup? Is it good to maintain large reserves?

• How far have reforms progressed in the banking and the corporate sectors?
• What has happened to private investment? Is the current level acceptable or do these countries need more investment to raise their growth rates?
• The US dollar has been weakening against major currencies including the Asian currencies. Is this progressing as a corrective mechanism on global imbalances?
• What is the impact of higher oil prices?
The following descriptive data analysis is aimed at assessing whether there has been improvement in the macro fundamentals of these countries. Other indicators will be sought to assess the progress in banking and corporate governance reforms. In general, the macroeconomic indicators in these four crisis-hit countries have improved since the crisis. There are concerns over the lower investment level and its impact on growth capacity over the medium term. This also means that countries have to raise their productivity levels to more than offset the lower investment rate in order to gain better growth. There is little doubt that exports have contributed significantly to the economic recovery of these countries.
Real gross domestic product (GDP) growth has stabilized after the recession in 1998 and all countries have recovered toward a more moderate growth path from the “above-potential” or “overheating” growth rates prior to the crisis (Table 3.1). There appears to be some convergence in the growth rates to around 5.0% to 6.0%, which pales in comparison to the pre-crisis rates. The strong export growth, particularly in electronics and commodity exports, has enabled the crisis-hit countries to recover faster, underpinned by the steady global economic expansion. Fiscal expansion has been limited in the three countries assisted by the IMF, but this was less the case for Malaysia, which has the largest fiscal deficit among the four countries. Despite strict IMF conditionality, the Republic of Korea’s GDP contraction in 1998 was relatively smaller than the others. Although Malaysia implemented capital controls temporarily and reverted to a fixed exchange rate regime, its recovery trend was not particularly different from the three others.

An interesting point is why the Republic of Korea recovered so fast and so impressively compared to the other countries. One major reason behind its fast recovery was greater political will to undertake reforms. The country also had less denial than the others toward the economic turmoil it was confronting. In contrast, some of the other countries were still in a denial mode, blaming the rest of the world without faulting themselves. The Republic of Korea responded quickly and positively when others were unsure what to do.
The nominal effective exchange rate (NEER) showed rather mixed trends among the four countries (Figure 3.1). The Korean won appreciated by 12.7% during the period 2000–2006, while the rupiah and the ringgit depreciated by 15.2% and 1.5%, respectively. The Thai baht remained roughly flat during the reference period. The real effective exchange rate (REER) of the four countries also exhibited somewhat mixed trends during the period 2000–2006 (Figure 3.2). Indonesia’s and the Republic of Korea’s REER rose sharply by 34.0% and 20.6% during 2000–2006, respectively, raising questions of whether exports had been affected by the stronger REER. In the case of Indonesia, the return of a stable political and economic situation may have contributed to the stronger rupiah.
The Thai baht’s REER increased by 5.3%, but despite the moderate rise, it was surprisingly hit by speculative attacks in late 2006. The Malaysian ringgit, which was fixed against the US dollar up until July 2005, saw its REER falling 1.2% during 2000–2006. However, with further weakening of the US dollar in 2007, it was expected that the trade-weighted exchange rates of these economies would continue to rise in 2007.

Studies (McCauley 2002) have shown that the volatility of Asian currencies increased after the 1998 crisis. This is sometimes taken to suggest greater flexibility in their exchange rate movements, although some think that the increase is minor and does not represent more flexibility. The data do illustrate a rise in volatility, but it is arguable whether there is any significant change in Asia’s exchange rate regimes (Table 3.2). These exclude the exceptional case of Malaysia, which reverted to a managed float regime from a US dollar peg regime, and the PRC’s policy to widen the band of the Chinese yuan.

In general, exchange rates have become more flexible than before, with greater convergence in the sense that movements are somewhat parallel. But in terms of daily variability or volatility, the picture now is not very different from before the crisis. What makes it converge in terms of movement? This is largely due to the US dollar depreciation against nearly all major currencies. What makes it more flexible? The exchange rate targeting that was widely practiced prior to the 1997–1998 crisis is no longer practiced.
One of the main reasons behind the more moderate GDP growth pace has been attributed to the lower level of domestic investment. In 1997, the investment rate was generally more than 30% of GDP for the crisis-hit countries, and was at a high of 43% in the case of Malaysia. Since the crisis, the investment level has dropped quite markedly, from the “over-investment” in the pre-crisis period to a lower investment level after the crisis (Table 3.3). Some explanations for this could be the more cautious investment among businesses and prudent risk management practices among banks. Banks are wary of lending to big firms but appear more willing to finance collateralized household loans.

Studies have shown that the decline in the investment rate is related to the relatively lower rate of return on investments and the fall in the domestic credit-to-GDP ratio (Felipe, Kintanar, and Lim 2006). Also, there is still excess capacity in the system, as indicated by the capacity utilization rate that has not recovered to the pre-crisis level. Another probable reason is that capital is now used more efficiently, and it is also likely that GDP growth has become increasingly productivity-driven and not just input-driven. The underdeveloped capital market in Asia is making Asia’s capital go elsewhere for investment. Investors are looking outside Asia for investment destinations rather than within the region. With the lower investment rate, the growth capacities of these countries will be affected due to the lower contribution of capital. Not surprisingly, with substantial current account surpluses in the balance of payments, savings do exceed investments.
FDI inflows to these four countries have been affected only temporarily by the crisis (Table 3.4). The amount of FDI dropped noticeably in Malaysia and Indonesia in 1998, suggesting that “new/greenfield” FDI was falling. But in the case of Thailand and the Republic of Korea, FDI rose somewhat after the crisis, which implies that the inflows could be targeted for M&A rather than new investments. Since 2003 or so, the level of FDI has improved in all four countries, though more gradually in the case of Indonesia. Most countries have regained much of their attractiveness for FDI, except for Indonesia, which continues to struggle for more foreign capital. Despite rising competition from the PRC, these countries will continue to make efforts to pull in FDI because it has been an important source of technology and jobs. With the opening up of the services sector, more FDI in services is likely to be seen in addition to manufacturing investment.

The plunge in the currencies of these countries saw their inflation rates surge in 1998, but they came down by 2004 (Table 3.5). The trend reversed after that due to the jump in global oil prices. The surge in global oil prices has led to the rise in transportation costs and, subsequently, inflation rates. The transmission of higher oil prices came through either imported inflation or the reduction in oil subsidy. With oil prices persistently hovering at high levels, the risk of higher inflation remains in sight. On the positive side, the appreciation of the currencies of these countries can reduce the cost of imports, partly mitigating the inflationary pressures.
After recording mostly current account deficits during the mid-1990s, these countries saw their current accounts reverting from a deficit to a surplus beginning in 1998 (Table 3.6). The trade surplus has largely contributed to the current account surplus, which also led to higher foreign exchange reserves. On the other side of the equation, the fall in the investment level has resulted in the widening of the saving–investment gap, reflecting the

lackluster domestic demand that is not dynamic enough to utilize excess savings. Some of the savings have been channeled to US assets, which is unhealthily feeding a consumption frenzy in the US economy.
Owing to the current account surplus and FDI inflows, including the volatile portfolio inflows, the foreign reserves of these countries have risen significantly since the crisis (Table 3.7). The inflow of funds has also resulted in the rise in liquidity in the financial system, forcing central banks to absorb excess liquidity to prevent the rise in inflationary pressures and to stabilize interest rates. Too much liquidity in the banking system could lead to reckless lending if prudential procedures are not observed. In 1997, the differences in the level of reserve holdings were not too divergent among the four countries. But, since then, all the countries have accumulated large foreign reserves, possibly driven by the precautionary motive to ward off speculative attacks. Large reserves also act as a cushion against the large movements of capital in and out of the country. With little change in the global financial system, Asian countries have to depend on their reserves as a first line of defense.
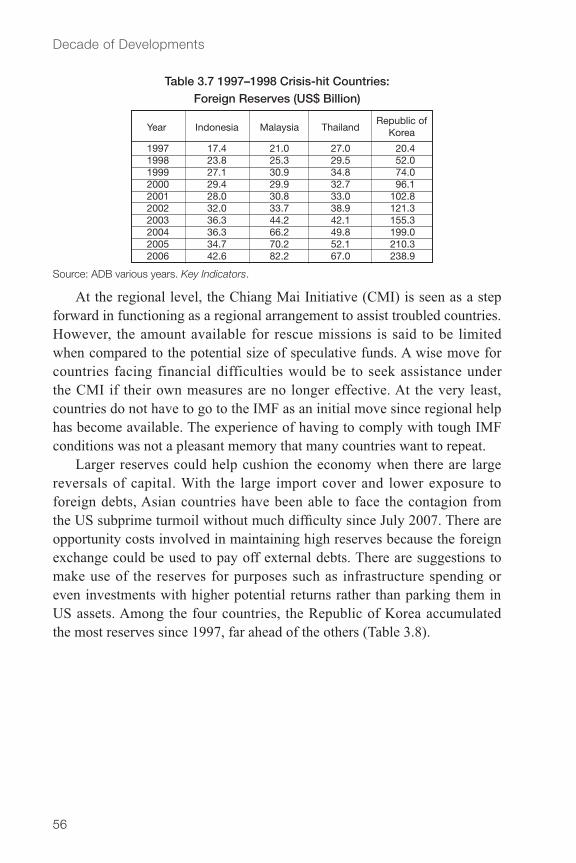
At the regional level, the Chiang Mai Initiative (CMI) is seen as a step forward in functioning as a regional arrangement to assist troubled countries. However, the amount available for rescue missions is said to be limited when compared to the potential size of speculative funds. A wise move for countries facing financial difficulties would be to seek assistance under the CMI if their own measures are no longer effective. At the very least, countries do not have to go to the IMF as an initial move since regional help has become available. The experience of having to comply with tough IMF conditions was not a pleasant memory that many countries want to repeat.
Larger reserves could help cushion the economy when there are large reversals of capital. With the large import cover and lower exposure to foreign debts, Asian countries have been able to face the contagion from the US subprime turmoil without much difficulty since July 2007. There are opportunity costs involved in maintaining high reserves because the foreign exchange could be used to pay off external debts. There are suggestions to make use of the reserves for purposes such as infrastructure spending or even investments with higher potential returns rather than parking them in US assets. Among the four countries, the Republic of Korea accumulated the most reserves since 1997, far ahead of the others (Table 3.8).

To counter the large inflows of funds that resulted in the buildup in reserves and contain the appreciation of their currencies, Asian countries have relaxed some rules and allowed more local funds to be invested abroad. The outflow of funds could offset some of the liquidity buildup in the system and relieve pressures on the currency. Some caution has to be exercised to ensure that the outflows are of a reasonable amount that does not lead to a threatening decline in the reserves.
Monetary policy was tightened during the initial period of the crisis. A short while later, when this was seen as aggravating or deepening the recession, monetary policy was relaxed. Analysts have remarked that the IMF took a wrong turn by imposing tight policies initially. The subsequent relaxation of policies, coupled with strong export growth, allowed the crisis-hit economies to recover steadily. The strong export growth has been critical in pulling the crisis-hit countries out of the recession at a quicker pace than expected. The IMF had consented to fiscal deficits in three countries, but it was still relatively tighter when compared to Malaysia’s case. Malaysia’s fiscal deficit is the largest among the four countries (Table 3.9) at –3.5% of GDP in 2006, compared to the Republic of Korea’s –2.4% of GDP. Initially, interest rates were raised with the aim of arresting the decline in the exchange rate but the costs in terms of output were too severe. Interest rates were reduced gradually to encourage the recovery in consumption and investment, underpinned by strong export growth. There is some correlation between the interest rates of these four crisis-hit countries and the US

Federal Reserve funds rate (Table 3.10), as they possibly wanted to avoid the widening of interest rate differentials.
The reforms and restructuring in the banking and corporate sectors have made them both more resilient to future crises. Nonetheless, there is room for further improvement. The landscape in the banking sector has changed dramatically due to mergers and acquisitions by both locals and foreigners. Efforts have been made to diversify the structure of the financial system, with greater financing raised through the bond market (Table 3.11). The banking sector is sounder and healthier as indicated by the stronger capitalization base, higher profitability, and better asset quality. Non-performing loan (NPL) ratios have been reduced significantly through special purpose vehicles (Tables 3.12 and 3.13). Bad loans were resold at

discounted prices to at least recover the funds partially rather than suffer complete losses. Central banks had to take drastic reform measures to ensure that the systemic effects of a bank run could be contained. Regulations have been improved, and lending practices have become more prudent. Better risk management practices have been put in place in preparation of Basel II requirements, which are more demanding on the assessment of risk.

Bank consolidation exercises, which are mostly market-driven, have taken place and are still progressing. Better banks have taken over troubled banks. In some cases, mergers were encouraged as a policy move to enlarge and strengthen domestic banks to face greater liberalization. Larger banks have a bigger capital base to withstand another crisis and more funding to invest in better management practices as well as training, information technology infrastructure, and risk management practices. In cases where no locals are interested, foreigners have taken the opportunity to take over troubled banks. However, having been seen as one of the causes of the crisis, financial sector liberalization has been conducted cautiously for fear of repeating the same mistakes. The huge buildup of foreign reserves may have made countries feel more secure and they are reluctant to introduce greater uncertainty by opening the financial system further.
The banking sector landscapes in the four crisis-affected countries have changed dramatically. Ghosh (2006) remarked that the countries’ banking sectors had undergone significant structural changes. Closures and the consolidation of banks have occurred. In general, the number of commercial banks has been reduced (Table 3.14) due to mergers and takeovers. The large banking assets relative to GDP show the importance of the banking sector funding relative to other sectors, and this has remained true even after the crisis. The share of state ownership has declined noticeably, while the share of foreign ownership has risen significantly in Indonesia. It is interesting to note that even in more liberalized settings in the Republic of Korea and Thailand, the foreign equity shares in the top ten banks of these countries have never been higher. The foreign share was higher in Malaysia in 2004, in spite of the 30% limit on foreign equity.

Ghosh (2006) observed that banks in the region have increased their efficiency since the crisis, as measured by the ratio of operating costs to assets. Indicators of bank soundness, particularly NPLs, have shown significant improvement from the worst readings during the crisis. The NPLs in Indonesian banks peaked at 48% in 1998, improving to 15.6% in 2005. The bad loans were sold to the national asset management company—Indonesian Bank Restructuring Agency—in exchange for government bonds.
The initiative was similar in the three other countries, where asset management companies were set up to buy up bad loans at discounted rates from the banking sector. This has allowed banks to resume their role as financial intermediaries. The NPL ratio for the Republic of Korea dropped to 1.2% in 2005, the lowest among the four countries, due to a sizeable disposal of bad loans to the asset management company KAMCO. Still, excessive and imprudent credit card lending led to a small crisis in the Republic of Korea in 2000–2002, suggesting that many banks in the region still have difficulty identifying, monitoring, and managing risks (Ghosh 2006). The challenge to the Asian banking sector is how to promote healthy competition that will lead to an increase in efficient and effective risk management and supervision, plus the implementation of Basel II, which will incorporate a more stringent risk management system.
On the aspects of corporate governance, some progress has been made in increasing corporate transparency and raising the standards of financial reporting. However, it is difficult to judge how far reforms in the corporate sector have progressed, as evidence and data are scarce. Admittedly, the data is incomplete, but the crisis-hit countries have tried to raise the standards of information disclosure, shareholders’ rights, and accounting standards to be closer to international standards.
Scoring data from the Asian Corporate Governance Association (2007) in Table 3.15 indicates that while the crisis-hit countries may have implemented corporate governance reforms, they are still some way from the benchmarks of Singapore and Hong Kong, China. Thailand scores relatively better in terms of rules and practices, while Indonesia still has a lot more catching up to do. In terms of enforcement, Indonesia lags behind the other three countries.

Analysts have used data from the World Competitiveness Yearbook that compares the transparency of financial institutions among countries. The data shows that the transparency of the corporate sector in the region has improved little (Park 2006). According to Ghosh (2006), the Republic of Korea and Malaysia, with Thailand not far behind, have made progress in reforms of their rules, regulations, and practices. In East Asia, the benchmark for best practices in corporate governance is Singapore. The crisis-hit countries have much more catching up to do to measure up to Singapore’s standards in enforcing rules and regulations, protection of minority shareholders, and disclosure and quality of financial reporting.
One question asked is how the crisis-hit countries managed to recover from the severe 1997–1998 crisis relatively quickly. Aziz (2007) discussed some of the key elements that contributed to the relatively fast recovery. In short, in her view, three elements—economic flexibility, stronger fundamentals, and improvements in the financial and corporate sectors—supported a relatively swift recovery.
Asian economies are flexible in the sense that labor and capital can adjust according to changing market conditions. In their export-led development strategy, they have been flexible enough to adapt to and take advantage of globalization. As the crisis-hit countries went through the painful adjustments forced by the crisis, excess capacity and non-core businesses had to be disposed of. Policies have also been flexible enough to respond to changing economic conditions. Domestic demand is playing a greater role in supporting growth and reducing dependence on exports as export performance can be weak at times. Although prudence is still called

for, their traditionally high saving rates have given Asian economies the flexibility of boosting spending through domestic funds.
The strengthening of economic fundamentals has enabled governments to play a more active role in the economy. The exchange rates have become fairly more flexible, with the large foreign reserves acting as defensive backup. Though still a work in progress, the reform and restructuring of the banking and corporate sectors has started to bear fruit. A stronger financial sector has raised investor confidence and allowed lending to resume. This has enabled private investment to recover after contracting steeply during the crisis. The bond market has been developed further to provide alternative financing and reduce mismatches in lending terms.
The pace of regional integration in trade and investment has not slowed down despite the 1997–1998 crisis. The large and rapidly growing economies, such as PRC and India, are helping to enlarge Asia’s export markets. This will reduce the over-dependence on the traditional markets of the US, Japan, and Europe. Intra-Asian trade has been rising rapidly and accounts for more than half of total trade in Asia. The greater integration in the financial sector will facilitate trade and investment activities across countries. The strengthening regional economic cooperation can provide support during gloomier times in major developed markets. The same trend is observed in investment flows where intra-Asian investment has been rising as well.
An ADB study (2007) estimates that about 60% of Asia’s total exports are ultimately destined for the big G3 markets, namely, the US, Japan, and Europe. Only about 21.2% of exports are estimated to be for final consumption in Asia. This shows that Asia’s export performance is still largely dependent on demand from G3 countries, at least for now. In this sense, Asia has not decoupled itself from North America and Western Europe, and hence remains vulnerable to US slowdown and recession. However, with rising incomes in Asia and the increasing consumption culture, there is little doubt that Asia’s demand for imported finished products will rise. There is a conscious policy effort to encourage domestic spending to become a larger contributor to economic growth. The export market in Asia will expand with the rapid growth in Asian economies and the emergence of large economies such as PRC and India.
Increasing trade and investment linkages will reinforce greater financial integration in the region, making the region more resilient to external

disturbances. Asia is also strengthening its ties with other emerging regions such as the Middle East, which is getting windfall gains from oil dollars (Aziz 2007). The Gulf States are showing interest in some Asian countries by making investments in Islamic financial services and making Asia a tourist destination.
At the regional level, Malaysia is a member of the Association of Southeast Asian Nations (ASEAN) and is involved in the CMI, which has set up a “collective fund” from which member countries can seek assistance. The CMI is intended to address short-term liquidity problems and complement international financial facilities. Malaysia has a financial commitment of US$300 million in the move to raise the funds of the ASEAN Swap Arrangement (ASA) to US$2 billion. However, the amount allocated may not be large enough to handle crises of larger proportions. Nonetheless, it is a starting scheme toward having a regional assistance mechanism that could evolve into an institutional form with greater caliber.
During the crisis, there was no regional facility that could assist the affected countries. Each country had to resort to its own policy to stabilize the domestic economy. During the ten years since the crisis, efforts have been made to strengthen regional surveillance by setting up arrangements with the objective of deterring future crises. As Asia proceeds with greater regional integration and cooperation, more constructive engagement with multilateral agencies is essential. Asia’s increasing presence in the global economy means that its views and representation in the global setting should gain greater clout.
Asia’s savings-investment surplus is creating a savings glut, but the bulk of Asia’s savings are going elsewhere. Intra-Asian investment in stocks amounts to only 5.8% of the total, compared to 64.2% for intra-European Union, according to estimates from Kwan and Cheung (2006a). In the case of FDI flows, Kwan and Cheung (2006b) have estimated that intra-Asian FDI flows constitute about 40% of Asia’s total FDI inflows in 2004. Asia depends on G3 not only for merchandise exports, but also capital exports. If Asia’s savings are invested within the region, Asia can grow faster, and demand for each other’s exports can be created.
The deepening globalization is creating new challenges for Asian countries. The emergence of PRC and India are opening up new opportunities, but

there are risks as well. The greater global integration means that countries are more exposed to external shocks and are also vulnerable to destabilizing capital movements. Greater regional integration means easier transmission of volatilities. Although countries are benefiting from deeper integration, there are many challenges that they will face. Countries have to be prepared to cope with external shocks that can come unexpectedly. Some of the challenges of globalization to Asia in general are discussed below.
One such challenge is the unstable capital flows that have intensified from the increased financial integration among countries (Burton and Zanello 2007). The high growth in Asia has been attracting foreign portfolio funds from all over the world, and this has become overwhelming at times, flushing the local market with plenty of liquidity. Rapid inflows could lead to an unstable appreciation of the currency, asset price inflation, and imprudent lending by the banking sector. The crisis-hit countries experienced sudden surges in capital outflows during the 1997–1998 crisis as investors rushed for the exit door when confidence was collapsing. Although there are domestic and external factors contributing to the loss of confidence, such sudden and herd-like outflows of capital led to a plunge in regional currencies. Even after making efforts to reform their economies, East Asian countries continue to face volatile swings in capital movements.
While Asian countries are continually exposed to the threat of volatile capital flows, there are no policies that can totally insulate a country from this threat. Having consistent and transparent policies in place can reduce chances of reversals in flows, but external pressures and contagion can lead to sudden outflows as well. Making efforts to strengthen the macro fundamentals can increase the resilience of a country. Market overreaction or overshooting is a feature in the global financial sector that many will have to live with. Raising interest rates to high levels has not been very effective in deterring outflows (Grenville 2006). Having a broad-based economic structure and diversified export markets can mitigate painful external shocks to some extent. Strengthening the domestic sector by encouraging household consumption has been a strategy to reduce the vulnerability to external weakness. This could be achieved by lowering the already high savings rate and putting those savings to good use. The level of investment, which decreased after the crisis, could be cautiously stepped up in productive sectors through fiscal spending. Unhealthy and excessive investment in property should be avoided.

The wave of globalization has increased the demand for technology and skilled workers, while labor-intensive industries are shifting to lower-cost countries. This has the consequence of widening the income gap between the skilled or highly qualified workers and the less skilled workers, hence raising income inequality. The trend is observed across many developing countries. If left unattended, rising inequality could lead to social problems and undermine the political stability of a country. This could affect the longer term economic stability of the country. To reduce income inequality, the fruits of growth should be widely dispersed and the poor should be given education and opportunities to live a better life. Education and training infrastructure should be made available for the poor so that they can gain skills for better employment. Financial assistance could be given to the poor to assist start-ups and small businesses.
The large US current account deficit of more than 6% of GDP continues to pose the risk of global turmoil should the dollar collapse. The huge US current account deficit implies that, over the medium term, further exchange rate adjustments to reduce the global imbalances are inevitable. The fear is that there is a chance the adjustment could become disorderly and highly disruptive to the global economy. The US dollar has weakened following the Federal Reserve’s decision to cut the interest rate in September 2007. The slide in the US dollar could accelerate if the US Federal Reserve decides to cut interest rates further to prop up the softer US economy, while Europe and Japan experience sustained growth with further increases in interest rates. Managing the exchange rate will be challenging in the wake of a US dollar weakness, as this will consequently strengthen most Asian currencies.
The high oil prices reaching US$100 per barrel are no longer simply a cyclical event but could also characterize in part structural changes, driven by rising demand from emerging markets such as PRC and India. Although the impact has been mild so far, this could change if oil prices remain persistently high. Coupled with the rise in commodity prices, this could eventually lead to increased inflationary pressures worldwide. With the PRC’s growth projected to remain robust, and without peace in the Middle East, oil prices will likely remain high. This will raise the risks of higher inflation is the situation is prolonged.

Populations have been aging in a number of Asian countries including Japan, Singapore, and Hong Kong, China and this has implications on the household savings rate. The spending pattern of the younger generation, which involves credit cards, among other methods, may exacerbate this problem. This could reduce the savings pool for investment and social expenditure. The elderly will also require assistance in health care and income support, and this will require greater fiscal outlays.
There is greater awareness that environmental protection is important to human well-being and sustainable development. Pursuing development without caring for the environment will harm the quality of life of future generations. Unmanaged and widespread pollution will affect health and living conditions, which will translate into large sums in monetary terms. Climate change is a global problem that requires concerted efforts from various parties if further progress is to be made.
The 1997–1998 crisis has been a catalyst to reforms in the banking and the corporate sectors. The prudential supervision standards have seen some upgrading although there is room for further improvement. Better risk management systems are now in place and deposit insurance schemes have been implemented. Nonetheless, some analysts view the reforms as incomplete and still requiring more work.
Efforts and initiatives have been taken to make Asia more resilient and to reduce the probability and intensity of another crisis. Although policies may not be able to guarantee that a crisis will not happen, having sound macro policies can reduce the intensity of the impact. Asian countries have taken measures to reduce domestic credit growth, enlarge foreign reserves, and prevent overvaluation of the currency. This is not to say that everything is running well, but progressive improvement is critical to ensure investor confidence.

Ariff, M. 2007a. Comment on “Asian Currency Crisis and the International Monetary Fund, 10 Years Later: Overview.” Asian Economic Policy Review 2(1): 50–51.
——. 2007b. Economic Openness, Volatility and Resilience: Malaysian Perspectives. Kuala Lumpur: Malaysian Institute of Economic Research.
Asian Corporate Governance Association. 2007. CG Watch 2007 presentation. Available: www.acga-asia.org.
ADB (Asian Development Bank). 2007. Asian Development Outlook 2007. Hong Kong, China: Oxford University Press for ADB.
——. Various years. Key Indicators. Manila: ADB.
Aziz, Z.A. 2007. Asia’s Decade of Transformation. Finance and Development 44(2, June).
Burton, D., and A. Zanello. 2007. Asia Ten Years After. Finance and Development 44(2, June).
Felipe, J., K. Kintanar, and J.A. Lim. 2006. Asia’s Current Account Surplus: Savings Glut or Investment Drought? Asian Development Review 23(1): 16–54.
Ghosh, S. 2006. East Asian Finance: The Road to Robust Markets. Washington, DC: World Bank.
Grenville, S. 2006. Ten Years After the Asian Crisis: Is the IMF Ready for the “Next Time”? Analysis Series. Sydney: Lowy Institute for International Policy. August.
——. 2007. Regional and Global Responses to the Asian Crisis. Asian Economic Policy Review 2(1): 54–70.
Griffith-Jones, S., and R. Gottschalk. 2006. Financial Vulnerability in Asia. In Asia 2015: Sustaining Growth and Ending Poverty, edited by M. Robinson and J. Farrington. IDS Bulletin 37(3, May).
Kawai, M., R. Newfarmer, and S. Schmukler. 2005. Financial Crises: Nine Lessons from East Asia. Eastern Economic Journal 31(2, Spring): 185–207.
Kwan, N., and F. Cheung. 2006a. Asia Focus: Intra-Asia Portfolio Flows, A Weak Link. Standard Chartered, September 13.

Kwan, N., and F. Cheung. 2006b. Asia Focus: Intra-Asia Investment Reinforces Integration. Standard Chartered, June 21.
McCauley, R.N. 2002. Setting Monetary Policy in East Asia: Goals, Developments and Institutions. The South East Asian Central Banks Research and Training Centre (SEACEN), Occasional Paper No. 33.
Park, Y.C., and C. Wyplosz. 2007. Financial Vulnerability in Asia. In Asian Tigers: New Vulnerabilities to Crisis, edited by S. Griffifth-Joines and R. Gottschalk. IDS Bulletin 38(4, July).
US Department of Treasury. 2007. Major Foreign Holders of Treasury Securities. http://www.ustreas.gov/tic/ticsec2.shtml.

The two chapters give us an excellent perspective on Asia today. The one by Mr. Ariff and Mr. Kadir looks back to the Asian crisis, while Mr. Petri’s looks forward into the future.
There is not much to add to Mr. Ariff and Mr. Kadir’s chapter. Immediately after the Asian crisis, there was some debate as to whether this was an inevitable outcome of crony capitalism or was unnecessary suffering caused by a malicious attack by hedge funds that was aggravated by the wrong response, including that by the International Monetary Fund (IMF). Ten years later, the world has arrived at a more balanced consensus. Countries have taken a pragmatic attitude to addressing potential vulnerabilities and have made significant headway, and Asia is in a much stronger position, as the Ariff-Kadir chapter demonstrates, although challenges remain.
Are there chinks in the armor? One risk that the authors note and which is shared by many policymakers in Asia is the large inflows of capital. Asia has been again experiencing a period of rapid capital inflows. This is not a phenomenon that is unique to Asia. Recent years have seen a surge of capital flows into emerging and developing market economies. Overall, Asia has managed the inflows well, and the signs of overheating and buildup of vulnerabilities of the sort that we saw prior to the Asian crisis appear limited. Still, Asian countries have been concerned about the inflows, particularly over the effects of the inflows on exchange rates and hence on competitiveness.
The authors suggest that the increase in exchange rate flexibility may not be as large as touted and that there is still “fear of floating.” When comparing the daily volatilities between the pre-crisis period and today, there is some increase, particularly when compared with 1996, but the increase is not particularly large. However, when one compares the overall movements in the exchange rates, they do seem to show more variability over the medium term.
While this points to the increase in the overall flexibility of the exchange rate, many countries still resort to exchange market intervention to stabilize the exchange rate—and this is notwithstanding the adoption of inflation targeting as a monetary policy regime in many countries. With already large

reserves, the argument that more reserves are needed as insurance is less convincing today, although intervening to counter short-run hot-money inflows does make sense to some extent. Moreover, a significant portion of the exchange market pressure has come through the current account surplus.
Moreover, the authors note the increase in oil prices pose a new challenge in this context. Asia has been able to maintain stable inflation and inflationary expectations, at least a part of which should be attributable to credibility of the monetary policy framework. However, the combination of increased input prices, not just of oil but of commodities more broadly, and the desire to limit exchange rate appreciation may not be conducive to maintaining the credibility of monetary policy.
These considerations, as well as the risk of disorderly unwinding of global imbalances, seem to point to the desirability of pursuing more flexibility in exchange rates.
With regard to more generally what needs to be done to reduce the risks from large capital inflows, the IMF has recently published a study in the World Economic Outlook, which looks at the episodes of large capital inflows to see what policies would help to reduce the risk of post-inflow recession and crisis. It shows that the only policy that seems to work to reduce the risk is to be conservative with regard to the growth of government expenditures during the inflow period. How this advice should be seen in the Asian context is not straightforward, given Asia’s large current account surplus, the level of investment, which has declined since the Asian crisis, and the need to build up public infrastructure.
In fact, Asian governments have generally been quite conservative with respect to fiscal policy. Even in the aftermath of the Asian crisis, notwithstanding the common criticism about fiscal austerity in IMF programs, the fact of the matter was that Asian crisis-hit countries could not or did not wish to deliver too much fiscal stimulus. Indonesia’s fiscal deficit outcomes undershot the program significantly, and in the Republic of Korea the IMF urged the government to let automatic stabilizers come into play in the event of economic slowdown and revenue shortfall.
Looking into the future, given the increasing weight of Asia in the world economy, it is clear that Asia cannot be analyzed in the framework of a small open economy. Mr. Petri makes a valuable contribution by putting the outlook for Asia’s investment-saving balance in a global context. One is often tempted to look at only country-specific factors in considering the

important nexus between savings, investment, and growth, but clearly, given that Asia is providing a large portion of global net savings, the compatibility with the global picture is important. The extreme scenario of continued very large net saving in Asia appears possible only with a continuing very large deficit in the United States (US). Even though the world has been able to live with this global pattern of savings and investment for some time, it is difficult to see this continuing for another decade.
To see what could drive the economies along different paths and to understand the potential interactions between regions, a structural model would be useful. One such is the INGENUE model that was referred to in the IMF’s World Economic Outlook Chapter on Economic Impact of Demographic Changes (September 2004). This is somewhat dated, but it provides an internally consistent simulation result that projects the evolution of savings, investment, growth, and current account balances of the various groups of countries from 2000 onwards. The main driver of the projection is demographics, and some of the results are consistent with Mr. Petri’s scenarios, including a projection that emerging countries’ net savings will rise.
However, the actual outcome over the last several years has deviated significantly from the projections, in particular the massive increase in the US deficit, the small increase in the Japanese current account surplus (as opposed to the predicted large decline), and a rise in the net savings of emerging market countries.
The lesson to be taken away is that these long-term projections are subject to large margins of error, and also show the value of the scenario approach taken by Mr. Petri, which though simple in its framework, provides a clearer idea of where the pressure points may appear. The scenarios clearly point to the need for resolving global imbalances before markets force them to correct in a potentially disorderly fashion. For Asia, this means rebalancing demand, including through exchange rate adjustments.
The microeconomics of how assets holdings will be distributed is more difficult to analyze. For the projection to 2020, I am not sure whether I understood Mr. Petri’s analysis correctly, but the projection seems to rest on the assumption of applying current patterns of holdings. The diversification of portfolios in Asia could proceed much more quickly. Recent steps to liberalize capital outflows have resulted in considerable surges in capital outflows, the destination of which could be much more diversified than before, where accumulation of foreign assets often took the form of reserve accumulation that would be placed largely in US government debt. Capital

inflows have also been liberalized, and the World Trade Organization accession of the People’s Republic of China has provided a further boost.
I fully agree with the observation that Asia needs to develop its financial markets, but as this proceeds, together with capital account opening and reduction in home bias, we will likely see a much more rapid growth in international asset holdings as well as greater diversity of such holdings, leading to much larger intra-Asia cross holdings of assets. Indeed, the large holdings of European assets by European investors reflect the economic union and the adoption of a common currency, which has reduced obstacles and increased incentives for cross-border investment. The large size of intra-European investment could be interpreted as a wider form of home bias.
In trying to predict Asia’s future financing needs, Mr. Petri has focused on growth, savings, and investment trends to draw on future scenarios. Predicting the future on the basis of present data and past experiences is always risky. For example, in the late 1950s, the United Nations Economic and Social Commission for Asia and the Pacific (ESCAP) (then known as the Economic Commission for Asia and the Far East, or ECAFE) tried to predict economic outcomes 25 years on. The study predicted rosy development of the Philippines and Myanmar and regarded the Republic of Korea as a basket case. Likewise, the World Bank’s East Asian Economic Miracle and many other studies predicted a rosy picture for East Asia; the advent of the Asian financial crisis in 1997 was totally unexpected.
My specific comments on projected trends in growth, savings, and investment rates:
(i) Growth rates. Gross domestic product (GDP) growth rates have recovered rapidly after the financial crisis, but for many economies, they have not regained their pre-crisis trajectory. At present, economic growth in Asia has been uneven and has been dominated by the super-growth of the People’s Republic of China and India. It remains to be seen whether the People’s Republic of China and India will be able to act as growth engines for the rest of Asia. East Asia has not decoupled from its dependence on the United States (US) and European economies for markets, investments, and technologies. The possibility of a US recession in 2008 and growing

protectionism in the US and Europe will dent Asia’s growth prospects in the coming years.
(ii) Savings rates. It is not entirely clear that savings rates in East Asia will remain high, due to two developments. First, demographic aging in Japan; People’s Republic of China; Republic of Korea; Hong Kong, China; and Singapore will affect the savings rates of households. Second, the widespread use of credit cards in East Asia has changed the spending patterns of the younger generation.
(iii) Investment rates. These have been low in the post-financial crisis period, contributing to the high net savings scenario. The low investment rates may be explained by over-investment during the pre-crisis years and the huge excess capacities that resulted from the crisis; these are particularly obvious in the real estate and infrastructure sectors, but also to some extent in manufacturing capacities. Only in the past two to three years are investment rates rising again, particularly with new huge investments in infrastructure projects.
Every economy in East Asia has been enjoying growing net savings since the financial crisis. Many economists have analyzed how East Asia could resolve the global imbalance. The mantra for East Asia is to consume and import more. Another recommendation is for East Asia to use its abundant savings to finance East Asian economic development through various proposals of financial and monetary cooperation, including the expansion of the Chiang Mai Initiative, development of the Asian Bond Market, and the establishment of infrastructure funds. Perhaps Mr. Petri’s chapter could critique these various proposals on financing Asia’s future development.
In the coming years, Asian economies will increasingly be engaged in outward investments at the same time that they are receiving foreign investments. A flood of Asian investments in Western countries, particularly in the form of mergers and acquisitions, could invite a protectionist backlash. This is already evident in the negative reactions to investments by sovereign wealth funds (SWFs). An Economist article in May 2007 highlighted the rapid growth of SWFs managing money drawn from countries’ reserves and natural resource earnings. The funds are usually held separately from the countries’ foreign reserves and administered separately. The estimated size of SWFs is expected to reach US$2.5 trillion by end-2007 and could swell to US$12 trillion by 2015. SWFs have typically invested in bonds,

dollars, and bank deposits, but they are also increasingly buying up bonds and shares. There is growing concern in the US and Europe that SWFs from the Middle East, the People’s Republic of China, and Russia would be buying up their strategic assets and undermining national security. The G7 has called for studies by the Organisation for Economic Co-operation and Development and the International Monetary Fund (IMF) and the establishment of “codes of conduct” that would include transparency and accountability in the operations of these SWFs. Sensitivity to investments by SWFs is not confined to the West. For example, Singapore’s Temasek Holdings has encountered difficulties in some of its investments in Thailand and Indonesia. Mr. Petri’s chapter could perhaps analyze the character and impacts of such state-led foreign investments.
I will not comment on financial issues, particularly exchange rate movements, but on other aspects of the chapter.
The chapter illustrates very clearly what has happened in the ten years after the onset of the Asian financial crisis. There are two ways of evaluating the performance—either the cup is half-full or it is half-empty. The authors reached positive conclusions but critics could argue that much remains to be done.
The authors’ positive assessment does not apply to post-crisis investment rates, as investment rates remained way below pre-crisis levels. I proffer two explanations. First, there have been excessive investments in the pre-crisis years, resulting in the problem of excess capacity, particularly in the real estate sector. Second, for several Southeast Asian countries, the investment climate has remained negative, due to political and social turbulence and uncertainties, hence deterring both local and foreign investments.
In assessing performance over the past ten years, perhaps Kawai’s 2007 paper could be used as a benchmark. Kawai lists national, regional, and global measures to reduce risk through sound macroeconomic management, adopting sustainable exchange rate regimes, managing risks in national balance sheets, and managing risks in the financial and corporate sectors; to manage effectively through mobilizing timely and adequate external liquidity, tailoring macroeconomic and structural policies to crisis specifics, and bailing in private international investors; and to resolve systemic consequences through resolving impaired assets and corporate liabilities and supporting vulnerable groups through social sector policies. It has been reported that while national policy responses were robust in the early post-

crisis years, the reforms (particularly those pertaining to governance) slowed down once the economies regained their recovery paths.
Mr. Ariff and Mr. Kadir focus on lessons from the crisis for the crisis-affected countries. However, two other lessons deserve mention. First, the IMF has learned to be more discerning in its policy prescriptions and conditionalities and not treat all crises with the same remedies. In the case of the Asian crisis, the severity of IMF measures helped send the crisis economies into severe recession and the IMF had to modify its policies soon after. Second, economists and policymakers have been more aware of the differences between trade liberalization and capital account liberalization. The latter could produce large and volatile capital flows with negative effects and should not be embarked on unless the domestic financial and regulatory systems are robust.
While all crisis-hit economies have recovered, some have been more successful than others. In particular, the Republic of Korea has achieved spectacular recovery but Indonesia has been somewhat of a laggard. What accounts for the differences in recovery, since both (as well as the Philippines) received the IMF aid package? What lessons can be drawn from the Republic of Korea’s recovery experience?
The authors have listed some challenges facing Asia. Will there be another crisis facing East Asia? The 1997–1998 crisis took the countries, as well as foreign observers and specialists, by surprise with its timing, severity, and rapid contagion. Since then, the region has sought to strengthen its weaknesses, notably by accumulating huge foreign exchange reserves. However, the volatility of international capital flows could give rise to other types of financial crises unless the regulatory and financial systems are robust. The ongoing subprime mortgage crisis in the US is a case in point. In the years ahead, Asia faces many other challenges, including environmental sustainability, rising inequalities and demands for inclusive economic growth, demographic changes and their impact on labor markets and migration, and structural adjustments to the economic rise of the People’s Republic of China and India.


Justin Yifu Lin
When the Asian Development Bank Institute (ADBI) was established in 1997, I had the honor of being a member of its advisory council. I would like to take this opportunity to congratulate ADBI for having achieved its intended goal of becoming a leading knowledge production and sharing institution in Asia under the leadership of its deans and with joint efforts of its staff and other partner institutions throughout Asia.
ADBI was established at the advent of Asian financial crisis. Asia has recovered robustly from that crisis, and once again become the fastest growing region in the world. However, according to the World Bank’s World Development Indicators, the per capita gross national income in East and South Asia and the Pacific in 2004 was US$1,056, which was just 16% of the world average. Moreover, in 2002, 11.6% of people in East Asia and the Pacific and 31.2% of people in South Asia still lived on less than US$1 a day. If we use a higher poverty threshold of US$2 a day, then the percentage of people living in poverty in those two regions jumps to 40.7% and 77.8%, respectively (World Bank 2006). Therefore, how to further facilitate economic development, and how to achieve inclusive growth that may help the poor to escape poverty, are still challenging issues in Asia and the Pacific.
ADBI was established in 1997 in response to the needs for identification of effective development strategies and improvement of the capacity for sound development management of agencies and organizations in the Asian Development Bank’s developing member countries. Poverty reduction is one of ADBI’s four priority research theme areas. I am delighted to have the opportunity to contribute to the session on poverty reduction for an inclusive and equitable Asia at the tenth anniversary conference, and to report the research findings based on my studies over the past decade. The major finding is that, during the process of economic development, the
1 This chapter draws heavily on the author’s Marshall Lectures, entitled “Development and Transition: Idea, Strategy and Viability,” delivered at Cambridge University in 2007 and ADB’s Distinguished Speakers’ Lecture, entitled “Development Strategies for Inclusive Growth in Developing Asia,” in 2004. The author is most grateful for helpful comments by Yasuyuki Sawada and Iwan Azis and other participants of the conference.

development strategy of a government plays a pivotal role in determining whether or not a developing country can achieve sustainable, dynamic, inclusive, and equitable growth. If an appropriate development strategy is adopted, then a developing country will achieve fast and healthy economic development and the poverty will eventually be eliminated.
My main arguments are as follows: A continuous flow of technology/industrial innovation is the key to the sustained dynamic growth of any country. Developing countries have the “advantage of backwardness,” as they can borrow technology/industry from developed countries. In this way, the developing countries will be able to achieve much faster growth than developed countries and realize convergence to developed countries. However, in an open, competitive market, the optimal technology/industrial structure of a country is endogenously determined by the country’s endowment structure, which is given in each specific development phase of an economy. The optimal technology and industry will be either labor- or resource-intensive as developing countries are rich in either labor or natural endowments. Therefore, to benefit from the advantage of backwardness, a developing country needs to have an appropriate strategy that guides its technology/industrial borrowing from developed countries. However, the governments in most developing countries after World War II adopted an inappropriate development strategy that attempted to defy their comparative advantages, determined by their endowment structures, for the purpose of building up the developed country’s capital-intensive industries on a relatively capital-scarce endowment structure. This strategy made firms in the priority sectors nonviable in an open, competitive market and was responsible for many policy distortions in the developing countries. Consequently, the developing countries failed to catch up with developed countries and to achieve inclusive and sustainable growth. A transition to a policy regime that facilitates industrial development along the countries’ comparative advantages is necessary for the developing countries to improve their growth performance and to allow the poor to benefit from the growth.
This chapter is organized as follows: Section 2 discusses two mutually exclusive development strategies, the comparative advantage-defying strategy (CAD) and the comparative advantage-following (CAF) strategy, and explores the effects of a country’s development strategy on the institutions, growth performance, and income distribution. Section 3 tests several hypotheses derived from Section 2. Some concluding remarks are provided in Section 4.

Most economists now believe that developing countries failed to catch up with developed countries because of bad institutions due to the government’s interventions and regulations, including widespread corruption, weak protection of investors, and a high degree of social conflict (Shleifer and Vishny 1998; Rodrik 1998; Acemoglu, Johnson, and Robinson 2001a, 2001b; Acemoglu and Robinson 2002; Acemoglu 2002; Djankov et al. 2003). As Rodrick (2003: 7) stated, “institutions have received increasing attention in the growth literature as it has become clear that property rights, appropriate regulatory structure, quality and independence of the judiciary, and bureaucratic capacity could not be taken for granted in many settings and that they were of utmost important to initiating and sustaining economic growth.”
Several studies have explored how government intervention and regulation occur. Shleifer and Vishny (1993, 1998) and Grossman and Helpman (1996, 2001) proposed a “grabbing hand” hypothesis and argued that the government adopts interventions for the benefits of politicians and bureaucrats. Politicians use regulations to favor friendly firms and other political constituencies, and thereby obtain campaign contributions and votes. A recent paper presented by Djankov et al. (2002) provided an empirical test on the theories of “grabbing hand;” for example, barriers for business entry might arise from the corruption of bureaucrats.2 Other economists attribute government intervention and regulation to legal origins (La Porta et al. 1998, 1999) and colonial institutional inheritances
2 This grabbing hand hypothesis may not be appropriate for most interventions and regulations in developing countries. Supposing that the government’s regulations in the developing countries could arise from the grabbing hand of government, or political elites, the unsolved question in the literature is how to understand the evolution of institutional structure under the government’s interventions. In the developing countries, the institutional structure shaped by the government’s interventions is extremely complicated. We wonder what are the incentives for political leaders to design such complicated systems, because the increase of costs of expropriations and political control due to the complexity of institutions would diminish the gains of the grab. Corruptions induced by the special interest groups might not be a good answer for this question either, because the benefited groups are often taxed or suppressed along with the protections/subsidies. Moreover, many interventions do not have obvious beneficiary groups.

(Acemoglu, Johnson, and Robinson 2001a, 2001b; Engerman and Sokoloff 1997).3
I agree that inappropriate intervention and regulation are attributable to the poor economic performance in developing countries. However, I would like to propose an alternative hypothesis for the existence of government intervention and regulation in developing countries. My argument is based on the conflicts between the government’s development strategy in a developing country and the country’s endowment structure (Lin 2003, 2007).
As suggested by Kuznets (1966), continuous innovation and upgrading of technology and industries is the key to dynamic growth in any economy in modern times. A developing country may have an advantage over a developed country in the speed of technology innovation because the developing country could purchase mature and low-risk technologies from the developed country at low costs, while the latter has to engage in highly costly and risky research and development (R&D) activities to obtain further technology innovation (Hayami 1997). The higher speed of technology innovation will enable the developing country to have a higher return to capital investment, resulting in faster capital accumulation, industrial upgrading, and larger scope to reallocate labor and other resources from low value-added industries to high value-added industries. Consequently, a developing country could potentially have a higher economic growth rate than developed countries and could thereby finally achieve economic convergence. However, whether or not a developing country could benefit from the “advantage of backwardness” very much depends on the government’s development strategy and the resulting economic institutions.
Generally speaking, the government is the most powerful and important institution in a developing country. Its economic policies shape the macroeconomic structure and micro incentive schemes for every economic agent in a developing country. However, development strategy and its resulting intervention and regulation adopted by governments in most
3 If a developing country’s existing institution that is detrimental to economic growth is endogenous to colonial heritage or natural endowment, the knowledge is not useful for the development policy as we can do nothing at the present time to affect the colonial heritage or natural endowment of several hundred years ago.

developing countries after World War II denied them opportunities to benefit from the “advantage of backwardness.”
Many of the early generation of political leaders in both socialist and non-socialist developing countries, such as Nehru in India, Nasser in Egypt, Sukarno in Indonesia, Mao Zedong in People’s Republic of China, and Ho Chi Minh in Viet Nam, were elites taking part in independent movements or revolutions for the purpose of their nations’ modernization. They believed the development of modern, capital-intensive heavy industry to be the foundation for modernization of their nations. The institutions laid down by the early generation of political leaders were endogenously shaped by the conflicts between the elites’ ambitious drives of industrialization/modernization for nation building and their nations’ economic realities. The key to the argument is the viability issue of firms in the priority sectors of the government’s industrialization drives.4
The term viability is defined as follows: “If, without any external subsidies or protections, a normally managed firm is expected to earn socially acceptable profits in a free, open, and competitive market, then the firm is viable. Otherwise, the firm is nonviable” (Lin 2003: 280) It is obvious that no one will invest in a firm if it is not expected to earn a socially acceptable normal profit. Such a firm will exist only if the government gives it financial support or protection.
In an open, competitive market, the management of a firm will affect its profitability, which is a known proposition. However, the expected profitability of a firm also depends on its industry/technology choice.
To illustrate this idea, I will discuss the case of a simple economy that possesses two endowments, capital and labor, and produces one product. As shown in Figure 4.1, each point on the isoquant represents a production technology or a combination of capital and labor required to produce a given amount of a certain product. The technology represented by A is more labor-intensive than that of B. The lines C, C1, D, and D1 are isocost lines. The slope of an isocost line represents the relative prices of capital
4 The bureaucrats in lower levels of government in a developing country may subsequently use the interventions/regulations endogenous in the nation-building attempt for their personal grabbing hand purpose. However, the grabbing hand of bureaucrats should be viewed as a consequence, not the cause, of the distortions and regulations that were created by first-generation leaders who did not have much personal purpose other than the dream of nation building. Similarly, various groups may subsequently take advantage of these interventions and regulations and seek rents to benefit themselves. However, the vested interest group’s rent seeking was an unintended consequence of the first generation leaders’ motivation for interventions and regulations.

and labor. In an economy where capital is relatively expensive and labor is relatively inexpensive, as represented by isocost lines C and C1, the adoption of technology A to produce the given amount of output will cost the least. When the relative price of labor increases, as represented by the isocost lines D and D1, production will cost the least if technology B is adopted.
In a free, open, and competitive market economy that produces only one product as illustrated in Figure 4.1, a firm will be viable only if it adopts the lowest cost technology in its production. In Figure 4.1, if the relative prices of capital and labor can be represented by C, the adoption of technology A costs the least. The adoption of any other technology, such as B, will have a higher cost. The market competition will make firms that adopt technologies other than A nonviable. Therefore, in a competitive market with given relative prices of labor and capital, the viability of a firm depends on its technology choice.
In a competitive market, the relative prices of capital and labor are determined by the relative abundance/scarcity of capital and labor in the economy’s factor endowments. When labor is relatively abundant and capital is relatively scarce, the isocost line will be something like that of line C in Figure 4.1. When capital becomes relatively abundant and labor relatively scarce, the isocost line will change to something similar to line D. Therefore, the viability of a firm in an open, competitive market depends on whether its choice of technology is on the lowest cost lines determined by the relative factor endowments of the economy.
The above analysis can be extended to a multi-product and multi-industry case, and in an open, competitive market, whether or not a firm is viable depends on whether or not the firm’s industry, product,
Capital
A
B
D D1 C C1
Labor

and technology choices are consistent with the comparative advantages determined by the economy’s endowment structure.5 If a firm’s choices are not consistent with this condition, the firm cannot earn an acceptable profit in an open, competitive market even under normal management and its survival relies on government subsidies and/or protections.
It is important to note from the above discussion that in an open, competitive market, without government intervention, only viable firms will exist. Therefore, an economy’s structure of industry, product, and technology in an open, competitive market is in effect endogenously determined by the economy’s endowment structure.
Most developing countries are characterized with relative abundance of labor and scarcity of capital.6 As such, in an open, competitive market, the structure of industry and technology in a developing country will be relatively labor-intensive. However, unaware of the endogeneity of the industrial/technology structure and inspired by the dream of nation building, political leaders, economists, and social elites alike in developing countries often attempt to build up the most modern, capital-intensive industries and adopt the most advanced technologies, similar to those of the most developed countries, within the shortest periods of time as the objective of their development drives. I call such a development approach in a developing country a CAD strategy because the government attempts to encourage firms to ignore the existing comparative advantages of the economy in their choice of industry and technology.7 Most firms in the priority sectors of a CAD strategy are not viable in open, competitive markets. Therefore, the developing country’s government has to subsidize and protect those firms through various interventional measures.
5 It is worth noting that the viability of a firm and the comparative advantages of an economy are highly related. The viability is a concept that focuses on a firm’s technology, product, and industry choices in a competitive market, whereas the comparative advantage refers to the competitiveness of an economy’s product/industry in an open economy. However, both are determined by the country’s endowment structure.
6 The other possibility for a developing country is to be relatively abundant in natural resources and relatively scarce in capital and labor. The discussions and conclusions in this chapter can be easily extended to cover such a case.
7 The CAD strategy includes the heavy-industry-oriented development strategy in the socialist countries and in developing countries such as India as well as the secondary import-substitution strategy in many Latin American and African countries. The strategy also includes the protection of certain industries that has lost comparative advantage due to the development of the economy, such as the protection of agriculture in many Organisation for Economic Co-operation and Development (OECD) countries.

In a developed country, if a government adopts a CAD strategy and the deviation of the firms’ choices of technology/industry from the optimal ones (as determined by the economy’s endowment structure) is small, and the number of nonviable firms that the government attempts to support is limited, the government may subsidize the firms directly by tax transfers as in the case of agricultural protection in many Organisation for Economic Co-operation and Development (OECD) countries. However, when a developing country’s government adopts a CAD strategy, the distance of deviation from their comparative advantages is often very large, the number of nonviable firms numerous, and the government’s taxation capacity very weak. The developing country’s government often turns toward implicit measures of subsidies through price distortions, limitations on market competition, direct administrative allocation of resources, and the like.8 As a matter of fact, the traditional planning systems that existed before economic transitions in socialist economies were typical institutional arrangements for supporting and protecting the nonviable heavy industrial firms (Lin, Cai, and Li 2003).
Moreover, when a developing country’s government adopts the CAD strategy, the government does not know exactly how large the subsidies should be due to information problems. The firms in the priority sector will have incentives to use their viability problem as an excuse and use resources to lobby the government officials not only for more ex ante policy favors, such as access to low-interest loans, tax reductions, tariff protection, and legal monopolies, but also for ex post ad hoc administrative assistance, such as more preferential loans or tax arrears. The economy will be full of rent seeking activities and corruption. Because the firms can use the viability problem as an excuse to bargain for more government support and because it is hard for the government to shun such responsibility, the firm’s budget constraints become soft (Lin and Tan 1999).9 In such a situation, the firm will face no pressure to improve productivity and the firm’s efficiency will be low. Moreover, with the subsidies/protections and soft budget constraints for the firms in the priority sectors, entry into these sectors becomes a
8 From the above perspective, the root of interventions in a developing country is not the grabbing hands of government officials or the manipulations of interest groups but the dream of nation building of political elites. The corruptions may be an endogenous phenomenon of the distortions and interventions arising from the conflict between the economy’s endowment structure and the political leaders’ ambitious and unrealistic development attempts. From this perspective, the political target should be separated from the corruption view of the grabbing hand approach or the “Leviathan” approach.

privilege. The political leaders in a non-socialist developing country may select their own close friends or political supporters to invest in those priority sectors, resulting in the phenomenon of crony capitalism.
In addition to the above problems that can be caused by the CAD strategy, if the government in a developing country adopts such a strategy, the economy will become more inward-oriented than it would otherwise be. This is because the CAD strategy attempts to substitute the import of capital-intensive manufactured goods with domestic production, causing the reduction of imports. Exports will also be suppressed due to the inevitable transfers of resources away from the industries for which the economy has comparative advantages to the priority sectors of the CAD strategy. The exchange rates are likely to be overvalued to facilitate the import of technology and equipment for priority industries, effectively hampering export opportunities. In addition, under the CAD strategy, the carriers of a government’s development strategy are normally large-sized firms. To support the financial needs of nonviable large-sized firms, the government often nationalizes the firms and uses direct fiscal appropriation, skipping financial intermediation, to support these firms. Such was the case in the former socialist planned economies; it continues to be the case in many developing countries. Even if the government relies on private firms to carry on the CAD strategy, the financial needs of large-sized firms will be large and can be met only by a heavily regulated oligopolistic banking system or an administratively intervened stock market, resulting in the phenomenon of financial depression (McKinnon 1973; Shaw 1969). In either case, the financial system in the country will be very inefficient. The development of the nonviable firms relies heavily on external financial support. The government first mobilizes domestic resources to support these firms through the above interventions in the financial system. Once domestic financial resources run out, the government often allows the nonviable firms to turn to international financial markets for supporting their further
9 The “soft budget constraint” is a term coined by Kornai (1986) to explain the problem in the socialist countries. According to Kornai, the soft budget constraint arises from the paternalistic nature of the socialist government toward the state-owned firm. His argument cannot explain why soft budget constraints exist in non-socialist economies and why they still exist ten years after privatization in Russia and Eastern European transitional economies (World Bank 2002). Dewatripont and Maskin (1995) argued that soft budget constraints arise from the bank’s imperfect information on investment projects and the time inconsistent problem of the projects. However, this argument cannot explain the prevalence and persistence of the soft budget constraint phenomenon in developing countries.

development. Fiscal deficits, bad loans, external debts, and financial fragility will be exacerbated and macroeconomic stability will become unsustainable, leading to eruptions of financial crises (Lin 2000), which may also trigger serious social conflicts and political instability (Rodrik 1998; Caselli and Coleman 2002).
From the above discussions, we can see that many of the interventions and regulations and their resulting inefficiency in developing countries are endogenous to the viability problem of the firms in the government’s priority sectors.
The government in developing countries could adopt an alternative strategy, which I call a CAF strategy, to encourage firms in the country to enter the industries for which the country has comparative advantages and to adopt the technology in production that will make these firms viable.
When the government adopts a CAF strategy, all firms are in sectors of the country’s comparative advantages and are viable. The firms have no excuses for seeking government subsidies and protections; this reduces the possibility of firms’ rent seeking and the possibility for the government to have financial depression as a way to mobilize resources for the priority sectors. Therefore, the way for a firm to be profitable is to improve its management and technology so as to reduce costs and increase the quality of products in order to increase its competitiveness in the market. International trade will be more important under the CAF strategy than under the CAD strategy, as the economy under the CAF strategy will import whatever items are not its comparative advantages and export whatever it has comparative advantages in. The openness of the economy will facilitate the firms to borrow technology from developed countries, contributing to the realization of the “advantage of backwardness.” Because firms fully utilize the economy’s comparative advantages, the economy will be competitive in domestic and international markets, have a larger surplus, accumulate more capital, and have a faster upgrading of the endowment structure than what is possible under the CAD strategy.
As discussed in the above subsection, the industries for which the economy has comparative advantages and the technologies that are appropriate for production are all endogenously determined by the country’s factor endowments structure. However, the managers of firms, as micro agents, have no knowledge of or concern for the actual endowments.
Their only concerns are the prices of their outputs and the costs of their production. They will enter the industry and choose the technology of production appropriately only if the relative factor prices correctly reflect the relative factor abundances, which can be achieved only if the markets are competitive. Therefore, when the government in a developing country adopts a CAF strategy, its primary policy is to remove all possible obstacles for the function of free, open, and competitive product and factor markets, as suggested by neoclassical economics.
However, the government in a developing country that adopts the CAF strategy can play a role that is larger than what is required by a minimum government. When the factor endowment structure of the economy is upgraded, the firms should upgrade their products/technologies accordingly from a less capital-intensive industry to a relatively more capital-intensive industry. Such technology and industry may already exist in the more developed countries. However, the information for what exact technology and industry would be best to borrow from the advanced countries may not be freely available. It is necessary to invest resources for information acquisition and analysis. If a firm carries out the activities on its own, it will keep the information private, and other firms will be required to make the same investment to obtain the information. There will be duplication in information investments. However, the information has a public good nature. After the information has been gathered and processed, the cost of information dissemination is close to zero. Therefore, the government can collect the information about the new industries, markets, and technology, and make it available in the form of an industrial policy to all firms.
The upgrading of technology and industry in an economy often requires coordination of different firms and sectors in the economy. For example, the human capital or skill requirements of new industries/technologies may be different from those used with older industries/technologies. A firm may not be able to internalize the supply of the new human capital. Therefore, the success of a firm’s industry/technology upgrade also depends on the existence of an outside supply of new human capital. In addition to human capital, the firms that are upgrading their technology and industries may require new financial institutions, trading arrangements, marketing, and distribution facilities, and so on. Therefore, the government may also use the industrial policy to coordinate firms in different industries and sectors to make necessary investments for the upgrade of industry/technology in the economy.

The upgrading of industry/technology is an innovation, and it is risky by nature. Even with the information and coordination provided by the government’s industrial policy, a firm’s attempt to upgrade its industry/technology may fail due to the upgrade being too ambitious, the new market being too small, the coordination being simply inadequate, and so forth. The failure will indicate to other firms that the targets of the industrial policy are not appropriate and, therefore, they can avoid that failure by not following the policy. That is, the first firm pays the cost of failure and produces valuable information for other firms. If the first firm succeeds, the success will also provide externalities to other firms, prompting these firms to engage in similar upgrades. These subsequent upgrades will also dissipate the possible rents that the first firm may enjoy, so there is an asymmetry between the costs of failure and the gains of success that the first firm may have. To compensate for the externality and the asymmetry between the possible costs and gains, the government may provide some form of subsidy, such as tax incentives or loan guarantees, to the firms that initially follow the government’s industrial policy.
It is worthwhile to note that there is a fundamental difference between the industrial policy of the CAF strategy and that of the CAD strategy. The promoted industry/technology in the CAF strategy is consistent with the comparative advantage determined by changes in the economy’s factor endowments, whereas the priority industry/technology that the CAD strategy attempts to promote is not consistent with comparative advantage. Therefore, the firms in the CAF strategy should be viable and a small, limited-time subsidy should be enough to compensate for the information externality. By contrast, firms following a CAD strategy are not viable, and their survival depends on large, continuous policy favors/support from the government.10
The government’s development strategies have determinant effects on the income distribution in a country. The adoption of a CAD strategy
10 The dynamic comparative advantage is an often used argument for the government’s industrial policy and support to the firms (Redding 1999). However, in our framework it can be clearly seen that the argument is valid only if the government’s support is limited to overcoming information and coordination costs and the pioneering firms’ externality to other firms. The industry should be consistent with the comparative advantage of the economy and the firms in the new industry should be viable, otherwise the firms will collapse once the government’s supports are removed.

is most detrimental to the poor, most of them living on agriculture in environmentally stressful, rural areas. The most important asset of the poor is their own labor force. The rich have other assets: land, capital, good education, personal relations, and political-economic networks. But the poor, except for their labor, may not have other assets that could bring them income. Because of this, unless their labor becomes relatively scarce and valuable, it is almost impossible for them to increase their income and improve their social status.
The production activities of rural people living below the poverty line have their own characteristics as well. Because they are poor, they produce mainly farm products, such as grain, which have low income and price elasticity. Because of the low elasticity of income, overall economic growth will have only minimum effects on the demand for farm produce. Because of the low price elasticity, the production increase of an individual rural household may increase its income. However, when most of them increase production, the price will go down, resulting in little effect on the increase of farm income.11 These two characteristics make the attempt to increase the rural poor people’s income by increasing agricultural production through investments in infrastructure and technology alone ineffective.
In my view, the most important way to win the anti-poverty war and achieve environmental sustainability is to reduce the rural labor force. When the rural labor force is reduced, people living on agriculture in rural areas will have more land and resources to work on. At the same time, when the farm workers become non-farm workers, they will change from suppliers to consumers of agricultural products. The supply curve of agricultural products will thus shift to the left and the demand curve will shift to the right. Consequently, the prices of agricultural products will go up, as will the marginal product value of farm labor and its earnings. The income of rural people will in this way increase as the farm labor continues decreasing. Apart from this, the reduction of rural labor and rural population will also help to ease the tension between population and the environment, avoiding excessive pressure on the environment due to production and living
11 If the increased produce could be exported to international market, it would help to increase the price elasticity of farm produce. Unfortunately, most countries have imposed various barriers for the import of farm produce. Therefore, the opportunity for a developing country to increase its export is pessimistic. In addition, the overvalued exchange rate in most developing countries further impairs the competitiveness of their export of farm produce.

activities, which destroys the environment’s ability for self recovery and makes the environment unsustainable.
To reduce the rural population and labor force, it is necessary to ensure that people who have stopped farming can find jobs in non-agricultural sectors in urban areas. Otherwise, the laborers that migrate from rural areas will only turn into unemployed urban poor. The overall social welfare would not improve in such a scenario.
Unfortunately, the governments of many developing countries adopted the CAD strategy to build up the capital-intensive industries. These industries required a large amount of investment but created only a small number of job opportunities, making little room for the absorption of out-migrated rural labor. This will result in one of the following consequences:
(i) The government puts restrictions on the migration from rural areas to urban areas and lets the population below the poverty line stay in rural areas, just as the People’s Republic of China did before the transition to the market economy in 1979. In this case, not only will rural poverty remain but, with the increase of the rural population and the intensifications of living and production activities, the environment will worsen.
(ii) The government allows rural people to migrate to urban areas. But since industries in urban areas cannot create enough jobs and job opportunities in the tertiary industries are also depressed due to the slow income growth, most rural out-migrants will change only from the status of rural poor to urban poor. The urban living environment will also deteriorate.
Operation of nonviable firms under the CAD strategy requires continuous financial support. When the domestic funds are exhausted, the government often allows the nonviable firms to borrow from international sources. But since they are in the comparative advantage-defying sectors, it is hard for them to profitably export their products to international markets. When they have to repay foreign loans, a financial and monetary crisis may occur. Furthermore, due to the development of the non-comparative advantage industries, domestic industries that have comparative advantages cannot be fully developed for the lack of investments. Under these circumstances, if the country is forced to open its door and adopt a free trade policy, it will be a big shock to the domestic economy. Then, the poor—no matter where they are—will be the group that is most seriously hurt, as in the case of the recent Asian financial crisis (Lin 2000).

Contrary to the CAD strategy’s adverse effect on income distribution, a CAF strategy will result in an inclusive and equitable income distribution. A developing country will develop labor-intensive industries at the early stage of its development if the government adopts a CAF strategy. The CAF strategy will thus create more job opportunities, enabling the economy to achieve full employment and enabling the poor to benefit from the economy’s growth. Thus, the growth will be inclusive. Moreover, with dynamic growth and faster accumulation of capital under the CAF strategy, the labor force will turn from relatively abundant to relatively scarce. In this case, the wage, which is the main source of income of the poor, will increase while the return to capital, which is the main source of income of the rich, will decline. Therefore, the growth will be equitable, creating the desirable consequence of “growth with equity” (Fei, Ranis, and Kuo 1979; Hasan and Quibria 2004). Under the CAF strategy, the government needs not distort the financial sector to support nonviable firms, as in the case of a CAD strategy. The financial system will perform its functions in a healthy way. Therefore, the economy is less likely to encounter an economic crisis, which is most detrimental to the poor.
The previous section has discussed the effects of development strategy on economic performance and income distribution. Two testable hypotheses are in order:
1. A country that adopts a CAD strategy will have poor growth performance.
2. A country that adopts a CAD strategy will have unequal income distribution.
This section will report the results of empirical testing of the above hypotheses.
In order to test the above hypotheses, a proxy for a country’s development strategy is required. Lin and Liu (2004) proposed a technology choice index (TCI) as a proxy for the development strategy implemented in a country. The definition of the TCI is as follows:

, (1)
where AVMi,t is the added value of manufacturing industries of country i at time t; GDPi,t is the total added value of country i at time t; LMi,t is the labor in the manufacturing industry, and Li,t is the total labor force. If a government adopts a CAD strategy to promote its capital-intensive industries, the TCI in this country is expected to be larger than otherwise. This is because if a country adopts a CAD strategy, in order to overcome the viability issue of the firms in the prioritized sectors of the manufacturing industries, the government might give the firms monopoly positions in the product markets—allowing them to charge higher output prices—and provide them with subsidized credits and inputs to lower their investment and operation costs. The above policy measures will result in a larger AVMi,t than otherwise. Meanwhile, investment in the manufacturing industry will be more capital-intensive and absorb less labor—ceteris paribus. The nominator in Equation 1 will therefore be larger for a country that adopts a CAD strategy. As such, given the income level and other conditions, the magnitude of the TCI can be used as a proxy to the extent that a CAD strategy is pursued in a country.12 The data for calculating the TCI are taken from the World Bank’s World Development Indicators (2002) and the United Nations Industrial Development Organization’s International Yearbook of Industrial Statistics (2002).
Hypothesis 1 predicts that over an extended period, a country adopting a CAD strategy will have poor growth performance. The following econometric model is used to test the hypothesis:
GROWTHi,t =C + αTCIi,t + βX + ζ , (2)
where GROWTHi,t is the economic growth rate during a certain period in country i, X is a vector that includes the initial per capita gross domestic
12 Lin (2003) constructed another index—based on the ratio of capital intensity in the manufacturing industry and the capital intensity in the whole economy—as a proxy for measuring the degree with which a CAD strategy is pursued. That proxy is correlated highly with the current proxy and the results of empirical analyses based on that proxy are similar to the results reported in this section. The data for capital used in a country’s manufacturing industry are, however, available for only a small number of countries. To enlarge the number of countries in the study, I therefore used the proxy based on the added value of manufacturing industries as defined in Equation 1 in this section.
TCIi,t = AVMi,t ⏐LMi,t
GDPi,t ⏐Li,t

product (GDP) to control the effect of the stage of development, the initial population size to control the effect of market size, the indicator of rule of law to reflect the institutional quality—which was constructed by Kaufmann, Kraay, and Zoido-Lobatón (2002)—the trade-dependent ratio to reflect openness, the distance from the equator, and whether the country is landlocked. The last two explanatory variables are included to capture the effects of geography. The instrumental variable for controlling the endogeneity of institutional quality is the share of population that speaks English and the share that speaks a major European language (Hall and Jones 1999), which are used to capture the long-run impacts of colonial origin on current institutional quality. Similarly, the fitted values of trade predicted by a gravity model are used as the instrument for openness. This approach was proposed by Frankel and Romer (1999) and revised by Dollar and Kraay (2003). In the regressions that use panel data, the instrument for openness is the single-period lagged value of itself. Table 4.1 summarizes the definition of each variable and the data source.


I will use two approaches to test this hypothesis. In the first approach, the dependent variable is the average annual growth rate of per capita GDP for the period 1962–1999, and in the second, the dependent variable is the average annual growth rate of per capita GDP for each decade of the 1960s, 1970s, 1980s, and 1990s.
Table 4.2 reports the estimates from the first approach. Regression Models 2.1 and 2.2 use the ordinary least squares (OLS) approach to obtain the estimates. The explanatory variables in Model 2.1 include only the proxy for the development strategy, LnTCI1, and the initial GDP per capita, LnGDP60, whereas Model 2.2 includes other explanatory variables that capture institutional quality, openness, geographic location, and market size. Model 2.3 has the same explanatory variables but the model uses the two-stage least squares (2SLS) approach in order to control the endogeneity of institutional quality and openness.
The results show that the TCI has the expected negative effect and is highly significant in all three regressions. This finding supports Hypothesis 1 that the more aggressively a country pursued a CAD strategy, the worse the growth performance was in that country in the period 1962–1999. The estimated coefficients of LnTCI1 have values ranging from –0.66 to –1.25. From the estimates, we can infer that a 10% increase from the mean in the TCI can result in approximately 0.1 of a percentage point reduction in the country’s average annual growth rate of per capita GDP for the whole period of 1962–1999.
The regression results also show that the initial per capita income and the population size have the expected signs and significant effects on the growth rate. Rule of law, openness, and distance from the equator also have the expected signs. Rule of law is not, however, significant in the 2SLS regression and distance from the equator is not significant in the OLS regression. Whether the country is landlocked is insignificant in all three regressions.

Table 4.3 reports the results from the second approach, in which the dependent variable is the average annual growth rate of per capita GDP in each decade from 1960–1999. The regressions to fit the estimates were OLS for Models 3.1 and 3.2, one-way fixed effect for Model 3.3, 2SLS for Model 3.4, and 2SLS and one-way fixed effect for Model 3.5. In the fixed-effect models, time dummies were added to control the time effects, whereas the 2SLS models were used for controlling the endogeneity of institutional quality and openness.
As in the results in the first approach, the estimates for the TCI have the expected negative sign and are highly significant in all regressions. The finding is once again consistent with the prediction of Hypothesis 1 that development strategy is a prime determinant of the long-run economic

growth performance of a country. The results for other explanatory variables are similar to those in Table 4.2.
In testing the effect of development strategy on income distribution, the following regression equation is used:
GINIi,t =C + αTCIi,t + βX + ε , (3)
where GINIi,t is the index of inequality in country i at time t, TCI is a proxy for the development strategy, and X is a vector of other explanatory variables.

Gini coefficients are taken from a revised version of the data set in Deininger and Squire (1996). The data set includes the estimation of Gini coefficients for many countries in the literature. Some are estimated according to the data on income; others are based on expenditure. The coverage differs between the different countries’ Gini data. Deininger and Squire (1996) assessed the quality of Gini coefficient estimations; only those ranked as “acceptable” were used in the regression. The original estimates of Gini coefficients based on income data were left unchanged, but those based on consumption expenditure were adjusted by adding 6.6, which is the average difference between the two estimation methods. For details of the calculation of the TCI index and data sources, see Lin (2003). Matching this Gini data with the TCI, I ended up with a panel of 261 samples from 33 countries. Figure 4.2 shows the relationship between the TCI and the Gini coefficient.
In order to test alternative hypotheses for the determination of inequality, I have included the explanatory variables—per capita income, GDPPCi,t , and its reciprocal, GDPPC_1i,t —which test the Kuznets inversed-U hypothesis. If Kuznets’ hypothesis holds, the coefficients for these two variables should be significantly negative.13
Based on the data set of Deininger and Squire (1996), Li, Squire, and Zou (1998) conducted a robust empirical test. The result showed that the Gini coefficient for an individual country was relatively constant across different periods. Based on this conclusion, the Gini coefficient in the initial year in the data set was introduced into the regression, denoted by “IGINI.” In this way, the historical factors that could affect income distribution and those non-observable factors across countries can be excluded. In
13 For this specification, please refer to Deininger and Squire (1996).

the data set, the year of IGINI differs from country to country. In spite of this difference, the higher the IGINI, the higher are the subsequent Gini coefficients—regardless of the initial year. As a result, the coefficient of IGINI is expected to be positive.
Corruption could also affect income distribution. Two explanatory variables are included in the regression: the index for corruption, CORRi,t, and the quality of officials, BQi,t. The data for these two variables are taken from Sachs and Warner (2000) and they differ from country to country but remain constant throughout the period studied. The larger the value is, the less is the corruption and the higher is the quality of officials. The coefficients of these two variables are expected to be negative.
Foreign trade could also affect income distribution. It affects the relative prices of factors of production (Samuelson 1978) and market opportunities for different sectors in the economy. Consequently, trade—through its effect on employment opportunities (Krugman and Obstfeld 1997)—can affect income distribution. The regression therefore includes an index of economic openness, denoted by OPENi,t, which is the share of total import and export value in nominal GDP, as an explanatory variable. The data are taken from Easterly and Yu (2000). Openness could, however, have different impacts on skilled and unskilled labor, on tradable and non-tradable sectors, and in the short run and in the long run. Its sign is therefore uncertain.
Table 4.4 reports the results from five regression models. Model 4.1 includes all explanatory variables: TCI, IGINI, GDPPC, GDPPC_1, CORR, BQ, and OPEN. As CORR, BQ, and OPEN are endogenous, other models exclude these variables to control the endogeneity problem. Because IGINI, CORR, and BQ are time invariant, the one-way effects model is applied in fitting the regression of Models 4.1, 4.2, and 4.4. According to Hausman tests, the one-way random-effect model is used in the regressions of Models 4.1, 4.2, and 4.4, and the two-way fixed-effect model is used in the regression of Models 4.3 and 4.5.
The estimated coefficients of TCI are positive and significant at the 1% level in all five regression models. These results strongly support the hypothesis that the more a country pursues a CAD strategy, the more severe will be the income disparity in that country. This result holds whether the initial income distribution is equal or unequal.
The estimated coefficients of IGINI are also positive and significant at the 1% level in Models 4.1, 4.2, and 4.4. This result is consistent with the finding in Li, Squire, and Zou (1998): the initial income distribution will have a carry-over effect in the subsequent period’s income distribution.

The estimated coefficients of GDPPC and GDPPC_1 in Models 4.1, 4.3, and 4.4 are all insignificant and have an unexpected positive sign—except for GDPPC in Model 4.1. Kuznets’ inversed-U hypothesis of income distribution is therefore rejected.
The results in Model 4.1 show that the coefficient for CORRi,t has an unexpected positive sign. One possible reason for this is that the effect of corruption on distribution is not reflected accurately in the surveys. The coefficient for bureaucracy quality, BQi,t, has an expected, but insignificant, negative sign. The coefficient for openness, OPEN, is positive, but not significant.
From the results above, it is clear that development strategy and initial income distribution are the two most important determinants of income distribution in a country. For a country in which the government follows a

CAF strategy, income distribution will become more equal even if its initial income distribution is unequal. In effect, this is the “growth with equity” phenomenon observed in Taipei,China and other newly industrialized economies in East Asia (Fei, Ranis, and Kuo 1979).
In this chapter, I argued that the way for a developing country to eliminate poverty and to achieve inclusive and equitable growth is to follow a comparative advantage-following (CAF) strategy. However, after gaining political independence after World War II, many developing countries under the leadership of their revolutionary leaders adopted a comparative advantage-defying (CAD) strategy for the purpose of accelerating their countries’ modernization and nation building. For carrying out such a strategy, the governments in those countries introduced various interventions and distortions to protect and subsidize the nonviable firms in the priority sectors, causing poor economic performance and inequitable income distributions. As a result, they failed to have a sustainable and inclusive growth. Therefore, it is imperative for those developing countries to carry out necessary reforms so as to shift the path of their economic development from that of a CAD strategy to that of a CAF strategy. However, the existing distortions in those developing countries are endogenous to the needs of protecting/subsidizing the nonviable firms in the CAD strategy’s priority sectors. A shock therapy, which attempts to eliminate all distortions immediately or in a short sequence without addressing the firms’ viability issues first, may result in economic collapse and stagnation as what has happened in Eastern European and Former Soviet Union countries during the 1990s. It is more effective in the reform process to adopt a gradual, dual-track approach, as practiced in the People’s Republic of China and Viet Nam, that allows entry to the previously repressed sectors in the CAD strategy and continues to provide necessary subsidies and protections to the nonviable firms in the CAD strategy before the firms’ viability problem is eliminated (Lin 2007).
If a developing country successfully switches to the CAF strategy, it is expected that the economy will have dynamic growth with quick changes in the industrial and employment structures, similar to what happened in the East Asian newly industrializing economies. Therefore, to achieve inclusive and equitable growth, the government should invest in education so that labor in the rural and traditional sectors will have the ability to adapt to the job requirements in the urban, modern sectors. Governments should

also invest in agricultural technology and rural infrastructure in order to help those people remaining in the rural agricultural sectors. In addition, among other activities, governments need to introduce reforms in various social, economic, legal, and political institutions in order to facilitate their countries’ transitions from traditional agriculture to modern industrial societies. With the joint efforts of the government and the people, it is possible to achieve inclusive and equitable growth in a developing country.

Acemoglu, D. 2002. Why Not a Political Coase Theorem? Social Conflict, Commitment and Politics. NBER Working Paper No. 9377.
Acemoglu, D., S. Johnson, and J.A. Robinson. 2001a. The Colonial Origins of Comparative Development: An Empirical Investigation. American Economic Review 91(5): 1360–1401.
——. 2001b. Reversal of Fortune: Geography and Institutions in the Making of the Modern World Income Distribution. NBER Working Paper #8460.
Acemoglu, D., and J.A. Robinson. 2002. Economic Backwardness in Political Perspective. NBER Working Paper No. 8831.
Caselli, F., and W.J. Coleman II. 2002. On the Theory of Ethnic Conflict. Mimeo, Harvard University.
Deininger, K., and L. Squire. 1996. A New Data Set Measuring Income Inequality. World Bank Economic Review 10(3): 565–591.
Dewatripont, M., and E. Maskin. 1995. Credit and Efficiency in Centralized and Decentralized Economies. Review of Economic Studies , 62(4, October): 541–56.
Djankov, S., E. Glaeser, R. La Porta, F. Lopez-de-Silanes, and A. Shleifer. 2002. Regulation of Entry. Quarterly Journal of Economics 117(1): 1–37.
——. 2003. The New Comparative Economics. Journal of Comparative Economics 31(4): 595–619.
Dollar, D., and A. Kraay. 2003. Institutions, Trade and Growth. Journal of Monetary Economics 50(2003): 133–62.
Easterly, W, and H. Yu. 2000. Global Development Network Growth Database. Washington, DC: World Bank.
Engerman, S, and K. Sokoloff. 1997. Factor Endowments, Institutions, and Differential Paths of Growth Among New World Economics: A View from Economic Historians of the United States. In How Latin America Fell Behind: Essays on the Economic Histories of Brazil and Mexico 1800–1914, edited by S. Haber. Stanford University Press.
Fei, J.C.H., G. Ranis, S.W.Y. Kuo. 1979. Growth with Equity: The Taiwan Case. New York: Oxford University Press.

Frankel, J., and D. Romer. 1999. Does Trade Cause Growth? American Economic Review 89(3): 379–399.
Grossman, G. M., and E. Helpman. 1996. Rent Dissipation, Free Riding, and Trade Policy. European Economic Review 40(3): 795–803.
——. 2001. Special Interest Politics. Cambridge and London: MIT Press.
Hall, R.E., and C. Jones. 1999. Why Do Some Countries Produce So Much More Output Per Worker Than Others? Quarterly Journal of Economics 114(1): 83–116.
Hasan, R., and M. G. Quibria. 2004. Industry Matters for Poverty: A Critique of Agricultural Fundamentalism. Kyklos 57(2): 253–264.
Hayami, Y. 1997. Development Economics: From the Poverty to the Wealth of Nations. New York: Oxford University Press.
Kaufmann, D., A. Kraay, and P. Zoido-Lobatón. 2002. Governance Matters II: Updated Indicators for 2000/01. World Bank Policy Research Department Working Paper 2772. Washington, DC: World Bank.
Kornai, J. 1986. The Soft Budget Constraint. Kyklos 39(1): 3–30.
Krugman, P.R., and M. Obstfeld. 1997. International Economics: Theory and Policy. Boston: Addison Wesley Longman.
Kuznets, S. 1966. Modern Economic Growth: Rate, Structure, and Spread. New Haven: Yale University Press.
La Porta, R., F. Lopez-de-Silanes, A. Shleifer, and R. Vishny. 1998. Law and Finance. Journal of Political Economy 106(December): 1113–55.
——. 1999. The Quality of Government. Journal of Law, Economics, and Organization 15(1): 222–279.
Li, H., L. Squire, and H. Zou. 1998. Explaining International and Intertemporal Variations in Income Inequality. The Economic Journal 108(446): 24–43.
Lin, J.Y. 2000. The Financial and Economic Crisis in Asia: Causes and Long-term Implications. In The New Social Policy Agenda in Asia: Proceedings of the Manila Social Forum. Manila: Asian Development Bank.
——. 2003. Development Strategy, Viability and Economic Convergence. Economic Development and Cultural Change 53(2, January): 277–308.

——. 2007. Development and Transition: Idea, Strategy, and Viability. Manuscript for the Marshall Lectures at Cambridge University.
Lin, J.Y., F. Cai, and Z. Li. 2003. China’s Miracle: Development Strategy and Economic Reform, Shanghai. Shanghai Sanlian Press, 1994 (Chinese edition); and the Chinese University of Hong Kong Press, 2003 (second English edition).
Lin, J.Y., and M. Liu. 2004. Development Strategy, Transition and Challenges of Development in Lagging Regions. In Annual World Bank Conference on Development Economics: Accelerating Development. Washington, DC.
Lin, J.Y., and G. Tan. 1999. Policy Burdens, Accountability, and the Soft Budget Constraint. American Economic Review: Papers and Proceedings 89(2, May): 426–31.
McKinnon, R. I. 1973. Money and Capital in Economic Development. Washington, DC: Brookings Institution.
Redding, S. 1999. Dynamic Comparative Advantage and the Welfare Effects of Trade. Oxford Economic Papers 51(January): 15–39.
Rodrik, D. 1998. Where Did All the Growth Go? External Shocks, Social Conflict, and Growth Collapse. Mimeo, August, Harvard University. A Re-Interpretation of Recent Economic History (revised version of NBER Working Paper No. 6350).
——. 2003. Institution, Integration, and Geography: In Search of the Deep Determinants of Economic Growth. In In Search of Prosperity: Analytic Country Studies on Growth, edited by D. Rodrick. Princeton, NJ: Princeton University Press.
Sachs, J.D., and A.M. Warner. 2000. Natural Resource Abundance and Economic Growth. Leading Issues in Economic Development. Oxford: Oxford University Press.
Samuelson, P. 1978. The Canonical Classical Model of Political Economy. Journal of Economic Literature XVI: 1415–31.
Shaw, E.S. 1969. Financial Deepening in Economic Development. New York: Oxford University Press.
Shleifer, A., and R. Vishny. 1993. Corruption. Quarterly Journal of Economics 108: 599–617.

——. 1998. The Grabbing Hand: Government Pathologies and their Cures. Cambridge, MA: Harvard University Press.
UNIDO (United Nations Industry Development Organisation). 2002. The International Yearbook of Industrial Statistics 2002. Northampton, MA: Edward Elgar.
World Bank. 2002. World Development Indicators, 2002. Washington, DC: World Bank.
——. 2006. World Development Indicators, 2006. Washington, DC: World Bank.
Ifzal Ali
The release of two highly publicized reports in 2006 will have a major impact on the development debate in Asia over the next two decades. India, which has had poverty reduction as the central goal of policy over the last 50 years, has recently switched to a new development strategy focusing on two basic goals: raising economic growth and making growth more inclusive (World Bank 2006b). The central focus of the 2006 World Development Report (World Bank 2006a) is the pursuit of equality of opportunity while avoiding extreme deprivation. Both reports emphasize the paramount importance of inclusive growth, i.e., creating economic opportunities through sustainable growth and making the opportunities available to all, including the poor.
The key messages of this chapter are as follows. Rising income inequalities and the persistence of unacceptably high levels of non-income inequalities pose a clear and present danger to Asia’s sustained progress. Inclusive growth that focuses on both creating opportunities rapidly and making them accessible to all, including the disadvantaged and the bypassed, is a necessary but insufficient condition for reducing inequality outcomes. Inclusive growth that focuses on understanding and addressing the causal factors underpinning inequality outcomes is process-oriented and is primarily concerned with ex ante policy formulation. Ex post measurement of inclusive growth assesses the extent and degree of inclusiveness attained. Finally, inclusive growth needs to address economic, social, and political constraints in generating opportunities, as well as ensuring equal access to them.
Figure 5.1 presents estimates of the Gini coefficient, a popular measure of relative inequality. Seven countries have Gini coefficients of around 40 or more; the remaining countries have Gini coefficients of 30 to 40.
1 This section draws heavily from the special chapter “Inequality in Asia” in Key Indicators 2007 (Asian Development Bank 2007).

These current levels of inequality represent increases over the last ten years (see Figure 5.2). An increase in inequality is registered for a majority of economies. The increases in inequality in Bangladesh, Cambodia, People’s Republic of China (PRC), Nepal, and Sri Lanka are noteworthy.

Moving to an absolute measure of inequality provides an even more compelling story. Figure 5.3 describes changes in per capita expenditure levels of the top 20% and bottom 20%. The bars represent the level changes while percentage changes are provided in parentheses. The richest 20% have been experiencing the largest gains in expenditures in all the economies depicted in the figure. This is also the case for those economies where the bottom 20% registered a higher growth rate in per capita expenditure than the top 20% (for example, Indonesia).

The picture that emerges is that in a majority of Asian countries, inequality has increased. However, this is not a story of the rich getting richer and the poor getting poorer. Rather, the rich are getting richer faster than the poor. This point is important because while economists focus on relative inequality, politically and socially, absolute inequalities can get considerable attention.
Inequalities in income and expenditure represent only one dimension of inequality. Inequalities in health, education, and economic assets such as land could be high even in countries where income inequality is not high. As an example, India and Pakistan, which do not have high income inequalities, have very unequal outcomes in terms of how severely underweight children are distributed across rich and poor households. In India, 5% of the children are severely underweight among the richest 20% of households. In the case of the poorest 20% of households, this share is 28%. Education outcomes

show a similar pattern, with Bangladesh, India, Nepal, and Pakistan having very unequal education attainments.
Low levels of income inequality can also coexist with high levels of inequality in asset ownership and access to infrastructure services. The distribution of land, one of the most important economic assets, in developing Asia is heavily concentrated. This is particularly true in the South Asian countries where income/expenditure inequalities are low. A similar phenomenon is seen in terms of access to public services like clean water, health facilities, sanitation, electricity, and schools. Banerjee, Iyer, and Somanathan (2007) showed that a great proportion of the population in lagging subnational regions in Asian countries have little or no access to these public services. This is especially true for South Asian countries like India and Nepal.
The description of inequalities in developing Asia highlights three issues. First, income/expenditure inequalities are rising in many Asian countries. Second, low levels of income/expenditure inequality can coexist with high levels of inequality in important dimensions of well-being that could circumscribe the capacity of people to participate in productive economic activities. Third, a concentration of assets implies that for the economically disadvantaged, potential economic opportunities may be difficult to seize.
The key factor responsible for increases in inequality appears to be unevenness in growth. Three dimensions of uneven growth seem especially pertinent in accounting for increases in inequality in many parts of the region. First, growth has been uneven across subnational locations (i.e., across provinces, regions, or states). Second, growth has been uneven across the rural and urban sectors. Finally, growth has been uneven across households, such that incomes at the top of the distribution have grown faster than those in the middle and/or the bottom. In particular, the growth of incomes has tended to be the highest for the best educated.
One can ask what policy factors are behind these patterns of uneven growth. The policy factors are complex. However, some broad themes emerge. First, there has been a relative neglect of the agriculture sector by policymakers. While economic development entails a move off the farm to industry and services, deficiencies in public investments in agriculture, and the rural economy more generally, have been problematic precisely because the productivity of agriculture determines the standards of living of so many

people in Asia. Even today, a majority of the labor force of many Asian countries, especially the largest ones, is to be found engaged in agriculture.
Second, the interplay between market-oriented reforms, globalization, and technology has played a role in unequal growth. In several countries, for example, dismantling state-owned enterprises has been part and parcel of market-oriented reforms. Typically, state-owned enterprises have had fairly compressed wage distributions. As the importance of the private sector has grown, it would be natural to find increases in wage inequality.
Similarly, globalization—or increased international integration—has tended to benefit certain subregions within countries over others. For example, in the PRC, there is a general consensus among analysts that sharpening income disparities between coastal and interior regions have been driven by the country’s increased openness. The cost of shipping goods from the coastal regions to major international trade centers is far lower than that of shipping goods from interior regions. The lowering of barriers to trade has probably also reduced the bargaining power of workers relative to capital. This has happened on account of the fact that capital and skilled workers are far more mobile across countries than relatively unskilled workers.
Finally, new technologies display a bias in favor of skills. The same is true of foreign direct investment. Either way, the demand for skilled workers has increased faster than the demand for unskilled workers. The result has been faster growth of wages among the skilled. Since these are precisely the group of workers who would have been better paid to begin with, inequality would increase.
Turning to inequalities in access to public services, a major issue is the rapid decline in the effective delivery of these services (ADB 2006; World Bank 2006b; Tandon and Zhuang 2007). A deterioration of public ethics, public institutions, and public administration has resulted in significant leakages of public expenditures that do not reach the target groups. As a result, schools with errant teachers, measles immunization that never reaches rural areas, and child nutrition programs that are not delivered are commonplace in many Asian countries. A lack of accountability on the parts of governments to deliver public social services is widespread.
Land reforms that never took place are the root cause of inequality in land or access to it. Lack of political will and/or elite capture of political institutions make meaningful land reform exceedingly difficult in many countries. Related to inequality in land or access to it is the lack of access to

credit that compounds the problem. Debt, penury, and pauperization all go together.
An influential view in the development community is that greater inequality is inherent in the growth process (Lewis 1983). In the process of structural transformation and growth, certain regions in certain sectors can be expected to benefit first. This would cause some increase in inequality initially. As growth proceeds, more regions and sectors undergo beneficial transformation and inequality declines. This view is consistent with the famous “Kuznets curve,” where inequality first rises and then falls with economic growth.
There are two problems with this viewpoint. First, the empirical evidence for the Kuznets curve is weak. In the Asian context, Republic of Korea and Taipei,China clearly demonstrated in their rapid period of growth between the 1970s and 1990s that a rapid and sustained increase in inequality is not an inevitable result of high economic growth. Their income-based Gini coefficients never reached 40 during their period of rapid growth. In fact, they declined over some periods of high growth. Second, there are compelling reasons to believe that high levels of inequality may in fact hinder future growth. The specific mechanisms work through wealth effects and political economy channels.
People with little wealth or low incomes find it difficult to invest in wealth- or income-augmenting activities. This is compounded by imperfections in financial markets that seriously constrain the ability of otherwise credit-worthy individuals to borrow to finance investments in education or business opportunities. Underinvestment by people with little wealth or low income impacts negatively on growth.
An alternative way of looking at the same problem has been recently enunciated (Banerjee 2007). Against the phenomenon of the rich getting richer faster than the poor, it becomes harder for the poor to compete with the rich for limited resources including capital. With too much capital concentrated in the hands of the rich, allocative inefficiency in investment will impact negatively on growth.
The political economy considerations operate at three different levels. First, high levels of inequality lead to pressures to redistribute, which, if executed through a distortionary manner, may lower growth. Second, the persistence of inequalities reinforces the capture of political, economic, and legal institutions by an elite who ensures that the benefits of public policy, public investment, and public services accrue to the most favored.

The capture of political power by an elite that leads to political inequality aggravates the initial inequality in endowments and opportunities (Bourguignon, Ferreira, and Walton 2006; Rajan and Zingales 2007). Third, the call for redistribution and sharing of political power can range from peaceful and prolonged street demonstration to violent civil war. In their extreme form, these tensions could lead to armed conflict as has recently occurred in Nepal (Murshed and Gates 2005). A lack of opportunities, as indicated by higher poverty rates or lower literacy rates, has been found to be significantly associated with a higher intensity of violent conflict (Do and Iyer 2006).
Clearly, rising inequalities in Asia pose a clear and present danger to social and political stability, and therefore the sustainability of the growth process itself.
The discussion on the nature and drivers of inequalities points to three noteworthy issues. First, rising inequalities could be an inherent by-product of the growth process, and knee-jerk reactions to eliminate increases in inequalities may stifle the growth process itself. Second, lack of access to basic public services, credit, and risk-mitigating instruments perpetuates the lack of capabilities and opportunities for large sections of society. Third, the marginalization and bypassing of significant sections of society could undermine the sustainability of growth.
Inequality is an outcome, and how it should be addressed must begin with identifying the drivers of inequality. Inequalities can be associated with efforts that respond to market incentives. Inequalities also arise from lack of access to social services, geography, and social exclusion that are related to circumstances. An individual’s circumstances, such as religious background, parental education, geographical location, and caste (in India) are exogenous to and outside the control of the individual; he or she should not be held responsible for them. Inequalities due to differences in circumstances often reflect social exclusion arising from weaknesses of the existing systems of property and civil rights, and thus should be addressed through public policy interventions. On the other hand, an individual’s efforts represent actions that are under the control of the individual, for which he or she should be held responsible. Inequalities due to differences in efforts reflect and reinforce market-based incentives needed to foster innovation, entrepreneurship, and growth. Incentives should not be disregarded.

Differences in outcomes, such as differences in incomes across individuals, reflect some combination of differences in efforts, i.e., the set of actions that are under the control of the individual; and differences in circumstances, i.e., the factors, including economic, social, or biological ones that are outside the control of the individual (Roemer 2006).
The inequalities that result from differences in efforts are acceptable and even desirable to the extent that they reflect the incentives that an economy provides to its citizens for working harder, looking out for new opportunities, and taking the risks entailed in seizing them. However, inequalities resulting from differences in circumstances are not only ethically unacceptable, they result in wasted productive potential and misallocation of resources. Disadvantages of circumstances are doubly undesirable. In addition to the disadvantages that they create as when access to education, health care, and job opportunities is unevenly distributed, they can create additional disadvantages by negatively influencing the amount of effort that an individual in unfortunate circumstances is willing to make. Inequality of opportunities caused by circumstance-based inequalities should be the target of public policies.
The distinction between inequality outcomes resulting from efforts and circumstances provides the basis for the definition and rationale for inclusive growth. Inclusive growth is growth that not only creates new economic opportunities but also ensures equal access to the opportunities created for all segments of society including the disadvantaged and the marginalized. Growth is inclusive when it allows all members of a society to participate in, and contribute to, the growth process on an equal footing regardless of their individual circumstances (Ali and Zhuang 2007).
The importance of equal access to opportunities for all lies in its intrinsic value as well as its instrumental role. The intrinsic value is based on the belief that equal access to opportunity is a basic right of human beings and that it is unethical and immoral to treat individuals differently in access to opportunities. The instrumental role comes from the recognition that equal access to opportunities increases growth potential, while inequality in access to opportunities diminishes it and makes growth unsustainable because it leads to inefficient utilization of human and physical resources, lowers the quality of institutions and policies, erodes social cohesion, and increases social conflict.
The differentiation of inequalities arising from efforts from those arising from circumstances leads to an important distinction between “inequalities of outcomes” and “inequalities of opportunities” (World Bank 2001a

and 2006a). Inequalities of opportunities are mostly due to differences in individual circumstances, while inequalities of outcomes such as incomes reflect some combination of differences in efforts and in circumstances. If policy interventions succeed in ensuring full equality of access to opportunities, inequalities in outcomes would then only reflect differences in efforts, which hence could be viewed as “good inequalities” (Chaudhuri and Ravallion 2007). On the other hand, if all individuals exert the same level of efforts, while policy interventions cannot fully compensate for the disadvantages of circumstances, the resulting inequalities in outcomes are “bad inequalities.” While these two extreme cases are useful for analytical purposes, in reality, inequalities in outcomes would consist of both good or desirable and bad or undesirable inequalities. Equalities in opportunities that emphasize eliminating circumstance-related bad inequalities so as to alleviate inequalities in outcomes are at the core of inclusiveness and at the heart of an inclusive growth strategy.
The recognition that equality of opportunities need not necessarily translate into equality of outcomes, i.e., lower levels of inequality achieved, is important. Inclusive growth, with its simultaneous focus on rapidly expanding opportunities and ensuring equal access to these opportunities, results in an inherent tension. The tension arises from the coexistence of effort-based or good inequality and circumstance-based or bad inequality. An increase in effort-based inequality could swamp out the decline in circumstance-based inequality resulting from equalizing access to opportunities, leading to an overall increase in inequality outcomes. It needs to be recognized that even this case, with and or without a counterfactual, would suggest that inequality would be lower with an inclusive growth strategy as compared to that without an inclusive growth strategy scenario. As a consequence, inclusive growth is a necessary but not a sufficient condition for lower inequality.
The distinguishing feature of the inclusive growth process is that it focuses attention on understanding the causal factors behind inequality outcomes and then addresses those causal factors. Inclusive growth depends on average opportunities available to the population and how opportunities are shared among the population (Ali and Son 2007b). Whether growth is inclusive depends on the contribution of increasing average opportunities in society with distribution of opportunities constant, and the contribution of changes in distribution when average opportunities do not change. As long as the combined effect is positive, growth would be inclusive. With inclusive growth, there would be improvements in social welfare. Thus, as an ex ante
instrument of policy formulation, the concept of inclusive growth provides a powerful analytical tool that links the diagnostics of inequality to policy formulation, which in turn addresses the drivers of inequality. The trade-offs between growth of average opportunities and their distribution, if any, are factored in at the outset.
Public policy to address the disadvantages of circumstances and thereby ensure an even playing field for all is at the core of inclusiveness (Roemer 2006). Market and government failures that result in a lack of or inadequate access to basic public goods and services will need to be addressed in a responsible and accountable manner (ADB 2006).
In terms of opportunities and access to them, labor market outcomes in Asian countries tell a powerful story. Four features are noteworthy (Felipe and Hasan 2006). First, corresponding to rapid output growth, employment growth has been far lower in recent years. Second, in both relative and absolute terms, the differences in real wages between the bottom and top quintiles of the labor force in urban areas increased significantly over the last two decades. At the same time, rural–urban differentials in real wages have also widened. Third, employment in the informal sector, where productivity levels and wages are low, is either on the rise or persistently high. Last, the nature of employment in the formal sector, which has been historically associated with regular contracts and job security, is changing toward that which is more characteristic of the informal sector. These features of labor market outcomes are contributing factors, albeit very important factors, of lagging opportunities and lack of access to opportunities in Asia. This has led to an advocacy for countries to adopt the goal of full, productive, and decent employment (Felipe and Hasan 2006; Felipe 2007). Creating opportunities is the first pillar of inclusive growth.
Equalizing opportunities means that the opportunities generated by growth are available to be shared across the entire spectrum of the population, including by those who are less-well-off. Equalizing access to economic opportunities is multidimensional, i.e., addressing the disadvantages of circumstances. In particular, strengthening human capabilities enables individuals to qualify for productive and decent employment. Ensuring equal access to economic opportunities is the second pillar of inclusive growth.
There is increased recognition that even if access to opportunities were equalized, there would always be some chronically poor who, for a
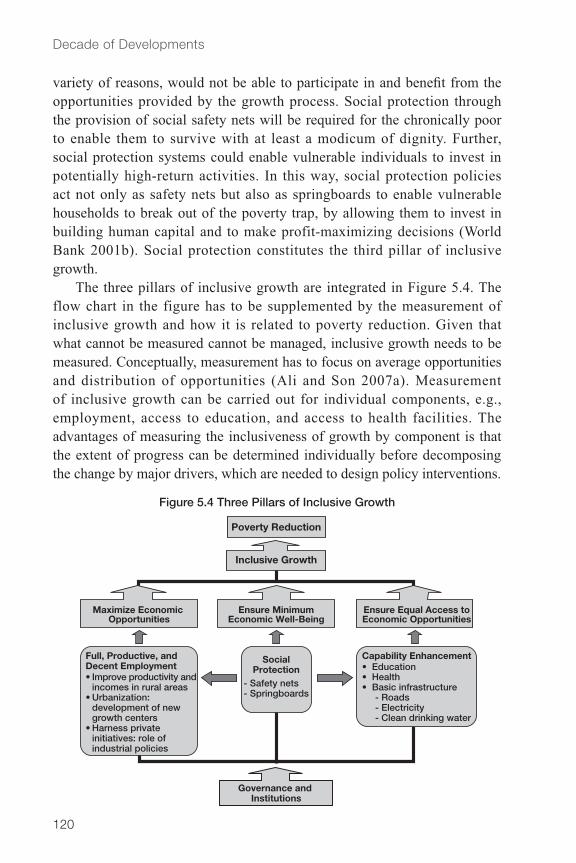
variety of reasons, would not be able to participate in and benefit from the opportunities provided by the growth process. Social protection through the provision of social safety nets will be required for the chronically poor to enable them to survive with at least a modicum of dignity. Further, social protection systems could enable vulnerable individuals to invest in potentially high-return activities. In this way, social protection policies act not only as safety nets but also as springboards to enable vulnerable households to break out of the poverty trap, by allowing them to invest in building human capital and to make profit-maximizing decisions (World Bank 2001b). Social protection constitutes the third pillar of inclusive growth.
The three pillars of inclusive growth are integrated in Figure 5.4. The flow chart in the figure has to be supplemented by the measurement of inclusive growth and how it is related to poverty reduction. Given that what cannot be measured cannot be managed, inclusive growth needs to be measured. Conceptually, measurement has to focus on average opportunities and distribution of opportunities (Ali and Son 2007a). Measurement of inclusive growth can be carried out for individual components, e.g., employment, access to education, and access to health facilities. The advantages of measuring the inclusiveness of growth by component is that the extent of progress can be determined individually before decomposing the change by major drivers, which are needed to design policy interventions.

Turning to poverty reduction, whose measurement depends on the poverty line, mean expenditure of household expenditure distribution, and inequality of the distribution, the focus is on outcomes. Basically, getting people just below the poverty line to cross over has been the implicit focus of most development practitioners. Issues on the severity of poverty and poverty gaps associated with the level of inequality receive less attention (Son 2007).
An inclusive growth strategy encompasses the key elements of an effective poverty reduction strategy and, more importantly, expands the development agenda. A poverty reduction strategy based on a single and absolute income criterion ignores the issue of inequalities and the risks associated with them. In contrast, an inclusive growth strategy addresses circumstance-related inequalities and their attendant risks. Inclusive growth is not based on a redistributive approach to addressing inequality. Rather, it focuses on creating opportunities and ensuring equal access to them. Equality of access to opportunities will hinge on larger investments in augmenting human capacities, including those of the poor, whose main asset—labor—would then be productively employed.
Overall, inclusive growth with its focus on the process of expanding opportunities will result in more effective poverty reduction. In particular, with its focus on addressing inequalities, inclusive growth will address issues of poverty gaps and the severity of poverty, thereby enlarging the poverty reduction agenda. The more important point is that inclusive growth is concerned with the overall welfare of society, which includes the poor.
The distinction between the inequality of opportunities and equality of outcomes is important. The equality of opportunity is a necessary but not sufficient condition to ensure equality of outcomes. In this regard, this section describes the results of a scenario analysis relating growth, inequality, and poverty. It provides some insights to the potential of inclusive growth as well as its limitations in addressing poverty reduction.
Scenario analysis suggests that both the pace and pattern of growth are critical for poverty reduction. The scenarios are termed best (benchmark growth and pro-poor distribution), neutral (benchmark growth and neutral distribution), and worst (low growth and pro-rich distribution) (Table 5.1).


With a benchmark growth rate (the average of annual growth rates of gross domestic product [GDP] per capita between 2002 through 2006) coupled with pro-poor distribution (the bottom 40% of the distribution experiencing consumption growth five percentage points higher than mean growth), poverty incidence for developing Asia would fall from 18.0% in 2005 to 2.0% in 2020, with the total number of extreme poor falling from 604 million to 78 million. In contrast, with a lower growth rate (40% lower than the benchmark rate) and pro-rich distribution (the top 40% of the distribution seeing its consumption grow five percentage points higher than mean growth), poverty incidence would only fall to 9.9% in 2020, with the total number of extreme poor at 391 million, the bulk of which will be in South Asia. These results indicate that the elimination of extreme poverty by 2020 is not preordained. Countries must stay on a high growth trajectory and ensure that pro-poor distribution is attained. In the best scenario, poverty reduction is attained through both growth and a reduction in inequality, implying that people at the lower end of the distribution benefit more from growth.
The same scenario analysis suggests that measured by the US$2-a-day poverty line, even with the neutral distribution assumption, poverty would fall only to 25.7% in 2020 at the benchmark growth rate; at a lower growth rate assumption, it would fall only to 36.8% (Table 5.2). With a pro-rich assumption, as implied by the currently rising income inequality, it would fall only to 29.3% under a benchmark growth rate and 39.8% under a lower growth rate. The combination of the lower growth and pro-rich distribution would mean that 1,567 million people within developing Asia’s population would live under the US$2-a-day poverty line in 2020, with 62% being located in South Asia.

The scenario analysis clearly demonstrates the imperative for ensuring inequality outcomes that are lower. Inclusive growth led by an enlightened and active state with sound governance and effective public administration so critical in the delivery of public goods and services in equalizing access to opportunities would significantly contribute toward such outcomes. Clearly, that is also the expectation of the Indian and Chinese governments, which have adopted inclusive and harmonious growth respectively as they embark on their next five-year plans.
Sharing the benefits of growth more equitably as developing Asia becomes progressively more prosperous is the development challenge over the next generation. While high and sustainable growth are absolute requirements, the fruits of growth must be shared more equally. Asia’s movement from low, to medium, to high levels of income and non-income inequalities is worrisome as social and political tolerance to growing inequalities is getting lower. The sustainability of growth could thus be undermined. It is in this context that inclusive growth with its focus on rapidly expanding opportunities and ensuring equality of access to these opportunities is desirable in both intrinsic and instrumental considerations.
The thrust of inclusive growth is on the positive, emphasizing expanding opportunities and capability enhancement at the economy-wide and household levels. The directional change is from entitlement to empowerment. Circumstance-based disadvantages must be addressed by public policy interventions that guarantee an even playing field so that people can be empowered to lift themselves up by their bootstraps to exploit the opportunities generated by rapid and sustained growth.
While the adoption of an inclusive growth strategy is a natural evolution in Asia’s development process, the reform agenda required to achieve it is complex and ambitious. Reforms relating to governance, institutions, and policies that address both economic and political inequality will need to be addressed simultaneously. An enlightened and an active state will be needed to partner with the private sector and civil society in the pursuit of shared prosperity.

Ali, I., and H. Son. 2007a. Defining and Measuring Inclusive Growth: Application to the Philippines. ERD Working Paper 99, Economics and Research Department, Asian Development Bank, Manila.
——. 2007b. Measuring Inclusive Growth. Asian Development Review 24(1). Forthcoming.
Ali, I., and J. Zhuang. 2007. Inclusive Growth Toward a Prosperous Asia: Policy Implications. ERD Working Paper Series No. 97, Asian Development Bank.
ADB (Asian Development Bank). 2006. Special Chapter on Measuring Policy Effectiveness in Health and Education. In Key Indicators 2006. Manila.
——. 2007. Inequality in Asia. In Key Indicators 2007. Manila.
Banerjee, A. 2007. Investment Efficiency and the Distribution of Wealth. Paper presented at the Yale Conference in Equity and Growth. Available: http://www.Growth commission.org/Workshop Sept 26-27-07.htm.
Banerjee, A., L. Iyer, and R. Somanathan. 2007. Public Action for Public Goods. NBER Working Paper No. 12911. Cambridge: National Bureau of Economic Research.
Bourguignon, F., H.G. Ferreira, and M. Walton. 2006. Equity Efficiency, and Inequality Traps: A Research Agenda. Washington, DC: World Bank.
Chaudhuri, S., and M. Ravallion. 2007. Partially Awakened Giants Uncover Growth in China and India. In Dancing with Giants: China, India, and the Global Economy, edited by L.A. Winters, and S. Yusuf. Washington, DC: World Bank.
Do, Q. T., and L. Iyer. 2006. An Empirical Analysis of Civil Conflict in Nepal. Institute of Governmental Studies Working Paper No. 2006-14, University of California, Berkeley.
Felipe, J. 2007. Macroeconomic Implications of Inclusive Growth: What are the Questions? Asian Development Bank. Unpublished.
Felipe, J., and R. Hasan, eds. 2006. Labor Markets in Asia: Issues and Perspectives. London: Palgrave MacMillan for Asian Development Bank.

Lewis, W.A. 1983. Development and Distribution. In Selected Economic Writings of W. Arthur Lewis, edited by M. Gersovitz. New York: New York University Press.
Murshed, S. M., and S. Gates. 2005. Spational-Horizontal Inequality and the Maoist Insurgency in Nepal. Review of Development Economics 9(1): 121–34.
Rajan, R., and L. Zingales. 2007. The Persistence of Underdevelopment: Constituencies and Competitive Rent Preservation. NBER Working Paper No. 12093. Cambridge: National Bureau of Economic Research.
Roemer, J. E. 2006. Economic Development as Opportunity Equalization. Cowles Foundation Discussion Paper No. 1583. Boston, MA: Yale University.
Son, H. 2007. Interrelationship between Growth, Inequality, and Poverty: The Asian Experience. ERD Working Paper No. 96, Economics and Research Department, Asian Development Bank, Manila.
Tandon, A., and J. Zhuang. 2007. Inclusiveness of Economic Growth in the People’s Republic of China: What Do Population Health Outcomes Tell Us? ERD Policy Brief Series No. 47, Economics and Research Department, Asian Development Bank, Manila.
United Nations. 2006. World Population Prospects: The 2006 Revision. Available: http://esa.un.org/unpp/.
World Bank. 2001a. From Safety Net to Springboard. Washington, DC
——. 2001b. Social Protection Sector Strategy: From Safety Net to Spring Board. Washington, DC.
——. 2006a. Equity and Development. In World Development Report 2006. Washington, DC.
——. 2006b. India: Inclusive Growth and Service Delivery: Building on India’s Success, Development Policy Review Report No. 34580-IN, Washington, DC.

The two chapters by Mr. Ali and Mr. Lin use different approaches but to some extent are complementary. Mr. Ali is correct when he points out that growth and inequality are inter-related. While the last few years have seen a rise in income and inequality in Asia, the argument that the process simply follows the Kuznets hypothesis is erroneous. The experiences of Taipei,China and Republic of Korea clearly defied the hypothesis. Thus, a further explanation for the worsening inequality is warranted.
The crux of Mr. Ali’s chapter is to discuss the effect of growth on inequality, from which the concept of “inclusive growth” is introduced. However, is this not just a new name for an old idea? For example, a few years ago the World Bank promoted what is known as the Comprehensive Development Framework, in which eliminating poverty, reducing inequity, and improving opportunity are the key components. At the time, the Bank believed that the Comprehensive Development Framework was the way to enhance country ownership and the achievement of the Millennium Development Goals. This is different from, but in coherence with, the “pro-poor growth” concept. If growth creates new opportunity and equal access, it meets two of the necessary conditions of inclusive growth. But having the same opportunity and same access does not mean that there is an even playing field for the poor; thus, the government still has to provide social protection, which is the third pillar of inclusive growth.
One of the unique features about inclusive growth is that it concerns itself not only with the poverty incidence, i.e., number of people living below the poverty line (head count), but also with the poverty gap, as well as the severity of poverty. For the purpose of policymaking, the last two are far more useful than the first.
Despite Asia’s robust growth performance, the region has not reached an inclusive growth pattern, as indicated by the following trends: employment elasticity has declined, the gap between high and low real wages has increased, and the number of informal sectors has also been on the rise.
One thing from Mr. Ali’s chapter that differs from Mr. Lin’s is the role of institutions. In Mr. Ali’s chapter, institution is exogenous, while in Mr. Lin’s chapter, institutions, including government intervention, are endogenous. Mr. Lin argues that together with policies, institutions hold the key to the resulting economic performance: a right policy with the wrong

institutions may result in a disappointing performance. As Mr. Lin’s chapter rightly points out, the only exogenous variable in the development process is endowment. One cannot change the fact that a country may not have natural resources while others are rich in them. But the quality of endowment can be altered, for example in the case of human resources. The endogeneity of the “viability” factor in Mr. Lin’s chapter holds the key to the arguments that lead to the most important message of the chapter, i.e., to not remove government interventions too fast, precisely because the “viability” issues have not been resolved. Thus, intervention and subsidy in a country like the People’s Republic of China can still be justified, i.e., the viability factor, which is endogenous, is not yet resolved. But that raises the question of timing. Granted that viability needs to be resolved first, when and under what conditions can one say that the time has come for interventions to be removed? If the model is dynamic with an explicit time element, such timing should be predictable. This is a far more important question for policymakers.
The general message of Mr. Lin’s chapter is that comparative advantage-following (CAF) is a more appropriate strategy than comparative advantage-defying (CAD). Putting aside the correctness and suitability of the econometric model used by Mr. Lin, while theoretically that message may be true, further elaboration and empirical work on CAF should be conducted before such a conclusion can be derived. Demonstrating the failure of CAD, which is what the chapter is all about, does not prove the superiority of CAF.
The two chapters are part of the effort to formulate an appropriate development strategy that will improve the welfare of the poor and reduce inequalities. Different objectives call for different strategies, theories, and policies, and they also require different data systems. For example, in the 1970s, when an explicit objective about poverty alleviation was first stated, academic research on the subject was intensified, resulting in new theories and models. The kind of data and information required has also changed. This was the period when the social accounting matrix as a useful data system began to develop. The analysis simply suggests that since development objectives and policies are always closely interrelated with theories, models, and data systems, the interactions between researchers and policymakers are critical for new ideas and strategies to develop. Entering the 2000s, no big idea or new paradigm has emerged. Thus, Mr. Lin and Mr. Ali should further pursue their work, with the hope that they can contribute to the development of such new ideas.

To conclude, there is no such thing as a fixed paradigm. As the system becomes more globalized with complex interactions among components and agents, any dominant paradigm can be challenged. We all need to be more open-minded and liberal in our efforts to search for an appropriate development strategy that places the welfare of the poor as the highest priority, and not get stuck with a certain paradigm.
Mr. Lin’s chapter answers a very important question of what economic and social structure generates a particular income distribution function.
I am afraid that the first part of Mr. Lin’s chapter looks a bit old-fashioned and seems to be just a re-invention of an old idea. The “static” framework in Figure 4.1 seems to be inappropriate to illustrate “dynamic” process of technological adoption/progress. Further, there is a need for clarification on the concepts of comparative advantage-defying (CAD) strategy and comparative advantage-following (CAF) strategy; the differences between import substitution industrialization and CAD strategy; and the differences between CAF strategy and neutral incentive policies such as export-oriented strategy.
The technology choice index used in the empirical part of the chapter is biased toward capital-intensive industries. Moreover, the econometric exercises involve problems related to robustness, namely, omitted variable bias and/or endogeneity bias arising from reversed causality. A better approach would be to rely on the fixed effects model. Moreover, there is a need to consider dynamics explicitly on technological progress, absorptive capacity, channels of technology diffusion such as foreign direct investment, international trade, and foreign aid. A more standard framework, such as the augmentation of the standard model of international technology transfer of Benhabib and Spiegel (2005), which uses the nested exponential model of Nelson and Phelps (1966) and a logistic model, should be applied.
Mr. Ali’s chapter attempts to answer why we need to care about increasing inequality per se. Inequality hinders growth prospects, leads to a decline in social cohesion, and leads to political bias toward rich people. Furthermore, the chapter adds two more answers that with a given mean income, an

increase in inequality implies an increase in absolute poverty, which can be captured by standard poverty indices such as poverty head count ratio. Further, an increase in inequality generates direct negative welfare effects because of individuals’ aversion to inequality and relative deprivation.
However, the main problem of Mr. Ali’s chapter is in the lack of proper connection between the three pillars of inclusive growth framework and standard poverty concepts. While the first and third pillars “to maximize economic opportunities” and “to ensure equal access to economic opportunities,” respectively, are for chronic poverty, the second pillar “to ensure minimum economic well-being” is related to transient poverty. It seems that Mr. Ali misunderstood the standard concepts of poverty dynamics. There should be a way to develop linkages between these pillars with the existing very rich empirical literature on poverty.
Benhabib, J., and M. Spiegel. 2005. Human Capital and Technology Diffusion. In Handbook of Economic Growth, 1A, Chapter 13, edited by P. Aghion and S. Durlauf. Amsterdam: North Holland.
Nelson, R., and E. Phelps. 1966. Investment in Humans, Technological Diffusions, and Economic Growth. American Economic Review 56: 69–75.


Antoni Estevadeordal
Kati Suominen1
Regional trade agreements (RTAs) have spread en masse around the world in the past 20 years. Today, some 200 RTAs have been notified to the World Trade Organization (WTO); the number is expected to soar to 400 by 2010. Virtually all countries are member to at least one RTA, and most countries belong to two or more RTAs simultaneously. The most prolific integrator, the United States (US), which until the 1990s was reticent to form RTAs, has in the span of a mere 13 years signed 14 RTAs with partners in the Americas, Asia, and the Middle East; its North American Free Trade Agreement (NAFTA) partner, Mexico, sports 12 RTAs, and Chile has entered into seven agreements, including those with the United States and Mexico, respectively.
The European Union (EU) has adopted a distinct logic of integration, expanding gradually since the early 1970s to cover no fewer than 27 countries. Yet the EU is also looking outward, having concluded RTAs with southern Mediterranean countries, South Africa, Mexico, and Chile, and aiming at further RTAs in the Americas and Asia.
Asian countries are relative newcomers to the RTA theater (Figure 6.1), having notified a total of 18 RTAs to the WTO by the end of 2007.
1 Matthew Shearer of INT contributed extensively in sectoral data work. The authors wish to thank Santiago Florez Gomez for superb research assistance and Sara Marzal Yetano for an outstanding analysis of services and investment provisions.

However, Asian countries are catching up fast with the global trend. Indeed, the recent proliferation of RTAs in the Asia-Pacific region can be seen as the most notable development in the region’s trading panorama in recent years. Asian countries’ integration started with a megabloc, the Asia-Pacific Economic Cooperation (APEC) forum, in 1989, and the Southeast Asian countries pursued a plurilateral scheme by the 1992 establishment of the Association of Southeast Asian Nations (ASEAN) Free Trade Agreement (AFTA). Today, however, many Asian countries—first and foremost Singapore, Republic of Korea, Japan, and People’s Republic of China (PRC)—have also set out to pursue bilateral agreements both within and beyond the region. Singapore has been Asia’s integrator juggernaut par excellence, having concluded 13 FTAs. Some of the regional economies’ bilateral agreements include Japan–Philippines; Japan–Thailand; Japan–Singapore; Japan–Malaysia; PRC–Hong Kong, China; Republic of Korea–Singapore; and New Zealand–Thailand FTAs. Further negotiations are being pursued for PRC–Singapore and Japan–India FTAs, among others.
0
5
10
15
20
25
1948
1951
1954
1957
1960
1963
1966
1969
1972
1975
1978
1981
1984
1987
1990
1993
1996
1999
2002
2005
Asian RTAsNew RTAs in Rest of World

On the extra-regional front, Asian countries have pursued FTAs with countries of the Americas, in particular. In 2003, Republic of Korea and Chile signed the Republic of Korea’s first comprehensive bilateral FTA, and in 2005, Brunei Darussalam, New Zealand, and Singapore concluded negotiations for a four-partite FTA with Chile. An FTA between PRC and Chile, the PRC’s first extra-regional FTA, went into effect in October 2006. The Mexico–Japan Economic Partnership Agreement (EPA), Japan’s first extra-regional free trade agreement, took effect in 2005. In November 2006, Japan reached an agreement with Chile.
Singapore and the US reached one of the first agreements of Singapore’s now extensive network of FTAs in 2003, and the US–Australia FTA entered into force in 2005. The same year, Peru and Thailand signed a bilateral FTA, while FTAs between Taipei,China on the one hand, and Panama and Guatemala on the other, took effect in 2004 and 2006, respectively. Panama concluded FTA negotiations also with Singapore in 2006. Trans-Pacific agreements are poised to expand: the US has concluded negotiations with Republic of Korea, and is amid negotiations with Malaysia and Thailand, while Malaysia and Chile are pursuing FTA negotiations.
There have also been moves to form plurilateral FTAs in the Asia-Pacific region. The PRC has entered into an FTA with ASEAN, and Japan and Republic of Korea are seeking a similar deal. The chapter on trade in goods of the ASEAN–Republic of Korea FTA (AKFTA) entered into force in June 2007. Further ASEAN plurilateral initiatives include a proposal for an ASEAN–India economic partnership and a recent decision to convert the long-running trade cooperation between ASEAN and Australia and New Zealand into a genuine FTA. The PRC is currently negotiating with Australia and New Zealand for a PRC–Closer Economic Relations agreement.
The existing and planned agreements are poised to result in a veritable Asian noodle bowl of RTAs (Figure 6.2). The most ambitious current proposal is to form a Free Trade Area of the Asia-Pacific (FTAAP) that envisions including all APEC members or some subset thereof.

The purpose of this chapter is to survey selected Asian RTAs in a comparative perspective, and to make some projections as to the future constellations of integration in Asia. Section 2 compares and contrasts the contents of RTAs in Asia and elsewhere, dissecting key RTA provisions such as tariff liberalization schedules, rules of origin, and investment and services provisions. Section 3 explores some potential future scenarios.
Asian countries are relative newcomers to the global RTA chessboard. There are numerous explanations as to the factors that have hampered and subsequently propelled the rise of integration in Asia. Perhaps the main forces that have been cited to have held back formal integration in the region include intra-regional rivalries and difficult domestic political economy
United States Canada
Mexico
Thailand
PRC, Korea
Lao PDR
Cambodia Myanmar
BangladeshSri Lanka
India
BhutanNepal
MaldivesPakistan
Peru
Chile
FTAAP
Costa Rica, Guatemala, El Salvador, Honduras, Nicaragua & Dominican Republic
SAFTA
CAFTA–DR
APEC NAFTAASEAN+6 (CEPEA)
ASEAN+3 (EAFTA)
Northeast Asian
Japan
Australia
Bangkok
Brunei DarussalamPhilippines
Viet NamMalaysia
SingaporeIndonesia
ANZCERTA
New ZealandASEAN (AFTA)

in several countries in agriculture, in particular. Moreover, there has been less urgency for preferential liberalization in manufactures in light of the relatively low intra-regional trade barriers in the sector and the attendant multinational regional production networks that have long epitomized Asia’s rise as a global manufacturing hub.
The forces propelling Asia toward RTAs in the recent years can be seen as in part rooted in the APEC process, which brought countries together to discuss trade issues under one coherent umbrella, and in part rooted in the 1997–1998 Asian financial crisis, which increased awareness of the importance of regional economic policy coordination and resulted in a number of initiatives particularly in financial integration.
However, perhaps a particularly strong driver of today’s RTA wave in Asia is a systemic one—concerns about remaining outside the proliferating network of RTAs around the world as well as in the region. Asian countries can be viewed through both the lenses of the competitive liberalization and domino theories, whereby the spread of RTAs gives outsiders incentives to form new RTAs or to join existing ones, lest they see their market access edge and investment inflows undercut in the global economy.2 The forceful drive by the major regional traders—PRC, Republic of Korea, and Japan—to forge formal trade ties within and outside the region, along with the entry of extra-regional players, particularly EU and US, into the Asian RTA theater will likely only accentuate these systemic forces.
It is unlikely that there is a “one size fits all” explanation; rather, some interpretations may gain greater currency in some periods than in others and also vary from country to country. There are certainly also cross-country differences in the type of integration that is pursued and preferred, whether bilateral, plurilateral, or something broader. Moreover, the choice of partners varies across countries and is often driven primarily by considerations well beyond economic logic, such as regional security dynamics and foreign policy imperatives.
This section strives to dissect and detail the liberalization state of play in RTAs in Asia in a comparative perspective, contrasting Asian agreements (both intra-regional and with countries of the Americas) with agreements formed in the Americas, between the Americas and Europe, and elsewhere in the world. We focus on tariff liberalization schedules of 76 parties in
2 See Baldwin (1993) and (2006) and Bergsten (1995).

38 RTAs (Table A6.1).3 Much of the data here draws on Inter-American Development Bank (IADB) (2006). 4
Figure 6.3 examines the share of tariff lines liberalized by the partners in the 38 FTAs. It maps out the shares of national tariff lines that become subject to liberalization in year 1, years 2–5, years 6–10, years 11–20, and more than 20 years into the RTA. The code representing each economy giving the concession (i.e., the importing country) precedes the arrow, while the code of the partner economy follows the arrow.
Asian agreements stand out for being particularly front-loaded: they liberalize the bulk of the tariff universe in the first year of the RTA. This is in good part due to Singapore’s according duty-free treatment to all products upon the entry into force of its agreements. Also Japan in the Mexico–Japan EPA and US agreements with Asian countries free some 80% of tariffs in the first year; however, Chile in the Chile–Republic of Korea and Chile–PRC agreements and Mexico in the Mexico–Japan agreement backload more than half of liberalization to years 2–5 or beyond.

The share of tariff lines subject to backloaded liberalization—particularly marked in Morocco and South Africa’s schedules in FTAs with the EU, and in the EU’s schedule in the FTA with Lithuania—is due largely to the persistent protection in the agricultural protocols. Agreements formed in the Americas and particularly those signed by the NAFTA members generally liberalize trade relatively fast, with some 75% or more of lines freed in the first year of the agreement. However, some of Mercosur’s agreements have somewhat more backloaded liberalization, with a large share of lines being liberalized in year 6–10 into the agreements.
Figures 6.4a and 6.4b assess the extent of reciprocity in tariff elimination between RTA parties by years 5 and 10. They are sorted in a descending fashion from the least to the most reciprocal. While the parties’ respective product coverages often diverge markedly in year 5, with some partners (such as Republic of Korea) liberalizing up to twice as many lines as their partners (such as Chile), the differences shrink considerably by year 10. The wider gaps in concessions among a pair tend to owe to north–south differences in liberalization—a pattern that is evident nearly throughout the sample in all regions.
3 The tariff liberalization schedules were obtained from the Foreign Trade Information System at http://www.sice.oas.org/ and some national sources, including websites. Some tariff data was obtained from TRAINS. The study also maps out the coverage in RTAs of four trade disciplines besides tariffs: non-tariff measures, rules of origin, special regimes, and customs procedures.
4 There are a handful of other studies on tariff liberalization in RTAs. The World Trade Organization (2002) carried out an extensive inventory of the coverage and liberalization of tariff concessions in 47 RTAs of a total of 107 parties. The data cover tariff treatment of imports into parties to selected RTAs, tariff line treatment as obtained from individual countries’ tariff schedules, and tariff dispersion for a number of countries. Scollay (2005) performed a similarly rigorous analysis of tariff concessions in a sample of 18 RTAs. IADB (2002) presented an exhaustive survey of market access commitments of RTAs in the Americas, while the World Bank (2005) carried out a more general mapping of the various disciplines in RTAs around the world.

Figure 6.5 displays the dynamic, year-to-year evolution of liberalization by the 76 RTA parties over a period of 20 years, as well as the respective averages of the five regional groupings.5 Agreements between the Americas and Asia and within Asia feature the fastest and most extensive liberalization; in the case of Asia, the data is affected by the predominance
5 The entry into force dates differ between agreements, thus the actual years of a given benchmark (e.g., agreement year 10) differ as well.

of Singaporean agreements. Overall, RTAs in general free more than 90% of tariff lines within ten years. However, it should also be noted that a small number of agreements contain phase-outs even after year 20—although the number of products subject to prolonged phase-outs is quite small.
Figure 6.6 takes the analysis to real time for the period of 1994–2026. The bold lines map out the simple average for the regional samples from 2007 onward (i.e., during the period during which all agreements considered here are expected to have entered into effect). The main findings are the extent of deep liberalization in the Asian and transpacific agreements examined here. As of today, most RTA members have liberalized more than four-fifths of the tariff items to their partners; some of the newer agreements will attain this level by 2010. Liberalization in the recent Mercosur–Andean agreements is more limited, reaching about a fifth or a quarter of tariff lines by 2010. Overall, the figure conveys the rapid liberalization by Asian countries and the advance of opening in Asia–Americas agreements, which will have freed more than 95% of tariff lines by 2015.

What accounts for the gaps in liberalization? Agriculture is one of the main laggards. Figure 6.7 maps out the evolution of duty-free treatment for agricultural and industrial products (as grouped by the WTO) by the regional samples. As expected, agricultural products in each region are more protected than are industrial products. On average, RTAs explored here liberalize only 61% of tariff lines in agriculture by year 5 and 78% by year ten, while reaching duty-free treatment for 77% and 94% of industrial goods by the same points in time.
The Asia–Americas average sees a meaningful, though smaller jump in year ten. This is primarily due to increases in the PRC’s concession to Chile and Panama’s to Singapore. In Asia, the jump is less substantial and comes earlier. This is mainly due to increases in coverage in the PRC–Hong Kong, China schedule in year 3. RTAs in the Americas take off in agricultural liberalization in year ten, gradually converging with Asian agreements. This is largely due to very large jumps (in the order of 60 percentage points or more) in agricultural duty-free coverage in the Mercosur–Bolivia and Mercosur–Chile agreements, as well as smaller increases in coverage in Mexico–Nicaragua and Mexico–Costa Rica FTAs and the representative average Central American countries’ schedule in the Central America Free Trade Agreement (CAFTA) vis-à-vis the US. Peru’s agricultural concession to Mercosur also increased substantially that year.

Simply measuring the share of liberalized tariff lines fails to capture the full effects stemming from the exclusion of sensitive products from RTAs if those products are covered in a very small number of tariff lines. Does the picture change with alternative measures that engage trade?
We strive to shed light on this question by introducing two alternative methods of exploring the depth and speed of liberalization in RTAs: liberalization statistics examined above as weighted by trade at the HS chapter level, and the actual percentage of total trade (imports) from the RTA partner that is liberalized.6
Figure 6.8 examines the evolution of duty-free treatment as trade-weighted share of tariff lines. There are general similarities with the unweighted data in Figure 6.5; however, it is notable that the initial point at year one is higher in the trade-weighted dataset than in the unweighted tariff lines. This is hardly surprising: most trade occurs in sectors that are opened up rapidly, while sectors with back-loaded liberalization tend to have very little trade (precisely because they are protected). To be sure, while the
6 The calculations are based on data from United Nations Comtrade database, DESA/UNSD.

bolded averages in the two figures are also similar, they are not immediately comparable due to different numbers of observations—38 vs. 27 RTAs.
Figure 6.9 measures the evolution of duty-free treatment as a share of imports from the partner that are liberalized. By this measure, RTA partners in all regions on average free 90% or more of the lines at year ten. Moreover and importantly, the figure does not capture the potential trade among the RTA partners. This is due in part to the endogeneity of trade flows: even if the share of actual trade excluded from an RTA were very small, the potential trade could be very significant in the absence of policy barriers.7
7 That the extra-regional sample has a higher average in Figure 6.11 than in Figure 6.10 is partially due to the sample set: here the EU–Morocco agreement was additionally excluded from this sample, increasing the average somewhat. The change in measurement method also had a strong positive effect on coverage in the two early years of the People’s Republic of China, Hong Kong, China concession, flattening the initial part of the curve.

Besides tariffs, rules of origin (ROOs) are a key provision arbitrating the discriminatory impact and trade-creating potential of RTAs. Since a failure to meet the ROOs disqualifies an exporter from the RTA-conferred preferential treatment, ROOs can and must be seen as a central market access instrument reigning over preferential trade.
ROOs are widely considered a trade policy instrument that can work to offset the benefits of tariff liberalization in RTAs.8 In general, Asian agreements have some of the least restrictive origin regimes, although agreements between Asia and the Americas do carry more restrictive ROOs (Figure 6.10).9 Encouragingly, however, unlike the straitjacket ROO model that the EU uses in all of its RTAs, agreements in Asia and the Americas are marked by diversity in ROOs that suggests accommodation of RTA-specific idiosyncrasies. The regional countries have also employed such measures
8 Most prominently, ROOs can be employed to favor intra-RTA industry linkages over those between the RTA and the rest of the world and, as such, to indirectly protect RTA-based input producers vis-à-vis their extra-RTA rivals (Krueger 1993; Krishna and Krueger 1995). As such, ROOs are akin to a tariff on the intermediate product levied by the country importing the final good (Falvey and Reed 2000; Lloyd 2001).
9 See Suominen (2004), Estevadeordal and Suominen (2006), and Estevadeordal, Harris, and Suominen (2007).

as short supply clauses to help producers adjust to shocks in availability of intra-regional inputs.
Furthermore, developments over time are marked by a trend toward market-friendly rules of origin, particularly in North America. United States ROO regimes have evolved toward a more liberal framework from NAFTA to US–Chile FTA, CAFTA, and US–Colombia and US–Peru FTAs; also the Republic of Korea–US (KORUS) FTA ROOs are less restrictive than those of the US–Chile FTA. In the meantime, the NAFTA ROO regime itself has been under a liberalization process, with more flexible ROOs being adopted in sectors ranging from alcoholic beverages to petroleum, chassis fitted with engines, photocopiers, chemicals, pharmaceuticals, plastics and rubber, motor vehicles and their parts, footwear, copper, and others.
In sum, the analysis of sectoral provisions in RTAs in Asia and beyond yields two main results:

• Agreements in Asia are rather young compared to their counterparts in the Americas and Europe, yet the agreements analyzed here liberalize trade very rapidly. Singapore liberalizes basically all goods in the first year of its agreements. RTAs formed by the countries of Asia with partners in the Americas are somewhat more backloaded particularly by Chile in the Chile–Republic of Korea FTA and Mexico in the Mexico–Japan FTA. In the Americas, RTAs signed by the original NAFTA members liberalize most products rapidly (usually some 70% in the first year). However, since most RTAs explored here liberalize 90% of tariff lines (as well as trade-weighted lines) by year ten into the agreement, the coverage of products across the regional samples tends to become rather homogeneous by the end of the first decade.
• All five regional samples carry a number of outlier RTA parties (often southern parties) and product categories (particularly in sensitive sectors—agricultural products, food preparations, textiles and apparel, and footwear) that trail the overall trend of liberalization. Many agreements in the Americas also carry provisions that could potentially be classified as “other restrictive regulations of commerce,” such as restrictive rules of origin, as well as tariff rate quotas and exceptions. Such instruments appear to capture the price the region’s integrationist interests are willing to pay for the liberalizing and encompassing RTAs.
Analyzing tariffs and other instruments governing trade in goods provides a limited view of RTAs’ anatomy and potential effects. RTAs contain a host of disciplines beyond tariffs ranging from investment to competition policy, labor issues, dispute settlement, standards, government procurement, and transportation. These can provide for important complementarities, such as between tariff, services, and investment liberalization.
Here, we supplement the tariff liberalization statistics by providing a comparative analysis of the coverage (rather than depth of liberalization) of investment, services, and customs procedure provisions in agreements formed by countries of Asia in a comparative context. The sample sizes vary somewhat across the disciplines.
Figure 6.11 provides a stylized visualization of RTAs’ coverage in the three disciplines.

RTAs’ investment chapters tend to be encompassing, extending to such areas as Most Favored Nation (MFN) treatment, national treatment, transparency, denial of benefits and restriction of transfers, nationality of management and board of directors, performance requirements, expropriation, and investor–state disputes (Figure 6.12).10
In Asia, Singapore and Australia’s agreements are more encompassing in investment, but other agreements have scant coverage. In interregional agreements, the coverage is somewhat lower due to the limited coverage of disciplines in the EU–Mexico and EU–Chile agreements, as well as in the Chile–PRC FTA, P4, and US–Jordan FTA. All RTAs forged by the
10 An FTA’s investment provisions are coded when there is an investment chapter in a preferential trade agreement (PTA) or when the PTA refers to a bilateral investment treaty as the agreement applicable to the PTA. When no such mention is made, a zero value is assigned (even if the PTA partners were connected via a bilateral investment treaty, or BIT).
Japan-Singapore Singapore-AustraliaNew Zealand-Singapore
New Zealand-ThailandThailand-Australia
Hong Kong,China-PRCANZCERTA
Australia-Papua New Guinea
ASEAN
PRC-ASEAN
Rep. of Korea-Singapore
Japan-Malaysia
Japan-Philippines
Japan-Thailand
US-Australia
US-Singapore
Mexico-Japan
Rep. of Korea-Chile
P4
Panama-Singapore
PRC-Chile
Chile-Japan
Peru-Thailand
US-Rep. of KoreaNAFTA
US-ChileCAFTA
US-PeruCanada-Chile
Mexico-NicaraguaACE 58ACE 59
US-Col.Mexico-Uruguay
G3Chile-Mexico
Canada-Costa RicaCent. Am.-Chile
Cent. Am.-DR
Mexico-N. Triangle
Chile-Peru
Mercosur-Chile
Mercosur-Bolivia
Mexico-Bolivia
Mexico-Costa Rica
Peru-Mexico
EU-Mexico
EU-Chile
EFTA-Mexico
US-Jordan
US-Israel
US-Bahrain
US-Morocco
Canada-IsraelMexico-IsraelEU-South Africa
EU-MoroccoEFTA-Singapore
EU-RomaniaEU-Lithuania
Comesa
Customs procedures Services Investment

three NAFTA members with their respective partners in the Americas are encompassing, applying the four modalities of investment—establishment, acquisition, post-establishment operations, and resale—and also cover such disciplines as MFN treatment, national treatment, and dispute settlement. Eighty percent or more also cover transparency, denial of benefits and restriction of transfers, nationality of management and board of directors, performance requirements, and expropriation. US RTAs again lead the way in being particularly comprehensive.
RTAs in the Americas are quite encompassing in services (Figure 6.13), with more than 60% of them addressing MFN treatment, national treatment, market access, and unnecessary barriers to trade, and prohibit discriminatory treatment—all areas generally not addressed in Asian agreements. The exception is the Japan–Singapore FTA, which covers national treatment, market access, domestic regulation, recognition of qualifications, transparency, and restriction of transfers, as well as certain provisions on telecommunication and financial services.

In customs procedures, nearly 60% of the RTAs examined here include provisions on confidentiality, advance rulings, penalties, review and appeal mechanism, and cooperation in administration, and nearly one-half provide for technical assistance, transparency, and sharing of information. Asian agreements and, in particular, agreements between Asia and the Americas are comprehensive in customs procedures (Figure 6.14). Box 6.1 lays out the provisions in a case of particularly comprehensive coverage in this area—the recently concluded FTA between Brunei Darussalam, Chile, New Zealand, and Singapore. CAFTA and the EU–Chile, US–Chile, and US–Morocco FTAs contain similarly comprehensive coverage of customs procedures and trade facilitation disciplines.11 US agreements stand out also for particularly high precision.12
11 It could be argued that although there are already guidelines for customs procedures and trade facilitation provisions at the World Customs Organization (per the Revised Kyoto Convention), including these provisions in RTAs and in the WTO’s legal framework could have the advantage of making them more binding for the signatories.
12 For instance, CAFTA requires that advance rulings be made within 150 days, and the release of goods occur within 48 hours. The customs procedure chapter also provides for specific transitional periods for the six Latin American parties.


The Trans-Pacific Strategic Economic Partnership Agreement formed by Brunei Darussalam, Chile, New Zealand, and Singapore has a comprehensive list of provisions regulating customs procedures and trade facilitation between the parties. Some of the key provisions on customs procedures include:
Customs Cooperation (Art 5.5): The parties’ customs administrations are to cooperate on issues pertaining to the implementation of the agreement, movement of goods, investigation and prevention of customs offences, the application of the WTO Customs Valuation Agreement, and the improvement of procedures through such measures as best practices and risk management techniques, technical skills, and technologies.
Advance Rulings (Art 5.7): The parties are to put forth procedures for advanced rulings on the origin of goods traded between them. The article allows the application for a ruling to be made prior to the importation of a good, and requires the advance ruling to be issued expeditiously (within 60 days of the receipt of the information).
Review and Appeal (Art 5.8): Importers in each country are to be provided access to independent administrative and judicial reviews.
Paperless Trading/Automation (Art 5.10): The article strives to increase efficiency of customs procedures through the introduction of modern techniques and new technologies. The parties are also to seek to use electronic procedures that support business transactions.a
Express Shipments (Art 5.11): Parties are to implement procedures aimed at ensuring an efficient clearance of shipments, including pre-arrival processing of information and coverage of all goods in the shipment with a single document (that can be issued electronically).
Risk Management (Art 5.13): The article refers to customs procedures that facilitate clearance and movement of low-risk goods and focus attention to high-risk goods.
Release of Goods (Art 5.14): The parties pledged to simplify the release of goods and to release goods at the point of arrival and within a period not exceeding 48 hours. This stands in clear contrast to many other RTAs, which have very few and only general rules governing the release of goods.
a Notably, the NAFTA countries are developing a concept of trade automation (NATAP) that implies introducing standardized trade data elements, harmonizing customs clearance procedures, and promoting electronic transmission of standard commercial data using UN/EDIFACT messages and advance processing by governments.
In sum, the Asian agreements are somewhat less encompassing in some of the major trade-related provisions explored here than are agreements between Asia and the Americas and, in particular, in the Americas. Many US RTAs in particular could be viewed as WTO+ in terms of incorporating a larger number and/or more specific provisions than are present in the multilateral rules. This indicates the perceived usefulness of rule-making in the RTA context, perhaps both as a means of overcoming slow multilateral negotiations and as a way to deepen and appropriately mold provisions that are particularly pertinent to the RTA relationship—as well as a tool to attain greater synergies across the various RTA disciplines. A closer inspection of the data suggests the exportation of RTA models from one region to the next through transcontinental RTAs, such as “borrowing” of some of the US–Chile FTA’s market access provisions in the Chile–Republic of Korea FTA; this may suggest some longer-term melding of the Asian agreement models with those of the Americas.
Asian countries have made forceful and rapid inroads into the now-global network of RTAs. Their agreements tend to be rapidly liberalizing and some of the Asian agreements, particularly those formed with some partners in the Americas, are rather encompassing in issue coverage, often going beyond the multilateral provisions in coverage and precision alike. But what does the future hold for integration in Asia? Will integrationism decelerate or continue accelerating further?
There are perhaps five potential future scenarios. The first is a status quo continued proliferation of bilateral FTAs throughout the Asia-Pacific region and with extra-regional partners, first and foremost with some Latin American countries such as Chile and Peru and India, EU, and US. Should competitive liberalization and domino logics of regionalism dominate, such major schemes as KORUS could be expected to only catalyze further FTAs.
The second scenario is the formation of intra-regional blocs, such as ASEAN+3 (PRC, Japan, Republic of Korea) or the ASEAN+6 (PRC, Japan, Republic of Korea, India, Australia, and New Zealand), or some other constellation, such as a PRC–Japan–Republic of Korea trade center in Northeast Asia.
The third scenario is the pursuit of a broader, megaregional integration scheme along the lines of the FTAAP. Potentially building on the APEC architecture and essentially replacing the FTAs crisscrossing the Asia-Pacific, this line of action would connect countries of the region into one

seamless production bowl. A sister scenario would be to pursue the FTAAP through some sub-set of the 21 APEC members or another “coalition of the willing” (Bergsten 2007).
The fourth scenario is realization of global trade liberalization in the context of the Doha Round. This would reduce the potential noodle bowl problems of overlapping regimes to the extent that it would erode the preferential edge of the regional RTAs; it would resolve such problems once and for all if accompanied by extensive multilateral rules in other trade-related areas. However, the odds of either policy to materialize in the short- or medium-term appear low. Perhaps a more likely scenario will be some advances at the multilateral sphere. To be sure, Doha could arguably be affected by regional developments—for instance, the specter of an FTAAP could hasten Doha negotiations. However, the relationship of Doha to the regional dynamics is uncertain.
The fifth scenario, and perhaps the most likely one, is either some combination of the prolific bilateralism and rise of mini-blocs, or a sequential movement from the first scenario to the second one. Whether either would deviate countries from or propel them toward the pursuit of a megaregional scheme is not clear. If involving deep liberalization, such efforts could help derail import-competing interests, but they could also risk deviating attention and resources from the broader picture.
According to estimates of Hufbauer and Schott (2007), the FTAAP would provide the greatest economic benefits out of any other regional integration scenario for the major players in the Pacific Rim—PRC, Japan, Republic of Korea, US, ASEAN, and the APEC zone (Figure 6.15). Due to its potential members being increasingly connected to trade hubs beyond the Pacific Basin, the FTAAP would also likely avert the risk of trade diversion.

Should a megaregional agreement be pursued, there would be a number of alternative paths to attaining it. The first is building a bloc from scratch, with a blank negotiation slate. The second is convergence, whereby the involved countries would take their existing common RTAs and knit them together. A starting point would be to negotiate a common rules of origin regime (and to allow for cumulation of production among the participating RTAs), followed perhaps by common services and investment provisions. The third path is through expanding any one existing regional RTA toward other regional partners, perhaps through a docking provision. The fourth path could be through converting APEC or, alternatively, some coalition of the willing (that upon attaining a critical mass would leave outsiders few options but to join), into a full-blown FTA. One fundamental question in any of the paths is the sequencing of the issue coverage—whether a single undertaking; trade in goods first, followed by services, competition policy, and other rules; or some other gradual buildup.
Importantly, there are similar risks involved in scenarios one through four. The first one is the formation of exclusive, inward-looking schemes, be they bilateral, regional, or megaregional. Failing to continue liberalization vis-à-vis non-members could result in trade diversion. The second risk
4,839
0
200
400
600
800
1,000
1,200
1,400
1,600
US PRC Japan Rep. ofKorea
APEC ASEAN
US-Japan
ASEAN+3
FTAAP

is the formation of shallow agreements instead of robust, liberalizing, and comprehensive ones, which could perpetuate the political economy resistance to liberalization. To be sure, there are ways to advance in cases where reaching a full-fledged FTA proved difficult at the present time, such as the negotiation of a services agreement alone.
The Asian regional trade agreement (RTA) spree has followed and in some cases paralleled the region’s overall economic and multilateral trade liberalization strategies, and has brewed into an increasingly dense regional noodle bowl of agreements that is today starting to attain a genuinely transcontinental reach. The region’s RTAs are still relatively nascent, but they also feature rapid liberalization. Particularly agreements with countries of the Americas are also comprehensive in issue coverage and precision. The main challenge for the region in the near term is to define a future integration strategy that leverages the wave of reforms and RTAs, while also retaining Asia’s already important gains from liberal global trade and investment regimes.


Baldwin, R. 1993. A Domino Theory of Regionalism. NBER Working Paper No. W4465, Cambridge, MA.
——. 2006. Multilateralising Regionalism: Spaghetti Bowls as Building Blocs on the Path to Global Free Trade. Centre for Economic Policy Research Discussion Paper No. 5775.
Bergsten, C.F. 1995. APEC: The Bogor Declaration and the Path Ahead. APEC Working Paper Series, 95-1. Institute for International Economics, Washington, DC.
——. 2007. Toward Free Trade Area of the Asia-Pacific. Paper presented at the conference “New Asia-Pacific Trade Initiatives,” Japan Economic Foundation and Peterson Institute for International Economics, Washington, DC, 27 November 2007.
Estevadeordal, A., J. Harris, and K. Suominen. 2007. Multilateralizing Preferential Rules of Origin around the World. Washington DC: Inter-American Bank of Development.
Estevadeordal, A., and K. Suominen. 2006. Mapping and Measuring Rules of Origin around the World. In The Origin of Goods: Rules of Origin in Regional Trade Agreements, edited by O. Cadot, A. Estevadeordal, A. Suwa-Eisenmann, and T. Verdier. Oxford University Press and Centre for Economic Policy Research.
Falvey, R., and G. Reed. 2000. Rules of Origin as Commercial Policy Instruments. Leverhulme Centre for Research on Globalisation and Economic Policy, University of Nottingham.
Hufbauer, G., and J.J. Schott. 2007. Fitting Asia-Pacific Agreements into the WTO System. Washington, DC: Peterson Institute for International Economics.
IADB (Inter-American Development Bank). 2002. Beyond Borders: The New Regionalism in Latin America. In Economic and Social Progress in Latin America, 2002 Report. Washington, DC: IADB.
——. 2006. Market Access Provisions in Regional Trade Agreements. Presented at the IDB/WTO Regional Rules in the Global Trading System Conference, 26–27 July 2006, Washington, DC. Forthcoming in IDB-WTO Handbook on RTAs (2007).

Krishna, K., and A.O. Kruger. 1995. Implementing Free Trade Areas: Rules of Origin and Hidden protection. In New Directions in Trade Theory, edited by A. Deardorff, J. Levinsohn, and R. Stern. Ann Arbor: University of Michigan Press.
Krueger, A.O. 1993. Free Trade Agreements as Protectionist Devices: Rules of Origin. NBER Working Paper No. 4352. Cambridge, MA: NBER.
Lloyd, P.J. 2001. Rules of Origin and Fragmentation of Trade. In Global Production and Trade in East Asia, edited by L.K. Cheng, and H. Kierzkowski. Boston, MA: Kluwer Academic Publishers.
Scollay, R. 2005. Substantially All Trade. Which Definitions Are Fulfilled In Practice? An Empirical Investigation. Report prepared for the Commonwealth Secretariat, APEC Study Center, University of Auckland (15 August).
Suominen, K. 2004. Rules of Origin in Global Commerce. PhD Dissertation, University of California, San Diego.
World Bank. 2005. Global Economic Prospects. Washington, DC: World Bank.
World Trade Organization. 2002. Regional Trade Agreements Gateway. Available http://www.wto.org/english/tratop_e/region_e/region_e.htm# analysis_publications.

Chen Bo
Yuen Pau Woo
The process of economic integration is commonly defined as the freer movement of goods, services, labor, and capital across borders. The degree of economic integration can be analyzed at bilateral, regional, and global levels. The trend toward regional trading arrangements (for instance, the European Union, Association of Southeast Asian Nations [ASEAN], and North American Free Trade Agreement [NAFTA]) has created a need for measures of economic integration within that region, which in turn allow for comparisons across different regions. There are many single variable measures of regional economic integration, but relatively little work has been done in developing a composite index of economic integration.
Even though the Asia-Pacific (AP) region is not covered by a single trading agreement, there is much anecdotal evidence to suggest that it is becoming more integrated. As defined by the Asia-Pacific Economic Cooperation (APEC) membership, the region consists of not only developed economies such as the United States (US), Japan, Canada, and Australia, but also emerging markets such as Republic of Korea and ASEAN, plus an emerging superpower in the form of the People’s Republic of China (PRC). It is well known that parts of the region are already highly integrated through production networks that trade intermediate and finished goods across borders, often within the same firm. Since 1998, many economies in the AP region have negotiated bilateral and subregional free trade agreements with partners in the region as well as outside the region. APEC leaders have also endorsed a proposal to investigate the idea of a Free Trade Area of the Asia-Pacific (FTAAP), which, if successful, would constitute the largest regional trading bloc in the world. The main purpose of this chapter is to construct a composite index of economic integration that will show the
1 This chapter was originally commissioned by the Pacific Economic Cooperation Council’s State of the Region Project. The authors are grateful to Dr. Shinji Takagi and participants at ADBI’s tenth anniversary conference for helpful comments. The authors would also like to thank participants at the SFU-UBC Economics Winter Workshop for their feedback.

extent of integration not only of the Asia-Pacific region as a whole, but also the degree of integration of individual economies within the region.
There is a vast literature attempting to measure indicators/variables from different economic and sociological dimensions using a composite index by looking at a number of independent indices. For example, the United Nations Development Programme (UNDP) periodically reports the Human Development Index (HDI); similar to HDI, the European Union (EU) reports the Lisbon Strategy Indices (LSI) measuring the comprehensive development level of EU member economies; likewise, the consulting firm, A.T. Kearney (2002, 2003) has a simple composite globalization index based on indicators of economics, technology, demography, and politics. All of these indices are constructed by non-parametric methods: that is, the weights used among indicators are determined subjectively by experts based on their knowledge about the relative importance of each indicator (or sub-index). A different way of constructing a composite index is to use parametric methods where the weights among indicators or sub-indices are determined by the relative variation among those indicators. The most popular parametric method is known as principal component analysis (PCA). Dreher (2006) and Heshmati (2003, 2006), for example, used PCA to determine the weights of sub-indices of a composite globalization index. Common factor analysis (CFA) is another frequently applied parametric method (for example, Andersen and Herbertsson 2003).
Though much research has been done on the integration of the member economies under a given trade/political agreement such as ASEAN (Batra 2006) and NAFTA (Acharya, Rao, and Sawchuk 2002), there has been little research on the economic integration of the AP region as a whole.
We attempt to use a composite index to measure the dynamics of AP economic integration. In Section 2, we describe our methodology of constructing a composite index from multi-dimensional data. In Section 3, we provide a description of the data and rationale for the chosen indicators and a sub-index measuring the convergence of sample economies. Section 4 reports the sub-index as well as the composite index. Section 5 concludes with the main results and discusses possible extensions of the research.
To include as much information as possible from a multi-dimensional dataset in a composite index, the key task is to allocate reasonable weights to the included indicators or sub-indices. A good index should still carry the

essential information in all the indicators but not be biased toward one or a few of the indictors.
As mentioned in the previous section, there are both non-parametric and parametric methods to construct composite indices.
The non-parametric methods are directly assigned weights to those included indicators based on researchers’ prior beliefs about the relative importance of the indicators (i.e., they assign higher weights to more important indicators). Examples of non-parametric indices include the UNDP’s HDI and EU’s LSI.
On the other hand, parametric methods assume there is some structure behind the variation of the included indicators and hence the weights for these indicators are determined by the covariation between them on each dimension of the structure. The commonly applied parametric methods are common factor analysis (CFA) and principal component analysis (PCA).
CFA attempts to simplify complex and diverse relationships by assuming that there exist underlying common dimensions among a set of observed variables. That is to say, CFA attempts to explain each of the original variables by the set of common factors (CFs). The loadings of the original variables on each CF reveal their relative importance in the dimension represented by the corresponding CF.
Originally introduced by Pearson (1901) and independently developed by Hotelling (1933), PCA transforms the original set of variables into principal components (PCs) that are orthogonal to each other. Each PC is a linear combination of all the included indicators. The first PC accounts for the largest amount of the total variation (information) in the original data (in the following, the second PC explains the second largest variation and so on). The (normalized) loadings in a PC are the weights of the corresponding indicators in the dimension represented by that PC.2
The final weight assigned to each indicator in a composite index is its loading in each dimension of the selected CFs or PCs weighted by the relative importance (accountability of the total variation of the original data) of that factor or component.
While non-parametric methods are simple to construct and allow for ease of comparison over time, they suffer from the subjective assignment of weights, which often lack a theoretical basis. Changing the weights on a non-parametric index even slightly can dramatically alter the final index.
Parametric methods, on the other hand, are mathematically sound because the weights are determined by the sample indicators themselves. 2 The normalization is to make the squared loading of each indicator in any PC to be unity.

From an empirical point of view, PCA is often preferred to CFA for two reasons. First, PCA is simpler to apply mathematically, since no assumptions are attached to the raw data (i.e., the underlying common factors) (Stevens 1992). Secondly, PCA does not have to account for factor indeterminacy, which is a troublesome feature of CFA (Steiger 1979). PCA is widely used in research on indices and we have chosen this method for the construction of a composite index of economic integration in the Asia-Pacific region.
Our PCA method is similar to that used in the Trade and Development Index constructed by the United Nations Conference on Trade and Development (UNCTAD). Suppose there is a multi-dimensional data XTxp,3 where T is the total number of periods and p is the number of the indicators (dimensions). Rpxp is the correlation matrix of the p indicator series. Define λ i (i = 1, ..., p) as the i th eigenvalue and α i
px1 (i = 1, ..., p) as the i th eigenvector of the correlation matrix Rpxp respectively, given the property of eigenvalue and eigenvector, we know, λ i should be the solution of the determinant⎪R-λ I⎪= 0 (where λ = (λ 1, ..., λ p)’), and the corresponding (normalized) eigenvector α i can be solved by (R - λ i I ) α i = 0, subject to α i’α i= 1 (normalization condition). Without loss of generality, assume λ 1 > λ 2 > ... > λ p, and denote the i th principal component as PCi , then
PCi = Xα i (1)and λ i = var(PCi ). (2)
Therefore, the first principal component is the linear combination of the initial indicators; it has the biggest variance. The second PC is another linear combination of the indicators that is orthogonal to the first PC (since the eigenvectors are orthogonal to each other) and has the second biggest variance. Following this order, the p th PC is a linear combination of the indicators that is orthogonal to all the other PCs and has the smallest variance. In other words, the PCA is a method to represent a p-dimensional data by p orthogonal PCs, with the first i PCs carrying the biggest i variances (information) of the initial data.
Thus, our index will be constructed by the PCs and their relative importance (accountability of the variance),
, (3)
3 In general, the components of matrix X are the normalized transformation of the raw data to avoid the problem of heterogeneous scales.

where xj (j = 1, ..., p) is the jth column (indicator series) of the matrix X, and the final weight4 of indicator j is given by
. (4)
However, we should still be aware of a problem when using PCA. Since the weights are determined by the correlation between indicators, if there are some indicators that are highly inter-correlated, the weights may be biased toward these indicators (Mishra 2007). A method to overcome this problem is to adopt a two- (or multi-) stage PCA. That is, one needs to group the highly inter-correlated indicators together and construct a composite sub-index first, then use this sub-index with the rest of the indicators to construct the final composite index. In this chapter, we apply such a two-stage PCA strategy.
Most research on economic integration is based on the following four indicators: trade, foreign direct investment, portfolio capital flows, and income payments and receipts (for instance, Keohane and Nye 2000; A.T. Kearney 2003; Bhandari and Heshmati 2005; Heshmati 2006). Other indicators that have been applied include the flow of people, i.e., international tourism (Acharya et al. 2002), gross domestic product (GDP) per capita (Heshmati and Oh 2005), and the relative size of the agriculture sector to GDP (Cahill and Sanchez 1998).
Given data availability, we have chosen the following seven indicators: the absolute deviation of real GDP per capita; the non-agriculture sectoral share (of GDP); the gross capital formation ratio (to GDP); the urban resident ratio; the AP regional imports and exports share (to GDP); the AP regional foreign direct investment (FDI) inflow share (to GDP); and the in-AP regional tourists share (to total annual international tourists hosted by each country).5 The data sources are listed in Table 7.1. These data are collected from the following 15 representative economies in the AP region: Japan, Republic of Korea, PRC, and Hong Kong, China from East Asia;
4 In general, the sum of weights is not, but is very close to, unity due to the fact that PCA normalizes the mode of each eigenvector is unity.
5 We want to emphasize that no indicators can sufficiently reflect economic integration individually. However, the process of integration must be reflected from various aspects, which we hope are captured by our selected indicators. That is why we try to measure integration from various dimensions rather than focus on a single aspect.

Viet Nam, Thailand, Philippines, Indonesia, Singapore, and Malaysia from Southeast Asia; US, Canada, and Mexico from North America; and Australia and New Zealand from Oceania. The data starts from 1990 and ends at 2005. Missing data was approximated using standard interpolation and extrapolation techniques.
The first four deviation indicators are grouped together because they may be highly inter-correlated. We have labeled the sub-index of these four indicators as a “convergence index” (CI) because the dispersion in these four indicators is expected to narrow over time with growing economic integration. In particular, the absolute deviation of real GDP per capita

measures dispersion of overall welfare of the sample economies, that of the non-agriculture sectoral share measures the dispersion of industrialization levels, that of the gross capital formation ratio (to GDP) measures differences in the ability of investment for the future, and that of the urban residents ratio measures the dispersion of modernization levels (since most industrial and business activities occur in urban areas). If economies in the region are integrating over time, one would expect the deviation of these indicators to decline, i.e., to move toward convergence. Figures 7.1a–7.1d illustrate the aggregate performance of the indicators using 1990 as the base year. The indicators are obtained as follows:
(5)1990, ..., 2005.

Therefore, compared to the base year (1990) indicator, which is normalized to zero, a positive indicator implies the absolute deviation of that year is smaller than that of the base year, i.e., there has been convergence compared to 1990; a negative number would imply the opposite, which is greater divergence. A higher score implies a higher level of convergence, while lower means the opposite. Figures 7.1b and 7.1d clearly show that the indicators of non-agriculture sectoral share and urban resident share are consistently converging across the sample economies over time. Figure 7.1c shows that the gross capital formation ratio is converging in level but the trend is volatile. Finally, the indicator of real GDP reveals that the gap in real income (welfare) among sample economies has been getting wider over time, suggesting economic divergence.
The second part of our index construction involves the collection of economic integration indicators. We have chosen commonly used indicators that measure flows of goods (trade), capital (FDI), and people (tourists) in a region. To avoid bias, we have netted out flows among AP economies that are part of a sub-regional unit, for example between Hong Kong, China and PRC, among ASEAN members, among NAFTA members, and between Australia and New Zealand. In order to obtain the data that conveys the “pure” information of AP regional integration, the value/number of trade,

FDI, and tourists are calculated as the total inflows (outflow for exports) from the AP sample economies net of those from other members of a trade agreement. For instance, we exclude the FDI inflow from Hong Kong, China when we calculate the total AP regional FDI inflow to PRC. Otherwise, ignoring the effects of sub-regional agreements may seriously overstate the level of integration in the AP region. For example, Mexico’s trade and FDI inflow increased rapidly after it became a member of NAFTA in 1992. However, most of the growth was due to increasing business with the US and Canada rather than with economies outside of North America. A global economic integration index for Mexico that does not exclude the effects of NAFTA will provide a false reading of Mexico’s integration with the world. Most of the literature measuring country global integration ignores the effects of regional agreements on an economy’s broader integration with the world, and hence provides an inaccurate reading of globalization.
Figures 7.2–7.4 illustrate the total (in-AP) regional imports and exports share (to regional GDP), the total (in-AP) regional FDI inflow share (to regional GDP), and the total (in-AP) regional tourist share (to total annual international tourists hosted by all AP sample economies), respectively. As illustrated in Figures 7.2 and 7.4, the trade share and tourist share have both increased over time, implying stronger links in goods and demographic flows in the AP region. However, the FDI inflow share has dropped about half from 0.8% in 1990 to 0.4% in 2005. Even though there has been a large increase in FDI in many AP economies, much of the increase has been due to investment from economies belonging to a sub-regional trade agreement, e.g., NAFTA. Another factor worth noting is the growing volume of FDI inflow from tax havens such as the Cayman Islands and the British Virgin Islands. Even though much of this inflow may in fact originate from AP economies, we are unable to make this determination based on the available data. It is likely, therefore, that the investment measure of AP integration is understated.

What are the properties of a good composite index of economic integration? Intuitively, at least two characteristics should be possessed by the index. First, the index should not exhibit a high degree of volatility. Since economic integration is a gradual process, a representative index should reflect the modest pace of change as economies become more closely tied to each other. Second, the index should not be biased toward any of the indicators, i.e., the weight of any indicator should not be so high that it dominates the overall index. After obtaining values for the indicators and computing the composite index, we can test for the two desirable properties identified above.
In the first stage, we computed the weights for the four deviation indicators and calculated the CI. Table 7.2 reports the summary of PCA for CI indicators. The weights of the four deviation indicators were derived by Equation 4. The deviation indicator of gross capital formation was assigned the highest weight (0.43), followed by urban resident ratio (0.26), with the weights for real GDP per capita and non-agriculture share roughly the same, at 0.16 and 0.14, respectively.

Using the weights, we computed the CI for the AP region as well as each economy in the sample. Due to space limitations, we provide only the CI for the AP region as a whole in Figure 7.5.6 Starting from 1990 as the base year with CI normalized to zero, the CI series fluctuates over time, peaking at 21.83 in 2001 and falling to 5.58 in 2005. This pattern of fluctuation seems to resemble that of the gross capital formation share (Figure 7.1c).7
In the second stage, we used PCA again to compute the weights for the other three indicators (trade, FDI, and tourists) as well as the CI. The summary of the second stage PCA is reported in Table 7.3. PCA assigned the biggest weight to FDI (0.34), followed by trade flows (0.28) and tourist flows (0.27), with the CI obtained from the first stage resulting in the smallest weight (0.18). Though the weights are not evenly distributed, none of the indicators is dominant. Figure 7.6 shows the movement of the
6 The detailed HI of each sample country can be provided upon contacting the authors. 7 The resemblance does not mean that deviation indicator of the gross capital formation ratio
is dominant in HI, it is so just because the consistent trend of the other three indicators are offset (the deviation indicator of the real GDP per capita is consistently decreased while the other two increased).

composite index for the AP region from 1990 to 2005. This figure clearly shows the composite index is upward sloping, implying that the economic integration is strengthening over time even after filtering out the effects of sub-regional trade agreements. Fluctuations in the index are relatively modest, which satisfies the need for an index that reflects a “smooth” process of integration.
The sample economies’ integration indexes are shown in Table 7.4. Due to space limitations, only six sample economies are reported (US, Canada, PRC, Malaysia, Thailand, and Australia). The annual growth rate of the integration (shown in the parentheses of Table 7.4) level are calculated as
(6)
where gt and It are the growth rate and integration index, respectively, in year t.
1991, ..., 2005,

According to the integration index reported in Table 7.4, the ASEAN+2 economies are the most integrated in the AP region: i.e., they rely most on the AP regional market, followed by Australia, whose integration level is close to the regional average. The PRC is next but its integration level has been decreasing in the past five years, which may be a result of the relatively closer local integration with Hong Kong, China; Macau; and Taipei,China, as well as diversification of trade and investment toward the EU. NAFTA economies are the least integrated in the AP region, likely because of the

bias for trade and investment within the NAFTA region. Interestingly, even though Canada is one of the least integrated compared to the other AP economies, the Canadian economy has nevertheless become more integrated with the AP region over the period studied.
Table 7.5 reports the dynamic performance of the composite index and its indicators for a single economy, using Canada as an example. Canada’s economic integration with the AP market first dropped from 1990 to 1996 and then increased rapidly from 1997 to 1999, with the integration level of 4.64 in 1990 dropping to 1.32 in 1996 but increasing to 8.11 in 1999. This large fluctuation can be mainly attributed to a divergence (to the AP sample country average) of the gross capital formation ratio from 1990 to 1996 and convergence afterwards from 1997 to 1999. A second modest but growing integration trend occurred in the most recent five years (2001 to 2005). With the indicators of CI relatively stable, the integration trend can be mainly attributed to the fact that Canada had relatively more trade and FDI in the AP market (the trade and FDI share increased from 5.03 and 0.02 in 2001 to 6.36 and 0.27 in 2005 respectively) and a big increase in trade with the PRC (stimulated perhaps by the surge in Chinese business immigration to Canada).

Table 7.6 reports the ranking of AP economic integration level for the 15 AP sample economies. Consistent with anecdotal evidence, the level of economic integration in the AP region is growing. Interestingly, the relative ranking of AP economies has not changed significantly over time. Singapore and Hong Kong, China are consistently ranked as the economies most closely integrated with the AP region while US and Canada are the least.

This chapter measured the economic integration in the Asia-Pacific region by construction of a composite index. The weights of the index were obtained from a two-stage principal component analysis (PCA). In the first stage, we obtained a convergence index to measure the dispersion of Asia-Pacific sample economies’ main macroeconomic indicators. In the second stage, we used the indicators of trade, foreign direct investment, and tourism as well as the convergence index to compute the composite index.
Overall, we found that though economic convergence in the Asia-Pacific region fluctuated during the years from 1990 to 2005, the economic integration has been steadily growing. Among the 15 sample economies, Singapore and Hong Kong, China were the most integrated with the Asia-Pacific region, while the United States and Canada were the least.
Though the PCA has many good properties in constructing indices for multi-dimensional data, there are some shortcomings that we need to note. For instance, the weights in PCA are completely determined by sample data, i.e., they are sample-dependent. Adding more data from recent years or new dimensions will change the weights so that the new index cannot be directly compared with the old index. This problem can be overcome, however, by using a “chained index” to account for the different weights used in different years. This is particularly important if the index is used in time series comparisons, for example as an annual measure of the state of Asia-Pacific regional integration.

Acharya, R.C., S. Rao, and G. Sawchuk. 2002. Building a North American Integration Index: An Exploratory Analysis. Micro-Economic Policy Analysis Branch, Industry Canada.
Andersen, T.M., and T.T. Herbertsson. 2003. Measuring Globalization. IZA Discussion Paper No. 817.
Batra, A. 2006. Asian Economic Integration ASEAN+3+1 or ASEAN+1s? Indian Council for Research on International Economic Relations Working Paper No. 186.
Bhandari, A.K., and A. Heshmati. 2005. Measurement of Globalization and its Variations Among Countries, Regions and Over Time. IZA Discussion Paper No. 1578.
Cahill, M.B., and N. Sanchez. 1998. Using Principal Components to Produce an Economic and Social Development Index: An Application to Latin America and the US. Mimeo, College of the Holy Cross-USA.
Dreher, A. 2006. Does Globalization Affect Growth? Evidence from a New Index of Globalization. Applied Economics 38: 1091–1110.
Heshmati, A. 2003. Productivity Growth, Efficiency and Outsourcing in Manufacturing and Services. Journal of Economic Surveys 17(1): 79–112.
——. 2006. Measurement of a Multidimensional Index of Globalization. Global Economy Journal 6(2), Article 1.
Heshmati, A., and J.E. Oh. 2005. Alternative Composite Lisbon Development Strategy Indices. IZA Discussion Paper No. 1734.
Hotelling, H. 1933. Analysis of a Complex of Statistical Variables into Principal Components. Journal of Educational Psychology 24, 417–441.
Kearney, A.T., Inc., and the Carnegie Endowment for International Peace. 2002. Globalization’s Last Hurrah? Foreign Policy (January/February): 38–51.
——. 2003. Measuring Globalization: Who’s Up, Who’s Down? Foreign Policy (January/February): 60–72.

Keohane, R.O., and J. S. Nye. 2000. Introduction. In Governance in a Globalizing World, edited by J. S. Nye, and J.D. Donahue. Washington, DC: Brookings Institution Press.
Mishra, S.K. 2007. A Comparative Study of Various Inclusive Indices and the Index Constructed by the Principal Components Analysis. MPRA Paper No. 3377.
Pearson, K. 1901. On Lines and Planes of Closest Fit to Systems of Points in Spaces. Philosophical Magazine 2: 559–572.
Steiger, J.H. 1979. Factor Indeterminacy in the 1930s and the 1970s: Some Interesting Parallels. Psychometrika 44: 157–167.
Stevens, J. 1992. Applied Multivariate Statistics for the Social Sciences (2nd ed.) Hillsdale, NJ: Lawrence Erlbaum Associates, Inc.
United Nations. 2005. Trade and Development Index. Developing Countries in International Trade 2005.
World Bank. 2007. World Development Indicators 2007. Available: http://go.worldbank.org/3JU2HA60D0.

Mr. Estevadeordal and Ms. Suominen’s chapter is a comparative analysis of regional trade agreements (RTAs) and free trade agreements (FTAs) by region while Mr. Bo and Mr. Woo’s chapter gives a summary index of integration in the Asia-Pacific.
The chapter is mostly factual but very data-intensive. It is a useful contribution by a multilateral institution to the debate in Asia and it can be used to identify areas where Asia can improve to further integrate trade and related activities in the region.
The main findings of the chapter are as follows: Asia is a relative latecomer to RTAs/FTAs and Asian agreements tend to be (i) more frontloaded in terms of tariff reduction and (ii) less restrictive with rules of origin (ROOs). They tend, however, to be more limited in coverage beyond trade in goods and related activities (e.g., customs procedures).
There is little to add to the chapter as it is largely factual. The distinction between bilateral FTAs and RTAs is not clear. Are they used interchangeably? One of the drivers of the process is a country’s desire not to be left behind. This may suggest the high cost of trade diversion, but also indicates that economic forces are at play to undo trade diversion. FTAs/RTAs may be contributing to freer global trade.
Integration has many aspects. In order to have a single measure, one must assign weight to each. The chapter uses principal component analysis to determine the weights endogenously from the data, and the first principal component is the linear combination of the underlying factors that gives the largest variance. The methodology is not new, but it provides one way of measuring overall integration.
These are the aspects of integration (factors):
(i) Deviation of real gross domestic product (GDP)/population
(ii) Deviation of non-agriculture/GDP
(iii) Deviation of gross capital formation/GDP
(iv) Deviation of urban population/total population
(v) Regional imports + exports/GDP
(vi) Regional foreign direct investment inflows/GDP
(vii) Regional tourists/total tourists
The first four deviation indicators are combined as the harmonization index at the first stage.
Are these deviation indicators about integration or convergence, since convergence does not mean integration? Non-agriculture/GDP can differ widely if specialization occurs within the region. Gross capital formation/GDP is known to be volatile. Moreover, we must be careful about netting out flows between partners under local arrangements because such arrangements can be part of further regional integration. Also, principal component analysis gives greater weight to more volatile indicators such as gross capital formation/GDP. These indicators are also different in dimensionality (e.g., %Δgross capital formation/GDP vs. %Δregional tourists/regional tourists).
To conclude, any single index to measure overall integration is subjective. There is no basis to argue one index is superior to another. It is best to avoid using volume measures because they tend to be volatile from year to year.
As Central Asian perspectives have not featured in the discussions, comments are offered based on the experience of the eight countries and six multilateral institutions working within the Central Asia Regional Economic Cooperation (CAREC) Program. Three points are highlighted. First, regional integration and cooperation is critical for the development of Central Asia. Second, efforts to boost growth through bilateral and regional trade agreements have produced disappointing results. Third, within the CAREC Program countries are now focused on practical actions they feel ready to approach together.
The case for regional cooperation in Central Asia is clear. Although surrounded by large economies and trading opportunities, the region is characterized by small, landlocked economies and populations far from key markets and ports. United Nations Development Programme (UNDP) research suggests that with improved regional cooperation in the areas of trade policy, transport facilitation, and energy and water management, the region’s gross domestic product (GDP) could double—over and above normal growth—within ten years.

Following the collapse of the Soviet Union, the region suffered a steep economic decline. The response included efforts to establish a new regional trade regime. These efforts resulted in a number of overlapping agreements, many of which have not been actively implemented. Research by the Asian Development Bank and the International Monetary Fund suggests that participation in various regional arrangements has so far had a limited impact on the trade regime and trade in Central Asia.
These disappointing results appear to have led to a desire for more practical efforts. Within the CAREC Program, countries are urging practical solutions to the non-tariff barriers (e.g., poor transport infrastructure, cumbersome customs procedures, and weak institutions) that inhibit trade in the region and efforts to achieve World Trade Organization accession.
As Eurasian trade expands, there is a need to improve Central Asian transport infrastructure. A recent CAREC ministerial meeting endorsed a transport and trade facilitation strategy for the program that outlines plans to develop six priority corridors linking countries within greater Central Asia and linking the region to the rest of Eurasia. The strategy envisions about 100 transport and trade facilitation investment projects totaling about US$20 billion along the six corridors over ten years.
A question was raised: When and how can this region become integrated with the rest of Asia? Central Asia is interested in learning about the integration experience of Southeast Asia.


The final session of the conference was a substantive discussion on the future for Asia and the Pacific by identifying the most pressing issues that will confront the region in the next decade. Mr. Masahiro Kawai, Dean of Asian Development Bank Institute (ADBI), asked the seven panelists to identify challenges and issues that think tanks in the region like ADBI should focus on from the perspective of conducting research, in-depth study analysis, and capacity building for the public sector. Outcomes of this session will help inform ADBI’s long-term focus and mission.
The panelists for the session were Mr. Mohamed Ariff, Mr. Iwan Azis, Mr. Thanong Bidaya, Ms. Siow Yue Chia, Mr. Justin Yifu Lin, Mr. Aftab Seth, and Mr. Hiroshi Watanabe. Each participant was charged with presenting his or her three most pressing areas of concern.
Managing exchange rates is an issue that Asia has to grapple with in the near term, stated Mr. Ariff. He argued that managing exchange rates is really about managing short-term capital flows and foreign exchange reserves. He expected a global rebalancing to happen soon and said that this would be a serious challenge for Asia. Exchange rate adjustment is a key instrument for Asia to help correct global payments imbalances. The continued depreciation of the dollar is an example of this correction, which will be accompanied by other adjustments in the real sector of economies and in turn will have implications for capital flows and exchange rates. The next two years, Mr. Ariff said, would be critical because a real balancing could take place in 2008 or 2009 and the US dollar’s role as a reserve currency for East Asia would decline. The latter was then happening in the Middle East and the People’s Republic of China and countries such as Malaysia and Singapore were quietly diversifying their reserve currencies. Since central banks can no longer count on the dollar’s strength and stability, he said, they will likely minimize the risks that the current value of the dollar brings.
The yen was probably not playing the role that it should play in the region and this led to the question of whether or not Japan would allow the yen to be a reserve currency. This would require a different role from Japan: allowing its currency to be internationalized, creating a commitment to stabilize the yen, and making the necessary macroeconomic adjustments. The existence of a variety of exchange rate regimes in East Asia further
complicates the situation. For example, People’s Republic of China and Malaysia have a managed float system, which means these countries do not give their currencies a sufficient lease to move. Hong Kong, China has a currency board system while many countries have managed floating systems based on a basket of currencies. There is no doubt that a major currency alignment in the future would make East Asian currencies more volatile. However, the age of central banks in East Asia responding in haphazard and ad-hoc ways, Mr. Ariff said, is past. While some people have been talking about a common currency for East Asia, this is not likely to materialize in our lifetime, because East Asia is still too variant in terms of stages of development and economic size. However, some kind of convergence in terms of a common exchange rate regime for the whole of Asia is warranted. The growing regional and intra-Asian trade where exchange rate stability will be critical in terms of maintaining stable regional trade and capital flows is a strong reason. In sum, he concluded, there should be some kind of regional cooperation among central banks of Asian countries. Coordination through informal talks has been going on but a more formal dialogue to institutionalize a common exchange rate regime would make Asia more responsive to a looming major exchange rate realignment.
Mr. Azis identified three issues that did not exist prior to 1997 and are present in most East Asian countries today. The first of these was the excess liquidity that East Asia is currently amassing. Excess savings, he added, must be studied in order to understand the incentive mechanisms that can help mitigate its side effects. In addition, data systems, which involve analyzing flows of funds, must be carefully studied in order to determine the short- and long-term implications of excess liquidity. There is a need to disaggregate the data in order to identify exactly where the money goes. A detailed study of the flow of funds with respect to excess savings and financial assets should be a priority research agenda that he endorsed for East Asia.
The second issue pertained to the presence of domestic debt particularly in Southeast Asia. Prior to 1997, East Asian countries had domestic debt levels of virtually zero and debts were largely from foreign donors. Today their domestic debt levels are quite high. These countries have no experience in managing domestic debt compared to managing foreign debt (for example, concessional and commercial loans). Domestic debts have

a different dynamic, which makes them an interesting research topic for policymakers. ADBI is well-placed to do this type of frontier research with very strong policy implications. Tackling domestic debt must go beyond the macro approach and look at the micro details. In some cases, as in Indonesia, for instance, banks have no incentive to extend credit because they want to maintain recapitalization bonds issued by the government to respond to the financial crisis. As a result, they maintain an unnecessarily high capital adequacy ratio instead of extending credit. Analyzing this situation using a micro approach may reveal that once interest income from these recapitalization bonds is removed, banks are basically losing money. The research that focuses on the issue of domestic debt at a micro level must look at the balance sheets of the non-banking corporate sector as well as the banking sector.
The third issue was poverty alleviation. Actions need to go beyond the usual discussion of poverty alleviation through government provisions of social protection coupled with government expenditure on infrastructure for the poor. The world has changed and issues such as financial liberalization, say through a single policy at the macro level, have different repercussions on the income of different household groups. Studies which analyze the link among macro, financial policies and poverty show that macro policies (to achieve macro stability) dominate the debate and yet do not always consider the implications for poor households. Researchers must study the trade-off between macro policies and the impact on income of the poor. They must abandon certain paradigms and instead be more open-minded when generating solutions for old problems such as poverty alleviation while at the same time maintaining macro stability.
Mr. Bidaya first identified the need for financial sector restructuring. In his experience as the Thai Finance Minister, while exchange rate problems could be solved, painful measures had to be implemented. The East Asian financial crisis had weakened financial institutions but the subsequent financial restructuring undertaken by crisis-affected countries brought much needed progress. However, there remain grave doubts that this progress has been sufficient to maintain the competitiveness of regional financial institutions in the global arena. Commercial banks, with their superior access to skilled personnel, can more easily adapt to financial restructuring and new business environments. However, the same cannot be said of small-

and medium-sized enterprises (SMEs), which lack the capacity and know-how to do basic analysis let alone what is needed to be listed on the stock exchange. This is a fundamental problem that needs to be addressed before financial restructuring can have significant positive effects on the economy. Training SMEs and having SME-friendly regulations and technologies in place is useless without the necessary knowledge base. On a larger scale, financial restructuring should pave the way for the development of the Asian bond market.
The second important issue was poverty reduction, and related to that, economic competitiveness. A strong institutional framework that would maintain competitiveness must be put in place in order to address poverty reduction and economic competitiveness. This is one area which can be studied by ADBI. Moreover, it is very important to relate political intervention to economic affairs, especially given that the “invisible hand” will not work in poor areas where there is a need to provide for and “push” opportunities to the poor.
The third and final issue to be addressed was the need to better manage capital flows. In the case of Thailand, while the country had more than US$80 billion in foreign exchange reserves, it was actually a net debtor if the offshore baht amount and the foreign holdings in the Thai equity market on top of other foreign investments were included in its international liabilities. In view of potential capital flow volatility, countries must learn how to manage short-term capital flows and this management should take place through a regional cooperative framework. Even with its excess capital, the region is still crisis-prone. Regional groupings such as ASEAN+3 must engage in multilateral research in this area. In addition, some kind of insurance that will lessen the risks of volatility is needed. Asia must bring back its capital from New York and London and use it for the region’s projects, infrastructure, and logistical needs.
Ms. Chia discussed the issues of environmental sustainability, demographic change, and urbanization along with the rise of India and People’s Republic of China as the three most pressing issues that Asia has to face in the coming decade. Climate change may not be seen as an urgent problem for a number of countries but the consequences are irreversible and thus action must be taken now. The regional and global impacts of climate change, she stated, provide tremendous areas for regional cooperation among Asian countries.

Climate change affects a country’s productivity because of drought and floods as well as presents a political “hot potato” in cases such as potential water shortages in Southeast Asia brought about by the People’s Republic of China’s water diversion strategies. Water, very important for agricultural development, is not receiving enough attention at present.
The next issue was the rapid pace of demographic change and urbanization in Asia. Impacts of aging Ms. Chia said, are already being manifested in present-day Asia. Social protection for the graying population is needed as well as change in the industrial structure to better integrate labor flexibility and the necessary training and re-training of the labor force. Furthermore, demographic change brings about issues related to migration and the rise of mega cities. Asia should follow the example of Europe with its small and more sustainable cities. There is also the pressing need to manage labor flows from rural to urban areas more harmoniously so that labor can easily move from surplus areas to shortage areas. However, this is made more difficult due to the institutional and political constraints found in many countries.
The last issue was the rise of People’s Republic of China and India. Asian countries will have to adapt to the rise of these countries. There are two opposing views on their growth: that of opportunity and that of threat. Countries should try to maximize the opportunities brought about by the rise of these countries and minimize the negative threats that may come along. To face such threats, countries must undergo structural changes to maintain their comparative advantage and competitiveness. In the end, the two economic giants do affect the world but something must be done to help the smaller countries that may become overwhelmed with the “tsunami” brought about by People’s Republic of China and India’s rise.
Mr. Lin addressed three challenges that Asia would be facing within the next three years. These are for Asia to move from: poverty reduction to high levels of growth, growth to sustainable growth, and country focus to regional and global focus. Asia is likely to maintain its dynamic growth in the coming decades, he said, but many people who fail to benefit from this growth may raise the level of social tension, thereby threatening social stability. If this situation were to arise, growth would be impossible. Asia’s current growth, which is resource-intensive, is not sustainable, so a new

path for environmentally sustainable growth must be explored by Asia. Environmental issues cannot be solved by one country alone.
New ideas are needed in Asia because the issues and experiences that the region is going through are totally new. New solutions can be generated by tapping the local capacity to do research, identify agendas, and so on. In order to shore up local capacity, three strategies must be adopted according to Mr. Lin. First, Asians trained domestically and internationally must stay in their own countries in order to increase domestic intellectual capacity. Second, trained people must be adept at identifying issues and solutions beyond textbooks. Third, Asians must have the courage and confidence to come up with their own solutions and not just blindly follow the recommendations of the international community, which may not have sufficient knowledge concerning local situations. ADBI will be helpful as a hub in a network that generates and exchanges new ideas and experiences and promotes policy dialogue. Asia should provide a new model of economic development, which would bring about a new paradigm for economic development in the intellectual world.
Finally, Mr. Lin noted that it had been argued here today that there was a need to expand the People’s Republic of China’s consumption rate in light of the high stock of foreign exchange reserves. While government expenditure on social programs will expand, giving people more confidence to spend, there is also the need to deal with the income distribution issue. Currently, he said, wage income contributes about 40% to gross domestic product, but this is down from 60% in the early 1990s. However, addressing the global financial imbalance would require involvement of not just the People’s Republic of China and Asia but other major countries as well. The region has excess supply, while other countries like the United States have excess demand. The deficit in trade has been increasing rapidly since 1990 because of this huge demand. This issue needs to be dealt with on a global scale. To ask only an individual country to deal with the global issue will be ineffective.
Mr. Seth identified 3 D’s and 3 E’s necessary for Asia’s future. The D’s stand for diaspora, demography, and democracy; the 3 E’s are education, environment, and energy. Diaspora has made some countries lose their best talents. This course must be reversed. The continued population growth of countries in the next 30 or 40 years, for example in India, will put increasing

pressure on the resources of the region. Democracy in Asia must be “balanced” by knowing “how much to control.” Countries such as Pakistan, which take one step forward and one step backward, need to be supported in their efforts. Indonesia is a good example of a country that has been taking many important steps forward in recent years.
The first “E,” education, is related to the issue of diaspora. It is necessary to find the right balance between how many people leave versus how many stay. India is a country that has had to contend with this issue. For example, Indians who do not get in the top seven civilian institutes of technology are forced to go abroad for schooling. And these students who go abroad are also intelligent, for they get into the top 40 universities of the world. However, these brilliant students are spending close to US$8 billion to go to school abroad. This money could have been used for further educational opportunities at home. Countries such as Singapore spend large sums on education to avoid shortages in capacity. The next “E,” the environment, is a future problem for the entire region. In India, the entry of the cheap Tata car will increase the number of vehicles on the roads, putting more pressure on both the infrastructure and the environment. Finally, the energy requirements of both India and People’s Republic of China alone will have a tremendous impact on the region. A concern is how far these countries will take the nuclear energy route. The United States and India signed a nuclear agreement in July 2005 that will increase the use of nuclear energy by India to a level that is comparable to Japan’s 30% in the future or even to as high as the 80% French level. The region needs to determine whether nuclear energy is a viable answer to the vast energy needs of the future.
Mr. Watanabe spoke about the workings of the resource market. Right now, the region is awash in liquidity. There is a need to define the management, policymaking, and implementation aspects of money and commodity markets in the region due to the abundance of liquidity. More importantly, this cheap capital will have an impact on the development process. First, if capital is cheap, labor-intensive industries will be less popular compared to the past, when labor was cheaper than capital. In the past, labor-intensive industries were dominant in developing countries, but as additional capital is accumulated, these industries become more capital-intensive. The rise of capital-intensive industries will bring about changes in the allocation of income, even in labor-abundant nations such as India and People’s Republic of China. This means that the share of labor will become smaller and

smaller and will bring about further income inequality. As labor-intensive industries become fewer, there will be less capacity to absorb excess labor from the agricultural sector. Japan and the Republic of Korea, in the time of labor-intensive industries, were able to develop their manufacturing sectors through surplus labor from the agricultural sector. However, People’s Republic of China and India already have capital-intensive industries so these countries will need to keep more people in the agricultural sector for food production as well as for job opportunities. There is a need to develop agriculture and agro-industries to ensure the prosperity of Asia. This trend may also necessitate increased controls on excessive migration and urbanization.
Our distinguished panelists provided a rich set of issues that ADBI may tackle in the future to help ADB developing member countries achieve sustained growth, balanced development, and poverty reduction. Let me briefly summarize the key points identified. The need to address macroeconomic policy and financial sector issues, especially in the era of excess liquidity, is paramount. Issues of how to strengthen and promote investments in infrastructure, given this excess liquidity, need to be addressed as the region continues its strong growth performance. Moreover, managing capital flows in Asia is an important concern, as capital flows are the primary vehicle to channel liquidity and savings in Asia into more productive investments. This cannot be done without sound macroeconomic management and a strong financial sector.
Good economic management and a strong institutional framework are needed to support the development of the financial sector. This would entail appropriate choice of an exchange rate regime, careful debt management, and the formulation of prudent monetary and fiscal policies based on thorough analyses of the impact of these policies on growth, inflation, asset prices, legal and regulatory reforms, the external balance, and the economic well being of the poor segment of the population. Financial issues must be coordinated with real and social sector issues for the attainment of inclusive and sustainable growth. This type of growth requires substantial investment in education, management of urbanization, rural and agricultural development, and dedicated resources to protect the environment. The issue of equity in relation to labor migration and mega city externalities must be part of any consistent policy framework. These issues are all under the umbrella of inclusive and sustainable growth. The rise of India and People’s

Republic of China is part of the challenges that other countries, particularly members of the Association of Southeast Asian Nations (ASEAN), must grapple with. In order to meet challenges related to finance, volatility, and growth, there is a need to build local capacity to generate knowledge and formulate sound policies for economic development and growth.