1. Meeting called to order. 2. Recognition of persons attending ...
179
CALVERT COUNTY PLANNING COMMISSION REGULAR MEETING PROPOSED AGENDA February 15, 2012 - 7:00 p.m. Courthouse Square Conference Room, 205 Main Street, Prince Frederick, MD 20678 1. Meeting called to order. 2. Recognition of persons attending meeting. 3. Action on proposed agenda. 4. Town Center Architectural Approvals: Solomons, Prince Frederick, Dunkirk, Huntingtown, Owings, Lusby and St. Leonard (architectural approvals are not for action unless listed below). None 5. Major Subdivisions for Final Approval: a) SD 11-01, Holland Acres Resubdivision of Lot 5, Parcel 244 and Replatting of Parcel 74, to create Family Conveyance Lots 5R and 6 & Lot 7 Located on Holland Cliff Road and Fox Den Lane in Huntingtown. Preliminary approval granted 6/15/11. APF exempt for five or fewer lots. 6. Applications for Site Plan Review: None 7. Major Subdivision Applications for Preliminary Approval: None 8. Items for Discussion/Action: a) MSD-04-28-27, Wish You Were Here, Lots 2 & 3 – Request by applicant for extension of preliminary approval (request letter and staff memo attached). b) Work Session II: Text Amendment Case #12-03 – Application by Bargo, LLC regarding proposed amendments to the Land Use Charts - Prince Frederick Town Center Zoning Ordinance (Large-scale Retail in New Town, Village and Entry Districts). c) Overview of the Draft Calvert Watershed Implementation Plan (WIP) – Presentation by Dr. David Brownlee d) SPR 02-8-R1, Oak Tree Landing - Application by Asset Valuation Group regarding corrections in wetland delineation and minor modifications to phasing plan. Planning Commission originally approved the Oak Tree Landing site plan for a total of 152 townhouse lots on March 19, 2003 and the Final site plan was signed on August 2, 2006. 9. Approval of Minutes: a) January 18, 2012 Regular Meeting b) January 25, 2012 Special Meeting 10. Items of Interest: a) PlanMaryland, Draft Planning Area Guidelines b) MACO Planners Meeting held on February 3, 2012 c) Sustainable Communities Designation Application – Update d) Historic Roads in Calvert County: Information and Background e) Joint Land Use Study (JLUS) for Naval Air Station Patuxent River (PAX River)
-
Upload
khangminh22 -
Category
Documents
-
view
2 -
download
0
Transcript of 1. Meeting called to order. 2. Recognition of persons attending ...

CALVERT COUNTY PLANNING COMMISSION REGULAR MEETING PROPOSED AGENDA
February 15, 2012 - 7:00 p.m. Courthouse Square Conference Room, 205 Main Street, Prince Frederick, MD 20678
1. Meeting called to order. 2. Recognition of persons attending meeting. 3. Action on proposed agenda. 4. Town Center Architectural Approvals: Solomons, Prince Frederick, Dunkirk, Huntingtown,
Owings, Lusby and St. Leonard (architectural approvals are not for action unless listed below). None
5. Major Subdivisions for Final Approval: a) SD 11-01, Holland Acres Resubdivision of Lot 5, Parcel 244 and Replatting of Parcel
74, to create Family Conveyance Lots 5R and 6 & Lot 7
Located on Holland Cliff Road and Fox Den Lane in Huntingtown. Preliminary approval granted 6/15/11. APF exempt for five or fewer lots.
6. Applications for Site Plan Review: None 7. Major Subdivision Applications for Preliminary Approval: None 8. Items for Discussion/Action: a) MSD-04-28-27, Wish You Were Here, Lots 2 & 3 – Request by applicant for extension
of preliminary approval (request letter and staff memo attached).
b) Work Session II: Text Amendment Case #12-03 – Application by Bargo, LLC regarding proposed amendments to the Land Use Charts - Prince Frederick Town Center Zoning Ordinance (Large-scale Retail in New Town, Village and Entry Districts).
c) Overview of the Draft Calvert Watershed Implementation Plan (WIP) – Presentation by Dr. David Brownlee
d) SPR 02-8-R1, Oak Tree Landing - Application by Asset Valuation Group regarding corrections in wetland delineation and minor modifications to phasing plan. Planning Commission originally approved the Oak Tree Landing site plan for a total of 152 townhouse lots on March 19, 2003 and the Final site plan was signed on August 2, 2006.
9. Approval of Minutes: a) January 18, 2012 Regular Meeting b) January 25, 2012 Special Meeting 10. Items of Interest: a) PlanMaryland, Draft Planning Area Guidelines
b) MACO Planners Meeting held on February 3, 2012
c) Sustainable Communities Designation Application – Update d) Historic Roads in Calvert County: Information and Background
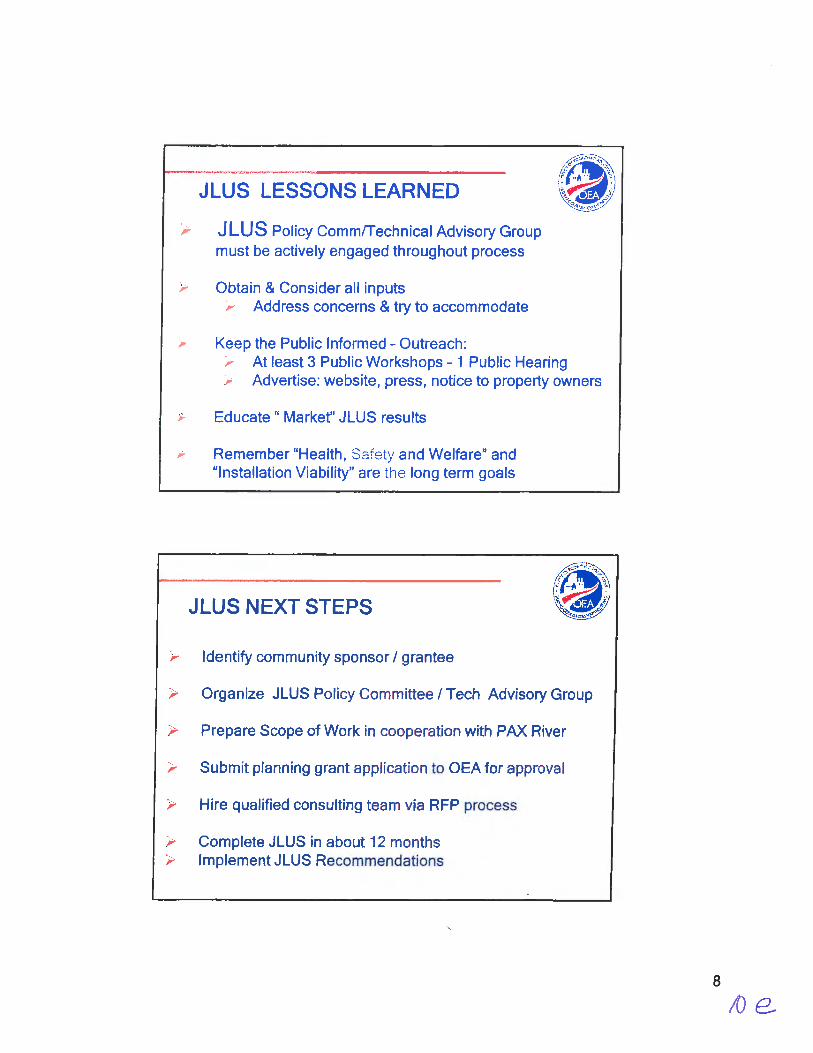
e) Joint Land Use Study (JLUS) for Naval Air Station Patuxent River (PAX River)

f) Zoning Interpretation Discussion g) American Planning Association’s National Planning Conference – April 14-17, 2012,
Los Angeles, CA h) Site Plan Application List for Upcoming Planning Commission Review
i) Site Plan, Category II List (not for Planning Commission Review)
j) Major Subdivision Proposed List for Upcoming Review
11. Adjourn.
FOOTNOTES: 1. Comments will be limited to the issue before the Planning Commission. 2. There will be a five minute break at 9:00 p.m. 3. A decision will be made at 10:30 p.m. whether to continue the meeting or reschedule. 4. Accommodations for persons with disabilities will be made with reasonable notice. 5. The Planning Commission operates under Roberts Rules. cc: Board of County Commissioners; County Administrator; Chuck Johnston, Director of Planning & Zoning;
Maureen Hoffman, Director of Community Resources; Jacqueline Vaughan, Director of Public Safety and Services; Terry Carlson, Director of Public Works; Linda Vassallo, Director of Economic Development


DEPARTMENT OF PLANNING AND ZONING
INTEROFFICE MEMORANDUM TO: Planning Commission VIA: County Administrator FROM: Dave Brownlee, Tay Harris, Mary Cook, Chuck Johnston DATE: February 7, 2012 SUBJECT: Development of the Calvert Watershed Implementation Plan Background: The State of Maryland, along with other states and Washington, DC that are in the Chesapeake Bay Watershed, were required by EPA based on the Clean Water Act to develop watershed implementation plans (WIPs) to meet the Chesapeake Bay total maximum daily load (TMDL) for Nitrogen, Phosphorous and sediment. This document is the Maryland Phase I WIP. The next step is for the local jurisdictions to develop their own WIPs (Phase II WIPs) that dovetail into the State WIP. The Phase II WIPs are required to include a strategy of best management practices (BMPs) that will be implemented to meet the target reductions (Attachment A) in nitrogen, phosphorous and sediments. The WIPs must also include a capacity analysis in terms of staff and funding necessary to meet the goals, must provide tracking of progress, must account for growth and contingency measures if the strategy fails to be accomplished in the timeframe proposed. The EPA target reductions must be 70% met by 2017 and 100% met by 2025. There is also a requirement for submitting a progress report every two years (2-Year Milestones Report). The State has broken the pollution reductions down by source: agriculture, urban (other than from septic systems), septic systems, waste water treatment plants, and forests. The estimated costs to meet the pollution reduction goals are staggering. It has been roughly estimated that the costs for Calvert County to achieve the required reductions is about 1.2 billion dollars. Discussion: The Calvert WIP Team has been meeting monthly to develop the Calvert County WIP. The State has provided the Maryland Assessment Scenario Tool (MAST) online. The County enters their proposed BMPs into the modeling tool and it calculates the reductions in nitrogen and phosphorous. County staff has entered a potential list of BMPs into the MAST tool and have received the results back from the model. Conclusion/Recommendation: Provide Staff comments and recommendations of the proposed WIP narrative. Fiscal Impact: There is an enormous fiscal impact to the County and the citizens of Calvert County.

Calvert County Watershed Implementation Plan
Briefing and Progress Report
February 15, 2012
1

Background• Chesapeake Bay placed on the Federal
Impaired Waters List for Nutrients and Sediment
• EPA was sued to enforce Clean Water Act including meeting the Total Maximum Daily Load (TMDL) for nutrients and sediment in the Bay
• State to comply via Watershed Implementation Plans (WIPs, Phase I)
2

Decline in Chesapeake Bay Water Quality and Fisheries
3

Background (continued)• County to develop County WIPs (Phase
II) based on State set target loading rates of nutrients and sediment
• Loadings are estimated using the Chesapeake Bay Model based on land use
• Loads are broken down by source (agriculture, urban, septic systems, wastewater treatment plants, and forest)
4

Background (continued)• WIP must include a capacity analysis –
funding and staff
• WIP must account for growth
• WIP must provide contingency measures if strategy fails
• WIP requires tracking and reporting including official 2-year Milestone Reports
5

Background (continued)• EPA requires that 70% of the required
reductions be met by 2017 and that 100% be met by 2025
• The State originally decided to meet the 100% goal by 2020 but has recently backed off on this proposal and has accepted the EPA deadlines.
6

Calvert WIP Team• DNR Coordinator – Claudia Donegan
• Planning and Zoning
– Dave Brownlee, County Lead
– Mary Beth Cook, Deputy Director
– Tay Harris, Asisstant Lead
– Steve Kullen, Watershed Planner
– Robin Munnikhuysen, Environmental Planner
– John Swartz, Environmental Planner
– Denise Cherry - Secretary
• Public Works
– Terry Carlson, Director
– Allen Brunson, Water and Sewer, Project Engineer
– Mighel Jackson, Stormwater Engineer
– Rick Mason, Water and Sewer, Project Engineer
– Shukri Sharabi, Division Chief, Water and Sewer
7

Calvert WIP Team (Continued)• General Services – Wilson Freeland, Director
• Economic Development – Linda Vassallo, Director
• Finance and Budget – Julie Paluda
• Calvert Soil Conservation District
– Bill Clark, District Manager
– Ron Babcock, Sediment and Erosion Control Specialist
• Environmental Health Dept. – Paul McFaden, Director
• North Beach - John Hofmann, Town Engineer
• Chesapeake Beach - Bill Watson, Zoning Officer
• Maryland Cooperative Extension – Herb Reed, Director
• Tri-County Council – Wayne Clark, Executive Director
• State Highway Administration – Ling Li, Engineer
• U.S. Navy - Tracy Maningas
8

Loading Rates and Target LoadsCalvert County Target Loads and Required Reductions
Nitrogen Loadings Reductions
Non-Federal 2009 2017
Target 2020
Target 2017 2020
Agriculture 148,669 109,362 92,516 -39,307 -56,153
Urban 195,663 154,264 136,522 -41,399 -59,141
Septic 299,785 215,492 179,366 -84,293 -120,419
Forest 150,410 150,667 150,776 257 366
Wastewater 27,893 32,589 30,313 4,696 2,420
Total 822,420 662,374 589,493 -160,046 -232,927
Without Ag 673,751 553,012 496,977 -120,739 -176,774
Phosphorous Loadings Reductions
Non-Federal 2009 2017
Target 2020
Target 2017 2020
Agriculture 14,020 11,558 10,503 -2,462 -3,517
Urban 20,777 14,164 11,330 -6,613 -9,447
Septic 0 0 0 0 0
Forest 3,881 3,886 3,888 5 7
Wastewater 12,803 6,917 4,740 -5,886 -8,063
Total 51,481 36,525 30,461 -14,956 -21,020
Without Ag 37,461 24,967 19,958 -12,494 -17,503
9

Waste Water Treatment Plant BMPs• Upgrade Chesapeake Beach WWTP to
Enhanced Nutrient Removal (ENR) - In design
• Upgrade Marley Run WWTP – Completed
• Upgrade Northern High School WWTP -Potential
• Connect Naval Research Laboratory WWTP to Chesapeake Beach (CB) WWTP –Potential
10

Nitrogen Removing Septic Systems• Bay Restoration Fund Upgrades - ongoing, 60/yr
• Require all new systems in Critical Area to be upgraded - ongoing, State Law
• Require all new system outside the Critical Area to upgrade – Potential
• Require all repairs of failed systems to upgrade (1.9%/yr) – Potential
• Require upgrades at “time of sale” (5%/yr) –Potential
• Consider requiring upgrades from 65% removal to 90% removal – Potential (possible contingency
measure)
11

Connect Septic Systems to WWTP• Connect Calvert County Industrial Park to Prince
Frederick (PF) WWTP – In planning
• Remainder of Dares Beach to PF WWTP – In Planning
• Hallowing Point Trailer Park and DNR Building to PF WWTP – In Planning
• Summer City/Randle Cliff to CB WWTP - Potential
• Connect Central Village to PF WWTP- Potential
• Connect Bayside Forest to PF WWTP - Potential
• Connect Huntingtown High School to Marley Run WWTP - Potential
• Connect Cove Point and Cove Point LNG plant to the Solomons WWTP - Potential
12

Storm Water BMPs• Wet ponds and wetlands
• Vegetated open channel
• Urban stream restoration or regenerative stormwater conveyance
• Urban infiltration practices
• Shoreline erosion control
• Impervious surface reduction
• Erosion and sediment control
• Bioswales
• Bioretention/raingardens13

SWM BMP Primary Reductions -County• Provide “Environmental Site Design”
(ESD) to the “Maximum extent Possible” (MEP) for all County structures and facilities by 2020 including public schools, athletic facilities and the County Services Plaza
• Implement grass channels or bioswales along 360 miles of County/Private roadways by 2020
• Increase drainage channel repair and stream restoration efforts to 1,000 feet
per year14

SWM BMP Primary Reductions County/Private Partnerships
• Reduce total untreated impervious coverage County-wide 20% by 2020
• Convert 160 dry extended detention ponds to wet ponds or wetlands by 2020
• Implement ESD to the MEP on approximately 600 existing commercial properties by 2020
• Construct micro-bioretention or rain garden facilities on approximately 1,250 single family residential lots, focusing on high density areas, by 2020
15

MAST• Maryland Assessment and Scenario
Tool
• Online modeling tool that is consistent with the Bay Model
• Jurisdictions add BMPs for each Source and MAST calculates the loadings achieved.
16

MAST Preliminary ResultsWaste Water Treatment Plants
17
Wastewater Treatment
Plants
2009 Loading
Rates
2017 Loading
Rates
2017 Target Loads
2020 Loading
Rates
2020 Target Loads
Flow (mgd)1.19 1.79 1.79 1.96 1.96
Nitrogen (lbs)27,893 32,009 32,589 31,271 31,271
Phosphorous (lbs)12,802 6,908 6,917 4,899 4,899

Stormwater
18
Stormwater Management
2009 Loading
Rates
2017 Loading
Rates
2017 Target Loads
2020 Loading
Rates
2020 Target Loads
Delivered LoadsNitrogen (lbs) 195,663 139,227 154,264 135,859 136,522
Delivered Loads Phosphorous (lbs) 20,777 11,390 14,164 10,688 11,330

Septic System - DenitrificationSeptic System
Upgrades
# Systems
from MAST
2017 2020 2025
Up-graded systems
% Up-graded
Up-graded systems
% Up-graded
Up-graded systems
% Up-graded
Critical Area
5,323 1,876 35.2 2,676 50.3 3,681 69.1
Within 1,000 ft of a stream
7,583 2,331 30.7 3,370 44.4 4,675 61.7
Other 15,163 4,575 30.2 6,627 43.7 9,206 60.7Total 28,069 8,782 31.3 12,673 45.1 17,562 62.6
19

20
Septic Systems and Septic Connections
without Growth
2017
2009 Loadings Loadings
lbs N removed
(50%)
lbs N removed
(65%)Critical Area 102,672 84,814 17,858 23,215
Within 1,000 ft of a stream 90,924 77,160 13,764 17,893
Other 109,099 92,857 16,242 21,115
Sectic Connections 2,236 2,236
Total 302,695 254,831 50,100 64,459Target 84,293 84,293
lbs reduction relative to target -34,193 -19,834
Without Septic Connections -36,429 -22,070

21
Septic Systems and Septic Connections
without Growth
2020
2009 Loadings Loadings
lbs N removed
(50%)
lbs N removed
(65%)
Critical Area 102,672 77,043 25,629 33,318
Within 1,000 ft of a stream 90,924 70,916 20,008 26,010
Other 109,099 85,474 23,625 30,713
Sectic Connections 13,838 13,838
Total 302,695 233,433 83,100 103,879
Target 120,419 120,419
lbs reduction relative to target -37,319 -16,540
Without Septic Connections -51,157 -30,378

22
Septic Systems and Septic Connections
without Growth
2025
2009 Loadings Loadings
lbs N removed
(50%)
lbs N removed
(65%)Critical Area 102,672 67,368 35,304 66,569Within 1,000 ft of a stream 90,924 63,031 27,893 53,738Other 109,099 76,178 32,921 63,983Sectic Connections 13,838 13,838Total 302,695 206,577 109,956 198,129Target 120,419 120,419
lbs reduction relative to target -10,463 77,710Without Septic Connections -24,301 4,534

Preliminary Draft Cost EstimateSource BMP Estimated Total
Cost to 2020Urban SWM Practices $1.09 Billion
Septic Systems N-removing systems (12,673 systems) $152 Million
Septic System Connections
To Waste Water Treatment Plants (962 connections)
$19 Million
Wastewater Plant upgrades $20 Million
Total $1.28 Billion
23

24
Stormwater Management Cost Breakdown
BMP 2017 2020 Delta
Bioretention/raingardens 201,866,531 266,855,156 64,988,625
Bioswales 21,640,458 24,731,952 3,091,494
Impervious Surface Reduction 106,270,106 141,693,475 35,423,369
Shoreline Erosion Control 15,000,000 15,000,000 0
Urban Stream Restoration 15,985,809 15,985,809 0
Infiltration Practices 251,986,075 325,125,670 73,139,596
Vegetated Channels 12,365,976 17,665,680 5,299,704
Wet Ponds/Wetlands 228,020,533 285,025,666 57,005,133
Total $853,135,488 $1,092,083,408 $238,947,920

Potential Funding Sources
• Bay Restoration Fund – Septic Systems & WWTPs
• Regulatory – Septic Systems
• County Stormwater Grant Fund - SWM
• Stormwater Utility – SWM
• State and Federal Grants
• Tax incentives
• General Fund (increase taxes)
25

Calvert WIP Schedule
• March 6, 2012 - BOCC Work Session II• March 31, 2012 State deadline to submit
Bay-wide WIP to EPA• Public Forum - April 2012• Public Hearing - May 2012• County refinements - June 29, 2012
26

Cost Benefits• Increased Fisheries and economic boost
to waterman
• Increased Tourism
• Improve Recreational Activities
• Economic Boost to Local Business to implement BMPs
27

28

1
Calvert County WIP II Strategy Section I: Calvert County’s Phase II WIP Team Process Calvert County’s Phase II WIP Team is a comprised of a multi-disciplined team committed to developing a strategy to meet 2017 interim target loads and 2020 load goals. The team membership is listed below. DNR Coordinator
Claudia Donegan Planning and Zoning
Dave Brownlee, County Lead Mary Beth Cook, Deputy Director Tay Harris, Assistant Lead Steve Kullen, Watershed Planner Robin Munnikhuysen,
Environmental Planner John Swartz, Environmental Planner Denise Cherry - Secretary
Public Works Terry Carlson, Director Allen Brunson, Water and Sewer,
Project Engineer Mighel Jackson, Stormwater
Engineer Rick Mason, Water and Sewer,
Project Engineer Shukri Sharabi, Division Chief,
Water and Sewer
General Services Wilson Freeman, Director
Economic Development Linda Vassallo
Finance and Budget Julie Paluda
Calvert Soil Conservation District Bill Clark, Director Ron Babcock
Environmental Health Dept. Paul McFaden, Director
North Beach John Hofmann, Town Engineer
Chesapeake Beach Bill Watson, Zoning Officer
Maryland Cooperative Extension Herb Reed, Director
Tri-County Council Wayne Clark, Executive Director
State Highway Administration Ling Li, Engineer
U.S. Navy Tracy Maningas
The team met monthly, from January 2011 to present (monthly meetings are on-going) to discuss potential actions to achieve Phase II WIP nitrogen, phosphorous and sediment target load goals. The team concentrated on existing programs and projects to achieve target load goals, assessed the load gaps, and identified actions to close the gaps. Some actions will be difficult to implement including the proposed schedule of septic system upgrades (due to an aggressive implementation schedule and a lack of qualified pool of contractors to install systems and County staff needed to administer upgrades); implementation of selected urban management measures (including County staff to administer BMP implementation), financing the strategy in its entirety; and passing legislation associated with a stormwater utility fee and septic system

2
required upgrades. To implement the Phase WIP II strategy, the County estimates it would need to double its annual operating budget.
Current programs in place that contribute to meeting target load goals include:
The County’s practice of land application of wastewater effluent rather than direct discharge at 2 of the County’s 3 major waste water treatment plants (WWTPs)
The use of shared community septic systems that utilize pretreatment and land application Identifying and upgrading failing septic systems Initiating watershed implementation plans in selected subwatersheds to identify pollution
sources and develop a strategy to reduce pollutants Upgrading to enhanced nutrient removal (ENR) at Chesapeake Beach WWTP Targeting growth to town centers served by public sewer Conducting public outreach and education on the importance of pumping septic systems
through programs such as the Calvert County Environmental Commission’s “Pump for the Bay Contest”
Upgrading existing conventional septic systems to nitrogen-removing systems through a Bay Restoration Fund grant
Minimizing future residential development in the Farm and Forest Zoning District through two downzonings and a TDR program, providing funding for land preservation through the Purchase and Retirement of TDRs (PAR Program)
Implementing lots-to-TDRs program to convert existing undeveloped lots to open space Calvert County Phase II WIP Target Loads It is anticipated that the Calvert County’s Phase II WIP Strategy will not meet the County’s target loading goals for nitrogen, phosphorus and sediment by 2020 due to the speed of implementation and the very high costs. Extending the 2020 target loads to 2025 will help with the implementation schedule, but the high costs of stormwater retrofits are prohibitive. The strategy proposed will, however contribute to achieving Maryland’s Chesapeake Bay total maximum daily load (TMDL) for nitrogen, phosphorous and sediment. The County’s required reductions for non-federal lands are given in Table 1. Reductions on federal lands are being addressed by the federal government. The Phase II WIP Strategy includes a capacity analysis in terms of staffing and funding, a description of tracking of progress, and a discussion of contingency measures if the strategy fails to accomplish the required reductions in the timeframe proposed. A discussion of the 2012-2013 (2-Year Milestones Report) milestones is also included. The Environmental Protection Agency’s (EPA) assessment to account for growth is being developed; therefore, growth is not accounted for at this time. Upon EPA’s completion of an “accounting for growth analysis” and EPA’s guidance, the Calvert County Phase II WIP Team will develop its analysis accounting for future growth.

3
Table 1. Calvert County Target Loads and Required Reductions
Nitrogen Loadings Reductions Non-Federal Land1 2009 2017 Target 2020 Target 20172 20203 Agriculture4 148,669 109,362 92,516 -39,307 -56,153 Urban 195,663 154,264 136,522 -41,399 -59,141 Septic 299,785 215,492 179,366 -84,293 -120,419 Forest 150,410 150,667 150,776 257 366 Wastewater 27,893 32,589 30,313 4,696 2,420 Total 822,420 662,374 589,493 -160,046 -232,927 Total Excluding Ag4 673,751 553,012 496,977 -120,739 -176,774 Phosphorous Loadings Reductions Non-Federal Land1 2009 2017 Target 2020 Target 20172 20203 Agriculture 14,020 11,558 10,503 -2,462 -3,517 Urban 20,777 14,164 11,330 -6,613 -9,447 Septic 0 0 0 0 0 Forest 3,881 3,886 3,888 5 7 Wastewater 12,803 6,917 4,740 -5,886 -8,063 Total 51,481 36,525 30,461 -14,956 -21,020 Total Excluding Ag4 37,461 24,967 19,958 -12,494 -17,503 Notes to Calvert County load goals and reductions 1Loads and Reductions on Federal lands are being addressed by the Federal Government 2Calculated as the 2017 Target Load minus the 2009 load 3Calculated as the 2020 Target Load minus the 2009 load 4Agricultural loads and reductions are being addressed by the Soil Conservation Districts and the Maryland Department of Agriculture
Calvert County Phase II WIP Estimated Costs The preliminary cost estimate to achieve Calvert County’s required reductions is approximately $1.26 billion dollars (Table 2). This amount includes implementation of WWTP upgrades and improvements; septic system upgrades including adding three staff persons and implementation of stormwater management (SWM) best management practices (BMPs). These costs do not reflect necessary land acquisition costs for SWM devices, three (3) additional staff persons to administer stormwater BMP implementation or contingency measures. The County would develop a stormwater utility to fund staff dedicated to the implementing the stormwater BMPs and administering the stormwater utility. A cost breakout of stormwater BMPs is provided in Table 3. A cost breakout and upgrade schedule for septic systems is provided in Table 4. The average cost per septic system upgrade is $12,000 (which includes a $200.00 administrative fee).

4
Property owners would pay for the required upgrades. The average cost per septic system connection to a WWTP is roughly $20,000.
The strategy’s tidal water monitoring program, conducted by the Chesapeake Biological Laboratory (CBL), has been in existence for 23 years in Mill Creek and from 1-3 years for the other creeks (6 in addition to Mill Creek in the Patuxent River drainage and 3 that drain to the Bay). In June of 2010, the County began quarterly sampling of one site in each of 21 of the County’s 22 subwatersheds. The samples are collected by County staff and volunteers, and the samples are delivered directly to the CBL for processing. The program is designed to recognize “hot spots” of pollution and provides a baseline from which to assess future water quality improvements that would be accomplished by the Phase II WIP Strategy. The tidal monitoring program is funded through the County and the freshwater sampling has been supported by a grant from the Cove Point Natural Heritage Trust (CPNHT). If the CPNHT and County funding continues, there would be no increased costs associated with this aspect of the strategy. The estimated cost breakdowns can be found on the next two pages.
Table 2: Calvert County Phase II WIP Implementation Estimated Costs
Source Best Management Practices Estimated Total Costs
Urban Stormwater Management Practices
$1.09 Billion
Additional Urban Land Costs
Land for Placement of Stormwater Practices
under development
Technician, Reviewer and
Inspector
under development
Septic System Upgrades
Nitrogen-removing septic systems(12,673 systems)
$152 Million
Additional Septic System Upgrade Costs
Planner II and Health Department Inspector
under development
Septic System Connections
To Waste Water Treatment
Plants (962 connections, contingency
measure)
$19 Million (contingency measure)
Wastewater
Plant Upgrades
$20 Million
Total
$ 1.26 Billion
(does not reflect SWM staffing,

5
land costs or contingency measures)
Table3. Stormwater Management Cost Breakdown
Best Management Practice 2017 2020 Delta
Bioretention/raingardens $201,866,531 $266,855,156 $64,988,625
Bioswales $21,640,458 $24,731,952 $3,091,494
Impervious Surface Reduction $106,270,106 $141,693,475 $35,423,369
Shoreline Erosion Control $15,000,000 $15,000,000 $0
Urban Stream Restoration $15,985,809 $15,985,809 $0
Infiltration Practices $251,986,075 $325,125,670 $73,139,596
Vegetated Channels $12,365,976 $17,665,680 $5,299,704
Wet Ponds/Wetlands $228,020,533 $285,025,666 $57,005,133 Staff (Technician, Reviewer & Inspector) & Land Costs under development under development under development Total $853,135,488* $1,092,083,408* $238,947,920*
*does not reflect staffing or land
costs
*does not reflect staffing or land
costs
*does not reflect staffing or land
costs

6
Table 4: Septic System Upgrade Schedule and Costs
2017 2020 2025
# Systems Upgraded - Cumulative 8,782 12,673 17,562
2013-2017 2018-2020 2021-2025 # Systems Upgraded 8,782 3,891 4,889 Average
# Systems Upgraded /yr 1,756 1,297 978 1,344
Staffing Cost/yr
2 positions Health Department $150,000
1 Position Planning and Zoning $75,000
Total $ $225,000
$/System $167 ($225,000/1,344 systems)
System Installation Costs 75% of system installed are conventional and cost $11,300/system
25% of the systems installed are composite tanks and cost $13,285/system
Cost Breakdown $847,500 ($11,300 * 75 systems)
$332,125 ($13,285 * 25 systems) $1,179,625 Total
$11,796 Cost/System $11,964 Cost/System including staffing
Costs to 2020
$151,615,893

7
Costs to 2025 $210,106,393
Section II: Calvert County’s Phase II WIP Strategy Point Sources
Point Sources
Wastewater Treatment Plants (WWTPs) - Implementation Milestones
The County anticipates meeting 2017 interim reduction goals and 2020 load cap goals for point sources through system reconstruction and Enhanced Nutrient Removal (ENR) upgrade to Chesapeake Beach WWTP (Table 5). Funding sources include the Bay Restoration Fund and the Maryland Department of the Environment (MDE) funds. Project completion is anticipated in 2012. The County’s two other large WWTPs are land application.
The County is also engaging in discussions with the U.S. Navy and MDE regarding the potential connection of the Naval Research Laboratory (NRL) minor WWTP in Randle Cliffs to the Chesapeake Beach WWTP. Potential funding being considered is the Maryland Bay Restoration Fund, bonds, capturing repayments through rate increases and federal funds. Alternative funding options will be explored and estimated costs will be developed as discussions evolve.
Table 5: Waste Water Treatment Projected Loading Rates and Target Loads
2009 Loading
Rates 2017 Loading
Rates
2017 Target Loads
2020 Loading
Rates 2020 Target
Loads
Flow (mgd) 1.19 1.79 1.79 1.96 1.96
Nitrogen (lbs) 27,893 32,009 32,589 31,271 31,271
Phosphorous (lbs) 12,802 6,908 6,917 4,899 4,899
Non-Point Sources Proposed Septic System Upgrades - Implementation Milestones

8
The County does not anticipate meeting 2017 interim reduction goals or 2020 load cap goals for septic system upgrades through the proposed actions described below; however, the County does anticipate meeting 2025 load caps by implementing these actions:
Continue installing about 60 nitrogen-removing septic systems per year via the County’s on-going Bay Restoration Fund (BRF) Grant Program
Require all new septic systems within the Critical Area as per State law to be advanced systems and require further that these systems have a nitrogen removing efficiency of at least 69%
Require all new systems outside the Critical Area to be advanced systems with a nitrogen removal efficiency of at least 69%
Require all repairs of failed systems (about 1.9%/year) to use advanced systems with a nitrogen removal efficiency of at least 69%
Require all septic systems at “time of sale” (about 5%/year) to be upgraded to advanced systems with a nitrogen removal efficiency of at least 69%
Proposed Septic System Upgrades – Programmatic Milestones The County would need to pass legislation requiring the use of advanced denitrifying systems capable of achieving nitrogen reductions of at least 69%; and requiring such systems within the Critical Area, outside of the Critical Area, when repairing failed systems, and “at time of sale”. This process is anticipated to take one year. Based upon these proposed policies and the timetable associated with passing legislation, Table 6 contains the proposed schedule of septic systems upgrades to achieve 2025 target nitrogen loads. The number of systems upgraded accounts for decrease in housing stock without upgraded septic systems over time.
Table 6: Proposed Septic System Upgrades
# Systems
from MAST
2017 2020 2025
Upgraded systems
% Upgraded
Upgraded systems
% Upgraded
Upgraded systems
% Upgraded
Critical Area 5,323 1,876 35.2 2,676 50.3
3,681
69.1
Within 1,000 ft of a stream 7,583 2,331 30.7 3,370 44.4
4,675
61.7
Other 15,163 4,575 30.2 6,627 43.7 9,206 60.7
Total 28,069 8,782 31.3 12,673 45.1 17,562 62.6

9
As discussed under Section V: Identification of technical Discrepancies, Maryland’s Assessment Scenario Tool (MAST) gives a 50% reduction in nitrogen load credit per upgraded septic system. However, the advanced systems being installed via the County BRF Program achieve 69% nitrogen reduction. Table 7, found on the next page, shows the loading reductions reached using the 50% reduction allowed in MAST, a 69% reduction based on our current and proposed future programs, a 93% reduction based on using the most efficient nitrogen-removing septic systems (a contingency measure) and reductions from proposed septic systems to WWTP connections. The County implementation strategy for septic systems falls short of meeting the 2017 and 2020 target load goals with or without the septic systems to WWTP connections based on the projected 50% or 69% nitrogen reduction. If the 2020 target load is extended to 2025, the target load is exceeded in 2025 only if the 69% nitrogen reduction is applied. Using the 69% reduction, the goal is exceeded with or without the septic systems to WWTP connections.

10
Table 7: Comparison Table for Septic Systems with 50%, 69% and 93% Denitrification Capabilities(includes septic connections without growth)
2017
2009 Loadings Loadings
lbs N removed (50%)
lbs N removed (69%)
lbs N removed (93%)
Critical Area 102,672 84,814 17,858 24,644 33,216 Within 1,000 ft of a stream 90,924 77,160 13,764 18,994 25,601
Other 109,099 92,857 16,242 22,414 30,210 Septic Connections 2,236 2,236 2,236
Total 302,695 254,831 50,100 68,288 91,263 Target 84,293 84,293 84,293
lbs reduction relative to target -34,193 -16,005 6,970
Without Septic Connections -36,429 -18,241 4,734
2020
2009 Loadings Loadings
lbs N removed (50%)
lbs N removed (69%)
lbs N removed (93%)
Critical Area 102,672 77,043 25,629 35,368 47,670 Within 1,000 ft of a stream 90,924 70,916 20,008 27,611 37,215
Other 109,099 85,474 23,625 32,603 43,943 Septic Connections 13,838 13,838 2,236
Total 302,695 233,433 83,100 109,420 131,063 Target 120,419 120,419 84,293
lbs reduction relative to target -37,319 -10,999 46,770
Without Septic Connections -51,157 -24,837 44,534
2025
2009 Loadings Loadings
lbs N removed (50%)
lbs N removed (69%)
lbs N removed (93%)
Critical Area 102,672 67,368 35,304 48,720 65,665 Within 1,000 ft of a stream 90,924 63,031 27,893 38,492 51,881
Other 109,099 76,178 32,921 45,431 61,233 Septic Connections 13,838 13,838 13,838
Total 302,695 206,577 109,956 146,481 192,617

11
Target 120,419 120,419 120,419 lbs reduction relative to
target -10,463 26,062 72,198 Without Septic
Connections -24,301 12,224 58,360 Funding of required upgrades would be paid by homeowners and homebuyers unless the County develops another funding mechanism. When the above policies are in place, the BRF could be used to pay for upgrades for low income families or to upgrade systems from 69% removal to 93% removal. The Department of Planning and Zoning would administer the system upgrades. Inspections of all upgrades and denitrifying systems would be administered by the Health Department. All upgraded system would be required to include an alarm system with tele-monitoring, which provides an email or text message to the County Health Department and service provider upon system failure or the development of mechanical problems. The Department of Planning and Zoning administers the BRF Grant Program including receiving applications, evaluating sites, prioritizing sites, preparing bids for installations, providing property owner outreach and education and assisting in the upgrades process. The Environmental Health Department evaluates sites, reviews designs and inspects and monitors installed upgrades. The Health Department and Planning and Zoning would administer additional upgrades through this process. The County has identified the need for three additional staff people to administer septic upgrades. One (1) staff person is needed in Planning and Zoning to conduct homeowner outreach/educational/technical assistance, handle a bid process to obtain the best systems at the lowest cost and monitor and track systems; and two (2) staff persons are needed in the Environmental Health Department to conduct field inspections and monitor installed systems. A $200 administrative fee per system would fund these positions (Table 4). Proposed Septic System Connections to WWTPs: Since the target loads for septic systems can be met by 2025 without the septic system to WWTP connections (Table 7), the connections proposed below will be considered as contingency measures.
Proposed Residential Connections to the Chesapeake Beach WWTP: The Chesapeake Beach WWTP serves 9,750 equivalent dwelling units (EDUs). According to MAST, 2010 flow was 0.60 million gallons per day (MGD). The Chesapeake WWTP’s planned capacity is 1.5 MGD,i which will be accomplished upon the completion of its reconstruction and ENR upgrade in 2012. Proposed septic system connections to the Chesapeake Beach WWTP include:
289 EDUs in Summer City/Randle Cliff sits along the shores of the Chesapeake Bay, south of Chesapeake Beach (contingency).
Proposed Residential and Institutional Connections to the Prince Frederick WWTP:
The Prince Frederick WWTP, comprised of two wastewater treatment plants, serves 2,775 EDUs. Prince Frederick WWTPs I and II are interconnected via a force main that allows these facilities to work in tandem providing a combined capacity of 750,000 gallons per day of sewage disposal. According to the Chesapeake Bay’s MAST tool, due to the fact that these facilities utilize land application, nutrients are considered a 0 discharge into the Bay.

12
Therefore, septic system connections to the Prince Frederick WWTP will translate into a 0 discharge. Proposed septic system connections to the Prince Frederick WWTP include:
121 EDUs in Dares Beach, east of Prince Frederick, sits along the shores of the Chesapeake Bay (40-50 by 2017, the rest are contingency). Septic system failures occur due to high groundwater and poor percolation
278 in Bayside Forest, which is located north of Dares Beach (contingency) 40 EDUs in Central Village, which is located on the north side of Dares Beach Road
between Dares Beach and Prince Frederick (contingency) 33 EDUs in Hallowing Point Trailer Park, which is located near where Route
231/Hallowing Point Road crosses the Patuxent River (contingency but may happen with private funds)
The Department of Natural Resources (DNR) building, which is located where Route 231/Hallowing Point Road crosses the Patuxent River (contingency)
The Calvert County Industrial Park currently using a sewage treatment plant with subsurface disposal (essentially a large septic system) (in planning)
Proposed Residential and Institutional Septic System Connections to Solomons WWTP:
Capacity at the Solomons WWTP is 1.052 MGD with an actual flow of 0.335 MGD (CY 2006). Proposed septic system connections to Solomons WWTP are presented below. According to the Chesapeake Bay’s MAST tool, due to the fact that this facility utilizes land application, nutrients are considered a 0 discharge into the Bay. Therefore, septic system connections to the Solomons WWTP will translate into a 0 discharge. Proposed septic system connections to the Solomons WWTP include:
200 EDUs in Cove Point, which is located north of Solomons Island and south of Calvert Cliffs State Park, at the end of Cove Point Road on the Chesapeake Bay (contingency)
Cove Point, LNG, which is located west of the Cove Point community, north of Solomons Island and south of Calvert Cliffs State Park on Cove Point Road (contingency)
Proposed Septic Systems Connections to Marley Run WWTP: Marley Run treatment
facility is a shared community system that serves sixty (60) homes in the Marley Run Subdivision. The system discharges effluent to nearby drip irrigation fields. The current permitted capacity of the treatment facility is 15,000 gallons per day (gpd). Permitted capacity of the treatment facility is 40,000 gpd. The facility is currently being upgraded to meet the required build-out capacity and more stringent treatment limits for 160 EDUs. According to the Chesapeake Bay’s MAST tool, due to the fact that Marley Run utilizes land application, nutrients are considered a 0 discharge into the Bay. Therefore, septic system connections to Marley Run will translate into a 0 discharge. Proposed septic system connections to the Marley WWTP include:
Huntington High School, which is located on Rt 2/4 in Huntingtown. The effluent is currently treated by extended aeration, clarification, nitrification/denitrification and discharged to an underground drainage field.ii Capacity is 0.0115 MGD, and 2007 average peak flows were 0.0024 MGDiii. (Land application to land application, therefore no loadings charged and no loading reduction credits given.)

13
Septic system to WWTP connections in areas with failing septic systems could occur without amendment to the County Comprehensive Plan and Comprehensive Water and Sewerage Plan. In areas without failing septic systems, amendments to the County Comprehensive Plan and Comprehensive Water and Sewerage Plan would be required. Upon deciding to utilize this contingency measure, it is estimated to take one year to pass legislation. Project funding sources would be bonds. Bond repayments would be captured through rate increases. Estimated cost per equivalent dwelling unit (EDU) is estimated at $20,000. Additional staff requirements would be assessed when and if the need becomes apparent. Table 7 shows the target load reduction projections with septic system upgrades and connections. Contingency Actions: Require Septic System Upgrades that Achieve a 93% Nutrient Reduction: In the event that the County fails to keep on track to meet 2025 load goals by implementing the above described septic system upgrades (at 69% removal), the County will consider requiring septic system upgrades that achieve 93% removal efficiency wherever feasible. The schedule of implementation as described above would be modified accordingly. If this contingency measure were used, it is estimated that passing the required legislation would take one year.
Require Septic System to WWTP connections: Require a sufficient number of septic connections to cover the shortfall. Implement the ones that do not require plan amendments first, then proceed to the others.
Urban Nutrient: Stormwater Management - Implementation Milestones Upgrading Existing Failing And Inadequate Stormwater Management Facilities: Calvert County’s urban nutrients stormwater management strategy initially focuses on upgrading existing failing and inadequate stormwater management facilities to provide greater detention quality treatment of runoff. Existing facilities such as dry extended detention ponds and grass swales will be converted to wet ponds, wetlands and bioswales where appropriate to achieve higher nutrient removal efficiency than can be achieved in their current form even when properly maintained. Current drainage channel repair and stream restoration implementation will be increased substantially to reduce the sediment and nutrient loads that are flowing into our waterways. Treat Unmanaged Impervious Surfaces: Calvert County is also proposing to provide stormwater management for currently unmanaged impervious areas through the reduction of impervious areas, providing stormwater management for all County structures and the majority of County roadways, and incentivizing the construction of infiltration and filtering facilities on existing residential and commercial properties. See the bulleted list below for the suite of combined actions: upgrades to existing failing or inadequate stormwater management facilities and treatment of impervious surfaces.
Convert approximately 200 miles of grass swales to bioswales and install an additional 160 miles of new grass swales along county and private roadways

14
Increase current rate of drainage channel repair from 200 feet per year to 715 feet per year, representing a total of 5,000 feet
Pursue implementation of regenerative stormwater conveyances or other vegetated flow attenuation wherever appropriate
Partner with local communities to sponsor cliff stabilization projects at a rate of 715 feet per year, representing a total of 5,000 feet
Provide or upgrade stormwater management facilities on approximately 30 County structures to provide environmentally sensitive design (ESD), to include public schools, the golf course and the County Services Plaza
Construct or upgrade approximately 160 miles of grass swales along currently unmanaged County and privately owned roadways to provide water quality treatment
Reduce total impervious cover in Calvert County by 15% by 2017, and by 20% by 2020 through changes to parking requirements
Incentivize removal of unused impervious area, green roof retrofits, and expanded use of permeable pavement
Incentivize the use of microscale ESD practices on approximately 600 existing commercial properties that drain to regional facilities or pre-2000 stormwater management facilities to reduce nutrient loading closer to the source
Incentivize the construction of bioretention, micro-bioretention and raingarden facilities on approximately 1,250 single family residential lots; focusing primarily on densely populated areas such as Chesapeake Ranch Estates where facilities can treat multiple homes
The stormwater management portion of the Phase II WIP strategy requires one staff person to review projects, one staff person to inspect projects and one person to administer the stormwater management impact fee and identify projects. All three staff persons would be housed in the Public Works Division of the Department of Inspections and Permits. The County will develop a stormwater utility to implement this program and provide funding for these positions.
Urban Nutrient: Stormwater Management - Programmatic Milestones
The County would need to pass legislation establishing a stormwater utility fee. The County is considering two different approaches to developing the stormwater utility fee. The first approach would consist of a flat rate per household and an impervious surface-based fee for non-residential development. With an estimated 33,000 households in the County, $1.98 million/year could be collected through a $60 flat fee per household (similar to some other jurisdictions). The non-residential fees generated will need to be developed based on impervious surface coverage if this is the method approved. The second approach would consist of an impervious surface based approach for both residential and non-residential development. If the second option is the approved method, the County would need to develop an estimated income from this approach. In order to fund the required implementation only through residential development, each property owner would have to pay an additional $2,753/year between 2013 and 2025. This is

15
unreasonable and is extremely problematic. As a better handle on the non-residential contribution to the strormwater utility is achieved, the residential cost would be reduced. Tree Plantings: Through Calvert’s existing Critical Area Program and Forest Conservation Program, the fees-in-lieu (FIL) fund for these programs currently contains enough funds to plant two (2) acres of trees per year inside the Critical Area and two (2) acres of trees outside the Critical Area annually through 2017, but more revenue from fees-in-lieu are expected during this time. Planning and Zoning will administer and track the four (4) acres of tree planting per year. Technical Discrepancies and Alternative Measures: Stream Restoration and Oyster Reefs and Floats Alternative options for meeting 2017 interim goals and 2020 target load goals include stream restoration projects and oyster reefs and floats. The Southern Maryland Oyster Cultivation Society (SMOCS) has been active in encouraging oyster floats attached to private and commercial piers and in creating oyster reefs in local tidal creeks. The oysters remove algae (that contain nitrogen and phosphorous) and sediment from the water though this method of reducing pollutants is not yet recognized as a valid BMP in the Chesapeake Bay Model. It is hoped that this BMP will be recognized in future years. Stream restoration projects are more expensive in nature ($150/ linear foot) than other storm water management measures. State and Federal Grant funding will be sought to implement stream restoration projects. Section III: Calvert County’s 2012-2013 Milestones The County’s 2012-2013 milestone goals are to:
Pass septic system upgrade legislation, requiring: All new septic systems within the Critical Area as per State law to be nitrogen-
removing systems and require further that these systems have a nitrogen removing efficiency of at least 69%
All new systems outside the Critical Area to be advanced systems with a nitrogen removal efficiency of at least 69%
All repairs of failed systems (about 1.9%/year) to use advanced systems with a nitrogen removal efficiency of at least 69%
All septic systems at “time of sale” (about 5%/year) to be upgraded to advanced systems with a nitrogen removal efficiency of at least 69%
Pass a stormwater management impact fee to create a stormwater utility Complete ENR upgrade at the Chesapeake Beach Wastewater Treatment Plant Hire five (6) additional staff people to implement the septic system upgrade and stormwater
management aspects of the Phase II WIP. Resolve the septic system “50%” credit issue with EPA and the Chesapeake Bay Program, so
that the County receives the accurate credit of 69% nitrogen reductions for upgraded septic

16
systems; and the ability to receive 93% reduction credit if the County implements the requirement for septic systems to have 93% nitrogen reduction capabilities.
Apply for Federal and State grants to conduct stream restoration projects.
Section VI: Calvert County’s Tracking, Verification and Reporting Methods
Water Quality Monitoring. The County will monitor the Phase II WIP implementation by utilizing its existing water quality monitoring program (in existence for 24 years, 1987-1988 and 1990-2011) in 10 locations within Mill Creek; and from stations in nine (9) tributaries, 6 located in the lower Patuxent River drainage (Helen Creek, St. Leonard Creek, Island Creek, Battle Creek, Hunting Creek and Hall Creek) and 3 in the Chesapeake Bay Drainage (Fishing Creek, Plum Point Creek and Flag Harbor). Sampling in the 9 tidal tributaries has been in existence for 1-3 years. The Calvert County Board of County Commissioners has provided the University of Maryland Center for Environmental Science, Chesapeake Biological Laboratory (UMCES CBL) with funding to conduct this water quality monitoring. The focal point of these studies was to measure the variables that best indicate stress to an estuarine system (oxygen in bottom waters and algae pigments - chlorophyll-a) due to increased development and recreational activity. Variables measured included chlorophyll-a, temperature, water column clarity, dissolved oxygen concentrations and salinity. . Section V: Identification of Technical Discrepancies Septic System Nitrogen Credit: As discussed in the septic system upgrades portion of the County’s Phase II WIP Strategy, Maryland’s Assessment Scenario Tool (MAST) gives a 50% reduction in nitrogen load credit per upgraded septic system. However, the advanced systems being installed via the County BRF Program achieves 69% nitrogen reduction. The County will seek approval from EPA and the Chesapeake Bay program to receive 69% denitrification credit. The County possesses the scientific data to verify the findings and make the argument. In addition, the County has utilized, on a limited basis, a septic system that achieves 93% denitrification, and has the scientific data to verify such findings. The County will pursue, simultaneously in its pursuit to receive a 69% credit, approval to receive 93% credit per unit that achieves a 93% reduction in nitrogen. Table 7 shows the comparable loading reductions achieved using:
The 50% reduction allowed in MSAT A 69% reduction based on our current and proposed future programs A 93% reduction if the County were to require 93% nitrogen removing septic systems in the
future Septic System Connections to WWTPs Utilizing Land Application: Additionally, the County proposes to explore connecting a potential 683 residential septic systems and three (3) non-residential septic systems to WWTPs. However, commercial septic system connections to WWTPs (i.e. Calvert County Industrial Park) provides the County with no additional “credit” even though there will be water quality benefits. Recognizing that this is a double edged sword because commercial septic system loadings are not counted against the County, the County’s

17
feasible options for addressing nonpoint source loads is limited due to MAST’s inability to credit and account for such measures. Land Use Categories in MAST: The current land use categories in MAST lack details that provide a more accurate measurement of impervious surface, which impacts the accuracy of assessing stormwater management BMP implementation needs to meet urban loading goals. MAST should incorporate land uses that better reflect land uses used in the discipline of planning, and incorporate more accurate impervious surface ratios associated with the different types of land uses (e.g. low, medium and high density residential land uses, light and heavy industrial land uses, commercial and retail land uses, etc.) Ground Truthing MAST Numbers with County Numbers: MAST’s inventory and location of septic systems needs to be verified. The County identified a discrepancy in the number of septic systems within the County and their locations (inside the Critical Area versus outside the Critical Area, within 1,000 feet of a stream, etc.). The County using a more complete stream GIS layer, found a greater % of septic systems outside of the Critical Area but within 1,000 ft of a stream that those outside the Critical Area but beyond 1,000 ft of a stream. MAST’s inventory shows the opposite result.
i Calvert County Draft Comprehensive Water and Sewer Plan 2011, Table 10, pg.71. ii Calvert County Comprehensive Water and Sewer Plan 2011, Table 10, pg. 72.
iii Calvert County Draft Comprehensive Water and Sewer Plan 2011, Table 10, pg. 72.