1 3 samantha
23
MARKET INEFFICIENCY: “THE NEW FINANCE” INVESTMENT FINANCE UNIVERSITY OF KWAZULU- NATAL SCHOOL OF ECONOMICS AND MANAGEMENT DURBAN 4001 SAMANTHA BUSHELL (201501549) Date Submitted: 9 March 2004. Henry Mkhize Topic 1.3: “The New Finance” - 1 -
-
Upload
independent -
Category
Documents
-
view
0 -
download
0
Transcript of 1 3 samantha
MARKET INEFFICIENCY:“THE NEW FINANCE”
INVESTMENT FINANCE
UNIVERSITY OF KWAZULU- NATALSCHOOL OF ECONOMICS AND MANAGEMENT
DURBAN4001
SAMANTHA BUSHELL(201501549)
Date Submitted: 9 March 2004.Henry Mkhize
Topic 1.3: “The New Finance”
- 1 -
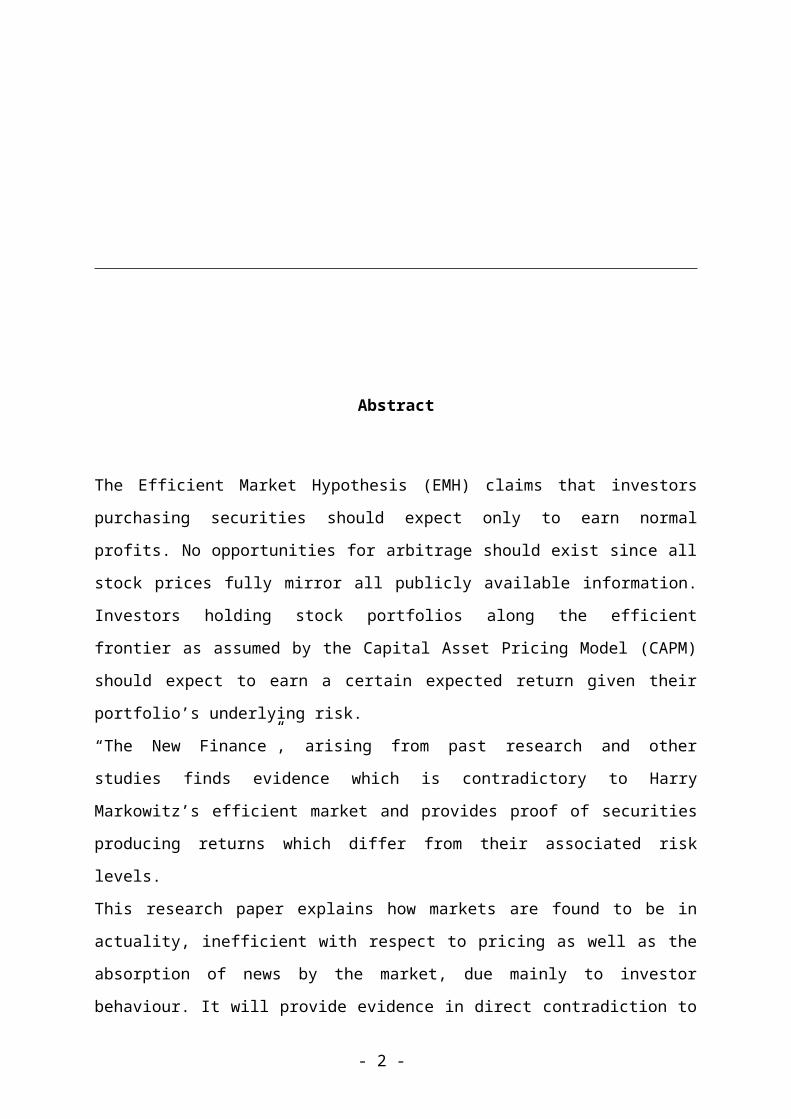
Abstract
The Efficient Market Hypothesis (EMH) claims that investors
purchasing securities should expect only to earn normal
profits. No opportunities for arbitrage should exist since all
stock prices fully mirror all publicly available information.
Investors holding stock portfolios along the efficient
frontier as assumed by the Capital Asset Pricing Model (CAPM)
should expect to earn a certain expected return given their
portfolio’s underlying risk.
“The New Finance”, arising from past research and other
studies finds evidence which is contradictory to Harry
Markowitz’s efficient market and provides proof of securities
producing returns which differ from their associated risk
levels.
This research paper explains how markets are found to be in
actuality, inefficient with respect to pricing as well as the
absorption of news by the market, due mainly to investor
behaviour. It will provide evidence in direct contradiction to
- 2 -
the EMH as well as the CAPM by giving details on the nature of
investor overreaction, the subsequent mispricing of securities
and the speed at which the stock market adjusts to news and
announcements. It will discuss the tendency of investors to
place great importance on the past earnings and performance of
certain stocks and the positive link which exists between this
past performance and future expectations by individuals. This
is an obvious violation of the EMH. I will also introduce
growth and value stocks and how their respective prices and
returns are affected by stock market expectations. Results
show value stocks, outperforming growth stocks, the supposed
“winner” stocks on more than one occasion.
Market Inefficiency: The New Finance
TABLE OF CONTENTS
Page Number
- 3 -
Abstract1. Introduction
22. The EMH and the CAPM – Realistic Models?
3 3. The CAPM’s Prediction in Terms of Growth and Value Shares
4 3.1Actual Performance of Growth and Value Shares
43.2 Implications for the Market
6 3.2.1 Mispricing6
3.2.2 A Contrarian Investment Strategy6 3.2.3 Reversals/Corrections7 4. Investor and Market Behaviour 7 4.1 Overreaction 7 5. Anomalies 10 5.1 Sluggish Markets10 5.2 The Size Effect/January Effect10 6. Conclusion 11 7. Appendix A 12 8. References 13
- 4 -
1. Introduction
An efficient market is described by Basu (1977) as one in
which “security prices fully reflect available information in
a rapid and unbiased fashion” (p.663). Share prices therefore
provide a true reflection of the intrinsic value of a firm,
providing shareholders and investors with an understanding of
their portfolio’s true worth. Since all publicly available
information is, according to the Efficient Market Hypothesis
(EMH) immediately embedded into share prices, there are no
exploitable opportunities for investors to take advantage of.
This is because all share prices are accurately priced and
arbitrage occurs only when there is a mispricing of
securities. The rule stating how assets should be priced is
known as the Capital Asset Pricing Model (CAPM) (Bodie, Z et al,
2002). The CAPM asserts a certain relationship to exist
between an assets’ level of expected return and its risk
(Bodie, Z et al, 2002). In other words an investor can expect to
earn a specific return, given the assets underlying level of
- 5 -

risk. The CAPM thus predicts value shares to earn relatively
lower returns since these shares contain relatively lower
levels of risk. The opposite is true for growth shares, where
high-risk levels associated with these shares command a
related high return. However, evidence has shown that this
positive relationship between risk and return does not
necessarily hold in the stock market. Research shows low-risk
shares (value shares) to be in fact, generating superior
returns. Correspondingly high-risk shares (growth shares) are
found to be earning relatively lower returns (Haugen, 1995).
Haugen (1995) attributes this violation of the CAPM to
inefficient stock market behaviour in which investors
overreact to earnings announcements. Consequently, growth and
value shares become mispriced as investors misinterpret good
or bad news. As a result growth and value shares become an
area of exploitation by profit-seeking investors. This is an
obvious contradiction of the EMH. However, not only is there
evidence of the CAPM’s failure, there is also confirmation of
a sluggish market in that there are found to be “lags and
frictions” [Basu, 1977 (p.681)] as the market attempts to
correct itself. Studies are showing increasing evidence that
markets may not be as efficient as previously thought. This
has a significant impact on expected returns for investors and
may, as a result change the mindsets of many individual and
institutional investors with respect to their portfolio
allocation decisions for the future.
- 6 -
2. The EMH and the CAPM – Realistic Models?
As discussed above, the EMH proposes the swift incorporation
of available information into share prices. It does not
allow for the possibility of abnormal profits to be
generated since prices are assumed to reflect a firm’s true
underlying value and there is therefore no room for excess
returns to be earned [Basu, 1977 (p.663)]. The instantaneous
adjustment of share prices to new information, in an
efficient market represents a neutral expectation for earnings
in the future (Bernard and Thomas, 1990). There is assumed
to be no relationship between past and future earnings
(Bernard and Thomas, 1990). The EMH dismisses the ability of
investors to earn excess returns based on past earnings
performance as this information has supposedly already been
included in the share’s price. Bernard and Thomas (1990)
however find evidence in direct contradiction to this. They
found that security prices to an extent represented a naïve
earnings expectation. In violation of the EMH, future
earnings were expected by investors to be the same as the
previous year’s earnings (Bernard and Thomas, 1990). This
has severe implications for the efficiency of the market.
The focus by investors on past earnings will be discussed at
a later stage in this paper.
Stout (2003) finds further discrepancies with respect to the
validity of the EMH. A market is described as efficient when
prices completely mirror publicly available information.
- 7 -
Stout (2003) argues that it is not always possible for every
investor to obtain and comprehend all publicly available
information. It can also be expensive to acquire and
administer. Therefore we can deduce that security prices may
not accurately reflect the market’s actual understanding of
the released news, which may further imply that share prices
are not a true reflection of their intrinsic value. Stout
(2003) goes on further to explain that even if the market
were efficient enough to adjust to new information
immediately, it wouldn’t necessarily mean that the market
would represent that information accurately.
Stout (2003) similarly doubts the reality of the CAPM’s
assumptions. The CAPM presumes that all investors have
homogenous expectations in terms of future returns and risk.
She disagrees with this supposition; arguing that investors
are not identical and do not always hold the same view
regarding the true value of a certain share. Investors are
found to disagree and have different opinions about shares
as well as their future outlook
(Stout, 2003). Her argument implies that not all investors
hold portfolios along the efficient frontier, as the CAPM
assumes everyone to do. This means that the market index
cannot be efficient, since it is the aggregation of every
investor’s portfolio along the efficient frontier that makes
up a market index, for example the S&P500 (Haugen, 1995).
Haugen (1995) concurs, finding the CAPM to be a “highly
inaccurate depiction of reality” (p.117).
- 8 -
3. The CAPM’s Prediction in Terms of Growth and Value Stocks
Growth shares have high market - book ratios, indicating a
relative high price in relation to their fundamental, book
value. The market expects these shares to grow at a faster
than average growth rate (Bodie, Z et al, 2002). Value shares
correspondingly are expected to grow at a below average rate
and have low market-book ratios. The CAPM prescribes growth
shares, with their high investor expectations to be risky
and therefore attaches a higher relative expected return to
them. The opposite is true for value shares with their low
market expectations and hence lower volatility. Value shares
have a lower expected return in line with the CAPM’s
prediction.
3.1 Actual Performance of Growth and Value Stocks
Numerous studies, research papers and articles have shown
evidence of value shares outperforming growth shares (the
supposed “winners”), earning above average profits (Haugen,
1995). Growth shares have been found to often disappoint
investors by performing relatively worse compared to value
shares. American and South African evidence support these
findings. Apppendix A provides the total returns of growth
and value shares in the Vanguard Index. The appendix also
shows local South African performance of Investec’s growth
and value funds. Featured on the following page are graphs
- 9 -
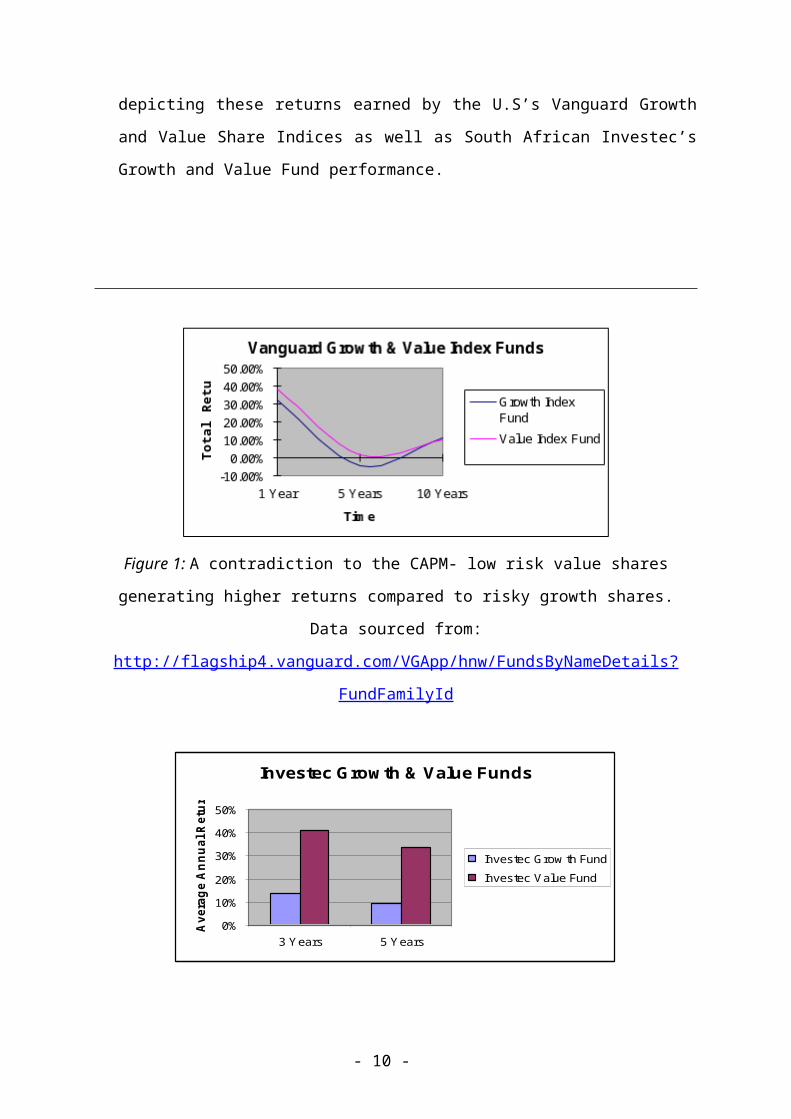
depicting these returns earned by the U.S’s Vanguard Growth
and Value Share Indices as well as South African Investec’s
Growth and Value Fund performance.
Figure 1: A contradiction to the CAPM- low risk value shares
generating higher returns compared to risky growth shares.
Data sourced from:
http://flagship4.vanguard.com/VGApp/hnw/FundsByNameDetails?
FundFamilyId
Investec Grow th & Value Funds
0%
10%
20%
30%
40%
50%
3 Years 5 Years
Averag
e An
nual Return
Investec Grow th Fund Investec Value Fund
- 10 -

Figure 2: South African evidence supports international
findings.
Data sourced from:
http://www.investecfunds.co.za/sa_retail
Similarly, Basu’s (1977) empirical evidence gives results
contradictory to the CAPM. He found that higher levels of
return are not linked with a correspondingly higher level of
systematic risk for a portfolio. This conclusion was reached
after discovering the higher returns generated by low PE
(Price-Earnings) ratio portfolios (value shares) were not
linked with higher levels of risk (Basu, 1977). The Jensen
measure – a measure of excess return in comparison to the rate
of return as predicted by the CAPM (Bodie, Z et al, 2002) shows
two
value share portfolios to have produced returns of 4,5% and 2%
per annum respectively. These rates of return are higher than
what is inferred by the underlying levels of risk inherent in
these portfolios [Basu, 1977 (p.667)]. Similarly, growth share
portfolios generated a 2,5-3% per annum return – less than what
they should have been given their underlying levels of risk
[Basu, 1977 (p.667)]. These results are in obvious violation
of the CAPM. Haugen (1995) echoes this when he states the CAPM
relationship between risk and return to have been “turned
upside down” (p.87) with the less volatile value shares
earning the highest return. As a result, share prices are
- 11 -
considered by many, including Basu (1977) to be “biased”
(p.663) due to shares earning returns which differ from what
their primary risk levels prescribe.
3.2 Implications for the Market
The world of security prices, having been “turned upside down”
[Haugen, 1995 (p.87)] has serious implications for the market.
I will discuss the three main effects below:
3.2.1 Mispricing
As discussed above, investors have an extremely unrealistic
expectation of the future earnings of their shares being a
reflection of the past earnings of that share for the
comparable time period of the previous year (Bernard and
Thomas, 1990). This would suggest that PE information is not
being fully integrated into share prices as effectively or
accurately as previously thought (Basu, 1977). As a result,
share prices cannot truly reflect a correct indication of a
shares intrinsic value. This means a share may be found to be
under or over valued, resulting in the creation of profitable
opportunities for investors. Obviously share prices being
under or over valued is not consistent with the EMH.
3.2.2 A Contrarian Investment Strategy
With the under and over valuation of securities, an obvious
profitable opportunity for investors exists. The contrarian
investment strategy involves the acquisition of shares which
- 12 -
have performed poorly in the past (value shares) and selling
growth shares, having performed well in the past (Chan, 1988).
According to Chan (1988) profitable opportunities exist since
undervalued shares (value shares) represent a “bargain” to
investors and recent market evidence has suggested that these
shares outperform overvalued growth shares, providing
investors
with a gainful profit margin. Profits are obtained when share
prices are corrected and revert back to their true worth
(Chan, 1988). A contrarian investor, having acquired value
shares at
their undervalued prices can expect to receive an excess
return and it is this clear success of the contrarian
investment strategy that has led many researchers to believe
that the stock market does in fact, overreact (Chan, 1988) and
that the certain securities studied are inappropriately
priced.
3.2.3 Reversals/Corrections
The success of the contrarian investment strategy depends the
market recognising investor overreaction and revising share
prices to their true intrinsic value. The exploitation of
under and over valued shares and the subsequent profits that
are earned implies that the stock market has acknowledged its
prior overreaction and has now corrected prices back to their
original values. As Lo (1997) states, “what goes up must come
down” (p.xvii) and this is precisely how contrarian profits
- 13 -
are generated. Once again, we see the real world workings of
the stock market and how it does not correlate with capital
market theory.
4. Investor and Market Behaviour
4.1 Overreaction
As we have already seen, stock markets do not always behave in
the way they are meant to in terms of the EMH and CAPM. Stout
(2003) attributes this to “human emotion” (p.31) and discusses
this impact on investment decisions. As previously mentioned,
investors differ with respect to their perceptions regarding
the future (Stout, 2003). Their inconsistent perspectives of
the actual worth of a share (Stout, 2003) means that share
prices are not as accurate a depiction of actual value as the
EMH pertains. Overreaction by investors and the market stems
from the overemphasis that is placed on past performance
(Haugen, 1995).
Psychologists find that people tend to base their future
prospects on the past performance of shares held in their
portfolio (Stout, 2003). The market, observing excess returns
generated on growth shares in the past, develop high
expectations of these shares believing growth will be above
average once again in the future (Haugen, 1995). The market,
however, is incorrect in believing excess returns will continue
to be earned long into the future (Haugen, 1995). This
- 14 -
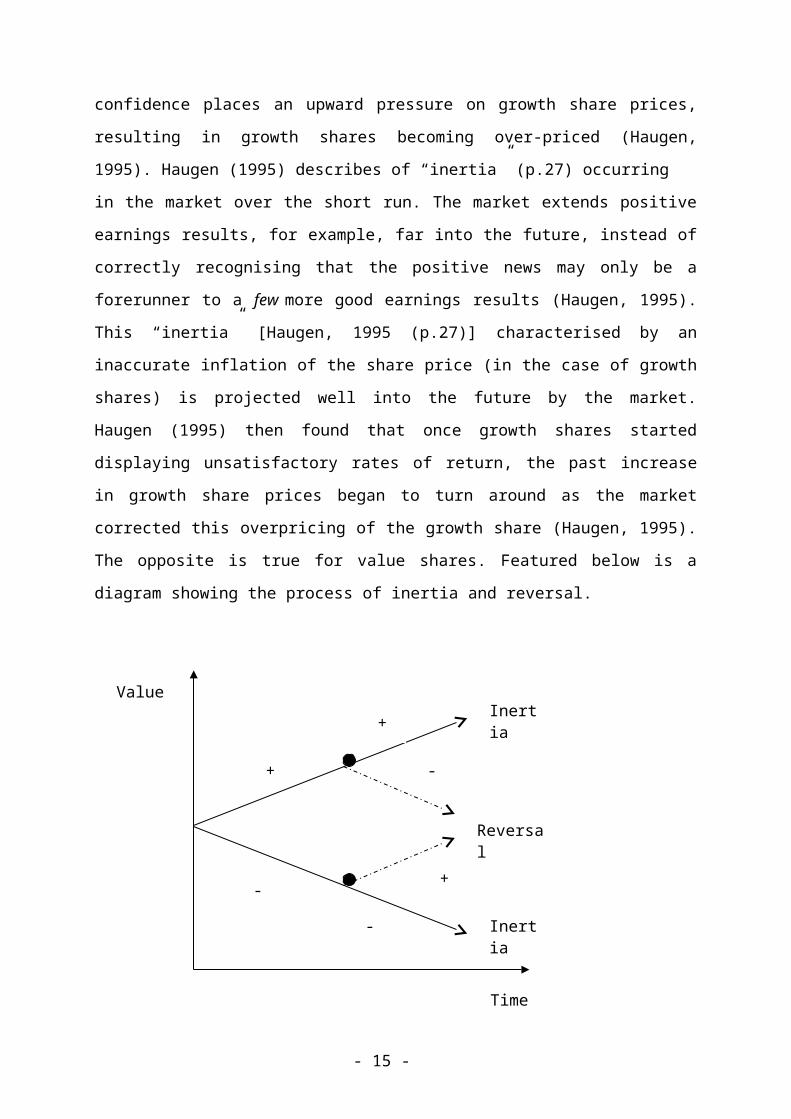
confidence places an upward pressure on growth share prices,
resulting in growth shares becoming over-priced (Haugen,
1995). Haugen (1995) describes of “inertia” (p.27) occurring
in the market over the short run. The market extends positive
earnings results, for example, far into the future, instead of
correctly recognising that the positive news may only be a
forerunner to a few more good earnings results (Haugen, 1995).
This “inertia” [Haugen, 1995 (p.27)] characterised by an
inaccurate inflation of the share price (in the case of growth
shares) is projected well into the future by the market.
Haugen (1995) then found that once growth shares started
displaying unsatisfactory rates of return, the past increase
in growth share prices began to turn around as the market
corrected this overpricing of the growth share (Haugen, 1995).
The opposite is true for value shares. Featured below is a
diagram showing the process of inertia and reversal.
- 15 -
Value
+
+ Inertia
Inertia
Reversal
-
-
-
+
Time
FFF
Where: “+” denotes an upward pressure on prices
“-“denotes a downward trend on prices.
The black dots represent market correction of past
over/underpricing.
Studies undertaken, investigating whether or not there is in
fact a link between past and future growth, provide evidence
to the satisfaction of the EMH: that there is no correlation
with respect to growth of earnings between a future period and
the period preceding it (Haugen, 1995). Investors would well
be taken advice of this – recent achievements are not
equivalent to prolonged success in the future (Haugen, 1995).
However, while researchers are aware of this academic fact, it
is another aspect altogether what the market base their
investment decisions on.
As previously discussed, the mispricing of shares and the
ultimate performance of growth and value shares can be
ascribed to investor emotion and perception. The high
expectations placed on growth shares to outperform in the
future drives up their prices, resulting in them becoming
overpriced. Investors purchasing growth shares pay an
extremely inflated price and when returns turn out to be
disappointing and the market corrects itself, adjusting price
downward so that price is equivalent to intrinsic value,
- 16 -
Time
Figure 3: Extracted andadapted from Haugen (1995)
investors realise a loss. Much research verifies this
“overreaction hypothesis” as described by Chopra, N et al (1992)
(p.804) where value share portfolios are found time and again
to outperform growth share portfolios. Chopra, N et al (1992)
discovered prior “losers” (p.804) to have generated a return
of 25% more than the prior “winners” (p.804). Haugen (1995)
found in a study that value shares outperformed growth shares
as well as the S&P500, a well-known market benchmark (p.60).
Studies of the long-term behaviour of share returns provide
evidence of something called the “fads hypothesis” [Bodie, Z et
al, 2002 (p.358)]. This hypothesis finds that overreaction
often occurs to certain significant news. This overreaction,
according to Bodie, Z et al (2002) results in “positive serial
correlation” (p.358) - meaning positive returns on a share are
inclined to be repeated and negative returns are also
recurring. The “fads hypothesis” asserts that this occurs over
the short term; however the hypothesis finds that over the long
run, negative serial correlation prevails. This means that
negative returns or below average returns follow on from
positive returns (Bodie, Z et al, 2002). The “fads hypothesis”
concurs with empirical evidence in that past abnormal profits
generated by growth shares do not continue into the future, as
expected by investors. Instead, below average returns are
earned and investors realise losses, as they sell their growth
shares assisting the market in correcting itself. Value
shares, on the other hand, enjoy excess returns as high
returns follow on from low returns and value stock investors
find themselves outperforming their growth stock counterparts.
- 17 -
5. Anomalies
Anomalies are described by Lo (1997) as a “regular pattern in
assets returns which (are) reliable, widely known and
inexplicable” (p.xviii). These anomalies serve as a direct
contradiction to the EMH’s principals, yet they continue to
play a part in today’s capital markets. Discussed below are
two observed market anomalies:
5.1 Sluggish Markets
Market efficiency hinges on the rapid adjustment of new
information into share prices. It is this speed of adjustment
that ensures that no arbitrage opportunities come into
existence. However, research has uncovered this anomaly
whereby prices, in fact react slowly to earnings announcements
(Bodie, Z et al, 2002). It has been found that following a good
earnings announcement, the particular share’s excess return
remains on its upward growth trend. The continued increase in
growth of these abnormal returns highlights the markets gradual
adjustment of price in response to the earnings announcement
(Bodie, Z et al, 2002). The implication of the sluggish nature
of price adjustment in the market is obviously that profitable
opportunities exist: Bodie, Z et al (2002) point out – one could
earn positive profits simply by purchasing the said portfolio
of shares once the earnings have been announced. Such an
investment strategy would earn abnormal returns due to the
market’s slow reaction and the continued period of high
- 18 -
returns that subsequently ensues. This should not be possible
in an efficient market (Bodie, Z et al, 2002).
5.2 The Size Effect/January Effect
This phenomenon as described by Lo (1997) is whereby small
firm portfolios are observed to outperform large firm
portfolios significantly over the new year (Lo, 1997). It is
believed that small cap shares are relatively riskier than
larger cap shares. However, Bodie, Z et al (2002) found that
even with these small cap shares being adjusted for risk,
there was still a considerable profit being earned by small
cap shares compared to the larger cap shares (Bodie, Z et al,
2002). A theory behind this odd occurrence is that a lot of
selling occurs during this period, with investors getting rid
of poor performing shares in an attempt to reduce their
realised losses before the tax year-end. These investors do
not transfer their
profits back into the market by acquiring other shares until
January. There subsequently ensues a surge of demand for
shares, driving prices upward (Bodie, Z et al, 2002).
6. Conclusion
Years of research and articles still haven’t concluded whether
or not the market is indeed efficient (Lo, 1997). The “upside
down” [Haugen, 1995 (p.87)] world of security pricing has led
- 19 -
many economists and researchers to question the validity of
the CAPM. Vibrant, risky, growth shares are seen to generate
below average returns and unexciting value shares high returns
(Haugen, 1995). This is in direct opposition to what should be
occurring. The CAPM predicts that a share’s expected return is
in direct correlation to its underlying risk, namely that
risky shares should enjoy relatively higher returns and the
opposite should be true for value shares. Haugen (1995) cites
the CAPM as being a “highly inaccurate depiction of reality”
(p.117). He believes that the foundation of the CAPM’s demise
is the failure of an efficient market. The sluggishness of
price adjustments to new information; mispricing of shares as
a result of investor overreaction and behaviour as well as the
evident profitability of a contrarian investment strategy has
led many to doubt the efficiency of the stock market. Stout
(2003) finds room for further research into the workings of
the market and highlights three areas of further study: a
“heterogenous pricing model” (p.40), which explains actual
market behaviour; arbitrage opportunities; and a detailed
investigation into the speed with which the market integrates
news into prices. She asserts that research into these three
areas may help us understand some market anomalies. The
efficiency of the market is liable to be a subject of great
discussion and research for a while to come. There is still
great debate amongst economists as to the reasons behind
certain anomalies and this only serves to provide a further
incentive for additional study into this area of finance
economics.
- 20 -
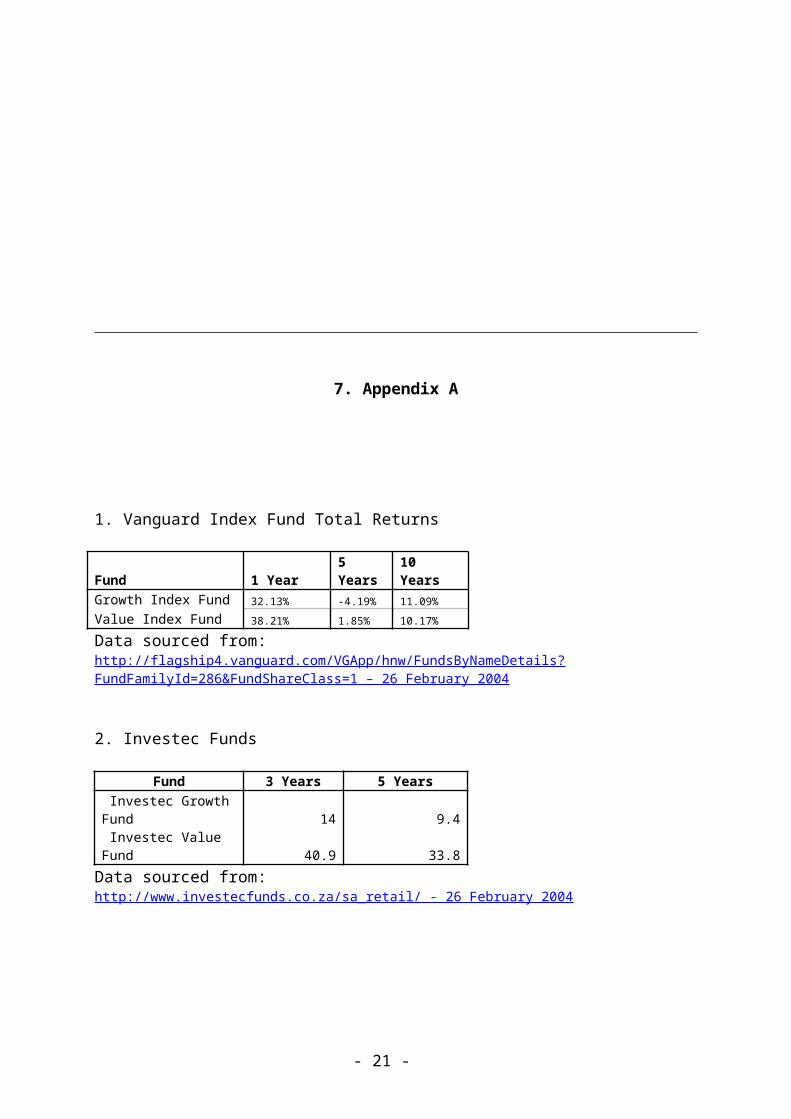
7. Appendix A
1. Vanguard Index Fund Total Returns
Fund 1 Year5 Years
10 Years
Growth Index Fund 32.13% -4.19% 11.09%Value Index Fund 38.21% 1.85% 10.17%
Data sourced from:http://flagship4.vanguard.com/VGApp/hnw/FundsByNameDetails?FundFamilyId=286&FundShareClass=1 – 26 February 2004
2. Investec Funds
Fund 3 Years 5 Years Investec GrowthFund 14 9.4 Investec Value Fund 40.9 33.8Data sourced from:http://www.investecfunds.co.za/sa_retail/ - 26 February 2004
- 21 -

8. References
Basu, S. (1977) Investment Performance of Common Stocks in Relation to Their Price – Earnings Ratios: A Test of the Efficient Market Hypothesis. Journal of Finance, XXXII (3), June, 663-82.
Bernard, V and Thomas, J. (1990) Evidence that Stock Prices donot fully reflect the Implications of Current Earnings for Future Earnings. Journal of Accounting and Economics, 13, 305 – 40.
Bodie, Z et al. (2002) Investments. New York, McGraw – Hill Irwin.
Chan, K. (1988) On the Contrarian Investment Strategy. Journal of Business, 61(2), 147-63.
Chopra, N et al. (1992) Measuring Abnormal Performance: Do StocksOverreact? Journal of Financial Economics, 31, 235-68.
- 22 -

Haugen, R. (1995) The New Finance: The Case Against Efficient Markets. Prentice – Hall Inc.
Lo, A (ed) (1997) Market Efficiency: Stock Market Behaviour in Theory and Practice. Volume II, The International Library of Critical Writings in Financial Economics. Edward Elgar Publishing Limited.
Stout, L. (2003) The Mechanisms of Market Inefficiency: An Introduction to the New Finance. UCLA School of Law and Economics. Research Paper No. 03-23. Social Science Research Network Electronic Library. Available from: http://ssrn.com/abstract=470161 (Accessed 24 February 2004).
Websites:Vanguard Index Fund Performance. Available from: http://flagship4.vanguard.com/VGApp/hnw/FundsByNameDetails?FundFamilyId=286&FundShareClass=1 (Accessed 26 February 2004).
Investec Growth and Value Performance. Available from:http://www.investecfunds.co.za/sa_retail/ (Accessed 26 February 2004).
- 23 -


![1-{( E )-[3-(1 H -Imidazol-1-yl)-1-phenylpropylidene]amino}-3-(2-methylphenyl)urea](https://static.fdokumen.com/doc/165x107/6324d53685efe380f30663d5/1-e-3-1-h-imidazol-1-yl-1-phenylpropylideneamino-3-2-methylphenylurea.jpg)