1 016.545 - ERIC
409
ED 233'665 AUTHOR TITLE INSTITUTION PUB DATE NOTE PUB TYPE EDRS PRICE 10.DESCRIPTORS 1 DOCUMENT RESUME. 1 1 016.545 Green; Diana M., Ed. Doing Institutional Research: A Focus on Professional Development. Papers from the Annual Meeting of the North ,East Association for Institutional Research, (9th, Durham, New Hampshire, October 17-1g, 1982). North East Association forInstitutional Research. Oct 82 . s 422p. Collected Works - Conference Proceadin9s (021) -- Viewpoints (120) Reports - Deicriptive (141) MF01/PC17 Plus Postage,. Academic Persistence; Career Choice; *College Faculty; *College Students; Computer Oriented ( Programs; Databases; Department Heads; Educational Finance; *Educational Planning; Eillbllment Projections; Higher Education; *Institutional Research; Microcomputers; *Odtdomes of Education; *Professional Development;.Reputation; Researchers; Surveys; Tenure ABSTRACT , Institutional research that foguses on professional . development is addressed in 35 papers from the 1982 meeting of the North East Association' for Institutional Research. Titles and authors include the following: "Modeling College Student Adjustient and' Retention for the Individual Institution" (Norman p. Aitken); "The . Development Saga of an Institutional Research Database at a State College" (Edward L. Delaney); "Projecting Enrollments at Small. Colleges (The Role of the Institutional Researcher)" (Randall, Drapery; "A Model of University Tenure Decision-Making: Some Additional Results" (Winship C. Fuller, Susan, Goodwin); "Microcomputers in Institutional Research" (Leah R. Hutten); "Strategic Planning: Working with-Department Chairs" (Antoinette IadarOla); "The Design and Implementation of an Evening Student Survey: Methodological Issues and Practical Considerations" (Linda Lyons); "-Developing a Composite of Iutitutional Reputaiion and Assessing Its,Impadt upon Selected aftdent Behaviors" (John P.', Mandryk); "Improving Faculty Use of Student Outcomes InformatiOn" (Sidney S. Micek); ''Sexual -Inequity in Career Choice: How Cam Colleges Help?" (Jean'V. Morlock); and "Comparative Fiscal Analysis in Nigher Education" (David L./Rumpf)4. 4SW) Mb- 41111k a. ***************************** *******.***4*************i************** eReproductions supplied by EDRS are the best that can be made from the original document. *********************************************************************** .0 *-,.
-
Upload
khangminh22 -
Category
Documents
-
view
0 -
download
0
Transcript of 1 016.545 - ERIC

ED 233'665
AUTHORTITLE
INSTITUTIONPUB DATENOTEPUB TYPE
EDRS PRICE10.DESCRIPTORS
1
DOCUMENT RESUME. 1
1 016.545
Green; Diana M., Ed.Doing Institutional Research: A Focus on ProfessionalDevelopment. Papers from the Annual Meeting of theNorth ,East Association for Institutional Research,(9th, Durham, New Hampshire, October 17-1g, 1982).North East Association forInstitutional Research.Oct 82 .
s 422p.Collected Works - Conference Proceadin9s (021) --Viewpoints (120) Reports - Deicriptive (141)
MF01/PC17 Plus Postage,.Academic Persistence; Career Choice; *CollegeFaculty; *College Students; Computer Oriented (Programs; Databases; Department Heads; EducationalFinance; *Educational Planning; EillbllmentProjections; Higher Education; *InstitutionalResearch; Microcomputers; *Odtdomes of Education;*Professional Development;.Reputation; Researchers;Surveys; Tenure
ABSTRACT,
Institutional research that foguses on professional .
development is addressed in 35 papers from the 1982 meeting of theNorth East Association' for Institutional Research. Titles and authorsinclude the following: "Modeling College Student Adjustient and'Retention for the Individual Institution" (Norman p. Aitken); "The .Development Saga of an Institutional Research Database at a StateCollege" (Edward L. Delaney); "Projecting Enrollments at Small.Colleges (The Role of the Institutional Researcher)" (Randall,Drapery; "A Model of University Tenure Decision-Making: SomeAdditional Results" (Winship C. Fuller, Susan, Goodwin);"Microcomputers in Institutional Research" (Leah R. Hutten);"Strategic Planning: Working with-Department Chairs" (AntoinetteIadarOla); "The Design and Implementation of an Evening StudentSurvey: Methodological Issues and Practical Considerations" (LindaLyons); "-Developing a Composite of Iutitutional Reputaiion andAssessing Its,Impadt upon Selected aftdent Behaviors" (John P.',Mandryk); "Improving Faculty Use of Student Outcomes InformatiOn"(Sidney S. Micek); ''Sexual -Inequity in Career Choice: How CamColleges Help?" (Jean'V. Morlock); and "Comparative Fiscal Analysisin Nigher Education" (David L./Rumpf)4. 4SW)
Mb- 41111k
a.
***************************** *******.***4*************i**************eReproductions supplied by EDRS are the best that can be made
from the original document.***********************************************************************
.0
*-,.

e
41,
tt
DOING INSTITUTIONAL RESEARCHt
A focog on Professional Development
a
Papers from the Ninth Annual Meeting
of the
North East Assbciaton for InstitutiOnl Resiirch
"PERMISSION TO REPROOUCE T141$
MATERIAL HAS BEEN GRANTED BY
TO THE EDUCATIONAL RESOURCES
INFORMATION CENTER IEFUC)"
New England Center
Durham, New Hampshire,
October 17-19, 1982
4
C
rI
4
Hat
444
4 O
%
U.S . DEPARTMENT OF EDUCATION 0.-WIDOW% INSTITUTE OF EDucm$014'4,11-'
Eat/CATO AL RESOURCES INFORMATION ,CENTER WHO
document has been eptoduced as-Iecenved from the person or organtsgelonomahnortMmOr changes ham boon made to unontereproduction qualm,
Pants of wow Or oomtotts stated m this dalmeat do not neoeSsanly represent ottoatIME
poSItiOn a POACY
If

,
, 1
PREFACE
The Ninth Annual conferencebf the North East Association for institd-:
tfan;-1-Researchwo held October 17-19, 1982, it the NeEngland Center,
Durham, New Hampshire. The conference theme, "Doing institutional Researa:,
A Focus on Professional 'Development" drew,167:Oarticipants..'
The Call or Papers produCed a large number of proposals, which Made
. possfble,a wide variety of topics and presentaiiqn"formats.. The program
consisted of one-symposium, thr4Oprofessionaldevelopment semiears,,fiVe.
panels, and 38 paper presentations. The three workshops wtre well attended,
and provided an opportunity for members to choose among attractive alterna-
'tives. l'he Conference Evaluation-indicatedkan increase in the "pertinence of
pager presentations," a tribute to thoie whq have contributed their work for
others to shire.
John McCredie presented a' relevant keynote address on Sund4Y.,evening.
Mr. McCredie is,President of EDUCOM and an active institutional researcher.
He scribed various strategies for campus computing; drawing on recent cow,
, prehenVi-ve studies at'a numbet of iffelont institutions.
We hope that ydu will find the material in the Ninth Proceedings to
be stimulating and informative. in reading the reports you may see some
.references to appended materials that are-not included, The need to keep the
papers within certain page limitations precludes the inclusion of excessive
tables, copies of questionnaires, etc. .Please feel free to contact the
individuals who submitted the paper's for this additional information.
° The Association'is grateful to Bob Lay (Boston College) for his excel-
lent job as Chairof the Conference Program Committee.- John Kraus, Local.
Arrangements Chair (University of New Hampshire) and his able staff were
'responsible for a particularly well run conferenCe.
The papers included in the Proceedings are those submitted for publica-
tion and do not cover all thepreSentations made at the conference. -Appreci-
Nation is due all who contributed their time as moderators, presenters,.and
, 'panelists.
The.final form of the Proceedings ls.thanks to the efforts of Peter
Farago', Dave Bradley, Wendlp Lorap, Bob Lay, and Ed Delaney, who helped
rev* pipers for inclusion. Special commendation goes to Helen Rock, State
University of New York at Plattsburgh, who provided editorial assistance fdr
the third year in-a row.c
41.
Diana M. Green,'NEAIR Publications Chair
iii 3
,
1
e

ti
NNEA10,OFFICERS 1
.
148T-82,.%
,.
President:,
, Helen S. Want ,
.
- Director Of-Student Testing and Research4 0
4 ) Stateghtficersity of New Yorltat BuffaloI . .
Sdretary and -. '. Diana M. Green.;. .
, Publications Chair:,, ', Director aYInstitutional research ' .
'State Universtty ofitew York at Plattsburgha
TreaSurer:.s
.-
s .
-.
institutiOnal Planner and ReSearcher,,,
= i %Office of Institutional Planning and
:University'
,
.',v . . . ,...
'1982 -83'1982%.4
.
, .
President: Robert S..Lay ,.
Program. Director EirrolimenttManagement.ResearcbBoston Colle§e* .
. ..
.,
Secretary and'i Publications, Chair: 'Diana M. Green .
.Director of Institutional Research...
State UniverStty of New, York Ott Plattsburgh . - 4
r , ;
Treasurer: RichardC, }lea. .
Institutional.Planer and Researcher. , Office of Institutional Planning and Research
.
C91gate.UniversitY
.,-
iPrevious NEA4R Conference Proceedings ude:,_
' '' A. . C
1975 Coping in the ?Vs . ' , -.. 0126-818 .1976 Rational Decision Making and Political Realities ED146-773,1977 Does IR = Institutional RetrenchMent? . ED156-058 f1978. Institutional Research: Nqw Responses to New Demands D174-163 ..-
i979 Institutional Research and Creative - Change ED187-2221980 Institutional Researh.in the Decade Ahead: Enhancing. ED203-749
,
. , Performance '"'
4.
1981 Planning for QUality .
. .z..,ED222-103
f t0
1

1- . ..'''
1
t!,
. TABLE..
OF CONTENTS-.
TITLE.
NORMAN D..AITKEN : Modeling College,Studint Adjustment and.
Retention for,the,Individual Institution.,.
f,
KENNETH W. BORAS, G. GREGORY LOZIER - A Comparison of Minority and. Nonmi.nority Faculty Perceptions of Ca0eer Opportunities at '
Penn, State '
PAGE
11
'.DAVID W. BRADLEY.- Using MultidimentfonaT Scaling to Support
Competitor Analysisoand.rnstitutional Positioning 23
EDWARD L. DELANEY - The Development Saga of an InstitutionalResearch Database at a State College 35
RANDALL DRAPER - Projecting Enrollments at Small Colleges,(The Role of the Institutional Researcher) 42
JOHN-A. DUNN, Jr. - Institutional Support Costs: AComparative Study.
.
54
GLORIA J, DYER - Publication Usage Index (pa: A Quantitatile
-
\
Method of Eyaluating the'Publications'of science Faculty 64
PETER T. T. FARAGO"7 The Role of,lt.stitutional Researchers in LaborContract Administrations. 76, .
WINSHIP C, FULLER, SUSAN A. GOODW1W - A Model of'University TenureDecision-t making: Some Additional Results'
144LOREN GOULD - The RolqoftInstitutional Research-Initiatory or
Responsive ? .t 1' .. .
STEVEN H. GRATCH, LOUWM. SPIRO -"Access: The System That NeverHad A' Chance To Fail ..
.
.,
ROBERT F. GROSS -, Student 'Choices: Why Are Elective.Courses Electe'd7
JANE GROSSET, GRETCHEN BORIS - Improving the Quality of Data' Obtained Through'SUrvey% Research ,
4 ,
-MINALD 6. HESTER - Degree Patterns and Enrollment Trends' .
GAIL HOGAN, LARRY W. .METZGE/R.;Meas.uring the Impact of Proposed
Financial Aid Cuts:/'F -h Study is Always Too Late
0
108
118
130
143
156
'.LEAH R. HUTTEN MiCrocompUterein" Institutional Research,
ANTOIKETTEIADAROLA - Strategic Planning: Working With DepartmentChairs t ,s.
ALEXANDER i. JONES, DANIEL A. UPDEGROVE - Planning and Computing*
-167
'171
in The logical Seminaries A 190
V't
J

>
EDWARD Q JORDAN The Economia Contribution of the Consortium ofUniversities to the WaslIngton Metropolitan Area.
'A fINDA' LYONS - The Design and Implementation of an Evening StudentSurvey.: Methodological Issues and Practical Considerations
HE1Dt L. MAHONEY, SLAUKO F. MEDiNAC, BARBARA A: MEYER - HumanResource Planning: A Model for Establishing and ProjectiAttrition Rates Amongth'e Nori-Instructional,Staff of an .
Academic Institution
ng
JOHN P.. MANDRYK - Developing a Composite of InstitutionalReputation and Assessing its Impact Upon Selected StudentBehaviors 1
s. . . .
. , ..
A SIDNEY S. MICEK - Improving Faculty Use of Student Outcomes .
Information
'
'MICHAEL F. MIDDAUGH - Boundary Spanning: .A Conceptual Framework/ .for Examining the Organizational Role of.Affices of Institu-:
. tional research
JEAN V. MORLOCK - Sexual Inequity in Career Choice: How CanColleges Help?
JANYCE J. NAPORA - What Happens wixt the COp and the Lip;_Data to Information to Action--Data Development in aComplex Multi-Level Environment
,
JANYCE J. NAPORA - A Case Study of the Academic Planning
202:
Z14'
222
232I
241
252
266 ,
-
278
Process ...4, .
DONALD NUTTER, PAUL WING, SUSAN SILVERMAN - Estimating Net Cost ofCollege Attendance in New Yo'rk State .
RICHARD L. PASTOR - Student College Choice and Decision-Making
,
RICHARD PATTENAUDE - Carvino Op Paradise: Politics; Data and the.
g89.
307 ','
'322
. ,
4
.....
,
...
AllocatiOn of Academic Space \ .336
RONALD F. PERRY, FIUMBERTO F. GONCALVES - Enrollment Projection .
Models: Seeking Effective Predictor Variables 347 4
.
DAVID L. RUMPF - Comparative Fiscal Analysis in Higher.Education , 363
LXJIS M. SPIRO, JILL F: CAMPBELL - Breaking.the "ViciousCircle" of Decline After a,Faculty Rentrenchment: ACybernetic Model 374
'ELIZABETH TAYLOR - Institutional esearch in an ExperimentalSetting: ExperienCes With tale New York State RegentsDegree Pr*aol
CONFERENCEPROGRAM - DOING INSTITUTIONAL RESEARCH: A FOCUS'
*,385
zON'PROFESSIONAL DEVELOPMENT 39 5
vi

t.
11,
if
r
MODELING COLLEGE STUDENT' ADJUSTMENTAND. RETENTION FOR THE INDIVIDUAL INSTITUTION
Norman D. Aitken .
pept." st EconomicsUniversity Of Massachusetts
Individual institutions of higher learning have become increasingly,
. . ,
interestdd in systematically examining the determinants or student adjust-. .. ' "...-
ment and mtention.on their own campuses., This paper, addresses some of the. . ,, f
issues an institutional researcher is likely teface in attempting to con-,
struct _both' a methodologically sound model of retention and yet one which
is Of pratical value to the institution itielf. I n other wordil the paper
will examine both the science and art of model"building as it.pertains to
institutionally based studies of col le:ges_student retention./
.
STRUCTURAL MODEL, .
We.begin by defining a collqgq student retention model'as a logital
represerrtati on of' the existing theory of student adjustment and reaction. -
to _the college experience as it affects the ultimate outtorneof whether or,'
. .
hot the student con tiinues or completes) her/his'educdtibb bt aolplicylar
\
i nsti taibn . the model. wi 1 l normally don si s t of, a serifs .otstrtictvnal4
,-. . : - 1 .4'equations,,whiiit-are defined as ecivationi whidh specify the- det4lIed:64- .
.,
, s, , . . ? . . , .,
, . , X ;havioral relationships hypothesized by the theory without exploiting: , i
. -
poski bi 1 i ties' of algebraic simiA i fi cation. Each equat4olt tn the structural ."' ,
. .,
mode T ,\therefore , Wi 1 V normally hypothesize e a di reet ca usa I re) a Von shi p
Thii in turn means that the model will ,provide a framework thno ugli will 01 one.
4 .,. ,can explicitly trace the effectsof' a change in any variable or paramgter ,Nthrough the 'theoryi,s behavidral r'elitionships: A structural model,
10.

. 4
2 '
thereforeastands in sharp contrast tb asingle predictive equation, where,
retentiOh is made to depend upon a series of explanatory variables which4
are justified at most on an ad hoc basis. Not only is the latter type of
equation likely to proddce unreliable results, but it is almost impossibl
to use for policy,evaluotion since there is nobehavioral structure withi
whichto observe the effectof a policy change..
Obstacles to Model Estimation"
.17
Degpit4/the desirability of structural models, the followingobstaclet
need to be overcome by the institutional researcher who would like to esti-
mate such,a model for his or her institution:
(1) Absence of a well-defined and generally accepted theoryof student adjustment and retention.
(2) The need to modify any general theory'of retention to fit'the unique characteristies and specific needs of theindividual institution.
(3)- The need to find operational-measures of theoreticalvariables. 4
(4) Identification of the most effective statistical tech- .
niques for estimating the models parameters.A...
The objective of, this paper is to discuss methods'by which the above
obstacles can be overcome.
General Theory of Sjudent Retention
,While there may been° yiell-defthed general theory of student retention,
there is sufficient agreement in the literature about the batic determin-
'ants of retention to allow the construction of at least a simple structural, 1
mode) For example, the Mai?r writers on the subject tend to -agree that.
retention is largely de ermined by the successful integration of the stud
t . dent.
into'the intellec 41 akd'social systems of the institution. (Spady,. . -
. ., .
1970; linto; 1975), Each' of these major summation aspects' of a student's, ,
. .
.
. ..
%
, .
.4
.. .
,A
#

a
3
experience is, ,in,turn, determined by'a combination of factors, including.
individual attributes, family background of the student and student inter-.
action with both Reers and faculty.r,
Based on a revised and somewhat condensed version of T.knto's theory
of retention, we have specified the folloOing model. It is p'esented by
way of illustration only and is not intended as a comprehensive model of
retention\
Retention (R) = ao + alAl + a2SI -Vua .(1)
lAkokslemjc.ltegration (AI) . + biGP + ub (2)
Social Integration (SI) = co + ciPGI + coFI + c3P + uc (3)v \
Grade Performance.(GP) do + d1IA d2FS + d3PGS + d4FC + ud (4) G
The variables on the left-hand side of the equal signs are endogenous
(i.e., determined within the model) while 11 other variables in the equa-
tions are exogenous ( determined outside he model). The lower case letters
(a0...a5; b0...b6, etc.) are parameters (to be estimated empirically) while
the u's are random error terms.
For equation (1), student retention by a specific institution1R) is
-\assumed,to be a function of the degree to which the student is-integrated
...1into the academic (Ai and socia(SI) systems of the institution. Equa- 6
..,
. ....
tion6 speCifies that academic integration is determined by grade, 61
. 6.%
perforiance (GP) and intellectual development (ID) which is defindd as the -
y
.
student's 6eva]uation of the academic system" (Tinto,.1975, p. 104). For
equation (3)' social integration (SI) is a function o the extent of peer
interaction (PGI), the extent of interaction with faculty 'MI) and the (...1L-
student'sTrsonality (P). 'Finally, for equation (4), grade performance
. (GPf is assumed to be determined by the intellectual ability of the
A'
0 ,
6

0.
,4
student (IA), the degree of family support for the student completing a
College education (FS), the degree of peer group support for4intellectuaj
and academic activities ('PGS), and the degree of close personal contact with
faculty,around ntellectual or academic issues (FC').
,,APPLIED MODEL
aWhich Type of Retention?'
40.
Having specified a general theoretical model of retention, the next
step in the press is'tb convert the general model.into an applied model-
. _which fits the unique Characteristics and specific needs of the individual
institution. In order to achieve this objective, we shall have to simul-
taneously overcome obstacles two and three listed above, 'One of the fi4
decisiqns an institution willoahave to'make is whether it wants to focus on4 '
voluntary dropouts or whether its retention equation is to account for'both.
voluntary withdrawal'and academic dismissals. If the voluntary withdrawal
model is chosen, then the study sample to be used to estimate the model's\. ,
stapistical parameters would exclude all students dismissed froM the,,`No.
.A.. .
institution for academic reasons. If the model is to extaaih the total.. . .
loss of students, including academic dismisSals, then not-only would the
'study sample incipde all types of student withdrawals, but it .will also
in equation (1).
'university solely4
a dummy variable
. reqU thetheAntroduction of a-new.indep dent variable
ha
'IP
Since students could beillor'ced to leave. college or
' pecadse they did not meet a certain'grade requirement;
reflecting the grade requirement should be :introduced as an independent'.
variable.,
(.134 advantage' of the lafter approach is t)4tthe relative size of the
PGPA Requirement coefficient would indicate the relatiOe importance

5
.of acadbmic dismissal in explaining the overall loss of students, while at
'the same time standardiOng for,the effects of academicdismissal in testing
for the significance of the other variables that explain voluntary with-----
drawal, The equation, therefore,provides a compact summary of the insti-
tutions overall retention situation, and if itwece to be estimated,for a
series of Years, changes in the relative importance of causes Would be
:revealed by corresponding changes in coefficients.-
Retention Eqiiation
Once the type of model is decide he researcher must then
examine` the other independent variabl in equation .11) and see how they
Right best. be measured.
are abstract theoretical
Because academic integration and social integration
variables, the researcher may decide to settle for
-redefined proxy variables which are. ea r to measure, such'is academic
satisfaction and social iatisfactiori. Assuming the given institution-adopts
the more comprehensive retention model and makes the specified changes, the
Applied version of equation (1), would then appear as 'follows:
Retention (R) ao alAS k.a4S a3MGPA ua
Where the dependent variable, retention (R): is a'dummy. variable which
takes the value one if the student is retained by the institutyrarid, a
$vatue of zero if the strident withdraws,or is dismi sed froM the institution.
AS 'and the SS are survey response measures for each 'ndividual student in. ,
thestudy, which-measure satisfaction With their academic and social experi-
ence. Finally, MGPA; another dummy variable, takes the value of one if the
student has met the institution's minimum grade point averages the value
of zero if the student has not achieved the required minimum.

Ac4demic Satisfaction94
'.- eon
In constructing the applied version of equation (2)., academic Integra-
<
tion will obviously need to be replaced by acadepic satisfaction. In terms
of the Independent variables, GP.iseasily measured by student grade point .
00
average, but intellectual development may proie impossible tkilleasare.
-. Since ifitellectmal develOpment is supposed to-measure a student's overall. . , (
,
evaluation of the academic system, it may be possible to substitute a series
of variables for ID, each of which imeasures the studentl.s evaluation 6f la
4
'specific parIor component of the academic environment. Iii addition, the
researcher may want to add' additional variables to account for special
programs which might have a favorable impact on a student's satisfaction
6 with !)is or her. academic experience, such:as.an honors proltm, academit
dormitory, or various types of acade mically based extracurricular activities
(e.g.:language club or debate team), In Pie latter case,"the equation01
serves,as a test of the effectiveness of various types of prograMs which s
constitute the policy of 'the institutiont The'following equation is..*,
representative of the type of equation which might be specified.
Academic Satisfaction (AS) =.'bo
b1GPA b
2CR.+ b3AAR + b4LR
,b5HP b6AD b7AEA ub
, Where AS represents overall student satisfaction with'the.academic.. .
program and is Measures:1as a survey response item and GPA is measured by
the student's grade point average." CR, AAR, and LR.represent student
ratings of the curriculum, academic advising, and libraryfacilities and
they presumably Sid also be measured via a survey. HP, AD, and AEA are 0.
dummy variables which measure whether or not the student is participating ° e°
l in the ho program, living intan academic dormitory, and participating
)n academic extracurricular activity, respectively..

fr7
Social Satisfaction
While student.sdtisfaction. with their socil_experience may be large1.9
44ermined Olt the extent of positive interaction with peers, the interaction
Ifitsel take place ht several different types of environments which the
e
. researcher may wish to identify in the model. Specifically, the interaction
can take place (1) through academic or classroom related activity.(e.§. study
V *1/4grows), (2) through participation iii extracurricular activities, or
(3) within the residence hall system. Since each type of interaction.may
have a different type.or degree of effect on student reaction to' both their
soda) and academic experience,.
it js not entirely clear how student social
'experiences canbe most effectively modeled. .
It may depend primarily on the way students conceptually aggregate the
various types of social experiences into a meaningful wholkwhen they con-.
sciously evaluate the institution. 14.ttudents tend to sum up the various. .
types of social experience into one overall reaction of, evaluation of their
social experience; per e, o they incorporate the re levant social
experience into their evaluation of the academic, residential living, and.
extracurricular experience? The second hypothesis implies a very different
type of model than the first and the choice betWeen the two alternatives
will need Jo be decided by additional empirical wak. Because the first
kYpothesisIs consistent with Unites theory, it has been used as the basis- 1.
for formulating the following equation: The alternative approach, however,
has also been used elsewhere. (Aitken, 1982)0
444,
5Ocial Satisfaction SS) = co
+ c1RHSR + c
2ASR + c
3Egg + c
4FSR +
c5SO + u
c
Where student satisfaction with their total social experience (SS) is
determined by satisfaction with residence hall social relations (RHSR),

$
Academic social relations (ASR),.extracorricular social relations (ESR),
social relations with faculty (FSR), and some measure'of the4tudents degree
of optimism (SO) in lieu of a more comprehensive measure of student person-.
ality, All specified variables should be measured as survey responses.
The resArcher may also wish to includeadditioT variables to measure the
.impact of counseling services or orientation programs offered by the iristi7
tuiion for the purposeof improving student social relations. 14
Grade Performance
Gride performance is perhaps the easiest equation to convert to the
applied form:
GM.= do + 41SATV + qSATM + d3HSR + PE + d5PGS.+ d
6FC + d
7HP +.
d8AD + d9AEA + u
d
Where student grade point average (GPA) is a function of SAT verbaliind
"math scores and high school rank (HSP) as measures of intellectual ability,
.educational level of parents (PE) as a proxy Variable for pare ial support
of students' academic goals, peer group support for academic activity (PGS)
and degree* of contact with faculty around academic issues (FC); with the
,
. ti
last two variables being measured by survey responses. Finally, additional
Variables may be added to account for student participation in various
programs which may imprOve academic performance. The vaflables'previously
included in'the academic satisfaction equation have been included here as
well (i.e participation in the honors program (HP), academic.dormitory
(AD), and academic extracurricular activities (AEA).,
Additional_ Equations
The model need not limited to the fou basic equations, derived from
the theoretical model, but could be expanded by choosing one or moreA
14

t
V
independent variables for use as a dependent variable in'a new equation.
(e.g. the effect of typeof residence hall oh residence hail soeiarrela-
tions might be explored-by specifying an additional equation with RHSR as
the dependent variable.) Consequently, the institutional researcher has
the option of expanding the model to cover areas or issues of primary con-.
cern to the institution.
Statistical Estimation
The parameters of the model (e.g. the lower case letters listed in the
above equatiOns) can be estimated through the use ot multiple regression .
analysis which is both described in a number of standard statistical works
(e.g. Kane,,1968) and is included as a program in the Statistical Package
.for the Social Science (1975). .
In'the event that the specified model contains one or more sets of.
simultaneous equations, special types of regression analysis may be. required.
(Anderson and Evans, 1974) Where the model is charatterized\by a one way
flaw of causal influence among the dependent variables, like the models
specified above, estimates of the models' parameters can be,obtained'hy
the use of ordinary.least squares regression.
CONCLUSION
Despite the lack of a comprehensive general'theory of college student
retention, it should be possible for the institutional researcher to develop
and empirically estimate a model of college student retention which-is not ,
only methodologically sound but also capable of capturing the unique features
of the specific institution. The latter feature,' in turn, means that the
model may eventually be used for policy evaluation and simulation.
jde,
^

10
REFERENCES
4
Aitken, N. College Student-Performance, Satisfaction, and Retention:.Specification and Ettimation of a Structural Model, Journ61 ofEducation, 1982, 53, pp. 32-50:
'Anderson, J., and F.Evans. Causal Models in Education Research:Recursive Models. American Educational Research Journal, 1974,pp. 29-39.
'3
. .
Kane, E. Economic Statists and Econometrics, New York: Harper & Row,1968. .
Nie, N., et aT. ,Statistical Package for the Social Sciences, 2nd Ed.,New York:' McGraw - Hill., 1975.
Pascarella, E., and P. Terenzini. PrediWng Freshman Persistence andVoluntary Dropot Decisions fraiwa Theoretical Model. Journal ofHigher Education, 1980, 51, pp. 60-75.
t .-
Spady; W. Dropouts from Higher Education: An Interdisciplinary Reviewand Synthesis, Interchange, 1'970, 1, pp. 64-85.
Tinto, V. Dropgut from Higher Education: A Theoretical Synthis ofRecent Research. Review of Educational Research, 1975, 45, pp. 89125.
4
j
16 ,
. .
.
-

1'
A Comparison:of Minority and Aonminority Faculty .
4 Perceptions of Career Opportunities at Penn State
-Kenneth W. BorasPlanning AnalystG. Gregory Lozier
Associate DirectorOffice of Planning and Budget
The PennsylVania State University
INTRODUCTION,
Faculty hiring and promotion practices have undergone substantial
.
changes over the last 25 years. These changes have resulted in part from the
passage of over 45 pieces of legislation designed to ensure equal opportunity
for minorities and women. Most of these laws, and Several executive orders,
have been extended to include institutions of higher educatioft Given these
:mandates, many colleges and universities have sought to strengthen affirmative
action programs to improve recruitment, hiring, and professional advancement
opportunities for women and minority faculty numbers.
The'process of.change takes time.. According to Braithwaite and Beatty ',
.
(1981), in 1978, all minority groups combined, comprised 16.1 percent of the
total U. S. populatiOh. Yet, they constituted only 1 percent of all recipients
of O.D., M.D., and Ph.D. deli-tes.and 3Joercent of the recipients of the
master's degrees. This small group was responsible for approximately 7
percent ofthe research'knowledbe, production and utilization effortpqimarily
concentrated.in education and soCial'science fields:' Estimates for 1976'
.revealed that blacks represented about 4.4 percent afthe total higher, education
'faculty and thit black males held 1.7 percent of full professorships: Despite
all the legislatiOn, the achievement of equal employment oppor nity in
higher education-has been-slow.
J.

e
PO
s
Current pressures on institu lonotemmiing from .the projected decline in
enrollments and the realities of financial stringency are resulting in1. .
.. .
fewer new faculty positions; In addition to these pressures. -a recent article. - . .
. ;.-: ...
in The Chronicle' of Higher Education (19804mplies that the Reagan Administration4 t % ....,
is altering the federal government's approach to affirmative action by adopting
0 I. A :4 4 ,
"volun4pry compliance" as a means of achieving'affirmative act4on goals.4 ..1.
This change In, direction, it is feared, may retard the progress that
`affirmative action programs have produced.
Steps shave been taken by somefnstitutions,to assess their effectiventss
in creating an environment conducive to equitable access and advancement of
.
. .
faculty and professional, staff. For example, after identifying a disproportionate
rate of attrition for female faculty members as compared 10 men, Dartmouth
,College initiated a survey of junior faculty to determine the factors contributing
to this occurrence (1978). In another project, the AmeriCan Institute for
Research, funded by a grant from the Carnegie Corporation of New York,
developed an 4stitutionalSelf-Study Guide on Sex Equity to "evaluate theI -
extent and effects of inequitable treatment by sex and race" (nd.)
Penn State, likt other institutions, is concerned with encouraging
access to its academic ranks bminorities and women. In accordance. with
Executive Order 11246,he University established_an Affirmative Action
Office reporting to the University Provost in 1972. Over the next few years,
several studies were conducted to explore reasons why minorities, blacks in
particular, left the University.
In November 198, the Forum on Black Affairs at The Pennsylvania. State,.
.9
University submitted a report to the University President. entitled "Bucking'
the SendToward the Development of a Program to Stabilize and. Expand
Number of Black Faculty, Staff ant Graduate Students at The Pennsylvania!
State University" (1981). The report Showed that./from 1975 to .1980 the
16,

..,.
.
,
.
number of, full-time faculty declined by 5.9 percent while the riumbir of black*
.
faculty declined by 11.9 percent.. One outcome of the Forum's report was a
decision to conduct a faculty survey .to assess factors militating againit
more successful hiring and retentiat4of minority_ faculty.
METHODOLOGY
The basic problem which the survey was designed to address was the
identificationtf circumstances which restrict black and other minority
faculty.accesssto and professional advancement within Penn State. Dui-ing
initial survey development efforts., a number of questions surfaced regirding'
general career development: How do faculty hear about a position at Penn
State? Why do they come to Penn State? What were their expecIations? 'How
are they treated profesiionally and personally by members of their depart-
ments? It a mentoring relationship important? From these general questions
. -
eight survey areas. were 4Untified: recruitment; promotion and tenure;
mentoring; inclusion, acceptanceand "recognition; feedback and evaluation;
role in.uniyersiIy service; professional opportunities;and affirmative
action. between five and 15 descriptive statements were prepared for each.
arra. For each statement, respondents had the: choice of selecting one of six.
poSsible responses, from 17-strongly disagree.to 6--strOngly agree. For
explanatorY purposes, a'3.65 average response,(which,414 in the 3.50 to
4.49 range) was interpreted at almost "moderately agree" (4\0), while a-4.25
response,(in the same range) was referred to as.more than '_`moderately agree.". . -
.
The gederal format-of the "Bucking the Trend".sarvey was adopted frem.the-. t .
.Dartmouth College survey of junior facultr (1978).- Prier to cOnatiing the.. . !. ,
. .,
..k.
survey, an instrument preteilp was conducted with a sample of 22 facUlty- .
,
member's.
AI , 6 6

E
1 414
.
. The faculty response groups selected for analysis were: Blacks, other
minorities (Asian, Hispanics, American Indians and others) and a proportionately. .
.
representatiVe sample of nonminorities. The same of nonmnorities.was. .
)selected to mirror proportionately the social and academic characteristics
portrayed by the two minority populations compared to the patal population of
nonminority faculty: The survey was sent to all 119 minority faculty at.Penn
/-
State and a representati'Ve nonminority sample of 323 faculty. Approximately
80 percent of all surveys were returned--139 minority faculty and 2i' nonminority
faculty surveys. The minority faculty response group distribbtion according
to survey's categories included: 67 percent (93) Asian, 19 percent (26)
Black, 10 percent (r4) Hispanic, 4 pertent (5) minority faculty Ilho dtd not
specify one of the prescribed racial groups, and percent (1) American
Indian.
two basic statisticii4kOidtires were used to analyze the survey data.
The chi-square procedure was used to identify differences when freqUency
distribution data were developed.' In addition, analysis of variance (AOV)
wts 'used to measure differences in average responses. The'.05 level of
significance was used to determine whether ar not the differences were significant.
,
Where AOV procedures yielded tigniffcantfferences, the post hoc Duncan.4
test was applied to measure differences among the groups; The Duncan procedure
requires equal sample sizes; howevee a harmonic mean can be used for analytical
'purpOses when'cell sizes are unequal. The Statistical Analysis Systems (SASS
computer package was employed to perform these statistical analyses..
FINDINGS.AND OVERVIEW OF FACULTY GROUP RESPONSES
Alt 'ugh the survey uncovered many-differences it per ceptions be tween
black, o her minority., and nonminorityespondents, on nearly 60 percent of
the survey items, the survey respondents were in relative agreement. Black -
faculty responses differed signifitantly from nonminority and tither minority
O

fatulty on approximately 40 percent and 30 percent, respectively., of the. .
oguestionAire items. However, the grpup of other Minority faculty differed'
from nonminority faCulty on only 15 percent of the questionnaire items. In a
15-4 -
,
statisticailsense', the group of other minority faculty resembled more closely.
'the responses of nonMinority faculty than slack faculty.. The major focus of. ., -.
'a t
the discussion is directed, therefore, on those items on which black faculty .
:
4 . .
responses differed signifivntl from nonminortk faculty, with additional
1//4vconsideration given to'ite on)which both black and other miri6rity faculty
differed significantly from nonminority faculty. / .
There also seemed to be consistency throughout the (irvey on the various
statements on which the individual groups agreed or disagreed.. By lookin
a group's responses acrosg the several sections of the survey, noting pa'r'ticularly
where one group differed from the others, it was possible to develop an
overview for each group. All differences Cited are statistically significant.
Nonminority Faculty.dm.
4 The nonminority group tended to agree iirre than minority faculty with
items in the survey which state that a condition/of.equality exists regardless
of race Or sex. For example, the nonminority group. generally believed that,\3
.their departments are doing. what they can to provide equal access and opportunity
for all faculty. Where tire nonminority fac y were lest in agreement with a
survey item, the focus was on departmental activity. For example, nonmirlrity
faculty perceived that department heads tk1(1" active role ift recruiting
minorities (4.2), but they recognized also that minority faculty are not
always utilized td help findjather:minority faculty when new positions are
open (42). The fionminority grow:, only moderately agreed'aboui the likelihood
that a mentoring systemmUld.be useful in order to advance professionally
(4.32) or that annual performance appraisals provide them-with valuable and.
cOhstructive information (3.57).
2i 4

16
,% ," ;
Interms of the profeisional'environment,,nonminoriti-6cultY.ageeed.
that their ideas al4/iaiued (4.54) and-xchanged within Al department. In
* _, .''. 0
. addition, they perceived that cplleagues consult with 44.8)and are con-
sul
it. .
sulted by (4.87) minorities in theAepartmept. A. onminorify respondents spent
- leis of their time than black respondentg in university seritoe. Nonmlndrities,.
.
agreed that atl,members of their departmeortre..equally enc6urapd in their
purvults ofpromotion and. tenure: and hayi equal access, to sabbaticals and. a ..o
. 0 tother competitive Opersity .opporfunities";they perceived that the department
4
is actively ensuring that minorities receiVe eqbalsalaries among Colieague$
of equal abilities. r %,
Ina capsul4, the nonminority facuity ta ple consfstently pointed out
that their departments are trying to provide an
profssional*cess.and advancement. -
Other Minority- Faculty ".
. .
quita0e. environment for
,. ..
Other minority facUlty ( -04; Asians and'Htspanics) had.significantly
different responses'from'the nbnprill q ity'saMple on a few-gems which dealt" w.
.N.
1 with recruitment; inclusion, acceptahce'and recognition; professional opportunity;,
and affirmative action. For example, a greater proportion of other minority
faculty than nonminority faculty agreed that access tonew faculty positions
t.may be limited due to theact that manortty faculty are not likely
,
to bea - !
used to contact other minority candidAt4r-12.85 othei minority and 4.00
nonminority). addition, other minorily.fadulty.onlymodara;ely agreed-
4.17) while nonminority respondeks agreed (4.87)that minority and non-
minority colleagues consult with one another. Other minority respondents
tended to agree less thanonminorities-tthat they have t same access to
university opportunities-44;13 otheminority.and 4.71 nonminority). It
.
;
4
was evident also.froM the. survey that there exists a question in the minds of
q

. .17v
other minority faculty as to whether thetfidepartments ensure that minorities
:receive equal salaries amalicoIleagues of equal abilities.
In combination, these observatiouv suggest that the other minority,.
.
faculty members tended to believe iiis sOinewhat.mOre difficult for minorities
than wfihinorities to gain an academic appointment at Penn State and to
attiiThsareerladvancemeni.1
Black .Faculty N
-'''Severaltems suggested that black $6culty were greatly concerned abodt'
their disproportionate representation in the facultyOinks, Only alittle
over one percent of Penn State=s faculty are black. There is also anbapparent
relationship between this small black representation and the findings of
several items on t Bucking the Trend survey.. Not surprisingly, black
facult;\tended 0 be less convinced pan Other faculty that al.) is being done
that could be to recruit more minority faculty. fili-surveyresultsshowed.
that 52 percent of black faculty respondents were recruited by word of mouth
. fromsOmeone at Penn State; however, these same respondents'did not agree
(1.6)-2,69) that minority groups, minority Oformation networks, Or mjaarity
.
4agulty_alT/ at Penn State are used sufficiently.to.redrUit additional.
minority faculty. Blackrespondents cited "the small number of minority
-,'-faculty as the most likely reason to contribute-to.leaving Penn State,
*and they believed more than the nosminority group that Penn State would 4.
:benefit by 'having more minority faculty--(5.69 for black faculty and 3.85 for
. nonminority faculty).
Perhaps the most telling sprvey results were thpse that indicated a4 1 r .
...greater sakise of career uncertainty among black faculty than among nonminorities.
.
: For example, 0 percent-of black faculty resoondentst on the tenure track and, s
those already having tenure were uncertain about career advancement; yet,
they prefer to make their careers at Penn State. Only 18 percent of .
.. . ..
.
. 23. .
,I,
p.
. .
41.

18
nonminority faculty responded in the same mafiner, Black faculty were more
likely than nonminority respondents to characterize relationships wi.th'thefr5-
.
colleagues as work-related associations with less likely social inthraction.
In-addition, black faculty were less likely to agree.that thbir ideas are5
valued by colleagues -(4.00 for black ,faculty and 4.54 forpOnminority).
During a faculty member's career, he or she woUld'expect to be given the
same opportunity or rewards as4colleagyes of similar. status. Thts may not be, *
the case perceived by some black faculty members at'Pelin State. Black
faculty respondents 'more than other respondepts felt they would have tp
refocus their area of specialization to gain tenure (3.53 for black faculty
and 2.40 for nonminority faculty). On_average,' more of their time is spent
AGproviding university..services (20=29 percent black faculty) than the nonminorit*
faculty (10-19 percent) while both faculty groups recognized that there is'
limited reward for university service. Black respolidentS tended to disagree .
that the department equally encourages and 'supports all faculty members
toward achieving promotion and tenbre regardless of sex or race, that
Minorities have equal access to other competitive university opportunities
including appointments tu administrative positiens, and that theirdepart-,
ments made an active'effort to insure that minorities receive equal salaries
among colleagues-of equal abilities.
a
The significantly greater uncertainties about career issues expressed by,
black,respondents suggest explicit problems that the University needs to
address. These problems include:
The need to further expand personal contact Ilecruitmentactivities and to'establish more extensive minorityinformation networks.
. Consideration of establishing a'formal mentoring systemfor new junioe faculty members.
Within appropriate standards of quality, provide adequatelyflexible review policies.
24 e
4"t,

4
RECOMMENDATIA AND ,CONCLUDING REMARKS .
19
;12
The Pennsylvania State University, like many colleges and universities,
has atepted to meet its affirmative action obltgatiob in part tby adVertising.
in all appropriate minority journals and otherinternal publications to
attract minority faculty: And; like other institutions, affirmative action
guidelines arein ace to,insure equal opportuwities for all faculty:
Nevertheless, if Blacks and other minority faculty are to truly have an equal
opportunity for employMent and advancement, strategies need.to be devised to.
supplement these On-gO4ng-affir4lati4 action efforts.
From the analysis of the 3ucking the Trend" survey, three recom- io -. e ...
menditions were prepared and submitted to penn State's president. First, it
was recommended that:
Deans and department heads should (a) reassess the effectiveness ofaffirmative action recruitment methods, e.g., advertising inparticular publications,,and (b) realloCate appropriate resourceswithin-the college for providing recruitment incentives to expandthe scope of affirmative action and increase the level of.upersonal.contact" recruitment.
More faculty learned,of an open position at Penn State'through pens al- 4
contact than by any other means. This-was particularly true for black respondents.
In contrast, advertising in professional journals Or newsletters and
in The'Chronicle of Higher Education, and postings in graduate school departments
were significantly less effective as means to recruit minorities. Data- on
file in the Affirmative Action Office regarding recruitment activities
generally confirM the ineffectiveness of current advertising strategies.
Minority faculty i'lso.indicated in the survey their belief that.. -
4 departments do not make every effort to contact minority groups and minority
information networks. The small number of black faculty currently empToyed
at Penn State tends to provide at least partial evidence for till's assertion.

20
If this recommendation is adopted, colleges and departments, in con-,
sultation with the Affirmative Action Office,'will need' to conduct.a reassessment.
, of the#minority recruitment plans and prOgrams. Using informed or" n the
effectiveness of various.4ecruitment methods, funds will need to be reallo
cated from current programs to newly developed activities
designed to increase the level of personal recruitment contacts with.
individuals in departments at other universities.. Under this reoriented
program, recruitment initiatives should not be limited to currently open
t
:111
411101
'
positions, but should lay the foundation for future recruitment initiatives :
as openings occur.
;The second recommendation addressed concerns for establishing a
mentoring pror'am. It was recommended that:
College.deins request department heads to initiate informationmeetings with tenure-track minority faculty members within their
. departments to discuSs the desirability of mentoring relation-'ships and to explore possible departmental-guidelines forestablishing a mentoring program.
All of the survey respondent groups at least moderately agreed that.
mentoring was important; however, the black faculty cohort 9Are than agreed
that a "formal" mentoring' system for all pew junior faculty members would be
desirable. For the present, however, without more deliberate consultationlgt-*
r with junior fruity members, insufficient information is available to .
warrant an unqualified reconiendation for the development of a formalized
mentoring program. It was felt that department heads should initiate'an
informal dialogue with tenure-track
particularlfblack,faculty members,
minority faculty members, and
to 3xplore further-the type of mentor
relationships junior faculty might like to'see encouraged. In addition, more
information regarding mentoring
=at Qther institutions , needs to
44I
programs, established or proeosed,
be obtained to guide those individual)
`t

ti
21
departments or colleges that belieye a mentoring program would be an
important service for new faculty members.
The third recommendation arose from a perception by minority faculty
members, blacks in particular, that department heads were not aware of the
full range of professional activities performed. by some faculty members. Many
faculty felt that not all of these activities were considered in promotion
and salary increase decisions. It was-recommended, therefore, that:
College deans encourage department heads to become knowledgeable aboutan individull's outside profestional as well as University activities.The review process for promotion and tenure, for salary increasesand for other professional advancement opportunities needs to beflexible enough to consider the faculty lember'sxfull.range ofactivities and responsibilities. 1
Responses to several survey items dealing with promotion, tenure, and
professional advancementat Pend/State suggested that black faculty more than
other groups are uncertain about their career possibilities at 'Penn
State.- Because of their current ltmited numbers, the obligations of black
faculty members to serve on numerous department, college and niversity
committees require a considerable commitment to university service. The
survey revealed that black faculty members reported spending a higher pro-. 6\
portion of their time in such service than'did other faculty. Accordingly,
factip such as uncertainty concerning professional advancement opportunities
and the level of expected University service have mobably influenced the
, obseriations,byfaaulty respondents that a more flexible review policy is.
needed. This recommendation does not imply that department, college,. .
or university standards should ,be different for any particular group or
individual. flowever-, it does request that department .heads take all
responsibilities.into consideration when making workload assignments and
provide recognition for the additional obligations which stem from beinf
s ,
271',
is

22
a member of an underrepresented group of faculty, whether it be a lack,
.
female, or other faculty group...
Institutional research can play a, vital role'in providing timely andr
critical policy analyses for university executives. Recently, Fenske (1982)
argued that greater emphasis on, policy analysis is the.only direction the
institutional research function can take to become viable in the future. At
Pern State -, important policy questions were being asked about the, status and
effectiveness of minority recruitment and advancement' opportunities. Penn
State's Office of Planning and Budget, Plahning and Research Group, ptovided
the necessary survey and statistical expertise to assist university admini-
strators and faculty representatives in condlicting an analysis of faculty
attitudes toward the University's affirmative action efforts. Since each
recommendation was directed primarily at the college and department heads,
a detailed version'of this report was forwarded by the/president to the
Council of Academic Deans fqr their review and comment.
REFERENCES
BrkithwaiteR. L.-and Beatty, ., "Minority Male Participation inEducation Research and Development: A Recruitment SelectionDilemma," Journal of Negro Education, 1981, 50, 389-400.
Dartmouth College. "Summary of Findings, Assessment of Junior FacultyExperiencelat Dartmouth College," Office of the President, 1978. .
.11
Fenske, R. H.. "Policy Analysis: The New Reality for Institutional Research." v.Paper presented at the 22nd Annual Forum of the Association forInstitutional Research, Denver, May,-1982.
Fields, C. M. S: Civil Right Commission Defends Affirmative Action,"The Chronicle of Higher Educ tion,'December 16, 1981, 93, (16), 13.
I Forum. on Black Affairs. "Bucking the Trend.- Toward the Development of aProgram to Stabilize and Expand the Number of Black Faculty, Staff,and Graduate Students at The Pennsylvania State Univervity."University Park, PA., 1981.
Self-Study Guide on Sex Equity. New York: American Institute for Research,
28

USING MULTIDIMENSIONAL SCALING TO SUPPORT COMPETITORANALYSIS-AND INSTITUTIONAL POSITIONING
David W. BradleyAssociate Director for ReseaichOffice of Enrollment'Servie*s
Boston UniVersity,
N
INTRODUCTION
A clear understanding of one's competitive environment is a vital
component of an organization's strategic view of the world. This is as true
for educational institutions as it is for profit-making corporations. For the
multiuniversity, it is as essential (and complex) as it is fdf.the large
conglomerate. Competitive position is the underlying determinantof the
success or failure of most viable strategic courses of action; it is a key
factor in explaining current situational assessments. A profile of major
competitors is one indication of an institution's image, and therefore an
indication of the alignment of the public's 'perc4ived reality of the
institution, versus the articulated or implicit mission.
It is, then, the ability to measure the differences between mission,
perceived reality ant relative competitive drawing power that makes a study of
competitive-poSition crucial: Marketing research techniques, such ai*those
described in this paper, become the means for the institution'to understand
the client-public's perception, and therefore to perceive and describe the<
reality with which they must deal. In this respect, the logic inherent in
utilizing the positioning methodologies is similar to that used in theAP
application of any academic discipline./40.
Boston University, because of the breadth of its acad is programs and*
services, because of its physical location and acause of si nffi-cant changes
4
23 23

.24
that hove taken'place since mid-century, suffers frob a lack of image
consistency. The spectrum oi"Competitor institutions is as broad as its own
academic portfolio. In order to better understand these complex realities and
'begin to isolate the actual dimensions of competitive force as they relate to
the por#ollo, ihe University hai undertaken a serious attempt to understand,
the educational marketplace in these terms%
The seriousness of this 'undertAg iss in several ways.
Resources have been dedicated to the development of primary data on all levels
of the student client market ("levels" meaning the transitional stages of the
admissions recruitment chronology). Committei structures have beenvdeveloped
to provide a natural consumer of resulting analyses. Organizational changes,
of the Aature of the creation of the enrollment'services "strategic unit",
have been implemented with the intention of facilitating the adoption of the
enrollment manogement mode of research, planning and implementation of
prescriptive strategies.
The goalipf these silmultaneous developments -- arid a working definition
of positioning -- will be to arriv at the optimal balanie between the
existing institutional mission, institutional strengths and weaknesses,
client-public perceptions (tidge), competitor positions and ultimately, the
client-public's desired benefitv While the statement'of mission may or mayO
not exist as a formal document, it is implicit in the current curricular
structures, program offerings and executive philosophies. The remaining
elements of the "strategic mix', while also qualitatiife in nature; require
empirical support.. -
The non-metric scaling (an unsolved contradiction of terms)2 of_the
qualitative competitor - :related elements of the strategic mix can be achieved,2
by means of multidimensional data, representation techniques. This piper will
,
30

/
Jo
,
,
,
25 .
present an application of multidimensional scaling (MDS) techniques to. non-
metric attribute measurements. It will also demonsti-ate the role that
.
multivariate eanalysis cah play in supporting the intetpttetation of the MDS
, . ' .output.
METHODOLOGY
Research Desiin
a
i
tin
'Rt.,
, ..Data analyzed' i n this paper are from a Spring, 1982 "Positioning .Study;" .
which was designed to obtain -informatton on the, desired-benefitS of a coPlege ..
'1
education, and the degree to which Boston University and its competitors were
perceived as offering those'benefits. The study was represehtative of the
University's primary market -- metropolitan region in the Northeast Corridor1
-'i- and was targeted to the three groups that are generally regarded as.
.critical participants in the college-choice process: prospective students,.
-theireparents and their guidance counselors.4 A-
The student and parent samples were drawn with equal representativeness .
from three institutional address files. Desirable prospects, who had not
inquired were randomly selected from the University's -Student Search file;q 'inquiries who had not applied and applicints -were randomly selected from the
appropriate files in the student recott system. Guidance counselors wi* ... .
artlftearily selected by virtue of the high schools they represented. *Analyses.'or--
%, discussed in this paper will be based on the total high school studejit sample. ,
ktual administration of the survey instrument was subcontracted to a1
research firm. As such, Roston University was never identified as the sponsor-"\--,of the study, and a potential source of bias was eliminated; The survey
administration consted of two stages. First, an envelope containing items
necessary for responding to an interviewer's questions was mailed to the. 31
,
.
.

26'
entire sample with instructions not to examine the materials; and that a
researcher would be in touch with them shortly. Within a week interviewers
0 contacted, by telePbone, the required number of potential, respondents.
Responses were obtained, from 613 high school students, 156 parents and 102
guidance ceuntelors. Blcause this was a teleOhone.interview,-retponse rates
were in the range, of 95/to.100 percent, thereby eliminating non-response
bias. 'The returns were, found to be Vtptisticaily representative of the
poPulatiOn at less than the .05 leVel orsignificance.'
Analyti01 Methods
The materials mailed to the sample meab rs includea packet of cards
with 17 distinct university "scenarios", each of which represerited.a:
fundamental positioning option. Also included was a card with 11 universities
litted: Boston University and ten competitors. *Exhibit 1 di sp1 ays the'
scenario descriptors and the, list of institutions studied.
Two egamples of the iceitaeio 'cards fnl,low:
Anyone would be proud to be a graduate or student of this
institution: its graduated typically -get the best jobs..It is an honor to attend this institution.. Its degree' isa major step to success.
This institution requires a firm grounding in the liberal
arts. All students must take the traditional program ofcourses in the humanities, social sciences, and the naturalsciences. This.helps to develop the intellectual skillsneeded to deal with theyariety of demands in theirprofessional and persofill lives.
The descriptors for these two scenarios are "Prestige" and ."GroundIng.in the
Liberal Arts," respectively.
Respondents were asked to what institutions they had appliedt in older of
preference, to which they had been admitted, and where theyjnost likely would
32
it

O
,
27
EXHIBIT 1
SCENARIO DESCRIPTORa. Prestige of Institutiohb. One-to-One Counselingc. Faculty Degrees
d. Financial Assistincee. Professional Experience Outside.
_the Classroom i
f.4rounding in the Liberal Artsg. Training for the 'Professionsh. City of Boston
1. Many Majorsj. Dei*anding Coursework
k. Interaction1. Traditional Campm. Teaching Facultyn. Athletics
t. Social Life'p. Selectivity
q. Facilities
INSTITUTIONS STUDIEDBoston University -Boston CollegeCornell University
Georgetown UniversityHarvard' University
.University of ConnecticutNortheastern UniversitySyracuse UniversitySUNY (Combined)
Tufts UniversityUniversity of Massachusetts
be altending. They ere then asked the extent to which they were familiar
with the 11 institutions being studied. Next, they were asked to go. throughAft
the deck of scenario cards and chooie the five "institutions" that most
Appealed to them, and the filithat least appealed to them. Finally, theyA
were asked whether they assoviated each of the 17 scenarios with each of the
+1 institutions. The attribution of the scenario descriptors to the
Competitor institutions provided the similarity measurements, which drive. he
variouls.perceptual mapping techniques. A number of other descriptive
questions were askai, which are not relevant to the topic at hand.
The power inherent in this tabular data scheme will be obvious to those.
who have worked with survey data. The limitations in applying multivariate
techniques will be obvious to those who are familiar with the least squares
Algorithms., Although an'approximation of a spatial configuration of
.competitor positions could be developed by hand using the nominal data, it is

,- 28
unlikely that the more subtle patterns in the data could be uncovered without
the aid of computtr-assisted scaling techniques.
MIWro ines have been developed to .support (among anbr things) the
subjecti e interpre ation' of dimensional solu ns to non-metric based
siml ity and dissi ass- -nts. A correla n matrix is
inte reted as a proximity measure, with the upder1,0 concept being that the
prox mity dtta is directly transferable to Euclidean space. Becauie the MDS
algorithms are iterative, rather than computational, their solutions --
coordinates for R dimensions -- are an optimigation similar to those of linear
-programming applications. The objective of. the roOtines is to preserve the
rank ordering of the proximities (that is, to maintain monoibnicity) while
solving the puzzle of the spatial configuration. The difference between the
original and the derived proximities (residuals) is measured in terms of
(Kruskal's) stres5. The MDS program which was used in these analyses was the
Guttman-Lingoes' Smallest Space Analysis (1).
INTERPRETATION OF NOS SOLUTIONS
Figure 1 displays the MDS solution for 11=2 (two dimensions). Note the
horseshoe shaped pattern which-indicates all proximity ,rankings of R2 = .3.
The superimposed vectors on Figure 1 indicate the author's subjective
interpretation of what the dimensions might be: "Academic Reputation" and
"City of Boston."- The standard deviations of the attribution to the .
descriptors, "City of Boston ", "Selectivity ", "Prestige", "Faculty Degrees",
and "Demanding CoursewoO\tre significantly higher, than the remaining 12,
which Supports this interpretation. The slope and intersection of the vectors
on Figure 1 are also a subjective interpretation, and point out the fact that
34
41.

rracr,rOn. NAP or los= vxtrustres mama woutrr WITH rot 'Ku cotolurotts..
-100 .14 .40 70 ..40 -00 440 lb.30 :.0a OOO100 .yea ,92
. SS00 06070 07206
000*
-10
. a
b2 6Aa
4:0 sot it .3032 0 a . ...1".26 ....,. .2 ...., ,
e, / l /.20 ....,12 Sertheaptere // ,/0
V CC700 1 fie 0.+6
29
.nand I
10 ;0 30 0 .01 00 70 re 40 I0C
,..... A..." el
Iv
/
S.
i e e
1.
11001011 Col
,
;O N
O
elk
.00.100 .... -... o 1" e
-
'0134010,0lit007/7;
40Sti*a,
0laIiPa2470
1.'19
-12 Tut co11 I d' e,.16 % ".... L :..20 i I / -It.2 . 1 4/ / S ..iik .2..211 / . ' u d ) e .Pib.32 - I I, . I .26
' '36 a, I;... V) Illit U. Mee gin 11044/41(in / / /
%.,'" I lo abo
1 g ...*,,..// " 1 /
1,
.62 '17toonsiefi 11ea6 /1 1 --,... / .0,, aii
'92..i 00 0 % / r "
0* / d' .. '' Ceres11 60.60 1 % e.+72 1+70 % .
e
4/ 'e
1-so-0. .4. sort %%
_ ii;. ( 1k .RQ. ..' . 0.. .0 wwieROWD..b .. %
. ...... 4Coral '''''4.. .
10.'9 lysecos .. +02+92
100 -90 so .70 .60 .50 ..0 -30 20 .10 10 20, 30 0 SO 60 70 p0 90 100
the.x/y axes_are for plotting purposes and do not necessarily indicate the
actual position of the dimensions which are underlying the data.. -
00-100
'\ *Since the city of;Boston is not a viable positioning alternative for
about alf the institutions studied, the scenario attributions were deemed to
be str tegically insignificant at this level of analysis. Ensuing analyses k
have excluded the =City of Boston" descriptor.
Figure 2 displays the MOS solution for R=2 excluding "City of Boston,",
with the dimensions again-being subjectiTy superimposed. While the
dimension, "Academic Reputation". is similar-to that found in Figure 1, I
dimension 2-indicates a new ordering along what wis tenttively deemed to be
"Preprofessional Orientatien."

PERCIPTUAL MAP Or 1027014 VNIVGRSITO2 ?UMW martian 'um KEY COMTISM
*00 96 40 ,70 40 GO .**0 30 20 10 111 20 30 ''Ir46 66t
00 70 00 0 SOO #leo
0 0 0 0 0 0 0 0 0 0 ... 0I.:06 . ..
..SOO00
....,_9200 L--C.. ' . 02
. 0000 A : . - *4
0404
00
7072 ..
000 , 0; 0924, 4 o 9
04 00
0006006 , 1 .: Ga
62 6240 6** ,40 036 * % 2032 0dt 2220 202* P 2*20
lb i SlortlwasCorl20
i20
.0iv Ssoton.9 e,
16I 2
0.0VECTOR 1 ***** **** 113 0 fe' 0... **
v t.e. 6 *010 *Wit ti
0SW" O . 1 2I2
* 20.24 I. ,U Km
11) *16*2**20
26 0*22 Cornell DInenelos' Is WIC REPUTMON a*
*20. *2234. *2640 0 liarVarti 4044 4440 ' <-0 0062 . 62* 60 . 4 *SO60 . ti. so04 GOOrasteftl V do 6..so 41 e 1 I *76,
*GO
*Oa 66* 72 , - 72-11* et ' ' 0..,
.
, Srsass *9G2 O92190
. 0 \- , / a SOte 011 96**** e, S., . 0 05"too oo -so 70 60 50 40 20 26 la 10 20 .30 0 66 011 70 . 00 00 100
30
TICS= 2
4
I01.
Note that the solution disp)ayed in Figure.2 shows a slightly more wen-
confined set of,two clusters. A discriminant function analysis (DFA) was
applied to the two "groups"' to gain further insight into the variables whichtut
had contributed tO this clustering. The significant variables, with their
discriminant coefficients,areranked below from negative_ horizontal
positioning to positive.
-11.2 Training foi.ihe Professions- 9.6 . Faculty Degrees- '5.6 Social Life+ 0:4 Teaching Faculty+ 3:0 Many Majors ,
+ 4:2 Demanding Coursework+' 5.0 i.. 'Grounding in-the Liberal Atts
. + 53 i Professional Experience Outside the Classroom+1.1:9 ' . Facil i ties
°"7
.
4 36 .

31
'Although these data might indicate a single dimension of "Classical Training"
versus "Experiential Training," further support from multivariate analysis was
required to reinterpret the two dimensions in light of this new potential
framework '
---\---)A frequent approach to interpreting MDS dimensionality is through linear.
multiple regression. The MDS.vector coordinates arc regressed over the-
attribution data to infer which variables explain the dimensionality (and what--...
the slope of the dimensions should be). A stepwise regression indicted that
dimension I was affected by the attributes "Selectivity" (-) and "Fin,ncial
Aid" (-0, and might now be interpreted as "Perceived Institutional Value."
''. The opposite poles' of the dimension may both be interpreted in a somewhat
positive light, with the negative bole being very selective (and very
expensive) and the positive pole being very affordable (butnot so selective).
,Dimension 4 was affected by the attributes "Interaction with Faculty". (-),a*-----7--..
"Athletics" (-) and "Professional Experience Outside the Classroo(41, Adx
#is now interpreted as "Institutional Focus." The opposite poles of this
dimension can be read as collegial focus (on the negative side) and career:-,. .
oriented focus..(on the positive side). Figure'ldisplays these new
interpretations.
Vie
Worth highlighting is the position of the two dimensions relative to each
. other. There appears to be, in the minds of the student clientele, a
correlation betweena collegial instftutional focus and selective institutions. .-
Perhaps more important to Boston "University is the antithesis of this
perception; a career-oriented focus is not perceived as taking place, at
'selective institu) ions. SteMiing from this assessment of the dimeniionality
are a number of issues that are pertinent-to ongoing discussions of the
VniVersity's positioning strategies.
.!)

PERCEPTUAL GAP OP BOSTON UNIVERSITY'S
e
PRIMARY GARRET 1IITN TEN KEY CAR(PETITORE
1 00 '90 *47 .0 .60100
66664 6 60666
909i
&SO7618
68eabe68
oCISO3825
80is
1810
1 NO.10 tuft
.go220 COnsII Dimension I:".36Iltvrd (11Ioce Iv.).4.
68036.668 0
. 0
.612700
.55 ".92go100.100 90 .0 -70
*30 .20 .16 10 20 30 0 Go6666
s.300105 V
# 000000000
PERCEIVED INSTITUTIONAL
6,
0Geossetovo
960 30.
loll 711.016;t.CP.
30 to 10
32
FIGURE )
60 70 00 90 100
100069801111410676180504.
' 32
. oo36321 4 is2.
e 0 Notelmatre1P 20
1618
i . .MINT 61:
16203 U Mao .2*
AWE
80631 `':"........36.),.012.56.00
V Coos ' 6.72.76. 00. .11. 'Is.0802
a loatob C11.27 . .00ilp r - ***** ***** i "°°
10 20 30 SO. - 33 60 70 0 00 100
(At fordbI*)
This solution, as interpreted, preseits Boston University's primary-
market in a pattern that is intuitively appealing and in terms that are
relative to institutional planners and strategic, planning techniques. Furth.er
statistical support through factor a alysis Aid not prove to be feasible due
to the lack of a strong metric bade (1...e., high communality of the norkinal
attributions)., MDS, solutions of eater dimensionality did not show a
significant enough reduction. in stress to warrant attention.
There remains4a great deal to be said about the validity of a
as this, and the potential to probe deeper via higher levels of dini
or with other multivariate support techniques (especially multiple
Alternative perceptual mapping techniques, such as factor analysis
design such.
ensionality.
regression).
and
I
4

33
discriminant analysis, have "their strengths and weaknesses when compared to
MDS; they are generally related to.the"nature of the data to be analyzed.3
Such a discussion is beyond the scope of this paper. _This design is presented
as a fairlly inexpenelly and relatively eas- y to use approach to perceptual
e-mapping.
memiiims
Insights gained from the perceptual maps displayed in this paper, and
others not Shown here, have serious implicationg-for Boston University's
future.strategic course of action. Further strategic interpretation of the.
maps must be grounded in other inference obtained from tie Positioning Study,
which hive not been discussed here. The us r of these methodologies must
understand the need to go beyond the level -of analysts presented here and
replicate the solution for each`of its key market segments. Included &his
stratification scheme should be perceptual assessientsAfeach level o'the
recruitment chronology.
A readi .0 the desirable course an institution might want to pursue as
it attempts to move itself across perceptull space must account for an
understanding of which market segments al ign themOlves with the various '
educational benefits.studied. Although these data were readily apparent in
the complete analysis, Boston UntVersitylis not wifling to share this
information until decisions affecting our awn future are finalized and
implemented. What has become Apparent as a result of this analyiis is the
need to measure-the congruence between an institution's mission and the
feasibility of implementing strategies which will contribute to the develop-.
mentof'that MISSIOA, it light of.a new underAtanding of the marketplace.
/

41,
FOOTNOTSN'
34
i
.-
..\1. George Zimmerman, "Basic Research: Aesthetics of Pure Science:"
the World at Boston University, 29 September 1982, p. 2, col. 1. .
2. Louis Guttman, "What is not What in Statistics," in Multidimensional--, Data Representations: *en and , ed. Ingwer Borg (Ann Arbor: Ma'thesisPres, lvui), pp. 44;4571k--- .
3. John R. Hauser and Frank S. Koppelman, °Alternative Perceptual Mapping. Techniques: Relative Accuracy and Usefulness,"' Journal_of Marketin
Research, November 1979, pp. 495-497. '
r
REFERENCES
..
. .
Assael, Henry. , °Perceptual Mapping to Reposition Brands," Journal of Adver-tising Research, February 1971, pp. 39-42. -
, %
'Boil, Ingwer,ed. Multidimensional Data Representation: When and A.",Ann Arbor; MathesisPress, 1981.
. ,.. .
Haley, Russejl I. "Benefit Segpentation:' A Decision Oriented Research Toq4," t
Journa_l of Marketing,Auly 1968., pp. 30-35.
Hapser, John R. and Koppelman, Frank S. "Alterativ44erceptual'Mappiny. OP
1 Techniques: Relative Accuracy and Uiefulness," Journal of MarketingResearch, NoVember 1979, pp. 495-506.
4: . 4. .P
Kruskal, Joseph B.and Wish, Myron. Multidimensional Scialint. Sage University .
Paper series on QuantitativeApplications in the Social Sciences, series no. ,-
07-011.. Beverly Hills andlondon: Sage Publications, 1978.
'Lay, Robert S. and Bradley, David W. "Arialyztrig----the Inquiry Rool to Develop
Positioning Stfat9giev ApplicatiOn to Two-Universitiest," Planning for
,Quality, papers from the efghthannual meeting of'the North East Associationtor Institutional Research, 1981, pp. 1 -14. , .
. ..
Porter, Michael E. 'Competitive Strategy: Techniques for Analyzing Industriesand Competitors. New York London: The Free Pres's, 198 .
...___(
''..Zimmenoan, George: *Besie Research: Aesthetics 'of Pure Science." The World_4,
at Boston University, 29 September 1982, p. 2, col. 1.
. . .
44g1
4y

The Development Saga 'Institutional Research Database
at a State College
Ndwird.L. DelaneyDirector of Institutional Research
Kean College of New Jersey.
Public colleges and universities have become iAcreasingly pressed in-
4 recent yearsto provide-ever more complex, reliable,timelyland accurate data
about their institutions, particularly students' entering characteristics,
college progress and college outcomes. During the same period colleges, like
r .
other complex institdtions,'have progressed, in the development of-Planning,
_ .
information management and evaluation systems. However, these development
efforts have largely focused on expansion planning and automated dati pro-
mi.ahceasing while devoting less attention to strategic planning d management
information systems.
0r-,
.0401.
The purpose of this paper is to describe the development of an
.
institutional researclidatabase which suppotted planning, 'management and eve-,
luation activitiekat a multipurpose state College. with additional funding
support from a Title III sraP Grant, the Office of Institutional Research Was
expaiided tb improve the efficiency and effectiveness of the College's systems
for planning, information management and evaluation review processes. These
highly interrelated systeiicwere intended to contribute significantly in
developing and implementing the institutional mission in the 19$0's The
0-intenaedresult was to strengthen an.institutional-research function respon-7
sive to the increasing planning, research and evaluation needs of the College
community.L
4.
35
c.

%Ns
ti .
a
The Preparatigh Process
36
A highly participative Self-Study Process in preparation for a
Areadcreditation visit and i long-range institutional planning effort inChased
the campus community's awareness of the importance of accurate and consistent. .
information on profile characteristics of the college's students, fabulty and
programs. Increasingly complex external reporting and program evaluation
requirements provides additional 'press to develop systems which would provide
more easily accessible information on various institutional characteristics,
particularly the entering characteristics, persistence and performance of speJ
cific student groups.
Initial efforts pointed out the difficulties of thepresent oper-
ating system to provide management information for research and planning
purpoSes. The following conditigns were especially noted:
1. Accurate information sometimes was unavailable, either because
it.4as hot collected by a specific operating area or, if collected,
-was collected in a form not particularly useful.
2. Information produced by one file on occasion conflicted with that
produced by another unit's'file.
'3. Documentation and procedures in-generating data files sometimes
contributed to the collection and storage of inaccurate or missing
'data.
4. 'The lack of file documentation and data- elkment definitions led
co union in identifying and utilibg appropriate information
sources.
'5. Many research'and planning issues required data elements from
42
a

several operating units and/or data files.
37
These conditions produced a fett need within administrative circlet
to begia process of creating a series of managemeht information systems
which would provide user-friendly access an would be less manual labor intent
sive. Because student-related aggregate datware most often sought and most
difficult to 'obtain at the level of analysis sought, initial efforts were
concentrated on the development of a longitudinal student databank system as
an institutional research resource.
While vast amounts otudent data are colledted and:electrvnically
processed, they tend tb be neither carefully maintained nor-greatly utilized .
foK planning and dei processes. Accurate infdrmation needed for
planninciand policy determination often tended to be neither.readily available.**
nor consistent among source providers. Documentation and procedural guidelines
were to be neither adequate norfwidely uhdekstood across administrative
units. These factor's served to have administrators 1) ofted misunders nd or
mistrust the inforeation they did receive, and/or 2) be pereexed as to ether
reeded4nformation existed or, if so, where to obtain it. '
\,6
Organizing 'the Effort
Through funding from the Title III Grant, additional research staff
and computing equipment were acquired, as well as the services of two con- -
suiting agencies.
1 A
Responsibility for the development effort was placed primvily With.
the Office of ilstitutional Research with, the intended involvement of the
C4Computer Center an othef-data providers and users.
4

/10
38,
The organizing role of the institutional research office seemed
legitimate because it could provide a unique. institution -wide perspective. The
institutional research office tends to use data from many ofethe operating0
systems and often has' need to i&tegrate data from diverse sources As Dressel
(1972) has noted nearly a decade ago, the institutional researcher seems to be
in the best position to be generally knowledgeable about the structure and con-
tent of'tlp basic operating data syjtems and their importance as a college-wide
resource. .
4.
Two consulting agencies comprised a highly qualified team with top =
acadric management and technical commuter compel dies attempted to.facili-..
tate the process by helping to gerrate broad administrative support for the
approach as well as specify procedures and suggestions on implementing the
project?. A management plan for the Office of Institutional Research, which_ 4
.
included a clarification of office functions to support institutional research
and planning, information management and evaluation eystems,,atemptea to. .
clarify its role and function, and provided furthexiegitimacy for institutionals. .
. .
research to take.prime resporisibility for the databank's development and uti-.
4
. lization.
refs
The Computer Center is another administrative unit within theP ,
college which has the potential for a college-wide perspective .on at least
those data which are gathered and electronically piodessed by various oper.-
sating units. The Center provides a central role not.only in data processing,
but increasingly in the logidal structure and design of the'various trans-.
action data files.maintainedby major offices such as admissionWregistrar$
'and fjnancial aid. The consultant team attempted to develop a management flan'
for both the .Office of Institutional Research and the Computer, Center. This. .
. .
40
a

39
intervention was intended to provide a?model for the functional relationship
between these two central unitiand thusficilitated the development process.
ti
Although the institutional research office and Computer Center'have
a general overview of the interrelationships among most of the data providers
and users, no single unit can be expected to have an in-depth knowledge of
every specific operating area or data system. Data user and provider groups
have the greatest insight and understanding of specific data required or4
available in their areas of responsibility. Thus,'there seemed to be a need
to involve.knowledgeable representatives in the development process;
guidance was sought from a small working. group composed of individuals with
some institution-wide terspective and extensive familiarity with a particular
data provider or user area. Such a group was quite instrumental in clarifying
the information needs of major potential users of the databank and the most
reliable sources of primary data elements. Their participation is the devel-
opment.
process was intended to.reduce the reluctance to share data ownership
a& lave impetus to efforts' to maintain accorate,and complete 'operating'data,
files.
Findings and Conclusions
Several major findifiqs about the 'nature and use of data have
emerged from the development process which may have ganeralizeitbility to simi-.1
lar institutions. They are:
1, ,Top administrators seem to have little understanding of the infor-
' ftp
Nation potentially available to them And thus they have diffibulty-
articulating their information needs for strategic planning and

t
40
decision-making. r.
2. There seems to be little administrative interest in and hence nos
.
mechanisms for thesyetematic colleetion of information external to4.
the institution, with the exception, of a growing conern,about
enrollment projections.
3. Vast amounts of student information are collected ihd stored on
various data files with considerable redundancy and inconsistency.
4. Although,E siderable labor intensive efforts are expended in
collecting data, especially student aata-, relatively little atten-
tion is given to its storage and updating,'nor to its utilization. in.
stratigic planning and policy deteiminatiOn.
5: Because the individual data systems generated by several operating;
units have been designed as transaction systems to meet the specific
purposes of the unit, there are considerable-feelings of ownership
for those data with little realization of their potential importance
for other institutional uses.
ridrMoreover, the process has also illustrated several opportunities-and
pitfalls for the institutional research functions. These4conclus one are the
tfollowi:gy
1. The role of influence of institutional research in strategic9
Iplennin4 and management information is very much determined by the
commitment of the institution, especially its top administrators,
to data-7based, planning and the proximity of the institutionkf.
research function-to that planning process.
2. While institutional research has the potential for an institution-
wide information brdicerage role, it's sphere of influence is often
44
ot-

I
a
\
41
consciously restricted by thee reluctance to share data ownership by
1operating units.
3. Although Apreatsexpectations are raised,, a specific management7
4nformation system will not anticipate and-be relponsive to all the
inf9FmationItf-AmSlodecision-maXerS. Its purpose and limits shouTd
° be ,clearly delineated at the start.'
4. There is, considerable need-to balance the efforts devoted to a long
range effort with the production of routine and immediately helpful
4
information. If not there is considerable risks that support for
the development effort will be withdrawn'before it's intended
results cati be produced.
5. While the ,cobperation and commitment of the Computer Center and.
other administrative units are vital tosuccessful completion,
institutional research st*f must develop enough technical con
petance to maintain sufficient locus of control assuring some degree.
of successful completion.
The specific approach in theidevelopment of the information system
described here may beldiosyncratig to the pilot institution or its sier
institutions within the state. Nonetheless, the processes and findings from
this effort may have considerable generalizeability to colleges and univer-
sities attempting to improve upon. their management of student information
systems which efficiently respond to increasingly complex reporting require-4
4 40
ments and policy issues.
*Reference
Dressel, P.L. et al. Institutional research in the university: A handbook.
San Francisco: Jossey-Sass, 1972,, 199-199.

UOJECTING ENROLLMENTS AT SMALL COLLEGES
(The Role of the Institutional Researcher)
. Randall Draper
Director of Institutional'Research
Johnsen State College
Vermont,
The setting is any small college with an enrollment of up to
1500 students and an incoming class of about 500., The college
faces increasing difficulty balancing it's budget in'an era of
shrinking resources and a declining student podl. Toqgh decisiOns
need to be made about curriculum, personnel, Capital projects, an4
even maintenance.
The problem is a lack of consensus about expected enrollments
among the key offices of admissions, financial affairs, the
registrar and the-president. This situation,reads to inaccurate
enrollment projections, poor planning, and inevitable financial,
shortfalls and surpluses.
To those of us trained in large research institutions, and
who make a living collecting and analyzing data,'the solution-is
simple: develop*an "information rich environment" through a
computer-based management information system. In other words, a
terminal for every administrator and a programmer for every
.terminal. (Not to mention a word processor for every secretary.)
Unkplievably, some administrators are Skeptical. They argue
that the size of the college doesn't demand such a scientific
approach, to planning. After all, "this isn't the state univer-
sity. We lipow from experience what to expect from day to day
and year to leer., If we want to know what students are planning,
we'll just ask their guidance counsellors."
Perhaps ydu recognize the clgssic confrontation between the
scientists and wizards, of management.
The following paper argues that the solution to poor enrollment
s
48.

43
projections lies not in science nor wizardry-, but in4Olitics.
In effebt, small college institiltional researchers shOuld
-probably spend 25%-of their time collectin5 data, 25% analyzing
that data, and 50% repoTting, interpreting, and seeing to it
that the resultant inficmation gets used. At .all costs he or she
should avoid getting lost in the procesd of'data collection and
storage. A little knOwledge goes a long way and doesn't demand
sophisticated instruments or machines. -
The following example of a modest, perhaps unsophisticated,
,enrollment prbjection system serves to illustrate the-point. The
"system" includes three components: preliminary projections,
the development of consensus, and year-long "adjustments." based
upon a cldse monitoring of recruitment and retention.
(
4

4
44
NEAIR
October '82
Predicting Enfollmehts at'a Small College
Begin fiscal yearJuly 1
4
.
Augusi-1
Oct
Historical Projection!
- J.
Historical Attrition-ad
:
Population Market ShareCharacteristics
le.,Immediate Demands
L.
PreliMinary Projections
(7:
.. 1 ' I .miss°Advions --.
1: . J . ). .Regfrbtrar , .. -.....13usineas Office
''Z' -'''
. j°4% s'.11.
IA.
PresiLnt's ffice ". .
(Insti-tutisoal,R, search) . .
..., 14 ,
Consensus.
6: 6, etentio piing RecrixAmeut,,.
II .
-to No,ng Retention/Fall Recruitment,
June 1
Cycle endsJune 30
Adjusted-Projections
511
41
2

45.
PRELIMINARY PROJECTIONS
This component begins with the accumulation of base-line
data on past enrollments and student characteristics supported
by a close monitoring of-external and internal influences on
the student market,.e.g. the size'of the'student poolor cur-
riculum changes. Specifically,
A. Historical Piojections:
Statistical' analysis of.eniollment trends either by liregresei4r,
or comparison of average changes semester to semester and
sub-group to sub-group. (e.g. state residence, academic .
major, on carpus/off campus)
H. Historical Attrition:
The weighted average of dropouts by class over ay.east a'
four year period.
C. Market Sha40:
The identification of primary andieccindary markets based
upon the geographical source of inquiries, applications,
deposits, and registrants.
D. Population Characteristics:
profiles of incoming, Outgoing, and graduating students
by number,'ac sex, residents, major, etc.; the,analysis
of the student ool by number of high school and junior
college graduates within pfimary and secondaty market
areas by age, sex, academic and career interests, etc.-
R. Immediate Factors;
The effect of local and national econ9my on career patterns
and financing, an education; expansion of contraction of
specific college programs; institution of new marketing
strategies, etc./
,/ The ats;mbly of the above.. information depends on the' avail-
ability of existing data at the college, and from local, state
41,

46
and national, agencies. Be advisbd that it is nevevas compre-
hensive, organized, nor accurate as expected. Very often, especially
at smaller institutions, the proqess is tedious and time consuming.°
Be prepar4d to take up residence in the Registrar!s Office.
4,
The second component, achieving consensus, 'is deceptively
simple, yet often ignored because of internal politics or pooi
communications.
The key to achieving consensus is the' establishment of clear
definitions and the existence of a medium through Which' to compare
expectations.)
Among many, the key concepts to be defined are:
CONSENSUS
FreOmanSophomoreJuniorSenior
RetentionAttritiori
In-State StudentOut-Of -State Student.
The natural medium for achieving consensus is the Office,of *,
Institutional Research, or more specificglly, the institution-al
researcher skilled in communication and negotiation. In essencesef A
the researcher's jobonly begins with the development of preliminary
projections. Accurate prbjections in the absence of clear under-
standings and mytual agrepment among the key officers of the college
FreshmanTransferFormer StUdentLeave ofAbsence
Returning StudentUnsure StudentExiting Student
is a- purely academic endeavor.
Therefore, the successful institutional researcher will
commit at least one third of his or her time to reporting, explaining
and evaluatinhe use of information. Researcher's at smaller
colleges shoUld spend less time building complicated Management.
Information Systems and more time managing information.
4I 4
A

e,
ADJUSTED PROJECTIONS
d
47
The greed upon enrollment projection is monitored systemati-
'capy thro gh a'series of wekly, bi-weekly, and monthly reports
that comparqooals and expectationi with actual'reoruitment and1111retention.
cruitment (Appendix Al., A2):
Th se two repOrts are assembled every Friday after the final
elivery of mail. ThePare distributed tp key ,administrators
efore the end of the workday and then discussedhsat i.he President's ,
staff meeting Monday morning:-
The reports enumerate the number of applications, acceptanies,
/...,0epOsiti, and withdrawals of deposits received during the week ,,
ending,Friday and compare the cumulative totals to the previous
year's total to date and final enrollment. Of:particular interest
is the column indicating the number of depositi received after the
,date of the report the previous year. A compghensive rtport
comparing the last four years week by week is distributed at the
beginning of the. recruitment cycle
B. Retention (Appendix B1, B2):
The pool of actiye and eligible 'students is identified name
by name in an accounting analysis pad and a set of "unobtrusive
measures" of their future plans are reviewed regularily, eg.4preregistration, request for transcripts to i5e forwarded,
forwarding addresses left at the mailroom, and-hearsay evidence
from faculty and staff, Subsequently, a decision is made as to .
each student's intentions-to return or to exit based upon previously
agreed upon decision rules, eg. preregistration and ,one other piece'
of supporting evidence classifies the student as a "returner."
This informatioh is reportqd to the President's staff biweekly.
4Towards the end of each semester and once during the summer
faculty contact any of their advisees about which insufficient
information exists to make-a decision. This serves to clarify
. projections as -well as' act as an excellent retention tool,
C. Measuring PrOgress (Appendix C):
- Once a month proillyress towards both budgetary a College goals.
. . .
.
is reported in a format that outlines the'best and the worst .
potential outcomes.'
.

48
The "least to date" Column includes only, those students definitely
expected to return and those on a"Leave of Absence that' have
preregistered while "most to date" counts nsures" and all.
LOA's eligible to return: In both cases; ly former stude s, ..
transfers, and freshmen with deposits are ounted.
Ie
To summarize, accurate enrollment, projections are no less
important for the small college than cotf the large university.
Unfortunately, often the tenancy is for institutional .researchers
"to overcomplicate the process while administrators oversimplify it. .
The solution is for institutional researc hers to become mere than
tpurveyors of information and to enter the political process at.
AtItheir institution. This can be accomplished through the development
of a straight forward .process for enrollment projecting which -,
enables the researcher to s#end more .time working t ards consensus"
and assessing the viabilitrbf budgetary and colleg 4poals.1
eve
r
1.
4if
f
V
R.
...
;e4

C
APPENDIX Al
49
(802)635.2356
. ti
Weekly Statistics Reports for Fall /Summer /Spring 198Week Ending Friday, , 198
4. -
Week's Activity' Cumulatilte at End of Wopk
TotalApps.
....
ACTIVE APPLICATIONS
. Total: /----7
VT: ti:
OOS: F:F:T:FSR:
.
,
Recld: / /VT: M:00$: F:F:T:FSR:
'TotalApps.Accpt: L::::7
Vt:00$:
R:
A:F: P/A:T: EDP:FSR:
...
ACCEPTANCES
1, (
Total: L:::::7
A:VT: t
00$: AF: P /A:
T: EDP:FSR: k
tal .
tposits
DEPOSITS,
Rec'd: / Total:
VT: R:00S: A:F: P/A:T: 'EDP:FSR: t
VT: R:00S: 'A:
F: P/A:T: EDP:FSR:
.
..
-TdtalWithdrals.
tWITHDRAWALS-----77-o---
.
Ree'd: "- / Total: jr /
_VT: R:00S: A:
.
P/A:1 EDP:
.
VT: R%DOS: ° A:
P/A:.
EDP:.
..
0
*-
* 7 I ' eCompared to r 19$
,
ACTIVE APPLICATIONS ,
.
.
Total: /"---7
VT: A:06S: F:F:T:.
FSR: ''
.
ACCEPTANCES
.4
Total: L----7
VT: R:
OOS :. As-
F: P/A:T: EDP:FSR:
.
t
'DEPOSITS.
Total: /----7
VTiP.. R:1
OOS: A.F: P/A:T: £DP:FSR: ,
WITHDRAWALS ...
4.
Total: / i
VT: R:00S: A:
.
P/A:EDP:
55 ,
a

/( 4
APPENDIX A2 .50
r--- .
FINAL ENROLLMENT DEPOSITS TO DATE DEPOSITS RECCIVEDa . AFTER THIS DATE
. .._ FALL 1981 FALL 1982 , LAST 11:Ail
First -tip e
Freshmen
In-stateOut-of-state
To.;e1
Transfers
4 in -state
Cut-of-state
Total"
FSR
I-state0.4-ofstate
Total
Subtttal
In-state
0..-of-state
Total
lef-state
6rartd Total
In-stateOut-of-State
Total.
(
IIEBHE
=m,
.m..
4
o
.
11

APPENDIX B
Date:
I
#
RETENTION REPORT*
FOR FALLISPRING
IN STATE
0.451
4
Retianking Unsure Not Returning Total number eligibleto pre-register
.
C
..
Returning
OUT .STA1E
..
.
_
Unsure
.
NoReturning. ,. -.
.
..
Returning
.
COMBINED
Insure Not Returning
,.
.
..,.
.
.
4
I 01
*working report57
4
. too
Total number 4i10.bleto pre-register
100
Total number eligible. to pre-register
100


APPENDIX C
of
Returning.ptudents
LOA'S.Returning
FSR's
Transfers .
Freshmen
TOTALS
w
PROJECTE6.ENROLLMENTS
Date:a
53
Least MostBudget Goals, To Datc College Goals To Date
1*.
1
t A
.4

s
ST/TUTIONAL SUPPORT COSTS: rA COMPARATIVE STUDY
John A. Dunn Jr., Vice-President, Planning, Tufts University
ABSTRACT f
This study analyzed the relationship of 'six institutional chara0ter-p.istics to institutional support expenditures. The share of operating
''budgets spent on executive management, fiscal and information services,logistical 'services, and community relations and fundraising, was foundto be inversely related to total budget size for a sample. of thirteenindependent moderate-sized universities.
BACKGROUND
It is instructive, in assessing how well a college or university is
managed, to ask what share of its resources go into internal administra-
tion and support activities.. While such expenditures are essential, 'they
use dollars.otheriiise available for,teaching, research, financial aid or
other needs.
There are no commonly acpaptad standards for the amount which should. 4
be spent on "institutional support." Spending. too much diverts resources
from the institution's primary missions; from the faculty's point of view,
anything'is,too mush.' Central administrators argue, on'the,i)ther hand,
Oat cutting resources back too far may curtail needed direction and
.support, and may 'damage the institution over the long run.:' Tufts under-
took the study of.expenditure patterns as part of its long -range 'budget
planning.
METHODOLOGY-
Twelve other 0 lieges and universities viewed is being roughly similar
4 to Tufts'in s v al important ways were selected for the study; Boston
College, Bost University, Brown, Dartmouth, Emory, Georgetown, Johns
Hopkins, Princeton, Rochester/ Vanderbilt, Wasbihgton University, and
Yale. Ail are independent institutions; .all are universities with both
graduate and professional schools; and all are of moderate size, at least
as' compared with' some public university giants.
61C
te

55
Three direct and three derivative measures of institutional character-
istics were thought to be related to institutional support expenditures.
The direot measures, total budget, total FTE enrollment, and number of
degree programs, seemed to be measures of institutional site and scope,
The percent of enrollment constituted by undergraduates was a dertved
measure of concentration, on undergraduate education. The other derived'
measures were.numbeyf students per program, which gauged institutional
complexity, and budgit per, student, which constituted a crude composite
measure of institutional and of program Fix, including the presence
of substantial sponsored reseafrch. Data collected from the registrars of
the institutions sampled are shown.in Table 1.
Table 1! Institutional base data 1981/82
Studs./
Program
Ope r
Institution BudgetFTE
SkJ510AStudentBudget/ % Degree
Undergr programs$000
Boston Coll. 96,701 17,430 5,548 71 8 2,179
Bost4 Uhfv. 1264,606 27,044 9,787 48 14 1,932
Brown Univ. 111,429 6,914 16,116 77 6 1,152
Dartmouth 103,849 4,389 23,661 80 5 878
Emory 82,862 8,154 10,162 52 9 906
Georgetown q..150,522 13,652 11;026 r 50 8 1;707
Johns Hopkins 26,492 9,904 27,008 47 7 1,415
Princeton . 227,000 6,10 37,2061
74 3' 2,034
Rochester 191;083 8,966 21,312 56 1,121
Tufts , 101,837 6,441 15,811 68 11 586
Vanderbilt 105,988 8,942 11,853 61 10 894
Washington U. 176,106 10,804 16,300 63 9 1,200
Yale 327,500 10,097 32,435 51 8 1,262
Questionnaires were sent to the twelve universities; telephone inter.,
views were conducted for clarification. ,The questionnaires requested
'schools to provide 1981/82! budget data, following the NACUBO ohari of
aocount definitions..wherever possible. A copy of the questionnaire and
C
62

.56
Ar
instructions is aVailable 'fromithe °author, on request. In the interests
of comparability, several editorial modifications were required:
.4where seniorlevel salaries were lumped in a single account rather
than, attributed to ,functional groupings, they were reassigned based on
numbers of people in each function, after consultation with respondents;
functions were rearranged to resemble the author's institution
where there were significant differences;
operating expenditures for hospitals were eliminated from total
institutional expenditures;
in one'instance, 1982/83 budgets were supplied and reduced to
1981/82 levels'after discussion with the respondent.
Institutions were asked to be as inclusive as possible, regardless of
how they.report'internally, so as to be sure that comparable expenditures
`ere identified. For instance, fundraising' expenditures on capital
campaigns are sometimes written off against capital receipts instead of
against operating incomes; wherever possible, such expenses were included
here. Thus some institutions will show higher support expend,ttures here
than those shown in their own accounting.
Comparability in executive management expenses was relatively good.
In fiscal affairs, differences in treatment of data processing madeit
useful to construct a "fiscal affWs and information services" grouping,
rather than segregating those elements. Logistical services were
extremely difficult to compare; only a few common elements were selected
for comparison. Finally, in community relations and development,
differences in titles and functions make assurance of comparability
difficult. Appendix A shows in more detail the elements grouped in each
category.,
Derived measures were constructed for the data and relatiofiships were
analyzed with correlation and regression technkquts. SPSS subprogram.
regression was used for this purpose.-
63

*.
\-57
RESULTS AND DISCUSSION. .-
For executive management fiscal and information services, certain
logistical services; dhd community relations and development, the insti-
tutions sampled spent between 4.8% and 10.7% of their operating 1udgets.
as shown in Table 2.- o
High
Mean 2:2 1.6
Median 1.11, 2.1 1.6
Low 1.4 .8
.Table 2: -.Percentage pf Institutional Operating BudgetSpentfor Institutional Support, 1981/82
Exec.' Fiscal LOgist. Community-& Info Svcs Subtotal Rel & Dev Total
2.6 3.1 Tir 7.4 11.7
2.3 7.6
2.0 7
1.1 11.8
5.2 0
4.9
3.6
10.7
The distribution ofAudget shares spent for the institutional support
elements is shown in Figure 1. .For, fiscal and informaAon servicei,
shares tended to be closely grouped;.for, community relations and develop-
ment expenditures, they were.wid 'spersed.
An exploration of the atmpl relations.(Tat4e 3) between the insti-
tutional characteristics ,ind budget shares for institutional support
components shows that the larger a_university's total budget, the smaller
the share for institutional support. A possible explanation is that each
institution, large:or small, requires certain minimum levels of support;
beyond that base, support. expenditures grow less rapidly than,_ total
budgets, This relationship holds for overall institutional support and
for each of the components except fiscal and information services: where
the rel4ionship'is too'weak to be significant.
:The- proportion of Undergraduate students to total enrollment/lis
related only to development expense. it may be that heavily undergraduate.universities may depend more substantially on fund-raising incomes than do
those with higher proportions of graduate and" professional schools ere
. research. income may be mope significant.
The more degree kograms an institution offers, the larger.its budget
share for fiscal" and information ' services. _Evidently, where there ar9
many programs and deans, there is a need for more (and more widely avail-
able) financial and managerial,data than,in less complex institutions.
64
I

FIGURE 1
INSTITUTIONAL SUPPORT COST ANALYSIS
SUMMARY OF COMPARABLE ELEMENTS
PERCENT OF TOTAL OPERATING BUDGET SPENT
INS T, COMPONENTS INST.
BUDGET % BUDGET %
5.0
4.5
4.0
3.5
3.0
2.0
\ 1.5
0.5
a
ir
EXEC.
MGMT.
Is
'12.0
11.0
10.0
9.0.
8,0
5.0
4.0
3.0\
2.0
1.0
FISCAL IENERAL COMMUNITY
& INFO. ADMIN. & REL. &
SERVICES LOGTIC DEVELOPMENTSERVICES
0.0
r.
0.1
58
TOTAIS
TOTAL T91AL
LESSCOMM:fte.
& DEV.
41,
ti

0
59-
.
Budget per student, as noted earlier, is a crude measure, relating in
part to institutional wealth, but also to the mix of programs, and to the
prebenoe of Significant research expenditures. it seems clear that the
bigger an institutfon's budget is in relation to the number of students it
has, the smaller the share of. its budget that goes for_ executive manager
ment and-iisoal and information services. There does not appear to be a
relationship between budget per student and development expenses or
logistical expenses.
The number of degree programs, total enrollment, and number of
students program do not appear to be broadly useful as-predictors of
institutial support expenditures.
le
Table 3: Pearson correlation coefficients between inst
/tutional
support expenditures and institutional character ics '
% on % on % n % on Subtot TotalLo St. Devel. exc Deli. PercentVariable Mgmt. Fiscal
Budget -.58 * -.40
Total FTt .36 .52 *
% undergrad .09 4-.02
. Vstudent .
i'ograms'. -
Stu /program
-.79
.39
.13,
* -.75
.50
, ..29
**
.=.51 * -.65 ** '-a,-.59 * -.79 **
-.40, -.47 .21 -.17.
*2 .65 ** -.02 .38
-.117 -.14 -.67 ** -.45
-.08 -.07 .33 18'
-.25 -.56* ' +.06 -.32
Correlations marked * are significant at the .05 level.Correlations marked * are significant. at the .01 bevel.
The mutual contributions of the siic institutional characteristics in _
explaining differences in institutional supporrt shares wereexamined.with
multiple regressions. Initially all%
six factors"were included,,but,the
results were inconclusive, Based on the simple correlations shown above;
it w thought that the overall budget and budget-per-student variables.
may hav interacted in such a way as to v9nfoundthe analysis. Hence the
latter valiable was left out and a second set of analyses performed.
Taken }together, ,;the five variables '-- total budget., students per
degree program, number of programs, total' enrollment, and percent under-
graduate -- explain most (78%) but. not all of the variance in institu--. .
tionaI support shares between institutions (Table 4).T' ' ""
Ole
Y.

Table 4: Multiple regression F-ratide and other statisticsomitting budget-per-student
1
Predictors
60
Subtotal of executive,fiscal and logistical Total instibtional
services support services"Students per program 6.932 * A.860
Number of programs 4.08 2.997
Total budget 16.307 ** 7.503 *
Total enrollment 3.049 1.580
Percent undergraduate .739x
.912
'F overall 5.425 * 4.144
{ R2
.82 .78
?
-* = significant at the .05 level.** r. significant at the .01 level.
In this analysis, total budget clearly emerges as the most powerful
predictor of the percent spent of institutional support.1
Further analysis of the relationship betweenbudget and institutional
support shares was undertaken. After experimenting with a numberiof
curvilinear relationships, the log of budget was found to be a better
predictor of institutional supfltt budget shares than: was tie absolute. .
value. The results of the linear anddlogariththic regressions are short
Table 5, and the resulting logarithmic curve is depicted in Figure 2.. .
;Table 5: Linear and logarithmic regressions
Subtotal of executive.,fiscal, and logistical Total institutional.
Item services support services
Linear regression:'(y = a + bx)
a 6.93 11.07
b -.00001
R2
.34 :63
fl
F 5.25 ' 16.69'1*
Logarithmic regression: (y = a + b log x)
51.29a 27%28
b -1.86 -3.68
R2 0. .
.65
F 5.87 * . 16.6}9.44
* = significant at the .05 level** = significant at the .01 level
a*
t

it,-1 . FIGURE .2
..
RELATIONSHIP BETWEEN OPERATING BUDGET AND PERCENT
' SPENT ON INSTITUTI001 SUPPORT: 'SCATTER PLOT AND
. ZESTY FITTING LOGARITHM CURVE,

62
Four of the'se universities paid all instifutional,support costs out
of genera, revenue; four charged back all costs to schools or other cost
centers; the remaining five pursued a mixed strategy, meeting some costs
out of general revenues but charging others to cost centers.
Although the institutional characteristics identified in this study
explained much of the variance in institutional support spending, it is(
clear. that there are other factors at work which this study did not
capture. Futuretstudies_might inveitiAte such items as urban vs. rural
location; single vs...qultiple campuses; centralization vs. decentralization
as 4a managedent style; research as a share of total budget; relative
stability'of.the institution vs. rapid growth and development; presence or
absence of major capital campaigns; and ,continuity of leadership vs. rapid
'changeover of senior personnel.
ACKNOWLEDGEMENTS
Gratitude is expressed to Steven S. Mans, Tufts Executive Vice-.
President, Who identified the need for the survey and read early /rafts;
to Dr. Leah'il. Hutten who prepared the statistical analysis; to Elizabeth
A. Cooper who prepared the tables; and, most importantly, to the respond-
ents in the institutions surveyed.. without whose willing'and intelligent
cooperation the -study would not have been poisible. .
I.. ,44, 'at.ri t om"
If

t
63
NDIX A: INSTITUTipNAL SUPPORT EXPENDITURE. DEFINITIONS
Executive management includes:,
oe - governing board (trustees' office. corpokstion secretary, etc.)
111- - chief executive officer (president. ohancellors associated expenses)- chief academic officer (senior academ0 officer on each campus)
- chief business officer (executive vice-president'. Oce-presidents forfinance, business administration, plant and services. etc.)
- planning and budgeting budget offices, planning, inst. research)legal counsel (internal and external)
- equal employment opportunity (affirmiiive action, etc.)Omitted nod-comparable items included: academic senates; investmentmanagement expenses, some of which showed up in operating budgets but mostof imhich are charged to investment incomes; cnap/aincy,' _or equivalent;,
other activities such as uniiersityAlistorian, university professor..P. - 9
Fisdbl and inforiation services included:fiscal reporting items such as accounting, cashiers, grant and
contract administration, internal and external auditing;- ad inistrative data processing, mgmt. inforMation, anct systeMs devel-
o ent. Since some institutions bill data'processing to users, notcosts may,. have been captured in this category.
Logistical services'included:- employee personnel and reach*: 0
- purchasing;.
4- environmental healtheand safety;
.r
- , security. .
Other items varied so widely as to be non-comparable.
, Community relations and development included: y ;
- Vice-Presidents for Development, Iublic Affairs, and similar4 activities, plus other development staff and costs;
7 Public Information, Public Relations,. and Publicatillifexcept for
catalogue and bulletin costs; ,
- Alumni Relations;0 - Fund - raising, capital fund-raising, "relations with schools" and
-government relations/resources.. 7
1U

4
a
PUBLICATION USAGE INDEX (PU1):A QUANTITATIVE METUPD OF EVALUATING HE
PUBLICATIONS OF FENCE FACULTY
Dr. Gloria J. Dyer.
is. Department of Biology, 1
,Fairleigh Dickinson University
With the prevailing academic problems related to finances and enroll-
ment, quality will ofx0Cessity'increase in importance on college campuses
.if tiori s.to survive. Quality of faculty research actiyik must
be ncluded, in.futur hiring, promotion bnd tenure decisions., .
d ie measure of research activity may be found in a faculty'member's
publications.. Accoi-ding tp the results of .a survey by Statup and Gruneberg
/(19794 ";.i ..elliinic rewar4s:in the form of preitige and promotion f16.4
',:..4
not s1!!h ,from. -reserch,actftity as from its products -- particularly
< 4
pOblishedlima.terials.k. They go.. on to report that 55% of the' respondents felt-%.
4'_.
_ ......,-.-.
.1,7 presspre to -do7.riarch'an4 publish for promotion. This pretsure was
.. , .r , /
felt by g0":6% ofSendon Lecturers d 93.3% .of Lecturers.
_.,
4 ? ' While 4t is easy tb count= the pu lications and determine numbers,.v,,
da defermin4tion of\the quality of,the p ions is more difficult. This9. .
.--- . , --- -. ..._ .
- dif ictjtxmay tle-behthd Batista's4observat on in hii review of the literature... ., . .
..., -( 976), that'*pkedominant criterion.in college teaching is research and
publicationS,'whtch-ire of evaluated but only counted.
The purpose of thi study was to determine statistically if, publications
were,min fact, being used in promotiolis in science departments of two'
different institutions; to determine statistically f lications were
counted or evaluated for promotion; to propose a method of quantifying .
scientific publications.
64
e,
. ,
4

65,
(Zissimilaeuniversitjes were selected for tampling, School A is'a
large, state-supported, urban university with a student population of
approximately .46,0001 Doctoral degrees.are awarded in the sciences.. The
University consists of six campuses and thirteen colleges. TAoldest
college of he University offering a broad currieulin the arts and '
sciences was sampled. 'School B is an independent, u n and suburban
university with four` main branches 012 three campuses Serving.approximately
14,000 graduate and undergraduate students.' School B does not award..:-:
r doctoral degrees. It is in a state other than that of: School A.
Three measures of faculty productivity were researched. They were
the total number of publications, p ication dvaluations, and citation
counts. These measures were obtAined for the five yeari preeeditg faculty
promotions in the science departments of the two different institutions.
The time i.ange of the%
14study encompalsed years from 1964-1978.
7
P.
The faculty sample consisted of 157 promotions to the ranks of assistant,
associate,or professor in the ten years and included bOth males and
.
and females.. Promotions were determined frdth old cataloguesand school
r
newsletters, and'were caplarmed by the inlaiduals ip the sample 1;1r by corrobor-
i
ating information,in other public files. , .,
, (
PUBLICATIONS.
d,
I
.
e r
Publications provided Oii data base for the publication count:pub-. .
:: 1lication eialuition and citation'count, This'study uses the publication
. . . . .
count to determine if it correlates with publication evaluations and citation
counts. An evaluation of the publicttion was made according to a weighted.
scale in the manner of Voeks 41962i, and Siefried and White (1971). .
O
0
1
I

0. 66
However, evaluation was based primarly on the "impact ratio" of the
journal, Is listed in the "Journal Citation Reports" volume of Science
Citation Index. The impact rating is "a measure of the frequency with
which the 'average cited article' An a journal has been cited in a particular
year." (Journal Citation Reports; 11)74Y. Those journals with an impact
rating of one or greater were weighted with three points.. There are
approximate* 750 journals. with an impact rating greater'than one. Thosesi
journals with an impact rating less than one.but listed injeWere weighted.
two points. There are app'roximately 1',706 journalsvath an impact ratio
.lets than one. Those journals which were notsone of the approximately 2,500
journals listed bySCI were given a one pointweighting. The weighting.
scale .is as folloWs:
Annual'Review Volumes, Symposia .: . 5 points(5/n if n.authors)
\
Monographs (Indludes all published booksexcept textbooks anti. edited
' , voluniesT ... -.., 4 points',.6 .. (4 /n ii n authors)
.
Articles in journals' haitog an impact "f. .. %- rating of one orgreater :. 3 points
' (3/nif'n authors).
Articles in joulfnals having an impact ... 1
rating less than ome, speciality and -
regional journals, contributions to ..,
encyclopedia, proceedings . 2 points
(2/n if n authors).-
.. ,
All, 6th4 pUblications* . 1 point4 . .
. (1/n if n authors)
* textbooks, edited books, signed research eports, chapterfIin books, discussion papers, book reviews, abstracts, bibUographiei,guide books, published memos and bulletins and government documents,letters, manuals, audio-visual authors. Not considered.4.' to be .published,' ERIC articles, 'ghost writing.
r
ir

t
67
Citation count -- The Citation Inde)c volumes of Science Citation Index
. `1n4rvide an author listing followed by a list of the.published articles
Citationsand years in Which he/she has been 'acknowledged by a citation. Citatiohs.
were counted for the fide years prior to proiotion.
The study olf ublibtions-rifl be commented upon as applied- to the
total sample and at specific schdols. The publication daunt In the sciencel.deOartments in the schools studied was the single most important promotional
, category af several .categories studied. The results of an analysis of.. .
.
variance for the total .sample are seen in Table 1.
The datapresented below., are in agreement With Aleamoni and Yimer
(1973), who report the academic rank of an instructor seems to be.more
highly related to publication* thin to other criteria.. .
Publications were examined in relation to the citation counts and f.
the publitation evaluations; as well as a simple publication count.
tignifidant positive correlations were, obtained, as seen in Table 2.
TABLE 1
ANALYSIS OF VARIANCE FOR DATA,CATEGORIS BETWEEN RANKS
Data, tategOry r (Probability) +0 ample Number
CitaticCount F.= 2.76 (0.07) 156 .
Publication Count F = 5.82 (0.004)* 156
PUblication'Evaluition F . 6.13 (01003)* 156
Grants., 4.\ ). 1.16 (0.32) 156
Student tvaluation F = 0 (1.0) 103a IIle
* p - 0.054s

r
TABLE 2
68 .
_
PUBLICAflOCOITRELATIONS FOR TOTAL SAMPLE
Publication Citation PublicationCount Count Evaluation i"
Publication
Counte
Citation Count
PublicationEvaluation
X 0.51* 0.89*
0.58*
X
I
0.-05, 's
Publication Cotint Versus Publication EvalUation
The strong oorrelationbetween the publtaatien count and evaluation.
(0.89) would be -expected. A prolific writer stands a better chance of
haVing his work appear in journals than does a sporadic writer. A person. .
who writes very little e expected to havia low pUbl)cation
evaluation.. While diametrically opposed, both groups would provide the high.
correlation between publication'counts and evaluations thatvias obtained
: f-.'in the present study asp
:6
The stre of the present correlation'arroborates
-Vie finds of Cole and Cole 6036n.Physics.
Publication Count Versus Citation Count -
The moderate correlation.befWeen the citatiop .end publication count
(0.51) is interesting. Thettcbrrelation implies tha the sample includes.
both many writers who have high puMcation counts and citation.counts
and writers with low publaation and loW citation counts. 'In Addition,
there must be.writers whci have high publication counts but low citation
counts, and vice-versa. Twenty-six percent of the total sample,Nip fact,
0.0,had no citations at all.
.
"
644
7a

4).
.
69
Table 3 lists examples of publication aid citation counts to illustrate
this point.
e
TABLE 3
PUBLICATIDN AND CITATION COUNTSFOR SELECTED SUBJECTS
Subject PublicationCount (5 years)
Citation'A
Count (5 years) ,
1
2 -
.
.8
7
246
133
3 . 40 110 i'"'
414
174
10
i10 0
'6 9 5
7 39 12.
Subject I has a low publication count with high citation counts while subject
5 has a.high publication count with no citations. The practice of Counting
publicationsis apparently widespread in the consideration of university
proMotions. However, the preceding eramples demonstrate that` counting
.
publicptions does not..gUaraZi'that quality work is being .rewarded.
Citatidn Coudt Versus Publication Evaluation
A moderate correlation between the citation count and the publication
evaluatign was found (0.58). The publication avaluationt'forpch article,Uranged fr6m slow of 1 to a high' of.5 points. A perfect correlation was
- .
not found since a high evaluation could, have been obtained by subjects
with many articles rated at ones point w4th few citations, as well as V
subje s with a few/articles rated higher. ',Table 4illustrates this point.
4
.

a
70
Subject 3 has many lesser weighted articles than subject 4, but
both have the same total evaluation. Publication evaluations, as demonstrated,
have inherent sources of error and cannot be relied upon to demonstrate
qu.ality of work.'
"Publication Usage Index"
Perhaps one measure of the impression en instructor makes upon his
discipline could be obtained by dividing the number of citations by theme
publication count. This "PUI" wou1,6 provide the'average number of times
an instructor's articles were cited by other authors. Table 5 gives
examples of how this would work.
TABLE 4
COMPARISON OF PUBLICATION RATINGSUBSCORES FOR SELECTED suBJecr"4-
'so
SubjectOne TWo
Point PointsAs
1
2
6 . 3
9 0
3 12 1
4 0 4
s , 18 8y ..
6 . 1 . 1,. o
.
ThreePoints.
, Total
Evaluation
2 18
6 18
1
N14
2., ,Aii--.
14
"16 34
12 37
S
I
I
4

e
71
TABLE 5
COMPARISON OF PUI FACTORS FOR .
SEECTED,SUBJECTS
Subject,
publicationCount
CitationCount
PUI
Count
1 12 01 0
2 11 13 1.18
17' 55' 3.24
17 10 0.59
19 240 '12.63
Iv
. #. ,. . .
. A person, such as Subject 1, with pUblications but no citations
would have a zero PUI-factor. 'A person, such as S4bject 4, with
many publications but.efew citations would have a'PUI factor less than
one. Aperson, Subject 2, who averages one citation per article would,
have a PUI factor of approximately one. A person with a few publications
and many citations, sech as Subjects 3 or 5, would have a PUI factor
A.
much greater than one.-
Hagstrom (1971) had used a similar, measure in his study, The Prestige
4.f University Departments." .However, he used mean citations in 1966 and
divided by mean articles pUblished from 1961-19660 Since Science Citation
Index began' in 1961 by indexing only 70b volums (now 2,800 Volumes are
indexed), the Index may not have been large enough to provide the sensitivity'.
needed.. 4
4
447

PUBLICATION USAGE INDEX
If the PUI factor is examined for both schools, an interesting
event is seenlTable 6).
TABLE 6
16 .PUBLICATION USAGE
72
'Rahk School A School B
Assistant Professor 1.93 . 0:73
Associate Professor 6.58 1.38
Professor 6.35 . 2.13
The progression hroigh ranks at School B reveals a tendency to
select for instructors who have more citations per article than those
instructors in the lower ranks. How this selection occurs in practice
was not revealed by the present study.
\...
The PUI at School A reveals that the mean article written by. .
instructors in the senior ranks is cited 6.5 times.` Each article written
senior faculty at School A is cited by approximately six other papers.
This gives some indication of the impression the senior faculty' at School A.,
I .is. making on its respective disciplines.
The PUI at School B discloses an increased (but not significant)
citation rate in.senior ranks, with professors' articles being cited by
two other articles.,
. .
Anais of variance revealed significant differences in pin between
,.
t
the schools (F = 9.68, df = i55, p = 0.002), but.pot between ranks. There
; was no interaction between schools and ranks. Hagstrom did find that avoragq*
9
4
research articles and citation counts combined accounted for half the variance .k
in rated quality-of dipartmehtal *estige%/.
.% ..

1
'TYPES OF PUBLICATIONS BY. DEPARTMENTS
The highest percentage of faculty members published articles in
journals Vied in.Scienc& Citation Index. -A smaller perce/ntage published
in jougnals not listed in the Index. Table 7 lists the drartments and theIP
percentage sf faculty:publishing in journals with different values as
deigcmined in the weighting scale used im'the present study.-. 4,
The departments of Botany,'Geology, and Zoology_at School A have
percentagei oftpubliCation in journals with lower wekgbtings.
These journals should'not be thought of as "lesser" journals: Bathe&
what is being seen is a reflection of the current activivti in the
discipline. If a discipline is in.a less actiye stage,'the journal
'articles will be cited less-frequently and will be accorded ftsser weights.
The discrepancy between departments underscores the need trestablish,
promotional criteria within subdis iplines of science, and illustrates
the dangers of establishing ge ra ized promotional criteria.ne4To summarize, "the data in *icate that while publications are a factor
.
.=
)n faculty promotions, only quantity is measured. There appear to
.
be'no
attempts to quantify publications in any way. The aubliation Usage:
Index is suggested as one way in which pOblicationS could be quantified.....
. if certain caveats were included. One4er would lie in trying to quantify
that exceptional work that does not find immediatp:aCteptance in the field. '-......,.
Another would lie in trying to quantify publications between departments.
However, when hard administrative decisions must be made, perhaps the
Publication Usage Index could aid in judicious Ind thoughtful evaluations.
4d
a4 ,

4
TABLE 7
PERCENTAGE OF FACULTY PUBLISHINGAN VARIOUSLY-* WEIGHTED JOURNALS BY DEPARTMENT
Oepartment
School A
JournalsValued1 Point
Microbio)ogy 43
Botariy 72
Chemistry 43
Geology 78
Physics 24 .
Physiology 67
Zoology 75
School B,
Biology . 17
Chemistry 21
Physics 435
2
74
Journals"' Journals Journals Journals Sample'Valued Valued . Valued '46*. Valued Number
Points 3 Points 4 Points 5 Pbints
a
f .
-57 86
-43 10d
28
71
15
50
'33 83
14 7
87 4 23 '
89 ,7
4 9 7 10 6 -
,100 6
, , , : ,
36 e 54 28 ''
, ,
4
3 53,.
19
41 41 :17
7
12 -\
t
I_BIBLIOGRAPHY'
Aleamoni, L.N, and M. 'timer. Investigation of the relationship between,.colleague rating, student rating; research productivitj and academicrank in rating instructisnal effectiveness, Journal of Educational."Psychology, 64:274=7, June 1973.
.....
ABatista, EE. The place of Collelue.evaivation in the appraisal of college .
teaching, review of literature, g6earch'.4n Hillier EAcation, 4.(3):257-71,/ ...
1976. . ,., ..
,
A ff: '
4.t
Cole, J.R. and,S: Cole, Social- Stratification in Scienc,°U.niversity of .,
Chicago Preit, 197.3 i.
i .. ...
HagstroT, W.O. Inputs, outputs, andthepresttge of university''s 'encedepartmeqs;,Sociology of &location, u0'1`. 44 (Fall): 351-397,-.1971
..
. 4. , r . 6
Journal Citation Rejorts, rnstitute for SOentificjatormation, PkiladelpRSa. .
,...:.. 4 ,

Startup,. R. and M, M,"Gruneberg. Rewards/of research',
Quarterly-, 30;227-38, Spring 1975. .e

e'
Feter t. FaragoOffice of Analytical Services
Boston University
4THE ROLE OP' INSTITUTIONAL RESEARCHERS
IN LABOR CONTRACT ADMINISTRATIONS
Since theleme of this conference is "Doing Institutional Research:
A Focus on Professional Development", I thought it may be appropriate to
.
speak about an application'of institutional research.which may be.nev. to
many of you. Hy topic is the role of institutional research offices in
labor contract administration.
The organization of various employee groups at higher education
IMPAc
institutions into bargaining agencies has been tgrowing movement over the
past 10 to 15 years. Today, in many institutions most employees,
including maintenance,security,clerical, and' professional staff, as well
as faculty members are represented by bargaining agents recognized by the
NLRB. In state systems or multiple -campus institutions, the legal
interaction between the administration and the unions takes pace at the
central administration level Mather than separately at each campus. In
single campus institutions;- this interationtakei place right on campus
and is often far more visible to all employees, student& and parents.
While the involvement of I.R. offices in labor contract related activity
« 1
may be more frequent in single tampus institutions, even in multi-campus.
institutions, much of the data needed to fuelthe process must be supplied
by the I.R. officesrated
/
at 614 individual campuses..
Why,, you may ask,
involve Institutional iearch.offices at all?
'Dealing with sf organizations effectively requires, among other,
things,' accurate up-to-date and quickly reaievable. statistical- and_.
7§ 83 -
A-
0tx

4
0
9
4
77
financial information 'about the bargaining unit. During contrac t
negotiations, decisions dare made and remade ina relatiAly short and
stressful time period. These decisions often involve policies and major
...,financial commitments for several years into the future. During the life
,
of the contract, exact adminiatraflon of contract provisions, timely
reporting andIxonitoring of imple changes. and the ability to access,
1
analyze and present historical data fol.....frievance asses are1 sll
essential. Errors at any of these stages can,be both financially and4
politically costly. The combination of skills- and data required to
respond to these needs, typically exists in the institutional research
office of the institut &on. Just exactly how'can I.R. offices help in this
process?
<IN
TYRES OF SUPPORT NEEDED IN LABOR CONTRACT ADMINISTRATION
.s0
/
During Contract Negotiations
#Contract negotiations typically involve the two parties presenting
thelr Pespective proposals, which beCome the stacting point for the
negotiations. During the course ol the bargaining, different parts of a
contract are hammered out one at a time. Usually each aide has a handful'
of key issues iihich they consider important enough to fight for and other
1144,
issues Which are "Straw ten"' proposed emly to be "yielded" during the
bargaining . The key to the administration's stance on many of these
issues, primari ly concerning wages (or salaries) and fringe "benefits,0
cost. TherefOre, at eJeh stage of the_ negotiations, from .original
proposals to final contract', the cost of each alternative must be quickly
a
4
,
and accurately calculated'. This is where the institutional research*
t"
.
...
office comes tn. With occess eto the beceasary data snd,dstie procesling/iI

fre
78
.
that office can model benefit cost's in a yay that will allow the
cost of proposed wage increases or benefit changes to be calculated
reliably and quickly., Our experience Was been that this .type of model.
needs to use individual' data, about bargaining unit members, rather than
aggregate data, and combine these with changeable parameters.
Using individual records rather than aggregate data is not onrlikely to
yield more accurate results but alsb allows far more, flexibility n the
analysis and, costing of alternative contract scenarios.
Develo ent of Comarative Statistics.
41.
J a I
In the course of normal labor' relations, one party 04 both will'
.
*inevitably resort to presenting comparative data to support their own,
Peposition or to discredit the opposing position. This is another area
where administrators will turn to the institutional research .office for
help. Itis the responsibility of good institutional researchers to. have
Vat .their fingertips the most current statistics aksout their own
institution as well as about other comparable institutions. addition,
current and historical regional and national statistics must be accessible
'ranging- from the Consumer PriCe Index to various labor and. tensus.
statistics. Even mow important than having the a'ailable data is the
need to have institutional researchers who can critically evaluate the .
rplevance of the, data and correctly, interpret them.a.This is one point
where the skill and the intellectual integrity of a good researcher can. .
often be put to the test.-40
. . ...
During the Administration of Contract,.
The -final contracts negotiated, zgpecially;thlos involving f,
% , -CI
y can often call for complex allocation schemes aimed at achievkAg very
.. . c)1
\
41'.
.)
la:0!"
.A.
I
4
a
specific aresults affectingylifferent, groups
79
. .
in the bargaining unit.
typical -example for facility may knvolv different benefits as a function,
of longevity, academic rank, and academic discipline. The institutions
.
0* data processing facility may not.be set up to handle such' unusual
Calculations4
or be able to incorpordte them in their regular reports on
short notice. This is another .area whemah'institutional research officet 4
(-can be called upon,to play a key part. The calculation and implementation.
\--o,f complex formulas for salary increases requires analytical skills, a
Complete and accurate data bise41,
-combine the twos I will return to
I
has proven in
and the data processing ability /td.
the issue of the data base, since it,
our experience to be oneof the more difficult aspects of
1-por contract related work. Ar-
.Analys and .Reporting of the Results of the Contract.
One of the
negotiated labor
:.:
inevitable, and -probably more useful, results of having
contrkts for any segment. of employees, is 'the increased
demand frdm both union.'and adkinistration for deseriptive data' about the
status of the bargaining unit. The gontrq6I typically, provides for
periodic (e.g- monthly) reporting of curiont membership thtir 'wages or
sa4aries (possibly forcurrent as well ad'several.hisiorital periods), and0
numerous demograpkic d rriptoDt-which.identifyemployees as belonging to
one or another subgroup of .the bargaining unit. Bdth the administration
and the union will be interested in how:closely'nd exactly'the provisions.,
of the contract wil carried out 'and at what cost.
groups will
may occur.
arability,
vit
In additiom both.0 .
attemptto identaifyjedividual and/or grOup inequities which.
Again the keys to pioviding this 'information arecalyVical
good data, and the necessati data proqesding capability.
ofprovidini this type:of informations Nitinterestingle .
86
'. .
In the course. .11) . .
V
tA r
a
a
4
071
4. 0e
II
. \4..1''''/
, choice may arise. Unions will, on odcassion,' burden lEhe employer with.. . N.9.
...,
'.blanket requests for laige vaunts of information. They are often 10.
,.
-...
'entitled to have access to,this type of information.'' The choice whin
arises is whether to,
use institutional resources to perform a large number....,
of analyses requested or to provide raw data instead: While the initial.Impulse may be "give theil'he data and let them do .the work", it is,
usually'better to provide the results of the'requested analysis instead.- .
The reason Is that whe;Viw data are.kovided, arguments will inevitably
arise about 00 correctness of the analysis' performed by the union or of
the conclusiOns drawn from the data. The institution will want its own
,.
i t 4
analysis done to check to analysis madeA
by 'tile union; Since the work
*ill have to be done anyway it is easier to provide the results to start
with, soeveryorfe Works with the same information, avoiding when posiihle. . ,
the debate about the analys-is. .lbe analysis needed is ideally performed
'4,
by inttitutionalreseSrchers.
PrdViding DatZlOr Grievance Settlements.
Ala
' . $One additional aspect of. an organized labor environment which may
.
require the r sources of an 'institutional research office is t he
, %processing .rolf grievances. Grievances, by their nature, involve claims
r--,
/ about past event, actS,, or. procedures. As such, thi........ equire complete. ..
!k
and:accurate historical data and their meaningfmeaningful interpre atir.This4 .
-type of data atynot normally kept online by data processing centers but
'4... .
must be retrieved and compiled fxdOP,historical rec ''rds usually spanning. . ,. . ft 0
:.
several years. Depending on the method by'which,such data are stored alip
the data ptoc ssin4capability of the instautionarFareerch office,'this
retrieval task. pay well fall- upon institutional, researchers.1.4
4
,
O

f-40 8
'ern COSTS AND BENEFITS OF INVOLVEMENT 1NIABOi CONTRACT ADMINISTRATION'
0it*
is
e
The decision concerning the role that the 'institutional research«
office pleiys in labor contract administration is influenced notonly..IV . .
.. s- . -
the technical ability of ouch an office to p rovide support, but also ...by. ,
,,, -...
considerations of the costs and benefits, involved, The ctists are. not. - -11,
negligible. A campus which, may have O inyeral bargaing nits representing' 1.
different employee groups, al-I -negotiating. their (contracts 'on
Pi ...
independent schedulesis likely ,to be involved'in negotiatAs almost on 'a. .
constant basis. New contracts with 'new provisiodl bigiqanoually. . In
-,.
uch a situation, the support...needed cou141 well tettuiree the full -time
1 9
ommitment.of an analyst, es well as .occasional research)fand. programming
..
support. , In addition to the staff time, this involvement 'will 'require4
.... * . -.
constant and 'extensive use, of data processing ficili les. l'. i ,
. . , .. i;,
In exchange for these commitments, the igreitution receives several.. ..
benefit's. The. first ,of these. is better ,informatioll prepiticd
professionally and consistently by institutional researchers who th6-ome
i intimately knowledgeable about, data relevant to the various ngniborgait, \
v.e
Units. A second benefit is-that the variety of . analyses and differint. 4
4
ways of examining trends in staffing and benefits will provide, insights !t, .407 0
institution's hellth'whieh the adminis r.a-on maY7Wot have gotten
#
. Wt i the close scruting of tdata requiied in this process- Qu estionsis
aare often raised about the con*istenc cos and value 'of Offerent . .
personnel policies and procAteo and theanalyses I often reveal areas.. . 1
..-
...", .5otere changes 'or-- improvements can , be made to the 'benefit of the
;lox.. .
,:,,
1,
institution. )
e
Should institutional :researchers get ,involved in labor contract..
related Work.oseveraldifficultielpwill be confronting them. As we deal '..
. s
toff
.
.

vv.
1
f 82 ,
with statistics about lar 2,4p;pulatIOns, We are, used td: working with9
imperfect .or incomplete data. In fact we often sandWidh our report's
between caveats and disclaimers. When deal ing, with labor unions;* the
usual 'tOlersoce for incomplete. or -xnaccurate\ data
acceptable. Whin we deal with the administration of. ;
reporting data aboUt the bargaining unit to the union,
- 0record must be Complete, accurate, and.current. inaccur
in costly grievance proceedings and awards against
is no longer
a contract. or
each and every
n re4ult
institution. -
Obtaining accurate data to work with can often become the most Cillfiqult'4
part of our task."0
Another difficulty possibly confronting those involved in labor
contract work is the.reeult of the inherintly adversary relationship which*
exists. between labor unions and management. I am refer-ring o the chace
involved in the selection add reporting of data. {dare must be taken that
data developed.or evaluatid by institutional researchers in .suppore of
arguments not be distortions or misrep resentations 01 Elie 10uth. /
.
%,r- . ..
In closing I would have a few, words of advice to ehose institutional0
researchers who *may gat involved'imlabor contract rkfateci work.
. 1 rAvOid 'being 'responsIble for data . maintenance. This is anever-ending tash whith,.belongs not in the .institutionalresearch office but .shoulcP rest with other academic oradministrative offices such as the personnel, pilyroll, dean's or.academic vice president's-Office.
- Be' on the aleit fore comparative stAistics.. Establish, and;maintain contact with other institutions., keei\clippings Of datapUblished 0in. the '"ChronkFle of Higher Education" and by my
gOvernmentaland non-governmental agencies. -.111k..
- Perform analyses for bOth management and - union. By providingconsistently complete and well analyzed dapa you.can bui.ldoarepaation for yoUr office and yourself as sources of reliable,information and retain the respect of all parties.: You willalso avoid being embroiled in debates about technical details 0.
which Orr Often cloud more baSip arguments of substance.
st;".p
tV

I
or
A
p.
4
83
-- le able to stand behind your work with pride. Do not compromiseyour objectivity.
e.
For those institutional researchers who ar called upon to45
support.. -.$ i
labor ctraot administration, this work.thll be both..chal4engigng and at11 .
11.
times frustrating. In,
dhe end, however you,
will find that the area is.
,44.
full of opportunities for doilt creative original research and for gaining( -
new insights into the health and welfare of youe
ti
1
" tl
A
,
. ....,
41.- si9:: y
... 4
I \ .
a
r
,.
f
t

'A MODEL OF UNIVERSITY TENURE DECISION- MAKING:SOME ADDITIONAL RESULTS
Winship C. Fuller, President, FAGHAMMER, INC.
Susan A. Goodwin, Vice President,Univerpiti.of Lowell.01c
This paper should be viewed as Art of an ongoIng 'project by .the two
uthors to use econometric modeling techniques to evaluate the impact of
selected factors on the process of promotipn and tenure decision-making
within the context of a large university. To date only he tenure deci-
sion has been modeled, with this paper extending the previous work of''0 .
Fuller and Goodwin (1981) through the addition of variables measuring. .
regional labor martket pressure: Further refinement is anticipated to
include addition .of'several more'academic years. of decision data as well
. as similar modeling of the omotion'prOcess.
,Y
.University faculties ave traditionally been highly Concerned wilN
the methods used in granting tenure, and naturally so, since the goal of ./)
.
is rfrocess is to Oalidate faculty accomplishments and to award careen',
security. Historically, universities have used various criteria in this
e aluation process; for example; excellence in teaching, publication, and.
-4 esearch, as well as service., both to the.hcademic community and ,to the
/Profession: Such factors are of course considered in the context of labori
.
. market conditions within each academic discipline, the level of tenure in
each' department and college within the university, and the antcipAte4 en-ft,
rollment growth or decline.
In the 4.980's and 1990's whenenrollments are expected to decline over-. , t
t . all but not necessarily#
in an even fashion across disciplines, it may be-
come more and more crucial to forecast requests for tenure by academic dis-'
ciptine.. This ,becomes all the more criticar'ffanAinstitution seeks to'
impose broad guidelines for levels of tenure, or even Oes so far as to
1PeciPy goals and timetables for tenure percentages. It is. within this
context then that a model predicting more than the numbers that will.be'I , . .t .,
. applying for tenure over the coming years would be helpful; more specific-. . y
lilly,%vhat is the iikefihood that those who apply fdr tenure will pass*.
4 s
.. ..through the'qualifiCation protedure and achieve that status? . ..
aft
11
.
84
0
a

,., : \
. : . l 85,_ . .. /..k , . ...
Ao examinatio40 the literature,has "yet to unearth a. formal.e
-econometric model of the tenure and promotion decision- making process.
Much ofethe lite tune {see the ERIC data base) focuse(o;the descrip-.
tionsibf the pro sea and their application, with and-W4thout.collec-
..tive bargaining, to planning and ihstitutional.resource management,
The university of S9pthern California Fatuity Planning Model makes.
"fr'available to its users the prob'able impacts of changes in un)mersity
_ policies along several of these dimensions. _However, it has little to .
say concerning whether stated policies actually influence the individual
decisions madeon promotion and tenure (see Linnell, 150, and Linnell,"Pk,.. artd Gray, 1977).
A
Presented herein are some,preiiminary results of ecopometric,,
ana4ysis of the actual tenure decision - making process at i large eastern
i university based information on eritation for and the subsequent
igrantng or.Oehyin of.tenure Pve; %recent three-year period. This .
' process occurred, wiihinthe conteft f,ato.rm'af pen4r1ct between the, ,
University admifkistratfon and a fa Oty union. Both the tenue process
and the criteria used were unchanged over the'time period in 'uestion.
Maximu'm likelihood techniquq are used to estimate the parametersI.. A.
of a model which accounts for the probable correlation between "un-
measured factors" which affect both,.".faculty, tenure appliCations" and
the "university tenure deciiion-makihOirocess." This model has beena
used to assist in predicting success -kachieving a mandated trustee,
goal of lowerlhg.tenure by 10% 4Ver 20 years.4.... APreliminary
.4
results point to the fgllowiNg:
(1) In spa e of the fact that the number of publications since date of
o hire nerally tliought tobe a predominant factor in a university's
ltenure criteria, ihe variablik-whiCh measers a faculty member's publi-
cation history iirfceecomi g-to this thstitutyon is not a do rant factor.
..4.A variable'potenlialltme suring "level.:of professional achievemeht prior
to.joining this institution's facultyerhoweVef, does appear to have a.
AFelatively stronger impact on the unillatetvity's decision:
(2) As on e would eupect, the universittaPPears to attach more importance6
to oyeirs at this institoitiOn than the ind4V1dual faculty member does when
deciding whether or not to apply for tenure.
(3) As expected, the two variables measuring la/bor market pressure point
1
6 C
..4h 9I*
. .

o4L 86
,quite )ro ly toward individuals, inlo N.pressure areasbeing more likely
to apply for tenure. However', contrary t expectations, these same faculty
appear to have been more likel,i, to have been,granted -tenure; some possible
r;asions for tis phenomenon are discussed in r ,e text,
(4) While the possession-'of kiterminal degree is, by. far, the most signifi-
cant detei-minant of whether or not an indvidual will apply for tenure, it
is. somewhat less important inIthe university's decision to grant or deny itU '8
N.7.(5) The universitys commitment to Affirmative Action appearS to be some-
what substantiated the positive coefficient 0 a variable measuring mi-OY
nority status in the to ure function. An the other. hand, for whatever rea-
'sons, females appear to.have) tendency not 4b even apply for tenure; there
are several possible exp4anations for this phenomenon..
(6) A varl iety of other varfables.measuring an indiVidual's status within
the university appear~ to affect neither the application for nor the univer-
sity's decision to grant tenure0
*Finally, a comparison of the%Simple probit estimates of each funetion
with those obtained from maximum likelihood analysis of the entire process
(taking into account the probable correlations between-uRmeasured influences.
on each decision) indicates that privy specification-of the decision-making
process is of vital importance in deal-mining how the variables influence
each set of ,ilecisions. ..
.
A description of the actual tenure process is specified in summary form
in Fuller and Goadwin'0981i... The advantage and usefulness of this type of M
C
/ model is se0eralfold:
(1) the daitafs easily collected as part of an annual faculty, aciltlity or
progress report, slmmarized by-the appropriate reporting administrator (dean!
division head) for'ttie annual report of'the vice president;
)42) annual predictions can be made of those who'are most likely to make it
through the tenure screening process, ceterius paribus;
(3) the margina) levels,of accomplishment which are necess r to bring a
junior faculty meMber up,to tenure caliber can be roughly entified; this
becomes particularly interesting when applied to t nseling of women ,
and minority junior faculty as they undertake to qualify thems.elves for tenure.
I. A Model of Tenurp
7-%---1).
The granting of tenure cSn easily be cfassified into a two -stage process
^( an individOt faculty member must decide whether or not to apply for
M4

4
- 87
t..
411
tenure, and then (2) the university must decide whet her 0g,not tenure isto
be granted. If an individual chooses,not to apply for, tenure, then.in this
model, no further consideratioh is given to that individual.
Within this two-stage decision-making process, several considerations
are impoltant. First, it i unlikely that the model is able to specify all. .
fAfactors influencing. both t a decision to,apply for and the granting of the. .
tenure. At best, variables measuring the more important individual facultyA
member characteristicsabor marketiconditions, and existing academic Opart-
mental,composiiions can be..collected. It is Well-known that, should unmear
- sured factov:s influencing the application decision be correlated with the
unmeasured influences in the, tenure decision, consistent estimation' of the.
parameters in this model cannot be achieved without, taking account.
of this
phenomenon. Details of this sample-selection bias have been presented else-
where (-see,-for-emple, Venti & Wise--(1982),ind iiii (1982)--,----;Meyer and'
Wise (1979), Griliches, Hall, and Hausman (1978), and Hausman and tpence
(19 ). Clearly, any unobserved personality conflict which is likely to. '
v .
inf uence the tenure process would also be a factor of some importance inA.4
the a lications 'decision. As a result, some correlatioo-ttlikely to exist
bet en unmeasured -influences in each of the two stages of this decision-
m king procest, and some measure of this correlatior.must therefore be,con-1 .
sidered as part of the ove 11 model. Presented id Eviler V'sd Goodwin
(19'81) is a mod hich descri es two separate decilions being made by.
different decision- makers with these processes connected 44the likely car-,
relation between the unmeasund characteristics in each equation.
II, Estimation and'Results .
Fuller and Goodwin (198i) describes the tenure modt1 used'in analyzing
1. those factors which most significantly influence both.the faculty_me6ber't
.
decision to apply for tenure and the university's decision lo grant tenure.. t -....,
In thks section, a general description of the data used here is fol,lowed
by 0eentation gndanalysit of parameter: estimates..
I' .ri / .41,,
(a) Summary of Tata. Historical data on faculty accomp shments.mai 61-
lected in 1977 as part of a presidentially mandated salary equity study.'. c
Subsequent updates in the Spring of 1.978 and 1979. have yielded the overall...,
data base whiqiis'described.in rable 1. In'bnief this inforyetion can be
classified as follows: The race ;leach individual faculty ember was class- ,,
ified as either Caucasian, Black, Spanish-American, or Asian-American while '
, .". '..
r . .fbe .
..
.. 4
40
1
Rd.
rf

88'
the usual characterization of ale/female was used for the sex variable. The
highest degree received by each aCjilty:member' was described as either. B.A.,
M.A., or Ph.D. Information on th number of years to have elapsed since
receipt of that degree was also o tained. A dichotomous Variable was used to
indicate whether that degree was onsidered'tobe the terminal Aualifica-'
tion for that particular profession; for example, $n tndustrial technology
an4 in musical performance, an"M.A. is considered by this institution to be'-
the terminal degree.
411Years of teaching experiencefor each individual was divided into the
number of years at thelistitUtion in .question 'the number' of years else-
where. The'rank of ea et faculty member,wasclassified as instructor, assist-
ant professor, associate prOfessor, or full professor; Pie:number of years
that an individual had held that, rants was also identified.,?
In' addi-iial, the
annual salary paid each faculty member each-year was included.
The variable measuring a faculty member's publishing productivity since
coming to the institution was deemed to be of primary'importante. The initial
classification scheme whicha'ssigned a zero (0) for no publications, a one
(1) for between one awl thre'e journal publications, a two (2) for foul. to t. -
seven journal articles, and A four (4) for eight or more artiOes or:for one,
or more books was converted to actual numbers of publications. The percent-,
age of faculty members tenured and tfie percent in each acadealic rank Were
calculated for each academic department and for each college within the uni-.
versity. A dic*omous variable was also used in an effort to.captdre unmea-
sUred departmentalliand.cgalege characteristics.
Mean salary levg,js were obtained for most.academic disciplines in an
effort to measure the-labor market pressurei and opportunities,in each of
these areas, It wis also possible to specify those colleges within the uni-
versity where the most external pressure presented probleffis in obtaining
qualified personnel. Since there appeared to be three dilyinct levels of.
labor market pressure withWthe colleg
tomous variables were used to identify each
low, medium, and high), two cliche
dividual faculty member's
werestatus; thus, leparate "low pressure" and "high pressure" variable
treated with the "medfum pre sure" status being the default categ ry.
(b) Bependent Variables. Recordsof applicants for tenure, the subs' cent '
4
progress through internal decision "channels", and the inal evaluation
were avair, Precise identifitation was possible o those who applied forr )
93
E.
a

4
..0
, 89:
. .
and those who were either granted or dknied tenure and how fir ,each made it.. el.
w . t. .6
. c 01
through the`five )s tale u2iversi ty,deciVon process. Al 1,O1 thi s.infornultionwas obtained for each of the academic ylors 1976-77, 1077-78,and 197849.. ** e
'e 1 b
If a faculty member was not at the university during any. onl of the three" ..-
years in question, hip or her data was classified as missing for that yei,riniy..The pobling of/ data for the three years in question is legjtimate only
i f i nternal 'university conditions were. e:ssenti al ly uncha4ed over the' entire*
period. Two facts point toward this; being the case, First, the collectivebargaining contract delineating both theL tenure process and the tenure cri,tria was in force and unchanged during the entire time period. Seconds the.
presidents, most of the dearis, and most of the membership of the reltont.* . . ,
committees were unchanged during this period. I-..
("c) /A Tenure- process Model. The results presented h re are preliminary inin variables discussed previ y have Yet to beinte;
9r ted intothe ata base. For example', the effects of such factors asei5arimental citaracteristict on either the applications decision or the tenure
t_. . - :decision are as yet' unknOwn. Fortunately,' none. -of theie types of influences,were.deemed a priori tobe of suffiCient importanc e rto have. their exclusion .
.. .
the sense that ce
substantially bias the results presenied.here.The results are described, in Table 2. Separate probit estimates- ,were'
. -obtained for both theapplifortivs, function and the ienurefunctidn (secondOOP --Nand fourth columns). In "contrasting thieser,.to the estimate 'of the two' fu _., -.
tions obtained with the joint maximum like.lihood procedure (dgcriberin .li
* , m,Section II) which accounts for, and also estimates, the prObable correlea-
1 . . ''. 4ton between unmeasured characteristics (p), little difference Is fouhdbet- .
,' ween the. twooets of estimates of. the applications funttion. This substanti .
ates the Ire' 1-known fact that sample- selection- bias- only yields inconsistent
.estimates of the parameterZr the; principle (tenure) etiV,on, not the
.
.
:,sample- lection (appjidations) equation) . .
. . . scomparison of the) two sets of tenure estimates;(third -and fourth
- .., 6 ..,,,' ...
- columns) illustrat'es this further. The estimated co'rrelation betreCurime-a7-
suedAaracteristies (p = .82) is sufficiently large to cause.substantial.,,. . ,bias in feme of the-simple Probit estimates (e.g.; the terminal degree, the
,./labor market, and the ndmber of public: lins). Thus, 14d the Joint ma.ximin
1likelihood procedure not been emplOyelf "ii, the results to be'slisclksdoinextwould havebeen quite different and inappropriate
$3
.-A13.. 4, .
, . . _e 0 o S eti
.- ,- -, . .
,* , 64:. n, 4
o
..1
!."

With respect to these retUlts'.(as presented in the first and third col-
umns of Table 2), it:is clear that the university tenure process considers
the acquisition of the terminal degree to be relatively more important than
is perceived Gy the individual applicant. However, both the individual ./
applicant and the university appear to agree that the possession coca termi-
nal degree is an extremely important factor determining whether tenure will ,)
be granted. (The marginal effects of each variable on the probabilities
involved are presented in Table 3). This effect, is sufficiently strong that
the.likelihood o'f being granted tenure without a terminal degree is extremely
small.
It is also apparent that, contrary to expeitatiop, the number of publica-,
tions since coming to this institution is not a very/1111'0g factor in either
the applications decision or in the granting of tenure. On the other hand,
however, both the individual applicant and the university seem to attach the
same relative level of importance to each publication. It may be that some
combination of tie yeah of prior experience variable and the number of publi-
cations variable would be a more appropriate measure of the research "quality"
of an individual faculty member. Unfortunately, the years ofprior experibnce
variable has yet to be. incorporated into the data set for non-applicants.
Another relatively important variable in both functions appears to be,
the number of years at this institution, with the probability Of-both apply-
irvt for and being granted tenure increasing as the years go by. A part of
-90
N.
this effect is obviously measuring the requirement that .an individual faculty
member must either be granted tenure or given a termiqe1 contractdUrjng his .
or her sixth year at this institution. It is also important to note.that this
variable takes on considerably greater importance in the university's tenure
granting process than it does in the individual's application decision. The
primary effect being felt hdre probably applies to those individuals who apply
for -"early" consideration; the tfidividual generally makes an "early decision"
after personal comparison to colleagues within the college or department in
question, yet the university must consider the faculty membei- in the context
of the entire pool of applicants and those who have previously received tenure.
ThUs,dihe university is likely to be fat more selective in ,granting "early
tenure" than the individual applicant would expect.
Some measures of the success of the u0v,4'sity's Affirmative Action ef-
forts may be Captured in the tenure equation`s racial minority variable.
9-/
1
or,
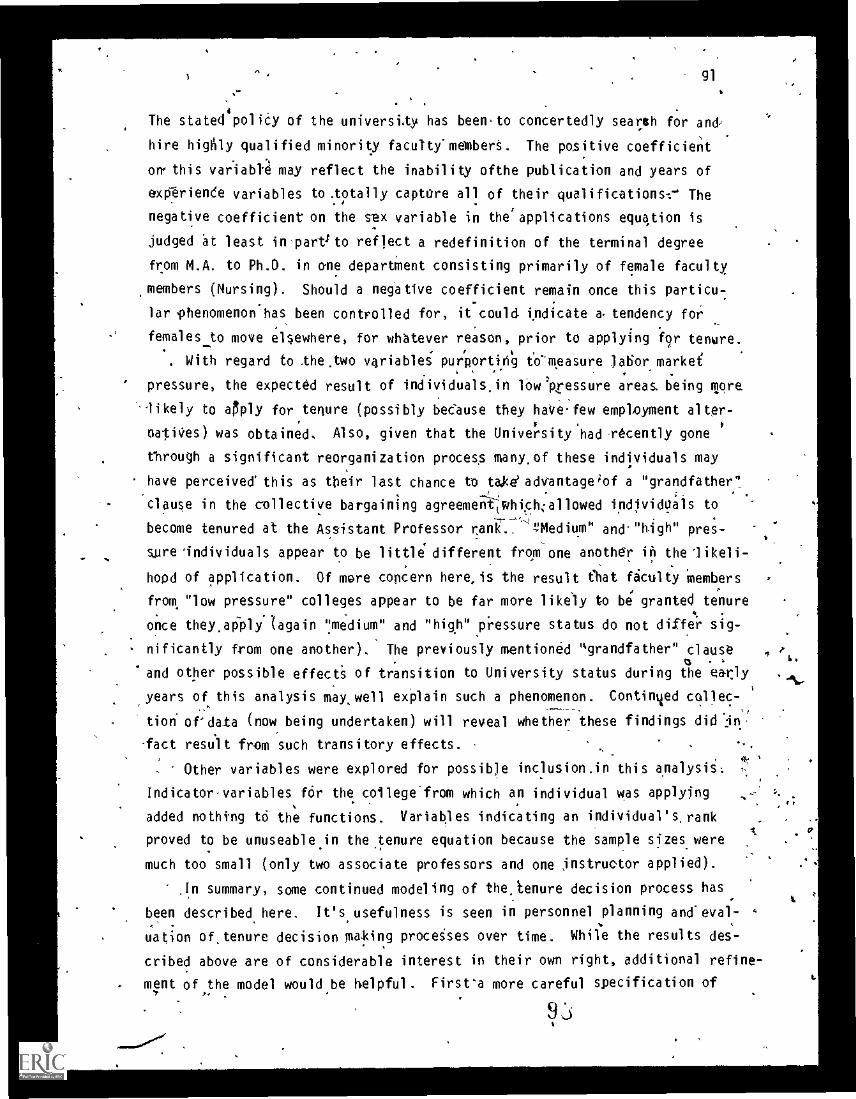
3 91
The stated policy of the universily has beento concertedly sea rah for and
hire highly qualified minority facutty'melebers. The positive coefficient
ow this variable may reflect the inability ofthe publication and years of
exp-eriende variables to.totally capture all of their qualifications: -' The
negative coefficient on the sex variable in the` applications equation is
judged at least in partIto reflect a redefinition of the terminal degree
from M.A. to Ph.D. in one departMent consisting primarily of female faculty
.members (Nursing). Should a negative coefficient remain once this particu-.
lar phenomenon has been controlled for, it could indicate a tendency for
females_to move elsewhere, for whatever reason, prior to applying f9r tenure.
. With regard to .the .two variablei purporting to -measure labor market
' pressure, the expected result of individualsin lowPressure areas. being more.
likely to apply for tenure (possibly beCause they haVefew employment alter-
na-tities) was obtained. Also, given that the University'had-recently gone
through a significant reorganization process manyof these individuals may
have perceived'this as their last chance to takeadvantage;of a "grandfather!;
clause in the collective bargaining agreementwhith;allowed individuals to
become tenured at the Assistant Professor rantMedium" and."high" pres-
%ire 'individuals appear to be little different from one another in the likeli-
hoed of application. Of more concern here, is the result that ficulty members
from "low pressure" colleges appear to be far more likely to be granted tenure
once they,a0Ply'Zagain ':medium" and "high" tiressure status do not differ sig-.
nificantly from one another). The previously mentioned 'grandfather" clause , et, i.
and other possible effecti of transition to University status during the early
years of this analysis may, well explain such a phenomenon. Continged
tion of'deta (now being undertaken) will reveal whether these findings did "in.
-fact result from such transitory effects.
Other variables were explored for possible inclusion.in this enalysii:
Indicator-variables for the coilegefrom which an individual was applying
added nothing to the functions. Variables indicating an individual's, rank
proved to be unuseable in the tenure equation because the sample sizes were
much too small (only two associate professors and one :instructor applied).
in summary, some continued modeling of thetenure decision process has
been described here. It's usefulness is seen in personnel planning aneval- A
uation of.tenure decision ma-king proceSses over time. While the results des-
cribed above are of considerable interest in their own right, additional refine-
. ment of the model would be helpful. First'a more careful specification of
l
6,

%.:riables ftdrtmental characteri%tics needs to be included. The
cciterca of teaching ,excellence and service to the university and the
community also should be measured and tested in these functions. It would
also be.helpful to have the same modeling effort appljed in the teqUence. .
of 'faculty promotion decisions, from instructor through to' full profe'ssor.":,
And, in conclusian, the model should be tested through application to an
existing set of potential-applicants, yielding results indicative of the
ability of this model to track imidieidual faculty members as 'they may or. may
not apply fpr and be granted tenure.
TABLE2
VARIABLE
TENURE PROCESS
TraURE azIsion ESTIMrTESAPPLICATION DECISION ESTIMATES
lib
Joint MaximumLikelihood
.
Simplh'ProbitJoint Maximum
Likelihood' Simile Probit
Highest degree is a -.840 .844' 1.23 r .981
.
terminal decree (1 = yes): (2.83) j2:95) (2.44) . (1.62)
Nvber of publications sincecoming to istrtution. .050 .049 .0,10 .006
(1.20) (1.23) (.75) (.114Y '3Number of years teactl.ng . .
.4082 .112
elsewhere: (n) (2.46)
4 1
Number of years teaching .132 .131
at this institution (1.50)" (1.631
Faculty member's sex (1 . -fertale): -.270'
J1.03) (.98)
. Faculty member's race (1 .' non - whiter. ' "
. 0
Low Pressure Laor Market . 4.7.20k, .715
12.46) (2.62)
High Pressure Lab Market .169 .179 .
(.52) 1 .58)
Constant-1.82 -1.82 ,
(3.89).,
(3.63)
)2.82
11.11)
Value of log likelihood function: -'39t7 -105.44ko i" .
i(OTE: ksymptotic t-stati tics_ are presented in parentheses.
.302(1,60)
.222
(.49)
.748
(-1..1::).
(.18) :
-3.43.14.68/
...- .
.330
(2-03)
.178
.04S)
4-.4942).
(.90)..
:.-2.25'
(2.29)
-37.7
'.t

P.
8
D E S CtiR I P T.r.
;\*
S T'A S.
ALL NOW-TENURED PACO TY`
,
93
A TENURE APPLICANTS"
StandardDeviatIOn Raflge
.f
VARIABLES Mean
.
Agandard -
aviatfoa
. . !.
Pang* Mean
Faculty Mtmber's_Race (1 = yea):
White %plack s
Spani,sA AmericanAsian American
Faculty Member'sSex (1 female) :
Highest DegreeReeived (1 * yes):
Ph.D.1
.
.863
.046.- .034
.067
.354
v
.709*
.291.
.000
'.344.219-.282.2,32: '
. .178
.154
.454..040'
D-1' ,
0-10-1;0-2,
-f!
%915:.1017-.000.068'
6'0.208
814.186
.000
Number of YearsElapse6:Since Highest,
.Degree Received: -
1$ the Highest negeee-'A Terminal DegreeYl * yes): .719
,
Number of YearsTeadhing at thisInstitution; 2.93
NumbA.r of YearsTeaching Elsewhere .)7
,Faculty Member's -Rank (1 *.yes):
Full. ProfessorAssociate s,
AssiStani .826Instructtir . .132
Number pf Years inPresent Rank: 2120
.
'Number, of PublicationsSiocetoming to this.institution: 2.45
. .
Faculty Member'sAnnual Salary: $15,369'
.140.50
. .134
2,58
1,96
.200
.379
.338
...1,6
.
:
0-23
_aLl
'-1 -9.
..
. 0-12
1
C!O0-2
-.' 0-9`4)-1
0 -6
.
0-20
-
i9 308-24,000
.1
.
3.94
.86*
'3,03
.n:M.
Q.0. 39.912.019
.
2.20'
3310
$16'.03252 414'
PaCultY Member'sCollege (1 *yes) -
EducationEngineeringHealthLiberal ArtsManagementMuiicScience
Year of Rliq bilitv.(1 es);
19y76-771977 -781978-79 e
.910..1,14,.126.251-191:063.211
.323,
.270
.407
.496318.332''.431.396.243':408
t.468 .
..141.494
)
0
..
0-113-1,
0-1 '.'
0-1
§7-10-1 .
,
6-104
'.
.
:4
.220
.t39
.000.252,
.4t3 - 0-2
.390
.390tam
, 3.81
,.342
1.38
lisa.
Or23
0-1
1-6
na..
0.01
0 0-0.192 0-1.231- 0-1-.137 0-1
1.12
433
$2,260 811,689-23.0
075
0-20.
.119
.270.:102«237.319..085.170,
.322
.33,9
.339
..123.376..302.425.323.279
.,,.467.473:All
0,10-2 '0-10-10-10-1,0 -1
0-20-20-2
.i
! The number of potential tenure applicatiaris clueing this period was 175.
" The number of actual.
MOrlications viaw 50,.witht31 (or 531) actually being grinleti tenure.
, .(...
.......
*1,

94
T B.L E 3
.ARGINAL EFFECTS OF TENURE PROCESS UAUABLES*
-ss VARIABLES- MAGN/TUDE4OF CHANGE*
RESULTING CpANdE INs, PROBABILITY
4
-*.
*
.
.
.
..
,
o
.
I.
s
".
.-
.
APPLICATIONS EQUATION**
t
'
)
'
-1.,4(+3.57
+1.0
+V.0
+1.0
-1.0
+4:119
,
.
I/
;
*
.
.222
+.068'
+;.cktio
1.088
6.- .282 ...:1, ' .
+.065.
-)-.173
+.051
POSsession of aT̀Terminal Degree:
. _Number of,Publications::
NuTber of Year% Teachingat this Institution:.
Faculty Member's Sex ,(1 w.feMale)":
* ..
Low Pre'ssure Labor Market,
High Pressure Labbr Market.
TENURE EQUATION***
Possession of aTprminal Degrae:.
Ilaber of Publ'ica'tions:
.-
Number of Years,TeaFhing,
at this Institution: : +1.38 +:132
Number-of Years Teachingasewheip: +2.96
.
1 +.073
* .
a.
Faculty Member's Race .
i +.066(F = non-white) 1 +1411
Lowyressure Labor Market +1.0 ' +..259. .
,
. +1.0, .
High Pressure Labor'Market -.029
V
..
*ihe magnitude of change in each variable was -Set!eqUilto the standarddeviation'of that variable for all.those includ0 in the saMple.used tikestimate the parameters or each equation, except in the caseof dichoto-mous variabies where a change of either -1 ,pr +1Awai uteri where approPr,iate.
rt*The predicted probability of application, evaluated at the means 'of thei-cdiltinuous , Ivariable was: .317,
.,.
/. . .
***The preclictapcohability of being granted tenure, evaluated at ttie meansof the tontinuous variables, was ..191. . St
, -
46
. .
.1 0

e
.
, REFERENCES
. . .
Berndt,;E,I.B. Mall, R. Hall, and J. Haugon; (1974), "Estimation and, In'ference.in Nonlinear Structural.Modets," Annals of Economic and
h: Social-Measurement, pip . t53-665. .
...i.
..
Fuller, W. and S. A. Goodwin,(1981), "A Model of University Tenure,
.. Decision- eking: Some Preliminary Reiults", Proceedings--Academic '
. Administ atidn Workshop, National Conference, American Institute.for.Decision Sciences,.November, 1981.
95
.1 Fuller, W., O. Manski, and D. Wise, (4982), "New Evidence on the, EconomicDeterminants of Post-Secondary Schooling Choices," Journal 15f HumanResources, Fail, 1982.
.w.
W.;,C, Manski, and D. Wise, (1982)', ""Impact of the BEOG Program on
College Enrollments,'' in E.,Helpman and A. Razzin, eds., Evaluation ofPublic Programs: An,Economic Perspective, Academic Press,-1982.
Griiiches, Z., B. Hall, and J. Hausman, (1978), "Missing Data and Self--Selection in Large Panels," Annales de L'Insee, Number 30-31.
Hluisman, J. and M, Spence, (1977), "Non -Random Missing Data," MIT Discussion. 'Taper Number 200.
Heckman, J.,-(1976), "The Common Structure of Statistical Models ofTruncation, Sample Selection, and Limited Daendent Variablei and aSimple Estimator for Such Models," Annals of Economic'and SocialMeasurement, pp. 452,49'2.
Heckman, J., (1974), "Sample.Bias as a Specification Error,"Econometrica, 47, pp: 1.53-161.,
:Meyer, R. and D. Wise, (,109), "High School Preparation and Early LabdrForce Experieke," NBER Working Paper Number 342.
Venti, 8, arid..Dz,. Et? ThePerformance, and Labor Maryet Opportuntties on College Applications,Quality, and Admissions," Journal of Public Economics, 1982.
Ienti, S. (1982), 'The Determinants bfAid to'College Students," in C. Manski)
and D. Wise, College Choice in America, Harvard University Press; 1983Iforthcomingj.. t.
Willis, R. and S.'Roten, (1979); "Education and Self - Selection," Journalof Political Ecenomy,.Vol. 87, - October; pp: 537-556.
A.
a

I
t
The Role of Institutional ReseAtch-Initiatory or Resp5ive?Loren Gould
Director, Institutional ResearChWorcester State College
486 Chandler StreetWorcester, MA 01602-2597
INTRODUCTION
) There are nearly 2,000 individuals in higher education in this coun-
try who are working in institutional research either full-time or as a
'second or third responsibility -with sufficient ties to their institutional
reltch role to be membdrs of either the national or a regional institu-
tional research association. Nearly all' institutions of higher education
have someone performing the institional'research functioR although many
of these individuals are unknown to their counterparts at other institu-.
hions.
Stecklein in 1966 pointed out Oe dichotomy of thought in the pur-
pose of institutional research - -- institutional research .should be free to
study any facet of highbr.education free from demands to provide reports
relevant.to immediate ptoblems or, albernativelyAinstitutional research-
should serve as an extension' of the president's or executive vice-presi-. 1
dent's offfbe in developing repoits:to 1141psolvt current operational .
,
Crirer510140s.001.4.to stretch the institutional dollards as far as'posisible../+.1. - .
. . ..
Stecklein thusIntroduced into' the literature the batit dichotomy ofr' .. t4,_
4 # .
.
J,IN initiatory, versus A onsive (active versus paAlve) institutional re---.
g .
rk
search. .- . - ..
There iSa move404t for.
an initiatory role ty institudonaertt-. $'
.
searcher wig) the Mated problem' of how far the'initiatory role should
v .
0 96t v;). .
I
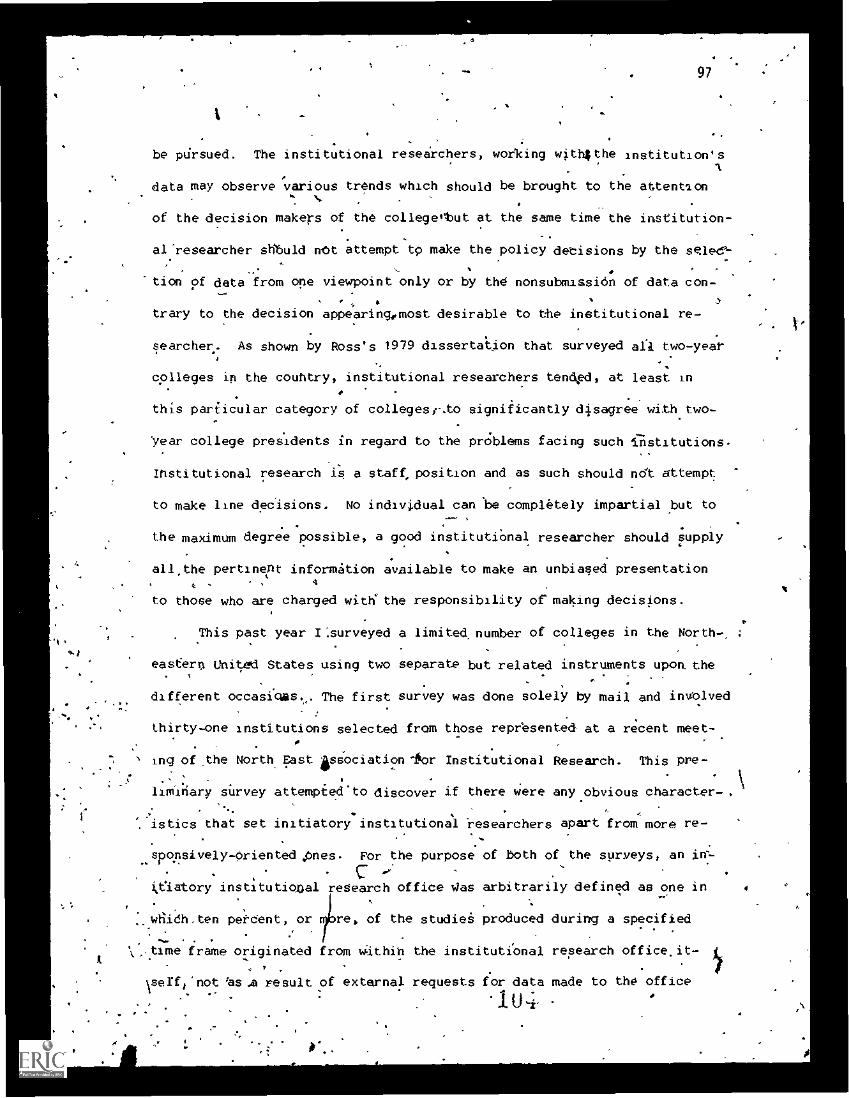
wl
,
.
k
I
97
be pdrsued. The institutional researchers, working with$the institution'sA
data may observe various trends which should be brought to the attention
of the decision makers of the collegeebut at the same time the institution-
alresearcher stibuld not attempt tp make the policy decisions by the stlee-.
tico of data from one viewpoint only or by the nonsubmission of data con--
trary to the decision anpearingomost desirable to the institutional re-
searcher. As shown by Rosss 1979 dissertation that surveyed arl two-year
colleges in the couhtry, institutional researchers tended, at least in
this particular category of collegesr.to significantly disagree with two--
Year college presidents in regard to the problems facing such institutions.
Institutional research is a staff, position and as such should not attempt
to make line decisions. No individual can le compl4tely impartial but to.'".
the maximum degree possible, a good institutional researcher should supply
all,the pertinent information available to make an unbiased presentation4
to those who are charged with the responsibility of making decisions.
This past year I:surveyed a limited number of colleges in the North-
eastern United States using two separate but related instruments upon the
different occasicas.. The first survey was done solely by mail and involved
thirty-one institutions selected from those represented at a recent meet-
ing of the North East association lior Institutional Research. This pre-. .
.
liminary survey attempiedto discover if there were any obvious character-.\
; ,Tistics that set initiatory institutional researchers apart from more re-
_sponsivelY-oriented 4Ones. For the purpose of both of the surveys, an in---
ckeiatory institutional research office gas arbitrarily defined as one in
..whidh.ten perdent, or
11.1,
re, of the studiei produced during a specified
.... . . .
%,.time frame originated from Within the institutional research office, t-
\seffi'not 'as .a result of external requests for data made to the office
1 U lt-. , .
.
I.

1'
I. 98
'.
whether such requests were totally external to te college or on-campus
but external to the institutional research office., This.clasiifiCation
was the result of the perceptions of the res0Ondent to ae survey since.
they alone d4cided what percentage of their studies originated from within
the institutional research office. Some of the characteristics invebtl-'
gated included respondent ones such as sex, age, educational background,
'association memberShips, invorventnt with institutional research organiza-,
tions and activities on college governance cpmmittees, while,
others were
. (,
%, -.4.-
'
characteristics of the college such as size of enrollment, sources of fund-
ing, Pevel of degrees offered and 'similar related items. None of these..
.
showed statistically significant relationships to institutions where the.
institutional research function was classified as initiatory. This pre-
liminary study was used to 'refine and narrow down areas to investigatefor
possible signifacance.so that the more4 ,detailed study that followed could
.ocus more accurately upon potentially, significant factors.
The results of the preliminary survey indicated the need fdr moref
( .,
subjective information than cold be culled from a mailedsur ey alone.,
Thus the final questionnaire was much more fUlly developed into twerty-
the t ques tion instrument encompassing six pages sent to a randomly c o n
,,/
'sample of higher education institutions from New York and New England.
. s.
,After the.return.of the completed 'questionnaire, each participating insti-
tution Was telephoned in
that were no evident to
tion of answers that were
,
order to clarify eiements.
the respondent an0 also
of the questionnaire
allow for clarifica-
.
not' clear to the reqipleht of the completed ques-:
tionnailF. The followup telephone calls also allowed arvopportunity to 4
ask'art additional set.of questioils that invOlVed perceptions relating in-
.!'"
'atatutional research at each institution to the rest of the administrative, . .
t

4,
tructure$ to the faculty', and to the students.
FINDINGS
. 99
Institutional research offices that tended 'to be initiatory in their
work by producing' studies and reports, yithin their time.constraints, that -
were not requested from outside the office of institutional research it-.
self, shared two areas of commonality. First, the.greater the number of
years of doing institutional research,fthe stronger the ties,to being an,
initiatory institutional researcher and second,"the more the institutional
researcher believed that institutional research should bemgre initiat ,
4 .. t. -
the more initiatory that office tended to be. This was no'more than would4
be expected since the lohger one works in a given field, the more inttia-
tory one would ioe expected to be presuming that the incumbent was.ihter-
ested in the work.0
LI THe mores detailed second study showed that the major criter,,ion sep-
aratihg private from public institutions was the locus of control for de-,t
cision making and that all two-year, -all fodr-year, and ail universities
.could be groupedirether for analysis regardless of private or public
control once dais locus was recognized. This secpad study analyzed the
colleges in thiee diffeqpit grbupings:' 'vate two-year, public two -year',%
private four-year, public fogr-year, private universities, public univer-*.
sities; alltwo-year colleges, all four-year colleges, and an universities;
:
and all private and public. institutions.. The only factor that was statis-.
tical ignificant -in all three analyses was She amount of time 'spent by
the respondent doing institutional research work/. ,This finding was re-(f, .
irrforced by the statistically significant finding among all six college
1U6

1
4
100
types and among the .two-year, four-year, and university analyses that the
__-.presence of one or moredull-Pme workers in institutional' research was, N.
. -' -'=--.. . .
. 4 .
related to the effectiveness of the function as a recognizable feaeure'ofr
"$higher education. This statistical significance was not present'in the
f I
1 ;
private /public analysis indicating that the presence or absence of a full-
time employee in institutional research- was not of value in separating
public institutions from private ones.
The, amount of institutional res arch dpne by the use of a computer-
was statistically significant when a - ng the six different types of
institutions and also when analyzing all two-year, all four-year, and all
universities, but was not significant when comparing all prrypte institu-
tions wi th all publi.6...7anes. This suggested the relationship of college
size and complexity to the presence or absence of. institutional research,-
.....not to the source of funds. Related to this was the statistical signifi-0,
cance of the'availability of computers to the person charged with the in--.
stitutional research responsibility, This was significant only in the
analysis of the two-year, four-year, and dniversity types of institutions
clearly suggesting that the availability of computers for use by selected
administrators is related to the size'and complexity of thepst&ttion.
)Also interpsting in this analysis'was the statistical significance a the
use of advanced management tools and techniques to this grouping. When
' aJl SIX categories were analyzed this statistical significance disappeared
5
suggestihg again the influence of size and complexity upon the use of such
1_,,,
tools and techniques. .
A series of vignettes were developed.describingithe varying tjults .
of institutional research characteristics at the six different types or
colleges: Siach vignettes suggested the great.i,ariety,to be found arifOng\.
1U 7
.

01.
I
.4 :
101,
t.
ed V . . \.,the practitiondrs of institutional research but there were Also threads 9:1!7f4 --
, N,__
commonality such as the increasing importance of institutional research
with Anareasing size and complexity of institutions. The following table
summdrizes Ale statistically Significant chisquarea found in the second
study: ,Statistically Significant Chi Squares
2-yr Private2-yr Public 2-yr Colleges4-yr Private 4-yr Colleges Private Collegis
010estion 4-yr Nblie- 4u.versities Public Colleges.Private Univ.Public
12
'13
14
'15'
21
:24
, :0017
.0086
.0407
.0107
(0028
.0699
.0224
.0082
.0165
.0005
.0486
$ 4
IP.
This study serves only as a prototype to analyze the fielir4
tutional research but it is a beginning point very needed at this tinie of
-decreasing membership in institutional research associations Teflecting
fiscal constraints nationwide. Institutional research has the potential-,
..
.
4 '
to be of major service. to higher education but it requires practitioders. - ,
.
whO have4the aigNity 'to see areas where studies shbuld be made and
velop studies from existing data with which they have more 'familiarity
than any her functional segment of higher education.it N
a
,1 I)
.) q.
0'
.f

1. .Your name
SECOND SURVEY INSTRUMENT
102
2. Sex: Male . Female
3. Age:. Under 30 30-39 40-49 50-59 Over 59
4. Degrees beyond baccalaurate:
( Degree) (College) (Ma3or Field).
(Degree), . (College') ((Major Field)
5. a. Other training or experience you hive found most relevant toyour work in institutional research: A
b. 'Job related experiences you have-found rlevdht to your work.in institutional research:
6,
6. Do you currently hold faculty status?. Yes -.. . No
If yes, what rank?- 'Tenured? Yes No
and in what epartment7
7. Your title as related to yout institutional research function?
4#.
' 8. What is the title of the person to whom yoU report in yourAirestitu-tional research function?
41' 0' 9. To,what titles the institutional research functbin report if
different fro the answer to question eight?
k
10. What is the number of years you have been doing-knstitutional re-search.at your present institution? .
,
)'years
'In your higher education career?
years
()J

t
.13. What percentage your work of answ4ring questionnaires and
!doing institutio al research studies do youth):
103 .
.11. a. Of which,,
if any,,of the following professional associations areyou a member?
% >
AIR NEAIR AERA NEERO AAHE
SCUP APA AIDS
b. _What other professional associations related to institutional--,.... ..
research.do:ou_belong,,to2.______ ________________
12. what style of management most closely resembles that found at pres-ent on your campus when it comes to decision making in the areaslisted below? Please.place a:check in the:appropriate space fOreach decision.
Local lbcal, control of the decision from origin to imple-mentation.
Local+Off - local development of the decision tilt requiringAoff-4ampus approval before implementation.
Off+Cocal - decision developed off-campus tut with consid-."erable input from the campus.
Off - decision made off-campus and handedIdown to be imple-Amented on campus.
Col/Bar - decision process controlledby collective bargain-ing"agreementst
ImM
I
, -411F
Debision,
Local
,
Local.+Off
Off+Local Off
at
Col/Bar
Admission requirements.
. .
Degree requirements-,,_Course requirementsCourse efferingsGrading practices .
New majors .
Program terminations_._
-Faculty` E2motionsFaculty workloadsFaculty released timeFaculty salaries L_Scholarship aidTuition and fees . _.
Capital construction .
Parking rules , .
by hand? % or by computer? %
u

t
I
104
ON
14. Do you have, a computer available at your college on which institu-tional research work is done?
No
'a. If yes% what kind of a com uter do you'have access to?
..b....DoyoU make use of the computer yourself? Yes No
c. ef yes, in what ways do you use it?
15. Do you use-any of the following in your institutional research work?
Linear programming Queueing theory Monte Carlo simula-
tion PERT CAMPUS EDUCOM NCHEMS
Please specify any similar tools or concepts that you use:
16. What percentage of the institutional research studies generated by(your office receive direct feedback to your offlte from your'supe-'riors in the chain of command?
17. Have you seen examples of chahges in college policies,that resultedfrom your institutional research reports?
Yes No
18. During the past two years, was an outside consultant hired to doone or more institutional research studies at your institutionother than dRing statistical. analysis for you?
Yes 11 No Unknown
If no, has the use of an outside consultant for doing institu-tional research studies been considered by your-institution inthe past two years?
Yes No Unknown
19. Do you share the results of your institutional research with fell-owinstitutional researchers at other colleges?
Yes No
20. Da you publish "institutional research studies in campus publica-
tions , in non - refereed journals such as NEAIR publishes
or in refereed journals such as-AERA publishes ?
None of the above111.1
r
4**

,105
21: In the institutional research staff categories listed below, pleaseindicate the number of full-time(35 hours or more per eek)and part-time staff: .
Institutional R esearchStaff Categories Full-time Part-time
Processional
_Secretarial
Graduate students
Undergraduate students
Other
22. Do you have the general coordinating responsibility for clues-tionnkres and institutional research at your instlitution?
4111-N .
Yes NoI
If no, please list the titles of other offices that share thisresponsibility with ybu:
1/
23. "Is the institutional research office supported, by an advisory group?
Yes NowIf yes, please indicate below the number of administrators, faculty,.4 1-iii students that make up the group; *\ .
, -
Administrators Faculty Students Others-Please specify any others
24. Whetis your estimate of the perc4ntage of time you spent doing in-.stitutional research work this past college year(1980-81)?
95
25. Is there an established procsdure to request reports fromiyouroffice for other segmentlit.orthe college to follow?
t
s.. .
e.
Yes' Nornmnw
If yes, please describe:.kft.
. *
t
1

.1106
26. PleaSe estimate the percentage of time during a. typical work yearthat your institutional research work falls into the following
;
, .ft categories:
(A) Off-tampui - questionnaires and data supplied to agenciesexternal to the college such as HEGIS reports for the federal govern-ment, data for accrediting agencies, college profiles for'admissionyearbooks, requests from professional associations such as the Amer-ican Council'on Education, local community groups or doctoral re-quests ych as thiS one.
(B) oh- campus - studies supplied to other segments of thecollege but' where the request originated outside the institutionalresearch office. This might ,involve data for grant applications;faculty and student data for management purposes, and similar re-quests that come from on-campus but external to the institutionalresearch Office.'
(C) Initiated studies that originated from within the in-.stitutional research office at the suggestion of,those working inthat office without any outside incentive. Thses may be the resultof analysis of data colleCted for other purposes but which the in-stitutional researcher saw could be reinterpreted Or managementinformation purposes or'it might justjoe data colleCted and analyzedpurely at the initiative of the institutional researcher.
(D) tOther - other time-consuming activities that fall withinthe purview of institutional research but not within the preceding
( three categories! Please list below, in general terms, what these'activities consist of:
27.
28.
(A) Op- campus ' % (B) On-campui % (C). Initiated %.
1 (D) Other %. Total should equal 100%. '
Have any of your studies, originally initiated by the institutionalresearch office, become routinized as standard reports?
Yes No
If yes, please pecify any such studies which have been'soroutinized during the past, two year's:
Assuming that all conditions were favorable, owtiat percentage of time
do you believe should be available for the, instit9tional'researchstaff to initiate studies of the college based.on thp'staff'sknowledge of the needs of the college?
113
4
0

11,
o
107
As a followup to "this questionnaire and.to ask certain other qgps-tions pertaining to your relatlioraiR to other offices on yourcampus, .
I will call your office shortly after receipt of this questionnaire.Please list any blocks of time whin you will not usually be available forsuch a call such as 'regularly scheduled meetings, lunch hours, vacatkoi%time Nor known off - campus' engagements in. the near future:
a
Your phone number:
Thank you for participating in this study. If you are interestedin the:results of this study please check telow.
I am annot interested in receiving a copy of the sum-mary results of this study.
REFERENCES -
Rosso Robert A. hall /Rural Two -Year Colleges: An Analysis of TheirProblems and Characteristics, 1979, University of Virginia.
Stecklein, John E. "The Birth of a Profession: In Research on AcademicInput, pp. 9-13. Edited by Clarence Bagley. Association forInst4tUtional Research, 1966.
.114 4

. ,
4ACCESS: The System /that Never Had A Chance To Fail
Dr. Steven k. Gratch, Office ofAdmissionsMr. Louis M. Spiro? OffiGe4bf Analytic Studies
State University of New YorkCollege at Brockport
This is a=case stucly of how a system that has administrative support
but licks pollitiG.GoiltrOl can run into.difficulties.for .those the system
is intended to serve. This paaicular case involves the development of an
informational resource syskm intended for use by the Admissions Office of
a medium sized public higher educational institution. Directors of Admissions
in many colleges have increased their dependence upon Institutional Research
and Data Processing offices significantly because of greater competition for
students and the recognition of the need for more sophisticated enrollment
management techniques. Larger universities haV, demonstrated that strategic
market planning depgnds heavily upon close working relationships between4 .
Admissions Office and Institutional Research offices to Produce the analysis
and information necessary to direct resources for more effective recruitment
strategies. Some universities and colleges have even gone as far as incor-
APporating research staff into the Admissions office. However, at many colleges,
the important'informatonal resource link between Admissions and Institutional
Research is at best, underutilized an0 in some cases almost non-existent.
iThis paper explores a case study of the development of an informational
linfc between Admissions and Institutional Research which helped Initiate and
fina.11y "accomplished" this particUlar project. .t,The goal was to design and
implement a ne0 computerized prospective student tracktng system, but a vast
array of political, organizational and operational factOrs at various times
.have helped and hindered the development of the system.
t.
SYSTEMS DEVELOPMENTAL HISARY
The very beginning of the idea for such a system stemmed from a request
from, the Admissions office to the Institutional Research Ace to "fill in
numbers" ona survey of the Scholastic Apptitude Testing Company. As this
was deemed to be the "function" of Institutional'Research, to supply "numbers";. .
nothing unusual would have been noted from such a request. However, a point
of frustration had been reached by the institution at the beginning of the
115

4
109
. -1980's due to the decline of enrollments and'it had resulted in an administra-
tive reorganization at this college. The reorganization included the creation.
of specialized research offices in other major divisions vf the College
(i.e. Student Affairs and Academic Administration) in order to provide greater
assistance to the Institutional Research Office. In the case of the Admissipns
office at Brockport, this reorganization4llowed a new Institutional Research
link through the newly created Office of Research and Evaluation for Student
Affairs.
The Director.of the Institutional ReTiiieh-15:ffiZt;tiWIEFTSCiiChe
Administrative Services division, contacted the new Student Affairs Office of
Research to discuss the request. It was during these discussAns that the
need for a student prospeCt file became evident and would be possible with
current available resources. With furtheresearch into the request made by> f
the AdTissions office, it was ud)scOvered" that the inVorm)tioil on prospective
students who have taken or will take the standardized national tests, were
supplied monthly on tapes and cards for disk storage. Receipt of this info"-
oration triggered little, $f any, response from ourAdmissions office. From
this initial inquiry into lack of responsiveness to our prospective students
the idea of building`a Prospective Student File, which woul.d then be combined
witha compdter generated and coded mailing system for appropriate informational
pieces to be sent to these students, was developed.
During this swim period of Mid-1980 the reorganization of the College
included thelpsearch for a new director 6f the Admissions office. The idea,
for this new student prospect system, therefore, had to be presentedtwithout
the endorsement or direction of the ofice for which it was intended. The
directors of Institutional Research and Research for Student Affairs approachedo.
the Vice President for.Student Affairs, the office responsible for the college's
admissiokprocess. When presented with the idea to develop the system, the
Vice President's response was immediate and positive. With his approval and
support,worI began,immediately to proceed with the development of this Prospec-
time 'Studint File:
The first draft presentation of'the computerized tracking system for
Admi sions was made by the Office of Research and Evaluation for Student
Affai s in early October of 1980. The presentation wasmade to the College's
exe utive management and was positi ly received and approved by the President
and his staff.. The detailed "walk- through" presentation outlined the benefits
of the new system to the College, as well as fokeeable.obstacles to its .

0
... , A 119..
. develOPment,_Amt _r eceived no. apOrent opposition:from any'area.'.1n,fact;. e 1. .
shortly, thereafter, the project was given "Top Prfority" for development and. .
..implementation so that the impact' would be eiidint by.Fell of 1981. 'This '-..., . .
! acceldrited acceptance was.due to the concernof the entire organization over
( the'recent hispry of declining enrollments and the belief thata system such
as the one-proposed,could help-th stabilizing or perhaps increas`ii-ig,s1!41eni
t
4 t
As work on the deVelopment of the system proceeded, the twd research
offices working together incorporat d the assistanceof 'the Office ofAamin-
istratixe Data Processing to a elop a program on the Burroughs B6800, only
recently installed :in the summe/of 1980. As` well asAdnAnistrative Data
Prqgessing, the office of the University Systems Analyst was brought in to
oversee the impact of the development of this admissions System and insure
integration with the Colleges.pxisting file structures.4.fwas anticipated
that the idea for AdmissiOns could grow to a College-wide Data Base communica
tions network for appropriate offices within the college (e:g. Registrar anti
Records, Financial Aids, etc.). -
Although efforts were made to provide leadership in the Admissions-area
during this period of reorganization the search foroa new director of
Admissions was begun but not concluded until November.ef1980. By December e
the new director assumed her responsibilities. .11 discussion with the new
'hector it was agreed that the development of the system should continue
subject to her approval on 'modifications and new additions'to the Admissions
process.
It was "assumed" in.the beginning of 1981 that the admissions area
be responsible for implementation once the spe lined research offices com-.
pleted the initial stages o systems desig fdrmal appointment was made,
, however, by the President. In the Spring of 1981 two addadditional in
the organization occurred which affected the implementation phase.of the
project. The first occOrence was the temporychange in reporting within
the organization for the Admissions office. This change made it necessary .
for therAdmissions director, to reorient the new leadership to the importance
of the project and its poittion among a new set of priorities that this
temporary leadership was faced with. .lhe sbcond factor was that during the
period the President of the College chose to resign and the search fora new
Chief Executive Officer for the College proceeded.
4

r-
111
: p
With these events chrOnicled let.us .rmprproceed.to a brief description
of the actual system.. . .
,.
, f* ACCESS: PROSPECTIVE STUDENT rat -.
:-. --tt, .
- The student.eracking system, 'known as.ACCES4 (Admissions Communication 4e 1.
-components for Enrollment Studedt Search),.had four basic goals. These.
0--- ) . were to: . ,
,,
-. ,
1. .Segment student poptilatibns, bath prospective and applicant students,
geographically, so that Admissions would have a better idea of areas
in w hich it was doinviell in attracting newtudents, and areas that
Would need more attention in:the future.
2. Provide inforMation to the.prospective and applicant student in a
timelyand,sequential manner. /This would result in the coordination
of student contacts -and would increase efficiency hyjeliMinating .
duplication of information. t"-t . 4
3. Analyze and evaluateoreoruitment echanisms and strategies and
iuggirt improvements.f9r the Tutu
5
4. Developthe new sys'tem withinthe ewisting limits'of current
- Liii-esouries'of the,Admissions office.
The main-purpose of the ACCESS system has continued to be the provision
of a systematic delivery of necessary materials.to both,prospective (no
aoplication,on.file)and ipplic;nt (with application on file) popUlations of 4
students. Asindicatedearqpr, during 1981 until the :present the Offices
of Administrative Data PropessinC.Institutionil Research, Universi.* Systems
Analyst, and Research and.Evaluatfon for Student Affairs along with Admiisions
has worked on. the necessary details of such a file (e.g. format, codes,
materials, schedules) ,and its filial implementation for the Fall of 1982
(originally 'Fail 1981).."
The conceptS of a. coordinated "data -base communication system between--f
relevant student service offices thdt:would.atsist the student applicant ha
not, as yet teen fully addrOsSed. However, the objectives for the'Au fissions-
office have been clearly defined. They are:'
1. An on -line computer systet:for.prospe2tive'and applicant students
to Broditorf College. .
4P
2. The use of ttie ACCESSaile to "vide systematic records and
continuous contact .._botto the prospects and the applidants.
4. . 1 la'it,
0.

4
,o.-
_
112'
3. Analysis of Brockport's market share-and 'development of potential -
. markets'. . -0-, .
4. Evaluations of Admission proceduresto increase efficiency and
effectiveness of these grocesseNa
S. To prbVide timely and clearprOfilesoi incoming classes that' are
sthe'outcome of Admissions efforts ferecruitment...
. THE PROCESS, 1;4
40 The Office of Admissions hats prepar4d an "input card" to- be used when
contact made with praspective students by counselors, staff and faculty.
N.
4
This card will pr videlmough infermati1
File, ,which will be created- Eithe Admi
The number of records in this file wi
to create a retard on the ACCESS
ions hffice'usilithelon-line stem.
be controlledWb"he Director of
`,Admissioris4 tn,order to predict the s ze of applicant pools and finally
matrteulant students is meet en llmetit quotas. By creating a record from
irioUs sources who OW m the input card to theAdmissions office, a
process Wl. b.triggeled:Whfchwill start a series of materials to be mailed.
tio-tile prospectivestudents. These'mateciils will attempt.to comrince the
student to submit an application. This file consiva-Cif prospects in-the.
Ihigigories of freshmen, trantfers, and high-school seniors..
.-Before sending each mailing', a check of the prospect's file will be made
..' to tee if an application has been recei!-
ceived, then theimaterials sent to the
Aifieren<series.of materialswirt begi
If theStudentiqoffered admission to-
series'ormailin0 will contjhue until
11/her studies or does not accept' the
applicants.iRthe categories of fresr.
.pRoposta OUTt ..
,
1 - F-r011ithe inforthition supplied by 14 ACCESS system a Aumber of uses for. . . . ,
.' -,the:Admi-ssitlis office have bepn plannecr in its development:
,., A.4 By.genOating a Hit- of high school, seniors from the file and match:.r - ;-
2.. .., i7iglIthem with applioktions.received by the College, a list of. -- .
"matchIsetitots" (withi on file) an0 "no-match Seniors"
.tno &pffications bn flleYcan be generated. At this point, the no-.
ved. If an application has been re- .
student.Orospect will cease. A
n which are necessary for applicants.
die College, th6i,fhis prescri
the_student arrives on campus
:Tli6art:OZ'the file
limen tarisferl .
COMES
bed
to begin
consistp
MIL
6
match,s4nior can'be crossed with the SAT tapes a nd ACT cards to
r.
,
rr

I
.0
-+ 113r
determine whether or not Brockport has'received their scores. 'At.
that time a letter from the Admissions office could be sent to the
no -mach student stating t hat irockporthas received their SAT or1ACT sires And is awaiting 4ir applicition,
B. A list of high school juniors that have been contacted Wilt*.
generated so that earlier and continuous communication with the
student and his/her'famiiy can be made. Information from the
Admissions office will be sent to the siudent.l. parents, since,
more often than not, the parentshave a.greAt deat of influence in
the decision process of chclice.of copIge. A letter firom the
-Financial Aids offiCe could be sent offering assistance -- giving
answ&s to where apprkations1can beobtained, and anydeadlines
to be met`' -
C. A list of high school applicants will be generated and sent to the
appropriate officials at the high,schools they are attending. 'In
this manner, the Admissions office can communicate with guidance
counselors as to who is aptlying from their school and indicate
whether the q uality is sufficient or:not. The same sort of process'.
can be done for the transfer population from two-year colleges.
D. This file will be used,to,evaluate Admissions travel. By crossing
the applications on.theACCESS file with high school or two-year,
college-codes.to get a better idea of where visitations are
effective oawhere they should be reduced.' Geographic distribution of
matriculatsd students will help jo Planning more effectiVe adniissjons.
strategies, as well..
E. Additional uses of the file will provide.the basic information to.
-help market the college. 'For example, it will give'loc4tion and
educational hfstory'on prospective. applicants and allow better
planning for thesi incoming students. It should give offices such
as those involved in.transcript evaluation and advisementa better
indicator df total numbers of students they will be processing in
advance of completed applications so they be prepared. It. ,
will also be possible'to examine whether or not certain segments
of the applicant pool are being reached (e.g., non-tradititiall etc.).
The preceedingere'just'some examples of the.scheduled uses of the
,system. This system, however, has not reached the Stage of fulL implementation,
although originally scheduled for Fall of 1981. At present,.it is estimated
1 2 id

.
that implementition'will occur'by Fallof 1983. Why? The authors will
now Attempt to analy ;e how a system, wanted, approved and supported by a
college administratio'n can be, hindered. in its development by the same
organiiaiOn. k.
..#
HINDER. . PROBLEMS THAT - 1.
. .
The reader may ask; "how can this system with solid organizational
support run it io Problems°.in its implementation?" Well, there have been
many reasons 'for delay in implemental on of _the system and most have been
organizational rather than technical in nature! The polities of higher
education is always a variable in impleintation that should be taken into, .
.
consideration. Certainly, the example of Brockport is one.which clearly
has shown that organizational and political reorganization his played a.
.
role in slowing the process of implementation, even in Its climate of accep-
tance to Initiation of this particular system.
As indicated in the 'brief history of develoPment of this system, it
was indicated that the initiation of the project occurred at-3 time when
the leadership within the Admissions office was in transition. The pre-
vious Director of Admisions-had been moved to a different position within
the college's organization during this period and no interim director was
chosen to replace him dtiring the search period: From June 1980 until. ,
December 1980, the Admissions office was'"leaderless". .iiiercfore, the 140
office for, which the-system of ACCESS was being designed had little; tf
any direct input; Such a lack.of user input can and has led to somewhat
of a "benign neglect" attitude, since the staff knew little of the opera-,
tional-techniques of the system. For the system designers this meant that
they had:to gueis.what the new director might want from the system and this
also led to a "fear" that a new director might not even want to use the
system once completed. This, of course, gave the designers a feeling of
isolation which is always detremental to the completion, of such a project's .
Aevelopment. After this six-month period,,a new Director of Admissions was
chosen; and after an "adjustment " period of approximately three months .
the director finally had a chance (due to the fact she was hired in the
middle and peak of the admissions cycle) to review what had been initiated. .
She endorsed the completion of the *CCESS file and inquired if she.should
direct its completion. No direct answer was given tot her, so each office
went about finishing its partwithout direct supervision or coordination.
121

4
115
To'exaterbate the situation, the kresidentof the .rseCollege; 'although
having indicated he was going to retire, decided to reorganize parts of
the,tollege, due to political conilivt Along some of the adminikrative-4
sAff. The Admiitions office had been moved physically'during this period '.
to anew loCation on' campus; and, then after the new director had beeil)in
3rer4ob only four months, it was decided to change ttii)reponting structure-" s's
tempoilrily to alean instead of the Vice President to whom She had been 1.
reporting. The dean was in a different division of the College al! wall.
'Since resOurc.677thp project had*all been in 1.1e Student Affairs divi-
sion it took another three months to initiate and explain what had been dpn
in this particular projett to the. new dean. So, an additional three morphs
elapsed before being able to continue the project.
By July of 1981, the new President had been chosen-, and'he dirett4
the Admissions office to report to the Vice-Presidential level,as before.
'The Director of Admissions had to reorient the entire project back age* to
its original area of Student Affairs. /-
The changes affected the project even though it was given the institu- I #
tion's "number-one" priority designation. Elon,with this designation,
'however, the continuous shifting of the reporting structure created a
situation wherein individuals with no pevious knowledge'of the system had -
to be indoctrinated and convinced that resources should' continue to be
diverted towards the project's development. Often,-this created confusion,
since not all of the resources could be made available_under the new argent-.
zational structure. 'It became particularly confusing for those working on
creating data input screens for ACCESS and the Data Processing managere'
because no notification-Jf who might be in charge of the project,,or which
divisionAit was necessary to contact for clearances, or whose budget the
cost of computer equipmgnt and supplies should be
Another point of interest is how the "number -one" priority designation
came about. Before the spring of 1981, there were'a number of reques,ts given
to Administrative Services Division's Administrative Data Processing a(rd
"4the Univeaitt systems Analyst. :With limited staff, the nuniberof.pe.
hours to accomplish' the proposed projects' in these areas would_ have teben et
decade! The development of priorities became imperative. This issue was
brought to the attention of executive management, resulting in a full moan',
.t9priaritize the list of requests for pro amming. Due to the obvidus
problems in declining enrollment, the S syitem was againgiven the1,11.
institution's top'priarity for these -as. )12. /
.

c
116
Within the Admissions office itself, there have been areas which have
lagged behind in development. Maink;1 systems for back -up when the computer
is "down" were necessary. How to train staff to use the system has.only
recently been given some attention. The reason for the delay has not been
lack ofnterest but more to do with the nature of the admissions proCess,
-cycles and external factors, such as the changes in reporting.structure.for'
Admissions indicated. earlier. The authors believe that since the project
was developed in isolation, rather than in association with staff of the
user office, that it has been difficult for the user to understand and often
appreciate certain parts of the system as it was-built. OfcoUrse, due,to
the pressing concern of declining enrollment, short-term and more immediate
projects (e.gtincrgised travel by staff) haye lessened the available tinig
necessary for implementation: These shorter term strategies have, for the
most part, taken precedence since they emanate from the executive management.
This continual "crisis management" mode of operation detracts from the time
necessary to be spent upon the longer range sistems implementation. .
Another factor in slowing the Implementation of the mailing process
was due to the hiring of an outside marketing consultant initiated by the
College in Spring of 1982. Even.if the system were operational in Spring
of 1982, the consultant indicated that new materials would be developed
. AO the Admissions office had to wait until the company hall finished pro-
ducing these new materials. Since these materials. have not as yet arrived,
the decis)ons as to when, how and to whom they will be. directed have not
been made. Existing materiials have not been re-ordered to insure against
the use of "out-of-date materials: The entire marketing effort is only
now Bing designed so that even with the delivery system in place, the
Materials are not as yet available. 4)
Interestingly enough, the marketing consultant indicated his lack of
knowledge in Writing his reco mmendations regarding the importance of such a"
system as ACCESS for timely deliver'y of. marketing'materials. Certainly,
this omission may set the project back, since it could be-seen by the
executive management as less of a priority in the overall marketing plan for
the institution.
'Mt

117
LESSONS LEARNED
One of the major outcomes of this continuing protess was that even with
all, the political and organizational obstacles some truly significant, changes
were instituted. What.has been accomplished has been due to the persistence
of a link developed between the Institutional Research office and Wer
Admissions office.. An example of utilizing this link occurred when the
Admissions office was asked to shorten its turn-around time from receipt of
application to mailing of acceptabce offer. Staff in Institutional Research
made suggestiont-concerning the current process to the Admissions director,
which reduced the time for turn-around. The link can be used effectively.
once confidence in the fact that institutional researchers can do more than
"provide numbers" is established in the eyes of the Admissions professional.
Less positive are those lessons which have we'ikenerthese same links.
These lessons are:
1. Initiationfand implementation are equally important and should
never be isolated but rather coordinated within the.organization.
2. Good ideas and systems are subject to the hazards pf the political
environment of'the organization and simply cannoebe avoided.
3. Project management problems arise quickly/ The lack of specific
projeCt responsibilities,.time lines, pr press reports and
1evaluation -of outcomes makes it very easy for great lengths vir
time topass with relatively little accomplished.
4. 'There mustPe a "ccinspicious.consumer" actively involved ihrough-
''.1 out the length of the project.'
4
124

t .
STUDENT CHOICES: WHY ARE ELECT ECOURSES ELECTED?9
,d> Robert F. Grose, Office of Institutional Research, Amherst College
IrrIntroduction
My own interest in finding out more about elective courses and how
they get to be that way stems from several sources. There has been a
major trend "toward higher proportions of electives in our curricula. We
have also been trying.to Understand more about the learning histories of
individual students andhow much value has been added in their learning
development during the college years. Elective courses provide us with
both clues and questions.
The current highly sensitive reaction to course enrollments by
individual faculty, departments', programs, administrators, trustees, and
students invites us to understand better'how to project course enroll-
ments. Staffing, advising, funding, scheduling, all provide occasions for
wanting to know why students take certain courses-.
Although precursors can discovered; the general movement to an
elective curriculum is ordinarily attributed to Charles W. Elliott who
became President of Harvard in 1869. He.had'Oofin out before his
inauguration and continued to champion an increasingly electivfr,curriculum.
Frederick itudolph's Curriculum, A History_of the American Undergraduate
Course of Study (Rudolph, 1977) ps well as several recent books by Arthur
Levine on past and current curricula in higher education supply very help-
ful background.
Rudolph demonstrated that the change from a college to a university
.was facilitated by'the elective systqm. He further noted:
"President John E. Bradley of Illinois College was probablyunaware of both Galton and Cattell when, early in the 1890's
he observed: 'To mv mind the object of elective studies is notso'much to permit' 'a student to choose those branches which bearupon his future work as to enable him to select such as willinterest him Amd thus lead his mind to act with greatest vigor.'.Neither the old school nor the new school had the final answerson how the human mind worked; the neeschool may have helped to-kill off some of the silly pretensions that had been advancedin the name of Greek, but it did not eliminate theidea'ofmental discipline and training, of habit and routine and workas sources of intellectual vigor."
125

119
;Rudblph goes on:4
"Edwin E. SloSson's verdict on the elective system was also a.pronouncement on the new and old schools o1 psychology: That
- many students abusetheelective system is obvious, but theprescribed iystem.abuses many students, and this is worse.'
II. Concelits.
Space does not allow further exploration of the intriguing history
of the role and.nature of electives in our undergraduate colleges and
universities. On one extreme we have a cmicentralion or major almost
'always being required for students. In addition to the concentration
we have some sorts of general educationcourses sometimes referred to as
core. The samesourses are sometimes-prescribed for all students or .
groups of students (common courses), but more often a distribution is
introduced within which there are partial, electives under prescribed
.irotipings. Finally, there are free electives that go to make up the4
remainder of the students' required number of courses whether by
semester, year, or degree program.
But we must keep in mind another distinction. A Course takeny
one. student for his or her.major may constitute a free elective for
another student. Certain Concentrators must take preicribed courses,
whereas other students may elect to take thoie identical courses (off
on the other hand may be prevented by regulations from taking those
courses.) From institution to institution the amounts of the student's
program consisting of' general education distribution and of concentration
will vary and hence will the proportion of free electives. Moreover,
even within the major or concentration there are oftensomenelections"
from groups of courses within the major field.
At Amherst College; theoproportion of courses required for the
bachelor of°arts degree that can be devoted to free electives has changed. . .
considerably over the years. Professor Hugh.HaSkins, a member of the
Select Committee on the Curriculum, recently wrote some of this history
forys. In one of his tables here attached (Appendix O'the entry for
1875-76 shows only 15% of the courses were free elections. By 1905,
Amherst had followed Harvard and moved to some 75% electives in its
curriculum. 'Things changed and in 1946-47,"Amherst introduced a
curriculum in which the first two years were pr9dominately courses
common to all students. The proportion of electives dropped to 29%,
)t.

120.
40
but then by the early Seventies, the faculty had moved back to'allow
some 75% of'courses to be free electives for students:
It is 'with this background thatI encountered a continuing, problem .
for me as an institutional research investigator. With such a wide oppor-
tunity foestudents to elect courses;4and-without any disiObution
ipecifie4 it became more and moredifficultlo describe to the College
community just what students did take. We evolved a dimple count as a1crude way of showing what many of the students did and produced,swnmaries
of the courses elected by graduating classes throughout their time at
the College. Table A, f6r example, shows the way in which the Humanities
majors distributed their 3301 courses in'their four years. Aiherst is
part of a Five-College Consortium so some courses were taken,off campus
at the other institutions: Hampshire College, Mount Holyoke College,
Smith College and the University of Massachusetts. Here are same2611
courses or 8.9% of theTh total courses (Appendix II).
This and similar tables are developed somewhat as a course load
matrix, but rather than limiting ourselves'to a single semester or year,
the packets of courses taken by each student (no matter in which year)
are the vehicles for analyiis. 'Another example is found in Table F
(Appendix III) which shows for several'years whether students tried
either one course or more or none in a particular department. (The
full report on theSe electiOn patterns is available from the Officeof
Institutional Research at Amherst College.).
-It was my examining-some of these data that led me more and more toor
question what really were the reasons -for students electing courses--out-
ielde their major. We have also noticed a phenomenon in which some 17%
or 18% of the most recent classes have tosen to elect two separate
jov And completed both.
III. Factors and Reasons
What can we say about the kinds of possible factors judged to be of
importanCe in influencing students to make aparticular selection among
the courses available? A
A. First-we must recognize a variety of requirements or partial
requirements. Some dqtributional requirements will have strict
alternatives of sOecific .courses. Curricula will differ in the loose-
ness or degree. -of flexibility as well as the number of alternatives
v.
"sr

121
they offer for satisfying requirements. We have requirements for grad-
uation alone; the possibility of a course being a pre - requisite or
requisite for yet another dgSired course, whether a course is thought to
be helpful in' terms of the local lore tAeffipare for another course.
The general education distribution requirement,Will supply added direct-
.ives. 'Some students evaluate courses as possibly uleful for admission
to graduate professional schools or other post-baccalaureate study.- All
of these factors ar in. addition to the courses required for the major.
B. We -know soinething from pur experience as to the sources of
information available to students courses. We do not know, how-
ever, much about how to sort out the differential effects of the Catalog
itself, registration materials, word-of-mouth, course syllabi, graduate
schoolcatalogs, an interview with the instructor and so forth, as
sources of information. The sources Of information also overlap the
particular sources of influence or rec endations. These.are found not
only in printed materials but among stud nts and other effective indi-
viduals. That is, influence may come fr m an academic advisor; espe=
daily for freshmen; a secondary school guidance counselor; individuals
at'(he department level; the registrar; another faculty member; the
instructor of the course; Deans; parents; family; siblings; general -
higher education directories and so forth.
One study carried out at Williams College showed both sources and
agents withjn the same list for-the group of freshmen entering in 1977.
College materials were judged by the students involved to have been.the
major influence (86% major or...some influence). Parents and relatives
were also important. (46%). Even though these were students making their
first course elections by mail prior to coming to Williams College,
Williams students were mentioned by 29% indicating that the summer grape-
vine may extend quite a distance.
Our studies of some of these matters,however, are not very complete
as yet and offer some interesting cautions. Borgida and klisbett (1977)
demonstrated that students paid greater attention to course information
given by two or three students on i T.V. monitor than they did to a
quantitative summary of course ratings from.over a hundred students As
the authors point out, "subjects in the present studies may have disi
counted.the population that generated the base rates' [for Course eval-
uation] as being of dubious comparability to"themselves:"who ,are these
128
4

122
people anyway? I don't know them.' In the face-to-face condition they
saw the people who generated the evaluation they could tell for them-
selves that they were reasonable people whose views'could not be dis-
counted." (Page 270.)
C. The real masons for choice by students are both complex and
numerous. So far I have, only begun my taxonomy of such,reasons as I have
discovered that such a classification is somewhat idiosyncratic so far
and..slot-very well -Here are some of the
reasons have .developed; however:
1. Some note that the chosen course may involve a familiar subjeCt -
one that tae student likesor alternatively, one that the student does
,well in. Ken Wilson at Service in analyzing the, ,
power of achievement tes ree to preedictfreshman grade point perfor-
mance notes that with an elective high school curriculum and an elective
coll4e curriculum in freshman year, one discovrs many continuations
And even overlaps with high school courses. This results in higher
; correlations than might be the case for new.courses and tt may well
explain the high correlation between certain achievement test averages
and it4shman GPA. Ik does. raise the possibility that the student may
choose to'continue and-be comfortable in kfamiliar subject even at the
cost ofa high proportion of repetition; some want to,play it safe.
2. Many areas of choice dm to be simply aexpregsion of interest,
'±13tever that means. In some ifs, Os could be circular, in that by
,definition: if.someone engages in something there must be some interest
and we tell whether an individual 'has interest by seeing what he engages
in. Some would note the,exploration for possible interest and it is not
unusual in some institutions' for students to eiplore broadly for a
Possible major concentrftion. In a recent study of career development in
'samples, of students at seven selective liberal arts colleges, Hagen dis-.
covved that the alternative-endorsed by far the greatest plurality of
students .was "a subject in which I have a great deal of interest" even
when compared to the poll of requirements (Haagen, 1982).
3. Another cluster of reasons seems to be the general desire of
students foe a diverse education "to be balanced"'"to spread out" "to
have Oiberal arts experience.'- .
4. Related to this but attached to the current semester is the
desire of-the student to provide for himself or herself a*varieiyor
4t
12j4
R

123
balance to the other courses in his or her current schedule, Preference
for "diversity" in the modes of instruction, the subject matter, the pace,
the workloaj, and all the other course features seem to be involved.
Variety seems. to be more prized in"course-taking than homogeniety.
. A whole cluster of .factors are found relating to the quality and
re tation of he professor, that is, the charisma, and the reputation of
t e instructor. It i usual to find students saying "you,certainly
ant 0 take a course with Pro ssor X before you graduate." This is
found in the selection of sections in psicholo byact
Leventhal, et al,
(1975) .
. 6. flowevir, it is not solely the professor; there is also the
evaluation of the course and its reputation. "The course is an excellent
course."
7. There are reasons offered by At least-some students that are less
complimentary to the strength of the educational enterOtiset It is not
unusual to have students say "I thought I could get a goodkgrade." Or
"it appeared to impose a-somewhat lighter work load." Students are .
motivated to maintain high averages, to seek lighter courses to go along
with particularly difficult required courses or thesis project'work loads.
There is a somewhat apochryphal story about Robert Benchley and his course
choices. When he was asked why he happened to choose such a peculiar,
major at, arvard, he replied that the reason he chose the combined major of
.industrial archeology and Turkish tapestry studies was that he hod timpl/
insisted that each of hts courses would have to be after 11:00 a.m., prior
413:00 p.m.lard not be above the first floor.
8. certainly.these days the relation of the course to a career or
job will have a high valence for many. Who has not heard""insurance"
mentioned or "market utility:"
9. There are some other more social reasons - one's"Nyfriend or
girlfriend may be taking the course, one's group of friends or roommate.
10. Supposedly one could dig deeper and find that some students are
electing certain courses not a's a matter of fpproach, but rather,of
avoidande. That is; they may be avoiding other courses and take the.
least uncomfortable alternative.
11. WhAt we do not see too often are those individuals who take" 0
courses because such courses are challenging or that would extend the
individual beyond what he or she is now able to do.
40.

A ta
124
IV. Added Considerations, .
4%A. It is likely that there-are different reasons or factors at
different levels of advancement through the curriculum. That is,
freshmen may select several courses'to explore possible majors. Seniors,.
for eXimp14, may be looking for areas that they have omitted and now wish
to have some sense of completion, whether it be a foreign language or a
course in accounting. Where there is a special program in senior year
such as senior honors or a thesis, then such factorsas a course's Amited
reading load mayIoflbence course elections simply in terms of intelligent
time management.
8. Information about student choice could also be contributed by
studies of why students.'grop courses or withdN from them. That is, if
we could find the reasons why students left courses we would have some
indirect information.on the effectiveness of certain Motivations for
selecting those courses. (e.g.See Reed, 1981.)
C. "Temporal sAuence-goes not only from the high school but also
continues on to activity after college. It is even.suggested,that contin-
uing education or adult education will often consist of "postponed
electives. (Levine, 1979.)
Certainly the shifting views of prescription and freedom
Influence what the student has to choose among and the proportion of.his
work that may be so chosen. The trinity of concentrations/distributions/
elective classification of courses says a good'deal of the institution's
attitude toward its students. 'In the Sixties and Seventies there were
some institutions whichArthrigkly proclaimed that the student will have
to select his/her )earning experience after college and that it seems wise
to'starfthe student during college to take over control of his or her own
education. Hence, a good number of electiies.
D. Data on student course election could be used to evaluate advising,
to estimate the value of freshmen orientation, to evaluate curricular
programs, and to perhaps even monitor over time the preparation of second-
ary schools. Depending on-the circumstincY and'point of view, a student's
choice of electives may be the input (or independent variable), part of I
the process or treatment, or finally a part of the siutcomydependent
variable): These call er a whole program of study with hardly satisfying
.131
4

I
I
125
answers yet to my original question. -
E. Colleges -and, universities d not general* annotate the nature .
of the elective choices in their retording.of studett learning on the
transcript. Chronological trans ripts usually give no indicatio0Whatso-c...,
ever of whether the. student is cdm eting a required activity or one
that he or she selects 'freely. t
S.
We have onl,y a few of the pieces of this complex picture puzzle.
Not even all the edges are visible yet: The shape.and colors of some of
the different pieces remain to be seen: Ile process, by which a student.
;elects courses and the reasons motivating those choices will require. ,
considerable lengthy and sophistitated investigation. The factors are
complex and sO'far it appears that any1one factor seems to relate only to
a small portion of the variance across courses and across institutions.
The growing emphasis on enrollment data, however, and the,conlwsiderable
interest both by curricula architects.and funding agencies in knowing
more about. students electing certain courses leads to the probability -
.0that we in institutional research will be coping with such.problems.
` °
ir
. Note: Reports and added tables Are available from, the author:.Ha.also wishes to acknowledge the generous sharing ofOata-by Dr. David Bobth and Dr. Hess Haagen-as well` asthe bibliographic searche; by'Philip Nelson and theessential tabulations and clear presdhtations by101s.Hill.
,
I
1.

126
BIBLIOGRAPHY
Booth, David. Reasons for and Influences on, CourseWilliamstown, Mass.: Williams College, 1977. (Published,
,jtudy - Associate Provost's. Office.)
Borgida, Eugene and Nisbett, RiChard E. The Differenti'al impactAbstract vs.. Concrete Information on Decisions. Journal4,A lied Soc. Psychology,j977, 7, pp. 258-271. ,
Carnegie Foundation for the Advancement of Teaching. Missions of theCollege Curriculum. A Contemporary Review with Suggestions.San Francisco: JosseTtass, 1977.
Coleman, Jeffrey and McKeachie, W.J. Effects orinstructor/CourseEvaluations on Student Course Selection. .Journal of EducationalPsychology, 1981, 73; -pp. 2242 26.
. .
Haagen, Hess. Personal comkUnicationfor a portion of the Josiah H.Career Choice. Middletown, Connof Institutional Research, 1982.
reporting on preliminary dataMacy, Jr. Seven College Study 'on
.: Wesleyan University, Office
Lan'tz, Alma E. and Smith, GfegoryA. Factors Influencing the Choiceof Non-Required Mathematics Courses. Journal of EducationalPsychology, 1981, 73, pp. 825-837.
Leventhal; Les; Abrami, Philip C; Perry, Raymond P.; and Breen, Lawrence J..§ection Selection in Multi-Section Courses; Implications for the 0
g and Use'of Teacher Rating Forms. Educational esychologyMeas., 3975, 35, pp. 885;895.
Levine, Arthur. Handbook on Underzad*te,Curriciaum. San Francisco:Jossey-Bass, 1979,
di;
Levine, Arthur and Weingart, John. Reform of Undergraduate Education.San Francisco: Jossey-Bass, 1973.
Office of Institutional Research, Amherst College. Course Elections bythe Class of 1982. Amherst, Mass., 1982,34 pp.
Reed, Jeffery G. Dropping a College Course: Factors InfluencingStudents! Withdrawal Decisions. "mai of Educational Psychology,1981, 73, pp. 376-385.
Rudolph, Frederick. -Curriculum: A History of the American UndergraduateCourses of Study Since 1636. San Francisco: Jossey-Bass, 1977.
Select Committee on the Curriculum,% Amherst College. Education at AmherstReco sidern: The Liberal Studies Program. Amherst, Mass.: Amhersttoll ge Press, '19f8.
4
A

EDUCATION AT AMHERST RECONSIDERED
Free Election and Requirementin the Amherst College Curriculum
(Percent of courses required for the B.A..approximated from Catalog Statements)
% Required*a Specific Courses'
ancluded inFree c7c Required ' Required
Year Election cc 4vog Distribution Distribution)
1S75-76I -035-Nt)14:95-t461405-i ea19V5-46
1925-26
19:35-361945 161955-56I966 -6T(plan
adopted1965).
1975-76
153`)
56
i D.-
40
45452944
--..)
'....e30*
,t,0,h,ors.30e
t two majors;15' .25'23
'25
25
0.856244°2V45
40
1W,404831
0,
n
(
112)
(CO):224. P
"(15)
t 00( 5)(25)4. 9)
.-
( 0)
Choices limiteSto Creek and.Latin, or to French apd German. are counted asspeink requirements In no case has a lorergn language proficiency require-t.nt been (Cbtin:ed
6 OM: "Ise sm.:, .b drequirement met A Alistnbutional.: choice one offour iri lie. in the ,nnhosnoe %ear was. to be mathematics or a natural sc *neeThere no '14 tq b lnkible for Honors*,- a student was
t. senitater ..nurses in a Wick, depart111ent-90c of alltore work
a Require:I .agar :rot, 'specific courses consisted in freshinelkchoice ,,t rwo courses out of a list of eleven
,There hi poriap m the maim w ith either courses taken as distributioniequirenients .: tne sophomore %ear or wttfl tree elect:. es of the la,' twoeat, Ti.is et:a; e.piaist ihitotal of 1101- 4.
lit each the :".f Ilsret %tam .4,;(1r:tts were required topske two ear-longntiraes in two sublect$ in ulna* courses were taken the precechng year. Thts'...tmtinur,." requirement has been counted here as a chitributto»al requoremeta In most cases. courses taken to got continua. also consutotted themow pence the total of I15%Throughout this table. :he required fractional konrse sii"putflic speaking gen-erall. a :hail a fourth of a regular course, hls not been counted Since, in)935.-36 a "oile-hour course in public speaking was required of freshmen, .the figure of "0' here 'night better be rendered "1 Similar'. fractiomdpltk ma! ecloca;on and hygiene courses, though usual!. required hase notbeen counted
" A 10(1 (netlap 'If :he limier and chstlibutan retiurrement was probable
11.L.
127
APPENDIX I
Taken from: Select Committee'on-the Curriculum, rducatioll at
Anherst Reconsidered: The Liberal Studies Pro ram:
Amherst, .Massachusetts, Amherst College Promp, 197S.
1st
1
a
is
13'2

ELECTIONS OF COURSESCLASS OF 1982'1,82E - AMHERST
4 YEATS
128APPENDIX I I .
Table A
HUMANITIES SOC.SCI. - 'HAT.SCI. 5 MATH OTHER - OVERALL*113 MAJORS 171 MAJORS 70 MAJORS 9 MAJORS 363 MAJORS
. *
COURSES IN: Courses Elected Couries Elected Courses Elected Cdurses Elected Courses Elected
iN
4-t (Fine Arts) 227Classip aDrama 109
Ge n1::shr nC r
k .638141
74Greek 31
:at- 40m6s1: . 145
Ph-}osonny 125
Religion . . 117
Rvsslan 114
Soanisr 70
107k 1899-
Alericar StPdses 21
Anthropology 72
Black Studies 36
Econcmics 70hstOmle . 144
Pc417.1ca1 2:1. 149
Psycnolog 75
T3TA!: 605
5°c:clog). 38
Astronomy li
'Eiology 70
Chemistry 61
Geology 21
Kathemat:cs 84
'NeurosciencePhysics 54
T07A1- 3G7
'Asian Stucies 23
CoLlccusvm 9
European Et. 19
Fie% S.dY -
Fmesrshah Sem: 2
Inc: Scholar -
Inte.dis. -
t. Incory 1.
Kenan -
.Merlon 4
4..4. ,.or.ov 48
.
:Ls 178.
(*merit), ,HiMasnire 33
Pt. Holyoke 69
Smith 83
. U. Mass. 75
TOTAL 264
GRANC TOTAL 3301
'4-
1
.
' .
W
6.9 4 .Sr7
2.1 ji 953.3 68
I ii...,4-A. 334
4.32:2
104
27.9 8
1.2 5
4.a . 14$
3.9 145
3.5 77
.., 3.5 72
2.1 57
%
1.9
1.9'
1.4
6.7
2.1
.5
.2
.2
2.9
N
6744
15136
14'.9
6
,4"
.
.
1.22.1.7
"6,5
.7
.9
.3
.4
4.5,.'
2.61:01.2
.6
24.7
.3
2.01.53.02.2 .
2.76.2
.9 '
. N. N
. r
11 4.3 402
3 - 1.2 , 2107 2.7 <'-' 195
15 5.7
9 3.5'1123
268.
7 2.7 . 127- . .45- 57
15 5.1 402
3 1.2 325
2 .8 217
4 1.5. 217
- 140
76 25.3 3736
3 1.1 196
. 7 2.7 257
1 .4 179
23. 8.6 70911 4.3 58510 2:9 861
7
8
2.. 572
2, . 208
64
2
24.7 36Ce
.8 87
7 2.7 386
5 1.9 316
8 3.1
8 .3.1 44- \- 7
2 .6 309
113.82.01.9
10.62.51.2.4'
.5
2.85.1
2.0
I.G3
.
2.9
1.6
1.5
1.2
25.0
2.33.5
2.2
11.1
7.713.0
7.3
3.0
55
21
2?
13
519
641
3)
62*7
57130
396
24
244198 -
102174
6
182
57.5 1242
.6 166
2.1 174
1.1 111
2.1 553
4.4 * 383
1.5 647
2.3 360
1 0.2 1
18.3, 2543
.5 4 44
'2.1 65
. 1.9 52
.6 44
2.5 178'- 1
1.1 71
9.2 455
.4 22
.3 17
.6 . 3- .
. .1 8
. -
-
- 7
1.5 73
5.4 . 264
1.0 43
2.1 982.5 652.4 168
4.)
1.e2.8
1:7
.5..
5.58.05.4
2.0
.33.9
.8
3.6
2.91.7
4.2.1
2.9
51.1-
.9
1.3 :
1.1
.931,6
-1.4
9.2
.6
.3
.2
.
..2-
-
.1
1.4
5.7
.k.2.a1.4-3.4
7.6
101.0
1.1
9.44.88.3
.38.7
930
9
3
4
4
.
-
1
21
114.
.3'
1
3
21
90
123
2103
44.2
.4
.1
.2
.2-...
.
.
.1
1.05.4
.2
.6
1.7
1.0
224
5.9
100.0
,
.3....., 2. 12.4 T724-.
1§- 7.3 73
1 .4 3G20 7.7 52
- 14
3 1.2 3
'1
- -
. . 12
18%2
. .7
.3
.5
.1
-
.1
1.7
5.6
-
.9
2.01.7
2.9
7.9
100:0
43 16.6 ----Tr-. 14 5.4 590
.
. 3
0 2. .8 91
5 1.9 208
8 3.1 , 181
15" 5588 ..-312
30 11.6 795
259 100.0 10618
.
Office of Inslitutional ResearchAmherst College - June'1952
8.0 378
100.0 4975
,
133

IP4%4
FOUR-YEAR CUMULATIVE C seacilgn OF mirs BYORAOOATINGIEN1OR5 " AMAMI COLLEGE
CCASS OF 1976 CLASS OF 19,9A 356 A 344
DEPARTMENT .
Elect1 or More
Courses in
Dept.
Art (Fine Arts1 67:Classic*. 33:
Dramatic Arts 25:Enolisr 85:crenc: 22:
German` 2.7%
,reek 6:Latin, - 6%
Music 45%
Philosophy 641
Religion 28:
Russian 21:
Spanish 23%
TOTAL S9:
American 5e:idles
Anthropology 3151
A
Black Studies 16:
Economics 62:History ..: 69%Political Science 65%
Psychology 58:Sociology 28%
TOTAL 98:
AhrOn0My 12:
81010p 45:
ChertliStry-
Geology .1, 17%
Matnemativi 53:Neuro ".fence 1%
Physi s1
44%
TOTAL
.113
77% 401
Asian Studies- 7%Collopuiut . 4C%
_European Studies 15:4rteid Stacy 1:
Freshman Seminar 50%Ind. Scholar . 1%
Inouiry .
Interciscip. 2:Wan 17%Mellon, 6:
TOTAL 78:
'LS
Hampshire IS%
Mount Holyoke 47%SOtth 54$Ohiv. of Mass. 46:
TOTA. 90:
CLASS OF 198CN = 37V
APPitt4DIX III
Table F
CLASS OF 1981N = 363
CLASS 0= %ft:
Not. Elect
Coursesin
Dept.
.
Elect Not Electt or More CoursesCourses in in
Dept. Dept
Elect.* Mot Elect
1 or re arses
Courses in in
Dept.
. %
El ct Not qect Elect NOt EreC:
1 o More Courses 1 or More Course:
arses in Courses' in in
Tint. Deo . Oe.A. Dec .
43:67%75:
15%
78%80%94%94:55%46:72:
79%77:
i:%
36%
86:26:
15: -
'6%
8:51%
62%
33:
25%
29:
46%
69:64:14%
74%
85%92%
-92:49%36:67%75:
71%
70%36%'
31:
88%27%
16:4:
6%59:63:
;ft
35:
,26%
62%69%12%
73;.8496'%
94%41%37:7z
65:74:
66%41:
32%
89t
22:
48:3%1.
64%
69:32:
44:
25:
14% 5
59: 4
66% 30%111 69%
72% 33. r
62% 181
97% 4%
93% 836% el.411 51%
56% 341,"5: 20.
41%
5::
70%
11t
'17%
9irf:t39,
491
6;1
CC,
1% 99% lt 99: 1: 103: "10:1;
75% 27:32:
'3%68%
27%
40%
73%60%
26%
42:
74 . 25%se% 501
1St
84% 174 63* 26% 74% 23% 77: 30: 7:1
38%31%
35%
62:
65%
66:
38%35%34:
65:67%
74%
35%-32%261
64:65%7E%
36: 60%36: 66%.
73% A42% 55: 45% 62% 38% 62: 38: 57:
72% 34% 66: 37% 63: 41: 59: `4."35:
4: 97% 3% 99: 1% '99: 1: 6.9%
1
,'
gz13:43%
87.%
57%
20:44%
80%56%
2B%46%
72% 19:54: 37%
kelr63 .
67% 34: 66% 34% 66% 34% 66: 34: 6E: a-
83%47:
\ 181'55%
l g. 24%
6
30%
65%
if 7C% 2.1%
35% 66:
19% 2% 98i 2: 98% P 1% 95;
56% 48: 521 51: 49: 47% 63: 431 57%
'23% 78% 221 84% 16: 67: , 13: 84% IL:
i.93% 19% 81% 181 11% 13% 87% ° 11% 99.
60% 24: 75: 201 80% 161 85% 81 . ,2:t
85: St . 951 101. 90% 7% f31 * 9: 9::
99% * 100: 1002
50% 42% 5 54% * 46%
10C%
30: 7C: 4: 5E%
99% 1: 99. 99%
1: 99: * IGC%
981. 4: 96: 4 5% 95% 2%- 98% r. 99;
83% 16% 84% 94: 1% 99%94: 8% 92: 6%' 94: 8: '92: 3: 97f.
22% 76% 24: 74% 26: 59: 41: f:t
79f
85: 19: 81% 16% 84% 16: 84% 151 :1053% 44% 56t 35%. 65% 36% 64% /- 36: 54%
46: 451 , 55% 37% 63: 33% 62t . ..-% 30: C%
$4: 49: .51; 45: 55% :42% 58% 4+:.a- 55%
10: 84% '16% 791 ' 21: 80: 20% .73% 2%
*Less than l%
*°":,11°%!7:;:rsrpt:.:::179c23

M
Introduction
IMPRtIING THE QUALITY OF .
DATA OBTAINEDTHROUGH SURVEY' RESEARCH
Jane GrossetGretchen Boris ,
-Community. College of Philadelphia .
Several years ago, the Institutional Research Office at Community
College of Philadelphia (CCP) decided to systematically gather data
/ -
on an ongoing basis Irom a variety of subgroups associated, with the
Institution'. As a result of this decision, data collection efforts
at CCP became heavily reliant on the use of the mail-out questionnaire.
Much of thappeal of this data colledtion method stemmed from its
abflity-to provide an efficient meaulf to gather large amounts of data.,
at-i relatively low costin a ihortReriod'of time.
The standard data collection procedures included one mail-out of
the survey instrument, cover letter and postage-paid..zenvelope to all
survey participants, followed in three weks by a poet card reminder-
no all'nonrespondente to the initial mailing.
Despite thezelative economy of this-survey approach, the associated
response rate (20%) was often unacceptably low2. Since the\respondebres to
these surveys did not represent a. randomly selected group from the survey
population, a questia concerning the quality of the delta was frequently
raised.
In an effort to mailmize the quantity and quality of information
lathered through institutional surveys, a series of experimental data
tcollection procedures were put into motion. Built into each ongoing survey
that was designed to gather information pertinenrto:the functlo-ing of
1130
Vs
f

131
the Institution, was a research component that was designed to provide
0answers to methodological issues that would eventually reduce errors at
the data collection staget largely' through improving responses rates.
BY%using'this approaciegver the-lastseveral yeirs, a reservoir of ii '
formation has developed which has been successfully applied to subse-
quent survey research conducted at CCP. Most of the exPerimentalin-
formation can be broadly categorized as either data collection procedures
or questionnaire redesign.
When a particular procedure has been found to positively affect the. ' s..._
survey response rate, a crude cost-benefit lysis is made in order tocost - benefit
. . ,
determine if the procedure should be incorpo ted in futufe institutional
,,
'surveys. (A cost chart . used for this analysis appears in Appendix A)..
J
REDESIGN OF DATA'COLLECTION PROCEDURES
Consideration. of data collection procedures included analyzingthe
effects of introductory preletters,'postage-paid envelopes, rewards and
.
personaltzation on response rate; studying effective methods for following
up do nonrespondents; examining the quality of data collected,face-to-i
face versus through-the,mail and surveying random samples rather than
entire populations.
0
Nonrespondents Follow-up Proceddres
.04s stated earlier, the standard data collection procedure at CCP in-
tluded an initial mail-out of a.cover letter, queitionnatre: and postage-.
paid enuspe, followed three weeks latilit a postcard reminder to non-
respondents, netting approximately a 20 per cent return on the questionnaire.
13Es.

132
I
Based on the suspicion that, many of the nonrespondents to the initial
Mailing had discarded the original copy of the questionnaire and return
* .
envelope by the time a follow-up reminder was sent, a decision was made .
to include these two items with the reminder to nonrespondentsin a
subsequent survey. This additional proc ure resulted in enlarging the
overall response rate by approxima k 10 to 15 per-Cent.
The cost of each additional questionnaire gathered by this approach
was approximately $1.28 (based on an initial return of 20 per cent and
/follow-up returni of 15 per cent).
Before evaluating the faked cost of the procedure against the'increased
response, it was decided to add one more step to the process that would
. enabXe'en assessment of the.quality of the extra data that was collected.
In cinder-
to do this, a 10 per cent sample of randomly selected nonrespondents.
sf..the mail-oUt questions ires, selected from both surveys, was interviewed
over the'telephone. The questionnaire Used for the mail survey served
the telephone interview instrument.
\ A
-Since the' participants in the telephone survey wereobased on a random
selection, an assumption was made atat the information gathered by this
meaha\was more representajive of the overall survey population than was
,the information gathered through the mail survey of self-selected re-
spondents. Comparisons of participant demographics and.survey responses
between the mail and telephone groups Indicated that a small amount of
bias was presenp.in the mail data, however, inclusion of the data obtained'
.41
r
4f
from the mail nonrespondentfolIow-up'helped to normalize the mail survey
" information.
13j

sib
Based on these findings, a decision was made to routinely include a
questionnaire and postage-paid envelope in future survey fotlow-ups io
nonrespondents and to include a telephone follow-up of a randomly selected
group of nonrespondents in order.to check for the presence of response
bias.
Introductory Preletter
A fairly common survey pn/tedure includes the use of an introductory
preletter sent to potential respondents a short time before the arrival
of the questionnaire. It is anticipated that a preletter has a positive
effect on response rate.
In order to test this pcbsibility, half of the potential respondents,
in a survey received dipreletter approximately one week prior to the
arrival of $he qqbstionnaire. For the remaining survey pirticpants, the,
: arrival of th cover letter and questionnaire served as the introduction.
to the survey.
.
Analxiis of response rates associated with the diffeient groups in-.
dicated whatP
iffdividuals who received an introductory prelettIr were
three penocent more',likely to respond, however the differences between
group response rates were nonsignificant x2 (1) = n.s. for graduates,
and' (,2 (I) =..5610n4. for non-returners..
Theqe results, taken into. consideration with the cost per additional
questionnaire ($3.46), Zed to a decision that a preletter.uouid not be4 .
incorporated into the dapa.collection methods for these two surveys.
4
14U

. .
Personalization
134
A
One of the More interesting f4aings-occurred serendipitously, as a. d
result of time constraints rather than intentional design.
.
Great care has always been taken to ensure that profepsional im-
pression is conveyed to survey participants. Identifying inforn6tion.has
been typed on all correspon0Ance.
Inthe middle of preparing survey materials one year, the Institutional
Research Office found itself pressed for time and in the interest of
meeting mailing deadlines, only half of the surveys had typed identifying-
,
information and mailing envelopes, While the other half were handwritten.
The response rate to the survey that year increased by seven per cent.
In the next go around of the survey, identifying information and
envelopes were handwritten for all survey participants. This approach
produced an increase of thirteen per cent in response from the.original
all typed format.4
' Based on these results, this information will-continue to be band- ,
written at no extra cost.
4
Postage-Paid Envelopes.
Inclusion of a postage -paid envelope for the return of the completed
questionnaire has been regularly included in CCP survey procedures. The
reason for doing so bad, been based on the assumption that-the envelopea
will increase the likelihood of response. In order to determine if it
Il6 . -
would be cost effective to continue this practice a College survey Oas
administered eliminatipg the postage-paid envelope from the process.
141

135
The returns form this survey were compared to the returns from a similar
survey conducted the previous year'. The survey with the envelope had a
response rate that was seven per cent greater than the survey without
the envelope, "42 (1)=53.2,ja .000. The cost was approximately $0.30 per
additional questionnaire. A decision was made to continue the use oL
postage-piid envelopes as a standard survey procedure.
Face-to-Face Data Collection
In'theiinteresi of cutting, survey costs through the elimination of
mailihg expenses, the Course Withdrawal questionnaire was distributed by
/ college personnel who were responsible for expediting the course drop
,
process. This data collection approach appeared feaSible'since students
had to report to a centralized location in order to complete the necessary
.paper work to drop a course. In addition to a drop slip, college personnel. -.
were' instructed to request that the student complete the Course Withdrawal
questionnaire.
43
By semester's end, 1,383 questionnaires were completed. This number re-
presented only 24 per cent of all course withdrawals in the semester, far shy
a the 100% hoped for-through this method of collection.
In order to check oh the quality of the data, a 10 per cent randomly ,
$ selected sample of students who withdrew froma course during the semester
and had not already completed a questionnaire were sent a survey form.
Sixty four per cent (64%) of the sample returned a'questionnaire,
I
142

136'
An assumption was
mdre representative of
selected sample, while
made that the response from ;he mailed out method was
the survey population since it was based on a randomly
the face-to-face.zesponse were in all likelihood subs
ject to sampling bias by personnel responsible for,qp6stionnaire distribution.a
With this in mind, questionnaire responses, student demographics and course
information were comd for the two distribution types. These analysis in-
dicated that a great deal of bias was present in the face-to-fac'e,data and
that statistical corrections for the would be needed befc4e the survey
information could be analyzed Meaningfully.
Since the quality of the data collected face-to-face was so poori it
was decided to forego thiAinethOd of data collection and mail out future
Course Withdrawal surveys.
Population Vs. Sample
Approximately 6,000 courses al6 dropped by CCP students in a semester.
fThis large number makes the administration of a mail out course withdrawal
questionnaire an eXpensive process, ap proximately $1,500. In order to cut
costs, the questionnaire recipients were limited to a 20 per cent randomly
selected sample (cost of $300). that was stratified in order to ensure
proper course representation.'
Useable questionnaires were obtained from 20 per cent of the sample.
A telephone follow-up of nonrespondents 'Was conducted and comparisons of
these surveys'' results were made with the mail sa mple survey results. TheseII
comparisons indicated there' were very few difference in survey xesults
between the telephone and mail responses. In addition, returns by dropped
courses represented institution wide figures.

137
As a result, this questionnaire will continue to be sent to a stratified
random sample of students rather than the entire population.
REDESIGN OF SURVEY QUESTIONNAIRES
Experimental factOts discussed up to this point can be generally
categorized as data collection procedures. In addition to this group
of variables, several items related to the design of survey questiOnnaires
have been studied.
IF
The time for replacing the dwindling supply'of questionnaires appeared
to offer a perfect opportunity is consider strategies related to questionnaire
format that might improve the quality of the information gathered through
the forms. Professional layout..of the questionnaire, color, length and question
phrasing were considered.
Professional Layout
'Questionnaires originating in the Institutional Research Office have always
been professionally designed, conveying an air of importance to the survey
participant through the questionnaire's neat and orderly appearance. It has .
been assumed that the -more important the questionnaire appears to be, the dit
Ore Likely it will be completed and returned.
The questionnaires have generally been one of two types, a technical
AP
opscan-readable form or a machine-typed duplicated form. Although both
forms are identical in content,,neat and orderly, they differ in some im-
portant respects. The technical form is one sheet, printed back-to-back ,
while the typed form is a mqlti-paged, stapj.ed document. The technical form
14

1,38
also looks more expensive (cost.approkimately4t92more per questionn9ire
to produce) than the machine-typed form. For these two reasons., the
technical form might produce a greater response than the typed form. .
In order to determine if questionnaire format has -an effect on response
rate,-half or the potenettl respondentd to survey were sent the technical form
while the other half we're sent the machine-typed form. ,Significantly more of
the technical forms were returned, X(1)=4.42,k4.05.,
Weighing the added cost of. the technical form against the increased
response of eight per cent, a decision was made to use technically designed
forms, wherdpoisible, in future surveys.. .
Questionnaire Length and Question Format
As noted in the previous section, technically designed forms produced
greater-response rates than did machine-typed forms. Twv factors were hypo-
thesized.
as explaining this result, the importance of the information con-.
veyed py the technical form and the brevity possible from this type of form..
In order to determine if questionnaire length alone would affect resp4se
rate, a questionnaire was redesigned to include fivelquestions, printed on
a single side, postcard sized form. The. survey form used prior to this.
. year contained 25 items printed back -to -back on 8" x11" page.
Responses from this short form were compared to the most recently collected
standard length form. This comparison seemed reasonable since the surveys werk
'conducted only one year apart and they had the 'same size populations and the
smile population definitiois.
14at

qa..139
Three per cent (3 %) fewer of the short,eurveiewere returned, )0(l)=.82,n.s.
Part of an explanation ler this result is that the longer form, Which is the
standard-questionnaire length for-most institutional sulveys, probably has not* :
reached an.onaccepiahle limit and isthereiore as likely to be returned as a
shofter form..
'110.
4
. 1_ . - -
An additional feature was built into-the experimental short form that was, . .
.,
. designed toethe Nonfeturning.Student Survey. It Ap0.1 into the/area of question. ..
4
. .. format: ehe issue of ,open versus close ended'question types... .,
.
r
. 41.
.A 'major objective of the survey is to. learn the reasons .why a student
. ,
did not re- roll at. the College in subsequent,semesters. The questionnaire
itemecsig d for Chis purPose-has apPeared in past surveys as a multiple
--s
-40
choice question, Which provided the respondent with 14 options,"including an
"other" category. In recent yedrs; tile' nuMber -of respondents reporting other
reasons has increased 00-pir cent), along with-a suspidion that the forced
._.
.
choice alternatiwssociated.with the question no longer adequately covered
'' )
te'culi range of reasons for nonreturn. 4.12is seemed to'be reasonable since/
_, .,
...."=21" ...
the. qt4stionnaire had been designekin i9761... , -,
..1 1\; .
an Oidef to develop choices thariould lore realistically represent the,. ..) if s .'..r
, i, . , ....
current-survey.poRulati0", the question on the redesigned short form left the,-;..4-,. .
..-----t . A, . ,..., . . .
reason fonndbretuf4 o n ended, the
ieby avoiding the suggestion or imposition'
k.'A '.
ers to the re R. nt. .
. .
1 c,_. -,
.
l7. Camper sona'n
format with the open,
9,./Plikelyo elicla6lesocially acceptable response. Five .per cent (5%) of the
forced choice q-re-"Widenie indicated` they did not re-enroll because of academic
onsesfrom the most recently colleCted forced choice
d format indicated that the lattera approach was less
.1:..1.
,
.t
reasons, while 19 per cent of the open ended respondents indicated they had
academic problems;. :I 4 6 4

140
tough the open ended responses produced more work since they had to
behead tabulated, it -was decided to employ this format in future surveys.
The greater degree of specificity and greater likelihood of unanticipated
reasons provided by this-type of question, will help in the development
'of institutional retention strategies.
Questionnaire Co/or
A number of individuals responsible for conducting suiey research are
proponents of the use of colored forms in order to increase rates of response.
The reasoning is that the colored form will attract the potential respondent's
0'attention and after having done so, will increase the likelihood of that
person completing the questionnaire.
In order to eetermine if this procedire might be employed effectively
at CCP, 500 participants in a survey of currently enrolled students received.
ta questionnaire and cover letter printed on blue paper while the'remaining
500 received white forms. Question wording And all other survey procedures
were identical for theatwe groups. Thirty five per cent (35%), of the blue
forms were returned Land 27 per cent of the white forms. The eight per cent
difference in response rate was significant, :1/4 2(1)+5.7,p .05, however,
duplication of this" locedure in subsequent surveys; while producing results
in the same direction, failed to reach sign ificant levels.-
The, difference in cost of the colored forms,is minimal, therefore a de-
cision was made to use colored forms in subsequ nt surveys.
OP.
of
41414
-.0

Conclusion
141
Various survey methods were tested in conjunction with ongoingInstitutional
surveys. The purpose of this research was to develop survey methods thee yould
maximize' response rates while remaining relatively inexpensive. The results
of this research hag led to survey procedures that have doubled response rates
to some Institutional surveys. In turn., the larger 'response rates have produced
a greater degree of confidence in the data collected by survey methods.
4R.
I
Notes
1: The questionnaires inplbyed survey research at CCP were adaptedfrom those developed by Project Follow;up of the Tex-Sis system.
2. Response rate is defined as tte ,total sample minus all incompletedsurveys dimided by the total sample.
3. glIce the nominal variables throughout this paper are dichotomous,the chi-square analyses included tikes Correction for Continuity:Yates' Correction consists of subtracting .5 from the absolutedifference of the observed frequency mantis the expected requencybefore squaring. This correction provides a better approximationto "x2 curve.

) Questionnaires
tem
2.
Cover letters
APPENDIXIP .
Cost Of Mailed Snrvey Materialstand Personnel
Return envelopes
Mailing envelopes
Postage
I
Personnel
f'
Description .
Typeset and printed technicalform; or 3 or 4 typed pages,reproduced
142
Cost-per poten-tial Respondent
$0.10.
Typed and ,printed on letter- , 0.027
head paper s
Business reply postage paid,envelope: returned
noareturned
40.200.027
Letterhead 0.027
Bulk Mail Rate ,(minimum of 0.038$
200 pieces, pre-sorted inzip code order)
I
7.5 hours to collate, fold,and stuff 300 Surveys at$3.35/hopr minimum wage (costof work-study students)
1 4
0.08
t

Y.
-f
, -
DEGREE PATTERNS AND ENROLLMENT TRENDS
Donald G. Hester. ,
(
. State University of New York at Albany 1 $7 .44,
.* . 'T.r,
.
Research may serve a variety of purposes. The purposes. could be placedc .
. , ., ion a continuum of utility from practical,to theoretjcal, I have been study-
ing
e'N.,
(
degree data from New York Statfor.the Past threeyears and suggested
in my last paper (Hester, 1981) that degree natterns reflect restionsivenessla
ore practical concern for many might well be forecasting enrollment trends. ,
/fh ()resent paper presents tabulated Degree data for three separate years and
\ also, ' -velops occupational data into comparable units. The basic question
\ which th's paper addrases is whether changes in de ee production. cot.espon0,
'\ -with chang _in size OroccupatiOnal.groyps and if. how will future enroll-.
flient be affec d? The degree is an end Product of the higher edgcational sys-4
'
tem (I use the w d "system" in an open sense) and lay thlerefore be dohsidirefo: -,
,
as ap output measur As such, it says something about - activities earliecr'in
the cyoTe within thek tem.* For the institutional planner. the
.
interest may
.
0
\ AtO
.
simply be in grojecti ng th future direction off' grograms , .departMentVor .: :
.
* - ,
schools within a system. devee'production is related in sone wayto:,, . .,-,.
.occupati4 onal changes; then forecasts of occupatilnal chadgel If realized in
, . .
'relity, will at sometimeimbact the campus*ith a change in mliind for pro;
granis.! Obviously, program resource allocatori"would like to know whA futi.re....v,
.
trends are likely. ,There are a variety g# sources for foree)stitof future .
occupational trends. The basicquektion however, is whether! program demand
is in anyway related. Tliere ,are a nur6er of more theoretical
,
conceit
which this research,May illuminate andgthey\
also belOscussed.i 1
ge:
143-
tve

144
The Study-Broad Background
,. .
New York State has an extensive public and private system of highert-.. . .
. edudatipn. It is therefore, an ideal state to study at the macro lvel.. ,
Within the public sector there are two major systems. SUNY, the'State. :*
University of New ark and CUNY, theitity University of Nevi York; ,res'pec- /
tively the first and third largest universities in the lew,York
also has a highly developed economy; if it were a nation, it would have. the
ninth largest economy in the world. The private systemof higher educition
is equally well developed, some of the most regarded institutions in the.:
.world are among them. In the Period 1960 to 1980, nearly 2.4 million degrees
were awarded. In 1960, the private sector awarded 70.7% of the degrees; by
1980, the public sector had increased its share to 5,1.2%. Neither sector
however, in reality, exchanged Pieces of the pie., T is because overall
growth in degree production wal 270 percen ring the period.' The private
sector pre2ntly dominates production of advanced degrees (72:8%). While
the public sector has the major task of a arding.assoolate degrees in the
?atio of 6to 1.
Presently, in the State of New York deg es are awarded at five levels
and in thirty main program areas (that is using the two digit HpIS tlasstfi-'
cation to define program area). Degree data is collected annually from
institutions by the State Education Department as the Higher Education Gen-,.
eral Information Service (REGIS). agent. The researcher was assisted by the. .
Information Center On Education of the New York State Education Department.
They provided basic annual data, from which extensive tabulations have been
made.
.
.

145
4
, -Ptirpose of the Present Study
A The degree data covers twenty years, the period 1960 to 1980. It is
state-Wide"arid-has been broken out in a widi variety of ways. Extensive
graphing revealed) variety of oatterps throughout the period. Some pro-
- t
grains grew, others contracted, some peaked and then declined, while s
waved. Some of the differences might be culturally determined, but the major
growth areas'corresponded.with the economic changes in society. It was
hypothesized that while individual'staleits choose'prograths for a variety"of
idiosyncratic reasons; there is an overall awareness of economic or external
reality and that therjlore'program demand is basically economically driven."-
Students invest In their college education and expect a return. If this'/-
supposition is correct: then it is reasonable to expect that degree produc-
tion patterns will be similar to proportion changes in the occupations of
members of the work force.
Method
It was hoped to match the data for degrees with data on occupations4
drawn ;from New York State. Such data,is apparently not accessible. The
ideal would be to have annual occupation data to match the degree data and
look at corresponding trends over the twenty years that the degree data
covers. A proxy measure' was found to be available in the form of. the U. S
;
Bureau of Labor Statistics National Industry - Occupation Employment Matrix
1g X0 and 1978. For i given industry, the matrix presents the propor-
tion of total employment that is accounted fer by each detailed occupation.
The BLS industry - occupation matrices divide total U.'S. employment into't
. 425 occupations and1260 industries. The occupational classifications used
in the matrices are based upon ciassificatfons tiiiian the 1970 census of
dft

4 OW
146
population, supplemented by employment data from other sources. The Bureau
of.tabor Statistics has updated the 1970 matrix to 1978,'using current pop-
ulation survey data, analysis of historiCal census trends, and assumptions
"--/regarding factors such as changes in product mix or production methods that
affect the structure of industries.
It was thought that, if the 425 occupations could be compressed to the
30 HEGIS categories, then differencei in the two survey periods could be
Compared with degree data for the same years. he crosswalk between the HEGIS
Taxonomy andothe new classification was used to allocate the occupations to
HEGIS 2 - digit areas: The ratios for each year 1970 and 1978 were distri-
buted and then eventually summated.
Degree data was aggregated, bachelors through doctoral far 1970-71,
1977-78 and 1979 -80 Associat' degrees were aggregated for the same perias.
All were then transformed into pi.oportions'of theirs aggregate group'.. This,.- ,
done to .c9ntrol variation from other variables, such as changing uopula-..
tion.,
Thisstudy it clearly limited by comparing New York State degree data
with national occupational data, to the extent that NewiYork departs from
c the national picture. I have suoplied percentage chinges on -thelables
that follow, the main point however, was to oroduce to matrix of program,
occupational change. Ananalysis of differences in rate 9f change would .
require other variables for which do no..have data.
Results (--
Tables A through.present the result of this macro data compressijauid( .
-
Folk HEGIS,areas do not ave.corresponding occupation data, they areUweaft
Studies, Foreign Langu ges, Letters. and Interdisciplinary Studies, programs

.
Table 1Degrees Awarded Bachelors and Above -
New York'State 1970-711977-78 and 1979-80
147
HEGIS + Program AreaCode
1976:71 1977-78 1979:80
01 Agriculture.and Natural Resources' 629 850- 758
02 'ArcKitectuie and Environmental Design 804 1267' 1274,
03 Area studies *le° 344 A 504 405
04 Biological Science 4i97 6256 5861
%.
05
06
Amsioess Management
(Comiluhications **
1 872-.
/I1
713
18425
2641
.21705
3132
-..:
97 Computer and Info, Science * 408 .A248 1823-
08 Education. 22012 20663 17421
09 'Engineering 6485 6883 '7570
: 10 Fine and Applied Arts 4498 6282 6293
11 Foreign Languages 3326 2122. .1880-
12 Health Professions. '2881, 8331. 9109
3 ` Home Economics ' 663 1563 1371
. 14 Law . 409 573 5\44?
15 Letters 10381 6889 6151 .
16 Library Science 1161° 850 760
17 Mathematics 3858 /2007 1622
19 Physical Sciences 3418 3058 2769
20 Psychology '5574 6838 6439
21 Public Affairs ** 1821 5779 *60f8
.4
22 Social Sciences - 18204 16743 15219Ai
23- Theolo9y 485 283 335
49 Interdisafilinary Studies0 4,
.1561.
. *5593 5324,
,
* Degrees awarded from 1964-65 .
** Degrees awarded from 1969-70 .
Sm 4
Source NYSED: Postsecondary Information Systems /REDS and Information Center
-on Education
HEGIS: Higher Education General Information Service.
T
A st

Table.2 o..
Associate Degrees AwardkNew York State, 1970-71
1977-18 and 1979-80
-148 '
. 1
HEGISCo d
Program Area 197041 1977-78 1979-80
4 -and Science .. 12521 '16274 11299
50 Business and Com. Tech, 8080 16274 '518059 .
51 Data Processing Technologies 721 , 960 1341
.52 Health Servi-ces & Para.' Tech. 3694 '6818 '1279'
53 Mechanical Science Tech. , 3010 4629' 4666
'54 Natural Science Tech. 1006 2857 2814
55 Public Service RelatedTech. '18834 4223' 3458 .
,
. i -
Source NYSED: POstsecondary Infdrmition Systems/ HEDS and Information:
Center on Education..
. . .
Table 4NationalOccupational DataGrouped By 2 Digit HEGIS
Categories 1970&1978Technblogist Level
HEGISCode
Program Area 19704? 1% Total 0cc.
1978
% Total 0cc.PercentageChange
50 Business & COMmerce Tech. 23:61. 23.78 +0.1
51 Data Tech. 0.63 0.78 +23:8
52 Health Services & Parained. Tech. 0.43 0.65 +51.2
53 Mechanical & Eng. Tech, 14.14 14.14.
0.0
54 Natural Science Tech. . 0.70 0.52 -25.7
''
Public Service Related Tech. 1.14 1.19 + 4.4
Operative, CategOrees ) -- 35..38,,._33.03,
Source: The U. S. Burea6 of Labor StatiticsNational Industry - Qcqupation'Matrix for 1910 add 1978
411010svo.
153

Table 3National Occupational DataCrouned,By 2 Digit HEMS
6
01
02
03
04
05
06
07
D8
09
10
11
12
'13
14
15
16
17
19
20
21
22
23
49
Categories 1971)&1978
HEGIS Program Area 1970
Code & Total. Occ,
Agriculture & Nat. Reioui,ces 2.26
Architecture & Envir. Design ' .0.80' -
.4- -
Area'Studies
Biological Sciences ' 0.04
Business Management 9.64
Communications 0.35
Computes & Info. Science 0,3$
Education- 4.53
Engineering - 1.42,
Fine and Applied Arts 0.46
Foreigq Languages -
0e4th Prc;fessions 1.77k
Home Economics *" 0.01
Law '0.40
Letters -
Library Science :0:6. .
° Mathematics 0.05
° Physical Sciences 0.21
Psychology 0.04
Public Affairs.
0.76
Social Sciences . 0.41
Theology 0.31
Interdisciplinary-Studies.
46,
a
149
1978 Percentage1 Total Occ. Change \
1
1.66 -25.5
0.80 0.0
0.05 +25.0 ..
11.24 *16.6
0.50. +42.9
0.46 +31.4
4.46 ..- 1.5
1.25 -11:9
0.61 +32.6f',, -
2.03 +14.7e
0.01 0.0 --
6.54. +35.0
- -
0.17 ., + 6.3'
. 0.04 .-20.0
0.20 - 4.8
-0.12 % +200.0
0.85. +11.8
0.64. +56.1
0.28 - 9.7
Source; The U. S. Bureau of, Labor StatisticsNational Industry - Occupational Matrix for 1970 and 1978
4.
Z1 t156

.150
Table 5Degrees Awarded Bachelors add Above,
New York State 1970-71, ,1977-.78.and 1978-79
As Percentages, Percentage Change andOccupationShange.
ercen ag- '. ercen age ercen age ucc.Of Degrqes Of, Degrees Change Of Degrees Change %
1970-71 1977 -78 1979-80 Changed
, -a I ,
01 Agriculture & Nat. Resources..
..60 .68 +13.0 .61 +1.7
OZ Architectur& EnV. Design .76'
'''.3
1.01 +33.0t
Loa +35.5
03 Area Studies ** :40 +21.2 .33 -
04 Biological Science ' 3.99 4.98 . +24.8 4.60 +15.3
05. Business Management 10.134 14.66 ' +41.8 17.56 +69.8
06 Communications ** .".. .68 2.10 +208.8 2.53 +272.1
07 Computer & Info. Science * .39 .99 +153.8 1.48 +274.4
08 Education 20.94 16.45 -16.7 14.Q9 -41.5
09 Engineering * 6.17 . 5.48 -11:2 6.13 , -6.5.
10 Fine & Applied Arts :4:27 .4.99 +16.9 5.09 +19.2
11 Foreign Languages 3.f6 1.68 -46.8 \ 1.52 -51.9
12 Health Professions : 72.74 6.63 +142.0 7.37 +182.1
13 Home EconOmics .63 1.24 +96.8 1.10 +74.6
14 Law )/ ..39./6
+17.9 . .43 +10.3
15 ktiers 9.88 5.48 -44.5 / 4.97 -49.7
16 Library 1.10 .68 -38.2 .56 -49.1
47-Mathematics A3.41 1.60 -53.1 1.31 -61.6
19 Physical 'Science 3.25 2.43 -25.2 2.24 -3T.1
20 Psychology. 5.30 '5.53 +4.3 5.21 -1.7
21 Public Affairs ** 1:73 4.60 ' +165.9 4.91 +183.8'
22 Social Sciences 17.32 13.32 -23.1 12.32 --28:9
23. Theology 0.46 .23 750.0 .27 .-41.3
49 Interdisciplin y Studies 1.49 4.45 +198.7 4.31 +89.3"
-25.5
0.0
-.
+25.0
+16.6
+42.9
+31.4
-1%5
--11.9
+32.6
+14.7
0.0
+35.0
-
*3720.0
4,6..4:8
+200.0
+1--t56.f
-9;7
* Degrees awarded from 1964-65
** Degrees awarded from 1969;30
tit
S
'aa
S

00
=
0
MI
151
Table 6Trends in Degree Production and
Occupational Change Between1970 and 1978Programs.
{expanding program A
expandirig occupWons
Biological Science Law.
Business Management ...-Public
Gommunications Affairs `
Computer & Inf. Sc., Psych.
Fine & Applied Arts (1977-78)
Health Professions
HomeEconomics
I
Library Science
Psychology (1979-80)
Social Science
Architecture and
Agriculture andVat, Resources
ti
C
Environmental Design
Engineering
Education
Mathematics
Physical Sciences
Theology
contracting occupation
contracting programs
156

re
152
that have a generic function.
There are degrees awarded at the higher levels (bachelors,and above)
in nineteen areas for which there is corresponding occupation data. It will
be seen that there are eight areas which are expanding in degree production
and also in occupation. These are all areas whichcorrespond with the
known reality that.the economy is moving in a service orientation.
The Areas are:
Biological Science
BusinessManagement
Communications
Fine and Applied Arts
Health Professions
law s
Computer and Information Science ''ublic Affairs
There are five areas where there is contraction of programs and of
occupations. Demographic, cultural and economic factors al, likely -to be
involved in accounting for the declines.
They are:
Engineering Physi* Science
Education Theology
Mathematics
The remaining programs have contradictory, findings and maybe affected
by particular factors including Ones specific (to New York State.
They are:
Agricultural and Natural Resources
Architecture and Environmental Design
- Home Economics
1
Library Science
Psychology
Social Sciena

; 153
Discussion
A
The parameters of this paper preclude a full discussion of the data
presented here. However, some interesting featurei are worthy of comment.
,Two sets of occupatidnil data'were used, and it should be noted only eight
years apart and even irOhat relatively short time-frame considerable per-
centage change is'in evidence. This is particularly theiase with the
growing programs/occupations, where there is considerable gain 0 botho
variables. The contrActing programs/occupations show a smaRty decl
generilly in occupations, with.the exception of mathematics (which may be
due to a flight to Computer Science), never thvless-, degr7s production,
contracts accordingly. ,
I had reasonably assumed a'lag effect might be present between occu-
pation change and degree production. I therefore included the latest year
of degree data available.in Makisng the tabulations. The broad trend is
matched however, year fot year a "lagged" year of degree data serves
more to clarify the' contradictory relationships. Agriculture occupationally,
is shown in decline but the degree data shows growth to 1977-78 but moves
;into deolinVin the lag period. It may further be suggested that agricul-
ture.has contracted itsAabor-force, while increasing production thrOgh
the use of superior technology. It 'is possible that the 'demand for education
was increased. Similarly, with Architecture and Environmental Design heV
1438 period has stability. in degree production, it is possible tha there wass . .
a hump in'occupation.growth between the two labor surveys.
Library Science may have in it a-credential effect (the State raised
its standards) thus creating demand for education at the turn of the
seventies in New York State. In the case of degree productiin within the
16u

154
.0
Psychology category there was "growth in both degrees and occupations, but a
decline in degrees on the lag year_of 1979-80. Moreover, the higher degrees
continueeto grow. There has been a marked decline in bachelor's degrees
through the- period as also the case with Social Sciences, though.in the latter
higher degrees-declined as well. Both ocCupations have made a rapid advance
in minimum qualifications. It is also probably true that students have
- moved away from bo th these areas at the bachelor's level becaUse of change
in attitudes culturally towards social science study.
Associate degrees were introduced in New York State and awarded from
1970-71 Onwards, the same year from which is drawn the occupationda:ta of
JP
this study. Some caution in interpretation is therefore warranted. Natural
Science Technologies is the only one though, that does not correspond with
tthe occupatiOn trend. It is also worthy of comment that the- large numbers of
associate degrees produced in the short time frame oft 'decade wpuld seem to
be related to' the size of the occupation ratio.
The data suggests that there is a Close relationship between changes
in degree production and changes in occupation size. It should, of azurse,'' °
4
'be realized that developing a forecasting model for a p,rticular'situation1
- would require the inclusion of a number of variables notconsidered
.At the more theoretical level the data suggests that higher ed,
is operating very much with a sense of the wider environment. Recent -arch
on economic forecasting (Lahiri, 19182) .suggests that the non-expert can
do a good job when compared with the expert. Students mayl similarly
sensitive. It seems at the aggregate,level students_anticipateAbe reality
\,1p
,of the world of work and choose accordingly.

*
Conclusion's
This study has answered the question in the affirmative of whether
there is'a relationship between degree production and occupational change.
155
Planners would do well to maintain awareness of occupational trends. Fur-
ther research on the strength of the relationship between educational pro- '
grams allichanges.in occupations is indicated. Gluts and shortages could
ji also profitably be considered. Clearly the'eduoational enterprise adjusts
to its environment. A better knowledge of how it works would at the least
provide the means for improving information dissemination and anticipation
on the part of planners.
Referencas.
Oster, Donald G. Degree,Patterns - At Indicator of Institutional-I
Responsiveness. Planntt2 for Quality. NEAIR, Princeton, 1981.
r--
Lahiri, K. Lahiris Our Expert on Experts. University News, October
1982,. Vol. 6, No. 4, pp. 1-2. S.U.N.Y. eat Albany.
U'. S. Bureau of Labor Statistics. Natidnal Industry - Occupation
EmPloyment Matrix for 1970 and 1`978 and/Projected 1990. Washington,
D. C.1. S. Department of Labor Bureau of Labor Statistics, 1981.
.4k
r

MEASURING THE IMPACT OF PROPOSED FINANCIAL AID CUTS:
THE PERFECT STUDY IS ALWAYS. TOO LATE '
Gail HoganOffice of knstitutional Research and Planning
Ithaca College, Ithaca, New York
Larry W. MetzgerOffice of Institutional Research and Planning
Ithaca CollegeIthaca, New York
INTRODUCTION
In the fall of 1981, the Reagan administration proposed a series of
major reductions in federal financial aid programs. Prior to that time,
short-range planning studies at Ithaca College had focused oNestimating
the effects on enrollment of demographic changes, shifts in students:
interests, and changing requirement's for entry into the professions; it
had been assumed that the efts of the financial-need variable would
'vain constant in the short term. /Ability:to pay has never been a'
factor in admissions decisions at Ithaca. Although.the College has not
been able to meet all financial need, opportunities for middle-income and
lower-income students to attend Ithaca College increased between 1976 and
1981 as a'result of three factors. A deliberate decision.to keep increases
in tuition low made the College more affordable fn comparison to other
independent colleges. Successful development efforts increased the College's
scholarship resources; in partnership with Ne% York State and the Federal
government, Ithaca;C011ege, was able to proOde better fipancial aid packages
to its students. Most important, the Guaranteed Student Loan program
allowed students to borrow money at a reasonable cost.
Since the Reagan administration's proposals implied a radical change
in the federal government's role in financing higher education, it was
.apparent that an assessment'of the probable effects of these proposals was
essential before further dedisions could be made regarding enrollment goals,
marketing and recruitment initiatives, tuition and fee.polAcies, and fund-
raising priorities. This 'paper describes the first stage of a series of
.1 6;)
156
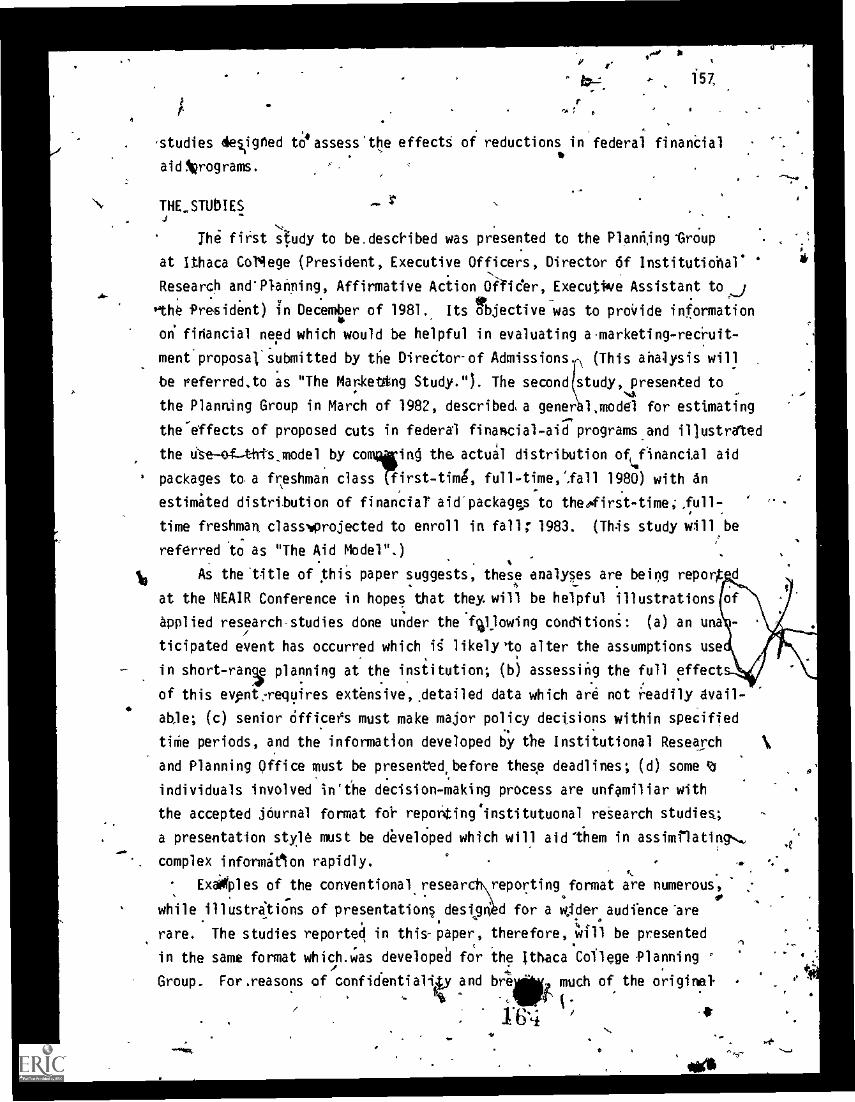
studies designed to assess'the effectS of reductions in federal finanCial
aid iprograms.
THE.STUDIES r
The first study to be.deschbed was presented to the Plant:Ong-GT.4:41p
at Ithaca CoNege (President, Executive Officers, Director df Institutiohal.
Research andPlanning, Affirmative Action Ofider, ExecuOve Assistant to j
'the P objectivein December of 1981. Its objective w- as to proVide information
on financial need which would be helpful in evaluating a.marketing-recruit-
ment'proposaliubmitted by the DireCtor-of Admissions. (This analysis will
be referred,to as "The Marketitng Study."). The second study, presented to
the Planning Group in March of 1982, described,a gener 1,model for estimating
the-effects of proposed cuts in federal financial-aid programsand illustrated
the Ute-o4-thilodelby comilin4 the actual distribution o%financial aid
packages to. a freshman class (first-time, fulltime,%fall 1980) with an
estimated distribution of financial' aid'packages to theefirst-time; ,full-,
time freshman, class' rojected to enroll in fall; 1983. (This study will be
referred to as "The Aid Model".).
As the title of this paper suggests, these analyses are being repor d
at the NEAIR Conference in hopes that they will be helpful illustrations
applied research-studies done under the.fWowing conditioni: (a) an una
ticipated event has occurred which is likely 'to alter the assumptions use
in short -ran 1e planning at the institution; (b) assessing the full effect
of this evpnt:requires extensive,, detailed data which are not readily avail-
able; (c) senior dfficees must make major policy decisions within specified
time periods, and the information developed by the Institutional Research
and Planning Office must be presentd.before these deadlines; (d) some to 0'
individuals involved in'the decision-making process are unfamiliar with
the accepted journal format foih reporting'institutuonal research studies;
a presentation style must be develOped which will aid-them in assielating.,
. complex informitIon rapidly.
ExaMples of the conventional resear reporting format are numerous,. 0
.
while illustrations of presentations desitg d for a wjder.audience-are
rare. The studies reported in this-paper, therefore, Will be presented
in the same format which.was developed for the Ithaca C ollege Planning °
Group. For.reasons of confidentialiity and br4jiiii much of the original.
.cWv16'4
el' 11
i57,
e
'

;.>
158
1
infonnatien has been omitted. It is not anticipated that.an institutional
research and pthnning officer at andther institution will formulate the
same questions, collect the same,data, or use the same presentation 'format;
tgfis de'scription of the_work of the Ithaca College institutional research
and'planning staff is being reported as an example of one kind of response,
which can be made'to an unanticipated event which affects short-term planning
aSsumptiOns.
THE MARKETING STUDY
Date of Presentationto the Planning Group: December 16, 1981
Objective,: Provide information for evaluating the proposed admissions/ pub-
lications package for entering classes, 1983 and 1984.
Decision deadlipe: Christmas
Questions to be addressed:
kle, How many student4.requett financial aid when they apply to Ithaca College
and how many do not? .
7B. -Considering applicants (1) who do not request financial afd, and (2) who
are rejected by Ithaca College; how is dis group distributed across SAT
categories?
C. What percerit of our freshmen'class apply to and are accepted at other
colleges?
D. By specific academic program, who are our major competitors?
E. .Many of the students we admit are also:admitted by another college.
When we'compare "matriculants" (those who choose to enroll at Ithaca College)
with "cancels" (those who choose to enroll at a competing college), what
percent of each grodp rank costs'ind firihncial aid as major reasons for
their choice Ocollege? 'Do these percentages vary among specific academic
programs at Ithaca College?,fi
Conclusions:-
A,' For the College dt a' whole, 'about half of our freshman applidants in
1980 requested financial aidand half did not. These percentages varied
considerably by prkgram: 64% of the applicants to Program Group #1 asked
for alt, while only 25% of applicants to Program Group #2A asked for aid.
For the College as a whole, there is no difference in the percent of "Cancels"
'These conclusions were rev.iewed and discussed by the Director of Institutional
Res arch and Planning -ftas each table was esented to de Planning Group..
.%.
. -
- .1412, ''s.*C.;7 .1...
7 #:N
1 6 .)
AP
4

,
3
159
(students we admitted who did not enroll) and.."Matrics" Istudents who did
enroll at Ithaca College), insofar as requests for financial aid are Con-
cerned. It does appear,.though, that in some programs financial need may
already be a factor in the decision to enroll at Ithaca College. SEE
TABLE 1. .
B. If cuts in federal.financial aid programs keep needy students from.
attending Ithaca College in the future, we may have to choose between a
smaller freshman 'class ,or a ress acadeAtally capable freshman class. Of
the students we rejected who did not ask for aid in 1980) 88% had SAT scores
which were lower than the Ithaca College median Score. .5EE TABLE 2.
C. Of the students who enrolled as freshmen in 1980, about 4 out'of Sy:,
applied to .and were accepted at another ceAlege., Since our'programs'are
diverse, we tend to-have a different group of major competitors for each
prog am. In the case of some of our smaller programs, specific major com-
pettors do not even appear on our a11- college list of major competitors.
Oilly one of the major competitors identified in this study is an independent
institutiowin New York State which will be affected comparably by changes
in both Federal and New York State financial etc! programs. For most'Oograms,.
we are competing with public and inddpendent institutions: %'iEE TABLE 3.
D. We were able to find some groups of students who were accepted at Ithaca
College and another college and match the reseonses of those who came to
t Ithaca College ("Metrics" who responded to our Student Orientation Question-
naire) with those whochOse the other college ("tancels4vhb completed opr
Cancel Questionwire). _These are small groups and may not be fully repre-
sentative of all the studen who were accepted by us and by a specific
competitor. It appeirs, thou h, that in some casO we have marketed
Ithaca College successfully byt have lost students to competitors because
we were too expensive or because curfinancial aid packaged were insuffir
cient. In other cases,.costs,and financial aid did not appear to be the
significant factor in the decision not to enroll at Ithaca College. Given
the prospect of major cuts in financiI1 aid, we need to ask whether the
same marketing approach is appropriate for all prograis. SEE TABLE 4.
TNE AID MODEL
Objective: Estimate the impact of 'proposed federal financial aid cuts on
the freshman class at Ithaca College in 1983-84, based on an analysis of
financial aid patterns for freshmen 'in 1980-81. (EOP-HEOP freshmen and
I

ABLI 1, Admissions Cycle; Freshmen, Fall 1980: Requests forFinancial Aid.
.
group All - College
'Applicants:"
Financial Aid: No
Yes1k
Mean Need
100%
53%
47%
$N,NNN
Rejects: 100%
Finial Aid:// No 53%Yes 47%
Mean Need
y.tceptS:: 100%
''''-financial Aid: No 54%Yes 46%'
Khan nNeed
>1
$N,NNN
160
Program/ ProgramGroup #1 Group42A
Program
Group #3
100% 100% 100%
64%36%
125%75%
59%41%
A
$N,NNN $N,NNN0!
$ N,NNN.
100% 100% 100%
69% 26% 63%31% 74%
$N,NNN $N,NNN .
..$47%
$N,NNN
100% 180% 100%
62% 24% 57%38% 76% 43%
'$N,NNN $N,NNN; $N,NNN .
Cancels . 1,00%.
7140Tal7Aid:' -lip. 53%- Yek .47%
Mean. NNN °
Marics:' 10
. Financiald: - No 54%
Medi. Need $ N,NNN .
s' L .-
Yes 46%
100%
62%
3.8%
$N,NNN
100%
62%38
100%
. 26%74%
$N,NNN
100%
22%78%
$N,NNN
100%
54%46%
$ N,NNN
100%,
62%38%
$ N,NNN
.7 .-. .
llai-LR;t11;i of Combined SAT Scores fbr Applicants Who Were Rejectedby.anaci-aftege an W40 Old Not Requet Financial Aid.
I .
ProgramGroup .Tdtal
AboveAverage
tit
Average
#1
tqA
#26
#3#4
#5#6
100% .3%
100%.100%100%100%100%100%100%
2% 6%9% 26%0% 0%.0% 8%8% 14%0% 0%
10% 15%
3
4
BeloAyer
. '
-
'88% .
92%.
65%100%92%78%
100%p.
75%

A. 161
TABLE 3. Competitive Status: Full-time Freshmen, Fall,',1980
Category
Program Group
'Total #1A #1B .42A #28 #3 #4' #5 #6,,
All matriculants 100% 100% 10Q %' .100% 1,09% '100% 100%41.00%. 100%11121''.
17% '13% 23% 16% 15% 18% 18% 118% 21%No competition
Applied only at (11%) ( 5%) (19%) (16%)(15%) (
Ithaca College t
) (16%).(114) (14%),
Accepted only6 %)
( 4%) (10%).( 3%) ( 7%) (7%)
at Ithaca Coll
Competition 83% 87% .77% 84% .85% 82% 82% 82% 79%
TABLE 4. Competitive Status: Seleled Competitors by Spec4fic Programl.
4' Rein
Program Group 2A Program Group 3
A Select Competitors Select Competitors.
School 1 School 31chool 1 School 2 School 3 ,School 4
Number
Matrics at It_
Cancels at IC
Comb. SAT 5Core (X)
Matrics at IC
Cancels at IC
%Req. Fin. Aitl at'IC
Matrics
,Cancels at,IC
Mean Need' at
'Matrics at IC
Cancels at IC
'Costs Major Con-sideration
Cancel Group Onfy
in
n1
75%
83%
n n
T AIX
n
n n
86% -27% , -38% ." 0% I.:75%
67% 56% 33% p% '33%
1
$N,NNN $N,NNN, $N,NNN . $N,NNN $ 00 .$N,NNN ,
$N,NNN .p41,NNN $N,NNN .$N,NNN $ 0 $N,NNN
I-
..Competitors: School
School 3-instate p.101
I
50 -74% KO% 6-=-25%' 25-49% *25-49%
.
I-out of state private U.;:. School 2-instate private U.;
is U:; School Arout of state public U.; Schodl 5 -....
'
16,3..c
2.

162.
4.
recipients-of Veterans Benefits, Social Security8enefits and Employee
046endent.Tuition Remissions havegbeen excluded from this analysis.)'
Model :, This model will be used for future studies; specifit assumptions
ibout.cuts i.n federal progr,;Mswill be changed to reflect actual legisla-
tion.'
A. "Cost of educattim" is the cost' of education to the student (tuition,
room, board, books, travel); the estimate used is the typical package
figure which our Financial AidOffice develops in order, to assess financial
need.4
8: It is assumed that the cost of education is met by: parental con-,
tributions; (2) student Contributioris (earnings during the summer and the, _
school year); (3) New York State financial aid programs; (4) Federal finan-
cial aid programs; (5) Ithaca College scholIrshipt.
C. In comparingresources'available in 1980-81 with resources likely'to be
available in 1983-84, it is assi;med that:
(1) Parents are able to pay the same percentage of the cost of education.
In this model, the Guaranteed Student Loan Program is considered a resource
for the parent. Ln 80-81, the pai-ent could borrow .up to :$2;500 per year,'regardless of whether
modlO assumes that jin
against "oamet need."
the student could demanstrate,"unmet need." This.
1983-84, the parent will be able to borrow wily
if on income cap is imposed for the GSL program
(e.g., exclusion of parents snaking more than $30:060, regardless of the
"unmet need" factor), then,thisodel will not beousefut
,(2) Students arele to pay the same percentage of the cost of education.
This model assumes that,both the College Work-Study Program and the Ithaca
college student payroll are resources for thestudent. It is assumed that
the College Work-Study Program will not: be cut substantially, and that the
Ithaca Colloge.Audent Payroll will meet the same percentage of the student's
4contribution in 1983-84 as in 1.588,181.
(3) New York kate financial aid programs will, meet the tame percentage of
'the cost of education.
(4) Pell Grant (8E0G) will be cid 40%.
or.
- 4 .
(5) 'Supplemental Educational Opportunity Grants (5EOG). will beipt 100%.
(6) pNational Direct Student Loans will be cut 100% insofar as freshmen in
1983-84 are concerned. This assumption will change forother classes. The
Werlying assumption is that we 'Will be hardpressed to maintain NDSL
,
,t.

163
-commitments to upperclassmen in 1983-84; At is unlikelY.that lmoney will
. b4--ailable for freshmen.
(7) Ithaca College scholarships will Meet the same percentage of the c9st-
of-education in 1983-84.
Illustration of the Model: Freshman Class, 19807.81,
Compared wioth Freshman Clips, 1- 983 -84
4
t
047
4(Note: The "Total Rst,pf Education" equals Aumber of matriculants
X Typical P'ackage. In 1980 -81, cost of education equaled 1297,matriculants
iiimet-$7,680 package. For illustration only, we are assuming the same number
of matriculants and a typical patkage cost of-$10,000 in 1983-84.)
80-81 83-84.
Total.cost-of education 00%
Parental andictudent cootribUtiogs 87%
(includes GSL, CWS, IC wages)
All other aid sources * 13%
(NYS) ,
--( ..3%)
.(IC scholarships) 4( 4%)
(BEOG, SEOG, NDSL) : ( 6%)
\ '160%
87%
- 8%
( 3%) -
(4 %),.
( 1%)
Shortfall resulttng 'from federal cuts / 5%
Distribution of Aid to Freshmen in1980-81
All freshmen 100%
Not receiving NY S aid, IC scholarship, BEOG, SEOG or NQSL 65%
Weiiing one or-more of theSe aid packages: NYS aid, IC
-35%SCholarship,i8E0G, BEOG, or NDSL.
ABOUT 1 IN Y,FRESHMEN IN 1980-81 °RECEIVED- AID FRdP NEW YORK STATE; IC
SCHOLARSHIPS, BEOG, SEOG OR NDSL.
Estimated Effects of Federal Cuts in 1983-84, Based on Patterns
7( of Aid in 1980-81 and Assumptions Previously Outlined
All freshmen.
Notreceiiing NYS
. Receiving NYS aid
ReceiNi4-only1C
4'
100%
aid, IC scholarship,I
BEOG, SEOG, or NDSL 65%
only )schol)ship, or receiving only IC
scholarshi'p and NY.S aid
Affectedby cuts in BEOG, SEOG, or NDSL
\
4%
5%
26%
(Range in,percent affected; proorpm A - 46%; program Z - 18%).
).17o
or

164
ABOUT 1 IN 4 FRESHMEN COLLEGE -WIDE ARE LIKELY TO BE AFFECTED 43Y CUTS IN
BEOG, SEOG OR NDSL. THE PERCENTAGE AFFECTED VARIES WIDELY BY ToL.
FOR THESE FRESHMEN, BEOG, SEOG, AND NDSL MONEYS ACCOUNTED FOR ABOUT 23%
OF THE COST OF EDUCATION JN.1980-81.I
AFTER THE ASSUMED CUTS, THESE FRESHMEN WILL BE SHORT,'ON THE AVERAGE,
ABOUT 19% OF THE COST OF EDUCATION IN 1983-84.
Offsetting Fede ral Cuts: Estimated Cost to Ithaca College
If we attempt to offset these estimated f 1.1 cuts. with Ithica.
College scholarship dollars, scholarship money: rWeshmen Aid have
to increise from 4% of the "cost of education" for a41,freshmen (number
of matriculants rpackage cost)'tO 9% of the "cost of education" for all
freshmen.. .
. -
'Another way to look at this prob)em is to consider Ithaca College
,scholarship moneys and Federal funds as "davonts" against the cost of
education. Because finahcial need varies widely by specific academic
program at Ithaca.College, the "discounti"'account for a much.
higher.
percentage of the cost of ed ation in some programs than they do in
others. The followi e details'the estimated effects of cuts in
. BEOG, SEOG, and NDSL %s.' the."discount" model. Note that while the
all-college'disCount" for freshmen in. 1980-81 was 10%, the range by
program was 7% to 19%.. .
. , !,:.:,
TABLE 5: Financial Aid ag,niscounk": All-College and Specific. Programs .4 . i
1."Oiscount4e on Oe'Cost of EduCation.for All Freshmen .
.. ...
Unit
Actual 80-81 Esmated.
83-84...
IC
"Scbol.BEOG,'SOG.NOSI. Total
I t.%Scho . BEOG Total
A''All-College 4%. ) 6% 10% 4% 1% 5%
46 - 9% s 1'0% 19% 9% '2% , 11% .
45. 7% ; : 10% 17% 7% 2%.
9%
#2 6% 9% 15% '6% . 1% 7%
#4.., 5%* 8% 13% .5%
.
'.
-
1% 6% ti
'#3 4% - 5% 9% , 4% 1% '- 5%
#1 . 3% 4% 7% . 3%: 1% 1 4%
¶.44

SUMMARY
These analyses were part of the plannineprocess at IthalCollege.
They were not the definitive factor in the formulation of any specific
decision, nor should they have been. When college administrators discuss
factors which contribute to good decision-making, the typical researcher,
165
argues the merits of quantitative data. But even the most forceful
Proponents of the value of institutional research studies assume (that
the topic under^consideration is "researchable," that-relevant dAt
exist, and that adequate time is available to do a comprehensive study.
At the typical.college, how6er,the institutional researcher is frequently
a participanein a decision - making process where the traditional assumptions
cannot be met. jt is on tiete occasions that the institutional researcher's
professional judgment is tested as he or she addresses the following ques-
tions: ,.
A. When does one infOrd the-President that thecareful planning studies
which have been completed by the Office of Institutional Research Planning
are now irrelevant -- or, perhaps;.actually detriiiental "to good decision -
making -- because an unanticipated change. in a major variable must be con-/
.sidered? ,
'B. If one cannot do "the perfect study," when should one do nothing, and
admit' that the techniques of institutional research are not useful in
addressing the`particular problem facing the institution? .
C. When should one do a limited or(partial study of a'comglex issue?
D. If one does a limite98tudy, Io W dges he or she_ communicate judgmedts.
about "scope," "vatidity;" and "reliability" to those who are unfamiliar
with,the researcher's definitions of those terms?
_ As this paper demonstrates, the institutional research staff at
Ithaca College chose to &I certain analyses related to the topic of federpl
f
aneial aid cuts. The major factor in the decision to do. these studies
was the'context in which the'information would be disseminath.° The
Planning Group is small, the members know each other well and have worked1
together for a long period of time and they share an extensive khowledgef
of the College. The Direct)! of Institutional Research and Planning
ex wined the an,Ayses to the group; eadrmajorpoint was discuised as it.
was pr ented. ince the group Included people w ith current knowledge of
legislat nitiatives at the Federaj level, the researcher's assumptjons,.
172. .*
.

166
, concerning federal aid cuts were carefully examined. As the group had
worked together closely on many other occasions, the tone of the working
session was frank and informal. Most important, the Director of Institu-
tional.Research & Planning was confident that a mutual understanding had
been established concerning the proper weight to be given to various kinds
of information. Under these conditions, limited studies of complex
issues help senior officers of a collegeto make shok-range Policy deci-
sions under time pressures. In other situations, the likelihood that
limited studies will be used inappropriately may be quite high. It Is,
therefore, the responsibility of the researcher to evaluate .carefully
the kind of audience to which such studies are addressed and the methods
by which they will be disseminated.
O
6
4
0
J
'MP

I
1
1
-4'
a.
MICROCOMPUTERS A INSTITUTIONAL RESEARCH
Leah R. Hutten'Tufts University
Medford, MA
Ward processors are lacking from many Institutional Research (IR)
offices and computer terminals are conspicuously missing from others, yet
it's n ly guaranteed that the /A office of the futdre will have its own
rocomputer. Theie ddsk-top computers, some smaller than a Selectric
typewriter, have taken the businesss world by storm, and have become an
ndispinsable tool Par accomplishing decision-making in increasing numbers
of organizations. This paper introduces the novice to the world of
microcomputers and provides useful , up -t01 date information for the
initiated. Three issues a0e addressed, in the paper:
Uses at microcomputers in IR
ansiderations in purchasing a miot400mputer
Recent 'microcomputer developments and future trends
A BYTE,(BIT) OFCOMPUTER BACKGROUND
In '150 B.C. the Chinese invented the abacus, humankind's first
calcdkating machine still in, use today in many parts of the world. Two
thousand years later, 1823, the Frenchmari Babbage, conclived of the first
automatic calculating ,machine, the analytic engine. More than a century,
later, in 1946, the twentieth .eentury .witnessed. the first electronic.
computer% The glum required over 5,000 square feet of floor° spacet, was
designed with 16:0s vacuum tubes, and had Y2000 wards of memory.
Technological advancement has 'proceeded at a rap id pace since,then. With
the adveht of the transistor (1948) and integrated circuitry (1961), the
road was paved for development ot the microprocessor. Originally
considered a hobbyist toy, the microcomputer industry is now' a'
)multi - billion dollar industry: °, In. contrast to the EN/AC, the
microprocessor, developed *up large scale integration XLSI):teohnology,
is contained within a 1" x 2*-x 1/4! silicon ohipitand typically has 64,000
(640() words (bytes) of memory. The creation of VisiCiac spurred the
inaUstry and over 10 companies werisi-wide manufacture microcomputers.
.
67 7V.
1 44

/ I68
USES OF THE MICROCOMPUTER IN IR
The'author has defined six' primary areas where the microcomputer
can greatly aid the institutional researcher:
modeling
e' graphic
word pfoceising
communications
databases
statistical analysis
Modeling
The infoEmation gathering process in IR provides data for the
planning and decision-making functions of the university. Modeling is an
important tool for the .planner.. .A model is a hypothetical set of
relationships used to forecast some future state. IR generally employs
financial forecasting" models which supplement the institutional budget
process. Some readers' may be familiar with the EFPM1 and IFPS2 modeling
,systems which reside on mainframe computers. Both systems can be costly- .
to use and IFPS reqqires considerable computer expertise. The
microcomputer has added a new dimension to modeling. The software is,
simple to use,- even by the notice, and powerful outcomes can be obtained
\Is.at the touch a; a key. VisiCalc. SuperCalc, ASS /F, and MBA are some of
the more well known microcomputer modeling systems. The first two systems
provide electronic spreadsheets with 63 columns and 252, rows. 'Labels,
constants, and formulas fill this matri4 and any cell in the matrix can he
made conditional upon cells above.and to the. left. A powerful repeat
command eases formula generation. Defining columns. as time periods, and
rows as budget line items, the modeler can easily modify inflation. growth
rates. and other assumptions to forecast future budgets. VictorCilc,is a
three dimensional modeling system, similar to VisfCale, but provide! the
capaqty to add university department or some other grodping variahle,as a
thirdNimension. Any two dimensions can be displayed simultaneously.
These programs ,do not require programming knowledge- end typically can be
mastered in 3. hours. The primary limitations of VisiCalc typei of
1Edpcom
2Execucom
"10

modeling software are matrix size, minimal report formatting, lack of
transferability or data to other software packagers (e.g. graphics), and
lack of- faoility.
\
for feedback loops in models,
BUM and MBA combine modelingi graphics, and report generation
into one pdokaie; Whiled more flexible and -powerful than'. VisiCajlc or
uperCalO,'these systems require considerable computer expertise and alp
restricted model sizes. Many planning and IR'offthes spend up tO
00,000,innually on modeling activities, so a.mitir000Rputer at $4000 and
VisiCalc at $250'oan prodde enormous cost savings to an institution.
Graphics ',.. t
tGraphs and charts for various presentagons and reports, and an
annual fact book filled with bar charts and pie charts are often produced
by the IR office. If you haveeliil.
riedited the produdtion of slides and
transparencies by hand whtch often have .to be redone whe4 data are
updated) then you can appreciate thd time saved by having .a computero -: . .0" 1,
assume this task. The microcomputer is outstanding in Its graphics
capability. An interactive graphics package with graphics terminals and a4
plotter cost approximately $50 ikon a.large computer. Powerful graphics
capability is available en a icrocibputer with the addition-of a softwa e.
Package at $250 and eclat matrix printer at $'500, or a plotter at $2,000. tz
Exceptional and finely detailed graphs can be generated with the
microcomputer. In addition to a graphics equipped machine, one needs
graphics software, a plotter (or aprinter), a high quality monitor,,and a
shot of imaginition. Two types of microcomputer software paCkages are
available: screen graphics and plottproraphics (sometimes combined into
one package)..
The most common graphics packages, iite screen graphics which
provide for screen transfer to a dotmatrix printer. These systems tend
to be menu driven Mid easy to use for creating bar charts, line graphs,
and piecharts. The screen can be photogmaphed to make slides, or can be
electronically transferred by recently11 developed processes to
transparencies or other hard-copy media.
Mioropompuillrs tend to differ griatly in "screen resolution from
200 by 200 pixels (dots) to 1,000 by 1,000 pixels. Somemicr9computers
are equip d with efficient bii-Mapped graphics, while "others are only
capablt'off character graphics. A, good quality black and ,white or color
1*(6

170
monitor is required for graphics' display. Since a TV cannon produce a
high resolution display., an RBG color monitor (cost $1,000) is suggested
for graphics., For the screen graphic to be to the printer.
the printer must also have a...graphics chip (usually installed by the
dealer), i 4%.
A second .type of graphics package drives a flatbed color pen
plotter. Since the lines drawn are continutous (rather tAan composed of
dots), a very high quality product is obtained. 4rhe microcomputer can be
directly linked to lle flatbed plotter, or data can be transferred over
phone lines to the plotter controlled by a central computer. Manyvery
promising developments in microcomputer graphics are underway at this
time;
Word Processing 4
Word processing (WP) has revolutionized the print industry and has
made the typewriter ob;olete. Since screen editors with ward processing.
capabilities tend to consume substantial system resources on a large
computer, many colleges have restricted word processing on the central
computer and the indgpiliaeht WP system has become rather common. WP
systems with letter 'quality printers cost- over $10,000. Though
microcomputer WP systems, which became available a few years ago, lack
some of the power and feattres of the independent WP system,
microcomputers'have the advantage of computational capability.
An excellent CP/M based WP system is WordStar. WordStar combined
with a sorting package, a merging facility, and a mail label and listing
program is a sophisticated system. It supports most of the well known
brands of dot matrix or letter quality printers. A dot matrix printerjs.
fast, but can not be used for final copy. The Diablo and .Spinwriter
printers cost around $2,000.and print .60 characters ,per second while the
new $500 letter quality printers print only 10 characters per second:
Thadvantages of using the microcomputer for word,processOg ar4
cost and computational...ill:lability. . A. filecreated in one program. for/
example, SuperCalc, can be procesed by a word processing program, for.
example, WordStar. Microbased WP does not aril.- all of the power and
features independent WP systems since 'microcomputers rather slow'
and their keyboards lack the-special editing and funtion ys found onvr"
independent WPsystems.
I1.
ti
I.
4
.-

17)
Communications
More new proiucts and 4systems have been developed for ) 1rNammunica-'
tions from microcomputers thpn any other application. The microcomputer's -%
real power will be realized when it is linked with other. users both '.
locally and on other campuses:. Communicagons can be used for: 0
simple erminal emulation"- linking' to mainframe
'file tr er to another computer
database access
distributed data processing
local area networks
electronil mail
access to nationwide networks, of information
typesetting , e
.
computer conferencing
Without a doubt. one of the mast:exgiting applicationSrof
communications is electronic mail networks. Bitnet and Edumail ,ars'twp
such networks available to universities -which can be 'acdissdd from a .
terminal or microcomputer. .Electronic mail provides editors) fife,
handling. and maAagement software for the transfer of infAmation
high speed lines across the nation. Network members must instalj spe
softare their. central computer ari0 rent a dedicated phone
1The.two rorms of communications are direct and i
V
dir . A diri4ct
link i les...tab-fished when a microcomputer is connected byk cable to ione.
e. or to--
re, such as.
ry, and
network Systems. purpoOted, t9. support 4 to 064
microdomputers, have been tested even less,
form of nefOork either ittnk4la to a larger Computer e
-thibrocomputers using a Winchester harp disk and network sbftw
Omninet. There 'are few proven network test sites in the co
miedocomputer
$10
Indirett. communications are established using .t6e, telephiond *
, system. Tbe-microcomputer must be equipped with comthunicationi hardware
and software and a modem or 'an. accoustic cou er is . The
microcomputer can call any computer or aan line irika worldwide networks'
of software that oan be f-through Tymenet or Telenet. There are four lev
' purchased for communications: teletype or
"sixAt" testa anal emulation (e.$ 3270. *VT 00);
fife transfer and error checking capab ity;
...b" terminaa emulattonT,'
'terminal tthaation wfrth
and pockpges thP
- .
.176
114

O.
It"
172
communicate wit a mainframe operating system. In addition to using the
microcomputer as a computer terminal for receiving information, more
sosphisticated communication ,software allows information to be
"downloaded" to the the microcomputer disk" system and "uploaded" (sent) to
another computer.
Communication over telepkone lines is slow and unreliable unless
the lies are dedicated to 'data communications or designed with optical
fiber.1,:Ohe greaiest drawback to microcomputer communications at this time
is that most 'operating_ systems are single task systems; while
'communicating, the microcomputer needs to be dedicated to this purpose.
Communication fr om limicracomputer is more pracbacal when a multitask
operating .systems, such as MP/M, is installed.
,Databases
Researchers need access to large amounts of information. The
microcomputer can play a significant role in data acirss: retrieval of
large databases from another computer; preppratiOn of datatases to be sent
to another 'ciimputer; management of small databases residing on the
microcomputer disks: For accessing information, the microcomputer can be
used like a terminal; in addition, .data can be retrieved on disk, and
analyzed or manipulated at a.later time. For example, maii,lists can be
do'wnloaded to the microcomputer for printing personalized letters and mail. .
labels.
When the microcomputer is used for data preparatiol, a great dear
of "on- line" time can be saved on the remote computer. Data can be
prepared, edited and scored on the microcomputer and tbesent in a single
tresiission to a Mainframe. In.an environment -where%data is entered
,interactively at a significantt cost., the microcomputer offers a practical
alternative. . .
Small databases can be created Ind maliip6lated directly on the
microcomputer: database langiwes have been developed far this purpose;
for example, DBMaster .and DBe sell. Many, small cillegei have put their
entire fund rai ing. alumni, and other datasets on aimicrocomputer. With
1K the addition, alinchester hard disk (capacity 5 to 50 million bytes)
fairly' large databases can be stared. The primary disadvantage of
r
micr000mputer:atabase systems is speed especially for searching so.qng
operations. The newly announced Motorola*68000 mforoprocesson (a 16/32
17,I
r

ti
k
4
173
bit chip) is more, efficient fOr database manipulatiAR because the data
word is largerand the U (Central Processing Unit) can directly address
millions of words of memory.
A very useful app ication of"the microcomputer is the preparation
of annual reports, such s a fact book. Data can.be stored in a database,
new figures can be computed yea Sly. text can be edited with the word
processor, graphs can be upd1ted. and the 'final text can be tranferred to
'\typesetting equipment over communicatio2,Mhes:
Statistical Analyiis
$ Statistical software' for microcomputers is limited for two
reasons:,general statistical products do net have significant appeal in.. .
the business world: and the capacity of memory on the microcomputer is
insufficient for the programming of sophisticated statistical rOotines.
Because floating'pOint numbers refit, re 5 bytes of storage on an 8hit
microcomputer, a regression problem with 50 variables requires 37.5K words
1111
a memory. The 16bit microcomputer can'directly address more ropm6ri, but
i also restricted to an 8bit data word. Microcomputers offer
statistical, software for simple disoriptive statistics, frequenqy tables.4
dross tabulation, chi /square tests, ttests, 'and simple anova,
correlation, and re sion.' The Ono microcomputer has distinctft
advantages for stati hal analysis, but at the present time little
software has been. developed for this system. It is anticipated thatD
statistical products will be developed by researchers in academi c
settings,, though most likely these will not be available" through
commercial markets. There are some statistical pa4ages,available Tor
CP/M microcomputers. VisiPlotarend, a combined regression and graphics
package is available en theAApple for trend and time series analysis and
there, is alsoa microcomputer versj of JPSS running under CP/M.
CONSIDERATIONS IN PURCHASING A MICROCOMPUTER,
Microprocessors can be classified into four basic chips: Ye. 4
6502 home computers with proprietary operating systems
280"--134it desktop computers with CPA.
8086 16 bit desktop computers with CP/M-86 Or msLAOS
68000 16/32bit computers with UNIX .
UI

0
174'
S
4
The 180 microcomputer, running the .CP/M operating system, has
become a. standard. : More software runs under CP/M than any other
microcompaer operating sy4tem.' CP/M-86 and MSDOS (the operating system
on the IBM PC) are competing to become' the standard for 16bit.
microcomputers. Some of the newer microcomputer systems, such as,DEC's
Rainbow 100, have the capability of switching between 4etrit and 16bit
programs. The Motorola 68000 microprocessor with 16bit architecture and
a 32abit register can directly address millions of bytes of memory and is,
a very powerful system. The UNIX operating system which operates on
larger computers, such as the VAX, has been redesigped for the 68090.
Within any class of microcomputers, the primary differences are
found in the, packaging and in the proprietary uoducts Offered.
4NicroCemputers are similar in that memory is divided into RAM (random
access memory) and Rom (read 'only memory) . The operating system, BASIC
interpreter, and system utilities reside in ROM. RAM'is best compared to
core memory on a mainframe. In terms of design, some microcomputers are
totally selfcontained, others have detached components,` and some are
handheld or portable. ,Screen displays and keyboards tend to be radically
different from one system to Another.4
Less expensive microcomputers can
display only 40 characters on the screen and have few extra keys on the
keyboard; better migeocomputers display 80 to 150 characters, and are
equipped with numeric keypads, function- keys, cursor control key; and
other special keyss(e.g. a,HELP key). Most desk top microcomputers come'. .
equipped with two disk drives.. Double sided double density disks have
More tracks and greater storage capacity.\The monitor, is usueily
purchased as an extra, as,are plotters,, philters, and other periphei-als.
Software' ddsigned to opertte under a specific operating system could4
exlcute. on ,any "other computerwith the same CPU if the disk formats
between systems were compatabile. Unfortunately,, at present, there as,
little exchangeability of software between systems. Home' computers with
proprietar. operating systems have softwire interchange.
Where are three methods for purchasing microcomputers; mail order,
retail outlets, and directly' from% the manufacturer. Uoiversittes are
granted a 5% discourit from retailers even on a Angle urc se.
.Manufacturers hay,, been rumored Leo provide/30 to 50 percent scounts on
large orders. To obtain these large discounts, a purchasing Areement is
40
k
ei
e

4
175
supplied by the dearer. Caption should be exercised in signing
agreements so that tfiere is not commitment_ ta'a single retailer. or
Microcomputers carri, a '90-day warranty, The purchase of ans r
extended annual service contract,which costs approximately $250 (an Item,
to be included in a deiartient''s% operating bddget) i.s stYcogly
recommended. 'The extended bontract can cover mail,.drop off service, or
og7site service; and the price incr eases respectively.
such
brand of microcomputer:
Host microcomputer sales and marke"ting.persons" are .new to4
computing, tend to know computer terminology, but have little prior/,
experience. *Sales' people diinnot be expected to experts and .yodr-',
knowledge ebOut computers may be jiroader than
for computers has many drawbacks. Although ma
substantial savings, there is.po simple mhOod
equipment malfunctions.
A microcompuW system witli two dip
from 0,000 .to $5,000 and another VOWsoftware. Hardware costs continue to drop
theirs. Bargain shopping
if order 'purchasing provides
fbr obtaining service when
AOdrives-Ai- a monitor coiis
needs to be budgeted Tor
, .6ut -software prices are
'rlising.. Following an initial microbomputer pUrphase, from $300 to $800
needs-to be budgend annually for maintenancs,supplies, software and. ,
hardwafe expansion .'(for *maple, more.memory)'. The good news about
fmicrocomputers is that an incredible amount of computational power can be
.
. a -pur4astd for $5,000. The bad news I that
*the system you purchase-today
Will De useable, but totally obsolete Arfive years...! t's
... With the exception of VisiCaltheee are few4utstiliding iirogrims
on microcomputers.
value- than for quality,. Software companies struggle to- keep pace with, ,
crocomputer software is designed more for profit
aonkinuously changing hardware; consequently products have been poorly
designed, minimally tested and lick quakity controls Documlyntation is4
often limited Orild training is never included'in purchahe costs, Educom,
HerComp, and Other graups offer supportiito educational mlcrocompuier
users, but with 150 differOt products .on the morket,"your computibg:
centgr personnelimay not be 'able to assist your with a specific brand, -S..
Singe anvIR office often has technpal Pleisoonel, it ma assume the
responsib.ilitx for traiink other admi nistrators 'and assuring
compatability-of iicroP9mpUter systems lin the cqtpu. 4017 0 4 .
. .
182A
,
4
. .
r

t
0 it. .
RECENT MCXROCOMPUTER DEVELOPMiNTS AND FUTURE TRENDS 9'
Some or the new deAppments in-mioracomputidig in the past year.
are shown.is Table 1. _During this period' the number .of micr000mputer N.!
manufacturers grew from 75 to approximately 150; three mainframe
companies, Digital, Wang, and Burroughs enterecrothe market; Japanese. 1
companies became formidible competitors, With such a market, forecasting
4
S.176
. . .....'future developments is difficult, Certainly there will be niany
..
enhapoemtnts in networks and communications-And clearly a large increase...
in competitors in tide 32 .bit markett, During the next year we can also
. envision: pater iwpro events in higliicapaoity storage devices, significant
,developmoot in flat 'screens and battery packs, more research in
non-volatile (bubble) memory, the opening of training denters throughout. #-.--.4'
.the country, and the vanishing of-sady small hardware and software1
. .
companies. Within a few years the primary competitors in the, 4
.. .
microcomputer industry will surface and many smakl companies will be
consumed. 41 the longeV range Standards will be established and the. ; .
. quality of both hardware and software sho,uld improve. Tfte rapid...,
,advancement. in technology, seen to date, wi:11 probably not slo its pace'
Wore the end of the decade. .. .
.
.
....
While the foregoing may, suggest that it would be wise to wait to.. .
.
purchase, a.
mcocomputer, these systems offer major increases in ...,. ..-----...
t . .
produotivity%anh higher quality'resUlts which me'afinis
producing work fisterv .
and better. With increasing competition between institutions of higher
education, a vanced technology can, help your university 'stay ai -the
forefront. . -
A LAST BYTE.
At Tufts University we have done considerable researchtinto
mior000thputer hardware nd have developed minimun.specifications"far' our
environment hows'in Table' 2. A Comparison of 26 microcomputer systems,
can be obtained from thee Suther..44k4 .0 1I PI
144.0.
I
4
a
.
>:

S
A
(e-
- Tatar. ,
iftVeveleirehtin Mioreitemputin..
'color dot l.atrix printer .
.. i
. ..0.,
Law. cost farmed character, printer ($500,d'onl from $2000). ;(`
ift 68000 miecop,rottessor .., . c` ...
. . ,
177
I
*
. .-. .. Winchester hard disk (5MB to 50MB) . . .
.. 4
Hard disk**.witli removable cartridges -
3 4/24' diskette :(.capacity 870K) . -/%7 ..
128K- U( bites of RAM (up from 64K) ii, , .'
. ,ti e)Bubble memory chip (256K - non Yola /--.. t ., . - ,..... .
Flit screen .., I 7.'''''. ' P
4-line, 80-characer LCD display,(11qtrld cry,stal)c.
Battery ap;rated partible microcomputer., -41 .
HASCI keyboard (H fOr Human)
iSOitharacter display , d ir
O.
`is# 1000 x 1000sCreen graphic resolution 4
vi '
.0. .
.. , b Micro -based lobal area network
a' 'Tran'spartible code (e.g. u-code fbr Pascal).. .
.. Robot armsontrdliftrs ).1-dimensional graphics -tablet [
$
I de'.
1;5
of
# '
184
. ,
O

tt
.14
- 9
410
Table 2
Minimum MICROCOM PUTER SpecificationsComputer Services - Tufts University
. .s-Feature Requirement0,
HARDWAkE .. ,
CPU: 8 bit - Z80A or Z808,
1b 'bit -.8086, 8088, MC68000
Memory: 8 bit - 64K
16 bit - 128K
Char. Set.: 128 ASCII 't
Diipltay: 80 x 24Upper and lower caseBit mapped graphics -
I
_if
CoMmunic,: RS-234C port (serial)
Printer:
.
5S-232 (serial) orCentronics (parallel) port
Disk-DriveS: Support for2 driies withone 5Y floppy> 3,20 KB cepa-
i city and second 5" or 8"floppy
Keyboard: ANSI standard including
'ESCAPE, BREAK, CONTROL,418KSP, TAB, CAPS LOOK,
. SHIFT, aursor-keys andnumeric ketpeg:
0THEJ3, FEATURES
6mmoent
K
178
Needed to r eratingsystems d below.
Need or Fiscal: FORTRAN,and her software.
Needed for communications.
Needed for word processing.
As above.. -
Faster-and saves RAM `orother purposes.
Industry ndard forperipheral compatability.
As ahoye
EV'tbiency and interchange-ability-between systems..
Needed for communibations'and editing Udetions.
0,
Ex'pandable/upgradeable,len-Ote service a4ailable,.gopda:company reputation ..-
4
ASOFTWARE.10 ).
' Error correotimg oommUnications .CC DX pi /E'Redem),ZP/M,...CP/M-86 or i4S-DOS operating systems; word pOcessor.supportor editor, Visioalc or similar moctelinaisimulationasystem-,graphics; database support, and languages: BASIC, Pascal, C,and FORTRAR
41.183
4.
4
4t. 6
1P
41

f-
X
/. , A
ti
4'
STRATEGIC PLANNING:, WORKING WITH DEPARTMENT CHAIRS e
.
The pre
you will, rais
. 4
Antoinette Iadarola, Ph.D.5ppcial Assistant tithe President
for Planning and Eduditional4Affairs andCha$, Department of History
Saint Joseph CollegeWest Hartford, Connecticut
INTRODUCTION
t crisis in higher education, the "panorama of misery:I:11
serious queSiions about the future of higher education in_4( p
.11
the country. More specifically, can colle§estland universities maintainI.
flexibility and viability,"preserve quality, be accountable, apd respondA
effectively to .the chatqing nOeds of society within the context of budget-
k.ary cuts, inflation, Owindlinilendowments and declining enrolippnts? Can
re trenchMentof faculty proceed without injury to academie vitality, with-
out e erosion of faculty morale, and without a loss of curricular
rentel A
Although the` key issues, of the eighties in higher education are cer-
tainly economi,c in nature, L Ipldargue that the "micro" -consequencesmf
the policies adopted to deal with economic,contingencies may well 'determine
ak6
whether-or not colleges an4universities can continue 'to be places in which
cteativity and excitement about1earN can be promoted! .
.
-
' .
inThere is,no question that institutional vitality isocomMonly regarded. ,i,
.
. .
a
the.
i in economic terms as is -vitality of a cit y, a Region, or.
an entire. , '40
nation. Any nuMberof indicators dinuprovide a relatively simple and in-. ,
... .
expensive way of monitoring fiscal .Health` in &small-private college:.
performance against inflation, cash flow, return on endowment,'mo ney set
4
179.
66
/"...
.z.S.
A

A 180i
aside for maintenance, number of student applitations relative to enroll-,
njtnt, retention of students, expenditures per s'tudent, and so on. It is4
.. .
essential that small colleges understand these and other economic indicators
Ws the vital,signs that they really are...
. .
,-Howevei; there is another dimension of the vita.tity. question: they . .
.
ocial 'and psychological components of an alive and vibrant institution.'
. Even if economic indicators remaim relatively stable during the eighties:
many of those in the academic profession, and especially those in small col-...
leges, are likely to faceia great deal of both professional and personal
uncertainty: Added to this uncertainty will be a number of constraints that
.
appear now to be almost inevitable,corisequences of many of the trends we can
currentlytetect. It seems r her certain that job mobility will be low:,
AwThe average age of college iafculty will increase dramatically. With less`
mo y f9r travel acrd professional development, there will no doubt be feIr.
,. . , .
opp.rtunt ities for profelsional interchange. ,
*
/ . . -\,
.
.Together, all of these factors, and other's now only dimly perceived,
, .
cr,biring about a rapid dete (oration of Morale, a sharp drop in the
"volunteerism" which small,, private colleges teed to lye on an increase'in
the phenomenon aj burnout, an inability to stay abreast of one's field, and
extraordinary levels of interpersonal conflicts. And yet, the primary prob-..
lem in the contemporary, small, private college'is that.to key administrators
life often seems, or is, a daily struggle for economic survival. Short-t6rm
pragmatic decision - making is the.order kthe day, and bits and pieces of
qui;t4ative data often override qualitative considerations:; *In this kind
of environment, planting is difficultand attention to the micro - concerns
ate he quality of life in the institution becomet almost completely obscured.
Yeti in the 1980s, institutional research must find ways to become more
person-orieked and'more interestedlin ways of collecting and organizing the
r4 1,"

r
0
a
qualitative information which can support and inform the strategies we.. P.
evolve An order to cope with the.issues confronting us.'
u
.PURPOSE ..
c' . .
181
. " The,rapidly increasing complexities. involved in the various aspects of.
\DApratim institutions, both large and small, within the environment I have
. .
. just described, have 'resulted over the past years fn increased delegation.of : .1
responsibility from deans and oth6sii department chair s4 Academic depart-
men
. t. ..
s dre,the organizational units within an institution/which are mostr% I o
, .
severely affected by this state of atiairs! There are alteirnatives,lo theAt" /
acde6iC department, such as divisions of related disciplines or schools..___......_ .
i ,
and colleges without formalized sub- visions, but the fact remains that thet , .
. academic department constitutes theip railing pattern of organization for ,
.1 . 6 N .
N.thepthning and management of the leatningOdcess asid,or resbrch, cre-
4
ative activity, and pUblic service. Department chairs are middle-managers
in the dee0oh-making proCe. They atethe chief planners. Their day -to-
day decisions' do impact the .future of their departments.aind institutions.
How c an institutional researchers a ist academic dIpartment chairs in
strategic plannfi3 and in'confrontilkg the issues during-this "shallow valley." 5"
N--"/period of higher education?
0
oWhat ev9lved at laint Joseph Collekwas a series'bf three planning
..,I
workshops over the academic yeler 082-19831 each four hours lo g followed1. ,
%-- (. ,
by cocktails: Theiopupose. it,thii papef.i:s too' describe the fi t planning
#: .
... .
workshop., t
0*.
.
As,. ASSUMPTIONS AND 01-JECTIWS
u ..
.ThisrarticularIworkshop strategy.ot,Saini Joseph College was b8ed
6
t..
, upon the following assumptions: .
. .
I,' That the'department chairperson is a primary filter affectingacademic change and climate within ani4nstitution'of higher learn-
-.* .1* !. .,1KJ
. o

. \ $
.1-
ing. A 'fat amount of research indicates thaX climate orquality of ljfe existing,withjn liege may, be the singe,OostPftowerfurelement affecting teaching and Gtbdent performance;
182
2, That more slfaring of information .end strategies would re-.
( 4
date the sense of isolatiblt and encou me interaction amongacademic leaders at the departmental 14vel;
/3.. That the department chairperson plays a critical role ascriticalmentor, as connector between departmental fadulty and Weirrespective divisions; 1
1. v 4'
t,/.
.
4. That a more thorough understanding of the college as an in-: gtitution an rganization will result ina commitment to missiondNand Oared perc tions of the mlaion which will be both.a sourceof pride and uniqueness for the colleg ;;'
1 .
5. That sound academic planning requires both a theoretical frame-wvicand eliable'data analysis.
Flowing from these assumptions; the following objehives emerged:
1. Owning.the theoreticaleframewOrk for planning, that is thoseoverarching principles of the College guiding th planning process(e.g.; mission statement, college -wide goals and objectives, plan-
. ning and budgeting guidelines approved by the Board of Trustees);
2. Assisting chairs in articulating the goals at.-7a`objectives oftheir departments within the broader framework Of the College andin apbreciating the interlocking nature of each;
3. Assisting chairs in;analyzing dataAjn taking basic 'institu-, tionaedata and combining frwrith depareental. data to provide ,
solutions to imbalancq;
4. Assisting chairs in developing strategies for implementingBoard of Trustees*planning and budgeting guidelines;
e. ,5. Challenging chairs to, see the positive elements'of retrench-Went rather than the negative features of movement away'fromwhat has been;
A 6. Challenging chairs to move beyond an either/or approach to .
change'and exploit the creative tension between retrenchmentand revitalization;
7. Creating .a climate which empowers individuals 't e parti-cipants in the fulfillment of the mission an ve the senseof being involved in a creative, productive, and energizing worklife.
`,1
1SJ

183
1 PLANNING AT SAPkT JOSEPH COLLEGE
During 1980-1981 alining activities at Saint Joseph Colleie'focused
on the revision, reaffirmation', and updating of the mission statement of
the College. This mission statement, along with supporting goals and ob-
jectiLs, was hammered (it bycll constituencies of the College and adopted
in the Fall of 1981. On April 28, 1182 the Board of Trustees approved plan-
ning guideline:s intended to prowl& a policy framework within which faculty-4. a
and administrators may plan for the next three fiscal years, FY1983, FY1984'
FY1985.
Saint ,Joseph College's planning and budgetiO efforts have been refined
over_the pAstNtwoyears, Attempts_have bein made-to-integrate-planning
wales and budgeting activities into a comprehensive, unified process;
hat integrated process was implemented during 081-1982, when a new Plan-
ning and Budgeting Committee advisory to_ the President was formed in Novem-.
1981. The Planning-and Budgeting.Committee, chaired 6y the President,
is a College-wide committee which advises the President on all matters per
soh.
taining to ple4k4ng and budgeting. The committee consists of nine voting4k,6
members:I the undergraduate and graduate'Deans, The Treasurer, the Dean of
tudents, the Director ofDevelopMknt and.Oublic Relations, three faculty4
elected by the feculty,'and the President pf the Student Gwiernment
Association.. ii. .
%Func tions of the Planning and Budgeting Committee include the follow-
. V )
,,
ing:\ ... .,
, . . .
., . .1
1., To asgist the President
4t
ident in the development 'and updating of
a long-range pjan.,consistent with the College'S'Mission and ob-jectives and guidelines set by the 'Board of Trustees;
... ,..,
2. To recommend to the President a balanced budget review
by the -bard of Trustees; . .
q4 4
3. To provide advice to the President on:
4
4-1-0 u
<

a) Strategy for integrating lanning.and budgeting efforts;
b) Strategy for the involvement of various constituenciesof .the College;
c) Forms uset for annual reports and budget-requests;
d) Coordination af regular programmatic evaluation 4with the planning and budgeting process;
e) Optimum utilization of human, physical,fand fiscal.,resources.,
184
In addition jo the establishment of the00
Planning and.Budgeting Committee,. a A ,
othr steps were, taken during the past academic year to integrate planning
4
and budgeting4 Forms used by a ademic and administrative unit heads for
planning proposals and budget requests were drawn up so that they weredom-
plementary, and so that the unit heads could project both plans and budgets
for a three-year period. This Fall, a comprehensive list of key dates for
,both plarining. and, budgeting and a planning/budgeting .calendar were issued
by the President, in order to illustrate and facilitate an.integrated ap-
proath to the combined processes along the time-line of the academid year.
CONTEXT OF SAINT JOSEPH COLLEGE
Saint Jolleph College occupies 84 acres of residential area'on Asylum
40
Avenue in Westifiartford, Connecticut. A women's undergraduate institution,.14,
fombinilig liberal educatiewith career preparation, it enroll! 855 students,
and has had a a% increas a enrollment during the decade of the 1970s when
women's colleges experienced a net gain of 15%. The graduate program, open
Vto men and,women, enrolls abotit 400 s ents each semester. It has a. modest
endowment, has alwayi operated in the blac has no deferred maintenancetind*' L.0.
predicts a stabilization of enrollment over the next three yea s. It has4
62.FTE.faculty and an overall institution UcuTty/stu ent otio (04:11.
Il

4
c
e
ric
v
PLAUNING WORKSVP AGENDA
General. Framework for Planning
A: M1Ss4 on. GUIs and Objectives
qi Board of Trustees Planning Ghidelin
CieVenue-and Expenditure Assumptions
U. Some Suggested Strategies for *Dealingwith Board of Trustees Guidelines
II. Planning and Budgeting,Forms Explanation(See Exhibits 1 and 2)
IIr. Institution3j.emdpepartmental Data for Planning
41
I
0.1
04
'J
192
, I
."1/4
4.
..0% .
0.
ti
*St
f.\
sr* `
4h
I
e

4
Unit
Exhibit 1
PLANNING REPORT
Date'Submitted
186
Oivision
SECTION IWnent of PurpOse for the Planning and Budgeting UnitIn this section state concisely and clearly the purpose or mission of your depart-ment or office. Focus on your strengths. Indicate the specific and unique con-tributions of your particular unit to accomplishing the College's mission. In yourstatement aad purpose, identify the emphasis, scope and character of your programsand how you best serve the College. A review of your strengths and unique contri-butions to the College's mission will assist all of us in determining whichservices, programs, and activities are essential to Saint .loseph College's success.and which ones might be less necessary in the decade ahead.
SECTION II (Forms)planning and Budgeting Objectives, in Priority Order, for 1982-1983, 1983-1984,1984 -1985
or ei listed in priority order for implementation over the nextthree years:
1. List the all-College goal and objective which your proposal supports, and ex-plain briefly how it is supportive. (See ccilege -wide goals and objectives.)
2. In justifying. our proposal:...if the proposal is to add, explain why the item is necessary and thebenefits you and the College will derive from its addition;...if the proposal is to delete, explain why the component is identified fordeletion and the potential savings you and the College will derive from itsdeletion;...if the proposal is to change, explain how the item will complement orstrengthen a current program, or how you and the College will benefit fromthe change;...if the proposal.is to substitute one program for another, indicate adeletion and an addition as two goals, with the appropriate explanation(s).
3. Discuss the anticipated costs and/or savings and/or income generated by yourproposals to accomplish your goals and/or objectives:...using 1981-1982 as the base budget year, describe, for each goal or objec-tive, any additional costs, anticipated savings, or substituted expenditures;...for each goal or objective, indicate its effect, if any, on your total
lepartmentayoffice budget;...keep in mind the all-Collge budgeting and planning guidelines of theTrustees with regard to increasing numbers of faculty and staff, etc.
SECTION IIIIdeas to Explore
1. Department/Office/ProgramIn this part, propose ideas which your specific area of the College plans toinvestigate, or which your staff pr'..oses to look into in future planning.
2. All-CollegeIn this Part, propose ideas r.utside your department or office or program forF:onsideration in future plan,'-- sessions or by others at the College. Be as
specific as possible. Idet 'tier groups or persons who might share an
interest or concern in these ,
19,-)
8/82

P PersonnelS6E Supplies 4 ExpensesR6R Renewal. and Replacement
S Space
Division
Unit
Divisions of the College:
SAINT JOSEPH COLLEGE \ Academic - (Undergraduate)Academic - (Graduate)
PLANNING PRIORITIES Student Services1982-83 through 1984-85 Development 6 Public Relations
Business 6 Administrative Services
Date Submitted:
Priority
Proposal for addition, deletion, or change indepartmental programs, majors, concentrations,activities, services
tt ty,4* *** 00 IS
40_11
C OSTS
1982-1983 1983-1984 1984-1985
High Goal 0: P
S6E
R6R
S
College Goal and Objective Supported, and How:
Justification of the Objective;
. _
-.
Discussion of Costs and/or Savings or Income Generated;
19:1
XMJ.J.KN.)

188
SPECIFIC RESULTS OF WORKSHOP
Some tentative claims. of success can be made:
I. Departmental chairs have a broader conception of de-partmental atmosphere as a key to student and faculty moraleand productivity.
_2. Curriculum development, program costing methe4ologies,institutional research/HEGIS language--FTE, SC4--are poorlyunderstood by many academic leaders.
3. Many academic leaders are unaware of the substantialeconomic commitment made by an institution in the act ofhiring a faculty member.
4. Department chairs see the College as a more "complex"organization.
5. In the words of one participant, there was a sense that"someone was really at the helm, guiding the institution."
6. There was an "upbeat" atmosphere after the meeting:"We have the guidelines, we have the data. Now we knowwhat to do. We just have to go ahead and do it!"
7. The workshop increased both the confidence and competenceof department chairpersons and created an atmosphere whereinthese academic leaders feel appreciated and more eager to co-operate with central administration as partners in confrontingthe challenges of the 80s.
ON-GOING QUESTIONS AND SOME CANTANKEROUS CONTENTIONS
During the course of planning and implementing this academic planning
workshop, several questions and some cantankerous contentions about the
academy emerge:
I. How long do the effects of such a planning workshop last?
2. There exists little clarity about the expectations whichacademic chairs must meet not only in planning but in other re-lated activities.
3. Department chairs often lack direct accc.i to, and inheritmultiple interpretations o°, central administration plans.
4. Listening is a competoncy poorly developed by many academicleaders.
-

5. Academic institutions rarely provide ample opportunitiesfor informal interaction in enriched surroundings for academicleaders.
6. Academic institutions rarely provide 'special time forthought and conversation on issues of substance by acadeMicleaders.
7. Basic humanism in academic work is the only sufficientoffset to low compensation for academic leaders.
Of course, these all await, I might add, solid empirical verification.
SELECTED REFERENCES
In the Area of Strategic Planning and Departmental Leadership
Guardo, Carol J. "The Redesign of a College:Education, Spring 1980, pp. 86-101.
Heimler, Charles H. The College DepartmentalRecord, Spring 1967, pp. 158-163.
189
Change in the 80s." Liberal
Chairman," Educational
Kraus, John, Jr. and Engel, Robert E. Preparing for Planning: An'Outlinefor Smaller Colleges and Universities. Washington, D. t.: 7.5TDC-57-
of American Colleges, 1978.
Parekh, Satish B. Long Range Planning. New Rochelle, New York: ChangeMagazine Press, 1977.
Roach, James H. L. "The Academic Department Chairperson: Functions andResponsibilities." Educational Record, Winter 1976, pp. 13-23.
Shirley, Robert C. and Vol kein t tabstingAdemiAcademic
3ri
Nigher"Establishing
on,
Io4
9lo.5
Sept.-Oct.,1978, Pp. 4, 2-486.
Tucker, Allan. Chrn the Academic Illpartment. Washington, D. C.:American Council on Educiii6E779 .
190

Planning and Computing in Theological Seminaries
by
Alexander M. Jones and Daniel A. UpdegroveEDUCCM
In March 1980 the Religion Division of the Lilly Endowment awarded a grant
to EDUCCM for a project of "research and development of cost effective planning
tools for theological seminaries." In this project, EDUCCM staff worked with
administrators at eleven seminaries to evaluate the usefulness of
computer-based financial planning models. In addition, when it became apparent
that some seminaries were not prepared to use planning models effectively
because of outmoded data processing operations, EDUCCM extended the project to
provide consulting on hardware and software options and systems management at
several of the seminaries. (1)
By the end of the project (July, 1982), four seminaries reported that
models were "integral' to their planning and four reported that models were
"useful adjuncts". Both EDUCOM's EFPM modeling system and microcomputer-based
systems were used successfully; EDUCCM concluded that most seminaries should
use microcomputers because of their lower cost and ease of use. (2)
To test the generality of these findings, EDUCCM sent a questionnaire on
planning and computing to the chief executive officers of all 192 seminaries
-affiliated with the Association of Theological Schools. The survey was mailed
in March, 1982 with one followup in April. Completed questionnaires were
received from 106 institutions (55%), with most returned by chief executive or
chief business officers. It must be pointed out, of course, that despite the
(1) For details see Alexander M. Jones and Ronald L. Orcutt, 'Computers inTheological Seminaries: Strategies, Options, and Services," Princeton: EDUCCM,1982.
(2) For details see Daniel A. Updegrove and Carole C. Shields, "FinancialPlanning in Small Institutions: A Case Study of Theological Seminaries," EDUCOMBulletin 11, ND. 3, Fall 1982, pp. 2327.
190
_19;

}91
high response rate there is the potential problem of non-response bias in the
results. That is, one would expect a lower response rate from seminary officers
less interested in planning and computing.
PLANNING IN SEMINAR/ES
Among the basic premises of the project were the perceptions that
seminaries did not, in general, appreciate the need for planning, did not
practice effective planning, and and vid not have the personnel, experience,
and tools necessary for effective planning. During the course of the project,
we had the opportunity to deal with eleven selected seminaries that, to varying
degrees, were exceptions to these basic perceptions. In dealing with the
participating seminaries, we were exposed also to evidence that attitudes and
practices are changing.
Seminaries Believe They Need More Planning
Of the 106 respondents, 82 indicated "we need to do more planning in the
next two years," while 21 felt the current level of planning was adequate, and
2 felt that less planning would be more appropriate. Interestingly, there is a
clear sense that the need for planning is increasing, since a separate question
about the current situation (as opposed to the future) produced the following
answers: 66 "we do too little", 37 "we do the right amount", and 2 "werdo time
much".
Seminaries Pia'', Or At Least Believe They Plan
One of the questions asked "Over what time period do you plan for each of
the following?", and a list of 9 specific categories. For each categoey,
respondents could specify "current year only", "next year", "2-3 years", "4-5
years", 6-10 years", or more than 10 years". If we categorize "not
applicable", "no response", and "current year only" as "no planning", "next
year" as "short -term planning", and the other categories as "long term
planning", we obtain the following results:
19s

192
TABLE I
Planning Practice By Category
Category No.Planning Short Term Long Term
7
Operating BudgetCapital BudgetDevelopment
EndowmentAcademic ProgramEnrollmentFaculty TenureSpace and FacilitiesComputers and Data Procesing
13%15%
17%22%8%11%
25%
18%
47%
52%31%29%22%27%
39%9%15%
26%
35%511%
511%
56%65%50%66%67%27%
These numbers do not necessarily indicate "effective planning" or "serious
commitment to planning", but they cake it clear that respondents perceive that
planning is going on.
Boards Want Better Planning
The evolution of planning in seminaries will be strongly influenced by the
attitudes of seminary boards. While the survey was distributed to CEO's, rather
tAan beard members, zeveral important inferences can be drawn. Eightyfour
respondents indicated "our board is interested in better planning", while only
four indicated "our board is not interested in better planning". Most
respondents indicated that trustees are involved in the planning process,
either the entire board (35%) or a committee of the board (65%).
Impediments Are Recognized
There are many impediments to effective planning in seminaries: historical
attitudes toward planning and the consequent lack of experience; small size and
small staff, etc. These impediments cannot be overcome until they are
recognized, and the following results indicate that recognition has occurred:
112% We don't have enough staff to do the planning we need.
58% We don't have staff trained in the appropriate analyticaltechniques needed to do better planning.
38% We lack the data required to do better plannirg.

1
193
25% We 4on't know what data are required for better planning.
47% We would like to use computer-based tools for planning. [Weassume this implies they don't or can't.)
The perceived need for better planning may lead to efforts to overcome
these obstacles.
Broad-based Planning,Efforts
In response to the question "Who is involved in planning at your seminary?"
the following responses were received, indicating that most planning processes
are broad-based:
65% - A Committee of the Board35% - Entire Board of Trustees95% - Chief Exec Officer (Pres. or Dean)18% - Ekecutive Vice President56% - Vice President for Academic Affairs or Provost61% - Vice President or Director of Finance/Administration53% - Vice President or Director of Development15% - Vice President or Director of Planning77% - Other Staff51% - Faculty Committee35% - Entire Faculty20% - Student Committee4% - All Students10% - Alumni Committee4% - Other
Multi-institutional PlanLitg
Several questions addressed the issue of joint planning by groups of
seminaries. Of the 55 institutions participating _n local or regional0
consortia, 38 (a surprising 69%) indicated that cooperative planning took
place. Only 20 of the 66 (30%) denominational seminaries indicated that
demomination-wide planning occurred.
Disparate Time Frames
The time-horizon data used to create Table I provides some insight into the
amount of "lookahead" practiced in various planning areas:

194
TABLE II
Planning Horizon in Years
01 1 2-3 4-5 6-10 10+ Ave2Faculty Tenure 27 10 18 28 13 10 5.5Endowment 23 23 15 31 10 4 4.1Space and Facilities 19 16 22 33 15 1 CoDevelopsent 18 31 21 31 5 0 3.0Capital Budget 16 33 20 32 4 1 3.0Academic Program 9 29 36 31 1 0 2.8Student Enrollment 12 1 24 25 3 1 2.7Operating Budget 14 55 12 22 3 0 2.3Computers & Data Processing 50 28 14 12 2 0 2.0
Notes:"0" includes "current yearresponse.This average is calculated("current year only", etc.the average, 2.5 was usedand 15 for "10.0.
only", "not applicable", and no
from the data in the last 5 columnsare excluded). In the calculation offor "2-3", 4.5 for "4-5", 8 for "6 -10 ",
These numbers are interesting and display some significant information, but
they must be interperted with care. In particular, several biising factors
should be noted: the "five year projection" is a traditional planning practice
leading to a bump in the "4-5" column. Often, most of the actual "planning"
involves the first few columns of the traditional report. In addition, there-are many interactions among the categories, such that planning for one category
(say capital budget) may lead to the appearance of similar term planning for
another category (e.g., development) when such planning does not occur.
The "average", while a useful indicator of areas which are more likely to
have long term planning significance, does not reflect normal practice. 2.7,
for instance, does not indicate that anyone has a 2.7 year planning horizon,
but rather a roughly equal division between 1 year horizons and 4-5 year
horizons. The numbers in the first column do not necessarily represent anything
real (failure to plan or incompetence) since various circumstances and
structures may make the category uncontrollable or irrelevant (e.g. endowment
plann;ng fbr an uncndowed instit.ition, various categories for seminaries which
are part of larger institutions).
2 1.1i

A
iS5
The table is ranked in order of "average", and that order is not
particularly surprising. A few ob3ervations and comments follow:
Tenure: It is not surprising that this category leads the list, since the long
term importance of tenure decisions is obvioUs, and the implications of
particular decisions are relatively easy to determine.
Endowment and Space and FaCilities: These categories both naturally involve
long term policies and decisions, and thus imply lengthy planning horizons.
22pital Budget and pevelopment: These are both "fuzzy" areas. Long term
planning in these areas is likely to be categorized iinder Space and Facilities
or Endowment, and the short term details as the "planning" in the area. A
reverse bias may occur* for institutions in "capital campaigns.
Academic Program: This is the only category for which the 2-3 year period
dominates -- probably becatse the typical M. Div. program is three years long.
Enrollment: This is also po entially misleading, since the processes involved
are very diffc.rent. The clew , open, widely visible coping with admissions is
very different'from the long term process of coping with enrollment trends.
Operating Budget: The indicated short term nature of operating budget planning
is a matter for serious conce n. The operating budget, is, in many ways, the
critical component of institutional planninf In general, the interaction of
all the other categories occur=s in the operating budget. In the long term,
institutional viability is conttrained by the necessity of reasonable operating
balance, and plans in all other areas must be evalu...,:ed in terms of the
maintenance of that balance. In addition, short-term operating budget planning
provides extraordinary opportunities for mistakes. Next year's deficit can be
covered, for instance. by deferring maintcnam:m, by borrowing, or by
over-spending endowment income. Each of these actions has two serious
impl ications:
o future expenses are increased (or income reduced)
o nothing is done to correct the real imbalance in the budget, whichis thus likely to persist and probably get worse.
2u4:,

196
Good, long term operating budget planning is a complex and difficult endeavor,
but it is absolutely necessary, since it defines the context of all other
activities.
Computers and Data Processing: This category has been relevant to seminaries
for only a short time, so long term planning processes have not yet evolved. In
addition, rapidly changing technology makes long term planning difficult.
Conclusions
From this survey and our experience, we conclude that:
1) The officers of theological seminaries are well aware 01 the .teed
for effective planning.
2) "Planning" is widely practiced in theological education, but the
types of planning and the time horizons used Aran; widely.
3) Current planning practices are perceived to be less effective
than they should be.
4) Many of the impediments to effective planning are widely
recogni zed.
5) TrUstees and administrators are motivated to achieve effective
planning.
6) Lack of operating budget planning beyond the next yeer is a
serious problem in many seminaries.
7) Computerbased modeling tools like EFPM and VisiCalc have been
shown to be effective aids to planning in seminaries and their
Use should be encouraged.
COMPUTING IN SEMINARIES
This section addresses three particular issues: perceived need for specific
computer services, degree to hilich these services have already been
computerized in th;olagical education, and degree to %Mob computerization is
perceived to be satisfactory. The question from which this section was derivdd
asked, "Please evaluate the following functions in the seminary". Four possible
answers were specified for each of the seventeen functions:
2u,,

r-
197
o Doesn't Need a Computer
o Should be Computerized (but isn't)
o Omputcrized adequately
o Computerized -- inadequately
Not all respondents answered the question for all of the functions and
some specified "other", or "E .t. applicable". etc. The handling of
these responses 1.3 outlined in the speoific sections below.
Perceived Need for Computerized Service
Perhaps the most dramatic result of the survey 1.8 that those who run
seminaries believe they need computerized services. Table III indicates the
level of perceived need. For eaoh service, two percentages are given. The lower
number assumes that all non-responses for a particular service should be
interpreted as "doesn't need a computer", wh!le the higher number ignores the
non-responses. In both cases, "should be computerized", "oomputerized
adequately", and "computerized inadequately" are assumed to imply that the
computerized service 1.3 perceived to be needed. The questionnaire did not
define "need"; it is likely tLst some responses should be interpreted as "it
would be nice if...", as opposed to "absolute necessity".
TABLE IIIPerceived Need for Computerized Services
LowEstimate
HighEstimate
Accounting - General Ledger 82% 87%Accounting - Accounts Receivable 78% 83%Accounting - Accounts Payable 78% 83%Development 75% 89%
Payroll 77% 85%Personnel Records 52% 60%Student Records 73% 81%Financial Planning 69% 85%
WP - Administration 71% 84%
4. WP 55% 71%e WP tudents 31% 45%
bblications 56% 73%
Ls 2u4

Library - Catalog 75%LibrarY - Circulation 56%Instruction 26%Faculty Research - 36%Aux it iaries WI
88%68%40%48%
198
There is clear consensus that traditional accounting and payroll functions
in seminaries should be automated and a general sense that most of the other
listed functions should be as well. By addition of the raw data, and ignoring
non-responses, it can be seen that 1093 of 1485 possible functions "need to be
computerized." (Phis works out to 74% or about 12.6 functions per institution.)
Some comments with regard to specific services are in order.
o The numbers for "financial planning" may be inflated becaUseearlier sections of the questionnaire focused on financial planningissues and resources.
o The"word is out" on word processing, at least for administrativeand publications activities. (Pilch of the credit for this can be
attributed to the recent "blitz" of advertising from many vendors.)
o The high numbers for "Aprary catalog" can be attributed to thewell known, high quality service distributed by OCLC, Inc.
o It is not clear to What degree the low numbers for servicesdeliverable to faculty and students (as opposed to administrativeservices) can be attributed to the fact that the questionnaire wasdistributed solely to administrators.
The overall message, however, is this: "Seminary officers know they need
computing services".
Use of Computerized Services in Theological Education
Clearly, it is easier to recognize a need than to do something about it.
The data summarized in Table IV indicate that seminaries have implemented more
computer systems than would have been expected. These figures represent thl
computerization of services from any source (seminary-owned equipment, services
from affiliated institutions, services purchased from service bureaus, etc.)..
Again, two numbers are given for each service; the low estimate includes
non-respondents as if they did not have the service, the high estimate ignores
them. "Use as percentage of need" relates actual use to perceived need
(ignoring non-respondents).
2 tk;
4.

t
TABLE IVActual Use of Computerized Services
Usage "Use" as
low and high % ofestimates "need"
199 '.
AcCounting - General Ledger 50% - 53% 61%
Accounting - Accounts Receivable 49% - 52% 63%Accounting - Accounts Payable 48% - 51% 61%Development 40% - 47% - 53%
54% - 59% 70%Personnel Records 20% - 23% 38%Student Records 37% - 38% 47%Financial Planning 23% - 28% 33%
WP - Administration 28% - 34% 40%
WP - Faculty 24% - 30% 43%WP - Students 14% - 21% 45%WP Publicati4ns 20% - 26% 46%
Library - Catalog 42% - 48% 55%Library - Circulation 25% - 301E 44%Instruction 8% - 13% 32%Faculty Research 10% - 14% 29%Auxiliaries 19% - 26% 45%
These figures make it clear that the use of computerized services is
widespread in seminaries. In one area, payroll, computerization is the rule,
rather than the exception. Overall, summing the raw data indicates that 537 of
1093 "needed" functions have been computerized, for a combined "use as
percentage of need" of 49%. Again, several observations are in order.
o" Some Of-the higher ritimbers can-be-traced-to-the-availability of
well known, high quality external services (commercial payrollservice bureaus, and OCLC).
o Roughly half of the seminaries surveyed now use computerized basicaccounting functions.
o The "use as % of need" numbers are generally low. We suspect thatthe explanation could be one or more of the f-'lowing: computersare perceived to be too expensive; computers are a lower prioritythan other expenditures; decisions about computing expenditures arecomplex and risky so they are often deferred; the perception of
. .
need is a recent one.
2u0

200
Satisfaction with Computerized Services
Finally, by looking at the "adquate/inadequate" responses, we can develop
some understanding of the degree of satisfaction with specific computerized
services. Table V lists the total number of computerizations of each service,
the number characterized as adequate, and the percentage. In the cases marked
with an asterisk, the number of implementations is small, and the results
cannot be viewed as reliable.
TABLE VAdequacy of Computerized Services
-Ego'"Computerized" "Adequate Percentage
Accounting - General Ledger 53 51 96%Accounting - Accounts Receivable 52 48 92%Accounting - Accounts Payable 51 48 94%Development 42 27 64%
Payroll 57 55 96%
Personnel Records 21 15 71%Student Records 36 30 83%Financial Planning 24 15 63%
WP - Administration 30 22 73%WP - Faculty 25 20 80%WP - Students 15 6 40$11
WP - Publications 21 12 57%
Library - catalog 44 40 91%Library - circulation 26 19 -73%Instruction 9 6 67%0
Faculty Research 11 5 45%*
Auxiliaries 20 15 75%
These numbers indicate that the most commonly computerized services (basic
accounting functions, payroll, and library catalog) have, in general, been
adequately implemented. Overall, 434 of 537 functions have been "adequately"
computerized (81%). Certain other points should be noted.
o "inadequate" can mean one of three things: 1) theimplementation of the computerized function was a poor one. 2)experience with a system has led to perceptions of need forgreater capacity or increased function, or 3) the systeminvolved has become overloaded, and no longer performs some of
its functions adequately.
2u;

201
o-The-16i) level of adequacy of "development" systems can be
traced to several factors: increased dependence by seminarieson fundraising and increased understanding that acomputerized system for a development office should do morethan just produce mailing labels. The ideal system should linkto word processing for generation of customized form lettersand reports; to the accounting system for automated processingof gift transactions, and to a data base management system foranalysis and decision support.
o Word Processing is a contagious phenomenon -- initial systemswith limited capacity breed demand for increased capacity andfunction.
o "Financial Planning" is an especially difficult area, partlybecause the technology is relatively new, and largely becausefinancial planning itself is a difficult process these days(and one that, until recently, received little attention intheological education).
Conclusions
While no specific seminary is "average", or "normal" or "typical", the
survey data can be combined to produce the following characterization of the
"average" seminary: It "needs" about 12:5 computerized functions; It "has"
about 6 computerized functions; Of those functions, about 5 are viewed as
adequate.
It could be concluded that the officers of theological seminaries perceive
the needs for computerized services, are well started along the road to
implementing those services, and are generally satisfied with the results 'to
date. We would, however, caution the seminary community against an overly
sanguine view of computing. In particular we point out the following concerns:
o Some seminaries have little or no experience.
o The number of hardware and _software options is bewildering) ylarge -- and growing.
o As computer use grows, more sophisticated management isrequired.
Therefore, we urge seminaries to adopt the resource sharing and consulting
services of consortia used by colleges and universities to deal with th(
complex computing environment of the eighties.
20,3

THE ECONOMIC CONTRIBUTION OF THE CONSORTIUM OF UNIVERSITIES
TO THE WASHINGTON METROPOLITAN AREA*
Edward D. JordanDirector, Information Systems & Planning Office
The Catholic University of America
The Washington National Capital Area has continued to expand in the
decade of the 1970's. The more Important of these changes as noted by
Shidler are trends which have continued from the 1960's and include
decreasing household size, increasing.proportion of wbmen.participating
in the labor force, 'inward job mobility of black and. other minorities
and a proportionate increase in professional, technical, managerial and
administrative employment. Economic growth can be attributed partly to
changes in the composition of the area's population, employment and
labor force. Contributing to this economic growth in a rather complex
way are the myriad activities of the various universities and colleges
within the area.
The core of the Washington National Capital Area is the District of
Columbia, a complex jurisdiction which is the seat of the nation's
government and also a political-economic entity which has some of the
characteristics of a state. From a higher education viewpoint, the
District of Columbia, when considered as a state, is first among all the
states in the percentage of out-cf-stIte students (73%). The District
is also first among the stasis in the percentage of total enrollment in
private institutions (over 8070.
The private and publir: institutions of Agher education within the
District of Columbia belong to The Consortium of Universities of the
Washington Metropolitan Area. The Consortium consists of American
*Ynis work was a collaborative effort of W. Agee, American University,M. Bell, Georgetown University, W. D. Johnson, George WashingtonUniversity and J. P. Whalen, The Wash' ;ton Consortium of Universities.
202 20j
.11

203
University, The Catholic University of America, George Washington
University, Georgetown University, Howard University, The University of
the District of Columbia, Gallaudet College, Mount Vernon College and
Trinity College.
he objective of this study is to develop an estimate of the
eco is contribution of the Consortium institutions to the District of
Colu and to the adjacent political jurisdictions of Maryland and
Virginia. iaryland and Virginia are considered because of the close
economic interrelationships of the three jurisdictions within the area.
However, most of the economic contribution or impact occurs in the
counties of Maryland and Virginia nearest the District of Columbia. It ,
should be noted that finer degrees of political juirisdictions can
readily be used by, for example, using United States postal' ZIP code
classifications to obtain more geographic refinement. Important aspects
of the study are to produce results that are credible and readily
accepted by the various publics, to develop an analysis easily under-
stood by the political environment, and to develop a tool for effective
long range planning.
It is important to note that the economic effects to be analyzed
are current and short range. In this study no account is taken of such
long range effects as the upgrading of professional manpower, the
contribution of scientific research and training to business and
government or the attractiveness of the Metropolitan Area as a desirable
place for either residence or as a location of research and development
activities. However, the long raL4e effects on the national economy and
the lifetime income and productivity of graduates are important long-
term benefits to the community.
The methodology of the study uses simple linear relationships
incorporating what can readily be minted but omitting from quanti-
fication factors which can be termed "quality of life" issues. It is
these latter issues which usually lead to disagreements on the validity
and hence the acceptance of similar studies because the process
21d
O

204
of quantification brings to the surface various values and their
relative relationships as a system. These disagreements can lead to a
loss of credibility and hence compromise one of its prime objectives.
However, these qualitative factors do in some cases contain quantitative
factors and some of thew were investigated without incorporating them
into an estimate of their economic contribution. It is believed that
the study presents a conservative estimate of the magnitude of the
economic contribution because it does not take into direct account
political, social and aesthetic factors or the effects of the institu-
tions' human resources upon the community.
THE CASH-FLOW MODEL
To estimate the economic contribution or impact of the Consortium
of Washington Universities to the Washington region, a modified
cash-flow model as described by Caffrey and Issacs and by Montgomery
et.al. is used. The model developes estimates of aggregate demands in
the community resulting from expenditures by the academic institutions .
as well as by groups of individuals associated with the institutions.
Three groups of individivals are identified in this study in addition to
the Consortium as a collective corporation viz. Faculty and Staff,
Students and Visitors.
A flow diagram of operational and capital expenditure cash flow as
used in the analysis is presented in Figure 1. The Consortium
institutions pay salaries and wages to faculty and staff who in turn
purchase goods and services in the District of Columbia, Maryland and
Virginia. In addition faculty and staff pay taxes to these
Jurisdictions. The Consortium academic institutions grant funds to
students as student aid in,the form of grants and awards. Students in
turn use these funds to purchase -goods and services and pay taxes. The
Consortium institutions also attract visitors because of their
programmatic offerings (student applicants and families, research
participants, etc.) and in addition offer short-term programs such as
2.L1

CONSORTIUM
OF
WASHINGTON
UNIVERSITIES. ..-- - .......
- - - X PROGRAMS )- VISITORS%.. .4... ....
205
' FACULTY F.*STAFF
&
ISTUDENTS}-÷
PURCHASES OF GOODS,SERVICES
&TAX PAYMENTS
RETIREMENT&
IDEBT INTEREST
WASHINGTONMETROPOLITANMET ROPOL2TAN AREA
BUSINESSES & GOVERMENT
Fig. t OPERATIONAL AND CAPITAL EXPENDITURE CASHFLOW MODEL.
212

206
conferences, workshops and institutes. These visitors also purchase
goods and services in the community and are subject to taxes.
The academic institutions of the Consortiirn purchase goods and
services corporately for operatiOnal and capital purposet as well as pay
interest on debt services and retire debt. The purchase of these goods
and services from local businesses, the payment of taxes to various
government entities and the payment of interest to local financial
institutions produces a cash flow (or its equivalent) which is then
circulated and recirculated through the community. This circulation of
funds can be represented by an economic multiplier which represents the
purchase of additional goods and services and the payment of taxes.
DATA AND ANALYSIS
Most of the data for this study was obtained from readily available
institutional records and estimates derived from explicit assumptions.
In a few cases sample surveys were required to achieve a reasonable
assurance of a correct estimate. Financial data were taken from the
official budgets or audited statements of the various institutions.
Some categories of income and expenditure were reaggregated to make the
data more amenable to analysis.
Table 1 presents data on enrollment and the geographical origin of
full-time and part-time students belonging to the Consortium for the
Fall 1980 semester. Of the 90,465 students (essentially all academic
yearresidents of the District of Columbia, Maryland and Virginia),
57,512 or 63.6% of the total originate from the three political
jurisdictions and 31,240 or 34.5% of the total are residents of the
District of Columbia. These students pay a total of $217,419,000 in
tuition and fees to the Consortium institutions.
21,

207
TABLE 1 - SELECTED STUDENT DATA
STUDENT RESIDENCE NUMBER ENROLLED TUITION & FEES
District of Columbia 31,240 $ 45,295,000Maryland 15,613 39,820,000Virginia 10,659 32,368,000Other 32,953 .99,936,000
Total 90,465 $217,419,000
The number of faculty and staff and their place of residence is
shown in Table 2. Of the 38,500 faculty and staff, 19,344 or 50.2%
reside in the District of Columbia and 96.0% reside within the three
political jurisdictions. A total of $29,109,000 of local income taxes
(district and state) were withheld from faculty and staff for the 1980
year. Consortium faculty and staff who live in the District make up
6.1% of the labor force of those who live and work in the District.
TABLE 2 - SELECTED FACULTY AND STAFF DATA
FACULTY & STAFFRESIDENCE NUMBER
LOCAL INCOMETAX WITHHELD
District of Columbia 19,344 $11,769,000
Maryland 11,255 12,861,000 4
Virginia 6,366 ---------4,477,000
Other 1,535 2,000,
Total.
38,500 $29,109,000
The sources of operational funds for 1980-81 are shown in Table 3.
Government agency funds are used primarily for the purchase of
specialized services such as research and instruction and student aid.
The vast majority42f, these funds come from federal government sources.
Student tuition and fees and medical services provided to the general
public provide other substantial sources of revenue.
2 1 4
.
le

208
TABLE 3 - SOURCES OF FUNDS FOR OPERATIONAL EXPENDITURES
GovernmentFederal $261,958,000District of Columbia 61,534 000Other 1,358,0(0Sub-total $324,850,000
Tuitiun & Fee.; $217,420,000Investments 11,616,000Private Gifts & Grants 34,280,000Auxiliary Enterprises 50,603,000Medical Services 221,572,000Other (includes sales & services) ' 24,300,000
Total $884,641,000
Table 4 presents operational expenditurps for the 1980-81 year. It
is seen that salaries and wages comprise 66.5% of expenditures and
account for the largest share of-Consortium expenditures. Purchases of
goods and services account for additional significant shares. Within
these categories are large expenditures for various forms of energy
because of the extensive physical plants of the academic institutions.
TABLE 4 - OPERATIONAL EXPENDITURES
Salaries, Wages & Fringe Benefits ', $588,566,000Purchases 117,$39,000
Services1 89,889,000
Taxes 4,546,000
Student Aid 45,057,000Interest on Debt Service 14,598,000Transfers for Capital & Other Purposes 24,146,000
Total $884,641,000
Table 5 presents capital sources of funds for 1980-81.
Approximately 40% of capital funds comes from government sources.
21;:,

209
TA8LE 5 - SOURCES OF FUNDS FOR CAPITAL EXPENDITURES
Gifts and GrantsGovernment Agencies $ 19,529,000Private Sources 7,116,000
Debt FiancfngGovernment Sources 10,475,000?rivate Sources 13,858,000
Operating Budgets 23,460,000
Total $74,438,000
Capital expenditures by function are listed in Table 6. It is seen
that 74% of capital funds are used for physical facility construction
and renovation.
TABLE 6 - CAPITAL EXPENDITURES
Construction $54,905,000Capital Purchases 14,509,000Debt Retirement 5,024,000
Total $74,438,000
Capital investment for the decade from 1971-72 to 1980-81 is shown
in Table 7 for construction and capital purchases. The average yearly
expenditure was approximately $62,000,000. Hence, expenditures for
the 1980-81 year are typical (within 10%) of the average for the decade.
TABLE 7 - TEN YEAR LOCAL CAPITAL INVESTMENT
1971-72 $ 71,006,0001972-73 36,224,0001973-74 28,400,0001974-75 107,497,0001975-76 38,344,000
1976-77 46,227,0001977-78 68,798,000
1978-79 95,904,000
1979-80 55,860,0001980-81 69,415,000
Total for the Decade $617,675,000
21 6

210
Table 8 presents spending generated by the Consortium institutions
in the District of Columbia, Maryland and Virginia. It is seen by
comparing this data to Tabl._ 4 that.99.3% of salaries and wages g to
residents of the District of Columbia, Maryland and Virginia, whi4-
63.0% of the purchases of goods and 73.1% of the purchases of services
is directed to the three Jurisdictions.
TABLE 8 - INSTITUTIONAL-GENERATED LOCAL SPENDING (Thousands)
OperatingSalaries, Wages &
D.C. MD. VA. TOTAL
Fringe Benefits $273,873 $185,880 $124,630 $584,383Purchases 30,578 24,184 19,468 74,23DServices 37,308 14,384 14,060 65,752Taxes 4,472 38 35 4,545
Aid to Area Students 9,003 7,403 5,267 21,673Interest on Oebt Service 14,598 14,598
CapitalConstruction 54,905 54,9D5Capital Purchases 14,509
'
14'509
Debt Retirement 5,024 5,024
Total $444,270 $231,889 $163,460 $839,619
Student generated local spending is presented in Table 9. Students
generate $175,659,000 of expenditures and visitors $56,992.000.
TABLE 9 - STUDENT-GENERATED LOCAL SPENDING (Thousands)
Livinp ExpensesFull-time $158,476Part-time 17,183
VisitsBy Applicants & Families 16,737By Families of Students 30,515Conference & Institute Participants 9,740
Total $232,651
21

211
The total amount of institutional (operational and capital) and
student generated spending in the area or the direct economic impact
amounts to $1,072,270,050. The economic contribution or impact of the
Consortium on the local area is the product of the direct economic
impact and the economic multiplier.
THE ECONOMIC MULTIPLIER
Calculation of the economic multiplier can be quite complicated
requiring massive data if a fully disaggregated input-output model is
used. Caffrey and Issacs recommend a multiplier within the range of 1.2
to 1.5 for university economic impact studies. Table 1'0 presents a
listing of some economic impact studies and the economic multipliers
used in these studies. It is se that the value of the multiplier
ranges from a low of 1.4 to a high of 4.35. Based upon an analysis of
these values from the perspective of the academic institution and the
community and also discussions with Solomon who noted that although
there is no stated multiplier for the Washington metropolitan region,
coopering the region to other regions, it appears that the use of a
value within the range of 1.4 as used in this analysis is a conservative
estimate of the economic factor.
TABLE 10 - ECONOMIC IMPACT MULTIPLIERS
INSTITUTION YEAR MULTIPLIER
University of Florida 1970 1.4
Wisconsin State University 1970 2.0 - ?.3University of Alabama 1971 4.35Eastern Kentucky University 1971 1.75University of Pittsburgh 1972 2.0
Georgia State University 1976 1.48
Independent Colleges & Univ. of New York 197G 2.0Canisius College 1977 2.7Independent Colleges & Univ. of Mass. 1980 1.5
21i

212
Hence the total economic impact is estimated to be over
$1,500,000,000. Comparing this impact to the impact of other sectors of
the economy, the Consortium is the largest contributor to the District's
economy excluding the federal and local government.
REFERENCES
Bellenger, D. The Income and Employment Impact of the University ofAlabama on Tuscaloosa County. Alabama Business, 1971, 10, 1.
Bonner, E. The Economic Impact of a University on its Local Community.Journal of the American Institute of Planners, 1968, 5, 339.
Caffrey, J. and Issacs, H.H. Estimating the Impact of a College orUniversity on the Local Economy. Washington, D.C.: AmericanCouncil on Education, 1971.
Cook E. Analyzing University Student Contributions to the EconomicBase of the Community. Annals of Regional Science, 1970, 4, 146.
Montgomery, J.R., McLaughlin, G.W., Mahon, B.T., and Morey, P.E.Economic Benefits of Professional Schools. In R.H. Fenske (Ed.),Conflicting Pressures in Postsecondary Education. Tallahassee,Fla.: The Association for Institutional Research, 1976, 16, 147.
Olson, L. and Mucha, Z. The Economic Impact of Independent Higher.Education on Massachusetts. Boston, Mass.: Data Resources Inc.,1980.
Paley, H.Dt The Economic Impact of'Independent Higher Education in NewYork State. Albany, N.Y.: Commission on Independent Colleges andUniversities, 1978.
Salley, C.D. Calculating the Economic Multiplier for Local Spending.In R.H. Fenske (Ed.), Researth and Planning for Higher Education.Tallahasse, Fla.: The Association for Institutional -Research,1977; 17, 49.
Salley, C, Prather,-J., and Williams J. A Review of EconomicMultipliers for Post-Secondary Institutions with Selected ModelsApplied to Georgia State University. Atlanta, Ga.: Office ofInstitutional Planning, Georgia State University, 1976.

THE DESIGN AND IMPLEMENTATION OF AN EVENING
STUDENT SURVEY: METHODOLOGICAL ISSUES AND
PRACTICAL CONSIDERATIONS
Linda LyonsDirector of Institutional Research
--------- -Jersey Gity State Cbllege
OVERVIEW
A broadly-based function of institutional research is "to provide infor-
mation which supports institutional planning, policy formulation, and decision
making (Saupe, 1981)." In this regard, survey research can be useful in
planning and implementing a variety of programs and services at postsecondary
institutions. The findings can be particularly meaningful if the impetus for
survey research is internally motivated (Kells, 1981), and if results are
presented in a format that is "understandable to decision makers
(Sadler, 1980)." In light of these practical considerations, this paper
focuses on the development and administration of the questionnaire, tIe
analysis of data, and the communication of findings.
DESIGN AND ADMINISTRATION OF THE SURVEY
In response to a recent increase in evening student enrollments at Jersey
City State College, a public, four-year institution, managerial administrators
expressed an interest in assessing the needs of the evening student popula-
tion. In view of the fact that the evening program .serves a diverse, non-
traditional student population, the relevance of survey packages offered by
various test publishers was judged to be limited. Consequently, the decision
was made to develop and utilize a local instrument in order to assess student
concerns with various academic and nonacademic issues.
214
22 k

215
In order to identify pertinent issues for each student cohort, i.e.,
graduate students, matriculated and non-matriculated undergraduates, the
Director of Institutional Research met with department chairpersons and
administrators representative of Academic Affairs, Finance, and Student
Services. Suggestions for relevant items were incorporated in the develop-
ment of a questionnaire which could be completed withiiia-Fifii.rvely short
time period.
The questionnaire was comprised of 28 objective items and one open -
ended question, included for student comments. Twelve of the objective
items, assessed academic and demographic characteristics; 16 items, various
acauemic and nonacademic services provided for the evening students.
Nearly all the service-oriented items were scored on a five-point, Likert
scale, which facilitates scoring by an optical mark reader or manual coding
-of responses. The questionnaire was pretested and'several item revisions
were made.,
In view of the fact that mailed-in questionnaire returns, even with
repeated efforts, have been found to be relatively low, the decision was
made to administer the questionnaire to the' students in their classrooms.
Administrative support was obtained, and all academic departments received
prior notice of the time period during which the survey would be conducted.
In order to ensure a representative sample, classes wete selected to reflect
0the proportion of evening courses offered by the various academic depart -
ments,at the lower and upper undergraduate levels as well as the graduate
level. The questionnaire was administered to 1275 undergraduate and
graduate students during a one-week interval at mid-semester. Students were
requested to complete the questionnaire anonymously and, for students
enrolled in more than one class in which the survey was conducted, to fill
out only one questionnaire. All students completed the questionnaire within
222

216
five or ten minutes, so that disruption of instructional time was minimal.
FINDINGS
Responses to the student background items were compiled. Appropriate
tabulations and cross tabulations were computed to provide data on the
students' schedules, course load, status, major, age, sex, employment
patterns. Comparis-ons between thi evening students and the general college
population indicated similar distributions for sex and major area of study.
However, the evening students were more likely to attend part time, to be
considerably older than the traditional day student, and to be employed on
more than a half-time basis.
Responses to the service-oriented items were tabulated for the total
evening student sample. Data indicated that the most important issues
focused on security, the establishment of an Evening Student Office, ad-
justments in the evening course schedules, and the extension of various
services. Additionally, for the Likert-scale items, chi-square analyses
were conducted to determine if there were significant differences between
various subgroups, i.e., full-time and part-time students; undergraduates
and graduate students. Results of these analyses are presented in Table 1.
220

Table 1A
217
Analysis of Student Attitudes Toward the Evening ProgramBy Status and Class Level
Item
Response
NotImportant Neutral Important x
2
% N % %
Advisement After 7 PMStatus 8.22*
Full-Time 67 16% 96 23% 251 61%Part-Time 135 16% 140 16% 571 68%
Class Level 22.40***Undergraduate 118 13% 140 17% 584 70%Graduate 73 21% 81 24% 186 55%
Food ServicesAfter 7 PM
Status 21.40***Full-Time 98 24% 109 26% 206 50%Part-Time 306 36% 220 26% 320 38%
Class Level 5.16Undergraduate 249 30% 222 26% 370 44%Graduate 121 35% 90 27% 129 38%
Book Store HoursAfter 7 PM
Status 55Fuil-Time 28 6% 52 13% 334 81%Part-Time 66 8% 101 12% 679 80%
Class Level 5.52Undergraduate 53 6% 96 12% 693 82%Graduate 31 9% 49 ,14% 260 77%
Additional SecurityStatus 1.64
Full-Time 12 3% 31 7% 370 90%Part-Time 14 2% 62 7% 771 91%
Class Level 11.90**Undergraduate 1? 2% 77 9% 748 89%Graduate 5 2% 121 3% 323 95%
Student LoungeStatus 14.53***
Full-Time 35 8% 94 23% 284 69%Part-Time 125 15% 221 26% 501 59%
Class Level .60Undergraduate 105 13% 208 25% 529 62%Graduate 48 14% 81 24% 211 62%
224

218
Table 18
Item
Library Staff
NotImportant
Response
x2
Neutral _Important
.AdditionalStatus 4.11
Full-Time 26 6% 87 21% 298 73%Part-Time 82 2'4 186 22% 579 68%
Class Level .62
Undergraduate 72 9% 176 21% 592 70%Graduate 25 8% 76 22% 239 70%
Student ActivitiesStatus 97.49***
Full-Time 90 22% 144 35% 177 43%Part-Time 363 43% 313 37% 171 20%
Class Level 77.52 * ""
Undergraduate 258 31% 299 36% 283 33%Graduate 152 44% 134 39% 54 17%
Use of Gym/PoolStatus 66.73***
Full-Time 75 18% 130 .32% 207 50%Part-Time 324 38% 273 32% 252 30%
Claims Level 41.99***
Undergraduate 218 25% 266 32% 359 43%Graduate 144 42% 111 33% 85 25%
Courses in Sport &Leisure
Status 45.15***
Full-Time 79 19% 137 33% 196 48%
Part-TimeClass Level
302 36% 280 33% 265 31%51.60 ***
Undergraduate 209 25% 259 31% 373 44%Graduate 139 41% 129 38% 72 21%
Evening Student CouncilStatus 49.44***
Full-Time 96 24% 148 36% 168 40%Part-Time 326 39% 326 38% 196 23%
Class Level 39.53'"Undergraduate 241 29% 313 37% 289 34%Graduate 143 43% 138 41% 58 16%
Two Courses in OneEvening
Status 1.96
Full -Time 40 9% 95 23% 275 68%
Part-Time 78 9% 168 20% 598 71%
Class Level 5.11
Undergraduate 88 11% 179 21% 574 68%
Graduate 21 6% 71 21% 244 73%
220

Results indicate that full-time studen,r expressed significe-tly
greater interest than part-time students it various student a ;vides and
services. Part-time students showed significantly greater Jncern with
evening course schedules and coordination of academic se.lrices. As may be
expected, undergraduates showed significantly greater interest than graduate
students in various student activities.
Additionally, of he 1275 students who completed the questionnaire, 35%
responded to the open-ended item. The students' comments focused, primarily,
on the need for additional security, appropriate course offerings at
convenient hours, and the extension of academic services.
COMMUNICATION AND IMPLEMENTATION OF FINDINGS
A report was prepared and was furnished IA managerial administrators,
department directors and chairpersons at the College. In the report, the
assistance provided by the faculty and staff was acknowledged, and the design
and implementation of the survey were described. Data were presented in
tabular form followed by a summary of findings in the text. Additionally,
student concerns with various services were ranked and presented in descending
order. Responses to the open-ended item were analyzed, and a sampling of
responses was reported verbatim in each of seven categories. Although few
new issues were cited in responses to the open-ended item, the qualitative
data served to highlight the information provided by the objective measure.
A grand summary, which focused on salient issues to be considered by policy
makers at the institution, was also included.
Findings were implemented in several ways. In response to the open-
ended item, some students commented favorably about the evening program and
the College in general. These citations were forwarded to the Director of
Admissions, who included some of the comments verbatim in an Admissions
Office publication. Additionally, in response to survey findings, decisions

220
Table 1C
ItemNot
Important
Response
/
Important x2NeutralN % N % N
Courses Meeting Oncea Week
Status 8.25*Full-Time 18 5% 71 17% 321 78%Part-Time 33 4% 99 12% 712 84%
Class Level 2.23
Undergraduate 34 4% 125 15% 680 81%Graduate 14 4% 39 12% 284 84%
Courses at 10 PMStatus 10.72,*
Fu11-Time 269 66% 80 19% 62 15%Part-Time 594 70% 174 21% 76 9%
Class Level 27.51***Undergraduate 533 63% 192 23% 114 14%Graduate 267 79% 51 15% 20 6%
Evening Student OfficeStatus 6.07'
Full-Time 17 4% 51 13% 327 83%Part-Time 38 5% 70 8% 724 87%
Class Level .78
Undergraduate 37 5% 76 9% 706 86%Graduate 15 4% 36 11% 280 85%
p < .05
** p < .01
11" p < 001
22

221
were made to institute various changes, e.g., improved lighting and other
:security measures, adjustments in evening course schedules, provisions
for coffee and snacks in the student lounge. These changes were relatively
easy and inexpensive to implement.
Overall, the survey provided the institution with relevant information
about the needs and concerns of the evening student constituency. Particu-
larly in view of the fact that institutional support for the survey was
obtained, the findings were reviewed and utilized to enhance the services
provided for the evening students at the College.
REFERENCES
Kells, H. H. Some theoretical and practical suggestions for institutionalassessment. New Directions for Institutional Research, 1981, 29, 15-26.
Sadler, D. R. Conveying the findings of evaluative inquiry. EducationalEvaluation and Policy Analysis, 1980, 2(2), 53-57.
Saupe, J. L. The functions of institutional research. Tallahassee,Florida: The Association for Institutional Research, 1981.
29

HUMAN RESOURCE PLANNING
A Model for Establishing and ProjectingAttrition Rates Among the Non-Instructional Staff
of an Academic Institution
Heidi L. Mahoney, Faculty & Staff RelationsSlawko F. Medinac, Institutional ResearchBarbara A. Meyer, Personnel Data System
State University College at Buffalo i
As state: budget directors and college comptrollers loCk for ways to
control and diminish the cost of operations of postsecondary institutions, it
is evident that wages, salaries and benefits are a critical factor in that
costs indeed, these expenses generally account for 70 to 80 percent of the
institutional budget. To the extent that efforts at predicting institutional
human resource needs are sound and creditable, colleges will oe able to exert
more effective control over their staffing decisions and consequently, over
their budgets.
STOCK AND FLOW MODELS
Colleges and universities have not ignored the wisdom of developing
staffing projection models for faculty. Several studies have examined the
normal attrition which occurs among faculty through retirement, termination,
nonrenewal and resignation and have tested the effect of policy variables
related to hiring, promotion and tenure decisions on this attrition rate
(Bloomfield, 1977; Hopkins, 1974; Hopkins and Massey, 1981; Hopkins and
Schroeder, 1977; Oliver, 1969; Young and Almond, 1961). Curiously, little
attention has been given to determining and projecting the hiring and attrition
pattern among another significant employee sector in higher education, the
non-instructional staff. It is a sector which slightly exceeds in number the
faculty at the comprehensive four-year public college which was the subject
of this study, and it accounts for the expenditure of a relatively large
proportion of the personal service budget. Beyond these quantifiable factors,
however, lie the qualitative considerations which make staffing projection
and planning efforts so critical. To the non-instructional staff largely
falls the responsibility for maintaining what is euphemistically referred to
as "the quality of life" on campus -- counselors and caretakers, laboratory
technicians and bursar clerks--all make critical contributions to the support
J

F
223
of the academic environment. This study does not attempt to develop staffing
ratios for these support functions; its purpose rather is to bring to the
attention of administrators the fact that a comprehensive human resource
planning program must take into account non-instructional as well as faculty
scoffing.
Theoretical Background
The statistical analysis of human resource systems was first approached
systematically through the use of modelling techniques during the 1940s zind
developed rapidly with the widespread emergence of computer technology in the
1960s. These early studies demonstrated that, in general, propensity to leave
decreases with age and length of service, is higher for women than men and
decreases with increasing salary, status or skill (Silcock, 1954; Hedberg,
1961). Of these, length of service appears to be the most significant factor
(Bartholomew and Forbes, :979).
The next evolutionary step in the development of human resource planning
models move beyond the measurement and projection of attrition rates and
concerned itself with the construction of transition models depicting systems
of stocks and flow (Young and Almond, 1961; Gani, 1963; Haire, 1968; Mahoney,
1977). The stock and flow theory proposes that human resource systems of
organizations can be described in terms of stocks of human resources available
in various categories at a point in time. Variations within these groupings
are measured in terms of the flow of people from one category to another
through promotions, hires, resignations or terminations. Movement is
measured through . comparative analysis of the composition of each group at
two Points in time (111°, T-1); the statistical approach most often used in this
analysis is the Markov chain. For colleges and universities, standard stock
and flow models have obvious applicability ,When determining the rate of
movement among faculty ranks. The model, however, presents certain difficul-
ties when applied to the non-instructional staff, problems which result
primarily from its emphasis upon promotion or upward movement through a
hierarchical system.
A variation of the stock and flow model--the cohort flow model--provides
the flexibility needed in this study. This statistical technique models
personnel flows in terms of hiring, persistence rates and attrition by examining
a given cohort longitudinally through a specified period (Grinold and
Marshall, 1977; Hopkins and Massey, 1981). While the Markov chain method
most commonly used in stock and flow analysis requires less data than the
2jtj

41k
224
cohort flow model and gives an adequate depiction of staffing distribution
at a specific time, there is evidence that it is most effective when Cised.
for short-range forecasting during periods of relative stability in the
organization. The cohort flow model has been found to provide more accurate
projections for longer range forecasts and under less stable organizational
conditions (Marshall, 1973).
The theoretical approach of this study is further informed by the
statistical technique of renewal modelling which has particular relevance
for postsecondary education today. In the standard stock and flow models,
attrition and promotion flows are analyzed to predict expansion iu category
size. In effect these are "push" flows which tend to force the growth of
the organization. Renewal modelling takes into account the static situation
in which the growth rate is zero or negative. Since hiring or promotion can
only take place to fill vacancies, a "pull flow" is created. The analysis
is concerned with determining and projecting the attrition flow which may be
said to drive the system by creating the "pull" through which promotion or
hiring can occur (Bartholomew, 19730 Bartholomew and Forbes, 1979).
METHODOLOGY
The model employed in this study is cohort oriented, that is, it\,
examines the relevant characteristics of a group and traces that cohort year
by year into the future. The variables examined for each individual included
in the study are appointment type, date of hire, date of permanent appointment,
date and reason for termination of service, and date of birth. The model
uses probabilities based upon historical evidence to determine rates of
resignation, retirement, non-renewal, permanent appointment and hiring.
For purposes of this study, the critical population, the non-instructional
staff employees, was divided into three cohorts--non-teaching professional
(NTP), clerical and service/maintenance employees. These divisions were
based primarily on obvious distinctions in job responsibilities and contractual
provisions governing employment. The professional group is similAr to faculty
in that, when hired, they are granted a term appointment and are periodically
reviewed for renewal or termination of that appointment. At the beginning
of the seventh year of continuous service, the employee is advised of either
permanent appointment or termination. The terms and conditions of employment
for the clerical and service/maintenance groups are governed by New York State
Civil Service regulations and differ markedly from those which pertain to the
professional staff. within these groups, movement from probationary to
2:34:

225
permanent status occurs almost routinely and attrition through appointment
termination is relatively rare.
The data for this study were provided by the Personnel Data System, a
cornrehensive university-wide data base used for tracking personnel and
payroll information. It contains approximately 100 pieces of information
for each employee and has been maintained at our campus since 1976, thus
making it possible for us to create the historical file which was the basis
for this study. This historical file provided an account of each cchort's
characteristics and employment activities for the calendar years 1979, 1980
and 1981.
Professional Employees
Examinations of preliminary data immediately indicated that within the
professional (NTP) cohort two distinct subgroups could be identified:
(1) individuals with temporary appointments, and (2) individuals with
permanent appointments. The distinctions between these two groups centered
primarily around age and the rate and method of attrition. Table One
illustrates those differences.
TABLE ONE
AGE
ATTRITIONRATES
AGE AND ATTRITION DIFFERENCES
Permanent TemporaryAppointment» A intments
Mean 45 35
Median 44 32
Retirement variable 0.0%
Non-Renewal -- 2.6%Other Attrition 2.2% 9.0%
As might be expected, retirement is an age-dependent variable.
Temporary employees are hired at a relatively young age: as a result, they
become permanent employees, are not renewed or resign before retirement
becomes a critical factor. Due to the significant differences noted in
Table One, separate algorithms for projecting future employment levels
were developed for each group:
Permanent NTPs
NPY
= [71)Y-1
APB] - riPy + (NPY-1
(1.1)
NPy = total number of permanent NTPs at the end of the year y
2 3

226
Np = total number of permanent NTPs at end of the year y-1Y-1
AP = new permanent NTPs . . . a function of the number of
temporary NTPs eligible for permanent status
RP = total number of retirements (see Table Two)
rrP = attrition rate
Temporary NTPs
NT = (T . + HT:1 - + (NT ) nrT (NT }rA.] (1.2)Y Y-I Y Y Y-1 Y-1
NTy = total number of temporary NTPs at the end of year y
NT = total number of temporary NTPs at the end of yearY1 Y-1
HT = the number of new hires
nrT - non-renewal rate
rrT = resignation rate
The total number of NTPs employed in a given year is then simply the
sum of NP and NT.
Upon establishing our two algorithms, the first task became the
determination historical rates and levels for our variables. Tables
Two and Three present these rates and levels and describe how they were
obtained.
Table Four displays the nature and composition of our non-teaching
professionals should current policy be extended to the year 1964. These
projections ar= the results of equations (1.1) and (1.2), the rates and
levels are those bet forth in Tables TWO and Three
TABLE FOUR
NTP EMPLOYMENT LEVELS TO 1984
PERMANENT NTPs TEMPORARY NTPs
Other Total Other TotalRetirement Attrition Employees Non-Renewals Attrition Employees
1982 - 1 1 52 2 4 6 641983 1 59 6 58
1984 4 1 61 2 5 54
Several policy issues are raised by these projections. Among the most
obvious is the effect of the continuation of an extremely lenient policy on
the granting of permanent appointment, a policy which will result, within
two years, in a professional, cohort which has 0 majority of permanent
appointees. The implications of such a situation are clear in terms of
.?3je
1

227
salary costs, institutional flexibility in response to new program needs
or potential staffing reductions. Beyond these issues, there is a question
of the rigor and validity of an evaluation process which results in the
almost universal granting of lifetime appointment.
Clerical and Service/Maintenance Employees
The guidelines for the development of clerical and service/maintenance
models are essentially the same as for our non-teaching professional flow
model. Here, however, because of the nature of the conditions of employment,
the model becomes much less complicated. Management is extremely limited in
the kinds of actions it may take to manipulate flows within this group.
Essentially, once an individual has been hired, ,there is very little likeli-
hood that management will initiate actions to remove him from the ilyroll.
Attrition usually occurs through retirement and resignation, much 1 s
frequently through probation termination.
Two major cohorts, clerical and service/maintenance employees, were
identified within the general heading of classified employees. The primary
demographic difference between the two groups was age--for clerical empllyees,
the average age was 39, while for the service/maintenance staff, the average
age was 49. It was felt that this difference would make a significant impact
on retirement rates, therefore, the two groups were modelled separately.
The algorithm for both groups is:
N = ENY-1
+ H:i - + (NY-I
)r] (2.1)
LyNy = total number of employees at the end of year y
= total number of employees at the end of year y-1Y-1
H = total number of new hiresyR = total number of retirementsyrr1 = attrition rate (based on historical patterns includes all
attrition other than retirement)
Tables Five and Six present historical rates and levels for our
algorithm. Also included in these tables are descriptions of the procedures
used to obtain these rates and levels.
Table Seven displays'the employment levels of our clerical and service/
maintenance employees should current policy be extended. The projections
are results of equation (2.1), the rates and levels are those developed
in Tables Five and Six.
23.

1%1.1. 11:0
piafirevra Mime:Pi MR tre..vosr KW:. 1979-81
0 la du it len of--. -... 1979_ 191;0_ ,1281..-- - .111,:enrle ;l_ eaf e.-s
R,io K.ta] Ito. 3$ 3$ 49of Fem.- -f-f- 1limi1.
ng
- -- -- ---ina ot111 sit Nor
,e.
Vla 49 50I
t I I. eent a
-- -OtherAttrition --
2 0.0 2.6 4.1. .
2 12(13
4(4
ellitfl)e) elimih/o)
2 1 1----_ -Tv I ro- rot t re-
sent ages 4.ent der63,64 48
1 ..
228
,, 'SW d
ag... iflOMPO . 40.11.1M .. ..niushet of neu petroment Etr, is n Neel ion
of temporary M.4 elipahlw fur :web st4tom.1 .sent fat lv,lei et ori dm nindicate* that n11 thole fire eiated
'4I an re t !Wilt S 63.
Wan attritl.m rata. 2.22.
-----Beginning'total No. 81 83 69
of Teapn- niLT.:i . _
rary wire. yr. 03 69 66.. _ -- -- --
YAI1LE 1111iLE
HA.NP(61ER ACCOrXfS FOP. 11.11FORAKY $1:0s 1979-81
1979 1980 1981
Neu Hires
eh her*nett Ion
in ibeeallentAppu latmcsit
Derivation of Historical Rate,"
12 9 10 !lean number at new hires 10.3.- _
Roan ;171:i71-7.e Z 7;t7 WM--3 1 7
3.7 1.2 3.0SI 5 9 7
2 6.2 10.8 10.1.---__-__------__.2 13
The data indicates that non-renewal tends to<meet dart% the 5th wear of betviee.Mean attrition rat* 9..A.The data indtrat rs that "other attrition' tend*to peen/ AutinS the 4th year of stry Let:All those eligikie for permanent appointmentare gtanted such status.
TAISLE FIVE
11A1.147418 ACCOSKIS FOR SERVICE-MAINTENANCE EMPLOYEES 1979-8.1979 1980 1981 j Historical Rater
Total Fatployees Begin.Yr. 189 . 197 195
End of Yr. if 797 195 196
NEV
SIIIRIO
23 14 17 mean number of neu hires 18 .4
5
than age at ft-tips-cot 60 60 60 mean retirement age 60. - - -.-----..----..
AtIRIrfori ti 7 11 8
2 3.7: 5.62 4-12. --- ..--- ------------- mean attrition rate 4.5
Tot 61 Einp)
rAaLF. SIX
riAgrowkit AccourirS i'n* CI.FRICAL IMPLOYFFS 1979-81
19130 1901 Hl at or 1 cal Pate*
nyeeFeid of Yr.--.._ 191 187 162
187 182 ISO
NM 21 18 31 moan number of oiv hire.. 23...RI TIFFD 5 5 7
Wan sage at retirement 60 60 63 *ton tetirement age 61
AlIRIllati N 70 18 26
2 10.52 9.62 14.12 &ell/ at i ri t Ian rot m 11..
23J
--- ^- -

229
TABLE SEVEN
CLASSIFIED EMPLOYMENT LEVELS 1982-1984
CLERICAL SERVICE/MAINTENANCE
Other Other
Retirement -Attation- Total RetiteMent Atteition Total____...------
1982 8 21 174 20 9 185
1983 11 20 166 22 8 173
1984 4 19 166 20 8 163
This example shows that high retirement levels coupled with low hiring
rates will.tend to reduce the work force in these categories over the next
several years. Policy issues to be considered include a decision to increase
the traditional hiring rate to prevent depletion of these ranks, or a
determination that this natural attrition may be usel to offset potential
budget reductions.
CONCUISION
The examination of historical staffing patterns among specific employee
cohorts and the projection of these patterns establishes a quantifiable base
through which decisions on the handling of human resources can be formed.
The existence of a reliable system for recording and retrieving personnel
transactions--both current and historic--is critical to this process. The
reliability of the projections is significantly enhanced when the cohort
under study is traced for a multi-year period.
While cohort models tracing faculty flow are fairly common, there has
been relatively little application of these stock and flow techniques to
the study of non-instructional staffing patterns. Algorithms have been
tested in this study which are similar to those used for faculty models but
which eliminate consideration of the movement brought about by promotion in
rank and the granting of academic tenure. Analysis of the data revealed by
these algorithms enables administrators to consider for non-instructional
staff such issues as the natural attrition and replacement rates, compensa-
tion costs for a maturing work force and policy issues on the granting of
permanent appointment. Any of the variables may be manipulated to test the
results of changes in current personnel practices and policies.
The inclusion of projections on non-instructional staffing patterns in
human resource planning efforts adds to the comprehensiveness of the approach
23

230
and portrays more accurately the actual and projected configuration of the
work force. The result of this may be at least a partial refocusing of
administrative concern from one which concentrates exclusively on the
faculty cohort, to a more balanced and inclusive view of the commitment of
human resources in our academic institutions.
237

231
BIBLIOGRAPHY
Bartholomew, David J., Stochastic Models for Social Processes 12nd ed.),London: Wiley, 1973.
Bartholomew, David J. and Andrew F. Forbes, Statistical Techniques forManpower Planning, New York; John W. Wiley & Sons, 1979.
Bloomfield, Stefan, "Comprehensive Faculty Flow Analysis" in ApplyingAnalytic Methods to Planning and Management, ed. David S. P. Hopkinsand loger G. Schroeder, pp. 1-18, San Francisco: Jossey-Bass, 1977.
Gani, Joseph, "Formulae for Projecting Enrollment and Degrees Awarded inUniversities." Journal of the Royal Statistical Society, A 126,pp. 400-409, 1963.
Grinold, Richard and Kneale T. Marshall, Manpower Planning Models,New York: American Elsevier, 1977.
Haire, Mason, "An Approach to an Integrated Personnel Policy," IndustrialRelations, February, 1968.
Hedberg, M., "The Turnover of Labour in Industry, an Actuarial Study,"Acta Sociologica, 5, pp. 129-143, 1961.
Hopkins, David S. P., "Analysis of Faculty Appointment, Promotion andRetirement Policies," Higher Education, 3: 397-418, 1974.
Hopkins, David S. P. and Roger G. Schroeder, ed., Applying AnalyticMethods to Planning and Management, No. 17 in New Directions forInstitutional Research Series, San Francisco: Jossey-Bass, 1977.
Hopkins, David S. P. and William F. Massy, Planning Models for Collegesand Universities, Stanford, California: Stanford University Press,1981.
Mahoney, Thomas, G. T. Melkovich and N. Weiner, "A Stock and Flow Modelfor Improved Human Resource Measurement," Personnel, May-June,pf. 57-66, 1977.
Marshall, Kneale T , "A Comparison of Two Personnel Prediction Models,"Operations Research, 21: 810-22, 1973.
Oliver, Robert M., An Equilibrium Model of Faculty Appointments,Promotions and Quota Restrictions, Ford Foundation Project ResearchReport 69-10, Berkeley, California: President's Office, Universityof California, 1969.
Silcock, H., "The Phenomenon of Labour Turnover," Journal of the RoyalStatistical Society, A-117, pp. 429-440, 1954.
Young, A. and G. Almond, "Predicting Distribution of Staff," ComputerJournal, 3, pp. 246-250, 1961.
23,s

Developing a Composite of Institutional Reputationand Assessing its Impact upon Selected Student Behaviors
John P. MandrykOffice of Institutional Research
State University College at New Paltz
Introduction
New Paltz College is a four year, state operated postsecondary insti-
tution, awarding bachelors and masters degrees in Education, the Fine and
Performing Arts and the Liberal Arts and Sciences. During the late 1970's
the college experienced a precipitous decline in headcount enrollments,
from a reported 8892 in 1975 to a level of 6747 in 1978; all projections
indicated continual and gradual decline. Thi; decline did not appear
to be the function of declining college bound populations within the
college's feeder regions but rather, attributed to a complex net of immed-
iate institutional and student population behaviors. Since 1978, the
institution has continually increased the size and quality of the student
population. The Fall 1982 enrollment approached 7500 headcount students,
with the mean high school average of the recent entering class approx-
imately five percentage points higher than those entering in 1978.. This
reversal in enrollment was the function of an institutional-wide effort to
identify institutional weaknesses associated with enrollment behavior, and
to strategically ani immediately modify the institution where enrollment
would be most effected.
Since resources were not unlimited, it was critical that existing
resources be allocated and reallocated to activities which would effect-
ively contribute to positive enrollment outcomes, As such, each program-
matic decision would require justification on the basis of information
that might substantiate effectiveness. It thus became a college-wide
effort to examine the role which the following had upon the dynamics of
enrollment:
(1) Academic program mix
(2) Relative position in the competitive market place(3) Sources of information students use in learning
about colleges and quality of information thereof(4) College characteristics perceived as desireable and
undesireable(5) Admissions activities(6) Institutional reputation
23,E
232

233
This paper will present an approach to assessing the role of an
institutional reputation within the dynamics of enrollment. Specifically,
the purposes of this paper are:
(1) To present an approach to identifying indicators forestablishing a comprehensive composite of a post-secondary institution's reputation
(2) To share the data collection instrument and datagathering experiences of one public postsecondaryinstitution
(3) To present a methodology for establishing and pre-senting the relative presence of institutional rep-utational indicators
(4) To present a methodology for establishing and pre-.senting competitive advantages and disadvantagesevident within the institutional reputation
(5) To present a methodology for establishing and pre-senting the association of reputational indicatorswithin selected student behaviors
(6) To present a methodology for illustrating themarket posture of the institution to variousaudiences.
1. Developing a Composite of Institutional Reputation
Initially, a formal committee was established to identify reputational
images that might contribute to student application and persistance behaviors.
This committee, designated as an institutional research advisory committee,
was representative of a broad segment of the college community.
Individuals participating in the advisory committee represented the
following specific college constitutiencies:
Orientation and Advising OfficeFreshmen and Transfer Admissions OfficeCollege Relations and Public Affairs OfficeStudent Affairs OfficeInstitutional Research OfficeFaculty GovernmentFinancial Aid Off:LeStudent GovernmentPresidents Office
The research advisory group met weekly through the spring semester of
1979. During that time literally hundreds of hypothetical college repu-
tations were scenarioed. Two items became evident (a) there was 30 single
item which could satisfactorly measure reputation and (b) there were more
reputational items generated by the committee than could reasonably be
u
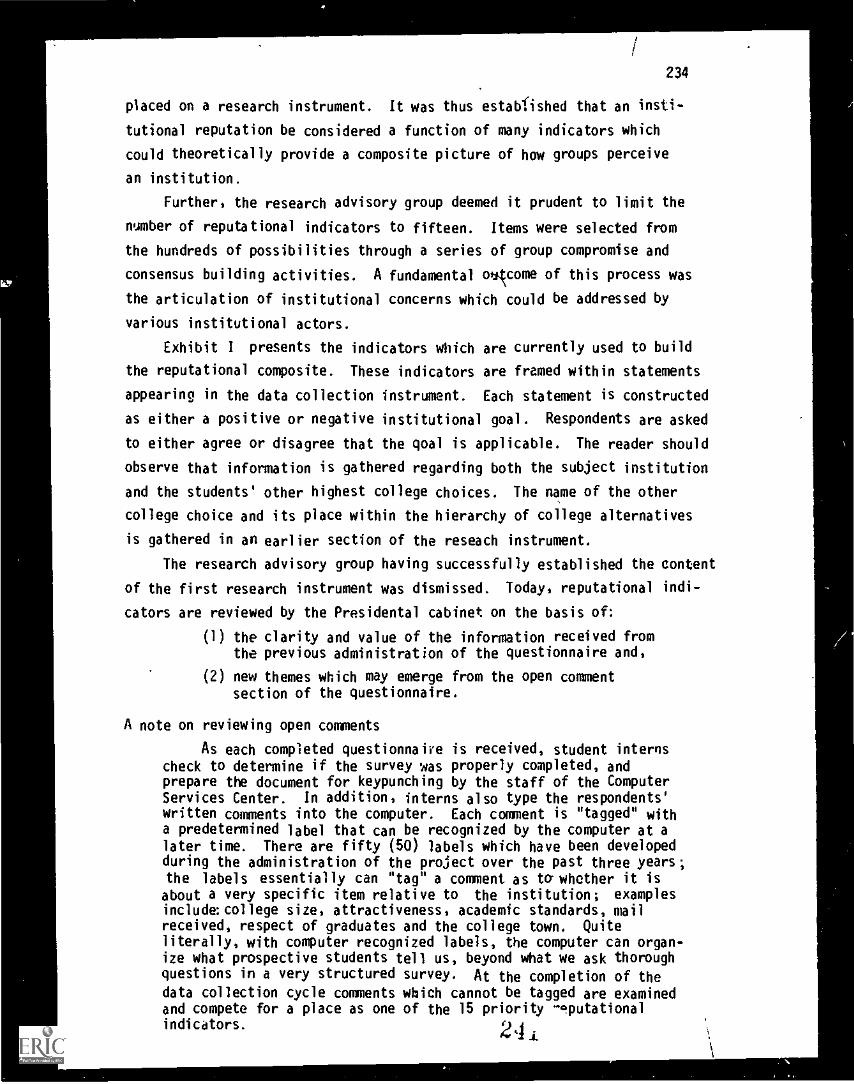
234
placed on a research instrument. It was thus established that an insti-
tutional reputation be considered a function of many indicators which
could theoretically provide a composite picture of how groups perceive
an institution.
Further, the research advisory group deemed it prudent to limit the
number of reputational indicators to fifteen. Items were selected from
the hundreds of possibilities through a series of group compromise and
consensus building activities. A fundamental oucome of this process was
the articulation of institutional concerns which could be addressed by
various institutional actors.
Exhibit I presents the indicators which are currently used to build
the reputational composite. These indicators are framed within statements
appearing in the data collection instrument. Each statement is constructed
as either a positive or negative institutional goal. Respondents are asked
to either agree or disagree that the goal is applicable. The reader should
observe that information is gathered regarding both the subject institution
and the students' other highest college choices. The name of the other
college choice and its place within the hierarchy of college alternatives
is gathered in an earlier section of the reseach instrument.
The research advisory group having successfully established the content
of the first research instrument was dismissed. Today, reputational indi-
cators are reviewed by the Presidental cabinet on the basis of:
(I) the clarity and value of the information received fromthe previous administration of the questionnaire and,
(2) new themes which may emerge from the open commentsection of the questionnaire.
A note on reviewing open comments
As each completed questionnaire is received, student internscheck to determine if the survey was properly completed, andprepare the document for keypunching by the staff of the ComputerServices Center. In addition, interns also type the respondents'written comments into the computer. Each comment is "tagged" witha predetermined label that can be recognized by the computer at alater time. There are fifty (50) labels which have been developedduring the administration of the project over the past three years;the labels essentially can "tag" a comment as to whether it isabout a very specific item relative to the institution; examplesinclude:college size, attractiveness, academic standards, mailreceived, respect of graduates and the college town. Quiteliterally, with computer recognized labels, the computer can organ-ize what prospective students tell us, beyond what we ask thoroughquestions in a very structured survey. At the completion of thedata collection cycle comments which cannot be tagged are examinedand compete for a place as one of the 15 priority -,putationalindicators. 241

235
II. Data Gathering Experiences
There are four selected student groups that have been established for
sampling. They are:
(1) No Show Acceptances(2) New Entrants(3) Currently Enrolled Undergraduates(4) Alumni
Information for both the no shag acceptances and the new entrants is obtained
during the institution's annual survey of a sample of accepted applicants.
Currently enrolled undergraduates are sampled in the spring of each semester.
The reputational indicators accompany an annual survey of student opinions
about the college. Finally, repntational indicators accompany an annual sur-
vey of alumni who graduated from tie college one, five, ten, and fifteen
years ago. It thus becomes possible to establish differences in reputation
from prospective, current and past students.
New Entrant Data Gathering
Approximately 20 percent or 1,00D accepted applicant students are
selected for purposes of surveying. Each selected student receives a letter
from the President requesting participation in the research project, a
questionnaire, and a self-addressed stamped envelope. If a participant has
not returned the questionnaire in five %e.iks, a follow-up letter from the
Director of Institutional Research and a different colored questionnaire
is mailed to the participant. Experience demonstrates that this method of
data collectionprovides a response rate of approximately 35 percent.
This is viewed as particularly good considering that the majority of the
respondents will have chosen to attend other postsecondary institutions.
Accomodating for Sample Bias
Before statistical analysis or the jata< examinations are performed
to determine if the returns are representative of the population. Tests
are conducted to determine if the sample biased by geographic market
segment and by en,-olling behavior of the Itx,:pted applicant population.
The data collection experiences of 1979, 1:3), and 1981 have demonstrated
that large sampling differences occur when the same population is viewed
by attendance behavior. Data collection efforts result in larger propor-
tions of attending applicants then is evident in observed data.
With the sample biased in terms of accepted applicant enrollment
behavior, it becomes necessary to appropriately modify the data, such
that the distribution of the sample population mimics the distribution
242

236
of the observed population. Tie sample distribution is weighted through the
use of the weighting option available in the Statistical Package of the
Social Sciences.
Similar data gathering efforts are in practice for obtaining current
and past student attitudes. Approximately 1,000 currently enrolled under-
graduates are surveyed annually; this population has a 40 percent response
rate. The population of alumni from the classes of one, five, ten, and
fifteen years ago are surveyed, they also bear an approximately 40 percent
response rate.
III. Market Penetration and Competitive Advantage
Having established a data base, we may now proceed with analysis. The
first item of interest is to determine the hierarchical dominance of one
reputational indicator over another. Specifically, we may examine the data
to determine the relative awareness which the sampled population has regard-
ing each indicator. This can be expressed in terms of the simple percentage
of respondents who indicated agreement or disagreement with the item. Re-
spondents are provided with the opportunity to claim that they do not have
an opinion. We may thus rank order the variablesaccording to the extent
to which opinions are expressed.
Operationally, the percentage of respondents expressing an opinion may
serve as a definition of market penetration. Since demographic data on the
repondents is collected, we may disaggregaZe the total sample into selected
categories. It is a practice to present the variations of opinions by
geographic market segment and by the student high school average of entering
freshmen, and by the category of student surveyed. The possibilities for
disaggregated views of the data are limited only by the demographic charac-
teristics collected and associated with each respondent record, and by
the size and bias associated with the various demographic cells of the
sample. To provide for very specific analysis, it is recommended that the
survey data be merged and linked to admissions files, and that the sample
be large, stratified by predetermined demographic variables, and random.
Our experience to date indicates that such preventative techniques gener-
ally provide for a sample richness that can address most Ad Hoc levels
of institutional concern.
2 4 j
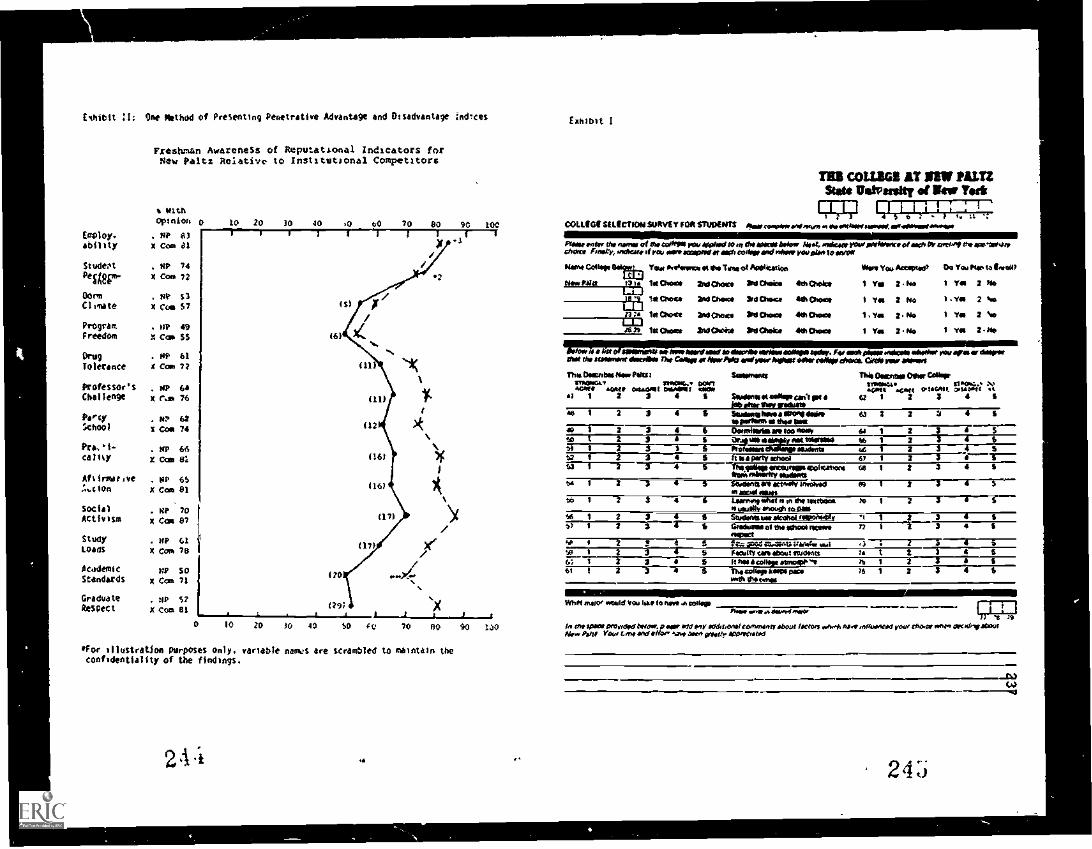
£ %hie It :1: One Wath05 of Presenting Penetrative Advantage and Disadvantage :1141,CeS
Txtshman AwareneSs of Reputatsonal Indicators forNew Paltz Relative to Institutional Competitors
With01) to ion
Employ . NP 63ability x Cos al
Student . NP 74NAN"-Norm . NV s3Climate x cos 57
x Con 72
PrOgT40. NP 49Freedom 2 Can SS
Drug . lIP 61Tolerance X Com 7?
Professor's . MP 60Challenge x rom 76
Poesy. N. 62
School x tom 74
Pre,'i. . LIP 66C511Ly
Aft bast Ave
SocialActivism
StudyL04 di
x Oho 8
. NP 61X ton el
. NP 70X Can 37
. NP 61X Con 78
Academic RP SOStandards x Con 71
Graduate . NP 52ReSpeCt z cos et
0 10 20 30 40 0 44r- 1
(51
(20
(?9)A
0 10 20 30 40 10 70 80 90 130I
Exhibit
TRICOLUIGEATIMMLIZStatellavassitust/igortlift
1:17-33 .4./96 v a.70 80 90 100 COLLEGE SELECTION SURVEY FOR STUDENTSr I r Mmativnanrenaon N eioawanomavatmaarovws...aimi
- 3 PONoontor nom oi PAWN rovrOolimisove de Nam 00e.. Ala, new thew weever, ol see iv amide th appNraxchew Fragy, Nakao of wt., wan azspfte asi* 00811101e14,Wor V4VDIM 11,014W
Maya CollaNN witru Ten mvonviva at *a Tens of Poilikmian Om* You Pee ate Oo Tao Fran to En eat42
Now Pile tp i in Ova* NalChowa 3rd Gays 46Chake Ys 2 Ns 1 To 2 No
200 Chao 20Care RA Own 1 Yas 2 No 1. v.. 2 *4crew:6 10 Chaet 2a0Cheas WV Cheat 41hChowe 1. Ws I No 1 Wu 2 Nt)
----------42L *Chasm 261111wiot WV Choice 41hChowe TM 2 No 1 v4a I Ma=2WITIIIIMrstsoma* se Matiesen1 MAa.e11Wlhme mo teeipmeter. far net Owe aeleme alaNhe vas Vet r &elm01rffi,u,twriatd eeelliv rim Cache. ex PewPele exIpearemegg saw eel* dote 131Ws rum Nowa
)t
)f
)t
The Omaha No.P.1011Toomey441174 416%74 0440x11
61 1 2 370047117
4akaas
S
fasowasalt
316.744111144aellop coal pilab Owe Ow wwlow
11.1 Gamow, Gear Colbyiraws 7104164.Katt 644i 4166/714. 01$63/70
t 2 3 4
17.1
5
a) 1 2 3 4 S Sambas Imo a Nwow4Isdeewham as Rae sae
63 1 2 b 4 5
3 4 6 Genalwiw me lab Wm. 0 1 2 3 6 St 2 3 a s or4imiasomoir aft would W. 1 2 3 4 5
$1 i 2 3 1 5 Proton.. mama . 1 2 3 4 S2 Napes ny Wax. 67
(41
1 2 3a4
S53 4 5 olls. mamas woheabxefhis
tiv*am nanar swimsis 1 2 3 Saone am aeleate linolvad
awal wow.9 9 2 3 4 S
lb 1 3 3 4 S talreveahe a m da teatimea wrath owah 76070
10 1 2 3 a
is 1 2 3 S Nadeau uw NNW tairoaably 1 1 2 3 4 5si 1 2 6 Gnaw. a1 thasehool nowt
meanit 1 3 4 5
t r wefato wwi .3 1 2 3 4 Stit 5 math on Maui mows to t3_ a
3It alma Wiese itam0.-,
114 =hap am. moorah den oast
76m 1
22
a3
aa
S561 1 2
X
'Far illustratloo purposes only, variable nas are scrambled to maintain theconfidentiality of the findings.
*6
1=IIM=MrVAN nap, +mild vox, Oat 15 has .45 03141P
law aa a a tliaaa awayemMIPIPM1M ...1 f
17 Itin intwowNormal Wow. pairNee pryakkamateerarane About lariat via.* M.* akaaaal you/ thaw**, at da MawNew Phu Yom teat au! effea varzara owastr avaa...tas
ta.)(Pa
24 t)e.

238
Maryei:?enetration
' In the absence of comparable national, regional, or sectoral norms,
we,are required to generate comparable data. This is accomplished by
requesting those surveyed, to simultaneously rate the subject institution
and their highest other college choices. The results of this technique
are egcouraging. While students most often do not, or cannot, make cow
prehehive comparisons :),etween institutions, they generally are able to
make jupegEnts about their primary college choice. That is, we can at
leas expect respondents to rate tr4 college they plan to attend. Thus,
data an be generated for competitive institutions by those sampled who
Wil be attending elsewhere; and generated for the subject college by
_hose sampled who will be attending the subject college.
We may now establish a market penetration index for: each
ind;cator for both the subject institution and for those institutions with
which it competes. Operationally, the difference between the two indicators
can be defined as the penetrative advantage index, where positive; or
disadvantage,where negative. Exhibit rI. provi'es one approach to present-
in,such data for executive level consideration. Experience, thus far,
has demonstrated that the penetrative advantage or disadvantage most
successfully describes the position of the institution within the compet-
itive market place. That is, the data now provides descriptive and
evaluative information.
The 6opetitive Advantage
As indicated earlier, the technique requires respondents to indicate
levels of agreement or disagreement with various statements regarding the
subject college and the highest other college choice. Of those eXpressing
an opinion, the percentage providing a positive reaction to the reputational
indicator respresents the favorabilF:1 score. Operationally, then, we can
define the competitive advantage as: the difference between the favorability
scores of each indicator for the subject college and the competitive colleges.
One method of presenting the competitive advantage is presented la exhibit
III. By observation, repuotional indicators with relative competitive
advantages are easily distinguishable from those with disadvantages. Again,
with respect to experi,Ince, the difference between each score is of prime
importance when establishing the posture of the competitive advantage within
the competitive market place.
24d
*NI

239
IV Reputation and its Association with Student Behaviors
laving established the penetrative, and competitive advantages and dis- .
advantages we now turn to associating the presence and quality of the rep-
utation with selected student behaviors. Examples of such behaviors include:
(1) Enrolling by accepted applicants12) Persisting by Undergraduate students(3) Contributing by Alumni
We will employ the first selected behavior as an example in executing
one techbiquefor associating reputation with behavior.
As previously indicated, we may divide the responses of sampled partic-
ipants into dichotmous variables: (1) those who had favOrable opinions, and
(2) those who had unfavorable opinions; those with no opinions are considered
and treated as missing information. Further, since the survey data also is
accompanied ".lith enrollment decision information, we may associate each
response with the dichotomous.behavior of enrolling°or not enrolling.
Thus, by crosstabulating each variabl by the student behavior, the
researcher may determine whether major fferences exist for each reputa-
tional indicator between the groups who choose to enroll and the group
who choose not to enroll. The chi square test of statistical significance
may be used to test for significant,associations between attitudes and
behavior.
Exhibit III presents one method of demonstrating the relative assoc-
iation which favorab;e and unfavorable responses have upon the yield behavior
of accepted applicants, and the significance thereof. This same technique
can be applied to the earlier suggested behaviors,persistance and contri-
butions, by associating such behavior with the reputational indicators.
Other statistica' treatments of the data are executed, including the
use of 'multiple regression to establish the relative impact which each of
the variab1ds have upon the student behavior. It has been our experience
thus far, however, that the simpler treatments of the data are more
effective for briefing executive level audiences.
Having established these reputational profiles and their association
with student behavior, it becomes the researchers objective to communicate
such findings so. that appropriate institutional initiatives result Exper-
ience has suggested that providing a quartered matrix which crosstabulates
penetrative advantage by competitive advantage is most effective for exe-
cuting briefings (see exhibit IV).
24-7

Eshib't 111 One Method of forst...n(10g Competiti.4 Advantage and DiSadvantoge Indices
Freshman ravorability Scores on Reputational indicatorsfor New Paltx Relative to Institutional Competition
Employ-ability
StudentPerform: me
Favorable
. 4. 9:x con 8S
NP 94x tom 91
0 10 :9 30 40 SC 60 70 80 90 100
.6
.1
00F14 NP 92Ciliate x 92 (.3)
Program . NP 89Freedom X coo 91 (1)X
Drug . NP 87Tolerance ,x Com 92 (6) 1 X
Professors . HP 83Challenge x Can 90 (7)f X
Party . HP 81School x tar 94 (13
Practi- XP 68cality x Con 91 (23)
Affirmative
Action. HP 69x Coo 97
(27)
SocialActivism
. MP 27X con SS (28) x
Studytoad%
. HP 60X Com 90
AcademicStandards
. NP 29
X Cow 73(34)
GraduateRespect
. HP IS
x Can S9(44)
0 10 20 30 50 60 70 80 90 100
For illustration purposes only. variable 'mem% are scrambled to maintain theconfidentiality of the findings.
rl 44 .f
Exhibit 11, One Method of Presenting the Relative Association hiCh FavOrable andlinfavereisfe-ResponseS have upon Yield
Freshman Yield Rates Associated with Favorableand Unfavorable Scores on Reputational Indicators
YieldRate
Employ- . Fay. 37
ability x not fay 4S
Student . ray 32
Performance x not fav 36
Dorm . rev. 30Climate X not fay 33
10 20 30 40 SO 60 70 80 90 1:0
Program rev. 33
Freedom x not fav 27,
Drug . Fay. 34
Tolerance (not fav 27
ProfesSor% rev. 31
Challenge 4 not fay 24
Party . ray. 32
School X not fav 19
Practi-cality
rev. 36X not fiv 23
Affirmative ray. 33X not fe0 16
Social . ray. 3S
Activism x not fay 20
Study . ray. 39
Loads X not fey 18
Academic . rev. 56
Standard% v not fey 22
Graduate . rev. 61
Respect x not fav 22
.13
.17 Yes
.7Yas
22 Yes
34 Yes
39 Yes
3 10 20 30 40 SO 60 70 80 90 100
rar illustration purposes Only, variable names are scrambled to maintain theconfidentiality of the findings.
2 4tli

IMPROVING FACULTY USE OF STUDENT OUTCOMES INFORMATION
Sidney S. Micek, Ph.D.Division of Educational Development,
Counseling, and Administrative StudiesSchool of Education, Syracuse University
Syracuse, New York
INTRODUCTION
Demands for accountability, improved productivity, increased educational
quality, and better information for students reinforce the need for colleges
to better document and understand student outcomes. Furthermore, the need
for better information about student outcomes to enhance student development
and improve institutional planning and management has been documented in
Ps tin's research about institutional impacts on student development (1976
and 1977); in Bowen's (1977) valuable work assessing the returns of individual
and societal investments in the postsecondary-education process; and in the
developmental research by Clark, Hartnett, and Baird (1977) concerning the
use of multiple criteria for assessing the quality of educational programs.
To obtain the student outcomes information required to respond to many
internal and external demands, institutions usually conduct some type of
student survey in which student goals, plans, activities, and attitudes are
documented and the _Impact of programs are assessed. However, all too often
the information obtained through such efforts is given only superficial
attention by persons most central in the educational process - the faculty.
Why is this the case?
One reason is that student outcomes studies and their application often
are focused almost entirely on administrative issues and uses. Consequently
241
25o

242
such studies are oriented to institution-wide concerns as opposed to depart-
mental concerns and thus are of limited interest and use to faculty in
their planning and decision-makino activities. A second reason is that
faculty generally have little, if any, involvement in planning for and
commitment to the outcomes studios and thus do not take ownership of the
study results. A third reason centers on the fact that outcomes study
results frequently are not analyzed and presented in ways faculty can use
them. Finally, survey directors sometimes do not fully grasp their role
as change agents in helping faculty obtain and use studentrtcomes infor-
mation.
The need to correct this situation is based on the assumption that
student outcomes information is critical to improving the performance and
decisionsof faculty in program planning and in the teaching/learning process.
As Hartnett (1974) points out, in many ways, the need for such information
is analogous to the need of the painter, the musician or the performing
artist for feedback - or what learning psychologists call "knowledge of
results" (Micek and Arney, 1973).
Although many college-wide student outcomes questionnaires have been
designed to generate information of use to faculty, getting faculty to make
effective use of the information obtained has remained a problem. As a
consequence, the overarching question addressed in this study was how to
improve faculty commitment to and use of student questionnaire data collected
on an institution-wide basis.
BACKGROUND INFORMATION FOR THE STUDY
In thinking about how to answer the major study question, consideration
was given to what is known from the theoretical research literature concern-
ing information use and what has been learned from practical experiences.
25

243
From this literature base, three major underlying factors appear to influence
information use by managers: (1) the organization loc-,tion of the informa-
tion provider, (2) the methodological procedures used to gather and analyze
the data, and (3) the decision-making context (Weeks, 1980). Furthermore,
literature concerning student and/or worker participation in the decision-
making process suggests that when participation is viewed as a legitimate
activity, productivity and satisfaction increases (Mica, 1974; Davis, 1972;
and Blumberg, 1969). Finally, insights about how to improve faculty infor-
mation use are gained from the "advance organizer" concept described in
Ausubel's (1967) theory of school learning. Advance organizers provide an
individual involved in learning with sorting and classifying models. Such
models draw upon and mobilize concepts in one's cognitive structure which
are relevant for and play an assimilating role relative to new learning
material. In the context of this study, the individual is the faculty mem-
ber, the new learning material is the available student outcomes information,
and the advance organizer is the process of involving faculty members ;n
developing and implementing a schema for identifying and sorting needed
student outcomes information.
From personal experience, it has been observed that when individuals
are activEly involved in the creation of survey instruments and procedures,
they tend to become more committed and are more willing to make effective
use of the results. However, all too often when institutions initiate a
college-wide student survey, especially when standardized questionnaires
are used, the opportunities for faculty to gain some "ownership" of the
instruments and processes are practically nonexistant. Therefore, their
commitment to and willingness to use the information provided is greatly
hampered. As mentioned, how to correct this situation was the focus of
this study.
254.

244
The importance of this study also is based on the paucity of empirical
literature regarding the use of evaluative research information, i.e.,
information gathered for decision-oriented inquiries as opposed to conclusion-
oriented inquiries. Three important studies have focused on the use of
program evaluation findings, specifically, Weeks, 1978; Patton and Associates,
1977; and Alkin and Associates, 1974. Also a larger number of studies have
examined the use of applied social research (Weiss, 1977; Caplan, 1976,
1977a, and 1977b; and Van deVall, Bolas, and Kank, 1976).
While limited attention has been given to empirical research on the
use of evaluative information in program decision-making, an abundance of
nonempirical literature exists in this area. This literature consists
mainly of prescriptive uses or speculations by academics and practitioners
about why evaluation results are seldom used (Weeks, 1978). In short, the
lack of empirical literature on evaluation utilization supports the need
to examine ways for improving faculty commitment to and use of student
outcomes information ottained from survey questionnaires.
STUDY METHODOLOGY
Study Design
To accomplish the study's research objectives, an experimental group-
control group, post test only design was employed. The design was imple-
mented by selecting two groups of faculty, a participants (experimental)
group and a nonparticipants (control} group, within two different collegiate
institutions, a four-year college and a two-year college. Those faculty
in the participants group participated by (1) identifying the student infor-
mation needed for their decision-making responsibilities, (2) helping
develop a pool of questionnaire items for obtaining the needed student in-
formation, and (3) organizing the items into a "mini-questionnaire" format
2 5 t)

245
that could be attached to the appropriate standardized questionnaire.*
Faculty in the nonparticipants group did not participate in these three
activities.
Following the administration of the selected standardized question-
naires, which were accompanied by the "mini-questionnaire," the results of
the surveys were analyzed and summary reports were written. The respective
summary reports then were distributed to the faculty in both the participants
and nonparticipants groups for their review and use. Subsequently, inter-
views were conducted with each faculty member in the two groups at each
institution to determine their commitment to and use of the'student outcomes
information.
Selection of the Participants and Nonparticipants Groups
The chief academic officer at both colleges served as the study liaison.
Each was instrumental in assisting the study director select two comparable
groups of faculty at their institutions.
While a participants group and a nonparticipants group were selected at
each institution, the process of selection within each institution varied
somewhat because of differences in organizational structure, communication
channels, and forces impacting each institution at the time of the study.
As a result, the selection of the two faculty groups at the four -year college
was accomplished by randomly assigning each of the seven academic departments
to one of two groups. Consequently, the participants group at the four-year
college was composed of faculty from three departments and the nonpartici-
pants group was composed of faculty from the other four departments.
At the two-year college, the chief academic officer was interested in
having faculty participate from each of the campus' four divisions.
*Standardized questionnaires used in the study were selected from theset of student outcomes questionnaires jointly developed by the CollegeBoard and the National renter for Higher Education Management Systems(Gray, et al, 1979).
25

2'6
Consequently, faculty who represented a cross section of the divisions were
randomly selected for the participants group. While the researcher expressed
some concern about participating faculty in a division talking about the
"treatment" with nonparticipating faculty in the same division, the chief
academic officer emphasized that such contamination would be very minimal
because of the size of each division as well as the independent nature of
individual faculty.
Instrumentation and Data Collection
The interview schedule developed to help answer the study's major
research question consisted of three sets of questions. The first set of
questions asked the interviewees to indicate how useful the survey results
would be (1) to them personally in carrying out their decision-making
responsibilities, (2) to their department, and (3) to the college, as a
whole. Those responding "very useful" or "somewhat useful" also were asked
to explain how the results would be useful.
Following this set of questions, each interviewee was asked to indicate
how useful the results of student questionnaire surveys were in general.
Again, they were asked to explain their answer if they gave one of the two
responses described above.
The final set of questions in the interview schedule was directed to
only those faculty in the participants group. These questions focused on
(1) the value of having an opportunity to participate in the development
of the local items, (2) ways their participation could have been improved,
and (3) how the overall surveys could have been improved. Generally, the
interviews lasted one-half hour.
A total of 55 faculty were interviewed in the study. At the four-
year college, a total of 32 faculty were interviewed, 13 faculty were from
25u
re;-4-re

247
the participants group and 19 were from the nonparticipants group. At the
two-year college, 24 faculty interviews were conducted, nine from the
participants group and 15 from the nonparticipants group.
Analysis of the Faculty Interview Data
As noted, the study design established a participants (experimental)
group and a nonparticipants (control) group at each college. The data gen-
erated by the interview schedule were in two forms: (1) nominal data - data
from the response categories regarding perceived usefulness of the survey
information, and (2) anecdotal data - qualitative data produced by responses
to the open-ended questions in the interview. Consequently, two types of
analysis were required. First, the chi square statistical test was employed
to examine whether participants differed from nonparticipants in perceived
usefulness of the student information for them, for their department, and
for the total college. Second, a content analysis technique was used for
examining the responses of faculty to the open-ended questions. This analy-
sis consisted of reviewing each response and then developing content
categories that would help in understanding the nature of their qualitative
responses.
RESULTS AND DISCUSSION
Will faculty, who participate (a) in determining their own student-
outcomes information needs and (b) in developing locally-specific question-
naire items be significantly more interested in and make significantly
more use of such information than faculty who only receive survey results?
The intent of this section is to provide some answer to this question. In
addition, faculty perceptions about the general usefulness of questionnaire
surveys are described. Finally, a summary of practical suggestions from
the "participants" group about the value of participating in the survey

248
development process and ways to improve faculty participation in that
process is presented.
Each interviewee was asked at the beginning of each interview whether
he/she had received a copy of the summary report. In all instances, the
answer was "yes." Subsequently, ,interviewees were asked if they had read
the report. Those who answered in the affirmative were then asked a series
of questions:
1. How useful do you think the results of the survey(s) will beto you in carrying out your responsibilities at (name ofthe college)?
2. How useful do you think the results of the survey(s) will beto your department?
3. How useful do you think the results of the survey(s) will beto the college, as a whole?
The responses to each of these three questions were placed in one of
four categories: very useful, somewhat useful, not useful, and can't say.
,
The results of the chi square 0(2) analyses that were conducted to
make comparisons between the Participants and nonparticipants groups are
summarized in Table I. Examination of these results indicate that when
Table 1
Summary of X2 Analyses Used to Compare Participants and NonparticipantsPerceptions of Usefulness of Student Survey Results
Two-Year College Four-Year College Colleges Combined
Useful toYOU
X2 = 3.289df 2 3
Xz= 4.279
df = 3Xz= 8.295*
df = 3
Useful toYOUR OEPARTHENT
Xz
= 1.576df a 3
Xz
2 10.855*df 2 3
X2 = 12.094*df 2 3
Useful toTHE COLLEGEWiralille-
Xz
= 5.65df 2 3
X2
2 2.165df 2 3
X a 7.101I df * 3
II
* Sifnificant at .05 level of confidence.
25;

249
the responses of the groups at both colleges were combined, a significantly
higher proportion of the faculty in the participants groups perceived the
survey results tu be useful for their own use and for their department than
did faculty in the nonparticipants group. This also was true regarding the
comparison between the participants and nonparticipants groups in the
four-year college with respect to usefulness of the survey results to their
departments. It also is interesting to note that none of the X2 analyses
regarding the usefulness of ;. 'vey results at the college-wide level were
significant.
With respect to the ways faculty see the survey results being useful,
it can be concluded from the content analysis of expectency remarks that
they view the information to be most useful for (1) course/program planning
and development; (2) gaining a better understanding of students' needs,
status, decision, satisfactions, plans, and activities; (3) recruiting and
marketing; (4) verifying hearsay; and, (5) improving relations both within
and outside the department and/or college. Furthermore, the responses
suggest that faculty, in general, tend to have a better notion about the
usefulness of student-survey information at the department and college-wide
levels than the usefulness of such information for their own responsibilities.
`From the responses to the question concerning faculty opinion about
the usefulness of student-questionnaire survey results in general, it appears
that faculty are generally positive about the utility of such information.
Many faculti pointed out, however, that the usefulness of the information
is greatly dependent upon the adequacy of the study design and the way the
study procedures are implemented.
The faculty participation processes, which weredeveloped at each of the
colleges involves' in the study, were tailored to meet the unique organiza-
tional structure and the special study questions of interest at each of the
ti
25o

250
colleges. However, the comments of the faculty in the participants grouPs
indicate that the opportunity to participate in the survey development
process is a valued experience. Based on their statements about why the
opportunity to participate is valuable, it can be said that in general,
the participation process provides faculty with a chance to get involved in
an institution-wide activity and to develop an "ownership" of the survey
processes and results. In addition, it allows them to think about how
they will use the results before they are reported back to them. As far
as ways to improve faculty participation, it is important that an effort
be made to keep faculty informed about the status of the project throughout.
In short, the more frequent the contact Wth faculty, the more likely they
will own the survey process and make use of the survey results.
Finally, it can be said that faculty in both the participants and
nonparticipants groups viewed the overall study as "eneficial to their
college. However, if faculty are to improve their commitment to and use
of survey results, it is important to identify ways to improve the response
rate to the questionnaire and to provide the survey results in a more
program specific form.
2jj
1

251
SELECTED REFERENCES
Alkin, M.C., et al., Evaluation and Decision Making: VII Experience.CSE Monograph Series and Evaluation, No. 4 Los Angeles: tenter forthe Study of Evaluation, University of California at Los Angeles, 1974.
Ausubel, D.P., "A Cognitive-Structure Theory of School Learning." In
L. Siegel (ed.) Instruction: Some Contemporary Viewpoints. SanFrancisco: Chandler Publishing Co., 1967, 207-260.
Blumberg, P. Industrial Democrat : The Sociology of ParticipLAon.New York: Schocken Boo s, Inc., 196 .
Caplan, N. "Factors Associated With Knowledge Use Among Federal Executives."Policy Studies, IV: 229-234, 1976.
Cdplan, N. "A Minimum Set of Conditions Necessary for the Utilization ofSocial Science Knowledge and Policy Formulation at the National Level."In C.H. Weiss (ed.), Using Social Research in Public Policy Making.Lexington, Massachusetts: Lexington, 1977a.
Caplan, N. "Social Research and National Policy: What Gets Used, By Whom,For What Purposes, and With What Effect." In M. Guttentag (ed.),Evaluation Studies Review Annual; Vol. 2, Beverly Hills, California:Sage, 1977b.
Davis, W., Student on
Attitude and 7cUniversity of Michigan, 1971.
Gray, R.G., et al., Student-Outcomes Questionnaires: An ImplementationHandbook. Boulder, Colorado: National Center for Higher -MarionManagement Systems, 1979.
Micek, S.S., Knowledge of Behavioral Objectives: The Effects On Student
Learnin . Unpublished doctoral dissertation, University of Washington,9 4.
Micek, S.S. and Arney, W.R. Outcomes-Oriented Planning in Hi her Education:An Approach or an Impossibility. Boulder, CO: National Center forHigher Education Management Systems, 1973.
Patton, M.Q., et al., "In Search of Impact: An Analyses of the Utilizationof Federal Health Evaluation Research." In C.H. Weiss (ed.), Using.Social Research in Public Policy Making. Lexington, Massachusetts:Lexington, 1977.
Van deVall, M., et al., "Applied Social Research in Industrial Organizations:An Evaluation of Function, Theory, and Methods." Journal of AppliedBehavioral Science, 12. 158-177, 1976.
Weeks, E.D., The Managerial Uses of Evaluation Findings. A paper presented
at the annual meeting of the Evaluation of Research Society, Washington,D.C., November 2-4, 1978.
.213t)

BOUNDARY SPANNING: A CONCEPTUAL FRAMEWORK FOR EXAMINING THEORGANIZATIONAL ROLE OF OFFICES OF INSTITUTIONAL RESEARCH
Michael F. MiddaughDirector of Research and Planning
SUNY College of Technology at Utica/Rome
Introduction
A substantial body of literature has developed over the past 20 years
in the area of organization theory, as it is applied to interorganizational
relationships and organization/environment transactions. Much has been
learned from this literature with respect to "adaptive" organizations,
i.e., those which survive during periods of scarce resources, changing mar-
kets, and varying economic circumstances. This paper is intended to review
the literature and apply it within the context of postsecondary educational
institutions. The paper will also state a series of research assertions
about which organizational characteristics are most likely to contribute to
the adaptiveness and survivability of colleges and universities. Minimally,
it is hoped that the paper will provide food for thought and discussion
among its readers. At best, it provides a conceptual framework for empirical
study that will enable its author to renew exploration of an area of pro-
fessional and intellectual interest that dates back to his graduate school
days.
Organizational Environments
Of necessity, most organizations, including colleges and universities,
interact with a variety of other organizations and groups, both formal and
inforwl. These interactions are necessary for the acquisitions of resources
(i.e., the money, raw materials, and oersonnel ev,ential to the activity of
?C2

253
the organization) and for the distribution andconsumption of the organization's
product. (Thompson and McEwen, 1958; Levene and White, 1961; Seashore and
Yuchtman, 1967) Those organizations external to a given "focal" organization
with which that focal organization must interact in order to carry out its
own mission are termed the organizational environment. (Katz and Kahn, 1966)
The interaction between an organization and its environment is analogous
to the biological principle of natural selection. (Aldrich and Pfeffer, 1976)
Just as living organisms must adapt to their environment, that is, obtain
adequate food supplies, shelter, reproduce in sufficient numbers or face ex-
tinction, organizations tco must adapt to their environment if they are to
remain viable institutions. Organizational adaptation, however, may be studied
in terms of the transactions with the environment which permit the acquisition
of resources necessary for the organization to operate, and for securing cus-
tomers to accept the organizational output. As in nature, the greatest threat
to adaptability and survivability stems from changes in the nature of the
environment.
The concept of a rapidly changing organizational environment was first
clearly articulated by Emery and Trist (1966) and has been reinforced by the
work of Terreberry (1968) and Liefer and Huber (1977). Terreberry (1968)
suggested that nearly all complex organizations operate within a rapidly
changing, or 'turbulent field" environment. These environments are character-
ized by uncertainty both with respect to continued supplies of essential re-
sources and with respect to the activities of other organizations within the
environment. That colleges and universities operate within a turbulent field
environment is evidenced by such characteristics as competition among institu-
tions for shrinking student markets, diminshed levels of federal, state, and
private research grants, increased competition with industry for the best and
brightest minds, etc.

254
.The organization, typified by colleges and universities, is then a
problem-facing, problem-solving phenomenon. Classical organization theory
would argue for a "rational model" approach to problem-solving emmanating
from the organizational environment, I.e., evaluation of all possible alter-
native solutions and selection of the most cost-effective course of action.
Recent literature suggests, however, that the very complexity of the en-
vironment which generates the problems faced by an organization is such that
it would overtax the limits of human rationality were the attempt made to
fully understand it. Thus the overwhelming nature of environmental com-
plexity forces organizations to operate within the context of "bounded
rationality." (Simon, 1957) Thompson (1967) summar'ies the problem this
way:
"The focus is on organizational processes related o choice ofcourses of action which do not fully disclose the alternativesavailably nor the consequences of those alternativcs. In this
view. the organization has limited capacity to ga:,er and processinformation or to predict consequences of alternai !yes. To deal
with situations of such great complexity, the orelnizations mustdevelop processes for searching and learning, as well as deciding.Tv? complexity, if fully faced, would overwWP. the organization,hence it must set limits on its defiiitions of situations; it mustmake decisions in bounded rationality." (p.9)
BoundarX Spanning Roles
The interactions between a given organization and other organizations
in its envirodthent involve a series -.1' tl.,-sactions acrm, die boundaries
of the respective organizations. (Katz and 1966; Thompson, 1967;
Starbuck. 1976) These transactions are generally concerned with the intake
of resources for organizational activities and the dissemination of organ-
izational output. A characteristic of adaptive organizations may be the
ability to accurately identify critical components in their environment
(i.e., suppliers of scarce resources and markets for the organization's

f
255
product) and the establishment of formal organizational structures to deal
with them. (Thompson, 1967; Aldrich and Herker, 1977; Aldrich, 1979).
These structures are referred to as "boundary spanning roles." (Thompson,
1967)
Faced with environmental uncertainty, the organization operating under
norms of rationality, establishes boundary spanning roles as the vehicles
for searching and learning in the environment. Having identified the most
crucial components of the organizational environment, boundary spanning
roles monitor those segments of the environment. The activities within
the boundary spanning roles should enable the organization to learn more
about these environmental components and to more effectively deal with
them. (Thompson, 1967; Alrich and Herker, 1977)
It is this underlying rationale that is prempting more and more colleges
and universities to look to offices of institutional research as focal
boundary spanning structures. The scope of their activities, in offices
with a boundary spanning thrust, goes beyond simple headcount and credit
hour tallying. Institutional research activities also include admissions
market analyses, student retention research, outcomes studies, community
impact analyses, etc. The objective of these activities is clearly the
acquisition of adequate student markets and fiscal resources necessary to
operate the college, while assuring that its graduates are marketable and
that a demand will persist for the institution's educational product.
Boundary spanning is not restricted to institutional research; offices of
sponsored research, public relations offices, academe/Industry consortia,
etc. are all directed to the same objective: institutional survival.
This paper, then, focuses on the relationship between boundary spanning
roles and a college's survivability, i.e., capability to adapt to changing
264
.

4
256
organizational envirorraent. The paper focuses on the office of institutional
research as a major boundary spanning role, and proffers a series of asser-
tions about the structure and configuration of that role and its relationship
to institutional adaptability. It should be underscored, however, that
while discussion focuses on offices of institutional research, the assertions
in this paper are generic to all boundary spanning roles within a college or
university and should be so interpreted.
Assertion #1: Those colleges and universities which establish boundaryspanning roles to deal with crucial components of their environments willbe significantly more adaptive than institutions which do not do so.
Such an assertion seems self-evident. If, for example, the identifi-
cation of student markets for institutional curricula, description of poten-
tial swdent perceptions about the college, measurement of satisfaction
levels among current students, identification of major factors in student
attrition, and assessment of curriculum-relevant employment and job per-
formance among alumni, are all factors that impact upon an institution's
ability to stay in business, then the institution should clearly establish
organizational structures, i.e., boundary spanning roles to search and
learn from the environment, and to provide the essential measurements de-
scribed above. A corollary to Assertion #1 might be that adaptive colleges
and universities have fully staffed, comprehensive offices of institutional
research.
Structuring the Boundaa Spanning Role
The relationship between the presence or absence of boundary spanning
roles and organizational adaptability to a constantly changing environment
may be controlled by structural characteristics of the boundary spanning role.
In other words, it may not be enough for a college or university to simply
a

257
have an office of institutional research. It is more likely that the manner
in which the office is structured will have a profound impact upon the in-
stitution's ability to probe, monitor, understand, and manage its organiza-
tional environment.
The number of boundary spanning roles conferred upon a given actor is
often a function of organization size. (Alrich and Herker, 1977) For
example, it is not uncommon in small colleges for the registrar's office to
be the repository for most institutional research functions. Similarly,
many institutional research offices are expected to assume development and
grantsmanship activities. However, Kahn et al (1964) warn against the dan-
ger of role overload, that is, assignment of a variety of roles to a single
boundary spanner or boundary spanning office, with the expectation that
all tasks associated with each role be completed within an unrealistic time
frame. To expect a college registrar to fulfill the primary tasks associa-
ted with registration, and at the same time to conduct community impact
analyses, attrition-retention analyses, outcomes studies, etc., is unrealistic.
It is Nkely that all activities would suffer because of the overloading
effect of competing time demands from the registrar and institutional research
roles.
Assertion #2: Those colleges and universities which assign separately, andWarnerWEI personnel or offices, those boundary spanning activities con-cerned with acquisition of essential resources and markets for the educa-tional product, will be significantly more adaptive than institutions whichdo not do so.
Similarly, role conflict (Kahn et al, 1964; Schein, 1970), in which
individuals are forced to make a choice between two roles, is a problem for
the boundary spanner. Logic would seem to dictate that an individual or
office charged with activities related to the acquisition of scarce resources
or maximizing the output market would not be involved in other non-related
26u

258
tasks. Returning to our previous example, the institutional researcher
engaged in identifying student markets for the college's programs, and
at the same time measuring the marketability of those programs among employ-
ers, is facing a major task. To require that individual to double as college
registrar, indeed, creates the problem of role conflict in which the indi-
vidual is frequently forced to choose between two sets of competing, vital
institutional functions. The result is the diminishment of each fun... on.
Assertion #3: Those colleges and universities in which personnel or officesengaged in boundary spanning activities dealing with the acquisition ofessential resources or product markets are assigned few, if any other roles,will have significantly greater adaptability than institutions in which personnel in similar boundary spanning roles are assigned a multiplicity ofroles.
Role professionalization refers to the suitability of an actor for a
given boundary spanning role as evidenced by the level of knowledge and
skills brought to that role. Aldrich and Herkey (1977) indicate that an
organization's ability to adapt to environmental contingencies depends in
part upon the expertise of boundary role incumbents in selecting, trans-
mitting, and interpreting the information originating in the environment
as well as successfully representing the organization as legitimate and
desirable to that environment. Aldrich and Herker's (1977) assessment
clearly reflect the general responsibilities and functions of offices or
institutional research.
The expertise evidenced by a role incumbent, i.e., practitioner of
institutional research, may be related to the professionalization of that
role. If so, then one might expect that the more professionalized the
boundary spanning role, the more effectively the activities associated
with it will be executed. Before making such an assertion, it is necessary
to first define the diminsions of professionalism.

259
Hall (1975) has examined the so-called "professional model" and has
drawn upon earlier studies to identify two dimensions of the professional.
The structural dimension, earlier delineated by Greenwood (1957) involves
five attributes:
1. Formal training in an area of knowledge that is not readily avail-
able to the laity.
2. Professional authority whereby the professional can "dictate" the
appropriate course of action for an organization.
3. Formal and informal sanctioning of the profession through licensure,
acknowledgement of the right to privileged communication. etc.
4. Subscription to a regulative code of ethics which dictates approp-
riate behavior for an individual acting in a professional capacity.
5. Professional culture wherein the individual maintains membership
in relevant associations, reads publications within the field, is
involved in various forms of continuing education, etc.
Hall (1975) also draws upon the work of Gross (1957) to describe the
attitudinal dimension of professionalization. Attributes such as a high
level of involvement within the profession, belief that the profession is
essential to the betterment of the human condition, concern for the advance-
ment of the profession rather than financial self-agrandizement are typical
of the attitudinal dimension. While interesting, they do not readily lend
themselves to empiric ' Aeasurement, nor is there a readily apparent relation-
ship to organizational adaptability.
Three characteristics of the structural dimension of professionalization
do appear to relate to the effective performance of the boundary spanner in
measuring and interpreting the organizational environment. They are train-
ing, professional authority, and professional culture.
26J

.111114,
260
Training in the activities of a boundary spanning role should contribute
to the expertise of the role incumbent and should add to the effectiveness
with which the role activities are performed. (Greenwood, 1957; Beal and
Wickersham, 1967; Hall, 1975) The broad spectrum of institutional research,
as described throughout this paper, should be more capably performed by an
individual with extensive training in social sciences, research methods,
and tests and measurements, than by an individual, e.g., a college registrar,
who is simply assigned institutional research functions.
Assertion #4: Colleges and universities in which the occupants of boundaryspat-WI5g roes have extensive training for the activities associated withthe role will be significantly more adaptive than institutions with roleincumbents not similarly trained.
Another measure of expertise in a boundary spanning role incumbent
may be the authority acknowledged to that individual by the organization
to provide direction for total institutional policy. The acknowledgement
of professional authority is based upon the belief that the professional
possesses the knowledge base to provide correct information for organiza-
tional decisions. (Greenwood, 1957; Etzioni, 1964; Hall, 1975, 1977) Con-
crete measures of professional authority are evident in the responses to
the following questions, again using the office of institutional research
as an illustration:
1. To whom does the office report? The Prt5itivt?
2. Does the Director sit on the Presideni's cabinet or Executive Council?
3. What is the role of the office of institutional research in the
institutional planning process? Is it a leadership role or simply a
supportive role?
Assertion #5: Colleges and universities in which occupants of boundary span-ning roles are accorded broad professional authority will be significantlymore adaptive than institutions where role incumbents are without professional
authority,

A
261
Operation within a professional culture would also appear to be an
important component of role professionalization. (Greenwood, 1957; Hall,
1975) The practitioner of institutional research who regularly attends
in-service seminars/workshops, reads relevant literature within the field,
and interacts with other professionals through membership in role-related
associations might be expected to be better versed in contemporary develop-
ments within the field and, therefore, might be expected to be more success-
ful j.n the performance of the activities associated with his/her role.
Assertion #6: Colleges and universities in which the occupants of boundaryspanning roles operate within a "professional culture" will be significantlymore adaptive than institutions where role incumbents do not do so.
Bringing together the structural dimensions of role professionalization,
it is now possible to offer an encompassing assertion.
Assertion #7: Colleges and universities which professionalize boundaryspanning roles will have significantly greater adaptability than thoseinstitutions which do not do so.
The preceeding paragraphs have argued for the necessity of colleges
and universities to establ"sh boundary spanning roles to monitor the organi-
izational environment and to make necessary institutional adjustments to
changes in that environment. Moreover, the paper has argued that certain
structural characteristics care be imposed upon ths boundary spanning roles
to make them more effective in contributing to organizational adaptability.
As persuasive as the arguments might seem, they will derive value only from
empirical test ng.
Directions for Future Research
The author has conducted research in the area of boundary spanning role
structure and organizational adaptiveness. (Middaugh, 1980) This early
research suggests three essential components in moving to empirical study of
2. u

262
boundary spanning roles in colleges and universities.
A. Role definition: Not only must the specific offices or roles be identified
which tre to be viewed as boundary spanning, but appropriate descriptive
measures of role incumbents must also be measured. Scope of the boundary
role itself must be assessed, as well as other organizational duties held
by the boundary role incumbent. Measures of role professionalization must
also be established. Subsequent development of a manageable empirical
measuring instrument to incorporate the various areas of role definition,
coupled with choice of data collection methodology, pose a formidable
task for the researcher.
B. Measures of adaptiveness: The purpose of the research is to measure
relationships between boundary spanning roles anu the ability of colleges
and universities to adapt to changing environments. But what are commonly
acceptable measures of adaptiveness? Avoiding declining enrollments?
Maintaining or enhancing existing levels of non-tuition-based funding?
Arriving at definitions and measures of characteristics which accurately
reflect a college or university's capacity to adapt to its environment
is perhaps the most difficult part of the construction of a study.
C. Moderating variables: Are the relationships measured actually the
relationships that are operative? Where do institutional politics,
institutional funding sources, general economic conditions, etc. fit
into the equation? In order for the study to be truly descriptive,
moderating and/or contaminating variables must be controlled.
While the obstacles to the empirical measurement of the assertions
outlined in this paper are substantial, the author's own work in this area
suggests they are not insurmountable. The benefits accrued by institutions
armed with quantitative measures of the environmental relationships described

or
4
263
Herein are self-evident: organizational survival. The author intends to
pursue the research and urges others to eiti\vr collaborate or conduct Parallel
research. The body of literature in organization theory and post-secondary
educational administration will be enriched, ana. our institutions will be
better equipped to move into the uncertain years of the late twentieth century.
2" 4,

264
BIBLIOGRAPHY
Aldrich, H.E. Organizations and Environmental. Englewood Cliffs, New Jersey:Prentice-Hall, Inc., 1979.
Aldrich o:. and Herker, D. "Boundary spanning roles and organization structure."Academy of Management Review, 1977, 2, 217-230.
Aldrich, :I. and Pfeffer, J. "Environments of organizations.'' Annual Reviewof Sociology; 1976, 2, 79-105.
Beal, E.F. and Wickersham, E.D. The Practics of Collective Bargaining.Homewood, Illionois: Richard D. Irwin, 1967.
Emery, F.E. and Trist, E.L. "The casual texture of organizational environments."Human Relations, 1965, 18, 21-32.
Etzioni, A. Modern Organizations. Englewood Cliffs, New Jersey: Prentice-
Hall, Inc., 1964.
Greenwood, E. "Attributes of a profession." Social Work, 1957, 3, 45-55.
Gross, E. Work and Soci.qty. New York: Thomas Y. Crowell, 1958.
Hall, R.H. Occupations and the Social Structure. Englewood Cliffs, New Jersey:
Prentice Hall, 1975.
Hall, R.H. Organizations: Structure and Process. Englewood Cliffs, New Jersey:Prentice-Hall, Inc., 1977.
Kahn, R.L., Wolfe, D.M., Quinn, R.P., Snoek, J.D. Organizational Stress:Studies in Role Conflict and Ambiguitt. New York: Wiley, 1964.
Katz, D. and Kahn, R.L. The Social Psychology of Organizations. New York:
Wiley, 1966.
Levine S. and White, P.E. "Exchange as a conceptual framework for the studyof interorganizational relationships." Administrative Science Quarterly,
1961, 5, 583-601.
Liefer, R. and Huber, G.P. "Relations among perceived environmental uncertainty,organization structure, and boundary spanning behavior." Administrative.
Science Quarterly,1977, 22, 235-247.
Middau0' M.F. "An examination of the structure of boundary spanning rolesin public school districts and their relationship to organizational boundaryflexibility." Unpublished doctoral dissertation, State University of New Yorkat Albany, 1980.
Schein, E. Organizational Psychology_. Englewood Cliffs, New Jersey: Prentice-Hall, Inc.,7976.
f)4, I 0
V

265
Seashore, S.E. and Yuchtman, E. "Factorial analysis of organizationalperformaace." Administrative Science Quarterly., 1967, 12, 377-395.
Simon, H.A. Models of Man Social and Rational. New York: Wiley, 1957.
StarL'uck, W. "Organizations and their environments." in M.D. Dunnette (ed.)Handbook of Industrial and Organizational Psychology.. Chicago: Rand-McNally,
7171.
Terreberry, S. "The evolution of organizational environments." Administ aliveScience Quarterly, 1968, 12, 590-613. .
Thompson, J.D. Organizations in Action. New York: McGraw-Hill, 1967.
Thompson, J.D. and McEwen, W.T. "Organizational goals and environments: goal-setting as an interactive process." American Sociological Review, 1958, 23,23-31.
2*/
.1

r
SEXUAL INEQUITY IN CAREER CHOICE: HOW CAN COLLEGES HELP?*
Jean V. Morlock
Office of ;:istitutional ResearchState University of New York at Plattsburgh
Plattcourgh, New York12901
Introduction
The past few decades have been a time of increased awareness of the
sexual inequities in employment, e.g., affirmative action legislation, and
the ERA movement. Those involved in the feminist movement have gone further
and have generally challenged the sex-role stereotypes, which have restric-
ted free choice of careers for both women and men. Consensual ideas of ap-
propriate roles for women have not only governed whether a woman chooses to
be a homemaker or to have a career, but also have contributed to the type
of career or job chosen. Careers or occupations that have been traditional
for women are narrow in range, tend to involve subservient, helping or nur-
turant roles, are less lucrative, and are lower in status and leadership
roles. While the number and proportion of women in the labor force has been
growing rapidly, women's employment has remained restricted to only a few
occupational fields. In 1972, it was reported that 70% of all career women
were working in one of four fields: nursing, social work, teaching, or
secretarial work (Tangri, 1972). Researchers agree that sex-role stereo-
types are powerful determinants in the restriction of women's free choice
of career type (Witkin, et al, 1977;,Bem and Bem, 1977; Goldman and Warren,
1973). That such stereotypes exist, with regard to type of career, and are
held in strong agreement by both men and women, has been shown by several
researchers, both on the basis of male and female perceptions and numbers
of women employed or majoring in various fields (Chewning and Walker, 1980;
Panek, et al, 1977;,Harren, et al, 1979; Brenner and Tomkiewicz, 1979).
One aspect of this study was to update anti replicate both of these measures
of sex-role stereotyping of career fields.
*This study was done as part of a requirement to complete an M.A. Degree inClinical Psychology. Anyone who would like a more detailed explanation ofthe methodology or results is invited to request a copy of the write-up of
that study.
275266

267
How can colleges help women to enter a greater variety of career
fields? Knowledge of the characteristics of women who have been able to
defy sex-role stereotypical career-aspirations may aid us in counseling
other women into appropriate fields for their abilities and interests.
Certain demographic and personality characteristics hay:: been found to
discriminate the woman who chooses a non-traditional career field or major
in college (the Role-innovator or NT) from the woman with a more tradi-
tional orientation (Traditionalists or T). Some researchers believe Role-
innovative women to be social misfits (the "social deviance" hypothesis);
while others believe that these women have experienced more enriched back-
grounds (the "enrichment hypothesis"), in terms of a variety of role models.
The present study contrasted these two hypotheses and examined a variety
of personality variables shown by past researchers to correlate with career
choice (Stake, 1970; Psathos, 1968; Astin & Myint, 1971; Reynolds & Jones,
1978; Almquist & Angrist, 1970; Tangri, 1972; Stewart & Winter, 1974;
Orcutt, 1979; Jordan-Viola & Fassberg, 1976). Also included are some new
variables inferred by the author from feminist research to contribute to4pw.
Role-innovation (Hjelle & Butterfield, 1974; Vankatesh, 1980; Dempewolff,
1973; O'Keefe, 1972, and Fowler, et al, 1973). The variables studied can
be seen in Table 1, which contains a summary of the hypotheses of this
study and the results. The unique value of this study was that a number
of variables were studied simultaneously, so that a profile could be drawn
of the Role-innovator vis-a-vis the Traditionalist. Also unusual was the
chance to compare both groups of females to mates on the same measures.
Self-perceptions were used for the personality variables, representing a
more accessible and economical form of measurement, and also an important
and personal perspective of the subjects.
Method
Two surveys were administered to two separate groups of males and
females at State University of New York at Plattsburgh. The Freshman
Survey was administered to all freshmen attending Summer Orientation, and
provided the demographic variables, such as parents' education and occupa-
tions, as well As self-perceptions on several personality traits. Freshman
Surveys from several years (1978-80) wenaused as a combired sample in order
to increase the number of subjects in the study. Finding a sufficient
2"0

268
number of non-traditional women majors in a largely traditional female
university was a problem. Except for the recently emerging fields of
computer science and business, our largest programs continue to be education,
nursing, and home economics.
The Program Perception Questionnaire was administered to students liv-
ing in the dorms, both males and females, of all class levels. Their per-
ception of the curricula offered at Plattsburgh were rated on an eleven-
point scale, from masculine (1) to feminine (11). In addition, they rated
themselves on several personality variables in a semantic-differential
style. Three hundred and forty-nine students responded to the Program Per-
ception Questionnaire, an ample number for perceptual ratings of programs;
however, the number of non-traditional women was small, making interpreta-
tion of the results of the personal traits from this questionnaire specu-
lative. Please bear this in mind when examining these results. This study
will be duplicated with larger and more diversified populations in the
future.
Programs were designated as "Traditional" or "Non-traditional," using
both criteria, i.e., students' perceptions and the proportion of women en-
v19d in a program. Cut-offs of mean ratings >6.5 or 4:4.5 and percent
females enrolled of >65% or 445% were chosen for traditional and non-
traditional programs, respectively.
Table 2 shows the programs as classified by both techniques into tradi-
tional or nontrAitional categories. There is a good deal of agreement
between the two criteria; however, .ame notable exceptions indicate that
stereotypes do lag behind changing trends. For example, accounting was
rated on the masculine side, yet more females than males were enrolled in
thv field (58%). Music is seen as a feminine field, but is male-dominated
at Plattsburgh (18% females). The perceptual criteria is generally more
extreme and limited, providing greater contrast between the two groups of
subjects.
Results were contrasted, using these two criteria. Step-wise discri-
minant analyses were performed to assess Lhe ability of the personality vari-
ables and demographic characteristics to discriminate between the Traditional
or Role-innovative and Non-traditional women (see Fig. i and 2). Analyses of
variance were also performed in which all three groups of subjects were com-
pared, i.e., Traditional females, Non-traditional females, and Males (see
Tables 3 and 4).
2 .

4
269
Results and Discussion
Program Percgptions
Results of the Program Perception Questionnaire confirmed that sex-
role stereotypes, measured by perceptions, do still exist and are held in
strong agreement by men and women students at Plattsburgh. Only aix of the
43 programs rated showed significant differences in mean ratings by men and
women (p.4.05, two - toiled t-test). For the most part, perceptions correct-
ly mirrored actual enrollment proportions, with two exceptions: 1) the
emerging fields and 2) only the Traditional females accurately assessed the
extreme femininity of highly female-dominated programs Such as home econo-
mics, nursing, and special education. In general Non-traditional women
behaved like men. They rated more programs on the masculine side than did
Traditional women.
Freshman Survey Variables and Demographics
The interpretation of these results was simplified by the development
of a profile of the NT female as compared to the T female, using a stepwise
discriminant analysis. In this way the relative importance of the variables
coule also be assessed and redundant i'formation removed. Fig. 1 presents
these results. Significant discriminant functions were found for both
criteria. The profile differed somewhat for tne two criteria. In both
cases the most important discriminant was math ability, followed on the
positive side, i.e., NT females exceeded T females, by independence, intel-
lectual self-confidence, then high school average. Other than less inter-
est in marriage by NT females, the negative loadings varied by criteria.
Using the perception criteria, NT females appear to have less social inter-
est or abilities. Thus the evidence lends support to each of the two hypo-
theses under study; the "enrichment" and "social deviance" hypotheses. An
alternative hypothesis, which explains the lesser social knowledge of NT
women in the perception criterion, is that the solitary nature of the sub-
ject matter they study: math and science, is related to these ..rafts.
Rather than being socially "deviant," they may Le more suited to such
fields .of study. Future studies will compare males and females in these
fields to students in other fields to test this hypothesis.0A better overall interpretation of the data than either of the above
mentioned hypotheses and one that avoids labels and political arguments
27
4

270
is seen when the two groups of females are compa 1 to males. The Non-
tradi+ional females seem androgenous. They are similar academically to
males, but socially to Traditional females. Table 3 presents the results
of one-way analyses of variance comparing the three groups. Non-traditional
females resembled (or even exceeded) males it their superior math abilities,
yet, like their Traditional sisters, they had achieved higher high school
averages than males. In spite of the superior academic abilities of NT
women, their intellectual self- confidence lies somewhere between T females
and males. Socially, NT females resewble T females. They share the curi-
ous contradictions of their Traditional sisters in that they report them-
selves as having developed more friendships, yet see themselves as less
popUlar and less socially self-confident than do males. Only for the per-
ceytion criteria, which is limited to fields most typically and extremely,
male-dominated such as math and science, do the NT females resemble males
socially. Women in these fields report less social knowledge than T females.
Finally NT females were the least interested of the three groups in preparing
for marriage while at college. These women seem to have postponed or set
aside thoughts of marriage while preparing for their career.
Personal Traits from Program Perception Questionnaire
As mentioned before, these results must be interpreted with caution,
due to the small number of NT women in the sample. Table 4 presents the
results of one-way analyses of variances performed on the three groups
simultaneously. The table is organized by similarity of means of NT females
to either T females or males. Again the suggestion of androgyny is there.
NT feiales resemble T females in their femininity, conventionality, gregari-
ousness, yet have begun to move closer to males in these traits. They
also resemble or seem to exceed (not necessarily significant differences)
I females and sometimes males in independence, autonomy, dominance, and
activity. They resemble males in their competitiveness, but are more
achievement-oriented like their T counterparts.
Fig. 2 presents profiles of the NT vs. T females, using stepwise dis-
criminant analyses. Significant functions were found for both criteria
and agreed with the hypotheses of the author, inferred from feminist and
other research. NT women were more independent, dominant, autonomous,
but less feminine and conventional. Results for other variables, such as
assertiveness, were mixed and contradictory. Further study is needed,
2 ij

A
271
with larger samples, to Nplicate these results.
Summary
To summarize, the profile of the Non-traditional woman emerges as
follows: She is academically superior, especially with regard to math
skills; more independent, dominant, autonomous, competitive, and confident
of her intellectual abilities, but less gregarious, conventional, and femi-
nine than her Traditional counterpart. She is better equipped to compete
with men in the Non-traditional fields that are highly mathematical and
intellectual and require more solitary work, yet may do so at a social
and personal cost. She seems to value marriage less or be more willing to
postpone it than either Traditional females or males, possibly because she
sees it in conflict with her career aspirations.
Our role at colleges could be to counsel and support Role-innovative
women and to encourage those with similar abilities and personality pro-
files to enroll in Non-traditional fields. Support groups or clubs for
Non-traditional women may be helpful. At some colleges, women's studies
forums perform this service. Also, other women with similar skills could
be encouraged and supported to develop the amount of independence and auto-
nomy needed at this time to consider entering male-dominated fields.
At the admissions level, women with high math scores on aptitude and
achievement tee's or measures should be encouraged to major in Non-tradi-
tional fields. High school counselors should be alerted to this possibi-
lity. Some research in the field has suggested that women are advised into
Traditional fields because of the stereotypes held by high school and col-
lege guidance or career counselors. Providing updated information and
training to such counselors may be a way of breaking this cycle.
CI-lieges can help to change perceptions or stereotyping of these fields
by students, as well as counselors. Fields that have recently emerged as
less male-dominated in terms of enrollment, such as accounting, were incor-
rectly perceived as being "mai61ine." Clearly stereotypes lag behind
reality and continue to influence the,career choice of both men and women.
Participation by colleges in natior;Ide,development of day care cen-
ters could help to relieve some of the confli?tqelt by women between
marriage and careers. Presently women are pressed by circumstances either
2t)

4t.
O
272
to make a chcice between these two important life goals or to postpone one
or the other.
Finally, the comparisons made between men and women revealed some
interesting inconsistencies in college women at Plattsburgh that suggest
a need for remediation. Women in this study, whether NT or T, had less
self-confidence than men, both socially and intellectually, even though
they reported better social skills and had achieved higher grades in high
school, and/or had superior math abilities. Support groups and programs
oesigned to enhance self-confidence in college women could contribute to
more effective job-seeking skills, and enable them to compete with men in
the move up the corporate ladder to management positions. Updated informa-
tion and role models provided by Role-innovative women, particularly those
who have successfully integi'ated their careers with marriage, could help
dispel the myths and stereotypes that discourage women from aspiring to
non-traditir'. ,l fields and contribute to sexual inequity in employment.

273
REFERENCES
Almguist, E. M. and Angrist, S. S. Career salience and atypicality ofoccupational choice among college women. Journal of Marriage and theFamily, 1970, Vol. 32, 242-250.
Astir, H. S. and Myint, T.' Career development and stability of young womenduring the post high school years. Journal of Counselim Psychology,1971, Vol. 19, 369-394.
Bem, S. 1. and Bem, D. J. Training the woman to know her place: The socialantecedents of women in the world of work. In Title and Denker. Re-entry women: A selective review of the educational process, careerchoice, and interest measurement. Review of Educational Research, Fall1977, Vol. 47, No. 4, 531-584.
Brenner, O. C. and Tomkiewicz, J. Job orientation of males and females:Are sex differen:es declining? Personnel Psychology, 1979 Winter, Vol.32 (4) 741-750.
Chewning, M. F. and Walker, W. E. Sex-typing of tasks and occupations.Psychological Reports, 1980, 47, 696-698.
Dempewolff, J. A. Feminism and its correlates. Diss. Abst. Internat., 1973,332, 3913-39148 (University microfilms No. 73-3829, Ann AFFOicliChigan).
Fowler, M. C., Fowler, R. 1. and Van de Riet, H. Feminism and politicalradicalism. Journal of Psychology, 1973, 83, 237-242.
Goldman, R. and Warren, R. Discriminant analysis of study strategies con-nested with college grade success in different major fields. Journal,
of Educational Measurement, 1973, Vol. 10, 39-42.
Marren, V. A., Kass, R. A., Tinsley, H. E. A. and Moreland, J. R. Influenceof gender, sex-role attitudes and cognitive complexity on gender-dominant career choir:s. Journal of Counseling Psychology, 1979, Vol.26, No. 3.
Hjelle, 1. A. and F R. Self-actualization and women's attitudestoward their Iv. 'n contemporary society. Journal of Psychology,1974, Vol. 87, 2tb 30.
Jordan-Viola, E. and Fassberg, S. Feminism, androgyny and anxiety. Jodrnal
of Consulting and Clinical Psychology, 1976, Vol. 44, No. 5, 870-871.
O'Keefe, B. E. Attitudes toward women's liberation: Relationships betweencooperation, competition, personality, and demographic variables.Diss. Abst. Internat., 1972, 33, 12938 (University microfilms No. 72-73,MT-Ann ArborTIRTEEigan).
Orcutt, M. '. and Walsh, W. B. Traditionality and congruence of careeraspirations for college women. Journal of Vocational Behavior, 1979(Feb), Vol. 14 (1), 1-4.
Panek, P. E., Rush, M. C. and Greenwalt, J. P. Current sex stereotypes of
25 occupations. Psychological Reports, 1977, Vol. 40, 212-214.
Psathos G. Toward a theory of occupational choice for women. Sociology and
Social Research, 1968, Vol. 52, 253-268.
Reynolds, Mio and Jones, E. Traditional and non-traditional career orienta-tion among female college students with differing motives and demographicbackgrounds. Paper presented at Eastern Psychological Assoc.. Convention,1978.

274
Stake, J. E. Women's self-estimates of competence and the resolution of thecareer/home conflict. Journal of Vocational Behavior, 1979 (Feb), Vol.14 (1), 33-42.
Stewart, A. J. and Winter, D. G. Self-definition and social definition inwomen, Journal of Personality, 1974, Vol. 42, 238-259.
Tangri, S. S. Determinants of occupational role innovation among collegewomen, Journal of Social Issues, 1972, Vol. 28, 177-199.
Vehleateh, Alladi. Changing roles of women: A life-style analysis. Journal
of Consumer Research, 1980 (Sep), Vol. 7 (2), 189-197.
Witkin, H. A., Moore, C. A., Goodenough, D. R. and Cox, P. W. Educationalimplications of cognitive style. Review of Educational Research, 1977,Vol. 47, No. 1, 1-64.
-4-
..e
4

fable 1. Summary Comparison of Results with Hypothes,3
Variable Hypothesis
1. Mother's Occupation2. Relative Educational level
of parents--Mother:Father
*3. SAT Math & Math Ability4. High School Average and
Academic Ability
NT have NT mothers
NT .M T
NT ).T
No difference
*5. Educational Aspirations NT
*6. independence Mr*7. Autonomy NT
Activity NT
9. Self-knowledge NT*10. Self-confidence (Intellectual) NTIli. Dominance NT
12 Assertiveness NT
*8.
Y3. Competiveness
14.
15.
16.
17.
*18.
Drive to SucceedPopularityFriendships
GregariousnessSocialSocial Knowledge
19. Social Self-confidence
*20. Femininity21. Conventionality22. Sensitivity to Criticism23. Goal of Preparing for
Marriage While at Colleve
> TTT
T
>T>T
T
r
NT j T
NT > T
hT < T
No difference
No difference
NTNT
NT
4 TT
< T
NT< T
Result
No difference
No differenceexcept perceptionprofile
NT )T
No difference;
except perceptioncritgriaNT< TNT )0 TNT .0 TNT 1. TNo differenceNT > TNT ;0 TSuggestive-contradictorySuggestive-contradictoryNo differenceNo differenceNo differenceNT 4 TNT <(Perception Only)
Contradictory-depends on criteriaNT 4: TNT OCTNo difference
NT T
Significant o 4C .05 using t-test or analysis of variance. Other variables,
listed as > or 4, contributed to a significant discriminant function.
Table 2. Comparison of Two Criteria for Role Innovation
111AD1TiONAL PROGRAMS
StereotypeBotn Criteria Agree Criterion
(71iiirkalEig)
Child Family Service 9.0Nearing & Speech Science 1.9Home Economics Education 9.5Special Education 8.1Nursing 9.4Food & Nutrition 8.5K-12 Speech & Hearing Handicapped 8.1
Elementary Education 8.6Early Secondary Education 7.9
French 7.5Theater 6.9English 7.6Spanish 7.1
Perceptions Only
Secondary Education 7.1Music 6.8
Enrollment Only
Psychology 6.48Behavioral Science 5.9Hciical Technology 6.0Sociology 6.3Art 6.4Health Education 6.1
EnrollmentCriterion
(i-TiiiTiEr
100100
10099
979494
91
8877
76
66
47
18
828079
75
71
65
NON - TRADITIONAL PROGRAMS
Both Criteria Agree
Engineering 3.2Pk/A(3 3.8Geolow 4.49Chemistry 4.49Political Science 4.45Endironmental Science 4.5
Perceptions Only
Accogoting 4.4BioLtemdstry/Biophysics 4.2Economics 4.4
Enrollment Only
Geography 4.9Music 6,8Communication Arts 6.0Mathematics 4.9Mass Mudia 5.7Computer Science 4.6Biology 4.8Business 4.6
9
11
13
323842
584648
018
3030
37
4044
45 285

C
J t1
Table 3. Compailsnn of Mean Responses to Freshman Survey Variables- -Traditional. Non-traditional Finales, and Males*
ENROLLMENT RATIO CRITERION
SIGNIFICANTCOMPARISONS**
Tradi-tionalFemales
Non:TFial-ticnal
Females Males
NON - TRADITIONAL FEMALESRESEMBLE HALM
SAT Math 492 5'5 524 M & NT > TMATH Ability 3.00 3.J6 3.33 M & N1 > Tindepeedence 3.63 3.85 3.72 NT >Preparing for Marriage 3.16 2.73 .98 NT< I
HON - TRADITIONAL FEMALES
IrtEMBLE TRADITIONAL FEMALES
High School Average 86.3 86.3 83.4 T > MSelf-confidence
(Intellectual) 3.26 3.3F 3.54 NT & T< MSelf-confidence (Social) 3.22 3.23 3.40 NT & T< MPopularity 3.26 3.27 3.36 Nonefriendships 4.04 4.01 3.82Social Knowledge 3.73 3.67 3.56 T > M
N 489 210 546
PERCEPTION CRITERION
NON - TRADITIONAL FEMALES
Tradi.tional
Females
Non-Tradi-tional
Nmales MalesSIGNIFICANTCOMPARISONS**
502
3.603.2?3.71
5373.78
2.99).44
5243.72
2.983.56
NT.NoneT MNT & M G T
SIMILAR TO MALES
SAT MathIndependencePreparina for MarriageSocial Knowledge
NON-TRADITIONAL FEMALES
SIMILAR TO TRADITIONAL FEMALES
High School Average 86.9". 87.7 83.4 T & NT 20 MSell - confidence
(Intellectual) 3.22 3.41 3.54 T < MSelf-conficence;Social) 3.21 3.21 3.ae T 4 M
Popularity 3.?3 3.19 3.36 T MFriendships 3.99 3.99 3.82 T M
NON-TRADITIONAL EXCEEDON GROUPS
Academic Ability 3.55 3.76 3.52 NT) T & M
Math Ability :.05 3.83 3.33NT & M) TNT )1. M
N 342 83 546
* Only significant differences (p.c.05 one -way analysis of variance) are
shown.** p L .05 Scheffes Test.
4. Comparison of Responses to Perception Questionnaire Traits- -Traditional, Non-traditional Females, and Males
ENROLLMENT CRITERIONlion.Tradi-
*Femininity*Conventionality
*Gregariousness
IndependenceAutonomyDominance
*CompetitivenessAssertiveness
ActivityAchievement-orientation
LiOnal tionalFemales Females Males
SIGNIFICANTCOMPARISON**
5.92 5.45
4.55 4.28
4.69 4.63
5.20 5.53
4.89 5.234.37 4.70
3.89 4.284.88 4.78
5.01 5.28
5.71 5.55
1.85
3.65
4.065.094.844.66
4.454.85
5.01
5.30
All
T &
T > M
M
NT > M
N 126 40 114
PERCEPTION CRITERION
*Femininity 6.09 5.92 1.85 NT & T :6 M
*Conventionality 4.64 4.21 3.65 T). M*Gregariousness 4.67 4.50 4.06 T MIndependence 5.17 6.00 5.09
Autonomy 4.80 5.50 4.84
*Dominance 4.19 5.14 4.66 NT & M ) I*Competitiveness 3.78 3.86 4.45 M > TAssertiveness 4.75 5.14 4.85Activity 4.92 5.64 5.01
Achievement-orientation 5.77 5.86 5.30
N 96 14 114

Variable
1 MATH ABILITY
2 MARRIAGE
INDEPENDENCE .
SELFKNOWLEDGE
5 RICH SCHOOL AVERAGE
6 SAT MATH
7 SELF-CONFIDENCE
(INTELLECTUAL)
8 DEGREE 1. 9
3
4
SEWCONFIDENCE
(SOCIAL) I
fa
Coefficients*
Enrollment CriterionCoefficients
Enrollment Criterion
Coefficient
.27
-.18
.55
-.44
.51
-.36
.35
.22
.17
-1.0
1'
X
+1.0 4.Illa Variable Coefficient-
1 FEMININITY
2 INDEPENDENCE
3 ASSERTIVENESS
4 AUTONOMY
5 DOMINANCE,
6 ACHIEVEMENT
7 COMPETITIVE
8 CONVENTIONAL
-.619
.494
-.669
.342
.422
-.365
.268
-.238
Canonical Correlation = .340 p
4 N T 126
NT 40
Total 166
.0116
-1.0
X
X
X
0
4
+1.0
9
danonica1 Correlation = .30(N Traditional; 489 p .0000
Non-traditional 210Total KfF
1 MATH ABILITY :81
2 SOCIAL KNOWLEDGE -.52
3 RELATIVE EDUCATION -.29
4 INDEPENDENCE .26
5 FRIENDSHIPS .24
6 MARRIAGE -.16
T SELF-CONFIDENCE(INTELLECTUAL) .30
8 SELF-CONFIDENCE(SOCIAL) -.27
9 HIGH SCHOOL AVERAGE *15
Canonical Correlation = .408N Traditional 342
Non-traditional 83Total rin
Stereotype Criterion
+2.0
StereotYPe Criterion
-1.0 0 +1.0
3
X,
XX
x
p ,0000
!Standardized canonicalfunction coefficients.
X.
X
x
discriminant
1 DOMINANCE .489
2 INDEPENDENCE .409
3 GREGARIOUSNESS -.476 X
4 ACTIVITY .567
5 CONVENTIONAL -.377
6 FEMININITY -.364 ,
7 ASSERTIVENESS .421
8 AUTONOMY
Canonical Correlation 7 .389 p .0291
N T 96
NT 14
Total 110*Standardi2ed canonical discriminant functi
X/'
X
4
coefficients
Fig. 2. Profile of Role -inniqative %Amen - rerception Traits..
fig. 1. Profile of the Role Innovative Woman - Freshman Survey Variables. *
2S328j
4.4
9

L.
41 '
tt
Wa.
O ,
What Happens.'Twixt the Cup and thelip:.. Data to Information to AFtion-2
.Data Development in &ComplexMulti4evel Environment
Janyce J. Napora' ,
Director of Planning and Institutional StudiesSystem Office
University of MIsiachusitts250. Stuart StreetBoston, MA*02116' .
My prIsentation will be a bit different from the others,.in that rathir
than desoribii4 a particular study, or instance of the use ofdAta, I am
going to relate to you ,the case study of the developmentof an Office of
Institutional Studies in.the Central 'Off. ice of a multi campus university
system.
The Unfifersity of Massachusetts has three campuses, a comprehensive
University Center i.n,Anthersq a Medical- .Center in: Worcester, and an urban.
campus, With developing graduate programs inBostnn. mUltircampus-
system is governecy a single Board of,Trbstees which is appo111 infed.py the
Governor, and a president who serves at the pleasure of the Board.' Each
campus is headed by a_ Chancellor., who reports .directly .to `,the -President.
In addition, the President retains a small Central office staff of approxi-,.
mateiy twenty.professionals. This central staff includes'University'Counsel,
collective bargaining personnel, central budget and planni*stafGand a
Public Relations Dirgcior. Many University-wide functions such .as the
Administrative Data Processing, the Uni'versity Controller, the Treasurer,
and the Internal Auditor report.to the President thrqugh.'hit central staff.
Al) public institutions inMassachusetts are further governed by a
statewile Board of Regents, also appointed by the Governor. The Board of
Regents is responsible for overall goveiTince,and planning.and policy
direction .for all of public higher education 'in the4ite. AS you have, .
#. "'probably guessed by now, the central problemfcedeveloping a system level
,-.o. fice of Panning and Institutional Studies.lies:in the inttrstices:between -
the campUses, the institutional *lard of Trustees and the Board .of Regents',i ,
".eand the Regents staff.. , .
, , ...
t
, .2.1JO
278
1
-
,` a

1
N.a
..,'.$
a le
.
'. NIn any organization, it is important to match the level of the
.
.
data to the level of decision making. In a situation such as the:,
Central Office, which is the middle level in a tri-level' hierarchy,
this match is crucial. For our purposes, wedivided data and thei c .
4 1
level of decision making each into three categories as follows:
Levels of Data Levels' of"Decision Making
Policy Policy ,-
Summary Level Implementation/ProcessOperational ,, Operation
a
279
I.
6
Each of the levels of dectsionroaktng exist in virtually all.
organizations.. On a campus for example, the operational.
level con-
. ,sists ofthose decisions which are necessary to.say, get a student.r. . .
a-
registered, or to run an admissions or financial.aid office. The
' implementation/process level, Which requires summary level' data,
would be those decisions which are made at the vice-presidential. . 6 . . 1 . ...
4
leVel, or by committees'ofoperating personnel--how long-should, the
registration period be? How much weight should'SAT scores begi.ve9
in the admissions process? The-iMplemeniation/pcess FeverwOUld. .
also include initiation functions for ssueslon which'final-dispo-'. .
... .
sition lies at the policy level. -For example, new academic program. . ..,
development-usually begins ,at thiOevel; with Board .approval,
-'. .
necessary. . ..:.
pOthoughwe can.'reach some consensus on the nature of operational
and summary level data, it is more difficult to address what constitute. .
. . :
policy level data. A working definition .of policy level data .includes
the following:
_-- c
a.
.
te
."

- it is aggregated (to what level?).,
. it is placed within an external context;
- it inciudes.trend datp analysis and;
- categories of dita relate directly to thepolicy issues at hand.
280
. In developing policy leVel.data, we focused' on a determination of,
the type and level of data appropriate to a systemAvel office. Pri-
, marily, we defined it by what itis not. We determined that the campuses
should retain responsibility fol. developing detailed enrollment, admis-
sions and other student related data, faculty/workload statistics, space,
,utilizati3h analysis and all other detailed campus-focused information.
Institutional Studies in the Central Office would focus more broadly on
university-wide issues Which,are'relivant to the Pres.ident and the Board
of Trustees; the developotnt of reports for external distribution:Ind,
1
the development of external opntextual data and information for polidy, :
planning and.decisiOn making. Thesespecifietasks"all led to the
establishment of a summary level database for planning and decision
making.
Three specific products which.we have developed over the st year
illustrate this focus; The Mbhthly Indicatbr Report, Environmental Scan-
ning and the development of data in support of Collectiv4 Bargaining.C.
'The Mogthly Indicator Report consists of both a financial section and a
on-financial section. The'financial ,section is a fairly conventional
overview of the stateocif each campus, and the University as a whole
along a variety of financial measures. These include expenditures to
date in personnel and non-personnel subsidiary ac ants, and monitoring
of expenditures in grants and contracts. Each of ese are then compared,
to the previous month and .to the same date last year. The second, or
2U.

O
281.
non-firiancial section consists of an lodicatorif the Month. Each-. < ,
month .a different indicator is selected for analysis. These indica-...
torthave included a look at admissions, degreei granted, and enroll-,
. .
raent trends. Future plans include tuchissves as faculty salaries.
and, trends in faculty movement. .
,
Environmental Scanning consists of three data related areas;
,access to demographic data; establithtent of a comparative data base.for peerinsfitutionsi and'econcletic indicators. We currently have
demographic data'available fromthe. census with on-line computer
access, We have begun to develop a .computer based comparative data
base with comparative data at the national, regional and institutional
level on a variety of topics ranging from faculty salaries to student
data: .T.he area of economic indicatorsi.is,our weakest area, although
the 'recent addition Of staff with econdthic experti,e promises to,. .
addreis`thi's problem in the foreseeable fUture. The development of
Alta in support of the 'Collective Bargaining includes the usual em-
ployee Arvid studies and, projections.. In addition, vie have begun
- exploring the development of a computer based cost modeling system.
for use during negotiations.
CONCLUSION
Has,thjs, effort been' successful? Since concerted effort in thistr.
direction has only been in effect for about one year, any definitive
judgement would be premature. The Monthly Inditathr Report has beenG! ,' °. . .
very well.receiVed by, a limited distribution group,of primarily Central
Officestaff. We Kill be able to better evaluate its acceptance when
we expand distribution to the campuses and members of(the Board of:
Trustees. Both the Environmental ..Scanntrig and data in support of
29d.

.
U
,
,
.,
/.
I.
a
,4
-Collective Efargaining projects are in embryonic states.. . :..
The kmost measurable effects to date of this new direction has
4 282
resulted from the overall improvement in our date bate, as opposed
. .
to a specific product.' These effects have been as follows:-. .
.... . . .,- enhanced percepti6n of the Once of, Planning and. Institutional Studies as al data source among the
central staff members; \\.
- improved credibility with the 'Board of-Trusteesand;
I
, I
- increased .utilization as a data source by the campusesand Board of Regents staff.
I
$. 4
.
., ..
4 ,..
.
,1
.
iat
1
:
..
,
.
,
...
4- c
...
)

1
,
I
k June 1\6, _1982
k
MORANDUM FOR: President Dav" C. Knapp ..' -------_--------------
and Presi. t's Office Staffeit.....-
FROM: Jan apo at Ellen O'Connor, Post
SUBJECT:. .Monthly Indicators Report.
\J EXAMPLE.
t.
283
Attached is the first, in a regular series of Monthly Indicator Reports. The purposeof these. reports 'is to both inform staff in the President's office and on the cim-pusis, aid to build a uniform imiversity-wide summary level data base.
Part I of -this report is a fiscal analysis summary, by campus for the last.month.Contextual information proitded through comparisons with the previous month andlast year; expenditures year to date and pro3ected yearly expenditures are alsoincluded. Information on the President's Office, the Hospital and Group PractiCeis also provided.- This portion of the-report was prepared by Linda Post, and com-ments can be directed to her.
Pant II of this report consists of indicators.of the month. Each month we willselect a different set 'of indicatort for display and analysis. By the end of thefirst year cyile, we will have developed trend data on a variety of important issues.This month the- selected indicators focus on financial aid.
We have developed a tentative schedule of the monthly indicators for the next.year,'including' salaries, faculty movement and various cost analyses. However, we havereserved some space to add indicators suggested. by other staff members. Ellen O'Connordid the data collection and analysis for this section of 'the repOrt. Comments can bedirected. tb either pie or her.
This, the first of thelionthly Indicator Reports, is being distributed only to staffin the President`s. Offite. As the concept develops, we expect to enlarge circuTationto Chancelloq, persons on the campuses,. and others,. We very much look forwardto your comments line-suggestions. -
I295
*

0
MONTHLY REPORTFOR MAY 1982
EXAMPLE
.284
t.
.
The attached tables, summarize perionnel, payr011, and expendituredata for the month of, May fbr each campus and for the University Nas a whole. Highlights of .this month's report arelas follows:.
erAMHERST - Although expenditures are up significantly froM lastmonth, almost all of the increase is due to the occurence of fivepay periods this month rather than the usual four. When adjustedfor the number of pay periods, there is essentially no change inpayroll expenditures fro last month and*a % increase in- totalstate expenditures. T is % increase is mostly due to a
increase in the 08 account for water and sewer, overlast Month. I
. .
rWhen compared to budget, 'total state expenditures are slightlybelow'bUdget while both state payroll expenditures and number of
3 state positions filled are tight on budget.. Alternatively,hontniate payroll expenditures are running % over budget for.FY82.
With regard to Gran ts and Contracts, both the number of proposalssubmitted and' the number of awards receive4 are up % ,and %,respectively,. from last month; however, the dollar valUe ofawards received are down % from lase month. Assuming Amherstreceives approximately the same amount of award money in June, asin May, then the dollar value of grant and contract awards thisfiscal year will be ,% under budget and 13$ below that of FY8r.
$
BOSTON - Both number of state positions filled and, subsequently,state 01, 02 payroll expenditures are down slightly from lastmonth, -after adjusting for .five pay-periods. On the other hand,both .other state and non-state payrq11 expendStures add .totalstate expendi.tu?es are up % this month after' adjusting. for fivepay periods. .
.
.1 .
.74. . 4%
.
.
Proj,cted state popitions:lilled. vend State .01, 02 payrollexpenditure's are rilbt on budget for thii fiscal year. Likewise',total state expenditures are projected to come in slightly underbudget., Other payroll expenditures are..running*way over budgetbecause of large unanticipated increases in the "state 03" and"'state spacial "' payrolls resulting, from fte reorganization andclosing of qoston State COpiege, . . . . . k
%..-.
.MEDICAL SCHOOL - Total etate%expenditurea for .the month o mayare % below ., April's expenditures when adjusted for five-payper164s.yHowever,-April's expenditur,es mere abnorMally high evenafter adjusting for the'lpft-time expenditure of $1. in, theFamily-, Medicine Resideny Prograii. Mqpcev whencompared,withMarch's expenditures, totWstate expenditures this month show a'slight increase after adjUsting'for the extra tiayroli; and arecurreilt/younning,;.% below,budrt: ;
SV.
2.9 1
t

285
State 01, 02 payroll expenditures are up slightly over April'sad.tusted figure while other payroll expenditures are downslightly over the same period. Similarly, state payrollexpenditures are projected to be % under budget for .FY82 whileother payroll expenditures are projected to be %, over budgetfor the fiscal year.
Once again, the number of state positions filled has not changedsubstantially since last .month and is still running to %
under budget. .
TOTAL UNIVERSITY - state expenditureg are up' "% over lastmonth's revised figures after adjusting for five pay' periods.Also, when as justed'for the number of par periods, there it
.essentially no thenge in payroll expenditures from last month.,
When comparing projected -expenditures to this fiscal year'sbudget, state 01, 02 payroll expenditures are right on budge;other payroll expenditures pre running % over budget; and totalstate expenditures are % below budget. Number ,of statepositions filled ace also right on budget. .
,.
,
Net caih.balance available for investment = cash balance on allfunds minus state .funds and -projects - is approximately $million this'mOnth. This is' an % increase over April and a ' %t
increase over May 1981 -,
,
PRESIDENT'S OFFICE - Total expenditures are up % over fastmonth and % over May. last year. Likewise, payroll
. expenditures are by A over last month and A over May 1981.. .
Although this signifies, a dramatic increase in ,spending, pothtotal exApridtures and payroll expenditures are Well Under budgetat % anlia-.% of budget, respectively k
.0
tIOSPITAL - Materials notfsubmitted.
GROUP. PRACTICE - Total expenditures or May are down % fromApril's level but are up _ % over -May 1981. Similarly, gross .
patient revenues are up 4 over April, which was an. unusuallylow ,mOnth, and -.% . over May of last year. projectedexpenditures for the fiscal year litb slighlty -over budget, but /
4
that represents no p"roblem iince projected revenues are .% oVer*
. :
budgets -
...
The group'practice's cash balance is at ftl'%
) million, h highest. inonh-end level ever.
. .0i
(/1
291
ti

0
MUCKST
lotal State Expenditures
Payroll Expenditures:
State 01, 02
All Other
Total
NAlt1011$ Filled:
State al, 02
Al Other
Total
0 Grants a Contracts:
Proposals SuUtitied
Awards Received
Oorlar Value
BOS1ON
Tutal State ExjenditureS
Payroll Expenditures;
State 01, Oi
. All Other
Total
NS]Liuns Fi 1 1 At
State '04 02
All Other
Total
23.
MONTHLY REPORT '
FOR MAY. 1482-,Change from
Current*** Last % Chinge from Same MonthMonth Month Last Month Last Year
v
a
a
..NA * riot Available , 1
* Expendttures Year to Date s (Current Month's Expenditures x 4/5).**Aurrent Month's Receipts. + ReceiPts_Year to Oate* *Currentmonth includes five pay periods rather thah,the usual four.
a
A
4
Expenditures ProjectedFY82 . Year Expenditures
Budget TO Date For FV82*
a
% of Budget
4
x

a . a
.6
' INDICATORS OF THE MONTH.
287EXAMPLE ,y/
.The r. ant indicators for June focus on financial aid. The extent to whichrecent changes in federaffunding policy and rising costs in higher educationaffect student enroilment.is of increasing concern to institutional adminis-trators. Three groups of variables have been selected to provide insight intothis issue; the-relationship between income, average award and tuition challges4
.need .versus aid ana.an analysit of the interaction between the aggregate stu-dent expense-budget and varia4 aid sources.
INCOME, AVERAGE AWARD AtD TUITION CHANGES INDICATOR: When average income forboth independent and deptndept aid recipients is compared to average award andtuition rates over time, several interesting trends begin to emerge. Thesevariables help explain the Uniyersity's ability to offer award packages thatkeep pace with changes in income and tuition. Ideally, tuition and inflationincreases should be matched by injections of revenues into financial aid as .a..university facesan obligation to, provide full aid when needy students are \accepted.
;
Table 1 lists these figures for both Amherst and Boston; whereas Chart I and IIare graphical depictions each campus' percentage change,i*the variables,The percentage change fr m FY 1978 to FY:1979 in average award for Amherst wasa 20% increase, but the incrsase from FY 1979 to.FY 1980 was only 3%. Thts lowwas off-set ,im part. by the percentage change from FY 1980 to FY 1981 where thesize of the average award rose by 13%.Independent student's income has risen lABLE I-
at a roughly constant rate with theexception of an 18% dip betweenFY 1978 and 1979. This constant 1011100. AVERAGE AWARD AND AVERAGE INCOME
increase was relatively close tothe rate of inflation which issignificant because tuition hasrisen It a greater rate.
NS
4
. 1978 1979 1980 Mi leg
Union 450 525 625 700 '952
Avenue Ausrd
Atherit 1.552 1.827 1.940 2.192 N/A
Ooston 1.560 1.536 1.608* 1.785 OVA
Dependent StudentIncome
16.800 18.4150d,) 20.003 22.408 4 11/A
10;006 13.069 114115 14.902 16.417 N/A -**
Indeigendelt Student AIncome
Amhersi 2.635 2.150 2.305 2.647 N/A
Oaten 2.782 2.903 3.841 3.526 NIA
-30o

.e .
288
6
Tuition increases jumped from a 9.!.. hike during 1978-1979 to a steady 20 percent
rise in sub.se4uent years. This gap of about 105. between tuition and the other.variables suggest that, sine 1979, parents of students on aid and aid recipients.have contributed a larger share of their income to educational costs.
, ....
;
a
INCOME' AVERAGE AWARD, AN4TUITION_ CHANGES FOR THE
hmHERST CAMPUS
......, At:Wm,* ............. .'''
r MA
4.241, 74 79 -NO O. -Of
FISCAL 'EARS
CHART I
a 1 tWRNSE IN llestP STUDENT INC:
... 1 CHANCE IN DEPSIUDENT INC
-.- g CHANGE IN AARAGE.AKAAD
..- 1 CNANK IN TUITION
re,
Boston's graph (Chart II) shows that the percentage change in independent studentsincomk swung from 4 percent rise over FY,1978 to FX.1.979 to a soaring 32% increaseduring the following year, and then dropped to an eight percent-decrease over 1980to 1981. It is difficult to_say why these aberrations occurred. Perhaps mare trulyneedy students chose to attend during 1980 81. Avera94 award and depan4ent student',income increases nicely converge during the 1980-81 period, but; the , similarto Amherst, between tuition increases and average award payouts has held steady atabout 10% Once 1978.
"Doran.
INCOME, AVERAGE AWARD ANDTUITION CHANGES FOR THE
BOSTON CAMPUS
CIO.
1 CIO
VNJ,
.7
ItCH11 79 . 7980
FISCAL MISWIN
CHANGE M 10E4 SIMKO INC
- fi CHANGE IN DM COVENT INC
11,CHNIE IN AVERAGE MINN
01A116E IN INITION
e.

4
V
A Case Study ofThe Academic Planning'
Process.
Janyce J. Hipora. Director of Planning nd Institu tonal Studiel
Syste fficeUniversity o Adssachuse s 4
250 Stua t StreetBoston, 02116
This paper reports a case study an lysis of the,planning process at a
major public university over a t4 -year eriod. It is unique because, unlike
previoys studies which have dealt with the,planning process in'eithev.a tech.:.!
nical or superficial manner, it conceptuali/es planning as a politital pro-%
ces The sele0ed'institution launched three distinct planning efforts
during this time, offering a microcosm for study. Studying the same institu-
tion over'ilme provided a setting in which certain variables were stable and,- .,
facilitated comparisons which could not have been,possible among different
institutions. These comps isons added to the understanding of those factors
which contributed to the sukcess or failure of the effort.Jr'
The focus of this study was on comprehensive institutional academic
planning. Comprehensive, in the sense of examining the way an institution
integrates its various subuni Ps. Planning as it occurs inethe individual
subunits is not without its i ortance, 6ut, for purposes of this study, was
dealt with only as it related to overall planning. Institutional, as op
posed to/state -wide or multicampu& appro'aches, although the linterface.bel-
bween the institution and the larger entity to which it belonged could not
be totall ignored. 'Academic, .in the broad sense of dealing with policy
questiOrland resource allocation, but with physical planning only tangen-
tially/as it inmpact4d upon academic decisions.
fi
Brief Literature Review
During recent years, change has pervaded higher education institutions.
A sur4 of over.1200 institutional presidentsb found that over three-
fourths of the respondents could identify a major change that had a signifi-.
.cant impact on their institution (Hocigkins(41974). However, despite the
realities of the environment, a subsequent study found that the planning
efforts undekaken,byinstitutions fared 'quite poorly.
I
289 3 0 2
290:
Although presidents unanimously endorsed planning as necessary and
desirable; academic plans,, on the whole, were characterized by a rejection
of the idea of scarcity and lack of Connections to the decision- making4
process. (Cohen and March, 1974). Thus, althoughinstitutional leaders
recognized,the problem and albeit in a generalized manner indeniified
the tools with which to cope with the problem they, for the most part,
have been'unable to,convert-this knowledge into an operative academic
plan.
ItIn order to plan more successfully, institutions need abetter
understanding of those factors which contribute to the success or failure'
of their efforts. The recent literature on planning has been primarily
descriptive rather than analytical. NCHEMS,00mmissioned a series of
four case studies in 1978, a project which appeared to be promising.
However, upon publication- this turned out to be merely an, examination of
the planing process documents rather thafi the process itself. (pia4S,
,1978). The limited analytical literature available has tended to focus
primarily on program budgetiitg, business techniques as applied to education,
or the cost study approach. There is very little attention paid to a
discussion. of -the interrelationship among value considerations, leadership,
and participation. /indeed, most of the writing has totally ignored the
political conterttAithin which such planning efforts have taken place.
Methodology
Preliminary research indicated that the case,under consideration 'N
could be divided into three subcases used on three distinct chronological
periods. Each period was distinct in approach, principal characters, and
)outcome. Each subcase was then individually evaluated along two dimensions--
.
a product dimension and a proces, dimension.
The hypothesis was that peOormance along either dimension would be
accounted for by thise variables. These variables, which were identified
3 u
1r"

1
. 291
through an extensive review of the literature included; a clear conception
.of tbstitutighal mission, the level of faculty participation, and the
quality of academic leadership. It was further hypothesized that one or
moreof these variataes acbounted for performance along a particular
.dimension wore than. along the other dimension.'
The ease study method was selected in order to provide sufficient'
detail and analysis to illuminate the complexities of the planning
process. The decision to study an-institution over time rather than
comparing institutions, was baiedclArgely on two major considerations.
First, stice the\bject of this study was an in-depth analysis, there is
some question whether a sufficiently thorough understanding of the
political aneadministrative complexities of a second institution wild
have been possible. Without access to candid and sometimes sensitive.,
information at other institutions it would towteen impossible-to
duplicate the in-depth and critical analysis. Second, the institution
selected offered the near ideal compromise. Since preliminary ,research
indicated that there had *.nthreamajor planning atteirpis over a
relatively short period of time, it'was possible to make comparisons
within a felatively stWbleorptext:
Data for each case study was developed in three steps. *The first
was to disdisseach eubcase informally with persons who had.been 016
campus during that time.- This, provided preliminary, although unfacUsed,
information. The second step was to review the available writtendocuments,
. including minutes of meetings, correspondence, reports, and newspaper
accounts. Particularly for the first two subcases, there was extensive
documentary material in the university archives, the planning cxmmittee
files--whiEhware Still intact--and in individual personal files. This
background information was used to produce a chronology of events, an
304
t.

41.
.. .
. f :
interview list, and a, list of guiding questions for ih§interviews.
The third step inVolvedextensive interviews with partticilaants. Almost
thirty formal interviews were held, averaging over ninety minutes each. .o
On a more informal basis, countless conversations were conducted with0 .
fabulty, staff, and administratois over aseveral year penal. These.
discussions contributed greatly to the overall understanding of the
institution and the content in which planning efforts were taking place.
. Definitions
There are almost as many definitions'of planning as there are
or
,writers addressing. the topic. Although there is a great deal of,overlap4,
and duplication, two viewpoints on planning emerge. The first, offered
largely though not exclusively; by writers of-the late 60's and very
early 70ts and writers witoh a business orientation is essentially
product oriented. This conceptiCaof planning focused on how to arrive
292
at and what to' do with a "plan':. (Drucker41964).
\ ',ter writers and those writing with specifiC application to higher
education .modified this concept by focusing on the planning' process
(Benghart and Trull, 1973 and Halstead, 1974). As practice indicated
that careful! planning did not necessarily result in inplenentation,
particular attention was paid .to the development of criteria for evaluating
planning effectiveness oimr7tine (Gianny and Weathersby, 1971).
This case study is interested in both of these dimensions of planning.
The development of a final plan is important as the end product of the
process, and as the mechanism against which to neasure progress. However,
the process itself, including the development and the implementation of
the plan, is integral tb the entire process.
The follewing are ite operational definitions of these two dimensions.
,
r

293
ofplanning as uselln this study.
Dimension I, the product dimension, was primarily concerned with
. .
whether a plan was produced) and implemented. The criteria which were
used in evaluating a planning effort along this dimension included: were
thd goals Clearly determlied, the problems diagnosed, tlieoptions thoroughly
examined, the possible solutions select:ed; and a plan of action determined?
Although the focus along this dimension was primarily with the product,
the mere writing of the plan was not suffiCient to indicate success.
The plan must have been, to same extent, successfully related to the
Ongoing life of the institution. However, there was no attempt to
evaluate the long term outcares of the changes instituted.
Dimension II focused on. the process. -A planning process was evaluated
along pimensionrII by ascertaining its maize to the institution. The
criteria used included: Did the procesb serve to educate the university
community to the existing possiblilities and constraints? Did it foster
an acceptance of the concept of planning in general and of this process
4in particular?P
Institutional Mission - For purposee of ibis study,institutiosal
mission was defined as the compendium of Values and priorities oF the
institution. The issues which an ingtitut4ennust facie in this regard
are staggering. Some of them include a delineation 'of the constituenciesI
served; the balance between-teaching, research and service {Kerr, 1963
and 1972) and' an outline of institutional role as A professional school,
liberal arts,college, graduate centervet. ONaldridge; 19 71a and 1971b).
Although virtually all institutions halve "mission statements", they all
too often are authcred fpr public relaticris purposes, rather than being
a thorLbugh look 'at the institution, its plesent and future.
A review of the literature on institutional mission and gol?. develop-
I./ 0

294'
nent raised several questions useful for evaluating the development of
institutional mission. These questions form the core of the operational
definition of institutional mission as used in this study.
Has the institution reached broad agreement on its mission?
Has the institution resolved the conflict amang goals?
Has- the institution been able to move from ideal goals to
realistic rals capable of .implementation?6 -:
There is ample evidence inthe literature that mission definition
is not an easy task for institutions. Several authors describe the
; 'tsplits within and.among'goals as both fundamental and inevitable (addridge,
r
1971, and Kerr, 1963), springing from the fact of competing pUllsionNan
institution as it attempts to adhere to exiaect.alions of its "backers" in
government and society, while at the sane tine trying not to stray too
far fran internal assumptions and expectaticips(Ridhman and Fearer,
1974).
Faculty Participation - The political environment of the university'
as well as the traditional role of the faculty in shaping academic
programs argues for .;higher level of teculty involVement than may be
necessary in other types of organizations. The literature"offefs several
good reasons for including faculty in the planning process.
First, planning is an opportunity to familirize faculty with 0
internal administrative problems and priorities as well as with external
constraints imposed by local, statewide or federal regulation. This
continuqus communication forces both faculty and administrators to
recognize diverse points of view and conflicting interests. Faculty
participation in planning is, therefore,* an education prooede which
should be viewed as a long term investment (Lindblom, 1959).
A second reason for faculty participation stems tram the. fact that
I
V

10 ,295
planning Suggests change, and that chani and innovation by their very-4,.
naturtare threatening.' By actively engaging faculty in thepLuvii.pg.
pr9oess, thelluMbei of unknown factors can be reduced, and kesistance to
change can ,36e reduced by relieving real, or perceived threats to-autonomy.
and secu$ Participants will Alewtheptoject5s their own if they
have participated in,diegnosing the prOblem and have agreed on the
defitrioniand:importance of the problert.and'adopted the soluticri by
-group decision. (Watson, 1969).
The issue of facultiparticipation presents tbs planner with two
prdblem. The first, is hew to identi faculty with the ability to
exert a leadership role during p and implementation. Lindquist
described the ideal faculty participant as a'"cosMopolitsn local ", a
person who has an extensive network of external yet is esteemed
and influential in campus govetnace groups, And is often an opinion
leader. Be concludes that the extent.to whidh planners can recruit a
'core of faculty able and willing to exert:a lealthiprqie in the
1-
implementatiot.: procOs may prove to be a key. to successful planning.
{Lindquist, 1974).
The second problem is. hOw to structure the process to assure the
optiroar 4.,ilization of the participants.4 Pacultk participation in
plannipg has been studied along three dimensions: the type of
ate
.structure; the degree Of faculti/admizitstratian integratian and the
amount of faculty participation. In most cises, planning was 0,$,Qatp.lished
through the existing committee structures where it had to col Pete for
attention among the array oriiems generally handled thr60, this structure;
that faculty and adrdnistra participated seperatelytanc; that. faculty,
v
participation was generally lighipand regarded as peripheral. Reooritendations
° to address these problems have included joint planning committeesto
. 398
4
.

\ ....
.
. .
.
. .
'
\provide.amectanism for o3mninication between faculty and.admipistrators,
. i%
296
0
and to focus attention on planning, and; steps.tO assure that participation
or,,in:eaanning be considered a legitimate part of jhe faculty roles,and tot
recognized in the criteria for faculty promotions .(Pa1O4, ratimann and
Blischke, 1971y.
The followtog questions form the core of amoperatonal definition
of-faciaty participation as used in this study.40# 4
' Is the level of particrtion _appropriately based on historical
pa4ide, organizational structure and the desiiability of using
"t1;e'paanniniprocess as a tool to educate facult1g2
Has a cadre of faculty members been cultivated who will be useful
to the ,process?
is there a structure that assuses that facult0.9pUt is not ely .
reactive, and that participation iS active and-neaningful? a . w
.7r
Leadership - A fully develcRed discussion of "leadership in a university
must be placed "thin the context of the relevant organizational/governance
models. Unfortunately, this discussion is beyond the scope of this
short paper. 1
In the literature, essentially three peripeetiires on leaderahip-, o
.emerge. Although they do not represent all perspectives con leadership.,.
they are useful in understanding the role of the leaderas 'planner. The
first, is the planner as manipulator,' using per in a, "mechanistic"0
sense. This approach portrays the planner as retiring tchis/iler,pEfice
and developing a plan in a technical sengsyreiod4i:,1972).' phis model
is inaPpropiiate to the university due to its peculiar,,oiganizaticreb
structure and diffuse power. pattern. The second Con oepi of leadership : 1'
(i,4eu;tadt:, 1960) points out that even in a hierarchr-tpaler and authority'
are not as simple as they seen. Thil perspective empihasiies the. importance
.

a
1
of periondl influence.p-
297,
4..
The third conoett of leaderShip.was develoPed by futuristic ?writers
(Bennis, 1966' and Mosher, 1971) ,, who describe the futliire organizattonai
l' as an adhocracy. -Their description of an adhocracy bas horny of
the-same attributes as a university; decentralization, increased-partici-, 4
pabon, specializatic,ind professionalism. The essence of leadership
in such an liganizatiimal structure is stimulative and collaborative*,
rather. than directive.
It is difficult to formulate an OPerational.definitionLof leader-4
ship in the - university setting. Hcever, it is quite clear that leader-.
shipis more than Issuing an order and having it carried out. Leaders
must command considliable persuasive powers, and be. able -to function in_
an environment in which speciaists, i.e.4itculty, can make legitimate.s
claim to having superior expertise in scsi areas.
p Analysis
The case study institution was a well established graduate/research
uni4eriity. IT. was one of the several.mflagship" campUses within a,
major state system. It experienced significant programmatic and pAySical
growth throughout-the iat6 sixfies /d5 the seventies. During the period
under. study, thalnstitution enrolled approximately 23,000 students,
roughly divided,into14,000 undergraduates, 4,000 evening students and
5,000 graduate and professional students. Major programs Caere available
in close to one hundred fields, through the Faculties of Arts and Letters,
Natural Science and Mathematics, Social Sciences Education and ten
professional shoots.; There was Also a- large Divi.siontof Continuing
Education. .r-
)
Each of -the"two-major division, Health Sciences and Academic
Affaiis was headed by a Vice Piasident, who reported directly to the
3'u
44.N

0-
I
4
47
president. In general the academic structure was quite traditional,
298
with deParment heads or prdgram directors reporting to. Deans, who then
reported to the appropriate vice president. Over decade under
consideiation, tTie,was a great deal of movement at the'pean leVel and
Within the position of Vice President for Academic Affairs. During thii,
time/ however, the president and President for Hialth Sciences*
retained constant. 4., ..1
1972-1974 r Shortly after the appo trent. a a new president, a .
yeVice President for Academic Affairs (/WkA) warbecruitedw441 a specific
mandate to produce an academic plan. Over the next threy2ars, thee
\.,
university was to.beoome involved in what were essentially, three separatefi
attempts to develop this plan. The first attempt"oonsisted of a Waft
per6onally developed by the VPAA. However, it was soundly rejected by
the Deans andiProvosis, who in turn, set out i6 develop their own plant
However, after several drafts,'theywere unable-to reach any agreement.
The third effort was initiated by the Faculty Senate as axesult of,
frustration at being left out of the process. 04"s:effort, which took
over a year, produced an official document. ik,wever, it' was vague 'and
had po impgct on,the university community. .
The university make no progress in developing a consensus on insti-. ,
.tutional mission as a result of this planning effort. The VPAA's arti-
culation of institutional mission was divergent from the prevailing norm,
iri the academic world in'general and that institution-in paxtibular.
The' Deans and Provosts and the Faculty Senate focused within a very
narrow range, and were preoccupied with process. The effort was further
characterized'by almost no faculty participation until late in the
process,.and a 4asic disagreement on what the desireable role of the
faculty in academic planning should be. The VPAA's personal style,
3 1

299
concept of 4dritiniitriative resortsiiglityk and view of the university
worked against his being able to serve as an effective leader:
. -
's At the end of this time, the VPAA had severely strained relation-
ships with the Deans, theNculty and the president, resulting in his
resignation. The university carrainityiwas 'torn by differing opinions ch
the nature of &caddmic planning,pe'appropriate roles for the different
constituent groups and even on-what constituted a proper time frame.
IThe period ended not only without producing a plan, but- with significant'
"costs incui--ted by 'the breakdown of 'tlie planning process.
1975-1976 - After the resignation of the VPAA, the university did
.1 not halve a permanent VPA/k for two years. Neverthelesi, the president
was determined to develop a plan, In an effort to avoid the mistakes of
1972-197/4, the president' decidedto retain control over this process
himself, at least at the,beginning.
The-mechanism the president selected was to appoint a "blue ribbon"- .
committee of -faculty, with faculty members as cochairs. This comittee
was appointed by the president, and was to be advisory to him. The
oortytttee undertook an ambitious and extensive study of the university.
They ultima tely produced two dccurrents, an interim report, *Lich aroused
great controversy on carpus, and'a final report.
This planning process also lacked a clear sense of Institutional
mission. Although, t1!e president offered his personal view of the mission
a separate document, and the Committee tried to define specific
laments of institutional mission, subsequent events indicated that the,
stated mission did not represent a consensus. It also was judged as
having an insufficient aliatmt of faculty participation. Although the
planning carrnittee was mostly faculty, it was a small group, and did. not
04
3121
1

. .
/... /
.adopt a widespread consultative or participatory process . Leadership
.wfrthin the .ccirraittee was exerted by ,both the president and the co- chairs.
. HOweyer, when Alibirations e.ntered the fbrult of thei entire,unlitersity,
4 4 /11 t ,
the leadership of the 0d-chairs was insuffic).ent and presidentia3. leader:-).
ship lapsed... . .
Although this process pro duced a plan, there was widespread agree-.
--
ment that no reccurrendations of the plan were implemented. On the1
°process dirrens\on, this planning .effort received mixed evaluations:
Interviewees pointed out that the process had educated people 'to the
reality of limited resources, created a cadre of versdns knowledgeable
about the university; and served as a basis for future plans. However,
.* the costsof another failed effort at planning, in terms of the per-
) ,ceived credibility of future planning efforts were high.
1976-1980 - The most recent pianning efforts studied were very -.e; $
closely identified with the new VPAA who arrived on campus in the fall
of1976. -Prior to his appointment, this Vice President, likeohis predessor. .
several- years earlier" was assigned the task. of developing an accidemic -
o,
..... N plan. ./Soon after arrivMj!on campus, the VPAA. appointed, a sitall number of
task forces to advise him in seleCted areas. .iitile viese panels were
deliberating, the office of Ad:Antic Affairs would be reviewing su.gges-o
to een..5 of priorities frail previous plans. The)'
new VPAA emphasized that
this, planning cycle was to benefit from the suggestions and evaluations,
of ,the previous Presidentts Committee on Academic Planning, refining and.
challenging them and developing alterhatives where necessary.,..
This effort resulted in an academic ,plan which had 'fairly wide)
consensus on campus., There was general agreement that the VPAA had been
an effective leader', willing to consult with various groups4
. 4
31J- 4
I.,
.
^
)
t
,
Al

ob
301
the best possible use of the Deans in the paanning process. However,
there was only limited participation by average faculty. 'Although the
sense of institutional Mission was considered vague - relying heavily on
statements contained in previous documents - it caused little or no
reaction.
This plan was the only one developed during this period which yes
technically capable of implementation. It was the VPAA' s own plan and
was written in terms (student/faculty ratios) that he was able to control
thiough his budgetary power. This approach might have waited had he
remained in office. However, he left campus for another position before
he had time to inrplen nt the plan.
Most interviewees felt that this planning process had been beneficial
to the university, if only because the institution had completed a major
planning effort without having experienced a major trauma. Others
pointed out that the consultative process educated persons to internal
and external contraints.
The results and/or conclusions are based only on the research
conducted at a single institution andjnave, therefore, Limited applicability.
However, they provide interesting joints for fgrther research at other
institutic,. i
4)
- In the absence of ill three variabIes.a clear sense of institutional
mission, faculty participationl'and appropriateleadeiship--there
is little probability of long team success at either developing and
implementing a plan'OamenSion arimmilWWna planning process for
purposes of ongoing institutional `development (Dimension
- Faculty participation and administrative leadership affect the
planning effort along Dimension II. Further research i.s secessarY.
31 .
at.

- 302
in order to determine the appropriate. level of each variable or the
best mechanisms to be employed.
- Since each of the planning efforts under consideration were
Characterized by the `lack of a clear mission statement, this research
dia not provide any insight into the inpact of institutional mission
along either dimension: Peihaps_resrrch at those institutions
which are marked by a dlear institutibnal mission, particularly
limited mission, privte institutions, may be helpful.
31:i:
0.

4
LEADERSHIP
Sub case I Sub case II Sub case III.)
VPAA's personal style, conceptof administrative responsibility.and view ot the university workedagainst his being able to serveas an effective leader.
While the arum was the catudtteeitself, 'p had been exerted
by both the president and the co-chairs.
When deliberations entered thethe forum of.the entire university,the leadership of the.co-chkirswas insufficient and presidentialleadership lapsed.
Agreement that the 'VPAAhad been an effectiveleader.
He was willing to consultwith various goups, and tomake the best possible useof the Deans in the planning
process.
. Low_ level of .faculty partici-
pation
kbasic disagreement on whatPAFTICIPATICW the desireable role of the
faculty in academic Planningshould be.
MISSION
3 1 a
The amount and nature ?tof faculty
participation was insufficient.- although mostly faculty,the PCAP was a small group
- the PCAr did not developa widespread consultativeor participatory process
- PCAP ambers had-been sel-ected in the President'ioffice with limited invol-sent by the Faculty Senate
High degree of participa--tion by Deans
Limited participation byaverage faculty
VPAA' s articulation of insti-tutional mission was divergent
. from the prevailing norm of theof the academic world in generaland the university. in particular.
The Deans and Provosts were uri-able to articulate a universitymission due to their.pre-occu-pation with process.
The Collegiun focused within avery narrow range.
'The president offered, his personalvieg, of the Mission of the univer-sity in his. statement, The Univer-sity: Its Purpose and Fulfillment
PCAP specifically tried definethe elements of the Insatutional.mission.
Events surrounding the release ofthe Interim Report indicated thatthis mission statement did notrepresent a consensus..
Sense of institutional mis-sion was vague--reliedlargely on statamentstamed in previous documentslittle or no effort to re-think the bails for then orto build consensus.
There was little 'or no re- '
sIact.ion to the missionstaterrent
O-317
(.4

MajorPlanningActivity
KeyParticipant
.t
4
Major Event orResult
Sub case II Sub-case III
Personal planning byvPAA
'Academic Affairs Council
Faculty Senate Efforts
. .., .
. ..
"Blue Ribbon Committeeconsisting of faculty,administrators andstudents--appointed bythe president and:advisory to him
,
-
.
.
Deyeloped a consultative plan
i .
e
.
. ...
InNW.
Deans and Provosts' 1 .
Faculty Senate apPointed.Ccomittee
. _
.
'No co-chairs of the"Blue RibbonadWittee"
In laterstages thePresident and the FacultySenate
.
d
the Vice Presidentfor Acadeinic Affairs
'
1
.
draft'documentdevelopedrlater rejected by theDeans and Provosts
draft document,
,lack of consensus-
final docent produced-too late to have any impacton the process
'No documents, an InterimReport, and a final reportneither had much impact
.
.
V-
.
. _
.
3
Plan completed in three years
Fairtyleidespread consensuson .COVINS
Some evidence of implementa-tion
. .
.
.
031J

'AtmEmodp.s
Baldridge, J.V., Power arid. Conflict .in the University, New York: Wiley,
1971a. .
Baldridge, :Acadernic Governance, Berkeley, California: McCutchan,
'1971b.
Banghart, F.W. and Trull, A.4r.,,Educationaltaanning, New Yolk: The.
4McMillan Company, 1973.6,
Bennis, Warren G., Changing Organizations, The JOurnal of Applied
Behavioral Science 2, ,Summer 1966.
Cohen, Michael D. and March, James G., LeadershlOraid the America:
College President, New Yorkf N.Y., 1974.
VDrucker, P.R. , Long Range Planning Means Risk 'Taking.' In D.W. Ewing
. (Ed.), Ion Range Planning for Mahagernent, New York: Harper and Pow,
1964.
Giellkly, L.A. and Weathersly, G.B. Statewid Planning for Postsecondary
Education: Issues and Design, Bouldei, Colorarlo:National Center for
Higher Educataon Systths, 1971.
Halstead, D.K. Statenir' Planning_ in Higher Education, Washingtorr: U.S.
Goverment Printing Office, 1974.
Hodglansert, Harold L.1 Institutions in Transition, New York: MoGraw-
Hill, 3.974.
Herr, Clark, The Uses of the' University, Cambridge, MaSsadiusetter:
Harvard University Press, 3.963 and 1972.
Linblin, Charles E., The Science of Muddling Through, Public AcInini-.
stration Review, Spring, 1959.-
Lindquist, Jack, Political Linkage -- The Academic Innovation Process,4
4/ournal of Higher Education, May i974.
32uI
305

Mosher, Frederick D., The Public Service in the Tanporary Society,
Public Adkinistraticm. Review, January-February 1971.
National Center for Higher Education Management Systems, Academic
Plannin : Four Institution Case tudies, Boulder, Colorado: NCHEMS
1978.
Newstadt, Richard E. Pres tial Power
1960.
Wiley and Sons,.
Palola, E.G., Lehmann, J and Ftlischkely.R., The Riluctant Planner:
Faculty in Institutional Planning, Journal of Higher Education; San
Francisco: Josey-Bass, 1974. 4
Temkin/ Sanford, A CCuprehensive'PLxmaingNIcdell Social Eccnamic
Planning Sciences, January 1972.
UUtsonl*G., in Bennis, WI Beenne, K. and Chin,. R. (Ed.),.The Planning
* of &angel New/York: 1969.
)
32:
V
s
4P4
306

0
a
-
ESTIMATING NET COSf.OF COLLEGE'ATTENDANCE IN NEW YORK STATE
Development bf Net Cost Indices for Full-Time UndergraduateStudents in Four-Year Colleges, for Relative Comparison Over Time
Donald Nutter-
, Paul Wing
Susan Silverman
New York State Education Department.
O
,INTRODUCTION
The forma' title of this paper was chosen for its brevity and clear
reference to the general subject: net cost of Attendance. But the sub-
title is the more accurate one. What is reported here, in the hope that,
it may be of value to those working in.the Northeast is the development of
three preliminary indices of net cost of attendance for the ultimate pur- ...- .
pose of enabling comparisons to be made across types of institutions-and
over time. . .
TWO statements should be clearly made at the beginning. First, the
.wOrk reported here iislt a'preliminary stage of development. Second, as
temphasized by colleagues in a recentpaper: "...one cannot subract average
aid per recipient frOm average total cost and define the difference as the
'average cost incurred by every student.' However, onecan describe the
growth of program awards and institutional costs from year to year to ex-
amine trends over time." [8]. Ultimately the work reported here would
be considered successful if it led to indicei comparable in function to
the Dow Jones or Standard an Poor's averages of major industrial, util-.
ities, transportation, etc., stocks -- offering a -"birds eye view" of
complex movements of costs of college attendance over time.
The three indices described in this"paper are not the final ones to
be developed in New York. Work has already begun:on more effective indi-,--cators of net cost of attendance. It is instructive, however, Rreview
both the procedures and the implications of the three preliminary indices
described below.
307
4
.322

308
BACKGROUND
Higher education n New York is under the authority, of the:Board of
Regents [5]. One of tie many responsibilities of.the Regents,whose staff '%.
4 is ttje Stpte Educatr n Department, is planning and coordin tion.
The Board of Regehts, in their 1980 Plan ?or the Develbp nlibof Post-
secondary Education [6], identified as a policy objective maintenance of
"a balanced system of higher education." :The unique strengths of all of.
the sectors should be preserved in the public interest, in Order to offerf -
broad curricular choice, to retaln:the existing rich variety of-campus set-
tings, academic styles and institutional Mission's, and tolsuegOal-d the- , 4
economic support for local communities provided by the presence of colleges
and universities.
After some initial discussion, "maintenance of a balanced sylstem" was
determined to mean--at least initially--monitoring of sector balance, or
Sector stability, in terms of enrollment shares. But it would not be enough
to look only at annual enrollment statistics; some better insight.illip_shifts
of student institutional choice from.one sector to another.(should such
shifts occur) would also be desirable: Student is a complex sub-.
A
. .
ject.but cost is known to bean important factoq,[7]. Net cost - -t e. "real--,
cost" to the student or his/her family after all financial aid ha been re-%(
ceived--is one determinant of access to college, particularly which col-t
lege is attended, and also sector enrollment balance.1
Measurement of net cost, as one aspect of monitoring sector balance, I'
was appealing for several reasons. Essential data are forthe most part
readily available. Net cost is at least partially subject to programs and
policies over which astate government has control, especially financial
aid and.public,tuition levels. Some index of net cost, if it were calculated. I IA
consiste tly using comparable data, over a period of yevs, could suggest
needed c rises. Fad example, one would expect (without really knowing,, .
of course) that an increasing differential, between cost of a endirig public
institutions and similar independent institutions.woul ntualliresult
in significint shifts in enrollments to the publics from the independents [1].
If this could be shown io be due solely to.cost fictors, then some legis-
lative or other changes might be warranted:.
*
32J

309
, .
While there are differences between the ways in which higher educa-
t ion is organized in New York, and in other states of the Northeast, there.
is plenty of common ground. The preliminary efforts reported here, should
be of interest to colleagues in other states as well as those in New York.
LIMITATIONS OF THIS WORK
Net cost of)attendance is unique for each student at each institution.
Within a single institutional type (e.g., independent colleges) may be col-
leges very diverse as to tuition level, location, prevailing life styles.
Forven one small institution' there may be a wide range of'net costs de
pending'on student backgrounds and student aid packaging. Development of
indices to summarize these different net costs requires many hundreds
averages - even averages of averages. Just as average net cost figures can
be worked out for individual institutions, weighted averages based on enroll-
ment may have to be calculated for institutional types and for sectors.
Since so many variations of tuition charges, student aid, living expenses,
etc., are averaged out, it would be.incorrect to refer to 4 single "average
net cost" at any one point of time. Instead the indicekishould be used to
show trends over time or relative changes among sectors, institutional types
or income categories.
Adeally, the concept of net cost should include all costs to the stu-
dent and/or family related to college attendance and all forms of student . Y
aid. In work reported here only tuition and required fees, and certain
. ( other costs: room and board, books, personal expenses, aQd so on, are.
considered. Likewise only selected types orstudent financial aid as in- a.
cluded.
ther iimitationsAre-: the analysis is restricted to full-time under-14
graduate students only (except where indicated otherwise) and to four. -year
institutions oaTy (except where-indicateh otherwise). Loans are not in-
cluded as financial aid, mainly because of uncertainty about how to measure
the value of subsidized interest, and because loans are essentially pur-
chases of a service, although they may be helpful - even essential - to some
prospective students: The. income categories used, although carefully
developed and documented, are unavoidably arbitrary. There elsomay be
gaps or errors in the data used, although where these have been found,
they have been corrected as carefully as.possible. Even Withfthese limita-
324

/
310
tions,Poweveri, the present work has produced interesting results which it
is hoped will stimulate discussion and reactions from the field.
AL--INDICES DEVELOPED SO FAR
Three different indices are described below: "Nei Cost Index 1,"
)1Re "Tuition Net TAP Index," and "Net Co;t Index 2." They-represent,,the
first three stages in an ongoing exploration of the measurement and inter-
pretation of net cost of attendan/ce. None of the indices is perfect, in;
.'deed tliere probably is no perfect index, but there are insights to'be
pined from each oftz.44m. The major elements of, the three indises are
shown in'Exhibit 1..1
"Net Cost Index 1"
This was the initial effort, designed primaril3( to determine the feas-
ibility of developing a net cost index. Only two sectors, the independent
and the Stateiniversity (SUNY), were considered. Comparable data for 51,,
independent institutions and 43 SIJNY campuses were taken from the Educations
Departments! Higher Education Data System. Approximations of room and
board and other costs were from the CSS College Cost Book for 1980-81. As
Table 1 shows, both sectors included some 2-year colleges.
Table 1
'V'"_4 e Cost Index 1" Summarized
.
I
4
Public (SUNY)
(4)
(1)
(11)
(3)
(3)
(6)
(15)
.
-s
Average
%
W1111,
fY
4,
University CentersHeallJuScience CentersUniversity College
4 SpecializedStatutory, CornellAg. & Techs.Community Colleges
Independent
$ 3,1333,8102,7553,2935,4292,973X20
(43)
(4)
(3)
(13)
(12)
(5),
(10)
(1)
(1)
(1)
(1)
(51)
2,987
$ 6,7955,0195,7714,3314,8413,144.
2,9585,6182,9834476k
Multiversity- ,
University,Coil. ComplexCollegeEng.-TechnologyTwo-yearHealth Sci 'CenterSpecializedSeminaryNursing ,
$ 4,731
Net cost ratio 1:1.6Net cost index 0.6
Net cost difference $1 7

C
t
Exhibit 1
Major Characteristics of Three Net Cost Indices
"Net Cost Index 1" :'Tuition Net TAP"
year(s) 1980 -81 1978-79 thru 1981-82it 1
Income Categories" 1 3Nraw.o.
Basis .far
Calucation institution" sector. .
NO. InstitutiohSi 51 independent43 public.
,
Costs as', other T&F
'NYS, Fed."; inst.. TAP
levelInst. levels 4-yr., 2.yr. 4-yr.
Student type undergrad; FT & PT undergrad.; FT
Mkhod T&F revenues-aid/ T&F - TAP,undergrad. enroll- /
ment; + other costs'
Data sources Supp. 2, HEDS, CSS HEDS, BLS,
326
$
.
"Net Cost Index 2 "
1980-81"
institution
72 independent; 32 pUblic
T&F, other
TAP, Pell
4-yr.
JPundergrad.; FT
T&F + other cost-TAP - Pell
a
(..
HEDS, Supp. 2, BLS
327
m

312
4.These are the steps that were taken in developing Net Cost Index 1:
1) Total tuition and fees revenues from undergraduates.were identi-.
fled. for eaoh institution from State Education. Department' data.
:2) From the same, source, financial: aid totals for Pell grants;
New York State grants arrd scholarships., institutional awards, other
Federal .(SEOG, CIS, and NOW programs-were obtained andsub-,
ti-acted from the tuition and fees revenues,total for each insti-
tution.
.3) The difference, T &F revenues less aid payments, was divided by the
institutions' "actual number of full-time and part-time students
attending (undergraduate)" from theliEGIS enrollment questionnaire.
.4) For each institution, estimates of room and boird costs, books,
'transportation and other expenses were taken from the College
Cost Book. These were totaled and added to the result of (3) to
produce:an arbitrary, average 'net host of attendance.
5) Averages.of the. Tnstitutional average net costs were obtained for
each institutional type, and for each of thd sectors. .
The resulting sector averages; $2,987 for SUNY; 84,731 forthe'inde-
',pendent sector do not mean very much for 10081, since they do not cover
all costs or aid. They can, hOWver, be compiled quickly indr;asily, and
if they were.to he obtained in the same manner each year for the peilod
,-198041 through 1989 -90, say, they might be useful indicators of changes in
the effectiveness of financial aid programs., the cost of higkemedutation
in relation to other costs-ip the same period. They might also help to
explain shifts in sector enrollment stares that may have occurred during
the period:
The two sector averages might be expressed as "net cost difference"
(1,744), as a net cost ratio (1:1.6), or as a relative net cost index 0.6.
The "tuition Net TAP" Index
In this exploratory effort, the objective was to developinter-sector
net cost indices forfour consecutive years for three income categories of
students, to consider as dosts.only tuition and required fees, and to con-.
sider only TAP (i.e., aid proidded via the New YorhyState Tuition Assis't-
'ance Program) as financial. aid. Further constraints were to'include only
full-time undergraduates at four-year institutions,
a
Od
32,'J

S
313
These steps were taken:
1) Tuition and fees data, fdr 1978-79 through 1981-82 were obtained
for each.four-,year institution enrolling undergraduates from the
Department's Nigher Education Data System (NOS) [3]. These data
were averaged-by institutional type and sector;"but were not
weighted by enrollment. Averages by sector are shown as Table 2.
2) Three Jroad income catego'ries were assumed: low, middle, high.
Bureau of Labor'StWstics'(BLS) totarbudget estimates for
families of fpur, living in major U.S. urgan areas, specifically
Buffalo, NY, were selected as the basis for a rough approxima-
tion of family income at the three revels [2]. Although these
are market basket estimates, and do not include unspent income,'
further checking convinced us that they were reasonable for 1979
(the latest year for which availible)-
3) The 1979 total budget figures were adjustedfor the next
sears by reference to .the Consumer PriceIndex[4]. From these
expenditure estimates, used as proxies for income, net taxable ,balance (NTB), th'e income statistic used-frralculating TAP awards
was derived using a recongized formu/a forthis purpose.. (In
kacti5e theNTB'used in calculat4ng actual TAP awards comes from.
the previous year's State income. tax return): The results are
shown as Table 3.
4) TAP Schedule "C" was used to estimate average'awards for the three
i come levels, for the four years, for the public sectors (com-
wed) and for tafndependent, sector. SchedUle C and the actual
calculations are included as appendix 1 to this paper.
Table 2 .
AverageTuition and Fees Charges by Sector, 1978-81WeiAbted by Number of Institutions by Type
108-79 '1979-80 1980-81 1981-82
SUNNY '
P$ 996 $1,123 $1,171
CUNY 892, 966 967
Total Public 9 1,082 1,117r
Independent 3,307 3,594 4,003
4-1,,A
''31)
$1,343
011631,243
4,529

1
Table 3 .
Total Budget Figures, Three Income LevelsFamily of 4, Buffalo New York Area
1979a 1980b
1981b
1982b
4
314
Low $ 12,409 $ 14,059 $ 15,690 $ 17,510Middle 21,806 24,706 17,572 30,770High 32,013 36,271 40,478 45,174
.- Net Taxable Balance, Three Income Levels --
(derived from total budget figures)
Low $ , 7,709 $ 8,810 $ 10,190 $12,010 -Middle 16,606 19,306 22,072 25,270
High 26,613 30,871 34,978 39,674
a.
Handbook f Labor Statistics, Burealiof 14bor Statistics, Dec. 1980%Tables 150 -152.
bAdjusted from ConsumerPrice
The results are_ shown in,..Table 4 . In' each cell., the average .tuition-
and feescharge less the calcunted TAP,award, is given for the'public and
.independent sectors, for thelear and income groups as indicated, result-
ing in a'"Tuipon Net TAP" index. The assumed net taxable balance is also
included (i.n Tarent-heses) for reference. The results are also expressed
as public?fndependent net cost (i.e.; tuition net,TAP) ratios and dif-
Jerences ih 101114e
it must be'reemphasized here that what is reported is primarily a
'concept and a method, and not specific numerical results. eleariy'other
costs than tuition and fees involved, other sources of aid than TAP
are available, andthree income levels,might be considered by some to be
.insufficient. The apprdach,dAs have some appeal however because, inso-
far as it goes,, it reflects the real world; and because its very simpli-
city wouldpable it to be (welly and easily compiled on a regular basis.
An index, after-aM can be useful,over a period' o1 time if.it is compiled
consistently year after year, if its liMitations are respected, and if it
is miderstgod to be meaningful in,a relative rather than'in absolute sense.
- Were the results in Tble 5 to be studied accordingly, the reader Pight
t bigin to'suspeci that: ift4

a
315
D4e to inflatiOnaryrincome growth, TAP awards for low income stu-
students have decreased consistently over four years. Middle
come students (as defined in this exercise) were not eligible for
TAP after 1979 -80. High income students have never been eligible .
for TAP (except-in cases where adjustments are made in NTB for
siblings attending College).
- The difference between public and ,independent tuition net TAP for
low income students, proportionate to NTB, is about two-thirds as
large as the comparable figure for Middle class students; more than
twice that.for higkincomi students. .Thus,. it is relptively more
expensive for a low income, than fora middle &come student to
attend an independent college When only tuition and TAP are consi-
dered.,
- TAP has served to narrow the public-independent cost difference for
low income .students and to sob extent for middle,intome st ents,
', which has probally promoted choice and sector balance.
,MP
iU
B
Table 4
t f IN0301-SECIOR NET 1111/108480EKTOititrussifees. L4118 TAP Paymenft Estimated for Selected Yeats
, Public and Independent Sectors
idea Income Category 1978-79 1919-85,-',...:
1980-81 1 1981-82 c
Public TV - TAP.. BUMF- 1741-
,.
4 'Assumed Nril
?
'
969,644 1,002-671 t,117-597 . 1.243-557.
3.307- 1,415
325.. 18pm
($7, q)-
1,594-1090
to2,204 ' '
(4,810 )
4.041:1,280
..1111- ' ,ti2.721 .
($14,190)'
4,529- 1,114
6863,413 '2°
(812,01$
PUb/ir TEX - TAP,
.
.
96y. Aii
77317710 '
769
1,082-200 1,117-0 1,243-0
witr=rioidle
.
Assumed Nib
3,594-232
082
KR Y371
-
1 4117
(122.07,)
4.5F9-0
lig
.(.25.270)
2.70
(*16.606) '
3,362 '
$19,306),
Public 7&Frilgr-
31 .
. .
Mooned NM
960-0
315775969
1.082-0 1,H7-0
..--Id
1.243 -0 0
/
.
3.594 fi.
AA211 *.7.394 -! '4".
if
($30.&)
4,004-0 .
124g-1.
.034,978)
433-71----
Itig .. .28
119.674/
.293007 a ''
$26,83.
v
.

Table S
Results From Table At Indices. Ratios. Differearem
Income Category TEARType of index 1978-79 1979 -a6--- 1980-81 7.981-92
121.0
Index .18 .19 .19 .20
'Aerie 1:5.6 1s5.4 1:5.2 1:5.0
niffevence $1,507 $1,794 $2.203 52,7294id
Index .28, .26 .28 .28
Ratio 1:3.5 1:3.8 1:3.6 1 :3.6
Difference $1.936 .$2,480 82,888, $3.286
High
In .29 .30. .28 4 .28
Recto' 1;3.4 _1:3.3 1:3.6 1:3.6
Difference $2,338 52,512 $2,886 $3.286
316
"Net Cost Index 2
This index shares characteristics with both of the efforts already,
described, but it also goes beyond them. As in "Net Cost Index 1" only
one year (1980-811 is considered;'however,'estimates of room and board
and other costs are included in addition-to tuition and required fees,
and Federal, as well as state, student aid is innaed Ai in "Tuition
Net TAP," the three major sectors: SUNY, CUNY, and the independent
sector are included; as are .three income categories/i
Again, source of tuition and fees data was HEDS, and source of other
costs data was. C4S. Again, this exercise was liMited to 611-time under-
graduaie students in four-year institutions. Average,income levels for
low,Alddle, and high income categories was estimated on the same basisek
as for "Tuition Net TAP," and NT8 was computed in the same'manner.
After a number of colleges were eliminated due to being ineligible
for TAP'
or'charging no tuition, or for similar reasons, 104 were in-
'cluded in the exercise: 23 SUNY, 9 CUNY,72 independent. These are ca-.
tegorized by type in Table 6.
This is the procedure which was followed:
1) For each institution, 1980-81 tuition and required fees, and
fall 1980,F-T undergraduate enrollment, was obtained.
2) Estimates.of "other costs" were taken from the CSS College Cost
Book.fpr 1980-81.
e

317
3) Statistics reported in NCES 2300-4: number of aid applicants
(undergraduate) by income category, were used to estimate three
broad income groups for all full-time undergraduate students, by
institution. Taking the assumed averages, an effort was made to
"Match" these estimates with'three low, middle, high.
The deciAlon,was made-to set the following iniervals:
low '$ 0-14,999
middle 15,000 - 32,999
high 33,000 and over
To each was assigned the assumed average income developed from
BLS data, as described in the previou0sectioh.
4Y The proportions of. aid applicants for these income intervals, were
applied to each Institution's total full-time undergraduate en-.
rollment. This assumption that income distribution of aia appli-,
. cants maybe applied to all full-time undergraduate students is
used only tentatively until.better infoimationis available.
5) For each income level the assumed average TAP.award.was calcu
fated, by applying Scheduld C to NTB forlow and middle income
students. ,(Schedule C is in appendix 1, and. the NTB's for low
and middle income were $10,190 and $22,072, respectively.) It
- turned out that no middle students were eligible for even
. the minimueTAP award ,so that TAP was calculated at each insti-
tuitfon for low .incomestudents Only.1
6) 'Total Pell grant funds awarded'by institution for.1980 -81 were .4
taken from.the Nigher Education Data System. The assumption wasaele.w
made that Pell was awarded only to,loW income students, as defined-
..
in this exercise. Campus4aed'program aid (and also Institutiona1
aid) were asvAbd to be too small, or to differ. too little be-,
tWeen sectors to'affect net cost indices. Guaranteed Student414
. ,
Loans were not considered mainly because estimation of .the'
value OCA6sidized interest is p refinement which lies inthe
future. .
7) An "average net cost" figure for each of the three income groups.
was identified for each institution. This was: tuition and.fees,
plus'other costs, lesi TAP and Pell (for low income only). 'A
"total average net cost" figures was obtained, weighted by in-
come group size. . ,
, 333
fr
. r

318
8) Average net cost figures for low, middle and higher income groups,4
weighted by enrollment, were obtained for institutional type, and
sector, as shown in Table 6. (A combined figtre for the public
sectors was also obtained.) Looking at only the public-4ndepen-
/ dent results, "Net Cost Index 2" provides the following results:
Net Cost ratio
$41;204.51Net Cost difference
Relative Net Cost index
I
t
Table 6
"Net Cost index El" Summulted (1980 -81)
L°) P4LIdillit Kiddie !!W Total(5)
NuLtiversiry S 6,813 9,154 9,31 8,522
tFTUC 11,651 18,660 8,370 38.681
(6)
University 5 4,846 7.198 1,236g . 6,151FTUC 15,858 18,376 4,738% 19.172
(26)
College Complex $ 5,082 7,608 7,812 6.883MC 1 17,606 28,759 11,675 38,040
(29)
, College 5 2,381 6,147 6,298 55.054FTUC 15.439 18,444 4.355...-----38,438
(6)
Eng.-Tech. $ 5,017 7,740 7,341 6,743FTUC 6,273 13,583 -. 41649 26,505
I
(72)
Independent $ .031 7,587 7,903 6,709 ILFTUC " 08,827 98,022 33,987 200,836
Pub is
Sio'NY
(4)
U. Center 5,2,759 4,239 3,640FTUC 1.6,231 19.517
,4,194
.,734 40,482
(Ll)U. College S 2,181 3.922 3,964 1,322pruc 20,527 42.658 5.976 59.161
(3)
Specialized $ 2,435 4,162 4,304 3.625Fro 1,024 1,804 369 3,197
(4)
Statutory 4 1,955 5,437 5,436 4,685FUG 1,978 2,637 879 5,494
(23)
SUNK S 2,412 4,113 4,174 3.519Fitz 39,760 56,6/0 11,058 Iq8.334
(9)
SP116
CUNT,
1 1,027 2,267 ,
9,5591.267 1,222
FTUC 53,583 574 63,7/6
(32)41
1` FTCO 66,175Public S 1,617
' 93,3433,84. 4.087 2,661
12,532 172,050
Net cost ratio pubtiod it 112.3
Nd . 0.4 . .
Net cost difference 54.041
6
33,4,
V

a
J
DISCUSSION
319
This paper has described the development of three indices of net cost
of Attending college. While noting the preliminary nature of these indi-
cators, the paper has discussed their potential value in Identifying
changes in the coverage of student aid and explaining changes in enroll-
ment of different groups of institutions.
It is useful to compare briefly the three indices, the Manner in which
they were developed, and their results. Exhibit 2 summarizes the results
for 1980 -81. The Tuition Net TAP index isshown for only one of the four
years for which it was calculated for three income levels (two of which are
the same for 1980-81. It is not possible to combine them into a total
summary, as is done for Net Cost Index ?; because calculations were made
by sectors rather than by individual institutions.
The "average net costs" resulting from Tuition Net TAP are lower4than
for the other indices as expected,, because the only cost considered was
tuition. However, the "average net cost" results forthe independent sector
are lower from Net Cost Index 1 than from NCI 2,' while the reverse is true
for the public sectors. The reasons for this unexpected result seem to.tte
the following:
- Institutional total tuition and fee revenues fatthe independent
sector in NCI 1 Included those from some unknown number of part-
time students, because all sources of aid were being considered
and'part-time students are eligible for Federal aid. When this
was divided by the total undergraduate enrollment the resulting
tuition and fees charges per student were smaller than would have
been the case were only full-time students considered. Of
course the same effect would be exerted on the public institu-
tions. Vbreover,"in NCI 2 assumptions were made that resulted
in only low incomestudents receiving TAP and Pell grants. This
left about two-thirds4(56 percent) of students in the independent
sector assumed to receive no TAP or Pell, which in reality. may not
'be the.case.
Per the public sector, "average net cost" from NCI 2 is slightly
\lower than that for NCI 1 mainly becanse.over half the students (54
perscena,orthe 4-year SONY and CONY campuses included were entitled
to TAP-and Pell, again based on the various assumptions made for
this exercise. ,
0
335

EXHIBIT 2
7000
6 0
`AVERAGE NET. COSTS"
Independent 8 Public Sectoes.1980-81
Difference = $1744
N Ratio * = 1:1.6
EIndex = 0.63
T .5000
C
T
4000
P 3000R.0
X2000
a3u
t000
4731
NCI)
6709
Difference = $404.
Ratio = 11;2.5
Index = 0,40
Difference.= $2886'Ratio = 1:3.6Index = 0.28
Difference = $2203Ratio = 1:5.2,Index . = 0.19
Independent'Public ,
2723
4003 4003-
TNT LO- TNT MD TNT HI
NET 6th INDEX
SSS
aaaa
S
Ua-N
2668*
NCI
4 I r

2
321
The public/inderendent neil cost gaps and ratios and
in Exhibit II illustrate the'kinds of statistics one might want to
Indices shown
track over time and compare with changes in enrollment shares. They would
be particularly valuable if an index could be developed that was compre-.
hensive in terms of the costs and student aid it included.
SUMMARY AND CONCLUSIONS.
.
Thi^ee indices of net cost of college attendance have been described
I in this report. None of them provides a satisfactory estimate of net of
attendatIce, but the preliminary results shown in this report suggest that
extensions and refinements of the general approach would be extremely
valuable to planners and policy makers at both the state and institutional
levels. Plans for such extensions are now being 'developed by the New
.York State"Educatinn Department.
REFERENCES
1. "Finances Force Freshmen to Switch Colleges" The New York Times,page A-1. October 5, 1982.
2. Hand1ook of Lab& Statistics. U.S Depavidient of Labor, Bureau ofLabor Statistics, December 1980. Table 150-152.
3. Higher Education Data System. New YoYl State Education Departm ent,September 1977.
41c.
4. Higher. Education Prices and Price Indexes: 1981 Update. ResearchAssociates of Washington, September 1981.
5. Institutional Directory: Postsecondary Education in New York State.NYS EW.Ication Departmdnt,July 1982. See 'The University of the
.State of New York." page 6.
6. The Regents Statewide Plan for the Development of PostsecondaryEducation 1980. New York State Education Department, October 1980.
7. Student Demand for Postseconclery Education: Ark Annotated Biblio0aphy.,New York State.E cation Department,Aigust 1988. .1.
8. Charles Treadwell, Jane Johnson:Financial Aid and Attendance Costs forUndergraduate Students in New York State 1973 Through 1979-80. NYSHigher Education Ser'vices Corporation, December 1980.
338

STUDENT COLLEGE CHOICE AND DECTSION-MAKING
RICHARD L. PASTOR
DIRECTOR 07 FINANCIAL AID
NORTHERN ESSEX COMMUNITY COLLEGE°
9
The proceis of choosing a college has received increasing attention
with,the emergence ofthe use of "marketing".in higher education, and the
realization that the aggregate pool of traditional age.college students will
decreasing during the next 20 years.4
4 .
eliterature contains a significant number of articles and research
§tudAles dealing with the complex. decision process each student must use in
decidin o go to college, in deciding which colleges to apply to, and
14,.1. deciding which college; to attend.
Chapman writes that even with the intense competition for students,
y colleges have persisted in the belief that they canaffect students' choice of college merely by modifying theirinsti, tional descriptions or the targeting of their recruiting.FeW"admissions officers operate front a systematic model of theinfluences on student college choice. h:Lacking such model,.
. colleges may overlook ways to increase the effectiveness oftheir recruiting or, conversely, overestimate' the influence ofrecruiting activities in which they do. engage." (Chapman, 1980:490)
Most of she research reported has been aimed at findipg out which
of the many facto.rs student's consider are the most important and influential,
in the.college choice process. Maguire and Lay (1460) have shown that-
the perceived improvement of meven,attributes (financial aid, parents
preference, .specific academic programs, size of school, location, athletic
It
facilities, and social activities) can be expected to create an increased
enrollment yield for Boston College. A
seniors in Aiizona;(Cibir, 1982) has shy
ation items' (quality of programs, cost,
recent itudy'of high school
own that only eight college infortp-
career options, fihancial aid,
helpfulnesi of instructors, how cfasses ore taught, evailabl.lity'of housing,
and admissions requirements) were listed as '.'of great importance",by
over 40% of the students surveyed. .
. , .
A college is never going to be able to meet .the needs 9f every
potential'student. But it is one thing to lose a potential udent because.. .
7 *---4 4p.
, ,33j A
e
322
4
V.

323
per year), location, and,ease f entry are the only concerns of potential
students. However, it wpuld encouraging to think that our academic
reputation, quality of facul y, and comprehensiveacademic support center
were integral factors influ cing students to enroll.,at Northern Essex CC.
The essential vbestions'that I felt needed to be answered to provide
Northern EssexCC with the datailheigssary to start constructing a long.
range enrollment pl n ing'strategy were:
I. Mat are e fac ,,rs or aspects which influence studentsto apply nd ultim tely enroll at Northern Essex CC?
. lit. What kinds of information Ore used or desired by studentsduring i decision-making process?
3. What tou ces of information are used or desired. by students,during their decision-making process?
4. How do0-e non - traditional students differ from the traditionalstudoits with respect to the three questions above?
I will report on the results of three studies: a study of the accepted
bux not enrolled students from the Fall 1980; a study of the factors and,,sources of information influencing enrolled students entering in the Fall
, 1981; and, a qualitative case study conducted in the Spring 1982 using.
in-depth interviews with six students
. I. STUDY. OF ACCEPTED BUT NOT ENROLLED STUDENTS
.0Responses from 250 potential students whO were accepted for the Pally
1980 entering-clas44 but chose not to enr oll were received. The responses
represent 10.0%of6all accepted but not enrolled students.
Chart I lists the factors most influential when these not enrolled
studehts were making, their final college cfloice. The five most influential
factors,were Academic programs, distance from home, tuition cost, academic
reputation, and financial aid award.
Chart; II shows a comparison of the'responses of the not enrolled
students to the responses of the. enrolled students who completed tie Cooperative
` Institutional Res rch Program (CIRPYquestionnaire. The sample of enrolled, A
- Students vat 39.1 of the entering students. Northern Essex was the first
,Chore of 75.6% of the enrolled students, while obviously a back-up choice
for, thou not enrolled at Northern Essex. The not enrolled students were not
as impressed with the academic feputatibn, nor looking for our specific
program offeringslas-were the enrolled studtts.
J40
t,
. 324
the college does, not have the institutional characteristics or program ,
of study desired by the student, and quite another to lose a student
because of misperceptions or inadequate information. As Clark,,Gelatt,
and Levine (1965:41) have stated, "although the use of relevant information
by no means guarantees the Irightvdocision, # 'good' decision cannot
occukwithout it )P ,
Litten andtiodigan (1.982) have extended the research to include
the media which students prefer to use to. obtain the' information they
need when making their college choice. They state that it can'be assumed
that there is at least a loose association between theimport:ike of
a college attribute in influencing 'college choice and the value of
information about that attribute to the decision-maker.*
r...1.44tten and Brodigan's study showed conclusively that there were
specific message media linkages that. suggest certain types of information
may have an wile in being received when committed to certain media `as:
opposed to -̀otherA For both students and piirents,:faCtual.information
was generally preferred through impersonal, c011ege originated media:.4
Information which mar/differ according to a student's personal situation
appeared to be preferred from a personalized source directly related to
the college.. For reputational/prestige information both parents and
students tended to prefer a source that was not associated with the college.
Little research has been conducted using other than high school senior's ,
or college Ashmen as the,subjects. Adults have enrolled in increasing'
numbers higher educational institutions as the number of traditional %.
age students have declined. Northern Essex CC has seen the percentage,
of students over age'24 increase to 25% of its day enrdllmet. If thdte. $.
adult learners are to be adequatellserved, institutions likpours must.
issess their educational needs, information needs, and motivations,i
understand the differvices between adult learners and traditional.
age4,
---
students, and make appropriate adjustments in administrative procedbrea,,.
programming, and the teaching-learning,process. (Wilfgang,and Dowlin , 1981)
&rrently at North rn Essex CC (3500 day stuants, 4700 evening studentsA 40
in the Fall 1982) the nofundamental strategy being used the devel-
opment of a coordin to recruiting plan, marketing Alan', publication plan, t
advertising plan, or ionge range enrollment plan. The lack of a compreensive_
3,
"plan of attack' has not affected our student gemand. Inquiries, acceptances,. .
yield,,
and.ertrollment are'all at:an all tithe high.' It may well be that the'
eclnomic situation has reached the pint where the low cost ($634 tuition. i
airt 3 4 i4
...er
. *iv - .I .;

4
CHART I.
INFLUENTIAL FACTORS IN COLLEGE CHOICE *
NOT ENROLLED STUDENTS - FALL ;980 .4
ALLRESPONDENTS
PTS. RANK
HIGH SCHOOL GRAD LESSTHAN 3 YEARS PRIOR
?TS. RANK
. I
HIGH $CHOOL GRAD. MORE :THAN 3 YEARS PRIOR
PTS'. RANK
ACADEMIC PROGRAMS 455 1' 331 1 124 1
DISTANCE FROM HOME 370.
2,
268 2 102 ", 2,
TUITION COST. ./
360 3 266 3 94.
*13
ACADEMIC REPUTATION 291 4 233 4 58 .. - .41
FINANCIAeATD AWARD 121 5 92 5 29 5. .
SIZE OF SCHOOL. 82 6 69 6 13' 6
... .
REPUTPZOTN THE FACULTY 56 7 ' .46 7 10 7
PARENTS PREFERENCE 42 8 39 8 3. 9
STUDENT ACTIVITIES 38 9 31 9 7 8'
'ONTACT WITH ADMISSIONS 31 10
4*""2610 1
.
ii
ATTRACTIVE CAMPUS 5 29 11 11 3 . 9
STUDENT-FACULTY RATIO 27 12 24 121 3 9
MALE7FEMALE RATIO 16 13 13 13 e 3 9
couNsEkbos ADVICE 12 14 12 14
HOUSING OPPORTUNITIES ) 10 e° 15 8 15 .., 10'
N .
* Pointswere assigned.as follows: 5 points for most influential factor,
second, and 1 point for third most influential factor.
3423 points for % se

CHART II TotalNot EnrolledFall 1980
Not EnrolledStudents
High School,,Graduates 1977or Prior
lot Enrolled°StudentsHigh School
Graduates 1978and after
.
Enrolled "Neu"SgdemIe (CIROFall 1980
.
I
Sample Size
1. KECC is student's-.a. First choiceb. Second choice
. c. Third choiced. Less than third "ice
*
2. Concern about financing collegea. No concernb. Some concern
.4p. Major concern
' 29)
I
32.4
1637.6.8
13.2
34.043.222.8
59.327.15.1-8.5
37.7
32.29.5
b
1s9
24.341.320.614.8
32.46.1
3
19.6
4.
4. Reasons noted as Very Tm tant indeciding to gO to college:
a. My parents vented we to gob. I could not find a jobc. ',wanted to got away from homed. To be able to get a better job '
e. To gain a general educationf. To improve 47 reading and study skillsg. There was 'Mang bettor to doh. To sake me a more cultured personi. To be able to mike more money .
j.'Tb learn more about things of interestk. 1' meet new and interesting pedple1. To prepare myself for graduate school
4. Reasons noted as Very ainortant in
deciding to apjly to NECC:
a, My relatives wanted me to come hereb. My teacher advised as'c. This college has a good reputationd. I vas offered financial assistance.e. I was not accepted anywhere elsef. Someone who had been there advised me to gog. This college.offers the specific programh. My guidance Counselor advised me toi. This college has low tuitionj. I wanted alive at homek. A friend suggested attending ' 8.41. A college representative recruited me i.6
20.86.83.666.857.836.42.4
33.262.4
68;842.019.6
2.81.. 6
21.66.01.6
14.4
37.2'8:8
37.624.0
5, Reasons noted as Very Impsatant indeciding not to attend NECC:
.
11.5 23.8
3.3 7.91.6 4.272.1 65.1
67.2 54.532.8 37.61.6 2.6
S 39.3 131.2
52.5 65.680.3 65.1
37.7 43.4.21.3 19.0
a. Financial Problems 13.2'b. NECC was not my first choicec. NECC is too close hone
23.6,,3.6A
d. Academic program available 10,8e. Unsure of career 14.0f, Family or personal fficulties 11.6g Moved or moving soon 3.2h. Transportation problems 11.2i. Classes not offered at convenient times 4.83-Time conflict due to work 10.0k. Nave decided not to attend any schoCa. 7.2
1.61.6
24.64.91.613.1
S.
3.21.6
20.66.31.614.8
5:1.8 (.; 33.01.6 12.2
44.3 35.449.5 22.26.6 9.01.6 1.6
26.2
3.30.0
30.4 .zu.4.8
4.9 12.79.8 15'.3
23.08.2
7.91.6
9.8 11.66.6 . 4.2
14.96.34.8
709
75.618.4
3.52.4
43.543.413.0
43.76.22.478.767.342.02.234.1
65.4
4772..1 5
, 45.7
4.64.932.77.2 '
4,918.125.7
13.5
23.0
8.7
343

4
327
The reasons why students decided not to enroll at Northern Essex are
quite differeht for traditional students as compared to those of the older
students. Financial problems, family.or personal difficulties, and time
conflicts due to work dominate the reasons why the non-traditional students
.choose not to enroll at Northern Essex.
II: STUDY OF THE FACTORS WHICH INFLUENCED ENROLLMENT AND THE SOURCESOF INFORMATION PREFERRED BY NZW.ITUDENTS
The population sampled in this replication of Litten and Brodigan's Work
was the Fall 1981 "new" student enrollment of Northern Essex CO. A response
-rate of 26.3% was opined from the 1663 "mew" students. ( A new student
according to the'Northern Essex data system, is one who was not enrolled in
the immediate past semetter.). The respondents were 65.5% traditional Students,
haying graduated high school with' the past three years.. Overall, 64.8%
of the respondentedid not have any prior college attendance, while only 33.8%
of do non-tudAtional students had not attended college previously:
Chart III reports the most important influential factors in the decision
to attend Northern Essex.. In order of importance the top eight factors
were: costs Glow tuition), had desired course of study, quality of coursesk
programs close to home, career improyement, academic tputatfqn,. financial
aid availability,'And variety of courses offerred. s' .
.
There was only a slight difference in the responses of non-traditiona l(
students versus the traditional student responses. This difference was in,'y'
placing career improvement'tPlid instead of fifth for traditional students.
Chart tV shows the preferred-sources of informatibn about Northern
,Essex CC. The preferred sources of information in order of preference '
were: the college catalog, general knowledge, high school counselor, former
students, friendk, admissions office, current students, parents, and Northern
Essex faculty. As one mig ht assume, the guidance counselor was a much mordi
preferred source for the tradit ional.studen while non- traditional students
tended to prefer former students, the admis ions office,.and faculty to a4
'greater extent. ( The question asked the stu nts to list the most "preferred"
source of:information, but I feel that many stu ntd probably responded with
the sources of inforiation they "used" in obtain' g inforMation.ihey needed
se
about Northern Essex.
Chart V reviews the rankings of all 21 it listed, on the questionnaire
as possible influential aspects of-the coxlegef It is'interesting to note
-'
344

CHART Ifl
MOST IlD'ORTANT INFLUENTIAL FACTORS *
4
ENROLLED STUDENTS
ALL' RESPONDENTS
FALL 1981
RESPONDENTSHIGH SCHOOLTHAN 3 YEARS
OUT OFLESS
REPOS:DENIS OUT OFHIGH SCHOOL MORETHAN 3 YEARS
/
Points Ranh Pan's Rank Points Rank
COSTS ( Low TUITION ) .- 846 i 574 t 272 1
HAD DESIRED COURSE OF STUDY 671 2 412 2 259 2
Quarry or axesssiraoaLus 437 3 298 3 i59 4
CLASS IV YOUR HON 418 4 279 4 139 5,
CAREBVIVEROVEICIff 374 5' 198 5 i76 3
-ACADSNIC REPUTATION 227 6 11,1
6 75 6
FINANCIAL AID AVAILABILITY 180 7 135 7 45 7
VARINTY OP GOOSES OFFERED - 141 8 to 0 35 8
e`
CHART IV
PREF'ERRE'D SOURCES OF INFORMATION
CATALOG
wimpy mgmaiDGB ,
Am SCHOOL cassuce
roRisigunor
ramps'
ADMISSION; OFFICE
CURRENT 'STUDENTS
PARENTS
MECC FACULTY
ENROLLED
,
.
STUDENTS - FALL 1981
'LESS THAN 3ALL YEARS OUT OF
issromorms HIGH SCHOOLPte. Rank Pts. Rank
1869
1167 :
863
.07
657
614
608' ,
506
446
i
2
3
4
5
6
7
8
9
4..
1132
639
810
374
446
37&
443
428
242
1
3
z
8
4
7
5
6
9
MOIRE THAN 3
YEARS OUT OFHIGH SCHOOLPts. Rank
Points were assigned as folio's: 5 points for the most influential factor,3 points for second, and point for third most influential fattor.
. 737 1
...
528 2
53 lt
,
003 3 -,
216 5
.236 ' 4
163 7
78 10
7-2043 111
6.

Ale
I\
CHART Al
MOST IMPORTANT INFLUENTIAL FACTORS *
ENROLLED STU1 iT6- FAL 1981
ALLLESS THAN 3YEARS OUT OF
RESPONDENTS - HIGH 1 SCHOOL
COSTS LOH. TUITION') .
HAD DESIRED coups OF STUDY
QUALITY or commirRomuts%CLOSE TO HOME
CAREER IMPROVEMENT
ACADEMIC REPUTATION 6
FINANCIAL AID AVAILABILITY 7
VARIETY OF COURSES OFFERED '8
GUIDANCE COUNSELORS ADVICE
REPUTATION OF THE FACULTY 10
STUDENT /FACTY RATIO 11
SOCIAL ATMOSPHERE 12'
SIZE OF NECC,. 13.
ATTRACTIVE.CAMPUS 14.
RECOMMENDATION OF FRIENDS 15
PARENTS PREFERENCE 16
'COLLEGE CATALOG ' 17
RANGE OF STUDE1T'ACTIVITIES .18
REPUTATION OF ALUMNI (
STUDENT. ACTIVITIES AVAILABLE.41
'20
HOUSING OPPORTUNITIES 21
MORE THAN 3YEARS OUT OFHIGH SCHOOL
1 1
2 2
6
78
9
10
.36
78
9
16 10.
17
12 13
13 13
15 12
17
1.913
19
ZO 13
21
* Ranked in ordeiof importance obtained by assigning 5 points for the most
influential facto, 3 points for second, and 1 poimt. for the third most
influential factor.34 6

CHART V/
PREFERRED SOURCES OF INFORMATD11*
ENROLLED STUDENTS - FALL 1981
RANKED IN ORDER OF IMPORTANCE
COSDESIRED COURSEOF STUDY
QUALITY OFPROG!AMS
CLOSE TOHOME
CARERU1PROV.
ACADEMIC'REPUTATION
FIN.-AIDAVAIL.
VARIETY OF 4
COURSES' TOTAL
(
CATALOG1 1 1
eI 4 2 3' 3 1
GEN. KNOWL. 2 2 5 7' 1 1 9 4 4 9
HS COUNSELOR 3 4 2 4 7 3 2 '2 2
_
FORMER STUDENT.
6 4 2 5 4 f 9 6'
FRIENDS 5 5 8 8 2 5 6 11 -9
ADMISSIONS 07. 6 3 3 6 8 8 %. 10 `
_
1
.
3
CURRENT STUDENTS 7 7 , 7 2 6 0 8N
8 5
PARENTS 8 8 10 3 17 9 5
.
7-
NECC FACUL 9 . 10 6 5 It) l 6 6 6. 4
CHART VII
GROUP LESS THAN 3 YEARS OM' OF HIGH SCHOOL /CORR 3 IMAMS CUT OF HIGH SCHOOL
PREFERRED SOURCES OP 'IODINATION *
ENROLLED STUDENTS - FALL 1981NARKW ID (MUM W iNIVRTAME
4 TOTALCOSTDESIRED COURSEOF STUDY
QUALITY OFPROGRAM-
CLOSE TOHOME
CAREERIMPROV,
ACADEMICREPUTATION
.
FIN. AIDAVAIL.
.
VARIETY OFCOURSES
CATALOG
AAw....---MIMIIEllirIPPPICOMMINittaLuirialOwillWIML-IrdiVerolikwrigred%11141101111M1111/111PPINW411.11
:,,,,,a ,411,44
_IF;-MK0,Nrlail
6111J.Wa
GEN. KNOHL.
1
HS COUNSELOR
FORMER STUDENT
FRIENDS MIX1 211111111111WPagaPPIZIOWL9stat.ADMISSIONS OFF.
m-iCURRENT STUDIWTS MUM -..orl11 I IePARENTS r° imoiHilgliM__aMMwrdirIJwM
1 8i
10
NECC FACULTY9 111111111111"- IPP"-
- 4011Pw- 4101IPP _,-----1---1
* Rankings obtained by assigning 5 points for the most preferred source, 3 points forsecond, Apd 1 point for the third most preferred source.

I
331
that items such as parents preferen e, recommendation of friends, reputation.
of alumni, and student acti ties. re not considered as important influential
factors.
The'preferred sources of information for each of the mostkinfluential
factord are ranked in Chart VI. It is easy to see that when planning to
communicate with prospective students, the presentation Of the information
through the Northern Essex catalog and high school counselors are the most
preferred sources.
Chart VII shows the preferred sources of information for the most
important factors for traditional students and non-traditional students
separately, The sources which differed in ranking by more than four have
been circled to call attention to the most glaring differences. The matrix
has 72 items, and there are 22 cases of a ranking differing by more than four.
III. QUALITATIVE, CASE STUDY
The data for this study was collected through in-depth interviews
held with six full-time students who entered Northern:Essex in the Fall .
1981. The interviews were held during the Spring 1982 semester. The general
interview guide approach and purposeful samplingstrttegy were utilized.
These students first decided to go to college at various points in
their life. .The more traditional students decided to attend college right
after high school:\
t was my senior year in high school and the reason that I'decidedis that year was the first I ever did that well in high school. I
never really thought I had the ability to do it, and that's whenI decided I wanted to go onto college. (Doria A.)
The non-traditional students decided to.attend college after some
other experiences in life:
I realized that I wasn't going to make any money if I didn't goto college. I had tried every line.of wole. I was uneducated.didn't complete high school. knew I could get a GED, but I
was undereducated and I could that it was sewn up economically.I had stopped traveling and d ided to stay in one place for a while?,and I wasn't going to climb any social scales without an education,(Tim C.)
The college choice decision-making process that some of the students
used was very logical And well-organized:
I put a little more into the decision be9ause I figured if wouldinfluence, you know, it was a big step -in my life. I like to learn
but I don't like to put the time in, I'd rather be out working, and.
348

332
AL
I liked the fact that I would go here for just 2 years and thenget out. The location and the curriculum were what I wanted,and I liked the course descriptions... (Lisa B.)
Tr reasons why students wanted to attend college were dominated
by economical concerns:,
I hadn't worked in about nine years. And, in trying to competein the job market with the youngsters that are out there today
.I didn't stand a chance. I was too far behind things...so Ifigur this was the chpnee... (Marion C))
0the benefits of college attendance were also found to be important:
The way people are today I think its 50/50 between-personalgrowth and financial growth... (Tim C.) *Poo" '
The influence of "signifl.cant others" can many times.aifect the
college choice decision process.
One gentleman I know that went here really respected the factthat there were small classes and he got-the extra attention thathe needed... I never expected him to go to college,.much lessdo as good as he did. (Ken A.)
The strengths as perceived by current students are.the factors that
should be communicated to future students. It.was interesting to find
a large amount of relatively intangible strengths expressed by the students:
Well, for one thing I appreciate the attitude of the people whowork here. I have never' met anyone here in any position who-has anegative attitude. There is always somebody who.gets you an answerand that means a lot. I think they ought to hang a sign up that saysthe...,'Buck Stops Here" and place it above everybody, because that is
the way it works around here. (Marian C.)
I like it because I can get on a personal level with the teachers,whereas at a bigger college you might never see a teacher, or youwould not get that extra help you need. ,I think the faculty are
4like an A+. All the teachers I have had have just been tremendous.(Ken A.) #
Historically, community colleges have been the model in meeting the
needs ofthe educationally underprivileged who have,choien to attend college
without an appropriate college preparatory program. The community colleges
. have given them a chance for success. This model appears to be alive and well
at Northern Esiex CC:
Everything that I thought made a good excuse not to go got shot.down. I thought that when I came over here and!said how can Iafford to go to school the financial aid office was going to sayyou put up so much and we will put up so. much... I never dreamedthat the s a Pell Grant progrim that would pay all my tuitionbills. ( nna H.)
I had never seen a college before, and I thought to myself, well hereI'll be in a crass with 4-5 other old biddies and'we can sit there andyak and see what's what, but it was so different, and it hat given me
-
34.1

3334
AN
a whole new outlook on life, a.way to fill up all-that time andput it to godd use... to go someplace alone was a big step to me,I don't think I would have come to school if it hadn't been for my .
son taking classes along with me... (Marion C.) 40
SUMMARY
The important factors and aspects of Northern Essex CC which
influence students to apply and enroll are the'cost (low tuition),
academic programs, distance from home, academic. reputation, and financial
aid availability. The most preferred source of information for four of
these five influential factors was a different medium.'
the most preferred sources of information about Northern
Essex CC we e the college catalog, general knowledge, high school counselor,
former students, friends, the admibsions office, current students, parents,
And faculty. Each of these sources was ranked at least third in preference
for at least one of the eikht mostinfluential factors. These results
indicate that fok Northern Essex CC to be succeattul in the dissemination
of informationabout its strengths and characteristics, a coordinated, multi-
media approach must be implemented.
While the important influential factors are.the same for traditional-
age as well -as non-traditional age students, their preferred sources of
information are quite divergent. Traditional students prefer to use the
catalog and high school counselor as their sources of information.
The non - traditional, students prefer to use the faculty, former students,
and the admissionsoffice as a source of information. These results would
indicate that each student,ahould receive a catalog for their review, and
that a segmented marketing approach is needed to effectively meet the
informational needs of both the. traditional and non-traditional students.
General knowledge appears to play a very important role as a source
of information. Nop-traditional students rank this item generally higher
than do tradj.tionaistudents. I believe this response is due to thelw
assimilation of bits of information from a variety of sources over.time,
especially the Division of Continuing Education brochure which is mailed to
all area households three times a year. The importanoe of general know-
ledge as an information source supports the contention that the college
should be active in the community as a way of increasing its visibility.
.350

*
--.....
e
Ia
334
s.-.. .
le -
The concern for individuals as shown:6y
thefaculty, staff, and other
students is also a major factor in the attraction of-Suture students. Many. -
times we tend to forget that by meeting the personal needs of,, individuals,. -
we will be encouraging an atmosphere thatiAll result in a positive educa-
tional experiente.
1
;
...
e
1
*
..-
i
3 5i
4..
0
-4
,,,
...
.

)REFERENCES
4, 335
-1. Chapman, D. W.. A model of college choice. Journal of Higher Education,1981, 5203 , '490-505.
2 Cibik, M. A. College information needs. College and University,1982, 58(1), 97-102.
3. Clark, R., Gelat, H. B. & Levine, L. A decision-making paradigm, forlocal vidance research. Peilonnel and Guidande Journal, 1965, 44, 40-51.
4..Litten, L. H. & Brodigan, D.: L. On being heard in a noisy,wAldtMatching messages and media in college marketing. College and University,1982, 57(3), 242:-264.
5 Maguiie J: &01,ay R. Modeling the college choice process; Image anddecision. College and Univeisity, 1980, 56(2), 123-139.
6. Wolfgang, M. E. & Dowling, W. B. Differences in motivation of adult.and younger undergraduates. Journal of Higher Education,.1981,52(6), 640-648.
352
'N

.
4
. ,
CARVING UP P*ADUSE: POLITICS, DATA AND IRE ALLOCATION OF ACADEMIC SPiXE,
The all
._ Richard Pattenaude
Assistant Vice President, Academic Affairs'StatAniverSity of New York at Binghamton
AN. Binghamton,. New York 13901
* .
. .
ocation or 'reallbcation of academic space on.-
.,
a campus is a
political. and rational. activity% It is rational in thi sense that a
specific square footage is assigned and programs occupy what is assumed to
be nt utilization of available resources. But that is the lesser
spect o the issue. In .my mit politics dominate the decision making
ess. Like it or one is faced with the reality that the effective
utilization of space, a key` institutional resource, is dependant' on
political factors.
administrators.need
an important role
1984
jje Problem(
4 The enrollment squee9, long.promised by planners.
. ,
beginnipg to take its toll: At the saMe.ttme the United States is pass
Institutionalresearchers and physical plant
to sharpen their ,political skills if the0ish.to play
lini assisting their institutions in dealing with the
.0
and demographers, is
, .
ing through a period of econ9mjcstognation and the economic value of a
bachelors degree is being questioned. These factors, taken together,
suggest that little additional space will be builton America 's campuses
over the next decade. Those institutions most injured by this emerotncr. ,
situation may need to lbck up space. This cutback; this change in mind-
set, this new era of constraints necessItatbs more effectiye thinking. The
pOlitieal s%resses produced bythi's down-turn in the economy of higher. . .
Yeducation makes the politics of space chit cal: In the past it was often\ .
.
possible to "buy" ..one's- way out of a difficult space situation.
\
41, si r
3 5.3336 it
'1111
4

I-
?
337
The new.building, the major rehabUitation, or the opportuni(' for other
resources* reduced the sense of scarcity and competition.. This brief
) .description of the current situationpresents nothing new but the context
is critical.for coming to grips with the politics of space.
So whaA t? If conditions hold or continue to decline, institutions must.
1
have full control of their resources. They need to have flexibility in the
utilization of re's6urces if plannihg is to have any meaning. Institutions,
in terms of physical space, need to break the emotional grip of perceived
ownership. Space must take on the characteristics of any other rating
resource. There are. already enough factors present in the higher eOuc ion
-'-uxironment which can produce ill will, ali.enAion, and intra-organiza-.
tional warfa-re. Space should not add to institutional stress, at least no
more so than any'other essential resource.
We oust also remember that faculty come, to institution' of higher
learning to pursue their careers because they view it as .a form of.
professional paradise--a place where personal Interests can be pursued ,and
_avocations become vocations. It is alio a; place where they exchange net4
income for flexibility and life style; a place where ideas and ,their
exchange prodiice a personal sense of growth and intellectual excitement.
But faculty members can be easily dra$4n into long term squabbling Qver
physical space. Is_ this understandabie? Of course. Space. represents
prograt legitimacy, program strength, quality of 'life, and institutional,
commitments. Reducing, changing, or refining the space of an academic
department can be viewed as a direct threat to that department's vitality,
now and-in the future. Thus the entire process'of managing academic space
ClfraugNwith politics, emotions, and conflict. If handled poorly 'the
political chaos associated with space decisions can result in paraese'
lOit. 44
3544t
4"-

Organization Facts le% 4
I we6d like' to review same basic assUmptionq, about the way
338
organizations fmnction. Orga2izations are basically political and
1 emotiael, not rational:
.
(WilAm4y, 19791 ch.2) Decision .making.
..
processes are slow and incremental, based on past events and decisions,
seldcip moving frqm a blank sheet in 'a systematic way toward a new set' of. . 't 0
*a 4. OF
conclusiOns. (Lindblom, 1965: ch.3) Individual;" within organizations tend
6 respond negatively to stress and change while, atthe same time, it isri,
uenvironment. (Etzioni, 1964: 08) At the same time organizattonal
,----1....0 essential for an organization ±o be responsive to it? working
techniques and process must rtlemd_sensitively to organizational reality
and employee stress if they are to be effective. Unfortunately colleges
and universities are not always the collegial entities as we often suggest;
they are like all large complex organizations. Finally it is clear that
the management of chafe in a professional organization is one of the most
challenging of management activities, particularly when change it on the
down side.. (Etzioni, 1964: 83) Ta'ken together these brief IhouAts.about
organizations reinforce the idea that planning for space allocation needs
to lie managed carefully with full recognition of its political content.
Space and Facilities Facts.
It is simply a truism that academic departments never have enough
space. Recently we dealt with a department which had, according 'to
-4*
f(4,Tula, more than' double the space to which it is entitled. After careful
inspection, a walking tour of the -spate, and hours of discussion their
conclusion, to our dismays, was to ask tor an additional .500 square feet.
This outcome of an attempt to approach the issue, rationally is not °;
uncommon.
3
I.

4
1/4
'339
Formulas tend to tte of little value in workingwith academic depart-
ments. SUN? has an ekcellerat space entitlement formula that accounts for
r the following factors: lower division.enrollments, upper division enroll-.
ments, beginning graduate enrollments, advance "graduate enrollments,
faculty FTE, general instruc tional space, classroom labs, individual labs,
research slyce and support space, and faculty office space. (Office for
Capital Facilities, 1979) Factors'have been generated for each of he
resulting cells (see below)4, i Whenever this formula is utilifed in a..
discussion with an academic'department it only produces heated argume&.
This has resulted in our discontinuation of its use as a negotiating tool.
Department X: Space Facprs
Lower Upper keginning Advanced AdvancedDiv. Div. Graduate Graduate "Graduate FacuTtyFTE FTE FTE FTE HEADS FTE
GeneralInstruction
Classroom .
LabsIndividualStudy Labs
Research.andSUpport
SpaceOffice
Space
TOTAL
Of course different departments .have different space needs. And a4
single discipline, depending upOn' 4s:'-'f141cus and its pedagogy, can have
different space :reds at different inttitcOons. This adds to the
inability to utilize standardized lOrmulas. Formulas dikhave a value they
identify areas and disciplines which need careful study. They also allow
one to identify classes of space needing attention. At best one can use
_- 4.4
4
k
1

340
them to estOlish ordinal rankings of departments which are overspaced.
Yet experience has made it clear to me that formulas. are of little value in
dealing with the automatic opposition one encounters when attempting to
reduce or reastirthe space of academic departments.
The Challenge
This brief'review of the realities of space allocation results. in a
potentially frustrating situation. Institutions need,totount Qv space as
a fleiiiple resource supporting new directions and needs. At the same time
h .
the logics of organizations and the realities of space make it extremely
difficult to exercise managerial authority.. This is particularlyitrue in
universities and colleges because the key actors are the professional
members of the organizatio . The organization behavior literature is
filled with examples whic highlight ,/he difficulty of managing a
pr9fessional organization wherein the employees .feel that administration
has only one purpose--to provide adequate resqprces for the professionals
to 'function. Thus the administratiOn lacks basic authority for pursuing
institution-wide priorities. (Etzioni, 1964: 81-85)
How do we detl with this? Is it impossible then to manage physical
4Pi space without creating organizational chaos? Can we change .paradise
t
withoft ,creating paradise lost?t.
At SUNY-Binghamton we have considered this issue carefully and have
over the past eighteen months, significantly altered our approach to space
planning. We he done this becalise we are in'Ahe fortunate position of
being a growing campus.
increasing, and programs are
Enrollients are increasing, resources are'
being added. Most recently we have received
. 1
approval to add engineering programs. However, we cannot expect any

4
f.1
341 .
additional buildings. TVs we are deepl! involved in the problem and haveA
to'wrestle with the challenge. We have no choice.
Our challenge is to move forward within a fixed amount of space to.
meet our goals. More importantly, we must do. tft Nrewithout 'creating un-
necessary orrizatiobat stress.
An Approach to Consider1
.
The folloWiqg information describeg the revised approach to phlivical
..space' deciston Making we have adopted.-/'
.
// .
lw .
1. Redefinitio of e: FUndamental to the reorganization of a. /.
.1
space-allocation proc(s:was.aredeqnition of space. At awidely attended,
Presidentially-chair*. retreat the concern for space was discussed at ..-.
. length. From this came a clear message that space' is a uniyersityresourdY\
,
and, like', all resouiceS the university, subject for control,7 / _
i / 1_1- -,
accountability, and. rOview._ .....-_-as
,
alsormade,clear.that space allobation.'
would be based upop progrimmatic need And that programmitic need wnulehave,**'17,,.,;:-1:...-7,'
that
to be caref94 provn.' -, 'N fi.
.... ..2'. "Restructhringihs.DetiSion Making Proc : A new space advisory
.--4, `--
.\ . . .
commi tee was formedvhich,rehorts: dfrectly,to the president's staff and\t.. ,
# 'serves as a,
?
working.jsubcoim9qteef that group. 7h membe hip is cow,.,.
,
440 j
4
r posed of four highel.leve/-inahage-r.s., M.6Aly assistant vic4esidents, and
the director of phis'icififlintfriceY member, The space advisory committee .
"--*--):has an advisory .role only-, foitiOrdlng r commendations to the president's
staff, for consideration. The commi tee !meets regularly with the./
' president's staff to discuss these recommendations and it is the staff '
which makes the final decisions. Naturally these decisions are some.
. .
broiditrush in nature but they represent university decisions taken at the
highest revel. The 'space advisory 'committee does have some discretion in
3534
16f

4
a
Ol
1,342
its implementation of these decisions but proceeds with a mandate from the
president's staff, free of.ljngering political questions.
3. Consultation Process: In preparpg recommendations for the
president's staff the space advisory committee engages in an extended
consultation rocest. This process is always referred to as infOation..
gathering. It is in'this process, that programmatic needs are clarified.
Naturally the committee has a sense of where, it is headed because lf its
regular interaction with the ',president's staff. Often the. president's.
. -
staff will indicate that a specific problem is to be solved or project to $
pursued. One recent example Was a request from president's staff for the
space advisory committee to locate appropriate space for a small
. 'facu f dining roan. In this effort a number of ,alternative
.10cotIons were explored without consultation by reviewing large blueprints
. of various spots on campus. After an ititial.,proposal was reviewed the
president's staff gave the committee permission tobbegih the .consultation
process.
4 Th, factorswhich were considered as part of thfS,6nsultation,process
were: the needs of the _program being.impacted,,the pedagogical style- of
-; the program, the building constraints, the tradition and histolill,of the'
building's occupancy, thepolitical roles of the people involved, the 'size,
of the program, the external 1jnding of the prOgrol& its research'foci and
. future, Ole costs of "Various approaches, and the interests of all0
con tituendie.S involved. -This resulted in a need to consult with-secondary
groups .such as graduate student organizations, student leaders, ,facultle
4 leaders, food service experts, and anyone else who had on inXerest in the
particular issue.
As a result all factors ,which stood in the way of this,proJect were
brought into the decision making process. Areas that were sensitive were
1.0 5j

7.
343I -
highlighted and specific'needs accembdated. This entire toceSs alSo had
the intended and important tangential impact of informing the academic
community of a, pending decision. Clearly little harfi data were utilized.
However the institutional research office was essential in that it supplied-
an absolutely precise picture of the jnvolved-department. This informatiOn
.
-.allows the committee to force all particopants to deal with the facts in ar
common manner. (This eliminates the ability for a person to assert that a
. pr;ogral,M is ,growing significantly; ',a quick reference to information
nrovided by institutional research would indicate the actual facts, in
detail) Lt:is.here that data are critical., yet. they are clearly a backup
to the focus on'the political issues.
As this information was being" gathered, points of opposition and
active opponents to the concept were identified. This allowed for careful
consultrAion and discussion with the opinion, leaders involved. This
proc4ss reduces'unexpected political Problems at the implementation stage.
This also allovalka careful shaping of arrecommendation for the president's
staff free of undue political casts.. .
1..
4.: Recommendation;' After .the extended and detailed consultation
process the space advisory committee is then capable of providing a two-.
part recommendation to the president's staff. The (first part.. of a
recommendation is the physical layout of the proposed .project.
Configuration, square footage, location, and design features are presented" 10.
for review and approkal by'the president's staff. Oils Allows the staff to.4 .
add its comments and refinements Athe facility under conSiderationt The. .
staff can also be informed of the special interests and ..needs.,, of thec' 4 . .
4 0involved parties and thesubsequeni impact upon design configuration and,
a
it

344.
The second part of recommendation is perhaps more 'critical. Here the
space advisory committee mak comments and suggestioni concerning the
political and organizatioh implications.so that an implementation plan can
be prepared to, address theNhuman dimensions of the problem. This ..allows
the staff to,offer political advice and, to determine whether or not it
shoqd become involved for the purposes of assuring agreement, obtaining
suppok, a,nd containing conflict. At this time itf.is also possible to
discuss fining' =if neceskame:-,.
li
The outcome is a clear directive from the president's staff to roceed
on a project within'clear parameters sensitive to the,organizatio al and
political factors involved. Space Okeded 'for a' specific function or, ;
project is identified and leads to a specific allocation process described
below.
. <5. Allocation:'',The.space advisory committee :proceeds to secure
final refinemel of the recommendation and the .communicates that
'recommendation to the affected parties in writing. 'All specifics and
ati-eements arelayed Alt and made part of the retard. Criticalito this is
the concept of university development 'space. Under this concept
allocations of sliace are considered temporary,. A program or project which
, ,
receives reconfigured or reduced sp e is assigned that space under the. a Mt
aegis of university development sp e; This quasi- contract make's it clear
at
..,
that space is a 'university, resource and that the space is being assigned, .
to the deRar vent or unit ft a specific period of time for a specific'
purpose with t e proviso that after one or two Years this assignment will
Appropriate,.
be renewed. This scheduled review'insures that usage remains Appropriate,
that the decision was 'reasonable; and that the ff;ked department has a., 6
t '
clear opportunity to request reconsigeration of. is space allocation:, It'
maintainsflexibility for all involved parties.
r
3(;
4

.
;4
6, ImpleMentatian: The space advisory committee then proceedsto
activate all' necessary Parties, particularly the physical plant. Working
within the clear purposes and parameters set by the president's staff, the
committee retains 'minor flexibility in design features. This insures that
11
345
departments will feel that they have a legitimate and meaningful Impact on
the final design of their space. Sometimes it is necessary to reject a
'department's suggestion bOcause Of cost or incompatibility `,with building,
A configuration. But these disagreements are resolved in open and frloil-
dis-
cugsions where each party presents.'the facts it feels addresses the
I
question. The space advisor), committee has the advantage of working to
implement a university decisionacked by the highest leiml of authority,O.
which -has been.imadp clearly, openly, and with appropriake consultation.
This reduces implementation costs and speeds- the process. Certainly. this
does not always go smoothly but it greatly reduces the level bf political4
stress. ..
Conclusion
The process. I have described' is systehmtic, understandable; and
efficient. It relies on discussion, consultationAnd compromise whereas.
..'. 1J --
hard facts play a mina,' but critical role. It%is Flea* evident that the
.decision making process :is
Is sensitive to the political dynamics. of, the
institution. Nallows all concerned parties to have an appropri e voice
in the process; na one group or individual, is -able to doming e the
r
decision making process. 'At the same time it does got erode or unde ne
the authority of the senior administration. The process is responsive to. , ii :
. the specifiC programmafic needs of depaAments as well as being seniitive',
.
to the needs of pie total institution as tt looks towards the future. By
i ncreasing both the political content, and, the consultation level, the
:.
. .
to.
. 362 *

Sr
346
process actually decreases the political costs by avoiding unworkable
decisions. It also assures that departments will feel that th4 have had a
legitimate opportunity to influence a decision. Although a.departmen may
not' obtain its desired outcome it cannot assert tfiat it has been kept in
thedirk.. .
Because it it systematic and open and will be the ongoing mode of
operation, the academic community has come to understand that this will be
the modus operandi for space decisions. dust as departments understand how
promotion and tenure decisions take place they now understand how space
decisions take place. . This regularization of the process is terribly
important in that it reduces any concerns for unilateral, decision4making
and assures that 'departments know when and chow -they can appropriately,
influence a" decision. We have foundhis approach to "be much-More workable
than previous processes and to add legitimacy to the space allocation....1.
process.
Universities and colleges can indeed be paradises for` those who work
there. But 'maintaining that sense of organizational harmony and vitality. .
is :a, difficult and delicate. process. Thoughtful and informed
leadministrators can guide'institutions. through the difficult days 'ahead
without p.roducing paradise lost.
al
REFERENCES
Etzioni, Amitai. Moderniip§aniliations, (Englewood Cliffs,,New Jersey:Prentice-Hall, 1964JT pp.81 -85, 83 & 98.
Lindblom, Charles. The Intelligence of Democracy, (New York: The.Free Press, 1965), Chapter 3.
Officebfdor Capital Facilities, State University of New York. ,Space
Management Data Bevel° ent and Utillization (Albany, New cork: State-.University ofNew York, 9).
Wildayskyo *Aaron. 'The P 'olitics o Budgetary Profess, 3rd Edition
(Rostov Little, Brown and Company, 19791, Chapter 2.
. 3

V
46.
ENROLLMENT PROJECTION MODELS:SEEKING EFFECTIVE PREDICTOR VARIABLES
4'Ronald F. Perry
'Associate Professorof
Industrial Engineering and Information Systemsand
Humberto F. Goncalves, DirectorOffice of Institutional Research
ENROLLMENT PROJECTIONS AND THE ACADEMIC BUDGET PROCESS
Northeastern University is a private University founded in 1898 and
located : Boston, Massachusetls.. The 'total full and part-time enrollment
during 1 1t-82 for its ten undergraduate colleges and eight graduate
schoolS was In excess of 45,000 students. Although the University hasIiwomeMPOP
experienced a small overall decline in enrollments during the last two
years, it has remained in a strong financial position.
The annual budget process at Northeastern can be charNterized as d
traditional, iteratIvebottom-up approach. Due to the 'fact that ther-
endowTent,band is quite small,, the University is extremely dependent on
student generated revenues. The.process starts in September afterN,the
freshmen admission goals are established for the next fiscal year and
usually finished by February after oneor more rounds of adjustments.
In late September, a three year enrollment
the Office of Institutional Research in
tion is developed by
th the deans. Thig.
prjection reflebts the group's view of .)1e most 1 kely enrollment levels,
glveW certain assumptions regarding the expected student attrition rates,
the ability of the Admissions Office to meets its goals, and
.
repohel/national ,enrollmenfrtrends.
366
41;
4

OR
348
During October and November, the department chairmen develop budgets
that reflect their financial needs in light of the' projected enrollments
-
and their academic goals. After these budgets are reviewed and approved by
the appropriate dean" and vice president, they' are consolidated and
submitted to the president for'approval. 0
Concurrently, the Finance Office dev elops its revenue projections for
the next fiscal year. Tradit nally, their projections reflect a more
conservative view of future enrollments than Ours.'
It is clear that the revenue projections developed by the Finance
Office are an overriding constraint in the process. A planned, deficit
budget would probably not be accepted by eitheithe president or the
trustees. In past years, the original budget reqiests have had to be
re-negotiated with the deans because in totaal they exceeded the,projectd
revenues. This situation is inherent with the bottom-up budget approach.
Prior to 1977, tie establishment of the revenue projections was very
much in the domain of the financial administratbrs and reflected' the
$conservatism of the profession. OUr originaf forecast "model was the first
attempt to temper this conservatism which created large budget_ surpluses
combined with scheduling and staffing problems in the academic departments
at the beginning of eaclqracademic year. InvoNply,the number of student's
enrollieg each tall was larger than the number used for budget preparatiA...
The partial acceptance of the model did in fact result in a smalldr1 to
variance between budgeted and actual enrollments during the last three
fiscal yew.
,
I
4
I
0.

3.49
MODELING CONSIDERATIONS AND ENROLLMENT PROJECTIONS
Criteria for Model Evaluation
Forecasting should promote better making in organizations.
Consequently;* it is appropriate to consider the organizational and
prismatic aspects df forecasting as well as the technical aspects before
-commencing model building1
. In this section we discuss the*
impact of
several important factors on the choice of model type, model variables, and
data sources. These are accuracy-cost trade -offs, timeliness, model
comprehension, and implementation.
The level of accuracy of a forecast should be appropriate to the
decisions supported by that forecast. 1 grade-offs mist be made between
inexpensive forecastingomodels which yield large forecast errors. and 'more
costly -models yielding better precision.
The concept of ,timeliness an be captured by noting that early
.computer-based weather forecasting systems required greAter ,tan
twenty -four hours to produce tomorrow's forecast. Fbrecasts must be
available in sufficie time to make decisions about activities which occura
dulling the forecast's planning horizon.
A technically complex model may produce an accurate forecast, "but be
totally incomprehensible to the user. A conceptual understanding of the
model by the manager is essential. Only in.this way can model- produced
forecast benefit siinific.Ntly'ffom the 'subjective judgment of the
experienced manager, .as suggested by Jenki(19$2).
1
A most relevant paper which addresses the issues of forecasting iti anorganizational setting is that by.. Gwilym W. : Jenkins
dr
'366--,

- ...../
\ -....
minimal mathematical complexity. To produce:an. appropriate precise
forecast, the model should also explain a large fraction of the inhere".
. 350
,
a
ImpleMentation is a. multi=faceted problem., It requires the SuppOrt of
the users as well as a technically well-devised forecasting system.
Deficiences in technical desigp may diminish the value of forecasts, but4,
uncooperative users totally emasculate their usefulness. Implementation
must begin very early in liemodel Welopment process to insuee-success
(see Jenkins,1982).
DIa availability, is a key factor till producing timely forecasts-
Traditionally, efforts to forecast college 'enrollments have focused on
demographic data In defining predictopariables. When our forecasting
zffort began several years ago, we focused on these same'data since they
were available in areasonably timely fashion.
Implications fbr Model Dev'elopment,
in light of the previous discussion, e may now.psketcti the,typa pf
forecasting.mode)1/6nd moajl development process which was pursued..
The' "optimal" model- type had to be at b. technical leiel whichicould be
explained to Administrators on a meaningful' conceptual basis. This implied
data variability. iso, the model should produce forecasts in a cost
effective manner. Multivariate linear regression analysis meets all of,
these requirements and is the technique which was ultimately seiected.
To minimize the size of the, required data base, h'gh school enrollment
Tatt from as few 'states as possible were corlidered. Ai described }below,
we focused on eight states selected after an
patterns.
.
ysis ,of enrollment.:
r

...
I
'
1#
p I
351
The model development team was oross-Ainctional, possessing expertise
in model building and extensive knowledge of university operations. In
addition;"the 'Office of the Dean of Admissions was invOi#ed in the processlb
at an early stage.
MODEL DEVELOP1
Review of Literature
The literature on enrollment forecasting divides into two major
categories: 1(1) extrapolation and causal models" based on "hard" data,
usually demographic, and (2) more recent prediction models based on survey
data, usually student perceptions of university characteristics. When our
forecasting effort started, the latter category was embryonic. Of
necessity, we looked to the, former type of 'research effort for guidance.
cMost of the work done was of a more macro nature Ilan ours. Often,
predictions were made for the entire country or state school systeM, rather
than one school, thus providing much laiitude,for absorbingthe impact of.NA.
forClc,ast errors. Since much of the literatirre which helped launch our
effort is now quite dated, only the majoi works will be briefly cited, as41,
much to prov,ide historical perspective as toesteblish the credibility of
our approach. Our work has now evolved into the secondcategoryk
of
research after a worthwhile learning experience.
Goldlifig and Huang (1977) 'provide a .review and cYessifioation'of-some
of the earlier enrollment prediction models. The works by Lin (1968) and
Oliver and Hopkins (1972) develop extrapolation models using cohorts
survival methods for state school systems. The paper by Banks and
368

01'
Hohe .*4)irn
352
reports on h collection of models for the state of
Georgia pg regression analysis witch demographic data and economic
indices a. predictor variables. Another effort using regression' analysis
applied o variables such as high school g aduates, economic indices, and
1970). The models producellinational census data,is the paper by Wasi
forecasts'fo?\community college enrollments.
Several difficultiesare encountered when attempting to apply the
cited to the design and operation of an an enrollment system for a large,
rks .
.
prive,urban institution, such as Northeastern University. First, most4
work addres d the problem at the state or higher level of aggregation.
Forecasting of freshmen matriculation, the component of total enrollments
with the most uncertainty associated with it, was not adequately treated.
Nohe of the models Was designed to become part of an ongoing forecasting
systek to support decisions. Finally, the.iMplenientation of these modelg'
into the decision-mal ,g process was nil.
The last several.ti
with the analysis of the college
hrte rodyced *some noteworthy dealing
aleeprOcess. Not surprisingly, these''
*p =ipers have,a decidedly marketing research ring to Them, being concerned.
with topics such as the univers4y's,image,lhe bestitiedia for transmittal4 6:
of stifferent types of infOrmation, and targeting subsets of the prospedtilmp. .
p_ .
-,
oking t 11.stuttnt population.. -Brief mention is ma of the most thoughtprov.
i.
recent papers in these areas.
t,
Krampf and Heinlein. 0A
981) discuss ascertaining the university's image
using 23 attributes of the tnstitutiori and relate thieNto the probability
of matr> tion. Maguire and lay '(1981) analyze the college oho'
dik
Ptoces identi ingt14 predict4
\
X
i,matriculation.
1
36,
e
Using, a diff.rept
4fts, .st
.,

353
apikoach,hay et al. (1981) apply AID (Automatic Interaction Detector) to
divide applicants into subgroups of varying yield based on attribute's such
as SAT scores, high.school-Pank, and sex.\... 4(19e1) investigates sources students and
types of infiirmation about,a college., .
The. latter body of liters ire has provided .guidance to our. recent.
efforts to understand.the role of student perception an the recruiting and
The pa by Litten and Brodigan
1k
parents each prefer for various
a
Jar
admissions process. Discussion of some tentative results of this work are
or
contained inthe last section of this paper.
.Selected Modeling Approach tt f
In- light of the factors iiiscussed in the previous seCtion and the Imm, .
. .
guidance provided by 'the literature review, it was decided to use
multivariate linear regression analysis in conjunction with demographic
variables to devefop a freshmen enrollment forecasting model. Atter some
preliminary evaluation, we focused on high school gritduates as the single.'
most valuable predictor`rriable. Since 86% percent of Northeastern4
'University's freshmen come ft?* New Bhgland, New York, and New_ Jersey, weedr--
used only these states.
Since the budget process begins in September, the, timing requirements
%for forecast data are as followli. We desire a forecast, for entering
freshmenein the Pall of year t to be available in the gall of year t-i, gad.
based on projected school graduat s for June ,of year t: TWerefore,.t
high school graduate data for June o yes/ t-1 .must be available .by the
Pall Of that year to minimize the asp of the data used in projecting high
schoo l graduates.
s
I

'ThP forecast was develdped in two steps: ()I extrapolate hii-4h atho0
-graduates for the eight states using a predictive equation which is a
function of time, and (2) foreZ:Etst Northeastern freshmen using a predictive
equation which is a function of some or all of the high school graduates of
the eight.states. All of these equations were develo ng steWise
regression algorithms.
More succinctly we can write:
(1) HSG = f (T)
(2) RUE't
f( USGl' t
HSG2't C 8't
where;
NUF = forecast f r Np. freshmen for year01)
school: graduat.s for staid i, year tH8Gi,t = projecte i
t i4 _.
..4
.4. C
../4
'Using these equations a forecast 'is produced 40 each year of 'a four
. 1.. , . .year planning horizon.
The data base used forDbot% of these projections consists bf the years
beginning 1967 to the year precOing the forecast.: FOrecast4'were beguh in
19772 . This provided .periods of reasonably well- .behaved data for 1967
through 1977, 1967 through 1978, on upto 1967 through 1081, from which to
derive our forecasts. It should be noted that'fZreign studentagoremNot4.
included in the data base, and hence not in the for.ecast. Thus,
approximately 8 percent of the entering freshmen required estimation by
some other means.
4 A
A 4 2Harly. developm2Dt work was performed by Ramnsubramenian (1979) in
conjunction with-4 master's degree thesip.'
, 1.
.37,

,Selecting the "Best"-Model
455
A steputte regression algorithm was employed to derive the best pet of
predictive equations. The MOINE statistical analysis software package
Wks quite adequate for this purpose since the size of the data base.waset
modest.
The HSG projections as a function of time were obtained as follows.
Terms of the form t, t2
, t3,1 t4, sin(wti, sin(2wt) and sin(3wt) wereP
offered to the stepwise algorithm. The criteria for selecting the "best "
equation are the standard error of estimate ISE), and the coefficient of
determination (R square). In most cases R squares in excess of 0.x}5 were
achieved with SES of,a few hundred students, where typical enrollments were
in the tens or hundreds of thousands. A predictive equatioh was developed
for each of the eight state for the five forecast data periods (1967-1977
through 1967-1981).
In developing the NU? predictive equations, actual high school
graduates for states for a given year were paired with entering N.U.
freshmen for at year for each of the five forecast data periods. Terms
:offered toth stepwise.algorlthm were of the form: IMG, sHSG2, and the-) ! r
1s . .natural logarithm of HSG. The same criteria were used to select the best
, 1.
equation 'as above. R squares ranged from 0.93 to 0.9, and SEs from 54 to 94. , . .
we,,_
. _.students. The coefficrents, R squares, and Sts for these equations are
'shown insTable 1.;C.
In any time series analysis using regrssion techniques one is
concerned that the fundamental assumption of lank of serial scrrelation..c.f.sepov,
the errors is satisfied. Pol: all equations, the Durbin-Watson statistfn
was evaluated (Draper and Pnith,1981). In Keaay all cages, the hypothesil3
+P.
4.
372
I

a
I-
355
4 r
of hero serial correlation could not be rejected, *Where; significant0 0
correlation was found, the Hildreth-Lu procedure was appli0 in qn,attempt
to improve the it to the data (Pindyck and Rubinfsid, 1976). No
significant improvements were found.
4 41.
,... .. .,
r Table 1,Pftedictive Equations for NU Freshmen .
Forecast Standard Erro4 Coefficient of,
Oatq Period Equation* of Estimate Determination. 's
. . ,. .
1967 --1977 791.6 +0.1904CN +0.0513MA,
54.6 . 0.93,
.
+0.9688714J) A ''''-1967 -1978 -,0.25660N +0.06954MA +0.09041Nj- 81.0 0.9g-'7.
40
44101
1967-1979 2700.3 -0-.059MA +0.3005NH 7341 0.94.+0.02626NJ
T77-1980 3143. +0.08891 -0.05529MA 82.0IrD.5424NH
' 0.94
1967 -1981. 0.2169NH -P0.04)82NJA-0.0001562 0.99
-*State abbreviations:(
CM CoAnecticut M MaineNH New Hampshire/ NJ New Jersey
.
..
3-N0
The usefulness of the Obint estimates praaded by t equations could-. e
be enhanced by using, confidence- 'intervals. Since the independent variables
for the, NUF equations (HSG fbr the selected states) are not known with
to,
\c,MA Massaehusetti
. '
certainty, but probabilistic "estimates thelijlves,othis.uncertainty muitbe
of''included in any confidence interval developed for Nur. Such confidence
, ., ( . .
intervals cannot be derived analyttpally, since the' distribution "of the. . ..i.
forecast variable is dilrived from the product of normally "distribuied;- -
4 . s.
variables (Pindyck and ,RubiOte14, 1976). An appronpafipn for the 955w.
I 0.
1
4t

, -
It
of
357'
confide ce interval may be obtained by caaputimA4Ile NUF 95% confidence
interval for the expected Value of HSG plus 2SE and'foi the expected value
411:4. .af HSG minus 2SE for eaNatate in the `equation, and then: 'using the.union
of these: two confidence intervals to approximate the 95% confidence"
interval for NUF. This approach results er; the .confidence
displayed in
.through 1982
data perlogs:
. 4.
'kble 2; gigure,1 plots the actual NUF.for the Years 1967
and the confidence intervals developed from "three forecast
1967-1977, 067-1980, and 1967-1981. - i
= ,
Table 2 *
e
NU Freshmen Fbrecasts 1Wit1i 93% COnfidence Intervals
ForecastData Period
.'
Years
1978 .1979. 1980 .1981 .1982: 1983' 1984: 085
1967-1 977
UCI* 4266 4391. 4517 4889Y 4076 1 4143 4253 4443.LCI . 3974 4010 4030 411.0
19672-, UCI1978 . Y
LCI
370' 45287,-4755 f5098
4225 '4334 4497 47544164 42,9 4328 4497
UCI1979 Y
1967_ uc.1980 Y (
I,C1(
.1961--* 1981
47135 5086 5502 59884510 4769 5073 54244274 4177 4622, 4835.,
.
I491k 5176 5463 5776
4625 4833 5057 52954465 4631 4926 4950
. -
YICI
- 4546' 4550, 4495 -44044405 4382 4300 4187_,.4286 ,42017 412§ 3996
IR.
ACTUAL 4082VALUES
12 4093 3800
= 'Upper Value ConfideY = Expected Value ofNUF
ICI = Lower VAlue of Confide
I
nce, Interval
nak.,,Irrperval
. 37
to 1
.
41

s /I
58006 5700
56Q055005400530052005100--5000
. 490048004700
I (i) 46004500o4400a 43004200
z; 44004600
. 3900380037003600
00S4
. 33003200
0
is*
os.
ACTUAL 9,ENROLLMENTS
10
. t.1980 DATA ,
. ..a.-
0> - .
FORECASTS. . <p
c. . 1 ' . .
:. a-.-.0
:9, r'
le 1 - 0 , 0. iis .4:\ 1M
t,1977 DATA A .
.
FORECASTS ) - s,Ai) *
t . . :20
495%).
-13 c. ,,ii:.:,:;:::;':;:;-..;.;. -49-8i DA_IA ,
(o(A In
'1.
, , . a waSTSFORECA .
. (5- ...
, 4)-.-...!.§t) -. 2 /-0 -n
:c,s." En
. :''
.
. ADMISSIONS' r...
0 dO/14L
$
...... 6*
, 'A
.1
I I IjI al` I. I I I I I. I 4.8 09 w 7T 72" 73 74 75 76. .77 78 79 80 81 02 83 .84
FALL :.A
3' /a.
..01.
-,
At
I
fi
. .
N-

.1
4f
I .,,To evaluate the precision of our forecasts, we compared the point and
interval estimates with the actual entering freshmen in Table 2. Seli;-al
observations are in order. cFirst, the confidence intervalSare quite
large. In most of the cases the confidence me al include', the actual
value. Finally, all of the fotecasts, except the one made in 1981, failed.
to reffelbt the downturn in entering freshmen whichoccurred in 1981 (see
Figure 1):
ASSESSMENT OFsMODEL UTI TY FOR .BUDGET FLAMING
Despite the fidt-that- many confidence, intervals do include the actual
values, and t4t indeed some ot the point 'estimates Come remarkably close, A
to t1 actual values, failure to predict any /hint of reduced enrollment
until after the downturn has occurred calls Atiki naive model. into
Lconsiderable question as a budget planning tool. It should be noted that
"rdel perpimed quite we ,up to the turning point. What caused this
turning point: reduc schal graduates, increased -competition frei.,.
other institutions, orC.
T6 some extent, all three
'conspicuous, was
on po*ychanges by Northeastern University'?
hale contributed to the downturn. Perhaps most
an explicit effort to cap Engineering and Business/ ,
Administration %tering flesh A. beginning in 1981. These colleges are/
eajoyiro_considerible growt in enrollments, while some of 410 uncapped
collegp8 were aperiencing d clines.'
The inescapable ponausion is that naive
data are dbomed to.faii as planning tools in
models using only demoeaphic.
the environment dr increastng.
.activism by colleges 012 universities. Models which. rekleet 'and even
,predict,.the impactsof policy changes are becoming essential to planning..
.mo
7 sy

J
k
360
NE 1T FOR ADDITIONAL PREDICTOR VARIABLE
The foregoing iiscussion demonstrates that the current enrollment. -
fo coasting model- is not adequate for annual budget planning. However,'. .
ther- s a. rol r an enhanod version of this model in a two-phased
approach to freshmen rollment forecasting. First, for guidance.oVer a
-one to typo year planning horizon, the enhanced projection model will
provide a forecast every Fall. Then, for more specific estirlIes of the
next freshmen ClaSI, a Model based on student perceptions provided on the
admission application form will produce m revised forecast by the end of
the calen.d&ryear. ,
To enhance the,-current model, we will dis gate the forecast to the
level of the ten und rgrAduate colleges in the University and include
occupationalt4ndioes rel ani to each college and general economic indices.
For the revised estima e, we will use a matriculation prediction model
developer-from. sury y data provided by bath matriculants and
nom-maltriculants. Anailysis of this data thus far suggests that the Student
perceptions listed in Itble rOlscriminate betyeen matriculants and
non-matriculants.
Table 3
Student Perceptions Which Discriminate BetweentMatriculants and Non-Matriculants'
1
The following question items were fOund to be statistically significantat'least at*.the .05 level in both mean score and score profile (based on afive point opinion scale} for matriculants and non-matriculants.'
o Member imgediate familyaftended or attending NU.o_Priends currently atiendi NU.
.o Co-operative Education pl was an important consideration
ih:college choice.
3"
*4-

I
Use of
the budget
361
1
o Impact of r9cilliting activities on coiege.choiCe.* Visit to NU Cam
`0.4. * Interview with-,,is Sms Staff,*'MeetifIg with i Faculty Member* Col3ge Open Ho ,tee *
o Impact of certain common college choice factors-* Tuition, EQ0M, and Board
I. his two-p
* Distance of'Univerisity from Home '-10-,Sise of Sdhook
* Parent's Preference* Campus Location
A 411
approached permits tentative planning.early in
- 4._
process and refFinbment later on,.but still in sufficient time to
alter many funditg committments.
A' "
, 'REHM
Banks, J. and Hohen4tein,_ C: L.; Conce tua2 Models dProcedures for,Predicting Higher Ed5ation Ehrollmentg, ERI C ED046065, Oct 1970
Draper,' N., and Smith, H. Applied Regression Analysis, 2nd edition, New'York% John Wiley and Sons, 4981 A
I
.
Goldberg, .M. and Huang, "Student Flow Models: A SuEry", ResearchPaper, Dept.,of.Mathematics, University of Nevada; 1977
Jenkins G.M. "SomePractica l Aspects of ForecastinekJournal Oce
/
I
Forecasting, il. 1 No 1', 1982
Krampf, R.F., and einlein, A.C. "Developing Marketing- Strligie$ and. 'Tactics in Hi ation Through Target Market Resqarchq. Decision
Sciences, 1981, Vol.. . 2,(April)..
I 4
Lay, R. , Maguire, J and Litteri, "Idlyttifying4stinctive.'Groupe
in aCollege Applicant Poe'. Paper presented at't e Annual Neel!' of the
MfthesOtA, Ma 1981Association for Institutional Rdsearch,Miqteapol
Lin, L. J., Estimated and Pro of of EnrolWisconsin and Wisconsin. State Un versities, N C1DO11037, ARCH-1968
. ,. ;
entfi for the linversitv of
I - . fr. ...LLitten,-.'"And Brodigano. D. lOn Being Heard in a Noisy Witfd: Mdtching
Messirs and Media in College Marketing "" Paper presented a* the,AnnualMeeting of the Association of Institutional: Research, Mikthealiplis.,Minn.,
, 1' , '.
.
*.
..
Lay,MaViro, J., and Lay, R. "Modeling t119 College Choice Process;; Image and
"Decisi6n. College and University, Vol. 56, Winter 1981, pp.123-1,39' .
to
. 379
a
04
I
1

4Nu 362
.4:
Oliver, R. and Hopkins, D.,) "All IbTaifibfium Flow 'Model 0?V, University,'Campus:, Operations Research, Vol. 20, No. 2, 1972
v'. .
Pindyck, R. and Rubinfepit.
D.,lbonbmetric Modeling anatEconomic ecaSts,New York: McGraw-Hill Bo& Co., ,
)Ramasubramanian, R., A Mathematical Moe3,. to Forecast Student Ehrollment ata University, UnpubIl4led Mastpes Thesis, Dept. of Industrial EngineeringandInformation Systems,. WortheasteYn University, 1079. t .
..-
.., .
Wasik, J., The Dedo ent pf a! Mathematical Model to Project Enrollmentsin a Community College ystem, ERIC ED047 1970
;!C7
)
0
y.
7
1
I
II
, e
$
NI*
3 s u
$
A
C.
Is

O
offj
4
Introduction
A
COMPARATIVE FISCAL ANALYSTS IN HIGHER EDUCATION4
David L. RumpfAssistant Professor*
Department of Industrial Engineeringand Information SystemsNorthedstern University
Boston, Mass.
Cost analysis in higher'educatiqp 'has been documented in the 11 rature
for over fiftx years. The breadth and scope of the attempts to qu ntAty
the cost of the higher education enterprise are perti4ps best descri edlin
the four volumemonograph, A Study 0f Cost Analysis in Higher Education
(Adams, 1978), which was prepared under the aegis of the American Councilor
an Education. Comparative costanaLlys s forms a growing subarea within
978, Volum 4) used a Delphi Techniquewith a
ministrators at all levels, to,forecast the
ihis larger field., Adams (
panel of 120 faculty and a
future use 6f comparative
predIcted that the use 04
son- with other institution
tions in 1976 to 62% in
cost analysis in
cost Oormation
would increase
. . fle , t
highereducation. The .panel
for the purpose of costcompari
threefold from 21% of institu-
995. A second prediction was an increase,in in-'
vesMg)aion oethe operational compqnents which make up costs within Insfi-
tutiovf, A tfiirdtprediction was that'f4vercentage of states using cost
information' in deciding on the size of institutional, appropriations wo0d .
increase from 50% in 1976 to 81f in 1995. The stiidies described in.this ,
paper address all three ypes of comparative cost analysesprbdidnd to in-
creave in imporiance,. ,
growth In comparative fiscal analysis can be al.least partially
attributed tothe early Work at WICHE and NCHEMS. As Lawrence (P972) Ilk
stated adecade ago:
.
"A major' element in the )nan emenr61 higher educailon at alllevels is ihe use of comparab dr0 (especially cost data) . At
the ilisaikutions lutional coinparsons are cur-rently .iri important aspect of an i div4dual instilutiores evalu-ation process ..... Al tho,state a d national levels; comparebil-
I)
J, '
v Proviou:ly ihu\ganlger, 0( Plennin9 at f
Amhor, Md5S..
363,
6 University of MnssJchu-,eits,
381
I"
/

ao.
a364
ill( of in-Aitutional.data is even more critrcel.... As he needfor, and trend toward, increased planning for higher educaat the state and national level continues, the.neede for a-commondata base and standard reporting procedures becomes even more im7-portant because evaluation of state-and national programs is com-
' pletely dependent upon the availability of comparable data andinformation (p.59)."
The NCHEMS design for collecting cost comparison data, the Informar
Lion Exchange Procedure (IEP), pr&wed problematic regarding both in-
stitutional ability to provide data in the suggested format and the
benefits derived from iqgiost analysis. The problems encount4red in
applying the IfP approa,ch in 6 majorreieatch'univefsities is descriltd
in derail injopping (1979). tWhtle the IEP approach has been found want-..
ing, a number if institutions have developed individualized cost studies
Such studies have included interna costing analysis (e.g., cost per
student credit'hour by level) and.external comparison -or."peer" studies.
A basic.concern is.raised by Adams (1978, Volume 1) when he notes
tha' there is a significant lack of knowledge about decision-making in
higher educatidn. One could argue that performing comparative cost anal-
ysis is premature if the quesfion of how such analyses will be usedin0., 0
the decigion-making.process is unanswered. The three examples presented
in thdpaper provide limited evidence that comparative data will be used
by academic Decision makers' if it.is available, and that the use can
benefit the institution.
The first study is an analysis of academic department costs for a
peel' gtoup,of 10 to 15 Universities, ini.ludingfirthe University of.Massachu-.
sett%. 'The second study considers costs tia operational component; aca-.
clemics, administration, physical plant, and student affair3. The opera-
cos:t.analyiis study included major research institutions in 4
state... The third study compares public higher education appropriations
for a peer group of 17'states.
44. Academic Department Costs - Peer. Comparisons4
Amherst campui academic deans and t he provost first requested peer
cost data for the academic departments in 1977. The expected use of the's
data insthe decision makingprocess was not stated. However; there was-. . . .
an implicitunderstanding that departments found to be comparatively high
!in cosl would be scrutinized an( .possibly given lower budget,1:, while low-
cost (or ender-tunded).deparimen 4 would ilave a goot.case for.incressed
I \ ) /JV
.
3i d,,,,*.

11
-7 365.
IC .
) budget's. A>follow-Up.peer study was performed in 1980; additional,t011ow-
up studies ary expected to.
be performed on a regular basis%
Peer information exdages have become more common during the 1971A..r..
) . .The University of Michigan completed Its first peersurvey flki 1974 (Adams,
1978, Voluthe 3). Wchigan found that it'togk About 20 don-months to eol-
led and develop the initial output. The data are used to prOViele per- .
spective on the results of an internal cost analysis system. The Univer--
Isity of Houston. requested comparison cost data from 20 institutions In the
late 1970's in support Al a strategic planning model (Lawless et al: 1980).
Houston's information exchange was initiated in response to ibe concern
voiced by faculty and academic deans thyt departments should not.be iscompared
internally to other dissimilar.departments but, instead, to similar depart-,
M4f4i at other institutions. The UniVersity of Massachusetts academic de-
pnrtmenf peer study was d'sig.ned to answer the same typ of questions as f
Michigan and{ Houston studies.
3he mechanics of data collection included the following steps:
- identification of pder institutions *
- survey desigek.-
- mailing and follow-up
- software design for data preparation and reportsby
- verificbtion of data
- report generation., ,..00.--4
Criteria used to sect the 17 per public ipstitutidWS were gAiNraphice
,.
diversity, size, percent fulltime and percent undergraduate. Jhe major4./ 1 40 . .
issue in survey desi,gn was comprehensiveness versus ease of completion. The. v.
. .
1977 peer sudy opted for simplicity and obtayled responses from 13 of lj'. .
instillitions surveyed. The 1980 .,survey attempted to obtain' comprehensive t,
, the response rate plunged to 9 of 46 institutions surveyed. The en-
t ra process from initial request to disieminatTln ofresults.on ce:Ipus tookfw04
an aver4,ge of eight mon4s of elapsed time and about 10.mtn.2moinths of,effort.
The total cost was about ,,0004er study o1 which $7000 was. for personnel,.%
.and the remainder was printing,,mailing and .computpr.costs.. .finder
'Two major areas oferdern became apparent as the peer.
studies progres-.
. sod. ir
.
Ir..
st,ithe question-of data for example, *Me definition./ . .
of full time equiValeni sludnt was different. for each inq tftion. Another4 r
exampile: academic department expenditures included fringe.6 M it toss atc,
.
soma ,in5litulions whilu sucti.expunses were funded from university-wide or.. ig.
, .
fk sLate level accounls in of rh,:t second Probred area wasithd quest of
....
..t .
. ...""

366
comparabillly of academic departmeqs./10ne could argue that an English -
department emphasizing the classic.s.might have a cost, structure differ-,
ent th6n one focused on modern 'literature and journalism; The problem
'becomes much more acute when discussing speci6lized programs such as
sports tudies, exercise science or Afro-American studies The Amherst
campus sojution consisted of obtaining-as much i'hformation as possible
on the academic emphasis of the departments in question corining
or deleting departments to obtain a subjectively determined compara01-
ity for departments defined as similar. ,
Use of the studyr:esults in academic planning and decision - making
was4neither
immediate nor dramatic: The major purpose was Ain identifying.
outlying departments, those depart5talts which had much higher or lower
expenditures per student than the peer mean. There was a general r4ising
of consciousness concerning relative expenditures at the university-versus
peer institutions. In particular, the Amherst campus was found to have
relative.h4gh expenditures for personnel but co4arativelOow expenditures
on support categories, such as travel, supplies and equipment, etc. As a. 4
result of this obsetion, the university administration began to both re-
quest adgiTional state funding for support categories lid to, Internallyk
move funds into the support accounts:'.
t
ThepeeA
r'study was repeated in 1980; results were similai. At the
4present time, the university plans to,cooperate with the University of Houston
in a periodic Collection of peer,costddata. The Houston study includes 20
schools which considerably overlap widthejysachusefts peer university
group. Cooperation with Houston allow ongbing consideration of relative
expenditures for academic depai-tments at a fairly modest cost.
Operational Cost Analysis
An increasing number of university administrators and state;\
level anal-
yss of higher*educati464 are interested in comparative cost data for the
operational components of academic institutions. The widespread-use of for-
mula funding approaches (Gross, 1973) is one example of theibse of such in-
form)tion. An of direct interesf to the Amherst campus, was the
i'mposilion in 1980 effa limit on the number of adminhstrative positions
funded by the, state appropOation.
Th4 interest shown by the legislature coupled with evidence of an in-
creasing state governing board for higher education curiosity lod to
3si

comparability of academic departmels.i/One could argue fhat an English
department emphasizing the classfc's,might have a cost structure differ-
ent th6n one focused on modern 'literature and journalism: The problem
'becomes much more acute when discussing specOlized programs such as
366
sports ptudies, exercise science or Afro-American studies The Amherst
campus solution consisted of obtain ng'as much alformation as possible
on the academic emphasis of the departments in questiOn A Viningor deleting departments to obtajn a subjectively determined compara01-
ity for departments defined as similar. ,
Use of the study%results in academic planning and decision- making
was neither immediate nor dramatic: The major purpoi& was-dn identifying4.
outlying departments, those departmlsk which had much higher or lower
expenditures per student than the peer mean. There was ageneral r4i9Ing
of consciousness concerning relative expenditures at the university .Versus
peer rnstitutions. In particular, the Amherst campus was found to have
relative'high expenditures for personnel but comparativeli/
.low expenditures.
,
on support categories, such as travel, supplies and equipment, etc. As a. 4
result of this observation, the university administration began to both re-
quest adgirional state funding for support categories .1w1 to internally
move funds into the support accounts ;.
The peer'study was repeated in 1980; results were similar'. At the
4present time, the university plans to,cooperate with the University of Houston
in a periodic 'collection of peer.cost4data. The Houston study includes 20
schools which considerably overlap with the.M9Itsachuseits peer university
group. Cooperation with Houston will allOw ongbing consideration of relative
expenditures for academic depai-tments at a fairly modest cost.
Operational Cost Analysis
An increasing number of university administrators and state'level nal-
ysts of higherteduca066 are interested in comparative cost data for the
operational components of academic institutions. The widespread--.use of for-
mula funding approaches (Gross, 1973) is one example of theibse of such in-,
ferm-Jtion. Anillustration of direct- interest to the Amherst campus was the
rtivotAtion in 1980 efCa limit on the number of adminkstrative positions
funded by tbe.state approprilation.
,e Th6 interest shown by he legislature coupled with evidence of an in-
creasinq stnte governing board for higher education curiosity lod to
3H

367
a Planning Office study of formula funding and operational costs in four
states Illinois, Wisconsin, Texas and Ohio.' Each state either funds
% the higher *education enterprise via a formula based on cost analysis (the
last three) or performs a detailed cost analysis as part of the budget
procest'( Illinois).
The desired data were collected during site visits with major fiscal
officers at institutions, central offices and in the legislature. All*
states'were visited by the author with the eXception of Ohio; in this case,
a former Ohio state fiscal officer employed in Massachusetts provided the
needed data and.commentary. For the formula. funding states, detailed In-
, formation was obtained concerning the formula, hOw to apply it to an insti-
tution and any caveats which wouldinficence use of the formula at the ,._.
University of Massachusetts. Illinois provided detail&rcest study data
which gave comparable informatift. The obtained data al*iowed preparation
of theoretical budgets, that is, budgets as if the university wereilocated
in 111inois, Ohio or Texas (the Wisconsiin formula contained many idiosyn-
crasies which precluded such an approach).
The theoretical budgets detailed.the total level of funding the univer-'
sity could expect if it were located in.lilinols, Texas or °filo. In addition,
the budgets detailed expected funding evel for the four major:operational
areas on campus: academics, student affairs, physical 'plant and administra-
tion. Unfortunately, organizational differences from state to state ruled
out accurate comparisons for all four areas. However, a clear/division be-
tween academic and non-academic operations was poseible The r4tults were
quite illuminating; academic affairs appeared to be funded less.%111
than similar activities'in the three comparison state! )1hilenon-academic
areas were funded much more generously.
These findings were Old during the next budget decision cycle +.0 pro-
teCt academic area budgets at the expense of non7academtc bUdgets. 'The uni-
versity was forced to absorb a $2 million budget short fall'(frb:m inflation
adjusted level funding) in fiscal year 1982. Academic aff6irs ab1Orted pro-
portionally less of the short fall while non-academic areas weregixen
larger cuts. The perceat effect is shown in rigure 1; the total dollar.bene-
fit received by the academic area in 1982 and 085 ioiarod aboult onaomIllion
dollars.
Future use of operational cost comparison data is dependen:on impr6Vild
385.
et

)
f
Figure 1
36itt
416
\. .
. 1
MOVEMENT OF $ TO ACADEMIC PROGRAMS
6.1111
AlloCation of FY1982 Shortfall
Bercent of ExpendituresFY1981 .
AcademicAffairs
1
v
r ' .,
c
Percent of ShortfallFY1982
..0
i
.--""
.
,

\t,
. .1. ., ..\ . . .
analysis, of,the non- academic areas. 'A'detai,ed conSideration of the
L
. .
Amhe'rst campus organizational, structure ver the comerison schsOts, .
v,- ; ... ,
would allow direct tomparisOn of Ohystpel pla'.t cOstssgpartite from' ' ', ..
administration costs and'sbiforth. Campus adOtvistratOr's Nive'nof,yet. ,, Wagreed to fund a detailed.anklysii.talfhougivthagree lt
,-is needed to
...
make equitable budget decisions for the norr-apdeemit areas.t. ,
.
. .
1 . 5. State Support for Nigher Educatidn .
.t,,0
The MaSsachusetts Eloard of Regents,- the sta a goTerringsboard for:.,
higher education in Massachusetts, submits the bu get req est for public
higher education to the governor and legislature". One'of heir reSpons1-.-
bilities is pliblic and Oiwate lobbying' rn support df the ubmittei bud-
i get. The Director of Plannihg on the Regent's staff reque ed the support
of,the.author'ih analyiing the comparative"level of taxpay4- support for
public higher education in the Commonwealth. Alttiou h published analysesi
(Chronicle, 1978,1979,1980) ranked MassachusettS 48t or 49th of'the 50
states, the accuracy of the data was suspect. The pm pOse'Ofthe proposed'
study was to obtain ,accurate 'lap on relative support nd to use the re-..
sults in the politital arena.,
..
, . -
The first'step in the study was the definition of elative support;
should one lookat dollars per capita or at'dollars per f 11-time equiva-
te.nt (FTE) student: Support'per capita isa Measure of blic higher-edu-$
cation's share of thefotal state budgei an'd indicates fh access provided. . ...4-
for potential stildents. That is, a stet with'higher per pita scipporit, .
is funding educaponal:ogportunities tRr larger perdenta e of its resi-
dents.$
The seconl.possibipty, dollars er FTE student, me sures theleVel.
of support provided fOr students enroliei in the higher education system;
f.e., the amount of. money the state li c ntributing per enrolled student.. i
. , . . .
Previous studies (Hahtead, 1982; McCoy and Halstead, 1979; Chronicle, 1978,
1979,1980 largely considered the fir'st measure, support per capita, and ex-
cluded the second. kOwever, enrollment in private institutions of higher
-369.
, .
education comprises over 50% of Mdssachusetts post-secorIclacny enrollment.
I
.. ,,,>;-:.
Given this unique fact (the national avxage is much lovieritsleqr10%) d-, ' s4:s
noting that floper pgplfa measore is probably negativet* cori'61*Vd with..
percent enrollMent in the p6blic sector, the' second megdure was4Chosen:sup-.
^
00 per FITN$
ydent:,
. .
.
i.. . ..-,
1 1
..
... . ,
... e
387
.

S
3704
..1
.
. .
. . .
Twenty-three compa;% ison states were chosen for the, *study.'.:The 'States
chcsen wer'e a representativOnutionallsamplevccording to previoUsly:pub- .
_. .
lished cost studies and were perceived to be high technology states and /'or
geographically and,politically ppropriate for t'he comparison stddy. ,Sur-
'.0. ..K %
veys were mailed in late April 1982 with telephone follow -up. Altotal of-,. .
18 states (including Massachusetts) responded, a 78% respcinSe rate.
Special effoil- was made tc:obtain comparable data, especil"Ilyon fringe.
benefit expenditures and use of tuition receipts. A copy of the survey
and specific state data is available from the autteron request.
The results, summarized on Table I and 2;were surprising when com-
pared to previous result?: TheCommonweallth of Mas7sachusetts fu:ndin4for4
fiublic higher education was close to average, rather thannear the bottom..
I .
For community colleges and universities, Massachusetts support per,FTE was.. ..
. .
at or near the mean for the surveyed states. Only for the four year state. f ,
college was support per, TE low il3th of 15) . The results have been dis7.
cusSed yith public college and university presidents and the meMberS:of the
Board of Regents. To dat4-i no decisions save been madeconcerni.
ng use of. .
the data inthepolitic1
al Arena. Howe ver, the data have been described as\
.
very r.:..aling and usefuj by prIsidents and regents. While future use is
unclear, the Oireotortiof Planning is satisfied that a majdr goal,
has been
accemplished,that of obtaining accurate data and making the internal 'emit
stitue6ey (presidents and regents) aware of the situation.
,Summ3r1:
Three examples of comparative cost studies have been presented and dis-.
cussed. While cost effectiveness data must be considered'in the'context'of'
institutional mission, the rotative quality .of tie units compared and,stu-deist.
. dumand foc.prograiris, it Can sidekitlify high cost or underfunded program ,areas.
Fur the three studies describbd above, (the most. important function of accur-
a cosi comparisondatawas.to provide a more dnl.ightened.context for the
political budget decision process.
-)'
a:
1
A

't
.7
2-Year ,
State ComovAity Colleges'
.5/eTr. Rank
Massachusetts $2,14.0 s
I qinnesota - 1,926 9
Connecticut 1,.852 11
Texas'' 2,257 . ',..§
. 'Mai ne " NA NA
Utah '2,716 3
Ne4 Jersey 1,616 14
Washington 1,887 10
Ohio ** 1.690 12
Ma,ryland 2,270 5
Pennsylvania 1.439, 16Delaware. 4.306 1
New Hatpshire 1.478 IS
Rhode Island 2,23b . 7
Vermont 8,2 17
North Carolina 2.750 2
Ilfinois 1.615 13
California 2,596 4
Weighted***Average 2,140
M1S5ACHUSETTS ASPI RCM Ur.UE:G1:11D ALLRACE
COMPARATIVE STATE FUNDING
TABLE 1: FISCAL YEAR 1982 DATA
I
4-Year
CollegesVF1E, 'Rank '
$2,223 . 13
2,297 12
2,356 10
4,4 4,697 2
NA NA :
2,464 9/
2,872 7
2.343 11
NA NA2,855 8
C.-
4.190 3
6,97 1
1.653 15
3,00 Sfta
3,918.931 14 t-
.
Universities
SIETE
1, 655924581
32:.61123
3,4534,2254,899
2,453',
3,657
2,4583,2212,404
1,606
3.325 6 4,348NA NA 3,807 %
4,068 4 8.213
3,454
64°.
03 8;6
96%
4.
Subtptal
2 yr, 4 yr anclUnivorsity
Rai* :
1
4
9
/1114 g:83
12 3149' 6 2593
2 205.16 . 2244
,1,11, 2806
r
Is
13
17 .
,7
t18
UFTE Rank
96
15
15
2740 12
2752
2112 17;3324 3
1657 18
15 3275 4
J8 2658 13
. 1 3480 2
14
8
16
11
C.4
Does not inXade oil related revenues from land deeded to the Univeisity from the-stalet.inelusion of same would
add about 12% to the University's S/FTE.
a* ease note that Ohio combines 4 year college data with University data throughout this repOit.
38a** Stats with larger Full Time Equivalent (FTE) populations are weighted more heavily.
40,
39L

4
3i
4
cOMPARAT1VC MAIL FUNDING
.
TABLE 2*. EXPENDITURES PER FTE:, MASWKISEITS, RANK AND PERCENT OF MEAN
LEVEL 41
1
.
fiscal
.
2 Year N
,
.-
4 Year . UniversitySubtotal
2 yr, 4 yr, and
Percent Percent Percent . Ivercen
14,alk of Weighted' Rink of Weighted* Rank of Weighted Rank of Weighted'Mean Mean Mean Mean . '
.
.
1978 10 of 17 79% 412 of 15 663 '' 8 of 18 103% 9 of 18 NA
1979 5 'of 17 --.. , 108 13 of 15 71 6 df 18 111 vi 6 Of 18 NA '
.
1980 6 of 17 95 12 of15 8 of 18 10r \ 9 of 18 NA ')J
.66
1981 6 of 17 100 12 of 15 65 9 of 18 .96 8 of 18 NA
.1482 8 of 17 100 13 of 15 64 9 of 18. 96 9 of 18 .'NA
-'
Slates with larger FTE student populations arc weighted more heavily.
6, '.. k
3 (i/4.:. J

4
REFERENCES
4
Adams, Carl R. et al. A'Study of Cost Analysisin Higher Education,Volume I to 4; 1978, American Council on Education.
373
Chronicle of Higher Education, p.. 1; October 10, 1978; October 9, 1979and October It 1980.
Gross, F.M. IBC Comparative Analysis of 'the Existinq Budget rormuias Usedfor Justifying Budget Requests or Allocating Funds for the OperatingExpenses of State-Supported Colleges and Universities, 1973. , Avai 1-
able frtm Office of institutional Research, University-of Tennessee.
Halstead, D. Kent. How States Compare in Financial Support of higher -
Education, 1981-82. National Institute,of Education, Washington, D.C.rebruary 1982.
Lawless, R.W.; Wright, D.J.; and Norris, D.M. Processes and Techniques forAllocating /Reallocating Resources, A Presentation at the TwentiethAnnual Forum of the Associatibn for Institutional Re a rch., 1980.
Lawcence, Ben. "Tice, WICHE Planning and
Naturp, Scope and LimitationsinApproach, Paul W. Hammelman1972.*
11::=Th)11Xser:W7inNew York: Praeger Publishers, Inc.,"
1McCoy. M. and Hal-stead, D.K. Higher Edutation Financing In the Fifty States.National Institute of Education; Washirgton; D.C., September, 1979,
Topping, J. Evaluatidn of4he !EP Costing Procedure:,Akilot Study by SixMajor Research Universities. National Center for Higher EducationManagement Systems, 1979.
6
I

BREAKING THE "VICIOUS CIRCLE" OF DECLINF AFTER A FACULTY RETRENCHMENT:
A CYBERNETIC MODEL .
r7Louis M. Spiro and Jill F. Campbetat il te,
Office of Analytic Studies -4
State University of New YorkCollege at Brockport
I. INTRODUCTION
,Budget and enrollment difficulties have been.well documented
?inthe
higher education iterature during the 1970's and 1980's, and there seems
to be no-immedi f in Sight. ..What is of greater concern, is'the
e more recent cris situatjion developing in the public sector and fn the
larger independent Institutions, in addition to the small, private liberal
arts colleges that have been under pressure for some. time., These larger
Wleges and universities have management and/or planning systems yet many
see-i'unable to develop contingency plan% or to cope with sudden budget
and/or enrollment dislocationi.
The initial responses to these environmental Constraints tend to be.
fairly similar -- faculty and staff vacancies are not refilled; across they
board budget outs are mAde; maintenance ts deferred; and retraining efforts .
are made to'reallocate expertise internally -- but these are rarely success,
ful since-they deal-with the symptoms rather than the root causes of the
problems. In many recent situations, faculty retrenchMent and.program
elimination have been necessary as a drastic attempt to realign the insti-
tution, its resources, its mission and iyitudent clienteles. Unfortu-
nately, faculty retrenchment does not' guarantee an end to these budget
and enrollment woes, it may,only buy a little breathing room as the cycle
of decline continues, perhaps leading to. the .eventual closure of the fnsti-.
tution.
The contention of this paper is that the current management-and
planning systems are not being used to analyze many interrelationships of.
internal institutional acrd external envlironmental variables, and that a
new approach.is essential. Also, when organizi44em are subjected tp
stress, increased attention is focused upon time-hon6Yed strategies'that
have proven successful in the past, or simply upon managing and surviving
374
$
1.

4
.375
, ,
. .
the current crisis. New methods'of operation are generally ignored,
leading to an .in,tidticn iial,"tunnel vsonli at preciselethe time when:'.
.. .'.consideration of the widest range of'future options is require41a
.
The sections which follow Use the State University. of New Mil, ,
-, ,.o lege at- Brockport as a case studyof an institution,having budget
rollment probleMs 'and.seeking to readjust following a facip.
re pt ,.
-If. CYBERNETICSrl
Cybernetics has as its centra the concepts of regulation
and control of systems. This discipline has tend ocus,on machines,
such as thermostats and automatic pilots, but it has also been suitest
ful tin analysing living organismt and'social systems at more complex
systems, that. operate 'under the same principles. .
.
The following overview of cybernetics is from Ashby 11956) and _
91.
points out some of the basic components of cybernetW The basic
, problem ol regulation is that given somPessential variables of an
organism or social system (E), the atceptable levels or statesof.thest..
Variables (n), the environment (T) and sodeexternal threats or dis-
,turbances (D); to form a mechanism Of regula'tion (R) such that after, the
outcomes of the disturbances in the environment, the essential variables. .
are kept within the acceptable levels. .. .
.. .. .
One important point is that this process assumes that the essentj1 ...,
. . . lit
"variablet have already been identified aripthat the acceptable states of.
these variables have been specified as the goal. The emphasis is toJ
.
Achieve the pal in spite of disturbances and Orfficultfes. :--
.
To bring this discussion Of cybernetics-into'an eduCational context,
let us consider the 'following example:, An institu tion'requires'a sped:.. . .
numberfied- of faculty to operate (E), but tt is subject to studentpand ,ttei
budgetary aspects of theetiviroKpent(T); and the disturbance (U) is a :,
.,
decline in the number of traditionally ageestudenti. If the, . . ,
n ,
mechanism (R) can anticipate this disturbance andlitake action, such as ... . .
IMP through tapping non-traditional student markets,. the outcome tp:the number,
of faculty will remain unchanged. However, if the initial de,glin? in
J.
ti
.
S 'budgetary reductions in the environmental "outcPme dUe to the decline in
students is not-readilyaaticipated by the regulator,(R), the.first ,
* ,
-
students-(T) will cause an 'initial reduction in the number of fatulty.41-s.--.., ..
I .
. . .
.. .
S
4 al i %.;
! ,
395 --11
.1 V
O 6 .4:?'
#

the institution' (EY.,___Thisi nicirma-ti-en -wil-l-eau-se-t-he-regtrtator.4fRi--to* .
.begin operating to lounteract this small, initial error and prevent
°larger errtrs tat could threaten the required levels of faculty at the
institution.
376\ .
There has been less attention paid to systems in which thqe proc-
esses amplify ,somedisturbanee arld dilerge from the Original condition,
rather tiian'having them controlled or'counteracted. Maruyama (1963) is.
.thetiabrce for.the review of these deviation-aMplifying systems, which1.
he-defines as the "second cybernetics". Evolution of organisms and
cultural change are frequent situations where this type of process h
operates, and work has beenii4eloqbd in economic systems a* well. The
power Ip'this process that is so disproportional to the initial kick
makes. planning the direction of change'vital.
Severaf important definitions relate to these types of systems:
1. Mutual causat ion exists only when the size-of the influente in one
direction has an effect-upon the size of the influence in the.other
'direction and is in turn affected by it.
2. These-relationships caMbe defined by4many elements, and it is the
forMetion of loops that allows the influence of an element to come
back to itselfthroUgh another 'element. Positive relationships
indicate that the change's Petween.elements.are in the same direction.
Negative relationships'indicate.that:changes occur in opposite
directions.
3. A loop with an even number of negativedpfluences.is deViation,.
amplifying and a loop with an odd number of negative influences is
deviation- counteracting.
Most systems contai2Poth amplfYing and counteracting loops, and
the oYerg31 orientation of the system is deterAined by the relative
strengths o each loop.. 4
441k
Under changed Conditions, a deviation - amplifying loop, can becOMe
deviation - counteracting, and vice versa.t .
III. RESEARCH 00tIGN
Purposes
The primary purpose of this paper to adapt the cybernetics..
model, as illustrated by Maruyama, to an institution of higher educa,'
tion and to examine the elements that njake up the mutual causal relationships.
39.6

I
r .
377.
Specifically:, this entaili_the identification nEtne--0100r-e-l-efilents that
impact ido 'college at,Brollport frOm the external environment, as well
as from the internal operations and the constituencies of the`
college.
'This isIobe,followed by a deterifnation of the positive and negative
feedback relationships that exist between these elements and the clyste'r-
ing of these elenients of the system in to deviation-amplifying and
deviation- counteracting loops. The survey nature of this project marks
tie initial attempt to estimate the perceived relative strength of each
loop and the.general orientation of the smktem,,taking the Maruyami
approach from'a methodological deve opment to an operational .technique..4
A secondary purpose is to consider the potential of how the facultyA
retrenchment process may have alteredithese feedback relationships
between elements and loop and system orientations.
Methodology .The important elements were pre-determined in consultation with
several other administrators. Three basic eleMents'and their relation-.
ships were developed fir%t -- Budget, Students and Faculty -- based onA
the enrollment driven nature of the SUNY systein budget.process and the
past trends in these elements. Within thete basic cateiories, a list of)
Important elements was developed for the cybernetic model and then ran-
domlyessigned aplace on the survey form see Table 1}. Ave elements
were thenplaced in a matrix format with the main diagonal and one-half
of the matrix "X'ed out- This was to eliminate the evaluation of a
variable by itself.and the need to evaluate converse relationships, since
' once A-R'-was indicated by a value, B-A should have the same value.
Attachments to each survey fOrm included an introduction to the survey; -
directions for Ats completion, the range of possible positive and riega-
tiv0 values froM -5 to +5, 'and examples of negative relationships, no
relationship and positive relationships.
The expldOtory natuo;of this sUrvey,suggesied a relatively small
sample, and it'was determined that ten surveys each would be a ministered ,
, dr,to faculty, studs and administrator groups.
Survey forMt ere personally de1iveted or mailed to faculty and.
adm trators: fter a orsonal contact designed te.incease the response
rate. Completed surveys were unsigned/end
returned i unmarked envelopes
to insure confidentiality and anonymity. The student surveys were
4
.397

_
4
- 378
V
SurveyNumber
Table
BaskCategory
Budget, Student and Faculty Elements for the Cybernetic,Model
"-*-
Element Name
Budget_ New Prigram Development
Program Discontinuance
Unemployment Rates' \
Inflation Rates
10
12
16
20
Budget Allocations 21
Studehts Number of'New Students '1
Tota3 Number of Students 1l 3
Competition Within SUNY 4Student Attrition 5
Marketing Strategies 6
Admissions Standards '' 17
Financial Aid Eligibility 18
External Image of Quality, 22
Number of High School and Community College Grads 23'
Faculty Progrm Articulation with Community Colleges 2
Major Advisement -
General Education Program' 8
Faculty Research and Publications 9
Quality of Instruction 11
Public Service 13
Progra e 14
Program Quality 15
Number of Faculty
/ 390
4

th.
379
administered personally at the end 9f.a class session and collected upon
their completion. The nature of the student survey insoired one-hundred
percent completion and return. Administrators also had a one-hundred
percent response rate, perhaps because of the initial personal contact.
Faculty had a rather disappointing forty pekent responSe rate,,but the
impending-faculty retrenchment and associated concerns may have been an
over-riding factori
Analysis
The major emphasis of the project is t he examination of the three
distinSgroups of respondents, in terms of the elements relating to the
cybernetic model. Therefore, an analysis of individual respondents to
form similar gi-oups was required. tf-technique chosen to group, similar
respondents was Q.Factor Analysis, where instead of clustering variables
into factors.(as *6.R Factor Analysis) the respondents themselves were
clustered into factors. 'Since the Q Factor Analysis procedure was not
available on the existing version of SPSS (Nie et al, 1975) th)p data' was
inverted before analyiis so that the rows were equivalent to the element
relationships values and the Columns were eqogivalent to ifi-e-spondents.
A standard factor analysis procedure was perfOrmed,including the used:of!
communality estimates through iteratiiii7-tlid a VARIMAX rotation.
IV. RESULTS
A twoifactor solution with a VARIMAX rotation was,identified as a
trade-off position between the least possible number o'f factors represent-
ing groups of lespondents,Witha reasonable pattern of loadings of each
respondent with a factor hi the rotated solution.
The student, faculty and Administrator respondent groups disappear
in the Eptatedfactor solution. Of the 16 respondents comprising Factor 1,
- they include 7 out of 10 students, 7 out of 10 administrators and 2 out
of 4 faculty. Factor 2 has the remaining 3 students, 3administratori
and 2 faculty.
For each factor group and for the total grloup of all respondentgl,
the average rat* for each of the possible element pa Ws, was calculated.
The positive and/or negative response values for all members of the factor
group were totaled end then this total was divided by the number of.
respondents -in the groiup to arrive at an average rating of the element
pair relationships. very few element pairs have average raZings of "ho
relationShip" butthe vast majority of them fall into theklow "positive
399

1
380
relationship" and low "negative relationship" ranges (O.1 to 2.5and
-0.1 to -2.5). a few are moderate to high positive relationships
12.6 to 5.0) and there are no moderate to high negative relationships.
The specific element pair's with moderate to high relationships are used
for the remainder of the analysis, and it should be noted that all of
these systems are deviation-amplifying since there are an even ,number of
negative relationships, zero in all cases.
t Ftgures 1 and 2 provide the diagrams for the total respondents vie
of these processes and their generalized relationships. There is a high
degree of complexity inthis diagram as seen by the incredible number of
potential loops that can be established to indicate mutual causal rela-
tionships. These elements can be reduced by diagramming only the elements
with the highest number of linkages: There are direct interrelatfbnships
between all of the pbssible element pairs'with the exception of the number
of new students and the total number of students,, where there islan in-.
direct link. What is apparent is that minor disturbances in this deviation-
amplifying system can flow through a myrifed of channels to move tht entire .
system farther and farthef away from its -original condition without being
easily monitored, regulated or controlled. >
It is interesting to note how few relationships are perceivedlfor
the budgetary alloCation,and number of faculty element's, as well at their
relatively low to moderate.element relationship ratingly
The emphasis is on student numbers and quality issues,, particularly
the total numbet of students, the number of new students and the external
image of quality. This may have been a function of the coincident faculty
retrenchment process that had been well publicized and which had specified
program quality and student demand as major evaluative factors. It is
possible that the system petceptions that were obtained were somewhat
ahegrted and that the budgetary and faculty elements should have been
more prominent: In any event, these elements, processes and deviat4bn-'
,amplifying systems are quite useful in trying to understand the complexi-
ties of the current problems and in identifying 'means to cope with them.
. V. RECOMMENDATIONS FOR CH NGE '
It would not be an bvirgenerefizati n tosuggest that SUNY College
at Brockport is ina deviation-amplifying system characterized by fairly
abrupt changes. The condition has gone from an oversupply of students
u u

V
I.
.
Figure 1: Total Respondent piagram of Element Relationships
14 12
18
17
381
%.
Major Elements
)9 10 21
Linkages
22 External Image of 'Quality 7
15 Program Quality '6
6mberof Students -
1 Number of New Students 5
6 Marketing Strategies 5
Other Elements
2 Program.Articulation with 17 Admissjpns StandardsCommunity Colleges
4 Competition within SUNY 18 Financffl Aid Eligibility
'10 New Program Development 19 Number of Faculty
11 Quality of 'Instruction 21 budgetVocitions
12 Program Discontinuance
14 ProgramiReviqw
23 Number'br Hillh School &Community College Grads
- r

3
a.
382'
Figure 2: !Total Respondent Diagram of Generalized Relationships
Program Qu lity
15
Marketing Strimies
6
1, 22
Number of'
New Students
4P
3
Total Number of
Students-
4U24
4
External Iiage
of Quality

. 383,
with budget and faculty reiburces trying to catch up, to the current
condition of arr undersupply of students with budget and faculty resources
being removed quickly. What makesithese changes more frustrating is
that there is no simple exelanation of how the change started., why it .
continued, how it moved from a positive to a negative direction for the
institution, and howor if the change can,be stabilized or.reversed.
.The most obsykaiF problem that currently exists is 'that the level of
complexity and inter-relatedness of the various elements are notrecognized,..-
or well understood. The same problems appear in many different contexts
over time and never seem tot be satisfactorily resolved. The failtire of
this piecemeal' approach is not surprising considering th diagramis of
element/relationships. '
Another area of concern is the identification of,stabilizing factors
that can be built into the system oP sot of its component loops, to change
"fts4rom a deviation-amplifying to a deviation-counteracting system. This
:is particularly important because of the roller coaster nature of enroll-
ment, faculty and budget that has been experienced at Brockport.' One
mechanism of stabilization is admissions standards that can be negativelye
related to the number of new students. Modification of this cement can
be deviation-counteracting, but its effects on other elements o the
system, it. program quality and external image of quality: must cldsely1
monitored. New program development could 'also be negatively related to
4 the number of new anti total student, so that as the number of students.
decreased, the new pAlrogr'am development would be increased.:. The types of
additional element that could be developed as negative
positive ones that could be changed are limited only by
that are to be accomplished. In the current situation,
relationships. or
the system effects y
an initial kick
to increase program quality, the external image of quality and42r,market-
ing strategies' would seem to be appropriate and could spread througholit
the system elements to increase the total number of students and the'
number of new.students. Once the levels of students, faculty and budget
are in balance at acceptable levels, then the deyiation-amplifying system
can be modified to'become a deviAion-counteracting bne.
The extab ishment of specific gdals and the creation of a decision
making process ensure that they are achieved are essential to the .
'understanding and modification of cybernetic systems. As mentioned
earlier, specific goals are.assumed to already exist by.these cybernetic
403

Id
,t
4 9
-1%.
,
systems and the specification of acceptable levels or ranges of essential,..
elements are required in miter to determine if error con iti ns exist and. ,
to provide regulation to either maintain or return the ess ial elements
to..acceptable levels The'lack'of specific goals and the identification_ . )
of essential element levels preventt the mission of the.College and its
10day-Uo-day)perations from interfacing,effectively. The cohtrol of /day- 1(
to-day operations is-not Possible since .there 1-iiroverall'context within.-.
which they can be e%(aluatediand compared. White they may seem to be in
control at the unit level? and perhaps be seen as:functioning ih the best
,tiiinterests.4 e institution, 'at the systeinlilevel they,may be contributing,''
to deviaton-amplifying forces that ate no1 4parent and that actually..
.,
work counter to the best interests of the'College.. /
The.final recommendation is the developmentiof an information mech-.°
anism that not only monitors potential disturbances in the,en ronment,
such as the decline in high school graduates and the Changi participa-
tion rates, but Aso evaluatei the outcomes of change V. terms' of the
essential institutional variables. If these outcomes indicate a threaten -
ing situation, this information comportent should pe .ableto provide .
recommendations for action that take into account the, system inter-
relationships. A decisi6 making Axocess should alo be jnstituted so
that when the evaluation of outcomes indicates action or reaction, theI.
appropriate response will be initiated and brought to a successful. t
concluSion. /,REFERENCES
. ,
Ashby; W. R. 1964. An Introductqn to Cybernetics. Lond6n: Methuen
and Co. Ltd.
c. .
Maruyama, M. 1963. The Second Cybernetics: deviation-amplifying mutual. .
.,
f',' causal.processes. American Scientist, 51:2, 164-179. ..
. . . -a..
Nie, N.,H.;.Hull, C. H.; Jenkins, J. e.; Steinbrenner, jC.; 4nd;
Bent, D.-H. 2nd ed. i975. Statistical Pac1ca4e-for the Social
Sciences, New York;. McGraw-Hill BoOk Col
4
NO%

yr. O
dr
INSTITUTIONAL RiSEARGii tIN AN EXPERIMENTAL-SETTING:EXPERIENOS WITH THE NEW YORK STATE REGENTS EXTERNAL DEGREE PROGRAM.
lb .
-Elizabeth Taylor, Ed.D.Office.of Institutional Research'Regents External Degree PPogram
soki
Introduction0 0
The Regents Externil
of the State of. New' Yol*4
V
Degree Program of the State/University,
(REX) was oreated by the New York State
Board4of Regents in 1970 as #n experimental program, based on.
the concept that, whai a person knows is more important than how2 ,
or'where the''knowledge was acquired. Its central mission is
"to provide an. opportuni,pylor earl-ling a college degree to aca-
'derbically 0919 inOviduals at low cost, regardless of age, place. .
. .
,of residence, 'prior educational credentials, or constraints. .
imposed iiir occtipation. ill The program implements his mission4
by offeringacademic recognition'in the form of credit and$. .1
degrees to-students who have demonstrated college-level learning
through examinations, college coursework completed through other
acCradi,ted academit institutions, andbi" other approved-meand..66
, The Program.. currently offers eight degrees:' two associate.
degrees and' two, baccalaureate degrtes in.the arts sciences,
two associate degrees in-nursing,: and OaccaltS reate, degrees in t
.business and nursing. Overk 50,000 students are or have bn
involved irt the'program since its beginning. About 16,000,are
..
.
currently aotige candidates., .
REX diftervfrom gth.er more traditional colleges in that
385 4 (43,
t

v
A
386
it.. offers no direct instruction. "The tegents External Degree
the' proqedures traditionally asso-
education and may will change the
.drasticallythanges four .of
ciated with AMericalkhigher
.
fifth. Formal admission requirements are abandode4 all. effec-,
4
live methods of learniqg are accepted as valid, varied methods
(bothold and new) of measuring accomplishment are used, and the1
degree is awarded by what is as much-a department of government:. ,
as wag the University of London until 1900."2 .
° i Students in the prdgram arelpferred to as candidates, and,
there are m9 campus and no classrooms off-campus. Instead, the,.- .
staff assesses and documdnta.ilearning that takes place somewhere
els thrpugh several means, including the vfirifi'catio of tran-qt.
seri ts andthedeve1,opment of tests to assess'college' Llevel...
learning. As candidates progeees thrciugh the progiaffi they can
receive written and verbal advisitig. aboUt /Pethods to earn
. credit.
Faeulty involved
colleges
lerve-on committees to set standards and goals for-thle program.
Faculty committees meet seveewM t.-e64.1T a year toidiscuss°
members from
in the program are composed oi..faciat-y
and universities.who have agreed-to. .
policy and to review candidates or graduation:
The day-to-day activities of the program are performed bya
the staff. The_. program is divided into units that have'
-responsibility for specific functions, such as the Registrar
11. and Test Development. For example, personnel in the Office'
ofIndependent Study perform the! kinds of task6 most closely. .
associated With-faculty and counsellor,at a more traditional
r
..
loo
.
a

If
projects outside of nursing needed to be coordinated: Provisions
'388
were made to create the position of Institutional Researcher.'
, As originally planned, the ,,Institutional Researcher would have6
responsibility for th94eneration of information regarding
various aspects of the REX Program. The researcher would
4interact with various audiences to determine their inforMation)ri0-Aagweds, develop stretegieS for generating the-required inf.qr2
mation, carry out data capture activities, implement Systems
'.. for data storage, analyze data in Appropriate ways to yield,
the required information,' and present, the informationeffec-,
tiliely in written and oral form.
Research Needs of An EXternal Degree Pragram. .
.
- The fact that REX candidates do-not reside on a centralized
campus leads to some unique needs for information. Contact
betiteen faculty and candidates is minimal. Contact between.
staff and candidates,is somewhat greater,. but not every candi-. / oi 7
date receives personal contact. Thus there walk. basicneed
to discover just who the candidates were.. Much anecdotal evi-
dence existed to indicate the kinds of people w,ho needed the,
services REX provides. systematic- collection of information was
C
now needed to:give a clearer picture of candidates.
Beyond simple data gathering, there was an internal need 4
for a centralized research office to aid in the integration of
research .findings intc6le da;3,y decision; - making process.* Staff
members make decisions about ,student .advisement. and the inter-
pretation of ppogram policies on a continuous basis. Information
to base these decisions on wastgenerally'anecdotal, based on the
experiences of former candidates. A clear information base was. r
4u

1
38i
projects outside of nursing neededto be coordinated: Provisions
were made to create the position of Institutional Researcher.',
.A s originally planned, th6,,Institutional Researcher would hale'
respodsibility for the.generation of information regarding
various aspects of the REX Program. The researcher would4
.interact with various audiences to determine their inforMation
44;eds, develop strategies for gen4rating the-required ini:o.r2
mation, carry out data capture activities, implement 'systems
'.. for data storage, analyze data in appropriate ways to yield,
the required informatfbn,' and preseni.the information effec-
tiVely in ,written and oral form.
14
Research Needs of An External Degree Program
The fact that REX candidates do-not reside on a centralized.
campus leads to some unique needs for information. Contact44
betWeen faculty and candidates is minimal. Contact between.
staff and candidates,is somewhat greater?, but not every candi-.
date receives personal contact.. Thus there walk basictneed
to ascover just who the candidates were.. Much anecdotal evi-
dence existed to indicate the kinds of people who needed the
services REX provides. Systematic- collection of information was
now needed to:give a clearer picture of candidates.
Beyond simple data gathering, there was an internal need
for a centralized research office to aid in the integration of01
research findings intohe da.;.pr decisionz-making process. Staff
members make decisions about ,student advisement-. and the inter-
pretation of ppogram policies on a continuous basis. Informatfondb.
to base these decisions on wastpnerally. anecdotal, based on the
experiences of former candidates. A clear information base wasr
4s.
a
a
S.
needed to 1:6)vide cohesive' policy advisement rather than
1891
idiosyncratic interpretations. ' .0. .. ..
.e
1
N A third nee& wis for the integration of rese464hbfindings4 . .
into the lont-term planning and managemeht o theprogram. Abl .P x. fl) .
. 0
a rapidly expanding experimental program long term.p/anning goals
. oftewremain in the background as critical short-kte need are 1.
.
4 ! 'IOW: .aencountered. Now that the.progradhad reached a point where. it`'
. t
natural expansion and development were beginning Alrow, it wag-r*
/
.
. . 4 4, A. r-possible to reflect on what had been achieved
',.
the bet
direction for the future..%.
Finding the Candidates
40
tOttJ44.
k 6 .
The .first task' was to, determine just whop the candidates
were This task was complicated by the enrollment and graduA-
. .0
tion process. Candidates' may enroll in REX'at any time-avthe' -
1
year: Thus there are ntw enrollment figures on a daily,bas4s.
Candidates may grad to from REX at ,several times duringeyear:
.r,In addition, candidates May become "inactive" at several times,
s i" .during the year.. A candidate iscategorized as 1 active,Aften he
i
or she has not paid the annual fee for two conse utive years.lw.
. .
inactlues may be drop-outs, or they may be pans ng for lArsonala , .. 4
A' reasons, -with the intention of returning: As of *April,- 1i82,..
P. .
REX,t ransferred to a monthly billing system, and candidates are. ..
now, classified as inactive after. two months rather than two'years,4-
Finding the actual number of candidOes 4i. the program i -
.
'at any given time is complicated by all'thes Once, ,
Zd. 4
a time is selected,. the groups that fit the criteriallor being) .
..,,
. . .
inactive, active or graduated can6
be identified'atd sampled.. For,.
,# .
research purposes the groups is then frozen during that week;ter
C4

390
even though their actual status may change as on as. the ne'xt'
.., week..
Contacting the selected sample is 'the next shallenge inoPi
and external degree setting. All candtdates to be contacted must 's
be reached by mail. ,Their, addresses are available from a.form
they complete When'they,fic.st enroll: These addresses, however,
may have dhahged since the enrollment form was completed. This
'there are some candidates Who cannot lae reached until they ,
.
choose to update their addresses. This is particularly true
of the inactive candidates who were not identified until two
years after they chose not to pay the annual fee.
The 1981 Candidate/Graduate Survey: An Example
' The first large scale study of candidates' characteristics.
illustrates.some of the problems inherent in identifying and
reaching candidates. The status of candidates was 'roien for
May, 1981. From the information available at that. time a sample
of candidates were selected. These candidates were mailed a
four.page survey asking for basic information such asprevious
schooling, occupation, and satisfaction with the program.
ApprOximhtely 6,000 surveys were mailed,out. The response
rates varied tremendously betwAn actives, inactives and graduates.-o
The ndmbei of undeliverable surveys due tb incorrect addresses
was apprAimately 7% for active, candidates, 126 for graduates and
34% for inactives. For example,. .
inactives in the Business Degree
because of an unknow address.3
1
of the surveys returned by
Progrtmi, 810,! were undeliverable
In an experimental progrom it is difficult to determine
whether the surws that are returned are representative of the
41u
a.

391
population becausthe population is often not well-defined.
In an external degree program this becomes even, more difficult
because there are few other sources of background 'information.
For the 1981 Candidate/Graduate Survey certain questions were
repeated from the enrollment form so that the sample could NI ,checked-Vgainst the total population. Variables such as gi-NUFF,-
614xcation*previous to enrollment and'military status were used
as internal checks becuase they tended not to change over time.
In this case, the respondents were similar enough to the known
population to warrant furtheeconsideration of the responses.
Other Soul-6es of Information
Beyond Zile mailed survey, direct contact with candidates is
exceedingly difficylt in an external degree program. Even tele-
phone contact becomes formidable when candidates may reside over-.
_ .seas, an isolated militarybase, or anywhere in the United
/States %However; indirect information can provide some clues as
... ., .
to hQwcandidates progress through the program and how they
perceive the proceSs.
A first source of information is the actual\enro
graduation and attrition figures. Degree`progx'au w' in REX
vary as to their requirements, and the rate'of pro ess through.
y the degree varies. However, if an unusually high number of...e
candidate6 suddenly enter or leave the program it may. be an
indication that candidate perceptions of.tlie program have changed.
For example, when the Bachelor of Science in Nursing Degree.
became accre *tated by the National League of gursing, a groups.
of candidates who were inactive re-enrolled in that program
to finish their. degrees.

392)
Another sourse of information is available from piogram
advisors. .The advisement staff ha,s contact with candidates
through the mail and overthe telephone, and they form strong
and valid impressions of cndidates.needs and opinions.' The,
Registrar's office also has direct. contact with candidates when
they verify transcripts, as do volunteer advisors in the field.
Though these views of the candidates may be somewhat fragmented,N.
when looked at as a whole they reveal:a great deal about
candidate characteristics.
Other secondary sources are available from examining candi-
date test performance, performance in other educational settings,
as evidenced from transcripts and military records. Eacht can*
provide information about a specific problem or can be integrated
to provide a more compiete picture of the program.
Use Of Available Information Establishing Creditability
One of the pitfalls of establishing a new research office is
that once the initial tasks alre completed the tendency is to
continue the pattern of.addressing short-term needs for infor-.
mation while ignoring long-team planning. The need for all.
kinds.of information is great, and the researcher may become
focused on providing a great deal of information for individuals
without establishing a base of information needed for the
iinstitution as a whole. DI an experimental setting such 'as REX
this temptation is even greater bed'Lse there are no pfe-
estblished data collection requirements. Thus the researcher
can easily become useful only in dealing with short-term
"rises or problems.
The' next task, then, isto establish the creditability of

6
. 393
the Aloffice as a tool for long-term planning. In the case of REX,
I'this was initially a process fo establishing priorities on the
needs foninformation. The first step was to survey the staff and
the faculty about their goals'for the program. To accomplish
this a modified version of the Tristitutional Goals Inventory 4
1was used. Results for both professional and clerical staff were
compared to responses from the faculty. This initial survey
indicated that 'the gefieral goals establighed for the program.
were still considered important by both faculty and staff.5
From these goals it was possible to begin to prioritize
actual research tasksin a series of planning meetings held .
with unit coordinatos. By specifying research tasks it is pos-
sible to provide inforfiation that can then-be used to lay the
groundwork for furthen planning and research. The research.
information.4
. .
office must strongly affirm itsrole in producing
to meet these needs not only: for more information
better management of that information.
Conclusion1
but for
I-
Research in an external degree setting is a challenge when
the usual subjeCts of study are far removed from the institution
Some non-traditional methods' of data cApture\have been examined.
for use with external-degree staff and candidates. The role
of research within an experimental sysem:ha's also been
examined and reaffirmed. Emphasis must be plaCed on,the need
to provide coherent, cohesive information for the institution
as a whole.
t
"4X13
A

t.
I
FOOTNOTES
394
1. Regents External Degree Program. Self-Study Report of-theRegents External Degree Program of the University of theStd.-to of New York. Submitted Or Reaccreditation to theMiddleTimtes Association of qolleges and Schools. February,1982.
2. Houle,.Cyril O. The External Degree. San FrancidcolJossey-Bass, Inc.,1973.
1. Taylor,. E. The 1981 Candidate /Graduate Suive : InitialFindings. Document prepared for the Regents External Degree .
Program, March, 1982.
4. Educational Testing Service. Institutional Goals Inventory.Princeton, Nov Jersey: College and University Program, 19/2.
5. Taylor,E. The REX Goals Survey: Documentation. Documentprepared for the Regents External Degree Program, March,-1982.
C
I
44.
1
*X'
.004.

4...a
1. 4
4
41 1
S.
NorthZest i tiAssocaon forInstituttonalResearch ,
395,
iiiiceme to NEA1O's Winch Annual Coofersock
Jiving arrived and surveyed the New guglaud.tencer sod
.enviroos. you can seelmhy,we have bee* so enthusiastic
about the roof locution and facilities. We are
similarly cothuaisatic about the range of
wochakipei panels.' aceorters, and poper poesentations
cost have bee. scheduled in thia program. Ail that is
left to be sided isepur particliscioos aak'queattoos
sharpes your techi/sal skills. compare youeexpectea4s,
test youe ides!. Do whatever you need.to do to omho
this conference a success 1n furtherang'your profession./
development.
0.
DOING INSTITUTIONAL RESEARCH:
A FOCUS ON 'PROFESSIONAL DEVELOPMENT
NINTH ANNUAL CONFERENCE.00TOBER 17 - 19, 1982
-1..,THE NEW aNGLArtic CENTERDURHAM, NEW HAMPSHIRE
lest %datums for a productive contoconce.
PROGRAHSUNDIME 17 OCTOBER 1902
11:00 A.M. - 12:30 P.M.
PRESIDENPS PRECONMENCE BRUNCH,(MAIN DINING ROOM)
NOON 6:30 P.M.
REGISTRATION
1:30 - 4:30 P.M.
CONFERENCE WORKSICNIS:(xesistrsti requited)
WORKSHOP I - I Al. SlitFOR Siio I S NSTI UTIONAI. RES
(is30 4:23 P.N.. Windsor Rees sodMONDAY, 5:30 - VPDO A.M. , Itgefee$0 Dee.)
IES WORKSHOPRCH
cRobert Geese -Ambeeet Cellogo
Willis. imutoistAU Noss Ialleost
Commenoes fleecy Neville'schist*, lostituto of technology
). .
413
A
4.

4
aki
I
uoRARI91LI. MI t HODS OE EVALUATIONRESEARCH
(1 10 - 3 10 P . Charles Room)
Peter RoastU Kass Amherst
Convener Robert LayBooton Collette
V.ORKSIIOP Ill - COMPUTER PLANNING MODELS(1130 - IS P N., Berkshire Auditorium)
Dantel Updegrove' EDUCOM
J Lloyd Shiiteh Tate
Pout Wing-MY State Deportment of
Convener
M
T I tttPcf1(Windaar Room)
Moderator
iii,.../1CFN I4M11
-.s
Sarah E. JackRenseelaer Polyteekstiellaititute
4a
Education
GATHERING QUANTITATIVE At&MUTAT IVF STUDENT .OUTCOMESINIORMATION VIA COMPLEMENTARYLONGITUDINAL STUDENT SURVEYS
(4 /0 - L SS P.N.)
Ann Ries and Darryl ButtockMercy Collet! '
Sidney MeekSyracuse Unpocreity
DOING LONGITUDINAL STUDIES(5:00 - S2$ P N )
Nancy Mewl Ileaockeeter tostetuse of Technology
Kathy RulaktUniversity tif Lowell
IMPROVING THE QUALITY OF DATAOBTAINED THROUGH SURVEY RESFARCH
(5.30 -PSS P.M.)
Jew Ocooset and Gretchen Do.rioCommunity College of PRIIR4t11,010
a
a
396
TRACK II PROFESSIONAL DEVELOPMENTSEMINAR
MARKETING STRATEGIES FOR 1NSTITU 'TIONAL RESEARCN
(4:30 - 6:00 P.N., Ileckshice Aoditocium)
Neliess 0. DestooDefense bete}ligeoce College
Runyon A.Deset1theiveleity of Wseylsod
' TRACK III - PROFESSIONAL DEVELOPMENTSEMINAR a Of
MANAGING AN ONGOING COMPREHENSIVEINSTITUTIONAL RESEARCH EFFORT:CONCEPT AND APPLICATION
(4:30 - 5:30 P.M., Charles Roos)Karen N. Desusoo and Jobe P. IlsedryleSUM -'Rev Pelts
6:30.- T:30 P.M.
SOCIAL HOUR(Csik au. Iteception Aces)
T30 - 8:4S P.M.
DINNER(Ticket require*, Main Dialog Roos)
9:00 30.00 P.M.
CONFERENCE ADDRESS(Main Dining Soo.)
'STRATEGIES OR CAMPUS COMPUTING'
Job* W. NcCrediaSINKTNI ' t
30;00 33:00 I.M. .(Reoeptie0 Aces)
-RECEPTION - Let% GET ACQUAINTED
Everyone is welecoee. ileweemeecs to STAIR us Weltedto meat coattail*, weber* and afloat, of OleAssocistioa, Seated ,by'SRAIR StasciesCosh Sot.
a
MI

MONDAY' 18 OCTOBER 1982
PLEASE NOTE: &veal/estConfereace fee. You mayor in Dorhaa proper.
e:30 - 10:00 A.M.
REGISTRATION(Lobby)
e:36 - 10:25 A.21.
\\.!as sot iscl;mled in thechoose to est at the Ceater
TRACKOW se Roos)
CRITICAL STRATEGIES WORKSHOP(wonxsuot. I CONTINUED FROM SUNDAY)
(8:30 - 9:5S CM.)
TRACK ii PAPER PRESENTATIONS(liaeeor Lan)
Neeereter: Jeea SternSlave College
DEVELOPING AN IENROLL14ENT PROJECTIONSYSTEM
(830 - 8155 AM.)
Needy DrlaplrJo *wee State College
/ENROLLMENT PROJECTION MODELS:SEEKING EFFECTIVE PREDICTOR 'VARIABLES
(9:00 9:25 A.N.)
Ronald F. Perry sad Lambert* F. NeaceIveeNortheasters Usiveraity.
STUDENT COLLEGE CHOICE AND DECISION*MAKING
(9 :30 9:55 A.N.)
ItIrber4 PastorNorthers Seaga Commodity Cones&
MODELING COLLEGESTU/DENT ADJUSTMENTAND RETSNTION FOR THE INDIVIDUALINSTITUTION
00:00 t0:25 A.B.)
Names D. Aube*U Mese Amherst
1
4397
TRACK m PAPER PRESENTATIONS(Charles Room)
Moderator: Judith D. lisrlasiYale University
A CASE STUDY OF THE PLANNING PROCESS(8:30 5:55 A.A.)
JillYft 3. NsporeMee Bolles
SIZE OF THE ADMINISTRATIVE BUDGtTIN COMPARISON TO THE SIZE Or THEINSTITUTION
(9:00 - 9:25 A.N.)
Jolla A. Bum, Jr.tufts University
CARVING UP PARADISE: POLITICS, DATA,AND THE ALLOCATION OF SPACE .
(9:30 -1:55 AM.)
atcbeed PetteasudeSUM - Ringhseton
COMPARATIVE FISCAL ASAYSIS(10:00 10:25 AM.) I
David L. Am8044. Ness 4Rherat
TRACK IV PAPER PRESENTATIONS(Berkshire Auditoiimm)
Moderathei S. Wiliam ColesSUIT BaitsIo
.,tS
1/4
FROM watuancATtote TO INSTITUTIONAL,RESEARCH: THE VALUE OFPROGNOSTICATION IN HARD TOES
(8:20 ltp...A.11.)
AstiTya* A. UrsaOniverettp of Maryland
Soso A. IteeatagIMEeNee EetaIlLsesee local
ACCESS: THE SYSTEM THAT "in HAD'A CHANCE TO FAIL
(9:00 9:25 A.M.)
8t4vea R. Prete': sad Lolls M. Spiro
SUM trod:pert

r
BOUNDARY SPANNING:. A CONCERTUALFRAMEWORK FOR EXAMINING THEORGANIZATIONAL ROLE or OFFICES OFINSTITUTIONAL RESEARCH
(9:30 - 9:55*.M..)
Nicbsel F. Niitdausli5101Y - Utica*
THE ROLE OF INSTITUTIONAL RESEARCH -INITIATIVE OR RESPONSIVE?
(10:00 --10:25 CM.),e0
Loran GouldMorceetar SW* Cones*
10:30 - 10:4S COFFEE BREAKalatritilos Area)
10:45 - 12:00
TRACK 1 - PANEL DISCUSSION(Windsor Dom)
WHAT HAPEENS 'TWIXT THE CUP AND THELIP: DATA TO INFORMATIOti TO ACTION
Jobs A. Duro . David BradleyPearl Coordimoor DestoallaiversltyTutu Vaiversity
1114wsrd Delsaey 4111.. PeasteriesclierResole Callas* U 11466 Seeetft
Jaen* Nosoclee Portal' SeasesCole
U Nose Dostea *alerts Daivessity
TRACK II PANEL DISCUSSION(Charlaa /idea)
A COMPREHENSIVE FACULTY EVALUATIONPLAN
lister Aaa C. Wise*. Basin J. 31104sleiski,Jibs S. ftssessitt sod Robert L. CaiplvollWet.= Rev 20.1med Colless t
a
P
e
I
398
'TRACK III - SYMPOSIUM(Jerksliire Auditorium)
INSTITUTIONAL MISSION AND RELATED
MEASURES
PAW liFiasMY State tkivraiioa Department
Cornrow:: Althea MackColossi*
NOON - I:45 P.M.
LUNCH 41r
required. Msie Disisi Room). -
1:45 - 3:10 P.M. - PAPER PRESENTATIONS
TRACK I(Windsor Pow)
Moderator: Larry &OleoCosseetim. on FlasaMas Disbar Iducatios
141111SURING INSTITUTIONAL REPUTATION. -ASSESSING ITS CHANGE OVER TOM ANDDETERMINING ITS IMPACT ON THE YIELDOF ACCEPTED_ APPLICANTS
(1:45 - 2x10 P.M.)
Jots P. Mobadryl
SOW Mew Pelts"
USING MULTIDIMENSIONAL SCALING TO
POSITION THE INSTITUTION(2:15 2:40 P.M.)
David W. BradleySissies Naive:81g
NEW SOFTWARE FOR MARKET SEGIIENTATIQNANALYSIS: elt10
(2:45 3:1 Pato)
Robert LAM&mita* Callas* ,
J

399
r f
..714A00'
(charles Room)
Nor
Moderator: Jeaaafar PreaI4a Comecticut board of Usher Education
COMPUTERIZED `MODEL OF PROMOTION ANDTENURE
(tais - 2:10 P.N.)
Wei:whip Put ler and Susan CoodnioUotnesity of Lentil
A MODEL. FOR ESTABLISHING AND_PROJECTING ATTRITION AND HIRING RATESAMONG THE NONINSTRUCTIONAL STAFF OF ,AN ACADEMIC jilIST/TUTION
(2:IS - 2:400
FM.),
Heads Nabeesbtest Me4isac sal perbaea.Neyer. 4101Y buffalo
THE ROLE OF INSTITUTIONAL RESEARCHERSIN LABOR CONTRACT ADMINISTRATION
(2:43 - 3:10 P.N.)
',Peter Faroe*,- Boston Upfveratty
111A()K Ill ,
(berkahtre Auditorium)
' Moderatos: Bereodetts SkobjabRocbtater lestituta of Teebeelocr
SEXUAL INEQUITY IN CAREER CHOICE:HOW CAN COLLEGES HOW
(1:45 1:10 P.N.)
.40. 11. liorlock- Plattsburgh
A COMPARISON OF MINORITY AND NONrMINORITY FACULTY PERCEPTIONS OF
- CAREER OPPORTUNITIES(2:15 2'140 P.M.)
ItomMotb W. Sorsa sad Q. Ringo', linter'Pees State thetviraity
IMPROVING FACULTY USEOUTCOMES INFORMATION
(2t4S 3:10 P.M.)
MeekSyr see University
'
OF STUDENT
P
TRACK IV
t.
(
(Xearaarge boos)
Moderatos: Joe CampbellRutgers Vaiveraity
PAPER PRESENTATION:PLANNING AND COMPUTING IN THEOLOGICALSEMINARIES
(I:ni 2:10 p.m.)
Alensatler M. Jame101/C0/1
Rd PROFESSIONAL DEVELOPMENT SEMINAR:.
"4 /0
ON LINE INTERINSTITUTIONAL DATASHARING FOR POLICY ANALYSIS
(2:15 3:10 P.N.)
Ilicbsol P. liclieisb4PAUCON
TRACK I PANEL DISCUSSION(Windsor Room)
AUTOMATION AND TECHNOLOGYPAC KANAGEKENT1
(3:40 .4146 P.M.)
Ani tirganathenCatmeRie Mellen University.
Denial °Seer**IBUCON
TRACK 11 - PROFESSIONAL DEVELOPMENTSEMINAR
(Coyle* tens)
SPSS/SCSS: A WORKSHOP FOR BEGINNERS(346 4145
beeerly Jeyee eed Allis betelSUffelb IMiwaity
Freak VillieeeThe College booed
S.
a
4,,

TRACK III PROFESSIONAL DEVELOPMENTSEMINAR
(Serishi re Auditorium)
COLLEGE AND UNIVERSITY STRATEGIC 'PLANNING A METHODOLOGICAL APPROACH
(3:20 - 4:45 PR.)
James R. So/lowoodSostoa Collage
5:00 - 5:45 P.M.
NEAIR ANNUAL BUSINESS NEETlyai
PRESIDING:
Nolen *oat. President1981-42
ALL MEMBERS ARE URGED TO ATTEND
llection of *Me4, p . future cosfereece site*glottises. sad °thee Association eeriness* are aeon.the item that viT1 be covered. Participate is thefuture ef nom Association.
5:0 - ?SOCIAL EVENING, - ISO SCHEDULED ACTIVITIES
Avail y if of local aaaaaaaaaaa and atteoctioos.You oay dim at the Veit SAotood Unto., but you moatoak* your oleo roscroatiora.
TUESDAY.,19 OCTOBER 1982
7:30 - 8:45 A.M.Snakiest meeting of old eed saw stfteles committeewoes rs Wising Clone),
!WIC 1 - PAPER PRESENTATIONS(Modes, loon)
Moderators Richard PestoeSem Cenewity College
MEASURING THE IMPACT OF PROPOSEDFINANCIAL AID CUTS: THE PERFECT STUDYIS ALWAYS TOO LATE
(9:00 - 9:25 A.M.)
Gail Noose, Lprry W. Netager, Judith 11. Part/eadIthaca College
41117
4.N
a
4.
1.
./
1400
THE ECONOMIC CONTRIBUTION 0CONSORTIUM 'OF UNIVERSITIES TnirWASHINGTON METROPOLITAN AREA
(9:30 - 9:55
Edward D. JordanCatholic University
ESTIWIAT1h1O NET con OF COLLEGEATTENDANCE IN NEW YORK 511111C
(10:00 l0 25 A.M.)
Donald Nutter, Soma Silveroon, and Paul Wis.New York State Education Department
TRACK II - PAPER PRESENTATIONS
I
(Charles Roos) A
Moderato,: gothic,* KopfS4M1 albsay
PUBLICATION 113140 INDEX (PUI): AQUANTITATIVE" ME TROD OF EVALUATING.THE PUBLICATIONS OF SCIENCE FACULTY
(9:00 - 9:25 AM.)
Oloeis J. DyesFaintish Diertiesos adversity
STRATEGIC PLANNING AND RETRENCHMENT:WORKING WITH DEP.,,,ARTMENT CHAIRS
(9:30 - 9:55 edf:T
Aatoiaotte ladsrois&Alit Joseph College
BREAKING THE "VICIOUS CIRCLE" OFDECLINE AFTER A FACULTY RETRENCI1MENTtA CYBERNETIC MODEL
(t0;00 - 10:25 cll.)
:aids IL SpiroSONY Brod:poet
TRACKMI PAPER PRESENTATION8(Serkohirs Auditorium)
ModoradOrs David lamp! I- ilorkk000toto University
DEGREE PATTERNS AND ENROLLMENT TRENDS(9:00 - 9125
1 4
Would G. MasterAllow, Now York
I.
.r

.
401
.
LEADERSHIP' IN PRIVATE LIBERAL ARTSCOLLEGES
(9:30 9:33 A.B.)
Gloria J. DyerFeirleigb Diekinson University
STUDENT CHOICES: WHY ARE ELECTIVECOURSES ELECTED?
(10:00 - 10:23 A.M.) .
Robert F. GroseAnherst College
TRACK IV - PROFESSIONAL DEVELOPMENTSEMINAR
MICROCOMPUTERS IN INSTITUTIONAL.RESEARCH(9:00 - 1020 A./I.. Xesraerie Roos)
?Weald L. OrtuttEDUCCO
10:30 - NOON
TRACK I - PAPER PRESENTATIONS(Vindeor loco)
Moderator: Ed DelaneyKassa College
t.AN ACADEMIC MANAGEMENT DATA BASE;INSTRUCTIONAL UNIT .PROFILES £T SUNY-BUFFALO
(10:30 - NO:53 A.M.)
Levreace KelskuSONY - (utfele
INSTITUTIONAL RESEARCH IN AN EXPERI-MENTAL SETTING: EXPERIENCES WITH itIENEW YORK STATE REGENTS EXTERNALDEGREE PROGRAM?
(23:00 )1s23 A.N.)
al ifebetli ?silo rNY Revels Isternef Dege4e Provo*
THE DESIGtd AND IMPLEMENTATION OE ANEVENING STUDENT SURVEY: METHODOLOGICAL ISSUES AND PRACTICAL CONSID-ERATIONS
(11:30 - 11:33 AM.)
Linde LyonsJersey City Stet. College
.
p
TRACK III- PANEL DISCUSSION(Charles Room)
kW TRAINING AND USE OF PEERCONSULTANTS IN DEPARTMENTAL SEIX-EVALUATIONS
(10.30 - Noon)
furors, K. Mob, Tom Verna:tars. Anne Chr I lit Ian.John Q. Adorns. Elliot sKitay. and terry I' O'Dwyer
Nassau Coemunity College
O
V
TRACK ill PANEL DISCUSSION(Berkshire Auditorium)
e- PROFESSIONAL PERSPECTIVE ON INSTI-TUTIONAL RESEARCH
(10:30 - Noon)
4 Hugh N. DempseyPsoel CoordinatorSaint Vincent College
TRI IV - PROFESSIONAL DEVEOPMENTSEMI AR
(Kearsaege Room)
DEVELOPING DATA INTEGRITY AND USERCONFIDENCE IN CENTRALIZED MANAGEMENT.INFORMATIQN SYSTEMS 4
John F, Hendry('SUNK - lieu Pelts
Utilise! MadinahSCNY - Utica
g
PLEASE REMEMBER TO COMPLETE ANEVALUATION FORM BEItORE LEAVINGTHE CONFERENCE
42j
V
..
0
4V

A
t981.82 REAM STEERING COMMITTEE
PRESIDENT;Helen S. Vyant
SEW - Buffalo
Slat/TARP AND PUBLICATIONS CHAIR;
Diane M. SevenSEW - Plottaboesh
tiltASEREE:.itichard C. NeckCoigne ValversIty
NEKSERS-AT lAAGE:
Inter T. Foregologos University
Gel feigeopousVonnoutb Cello,*
Robert LayBoston College
Wendell G. tomsSUET - Albany
teary SevillaRochester Inttituteof Technology
J. Lloyd !WM*-Vile University
Paul ViolNew York StetsEducation DevaityPt
PAST PRESIDENT AND MONIVAING CONN1TtEt MAIM
Potriet Iereatini- Albany
SITt SELECTION EXAM
Marilyon.A. testi
University of EArYlesd
loolur.sOoPScollenTIMS;
J. Lloyd'Suttls. Chair Paul WarTele University ET StatcfEdusatios
oessetaeSt
NOVOGNAPE
SilOry RdeskSyracuse University
co pp LOCAL 4UNPANGRION3 GNAW
Jibs WooSvivOcartyrof New ilompshict
CONWESZOCE PROGRAM
Robert LayBested Coilts
#
.111. 402
NOTES NOTES NOTES ROTES NOTES NOTES NOTES
.
p
hhwth
pielsJP: 14etot
The logo cad 'symbol of MUIR wore conceived cad
executed by Sharma Iteyeack, 11,11. in CoasenicatiotRepine, Rocheater Institute of Techsology. Ifiteyabollase the offilistion of IMAIR vitih the laterestionelAoaociatioa for Inotitatioaal Research, the aetworking
Abed cooperation welch the Association supports, sad
the flow of iftforsation is and oat of an IR office.The aortheoat-gulbdreat is highlighted. to' esophagi:a
the close relotteeshipe aims IR prefesaistalo is thatarea, and their Tarsal aosocittlea.