0.2cm Evidence From an Immigrant Welfare Scheme in ...
32
NBER WORKING PAPER SERIES THE WELFARE MAGNET HYPOTHESIS: EVIDENCE FROM AN IMMIGRANT WELFARE SCHEME IN DENMARK Ole Agersnap Amalie Sofie Jensen Henrik Kleven Working Paper 26454 http://www.nber.org/papers/w26454 NATIONAL BUREAU OF ECONOMIC RESEARCH 1050 Massachusetts Avenue Cambridge, MA 02138 November 2019, Revised March 2020 We thank Amy Finkelstein, Mette Foged, Bo Honoré, Ilyana Kuziemko, Helena Skyt Nielsen, Torben Tranæs, Owen Zidar, and three anonymous referees for comments. Financial support from the Economic Policy Research Network (EPRN) is gratefully acknowledged. The views expressed herein are those of the authors and do not necessarily reflect the views of the National Bureau of Economic Research. NBER working papers are circulated for discussion and comment purposes. They have not been peer-reviewed or been subject to the review by the NBER Board of Directors that accompanies official NBER publications. © 2019 by Ole Agersnap, Amalie Sofie Jensen, and Henrik Kleven. All rights reserved. Short sections of text, not to exceed two paragraphs, may be quoted without explicit permission provided that full credit, including © notice, is given to the source.
-
Upload
khangminh22 -
Category
Documents
-
view
2 -
download
0
Transcript of 0.2cm Evidence From an Immigrant Welfare Scheme in ...

NBER WORKING PAPER SERIES
THE WELFARE MAGNET HYPOTHESIS:EVIDENCE FROM AN IMMIGRANT WELFARE SCHEME IN DENMARK
Ole AgersnapAmalie Sofie Jensen
Henrik Kleven
Working Paper 26454http://www.nber.org/papers/w26454
NATIONAL BUREAU OF ECONOMIC RESEARCH1050 Massachusetts Avenue
Cambridge, MA 02138November 2019, Revised March 2020
We thank Amy Finkelstein, Mette Foged, Bo Honoré, Ilyana Kuziemko, Helena Skyt Nielsen, Torben Tranæs, Owen Zidar, and three anonymous referees for comments. Financial support from the Economic Policy Research Network (EPRN) is gratefully acknowledged. The views expressed herein are those of the authors and do not necessarily reflect the views of the National Bureau of Economic Research.
NBER working papers are circulated for discussion and comment purposes. They have not been peer-reviewed or been subject to the review by the NBER Board of Directors that accompanies official NBER publications.
© 2019 by Ole Agersnap, Amalie Sofie Jensen, and Henrik Kleven. All rights reserved. Short sections of text, not to exceed two paragraphs, may be quoted without explicit permission provided that full credit, including © notice, is given to the source.

The Welfare Magnet Hypothesis: Evidence From an Immigrant Welfare Scheme in Denmark Ole Agersnap, Amalie Sofie Jensen, and Henrik KlevenNBER Working Paper No. 26454November 2019, Revised March 2020JEL No. H20,H31,J61
ABSTRACT
We study the effects of welfare generosity on international migration using reforms of immigrant welfare benefits in Denmark. The first reform, implemented in 2002, lowered benefits for non-EU immigrants by about 50%, with no changes for natives or EU immigrants. The policy was later repealed and re-introduced. Based on a quasi-experimental research design, we find sizeable effects: the benefit reduction reduced the net flow of immigrants by about 5,000 people per year, and the subsequent repeal of the policy reversed the effect almost exactly. The implied elasticity of migration with respect to benefits equals 1.3. This represents some of the first causal evidence on the welfare magnet hypothesis.
Ole AgersnapDepartment of Economics Princeton University Princeton, NJ [email protected]
Amalie Sofie JensenDepartment of EconomicsPrinceton UniversityPrinceton, NJ [email protected]
Henrik KlevenDepartment of EconomicsPrinceton University238 Julis Romo Rabinowitz BuildingPrinceton, NJ 08544and CEPRand also [email protected]

1 Introduction
Do generous welfare benefits act as magnets for low-skilled immigrants? This is a classic debate
among economists and policy makers, but there is virtually no evidence on the question. The exist-
ing literature provides correlational evidence consistent with the welfare magnet hypothesis. For
example, Borjas (1999) shows that immigrant welfare recipients in the U.S. tend to be clustered in
high-benefit states, while Boeri (2010) shows that low-skilled immigrants in the EU are more likely
to locate in high-benefit countries. These patterns are suggestive, but it remains an open question
if they reflect a causal relationship or if they are driven by confounding factors correlated with
benefit levels. To obtain casual evidence, we need variation in welfare benefits that is plausibly
orthogonal to other factors driving location choices.
We argue that Denmark provides an ideal setting for studying this question. First, Denmark
has one of the most generous welfare systems in the world — benefit rates are even higher than in
the other Nordic welfare states — making it a potential welfare magnet. Second, motivated by wel-
fare magnet concerns and general anti-immigration sentiments, Denmark has experimented with
immigrant welfare schemes that sharply reduce benefits to certain foreign immigrants. In June
2002, shortly after the formation of a new government supported by a far-right, anti-immigration
party, Denmark introduced a welfare scheme that reduced benefits by up to 50% for immigrants
from outside the EU.1 The welfare scheme was controversial and widely debated. It was repealed
in 2012 following the election of a center-left government, and then reinstituted in 2015 after the
return of a center-right government.
The Danish government has been active in disseminating information about the welfare scheme
to potential immigrants. For example, around the reinstitution of the scheme in 2015, the govern-
ment ran an ad campaign in Lebanese newspapers informing refugees of the reduced benefits.2
These ads, illustrated in Figure A.I, highlight the 50% benefit reduction at the top and suggest that
the scheme was motivated largely by a desire to reduce the inflow of refugees.
To study the impact of the welfare scheme on migration flows, we consider two difference-
in-differences strategies. The first strategy is a within-country approach based on comparing im-
1To be precise, the scheme applied to immigrants from outside the EU and the four member countries of the EuropeanFree Trade Association (EFTA), namely Iceland, Liechtenstein, Norway, and Switzerland.
2Lebanon hosts a number of large refugee camps and provides a common transit for Middle Eastern refugees headedto Europe.
1

migration flows to Denmark from outside the EU (treatments) and from inside the EU (controls)
around the three reforms.3 The findings are striking: The immigration flows of the two groups
evolve in parallel during the twenty years leading up to the 2002 reform, diverge sharply after the
introduction of the immigrant welfare scheme in 2002, converge again following the repeal of the
scheme in 2012, and diverge once more when the scheme is reintroduced in 2015. We find that
the scheme reduced the net flow of immigrants by almost 5,000 people per year, corresponding to
an elasticity of migration flow with respect to benefits equal to 1.3. The second strategy is a cross-
country approach based on comparing non-EU immigration flows in Denmark and a synthetic
control country constructed from the other Nordic countries. Consistent with the within-country
approach, the cross-country approach features large and sharp migration effects around each of
the three reforms.
To further underpin our interpretation of the data, we decompose the immigration effects by
type of residence permit: asylum permits, family permits, and work/study permits. Only those
coming on asylum or through family relations are treated by the welfare cuts. Consistent with this,
we show that the effects are driven entirely by asylum- and family-based immigration; the effect
on those coming for work or study is a precisely estimated zero. This implies that our estimates
are not biased by time-varying unobservables that affect all non-EU immigrants relative to EU
immigrants. Any threat to identification must come from time-varying unobservables that vary
both by region of origin (EU vs non-EU) and by immigrant type within region (asylum/family vs
work/study).
It is worth highlighting two points on interpretation. First, the effects should be interpreted as
capturing location decisions conditional on migration. Since Denmark is just one small country, we
would not expect the decision to emigrate from, say, Afghanistan to be affected by the Danish wel-
fare system. Rather, it is the decision by an Afghan migrant to locate in Denmark instead of, say,
Sweden or Germany that is affected by the Danish welfare system. Second, the presence of size-
able welfare magnet effects may make it tempting for governments to introduce immigrant welfare
schemes like the Danish one, and in fact several countries have introduced or are discussing the
introduction of related policies.4 Specifically, to the extent that the net fiscal impact of low-income
3To avoid confounding effects of the EU enlargements in the post-reform period, coming from “inside the EU” isdefined based on the member countries in the pre-scheme year, 2001.
4In the U.S., the welfare reform act of 1996 (PRWORA) denied non-citizens eligibility for welfare benefits. Specialimmigrant welfare schemes have also been passed in Canada (in 2014), Germany (in 2016), and Austria (in 2019, thoughthe law was ruled unconstitutional and overturned later that same year). Countries where such welfare schemes havebeen proposed, but not yet implemented, include Finland, France, Latvia, Lithuania, The Netherlands, and Switzerland.
2

immigration is negative, it may be individually optimal for countries to lower immigrant welfare
benefits.5 However, such policies impose negative fiscal externalities on other countries and are, in
general, not socially optimal from a global perspective. This tension between local and global wel-
fare when setting benefits for low-income immigrants is analogous to the tension that arises when
setting taxes for high-income immigrants (see Kleven, Landais, Muñoz, and Stantcheva 2019). Our
findings suggest that the issues surrounding tax competition and the risk of a “race to the bottom”
may be equally relevant for welfare policy.
Our paper contributes to an empirical literature estimating welfare magnet effects, for example
Blank (1988), Borjas (1999), Dodson (2001), Gelbach (2004), Kaushal (2005), Fiva (2009), De Giorgi
and Pellizzari (2009), Boeri (2010), and Razin and Wahba (2015). Much of the literature has focused
on migration responses to state-level variation in welfare benefits in the U.S., but the estimates
vary greatly across studies and no consensus has been reached. Our main contribution is to pro-
vide some of the first quasi-experimental evidence on the existence of welfare magnet effects, and
to show that these effects can be sizeable. The welfare scheme that we use for identification has
been studied in two existing papers (Rosholm and Vejlin 2010; Andersen, Dustmann, and Lan-
dersø 2019), but they focus on a different question: the impact of lowering welfare benefits on
immigrant outcomes (such as employment, earnings, crime, and children) conditional on locating
in Denmark. Finally, while we are interested in the effects of welfare benefits on immigration, there
is a recent literature studying what is essentially the reverse of our question: the effect of immigra-
tion on preferences for redistribution and voting outcomes (Alesina, Miano, and Stantcheva 2018;
Alesina, Murard, and Rapoport 2019; Dustmann, Vasiljeva, and Damm 2019). The introduction of
a special immigrant welfare scheme in Denmark provides prima facie evidence that immigration
may shape redistributive preferences and policy. Importantly, our quasi-experimental approach
will not be confounded by such reverse causation channels.
The rest of the paper is organized as follows. Section 2 describes the policy experiment and
data, section 3 presents our results on welfare magnet effects, while section 4 concludes.
5We do not estimate the net fiscal impact of the immigrant welfare reform in this paper. Even if low-income immi-grants collect welfare benefits (and pay little tax) in the first years after arrival, the net fiscal impact may be positive inthe long run (including intergenerational effects).
3

2 Policy Experiment and Data
2.1 Policy Experiment
We use the immigrant welfare scheme in Denmark as a quasi-experiment for studying welfare
magnet effects. The scheme was announced in January 2002, passed in parliament in June 2002,
and took effect from July 2002. Only immigrants coming from outside the EU and the four EFTA
countries (Iceland, Liechtenstein, Norway, and Switzerland) are subject to the scheme. For simplic-
ity, we will refer to treated immigrants as coming from “outside the EU”. Under the scheme rules,
welfare benefits are much lower than the standard, native benefit rate. The largest cut applies to
married couples with children for whom the maximum cash benefit is reduced by 50% due to the
scheme. For other family types, the benefit drop is somewhat lower. In order for immigrants on
scheme benefits to transition to the higher native benefits, they have to stay in Denmark for at least
7 years. The scheme was repealed in January 2012 and reintroduced in September 2015. Figure A.II
in the appendix illustrates the policy experiment, comparing cash benefits for scheme immigrants
to cash benefits for non-scheme immigrants and natives over time. The figure also shows that
benefits in the other Nordic countries have been smooth during the time period studied.
This benefit variation forms the basis of our two difference-in-differences designs: (i) a within-
country design comparing immigration from outside the EU to immigration from inside the EU
into Denmark, and (ii) a cross-country design comparing non-EU immigration in Denmark to non-
EU immigration in the other Nordic countries.6 It is worth noting that cash benefits are higher in
Denmark than in the other Nordic countries even under the scheme rules. This difference is partly
offset by housing benefits, which are higher in the other countries than in Denmark. Still, even
accounting for housing support, welfare benefits for Danish scheme immigrants are similar to the
benefit levels of other Nordic countries and higher than the benefit levels outside the Nordics.
This does not invalidate the experiment by making Denmark a strictly preferred destination. With
idiosyncratic variation in non-welfare preferences for location, there will be immigrants close to the
indifference margin between Denmark and alternative destination countries. It is these marginal
immigrants that may respond to the scheme by changing their destination country.
Aside from immigrant benefit reform, there have been many changes to immigration regulation
during the period we study. As documented in Table A.I, most of these changes have tightened
6To avoid confounding effects of the EU enlargements in the post-reform period, coming from “inside the EU” isdefined based on the member countries in the pre-scheme year, 2001.
4

the rules for non-EU immigrants seeking asylum-based or family-based residence, posing a threat
to our empirical approach. This concern is strongest for the 2002 reform where several regulatory
changes were implemented at the same time. The most important of these changes was arguably
the “24-Year Rule” according to which, in order to obtain marriage-based residency, both spouses
must be at least 24 years of age. To avoid any confounding effects of the 24-Year Rule, our main
specification restricts the sample to immigrants of at least 30 years of age.7 The other regulatory
changes in 2002 cannot be directly controlled for, but they are likely to have had a more limited
impact. Ultimately, the strength of our empirical design relies on the presence of three separate
welfare reforms, where the last two reform episodes are much less affected by regulation. Specifi-
cally, the 2012 repeal of the immigrant welfare scheme (which we find almost exactly reverses the
effect of the 2002 introduction of the scheme) was hardly confounded by regulatory changes.8
2.2 Data
The analysis is based on administrative data from Denmark covering the full population from
1980 to 2017. We combine several registers, linked at the individual level, to get information about
immigrant status, country of origin, type of residence permit, and demographics. We are also able
to link family members, which is important for correctly calculating welfare benefits. For the cross-
country strategy in which we compare Denmark to other Nordic countries, we combine data from
the national statistics bureaus of each country with OECD’s International Migration Database over
the period 1991-2017.
2.3 Migration Patterns
Denmark has seen a strong upward trend in the number of immigrants over the last four decades.
The share of first-generation immigrants in the population has increased from 3% in 1980 to over
10% in 2017.9 As a result, Denmark now has a foreign-born population share almost as high as
the U.S. (13.5%).10 Immigrants from non-EU countries — those targeted by the welfare scheme —
constitute the largest group: they accounted for 67% of all first-generation immigrants in 2001, the
7We do not cut the sample exactly at age 24 due to the possibility of intertemporal substitution around the age cutoff,i.e. spouses below the age of 24 who postpone moving to Denmark until they have turned 24. We will investigate therobustness of our results to different age cutoffs.
8Marriage-based (but not asylum-based) immigration rules were changed in 2011, but the changes were rolled backin 2012, thus being in effect for less than a year. See Table A.I.
9See Figure A.III.10OECD, International Migration Outlook 2019.
5

year before the scheme was introduced.
Figure 1 shows migration flows from outside the EU since 1980, in total and from specific
countries. Panel A shows that — apart from spikes in 1995 and 2015 — the net flow of non-EU
immigration has averaged about 8,000 people per year. A large part of the aggregate flow comes
from a relatively limited set of countries, illustrated in Panel A by the series for the eight main
sending countries. Panel B considers each of these eight countries separately. The most striking
feature of the graph is the presence of sharp spikes in 1995 and 2015, which reflect immigration
from Bosnia-Herzegovina and Syria, respectively. The Bosnia spike in 1995 is driven by the Bosnian
War of 1992-95 combined with a special Danish law that granted Bosnian refugees residence in
Denmark. Since this supply shock occurred well before the first welfare scheme reform, it does
not pose a threat to identification. It does create a large spike in the pre-trend for the treatment
group, however, and to avoid this we drop immigrants from Bosnia-Herzegovina in all years. The
Syria spike around 2015 is driven by the Syrian Civil War. This supply shock does pose a threat
to our strategy, because it coincides with the reintroduction of the welfare scheme in 2015. While
some of this spike may be interpreted as a confounding supply shock that creates excess migration
to Denmark, some of it may also reflect that, conditional on leaving Syria, the choice between
Denmark and alternative countries reflects the Danish welfare system. It is not a priori clear if
any bias from the Syrian refugee crisis will be upward or downward since the excess migration
happens on both sides of the scheme reintroduction. We do two things to address identification
concerns related to the Syrian supply shock: (i) we run the estimations on a sample without Syrian
migrants, and (ii) we carry out a cross-country analysis in which we compare Denmark to other
Nordic countries, which were also affected by the Syrian supply shock but did not implement any
welfare reforms. Our results are robust to both of these checks.
3 Is There a Welfare Magnet Effect?
3.1 Within-Country Strategy
Figure 2 presents our main results graphically. Panel A shows the net immigration flow from
outside the EU between 1980 and 2017, along with a linear trend estimated using pre-scheme data
between 1980 and 2001.11 The time series evidence is striking. Immigration follows a linear trend
11Net immigration flow is measured by the year-to-year changes in the stock of first-generation immigrants residingin Denmark according to the Central Person Register (CPR).
6

in the two decades prior to the welfare scheme, diverges sharply from trend after the introduction
of the scheme in 2002, catches up with the trend following the repeal of the scheme in 2012, and
diverges once more when the scheme is reintroduced in 2015. When the scheme is first introduced,
immigration falls for four years before reaching a steady state relative to the linear trend. When the
scheme is repealed, it takes exactly four years for immigration to catch back up with the trend. The
sharp changes around each of the three reforms and the great degree of symmetry across reforms
provide strongly suggestive evidence of a welfare magnet channel.
Of course, the time series evidence could be biased by non-welfare determinants of migration
that change over time. We therefore exploit that the scheme rules apply only to non-EU immi-
grants, which allows us to compare treated and untreated immigrants in a difference-in-differences
(DiD) framework. The results are presented in Panel B, in which we compare net immigration
flows from outside the EU (treatments) and inside the EU (controls) over time. Because the two
groups trend differently in the raw data, the plotted series have been de-trended by subtracting a
linear trend estimated on pre-scheme data. That is, the non-EU immigration series represent the
residuals between the actual flow and the predicted flow shown in Panel A, and likewise for the
EU immigration series.
The patterns in Panel B are compelling and consistent with the time series evidence in Panel
A. The treatment and control series evolve in parallel for a long period prior to the scheme, di-
verge sharply after the introduction of the scheme, converge when the scheme is repealed, and
diverge once more when it is reintroduced. Again, there is a striking degree of symmetry across
the different reforms: it takes four years for the full effect of the scheme introduction to materi-
alize, and it takes exactly four years for the scheme repeal to reverse that effect. Moreover, when
the scheme is reintroduced in 2015, the impact during the two years for which we have data is
similar to the two-year impacts around the other reforms. The graph suggests that, at full impact,
the welfare scheme reduced non-EU immigration by about 5,000 people per year, or 4.2 percent of
the pre-scheme stock of non-EU immigrants in Denmark.
Although the DiD evidence looks compelling, identification could still be compromised by
the presence of time-varying immigration factors that vary by country of origin (EU vs non-EU).
As discussed above and documented in Table A.I, this concern is particularly relevant for the
2002 scheme introduction as it coincided with other changes to immigration regulation. One of
the main changes — the 24-Year Rule — is not a confounder here, because the figure restricts
attention to immigrants aged 30 and above. But the other changes are not controlled for in the
7

graph. The symmetry of the DiD effects across reforms is particularly informative in this light.
The later scheme reforms did not coincide with such regulatory changes — the 2012 repeal in
particular is hardly confounded by regulation — and still produced similar effects.
To investigate the threat from time-varying unobservables more broadly, we exploit that our
data include information about residence permits. This allows us to check if the changes around
each reform are driven by the types of immigrants who are treated by the welfare scheme. There
are four main types of residence permits: asylum, family, work, and study. Those coming on
asylum and family permits are potentially eligible for welfare benefits and therefore treated by
the scheme, while those coming for work or study are ineligible for welfare benefits and therefore
untreated. Figure 3 shows immigration flows for the different types of residence permits between
1997-2017.12 The figure shows that the effects on non-EU immigration are driven entirely by those
on asylum and family permits; if anything, immigration by those on work and study permits
accelerates following the introduction of the scheme. Furthermore, the figure shows that asylum-
based immigration responds more strongly than family-based immigration. This is natural: most
newly-arrived refugees have very limited job opportunities and therefore no alternative to welfare
benefits, making the scheme treatment particularly severe for them.13
One type of confounding shock remains a concern, however: exogenous supply shocks driven
by war, political unrest, and the like. In practice such shocks affect only asylum-based, non-EU
immigration. If these shocks coincide with the scheme reforms, changes in non-EU immigration
by those coming on asylum (relative to family, work or study permits) may reflect non-welfare
factors in the sending countries. As described previously, the main supply shock during the post-
scheme period is the Syrian refugee crisis around 2014-16. Indeed, Figure 3 shows a spike in
asylum-based permits relative to other permits during these years. While it is not a priori clear
that this variation creates bias — in part because the Syrian refugee spike happens on both sides
of the scheme reintroduction in 2015 — it does represent a cause for concern. In the next section
we investigate this issue by comparing Denmark to similar countries that were also affected by the
Syrian supply shock. In this section, we consider a more basic robustness check: dropping Syrian
immigrants from the sample throughout. We come back to this below.
Another possible concern is that our measure of immigration is based on residency, which lags
12The figure restricts attention to the period 1997-2017, because the residence permit data is available only from 1997onwards.
13When the scheme was introduced in 2002, the employment rate for refugees was about 10% after one year in Den-mark, 19% after two years, and 32% after 3-5 years (Andersen, Dustmann, and Landersø 2019). As a result, welfarebenefits are the primary source of income for almost all refugees in the first years after arrival.
8

behind residence applications. It is the decision to apply for Danish residence that should respond
to benefit reform, and if the timing of applications is significantly different from the timing of
permits, the DiD evidence is less compelling than it seems. We are able to investigate this issue by
using that, for asylum seekers, our data includes information about both applications and permits.
We present evidence on asylum applications in the online appendix, showing that the empirical
patterns for applications and permits are broadly consistent.14 This lends additional support to
our empirical strategy.
To formally estimate the effect of welfare benefits on immigration flows, we collapse the micro
data to the level of welfare benefit groups. These groups are defined as those relevant for benefit
eligibility (see Figure A.II): married and unmarried individuals with different numbers of children
(0, 1, 2+) coming from outside or inside the EU, a total of 12 different benefit groups. We then run
the following DiD regression specification:
Ygt = βBgt + γg + ηt + νgt, (1)
where Ygt is the net immigration flow for group g in year t, scaled by the pre-scheme immigrant
stock for the group, Bgt is the maximum monthly benefit for a given group and year, γg is a group
fixed effect, and ηt is a year fixed effect. To make interpretation easier, we convert the benefit
amounts into US dollars (measured in 100s), so that the DiD coefficient β captures the impact
on immigration from raising monthly benefits by 100 dollars.15 The estimation of β in equation
(1) is based on richer variation than in the graphical analysis, because it exploits that the benefit
changes for non-EU immigrants (relative to EU immigrants) differ across families depending on
marital status and the number of children. We estimate (1) by weighted least squares using the
pre-scheme stock of each group as weights.
As discussed above, immigration flows trend upwards over time, and these non-welfare trends
differ across treatment and control groups. The DiD graphs were therefore adjusted for linear,
group-specific pre-trends. Consistent with this, the regression analysis is also based on de-trended
data. Specifically, the outcome variable Ygt is residualized by a linear, group-specific trend esti-
mated on the pre-scheme data (1980-2001). To obtain consistent standard errors from this two-step
14See Figures A.IV-A.V discussed in Section B of the appendix. We also note that asylum applications are more volatilethan residencies, especially around the Syrian shock, which reflects that a sizeable fraction of applications are rejected.This is an important reason for focusing on residencies granted as the main outcome of interest: We are ultimatelyinterested in the effect of benefits on actual immigration, which is better measured by residencies than by applications.
15We use the DKK-USD exchange rate of December 31, 2018. In the scheme reform years, we use average benefitsover the year based on the month in which the reform was implemented.
9

procedure, we use GMM to jointly estimate the pre-trends and equation (1), and calculate the as-
sociated standard errors.
The results are presented in Table 1. Panel A shows estimates of the effect on net immigration
flow (inflow minus outflow), while Panel B focuses on the inflow alone and breaks the effect down
by type of residence permit. The different columns show different sample restrictions in terms of
age and whether Syrian immigrants are included or not. Our baseline specification in column (1)
considers immigrants above age 30 and includes Syrian immigrants, corresponding to the analysis
in Figure 2. In this specification, we find that the immigration net flow increases by 0.44% of the
stock for each $100 increase in benefits. The immigrant welfare scheme reduced benefits by up to
$800 (for married couples with children), implying a total effect on immigration equal to 3.5% of
the stock.16 In the table, we convert this effect into an elasticity of the immigration net flow with re-
spect to welfare benefits.17 This elasticity is equal to 1.29. Reading across the different columns, we
see that the estimates are very robust to alternative age cutoffs and to dropping Syrian immigrants.
The migration elasticity varies between 1.29 and 1.53 across the different specifications.
Turning to the effects on gross inflow and its composition in Panel B, the following insights
are worth highlighting. First, the total effect on inflow equals 0.4% of the stock per $100 dollar of
benefits in the baseline specification. This represents 91% of the net immigration effect shown in
Panel A, i.e. almost all of the effect is driven by reduced inflow rather than by increased outflow.
Second, the inflow effect is driven entirely by asylum- and family-related migration, with some-
what larger effects on the former. The effect on work- and study-related migration is a precisely
estimated zero across all specifications. As discussed, this is critical for the credibility of our results
since immigrants coming on work and study permits are untreated by welfare reform. Third, the
results are again robust to changing the age cutoff and dropping Syrian immigrants.
To summarize, the within-country DiD analysis reveals large and strongly significant welfare
magnet effects. The effects of the scheme reforms are sharp and driven by changes in the inflow of
immigrants coming on asylum or family permits, precisely those treated by the scheme. The nat-
16This is roughly consistent with the results in Panel B of Figure 2. There we see a drop in immigration of about 5,000people (at full impact), corresponding to 4.2% of the 2001 stock of non-EU immigrants.
17We define the elasticity of immigration net flow with respect to welfare benefits as follows
ε = β̂ ·E [Bg,2001]
E [Yg,2001], (2)
where E [·] denotes weighted averages across treated benefit groups, and the elasticity has been defined relative tothe pre-scheme baseline in 2001. Note that the elasticity with respect to welfare benefits corresponds to an elasticitywith respect to total net income if those treated by the welfare scheme (newly-arrived immigrants on asylum or familypermits) have no other earnings opportunities in Denmark in the beginning.
10

ural interpretation of these effects is that they represent choice of destination country, conditional
on migrating. Because new arrivals in Denmark, particularly refugees, have extremely limited
employment opportunities for a period of time, it is natural that they are responsive to the drastic
welfare cuts implied by the Danish scheme.
3.2 Cross-Country Strategy
As discussed above, a potential identification concern is the presence of push factors such as war,
famine, and economic crises, which increase immigration and could be correlated in time with the
Danish policy experiments. The within-country approach relying on changes in non-EU (relative
to EU) immigration driven by asylum and family permits (relative to work and study permits) is
not immune to this concern, because the confounding push factors apply specifically to non-EU,
asylum-based immigration. The main supply shock during the post-scheme period is the Syrian
Civil War, which caused a massive influx of refugees to Europe between 2014-16, i.e. around the
time of the reintroduction of the Danish welfare scheme. While we have shown that our results
are robust to dropping Syrian immigrants from the sample, other smaller supply shocks may still
create bias. In this section, we consider a more compelling way of assessing the threat from such
supply shocks: a cross-country strategy comparing Denmark to other countries that experienced
the same supply shocks, but did not change welfare benefits.
For this analysis, we draw on additional data from three other Nordic countries: Norway, Swe-
den, and Finland. We focus on the Nordic countries because they are culturally and economically
similar and therefore more likely to be affected by confounding supply shocks in the same way.
We use the synthetic control approach developed by Abadie, Diamond, and Hainmueller (2010)
to construct a “synthetic Denmark,” a weighted average of the other countries. To construct the
weights, we match on annual migration flows from outside the EU during the pre-scheme period,
1991-2001. More precisely, because migration flows differ in absolute levels due to differences in
country size, we match on non-EU migration flows normalized by the pre-scheme stock of non-EU
migrants in each country.
Our results are presented in Figure 4. Panel A of the figure shows raw immigration flows from
outside the EU in each of the four countries.18 We see that the migration flows evolve similarly
18We note two limitations of the cross-country data. First, because we are unable to restrict migration by age for theother Nordic countries, the analysis in this section includes migrants at all ages. As a result, the patterns around the2002 reform may be influenced by the 24-Year Rule. Second, to eliminate the pre-scheme Bosnia shock in a consistentway across countries, we have to exclude migrants from all countries of the former Yugoslavia.
11

in the four countries throughout the pre-scheme period, 1991-2001, lending support to the parallel
trends assumption. Starting in 2002, immediately following the introduction of the Danish welfare
scheme, migration to Denmark begins to decline while the three other countries continue their
upward trend. Migration flows to Denmark settle at a much lower level until the repeal of the
Danish welfare scheme starting in 2012, after which Denmark rapidly catches up with the other
three countries. After the reintroduction of the welfare scheme in 2015, we again see flows to
Denmark declining compared to its Nordic neighbors.
Panel B of the figure presents findings from the synthetic control approach. The immigration
flows in Denmark and the synthetic control country match closely during the pre-scheme years,
and the patterns around the scheme reforms are consistent with what we saw in the within-country
analysis: Relative to the control country, migration to Denmark declines after the initial reform in
2002, catches up after the repeal in 2012, and again drops following the reintroduction in 2015.
This evidence alleviates concerns that the Syrian refugee crisis biases our estimates: the other
Nordic countries are exposed to the same supply shock, but experience a different timing in their
immigration spike. Immigration to Denmark spikes in 2014-15 — before the reintroduction of
lower benefits — while it remains flat in synthetic Denmark during these years and only starts
spiking in 2016. In fact, Panel A shows that the 2016 spike happens in every Nordic country except
Denmark. This is consistent with a model in which refugees choose where to seek asylum based
in part on benefit levels, and where the reduction in Danish welfare benefits causes some Syrian
migrants to forgo Denmark in favor of other destination countries.
The findings in Figure 4, taken at face value, imply that Denmark’s welfare scheme had a con-
siderably larger effect on immigration than estimated from the within-country approach. Note,
however, that since we are unable to restrict the sample by age in the cross-country analysis, the
response also captures any effect of the 24-Year Rule around the initial 2002 reform. Additionally,
if the other Nordic countries serve as substitutes for migrants who would have chosen Denmark
absent the welfare scheme, the synthetic control series will overstate the true counterfactual level
of migration to Denmark. In fact, if migrants’ only alternatives to Denmark were the other Nordic
countries, the effect in Figure 4 would be roughly doubled relative to the true causal effect: Any
migrant who avoids Denmark due to welfare reform would instead appear in the control group
and thus be counted twice. Of course, migrants do have options outside the Nordics, so we would
expect this source of bias to be less dramatic. Nevertheless, while the cross-country analysis pro-
vides clear evidence of a welfare magnet effect, and seems to rule out that our within-country
12

results are driven by confounding supply shocks coinciding with the Danish reforms, we caution
against attaching too much importance to the specific magnitudes found here. Our estimates from
the previous section are better measures of the magnitude of the welfare magnet effect.
4 Conclusion
The possibility of welfare magnet effects has been debated for a long time, but there is virtually no
causal evidence on the question. In this paper, we provide quasi-experimental evidence on such
effects using a Danish welfare scheme that cut benefits by up to 50% for immigrants from outside
the EU. Leveraging three scheme reforms and difference-in-differences designs, we find large and
sharp effects of welfare benefits on immigration. The decision to migrate is influenced by many
non-welfare factors, but our evidence suggests that, conditional on moving, the generosity of the
welfare system matters for the choice of destination country.
Does our evidence imply that the immigrant welfare scheme is an optimal policy? The answer
to this question depends partly on the net fiscal impact of immigration (which we do not estimate)
and partly on whether we take a local or global perspective. If the net fiscal impact of low-income
immigration is negative, local governments have an incentive to deter immigration by cutting
means-tested welfare benefits. Assuming that governments care only about the welfare of native
residents, welfare schemes like the Danish one may be optimal for individual countries. However,
the allocation of immigrants across countries is essentially a zero-sum game, implying that such
schemes are not globally optimal. The migrants who avoid Denmark due to the welfare scheme
end up in other destination countries, imposing fiscal externalities on them. In the extreme, this
may create a race-to-the-bottom in the setting of welfare benefits, similar to the race-to-the-bottom
discussed in the context of tax setting (Kleven, Landais, Muñoz, and Stantcheva 2019). Avoiding
such effects may require international policy coordination. In any case, while the welfare magnet
effects we find may be consistent with the political motivations behind the scheme, they cannot be
taken as evidence that the scheme is socially optimal.
13

References
ABADIE, ALBERTO, ALEXIS DIAMOND, AND JENS HAINMUELLER (2010): “Synthetic Control Meth-
ods for Comparative Case Studies: Estimating the Effect of California’s Tobacco Control Pro-
gram,” Journal of the American Statistical Association, 105(490), 493–505.
ALESINA, ALBERTO, ARMANDO MIANO, AND STEFANIE STANTCHEVA (2018): “Immigration and
Redistribution,” Working Paper 24733, NBER.
ALESINA, ALBERTO, ELIE MURARD, AND HILLEL RAPOPORT (2019): “Immigration and Prefer-
ences for Redistribution in Europe,” Working Paper 25562, NBER.
ANDERSEN, LARS HØJSGAARD, CHRISTIAN DUSTMANN, AND RASMUS LANDERSØ (2019): “Low-
ering Welfare Benefits: Intended and Unintended Consequences for Migrants and their Fami-
lies,” Study Paper 4, The Rockwool Foundation Research Unit.
BLANK, REBECCA M. (1988): “The Effect of Welfare and Wage Levels on the Location Decisions of
Female-Headed Households,” Journal of Urban Economics, 24(2), 186–211.
BOERI, TITO (2010): “Immigration to the Land of Redistribution,” Economica, 77(308), 651–687.
BORJAS, GEORGE J. (1999): “Immigration and Welfare Magnets,” Journal of Labor Economics, 17(4),
607–637.
DE GIORGI, GIACOMO, AND MICHELE PELLIZZARI (2009): “Welfare Migration in Europe,” Labour
Economics, 16(4), 353–363.
DODSON, III, MARVIN E. (2001): “Welfare Generosity and Location Choices among New United
States Immigrants,” International Review of Law and Economics, 21(1), 47–67.
DUSTMANN, CHRISTIAN, KRISTINE VASILJEVA, AND ANNA PIIL DAMM (2019): “Refugee Migra-
tion and Electoral Outcomes,” The Review of Economic Studies, 86(5), 2035–2091.
FIVA, JON H. (2009): “Does Welfare Policy Affect Residential Choices? An Empirical Investigation
Accounting for Policy Endogeneity,” Journal of Public Economics, 93, 529–540.
GELBACH, JONAH B. (2004): “Migration, the Life Cycle, and State Benefits: How Low Is the Bot-
tom?,” Journal of Political Economy, 112(5), 1091–1130.
14

KAUSHAL, NEERAJ (2005): “New Immigrants’ Location Choices: Magnets without Welfare,” Jour-
nal of Labor Economics, 23(1), 59–80.
KLEVEN, HENRIK, CAMILLE LANDAIS, MATHILDE MUÑOZ, AND STEFANIE STANTCHEVA (2019):
“Taxation and Migration: Evidence and Policy Implications,” Journal of Economic Perspectives,
Forthcoming.
RAZIN, ASSAF, AND JACKLINE WAHBA (2015): “Welfare Magnet Hypothesis, Fiscal Burden, and
Immigration Skill Selectivity,” The Scandinavian Journal of Economics, 117(2), 369–402.
ROSHOLM, MICHAEL, AND RUNE VEJLIN (2010): “Reducing Income Transfers to Refugee Immi-
grants: Does Start-Help Help you Start?,” Labour Economics, 17(1), 258–275.
15

Figure 1: Migration Flows 1980-2017
A: Immigration from Outside EU
05
1015
2025
30Im
mig
ratio
n N
et F
low
(100
0s)
80 81 82 83 84 85 86 87 88 89 90 91 92 93 94 95 96 97 98 99 00 01 02 03 04 05 06 07 08 09 10 11 12 13 14 15 16 17Year
Outside EU Eight Main Sending Countries
B: Immigration from Main Sending Countries
05
1015
Imm
igra
tion
Net
Flo
w (1
000s
)
80 81 82 83 84 85 86 87 88 89 90 91 92 93 94 95 96 97 98 99 00 01 02 03 04 05 06 07 08 09 10 11 12 13 14 15 16 17Year
Afghanistan Bosnia Iran Iraq
Lebanon Somalia Syria Turkey
Notes: Panel A shows the net flow of immigrants in Denmark from all countries outside the EU/EFTA as well asfrom the eight main sending countries outside the EU/EFTA. The main sending countries are defined as those with thehighest average annual net flow of immigrants over the years 1980-2017. Panel B shows the net flow of immigrants fromeach of the eight main sending countries separately. The annual net flow of immigrants is measured as the year-to-yearchange in the stock of immigrants.
16

Figure 2: Migration Responses to the Immigrant Welfare Scheme
A: Immigration from Outside EU
Sche
me
Intro
duct
ion
Sche
me
Rep
eal
Sche
me
Rei
ntro
duct
ion
-50
510
1520
25Im
mig
ratio
n N
et F
low
(100
0s)
80 81 82 83 84 85 86 87 88 89 90 91 92 93 94 95 96 97 98 99 00 01 02 03 04 05 06 07 08 09 10 11 12 13 14 15 16 17
Year
Outside EU Linear Pre-Trend
B: Immigration from Outside EU vs Inside EU (De-trended)
Sche
me
Intro
duct
ion
Sche
me
Rep
eal
Sche
me
Rei
ntro
duct
ion
-15
-10
-50
510
15Im
mig
ratio
n N
et F
low
(100
0s)
80 81 82 83 84 85 86 87 88 89 90 91 92 93 94 95 96 97 98 99 00 01 02 03 04 05 06 07 08 09 10 11 12 13 14 15 16 17
Year
Outside EU Inside EU
Notes: Panel A shows the net flow of immigrants in Denmark from outside the EU/EFTA over the period 1980-2017,and a linear trend estimated on the pre-scheme data period 1980-2001. Panel B compares the net flow of immigrantsfrom outside EU/EFTA (treatment group) to the net flow of immigrants from inside EU/EFTA (control group). Eachseries has been de-trended using a linear, group-specific trend estimated on pre-scheme data. We use EU membershipin the pre-scheme year (2001) to define the control group. The annual net flow of immigrants is measured as the year-to-year change in the stock of immigrants. The sample is restricted to immigrants who are at least 30 years of age, andimmigrants from Bosnia are dropped throughout.
17

Figure 3: Immigration Inflows by Type of Residence Permit
Sche
me
Intro
duct
ion
Sche
me
Rep
eal
Sche
me
Rei
ntro
duct
ion
-20
24
68
10Im
mig
ratio
n Fl
ow (1
000s
)
97 98 99 00 01 02 03 04 05 06 07 08 09 10 11 12 13 14 15 16 17Year
Asylum Family, Normalized Work & Study, Normalized
Notes: The graph shows the inflow of immigrants in Denmark from outside the EU/EFTA by type of residence permit(asylum, family, and work/study) over the period 1997-2017. Each series has been de-trended using a linear, group-specific trend estimated on pre-scheme data (1997-2001). The sample is restricted to immigrants who are at least 30years of age, and immigrants from Bosnia are dropped throughout.
18

Figure 4: Welfare Magnet Effects: Cross-Country Evidence
A: Non-EU Migration to the Nordic Countries
S
chem
e In
trodu
ctio
n
S
chem
e R
epea
l
Sche
me
Rei
ntro
duct
ion
-.10
.1.2
.3
Imm
igra
tion
Net
Flo
w (S
hare
of 2
001
Stoc
k)
91 92 93 94 95 96 97 98 99 00 01 02 03 04 05 06 07 08 09 10 11 12 13 14 15 16 17Year
Denmark Finland Norway Sweden
B: Synthetic Control Approach
S
chem
e In
trodu
ctio
n
S
chem
e R
epea
l
Sche
me
Rei
ntro
duct
ion
-.10
.1.2
.3
Imm
igra
tion
Net
Flo
w (S
hare
of 2
001
Stoc
k)
91 92 93 94 95 96 97 98 99 00 01 02 03 04 05 06 07 08 09 10 11 12 13 14 15 16 17Year
Denmark (Non-EU Immigration) Synthetic Denmark (Non-EU Immigration)
Notes: Panel A shows the annual net flow of immigrants from outside the EU/EFTA to each of the four Nordic counties,divided by the country’s 2001 stock of non-EU/EFTA immigrants. Panel B retains the same data series for Denmark asPanel A, but combines the three other Nordic countries into one synthetic control country, labeled “Synthetic Denmark”.This series is constructed as a weighted average of Finland, Norway and Sweden to minimize the sum of squared errorsin the pre-scheme (1991-2001) immigration flows between Denmark and Synthetic Denmark. This yields the followingweights: Finland 0.468, Norway 0.361, Sweden 0.171. Unlike the within-country analysis, no age restriction has beenplaced on migrants. To correct for the pre-scheme Bosnia shock, immigrants from the former Yugoslavia are droppedthroughout.
19

Table 1: Migration Responses to the Immigrant Welfare Scheme
Age ≥ 30 Age ≥ 24 Age ≥ 18Syria No Syria Syria No Syria Syria No Syria
(1) (2) (3) (4) (5) (6)
Panel A: Effects on Net Flow (Fraction of 2001 Stock)
Effect of Benefits (USD 100) 0.0044*** 0.0048*** 0.0046*** 0.0050*** 0.0044*** 0.0049***(0.0008) (0.0008) (0.0009) (0.0009) (0.0010) (0.0010)
Elasticity of Migration Flow 1.29 1.41 1.40 1.53 1.35 1.51w.r.t. Benefits (0.23) (0.24) (0.27) (0.28) (0.30) (0.30)
Observations 444 444 444 444 444 444
Panel B: Effects on Gross Inflow and its Composition (Fraction of 2001 Stock)
Effect of Benefits (USD 100):
Total 0.0040*** 0.0040*** 0.0042*** 0.0042*** 0.0045*** 0.0047***(0.0008) (0.0009) (0.0012) (0.0012) (0.0013) (0.0014)
Asylum 0.0029*** 0.0028*** 0.0031*** 0.0032*** 0.0032*** 0.0033***(0.0007) (0.0008) (0.0011) (0.0011) (0.0012) (0.0013)
Family 0.0027*** 0.0027*** 0.0034*** 0.0033*** 0.0038*** 0.0038***(0.0007) (0.0007) (0.0011) (0.0011) (0.0012) (0.0013)
Work & Study 0.0007 0.0007 0.0007 0.0007 0.0009 0.0009(0.0005) (0.0005) (0.0008) (0.0008) (0.0009) (0.0009)
Observations 252 252 252 252 252 252
Notes: Panel A shows the effect of welfare benefits (in 100s of dollars) on immigration net flow as a fraction of the pre-scheme stock and the implied elasticity ofimmigration net flow with respect to benefits. Panel B shows the gross inflow of immigrants by type of residence permit as a fraction of the pre-scheme stock. Theestimates of benefit effects correspond to β̂ obtained from (1), while the estimates of elasticities correspond to ε obtained from (2). We estimate (1) by weighted leastsquares using the pre-scheme stock of each group as weights. The specification is run on de-trended outcome variables, i.e. the residual between the raw immigrationoutcome and a linear, group-specific trend estimated on pre-scheme data. The standard errors (in parentheses) are obtained by treating the pre-trend equation andequation (1) as a set of joint moment conditions and calculating the associated GMM standard errors. Across columns, we consider different sample restrictions byvarying the age threshold and whether Syrian immigrants are included or not. Immigrants from Bosnia are dropped from the sample in all specifications.
20

Online Appendix (Not for Publication)
A Supplementary Figures and Tables
21

Figure A.I: Ad Campaign in Lebanese Newspapers and Online, September 2015
Notes: The two pictures show an ad campaign run by the Danish Government in September 2015 to inform potential immigrants about the recently (re)introducedwelfare scheme, along with information about other regulatory rules. The left picture shows the campaign text in English released by the Danish Ministry ofImmigration. The right picture shows the printed ad (from NBC News: https://www.nbcnews.com/storyline/europes-border-crisis/denmark-buys-ads-lebanon-newspapers-aimed-refugees-n423216). The ad campaign ran online and in Lebanese printed newspapers.
22
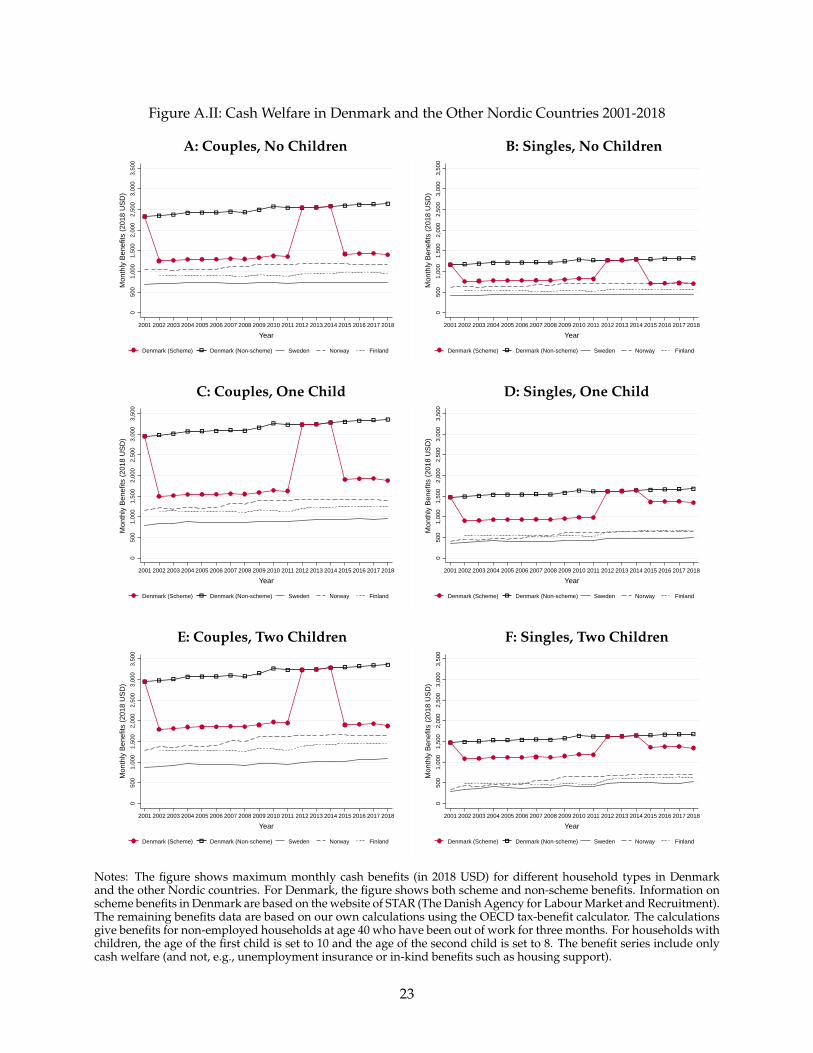
Figure A.II: Cash Welfare in Denmark and the Other Nordic Countries 2001-2018
A: Couples, No Children B: Singles, No Children0
500
1,00
01,
500
2,00
02,
500
3,00
03,
500
Mon
thly
Ben
efits
(201
8 U
SD
)
2001 2002 2003 2004 2005 2006 2007 2008 2009 2010 2011 2012 2013 2014 2015 2016 2017 2018
Year
Denmark (Scheme) Denmark (Non-scheme) Sweden Norway Finland
050
01,
000
1,50
02,
000
2,50
03,
000
3,50
0
Mon
thly
Ben
efits
(201
8 U
SD
)
2001 2002 2003 2004 2005 2006 2007 2008 2009 2010 2011 2012 2013 2014 2015 2016 2017 2018
Year
Denmark (Scheme) Denmark (Non-scheme) Sweden Norway Finland
C: Couples, One Child D: Singles, One Child
050
01,
000
1,50
02,
000
2,50
03,
000
3,50
0
Mon
thly
Ben
efits
(201
8 U
SD
)
2001 2002 2003 2004 2005 2006 2007 2008 2009 2010 2011 2012 2013 2014 2015 2016 2017 2018
Year
Denmark (Scheme) Denmark (Non-scheme) Sweden Norway Finland
050
01,
000
1,50
02,
000
2,50
03,
000
3,50
0
Mon
thly
Ben
efits
(201
8 U
SD
)
2001 2002 2003 2004 2005 2006 2007 2008 2009 2010 2011 2012 2013 2014 2015 2016 2017 2018
Year
Denmark (Scheme) Denmark (Non-scheme) Sweden Norway Finland
E: Couples, Two Children F: Singles, Two Children
050
01,
000
1,50
02,
000
2,50
03,
000
3,50
0
Mon
thly
Ben
efits
(201
8 U
SD
)
2001 2002 2003 2004 2005 2006 2007 2008 2009 2010 2011 2012 2013 2014 2015 2016 2017 2018
Year
Denmark (Scheme) Denmark (Non-scheme) Sweden Norway Finland
050
01,
000
1,50
02,
000
2,50
03,
000
3,50
0
Mon
thly
Ben
efits
(201
8 U
SD
)
2001 2002 2003 2004 2005 2006 2007 2008 2009 2010 2011 2012 2013 2014 2015 2016 2017 2018
Year
Denmark (Scheme) Denmark (Non-scheme) Sweden Norway Finland
Notes: The figure shows maximum monthly cash benefits (in 2018 USD) for different household types in Denmarkand the other Nordic countries. For Denmark, the figure shows both scheme and non-scheme benefits. Information onscheme benefits in Denmark are based on the website of STAR (The Danish Agency for Labour Market and Recruitment).The remaining benefits data are based on our own calculations using the OECD tax-benefit calculator. The calculationsgive benefits for non-employed households at age 40 who have been out of work for three months. For households withchildren, the age of the first child is set to 10 and the age of the second child is set to 8. The benefit series include onlycash welfare (and not, e.g., unemployment insurance or in-kind benefits such as housing support).
23

Figure A.III: Immigrant Stock 1980-2017
05
1015
Imm
igra
tion
Stoc
k (%
of P
opul
atio
n)
80 81 82 83 84 85 86 87 88 89 90 91 92 93 94 95 96 97 98 99 00 01 02 03 04 05 06 07 08 09 10 11 12 13 14 15 16 17Year
1st Generation 1st and 2nd Generation
Notes: The figure shows the share of first-generation immigrants and the share of first- and second-generation immi-grants in the Danish population. Definitions of first- and second-generation immigrants follow the official definitionsof Statistics Denmark: a first-generation immigrant is a person who was born outside of Denmark and where neitherof the parents are Danish citizens and born in Denmark. A second-generation immigrant is a person who was born inDenmark and where neither of the parents are Danish citizens and born in Denmark.
24

Figure A.IV: Asylum Applications from Outside EU: Annual Data
A: Application Submissions
Sch
eme
Intro
duct
ion
Sch
eme
Rep
eal
Sch
eme
Rei
ntro
duct
ion
05
1015
2025
App
licat
ions
(100
0s)
00 01 02 03 04 05 06 07 08 09 10 11 12 13 14 15 16 17 18 19 20
Year
Submissions
B: Application Submissions, Applications in Review, and Residence Permits
Sch
eme
Intro
duct
ion
Sch
eme
Rep
eal
Sch
eme
Rei
ntro
duct
ion
05
1015
2025
App
licat
ions
and
Per
mits
(100
0s)
97 98 99 00 01 02 03 04 05 06 07 08 09 10 11 12 13 14 15 16 17 18 19 20
Year
Submissions In Review Permits
Notes: This figure shows asylum applications to Denmark at the annual level. Panel A shows applications submitted,while Panel B compares applications submitted (dots), applications registered for administrative review (squares), andresidence permits granted (triangles). The solid vertical lines mark the timing of scheme reform implementations.Asylum seekers from Bosnia are dropped from the sample. The data are obtained from Statistics Denmark’s onlinedatabase (Statistikbanken, tables VAN5 and VAN77).
25

Figure A.V: Asylum Applications from Outside EU: Quarterly Data
A: Application Submissions
Sch
eme
Intro
duct
ion
Sch
eme
Rep
eal
Sch
eme
Rei
ntro
duct
ion
Ann
ounc
emen
t
Ann
ounc
emen
t
Ann
ounc
emen
t
02
46
810
12A
pplic
atio
ns (1
000s
)
00:Q
101
:Q1
02:Q
103
:Q1
04:Q
105
:Q1
06:Q
107
:Q1
08:Q
109
:Q1
10:Q
111
:Q1
12:Q
113
:Q1
14:Q
115
:Q1
16:Q
117
:Q1
18:Q
119
:Q1
20:Q
1
Year-Quarter
Submissions
B: Application Submissions, Applications in Review, and Residence Permits
Sch
eme
Intro
duct
ion
Sch
eme
Rep
eal
Sch
eme
Rei
ntro
duct
ion
Ann
ounc
emen
t
Ann
ounc
emen
t
Ann
ounc
emen
t
02
46
810
12A
pplic
atio
ns a
nd P
erm
its (1
000s
)
97:Q
198
:Q1
99:Q
100
:Q1
01:Q
102
:Q1
03:Q
104
:Q1
05:Q
106
:Q1
07:Q
108
:Q1
09:Q
110
:Q1
11:Q
112
:Q1
13:Q
114
:Q1
15:Q
116
:Q1
17:Q
118
:Q1
19:Q
120
:Q1
Year-Quarter
Submissions In Review Permits
Notes: This figure shows asylum applications to Denmark at the quarterly level. Panel A shows applications submitted,while Panel B compares applications submitted (dots), applications registered for administrative review (squares), andresidence permits granted (triangles). The solid vertical lines mark the timing of scheme reform implementations, andthe dashed vertical lines mark the timing of scheme reform announcements. Asylum seekers from Bosnia are droppedfrom the sample. The data are obtained from Statistics Denmark’s online database (Statistikbanken, tables VAN5 andVAN77).
26

Table A.I: Main Changes to Immigration Regulations, 2000-2017
Date Reform Description Affected group
May 2000 Affiliation requirement Restricts marriage-based immigration to cases
where the spouses’ "combined affiliation" to
Denmark is at least as strong as to any other
country.
Family
June 2002 24-year rule Marriage-based immigration restricted to couples
where both spouses are at least 24 years old.
Family
June 2002 Tightening of affiliationrequirement
Affiliation requirement tightened to require that
spouses have a "combined affiliation" to Denmark
stronger than to any other country.
Family
June 2002 Stricter criteria to obtainpermanent residency
Required time in Denmark to apply for permanent
residency extended from 3 to 7 years; tighter
restrictions for convicted criminals.
Asylum andFamily
June 2002 "De Facto" refugee conceptreplaced with "protectionstatus"
A tightening of approval conditions for asylum
seekers who do not meet critera set by
international conventions.
Asylum
April 2007 Immigration test Requirement to pass a test in Danish language and
society to obtain family-based immigration.
Family
May 2010 Altered criteria to obtainpermanent residency
Criteria for attainment of permanent residency
changed to include requirements on employment,
education etc., but required time in Denmark
shortened to 4 years.
Asylum andFamily
June 2011 Tightening of affiliationrequirement
Affiliation requirement tightened again to require
that spouses have a substantially greater affiliation
to Denmark than to any other country.
Family
June 2011 Point system formarriage-basedimmigration
Marriage-based immigration now made
conditional on obtaining a number of points based
on criteria such as past employment, education
and language skills.
Family
May 2012 Rollback of 2011 reforms Immigration reforms from 2011 (point system for
marriage-based immigration and tightened
affiliation requirement) rolled back.
Family
27

Date Reform Description Affected group
Feb. 2015 Introduction of"temporary protectionstatus"
Certain asylum seekers fleeing conflicts or war
will be granted "temporary protection status,"
which requires periodic renewal until the conflict
ends or permanent residency is attained.
Asylum
Jan. 2016 Longer waiting period forfamily-based migration forrefugees on temporaryprotection status
Waiting period for refugees on temporary
protection status to apply for visas for family
members extended from 1 to 3 years.
Asylum andFamily
Jan. 2016 Stricter criteria to obtainpermanent residency
Required time in Denmark to obtain permanent
residency extended from 4 to 6 years and subject
to some stricter requirements on e.g. employment,
language tests.
Asylum andFamily
Sept. 2016 Suspension ofparticipation in UNHCRresettlement program
Danish Government suspends participation in the
UNHCR resettlement program, through which
Denmark had received around 500 refugees
annually until this point.
Asylum
May 2017 Longer waiting period toobtain permanentresidency
Required time in Denmark to obtain residency
further extended from 6 to 8 years.
Asylum andFamily
Notes: This table summarizes the main changes to immigration regulation over the period 2000-2017. Many otheradjustments to immigration regulation have not been included in the table, as they changed only minor details of thelegislation.
28

B Asylum Applications
Our main specification uses residency as the measure of immigration. However, in the first in-
stance, it is the decision to apply for Danish residency that should respond to benefit reform. Due
to the lag between applying for residency and the final decision about residency, the timing of the
DiD evidence in Figure 2 may be less compelling than it appears. The length of the lag varies by
residency type and between individual cases, and in most cases we cannot observe it directly in
the data. However, for asylum seekers specifically, we do observe the number and timing of appli-
cations (in addition to actual permits granted). This gives a measure of the desirability of Denmark
as a destination country without any potential timing issues.
Graphical evidence on this outcome is shown in Figure A.IV on an annual level. Panel A shows
the total number of submitted asylum applications to Denmark since year 2000. We see a pattern
very similar to that of the treated group in Figure 2 in our main analysis. The number of asylum
applications declines markedly after the introduction of the welfare scheme, from around 10,000
to under 5000 within the space of a few years after the reform. It then increases again after the
abolishment, and drops yet again after the reintroduction of the scheme. This pattern is thus fully
consistent with what we see in our main analysis.
The series in Panel A is the best measure of asylum applications, but it is only available from
2000 onwards. Therefore, in Panel B of Figure A.IV, we add two alternative series which are
available further back in time. The first of these series shows the number of applications under
administrative review. This series excludes applications that were submitted, but rejected in an
initial stage before undergoing a rigorous review. This series contains some lag relative to the
one for total applications in Panel A. The second additional series shows the number of residence
permits granted for asylum seekers. Because this occurs after the review stage, the potential lag
for this series is greater still. Nevertheless, the three series track each other fairly closely.
One important point to notice from Panel B of Figure A.IV is that the spike in asylum applica-
tions around 2015 is much larger than the spike in residence permits granted. This suggests that
a sizeable part of the spike in asylum applications around this time came from individuals who
did not fulfill the UNHCR’s criteria for refugee status. This illustrates part of the reason why we
use actual residencies rather than applications as our main outcome: Not every application leads
to migration, and while variation in applications are useful for validating the existence of behav-
ioral responses, the economically important question relates to the impact of benefits on actual
29

migration.
Figure A.V shows the same series as Figure A.IV, but on a quarterly level.19 In this figure,
we have included two vertical lines for each reform, the first indicating the announcement of the
reform and the second indicating the actual implementation. Since the announcement and imple-
mentation fall within the same calendar year for each of the three reforms, this distinction was
not necessary for the annual graphs. However, with the higher-frequency data considered here, it
is useful to indicate both given behavior may plausibly start to react to the policy already at the
point of announcement. The quarterly series are more noisy as one would expect, but the patterns
remain consistent with immigration responses to the benefit reforms. We do notice that the large
spike of asylum applications in 2015 occurs just after the reintroduction of the welfare scheme.
This is not inconsistent with our interpretations, however, as a slight lag in the reaction to reforms
is to be expected due to e.g. informational frictions.20
Finally, to relate and contrast these results to those obtained in our main analysis, it is worth
highlighting the following points. First, the outcome variable considered here includes only one of
the two types of migration treated by the welfare scheme; our main analysis also includes family-
based migration. Second, the analysis here considers migration inflow, whereas our main analysis
considers net flow. Third, we do not have a control group for our asylum applications outcome,
so even though we observe sharp changes around the reforms, it is hard to obtain a quantitative
measure of the magnitude of the welfare magnet effect from this data alone. The main purpose of
this analysis is to show that the timing of changes in applications data is not too dissimilar from
the timing of changes in residence data, suggesting that our estimates do capture immigration
responses to welfare benefits rather than confounding effects of other immigration determinants.
19Unlike our main analysis where the outcome variable (net immigration flow) is observable only on an annual basis,asylum applications are observable on a quarterly basis.
20For instance, the Danish government’s ad campaign in Lebanese newspapers (see Figure A.I) ran in September 2015,just after the reintroduction of the welfare scheme. Its purpose was to inform potential migrants of the welfare cuts.However, while many Syrian refugees passed through Lebanon on their way to Europe, it is likely that many of thosewho applied for asylum in Denmark in the final quarter of 2015 would have already been further along in their journeyat this point.
30