طسوتلما قشرل ةيحصلا ةلجلما - Sign in
88
-
Upload
khangminh22 -
Category
Documents
-
view
3 -
download
0
Transcript of طسوتلما قشرل ةيحصلا ةلجلما - Sign in


البلدان أعضاء اللجنة اإلقليمية ملنظمة الصحة العاملية لرشق املتوسط
األردن . أفغانستان . اإلمارات العربية املتحدة . باكستان . البحرين . تونس . اجلامهريية العربية الليبية . مجهورية إيران اإلسالمية اجلمهورية العربية السورية . اجلمهورية اليمنية . جيبويت . السودان . الصومال . العراق . ُعامن . فلسطني . قطر . الكويت . لبنان . مرص
املغرب . اململكة العربية السعودية
Subscriptions and Distribution Enquiries regarding subscriptions and distribution of the print edition of EMHJ should
be addressed to: Printing and Marketing of Publications at: email: [email protected]; tel: (+202) 2276 5000; fax: (+202) 2670 2492 or 2670 2494
Permissions Requests for permission to reproduce or translate articles, whether for sale or
non-commercial distribution should be addressed to EMHJ at: [email protected]
Members of the WHO Regional Committee for the Eastern Mediterranean
Afghanistan . Bahrain . Djibouti . Egypt . Islamic Republic of Iran . Iraq . Jordan . Kuwait . Lebanon Libyan Arab Jamahiriya . Morocco . Oman . Pakistan . Palestine . Qatar . Saudi Arabia . Somalia
Sudan . Syrian Arab Republic . Tunisia . United Arab Emirates . Republic of Yemen
Membres du Comité régional de l’OMS pour la Méditerranée orientale
Afghanistan . Arabie saoudite . Bahreïn . Djibouti . Égypte . Émirats arabes unis . République islamique d’Iran Iraq . Jamahiriya arabe libyenne . Jordanie . Koweït . Liban . Maroc . Oman . Pakistan . Palestine . Qatar
République arabe syrienne . Somalie . Soudan . Tunisie . République du Yémen
Correspondence
Editor-in-chiefEMHJ
WHO Regional Office for the Eastern MediterraneanP.O. Box 7608
Nasr City, Cairo 11371 Egypt
Tel: (+202) 2276 5000 Fax: (+202) 2670 2492/(+202) 2670 2494
Email: [email protected]/[email protected]
EASTERN MEDITERRANEAN HEALTH JOURNALIS the official health journal published by the Eastern Mediterranean Regional Office of the World Health Organization. It is a forum for the presentation and promotion of new policies and initiatives in health services; and for the exchange of ideas, con‑cepts, epidemiological data, research findings and other information, with special reference to the Eastern Mediterranean Region. It addresses all members of the health profession, medical and other health educational institutes, interested NGOs, WHO Col‑laborating Centres and individuals within and outside the Region.
LA REVUE DE SANTÉ DE LA MÉDITERRANÉE ORIENTALEEST une revue de santé officielle publiée par le Bureau régional de l’Organisation mondiale de la Santé pour la Méditerranée orientale. Elle offre une tribune pour la présentation et la promotion de nouvelles politiques et initiatives dans le domaine des ser‑vices de santé ainsi qu’à l’échange d’idées, de concepts, de données épidémiologiques, de résultats de recherches et d’autres informations, se rapportant plus particulièrement à la Région de la Méditerranée orientale. Elle s’adresse à tous les professionnels de la santé, aux membres des instituts médicaux et autres instituts de formation médico‑sanitaire, aux ONG, Centres collabora‑teurs de l’OMS et personnes concernés au sein et hors de la Région.
EMHJ is a trilingual, peer reviewed, open access journal and the full contents are freely available at its website: http://www/emro.who.int/emhj.htm
EMHJ is abstracted/indexed in the Index Medicus and MEDLINE (Medical Literature Analysis and Retrieval Systems on Line) and the ExtraMed‑Full text on CD‑ROM, the Cumulative Index to Nursing and Allied Health Literature (CINAHL), CAB International, Lexis Nexis, Scopus and the Index Medicus for the WHO Eastern Mediterranean Region (IMEMR).
©World Health Organization 2011 All rights reserved
Disclaimer The designations employed and the presentation of the material in this publication do not imply the expression of any opinion whatsoever on the part of the World Health Organization concerning the legal status of any country, territory, city or area or of its authorities, or concerning the delimitation of its frontiers or boundaries. Dotted lines on maps represent approximate border lines for which there may not yet be full agreement. The mention of specific companies or of certain manufacturers’ products does not imply that they are endorsed or recommended by the World Health Organization in preference to others of a similar nature that are not mentioned. All reasonable precautions have been taken by the World Health Organization to verify the information contained in this publication. However, the published material is being distributed without warranty of any kind, either express or implied. The responsibility for the interpretation and use of the material lies with the reader. In no event shall the World Health Organization be liable for damages arising from its use. The named authors alone are responsible for the views expressed in this publication.
ISSN 1020‑3397
Cover designed by Diana Tawadros Internal layout designed by Emad Marji and Diana Tawadros
Printed by WHO Regional Office for the Eastern Mediterranean
هى املجلة الرسمية التى تصدر عن املكتب اإلقليمى لرشق املتوسط بمنظمة الصحة العاملية. وهى منرب لتقديم الوبائية واملعطيات واملفاهيم اآلراء ولتبادل هلا، والرتويج الصحية اخلدمات اجلديدة ىف واملبادرات السياسات املتوسط. وهى موجهة إىل كل بإقليم رشق يتعلق منها ما املعلومات، وخاصة ونتائج األبحاث وغري ذلك من واملراكز املعنية، احلكومية املنظامت غري التعليمية، وكذا املعاهد الطبية وسائر والكليات الصحية، املهن أعضاء
املتعاونة مع منظمة الصحة العاملية واألفراد املهتمني بالصحة ىف اإلقليم وخارجه.
املجلة الصحية لرشق املتوسط
Cover 17-8.indd 2 8/8/2011 10:11:18 AM

Contents
La Revue de Santé dela Méditerranée orientale
Eastern MediterraneanHealth Journal
Vol. 17 No. 1 •املجلد السابع عرش عدد 1 2011 •
Letter from the Editor ......................................................................................................................................................................................................................................................................................................................................3
Research articlesImpact of a quality improvement programme on family planning services in EgyptR. Hong , V. Mishra and N. Fronczak....................................................................................................................................................................................................................................................................................................4
Prevalence, awareness and determinants of contraceptive use in Qatari womenA.A. Arbab, A. Bener and M. Abdulmalik ......................................................................................................................................................................................................................................................................................11
Quality of care for obstetric emergencies in 4 general hospitals in Egypt: an observational study of delays in receiving care and blood bank servicesK.H. Nada, A.A. Barakat and R .Gipson .......................................................................................................................................................................................................................................................................................19Needlestick injuries among health care workers of University of Alexandria hospitalsM.I. Hanafi, A.M. Mohamed, M.S. Kassem and M. Shawki .............................................................................................................................................................................................................................................26
Nutritional status of children hospitalized in Tabriz Paediatric Hospital, Islamic Republic of Iran, 2008A.M. Mahdavi, A. Ostadrahimi and A. Safaiyan .....................................................................................................................................................................................................................................................................36Profile of drug users in Karachi city, PakistanH. Ali, R . Bushra and N. Aslam .............................................................................................................................................................................................................................................................................................................41
Type-D personality: a predictor of quality of life and coronary heart diseaseT. Saeed, G.S.K. Niazi and S. Almas ..................................................................................................................................................................................................................................................................................................46
Comparison of microscopical examination and semi-nested multiplex polymerase chain reaction in diagnosis of Plasmodium falciparum and P. vivaxM. Nateghpour, H. Abed Khojasteh, H. Keshavarz, H. Hajjaran, Gh. Edrissian, A. Rahimi and N. Gobakhloo ............................................................................................................................51
Prévalence du syndrome métabolique chez les hémodialysés chroniques au MarocO. Maoujoud, S. Ahid, M. Asseraji, A. Bahadi, T. Aatif, Y. Zajari et Z. Oualim .....................................................................................................................................................................................................56
Adaptation of the school health index to assess the healthy school environment in JordanI.M. Khatib and S.S. Hijazi ......................................................................................................................................................................................................................................................................................................................62
Évaluation des actes de prévention dans les cliniques du département d’odontologie de l’Université Cheikh Anta Diop de DakarM. Diouf, A. Faye, D. Cisse, D. Faye et C.M.M. Lo ...................................................................................................................................................................................................................................................................69
Specialty choices of medical students and house officers in Karachi, PakistanM. Aslam, A. Ali, T. Taj, N. Badar, W. Mirza, A. Ammar, S. Muzaffar and J.R . Kauten .................................................................................................................................................................................74
Eastern Mediterranean Health Journal reviewers’ panel, 2010 ..........................................................................................................................................................................................................80
Guidelines for authors ..................................................................................................................................................................................................................................................................................................................................82
Book 17-1.indb 3 1/3/2011 1:38:00 PM

M. Haytham Khayat MD, FRSH, Editor-in-chief Muhammad Afzal MSc, MPhil, PhD, Executive Editor
Editorial Board Mohammad Abdur Rab MBBS, DTM&H, MPH&TM, PhD Naeema Al Gasseer MSc, PhD Mohamed M. Ali BSc, MSc, PhD, DTMH Abdulla S. Assaedi MBBS, MPH Mounir Farag MD, DGS, DEmS, DPH Abdul Ghaffar MD, MPH, MHA, PhD Malekafzali Hossein MK, MPH, PhD Jaouad Mahjour MD, MPH Mamunur Rahman Malik MBBS, Dip (Health Economics), MSc, MPhil Kassem Sara MD
International Advisory Panel Dr S. Aboulazm. Professor of Orthodontics. Egypt Dr Abdul Rahman Al-Awadi BSc, MD, MPH, Honorary FRCM, Ireland Dr Law, Korea, Honorary FRCS & P, Glasgow, FRCP, Edinbugh. Kuwait Dr Fariba Al-Darazi RN, MSc, PhD. Bahrain Dr M. Al-Nozha, MD, FRCP, FACC, FESC. Professor of Medicine and Consultant Cardiologist. Saudi Arabia Dr Ala’din Alwan MD, FRCP, FFPHM. Iraq Dr F. Azizi. Professor of Internal Medicine and Endocrinology. Islamic Republic of Iran Dr K. Bagchi BSc, MD, PhD. India Professor K. Dawson BA, MD, PhD, FRCP, FRACP, FRCPCH, DObst, RCOG. New Zealand Professor Kaussay Dellagi MD. Tunisia Dr R. Dybkaer MD. Denmark Dr M. Aziz El-Matri. Professor of Medicine. Tunisia Professor F. El-Sabban BSc, MS, PhD. United States of America Dr A.H. El-Shaarawi MSc (Stat), PhD (Stat). CanadaProfessor N. Fikri-Benbrahim PhD (Pub health) (SocSci). MoroccoProfessor A.T. Florence BSc (Pharm), PhD, DSc, FRSC, FRPharmS, FRSE. United KingdomProfessor Cheherezade M.K. Ghazi BS (Nursing), MS (Nursing), DPH, MPA. EgyptProfessor M.A. Ghoneim MD, MD (Hons). EgyptDr J.A. Hashmi DTM&H, FRCP. PakistanProfessor J. Jervell MD, PhD. NorwayProfessor G.J. Johnson MA, MD, BChir, FRCS (C), FRCOphth, DCEH. United Kingdom Dr M. Kassas. Emeritus Professor of Plant Ecology. EgyptProfessor M.M. Legnain MBBS, MRCOG, FRCOG. Libyan Arab Jamahiriya Professor El-Sheikh Mahgoub DipBact, PhD, MD, FRCPath. SudanProfessor A.M.A. Mandil MSc (Paediatr), MPH, DrPH. EgyptProfessor A.B. Miller MB, FRCP. CanadaProfessor S.S. Najjar MD. LebanonDr Abubaker A. Qirbi BSc, MD (Edin), FRCPC (Can), FRCP FRCPath (UK). Republic of Yemen Professor O.S.E. Rasslan MD, PhD. EgyptProfessor W.A. Reinké MBA, PhD. United States of America Professor I.A. Sallam, MD, Dip High Surgery Cairo, Honorary FRCS, PhD (Glasgow), LRCP, MRCS, FRCS (London), ECFMG. Egypt Dr C.Th.S. Sibinga FRCP (Edin), FRCPath. The Netherlands Mr Taoufik Zeribi Eng BSc, MSc. Tunisia
Editors Fiona Curlet, Eva Abdin, Alison Bichard, Guy Penet
GraphicsSuhaib Al Asbahi, Hany Mahrous, Diana Tawadros
AdministrationNadia Abu-Saleh, Yasmine El Sakhawy
Book 17-1.indb 4 1/3/2011 1:38:30 PM

املجلد السابع عرشاملجلة الصحية لرشق املتوسطالعدد األول
3
رسالة من املحرر
Letter from the Editor
من املعلوم أن مراجعة الزمالء للمقاالت املقدمة للمجلة الصحية لرشق املتوسط ليست مطلبًا اختياريًا، وإنام هي رضورة إلزامية. ويتم اختيار املراجعني من قاعدة معطيات املجلة اخلاصة باخلرباء املشهود هلم بالكفاءة، واإلسهام يف جمال معني من جماالت البحوث الصحية، والذين أبدوا موافقتهم عىل إجراء قام ذلك أجل من املقبولة. البحوث جودة لضامن املراجعني قدرة تعزيز إىل باحلاجة ذلك مع شعرنا وقد للمجلة. مة املقدَّ للبحوث الزمالّية املراجعات حمررو املجلة بتنظيم دورات تدريبية يف عاَمْي 2009 و2010 للتدريب عىل كيفية كتابة األوراق البحثية، وعىل أصول املراجعة الزمالّية بغية توجيه الباحثني
واملراجعني إىل حتسني كتابة البحوث واملراجعة الزماليَّة. وقد ُقوبَِلْت مجيع الدورات باالستحسان، واستفاد منها نحو أربع مئة باحث وحمرر حتى اآلن.
وقد أَظهَرت الدراسة التي عرضتها املجلة الصحية إلقليم رشق املتوسط يف املؤمتر اإلقليمي اخلامس للمجالت الطبية، الذي ُعقد يف كراتيش يف باكستان يف اب بالدالئل اإلرشادية للمجلة الصحية إلقليم رشق املتوسط، وبمعايري إعداد التقارير حول ـّ كانون األول/ديسمرب من العام املنرصم، حول مدى التزام الكتاب بشكل عام ال يلتزمون التزامًا صارمًا بالدالئل اإلرشادية للمجلة، وال بمعايري إعداد التقارير البحثية. وإذا كانت ـّ البحوث العلمية، أن كثريًا من الكتسياسة املجلة حتى عهد قريب، تقوم عىل التـركيز عىل اجلودة العلميَّة للبحوث، ثم تصويب أوُجه القصور يف العرض أثناء التحرير والتنقيح، فإّن العدد
قة عىل املجلة، قد َحَدا هبيئة التحرير إىل أن تتبنَّى سياسة أكثَر رصامًة، مع مزيد من التـركيز عىل الدالئل اإلرشادية. الكبري واملتزايد من البحوث املتدفِّ
في املجلة تدريبًا يف املقر الرئييس للمنظمة يف جنيف عىل كيفية عرض املخطوطات عىل الشابكة ]اإلنرتنت[، وتنظيم مسرية األوراق وقد تلقى اثنان من موظَّالبحثية ونرش املجلة. ونحن نتطلع إىل بدء تنفيذ النظام اجلديد يف العام اجلديد.
وتعتزم املجلة يف هذا العام بعون اهلل، نرش اثَنْي عرش عددًا مفردًا يف مطلع كل شهر من شهور العام، من املجلد السابع عرش، كام هتدف إىل طرح عدد خاص عن معدل انتشار األمراض املدارية املهملة يف اإلقليم، وتيسري عقد املزيد من احللقات العملية حول قضايا الكتابة واملراجعة والتحرير يف بلدان اإلقليم.
واهلل ويلُّ التوفيق.
Peer review of the articles received by EMHJ is not an optional requirement, it is a necessity. Reviewers are selected from the EMHJ database of experts identified for their proficiency and contribution in a particular area of health research and who consent to review for the Journal. However, a need was felt to strengthen the capacity of reviewers to ensure the quality of the accepted papers. In this context, the editors of EMHJ ran training courses in 2009 and 2010 on writing a research paper and peer review which aimed to guide researchers and reviewers towards improved research writing and peer review. All the courses were well received and so far almost 400 researchers and editors have benefitted.
A study presented by EMHJ at the 5th Regional Conference on Medical Journals held in Karachi, Pakistan in December last year on compliance of authors with EMHJ guidelines and scientific research reporting standards revealed that authors generally do not adhere strictly to EMHJ guidelines nor to research reporting standards. Until recently, EMHJ policy has been to focus on the qual-ity of the science and to correct deficiencies in presentation on editing; given the large and ever increasing number of submissions, however, a stricter policy has now been adopted by the Journal.
Two EMHJ staff members received training in WHO Headquarters, Geneva concerning the development of online manuscript submission, paper management and publication of EMHJ and we are looking to initiate this in 2011.
In 2011, EMHJ intends to publish 12 single issues of the Volume 17. It also aims to bring out a special issue on neglected tropical dis-eases prevalent in the Region and facilitate further workshops on writing/reviewing/editorial issues in the countries of the Region.
Book 17-1.indb 3 1/3/2011 1:38:30 PM

EMHJ • Vol. 17 No. 1 • 2011 Eastern Mediterranean Health JournalLa Revue de Santé de la Méditerranée orientale
4
Impact of a quality improvement programme on family planning services in EgyptR. Hong,1 V. Mishra 2 and N. Fronczak 3
ABSTRACT The Egyptian government’s national Gold Star programme to improve the quality and usage of family planning was conducted from 1995 to 2000. Data from the 2004 Egypt Service Provision Assessment survey were used to assess whether the certified Gold Star facilities had sustained higher quality services than non-Gold Star facilities 4 years after conclusion of the programme. A nationally representative sample of 637 facilities providing family planning services were compared using several quality indicators. Gold Star facilities had significantly better availability of family planning methods, counselling and examination services than non-Gold Star facilities, independent of type, size and geographical location. Providers in Gold Star facilities were also more likely to adhere to higher quality practices in counselling and examination than in non-Gold Star facilities. The Gold Star programme was effective and could be implemented elsewhere in the region and globally.
1Measure Demographic and Health Survey, ICF Macro, Calverton, Maryland, United States of America (Correspondence to R. Hong: [email protected]).2Population Policy Section, Population Division, DESA, United Nations, New York, New York, United States of America.3Social Sectors Development Strategies, Boston, Massachusetts, United States of America.
Received: 31/05/09; accepted: 04/08/09
تأثري برنامج حتسني اجلودة عىل خدمات تنظيم األرسة يف مرصراثافوث هونغ، فنود ميرشا، نانيس فرونكزاك
اخلالصة: تم تنفيذ برنامج احلكومة املرصية الوطني للنجمة الذهبية لتحسني اجلودة واالستفادة من تنظيم األرسة يف الفتـرة من 1995 حتى 2000. وقد استخدمت املعطيات التي مجعت يف عام 2004 من خالل مسح تقييم تقديم اخلدمة يف مرص، لتقييم مدى مواصلة احلفاظ عىل مستوى اجلودة اختـتام أربع سنوات عىل انقضاء بعد التي مل حتصل عليها باملرافق مقارنة الذهبية، النجمة التي حصلت عىل شهادة املرافق للخدمات يف املرتفع ة عىل الصعيد الوطني مكّونة من 637 مرفقًا يقدم خدمات تنظيم األرسة، باستخدام عدد من الربنامج أو مل حتافظ عليها. أجريت مقارنة لعينة معربِّمؤرشات اجلودة، قد تبنيَّ أن املرافق احلاصلة عىل شهادة النجمة الذهبية تتوافر فيها طرق تنظيم األرسة، وخدمات املشورة، والفحص، بشكل أفضل بكثري من املرافق غري احلاصلة عىل الشهادة، بغض النظر عن نمط املرفق، وحجمه، وموقعه اجلغرايف. كام كان مقدمو اخلدمة يف املرافق احلاصلة عىل النجمة الذهبية أكثر التزامًا بمامرسات عالية اجلودة يف تقديم املشورة والفحص، من مقدمي اخلدمة يف املرافق غري احلاصلة عىل النجمة الذهبية. مما
يدّل عىل أن برنامج النجمة الذهبية هو برنامج فّعال، ويمكن تطبيقه يف أماكن أخرى يف اإلقليم، وعىل الصعيد العاملي.
Impact d’un programme d’amélioration de la qualité sur les services de planification familiale en Égypte
RÉSUMÉ Le programme national d’excellence Gold Star du gouvernement égyptien pour l’amélioration de la qualité des services de planification familiale et de leur utilisation a été mené de 1995 à 2000. Les données de l’enquête sur l’évaluation des prestations de service en Égypte datant de 2004 ont été utilisées pour savoir si les établissements certifiés Gold Star avaient fourni des services de qualité supérieure par rapport à ceux qui ne l’étaient pas, quatre ans après l’achèvement du programme. Dans un échantillon national représentatif, 637 établissements fournissant des services de planification familiale ont été comparés à l’aide de plusieurs indicateurs de qualité. Les établissements certifiés Gold Star offraient un niveau de disponibilité supérieur pour les méthodes de planification familiale, les services de conseil et les examens par rapport aux autres établissements, indépendamment du type d’établissement, de sa taille ou de sa situation géographique. Les prestataires dans les établissements certifiés Gold Star étaient plus susceptibles d’observer des pratiques de qualité supérieure en termes de conseils et d’examens que les autres. Le programme de certification Gold Star s’est révélé efficace et pourrait être mis en œuvre ailleurs dans la Région et dans le monde.
Book 17-1.indb 4 1/3/2011 1:38:30 PM

املجلد السابع عرشاملجلة الصحية لرشق املتوسطالعدد األول
5
Introduction
Egypt’s rapid population growth in recent decades is considered a major obstacle to the developmental goals set by the Egyptian government [1]. For more than 2 decades, the Egyptian gov-ernment in collaboration with various international donor agencies has been pursuing a national population control programme with the objectives to in-crease contraceptive use and to reduce fertility. As a consequence, between 1980 and 2003, current use of modern contraceptive methods among married women increased from 23% to 57% and the total fertility rate decreased from 5.3 to 3.2 children per woman [2]. Despite the progress, in 2002, according to the Human Development Report, Egypt had a population of 71 million growing at an annual rate of 1.9% [3].
Following the United Nations In-ternational Conference on Population and Development in 1994 in Cairo, which identified providing high quality family planning services as an essential component of any reproductive health programme [4], Egypt’s Ministry of Health and Population and Ministry of Information with support from the United States Agency for International Development developed a national family planning quality improvement programme, called the Gold Star pro-gramme [5]. The programme was de-signed to promote the supply of quality family planning services through better training and supervision of providers and to stimulate demand for family planning by promoting higher quality services to the public [6]. The programme assessed each facility in Egypt providing family planning services on a comprehensive checklist of 101 indicators of quality, including indicators of infrastructure availability, supply of family planning methods and condition of the facility. The assessment was undertaken quar-terly to ensure that quality was sus-tained. A facility that met all 101 quality criteria for 2 consecutive quarters was
awarded a Gold Star certificate, which had to be maintained at successive quar-terly evaluations to retain the status. The Gold Star programme was concluded in 2000 [7].
Previous research has linked the availability of a broad range of con-traceptive methods to increased uti-lization [8,9]. Better family planning infrastructure and adherence of provid-ers to standard practices—discussing issues and side-effects of contracep-tive methods, protecting client privacy, evaluating reproductive and medical history and conducting basic examina-tions to ensure safe administration of the methods—have also been linked with greater acceptance of family plan-ning [10–13].
Using data from a recent national health facility survey in Egypt, this study assessed whether the certified Gold Star facilities had sustained higher quality services than non-Gold Star facilities 4 years after the conclusion of the pro-gramme. The study compared Gold Star and non-Gold Star facilities on several indicators of quality of family planning services: availability of neces-sary infrastructure, availability of a broad range of family planning methods, adequately trained staff, adherence to standard practices in counselling and examination and systems to ensure safe and effective administration of the fam-ily planning methods.
Methods
The data reported in this paper are part of an Egypt Service Provision As-sessment (EPSA) survey conducted in 2004. The ESPA survey collected information from a nationally repre-sentative sample of health facilities and health service providers. The primary objective of that survey was to provide national and regional estimates of facil-ity characteristics and their capacity to provide quality services for family plan-ning, maternal and child health, sexually
transmitted infections, HIV/AIDS and other infectious diseases, such as malaria and tuberculosis.
Sample
Data were collected from a sample of 659 health facilities. Private, for-profit health facilities were not included in the sample. The analysis in this paper was limited to 637 of the sample facilities that provided family planning services and 1930 observations of consultations between family planning providers and clients. The survey also identified which facilities had been certified as Gold Star during 1995–2000. Further details about the survey design are provided in the main ESPA survey report [14].
Data collectionFamily planning quality indexUsing ESPA data from facility inven-tories and provider interviews, 4 major dimensions of quality of family planning care were identified:
Contraceptive supply: provision for •and availability of each of the 5 main family planning methods [oral con-traceptives, injectables, condoms, subdermal implants (Norplant®) and intrauterine contraceptive devices (IUDs)], as well as the provision of education and information on the rhythm method.
Counselling: availability of standard •guidelines, privacy in counselling room, visual aids and an individual client family planning card.
Examination: availability of a private •room for examinations, soap, running water, clean latex gloves, disinfect-ing solution, sharps box, examination table or bed, examination light and vaginal speculum.
Management: whether at least 50% •of the staff received training in fam-ily planning in the last 12 months; whether at least 50% of the staff received supervision in the last 6 months; and whether the facility had
Book 17-1.indb 5 1/3/2011 1:38:30 PM

EMHJ • Vol. 17 No. 1 • 2011 Eastern Mediterranean Health JournalLa Revue de Santé de la Méditerranée orientale
6
an up-to-date family planning register for the last 7 days.The family planning quality index
was used to compare the Gold Star and non-Gold Star facilities on each of the 4 dimensions of quality and on overall quality after statistically controlling for facility type [hospital, maternal and child health (MCH)/urban health unit, rural health unit, health office/mobile unit, nongovernmental organization (NGO)]; size of facility (small: < 10 staff, medium: 10–19 staff, large: 20+ staff); and geographical location of facil-ity (urban governorate, lower Egypt, upper Egypt). A list of the governorates included in each region is provided in the footnote to Table 1.
Adherence to standard practicesThe study also used EPSA data on obser-vations of provider–client interactions to assess adherence to standard prac-tices in counselling and examination. The indicators for this domain were: whether the provider ensured visual pri-vacy; ensured auditory privacy; assured confidentiality; reviewed the client card; recorded information on the client card; used visual aids during the consultation; and discussed the next visit. Again, Gold Star and non-Gold Star facilities were compared on the 7 indicators,
Ethical issuesThe findings presented here are based on an analysis of existing survey data with all identifier information removed. Informed consent was obtained from all respondents in the survey before asking questions.
AnalysisFor each facility, scores on the items from the 4 dimensions of quality of fam-ily planning care were added and the total score was standardized to 25. An overall index of quality of family plan-ning services was calculated by adding the individual index scores for the 4 dimensions (total score range 0–100).
The bivariate comparisons between Gold Star and non-Gold Star facilities
on various items of quality of family plan-ning services were made using the chi-squared statistic with significance levels. Multivariate analysis was conducted using multiple regression using STATA statistical package, version 8.0. Certain types of facilities were over-sampled and in all analyses sample weights were used to restore the representativeness of the facilities.
Results
Distribution of Gold Star and non-Gold Star facilitiesTable 1 shows the distribution of fam-ily planning facilities by type, size and geographical location. One-half of the facilities were rural health units and only one-tenth were hospitals. Two-fifths of the facilities had < 10 staff members, and about one-third had 20+ staff. About one-half of the facilities were in lower Egypt.
Table 1 also shows the proportion of the facilities that were certified as Gold
Star facilities at some time during 1995 and 2000. Overall, 16.7% of all fam-ily planning facilities had received Gold Star certification. Rural health units were most likely (47.7%) and NGOs were least likely (3.6%) to have received the certification. Larger facilities and facilities in lower Egypt were more likely to have received the Gold Star certifica-tion than other facilities.
Comparison of family planning quality indicators
Table 2 shows that Gold Star facilities provided higher quality family planning services for the majority of items in each of the 4 family planning quality dimen-sions than did non-Gold Star facilities.
The Gold Star facilities were sig-nificantly more likely to provide each of the contraceptive methods than non-Gold Star facilities. The difference was particularly evident for discussion of the rhythm method, but the difference was not significant in the case of IUD provision.
Table 1 Distribution of Gold Star and non-Gold Star facilities family planning facilities by facility type, size and geographical location
Characteristic Total Gold star Non-Gold star
No. % % %
Facility type
Hospital 67 10.4 10.5 89.5
MCH/urban health unit 96 15.0 32.4 67.6
Rural health unit 319 50.1 47.7 52.3
Health office/mobile unit 83 13.1 5.9 94.1
NGO 73 11.4 3.6 96.4
Size of facilitya
Small 258 40.8 8.4 91.6
Medium 173 27.4 19.4 80.6
Large 201 31.8 26.2 73.8
Regionb
Urban governorate 71 11.2 11.0 89.0
Lower Egypt 312 49.0 23.5 76.5
Upper Egypt 254 39.8 11.5 88.5
Total 637 100.0 16.7 83.3aSmall < 10 staff; medium: 10–19 staff; large: 20+ staff. bUrban governorates: Cairo, Alexandria, Port Said and Suez; lower Egypt: Damietta, Dakahlia, Sharkia, Kayubia, Kafr-el-Sheikh, Gharbia, Menoufia, Behera and Ismailia; upper Egypt: Giza, Beni Suef, Fayoum, Menya, Assiut, Sohag, Qena, Aswan and Luxor. MCH = maternal and child health; NGO = nongovernmental organization.
Book 17-1.indb 6 1/3/2011 1:38:30 PM

املجلد السابع عرشاملجلة الصحية لرشق املتوسطالعدد األول
7
For counselling indicators, avail-ability of guidelines was significantly better in Gold Star than non-Gold Star facilities, but there was no significant dif-ference between the 2 types of facilities in providing privacy in the counselling room.
Gold Star facilities were also sig-nificantly more likely to have most of the examination room supplies than non-Gold Star facilities, except there was no significant difference in the avail-ability of private room, running water, examination table/bed and examina-tion light.
A significantly higher proportion of Gold Star facilities than non-Gold Star facilities had complete family planning registers for the last 7 days and had supervised at least half of their staff in the last 12 months. There was no sig-nificant difference between the 2 types of facilities on the family planning train-ing indicator; although slightly fewer Gold Star facilities staff had trained more than half their staff in the last 12 months this was not statistically significant.
Table 3 shows the average family planning quality index scores for each
quality dimension—contraceptive supply, counselling, examination and management—for Gold Star and non-Gold Star facilities. The Gold Star fa-cilities had a higher mean score on each individual dimension of quality of family planning services. Overall, the Gold Star facilities had a mean family planning quality score of 80.4 compared with 72.7 for non-Gold Star facilities.
Results from the bivariate analysis indicated that the Gold Star facilities had significantly higher family planning quality index scores than non-Gold Star facilities (P < 0.01) (Table 4). Even
Table 2 Comparison of Gold Star and non-Gold Star facilities on selected indicators of family planning quality of care
Dimension/Indicator Total%
Gold star%
Non-Gold star%
P-value
(n = 637) (n = 110) (n = 527)
Contraceptive supply
Oral contraceptives 92.7 99.4 91.3 0.004
Injectables 96.1 100.0 95.3 0.020
Condoms 86.6 94.7 84.9 0.006
Norplant® 12.5 18.3 11.3 0.043
IUDs 98.0 100.0 97.6 0.099
Rhythm 66.8 82.1 63.6 < 0.001
Counselling
Guidelines 36.6 54.8 32.8 < 0.001
Privacy in counselling room 86.0 86.4 85.9 0.895
Visual aids 89.3 94.4 88.2 0.058
Individual client card 87.1 95.6 85.3 0.003
Examination
Private room 84.1 78.5 85.3 0.072
Soap 67.2 82.3 64.1 < 0.001
Running water 85.6 86.7 85.4 0.709
Clean latex gloves 30.0 39.5 28.1 0.017
Disinfecting solution 87.9 95.0 86.4 0.012
Sharps box 68.7 88.1 64.6 < 0.001
Examination table/bed 98.1 100.0 97.7 0.105
Examination light 91.7 94.9 91.0 0.182
Vaginal speculum 92.2 97.5 91.1 0.022
Management
> 50% of staff received training in family planning in last 12 months 28.6 27.1 29.0 0.740
>50% of staff received supervision in last 6 months 93.1 97.8 92.2 0.023
Complete family planning registration for last 7 days 90.6 100.0 88.6 < 0.001
n = number of facilities; IUD = intrauterine contraceptive device.
Book 17-1.indb 7 1/3/2011 1:38:31 PM
EMHJ • Vol. 17 No. 1 • 2011 Eastern Mediterranean Health JournalLa Revue de Santé de la Méditerranée orientale
8
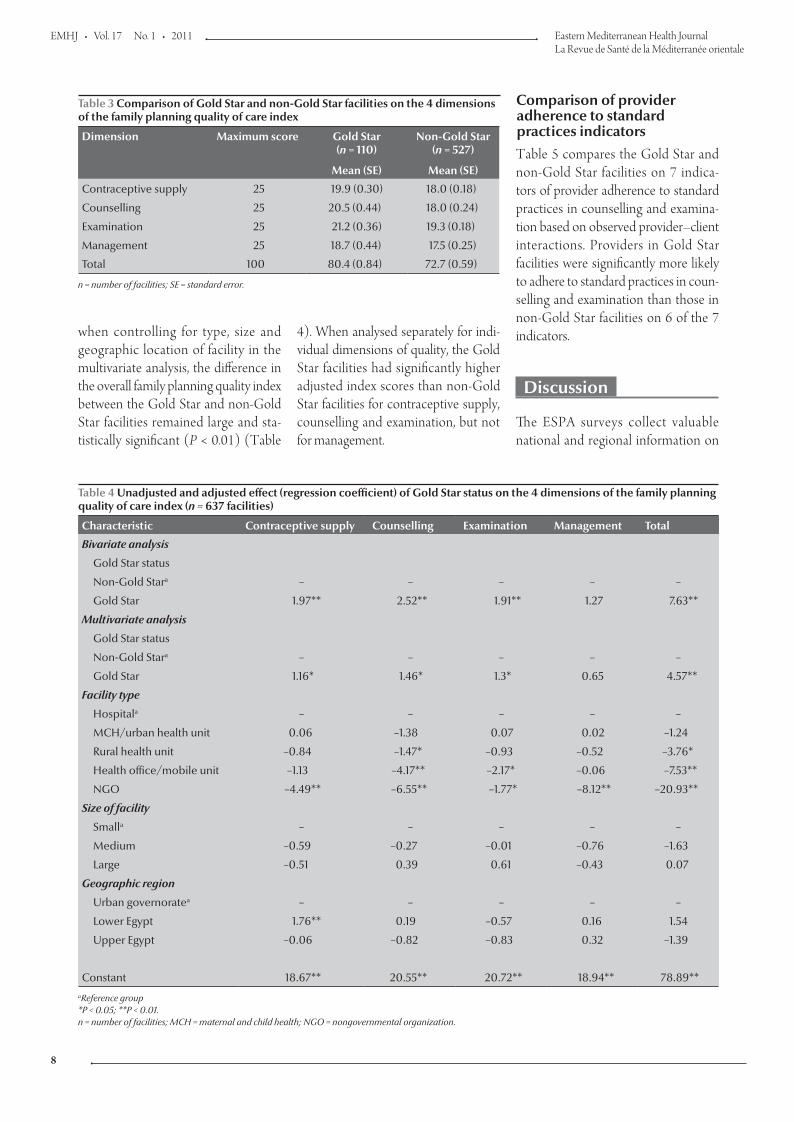
when controlling for type, size and geographic location of facility in the multivariate analysis, the difference in the overall family planning quality index between the Gold Star and non-Gold Star facilities remained large and sta-tistically significant (P < 0.01) (Table
4). When analysed separately for indi-vidual dimensions of quality, the Gold Star facilities had significantly higher adjusted index scores than non-Gold Star facilities for contraceptive supply, counselling and examination, but not for management.
Comparison of provider adherence to standard practices indicators Table 5 compares the Gold Star and non-Gold Star facilities on 7 indica-tors of provider adherence to standard practices in counselling and examina-tion based on observed provider–client interactions. Providers in Gold Star facilities were significantly more likely to adhere to standard practices in coun-selling and examination than those in non-Gold Star facilities on 6 of the 7 indicators.
Discussion
The ESPA surveys collect valuable national and regional information on
Table 3 Comparison of Gold Star and non-Gold Star facilities on the 4 dimensions of the family planning quality of care index
Dimension Maximum score Gold Star (n = 110)
Non-Gold Star(n = 527)
Mean (SE) Mean (SE)
Contraceptive supply 25 19.9 (0.30) 18.0 (0.18)
Counselling 25 20.5 (0.44) 18.0 (0.24)
Examination 25 21.2 (0.36) 19.3 (0.18)
Management 25 18.7 (0.44) 17.5 (0.25)
Total 100 80.4 (0.84) 72.7 (0.59)
n = number of facilities; SE = standard error.
Table 4 Unadjusted and adjusted effect (regression coefficient) of Gold Star status on the 4 dimensions of the family planning quality of care index (n = 637 facilities)
Characteristic Contraceptive supply Counselling Examination Management Total
Bivariate analysis
Gold Star status
Non-Gold Stara – – – – –
Gold Star 1.97** 2.52** 1.91** 1.27 7.63**
Multivariate analysis
Gold Star status
Non-Gold Stara – – – – –
Gold Star 1.16* 1.46* 1.3* 0.65 4.57**
Facility type
Hospitala – – – – –
MCH/urban health unit 0.06 –1.38 0.07 0.02 –1.24
Rural health unit –0.84 –1.47* –0.93 –0.52 –3.76*
Health office/mobile unit –1.13 –4.17** –2.17* –0.06 –7.53**
NGO –4.49** –6.55** –1.77* –8.12** –20.93**
Size of facility
Smalla – – – – –
Medium –0.59 –0.27 –0.01 –0.76 –1.63
Large –0.51 0.39 0.61 –0.43 0.07
Geographic region
Urban governoratea – – – – –
Lower Egypt 1.76** 0.19 –0.57 0.16 1.54
Upper Egypt –0.06 –0.82 –0.83 0.32 –1.39
Constant 18.67** 20.55** 20.72** 18.94** 78.89**aReference group *P < 0.05; **P < 0.01. n = number of facilities; MCH = maternal and child health; NGO = nongovernmental organization.
Book 17-1.indb 8 1/3/2011 1:38:31 PM

املجلد السابع عرشاملجلة الصحية لرشق املتوسطالعدد األول
9
health care facility characteristics and their capacity to provide family plan-ning, maternal and child health, HIV/AIDS and other services. The surveys provide important baseline information about the health care delivery systems, which can be used to evaluate various health and family welfare programme interventions.
Using information on family plan-ning facilities collected in the 2004 ESPA survey, the study reported here evaluated whether the facilities that were certified as Gold Star during 1995–2000 sustained higher quality services than the facilities that were never certified as such. The results show that the Gold Star facilities continued to provide higher quality family planning services on most quality indicators than non-Gold Star facilities 4 years after the conclusion of the programme. The Gold Star facilities provided significantly higher quality services independently of the type, size and geographic location of facilities. The results also show that providers in the Gold Star facilities were significantly more likely to adhere to standard prac-tices in counselling and examination of family planning clients than those in non-Gold Star facilities.
There are several limitations of this analysis that should be kept in mind when interpreting the results. First, there was no initial comparison of the Gold
Star and non-Gold Star facilities at the conclusion of the Gold Star programme in 2000. Therefore, it is not possible to evaluate how the differences in the quality of services between the 2 types of facilities have changed over time.
Another weakness is that the ESPA sample excluded private, for-profit fam-ily planning facilities. Although private, for-profit facilities were also excluded from the government’s Gold Star pro-gramme, it would have been useful to compare the Gold Star facilities with non-Gold Star facilities in both the pub-lic and private sectors.
Thirdly, our comparison of quality indicators between the Gold Star and non-Gold Star facilities was limited to the information collected in the sur-vey, which was not identical to the 101 indicators of quality that were origi-nally used to identify Gold Star facili-ties. Moreover, there are several other important aspects of quality, such as waiting time and client respect, that are not included in our analysis.
Finally, while the facilities in the ESPA sample were randomly selected, the observations of provider–client in-teractions were based on a convenient, opportunistic sample of clients who happened to visit the facility on the day of data collection. This may have in-troduced some bias, but to the extent that data collection days and the times
of visit were random across the facili-ties, any effect of this bias on the overall comparison of Gold Star and non-Gold Star facilities is likely to be small.
Notwithstanding these limitations, there is enough evidence to show that the Gold Star programme was among the successful family planning and population programmes in Egypt. The programme improved quality of care in family planning in Egypt by introducing elements of quality concepts and prac-tices including supplying good qual-ity services, creating demand for quality and research and evaluation of quality. The Gold Star programme was not only effective but also simple in concept and could therefore be implemented else-where in the region and globally.
Acknowledgements
The authors acknowledge Gulnara Se-menov for providing valuable informa-tion about the Gold Star programme. Funding for this research was provided by the United States Agency for In-ternational Development through the MEASURE DHS project (# GPO-C-00-03-00002-00). The views presented in the paper do not represent the views of the United States Agency for Inter-national Development or the organiza-tions to which the authors are affiliated.
Table 5 Comparison of Gold Star and non-Gold Star facilities on selected indicators of provider adherence to standard practices in counselling and examination of family planning clients
Indicator Total % Gold Star % Non-Gold Star % P-value
(n = 1930) (n = 436) (n = 1493)
Ensured visual privacy 74.5 85.2 71.4 < 0.001
Ensured auditory privacy 73.9 84.9 70.7 < 0.001
Assured about confidentiality 20.0 32.3 16.4 < 0.001
Reviewed individual client card 65.9 72.9 63.9 < 0.001
Wrote on individual client card 75.9 83.2 73.7 < 0.001
Used visual aids during consultation 7.3 10.9 6.3 < 0.001
Discussed next visit 78.3 76.9 78.8 0.399
n = number of provider–client interactions.
Book 17-1.indb 9 1/3/2011 1:38:31 PM

EMHJ • Vol. 17 No. 1 • 2011 Eastern Mediterranean Health JournalLa Revue de Santé de la Méditerranée orientale
10
References
Ali KA. Modernization and family planning programs in Egypt. 1. Middle East Report (New York, NY), 1997, 27:40–44.
Human development report 2004: Cultural liberty in today’s di-2. verse world. New York, United Nation Development Program, 2004.
Egypt interim demographic and health survey3. 2003. Calverton, Maryland, ORC Macro, 2004.
Summary of the ICPD programme of action4. . United Nations Population Fund [wesbsite] (http://www.un.org/ecosocdev/geninfo/populatin/icpd.htm, accessed 1 November 2010).
Egypt activities datasheet 2001–02.5. United States Agency for In-ternational Development [wesbsite] (http://www.usaid.gov/pubs/cbj2002/ane/eg/263-020.html accessed 1 November 2010).
John Hopkins University/Center for Communication Program. 6. Egypt’s Gold Star quality program wins clients and com-munities. Communication Impact, November 1998, Number 4 (http://www.jhuccp.org/pubs/ci/4/4.pdf, accessed 18 October 2010).
Best practices in accreditation. Best practices update: Reproduc-7. tive health, family planning and HIV/AIDS. Arlington, Virginia, Advance Africa, 2004.
Greenspan A. Adding choice to the contraceptive mix: les-8. sons from Indonesia. Asia-Pacific Population and Policy, 1991, 19:1–4.
Greenwell KF. Contraceptive method mix menu: providing 9. healthy choices for women. World Health Statistics Quarterly, 1996, 49:88–93.
Brown L et al. Quality of care in family planning services in Mo-10. rocco. Studies in Family Planning, 1995, 26:154–168.
Gilson L, Magomi M, Mkangaa E. The structural quality of 11. Tanzanian primary health facilities. Bulletin of the World Health Organization, 1995, 73:105–114.
Bertrand J. The EVALUATION Project promotes consensus on 12. family planning quality indicators. QA Brief, 1994, 3:6–7.
Askew I, Mensch B, Adewuyi A. Indicators for measuring the 13. quality of family planning services in Nigeria. Studies in Family Planning, 1994, 25:268–283.
Egypt service provision assessment survey 2004.14. Calverton, Maryland, ORC Macro, 2005.
Medical eligibility criteria for contraceptive use, 4th edition
Medical eligibility criteria for contraceptive use reviews the medical eligibility criteria for use of contraception, offering guidance on the safety of use of different methods for women and men with specific characteristics or known medical conditions. The recommendations are based on systematic reviews of available clinical and epidemiological research. It is a companion guideline to Selected practice recommendations for contraceptive use. Together, these documents are intended to be used by policy-makers, programme managers, and the scientific community, to support national programmes in the preparation of service delivery guidelines.
The fourth edition has been fully updated and expanded. It includes over 86 new recommendations and 165 updates to recommendations in the previous edition. To assist users familiar with the third edition, new and updated recommendations are highlighted. Everyone involved in providing family planning services and contraception should have the fourth edition of Medical Eligibility Criteria for Contraceptive Use to hand.
This publication is currently in press but is expected to be available later this month ( January 2011). Further information about this and other WHO publication is available at: http://www.who.int/publications/en/
Book 17-1.indb 10 1/3/2011 1:38:31 PM

املجلد السابع عرشاملجلة الصحية لرشق املتوسطالعدد األول
11
Prevalence, awareness and determinants of contraceptive use in Qatari womenA.A. Arbab,1 A. Bener 2,3 and M. Abdulmalik 4
ABSTRACT We determined the knowledge of, attitude to and practice of contraception and the associated sociodemographic factors among a representative sample 1130 Qatari married women aged 18–49 years. Data were collected by questionnaire. The mean age of the women was 32.5 (SD 7.6) years. The vast majority (94.6%) knew about contraception but of these 1070, only 694 (64.9%) were in favour of contraception. Knowledge of contraception increased with increasing level of education (P < 0.001), but decreased the lower the household income (P = 0.002). Only 511 (47.8%) women were currently using contraceptives, which was significantly associated with age, husband’s age, years of marriage, education level, income level and attitude to family planning. The most commonly known and used contraceptives were intrauterine device and pills. Friends were the most common source of knowledge about family planning method (80.0%).
1Department of Mother Child Health, 4Women Hospital and Hamad Medical Corporation, Doha, Qatar.2Department of Medical Statistics & Epidemiology, Hamad General Hospital and Hamad Medical Corporation, Weill Cornell Medical College, Doha, Qatar (Correspondence to A. Bener: [email protected]; [email protected]).3Department of Evidence for Population Health Unit, School of Epidemiology and Health Sciences, University of Manchester, Manchester, United Kingdom.
Received: 14/05/09; accepted: 27/08/09
معدل انتشار استخدام موانع احلمل لدى النساء الَقَطرّيات ودرجة الوعي هبا، وحمددات استخدامها أمل أبو بكر أرباب، عبد الباري بينري، مريم عبد املالك
ة تضّم ُمَعربِّ يرافقها من عوامل اجتامعية ديموغرافية، يف عينة بمنع احلمل، وما املتعلقة املعارف واملواقف واملامرسات الباحثون َدَرَس اخلالصـة: 1130 من النساء القطريات املتزوجات، وممن تتـراوح أعامرهن بني 18 و49 عامًا. وقد مجع الباحثون املعطيات من خالل استبيان، ووجدوا أن العمر
الوسطي للنساء يبلغ 32.2 عامًا )بانحراف معياري مقداره 7.6(، وكانت معارف معظمهن )94.6%( حول منع احلمل جيدة. إال أن عدد الاليت كّن يؤّيدَن منع احلمل من بني هؤالء النسوة الـ 1070، ملا يتجاوز 694 )أي 46.9%(. ولوحظ أن املعارف حول منع احلمل تزداد بازدياد مستوى التعليم )P <0.001(. يف حني أهنا تتناقص مع انخفاض دخل األرسة )P <0.001(. ومل يتجاوز عدد النسوة الاليت ُكنَّ يستخدمن موانع احلمل يف وقت ُيْعَتدُّ به إحصائيًا بالعمر، وبعمر الزوج، وسنوات الزواج، ومستوى التعليم، ومستوى الدخل، 511 سيدة )47.8%(، ويرتابط ذلك تراُبطًا الدراسة واملوقف املتخذ من تنظيم األرسة. وكانت أكثر وسائل منع احلمل من حيث شيوع املعارف عنها ومن حيث استخدامها هي اللوالب واألقراص.
وكان األصدقاء أكثر مصادر املعلومات شيوعًا حول طرق تنظيم األرسة )%80(.
Prévalence et déterminants de l’utilisation de la contraception et connaissances en la matière chez les femmes qataries
RÉSUMÉ Dans un échantillon représentatif de 1 130 femmes qataries mariées, âgées de 18 à 49 ans, nous avons évalué les connaissances, l’attitude et les pratiques en matière de contraception ainsi que les facteurs sociodémographiques associés. Les données ont été recueillies au moyen d’un questionnaire. L’âge moyen des femmes était de 32,5 ans (E.T. 7,6). La grande majorité (94,6 %) avait des connaissances en contraception mais sur 1 070 femmes, seulement 694 (64,9 %) y étaient favorables. Les connaissances en matière de contraception augmentaient parallèlement au niveau d’instruction (P < 0,001), et diminuaient parallèlement au niveau de revenus du ménage (P = 0,002). Seules 511 femmes (47,8 %) utilisaient alors une méthode contraceptive. Ce pourcentage était étroitement associé à l’âge, l’âge du conjoint, au nombre d’années de mariage, au niveau d’instruction, au niveau de revenus et à l’attitude vis-à-vis de la planification familiale. Les méthodes contraceptives les plus connues et les plus fréquemment utilisées étaient les dispositifs intra-utérins et les pilules. Les amies représentaient la source de connaissances la plus utilisée au sujet des méthodes de planification familiale (80,0 %).
Book 17-1.indb 11 1/3/2011 1:38:32 PM

EMHJ • Vol. 17 No. 1 • 2011 Eastern Mediterranean Health JournalLa Revue de Santé de la Méditerranée orientale
12
Introduction
Family planning assists “families in achieving the number of children desired with appropriate spacing and timing, ensuring optimal growth and development of each family member” [1,2]. Failure to plan a pregnancy can adversely affect the health of the mother, the child and the families as a whole. Family planning can also protect women from high-risk pregnancies, unsafe abortion, reproductive tract in-fection (RTI) and sexually transmitted infections (STIs) including HIV/AIDS [3]. The International Conference on Population and Development (ICPD) defined voluntary family planning serv-ices as a fundamental human right as well as a couple’s right [4,5].
Gaps in reproductive health/family planning and sexual health care account for nearly one-fifth of the worldwide burden of illness and premature death, and one-third of the illness and death among women of reproductive age [5,6]. Large number of pregnancies and short birth interval cause the health risk to rise [7,8]. The total fertility rate (15–49) years in Qatar for the last 2 years was 2.3, but it was 3.4 in 2001 [9]. By reducing the number of pregnancies that women have in their lifetime, the risk of maternal mortality and morbidity is reduced considerably [10].
Education can bring about appro-priate behavioural changes and improve participation in the use of family plan-ning [3]. Free choice and promotion of a wide range of effective contraceptives, including responsible counselling, will improve the quality of reproductive health/family planning services [11]. This will avoid unplanned pregnancies, reduce complications, injury and of ma-ternal mortality could fall by one-fourth [3]. The United Nation Family Planning Association (UNFPA) have stated that 1 in 3 deaths related to pregnancy or childbirth could be avoided if all women had access to voluntary contraceptive
services, that is, some 175 000 women each year could be saved [12].
Johns Hopkins School of Public Health studied the relationship between fertility and contraceptive use of some 100 countries surveyed in the 1990s. Results showed that in countries where contraceptive prevalence is high, the total fertility rate (TFR) is low; where contraceptive prevalence is low, TFR is high [13]. The latest TFRs posted by WHO in the Core Health Indicators database show that there was a large decrease in the TFRs of the countries of the Gulf Cooperation from the 1990s to 2005 [14,15].
Family planning services are sensitive to cultural conditions and background. While these services are available in Qatar, there is little information on their uptake and the use of family planning methods by Qatari women. The aim of this study therefore was to determine the knowledge of and attitudes towards contraceptives , and the determinants of contraceptive use among Qatari women. Such information will be useful to maternal and child health policy-makers for future planning and organi-zation of family planning services.
Methods
Study designThis was a prospective cross-sectional study based in the primary health care (PHC) clinics of Qatar. The survey was conducted only among Qatari married women aged 18–49 years old who had not reached menopause.
Sampling size and sampling procedureIn order to secure a representative sam-ple of the study population, the sam-pling was stratified with proportional allocation according to stratum size. Stratification was based on geographical location. The sample size was deter-mined with the a priori knowledge that the prevalence of family planning in
Qatar is similar to that previous reports [16] (43%) about the married Qatari fe-male population, and allowing an error of 2.5% and 95% confidence limits. Thus the sample size needed to achieve the objectives of our study was estimated to be 1300 subjects.
A multistage stratified cluster sampling design was developed; Qa-tar was divided administratively into 21 primary health centres (PHCs) in terms of number of inhabitants. Then the 11 PHCs visited mostly by Qatari women (8 urban and 3 semi-urban) were selected; the remaining 10 PHCs were excluded from our survey. The 11 selected PHCs represented geographi-cally, east, west, north, south and central locations of the country and hence were representative of the Qatari population. The women were selected by simple ran-dom sampling among married Qatari women aged 18–49 years registered and attending the PHCs for various medical conditions. Qualified nurses and health educators were trained to interview the women and complete a questionnaire. The interviewers explained the purpose of the study to the possible participants and assured the confidentiality of the data; those willing to participate gave verbal informed consent.
The study was carried out from April 2008 to October 2008 after get-ting approval from the Medical Ethics committee of the Hamad Medical Cor-poration. Data collection was carried out according to a schedule for PHC centres in the 7-month period.
Questionnaire and interviewThe instruments used for data collec-tion was designed in English and later translated to Arabic by a professional translator and reviewed for consistency by the investigators. The questionnaire included sociodemographic character-istics of the participant and her husband, followed by items related to socio-economic status, pregnancy history, knowledge of contraception, attitude towards contraception and current use
Book 17-1.indb 12 1/3/2011 1:38:32 PM

املجلد السابع عرشاملجلة الصحية لرشق املتوسطالعدد األول
13
of contraception. The questionnaire also included some items to determine the causes for use and reasons for avoid-ing contraception.
Breastfeeding, withdrawal, safe peri-od and isolation were defined as natural family planning methods. Intrauterine device (IUD) (the loop) is classified as medical methods. Vaginal cream/sup-plement, pills, injectable contraceptives, tubal ligation, condoms and emergency contraceptive were defined as modern methods of family planning.
The questionnaire was pre-tested for validity and reliability. It was tested to check if it was easy for the interview-ers to understand the instructions and flow of questions. Prior to pre-testing in the field, the interviewers underwent training and were provided with instruc-tions about the survey.
Data analysisThe Student t-test was used to ascertain the significance of differences between mean values of 2 continuous variables and the Mann–Whitney test was used for nonparametric distribution. Chi-squared analysis was performed to test for differences in proportions of categorical variables between 2 or more groups. Spearman’s correlation coef-ficient was used to evaluate the strength of concordance between variables. P < 0.05 was considered as the cut-off value for statistical significance.
Results
A total of 1300 Qatari women were approached and 1130 consented to par-ticipate in this study, giving a response rate of 86.9%. Of these, 170 women were excluded, either due to incomplete questionnaires or they excused them-selves before completing the question-naire due to lack of time.
The mean age of the participating women was 32.5 [standard deviation (SD) 7.6] years. Table 1 shows the sociodemographic and basel ine
characteristics of the study sample by knowledge, attitude and practice of fam-ily planning. The majority of the women (1070, 94.6%) reported that they had heard about contraceptives and men-tioned one or more. Women under 25 years of age were more likely to lack knowledge of family planning 28.3% compared to 14.7% in the same age group who knew (P = 0.036). Knowl-edge of family planning was also associ-ated with educational level; knowledge increased with increasing level of educa-tion (P < 0.001). Moreover in the lowest income group, 40% of the women did not know about contraception com-pared with 19.8% who did (P = 0.002).
Of the 1070 women who knew about contraceptives, 376 (35.1%) expressed an unfavourable attitude towards them (Table 1). More women over 40 years were not in favour of contraception compared to those who viewed favour-ably in the same age group: 25.8% versus 17.3% respectively (P = 0.003). The hus-band’s age also played a significant and similar role in the participant’s attitude (P = 0.005). Longer duration of mar-riage was also associated with a negative attitude towards family planning (P < 0.019). Education was also associated with attitude to contraception: more illiterate (12.0%) and primary-school educated (21.5%) women were not in favour of contraception compared to women with secondary school (5.6%) or college (14.8%) education (P < 0.001). Women with a history of abortion were more likely to be against contraception than those with no such history (P < 0.001).
Only 511 women out of the 1070 women who knew about family plan-ning methods were currently using any family planning method (Table 1). The practice of family planning was strongly associated with women aged 30–39 years and husband’s age group between 30–39 years (P = 0.001 and P = 0.017 respectively). The practice was more common among women who had been married for 5–14 years – 44.8% using
contraception compared to 38.3% not using (P < 0.001).
Table 2 gives the factors related to attitude towards and practice of family planning methods. Having a history of abortion was lower among women who were in favour of contraception com-pared with women who were not in fa-vour (33.9% versus 44.7% respectively) (P < 0.001). Significantly more women in favour of and using contraception had husbands also in favour of contra-ception and discussed their choice with their husbands (P < 0.001). Over 80% of the women who were in favour of and using a contraceptive method thought they needed more information on the methods.
Modern methods of family planning (67.7%) were more commonly prac-tised among those who currently use family planning method (Table 3). The use of traditional or natural method was 35.4%. IUDs (32.9%) and pills (30.1%) were the most common specific meth-ods identified while condoms (7.8%), breastfeeding (4.5%), withdrawal (4.5%) and injectable contraceptives (2.7%) were the least common in cur-rent practice with the studied women. Most of the women who currently use contraceptives (71.0%) mentioned child spacing as the most common reason for using them, while very few (17.6%) women did not want have more children. In addition, 10.8% of the women used contraception on a physi-cian’s advice while only 0.6% women use contraception for economic rea-sons. Only 15.9% of the women who currently used contraceptives reported experiencing one or more side effects from the method. The most common complications identified by the women were bleeding (4.1%), severe headache (3.1%), abdominal pain (2.3%) and vaginal discharge (2.0%).
Figure 1 shows knowledge of the type of family planning method among women who had heard of family plan-ning method. Women mostly knew about pills (90.0%) and IUDs (89.1%).
Book 17-1.indb 13 1/3/2011 1:38:32 PM

EMHJ • Vol. 17 No. 1 • 2011 Eastern Mediterranean Health JournalLa Revue de Santé de la Méditerranée orientale
14
Tabl
e 1
Soci
odem
ogra
phic
and
bas
elin
e ch
arac
teri
stic
s of
the
stud
y sa
mpl
e by
kno
wle
dge,
att
itude
and
pra
ctic
e of
fam
ily p
lann
ing
(FP)
Vari
able
Kno
w a
bout
FP
Don
’t kn
ow
abou
t FP
P-va
lue
In fa
vour
of
FPN
ot in
favo
ur
of F
PP
-val
uePr
acti
se F
PD
on’t
prac
tise
FP
P -v
alue
No.
(%)
No.
(%)
No.
(%)
No.
(%)
No.
(%)
No.
(%)
(n=
1070
)(n
= 6
0)
(n =
694
)(n
= 3
76)
(n =
511
)(n
= 5
59)
Age
(yea
rs)
< 25
157
(14.
7)17
(28.
3)10
2 (1
4.7)
55 (1
4.6)
51 (1
0.0
)10
6 (1
9.0
)
25–2
927
3 (2
5.5)
13 (2
1.7)
0.0
3619
5 (2
8.1)
78 (2
0.7
)0
.00
313
8 (2
7.0)
135
(24.
2)0
.00
1
30–3
942
3 (3
9.5)
18 (3
0.0
)27
7 (3
9.9)
146
(38.
8)21
6 (4
2.3)
207
(37.0
)
40–4
921
7 (2
0.3
)12
(20
.0)
120
(17.3
)97
(25.
8)10
6 (2
0.7
)11
1 (19
.9)
Hus
band
’s ag
e (y
ears
)
25–2
920
9 (1
9.5)
17 (2
8.3)
140
(20
.1)69
(18.
4)82
(16.
0)
127
(22.
8)
30–3
945
2 (4
2.2)
19 (3
1.7)
0.0
7531
5 (4
5.4)
137
(36.
4)0
.00
523
4 (4
5.8)
218
(39.
0)
0.0
17
40–4
940
9 (3
8.2)
24 (4
0.0
)23
9 (3
4.4)
170
(45.
2)19
5 (3
8.2)
214
(38.
3)
Year
s mar
ried
< 5
270
(25.
2)21
(35.
0)
185
(26.
7)85
(22.
6)10
1 (19
.8)
169
(30
.2)
5–14
44
3 (4
1.4)
17 (2
8.3)
0.0
9729
8 (4
2.9)
145
(38.
6)0
.019
229
(44.
8)21
4 (3
8.3)
< 0
.00
1
≥ 15
35
7 (3
3.4)
22 (3
6.7)
211 (
30.4
)14
6 (3
8.8)
181 (
35.4
)17
6 (3
1.5)
Educ
atio
nal l
evel
Ill
itera
te84
(7.9
)18
(30
.0)
39 (5
.6)†
45 (1
2.0
)24
(4.7
)60
(10
.7)
Pr
imar
y18
4 (1
7.2)
14 (2
3.3)
< 0
.00
110
3 (1
4.8)
81 (2
1.5)
< 0
.00
186
(16.
8)98
(17.5
)0
.00
2
Se
cond
ary
351 (
32.8
)16
(26.
7)23
9 (3
4.4)
112
(29.
8)17
2 (3
3.7)
179
(32.
0)
C
olle
ge/U
nive
rsity
451 (
42.1)
12 (2
0.0
)31
3 (4
5.1)
138
(36.
7)22
9 (4
4.8)
222
(39.
7)
Empl
oym
ent s
tatu
s
W
orki
ng47
2 (4
4.1)
20 (3
3.3)
317
(45.
7)31
7 (4
5.7)
0.16
124
1 (47
.2)
231 (
41.3
)0
.055
N
ot w
orki
ng59
8 (5
5.9)
40 (6
6.7)
0.10
137
7 (5
4.3)
155
(41.2
)27
0 (5
2.8)
328
(58.
7)
Ave
rage
mon
thly
inco
me
(QR
) a
<
12 0
00
192
(19.
8)20
(40
.0)
113
(17.8
)79
(23.
4)76
(16.
4)11
6 (2
2.8)
12
00
0–2
4 99
947
6 (4
9.0
)20
(40
.0)
0.0
02
313
(49.
3)16
3 (4
8.4)
0.0
7623
0 (4
9.6)
246
(48.
4)0
.025
≥
25 0
00
304
(31.3
)10
(20
.0)
209
(32.
9)95
(28.
2)15
8 (3
4.1)
146
(28.
7)
Inte
rval
bet
wee
n la
st 2
del
iver
ies (
year
s) a
<
1 68
(8.0
)2
(4.8
)46
(8.0
)22
(8.0
)46
(10
.0)
22 (5
.6)
1–
< 2
287
(33.
7)18
(42.
9)0
.417
205
(35.
7)82
(29.
7)0
.213
148
(32.
2)13
9 (3
5.5)
0.0
55
≥
249
6 (5
8.3)
22 (5
2.4)
324
(56.
3)17
2 (6
2.3)
266
(57.8
)23
0 (5
8.8)
His
tory
of a
bort
ion
Ye
s40
3 (3
7.7)
17 (2
8.3)
0.14
623
5 (3
3.9)
168
(44.
7)<
0.0
01
182
(35.
6)22
1 (39
.5)
N
o66
7(62
.3)
43 (7
1.7)
459
(66.
1)20
8 (5
5.3)
329
(64.
4)33
8 (6
0.5
)0
.186
a Valid
per
cent
age
show
n. Q
R =
Qat
ari r
iyal
s
Book 17-1.indb 14 1/3/2011 1:38:32 PM

املجلد السابع عرشاملجلة الصحية لرشق املتوسطالعدد األول
15
Only 25% knew about injectable con-traceptives, 17.1% about withdrawal, 15.9% about condoms and 11.3% about the safe period.
Friends were the most common source of knowledge about family planning methods among the women (80.0%), followed by physicians (35.8%) and relatives (34.8%). Health workers (12.6%), teachers (2.7%) and husband (0.9%) were uncommon sources of knowledge about family planning.
On the other hand, women who were not currently using any family planning method either wanted to have more children (34.5%) or believed that contraceptives have major side-effects (14.7%). Some women did not use contraceptive methods because of their husband’s objection (7.0%) or for medical reasons (6.4%). Few women who did not use contraceptives consid-ered it to be against their religious beliefs (3.0%) (Figure 2).
Discussion
Our study shows that the vast major-ity of women (1070, 94.6%) had heard about family planning methods and knew one or more method; intrauterine device and pills (30.1%) were the two methods most commonly known and
Table 2 Factors related to attitude and practise of family planning (FP)
Variable In favour of FP Not in favour of FP
P-value Practise FP Do not practise FP
P-value
No. (%) No. (%) No. (%) No. (%)
(n = 694) (n = 376) (n = 511) (n = 559)
History of abortion 235 (33.9) 168 (44.7) < 0.001 182 (35.6) 221 (39.5) 0.186
Have a child who died 21 (3.0) 15 (4.0) 0.404 19 (3.8) 17 (3.3) 0.667
Husband in favour of FP 598 (86.2) 141 (37.5) < 0.001 453 (88.6) 286 (51.2) < 0.001
Think it is right for married couple to decide how many children to have according to their economic situation 457 (65.9) 178 (47.3) < 0.001 342 (66.9) 293 (52.4) < 0.001
Discuss the choice of contraceptive method with husband 631 (90.9) 196 (52.1) < 0.001 479 (93.7) 348 (62.3) < 0.001
Think there is a need for more information on contraceptive methods 575 (82.9) 218 (58.0) < 0.001 412 (80.6) 381 (68.2) < 0.001
Table 3 Type of family planning (FP) method used, reasons for use, complications faced among women who practise FP (n = 511)
Variable %
FP method a
Injectable 2.7
Withdrawal 3.7
Breastfeeding 4.5
Condom 7.8
Tubal ligation 10.4
Pills 30.1
Intrauterine device (loop) 32.9
At least one natural method 35.4
At least one modern method 67.7
Reasons for using current FP method a
Economic 0.6
Physician’s advice 10.8
Do not want to have children 17.6
For child spacing 71.0
History of side-effects
Reduced breast milk 0.2
Back pain 0.2
Irregular period/absence of period 0.2
High blood pressure 0.2
Anxiety 0.4
Intrauterine device rejection 0.4
Nervous/heart palpitation 1.0
Got pregnant 1.2
Nausea and vomiting 1.4
Obesity 2.0
Vaginal discharge 2.0
Abdominal pain 2.3
Severe headache 3.1
Bleeding 4.1Any side-effect 15.9
aMultiple answers were accepted thus percentages do not add up to 100.
Book 17-1.indb 15 1/3/2011 1:38:32 PM

EMHJ • Vol. 17 No. 1 • 2011 Eastern Mediterranean Health JournalLa Revue de Santé de la Méditerranée orientale
16
used. The knowledge of family planning was associated with education level, increasing with increasing level of edu-cation. This is consistent with a previous reported studies in the Middle-East re-gion among Arabs [6,15–19]. Women with secondary education (32.8%) or those with college/university educa-tion (42.1%) were more likely to know about family planning compared with women with lower educational levels. Furthermore, fewer women with lower
monthly household income knew about contraceptives than those with higher income.
As regards use of family planning, illiterate women were the least likely to practise any family planning method and women with university or college education constituted the majority of the sample that were currently using any family planning method. Family plan-ning was more common among women with higher household income which is
in agreement with studies reported in Jordan [6], Oman [15] and Turkey [17].
The number of clients with no children was very low. Considering the importance of contraception be-fore a first pregnancy, the reasons why this group does not make use of the public family planning services needs to be determined. More emphasis on this area may be needed during pre-marital counselling. While premarital
Figure 1 Knowledge of type of family planning method among women who had heard of family planning: multiple answers were accepted thus percentage do not add to 100% (n = 1070)
Figure 2 Reasons for not using any family planning method among participants who currently do no use any family planning method: multiple answers were accepted thus percentage do not add to 100% (n = 559)
Book 17-1.indb 16 1/3/2011 1:38:33 PM

املجلد السابع عرشاملجلة الصحية لرشق املتوسطالعدد األول
17
References
Fisher AA et al. 1. Handbook for family planning operations re-search design, 2nd ed. New York, Population Council, 1991.
Leke RJI. 2. Family planning in Africa south of the Sahara. Geneva Foundation for Medical Education and Research (www.gfmer.ch/Books/Reproductive_health/Family_planning_Africa.html, accessed 18 October 2010).
Moronkola OA, Ojediran MM, Amosu A. Reproductive health 3. knowledge, beliefs and determinants of contraceptives use among women attending family planning clinics in Ibadan, Nigeria. African Health Sciences, 2006, 6:155–159.
Fertility and Contraceptive Use. UNICEF Statistics (4. http://un-stats.un.org/unsd/demographic/products/Worldswomen/Gender%20statistics%20sources.htm, accessed 11 November 2010).
UNFPA State of World Population 2004: Reproductive Health 5. and Family Planning (www.unfpa.org/swp/2004/english/ch6/index.htm, accessed 18 October 2010).
Sueyoshi S, Al-Khozahe HO, Ohtsuka R. Effects of reproduc-6. tion norms on contraception practice among Muslim women in Amman, Jordan. European Journal of Contraception & Repro-ductive Health Care, 2006, 2006, 11:138–145.
Obuekwe IF, Marchie CL. Family planning: a possible inter-7. vention in maternal mortality. The regional Institute; 25th Congress of the Medical Women’s Association (www.regional.org.au/au/mwia/papers/full/33_flossy1.htm, accessed 18 October 2010).
Population Resource Center website. Executive summary: ma-8. ternal mortality and morbidity (http://www.prcdc.org/files/Maternal_Mortality.pdf, accessed 11 November 2010).
Annual Heatlh Report for the year 2009, Department of Epi-9. demiology & Medical Statistics, Hamad Medical Corporatiojn, July 2010.
Ronsmans C, Campbell O. Short birth intervals don’t kill 10. women: evidence from Matlab, Bangladesh. Studies in Family Planning, 1998, 29:282–290.
Atighetchi D. The position of Islamic tradition on contracep-11. tion. Medicine and Law, 1994, 13(7–8):717–725.
Dharmalingam A, Morgan SP. Pervasive Muslim-Hindu fertility 12. differences in India. Demography, 2004, 41:529–545.
Family planning for the future13. . Baltimore, Johns Hopkins School of Public Health, 1999 (Population Reports, Volume XXVII, Number 2) (Series J, Number 49) (www.infoforhealth.org/pr/j49/j49chap11.shtml, accessed 18 October 2010).
WHO Statistical Information System (WHOSIS). Core health 14. indicators (www.who.int/whosis/database/core/core_se-lect.cfm, accessed 18 October 2010).
Al Riyami A, Afifi M, Mabry RM. Women’s autonomy, educa-15. tion and employment in Oman and their influence on contra-ceptive use. Reproductive Health Matters, 2004, 12:144–154.
Al-Jaber K, Farid SM. 16. Qatar Family Health Survey, 1998. Doha, Qatar Ministry of Health.
Cindoglu D, Sirkeci I, Sirkeci RF. Determinants of choosing 17. withdrawal over modern contraceptive methods in Turkey.
counselling is not mandatory in Qatar it is shortly be introduced. Premarital counselling is one of the important measures which can help reduce the incidence of genetic diseases and can contribute to a healthier and happier married life.
It has been shown that the rate of discontinuation is higher among women who have not been adequately counselled about side-effects. Similar observations have been reported from other developing countries such as Pa-kistan [18] in Islamic Republic of Iran [19] in Botswana and Tanzania [20]. In a study among Pakistani rural women [16], a positive attitude towards con-traception was found among (76%) of the women, while 41% stated their hus-bands’ had a positive attitude towards contraception; this is consistent with in our study although higher.
Fertility transition in Arab countries occurred when the use of modern con-traceptives was sanctioned by Islam.
Several legal opinions in Islamic juris-prudence on contraception indicate that Islam approves contraception use including the non-permanent modern methods [6,21–24]. Previous reported studies have also explained the contra-ception practices among Arab women in the context of Islam. In brief, Arab women tended to avoid the use of con-traception unless they had decided they had had a sufficient number of children, particularly at a certain age, and to let God decide on the ideal number of children. In addition, men play a signifi-cant role in determining childbearing [22]. These sociocultural norms explain women’s inconsistent behaviours (i.e. not wanting more children but not practising contraception) and the low ef-fectiveness of contraception (e.g. short duration and/or high discontinuation rate of contraception use) [23,24].
The women who were in favour of family planning methods were likely also to be currently using contraception.
Moreover most of the women in favour of contraception believed that it was right for married couples to decide on how many children to have according to their economic situation and almost half of those not in favour also held this believe; this is consistent with previous reported studies [21–24].
Conclusions
Our results show that the knowledge of contraception was high among the women interviewed (95%) although only a small majority had a positive attitude to it (61%) and only minor-ity (albeit a large minority) used contraception. Our research sug-gests that educational programmes are important to teach how family, individual, cultural and relationship environments influence decision-making about contraceptive use and child spacing.
Book 17-1.indb 17 1/3/2011 1:38:33 PM

EMHJ • Vol. 17 No. 1 • 2011 Eastern Mediterranean Health JournalLa Revue de Santé de la Méditerranée orientale
18
European Journal of Contraception & Reproductive Health Care, 2008, 13:412–421.
Mustafa R, Afreen U, Hashmi HA. Contraceptive knowledge, 18. attitude and practice among rural women. Journal of the Col-lege of Physicians and Surgeons--Pakistan, 2008, 18:542–545.
Simbar M et al. Quality assessment of family planning services 19. in urban health centers of Shahid Beheshti Medical Science University, 2004. International Journal of Health Care Qual-ity Assurance Incorporating Leadership in Health Services, 2006, 19:430–442.
Miller K et al., eds. Indicators20. of readiness and quality: basic findings. Clinic-based family planning and reproductive health services in Africa: Findings from situation analysis studies. New York, Population Council, 1998:31–85.
Musallam BF. Why Islam permitted birth control. 21. Arab Studies Quarterly, 1981, 3:181–197.
Petro-Nustas W. Men’s knowledge of and attitudes toward 22. birth spacing and contraceptive use in Jordan. International Family Planning Perspectives, 1999, 25:181–185.
Sueyoshi S, Ohtsuka R. Effects of polygyny and consanguinity 23. on high fertility in the rural Arab population in South Jordan. Journal of Biosocial Science, 2003, 35:513–526.
Sueyoshi S, Ohtsuka R. Ineffective contraceptive use and its 24. causes in a natural fertility population in southern Jordan. Hu-man Biology, 2004, 76:711–722.
Selected practice recommendations for contraceptive use
Selected practice recommendations for contraceptive use (second edition) is one of two evidence-based cornerstones of the World Health Organization’s new initiative to develop and implement evidence-based guidelines for family planning. The first cornerstone, the Medical eligibility criteria for contraceptive use, 4th edition is about to be published, and offers guidance on the safety of use of different methods. Selected practice recommendations for contraceptive use provides guidance for how to use contraceptive methods safely and effectively once they are deemed to be medically appropriate. The document provides selected practice recommendations based on the best available evidence and is intended to be used by policy-makers, programme managers, and the scientific community. It aims to provide guidance to national family planning/reproductive health programmes in the preparation of guidelines for service delivery of contraceptives.
Further information about this and other WHO publication is available at: http://www.who.int/publications/en/
Book 17-1.indb 18 1/3/2011 1:38:33 PM
املجلد السابع عرشاملجلة الصحية لرشق املتوسطالعدد األول
19
Quality of care for obstetric emergencies in 4 general hospitals in Egypt: an observational study of delays in receiving care and blood bank services K.H. Nada,1 A.A. Barakat 1,2 and R.Gipson 1
ABSTRACT A lack of available blood contributes to 16% of all maternal deaths in Egypt. This study aimed to assess the quality of care for obstetric emergencies in 4 general hospitals in Egypt over a 6-month period with the focus on delays in receiving care and blood bank services. Observations were made of the processes and delays in the clinical setting, from the start of each patient’s complaint until discharge, and the receipt and filling of orders for blood at the blood bank. Patients failed to recognize danger signs. Lack of transportation, incorrect choice of provider or facility and unclear referral systems added further delays. Delays occurred in hospital admission, assessment of patients, initiation of resuscitation, initiation of medical or surgical interventions, ordering blood, receipt of blood and administration of blood to patients. The blood ordering procedures were substandard. Lack of blood availability had multidisciplinary causes.
1Egypt Healthy Mother/Healthy Child Project, John Snow Inc., Cairo, Egypt.2Department of Public Health, University of Cairo, Cairo, Egypt (Correspondence to A.A. Barakat: [email protected]).
Received: 21/03/09; accepted: 26/07/09
الرعاية تلقي التأخر يف الطارئة يف أربع مستشفيات عامة يف مرص: دراسة مالحظة حول التوليدية يف احلاالت الرعاية جودة وحول خدمات بنك الدم
خالد حسن ندا، عبري عبده بركات، رجيينالد جيبسون
اخلالصة: يؤدي عدم توافر الدم إىل وقوع 16% من جممل وفيات األمهات يف مرص. وهتدف هذه الدراسة إىل تقييم جودة الرعاية التوليدية يف احلاالت الطارئة يف أربع مستشفيات عامة يف مرص، لفتـرة 6 أشهر، مع التـركيز عىل التأخري يف تلقي الرعاية وخدمات بنك الدم. وقد تم تسجيل مالحظات ر احلاصل يف املواقع الرسيرية، منذ بدء شكوى املريضة حتى خروجها، ومنذ استالم واستيفاء طلبات الدم يف بنك الدم. حول التدابري املتخذة والتأخُّم اخلدمة الصحية أو مرافق هذه اخلدمة، وعدم وقد أخفقت املريضات يف التعرف عىل عالمات اخلطورة. وأدى سوء املواصالت، وسوء اختيار مقدِّر، يف إدخال املريضات إىل املستشفى، ويف تقييم حالتهن، ويف بدء اإلنعاش، ويف وضوح نظم اإلحالة إىل إطالة فتـرات التأخري. ومتثَّلت مواقع التأخُّاملستوى الدم دون إجراءات طلب للمريضات. وكانت إعطائه الدم، ويف الدم، ويف احلصول عىل اجلراحية، ويف طلب أو الطبية التدخالت بدء
املعياري. ويعود عدم توفر الدم إىل أسباب تعود لنظم متعددة.
Qualité des soins obstétricaux d’urgence dans quatre hôpitaux généraux d’Égypte : étude d’observation sur les retards dans l’administration des soins et la mise en œuvre des services de la banque de sang
RÉSUMÉ Le manque de sang disponible contribue pour 16 % au taux de mortalité maternelle toutes causes confondues en Égypte. La présente étude vise à évaluer la qualité des soins obstétricaux d’urgence dans quatre hôpitaux généraux d’Égypte sur une période de six mois, avec une attention particulière pour les retards dans l’administration des soins et la mise en œuvre des services de la banque de sang. Des observations ont été effectuées sur les processus des soins et les retards dans leur administration en établissements de soins, à partir de l’apparition du motif de consultation des patientes jusqu’à leur sortie de l’établissement de soins, et sur la réception des demandes de sang à la banque de sang et leur exécution. Les patientes n’identifiaient pas les signes de danger. La carence des transports, le choix inadapté d’un prestataire ou d’un établissement et des systèmes peu clairs d’orientation-recours contribuaient à accroître les retards. Des retards se sont produits dans l’admission à l’hôpital, l’examen des patientes et la mise en œuvre d’un protocole de réanimation, mais aussi dans l’instauration d’interventions médicales ou chirurgicales, la demande de sang, la réception et l’administration du sang aux patientes. Les procédures de demande de sang n’étaient pas conformes aux normes. La disponibilité insuffisante du sang avait des causes pluridisciplinaires.
Book 17-1.indb 19 1/3/2011 1:38:33 PM

EMHJ • Vol. 17 No. 1 • 2011 Eastern Mediterranean Health JournalLa Revue de Santé de la Méditerranée orientale
20
Introduction
The World Health Organization (WHO) estimates that 515 000 women die each year from pregnancy-related causes, and almost all of these deaths occur in developing countries [1]. In Egypt, despite the decline in maternal mortality from 174/100 000 live births in 1992–93 to 84/100 000 live births in 2000 [2], haemorrhage is still the leading direct cause of maternal mortality and is associated with 38% of all maternal deaths. In the case of either antepartum or postpartum haemorrhage, timely receipt of blood, blood products or vol-ume expanders is required in order to save lives. The lack of available blood has been estimated to contribute to 16% of all maternal deaths in Egypt [2].
As the time from the onset of haem-orrhage to death in pregnant women is often short, WHO recommends that intravenous fluids should be available at all levels of the health care system, and that blood transfusion services should be available at all times in hospitals [3]. This study aimed to assess the quality of care for obstetric emergencies in 4 general hospitals in Egypt with the focus on delays in receiving care and blood bank services.
Methods
The study used quantitative methods to collect data on emergency obstetric care in 4 general hospitals in Egypt.
Study sites and sampleThe study was conducted in the general hospitals in the 4 governorates where the Egypt Healthy Mother/Healthy Child project was active: Sohag, Assiut, Minya and Giza. All pregnant women presenting to the study hospitals during the observation sessions who needed immediate blood transfusion, or for whom blood transfusion was anticipat-ed based on a clinical assessment, were included in the study.
Data collectionData collection started from the be-ginning of March 2003 and lasted for 6 months. Initially an assessment was made of each facility’s blood banks and general blood supply. Then for each woman needing blood transfusion at the study hospitals an analysis was conducted on the different processes involved from the start of the patient’s complaint until her discharge.
Three teams of 2 researchers con-ducted the clinical and blood bank ob-servations in parallel. In each pair one researcher, stationed at the hospital, interviewed patients about events before arrival at the hospital and observed the handling of emergency obstetric cases in the clinical setting. The second research-er, stationed at the hospital blood bank, observed the receipt and filling of orders for blood. All observations in were done in 8-hour shifts covering both day and night and all days of the week including weekends and public holidays.
ToolsAll data collection tools were revised and piloted before data collection started.
Clinical eventsA datasheet was used to record the clini-cal events for each woman admitted as an obstetric emergency. This included a structured questionnaire to interview the patient or her relatives to document basic demographic data and events oc-curring before and after arrival at the hospital: the decision to seek care (how long after the problem started was care sought, reasons for choice of provider); and details about transport to the facility (type of transport, time taken).
A checklist was used for direct ob-servation of all activities occurring in the clinical setting: admission proce-dures (time of admission, time when first examined by physician, time when diagnosis was completed and treatment started); diagnosis (diagnosis recorded by hospital staff on admission, diagno-sis recorded by researcher); surgical/
medical interventions (whether need-ed, whether intervention followed the agreed protocol; what interventions were done, when started, indications for blood transfusion, whether transfusion followed agreed protocols); and labora-tory tests (history taken, tests ordered, whether tests were appropriate, when results were received).
All steps related to ordering, prepa-ration and delivery of blood were docu-mented: blood transfusion (whether indicated according to protocol, wheth-er the blood/blood products ordered were the most rational choice for the clinical condition of the patient, and whether the timing and procedures for ordering blood/blood products could have been changed to improve the clinical outcomes). Each order of blood during the data collection period was followed step-by-step and timed.
Blood bank activitiesAnother datasheet was used to record blood bank activities. The first section was observations in the blood bank: timing of all stages in the blood orders (order received, action taken, blood sample received, blood group deter-mined; cross-matching completed, blood unit despatched); procedures and personnel involved in making the order; problems with orders and actions taken; types of blood product ordered; and inspection of orders.
The second section was observa-tions of the donation process (if appli-cable): timing of all stages in donation; why and who requested donation; do-nor counselling and consent; screening of donors; procedures and personnel involved in the donation process.
Research teamData collection required judging the clinical performance of providers, which necessitated a highly trained observa-tion team. Observations in the clinical setting were conducted by assistant lecturers in gynaecology and obstetrics and the blood bank observations were
Book 17-1.indb 20 1/3/2011 1:38:34 PM

املجلد السابع عرشاملجلة الصحية لرشق املتوسطالعدد األول
21
conducted by blood bank specialists. To minimize subjectivity on behalf of observers, standard Ministry of Health and Population protocols and guide-lines were used as a benchmark to judge clinical and blood bank performance [4,5]. The researchers were intensively trained on the objectives, methods and data collection tools, observation meth-ods, case inclusion criteria, guidelines for appropriate use of blood and blood components, standard management of relevant cases, standard information on blood donation, qualitative research, glossary of relevant definitions and logis-tical arrangements. This was designed to minimize observer bias.
Ethical considerationsObservers did not interfere in cases even where they were aware of negligence that might result in harm to the patient. This was done for the sake of the validity of research results. However, all remarks were communicated to managers and decision-makers in the hospitals, in order to guide the process of quality improvement inside the hospitals in-cluding prevention of recorded delays and harmful practices.
AnalysisData validation of the completed forms and the computer data base took place. Epi-Info, version 6.04 was used for data entry and analysis.
Study populationThe total number of women observed in the 4 hospitals was 102. The majority of patients presented to hospital either for delivery (50%) or suffering from bleeding (38%) or other complications.
The mean age of the women was 26.6 [standard deviation (SD) 6.5] years. Nearly three-quarters (73%) came from rural areas. A high propor-tion of women were illiterate (63%) and 13% could only read and write. Almost all (97%) were working as housewives, while 36% of husbands were unskilled manual workers and 52% skilled manual
workers. Participants had a mean parity of 2.3 (SD 0.4).
Delays in attending hospital Choice of providerPatients included in the present study lived on average 16.6 km (SD 4.5) away from the general hospital. Before com-ing to the hospital, 18% of the women reported being seen at home by a health care provider. In most cases, the home visits were performed by a daya (tradi-tional birth attendant). A further 31% of women sought care at the provider’s own facility (usually a private clinic) rather then being seen at home; these providers referred them to the general hospital. The remaining majority of the respondents sought care directly at the general hospital.
The most frequent reason men-tioned for their choice of any health care provider was the provider’s proximity to their home (55%). Among those who sought care directly at the general hospi-tal, one-third (32%) went because it was the nearest hospital, and only 6% went because they believed that they would receive good medical care there.
Patients’ transportAlmost all patients coming to the hospital had made their own transport arrangements. An ambulance was called in only 5 cases; in 4 cases it was called by a relative or neighbour, while in 1 case transport was arranged by a dis-trict hospital. Thus of the 23 women referred from a public facility to the general hospital because of an obstetric emergency, all but 1 was left to arrange for her own means of transportation. The most commonly used means of transport were taxi (67% of cases) or pick-up truck (22%) (where the patient lies in the open bed of the truck).
Time spent from decision to seek care until arrival at general hospitalThe time reported by patients from rec-ognizing the seriousness of the condition until the decision to seek care was only 56 minutes on average. However, when
the time spent travelling and attending other providers before finally reaching the general hospital were included, the average time from the decision to seek care until reaching the hospital was 3 hours 25 minutes (Figure 1).
Delays in admissionRegistrationRegistration of patients on arrival at the hospital required an identification docu-ment for the patient or someone accom-panying her (for 1 patient the husband had to return home to retrieve it).
Time spent from registration until decision to admitPatients arriving at the hospital had to wait on average 20 minutes to be registered by the hospital clerk. The av-erage time taken from registration until a physician examined the patient was 26 minutes. In 21% of cases the patient arrived at the hospital and was exam-ined first before a decision was taken to admit the patient and register the case. The average total time of both steps was 46 minutes, regardless of which occurred first.
Delays in initial assessmentInitial assessment and resuscitationRelevant vital signs were checked in only 62/102 (62%) of the study cases. Resuscitation was needed for 61 women (61%) and was done for 57/61 (93%) of them. The most common resuscita-tion measure was initiating a crystalloid intravenous drip (98%); other measures were emptying the bladder with a Foley catheter (35%) or oxygen administra-tion (16%). Medical supplies needed for resuscitation were generally avail-able, with a few exceptions. Colloids were available in only 1 hospital, but were never observed in use.
Time spent from initial assessment until intervention startedThe time between the physician first examining the patient until a medical or surgical intervention was started was approximately 3 hours. In some of cases
Book 17-1.indb 21 1/3/2011 1:38:34 PM

EMHJ • Vol. 17 No. 1 • 2011 Eastern Mediterranean Health JournalLa Revue de Santé de la Méditerranée orientale
22
(39.8%) the time spent was justified, but in 61/102 cases (60%) the long time interval could not be justified on medi-cal grounds by expert obstetricians.
Delays in anaesthesia and laboratory investigationsAnaesthesia was needed in 77/102 cases (76%), but was immediately avail-able in less than half of these (35/77, 45%). For cases where anaesthesia was needed, but not immediately available, an anaesthetist was called for only 80% of cases. According to the clinical judge-ment of the researchers anaesthesia was delayed to the extent that it contributed to patient morbidity in 32% of the cases where it was needed.
Laboratory investigations were judged by the expert obstetricians to be needed for proper clinical decision-making in 69 cases (68%). However, laboratory investigations were actually performed for just over half of these (40/69, 58%). In 21% of cases where laboratory inves-tigations were done the investigations were judged by obstetricians to be inap-propriate for the patient’s condition and in 26% the results were delayed to the extent of rendering them useless for clini-cal decision-making or were judged by the expert obstetricians to have delayed the decision-making process itself.
Sonography was available in all 4 hospitals, but in 1 hospital the sonar room was locked after working hours.
Delays in ordering blood for transfusionReservation of bloodAccording to the treating physician’s diagnosis, 16 cases warranted immedi-ate blood transfusion. Of these cases, immediate transfusion was ordered in 10 cases (63%), provisional reservation was ordered in 2 (13%) and no blood was reserved in 4 (25%). A further 85 cases were judged to need provisional reservation of blood. Of these, immedi-ate transfusion was ordered for 6 (7%), provisional reservation was ordered for 38 (45%) and no blood was reserved for 41 (48%).Fi
gure
1 F
low
ana
lysi
s of
tim
e sp
ent f
rom
com
plic
atio
n oc
curr
ing
unti
l firs
t exa
min
atio
n by
a p
hysi
cian
for a
ll pa
tien
ts p
rese
ntin
g (n
= 1
02)
Only whole or fresh whole blood was ordered, except in 1 case where packed red blood cells were ordered. A total of 48/56 (86%) of orders were for only 1 unit of blood. The blood product ordered was the first choice for the clinical condition according to the agreed protocol for 75% of 56 patients for whom blood was ordered. A history of previous transfusion or transfusion reaction was taken for only 4 of the cases for whom blood was ordered, and it was recorded in the patient’s records in 2 of them. In only 7 cases was the reason for transfusion recorded.
A request form was not used for any of cases in which blood was ordered. In-stead, the patient’s file was sent, usually with a sample in a syringe (64%). A third of the samples sent had no information written on them at all and most of the remainder had either the first name only or the first and family name written. In a few cases the department name or patient number was written as well. In 1 case the name was written incorrectly, but fortunately the blood bank nurse discovered the mistake. Information on the sample was compared with data in the patient’s file in less than a third of the samples sent to the blood bank.
After the order of blood was made, no communication between the treat-ing physicians and the blood bank took place, with 1 exception (1/56) (in which the communication was considered inadequate by the researcher).
Time spent from initial assessment until blood orderedThe average time from the physician first examining the patient until blood was ordered was on average 1 hour 20 minutes for all cases for which blood was requested. Interestingly, the aver-age time between the first examination and the time when blood was ordered was lower for the patients for whom provisional reservation of blood was ordered (1 hour 45 minutes) (Figure 2) than for the patients for whom immediate transfusion of blood was ordered (40 minutes) (Figures 3).
6 h
20 m
in56
min
3 h
25 m
in20
min
26 m
inTi
me
from
com
plic
atio
n oc
curr
ing
Tim
e fro
m c
ompl
icat
ion
occu
rrin
g un
til p
atie
nt’s
deci
sion
to se
ek c
are
Tim
e fro
m d
ecis
ion
to se
ek c
are
until
pa
tient
reac
hed
hosp
ital
Tim
e fro
m a
rriv
al
until
regi
stra
tion
Tim
e fro
m
regi
stra
tion
until
pa
tient
exa
min
ed
Tim
e fro
m st
art o
f del
iver
y (o
r sta
rt o
f com
plai
nt) u
ntil
patie
nt re
ache
d ho
spita
l: 10
h 4
1 min
Tim
e fro
m c
ompl
icat
ion
occu
rrin
g un
til p
atie
nt w
as e
xam
ined
: 5 h
7 m
in
Book 17-1.indb 22 1/3/2011 1:38:34 PM

املجلد السابع عرشاملجلة الصحية لرشق املتوسطالعدد األول
23
Figu
re 3
Flo
w a
naly
sis
of ti
me
spen
t fro
m c
ompl
icat
ion
occu
rrin
g un
til b
lood
tran
sfus
ion
was
com
plet
ed fo
r pat
ient
s w
here
imm
edia
te tr
ansf
usio
n of
blo
od w
as in
dica
ted
acco
rdin
g to
pro
toco
l (n
= 16
)
Figu
re 2
Flo
w a
naly
sis
of ti
me
spen
t fro
m p
atie
nt re
gist
rati
on u
ntil
bloo
d tr
ansf
usio
n w
as c
ompl
eted
for p
atie
nts
for w
hom
pro
visi
onal
rese
rvat
ion
of b
lood
was
ord
ered
(n =
85)
Time spent from order for blood until blood arrival at the hos-pitalThe average time from ordering blood for immediate transfusion until the blood arrived at the hos-pital was 50 minutes (Figure 4). In cases of provisional reservation of blood the time interval was 2 hours 5 minutes (Figure 2). This time interval included the time needed for donation by relatives or friends in cases of shortage of the needed blood group (donation took place for 19 patients). It also included the time for serological testing of the donated blood (using the rapid method).
In 1 case blood had to be pur-chased from the regional blood bank by the patient’s relatives (due to the lack of the blood group in the hospital). They brought it in a plastic bag surrounded by ice cubes. It took 1 hour 40 minutes from the time they were asked to buy blood until it was brought to the patient.
Delays in administering blood Transfusion of bloodOf a total of 56 orders, only 22 (40%) were brought to the clinical setting. Of the received blood 2/22 orders (9%) were not administered to the patient and were wasted since blood banks follow a non-return policy for blood units dispatched for more than 30 minutes. The blood unit was not properly inspected before administration for any of the cases. The patient’s identity was checked against the blood unit in only 40% of the orders.
Physicians did not record base-line information related to transfu-sion for any of the patients, except in 1 case. None of the patients were given assurances about the procedure or asked for their con-
26 m
in1
h 45
min
2 h
5 m
in1
h 10
min
2 h
19 m
in
Tim
e fro
mre
gist
ratio
n un
til p
atie
nt w
as
exam
ined
Tim
e fro
m e
xam
inat
ion
until
or
der f
or b
lood
was
mad
eTi
me
from
ord
er fo
r blo
od m
ade
until
it a
rriv
edTi
me
from
blo
od a
rriv
al u
ntil
it w
as a
dmin
iste
red
to th
e pa
tient
Tim
e fro
m tr
ansf
usio
n st
arte
d un
til it
was
co
mpl
eted
Tim
e fro
m w
hen
patie
nt w
as fi
rst e
xam
ined
unt
il bl
ood
was
adm
inis
tere
d: 4
h
4 h
26 m
in15
min
2 h
23 m
in15
min
23 m
in34
min
6 m
in56
min
26 m
in57
min
Tim
e fro
m c
ompl
icat
ion
occu
rrin
gTi
me
from
co
mpl
icat
ion
occu
rrin
g un
til p
atie
nt’s
deci
sion
to
seek
car
e
Tim
e fro
m d
ecis
ion
to se
ek c
are
until
pa
tient
reac
hed
hosp
ital
Tim
e fro
m
arriv
al u
ntil
regi
stra
tion
Tim
e fro
m
regi
stra
tion
until
pat
ient
ex
amin
ed
Tim
e fro
m
exam
inat
ion
until
nee
d fo
r bl
ood
was
es
tabl
ishe
d
Tim
e fro
m
need
for
bloo
d de
cide
d un
til
orde
r for
bl
ood
mad
e
Tim
e fro
m o
rder
fo
r blo
od m
ade
until
it a
rriv
ed
Tim
e fro
m
bloo
d ar
rival
un
til it
was
ad
min
iste
red
Tim
e fro
m
tran
sfus
ion
star
ted
until
it
was
com
plet
ed
Tim
e fro
m d
eliv
ery
or st
art o
f com
plai
nt u
ntil
reac
hing
hos
pita
l: 7
h 4
m
inTi
me
from
exa
min
atio
n un
til b
lood
was
ad
min
iste
red
: 2 h
2 m
in
Tim
e fro
m c
ompl
icat
ion
occu
rrin
g un
til p
atie
nt w
as e
xam
ined
: 3 h
16 m
in
Tim
e fro
m c
ompl
icat
ion
occu
rrin
g un
til b
lood
tran
sfus
ion
star
ted:
5 h
19 m
in
Book 17-1.indb 23 1/3/2011 1:38:34 PM

Eastern Mediterranean Health JournalLa Revue de Santé de la Méditerranée orientale
24
EMHJ • Vol. 17 No. 1 • 2011
Figu
re 4
Flo
w a
naly
sis
of ti
me
spen
t fro
m c
ompl
icat
ion
occu
rrin
g un
til b
lood
tran
sfus
ion
was
com
plet
ed fo
r pat
ient
s w
ho re
ceiv
ed im
med
iate
tran
sfus
ion
of b
lood
(n =
13)
sent, and only 40% of conscious patients were instructed to report any unusual symptoms.
The administered blood was judged to have been given too rapidly in 90% of cases, and patient monitoring in the first 15 minutes was only done in 30% of the cases. There was no system in place to report transfusion reac-tions in any of the study facilities.
Time spent from blood arrival at hospital until administered to patientOnce the blood reached the clinical setting, the average time taken until it was administered to patients for whom immediate transfusion was ordered was on average 39 minutes (n = 13) (Figure 4). In cases in which blood was only reserved and then later administered to the patient it was 1hour 10 minutes (Figure 2).
Time spent from start of transfusion until completionOnce the blood was ready for administration, the time from the start of transfusion till its completion was 56 minutes in cases where immediate blood transfusion took place (Figure 4). In cases where blood was initially reserved, transfusion took longer and was completed in 2 hours 19 minutes (Figure 2).
OutcomesOne woman died and, in the researcher’s judgement, delay in receiving blood was a contributing factor. Thus maternal mortality was the outcome in 1% of emergency obstetric cases compared with less than 0.2% in the other admitted patients.
Discussion
Key factors in the total delay in handling obstetric emergencies in this study was the delay in attending hospital due to women’s initial choices of care provider and inadequate transport facilities. While one-third of women (32%) came directly to the hospital because it was the nearest provider, only 6% believed they would receive good medical care there. This perception of poor quality of care provided at the general hospitals was likely to be a factor in the delay in seeking care. This acts both directly through prolonging the time until the decision to seek care is taken and indirectly through the decision to go to other providers who are not equipped to handle these emergencies. Barnes-Jasiah et al. identified confidence in the medical services as a crucial factor in delaying, or never making, the decision to seek care [6]. Also, a shortage in obstetricians can affect birth outcomes dramati-cally. In rural Washington women from “high-outflow” communities, where women deliver far from local hospitals due to shortage in local providers, had a higher rate of complicated deliveries than women from communities where most patients delivered in the local hospital [7]. Another major concern is that patients coming to the hospital nearly always made their own transport arrangements. In Tanzania participatory community plans to solve transport-related delays in handling maternal emergencies were developed in 50 villages and showed some success in collecting funds for and organizing better transport systems [8].
The next component of the total delay in emergency obstetric care was the delay in initiating care. The average total time for both registering then first examining the patient was 46 minutes. Delayed anaesthesia, delayed laboratory results and a locked sonar room contributed to patient 5
h 29
min
34 m
in1
h 59
min
14 m
in20
min
1 h
52 m
in7
min
50 m
in39
min
56 m
in
Tim
e fro
m
com
plic
atio
n oc
curr
ing
Tim
e fro
m
com
plic
atio
n oc
curr
ing
until
pat
ient
’s de
cisi
on to
seek
ca
re
Tim
e fro
m
deci
sion
to se
ek
care
unt
il pa
tient
re
ache
d ho
spita
l
Tim
e fro
m a
rriv
al
to re
gist
ratio
nTi
me
from
re
gist
ratio
n un
til p
atie
nt
exam
ined
Tim
e fro
m
exam
inat
ion
until
nee
d fo
r bl
ood
was
es
tabl
ishe
d
Tim
e fro
m
need
for b
lood
de
cide
d un
til
orde
r for
blo
od
mad
e
Tim
e fro
m o
rder
fo
r blo
od m
ade
until
it a
rriv
ed
Tim
e fro
m
bloo
d ar
rival
un
til it
was
ad
min
iste
red
Tim
e fro
m
tran
sfus
ion
star
ted
until
it w
as
com
plet
ed
Tim
e fro
m d
eliv
ery
or st
art o
f com
plai
nt u
ntil
reac
hing
hosp
ital:
8 h
2 m
inTi
me
from
exa
min
atio
n un
til b
lood
was
adm
inis
tere
d: 3
h 2
8 m
in
Tim
e fro
m c
ompl
icat
ion
occu
rrin
g un
til p
atie
nt w
as e
xam
ined
: 3 h
7 m
in
Tim
e fro
m c
ompl
icat
ion
occu
rrin
g un
til b
lood
tran
sfus
ion
star
ted:
6 h
15 m
in
Book 17-1.indb 24 1/3/2011 1:38:34 PM

املجلد السابع عرشاملجلة الصحية لرشق املتوسطالعدد األول
25
References
Mavalankar DV, Rosenfield A. Maternal mortality in resource-1. poor settings: policy barriers to care. American Journal of Public Health, 2005, 95:200–203.
National maternal mortality study, 2000. 2. Cairo, Egypt, Ministry of Health and Population, 2001.
Maternal Health and Safe Motherhood Programme, Division 3. of Family Health. The mother–baby package. Implementing safe motherhood in countries: practical guide. Geneva, World Health Organization, 1996.
Blood Transfusion Service. 4. Part 1: Guidelines for appropriate use of blood and blood components, 1st ed. Cairo, Egypt, Ministry of Health and Population, 1999.
Essential obstetric care: protocols for physicians5. . Cairo, Egypt, Ministry of Health and Population, 2001.
Barnes-Josiah D, Myntti C, Augustin A. The “three delays” as 6. a framework for examining maternal mortality in Haiti. Social Science & Medicine, 1998, 46:981–993.
Nesbitt TS et al. Access to obstetric care in rural areas: effect 7. on birth outcomes. American Journal of Public Health, 1990, 80:814–818.
Schmid T et al. Transportation for maternal emergencies in Tan-8. zania: empowering communities through participatory problem solving. American Journal of Public Health, 2001, 91:1589–1590.
Qureshi AM, Stevens M, Plaat F. Survey of anesthetic support 9. staff in obstetric units in England and Wales. Anaesthesia, 2003, 58:578–582.
Alihonou E. Africa: time for action. 10. Planned Parenthood Chal-lenges, 1998, (1):15.
Sachs BP et al. Hemorrhage, infection, toxemia, and cardiac 11. disease, 1954–85: causes for their declining role in maternal mortality. American Journal of Public Health, 1988, 78:671–675.
Sharma RR, Kumar S, Agnihotri SK. Sources of preventable er-12. rors related to transfusion. Vox Sanguinis, 2001, 81:37–41.
Allain JP. Risques transfusionnels d’hier et d’aujourd’hui 13. [Transfusion risks of yesterday and of today]. Transfusion Cli-nique et Biologique, 2003, 10:1–5.
Novis DA et al. Audit of transfusion procedures in 660 hos-14. pitals. A College of American Pathologists Q-probes study of patient identification and vital sign monitoring frequencies in 16494 transfusions. Archives of Pathology and Laboratory Medi-cine, 2003, 127:541–548.
Fereydoun A, Thierry B, El-Nageh M. 15. Plasma fractionation programmes for developing countries: technical aspects and infrastructural requirements. Alexandria, Egypt, World Health Organization. Regional Office for the Eastern Mediterranean, 1999 (Eastern Mediterranean Series, No. 22).
morbidity. This is not unique to devel-oping countries; for example, a national survey in England and Wales found that anaesthesia was delayed during obstet-ric emergencies in 29% of cases [9].
Deficiencies in quality of care were not judged by our researchers to be re-lated to lack of resources. Research has indicated that even countries with an annual per capita income of only US$ 200 have succeeded in substantially reducing maternal mortality. Maternal mortality is more closely linked to poor organization of services than to a lack of national re-sources [10]. For example, the dramatic decline in the incidence of haemorrhage as a cause of maternal mortality in Com-monwealth countries between 1954 and 1985 appears to have been due to both legislative actions and to improvements in medical practice such as licensing of maternity services and blood banks [11].
Communication between the treat-ing physician and the blood bank never took place, with 1 exception. Samples were sent without information, with incomplete information or with in-formation on the sample and “request document” not cross-checked. These factors exponentially increase the risk
of transfusing incompatible blood. Re-search shows that the majority of errors related to transfusions occur outside the blood bank [12], which was also the case in our study. The seriousness of such errors should not be underesti-mated. Presently in developed countries, transfusion errors are a greater source of morbidity and mortality than transfu-sion-transmitted infections [13].
Our observations showed that prac-tices related to blood transfusion were poor; the blood units were not properly inspected before administration in any of the cases and the patient’s identity was checked against the blood unit in only 40% of the cases. Studies show that patient and blood unit identification are not always done to the highest standard, even in developed countries. In a study in the US, completion of 4 specific com-ponents of the identification process was achieved in 62.3% of cases, whereas completion of all steps was achieved in 25.4% of cases [14].
WHO has frequently emphasized the need for a basic infrastructure and resources for the establishment of a plasma fractionation in developing countries as a tool for radical upgrading
of countries’ blood transfusion systems. Rapid transfusion and lack of monitor-ing before and after commencement of transfusion are life-threatening issues since the most serious transfusion reac-tions occur during that time [15].
Conclusions
In the current study, the delay in receiv-ing blood for transfusion was a key issue in the quality of care of women with obstetric emergencies. The problem is multidisciplinary. Availability of blood and delays in delivering it are not con-strained by the availability of resources, which were judged to be available to an acceptable level in all study hospitals. Controlling this problem in Egypt would require better organization and practices in the blood bank service, improved clini-cal performance within the general hos-pitals and better management of patient admissions and referrals. Interventions should also be directed towards women and health care decision-makers within households to help them to recognize the warning symptoms of obstetric emergencies and to appreciate the need to deal with these immediately.
Book 17-1.indb 25 1/3/2011 1:38:35 PM

EMHJ • Vol. 17 No. 1 • 2011 Eastern Mediterranean Health JournalLa Revue de Santé de la Méditerranée orientale
26
Needlestick injuries among health care workers of University of Alexandria hospitalsM.I. Hanafi,1 A.M. Mohamed,1 M.S. Kassem2 and M. Shawki1
ABSTRACT The aims of this cross-sectional study were to investigate the prevalence and circumstances of needlestick injury (NSI) among heath care workers at University of Alexandria teaching hospitals and to assess the effectiveness of the existing control measures and standard precautions. Data were obtained by anonymous, self-reporting questionnaire from 645 nurses, physicians and ancillary staff in 2007. Around two-thirds of workers (67.9%) had suffered at least 1 NSI in the last 12 months. High-risk patients (with history of HIV, hepatitis B virus or , hepatitis C virus infection or injecting drug use) were involved in 8.2% of injuries. On evaluating the effectiveness of existing control measures, significant protective factors against NSI were: using devices with safety features (OR 0.41), adherence to infection control guidelines (OR 0.42), training in injection safety (OR 0.14), comfortable room temperature (OR 0.32) and availability of a written protocol for prompt reporting (OR 0.37).
1Department of Community Medicine; 2Department of Obstetrics and Gynaecology, Faculty of Medicine, University of Alexandria, Alexandria, Egypt (Correspondence to A.M. Mohamed: [email protected]).
Received: 23/02/09; accepted: 26/07/09
اإلصابات الوخزّية بني العاملني يف الرعاية الصحية يف مستشفيات جامعة اإلسكندريةمنال حنفي، عايدة حميي ، حممد رشيف قاسم، منى شوقي
اخلالصـة: هتدف هذه الدراسة املستعرضة الستقصاء معدل انتشار وظروف اإلصابات بوخز اإلبر لدى العاملني يف الرعاية الصحية يف املستشفيات التعليمية جلامعة اإلسكندرية، لتقيـيم فعالية إجراءات املكافحة احلالية واالحتياطات املعيارية للوقاية. وقد حصل الباحثون عىل املعطيات من خالل استبيان ُيستوَف ذاتيًا دون ذكر األسامء، استوفاه 645 ممرضة وطبيبًا وعاماًل طبيًا مساعدًا يف عام 2007. وتبنيَّ أن ما يقرب من ثلثي العاملني )%67.9( قد عانى من وخزة إبرة عىل األقل يف األشهر االثني عرش السابقة. وقد كانت اإلصابات يف 8.2% من احلاالت أثناء العناية بمرىض مرتفعي اخلطورة )لدهيم سوابق اإلصابة بفريوس اإليدز أو بفريوس االلتهاب الكبدي »يب« أو »يس« أو ممَّن يتعاطون املخدرات باحلقن(. وتبنيَّ من تقيـيم فعالية إجراءات املكافحة القائمة حاليًا أن العوامل الوقائية التي ُيْعَتدُّ هبا من اإلصابة بوخز اإلبر هي: استخدام أدوات ظاِهُرها السالمة )معدل األرجحية 0.41(، وااللتزام بالدالئل اإلرشادية ملكافحة العدوى )معدل األرجحية 0.42(، والتدريب عىل سالمة احلقن )معدل األرجحية 0.14( وكون درجة
حرارة الغرفة ُمرحية )معدل األرجحية 0.32(، وتوافر بروتوكول مكتوب لإلبالغ الفوري )معدل األرجحية 0.37(.
Blessures par piqûre d’aiguille chez les agents de soins de santé des hôpitaux universitaires d’Alexandrie
RÉSUMÉ Les objectifs de la présente étude transversale étaient d’étudier la prévalence et les circonstances des blessures par piqûre d’aiguille chez les agents de soins de santé des hôpitaux universitaires d’Alexandrie et d’évaluer l’efficacité des mesures de lutte existantes et les précautions standard. Les données ont été obtenues au moyen d’un questionnaire anonyme direct rempli par 645 infirmières, médecins et personnels auxiliaires en 2007. Environ deux-tiers de ces personnels (67,9 %) déclaraient au moins une blessure par piqûre d’aiguille dans les douze derniers mois. Des patients à haut risque (ayant des antécédents de VIH, d’infection par le virus de l’hépatite B ou C ou d’injection de drogues) étaient impliqués dans 8,2 % des blessures. L’évaluation de l’efficacité des mesures de lutte existantes a révélé que les facteurs de protection significatifs contre les blessures par piqûre d’aiguille étaient les suivants : l’utilisation de dispositifs équipés de fonctions de protection (OR 0,41), le respect des directives pour la lutte contre les infections (OR 0,42), la formation en matière de sécurité des injections (OR 0,14), une température ambiante confortable (OR 0,32) et la disponibilité d’un protocole écrit pour une notification rapide (OR 0,37).
Book 17-1.indb 26 1/3/2011 1:38:35 PM

املجلد السابع عرشاملجلة الصحية لرشق املتوسطالعدد األول
27
Introduction
Workplace safety is a very important aspect of occupational health practice. In 1998, the Centers for Disease Con-trol and Prevention (CDC) estimated that approximately 800 000 health care workers (HCWs) in the United States were injured by patient needles and about 2000 of those workers tested positive for hepatitis C virus (HCV) in-fection, 400 for hepatitis B virus (HBV) and 35 for human immunodeficiency virus (HIV) [1]. The World Health Organization has estimated that in developing regions, 40%–65% of HBV and HCV infections in HCWs are attributable to percutaneous occupa-tional exposure [2].
In Egypt, like many developing countries [3], few efforts have been undertaken to raise awareness about needlestick injury (NSI) among HCWs and hospital managers. Con-crete knowledge on the transmission of bloodborne diseases in health care facilities is very limited and unsafe practices are common. Additionally, there is a lack of regulations and poli-cies to protect HCWs from exposure [4]. HCWs rarely receive training in infection control and standard precau-tions, even though these are low-cost solutions to reducing the risk of sharp injuries and have a high likelihood of being adopted [5].
There are no clear figures from Al-exandria about the prevalence of NSIs, the circumstances surrounding them or the barriers to reporting them. Previous research shows that the rate of injec-tions is high in University of Alexandria teaching hospitals and more than 30% of these injections are done with previ-ously used syringes [6]. The prevalence of HBV and HCV in Egypt is high and unsafe injections transmit most of these infections. Hence, the risk of NSIs and associated infections is higher in Egypt compared with other countries [6]. The present study was conducted to inves-tigate the prevalence and context of
NSIs and the behaviour associated with the reporting of injuries among HCWs in University of Alexandria teaching hospitals. An assessment of knowledge about risk perceptions and the practice of standard precautions was also con-ducted. This study will provide essential baseline data for developing and testing low-cost training interventions in stand-ard precautions.
Methods
Study designA cross-sectional survey was conducted during January to December 2007.
Study population and settingThe study population was HCWs at the 3 University of Alexandria teaching hospitals. All workers who were in direct contact with patients or using equip-ment on patients and who were likely to be exposed to bloodborne pathogens were included.
Sample sizeHealth care in the 3 teaching hospitals is provided by 6087 workers (Statistical Administrative Records of University Hospitals, 2007). The total number of HCWs to be selected was estimated using the following equation: n = (z2 × p × q)/D2. Since the actual prevalence of NSI was unknown, the probability of its occurrence was estimated to be equal to that of its nonoccurrence (p = q = 0.5) and a value of 0.2 was chosen as the acceptable limit of precision (D). Based on these assumptions, the sample size was estimated to be 913 HCWs. Samples were proportionally allocated across different job categories: nurses, physicians, ancillary staff, etc.
Data collection toolAn anonymous self-administered ques-tionnaire was developed based on the health belief model [7] and distributed to the HCWs at their work place. The purpose, procedure, risks and benefits of
the study were explained to the partici-pants and verbal informed consent was obtained. The Ethics Review Commit-tee at Alexandria Faculty of Medicine reviewed and approved the proposal. The survey tool was pre-tested on a random sample of 55 participants to ensure its practicability and validity. The reliability of the questionnaire was as-sessed using Cronbach alpha (0.81).
The questionnaire was delivered in Arabic and included information on the HCW’s sociodemographic data, profes-sional qualifications and total number of years in practice. We enquired about the number of NSIs during the past 12 months and circumstances surround-ing the latest injury, e.g. whether a high-risk patient was involved (one with a history of infection with HIV, HBV or HCV or injecting drug use), the ward/unit where it took place, actions being performed, time of shift, etc. We also asked whether the HCW had reported the injury.
The questionnaire assessed the fol-lowing health belief constructs:
Knowledge (1 item): “Can injury by •needles at the work place transmit hepatitis B, C or HIV?” (yes = 1, no = 0).
Perceived susceptibility (1 item): •“How much risk of acquiring hepa-titis B, C and/or HIV is involved in your work setting?” (1 = none to 5 = very high).
Perceived severity (1 item): “What •can happen if a HCW got an NSI?” (1 = infection with bloodborne patho-gen, 0 = nothing).
Practices concerning standard pre-•cautions (5 items): completed HBV vaccination (yes = 1, no = 0); wear gloves for procedures with possibility of blood/body fluid exposure (never = 0 to always = 3); wear gown for procedures with possibility of blood/body fluid splash (never = 0 to always = 3); needle recap after use (never = 0 to always = 3); appropriate waste handling (never = 0 to always = 3).
Book 17-1.indb 27 1/3/2011 1:38:35 PM

EMHJ • Vol. 17 No. 1 • 2011 Eastern Mediterranean Health JournalLa Revue de Santé de la Méditerranée orientale
28
Perceived benefits of standard pre-•cautions (1 item): “Do you believe that standard precautions practices protect against bloodborne infec-tions?” (strongly disagree = 0, strongly agree = 4)]
Perceived barriers to practise of stand-•ard precautions (2 items): unavail-ability of protective equipment (yes = 1, no = 0); lack of training in standard precautions (yes = 1, no = 0)
Cue to action (1 item): “Are you •exposed to factors (e.g. mass media campaign, advice from others, pam-phlet, illness of a friend/workmate, newspaper/magazine article) that prompts action to be taken?” (yes = 1, no = 0)
Perceived self-efficiency (1 item): “Are •you confident in your ability to success-fully practice safe standard precautions at your workplace?” (not confident = 0, completely confident = 2).An infection transmission knowl-
edge score was calculated and a standard precautions practice score was calcu-lated as a percentage of the maximum possible score.
High-risk injured workers (n = 187) was identified by 12 statements address-ing factors increasing the possibility of
infection transmission (no = 0, yes = 1), then a total score was computed. Those workers who had total score above the median were considered to have had a high-risk injury.
Statistical analysisData were entered in Epi-Info, ver-sion 6.04 and analysis was performed using SPSS, version 13.0. Data were analysed using the case–control ap-proach. Means and standard deviation (SD) were computed for continuous variables and proportions for categori-cal variables. Odds ratio (OR) and the corresponding 95% confidence interval (CI) were computed.
Multiple linear regression analysis was performed to assess the relationship between the standard precautions prac-tice score and the infection transmission knowledge score, the standard precau-tions knowledge score, perceived risk of infection at workplace, perceived severity of disease due to NSI at the workplace, age, work experience and qualifications. Those variables that were significant at P < 0.05 were selected for the multivariate model. The assumptions model fitness was assessed using residual plots. Alpha was set at the 5% level.
Results
Distribution of job categoriesOf the 913 HCWs selected, 645 (70.6%) completed the questionnaires: 371 nurses, 56 senior staff physicians, 55 trainee physicians (residents/attend-ing surgeons/interns), 88 technicians/bloodbank staff and 75 support staff (housekeepers, laundry, maintenance workers and porters). Nurses had the highest response rate (92.5%), followed by staff physicians (83.6%), trainee phy-sicians (74.3%), technicians/bloodbank staff (57.5%) and support staff (34.4%). Male HCWs accounted for 31.9% of the sample. The age of the participat-ing HCWs ranged from 17 years to 60 years, with a mean age of 30.8 (SD 8.6) years.
Prevalence of NSIMore than two-thirds of HCWs (438, 67.9%) had sustained at least 1 NSI in the previous 12 months. Of these work-ers, 33.0% suffered 1 injury, 18.0% 2 injuries, 12.0% 3 injuries and 5.0% more than 3 NSIs. Table 1 shows that HCWs aged 40+ years and those with 5+ years of work experience were significantly less likely to be injured (OR 0.32, 0.28
Table 1 Personal characteristics of health care workers ever experiencing needlestick injury (NSI) in the last 12 months and those not exposed to such injury in teaching hospitals in Alexandria
Characteristic NSI(n = 438)
No NSI(n = 207)
OR 95% CI
No. % No. %
Age (years)
> 20 142 32.4 53 25.6 1
20–< 30 138 31.5 46 22.2 0.74 0.39–1.84
30–< 40 112 25.6 50 24.2 0.96 0.45–2.74
40–< 50 36 8.2 34 16.4 0.32 0.02–0.59
50–60 10 2.3 24 11.6 0.28 0.01–0.51
Sex
Male 143 32.6 63 30.2 1
Female 295 67.4 144 69.6 1.8 0.64–2.70
Work experience (years)
< 1 219 50.0 67 32.4 1
1–< 5 162 37.0 86 41.5 0.76 0.37–1.85
5+ 57 13.0 54 26.1 0.34 0.01–0.73
OR = odds ratio; CI = confidence interval.
Book 17-1.indb 28 1/3/2011 1:38:35 PM

املجلد السابع عرشاملجلة الصحية لرشق املتوسطالعدد األول
29
and 0.34 respectively). However, sex had no effect on the occurrence of NSI (OR 1.8; 95% CI: 0.64–2.7).
Circumstances of NSINurses had the highest risk of suffer-ing NSI (62.3%) compared with the other occupational categories such as physicians (11.0%) and support staff (14.2%) (Table 2). Disposable syringes accounted for the highest proportion of injuries (38.4%) and most NSI (36.5%) occurred in the wards (Table 2). Over one-third of injuries (36.0%) occurred during recapping a needle. A high per-centage of NSIs (28.3%) also occurred during disposal of the used device. High-risk patients (those with a history of infection with HIV, HBV or HCV or injection drug use) were involved in 8.2% of injuries. The majority of injuries (73.1%) occurred at end of the shift. Most HCWs (77.4%) reported feeling mentally distressed after their injury.
Risk of infection after NSIThe 187 staff members who were judged to have suffered a high-risk injury were compared with the total sample (Table 3). Factors that increased a HCW’s chance of suffering a high-risk injury were: exposure to a source patient who had evidence of bloodborne infec-tion (OR 12.4, P = 0.003); when the procedure involved inserting a needle directly in a patient’s vein or artery (OR 9.07, P = 0.013); deep injury (OR 6.60, P < 0.001); and not wearing personal protective equipment (OR 5.20, P = 0.001) (Table 3). Nearly one-fifth of the staff surveyed (18.9%) were either un-protected or unaware of their HBV serological status; 83 HCWs (12.9%) had not completed HBV vaccination and this factor was also associated with a high-risk injury (OR 6.35, P < 0.001); Other factors—device nature; duration of potential contact; body part injured; time interval between injury and wound cleansing; availability and use of pro-phylactic medication; and follow-up testing of the exposed workers—did
Table 2 Circumstances of most recent needlestick injury among health care workers (HCW) in teaching hospitals in Alexandria
Circumstance No. (n = 438)
%
Occupational groupNurse 273 62.3Support staff 62 14.2Staff physician 48 11.0Trainee physician 47 10.7Technician, blood bank staff 8 1.8
Device involvedSyringe needle (pre-filled, disposable) 168 38.4Suture needle 102 23.3Winged, butterfly needle 59 13.5Intravenous catheter stylet 34 7.8Lancet (for skin prick) 33 7.5Blood collection (needle holder or vacuum tube) 26 5.9Hypodermic needle attached to disposable syringe 15 3.4
Location of occurrence (medical specialty area)Inpatient ward 160 36.5Intensive care unit 69 15.8Dialysis unit 55 12.6Operating room 46 10.5Emergency room 39 8.9Outpatient department 28 6.4Delivery room 23 5.3Laboratory 18 4.1
Activity and timing of accident Recapping or disassembly of needle 158 36.1
Inappropriate disposal of used device (container too full, wrong type) 124 28.3
After use and before disposal 49 11.2Before use of the device 46 10.5During use of the device 38 8.7During disposal (appropriate) 23 5.3
Work practiceRecapping by hand 148 33.8Collision with another HCW or sharp 75 17.1Unsafe collection and disposal of sharps waste 72 16.4Patient moved and jarred device 42 9.6Handling/passing equipment to another HCW 40 9.1Transferring body fluids between containers 38 8.7Manual tissue retraction 23 5.3
Involvement of high-risk patienta
No 211 48.2Yes 36 8.2Unsure/not specified 191 43.6
Timing of injuryEnd of shift 320 73.1Beginning of shift 118 26.9
Health status of HCW after injury Mental distress 339 77.4Chronic illness 52 11.9Normal 47 10.7
aHigh-risk patient (history of infection with HIV, hepatitis B virus or hepatitis B virus or injecting drug user).
Book 17-1.indb 29 1/3/2011 1:38:36 PM

EMHJ • Vol. 17 No. 1 • 2011 Eastern Mediterranean Health JournalLa Revue de Santé de la Méditerranée orientale
30
not significantly affect the chance of having a high-risk injury.
Rate of nonreporting of NSIA total of 327 respondents (74.7%) did not report the injury to the employee health service. Physicians were less likely to report an NSI than other health care pro-fessionals; for example, 87.5% of staff physicians did not report the NSI compared with 70.3% of nurses and 79.0% of support staff. Reasons for not reporting the injury were: lack of knowledge of appropriate pro-cedures after injury (22.6%); belief that their HBV vaccination status was sufficient (20.5%); belief they were at low risk of infection (19.9%); time constraints (16.5%); use of self-care (14.7%); and fear of punitive response by employer (5.8%) (Figure 1).
Effectiveness of existing control measuresTable 4 shows that the factors that decreased the frequency of NSIs were: access to devices with safety features (OR 0.41, 95% CI: 0.21–0.73); adherence to infection control guidelines (OR 0.42, 95% CI: 0.26–0.71); having had training in injection safety and appropriate work practices (OR 0.14, 95% CI: 0.03–0.40); a comfortable room temperature (OR 0.32, 95% CI: 0.06–0.67); and available written protocol for prompt reporting (OR 0.37, 95% CI: 0.02–0.57). Factors that did not significantly affect the risk of NSIs were: access to personal protec-tive equipment; location of the disposal contain-ers; rigidity and design of disposal boxes; having full immunization against HBV; practising double gloving; having organized shift schedules; having sufficient staff numbers, characteristics of the work environment; or having periodic inservice health monitoring.
Standard precautions practices and its predictorsThe percentage knowledge score of HCWs about the risks associated with NSIs ranged from 30% to 82%, with a mean score of 58.7%. The standard precautions practice score for the HCWs ranged from 27% to 78%, with a mean score of 46.3%. In the multiple linear regression model, the only significant predictors of the standard precautions practice score were knowledge of infection transmission following an NSI (adjusted β = 0.18, 95% CI: 0.06–0.29) and work experience of the HCW (adjusted β = 0.06, 95% CI: 0.02–0.09). The final model explained 9.3% of the variation in the safety precautions practice
Tabl
e 3
Fact
ors
incr
easi
ng th
e po
ssib
ility
of s
uffe
ring
a h
igh-
risk
nee
dles
tick
inju
ry (N
SI) a
mon
g he
alth
car
e w
orke
rs (H
CW
) in
teac
hing
hos
pita
ls in
Ale
xand
ria
Tran
smis
sion
fact
orTo
tal s
ampl
e H
igh-
risk
NSI
Low
-ris
k N
SIO
R95
% C
IP-
valu
e
(n =
645
)N
o.%
No.
%
Expo
sure
to p
atie
nt w
ith e
vide
nce
of b
lood
born
e in
fect
ion
3630
83.3
616
.712
.44.
6–23
.80
.00
3
Proc
edur
e in
volv
ing
need
le p
lace
d di
rect
ly in
vei
n or
art
ery
130
9069
.240
30.8
9.0
72.
5–18
.80
.013
Imm
une
stat
us o
f HC
W (h
epat
itis B
unv
acci
nate
d)83
8197
.62
2.4
6.35
2.7–
9.5
< 0
.00
1
Dep
th o
f inj
ury
(dee
p)13
312
090
.213
9.8
6.60
1.2–1
3.7
< 0
.00
1
No
pers
onal
pro
tect
ive
equi
pmen
t wor
n by
HC
W a
152
130
85.5
2214
.55.
201.6
–15.
1<
0.0
01
Body
par
t inj
ured
(vas
cula
r)10
220
19.6
8280
.40
.62
0.1–
1.80
.30
9
Dev
ice
was
vis
ibly
con
tam
inat
ed w
ith p
atie
nt’s
bloo
d31
895
29.9
223
70.1
1.77
0.3
–3.4
0.0
53
No
follo
w-u
p te
stin
g fo
r exp
osed
HC
W11
949
41.2
7058
.81.7
20
.5–3
.20
.254
Dev
ice
was
larg
e-ga
uge
hollo
w-b
ore
need
le23
610
444
.113
255
.91.5
90
.9–2
.90
.30
5
Una
vaila
bilit
y or
non
-use
of p
roph
ylac
tic m
edic
atio
nb 11
845
38.1
7361
.91.5
30
.7–4
.80
.396
Tim
e in
terv
al b
etw
een
inju
ry a
nd w
ound
cle
ansi
ng (>
30
min
)20
170
34.8
131
65.2
1.39
0.2
–3.7
0.3
26
Long
dur
atio
n of
pot
entia
l con
tact
101
5352
.548
47.5
1.30
0.7
–6.5
0.13
7a G
love
s, m
ask,
eye
pro
tect
ion,
face
shie
ld, g
owns
. b An
tiret
rovi
ral t
hera
py, i
mm
unog
lobu
lin a
nd v
acci
natio
n fo
r hep
atiti
s B.
OR
= od
ds ra
tio; C
I = co
nfide
nce
inte
rval
.
Book 17-1.indb 30 1/3/2011 1:38:36 PM

املجلد السابع عرشاملجلة الصحية لرشق املتوسطالعدد األول
31
Figure 1 Possible reasons for nonreporting among health care workers (HCWs) experiencing needlestick injury in teaching hospitals in Alexandria (n = 327)
% of HCWs
score (Table 5). Residual analysis using the assumptions of normality, linearity and constant variance revealed that the model fitted well.
Discussion
We found that more than two-thirds (67.9%) of HCWs questioned had sus-tained at least 1 NSI in the 12 months preceding the study. Lower prevalences of NSIs were reported among HCWs in 2 Malaysian teaching hospitals (31.6% and 52.9% respectively) [8]. In Vietnam, 38% of physicians and 66% of nurses reported sustaining a sharpstick injury in the previ-ous 9 months [9]. In South Africa, 91% of junior doctors reported sustaining an NSI in the previous 12 months, and 55% of these injuries came from source patients who were HIV-positive [10].
Our study provides descriptive epidemiological evidence of how such injuries occur, including under what circumstances, with what devices and during what types of procedures. The picture that emerges reflects a number of different risk opportunities involving interactions among patients, workers, devices and the environment.
Overall, the pattern of reported NSIs was consistent with other authors’ reviews [11–13]. Physicians mostly do not provide injections and hence their risk of injury exposure is lower than nurses. Housekeepers clean and collect waste without protective equip-ment and hence are at high risk of injury exposure. Concerning device-specific NSIs, syringe needles were associated with 38.4% of all NSIs experienced by the studied HCWs. This finding is con-sistent with data presented by Ippolito et al. 1997 [14], in which hollow-bore needles accounted for 38.5% of per-cutaneous injuries. Better prevention strategies need to be developed in our hospitals, for example, providing safer needle devices to all HCWs [15] or ensuring sharps containers are placed at appropriate spots [16].
Surprisingly, more NSIs occurred at locations such as patient rooms where there was less intense activity than in more intense areas such as the emer-gency room. This may be because better qualified staff work in the emergency rooms, because HCWs are more cau-tious in high intensive units where high-ly invasive procedures are performed or because HCWs in the less intensive
units may have responsibilities for more patients, which may cause staff to rush injections [17].
In contrast to the present work, 38% of percutaneous injuries among HCWs in Taiwan occurred during the injection, when a needle being manipu-lated in a patient became accidentally dislodged [18], whereas in our study recapping or disassembly of needles was the most common activity causing injury (36.0%). Even though recap-ping has been banned by the United States Occupational Safety and Health Administration, it continues to be an identified cause of injury [19].
Certain working conditions have been shown to increase the risk of NSIs, including reductions in staffing levels, HCWs who assume additional duties or who are rushed, difficult patient care situations and working at night with re-duced lighting [20]. However, we found that factors such as having organized shift schedules and having sufficient staff numbers had no significant effect on the occurrence of NSIs.
High-risk patients (those with a his-tory of HIV, HBV or HCV infection or injecting drug use) were involved in
Book 17-1.indb 31 1/3/2011 1:38:36 PM

EMHJ • Vol. 17 No. 1 • 2011 Eastern Mediterranean Health JournalLa Revue de Santé de la Méditerranée orientale
32
8.2% of injuries. HIV, HBV and HCV are highly transmissible pathogens and this finding is a concern in view of the high rate of NSIs with hollow-bore nee-dles, which are effective in delivering large amounts of blood and body fluids [21]. Of these bloodborne pathogens, HBV is preventable. Teaching hospitals in Alexandria have not made HBV vac-cination a requirement of employment. Many staff surveyed (18.9%) were either unprotected or unaware of their sero-logical status. This means that the health care facilities surveyed have allowed a proportion of staff to remain at risk to themselves or to patients. A vaccination programme for clinical and nonclinical
Table 4 Effectiveness of existing measures to prevent needlestick injury (NSI) among health care workers in teaching hospitals in Alexandria
Control measure NSI(n = 438)
No NSI(n = 207)
OR 95% CI
No. % No. %
Access to safety engineered devices (sheathed or retract after use) 61 13.9 71 34.3 0.41 0.21–0.73
Access to personal protective equipment 143 32.6 86 41.5 0.82 0.43–1.04
Awareness of standard precautions guidelines 283 64.6 139 67.1 0.90 0.46–1.53
Satisfactory adherence with infection control guidelines 127 29.0 123 59.4 0.42 0.26–0.71
Training in injection safety and appropriate work practices 35 8.0 56 27.0 0.14 0.03–0.40
Full immunization against hepatitis B 132 30.1 68 32.9 0.83 0.49–2.74
Double gloving practice 28 6.4 28 13.5 0.43 0.05–1.52
Having organized shift schedule 126 28.7 66 31.9 0.84 0.38–1.74
Having sufficient staff numbers 259 59.1 133 64.3 0.74 0.36–2.03
Periodic inservice health monitoring 30 6.8 19 9.2 0.68 0.38–1.05
Available written protocol for prompt reporting of NSI 42 9.6 80 38.6 0.37 0.02–0.57
Features of disposal containers
Location (in close proximity to work area) 124 28.3 62 30.0 0.92 0.45–1.52
Design (rigid impermeable plastic box) 255 58.2 102 49.3 0.75 0.38–1.94
Design (open top box) 279 63.7 143 69.0 0.93 0.12–2.93
Work environment characteristics
Lighting (bright) 307 70.1 156 75.4 0.83 0.53–2.54
Noise (silence) 134 30.6 124 59.9 0.34 0.02–0.71
Number of people at the bedside (only 1) 192 43.8 97 46.9 0.91 0.48–2.96
Condition of hands (dry) 279 63.7 150 72.5 0.74 0.18–0.19
Visibility (good) 306 69.9 145 70.0 0.95 0.63–2.83
Floor condition (clean) 195 44.5 98 47.3 0.78 0.26–1.95
Room temperature (comfortable) 177 40.4 150 72.5 0.32 0.06–0.67
OR = odds ratio, CI = confidence interval.
staff has been recommended by the CDC since 1983 [22].
Fortunately, not all NSIs result in exposure to an infectious disease, and of those that do, the majority do not result in transmission of infection. Neverthe-less, prospective studies of HCWs ex-posed to HCV through an NSI or other percutaneous injury have found that the incidence of anti-HCV seroconversion averages 1.8% (range 0%–7%) per inju-ry [23]. Data combined from more than 20 prospective studies worldwide of HCWs exposed to HIV infected blood through percutaneous injury revealed an average transmission rate of 0.3% per injury [24]. HCWs’ risk of infection in
the present study depended on several factors, such as the procedure involving a needle placed directly in a patient’s vein or artery, exposure to a patient who had evidence of bloodborne infection, immune status of the HCW, the severity of the NSI and the availability personal protective equipment.
Understanding the scope of the problem requires the scale of under-reporting to be recognized. It is believed that only 1 out of 4 NSIs is reported in Alexandria teaching hospitals and this was confirmed by the present study in which 74.7% of HCWs did not re-port the NSI to an employee health service. Other studies have found that
Book 17-1.indb 32 1/3/2011 1:38:36 PM

املجلد السابع عرشاملجلة الصحية لرشق املتوسطالعدد األول
33
40%–80% of all NSIs go unreported [25]. The present study identified com-mon reasons for nonreporting of NSIs that warrant attention. In the absence of access to postexposure prophy-laxis, there is little perceived benefit to reporting occupational exposure, es-pecially when reporting can result in punishment, blame or even job loss. In addition, health workers commonly perceived the risk of the exposure to be low. Barriers to reporting should be ap-propriately identified and eliminated in order to ensure appropriate counselling and treatment of health workers after exposure. Antiretroviral therapy admin-istered within 24 to 36 hours after expo-sure has been associated with an 81% reduction in HIV infection. Although no postexposure prophylaxis is avail-able for HCV, testing can identify HCV infection at an early stage, during which treatment is highly effective in prevent-ing chronic infection. Furthermore, reporting of NSIs may be required to establish the causal relationship of the exposure and subsequent complica-tions (e.g. chronic infection or inability to practise medicine). Although legal requirements vary, failure to report an occupational exposure may lead to the denial of subsequent claims [26].
HCWs in the present study were not educated in occupational blood-borne hazards, as indicated by the low score on infection transmission knowl-edge. Accurate information about the risk of bloodborne transmission from occupational exposure to needlesticks is necessary and should include informa-tion about the most effective measures to control exposure and infection.
This study assessed the effectiveness of existing control measures for preven-tion of NSI. The survey revealed that the use of preventive measures in our facilities was inadequate. Although an increasing number and variety of needle devices with safety features are now available, only 10% of workers knew about needle-less safety devices. Nee-dle-less or protected needle intravenous systems have been shown to decrease the incidence of NSIs by 62%–88% [27].
“Standard precautions” is a system of barrier precautions to be used by all personnel for contact with blood, all body fluids, secretions, excretions, non-intact skin and mucous membranes. It applies to all patients receiving care in hospitals, regardless of their diagno-sis or presumed infection status [28]. In the present survey, the mean score
of standard precautions practice was 46.3%. The rate of use of standard pre-cautions in teaching hospitals in devel-oped countries is considerably higher than in our hospitals [29,30]. Knowl-edge of infection transmission following NSI and work experience played an important role in prediction of standard precautions practice at university hospi-tals in Alexandria.
Some limitations of the present study should be noted. Because all informa-tion was self-reported, misclassification is possible, although the anonymous nature of the survey would be expected to facilitate accurate reporting. Also, this work lacked data on outcomes, including results of serological testing for HIV or HBV or HCV infection among HCWs who sought care for their injuries. Although NSIs are the most common type of exposure, other percutaneous and splash exposures rep-resented additional hazards to HCWs and our work did not collect data on these exposures.
As with any emerging public health problem, there are several important research areas in which our knowledge about NSIs and their prevention can be improved. Studies are recommended to determine the adverse outcomes
Table 5 Predictors of standard precautions practice score for needlestick injury (NSI) among health care workers in teaching hospitals in Alexandria
Variable Univariate model Multivariate modela
β F-value P-value R2 Adjusted β 95% CI of β F-value P-value
Knowledge score 0.22 14.39 0.000 0.06 0.18 0.06–0.29 3.05 0.003
Perceived susceptibility of acquiring infection at workplace
0.02 0.02 0.885 0.00 – – – –
Perceived severity of disease after NSI 0.35 11.83 0.001 0.05 – – – –
Age 0.05 16.29 0.000 0.07 – – – –
Years of work experience 0.07 16.84 0.000 0.07 0.06 0.02–0.09 3.39 0.001
Occupational group 4.00 0.008 0.04 – – – –
Nurse 1.75 2.33 0.021 – – – – –
Staff physician 0.57 0.70 0.486 – – – – –
Trainee physician 0.62 0.89 0.375 – – – – –
Support staff 0.98 3.14 0.002 – – – – –aAdjusted R2 = 0.093, F-value = 13.37, P < 0.001. OR = odd ratio; CI = confidence interval.
Book 17-1.indb 33 1/3/2011 1:38:37 PM

EMHJ • Vol. 17 No. 1 • 2011 Eastern Mediterranean Health JournalLa Revue de Santé de la Méditerranée orientale
34
(infectious, psychological and financial) of these injuries. An ongoing review of current medical devices and options and safety features of devices is neces-sary. Evaluation studies to provide im-proved information on what does and does not work will similarly continue to improve the effectiveness of compre-hensive safety programmes.
Conclusion
While the science base on NSIs con-tinues to grow, research indicates that
such injuries are an important and continuing cause of exposure to se-rious and sometimes fatal infections among HCWs. Greater collaborative efforts are needed to prevent NSIs and their consequences. Such efforts are best accomplished through a comprehensive programme that ad-dresses institutional, behavioural and device-related factors that contribute to the occurrence of NSIs. Critical to this effort is the elimination of needle use where safe and effective alterna-tives are available and the continuing
development, evaluation and use of needle devices with safety features. All such approaches must include seri-ous initial and ongoing training efforts. Accurately tracking NSIs is critical. Es-tablishment of surveillance that could be used to identify potential risk factors associated with NSIs, such as high-risk occupations, settings or procedures, and detects the emergence of new problems. Surveillance systems could be used also to track whether interven-tions put into place significantly help reduce injuries.
References
Surveillance of health care workers with HIV/AIDS1. . Centers for Disease Control and Prevention [factsheet] (http://www.aegis.com/files/cdc/FactSheets/1998/HCW.pdf, accessed 10 October 2010).Prüss-Üstün A, Rapiti E, Hutin Y. 2. Sharps injuries: global burden of disease from sharps injuries to HCWs. Geneva, World Health Organization, 2003 (WHO Environmental Burden of Disease Series No. 3).Simonsen L et al. Unsafe injections in the developing world 3. and transmission of bloodborne pathogens: a review. Bulletin of the World Health Organization, 1999, 77:789–800.Talaat M et al. Mahoney FJ. Occupational exposure to NSIs 4. and hepatitis B vaccination coverage among health care workers in Egypt. American Journal of Infection Control, 203; 31(8):469–474.Ismail NA, Aboul Ftouh AM, El Shoubary WH. Safe injection 5. practice among health care workers, Gharbiya, Egypt. Journal of the Egyptian Public Health Association, 2005, 80:563–583. Abdel-Haleem M. 6. Injection safety: knowledge and practice among health workers of teaching hospitals [MS thesis]. Faculty of Medicine, Alexandria University, Alexandria, Egypt, 2004.Glanz K, Marcus Lewis F, Rimer BK. 7. Theory at a glance: a guide for health promotion practice, 2nd ed. Washington DC, Nation-al Cancer Institute, National Institutea of Health Department of Health and Human Services, 2005. Ng YW, Hassim IN. NSI among medical personnel in Accident 8. and Emergency Department of two teaching hospitals. Medi-cal Journal of Malaysia, 2007, 62:9–12. Report on the implementation of the APW of a pilot survey on 9. unsafe injection practice in Vietnam. Hanoi, Vietnam, Ministry of Health, Department of Therapy, 2003:30.Mingoli A et al. Surgeons’ risk awareness and behavioral meth-10. ods of protection against bloodborne pathogen transmission during surgery. Annals of Surgery, 1999, 230:737–738. Trim JC, Elliott TS. A review of sharps injuries and preventative 11. strategies. Journal of Hospital Infection, 2003, 53:237–242. Lee JM et al. NSIs in the United States. Epidemiologic, 12. economic, and quality of life issues. Official journal of the American Association of Occupational Health Nurses, 2005, 53:117–133. Lewis FR Jr et al. Epidemiology of injuries by needles and other 13. sharp instruments. Minimizing sharp injuries in gynecologic and obstetric operations. Surgical Clinics of North America, 1995, 75:1105–1121.
Ippolito G et al. 14. Prevention, management and chemoprophylaxis of occupational exposure to HIV. Charlottesville, University of Virginia, International Health Care Worker Safety Center, 1997:15–16; 26–30.Sohn S et al. Effect of implementing safety-engineered devices 15. on percutaneous injury epidemiology. Infection Control and Hospital Epidemiology, 2004, 25:536–542. Shiao JSC et al. The prevalence of needlestick and sharp object 16. injuries at a medical center in Taiwan. Infection Control, 1997, 4:207–214.Wilburn SQ, Eijkemans G. Preventing NSIs among healthcare 17. workers: a WHO-ICN collaboration. International Journal of Occupational and Environmental Health, 2004, 10:451–456. Guo YL et al. Needlestick and sharps injuries among health-18. care workers in Taiwan. Epidemiology and Infection, 2000, 122:259–265. Final rule on occupational exposure to blood borne pathogens (56 19. Fed Reg. 64004). Washington DC, United States Department of Labor, Occupational Safety and Health Administration, 1991.Shiao J, Guo L, McLaws ML. Estimation of the risk of blood-20. borne pathogens to health care workers after a NSI in Taiwan. American Journal of Infection Control, 2002, 30:15–20. Centers for Disease Control and Prevention. Immunization of 21. health-care workers: recommendations of the Advisory Com-mittee on Immunization Practices (ACIP) and the Hospital Infections Control Practices Advisory Committee (HICPAC). Morbidity and Mortality Weekly Report, 1997, 46:RR18–23.Sulkowski MS et al. Needlestick transmission of hepatitis C. 22. Journal of the American Medical Association, 2002, 287:406–413. Beltrami EM et al. Risk and management of blood-borne in-23. fections in health care workers. Clinical Microbiology Reviews, 2000, 13:385–407. Abu-Gad HA, Al-Turki KA. Some epidemiological aspects of 24. needle stick injuries among the hospital health care workers: Eastern Province, Saudi Arabia. European Journal of Epidemi-ology, 2001, 17:401–407. Centers for Disease Control and Prevention. National Institute 25. for Occupational Safety and Health (NIOSH) NIOSH Alert: Preventing NSIs in Health Care Settings, 1999. Publication No. 2000-108.Yassi A, McGill ML, Khokhar JB. Efficacy and cost-effectiveness 26. of a needleless intravenous access system. American Journal of Infection Control, 1995, 23:57–64.
Book 17-1.indb 34 1/3/2011 1:38:37 PM

املجلد السابع عرشاملجلة الصحية لرشق املتوسطالعدد األول
35
Sharp injuries. Assessing the burden of disease from sharps inju-27. ries to health-care workers at national and local levels. Geneva, World Health Organization, 2005 (Environmental Burden of Disease Series No. 11).Centers for Disease Control. Perspective in disease prevention 28. and health promotion update. Standard precautions for pre-vention of transmission of HIV, HBV and other blood-borne pathogens in health care settings. Morbidity and Mortality Weekly Report, 1988, 37:24.
Henry K et al. Compliance with standard precautions and 29. needle handling and disposal practices among emergency department staff at two teaching hospitals. American Journal of Infection Control, 1994, 22:129–137. Michalsen A et al. Compliance with universal precautions 30. among physicians. Journal of Occupational and Environmental Medicine, 1997, 39:130–137.
WHO guidelines on drawing blood: best practices in phlebotomy
Phlebotomy poses risks for patients and health workers. The above-mentioned recent guidelines were produced to improve the quality of blood specimens and the safety of phlebotomy for health workers and patients, by promoting best practices in phlebotomy. In April 2008, the WHO Injection Safety programme – part of the Department of Essential Health Technologies (EHT) at WHO Headquarters in Geneva – convened a consultation on best practices for phlebotomy and blood collection. Th resulting document, WHO guidelines on drawing blood: best practices in phlebotomy, provides guidance on the steps recommended for safe phlebotomy, and reiterates the accepted principles for drawing and collecting blood. The guidelines are based on a literature review that focused on identifying systematic literature reviews and evidence relating specifically to phlebotomy practices in developing countries. Draft guidelines and evidence were reviewed by an expert panel, who reached consensus on the recommendations.
Further information about this and other WHO publication is available at: http://www.who.int/publications/en/
Book 17-1.indb 35 1/3/2011 1:38:37 PM
EMHJ • Vol. 17 No. 1 • 2011 Eastern Mediterranean Health JournalLa Revue de Santé de la Méditerranée orientale
36
Nutritional status of children hospitalized in Tabriz Paediatric Hospital, Islamic Republic of Iran, 2008A.M. Mahdavi,1 A. Ostadrahimi 2 and A. Safaiyan 1
ABSTRACT This study aimed to evaluate the nutritional status of children consecutively admitted as inpatients to Tabriz Paediatric Hospital in the north-west of the Islamic Republic of Iran between June and August 2008. A total of 140 children aged 2–12 years were included. Patients’ weight, height and triceps skinfold thickness (TSFT) were measured, and nutritional status was evaluated. Evaluation of weight-for-age, height-for-age, weight-for-height and TSFT showed that 48.6%, 30.7%, 32.2% and 14.3% of the patients, respectively, were malnourished. Malnutrition among hospitalized children is worthy of attention, and effective strategies for systematic screening and treatment of malnutrition need to be developed and implemented.
1School of Health & Nutrition; 2Nutrition Research Centre, School of Health & Nutrition, Tabriz University of Medical Sciences, Tabriz, Islamic Republic of Iran (Correspondence to A.M. Mahdavi: [email protected]).
Received: 14/04/09; accepted: 26/07/09
احلالة التغذوية لألطفال املقبولني يف مستشفى تربيز لألطفال يف مجهورية إيران اإلسالمية يف عام 2008آيدا مالك مهدوي، عيل رضا استاد رحيمي، عبد الرسول صفائيان
اخلالصة: هدفت هذه الدراسة إىل تقييم احلالة التغذوية لألطفال املقبولني يف مستشفى تربيز لألطفال يف شامل غرب مجهورية إيران اإلسالمية بني شهري حزيران/يونيو وآب/أغسطس 2008. وقد ُأدرج يف الدراسة 140 طفاًل تتـراوح أعامرهم بني سنتني واثنتي عرشة سنة، وقيس وزن، وطول، وسمك ثنية اجللد فوق العضلة الثالثية الرؤوس لألطفال املرىض، وجرى تقييم احلالة التغذوية هلم. وأظهر تقييم الوزن مقابل العمر أن 48.6% من األطفال املرىض كانوا يعانون من سوء التغذية، يف حني أظهر تقييم الطول مقابل العمر أن 30.7% من األطفال املرىض كانوا يعانون من سوء التغذية، وأظهر تقييم الوزن مقابل الطول أن 32.2% من األطفال املرىض يعانون من سوء التغذية، وأظهر تقييم سمك ثنية اجللد فوق العضلة الثالثية الرؤوس أن 48. 14.3% من األطفال املرىض كانوا يعانون من سوء التغذية. ومن الواضح أن سوء التغذية هذا يف األطفال الذين أدخلوا إىل املستشفى، جدير
باستـرعاء االهتامم، وهو بحاجة إىل وضع وتنفيذ استـراتيجيات فّعالة للتحري عنه ومعاجلته معاجلة منهجية.
État nutritionnel des enfants hospitalisés à l’hôpital pédiatrique de Tabriz (République islamique d’Iran) en 2008
RÉSUMÉ La présente étude visait à évaluer l’état nutritionnel des enfants admis consécutivement à séjourner à l’hôpital pédiatrique de Tabriz, au nord-ouest de la République islamique d’Iran, entre juin et août 2008. Au total, 140 enfants âgés de 2 à 12 ans ont été inclus. Les enfants ont été pesés, leur taille et l’épaisseur du pli cutané tricipital ont été mesurés et l’état nutritionnel a été évalué; 48,6 % des enfants souffraient de malnutrition selon l’évaluation du rapport poids/âge, 30,7 % selon celle du rapport taille/âge, 32,2 % selon le rapport poids/taille, et 14,3 % selon la mesure de l’épaisseur du pli cutané tricipital. La malnutrition chez les enfants hospitalisés mérite une attention particulière et des stratégies efficaces pour un dépistage systématique et pour un traitement de la malnutrition doivent être élaborées et mises en œuvre.
Book 17-1.indb 36 1/3/2011 1:38:37 PM

املجلد السابع عرشاملجلة الصحية لرشق املتوسطالعدد األول
37
Introduction
Growth depends on a constant sup-ply of essential nutrients in sufficient amounts and proportions. Failure to thrive occurs when growth fails as a re-sult of inadequate nutrition. Inadequate nutrition can be caused by inadequate intake, increased losses, or increased requirements [1]. Malnutrition is a major health problem in hospitalized paediatric patients [2] and is reported as varying between 21% and 80% in pro-portion with the level of development of the countries [1]. Malnutrition has con-siderable health impacts on the physical, social and economical status of patients [3,4]. It may also affect the quality of life of patients [5]. Therefore, it is essential that patients who are malnourished or at risk of developing malnutrition be identified soon after admission so that nutritional support may be provided to correct nutritional changes and improve the patient’s prognosis[6].
Nutritional assessment is a compre-hensive approach to defining nutrition status that uses medical, nutrition, and medication histories; physical examina-tion; anthropometric measurements and laboratory data [7]. Meanwhile anthropometric evaluation is very im-portant for early discovery of the pa-tients with high risk of malnutrition. For this reason, it is necessary to measure at least weight and height of the newly hospitalized patients, and to calculate the required anthropometric values [8].
The aim of this study was to evalu-ate children’s nutritional status at the moment of their hospitalization in the paediatric hospital in Tabriz, one of the major cities in the north-west of the Islamic Republic of Iran in order to provide baseline information to set up a regional population-based centre to control and prevent malnutrition-related disorders in the area.
Methods
SubjectsOne hundred and forty children (2–12 years of age) were included in the study. All subjects were hospitalized con-secutively in the Paediatric Hospital of Tabriz University of Medical Sciences [including surgical, infectious diseases, oncology, ear/nose/throat, and internal medicine (gastroenterology, nephrol-ogy, respiratory, neurology, cardiology, metabolic disorder) wards] between June and August 2008. Patients hospi-talized in emergency, neonatal intensive care and neonatal special care units were excluded from the study.
The paediatric hospital, located in Tabriz city, is the only specialty and subspecialty centre for children in the north-west of the country and it delivers secondary and tertiary care for paedi-atric patients. The study was approved by the Ethics Committee of Tabriz University of Medical Sciences. All of the parents (responsible caregivers) were made aware of the content of the study and written informed consent was obtained in each case. The details of the study were then also explained to the children who were participating.
Anthropometric measurements
While W/A and W/H are con-sidered suitable for cases with acute malnutrition (underweight and wast-ing), H/A scores are sound indicators of chronic malnutrition (stunting) [9]. In our study, given these 2 types of mal-nutrition, and in accordance with the various nutritional indicators for the different age groups, we used more than 1 anthropometric measurement.All subjects were assessed for anthro-pometric parameters [weight, height and triceps skinfold thickness (TSFT)] by a trained nutritionist during the first 3 days of hospitalization. All measure-ments were carried out by the same person.
Body weight was measured to the nearest 0.1 kg using a Seca scale with the participants barefoot and wearing light clothing. Height was measured to the nearest 0.1 cm using a mounted tape; the children were barefoot with arms hanging freely at their sides.
To evaluate a patient’s nutritional status, weight-for-age (W/A), height-for-age (H/A) and weight-for-height (W/H) were calculated [1].
W/A = [observed weight/median •weight (same age and sex)] × 100;
H/A = [observed height/median •height (same age and sex)] × 100;
W/H = [observed weight/median •height (same height and sex)] × 100.Malnutrit ion was defined by
the criteria established by Waterlow, 75%–90%, 60%–74%, and < 60% of the median sex-specific reference values of W/A of this population; 90%–95%, 85%–89%, and < 85% of the median sex-specific reference values of H/A of this population; 81%–90%, 70%–80% and < 70% of the median sex-specific reference values of W/H of this popula-tion were considered to indicate mild, moderate and severe malnutrition re-spectively [10].
TSFT was measured with a skinfold calliper to the nearest 0.1 mm at the midpoint of the arm between the tips of the acromion process and the olecranon process. The mean of 3 measurements was used. Criteria used to define malnu-trition were TSFT values < 10th centile of reference data based on the results of the National Health and Nutrition Examination Survey [11].
Statistical analysis Statistical analysis was performed with SPSS, version 11.5. Continuous variables were presented as mean and standard error of the mean (SEM), while categor-ical variables were presented as number and percentage. The chi-squared test was used to compare differences in cat-egorical variables and the independent t-test for continuous variables between
Book 17-1.indb 37 1/3/2011 1:38:37 PM

EMHJ • Vol. 17 No. 1 • 2011 Eastern Mediterranean Health JournalLa Revue de Santé de la Méditerranée orientale
38
boys and girls. P < 0.05 was considered to indicate statistical significance.
Results
Table 1 shows the basic characteristics of the study subjects. The study sample comprised 67 girls (47.9%) and 73 boys (52.1%), with a mean age of 6.32 (SEM 0.32) years for girls and 6.53 (SEM 0.34) years for boys. The length of hospital stay varied from 1 to 36 days. There were no significant differences in demographic data between the 2 groups (P > 0.05).
Table 2 shows the anthropometric data of the children. The mean of W/A was significantly higher in boys than
in girls (P < 0.05). There were no sig-nificant differences in means of other anthropometric data.
According to W/A data, 68 (48.6%) of the patients studied were malnour-ished, 20 (14.3%) moderately/severely so (Table 3). From the H/A data, 43 (30.7%) of the patients studied were malnourished, 12 (8.6%) moderately/severely so. According to W/H data, 45 (32.2%) of the patients studied were malnourished, 13 (9.3%) moderately/severely so. TSFT results indicated that 20 (14.3%) of the patients studied were malnourished.
The only significant difference be-tween boys and girls was in W/H data (P = 0.005).
Discussion
In our study we found that 48.6% of the children were underweight (low W/A), 30.7% were stunted (low H/A) and 32.2% were wasted (low W/H). Our findings also indicate that accord-ing to TSFT results, 20 (14.3%) of the patients studied were malnourished.
Consistent with our findings, Dogan et al. [1], in a study in Turkey covering 528 patients with mean age 5.8 years, chronic malnutrition was found in 27% of cases according to H/A, and acute malnutrition was found in 52.4% and 40.9% of cases according to W/A and W/H results respectively. In addi-tion, with regard to sex, no statistically
Table 1 Demographic characteristics of hospitalized children in Tabriz, 2008
Characteristic All children (n = 140) Boys (n = 73) Girls (n = 67)
Mean SEM Mean SEM Mean SEM
Age (years) 6.43 0.23 6.53 0.34 6.32 0.32
No. of family members 4.44 0.17 4.55 0.28 4.33 0.18
No. of children 2.06 0.08 2.11 0.11 2.00 0.12
Length of hospital stay (d) 5.37 0.44 5.30 0.67 5.45 0.57
No. % No. % No. %
Birth order
1st 65 46.4 30 41.1 35 52.2
2nd 54 38.6 31 42.5 23 34.3
3rd & higher 21 15.0 12 16.4 9 13.4
Father’s education
Illiterate 14 10.0 9 12.3 5 7.5
Literate 118 84.4 60 82.2 58 86.6
Higher educationa 8 5.7 4 5.5 4 6.0
Mother’s education
Illiterate 22 15.7 12 16.4 10 14.9
Literate 115 82.1 59 80.8 56 83.5
Higher educationa 3 2.1 2 2.7 1 1.5
Father’s jobb
High/moderate level 6 4.3 4 5.5 2 2.9
Low level 53 37.9 22 30.1 31 46.2
Very low level 81 57.8 47 64.4 34 50.7
Mother’s job
Housewife 134 95.7 68 93.2 66 98.5
Employed 6 4.3 5 6.8 1 1.5aUniversity plus. bHigh/moderate = management, skilled worker, etc.; low = sales assistant, semi- skilled worker, etc.; very low level = farmer, service worker, labourer, etc. P > 0.05 (not significant). SEM = standard error of the mean.
Book 17-1.indb 38 1/3/2011 1:38:38 PM

املجلد السابع عرشاملجلة الصحية لرشق املتوسطالعدد األول
39
significant difference was found for the mean values of H/A and W/H, which is similar to our study. However, this study found no statistically significant differ-ence regarding the mean value of W/A, which is in contrast with our findings.
Consistent with our TSFT results, Pawellek, Dokoupil and Koletzko reported that their TSFT measure indicated 17.2% malnourishment in hospitalized children [11].
Findings on the nutritional status vary considerably: studies in preschool children in Nigeria and South Korea re-ported acute malnutrition rates of 7.4% and 16.5%, and chronic malnutrition rates of 60.7% and 38.2% respectively [3,12]. In Thailand, 55% of patients aged 1–15 years suffered from acute mal-nutrition [13] while in Mexico varying degrees of malnutrition were reported in 72.2% of hospitalized children [14]. According to 2 studies from different areas of Turkey, malnutrition rates in the country varied between 55.1% and 56.6% [15,16]. Ferreira and França in Brazil reported that 71.2% of the sam-pled children suffered from malnutrition at the time of hospitalization according to W/A figures [8].
In contrast with our findings, an-other study covering 3152 preschool children in Turkey showed that only 21% of the children were stunted, 3% were wasted and 10% were underweight [17].
In more developed countries malnutrition has been reported to be
24.1% in children admitted to a ter-tiary care centre in Germany [11], 24.5% children admitted to a tertiary care centre in Boston, United States of America (USA), based on < 90% of median weight for height [18] and 7% in children admitted to paediatrics or paediatric surgery at the children’s hospital in Glasgow, United Kingdom, also using < 90% of median W/H of na-tional reference data [19]. In addition, in a study in the Netherlands among all hospitalized children, 15% had acute and 20% had chronic malnutrition [20]. With a different cut-off point (–2
standard deviations below mean W/H of the USA National Center for Health Statistics centiles), a lower prevalence rate (14%) of malnutrition was found among 255 patients aged 3 months to 18 years admitted to a children’s hos-pital in Birmingham, United Kingdom [21]. A study in Canada in 1977 found 20% of hospitalized children to have at least 1 subnormal anthropometric variable [22]. A survey of Cooper et al. In the USA revealed that 54% of the patients were malnourished (< 90% of standard W/H after McLaren) [23].
Table 2 Anthropometric data for hospitalized children in Tabriz, 2008
Characteristic All children (n = 140) Boys (n = 73) Girls (n = 67)
Mean SEM Mean SEM Mean SEM
Weight (kg)a 20.15 0.67 21.01 0.99 19.22 0.89
Height (cm)a 112.75 1.55 113.70 2.17 111.72 2.22
Weight-for-age (%)b 89.98 1.39 92.65 2.11 87.06 1.73
Height-for-age (%)a 96.83 0.46 96.87 0.64 96.78 0.67
Weight-for-height (%)a 95.58 1.06 97.01 1.47 94.02 1.52
Triceps skinfold thickness (mm)a 9.99 0.26 10.12 0.37 9.86 0.37aP > 0.05 (not significant); bP < 0.05. SEM = standard error of the mean.
Table 3 Nutritional status of hospitalized children in Tabriz, 2008, according to anthropometric measurements
Parameter & nutrition status All children (n = 140)
Boys (n = 73)
Girls (n = 67)
No. % No. % No. %
Weight-for-agea
Normal 72 51.4 40 54.8 32 47.8
Mild malnutrition 48 34.3 26 35.6 22 32.8
Moderate/severe malnutrition 20 14.3 7 9.6 13 19.4
Height-for-agea
Normal 97 69.3 52 71.2 45 67.2
Mild malnutrition 31 22.1 17 23.3 14 20.9
Moderate/severe malnutrition 12 8.6 4 5.5 8 11.9
Weight-for-heightb
Normal 95 67.9 49 67.1 46 68.7
Mild malnutrition 32 22.9 22 30.1 10 14.9
Moderate/severe malnutrition 13 9.3 2 2.7 11 16.4
Triceps skinfold thicknessa
Normal 120 85.7 66 90.4 54 80.6
Malnutrition 20 14.3 7 9.6 13 19.4aP > 0.05 (not significant); bP = 0.005.
Book 17-1.indb 39 1/3/2011 1:38:38 PM

EMHJ • Vol. 17 No. 1 • 2011 Eastern Mediterranean Health JournalLa Revue de Santé de la Méditerranée orientale
40
Many factors, including variations between the countries that conducted the studies, diversity in dietary patterns, socioeconomic status, comorbidities, and medical care in hospital, from one country to another or even within the same country, play a role in causing vari-ations in the prevalence of malnutrition in different studies. Also, the choice of measures used to define malnutrition in children obviously affects the preva-lence rates detected, as is also apparent from the use of different measurements in our population. In addition, the differ-ences in prevalence rates may be related to the heterogeneity of study popula-tions, different criteria for malnutrition and different approaches to nutritional management.
Children are especially threatened by malnutrition, because of the high protein–energy cost of growth. So while the results of these different studies are difficult to compare, all have indicated that the prevalence of malnutrition among hospitalized children is still high and has not decreased over the past 15 years.
In conclusion, our study shows that the prevalence of malnutrition among hospitalized children is relatively high. This warrants attention because malnu-trition among hospitalized children is an even more severe threat, not only for immediate survival, but also for growth, long-term development and health outcomes (e.g. high susceptibility to infection, delayed wound recovery,
muscle weakness, and inability to cope with stress). This situation may lead to longer hospital stay and results in increased cost to the hospital and so-ciety. Therefore, the development and implementation of effective strategies for detection and treatment of malnutri-tion in paediatric patients, appropriate governmental policies and education regarding different, balanced and suf-ficient nutrient intake is of the utmost importance.
Acknowledgement
The authors thank the Research Vice Chancellor of Tabriz University of Med-ical Sciences for the financial support.
References
Dogan Y et al. Nutritional status of patients hospitalized in 1. pediatric clinic. The Turkish Journal of Gastroenterology, 2005, 16(4):212–216.
Hankard R et al. Nutritional status and risk in hospitalized chil-2. dren. Archives of Pediatrics, 2001, 8(11):1203–1208.
Waitzberg DL, Caiaffa WT, Correia MITD. Hospital malnutri-3. tion: the Brazilian national survey(IBRANUTRI): a study of 4000 patients. Nutrition, 2001, 17(7&8):573–580.
Correia MITD, Waitzberg DL. The impact of malnutrition on 4. morbidity, mortality, length of hospital stay and costs evalu-ated through a multivariate model analysis. Clinical Nutrition, 2003, 22:235–239.
Wakahara T et al. Nutritional screening with Subjective Global 5. Assessment predicts hospital stay in patients with digestive diseases. Nutrition, 2007, 23(9):634–639.
Yamauti AK et al. Subjective global assessment of nutritional 6. status in cardiac patients. Arquivos Brasilieros de Cardiologia, 2006, 87(6):707–712.
Sungurtekin H et al. Comparison of two nutrition assess-7. ment techniques in hospitalized patients. Nutrition, 2004, 20:428–432.
Ferreira HS, França AOS. Evolução do estado nutricional de 8. crianças submetidas a internacao hospitalar [Evolution of nutritional status in hospitalized children]. Jornal de Pediatria, 2002, 78:491–496.
Baker S. Protein energy malnutrition in the hospitalized pa-9. tient. In: Walker WA, Watkins JB, Duggan C, eds. Nutri-tion in pediatrics, 3rd ed. London, BC Decker Inc Hamilton, 2003:910–916.
Needleman RD. Assessment of growth. In: Behrman RE, Klieg-10. man RM, Jenson HB. Nelson textbook of pediatrics, 16th ed. Philadelphia, WB Saunders, 2000:57–61.
Pawellek I, Dokoupil K, Koletzko B. Prevalence of malnutri-11. tion in paediatric hospital patients. Clinical Nutrition, 2008, 27:72–76.
Cruz JR et al. Estado nutricional de niños preescolares guate-12. maltecos hospitalizados por infecciones respiratorias agudas
[Nutritional status of Guatemalan preschool children hospital-ized for acute respiratory infections]. Archivos Latinoamerica-nos de Nutricion, 1989, 39:251–262.
Tienboon P. Nutritional status of pediatric patients: Maharaj 13. Nakorn Chiang Mai Hospital. Thai Journal of Parenteral and Enteral Nutrition, 1995, 6:3–14.
Cortes RV, Nava-Flores G, Perez CC. Frecuencia de la desnu-14. trición en niños de un hospital pediátrico de tercer nivel [Fre-quency of malnutrition in children in a tertiary level pediatric hospital]. Revista Mexicana de Pediatría, 1995, 62:131–133.
Ozer N et al. Determination of malnutrition in hospitalized 15. children. Turkish Klinial Journal of Pediatrics, 2001, 10:133–138.
Genel F et al. Prevalence of anemia and malnutrition in 16. hospitalized cases. Turkish Klinial Journal of Pediatrics, 1997, 6:173–177.
Tuncbilek E, Unalan T, Coskun T. Indicators of nutritional status 17. in Turkish preschool children: results of Turkish Demographic and Health Survey 1993. Journal of Tropical Pediatrics, 1996, 42:78–84.
Hendricks KM et al. Malnutrition in hospitalized pediatric 18. patients. Current prevalence. Archives of Pediatrics and Adoles-cence Medicine, 1995, 149:1118–1122.
Hendrikse WH, Reilly JJ, Weaver LT. Malnutrition in a chil-19. dren’s hospital. Clinical Nutrition, 1997, 16:13–18.
Hulst J et al. Malnutrition in critically ill children: from admis-20. sion to 6 months after discharge. Clinical Nutrition, 2004, 23:223–232.
Moy RJD, Smallmann S, Booth IW. Malnutrition in a UK chil-21. dren’s hospital. Journal of Human Nutrition Dietetics, 1990, 3:93–100.
Parsons HG et al. The nutritional status of hospitalized children. 22. American Journal of Clinical Nutrition, 1980, 33:1140–1146.
Cooper A et al. Nutritional assessment. An integral part of the 23. preoperative pediatric surgical evaluation. Journal of Pediatric Surgery, 1981, 16:554–560.
Book 17-1.indb 40 1/3/2011 1:38:38 PM

املجلد السابع عرشاملجلة الصحية لرشق املتوسطالعدد األول
41
Profile of drug users in Karachi city, PakistanH. Ali,1 R. Bushra 1 and N. Aslam 1
ABSTRACT Drug use has been identified as a major public health issue in Pakistan. A descriptive questionnaire survey in Karachi city was made to identify the socioeconomic profile and beliefs and practices of 500 drug users. The most commonly used drugs were cocaine (19.0%) and crack-cocaine (15.0%), followed by amphetamines (11.0%), alcohol, caffeine, barbiturates and benzodiazepines (10.0% each). Key psychological factors leading to drug use were problems with parental or marital relations or break-up of a relationship (45.0%). Drugs were seen as an escape from stressful life events (28.0%) or feelings of failure (18.2%). Many drug users blamed the origins of their drug use on bad social influences (47.0%) or socioeconomic problems (23.4%). Preventive measures are needed to decrease the rate of drug addiction in Karachi.
1Ziauddin College of Pharmacy, Ziauddin University, Clifton, Karachi, Pakistan (Correspondence to R. Bushra: [email protected]).
Received: 03/03/09; accepted: 29/06/09
مرتسم معاقري املخدرات يف مدينة كراتيش بباكستانهوما عيل، ربيعة البرشى، نوشني إسالم
املرتسم لتحديد كراتيش مدينة الوصفي يف للمسح استبيان ُأعد وقد باكستان. املخدرات مشكلة صحية عمومية كربى يف معاقرة ُتعد اخلالصة: االجتامعي واالقتصادي واملعتقدات واملامرسات لدى 500 من معاقري املخدرات. وكان أكثر املخدرات استخدامًا هو الكوكائني )19.0%( ومشتقات الكوكائني التي يتم تعاطيها بالتدخني )15.0%(، يليها األمفيتامني )11.0%(، ثم الكحول، والكافئني، والباربيتوريات، والبنزوديازيبني )10.0% لكل منها(. أما العوامل الرئيسية املؤدية ملعاقرة املخدرات فتكاد تنحرص يف املشاكل يف العالقات مع الوالدين، أو بني الزوجني، أو االنفصال )45.0%(. كام ُتَعُد املخدرات وسيلًة للهرب من ضغوط احلياة )28.0%( أو الشعور باإلحباط )18.2%(. وألقى الكثري من معاقري املخدرات باللوم يف مرشوعهم بمعاقرة املخدرات عىل التأثريات االجتامعية السيئة )47.0%( أو املشاكل االجتامعية واالقتصادية )23.4%(. ومن الواضح أن هنالك حاجة إىل اختاذ
تدابري للحد من معدل إدمان املخدرات يف كراتيش.
Profil des utilisateurs de drogues dans la ville de Karachi (Pakistan)
RÉSUMÉ L’usage de drogues a été identifié comme un problème de santé publique majeur au Pakistan. Une enquête descriptive par questionnaire dans la ville de Karachi a été élaborée pour identifier le profil socio-économique de 500 utilisateurs de drogues, leurs croyances et leurs pratiques. Les drogues les plus fréquemment utilisées étaient la cocaïne (19,0 %) et le crack (15,0 %), suivies par les amphétamines (11,0 %), l’alcool, la caféine, les barbituriques et les benzodiazépines (10,0 % respectivement). Les facteurs psychologiques déclenchants conduisant à l’utilisation de drogues étaient les problèmes relationnels avec des parents ou avec des conjoints ou une rupture relationnelle (45,0 %). Les drogues étaient perçues comme une échappatoire aux événements stressants de la vie (28,0 %) ou aux sentiments d’échec (18,2 %). De nombreux utilisateurs de drogues expliquaient que les mauvaises fréquentations (47,0 %) ou les problèmes socio-économiques (23,4 %) étaient à l’origine de leur utilisation de drogues. Des mesures préventives sont nécessaires pour réduire le taux de toxicomanie à Karachi.
Book 17-1.indb 41 1/3/2011 1:38:39 PM

EMHJ • Vol. 17 No. 1 • 2011 Eastern Mediterranean Health JournalLa Revue de Santé de la Méditerranée orientale
42
Introduction
Drug dependence is defined as “….a state arising from repeated, periodic or continuous administration of a drug that results in harm to the individual and sometimes to society” [1]. There is a large and growing body of research on the causes, risk factors and correlates of substance use [2–7]. Generally, addic-tive drugs can act as positive reinforcers (producing euphoria) or as negative reinforcers (alleviating symptoms of withdrawal or dysphoria) [6,7]. The drug abuser may expect or perceive the benefits of drug use as the attainment of pleasurable feelings (relaxation), increased social interactions (reduced inhibition), alteration of their psycho-logical condition to a more desirable state (escapism), physical changes (an-abolic steroids) or avoidance of with-drawal symptoms in someone who is dependent on drugs [8].
According to the World drug report 2000, from the United Nations Drug Control Programme, Pakistan is one of the countries hardest hit by the narcot-ics industry [9]. According to a survey in 2005 there are about 3.5 million drug abusers, and the numbers are growing at an annual rate of 7% [10]. An exami-nation of the social and demographic correlates of drug users in Karachi re-vealed that 71.5% were aged less than 35 years, with the highest proportion in the 20–30 years age group [10]. Al-most 50% of drug users were illiterate, yet, surprisingly, a similar percentage was employed. Among occupational categories, the frequency of drug abuse was highest among those in skilled and
unskilled labour categories (50.8%), followed by sales (16.8%), agriculture (7.4%) and students (7.4%) [10].
The present study aimed to add to the body of knowledge about drug use in Pakistan by describing the socioeco-nomic profile and beliefs and practices of a sample of drug users in the city of Karachi, Pakistan.
Methods
This was a descriptive questionnaire study of drug users in Karachi city, Paki-stan. Karachi is one of the world’s largest cities in terms of population (around 18 million), with a mix of ethnic groups.
SampleThe sample was a convenience sample of 500 drug users located from differ-ent areas of Karachi and including people from different age groups, social backgrounds and employment status. A group of volunteer students from Ziauddin University were trained in how to conduct interviews and fill the questionnaire. The field workers visited different areas of the city which had a reputation of being places used by drug addicts and identified suitable people to interview. Some drug users were identi-fied from personal contacts through the university.
All individuals participating in the study were initially approached by the field workers and informed about the objectives of the study and were given an explanation about the questionnaire, that participation was entirely on a vol-untary basis and that responses were
anonymous. The study was approved by the ethical committee of Ziauddin University.
The drug users were interviewed by a researcher using a structured questionnaire, which was also trans-lated into Urdu language to assist those who wished to complete it themselves. The specially-designed questionnaire comprised 25 close-ended plus 5 open-ended questions. The demographic data of participants was limited to age, sex and occupation. The survey form was designed to obtain information about the respondents’ drug use practices (types of drugs used, sources of drugs and frequency and routes of use); atti-tudes to their drug use (motivation for drug use in terms of mood before and after taking drugs, and its effect on social relationships and their role in society); and beliefs (about the causes of their drug dependency and parental/ family response to drug use).
The data were analysed and pre-sented as simple frequencies and per-centages.
Results
Demographic data
Out of the 500 participants, 389 (77.8%) were males and 111 (22.2%) were females. A majority of respondents (59.4%) were aged 15–30 years (Table 1). The occupations of the drug users were: employer (22%), student (15%), beggar (29.6%), general duty servant (25%) and other (9.4%).
Table 1 Age and sex distribution of the sample of drug users
Age group (years) Total (n = 500) Males (n = 389) Females (n = 111)
No % No. No % No.
15–20 112 22.4 97 86.6 15 13.4
21–30 185 37.0 139 75.0 46 24.8
31–40 145 29.0 106 73.1 39 26.8
41–50 58 11.6 47 81.0 11 18.9
Book 17-1.indb 42 1/3/2011 1:38:39 PM

املجلد السابع عرشاملجلة الصحية لرشق املتوسطالعدد األول
43
Pattern of drug use
The most commonly used drugs were cocaine (19.0%) and crack-cocaine (15.0%), followed by amphetamines (11.0%), alcohol, caffeine, barbiturates and benzodiazepines (10.0% each). Most of the individuals had poly-drug addiction.
Nasal inhalation was reported to be the most frequent mode of admin-istration of drugs (31.6%), followed by smoking (28.0%), oral (19.6%) and parenteral routes (8.0%). About 12.8% used a combination of oral and parenteral modes (Table 2).
Most drug users (67.0%) obtained their drugs from an unknown person,
while 23.0% obtained supplies from a friend and 10.0% from a pharmacy.
Motivation for taking drugs
Before taking drugs many of the respondents reported physical symp-toms such as feelings of “creeping”/dizziness/body aches (24.2%), sleep problems (18.6%) and vertigo/head-aches (17.8%). Other respondents had mood problems, such as anxiety/anger (23.4%) and depression (16.0%) (Table 3). After taking drugs they reported feelings of calm and peaceful-ness (22.0%), that all their problems were solved (19.4%) or a general eleva-tion of mood (12.8%).
Beliefs about the causes of drug useA majority of respondents started drug use due to bad social influences (keeping “bad company”) (47.0%). The second main cause was poor employ-ment opportunities and financial diffi-culties (23.4%). Some users developed their habit after using prescribed drugs (6.6%), while a few attributed it to ease of availability of drugs (3.2%) (Table 4).
On a psychological level, the most common reason given by respondents for starting drug use was stressful life events (28.0%), poor marital relations (21.4%), feeling of failure in life (18.2%) and poor parental relations (15.8%) (Table 4). Only 25.4% blamed them-selves for starting drug use; the rest put the blame on their socioeconomic situ-ation, parents/friends or a psychological or emotional crisis
Attitudes to quittingA high proportion (78.2%) of drug us-ers wanted to quit their drug habit, while 21.8% were not willing to quit. Less than a third of the respondents (29.0%) had ever tried to give up drug use by them-selves and the rest had never attempted to quit (38.8%) or thought that they could not do so (32.2%).
When asked about the conditions in which they would be ready to quit drug use, 37.8% of respondents agreed they would quit if their employment/fi-nancial problems were solved or if their family life became more stable (29.4%) or they achieved success in life (10.6%); 21.8% did not recognize the need to give up their addiction.
Beliefs about effect of drug use on social lifeA majority of the respondents reported that their parents/family (54.8%) knew about their involvement in drug use; 15.6% of users satisfied their needs at home, 44.6% took drugs on the street and the remainder (44.6%) used drugs at friends’ homes. When asked about
Table 2 Types of substances used, frequency of drug use and source of money of the sample of drug users (n = 500)
Variable No. of respondents
%
Type of substance used
Cocaine 95 19.0
Crack-cocaine 75 15.0
Amphetamines 55 11.0
Alcohol 50 10.0
Barbiturates 50 10.0
Benzodiazepines 50 10.0
Caffeine 50 10.0
Ecstasy 25 5.0
Cannabis 25 5.0
Morphine and its analogs 25 5.0
Route of administration of drugs
Nasal inhalation 158 31.6
Smoking 140 28.0
Oral 98 19.6
Parenteral 40 8.0
Oral + parenteral 64 12.8
Frequency of drug use
Once a day 91 18.2
Twice a day 111 22.2
Alternate days 81 16.2
When needed 217 43.4
Source of money for buying drugs
Employment 191 38.2
Pocket money 148 29.6
Borrowed 129 25.8
Stolen 32 6.4
Book 17-1.indb 43 1/3/2011 1:38:39 PM

EMHJ • Vol. 17 No. 1 • 2011 Eastern Mediterranean Health JournalLa Revue de Santé de la Méditerranée orientale
44
others’ response to their drug use, 42.6% believed that their parents or family
wanted them to stop, but 30.4% thought that they did not care. Over half of drug
users (56.8%) admitted that their re-lationships with their family or friends were affected by their habit, whereas 43.2% believed there was no effect on relationships. Of the respondents, 41.2% perceived themselves as active and contributing members of society and 58.2% believed that they were not a source of harm to society.
Discussion
The present study of drug users in Kara-chi assessed the demographic data and patterns of type of drug use. Drug users tended to be younger: individuals aged between 15 and 20 years made up 50% of this sample of drug users. Women were only 22.2% of the sample. The most frequent mode of administration of drugs was through nasal inhalation (31.6%) or smoking (28.0%). However, 8.0% used parenteral routes or a com-bination of oral and parenteral routes (12.8%). Injecting drug use is associated with the spread of bloodborne infec-tions. Most of the drug users (67.8% in total) paid from their salary or pocket money to buy drugs. Some of them borrowed money from friends and a few admitted to stealing money to fund their drug use.
The study also assessment drug us-ers’ beliefs about the causes of their drug use and the effect it had on family and friends. A high proportion of drug users (45.0% in total) reported relationship problems as the main psychological factor leading to their drug use: poor relations with parents or a spouse or break-up of a relationship. Most drug users said that they took drugs as an escape from stressful life events (28.0%) or feelings of failure (18.2%). They re-ported feelings of calm and peacefulness (22.0%), that all their problems were solved (19.4%) and general mood el-evation (12.8%) after taking drugs. Pre-vious surveys distinguished the factors that teenagers susceptible to drug abuse can often be identified by risk factors,
Table 3 Respondents’ reports of their motivation for using drugs (n = 500)
Variable No. of respondents
%
Mood before taking drugs
Addiction urge/dizziness/body aches 121 24.2
Anxiety/anger 117 23.4
Loss of sleep/restlessness 93 18.6
Vertigo/headaches 89 17.8
Depression/feeling sad 80 16.0
Mood after taking drugs
Relaxed, calm and peaceful 110 22.0
Feeling that all problems are solved 97 19.4
Physically active 87 17.4
Healthy and refreshing 73 14.6
Psychologically strong 69 13.8
Mood elevation 64 12.8
Table 4 Respondents’ beliefs about the causes of their drug dependency (n = 500)
Variable No. of respondents
%
Beliefs about origins of their drug use
Keeping “bad company” 235 47.0
Employment/financial problems 55 23.4
No reason (by chance) 44 8.8
After using prescribed drugs 33 6.6
Ease of availability 16 3.2
Other 55 11.0
Beliefs about psychological factors leading to their drug use
Stressful life events 140 28.0
Poor marital relations 107 21.4
Feeling of failure in life 91 18.2
Poor parental relations 79 15.8
Chronic illness 44 8.8
Relationship breakup 39 7.8
Beliefs about who/what to blame for start of their drug use
Employment/financial crisis 186 37.2
Myself 127 25.4
Parents/friends/relatives 113 22.6
Psychological or emotional crisis 74 14.8
Beliefs about parental/family response to their drug use
They want me to get stop it 213 42.6
They can’t help me 135 27.0
They don’t care 152 30.4
Book 17-1.indb 44 1/3/2011 1:38:39 PM

املجلد السابع عرشاملجلة الصحية لرشق املتوسطالعدد األول
45
such as emotional problems, depression or anxiety. These in turn create low self-esteem and a desire to escape feelings such as self-doubt, powerlessness and hopelessness leading to poor coping skills. This is why the use of psychoactive drugs is quite common in society even among those without any psychiatric disease [11–15].
Almost half of the drug users blamed their drug use on bad social influences (47.0%) or socioeconomic problems (23.4%), while a few (3.2%) com-mented on the easy access to socially ac-ceptable drugs such as alcohol, caffeine, central nervous system depressants, mood elevators, etc. A few individuals (6.6%) developed drug addiction after using prescribed drugs such as opiates, benzodiazepines and barbiturates for short-term treatment. Many respond-ents expressed a wish to quit their drug use habit, but 38.8% had never tried
to quit, while 32.0% believed that they were unable to give up the addiction. They believed that drug use was the best solution to their problems, giving them feelings of euphoria, heightened pleasure and reduced anxiety and de-pression. While more than half of drug users (56.8%) admitted that their habit had affected their relationships with family and friends, 58.8% believed that they were contributing towards society and their habit were harmless. On ex-ploring the willingness of drug users to quit, many of them said they would quit if their employment/financial problems were solved or they could enjoy a settled family life.
The ease of availability of narcotic drugs and psychotropic substances in many areas of Karachi has become a public health concern. The government of Pakistan has instituted a series of measures to address the situation but
has not completed the implementation of these. A comprehensive drug abuse control strategy demands a realistic as-sessment of the scope of the problem [16]. The available data indicate a sig-nificant increase in the use of morphine, heroin, opium, codeine, barbiturates and other natural, synthetic and semi-synthetics drugs in Karachi [16].
Our study confirms that habitual use of drugs to alter one’s mood, emo-tions and state of consciousness is very common in our society. Psychological and socioeconomic factors that lead people to abuse drugs should be ad-dressed at the government level in order to limit the risk of addiction in society. Education and awareness programmes for the public may help to prevent the inappropriate use of psychoactive drugs and opiates. Regular interventions to control the use of these drugs are also recommended.
References
Bennett PN, Brown MJ, eds. 1. Clinical pharmacology, 9th ed. Edinburgh, Churchill Livingstone, 2003.
Wallace JM Jr, Bachman JG. Explaining racial/ethnic differ-2. ences in drug use: the impact of background and lifestyle. Social Problems, 1991, 38:333–357.
Newcomb MD et al. Substance abuse and psychosocial risk 3. factors among teenagers: associations with sex, age, ethnic-ity, and type of school. American Journal of Drug and Alcohol Abuse, 1987, 13:413–433.
Koob G, Kreek MJ. Stress, dysregulation of drug reward path-4. ways, and the transition to drug dependence. American Journal of Psychiatry, 2007, 164:1149–1159.
Kalivas PW, Volkow ND. The neural basis of addiction: a pa-5. thology of motivation and choice. American Journal of Psychia-try, 2005, 162:1403–1413.
Spanagel R, Weiss F. The dopamine hypothesis of reward: past 6. and current status. Trends in Neurosciences, 1999, 22:521–527.
Stolerman I. Drugs of abuse: behavioural principles, meth-7. ods and terms. Trends in Pharmacological Sciences, 1992, 13:170–176.
O’Brien CP. Drug addiction and drug abuse. In: Brunton LL, Lazo 8. JS, Parker KL, eds. Goodman and Gilman’s the pharmacological basis of therapeutics, 11th ed. New York, McGraw-Hill, 2006.
Scott J. Substance use and misuse. In: Winfield AJ, Richards 9. RME, eds. Pharmaceutical practice, 3rd ed. Edinburgh, Church-ill Livingstone, 2007.
Niaz U et al. A survey of psychosocial correlates of drug abuse 10. in young adults aged 16-21, in Karachi; identifying “high risk” population to target interventions strategies. Pakistan Journal of Medical Sciences, 2005, 21:271–277.
Harvey RA et al., eds. 11. Lippincott’s illustrated reviews: pharmacol-ogy. Philadelphia, Lippincott William and Wilkins, 2006.
Byrne B. Relationships between anxiety, fear, self-esteem, 12. and coping strategies in adolescence. Adolescence, 2000, 35:201–215.
Tripathi KD. 13. Essentials of medical pharmacology. New Delhi, Jaypee Brothers Medical Publishers, 2003.
Wexler M. Adolescent drug use and psychological health: a 14. longitudinal study. American Psychologist, 1991, 46:165.
Luscher C. Drugs of abuse. In: Katzung BG, ed. 15. Basic and clini-cal pharmacology, 10th ed. New York, McGraw-Hill, 2007.
Drug abuse assessment study of Pakistan 2000–0116. . Islamabad, Pakistan, Anti Narcotics Force in association with United Na-tions Drug Control Programme, 2001.
Book 17-1.indb 45 1/3/2011 1:38:39 PM

EMHJ • Vol. 17 No. 1 • 2011 Eastern Mediterranean Health JournalLa Revue de Santé de la Méditerranée orientale
46
Type-D personality: a predictor of quality of life and coronary heart diseaseT. Saeed,1 G.S.K. Niazi 1 and S. Almas 2
ABSTRACT The present study examined the association of type-D personality (and its components) with quality of life in cardiac patients compared with healthy people. A sample of 80 patients with myocardial infarction (MI) and 70 healthy people aged 45–60 years completed the WHO quality of life brief questionnaire and the 14-item type-D personality scale. A significantly higher percentage of the MI group scored positive for type-D personality compared with healthy individuals (71% versus 33%). Significantly more MI patients had low quality of life scores than did healthy individuals (64% versus 20%). Regression analysis showed that higher scores on type-D personality had a negative impact on quality of life in MI patients and that the social inhibition component had a greater impact than negative affectivity. Psychological assessment for type-D personality may be helpful in developing health care plans.
1Department of Management Sciences, Foundation University, Islamabad, Pakistan (Correspondence to T. Saeed: [email protected]).2Departement of Psychology, Quaid-i-Azam University, Islamabad, Pakistan.
Received: 07/02/09; accepted: 21/04/09
الشخصية من النمط D بوصفها ُمْنبِئًا بجودة احلياة ومرض القلب التاجيطاهر سعيد، غالم شابري خان نيازي، شاذيا أملاس
اخلالصـة: تستعرض هذه الدراسة درجة التـرابط بني الشخصية من النمط D )وعنارصها( وبني جودة احلياة يف مرىض القلب، مقارنًة باألصحاء. وشملت العينة ثامنني مريضًا باحتشاء عضل القلب، و70 شخصًا صحيحًا، تتـراوح أعامرهم بني 45 و60 عامًا، وقد استوفوا مجيعهم استبيان منظمة الصحة العاملية املخترص حول جودة احلياة، عىل سلم القياس ذي الـ 14 بندًا للشخصية من النمط D وقد ُلوِحَظ أن نسبة مئوية أكثر ارتفاعًا، بقدر ُيْعَتدُّ به إحصائيًا، من بني مرىض احتشاء عضل القلب قد أحرزوا درجات إجيابية عىل سّلم الشخصية من النمط D )%71(، باملقارنة مع األشخاص األصحاء )33%(. كام لوِحَظ أن عددًا أكرب، بمقدار ُيعَتدُّ به إحصائيًا، من املرىض باحتشاء عضل القلب لدهيم أْحَراز منخفضة عىل سّلم جودة احلياة يف أن األْحَراز األكثر ارتفاعًا لدى الشخصية من النمط D كان هلا أثر )64%( باملقارنة مع األشخاص األصحاء )20%(. وقد أوضح التحليل التحوُّسلبي عىل جودة احلياة يف مرىض احتشاء عضل القلب، وأن عنرص التثبيط االجتامعي قد كان له أثر أكرب من العواطف السلبية. وقد يساعد التقييم
النفيس للشخصية من النمط D عىل إعداد خطط الرعاية الصحية للُمتَّصفني هبا.
Personnalité de type D : un facteur prédictif de la qualité de vie et de coronaropathie
RÉSUMÉ La présente étude a examiné l’association de la personnalité de type D (et ses composantes) à la qualité de vie des patients atteints de troubles cardiaques comparativement à la qualité de vie des personnes en bonne santé. Un échantillon de 80 personnes atteintes d’un infarctus du myocarde et de 70 personnes en bonne santé, âgées de 45 à 60 ans, a rempli le questionnaire de l’OMS sur la qualité de vie dans sa version abrégée et l’échelle en 14 items sur la personnalité de type D. Un pourcentage significativement plus élevé du groupe de patients atteints d’infarctus de myocarde a obtenu un résultat positif pour la personnalité de type D par rapport au pourcentage du groupe des personnes en bonne santé (71 % contre 33 %). Les patients atteints d’infarctus du myocarde étaient plus nombreux à obtenir des résultats faibles en termes de qualité de vie que les personnes en bonne santé (64 % contre 20 %). L’analyse de régression a montré que les scores les plus élevés pour la personnalité de type D avaient un impact négatif sur la qualité de vie des patients atteints d’infarctus du myocarde et que la composante de l’inhibition sociale avait une influence plus forte que l’affectivité négative. Une évaluation psychologique permettant de dépister la personnalité de type D peut être utile pour l’élaboration de programmes de soins de santé.
Book 17-1.indb 46 1/3/2011 1:38:40 PM

املجلد السابع عرشاملجلة الصحية لرشق املتوسطالعدد األول
47
Introduction
The incidence of cardiovascular dis-ease (CVD) is increasing rapidly in the developing world and CVD is expected to become the leading cause of death in future decades [1]. The South-Asian countries contribute the highest proportion of CVD compared with any other region globally [2] and in Pakistan surveys indicate a very high prevalence of CVD with over 20% of the population affected, and rapidly rising rates in urban areas [3]. Acute myocardial infarction (MI) is most frequently (but not always) a mani-festation of coronary heart disease (CHD).
Psychosocial factors such as health-related beliefs, social support, coping style and personality type are impor-tant predictors of health or illness. For example, individuals with different personality characteristics have been found to differ in the way they explain their symptoms and seek medical assist-ance. Type-D personality is a construct characterized by the joint tendency to experience negative emotions and to inhibit these emotions, while avoiding social contacts with others [4]. Grande et al. identified the type-D personality pattern as consisting of 2 components: negative affectivity (a tendency to ex-perience negative emotions including depressed mood, anxiety, anger and hostile feelings) and social inhibition (avoidance of potential dangers in-volved in social interactions such as disapproval or non-reward by others) [5–8].
Inhibition of emotional expression in type-D people puts them at greater risk of serious health problems, includ-ing hypertension, CHD and other physical and mental disorders. Patients with type-D personality may be more inclined to engage in unhealthy be-haviours, such as smoking, drinking alcohol, physical inactivity and not ad-hering to dietary advice. They may re-frain from consulting a physician, and
if they do so, are less likely to comply with the advised treatment. Type-D personality may be prone to emotional distress such as anxiety, depression and anger in general and myocardial ischaemic events in particular [9]. The estimated risk of cardiac events was found to be 4.7 times greater for type-D patients than for non-type-D patients [5].
Poor health has a potent effect on an individual’s quality of life (QOL) [10]. The QOL concept incorporates a humanistic view of health, in which optimal autonomy, personal strength and positive meaning of life are central components [11]. The psychological, social, physical and environmental do-mains of QOL have a major impact on the perceived health of CHD patients [10]. In clinical settings, type-D person-ality and poor QOL are associated with high mortality in cardiac patients [12]. There is little published research on CVD from Pakistan [13] and even less about its relationship with psychologi-cal factors, personality characteristics and QOL. QOL has been studied in Pakistan with reference to stroke pa-tients and diabetics [14]. The aims of the present empirical study were to investigate whether type-D personality and its 2 components (negative affectiv-ity and social inhibition) prevail among MI patients in Pakistan as compared to healthy individuals and whether these have a negative impact on QOL among cardiac patients.
Methods
The study was conducted from May 2005 to August 2007.
SampleThe patients were selected from the outpatient department of a local cardiac centre of Rawalpindi, Pakistan. A total of 125 MI patients were initially selected for the study using convenience sampling. Out of these, 80 patients fulfilled the
inclusion criteria; 45 patients dropped out, as 18 refused to participate in the study and 27 did not fulfil the required criteria. Patients were those in the age range 45–60 years who were diagnosed for the first time with MI by a consultant cardiologist. The exclusion criteria were: silent MI, comorbid chronic physical diseases (cancer, HIV, diabetes, renal problems, hypertension, etc.), psycho-logical disorders and being on therapy for any chronic illness.
A group of 110 healthy individuals were also selected for comparison from among the patients’ family members using convenience sampling. Of these 70 participated in the study; 19 did not agree to participate and 21 were excluded as they did not fulfil the re-quired criteria. For the present research, healthy people were operationally defined as individuals who physically looked healthy and had not visited the physician for any chronic disease in the previous 12 months. The MI and healthy groups were not matched for any criteria.
InstrumentsTwo instruments were used in the study. Type D personality was measured using the 14-item type D scale (DS-14) de-veloped by Denollet [5], which consists of 14 items: 7 items evaluating type-D personality in terms of negative affectiv-ity and 7 items evaluating social inhi-bition. Subjects rated their responses on a 5-point Likert scale from 1 = false to 5 = true, with a total score ranging from 7–35 for negative affectivity and social inhibition dimensions, with cutoff scores of 21. The range of scores for type D personality was 14–70 with cutoff score of 42. The alpha reliability values of negative affectivity and social inhibi-tion in the present study were 0.71 and 0.61 respectively.
The World Health Organization quality of life questionnaire brief version (WHOQOL-BREF) [15] is a short version of the 100-item WHOQOL instrument, and consists of 26 items to
Book 17-1.indb 47 1/3/2011 1:38:40 PM

EMHJ • Vol. 17 No. 1 • 2011 Eastern Mediterranean Health JournalLa Revue de Santé de la Méditerranée orientale
48
measure overall QOL. The scoring is done on a 5-point Likert scale from 1 = very dissatisfied to 5 = very satisfied. A high score on the scale is an indication of good QOL. The alpha reliability value of QOL in the present study was 0.93.
Data collectionThe purpose of the study was explained to hospital authorities and permission was obtained. The selection criteria were followed by the consultant cardi-ologists for the selection of the patients. The participants were also briefed about the purpose of the study and assured about the confidentiality of the informa-tion provided by them. The protocol consisted of the demographic data sheet and 2 scales: the DS-14 and the WHOQOL-BREF. The questionnaires were personally distributed by the re-searchers to all respondents.
Data analysisThe chi-squared test was applied to examine the relation between the MI and healthy groups. Regression analysis was conducted to examine relationships among the 2 dimensions of type-D per-sonality (negative affectivity and social inhibition) and QOL. The total score of the 2 facets of type-D personality served as independent variables and QOL as the dependent variable. The adjusted value of R2 gives the more accurate pic-ture about the fitness of model and was therefore used to explain the variance in QOL accounted for by the 2 dimen-sions.
Results
Background dataA total of 80 MI patients and 70 healthy individuals participated: 49 males (61%) and 31 females (39%) in the MI group and 38 males (54%) and 32 females (46%) in the healthy group (Table 1). There was no statistical dif-ference between the MI patients and the healthy group on the basis of sex and age category.
QOL and type D personality scoresTable 2 shows that a significantly higher percentage of the MI group (71%) scored positive for type-D personality compared with the healthy individuals (33%). Similarly, significantly higher rates were found with respect to the negative affectivity (74% versus 26% respectively) and social inhibitions di-mensions of type-D personality (66%
versus 37% respectively). The results also revealed a significantly higher number of MI patients with low QOL (below the cut-off score) as compared to healthy individuals (64% versus 20%).
CorrelationsThe inter-correlations among type-D personality, its subscales negative affec-tivity and social inhibition, and QOL are shown on Table 3. There was a significant positive correlation between type-D personality and negative affec-tivity (r = 0.93, P < 0.01) and social inhibition scores (r = 0.90, P < 0.01). Negative affectivity and social inhibition scores had a significant positive correla-tion with each other (r = 0.59, P < 0.01). The results also showed a significant negative correlation between QOL and type-D personality scores (r = –0.71, P < 0.01), as well as type-D components negative affectivity (r = –0.64, P < 0.01)
Table 1 Demographic characteristics of patients with myocardial infarction and healthy people
Variable Healthy group(n = 70)
Myocardial infarction group
(n = 80)
t-value P-value
No. % No. %
Sex 1.32 0.09
Male 38 54 49 61
Female 32 46 31 39
Age group (years) 1.87 0.17
45–50 17 24 11 14
50–55 21 30 38 47
56–60 32 46 31 39
Table 2 Percentage of myocardial infarction patients and healthy people scoring positive for type D personality and poor quality of life
Scale Total(n = 150)
Healthy group(n = 70)
Myocardial infarction group
(n = 80)
χ2-value P-value
No. No. % No. %
Type-D personalitya 80 23 33 57 71 3.51 < 0.001
Negative affectivitya 77 18 26 59 74 3.59 < 0.001
Social inhibitiona 79 26 37 53 66 3.08 < 0.001
Low quality of lifeb 65 14 20 51 64 2.90 0.03aType-D personality scale (cut-off scores: type D personality = 42, negative affectivity = 21, social inhibition = 21). bWorld Health Organization quality of life questionnaire brief version (cut-off score = 78).
Book 17-1.indb 48 1/3/2011 1:38:40 PM

املجلد السابع عرشاملجلة الصحية لرشق املتوسطالعدد األول
49
and social inhibition (r = –0.67, P < 0.01).
The results of the multiple regres-sion analysis showed that both negative affectivity and social inhibition scores were significant predictors of QOL among cardiac patients. The value of adjusted R2 = 0.50 shows that 50% of the variance in QOL was explained by type-D personality (F = 40.43, P < 0.001). At the same time beta values of –0.34 (P < 0.01) and –0.43 (P < 0.001) for negative affectivity and social inhibi-tion respectively suggest that social in-hibition had a greater adverse effect on cardiac patients’ QOL than did negative affectivity (Table 4).
Discussion
The results of the study show that the rate of type-D personality was higher in MI patients compared with healthy individuals. These results are consistent with Pederson et al. who also showed a higher prevalence of Type-D personal-ity among cardiac patients [16]. Regres-sion analysis also revealed that type-D personality has a negative impact on QOL in cardiac patients and that the social inhibition component contrib-uted more to low QOL compared with
negative affectivity. Again, these agree with Pedersen et al. [16].
Possible reasons for such a finding lie in the characteristics of type-D per-sonality. Those with negative affectiv-ity are more prone towards anxiety and social inhibition, which leads to poor QOL [17]. Poor self-management, in particular inadequate consultation be-haviour, in type-D patients may explain their increased risk for adverse clini-cal outcomes resulting in poor QOL [17]. Reporting somatic symptoms and seeking medical assistance is less com-mon among MI patients with type-D personality, which further affects their QOL [17].
Type-D personality may be regard-ed as a psychopathological condition that can be referred for psychological evaluation. Psychological assessment for type-D personality can be helpful for developing health care plans for pa-tients. Cognitive behavioural therapy, social skills training, emotional support, interpersonal psychotherapy and other stress reducing techniques can be de-ployed in type-D people to improve their quality of life.
This study had some limitations. First, a cross-sectional study design does not allow for the determination of cause and effect. Secondly, the study did not
include information about the tech-niques and treatment used by the cardi-ologists and nurses. Thirdly, assessment of psychological distress was based on a self-report measure, although the sensi-tivity and specificity of this measure has been shown by others to be adequate. Finally, the study was based on data from outpatients and an unmatched sample of healthy people without tak-ing a history of chronic physical and psychological problems.
Further research should be con-ducted on a larger sample on a longi-tudinal basis in order to confirm these results and to explore new dimensions of personality and health. Further stud-ies on the psychological and biological features of type-D individuals may help develop treatment approaches to im-prove their psychological and physical health. It will be important to ascertain in epidemiological studies whether type D is not only a prognostic but also an etiological risk factor leading to the development of CVD. More diverse variables such as psychological distress, social support and clinical outcome together with its potential role in other somatic diseases and its prevalence in the general population should be con-sidered to validate the effects of the type-D construct.
Table 3 Inter-correlations among sub-scales of type-D personality and quality of life
Variable 1 2 3 4
Type-D personality 0.81
Negative affectivity 0.93* 0.71
Social inhibition 0.90* 0.59* 0.61
Quality of life –0.71* –0.64* –0.67* 0.93
*P < 0.01 (boldface shows alpha reliability values of variables).
Table 4 Multiple regression analysis showing impact of negative affectivity and social inhibition on quality of life
Model B SE β t-value P-value
Negative affectivity –1.01 0.32 –0.34 –3.08* 0.003
Social inhibition –1.50 0.38 –0.43 –3.88** < 0.001
R2 = 0.51, adjusted R2 = 0.50, F = 40.43, P < 0.001. SE = standard error.
Book 17-1.indb 49 1/3/2011 1:38:40 PM

EMHJ • Vol. 17 No. 1 • 2011 Eastern Mediterranean Health JournalLa Revue de Santé de la Méditerranée orientale
50
References
Tazeen H et al. General practitioners’ approach to hyperten-1. sion in urban Pakistan: disturbing trends in practice. Hyperten-sion, 2005, 1(11):1278–1283.
Khan SM et al. Knowledge of modifiable risk factors of heart 2. disease among patients with acute myocardial infarction in Karachi, Pakistan: a cross sectional study. BMC Cardiovascular Disorders, 2006, 6:18.
Reddy KS et al. Cardiovascular risk profile in industrial popula-3. tions across India: results from the CVD surveillance in indus-trial populations study. Indian Heart, 2005, 57:543.
Grande G et al Evaluation der deutschen Typ-D-Skala (DS14) 4. und Pravalenz der Typ-D-Personlichkeit bei kardiologischen und psychosomatischen Patienten sowie Gesunden [Evalua-tion of the German type d scale (DS14) and prevalence of the type d personality pattern in cardiological and psychosomatic patients and healthy subjects]. Psychotherapie, Psychosomatik, Medizinische Psychologie, 2004, 54:413–422.
Denollet J. DS14: standard assessment of negative affectivity, 5. social inhibition, and type D personality. Psychosomatic Medi-cine, 2005, 67:89–97.
Habra ME et al. Type D personality is related to cardiovascular 6. and neuroendocrine reactivity to acute stress. Journal of Psy-chosomatic Research, 2003, 55:235–245.
Schiffer AA et al. Failure to consult for symptoms of heart 7. failure in patients with a type-D personality. Heart, 2007, 93(7):814–818.
Type “D” for distressed. 8. Harvard Heart Letter, 2005, August (http://www.health.harvard.edu/newsweek/Type_D_for_distressed.htm, accessed 20 July 2010).
Pedersen SS et al. Type D personality is associated with im-9. paired health-related quality of life 7 years following heart
transplantation. Journal of Psychosomatic Research, 2006, 61(6):791–795.
Reklaitiene R et al. Quality of life and perceived health among 10. CHD patients and in general population. Acta Medica Litu-anica, 2004, 11(2):39–44.
Cella D, Nowinski C. Measuring quality of life in chronic ill-11. ness: the functional assessment of chronic illness therapy measurement system, Archives of Physical Medical Rehabilita-tion, 2002, 83(2):10–17.
Pedersen SS et al. Type-D personality but not implantable car-12. dioverter-defibrillator indication is associated with impaired health-related quality of life 3 months post-implantation. Eu-ropace, 2007, 9(8):675–680.
The atlas of heart diseases and stroke.13. Geneva, World Health Organization, 2006.
Nizami A et al. Relationship between anxiety, depression, 14. psychological well-being and quality of life in diabetic patients having haemodialysis. Journal of the Pakistan Psychiatric Society, 2005, 2(2):80–84.
WHOQoL Group. The development of the World Health 15. Organization quality of life assessment instrument (the WHO-QoL). In: Orley J, Kuyken W, eds. Quality of life assessment: international perspectives. Heidleberg, Springer-Verlag, 1994
Pedersen SS et al. Type-D personality is a predictor of poor 16. emotional quality of live in primary care heart failure patients independent of depressive symptoms and New York Heart Association functional class. Journal of Behavioral Medicine, 2010, 33(1):72–80.
Schiffer AA et al. Failure to consult for symptoms of heart 17. failure in patients with a type-D personality. Heart, 2007, 93(7):814–818.
Book 17-1.indb 50 1/3/2011 1:38:41 PM

املجلد السابع عرشاملجلة الصحية لرشق املتوسطالعدد األول
51
Comparison of microscopical examination and semi-nested multiplex polymerase chain reaction in diagnosis of Plasmodium falciparum and P. vivax M. Nateghpour,1 H. Abed Khojasteh,1 H. Keshavarz,1 H. Hajjaran,1 Gh. Edrissian,1 A. Rahimi 2 and N. Gobakhloo 1
ABSTRACT We compared light microscopy examination and a semi-nested multiplex PCR (SnM-PCR) assay in endemic areas of the Islamic Republic of Iran. A total of 68 individuals with malaria-positive and suspected malaria symptoms were included in the study. Giemsa-stained thick blood films were examined under a light microscope for malaria parasites in 100 and 200 fields. DNA was extracted from blood samples and SnM-PCR based on the amplification of the small sub-unit ribosomal RNA (ssrRNA) gene sequences was applied. Microscopical examination showed that 48.5% (33.8% P. vivax and 14.7% P. falciparum) and 50% (35.3% P. vivax and 14.7% P. falciparum) of the samples were positive in 100 and 200 fields respectively. SnM-PCR showed the same results as the 200 field microscopy.
1Department of Medical Parasitology and Mycology; 2Department of Epidemiology and Biostatistics, School of Public Health, Tehran University of Medical Sciences, Tehran, Islamic Republic of Iran (Correspondence to H. Abed Khojasteh: [email protected]).
Received: 21/04/09; accepted: 29/04/09
املنجلية رات املتصوِّ التعشيش يف تشخيص اجلزئي ب املركَّ للبوليمرياز السلسيل التفاعل املجهري وبني الفحص بني مقارنة رات النشيطة واملتصوِّ
مهدي ناطق بور، هدى عابد خجسته، حسني كشاورز، مها حجاران، غالم حسني إدريسيان، عباس رحيمي، نفيسة قباخلو
ب اجلزئي التعشيش، يف املناطق اخلالصـة: قد قارن الباحثون يف هذه الورقة بني الفحص املجهري وبني املقايسة بالتفاعل السلسيل للبوليمرياز املركَّاملوبوءة من مجهورية إيران اإلسالمية. وقد شملت الدراسة 68 شخصًا دماؤهم إجيابية للمالريا وهم ُيبدون أعراضًا توحي باملالريا. وفحصت أفالم كثيفة للدم بتلوين غيمزا باملجهر الضوئي بحثًا عن طفيليات املالريا يف ساحة تكبري 100 و200. واستخلص الدنا من عينات الدم وطبق عليه التفاعل السلسيل للبوليمرياز املرّكب اجلزئي التعشيش مع تضخيم متواليات جني الرنا الريبوزومي يف الوحدات الفرعية الصغرية. وأوضح الفحص املجهري أن 48.5% من العينات )33.8% من عينات املتصورات النشيطة و14.7% من عينات املتصورات املنجلية( إجيابية يف فحص ساحة التكبري 100، وأن %50 من العينات )35.5% من عينات املتصورات النشيطة و14.7% من عينات املتصورات املنجلية( إجيابية يف ساحة التكبري 200. وأظهَرْت نتائج التفاعل
السلسيل للبوليمرياز املرّكب اجلزئي التعشيش، أهنا مشاهبة للفحص املجهري يف ساحة التكبري 200.
Comparaison de l’examen microscopique et de l’amplification génique multiplex semi-nichée pour le diagnostic de Plasmodium falciparum et P. vivax
RÉSUMÉ Nous avons comparé l’examen microscopique optique et l’amplification génique (PCR) multiplex semi-nichée dans des zones d’endémie en République islamique d’Iran. Au total, 68 personnes dont les résultats d’analyse du paludisme étaient positifs ou qui présentaient des symptômes suspects de paludisme ont été incluses dans l’étude. Les gouttes épaisses colorées au Giemsa ont été examinés au microscope optique à la recherche de parasites du paludisme sur 100 et 200 champs microscopiques. L’ADN a été extrait des échantillons de sang et la PCR multiplex semi-nichée reposant sur l’amplification des séquences géniques d’une petite sous-unité d’ARN ribosomique a été utilisée. L’examen microscopique a révélé que 48,5 % (33,8 % pour P. vivax et 14,7 % pour P. falciparum) et 50 % (35,3 % pour P. vivax et 14,7 % pour P. falciparum) des échantillons étaient positifs sur 100 et 200 champs respectivement. La PCR multiplex semi-nichée a produit des résultats identiques à la microscopie sur 200 champs.
Book 17-1.indb 51 1/3/2011 1:38:41 PM

EMHJ • Vol. 17 No. 1 • 2011 Eastern Mediterranean Health JournalLa Revue de Santé de la Méditerranée orientale
52
Introduction
According to the latest report released by the World Health Organization, 247 million people were affected with malaria in the world and nearly one million deaths due to the disease were recorded in 2006 [1]. Four species, Plasmodium falciparum, P. vivax, P. ma-lariae and P. ovale are causative agents for malaria in humans. Drug selection for an effective and suitable treatment of malaria depends on precise laboratory identification of the species, and con-ventional light microscopy detection in Giemsa-stained thick and thin blood films is still considered the gold standard method [2]. Differentiation among spe-cies and observation of morphological changes caused by recent treatment are some advantages of the microscopy method [3]. Although this procedure is cheap and simple, it is time consuming and requires a well trained microscopist. Moreover, in cases of low parasitaemia and misdiagnosis in mixed infection, the risk of severe disease may be increased, particularly in falciparum malaria [4–6]. Therefore, in recent years many alterna-tive approaches such as rapid diagnostic tests (RDTs) and polymerase chain reaction (PCR) methods have been developed for detection and identifica-tion of malaria parasites [7–9]. These procedures have some advantages as well as a few disadvantages [9]. PCR-based methods are not able to evaluate parasite morphology through the devel-opmental stages [10].
This study was conducted to com-pare semi-nested multiplex (SnM)-PCR and the microscopical method in 100 and 200 fields of thick blood films for diagnosis of malaria parasites. The examination of 100 oil immersion fields is usually a standard criterion for routine purposes of malaria parasite identification [11]. Examination of 200 oil immersion fields is recommended in areas with relatively low degrees of parasitaemia [12].
Methods
Study areaThis study was undertaken from November 2006 to July 2007 in the Minab and Bandar-Abbas districts in Hormozgan province and Iranshahr district in Sistan and Baluchistan province, both malarious provinces, located in the south and south-eastern part of the Islamic Republic of Iran respectively.
The weather in these provinces is usually warm and humid. Nearly 80% of the detected cases of vivax and falci-parum malaria come from these parts of the country (Annual report of Cen-tre for Disease Management in Iran ). P. vivax is the predominant species and P. falciparum the second commonest in these areas.
Sample collectionWe selected 3 health centres as pas-sive sentinel sites for sampling in each district. A total of 68 individuals (56 from Hormozgan, 12 from Sistan and Baluchistan provinces) aged 2–60 years, comprising 18 females (26.5%) and 50 males (73.5%), were enrolled in the study: 34 of the considered cases were microscopical malaria positive and the other 34 cases were selected with suspected symptoms of malaria to optimize the SnM-PCR method. At the same time, before treatment, 2 Giemsa-stained thick films were made from each patient and venepuncture blood was collected in tubes containing EDTA for microscopical examination and SnM-PCR assay (1 mL for each). The venepuncture blood samples were stored at –20 °C until DNA extraction could be carried out.
The number of samples needed was calculated based on 11% disagreement between PCR and microscopical ex-amination for diagnosis of P. falciparum and P. vivax [13] with 95% confidence level and 80% power [14].
MicroscopyThick blood films were air-dried and stained for 30 min in 3% diluted Giemsa stain (pH 7.2). The slides were then rinsed with tap water and air-dried.
Thick films were diagnosed by skilled local microscopists at the place of sampling. All the slides were examined under × 1000 magnification for 100 and 200 oil immersion fields. In line with the aim of this study, a plus system of count-ing was used to determine parasitaemia: a code of 1–4 plus signs (+) was used [15] as follows:
+ = 1–10 parasites per 100 thick film •fields,
++ = 11–100 parasites per 100 thick •film fields,
+++ = 1–10 parasites per single thick •film field,
++++ = > 10 parasites per single thick •film field.Thick blood films and blood sam-
ples were sent to the Department of Medical Parasitology in Tehran Uni-versity of Medical Sciences to confirm the parasite species by PCR analysis and double-checking of microscopical examination.
DNA extractionDNA was extracted from 200 μL EDTA whole blood with the FlexiGene DNA Kit (Qiagen, Hilden, Germany) accord-ing to the manufacturer’s instruction. DNA samples were stored at –20 °C until PCR could be carried out.
S n M - P C R w a s p e r f o r m e d with primers described previously [13], with some modifications. The primers that were used, (DNA-Technology, Aarhus, Denmark) comprised a reverse primer (UNR) (5′-GACGGTATCTGATCGTC TTC-3′) that would hybridize to all Plasmodium spp. and a wide vari-ety of vertebrates, 2 forward primers that hybridize to mammals (HUF) ( 5 ′ - G A G C C G C C T G G A T A C -CGC-3′) or to all Plasmodium spp.
Book 17-1.indb 52 1/3/2011 1:38:41 PM

املجلد السابع عرشاملجلة الصحية لرشق املتوسطالعدد األول
53
(PLF) (5AGTGTGTATCAATC-GAGTTTC-3′) and 2 other reverse primers (FAR) (5′-AGTTCCC CTA-GAATAGTTACA-3′) hybridize only to P. falciparum and (VIR) (5′-AGG ACTTCCAAGCCGAAGC-3′) which hybridizes only to P. vivax.
PCR amplification
This method has 2 main steps: a first amplification with specific Plasmo-dium primers for ssrDNA and a sec-ond amplification having 2 separate amplifications with independent pairs of primers for P. vivax and P. falciparum [13]. In the first reaction, using UNR, HUF, and PLF primers, we expected to have 2 products: a 231 bp band from
UNR-HUF (the positive control for all samples), and a band of 787 bp resulting from UNR-PLF which shows the pres-ence of any Plasmodium spp.; this band detected only parasitaemia of more than 3% (Figure 1).
In the second reaction, which iden-tifies Plasmodium spp., the PLF, FAR and VIR primers were used. A band of 395 bp with PLF-FAR indicates P. falciparum infection and a band of 499 bp with PLF-VIR indicates P. vivax in-fection (Figure 2).
The first amplification reaction was performed in volumes of 50 µL and 2 µL of isolated DNA that were added to a PCR Master Mix, contain-ing 1.75 mM MgCl2, 200 µM dNTPs,
25, 25 and 10 pmol of UNR, PLF and HUF primers respectively, and 1.0 U of Taq polymerase (Roche Biotech) in the PCR buffer. The second PCR reac-tion was performed in 25 µL and 2 µL of 1/500 diluted PCR product from the first reaction, which were added to a PCR Master Mix containing 1.75 mM MgCl2, 200 µM dNTPs, 25, 10, 10 pmol of PLF, FAR and VIR primers respectively and 0.5 U of Taq polymer-ase (Roche Biotech) in the PCR buffer. Reactions were overlaid with 25 µL mineral oil. A thermal cycler (Techne, United States of America) was used for both reactions with some modifications in the cycling programmes. Reaction conditions (first reaction) were dena-turation at 94 °C for 4 min. followed by 35 cycles of 94 °C for 45 s, 48 °C for 1.5 min and 72 °C for 2 min. plus an extension at 72 °C for 8 min. The second PCR condition followed with initial denaturation at 94 °C for 3 min. and 35 cycles of 94 °C for 30 s, 48 °C for 30 s and 72 °C for 1 min plus an exten-sion at 72 °C for 5 min. PCR products were stained with ethidium bromide for visual detection by ultraviolet transil-lumination, and resolved by 1% agarose gel electrophoresis for both reactions.
Genomic DNA from healthy in-dividuals, with no history of malaria, living in non-endemic areas of the country were prepared and used as negative controls in all PCR assays. A P. berghei DNA sample was also used as the positive mammalian control, which gave a UNR–HUF band on the first amplification but no band on the sec-ond one.
Results
The comparative diagnosis results of P. vivax and P. falciparum between SnM-PCR procedure and microscopic method are summarized in Tables 1 and 2. Conventional microscopy on 100 fields of thick blood smears identi-fied 23 (33.8%) of the cases as P. vivax
Figure 2 Agarose gel electrophoresis of amplification products of second reaction of SnM-PCR [lane M: 50 bp marker DNA ladder; lanes 1–8: Plasmodium falciparum (395bp); lanes 9–12: Plasmodium vivax (499 bp); lane 13: negative control]
Figure 1 Agarose gel electrophoresis of amplification products of first reaction of SnM-PCR [lane M: 50 bp marker DNA ladder; lanes 1, 2, 4, 5, 6: Plasmodium-infected samples with > 3% parasitaemia; lane 3: Plasmodium-infected sample with < 3% parasitaemia; lane 7: uninfected sample; lane 8: negative control]
Book 17-1.indb 53 1/3/2011 1:38:42 PM

EMHJ • Vol. 17 No. 1 • 2011 Eastern Mediterranean Health JournalLa Revue de Santé de la Méditerranée orientale
54
and 10 (14.7%) as P. falciparum (Table 1). In contrast 24 (35.3%) were identi-fied as P. vivax and 10 (14.7%) as P. falciparum on 200 fields of thick blood smears (Table 2). Using SnM-PCR the same results were obtained as for 200 fields of microscopical examination. To demonstrate the parasitaemia situation, the results for counting parasites in 100 thick smear fields are tabulated in Table 3. Meanwhile, 1 thick smear of P. vivax which was negative in 100 fields became 1+ when counting was carried out on up to 200 fields.
McNemar analysis showed signifi-cant agreement between the results for the SnM-PCR method and 100 fields (kappa = 0.97, P = 1.00) and also 200 fields (kappa = 1.00, P = 1.00) micro-scopical examination.
In order to confirm the SnM-PCR results and the specificity assurance of this method, 3 isolates were randomly sequenced by MWG Biotech (Ebers-berg, Germany) and submitted in the National Center for Biotechnology Information (NCBI) gene bank data-bases as: IRN-BV1 (accession number: EU551666, P. vivax from Bandar-Abbas district, Hormozgan province), IRN-SF1 (accession number: EU551667, P. falciparum from Sistan and Balu-chistan province), IRN–BF1 (accession number: EU551668 P. falciparum from Bandar-Abbas district, Hormozgan province)
Discussion
Since the latter part of the 19th cen-tury the microscope has been used as an useful tool for the detection of P. falciparum [16] and it is still considered the best tool for the diagnosis of malaria parasites in most malarious areas. The emergence of novel and sensitive tech-niques based on molecular studies such as PCR means the accuracy of light mi-croscopic diagnosis of malaria parasites has become more or less negotiable by some researchers.
Results from a study in a malaria-en-demic but unstable transmission district showed that 158, 89, 8 and 25 out of 280 Giemsa-stained slides examined with light microscope were P. vivax, P. falci-parum, mixed (P. falciparum and P. vivax) and negative cases respectively [17]. Us-ing nested PCR assay for the same blood samples resulted in 145, 79, 41 and 15 P. vivax, P. falciparum, mixed and negative respectively The same pattern of results was found in another Iranian study [18], i.e. PCR lowered the detection of
P. falciparum and P. vivax positive cases compared with microscopy. Another comparative study showed a pattern of results different from these 2 for P. vivax and P. falciparum, i.e. PCR increased the detection of positive cases: out of 174 Giemsa-stained slides examined with the light microscope 40 were P. falciparum, and 26 were P. vivax; using nested PCR assay on the same samples, 50 were P. fal-ciparum and 31 P. vivax [2].
Tham et al. showed that out of 52 samples 16, 34 and 0 were diagnosed as
Table1 Comparative identification study between SnM-PCR and microscopical method (100 fields of thick blood smear) for diagnosis of Plasmodium falciparum (Pf) and P. vivax (Pv)
SnM-PCR Microscopy Total
Positive (No.) Negative (No.)
Pf Pv Pf + Pv
Positive
Pf 10 0 0 0 10
Pv 0 23 0 1 24
Pf + Pv 0 0 0 0 0
Negative 0 0 0 34 34
Total 10 23 0 35 68
Table 2 Comparative identification study between SnM-PCR and microscopical method (200 fields of thick blood smear) for diagnosis of Plasmodium falciparum (Pf) and P. vivax (Pv)
SnM-PCR Microscopy Total
Positive (No.) Negative (No.)
Pf Pv Pf + Pv
Positive
Pf 10 0 0 0 10
Pv 0 24 0 0 24Pf + Pv 0 0 0 0 0
Negative 0 0 0 34 34Total 10 24 0 34 68
Table 3 Number of parasites in 100 thick smear fields of Plasmodium vivax and P. falciparum
Parasite No. Total
1+ 2+ 3+ 4+
P. vivax 5 7 8 3 23
P. falciparum 1 3 2 4 10
Total 6 10 10 7 33
A plus system of counting was used [15] as follows: 1+ = 1–10 parasites per 100 thick film fields; 2+ = 11–100 parasites per 100 thick film fields; 3+ = 1–10 parasites per single thick film field; 4+ = > 10 parasites per single thick film field.
Book 17-1.indb 54 1/3/2011 1:38:44 PM

املجلد السابع عرشاملجلة الصحية لرشق املتوسطالعدد األول
55
P. falciparum, P. vivax and mixed respec-tively by light microscopy and 16, 34, 2 were diagnosed as P. falciparum, P. vivax and mixed respectively by PCR [7]. PCR assay was considered equivalent to light microscopy method in the diagno-sis of P. falciparum and P. vivax.
In the present study we compared PCR technique with conventional mi-croscopy. Our findings showed that there were no significant differences between PCR assay and microscopical examina-tion for malaria diagnosis if the thick blood smears were examined precisely in at least 100 fields by a trained microscopist.
The results of microscopical examination of 200 fields were closer to the results of PCR than 100 fields of thick blood films. In fact, microscopical diagnosis of malaria parasites depends primarily on the skill of the personnel and the quality of the materials and equipment.
In conclusion, although PCR is a valuable method for detecting malaria parasites, particularly in low-level parasi-taemia, microscopical diagnosis still re-tains its unique usefulness for detection of malaria parasites, particularly in rural areas where the PCR technique is not available. Moreover, microscopy in combination
with PCR can generate a more reliable approach to identifying malaria parasites when there is a need for more specific results in a particular situation.
Acknowledgements
The authors wish to thank S. Rezayee, Gh. Mohseni, E. Torabi, M. Yareian, A. Amiri, M.T. Satvat and S. Charehdar for their cooperation in this study.
This investigation received techni-cal and financial support from Tehran University of Medical Sciences.
References
World Malaria Report, 20081. . Geneva, World Health Organiza-tion, 2008 (http://malaria.who.int/wmr2008/malaria2008.pdf, accessed 22 September 2010)
Johnston SP et al. PCR as a confirmatory technique for labora-2. tory diagnosis of malaria. Journal of Clininical Microbiology, 2006, 44:1087–1089.
Di santi SM et al. PCR-Based diagnosis to evaluate the per-3. formance of malaria reference centers. Revista do Instituto de Medicina Tropical de São Paulo, 2004, 46:183–187.
Perandin F et al. Development of a real-time PCR assay for 4. detection of Plasmodium falciparum, Plasmodium vivax, and Plasmodium ovale for routine clinical diagnosis. Journal of Clininical Microbiology, 2004, 42:1214–1219.
Speer DJ et al. Diagnosis of malaria aided by polymerase chain 5. reaction in two cases with low-level parasitaemia. Internal Medicine, 2003, 3:613–515.
Hänscheid T. Diagnosis of malaria: a review of alternatives to 6. conventional microscopy. Clinical & Laboratory Haematology, 1999, 21:235–245.
Tham JM et al. Detection and species determination of malaria 7. parasites by PCR: comparison with microscopy and with para sight – F and ICT malaria pf tests in a clinical environment. Jour-nal of Clinical Microbiology, 1999, 37:1269–1273.
Singh B et al. A genus- and species-specific nested polymerase 8. chain reaction malaria detection assay for epidemiologic stud-ies. American Journal of Tropical Medicine and Hygiene, 1999, 60:687–692.
Malaria diagnosis, new perspectives. Report of a joint WHO/9. USAID informal consultation. Geneva, World Health Organiza-tion, 2000.
Karl S et al. Enhanced detection of gametocytes by magnetic 10. deposition microscopy predicts higher potential for Plasmo-
dium falciparum transmission. Malaria Journal, 2008, 7:66 (http://www.malariajournal.com/content/7/1/66, accessed 28 September 2010).
Payne D.11. Use and limitations of light microscopy for diagnosing malaria at the primary health care level. Geneva, World Health Organization, 1988.
Trape JF. Rapid evaluation of malaria parasite density and 12. standardization of thick smear examination for epidemiologi-cal investigations. Transactions of the Royal Society of Tropical Medicine and Hygiene, 1985, 79:181–184.
Rubio JM et al. Alternative polymerase chain reaction method 13. to identify plasmodium species in human blood samples: the Semi-Nested Multiplex malaria PCR (SNM-PCR). Transactions of the Royal Society of Tropical Medicine and Hygiene, 2002, 96:199–204.
Altman, G. 14. Practical statistics for medical research. London, Chapman and Hall, 1991.
Basic malaria microscopy15. . Geneva, World Health Organization, 1991.
Wernsdorfer WH, McGregor I. 16. Malaria, principles and practice of malarialogy. Harlow, Essex, Longman Group UK Limited, 1988.
Zakeri ST et al. Detection of malaria parasites by nested PCR 17. in south-eastern, Iran: evidence of highly mixed infections in Chahbahar district. Malaria Journal, 2002, 1(2) (http://www.malariajournal.com/content/1/1/2, accessed 28 September 2010).
Ebrahimzadeh A, Fouladi B, Fazaeli A. High rate of detection 18. of mixed infection of Plasmodium vivax and Plasmodium fal-ciparum in south-east of Iran, using nested PCR. Parasitology International, 2007, 56:61–64.
Book 17-1.indb 55 1/3/2011 1:38:44 PM

EMHJ • Vol. 17 No. 1 • 2011 Eastern Mediterranean Health JournalLa Revue de Santé de la Méditerranée orientale
56
Prévalence du syndrome métabolique chez les hémodialysés chroniques au MarocO. Maoujoud,1 S. Ahid,2 M. Asseraji,1 A. Bahadi,1 T. Aatif,1 Y. Zajari 1 et Z. Oualim 1
RÉSUMÉ Nous avons déterminé la prévalence du syndrome métabolique chez 25 hémodialysés chroniques dans le centre d’hémodialyse chronique de l’hôpital militaire d’instruction Mohammed V de Rabat (Maroc). L’âge moyen des patients était de 46,5 ans (écart type [ET] 14,48) et la durée moyenne en hémodialyse était de 62,9 mois (ET 38,4). Nous avons évalué les cinq paramètres du syndrome métabolique : tour de taille, hypertriglycéridémie, cholestérol HDL (lipoprotéines de haute densité), pression artérielle et glycémie. Au total, 11 patients (44 %) avaient un syndrome métabolique : 7 femmes et 4 hommes. Un taux bas de cholestérol HDL a été retrouvé chez 100 % des patients, une hypertriglycéridémie chez 90,9 % et une hypertension artérielle chez 63,6 %. Il y avait une différence significative entre les patients avec syndrome métabolique et ceux sans syndrome métabolique concernant les niveaux de l’hypertriglycéridémie et du cholestérol HDL, et le tour de taille. Les facteurs associés significativement à la présence du syndrome métabolique étaient l’obésité abdominale, l’hypertension artérielle systolique et l’hypertriglycéridémie.
1Service de Néphrologie, Dialyse et Transplantation rénale, Hôpital militaire d’instruction Mohammed V, Rabat (Maroc) (Correspondance à adresser à O. Maoujoud : [email protected]).2Laboratoire de Biostatistiques, Recherche clinique et d’Épidémiologie, Faculté de médecine et de pharmacie, Rabat (Maroc).
Reçu : 23/03/10; accepté : 26/04/10
معدل انتشار املتالزمة االستقالبية لدى مرىض الديال املزمن يف املغربعمر موجود، سمري أحيد، حممد السرياجي، عبد العايل هبادي، توفيق عاطف، يارس زاجاري، زهري وليم
اخلالصـة: درس الباحثون معدل انتشار املتالزمة االستقالبية لدى 25 من مرىض الديال املزمن يف مركز الديال يف املستشفى حممد اخلامس التعليمي العسكري يف الرباط. ووجدوا أن العمر الوسطي للمرىض هو 46.5 عامًا )بانحراف معياري مقداره 14.8(، وأن املدة الوسطية للديال قد َبَلَغْت 62.9 شهرًا )بانحراف معياري مقداره 38.4(. وأجرى الباحثون تقيـياًم خلمسة من متثابتات املتالزمة االستقالبية وهي حميط اخلرص، وفرط ثالثي غليسرييد الدم، وكوليسرتول الربوتني الشحمي الرفيع الكثافة HDL، وضغط الدم، وغلوكوز الدم. وقد بلغ إمجايل عدد املرىض الذين لدهيم متالزمة استقالبية 11 مريضًا )44%(، منهم َسْبع نساء وأربعة رجال. ولوحظ انخفاض مستوى كوليستـرول الربوتني الشحمي الرفيع الكثافة يف مئة باملئة من املرىض،
وأن فرط ثالثي غليسرييد الدم موجود لدى 90.9% من املرىض، كام لوحظ ارتفاع ضغط الدم لدى 63.6% منهم. لوحَظْت فوارق ُيْعَتدُّ هبا إحصائيًا بني املصابني باملتالزمة االستقالبية وبني غري املصابني هبا من حيث فرط ثالثي غليسرييد الدم، وكوليستـرول الربوتني الشحمي الرفيع الكثافة، وحميط منة البطنية، وارتفاع ضغط الدم االنقبايض، وفرط ثالثي اخلرص. وكانت العوامل املصاحبة للمتالزمة االستقالبية بدرجة ُيعتدُّ هبا إحصائيًا هي السِّ
غليسرييد الدم.
Prevalence of metabolic syndrome in chronic haemodialysis patients in Morocco
We determined the prevalence of metabolic syndrome in 25 chronic haemodialysis patients in the haemodialysis centre of the Mohammed V military teaching hospital in Rabat. The mean age of the patients was 46.5 (SD 14.8) years and mean haemodialysis duration 62.9 (SD 38.4) months. We evaluated the 5 parameters of metabolic syndrome: waist circumference, hypertriglyceridaemia, high-density lipoprotein (HDL) cholesterol, blood pressure and blood glucose. In all, 11 (44%) patients had metabolic syndrome: 7 women and 4 men. Low HDL cholesterol was found in 100% of the patients, hypertriglyceridaemia in 90.9% and hypertension in 63.6%. There were significant differences between patients with and without metabolic syndrome with regard to levels of hypertriglyceridaemia and HDL cholesterol, and waist circumference. Factors significantly associated with the presence of metabolic syndrome were abdominal obesity, and systolic hypertension and hypertriglyceridaemia.
Book 17-1.indb 56 1/3/2011 1:38:44 PM

املجلد السابع عرشاملجلة الصحية لرشق املتوسطالعدد األول
57
Introduction
Les problèmes de santé et les décès précoces résultant des maladies cardio-vasculaires et du diabète menacent de paralyser les budgets de soins de santé de nombreux pays, tant développés qu’en développement . Dans ce contexte, le syndrome métabolique constitue une entité émergente qui regroupe chez le même individu plusieurs anomalies métaboliques qui prédisposent, chacune, au risque cardio-vasculaire ; il associe une obésité centrale, une hypertriglycéridémie, une baisse du cholestérol HDL (cholestérol des lipoprotéines de haute densité), une hypertension artérielle, une intolérance au glucose. Il multiplie par trois le risque cardio-vasculaire et par neuf le risque de diabète de type 2 [1]. Au point de vue épidémiologique, sa prévalence varie selon les définitions, les pays et les ethnies. Globalement, celle-ci avoisine 25 % au sein de la population adulte américaine et se situe autour de 10 % en France [1].
Cependant chez les hémodialysés, chez lesquels les maladies cardio-vasculaires constituent la principale cause de mortalité, la prévalence du syndrome métabolique est mal connue.
L’objectif de ce travail est d’évaluer la prévalence du syndrome métabolique chez les hémodialysés chroniques et de déterminer les facteurs prédictifs de ce syndrome dans notre centre d’hémodialyse chronique.
Méthodes
Il s’agit d’une étude transversale réalisée en mars 2009 dans le service de Néphrologie, Dialyse et Transplanta-tion rénale de l ’hôpital militaire d’ instruction Mohammed V de Rabat (Maroc).
Les patients retenus étaient les hémodialysés suivis dans notre centre depuis au moins un an. Nous avons exclu les patients hémodialysés dans le
cadre d’une insuffisance rénale aiguë et les patients hémodialysés d’autres centres, hospitalisés provisoirement dans notre formation.
L ’ o b é s i t é a b d o m i n a l e é t a i t appréciée par le tour de taille (T T), mesuré à 0,1 cm près à l’aide d’un mètre ruban au niveau des deux crêtes iliaques en fin d’expiration. La pression artérielle était mesurée à l’aide d’un sphygmomanomètre à mercure avant dialyse en position couchée après 10 minutes de repos ; la moyenne de 2 mesures à 5 minutes d’intervalle a été retenue. Le poids et la taille ont été mesurés respectivement à 0,1 kg et 0 ,1 cm près , en ut i l isant un équipement et des procédures standard. L’indice de masse corporelle (IMC) était déterminé par le rapport poids/taille au carré (kg/m2).
Pour le dosage de la glycémie et de la triglycéridémie, les patients ont subi un prélèvement le matin avant dialyse, après 9-12 heures de jeûne, sur un tube sec, au niveau de la fistule artério-veineuse avant l’administration de l’héparine. Le diagnostic de syndrome métabolique a été retenu selon la définition du National Cholesterol Education Program Adult Treatment Panel III (NCEP ATP III) [2], qui requiert l’association d’au moins trois des cinq critères suivants : tour de taille ≥ 102 cm chez les hommes e t ≥ 8 8 c m c h e z l e s f e m m e s , hypertriglycéridémie ≥ 1,5 g/L ou traitement médicamenteux, cholestérol HDL < 0,40 g/L chez les hommes et < 0,5 g/L chez les femmes ou traitement médicamenteux, pression artérielle ≥ 130/85 mmHg ou traitement médicamenteux, glycémie ≥ 1,1g/L ou traitement médicamenteux.
Afin de déterminer les facteurs prédictifs du syndrome métabolique, nous avons réparti les malades en deux groupes :
g r o u p e 1 : s a n s s y n d r o m e •métabolique,
g roupe 2 : a v e c s ynd rome •métabolique.
Les deux groupes ont été comparés en fonction de plusieurs paramètres cliniques et biologiques en plus des paramètres susmentionnés. À cet effet, les patients inclus dans l’étude ont bénéficié d’un bilan biologique comprenant hémogramme, vitesse d e s é d i m e n t a t i o n , p r o t é i n e C réactive (CRP), ionogramme sanguin avant la séance d’hémodialyse (urée, protides, albumine, calcium, phosphore, phosphatases alcalines, parathormone intacte [PTHi 1-84] et ferritinémie), et d’un dosage d’urée après la séance d’hémodialyse pour pouvoir calculer le Kt/V, ainsi que d’un bilan lipidique avec cholestérol total. Le cholestérol LDL (lipoprotéines de basse densité) a été calculé d’après la formule de Friedwald.
Les informations cliniques recueil-lies sont l’âge, le sexe, la néphropathie initiale, les comorbidités, l’ancienneté de dialyse, les traitements médicamenteux notamment l ’érythropoïétine, le sevelamer et la supplémentation calcique.
Toutes les analyses statistiques ont été réalisées à l’aide du logiciel SPSS 11.5 pour Windows®. Les variables quantitatives ont été décrites en utilisant les moyennes, l’écart type (ET) et les limites. Les variables qualitatives ont été décrites en utilisant des proportions et des pourcentages. Pour la comparaison des groupes, nous avons utilisé le test de χ2 pour les fréquences et le test de Student pour les moyennes. L’intervalle de confiance retenu était p < 0,05.
Résultats
V i n g t - c i n q h é m o d i a l y s é s chroniques ont été retenus pour l ’ é tude : 14 f emmes (56 %) e t 11 hommes (44 %). L’âge moyen était de 46,5 ans (ET 14,48 ; extrêmes : 22-74 ans) ; la durée moyenne de l’hémodialyse était de 62,9 mois (ET 38,4 ; extrêmes : 24-204 mois). Tous les patients étaient dialysés à raison de
Book 17-1.indb 57 1/3/2011 1:38:45 PM

EMHJ • Vol. 17 No. 1 • 2011 Eastern Mediterranean Health JournalLa Revue de Santé de la Méditerranée orientale
58
12 heures par semaine avec des membranes en polysulfone. Dans notre population, les néphropathies initiales d’origine indéterminée étaient les plus fréquentes, représentant 24 % ; l’étiologie diabétique représentait 20 %, les néphrites tubulo-interstitielles chroniques représentaient 16 % et la polykystose 8 %. Les autres n é p h r o p a t h i e s i n i t i a l e s é t a i e n t diverses (néphropathie du reflux, Goodpasture, amylose AA, lupus, maladie lithiasique). Les caractéristiques de la population étudiée sont résumées dans le tableau 1.
Onze de nos patients (44 %) avaient un syndrome métabolique : 7 femmes (63 %) et 4 hommes (33 %). L’anomalie omniprésente était la baisse du cholestérol HDL retrouvée chez 100 % d’entre eux, suivie de l’hypertriglycéridémie (HTG) dans 90,9 % des cas et de l’hypertension artérielle (HTA) dans 72,7 %. Un tour de taille (TT) élevé a été retrouvé dans 63,6 % des cas ; une glycémie élevée (GLE) > 1,1 g/L n’a été retrouvée que dans 36,4 % des cas (Figure 1). La triade la plus fréquente était l’association HTG – Hypo-HDL – HTA présente chez 63,6 % des patients.
En comparant le groupe 2 (syn-drome métabolique) au groupe 1 (sans syndrome métabolique), nous avons trouvé une différence significative
concernant l’HTG (p < 0,000), l’hypo-HDL (p = 0,03) et le TT (p =0,039), mais pas pour la pression artérielle et la glycémie.
Nous n’avons pas noté de différence statistiquement significative concernant l’âge, le sexe, l’ancienneté de dialyse,
l’IMC, la glycémie ou la pression artérielle. Les résultats de la comparaison entre les deux groupes sont rapportés dans le tableau 2.
L e s p a r a m è t r e s a s s o c i é s s ignificat ivement à la présence du syndrome métabolique chez
Tableau 1 Caractéristiques de la population étudiée
Caractéristiques Participants (n = 25)
Nbre (%)
Âge moyen (ans) 46,52 (ET 14,48)
Sexe
Femmes 14 (56)
Hommes 11 (44)
IMC (kg/m2)
< 25 16 (72)
> 25 9 (28)
Mise sous érythropoïétine
Oui 20 (80)
Non 5 (20)
Hémoglobine (g/dL)
< 11 8 (32)
> 11 17 (68)
Nombre d’heures de dialyse par semaine
< 12 0 (0)
12 25 (100)
Nombre de séances hebdomadaires
< 3 0 (0)
3 25 (100)
Ancienneté de dialyse (mois) 62,9 (ET 38,4)
ET : écart type IMC : indice de masse corporelle.
Figure 1 Paramètres du syndrome métabolique retrouvés dans la population étudiée (GLE : glycémie élevée ; OA : obésité abdominale ; HTA : hypertension artérielle ; HTG : hypertriglycéridémie ; HypoHDL : hypoHDLémie.)
0 10 20 30 40 50 60 70 80 90 100
GLE
OA
HTA
HTG
hypoHDL
Book 17-1.indb 58 1/3/2011 1:38:45 PM

املجلد السابع عرشاملجلة الصحية لرشق املتوسطالعدد األول
59
l’hémodialysé chronique de notre service étaient l’HTG ≥ 1,4g/L (p = 0,03), la tension artérielle systolique >135 mmHg (p = 0,014) et l’obésité abdominale (p = 0,015). Ces résultats sont résumés dans le tableau 3.
Discussion
Notre étude a trouvé une prévalence é l e v é e ( 44 %) du s ynd rome métabolique chez les hémodialysés. Ces données divergent peu de celles retrouvées dans une population d’hémodialysés américains où le taux était de 40,19 % [3]. Nous avons trouvé une prépondérance des troubles du métabolisme lipidique chez les patients avec syndrome métabolique :
100 % avaient une hypo-HDLémie et plus de 90 % avaient une HTG. Les dyslipidémies sont souvent rencontrées chez les hémodialysés chroniques [4] : ceci est dû probablement à une baisse de l’activité plasmatique de la lipoprotéine lipase et de la lipase hépatique [4,5]. Les glycémies élevées n’ont été retrouvées que chez quatre patients, qui étaient tous des diabétiques. Le syndrome métabolique est fortement lié à l’obésité et en particulier à l’obésité viscérale [6]. Dans notre étude, elle a été retrouvée chez 63,6 %. Elle semble bien être l’anomalie centrale dans la genèse du syndrome métabolique ; l’augmentation de la graisse viscérale induit une augmentation des acides gras libres vers le foie, ainsi qu’une insulino-résistance. Ces deux relais vont induire
eux-mêmes une cascade d’anomalies touchant de nombreux facteurs de risque proathéromateux ainsi que la glycorégulation, expliquant le risque évolutif vers le diabète de type 2 et les complications cardio-vascu la i res [1 ,7–10] . L ’obés i té abdominale mesurée par le tour de taille prédit mieux le risque cardio-vasculaire par rapport à l’obésité classée à partir de l’indice de masse corporelle (IMC). En effet, des études récentes [11–13] indiquent que le tour de taille est un marqueur du risque métabolique et cardio-vasculaire (diabète type 2, dyslipidémie, HTA, coronaropathie) b e a u c o u p p l u s i n t é r e s s a n t q u e l ’IMC [14]. Même en l ’absence d’obésité franche, la relation graisse abdominale/risque cardio-vasculaire persiste, comme le montrent les résultats d’une étude présentée par Chen [15]. Dans notre étude, nous n’avons pas trouvé d’association significative entre l’IMC et le syndrome métabolique : cinq patients avaient un IMC < 25 kg/m² et pourtant ils avaient le syndrome métabolique. Le nombre moyen des facteurs définissant le syndrome métabolique chez nos patients était de 3,72 par patient. Sattar a montré que le risque coronaire augmente avec le nombre de paramètres présents [16]. Dans notre étude, les paramètres associés significativement au syndrome métabolique sont l’hypertriglycéridémie, l’obésité abdominale et l’hypertension artérielle systolique. Cette même association dominante est retrouvée par d’autres études, notamment l’étude d’Ascaso qui montre que la prévalence du syndrome métabolique est plus importante chez les sujets présentant une obésité abdominale (48,4 %) que chez les sujets ayant un tour de taille normal (18,8 %) et que la présence d’une obésité abdominale est un bon indicateur de l’insulinorésistance [17]. Par ailleurs, outre le risque cardio-vasculaire associé au syndrome métabolique, des études récentes chez les transplantés rénaux ont montré que
Tableau 2 Résultats des données comparées chez les deux groupes
Paramètre Groupe 1 sans SM (n = 14)
Groupe 2 SM(n = 11)
p
Âge (ans) 43,21 50,73 NS
Ancienneté de dialyse (mois) 71,04 52,32 NS
Cholestérol (g/L) 1,4 1,7 NS
HDL (g/L) 0,39 0,29 0,038
LDL (g/L) 0,87 1,18 NS
TG (g/L) 1,02 1,9 0,001
Glycémie (g/L) 0,97 1,31 NS
TT (cm) 96,1 88,5 0,039
IMC (kg/m²) 23,0 24,3 NS
TA systolique (mmHg) 123,5 132,7 0,088
TA diastolique (mmHg) 74,2 73,6 NS
Poids sec (kg) 58,1 69,2 0,074
Phosphorémie (mg/L) 48,64 49,36 NS
Calcémie (mg/L) 89,21 88 NS
Parathormone (pg/mL) 301 293 NS
Hémoglobine (g/dL) 11,12 11,02 NS
Hématocrite (%) 33,57 33,51 NS
Ferritinémie (µg/L) 306 268 NS
VS (mm/h) 26 21 NS
CRP (mg/L) 4,92 5,45 NS
Kt/V 1,07 1,09 NS
Albuminémie (g/L) 42,4 42,7 NS
Protidémie (g/L) 70,1 70,8 NS
SM : syndrome métabolique ; HDL : lipoprotéines de haute densité ; LDL : lipoprotéines de basse densité ; TG : triglycérides ; TT : tour de taille ; IMC : indice de masse corporelle ; TA : tension artérielle : VS : vitesse de sédimentation : CRP : protéine C réactive. NS : différence non significative.
Book 17-1.indb 59 1/3/2011 1:38:45 PM

EMHJ • Vol. 17 No. 1 • 2011 Eastern Mediterranean Health JournalLa Revue de Santé de la Méditerranée orientale
60
Références
Delarue J, Allain G, Guillerm S. Le syndrome métabolique. 1. Nutrition Clinique et Métabolisme, 2006, 20(2):114–117.
Third report of the national cholesterol education program, 2. evaluation and treatment of high blood cholesterol in adults ATP III final report. Circulation, 2002, 106:3143−3421
Tsangalis G, Papaconstantinou S. Prevalence of the metabolic 3. syndrome in hemodialysis. International Journal of Artificial Organs, 2007, 30(2):118–123.
Lacour B 4. et al. Anomalies du métabolisme des lipoprotéines dans l’insuffisance rénale chronique. Néphrologie, 1993, 14(2):75–90.
Vaziri ND, Moradi H. Mechanisms of dyslipidemia of chronic 5. renal failure. Hemodialysis International, 2006, 10:1–7.
Attman PO, Samuelsson O. Dialyis modalities and dyslipi-6. demia. Kidney International Supplement, 2003, 84:S110–112.
Vaziri ND. Dyslipidemia of chronic renal failure: the nature, 7. mechanisms, and potential consequences. American Journal of Physiology and Renal Physiology, 2006, 290:262–272.
St-Pierre J et al. Contribution of abdominal obesity and hyper-8. triglyceridemia to impaired fasting glucose and coronary ar-tery disease. American Journal of Cardiology, 2002, 90:15–18.
Bigaillon C et al. Insulinemia and metabolic syndrome in a 9. population of French soldiers (EPIMIL study). Immuno-analyse & Biologie Spécialisée, 2005, 20:291–294.
European group for the study of insulin resistance (EGIR). 10. Frequency of the WHO metabolic syndrome in European cohorts, and alternative definition of an insulin resistance syn-drome. Diabetes & Metabolism, 2002, 28:364–376.
Janssen I, Katzmarzyk PT, Ross R. Body mass index, waist cir-11. cumference, and health risk: evidence in support of current
la présence d’un syndrome métabolique est un facteur de risque de détérioration chronique de la fonction rénale [18] et de perte du greffon [19,20].
Notre étude, malgré un nombre limité de patients, a montré que
les hémodialysés chroniques sont concernés par l’épidémie de syndrome métabolique. Ces résultats doivent être confirmés par des études sur des échantillons plus larges, mais aussi par des études longitudinales pour ap-
précier réellement l’impact de la présence du syndrome métabolique sur la survenue de complications cardio-vasculaires chez les hémodialysés chroniques. Le syndrome métabolique ne quantifie pas le risque cardio-vasculaire ; i l permet néanmoins d’identifier une population à risque, ce qui aidera à mieux cibler l’action thérapeutique et préventive.
Conclusion
Les hémodialysés chroniques sont des patients à haut risque cardio-vasculaire. Le syndrome métabolique est à la fois une menace et une opportunité : alors qu’il met en lumière le danger d’augmentation spectaculaire des troubles cardio-vasculaires, du diabète de type 2 et de leurs conséquences, il constitue également une opportunité d’identifier les personnes à risque et de mettre en oeuvre des stratégies de prévention en agissant tôt sur ses paramètres. Chez les personnes atteintes du syndrome, des mesures précoces peuvent être prises dès le diagnostic. L’utilité du tour de taille comme marqueur du développement du syndrome métabolique nous fournit un outil bon marché et universellement disponible pour poser ce diagnostic : un mètre ruban.
Tableau 3 Facteurs associés au syndrome métabolique (SM)
Variable Groupe SM Groupe sans SM
p
Nbre Nbre
TG (g/L) 0,003
< 1,4 1 10
> 1,4 10 4
GLE (g/L) 0,209
< 1,1 8 13
> 1,1 3 1
TA systolique (mmHg) 0,014
< 135 5 13
> 135 6 1
TA diastolique (mmHg) 0,593
< 85 10 11
> 85 1 2
IMC (kg/m²) 0,098
< 25 5 11
> 25 6 3
HDL (g/L) 0,534
< 0,4 4 6
> 0,4 7 8
OA 0,015
+ 3 11
- 8 3
TG : triglycérides ; GLE : glycémie élevée ; TA : tension artérielle ; IMC : indice de masse corporelle ; HDL : lipoprotéines de haute densité ; OA : obésité abdominale.
Book 17-1.indb 60 1/3/2011 1:38:45 PM

املجلد السابع عرشاملجلة الصحية لرشق املتوسطالعدد األول
61
national institutes of health guidelines. Archives of. Internal Medicine, 2002, 162:2074–2079.
Janssen I, Katzmarzyk PT, Ross R. Waist circumference and not 12. body mass index explains obesity-related health risk. American Journal of Clinical Nutrition, 2004, 79:379–384.
Zhu S et al. Combination of BMI and waist circumference for 13. identifying cardiovascular risk factors in whites. Obesity Re-search, 2004, 12:633–645.
Chellak S14. , Bigaillon C, El Jahiri Y. Correlation results between plasma homocysteine, metabolic syndrome components and cardiovascular risk markers in 2045 French military subjects: EPIMIL cohort. Immuno-Analyse et Biologie Spécialisée, 2005, 20(3):169–172.
Ninomiya K et al. Association of the metabolic syndrome with 15. history of myocardial infarction and stroke in the third national health and nutrition examination survey. Circulation, 2004, 109:42–46.
Sattar N, Gaw A, Scherbakova O. Metabolic syndrome with 16. and without C-reactive protein as a predictor of coronary heart disease and diabetes in the West of Scotland Coronary Preven-tion Study. Circulation, 2003, 108:414–419.
Ascaso J et al. Abdominal obesity, insulin resistance, and the 17. metabolic syndrome in a southern European population. Euro-pean Journal of Internal Medicine, 2003, 14:101–106.
Rogers J, Stratta RJ, Lo A. Impact of the metabolic syndrome on 18. long-term outcomes in simultaneous kidney–pancreas trans-plantation. Transplantation Proceedings, 2005, 37(8):3549–3551.
Oterdoom LH et al. Determinants of insulin resistance in renal 19. transplant recipients. Transplantation, 2007, 83(1):29–35.
Hartog JW et al. Risk factors for chronic transplant dysfunction 20. and cardiovascular disease are related to accumulation of ad-vanced glycation end-products in renal transplant recipients. Nephrology, Dialysis, Transplantation, 2006, 21(8):2263–2269.
Eléments d’épidémiologie
La deuxième édition de ce manuel, qui a connu un succès certain, offre une introduction aux principes et méthodes de l’épidémiologie. Depuis la publication de la première édition en 1993, Eléments d’épidémiologie est devenu une référence classique pour l’enseignement, la formation et la recherche en santé publique. Il est largement utilisé dans la formation des professionnels de la santé publique et des spécialistes de l’environnement, des étudiants en médecine et des étudiants d’autres disciplines de la santé.
La deuxième édition présente des exemples actualisés qui illustrent les raisons pour lesquelles il est indispensable de posséder des notions de base en épidémiologie pour comprendre les facteurs influant sur les maladies et appliquer les principes relatifs à leur prévention . Ce manuel met l’accent en particulier sur les facteurs environnementaux modifiables ; il encourage par ailleurs l’application de l’épidémiologie à la prévention des maladies et à la promotion de la santé, notamment en ce qui concerne l’hygiène du milieu et de la médecine du travail. Il prépare les membres des professions en rapport avec la santé à répondre à la nécessité pour les services de santé de faire face à tous les aspects de la santé des populations et de veiller à ce que les ressources sanitaires soient utilisées de manière à obtenir les meilleurs résultats possibles.
De plus amples informations à ce sujet et d’autres publications de l’OMS sont disponibles à l’adresse suivante : http://www.who.int/publications/en/
Book 17-1.indb 61 1/3/2011 1:38:45 PM

EMHJ • Vol. 17 No. 1 • 2011 Eastern Mediterranean Health JournalLa Revue de Santé de la Méditerranée orientale
62
Adaptation of the school health index to assess the healthy school environment in JordanI.M. Khatib 1 and S.S. Hijazi 1
ABSTRACT When the Jordan Ministry of Education planned workshops to raise teachers’ awareness of the health environment in schools in underdeveloped governorates, a pre–post intervention study assessed the impact of these workshops in changing teachers’ perceptions. A total of 193 teachers completed the self-administered Centers for Disease Control and Prevention school health index (SHI) for elementary schools, adapted for this setting using 6 of the 8 original modules. After the workshops, teachers’ mean scores on all modules improved significantly, from 49.5% to 55.9% for health and safety/environment policies; 44.2% to 56.5% for health education; 40.3% to 52.9% for physical education; 51.3% to 59.2% for nutrition services; 62.5% to 73.8% for health services; and 55.2% to 68.3% for family/community involvement. The SHI model is implementable in a developing country setting to monitor and appraise the environmental components of school health.
1Department of Public Health and Community and Family Medicine, Faculty of Medicine, Jordan University of Science and Technology, Irbid, Jordan (Correspondence to I.M. Khatib: [email protected]; [email protected]).
Received: 26/07/09; accepted: 10/08/09
تكييف َمْنَسب الصحة املدرسية بحيث يصلح لتقييم البيئة الصحية املدرسية يف األردنإبراهيم حممود اخلطيب، سعد سليامن حجازي
اخلالصة: عندما خططت وزارة التعليم لعقد حلقات عمل لالرتقاء بوعي املدرسني حول البيئة الصحية املدرسية يف املحافظات التي هي أقل تطورًا، أجرت دراسة سابقة وتالية للتدخل لتقييم تأثري هذه احللقات يف تغيري إدراك املدرسني. واستوف 193 مدرسًا يف املدارس االبتدائية االستبيان حول املواقع، ليالئم هذه تكييفه بعد ذاتيًا، يستوف استبيان أمريكا، وهو منها يف والوقاية األمراض مراكز مكافحة إعداد من املدرسية الصحة منسب باستخدام ست كراسات تدريبية من أصل ثامين كراسات. وقد ارتفع متوسط األْحَراز بعد حلقات العمل يف مجيع النامذج ارتفاعًا ُيعتّد به إحصائيًا، ّص سياسات الصحة والسالمة البيئية؛ ومن 44.2% إىل 56.5% يف ما يتعلق بالتعليم الصحي؛ ومن 40.3% إىل %52.9 من 49.5% إىل 55.9% يف ما َيُّص خدمات التغذية؛ ومن 62.5% إىل 73.8% للخدمات الصحية؛ ومن 55.2% إىل %68.3 يف ما يتعلق بالتعليم البدين؛ ومن 51.3% إىل 59.2% يف ما َيُيف ما يتعلق بمشاركة األرسة واملجتمع. وقد أثبت الباحثان أن نموذج منسب الصحة املدرسية هذا، يمكن تطبيقه يف البلدان النامية لرصد وتقييم
املكونات البيئية يف الصحة املدرسية.
Adaptation de l’indice de santé scolaire pour évaluer l’environnement scolaire sain en Jordanie
RÉSUMÉ Lorsque le Ministère de l’Éducation de Jordanie a programmé des séminaires-ateliers pour sensibiliser les enseignants à l’environnement sain dans les écoles des gouvernorats insuffisamment développés, une étude avant et après l’intervention a évalué l’impact de ces séminaires-ateliers sur l’évolution de la perception des enseignants. Au total, 193 enseignants ont rempli le questionnaire auto-administré sur l’indice de santé scolaire des Centers for Disease Control and Prevention pour les écoles élémentaires, adapté au contexte et composé de 6 modules sur les 8 d’origine. Après les séminaires-ateliers, les scores moyens des enseignants sur tous les modules ont été significativement améliorés, de 49,5 % à 55,9 % pour les politiques de santé, de sécurité ou d’environnement ; de 44,2 % à 56,5 % pour l’éducation sanitaire ; de 40.3 % à 52,9 % pour l’éducation physique ; de 51,3 % à 59,2 % pour les services de nutrition ; de 62,5 % à 73,8 % pour les services de santé ; de 55,2 % à 68,3 % pour l’engagement communautaire ou familial. Le modèle du questionnaire sur l’indice de santé scolaire est applicable dans un pays en développement mettant en œuvre le suivi et l’évaluation des composantes environnementales de la santé scolaire.
Book 17-1.indb 62 1/3/2011 1:38:46 PM

املجلد السابع عرشاملجلة الصحية لرشق املتوسطالعدد األول
63
Introduction
In developed societies, policies and pro-grammes concerning school health edu-cation and nutrition undergo periodic critical reviews [1,2]. The promotion of nutritional health among schoolchil-dren in developing countries, however, has only been superficially addressed. Fortunately, in recent years the ques-tion of nutrition and health of young children has attracted the attention of concerned international organizations and scientific researchers [3–5]. Based on the premise that children’s eating and physical activity behaviours are influenced by the school environment, not just by factors such as playing fields and cafeterias, the Centers for Disease Control and Prevention (CDC) has de-veloped the school health index (SHI) for elementary schools. The SHI tool is designed to help schools to identify strengths and weaknesses in their health and safety policies and programmes; to develop plans to improve student nutrition and health; and to engage teachers, parents, students and the ex-tended community in health-enhancing behaviours [6].
Until recently in Jordan most health and nutrition research has focused on preschool children [7–11]. However, some programmes promoting nutrition for school-age children have begun. The school snack service programme was initiated by the government in 1999 to help combat poverty-linked malnutri-tion in young children in underdevel-oped areas of the country. Based on reports of the positive impact of the school snack service [12], a dual-com-ponent research project for assessing students’ nutritional health and study-ing the health environments of schools in underprivileged areas was initiated. The first phase was a nutritional survey [13] to substantiate the findings of the previous survey [12] and this was fol-lowed by a study to collect data on the school environment in Jordan in rela-tion to health and nutrition. To launch
the “healthy school environment” part of the project the Ministry of Education (MOE) conducted 2 series of nutrition and health educational workshops for science schoolteachers in underprivi-leged districts. To assess the impact of these workshops in changing teach-ers’ perception of healthy schools, a pre–post-intervention approach was applied using an adapted version of the SHI for elementary schools to monitor changes in the school environment that could be attributed to increased teacher awareness.
Methods
The survey was conducted in 2 stages, pre- and post-workshop, with a 6-month period between the 2 workshop series (pre-determined by the MOE). This was designed to give the teachers suf-ficient time to implement their newly acquired health knowledge.
Site
The study sites were the elementary schools of 43 villages and hamlets, ran-domly selected with assistance from the Jordan general department of statistics. All these sites were eligible recipients of the school snack service and were lo-cated in 8 of the underdeveloped areas in Jordan. The beneficiary villages were clustered in districts of the governo-rates of Aqaba, Ma’an, Tafilah, Mafraq (North Badia district), Karak (Lajoon and Al-Saafi districts) and Balqa (Deir-Alla and South Shunah districts) [13].
Intervention
Each of the workshops was a 1-day course, focusing on the health impacts of children’s exercising and eating hab-its. The format of the workshops was lectures, discussions and role play. Each participating teacher was nominated by the MOE to attend workshops. The workshops’ team of instructors includ-ed volunteer paediatricians, academic
nutritionists and physical fitness and public health experts.
SubjectsThe authors identified potential respondents using the MOE list of teachers who intended to enrol in the workshop. All the teachers participating in workshops were requested to com-plete the questionnaire before and 6 months after attending the workshops. Only the teachers who signed informed consent for the survey were considered in the final analysis. In total, 202 teachers began the workshops and 193 finished the study, a completion rate of 95.5%.
Data collectionInstrumentThe original SHI employs a simple questionnaire designed so that admin-istrators, staff, parents and schoolchil-dren cooperate in creating healthier schools [6]. Anticipated outcomes of SHI-based surveys include improved student health, well-being and readi-ness to learn. The SHI for elementary schools includes 8 multi-item modules (domains) concerning a healthy school environment: school health and safety policies and environment; health edu-cation; physical education and other physical activity programmes; nutrition services; health services; counselling, psychological and social services; health promotion for staff; and family and community involvement. Implementa-tion of each domain at a school or by a teacher is evaluated through multiple items that are scored from “fully in place” to “not in place”. Once the survey is completed, a total percentage score for each module is recorded and respond-ents are instructed to use these scores in worksheets to determine recommenda-tions for next steps. Recommendations are rated by administrators using 5 cri-teria: importance, cost, time needed to implement, commitment of the school community toward implementation, and feasibility. Within each module, the
Book 17-1.indb 63 1/3/2011 1:38:46 PM

EMHJ • Vol. 17 No. 1 • 2011 Eastern Mediterranean Health JournalLa Revue de Santé de la Méditerranée orientale
64
priority of recommendations is then ranked using these scores.
To assure smooth implementation of the survey and to evaluate the suit-ability of the questions to the Jordanian context, the SHI questionnaire was test-ed in 5 rural schools in Irbid governorate 1 month prior to the beginning of the study. Several questions were found to have no relevance to poorer Jordanian students and their school set-ups. Those were mostly items on health promotion for staff and psychological counselling and social services. Another issue identi-fied was that teachers were reluctant to answer the questionnaire, cautious of the consequences of “telling the truth”. The pilot testing brought to light a need to adapt the SHI to suit the social and cultural circumstances of the schools and teachers. Adaptations included retaining only 6 of the 8 SHI modules, eliminating all inapplicable questions on certain items and translating the questionnaire into Arabic. Importance was also given to assuring teachers of the confidentiality of their responses and that SHI was not an instrument for auditing or punishing school staff who may not yet be implementing the strate-gies taught in the workshops.
ProcedureThe first phase of data collection began in early 2003 by distributing the ques-tionnaire to registered teachers in their schools of the study villages and hamlets at least 7 days prior to the first workshop. Short interviews were conducted with respondents to introduce the 2-page self-administered questionnaire and to deliver the consent form. Participants were asked to sign the form and to return it with the completed question-naire just before the workshop. The questionnaire included 60 questions covering the 6 modules investigated, as detailed earlier.
Approximately 1 week later, the MOE launched the 1st round of health-oriented educational workshops, with the 2nd round scheduled to be held after
6 months in the same 8 areas. Just before the start of the workshops, another short meeting with individual participants was arranged to answer questions on any misunderstood or misinterpreted items of the questionnaire.
Data analysisThe data were structured and analysed in a longitudinal framework. A response of either satisfactory or acceptable was considered positive in the analyses; the proportion of positive responses represented the score for that item. The measured outcome was the change in perception among schoolteachers on scored variables describing the role of health and nutrition in the school set-ting. Within-module changes in views were evaluated by cross-tabulation of positive responses comparing pre- ver-sus post-workshop scores.
Data analysis was conducted using SPSS, version 4. Microsoft Excel was used for data entry. Frequency tables for pre- post-intervention data were cre-ated, and data are presented as mean percentage scores. The focus of analysis was of the pre–post differences. For each module as well as for some module items, pre–post differences in imple-mented procedures were calculated and analysed using Pearson chi-squared and independent sample t-tests. In every analysis, differences were considered significant if the P-value was < 0.05.
Results
The distribution of respondents with complete data by district/governorate was as follows: Aqaba 5.9%, Ma’an 5.4%, Tafilah 19.8%, North Badia 22.3%, Ka-rak 4.5% (excluding Al-Saafi), Deir-Alla 13.4%, South Shunah 14.9% and Ghore Al-Saafi 13.9%.
Positive teacher responses for the 6 modules of the adapted SHI before and after the educational intervention are shown in Tables 1–6, including Pearson chi-squared analysis results.
For the majority of items, the baseline scores were lower than the correspond-ing final scores. In the majority of cases, teachers’ responses to questions on the different modules’ elements indicated general improvement in the school environmental conditions. Teachers’ perceptions were reflected in the clear rise in the final scores of the elements compared with the corresponding base-line figures. This applied to the status of schools’ infrastructure as well as to the other environment modules. School in-frastructure had an initial score of 59.7% for water, 58.5% for sewage and 69.3% for waste disposal. In the final survey, scores on water and sewage systems remained unchanged compared with the initial scores, while waste disposal scores improved to 90.0%.
For all 6 modules there was a consist-ent trend of significant positive changes in final scores compared with the initial values (P < 0.05), with less gain in school health-related policies than the other modules (Table 7). Mean initial and final scores were: health and safety/environment policies (49.5% versus 55.9%); health education (44.2% versus 56.5%); physical education (40.3% ver-sus 52.9%); nutrition services (51.3% versus 59.2%); health services (62.5% versus 73.8%); and family/community involvement (55.2% versus 68.3%).
Discussion
Following calls for continuation of the school snack service to improve nutri-tion in school-age children [12], this survey was carried out to report on the health-related school environment in deprived areas of Jordan. The survey found that neither of the basic infra-structure elements—water or sewage systems—were fully operational at a majority of schools at the onset of the study. Additionally, nearly all items of the 6 modules of school health were judged by teachers to have some de-gree of unsatisfactory performance or
Book 17-1.indb 64 1/3/2011 1:38:46 PM

املجلد السابع عرشاملجلة الصحية لرشق املتوسطالعدد األول
65
application. Deviations from the target of having every environmental health element “fully in place” were greater for some of the items/modules than in others. Results from the health educa-tion module indicated that curricula were failing to cover basic topics on physical activity, nutrition and first aid. At the same time, opportunities for
further education of teachers about this and other modules were scarce. School nutrition services were too often left in the hands of unqualified personnel, and the teachers’ endorsement of the school snack programme was not ac-companied by changes in the system’s management and operation. Students did not have sufficient time for physical
activity, and safety standards were minimal.
Nevertheless, the survey found a consistent improvement between pre- and post-workshop scores on all module items, in addition to waste disposal systems. This progress may be attributed to multiple factors. A rise in health awareness encouraged
Table 1 Frequency of teachers’ positive responses on selected items of the adapted school health index, before and after the intervention: school health and safety policies and environment module
Item % of respondents P-value
Baseline(n = 202)
Final(n = 193)
10-minute break for eating school snack 77.7 87.6 0.0096
Handwash before meals encouraged by teachers 66.3 74.1 0.0905a
Committee oversees health programmes 79.1 81.3 0.5835a
Access to low-quality foods prohibited 49.0 60.1 0.0268
20-minute recess, with physical activity stimulation 43.1 49.2 0.2240 a
Policies guiding major physical activity targets 39.1 43.1 0.4192a
Physical activity prevention prohibited as punishment 14.4 15.5 0.7592
Access to physical activity facilities outside school hours 11.9 12.0 0.9756a
Policies guiding nutrition goals 32.7 43.5 0.0270
Physical activity facilities availability 3.5 4.1 0.7550a
anot significant.
Table 2 Frequency of teachers’ positive responses on selected items of the adapted school health index, before and after the intervention: health education module
Item % of respondents P-value
Baseline(n = 202)
Final(n = 193)
Access to valid health knowledge 65.8 78.0 0.0071
Advocacy for people and community 64.2 75.8 0.0120
Use of communication skills 61.1 72.5 0.0163
Focus on using choice-making skills 52.3 64.3 0.0157
Curriculum has lesson plans 51.5 64.4 0.0095
Instructions on fitness 51.0 62.0 0.0276
Media influence on analysis 48.2 59.3 0.0270
Charts describing scope and sequence 48.0 60.1 0.0159
Parents notified about student hygiene 46.7 60.7 0.0053
Curriculum present in a written form 38.6 54.5 0.0015
Students enjoy health education lessons 38.1 53.9 0.0016
Evaluating students on health education 30.6 44.1 0.0055
Addressing healthy skills and behaviours 28.7 43.0 0.0030
Instructors enrol in continuing education 21.8 38.3 0.0003
Curriculum covers basic nutrition 8.9 9.3 0.8900a
Environmental health, air/water 75.8 84.8 0.0249anot significant.
Book 17-1.indb 65 1/3/2011 1:38:46 PM

EMHJ • Vol. 17 No. 1 • 2011 Eastern Mediterranean Health JournalLa Revue de Santé de la Méditerranée orientale
66
by the workshops may have rendered teachers more qualified to make objec-tive judgements regarding the school health environment, may have moti-vated school administrators to work on improving school conditions and
may have exerted an indirect influence on the surrounding community and encouraged students and their families to be more aware of health-related is-sues in schools. The improvement in pre- to post-intervention scores may be
Table 3 Frequency of teachers’ positive responses on selected items of the adapted school health index, before and after the intervention: physical education module
Item % of respondents P-value
Baseline(n = 202)
Final(n = 193)
Students active in at least 50% of physical education classes 40.1 54.4 0.0044Physical education lessons enjoyable 39.6 53.9 0.0044Satisfactory teacher/student ratio 31.3 34.8 0.4596 a
Applying physical education sequential curriculum 27.2 43.0 0.0010Lessons consider students with special needs 22.8 39.9 0.0003Teaching fitness through health-related lessons 21.8 37.8 0.0005Curriculum follows international standards 17.8 30.1 0.0041Safety standards 15.8 31.1 0.0003Teachers receive continuing education 15.8 32.1 0.0001Physical education teaching by certified teachers 13.9 28.5 0.0004Focus on basic motor skills 11.4 23.3 0.0017
anot significant.
taken as evidence of effective awareness-raising about healthy schools, and this prompts a need for such campaigns to be included in the educational policy of developing countries. In addition, the results of this survey suggest that the
Table 4 Frequency of teachers’ positive responses on selected items of the adapted school health index, before and after the intervention: nutrition services module
Item % of respondents P-value
Baseline(n = 202)
Final(n = 193)
Ensuring actual consumption of school snack 58.3 67.4 0.0615 a
Clean, safe and pleasant cafeteria 54.5 65.8 0.0219Appealing and nutritive foods 43.1 50.8 0.1253 a
Emergency preparedness (e.g. choking) 36.6 49.7 0.0086Suitable facility for snack eating 28.6 34.8 0.1853 a
Outside venues offer appealing foods 23.3 37.8 0.0018Service manager qualified and certified 15.8 29.0 0.0016Tools applied promoting nutrition education 23.8 28.5 0.2877a
anot significant.
Table 5 Frequency of teachers’ positive responses on selected items of the adapted school health index, before and after the intervention: health services module
Item % of respondents P-value
Baseline(n = 202)
Final(n = 193)
Informing staff about students’ medical status 63.9 74.6 0.0214
Identification and referral of unwell students 52.5 66.3 0.0053
Services provision partnership 47.0 61.1 0.0050
Healthy eating promotion methods 24.3 42.0 0.0002
Physical activity promotion methods 18.3 34.7 0.0002
Collaboration of health committee 53.6 65.3 0.0180
Book 17-1.indb 66 1/3/2011 1:38:47 PM

املجلد السابع عرشاملجلة الصحية لرشق املتوسطالعدد األول
67
SHI may be valid when used in develop-ing nations to monitor school health curricula and environment.
Currently government spending on education in the developing world tends to be directed toward the expansion of facilities, materials and training teachers in basic aspects of education, such as the use of blackboards and improvements in examinations. Although children in schools may be less healthy than their preschool counterparts [3] only limited attention is paid by the education com-munity to health problems in school-age children. Schools’ health curricula may focus on increasing students’ theoretical knowledge about nutrition, but place less emphasis on influencing students’
motivation, attitudes and specific eating behaviours [3–5].
Developing countries today must realize that children’s nutritional health is crucial to sustainable development. Policies should be implemented to promote investment in health among schoolchildren and ensure that nutri-tional goals for school-aged children are met. The use of an SHI-based pro-gramme to appraise the elementary school health environments is likely to be cost-effective. The teacher’s role in identifying priorities is of importance. Professional development in the area of childhood health and nutrition is needed, and would be an integral part of a programme that includes the use
Table 6 Frequency of teachers’ positive responses on selected items of the adapted school health index, before and after the intervention: family and community involvement module
Item % of respondents P-value
Baseline(n = 202)
Final(n = 193)
Teachers approve offering morning snack 46.2 57.5 0.0247
Educating families on physical activity and nutritional health 41.1 57.0 0.0016
Family/students have input into nutrition programmes 32.2 48.2 0.0012
Table 7 Comparison of teachers’ mean percentages scores on the 6 modules of the adapted school health index before and after the intervention
Module Mean (SD) % score P-valuea
Baseline(n = 202)
Final(n = 193)
Health and safety/environment policies 49.5 (23.5) 55.9 (16.4) 0.02
Health education 44.2 (30.7) 56.5 (29.5) < 0.001
Physical education 40.3 (26.0) 52.9 (29.0) < 0.001
Nutrition services 51.3 (18.4) 59.2 (19.2) < 0.001
Health services 62.5 (29.0) 73.8 (26.9) < 0.001
Family/community involvement 55.2 (37.8) 68.3 (35.6) < 0.001aIndependent sample t-test. SD = standard deviation
of the SHI. Developed countries are using the SHI track the links between behaviours and morbidity, such as the link between physical activity and overweight [14]. Stakeholders con-cerned with the welfare of developing nations are urged to study the SHI models of developed nations. Local re-searchers can develop and use a modi-fied version of the SHI to collect data essential to the formation of children’s health policy.
Acknowledgement
The authors wish to thank the Ministry of Education for funding this survey.
References
Consultation on strategies for implementing comprehensive 1. school health education/ promotion programs. Comprehen-sive school health education: suggested guidelines for action. Copenhagen, World Health Organization 1992.
G2. raham V et al. ‘Filling the gap’—children aged between four and six years: sources of nutrition information used by fami-
lies and kindergarten teachers. Australian Journal of Nutrition and Dietetics, 2000, 57:90–94.
Del Rosso JM, Marek T. 3. Improving school performance in the developing world through better health and nutrition. Directions in development. Washington DC, World Bank, 1996.
Book 17-1.indb 67 1/3/2011 1:38:47 PM

EMHJ • Vol. 17 No. 1 • 2011 Eastern Mediterranean Health JournalLa Revue de Santé de la Méditerranée orientale
68
Drake LJ et al. School age children: their health and nutrition. 4. SCN News, 2002, 25:4–30.
Keirle K, Thomas M. The influence of school health education 5. programs on the knowledge and behavior of school children towards nutrition and health. Research in Science and Techno-logical Education, 2000, 18:173–190.
School health index for physical activity and healthy eating: a 6. self-assessment and planning guide. Elementary school version. Atlanta, Georgia, Centers for Disease Control and Prevention, 2000.
Hijazi S. 7. Child growth and nutrition in Jordan. Amman, Jordan, Royal Scientific Society, 1977.
Hijazi S, Abulaban A, Waterlow JC. The duration for which 8. breast-feeding is adequate. Acta Paediatrica Scandinavica, 1989, 78:23–28.
Hijazi S et al. 9. Health of Jordanian children. The national multi-purpose study of preschool children in Jordan. Amman, Jordan, Ministry of Social Development, 1987.
Khatib I, Hijazi S. 10. JUST-child growth percentiles: cross- sectional study of the declination of jordanian child growth curve and its association with domestic patterns of infant weaning. Amman, Jordan, Jordan University of Science and Technology Dean-ship of Scientific Research, 1993.
Khatib IM, Hijazi SS, Aggett P. 11. A role for zinc-fortified weaning foods in prevention of early linear growth deficiency in Jordanian infants. Amman, Jordan, Higher Council of Science and Tech-nology, 1995.
Khatib IM. High prevalence of subclinical vitamin A deficiency 12. in Jordan: a forgotten risk. Food and Nutrition Bulletin, 2002, 23(3 Suppl.):228–236.
Khatib IM, Hijazi SS. Micronutrient deficiencies among chil-13. dren may be endemic in underprivileged areas in Jordan. Jordan Medical Journal, 2009, 43(4):324–332.
Datar A, Sturm R. Physical education in elementary school 14. and body mass index: evidence from the early childhood longitudinal study. American Journal of Public Health, 2004, 94:1501–1506.
Health-promoting school initiative
The health-promoting school initiative was implemented in 1994 in the Eastern Mediterranean Region and the initiative has been adopted by 13 of the 22 Member States: Bahrain, Egypt, Jordan, Lebanon, Libyan Arab Jamahiriya, Islamic Republic of Iran, Iraq, Oman, Saudi Arabia, Syrian Arab Republic, Tunisia, United Arab Emirates and Yemen. Generally, health-promoting schools are run by the ministry of health, in close collaboration with the ministry of education. The World Health Organization’ Regional Office for the Eastern Mediterranean is currently conducting a review of health-promoting schools in countries of the Region to set up a regional database on existing health-promoting schools and initiatives.
Further information about health promoting schools can be found at: http://www.emro.who.int/hps/index.htm
Book 17-1.indb 68 1/3/2011 1:38:47 PM

املجلد السابع عرشاملجلة الصحية لرشق املتوسطالعدد األول
69
Évaluation des actes de prévention dans les cliniques du département d’odontologie de l’Université Cheikh Anta Diop de Dakar M. Diouf,1 A. Faye,2 D. Cisse1, D. Faye1 et C.M.M. Lo1
RÉSUMÉ Il s’agit d’une étude transversale qui portait sur 295 patients pris en charge par les étudiants et dont l’objectif était d’évaluer les actes de prévention bucco-dentaires reçus par les patients en clinique au département d’odontologie de l’Université Cheikh Anta Diop de Dakar. Les variables socio-démographiques, spécialité clinique, technique de brossage du patient et les variables liées aux actes de prévention ont été mesurées. La population d’étude était composée de 48,5 % d’hommes et de 76,6 % d’adultes. Plus de 32 % des patients provenaient de la clinique d’odontologie conservatrice/endodontie. Pour 52,2 % des patients, aucun soin prophylactique n’était dispensé. L’utilisation de supports lors de l’enseignement de l’hygiène n’était respectée que pour 17,4 % des cas. Les attitudes et pratiques des étudiants par rapport aux soins méritent plus de vigilance et nécessitent d’insister sur la prophylaxie.
1Service de santé publique dentaire, Département d’Odontologie, Université Cheikh Anta Diop, Dakar (Sénégal) (Correspondance à adresser à M. Diouf : [email protected] ; [email protected]). 2Assistant au service de médecine préventive et santé publique, Faculté de Médecine, de Pharmacie et d’Odonto-Stomatologie (FMPOS), Université Cheikh Anta Diop, Dakar (Sénégal)
Reçu : 21/02/2010; accepté : 22/03/10
تقيـيم الرعاية الوقائية يف عيادات طب األسنان يف جامعة شيخ عنتا ديوب يف داكارماسامبا ضيوف، أداما فايـي، داوود سييس، داوود فايـي، شيخ حممدو مباكي لو
اخلالصـة: أجرى الباحثون دراسًة مستعرضة شملت 295 مريضًا عاجلهم طالب طب األسنان، وغايُتها تقيـيم الرعاية الَفَموّية السّنية التي يتلقاها املرىض الذين يتـرددون عىل عيادات طب األسنان يف جامعة شيخ عنتا ديوب يف داكار. وقد سجل الباحثون اخلصائص الديموغرافية االجتامعية ك وغري ذلك من متغرّيات الرعاية الوقائية. وشملت عينات الدراسة للمرىض، والتخصص الرسيري، والطرائق التي يستخدمها املرىض يف الَتَسوُّ48.5% من الرجال، و76.6% من البالغني. وقد جاء ما يزيد عىل 32% من املرىض من عيادات طب األسنان التحفظي، ومل يقدم أي إجراء وقائي لـ
52.2 %من املرىض، ولوحظ أن استخدام الوسائل املساعدة البرصية يف تعليم صحة الفم قد اقترص عىل 17.4% من احلاالت. مما يدلُّ عىل أن مواقف
ظ والتأكيد عىل الوقاية. وممارسات طالب طب األسنان يف ما يتعلق بالرعاية يتطلب مزيدًا من التيقُّ
Evaluation of preventive care in the dentistry department clinics of the University Cheikh Anta Diop in Dakar
This was a cross-sectional study of 295 patients treated by dentistry students that aimed to evaluate the preventive care received by patients attending clinics of the dentistry department of the University Cheikh Anta Diop in Dakar. The sociodemographic characteristics of the patients, clinic specialty, patients’ brushing technique and the other preventive care was recorded. The study sample comprised 48.5% men and 76.6% adults. Over 32% of the patients were from the conservative dentistry clinic. For 52.2% of the patients, no preventive action was provided. The use of visual aids when teaching oral hygiene was observed for 17.4% of cases. Attitudes and practices of the dentistry students in relation to care require more vigilance and emphasis on prevention.
Book 17-1.indb 69 1/3/2011 1:38:47 PM

EMHJ • Vol. 17 No. 1 • 2011 Eastern Mediterranean Health JournalLa Revue de Santé de la Méditerranée orientale
70
Introduction
L a p r é v e n t i o n e s t u n e n o t i o n f o n d a m e n t a l e e n s a n t é [ 1 ] . E n odontologie particulièrement, des actes de prévention comme l’enseignement de l’hygiène bucco-dentaire, les soins prophylactiques et la prescription de produits d’hygiène restent un des moyens essentiels pour aboutir au succès des traitements.
Au département d’odontologie de la Faculté de Médecine, de Pharmacie et d’Odonto-Stomatologie de l’université Cheikh Anta Diop de Dakar, des soins sont prodigués au public par les étudiants. Ces soins sont coordonnés par les services cliniques : chirurgie b u c c a l e , o r t h o p é d i e d e n t o -f a c i a l e ( O D F ) , p a r o d o n t o l o g i e , o d o n t o l o g i e p é d i a t r i q u e ( O P ) , o d o n t o l o g i e c o n s e r v a t r i c e /endodontie (OCE) et prothèse dentaire. Ces activités cliniques sont précédées par des enseignements théoriques et pratiques axés sur des thématiques dont la prévention en santé bucco-dentaire. D’ailleurs, la prévention au sens de l’enseignement de l’hygiène aux patients demeure obligatoire dans les plans de traitement des différentes spécialités cliniques. Une hygiène bucco-dentaire mal suivie peut mettre en péril tous les acquis d’un traitement [2].
Bon nombre de travaux ont été réalisés sur l’hygiène bucco-dentaire et la prévention. Le lien entre une mauvaise hygiène, la survenue de pathologies bucco-dentaires et/ou l’aggravation de ces pathologies a été établi [3-8]. D’autres études portant sur le comportement des patients ont conclu à la nécessité d’insister sur la formation de base pour une meilleure maîtrise des mesures prophylactiques [9,10]. En Afrique, et particulièrement au Sénégal, rares sont les études menées auprès des patients en odontologie concernant la prévention. D’où l’intérêt du présent
travail qui avait pour objectif d’évaluer les actes de prévention bucco-dentaires reçus par les patients en clinique au département d’odontologie.
Méthodes
L’étude avait pour cadre le département d’odontologie de la Faculté de Médecine de Pharmacie et d’Odonto-Stomatologie de l’université Cheikh Anta Diop de Dakar qui assure la formation d’étudiants en chirurgie dentaire. Ces étudiants font deux années de travaux pratiques en 2e et 3e années et deux années de clinique en 4e et 5e années. Au cours de ces deux dernières années, les étudiants prennent en charge des patients en odontologie conservatrice/endodontie (OCE), chirurgie, parodontologie, prothèse, odontologie pédiatrique (OP) et orthopédie dento-faciale (ODF).
Il s’agissait d’une étude descriptive transversale portant sur les patients reçus lors des activités cliniques d e s é t u d i a n t s d u d é p a r t e m e n t d’odontologie. Était retenu dans l’étude tout patient pris en charge lors d’une activité clinique, ne nécessi- tant pas de traitement d’urgence et acceptant de répondre aux questions.
La base de sondage était constituée par les patients qui fréquentaient les cliniques du département d’odontologie. La liste des patients du jour numérotés par ordre d’arrivée permettait de procéder à un échantillonnage de type aléatoire systématique avec un pas de sondage de 5. La première unité statistique était tirée à l’aide du logiciel Epi Info 6. Tous les patients qui venaient consulter au moment de l’enquête et qui répondaient aux critères de sélection étaient pris en compte. Ils n’étaient interrogés qu’une seule fois.
La proportion de patients ayant reçu un acte de prévention a d’abord été estimée à 15 %, ensuite une précision de
5 % a été fixée. La taille de l’échantillon correspondante dans le tableau de Lutz (détermination de la taille à partir d’une prévalence théorique et d’une précision fixée) [11] était de 290. Elle a été finalement portée à 295 pour suppléer aux questionnaires perdus ou non utilisables.
Les données ont été collectées grâce à une fiche d’enquête qui avait d’abord été pré-testée sur 20 patients. Les difficultés et ambigüités rencontrées ont été corrigées dans le but de préparer l’enquête finale. Les questionnaires étaient administrés directement aux malades participant à l’étude par un chirurgien-dentiste de santé publique. La collecte avait lieu tous les jours, du lundi au samedi, d’avril à juin et concernait les patients venant dans les six cliniques du département. Pour les enfants, les parents ou accompagnants répondaient aux questions.
Variables et indicateurs L e s i n f o r m a t i o n s à r e c u e i l l i r concernaient :
les variables socio-démographiques •des patients : sexe, âge, scolarisation, statut socio-professionnel, spécialité clinique ;
la variable bonne technique de •brossage des patients qui consiste, conventionnellement, à effectuer le brossage suivant le sens de la gencive vers la dent ;
les variables liées aux actes de •prévention reçus en clinique :
soins en rapport avec l’hygiène - bucco-dentaire (détartrage, surfaçage, polissage, etc.) ;prescription de produits ou - matériel d’hygiène (brosse à dent, dentifrice, fil de soie, bains de bouche, etc.) ;conseils d’hygiène bucco-- dentaire ;utilisation de supports durant - l ’e n s e i g n e m e n t (a l b u m , modèle de dents, etc.).
Book 17-1.indb 70 1/3/2011 1:38:47 PM

املجلد السابع عرشاملجلة الصحية لرشق املتوسطالعدد األول
71
Analyse statistique Les données étaient saisies grâce au logiciel Epi Info 2000 version 3.4.3. L’analyse faite avec le logiciel SAS version 9.1 en univarié intéressait les proportions et les moyennes. L’analyse bivariée a consisté en une comparaison des proportions à l’aide du test de χ². Un modèle de régression logistique multiple a été développé en retenant les variables dont le p est inférieur à 0,2 lors de l’analyse univariée. La variable dépendante était la technique de brossage des patients et les variables explicatives étaient celles en rapport avec les actes de prévention reçus en clinique. Un ajustement a été effectué sur les caractéristiques socio-démographiques. Le seuil de signification était fixé à 5 %.
Résultats
Caractéristiques socio-démographiques des patientsL’échantillon comprenait 48,5 % d’hommes et 51,5 % de femmes ; le sex ratio était de 0,94. La population d’étude était composée de 23,4 % d’enfants (moins de 16 ans) et de 76,6 % d’adultes ; la moyenne d’âge était de 26 ans (écart type 15,6) avec un minimum de 5 ans et un maximum de 88 ans. Les patients étaient scolarisés dans 90,5 % des cas, dont 59,3 % au niveau supérieur ou secondaire et
30,8 % au niveau primaire. Le statut s o c i o - p r o f e s s i o n n e l d e n o t r e échantillon était dominé par les non-salariés (85,8 %).
Concernant la spécialité clinique, la cl inique d’OCE avait 32,9 % des patients. Elle était suivie par la clinique d’odontologie pédiatrique avec 21,7 % (Figure 1).
Connaissance d’une bonne méthode de brossage
La bonne méthode de brossage n’était connue que de 29,8 % des patients. La bonne technique de brossage était significativement associée au niveau d’étude des patients et à la catégorie socio-professionnelle (Tableau 1).
Actes de prévention reçus en clinique
Pour 52,2 % des patients, aucun soin s e r a p p o r t a n t à l a p r é v e n t i o n n’était effectué. Cependant , les soins prophylactiques influencent significativement la bonne technique de brossage (odds ratio [OR] = 0,29 ; intervalle de confiance [95%IC] 0,17-0,51) (p < 0,0001) (Tableau 1) et ce, même après ajustement (OR = 2,8 ;
95%IC 1,5-5,3) (Tableau 2). En ce qui concerne les produits ou le matériel d’hygiène, 89,5 % de l’échantillon disaient n’avoir pas bénéficié de prescription.
L’utilisation de supports pour enseigner l’hygiène n’était respectée que pour 17,4 % des cas. L’association avec la bonne méthode de brossage était très forte (OR = 4,4 ; 95%IC 2,35-8,30) (p < 0,0001) (Tableau 1) et ce, même après ajustement (OR = 2,9 ; 95%IC 1,4-5,9) et ce, même après ajustement (Tableau 2).
DiscussionL’hygiène et la prévention sont des notions transversales qui concernent chaque personne, quel que soit son sexe ou son âge. Dans cette étude, 51,5 % des patients étaient de sexe féminin. Ce pourcentage ne traduit pas la répartition de la population dans la région de Dakar où il y a une prédominance des hommes selon l’enquête démographique et de santé réalisée en 2005 au Sénégal [12]. Cette différence, même si elle n’est pas significative (p > 0,05), pourrait être liée au fait que les femmes seraient plus fréquentes en consultation dentaire. C’est une population en majorité jeune, avec une moyenne d’âge de 26 ans. Cette jeunesse de la population s’expliquerait par le cadre d’étude choisi qui n’abrite que des patients étudiants pour la plupart. Dans notre échantillon, 90,5 % sont scolarisés avec un niveau d’instruction plus important pour le secondaire ou le supérieur, soit un pourcentage de 59,3 %.
32,9 %
14,6 %10,2 %
15,3 %
21,7 %
5,4 %
OCE Chirurgie Parodontologie Prothèse OP ODF
OCE : odontologie conservatrice/endodontie ; OP : odontologie pédiatrique ; ODF : orthopédie dento-faciale.
Figure 1 Répartition des patients en fonction de la spécialité clinique
Book 17-1.indb 71 1/3/2011 1:38:48 PM

EMHJ • Vol. 17 No. 1 • 2011 Eastern Mediterranean Health JournalLa Revue de Santé de la Méditerranée orientale
72
Les patients fréquentaient plus le service d’OCE (32,9 %) et le service d’odontologie pédiatrique (21,7 %) tandis que l’ODF avait la plus faible proportion de patients (5,4 %). Cette distribution semble logique d’autant plus que l’OCE et l ’odontologie pédiatrique s’occupent plus des consultations liées à la douleur. Segal rapportait que 2 patients sur 3 reçus en chirurgie dentaire le sont pour un motif lié à la douleur, soit 89 % des cas [13]. L’ODF, dont les soins peuvent exiger un certain niveau socio-économique, serait moins fréquentée.
Plusieurs techniques de brossage sont décrites dans la littérature dont celles de Bass, de Stillman, de Sharter ou la technique verticale. Elles ont cependant en commun de diriger toujours les poils de la brosse de la gencive vers la dent. La population de l’étude, bien que fortement scolarisée, ne semblait pas connaître la bonne technique de brossage. En effet, 71,2 % de l’échantillon utilisaient une méthode de brossage inappropriée. Cette proportion est plus élevée que celle trouvée par Marchini et al. au Brésil (54,1 %) chez une population de 553 personnes dont 64,7 % de femmes [10]. La différence pourrait s’expliquer par la proportion de femmes plus importante dans son étude. Il a été trouvé que les femmes s’occupent plus de leur hygiène que les hommes [14]. Cependant, i l n’existait pas de lien entre sexe et
bonne technique de brossage (OR = 0,8 et compris entre 0,4 et 1,3). Il ressort que la bonne technique de brossage était significativement associée au niveau d’étude des patients et à la catégorie socio-professionnelle (Tableau 1). En effet, plus les patients étaient instruits, mieux ils connaissaient la bonne technique de brossage.
Il est apparu que plus de la moitié des patients disaient être soignés directement sans recevoir des soins prophylactiques (détartrage, surfaçage, polissage, etc.). Pourtant les soins prophylactiques dispensés étaient fortement associés à la bonne méthode de brossage (Tableau 2). Une étude sur l’attitude des élèves infirmiers par rapport aux actes de prévention prodigués aux patients en Irlande avait montré, contrairement à nos résultats, que l’environnement clinique et le statut d’apprenant des élèves avaient une influence positive sur les patients [15]. Cette différence observée serait liée au système d’encadrement des élèves qui serait meilleur que celui
du Département d’Odontologie. Dans 89,5 % des cas, aucune prescription de matériels (brosses à dent, brossettes, fils de soie, etc.) ou de produits d’hygiène (dentifrices, bains de bouche, gels, etc.) n’était effectuée. Cette modeste quantité de prescription s’inscrit dans un contexte de faible utilisation du bâtonnet frotte-dents (1,3 % selon Kane en 2001). De plus, le rôle inhibiteur des antiseptiques contre la formation de la plaque dentaire [16,17] devait amener les étudiants traitants à prescrire davantage les produits comme les bains de bouche. Il existe un lien significatif entre la prescription et la bonne méthode de bros-sage (Tableau 1). Cette faiblesse de la quantité de matériels ou produits prescrits pourrait être imputée à une insuffisance de la culture de prévention chez les étudiants.
L’utilisation d’un support pour enseigner l’hygiène (maxi-bouche, maxi-brosse, album, brochures, etc.) était rare et 82,7 % de l’échantillon n’avaient pas vu de supports d’information lors de leur visite. Tout en étant averti quant à l’importance des supports pour faciliter la compréhension, ce pourcentage était élevé. Cette importante proportion pourrait s’expliquer par le fait que les étudiants seraient stressés par le quota d’actes à effectuer au point de négliger le support, ou que cet enseignement n’était pas noté. La bonne technique était pourtant très significativement associée à l’utilisation de supports au moment de l’enseignement (p < 0,0001). Kang et al. avaient trouvé des résultats voisins en milieu scolaire japonais [18].
Tableau 1 Relation entre bonne technique de brossage et variables explicatives en analyse univariée
Variables indépendantes Oui (%)a Odds ratio (95%IC) p
Sexe - 1,23 (0,74-2,05) 0,4
Groupe d’âge - 0,6 (0,32-1,17) 0,13
Scolarisation 31,1 0,17 (0,03-0,73) 0,007
Conseils 34,7 1,76 (1,05-2,93) 0,028
Soins prophylactiques 41,0 0,29 (0,17 -0,51) < 0,00001
Prescription de produits ou matériel d’hygiène 43,5 2,39 (1,35-4,20) 0,002
Utilisation de supports 34,1 4,42 (2,35 -8,30) < 0,00001 aProportion de patients connaissant la bonne technique en associant avec les variables indépendantes. IC : intervalle de confiance.
Tableau 2 Facteurs associés à la bonne technique de brossage en analyse multivariée
Variables Odds ratio Odds ratio ajusté (95%IC)
Scolarisation 0,17 6,0 (1,3-27)
Groupe d’âge 0,60 0,3 (0,1-0,7)
Utilisation de supports 4,42 2,9 (1,4-5,9)
Soins prophylactiques 0,29 2,8 (1,5-5,3)
IC : intervalle de confiance.
Book 17-1.indb 72 1/3/2011 1:38:48 PM

املجلد السابع عرشاملجلة الصحية لرشق املتوسطالعدد األول
73
Références
Haute Autorité de santé (HAS). 1. Éducation thérapeutique du pa-tient. Recommandations juin 2007 (Disponible sur le site http://www.has-sante.fr/portail/upload/docs/application/pdf/etp_-_definition_finalites_-_recommandations_juin_2007.pdf, consulté le 16 juin 2010).
Choukroun G. Motivation à l’hygiène bucco-dentaire. 2. Le Chirurgien-Dentiste de France, 1986, 56(332):37–39.
Harrison R et al. Effect of motivation interviewing on rates of 3. early childhood caries: a randomized trial. Pediatric Dentistry, 2007, 29:16–22.
Ay ZY. Appropriate oral hygiene motivation method for 4. patients with fixed appliances. Angle Orthodontist, 2007, 77:1085–1089.
Honkala S, Honkala E, Al-Sahlin N. Does life or school – sat-5. isfaction and self-esteem indications explain the oral hy-giene habits of school children? Oral Epidemiology, 2007, 35:337–347.
Sniehotta FF, Aranjo Soares V, Dombrowski SU. Random-6. ized controlled trial of a one- minute intervention changing oral self-care behavior. Journal of Dental Research, 2007, 86:641–645.
Christensen LB et al. Self-reported oral hygiene practices 7. among adults in Denmark. Community Dental Health, 2003, 20:229–235.
Dikbas I, Koksal T, Calikkocaoglu S. Investigation of cleanliness 8. of dentures in a university hospital. International Journal of Prosthodontics, 2006, 19:294–298.
Young LJ, Newell KJ. Can a clinical continuing education 9. course change behavior in dental hygiene practice? Journal of Dental Hygiene, 2008, 82:33.
Marchini L et al Self-sported oral hygiene habits among insti-10. tutionalized elderly and then relationship to the condition of oral tissues in Taubaté, Brazil. Gerodontology, 2006, 23:33–37.
Lutz W. 11. Comment former des échantillons d’individus, de ménages, de zones, pour l’étude des problèmes de santé de la col-lectivité. Rennes, École Nationale de Santé Publique (E.N.S.P.), vol. 2, 1986.
Sénégal.12. Enquête Démographique et de Santé 2005. Rapport préliminaire. Dakar, Ministère de la Santé et de la Prévention Médicale/Centre de Recherche pour le Développement Hu-main et Calverton, Maryland, ORC Macro, 2005 (Disponible sur le site http://www.unfpa.sn/docs/Senegal.pdf, consulté le 16 juin 2010).
Segal H. Duration and type of pain emergency patients. 13. Gen-eral Dentistry, 1984, 32:507–509.
Kane AW 14. et al. Habitudes d’hygiène orale et situation de la carie dentaire des étudiants. Enquête auprès de 150 étudiants en résidence universitaire à Dakar (Sénégal). Odonto-Stoma-tologie Tropicale, 2001,24(93):16–21.
McAuliffe A. Nursing students’ practice in providing oral hy-15. giene for patients. Nursing Standards, 2007, 21:35–39.
Biesbrock AR et al. Oral hygiene regimens, plaque control, and 16. gingival health: a two-month clinical trial with antimicrobial agents. Journal of Clinical Dentistry, 2007, 18:101–105.
Slot DE et al. The effect of 0.12% chlorhexidine dentifrice gel 17. on plaque accumulation: a 3-day non-brushing model. Inter-national Journal of Dental Hygiene, 2007, 5:45–52.
Kang BH et al. Effect of a Tooth-brushing Education Program 18. on Oral Health of Preschool Children. Journal of the Korean Academy of Nursing, 2008, 38:914–22.
Cette étude ne s’est pas intéressée aux besoins en soins prophylactiques, en conseils , en prescriptions et enseignement de l ’hygiène des patients venus consulter. Toutefois, cela permettrait de mettre l’accent sur les actes de prévention et de systématiser ceux-ci dans les activités cliniques.
Le recueil des données avait lieu dans l’enceinte du département d’odontologie. Cela pourrait influencer la réponse des patients et entrainer des biais d’information Cependant, si ces biais existaient , i ls seraient négligeables parce qu’une seule
personne administrait les question-naires aux patients en l’absence de l’étudiant traitant. L’enquête se déroulait tous les jours ouvrables et pendant les heures d’activités de soins et ce, pour avoir un échantillon représentatif de toutes les cliniques du département. Cette démarche a contribué à minimiser les biais de sélection.
Conclusion
Globalement, les actes de prévention effectués par les étudiants chez les
patients étaient insuffisants. Ces actes de prévention bien menés demeurent la clé de la réussite de tout traitement bucco-dentaire. C’est pourquoi, dans les programmes d’enseignement, une place devrait leur être réservée pour permettre aux étudiants d’avoir les connaissances théoriques et pratiques, en insistant sur les traitements prophylactiques et l’utilisation de supports lors de l’enseignement de l’hygiène. Il est tout aussi nécessaire de veiller au respect de ces actes par un système de notation en clinique.
Book 17-1.indb 73 1/3/2011 1:38:48 PM

EMHJ • Vol. 17 No. 1 • 2011 Eastern Mediterranean Health JournalLa Revue de Santé de la Méditerranée orientale
74
Specialty choices of medical students and house officers in Karachi, PakistanM. Aslam,1A. Ali,1 T. Taj,2 N. Badar,1 W. Mirza,3 A. Ammar,1 S. Muzaffar 1 and J.R. Kauten 4
ABSTRACT Understanding patterns of career choices in medicine is important for educators and policy-makers to plan the supply of specialists. This study analysed the career choices made by medical students and house officers in 2 private and 2 public medical schools in Karachi, Pakistan. An anonymous, self-administered questionnaire was completed by 850 students. Internal medicine, paediatrics, general surgery and obstetrics and gynaecology were the 4 highest ranked specialties, with internal medicine ranked top as both the 1st and 2nd choice. Internal medicine was the 1st choice for significantly more students in public than private medical colleges (22.2% versus 14.9%). Students from private medical institutions chose a wider range of specialties than those from publicly-funded colleges. A high proportion of medical students and graduates in Karachi favour the same medical specialties, which may lead to saturation in those areas of specialization.
1Department of Research, Dow University of Health Sciences, Karachi, Pakistan (Correspondence to M. Aslam: [email protected]; [email protected]). 2Department of Community Health Sciences; 3Department of Radiology, Aga Khan University Hospital Karachi, Pakistan.4Peachtree Cardiovascular and Cardiothoracic Surgeons, Atlanta, Georgia, United States of America.
Received: 16/06/09; accepted: 02/08/09
اختيار التخصصات الطبية لطلبة الطب واألطباء املقيمني يف كراتيش بباكستانمبرش أسلم، عارف عيل، طابر تاج، نارصة بدر، وسيم مرزا، عيل عامر، سعد مضفر، جيمس كوتن
الدراسة املتخصصني. وحتلل هذه توفري لتخطيط الطبي املهني املستقبل التعرف عىل خيارات السياسات للمعّلمني وراسمي املهم من اخلالصة: خيارات املستقبل املهني لطلبة الطب واألطباء املقيمني يف كليتني خاصتني وكليتني عامتني للطب يف مدينة كراتيش بباكستان. وقد استوف 850 طالبًا استبيانًا ذايتَّ االستيفاء بدون حتديد اسم املشارك. وكان الطب الباطني، واألطفال، واجلراحة العامة، والتوليد والنساء هي أعىل أربع ختصصات عىل التـرتيب، وترّبع الطب الباطني عىل قمة اختيار املجموعة األوىل واملجموعة الثانية من الطلبة. وكان الطب الباطني هو االختيار األول لعدد أكرب 22.2% وبنسبة تُفوق طلبة كليتي الطب اخلاصتني )14.9%(. واختار الطلبة يف كليتي الطب تني وُيعتدُّ به إحصائيًا بني الطلبة يف كليتي الطب العامَّاخلاصتني جمااًل أوسع من التخصصات مقارنًة بالطلبة يف الكليتني املدعومتني من القطاع العام. وفّضلت نسبة عالية من طلبة الطب ومن اخلرجيني يف
مدينة كراتيش نفس التخصصات الطبية، مما قد يؤدي إىل تشّبع هذه املجاالت من التخصص.
Choix de spécialisation des étudiants en médecine et des internes à Karachi (Pakistan)
RÉSUMÉ La compréhension des choix de carrière en médecine est importante pour les éducateurs et les responsables politiques afin de prévoir les effectifs de spécialistes. La présente étude a analysé les choix de carrière réalisés par les étudiants en médecine et les internes dans deux facultés de médecine privées et deux facultés de médecine publiques à Karachi (Pakistan). Un questionnaire anonyme auto-administré a été rempli par 850 étudiants. La médecine interne, la pédiatrie, la chirurgie générale, la gynécologie-obstétrique étaient les quatre spécialisations les plus demandées, la médecine interne étant la spécialisation venant en tête de liste autant comme premier choix que comme deuxième choix. La médecine interne était le premier choix pour un nombre significativement plus élevé d’étudiants des facultés publiques que d’étudiants des facultés privées (22,2 % contre 14,9 %). Les étudiants des facultés de médecine privées choisissaient des spécialités plus variées que les étudiants des facultés au financement public. Une proportion élevée d’étudiants en médecine et de diplômés à Karachi se prononçaient en faveur des mêmes spécialisations médicales, ce qui peut conduire à une saturation dans ces domaines de spécialisation.
Book 17-1.indb 74 1/3/2011 1:38:48 PM

املجلد السابع عرشاملجلة الصحية لرشق املتوسطالعدد األول
75
Introduction
Medical graduates’ choice of specialty can influence the supply of physicians in different areas and can become prob-lematic when there are specialties that are not well represented [1,2]. Many researchers have elaborated on this sub-ject and have highlighted the different reasons for the low popularity of some medical specialties, particularly fam-ily medicine [3–5], psychiatry [6–8] and radiology [9–11]. Globally, the distribution of physician specialization is a growing concern, as these choices may not meet community needs [12]. Little work has been done to predict the future distribution of medical students among medical specialties [13] and the factors responsible for that distribution [14,15].
It has been observed that choices of particular specialties vary from re-gion to region. Biggs emphasized the importance of annual surveys of medi-cal graduates to quantify future needs and career opportunities [16]. Little research has been done in Pakistan to explore the demographics of specialty choices. A study from a private institu-tion explored the career preferences and choices of final-year students in Pakistan, but the study was limited by a small sample size and was restricted to one institution [17]. Nevertheless, these types of studies can be helpful in career counselling and policy-making [18].
In Pakistan, all medical schools offer a 5-year programme, with basic health sciences as the primary focus during the first 2 years, with gradually increas-ing exposure to clinical rotations over the next 3 years, followed by a 1-year compulsory internship in a teaching hospital. Potential differences in the career choices of medical students of private versus publicly trained institu-tions have not been studied previously in Pakistan. Some private medical insti-tutions are following a problem-based
learning system [19], whereas all the public medical institutions follow a con-ventional lecture-based curriculum. In addition, there are certain postgraduate specialty training programmes, such as family medicine, which are only of-fered in private medical institutions [16]. Kassebaum et al. noted that the medical specialties within an institu-tion can influence the career choices of medical students and that practical experience in a particular field is a major factor spurring a student’s interest in a particular specialty [20].
The objective of this research was to determine the career choices of medical students and recent medical graduates in Karachi, Pakistan and to compare the career choices of those trained in private versus public medical colleges.
Methods
Study design and study settingThis cross-sectional study was con-ducted from June 2007 to August 2007 in 2 public and 2 private medical train-ing centres in Karachi, Pakistan. In the public sector, we selected the 2 leading centres out of the 3 medical colleges in Karachi (Dow and Sindh Medical Col-leges). Of the 6 private medical colleges in Karachi, we selected the only 2 col-leges with fully implemented problem-based learning systems (Aga Khan and Ziauddin Medical Colleges).
Study sampleOnly 3rd, 4th and 5th year medical stu-dents and house officers were included in the study; 1st and 2nd year students were excluded because of limited expo-sure to clinical work in the early years of medical studies.
QuestionnaireThe authors developed a self-adminis-tered questionnaire in English language, which is the official language of the medi-cal training centres studied. The 20-item
questionnaire collected data on age, sex, self-reported socioeconomic status (low, medium or high), undergraduate courses of study and postgraduate stud-ies plans (inland, abroad or undecided). Respondents were asked to indicate their satisfaction with the medical pro-fession (satisfied or not satisfied) and to state their 1st, 2nd and 3rd choices of medical specialty career.
After seeking verbal consent from the participants, data collectors distrib-uted the questionnaires to the students and house officers and collected them from the different wards of the teaching hospitals of each individual medical institution. The same questionnaire was used for data collection at each of the medical centres.
The questionnaire was pre-tested on 30 participants from each of the medical centres to determine the response and applicability of the tool. Changes were made in the questionnaire accordingly (unpublished data).
The Department of Community Medicine, Sindh Medical College, gave ethical approval for the study. An information sheet was attached with each questionnaire to provide project details, rights of the participants and notification that completing the questionnaire represented informed consent. The questionnaire was anon-ymous to ensure the confidentiality of the data.
Statistical analysisData were entered and validated in EpiData, version 3.1. Data analysis was performed in SPSS, version 14. A self-reported choice of different medical and non-medical specialties was the defined outcome.
Chi-squared and t-tests were applied for categorical and continuous variables respectively to test the statistical signifi-cance at a 95% confidence level. Logistic regression was also applied to determine statistically significant differences after controlling for possible confounders.
Book 17-1.indb 75 1/3/2011 1:38:49 PM

EMHJ • Vol. 17 No. 1 • 2011 Eastern Mediterranean Health JournalLa Revue de Santé de la Méditerranée orientale
76
Results
A total of 909 medical students and house officers participated in the study (285 from private colleges and 624 from public colleges). Almost three-quarters of participants were males (71.5%) (Table 1). Their ages ranged from 19 to 28 years, with a mean age of 22 (SD 1.7) years. There was no significant dif-ference in mean age between those attending public or private universities. However, significantly more respond-ents at private colleges were of high socioeconomic class and of female sex than those at public colleges. Similar proportions of respondents from public and private institutions were satisfied with the medical profession (82.8% in private and 79.1% in public colleges)
Some of the respondents (n = 59) did not answer the question about career choices and so 850 medical students
and house officers were included in the final analysis. The ranking of the top 10 medical specialties was made according to the participants’ 1st, 2nd and 3rd ca-reer choices. Internal medicine, paediat-rics, general surgery, and obstetrics and gynaecology were the 4 highest ranked specialties (Table 2). Internal medicine was the favourite, with 20.5% of stu-dents/graduates reporting it as their 1st choice, followed by surgery (15.0%), paediatrics (13.5%), and obstetrics and gynaecology (9.3%). Internal medicine was also the top-ranked 2nd choice spe-cialty (17.2%), followed by paediatrics (12.8%), obstetrics and gynaecology (9.3%), and surgery (9.0%). For the 3rd choice specialty, internal medicine was also popular (11.2%) but ranked below paediatrics (15.3%).
Analysis of the 1st choice career showed that the top choice, internal medicine, was chosen by significantly
more students and graduates from pub-lic medical colleges 22.2% than private medical colleges (14.9%) (P = 0.01) (Table 3). General surgery and paedi-atrics were the next most highly ranked by similar proportions of students from both sectors. Although a higher propor-tion of public college students (10.8%) stated obstetrics and gynaecology as their 1st career choice than did those at-tending private institutions (5.2%), the difference was not statistically signifi-cant after controlling for the effect of sex and socioeconomic status as confound-ers. A significantly higher proportion of participants from the private medical centres chose specialization in ortho-paedics (5.1%) as compared to those attending the public medical centres (0.6%) (P = 0.02) (Table 3). Other spe-cialties mentioned by the students from private medical institutes as 1st career choice included several other options.
Table 1 Characteristics of medical students and house officers of private and public institutions in Karachi, Pakistan
Variable Private university(n = 285)
Public university(n = 624)
Statistics P-value
Mean age (SD) years 22.7 (1.6) 22.2 (1.8) t = –0.79 0.28
No.a % No.a %
Sex
χ2 = 32 < 0.001Male 168 59.4 482 77.7
Female 115 40.6 138 22.3
Socioeconomic status
χ2 = 9.8 0.007Low 27 9.9 96 15.7
Middle 207 75.5 461 75.2
High 40 14.6 56 9.1
Postgraduate studies plan
χ2 = 41 < 0.001Inland 62 27.4 188 47.6
Abroad 135 59.7 122 30.9
Undecided 29 12.8 85 21.5
Satisfaction with medical profession
χ2 = 1.6 0.11Satisfied 231 82.8 484 79.1
Not satisfied 48 17.2 128 20.9
Year in medical school
3rd year 84 29.5 131 21.0
4th year 77 27.0 206 33.0
5th year 59 20.7 156 25.0
House officer 65 22.8 131 21.0aData missing in some categories. SD = standard deviation.
Book 17-1.indb 76 1/3/2011 1:38:49 PM

املجلد السابع عرشاملجلة الصحية لرشق املتوسطالعدد األول
77
Those reported by more than 1 student were: neurosurgery (3.2%), gastroen-terology (2.5%), urology (2.0%), ear, nose and throat (ENT) (2.0%), fam-ily medicine (1.8%), radiology (1.4%), oncology (1.4%), nephrology (1.0%), endocrinology (1.0%), anaesthesiol-ogy (0.7%) and chest medicine (0.7%). Among the public medical school re-spondents, other specialties included: ENT (1.9%), neurosurgery (1.6%), an-aesthesiology (1.4%), gastroenterology (1.3%), radiology (1.1%), PhD in basic sciences (1.1%), plastic surgery (1.1%), nephrology (1.0%), chest medicine (0.6%), Masters in Business Adminis-tration (0.5%), endocrinology (0.3%) and community medicine (0.3%), hae-matology (0.3%), urology (0.3%).
Discussion
Other studies have identified and ana-lysed factors that influence the career choices of medical students and gradu-ates [21] as well as factors responsible for career changes [22]. Khater-Menassa and Major in Lebanon reported that personal interest in the field, intellectual opportunities and social responsibilities were the major factors that influenced medical students’ career choices [21].
To be able to begin to understand how career choices are made, it is important to analyse how the medical education system influences students to enter into certain medical specialties. Bethune et al. reported changes in career choices with students’ progression through medical school [23]. This process of a student gaining experience as training progresses highlights the influence of curriculum and environment on the career choices of students.
An analysis of the top-10 list of preferred career choices in medicine revealed some interesting information. Internal medicine, paediatrics, general surgery and obstetrics and gynaecology were the 4 highest ranked specialties by our respondents, which is consist-ent with the findings reported by Huda and Yousuf from a medical university in Pakistan [17]. The health service in Pakistan is characterized by a high level of competition for market share in lucrative fields of medical practice such as cardiology, and different levels of opportunities are present for different specialties. Government health policy has been largely silent about organizing and regulating medical services; how-ever, improvements have been seen.
There were several fields of medicine, including family medicine, endocrinology, nephrology and radiol-ogy that were not high priority choices among our medical students, private or public. Community medicine and forensic medicine were not highly rated choices by either group. As a result, se-rious manpower deficiencies in these fields may exist. Manpower shortages in basic medical science and research faculty already exist in developing coun-tries such as ours [17].
The ability to understand and predict a medical student’s choice of specialization is a complex process and is being studied elsewhere [15,24,25]. It is considered as a new field of study that warrants further exploration [23]. Armed with information about career preferences, medical education policy in Pakistan can be structured to facilitate the redistribution of medical students and physicians to underserved areas of specialization such as primary care. It has been noted that areas with higher ratios of primary care physicians to population have much lower total health care costs than other areas, possibly as a result of the better preventive care and lower hospitalization rates that accompany good primary care [26]. It is essential to ensure that an adequate number of
Table 2 Pattern of first, second and third career choices of medical students and house officers in Karachi, Pakistan (n = 850)
Rank 1st choice %(n = 850)
2nd choice %(n = 646)
3rd choice %(n = 412)
1 Internal medicine 20.5 Internal medicine 17.2 Paediatrics 15.3
2 General surgery 15.0 Paediatrics 12.8 Internal medicine 11.2
3 Paediatrics 13.5 Obstetrics & Gynaecology 9.3 Obstetrics &
Gynaecology 10.2
4 Obstetrics & Gynaecology 9.3 General surgery 9.0 General surgery 8.7
5 Cardiology 7.6 Cardiology 6.0 Cardiology 8.7
6 Cardiac surgery 3.5 ENT 4.8 Dermatology 7.3
7 Dermatology 3.4 Ophthalmology 4.0 Psychiatry 4.6
8 Psychiatry 2.5 Neurology 4.0 Neurology 3.6
9 Neurology 2.5 Dermatology 3.9 Neurosurgery 3.2
10 Ophthalmology 2.3 Radiology 3.9 Ophthalmology 2.7
n/a Other 20.0 Other 25.0 Other 24.5
ENT = ear, nose, throat; n/a = not applicable.
Book 17-1.indb 77 1/3/2011 1:38:49 PM

EMHJ • Vol. 17 No. 1 • 2011 Eastern Mediterranean Health JournalLa Revue de Santé de la Méditerranée orientale
78
physicians are providing care in all areas of primary care. Family medicine as a speciality is still short of its predicted needs [17] as there are few opportuni-ties for postgraduate training in family medicine in Pakistan.
While a national medical education policy has been developed by the gov-ernment of Pakistan, there is no specific policy to address the need or mecha-nisms for determining the number and areas for specialties in medical educa-tion. National policy cannot influence the private medical institutions; how-ever, there are other ways of promoting and ensuring the practice of national policy. These can include developing and promoting formal collaboration between public and private institutions, for example with exchange programmes for faculty and students and funding for research.
There are a number of factors ex-plaining the decision-making of publicly trained versus privately trained medical students when it comes to the choice of medical speciality. In our study stu-dents and house officers with an educa-tion from a private medical institution chose a wider range of specialties than did those trained in public colleges. A
higher percentage of students receiving an education from a private medical school are affluent or the children of physicians. These students may have a broader exposure to the full spectrum of medical specialties. In addition, the private medical centres chosen for this study follow a problem-based learning system [19], which has been shown to develop better psychosocial skills in students and a better attitude toward patients than students trained in more traditional ways [27].
One limitation in our study is selec-tion bias of medical training centres and their students. Medical students were chosen from all medical school classes to minimize selection bias. Variations were expected to be minimal as partici-pants were chosen in the same manner irrespective of whether they were the products of private or public medical training.
Further research is needed to study the factors that influence a medical trainee to choose a particular field of study. Better knowledge of the demo-graphics and need for medical special-ties across Pakistan and other countries in the region is needed to determine educational direction and policy. This
capability will better prepare develop-ing countries to meet their present and future medical needs.
Conclusions
This study has shown that a high pro-portion of medical students and recent medical graduates in Karachi, Pakistan choose the same medical specialties. This may lead to saturation in those areas of specialization and as a result leave the population underserved in other impor-tant areas. Students with an education from a private medical institution chose a wider range of specialties than did those trained in publicly-funded colleges.
Acknowledgements
The authors gratefully acknowledge the contribution of Waqas Javed Siddiqui (Jinah Postgraduate Medical Centre), Zeenat Zehra, Zehra Hassan (Dow Medical College), Ali Abbas (medical student, Ziauddin Medical University) and Tauseef and Bilal Abid (medical student, Aga Khan University), for facili-tating the questionnaire administration at the different medical universities.
Table 3 First choice of medical specialties among medical students and house officers of public and private institutes in Karachi (n = 850)
Medical specialty Private university(n = 269)
Public university(n = 581)
P-valuea
No. % No. %
Internal medicine 40 14.9 129 22.2 0.01
General surgery 38 14.1 85 14.6 0.1
Paediatrics 31 11.5 80 13.8 0.4
Obstetrics & gynaecology 14 5.2 63 10.8 0.1
Cardiology 27 10.0 36 6.2 0.2
Cardiac surgery 11 4.1 18 3.1 0.6
Dermatology 7 2.6 21 3.6 0.8
Psychiatry 7 2.6 14 2.4 0.8
Neurology 12 4.5 9 1.5 0.08
Ophthalmology 9 3.3 10 1.7 0.15
Orthopaedics 14 5.1 4 0.6 0.02
Other 59 21.9 112 19.3 – aAfter controlling for sex and socioeconomic status in logistic regression.
Book 17-1.indb 78 1/3/2011 1:38:49 PM

املجلد السابع عرشاملجلة الصحية لرشق املتوسطالعدد األول
79
References
Cooper RA et al. Economic and demographic trends signal an 1. impending physician shortage. Health Affairs (Project Hope), 2002, 21:140–154.
Fisher ES et al. The implications of regional variations in Medi-2. care spending. Part 2: health outcomes and satisfaction with care. Annals of Internal Medicine, 2003, 138:288–298.
Campos-Outcalt D et al. Family medicine specialty selec-3. tion: a proposed research agenda. Family Medicine, 2007, 39:585–589.
Starfield B. Primary care in Canada: coming or going? 4. Health-care Papers, 2008, 8:58–62, discussion 64–67.
McGaha AL et al. Responses to medical students’ frequently 5. asked questions about family medicine. American Family Physi-cian, 2007, 76:99–106.
Lehane M. Psychiatry: the career of choice. 6. Nursing Standard, 2005, 20:34–35.
Goldacre MJ et al. Career choices for psychiatry: national 7. surveys of graduates of 1974–2000 from UK medical schools. British Journal of Psychiatry, 2005, 186:158–164.
Wigney T, Parker G. Medical student observations on a career 8. in psychiatry. Australian and New Zealand Journal of Psychiatry, 2007, 41:726–731.
Maj L, Baerlocher MO: Factors leading to radiology career 9. selection: results of the 2004 National Physician Survey. Ca-nadian Association of Radiologists Journal, 2006, 57(3):175–178.
Kazerooni EA et al. Medical students’ attitudes toward radiol-10. ogy: comparison of matriculating and graduating students. Academic Radiology, 1997, 4:601–607.
Ehara S. Preclinical medical student education in radiology. 11. American Journal of Roentgenology, 2007, 189(3):W166.
Brotherton SE, Rockey PH, Etzel SI. US graduate medical edu-12. cation, 2003–2004. Journal of the American Medical Associa-tion, 2004, 292:1032–1037.
Saigal P et al. Factors considered by medical students when 13. formulating their specialty preferences in Japan: findings from a qualitative study. BMC Medical Education, 2007, 7:31.
Lawrence J, Poole P, Diener S. Critical factors in career deci-14. sion making for women medical graduates. Medical Education, 2003, 37:319–327.
Kassebaum DG, Szenas PL, Schuchert MK. Determinants of 15. the generalist career intentions of 1995 graduating medical students. Academic Medicine, 1996, 71:198–209.
Avgerinos ED et al. Greek medical students’ career choices 16. indicate strong tendency towards specialization and training abroad. Health Policy (Amsterdam), 2006, 79:101–106.
Khan H et al. Problem-based versus conventional curricula: 17. influence on knowledge and attitudes of medical students towards health research. PLoS ONE, 2007, 2:632.
Biggs JS. Postgraduate medical training in Pakistan: observa-18. tions and recommendations. Journal of the College of Physi-cians and Surgeons of Pakistan, 2008, 18:58–63.
Huda N, Yousuf S. Career preference of final year medical 19. students of Ziauddin Medical University. Education for Health (Abingdon, England), 2006, 19:345–353.
Petrides KV, McManus IC. Mapping medical careers: ques-20. tionnaire assessment of career preferences in medical school applicants and final-year students. BMC Medical Education, 2004, 4:18.
Nandi PL et al. Undergraduate medical education: compari-21. son of problem-based learning and conventional teaching. Hong Kong Medical Journal, 2000, 6:301–306.
Mutha S, Takayama JI, O’Neil EH. Insights into medical stu-22. dents’ career choices based on third- and fourth-year stu-dents’ focus-group discussions. Academic Medicine, 1997, 72:635–640.
Sobral DT. Selective training and cross-year clinical tutoring as 23. educational influences on generalist career choice. Education for Health (Abingdon, England), 2001, 14(2):295–303.
Bethune C et al. Family medicine as a career option: how 24. students’ attitudes changed during medical school. Canadian Family Physician, 2007, 53(5):881–885.
Khater-Menassa B, Major S. Factors influencing the choice of 25. specialty among medical students in Lebanon. Le Journal Medi-cal Libanais, 2005, 53:16–20.
Scott I et al. Why medical students switch careers: changing 26. course during the preclinical years of medical school. Cana-dian Family Physician, 2007, 53:95, 95, 1–5, 94.
Caminal J et al. The role of primary care in preventing am-27. bulatory care sensitive conditions. European Journal of Public Health, 2004, 14:246–251.
Book 17-1.indb 79 1/3/2011 1:38:50 PM

EMHJ • Vol. 17 No. 1 • 2011 Eastern Mediterranean Health JournalLa Revue de Santé de la Méditerranée orientale
80
Professor Abdel Hamid Omar Abaza Dr Hilmy AbazaDr Ahmed Abdel Monem AbdallaDr Muzammil Hassan AbdelgaderDr Fardous Hanem Abdel Aal Abdel HafezProfessor Nagwa Abdel-MeguidProfessor M. Yosri Abdel-MohsenDr Ekram Abdel SalamProfessor Mohammad Abdel-SabourDr Alaa Awny Ramzy Abd-ElsayedProfessor Ahmed Ezzat AbdouProfessor Mohamed Farid Abdul-LatifDr Asmaa Ahmed AbdulsalamProfessor Mostafa Abdelfattah AbolfotouhDr Ahmed Gamal Abou El-AzayemDr Kamilia Ragab Abou ShabanaDr Hala Abou TalebDr Niveen Abu-RmeilehProfessor Ahmed Awad Abdel-Hameed AdeelProfessor Suhail AhmadDr Awad Mohamed AhmedProfessor Kamel AjlouniDr Tasleem AkhtarMs Deena Al-AsfoorDr Nabil Al-BeirutiDr Ayoub Al JawaldehProfessor Mansour M. Al-NozhaProfessor Faizeh Al-QuobailiDr Asya Ali Al-RiyamiDr Khaldoun Al-RoomiProfessor Zohair A. Al-SebaiDr Najeeb Al-ShorbajiDr A. Basel Al-YousfiProfessor Ezzat Khamis AmineDr Walid AmmarDr Michael AngastiniotisDr Nada Hassan A-RahmanProfessor George F. ArajDr Hossein Malekafzali ArdakaniDr Mohamed Ardekani AssaiDr Fazal AtherDr Hoda Atta Professor Osama Mohamed A. AwadProfessor Abla Ibraheem AyoubProfessor Fereidoun AziziDr Hanan Al-Sayed BadrProfessor Omneya Mostafa Badr-El-DinDr Kunal BagchiDr Mohamed BaldoDr Faraj BarahDr Hyam BashourDr Anwar BatiehaDr Saleh BawazirProfessor Myron BelferDr Faten Ben Abdel AzizProfessor Abdulbari BenerDr Jill BensonProfessor Sanaa Sabet BotrosProfessor Laila Maurice BoulosDr Maria Carmen CasanovasProfessor Monique Maurice ChaayaDr Irtaza Ahmad ChaudhriDr Paata ChikvaidzeDr Kian Fan ChungProfessor Maria Lucia Zaidan Dagli
Professor Fazal Karim DarProfesor Khaldoun DarwichProfessor Adekunle H. DawoduDr Jocelyn DejongProfessor Laila S. Abdel Hameed DorghamDr Bassel H. DoughanProfessor Nabil DowidarDr Abdi Hassan DualehProfessor Valsamma EapenProfessor Mohsen Saleh El-AlfyDr Samir El-AnsariProfessor Omar El Farouk El-AzzouniProfessor Mohamed H. Abdel Falah El BanoubyProfessor Hussein El-CharkawiDr Ahmed El-GanainyProfessor Abdul Salam El-GatitProfessor Zenab El-GothamyProfessor Mohamed El-KaliobyDr Eman El-LabanyProfessor Mervat El-RafieProfessor Farouk Mohamed El-SabbanProfessor Ahmed El-SadrProfessor Gamal Hosni El-SamraProfessor Ihab Hafez El-SawyProfessor Mahmoud Mohammed El-SibaeiProfessor Salah Nagiub El-TallawyDr Mohamed ElmiDr Sarah Beatrice EnglandProfessor Alaa Mohamed FadelDr Hoda Fahmy FaragDr Mounir FaragDr Shadley FataarProfessor Mahmoud FathallaProfessor Mohsen Abdel Hameed GadallahDr Ahmed Heshmat GadoProfessor Salma Badr El-Din GalalDr Sami GeorgeProfessor Hassen GhannemProfessor Rita GiacamanDr Yassin A. Azim GinawiProfessor Gamal GordonProfessor Bulent GorenekDr Allan GottschalkMr Peter GraaffDr Margaret GriggDr Motasim HabiballahDr Farrokh HabibzadehProfessor Tahsin HadidiDr Rana HajjehDr Samia HalilehProfessor Randah R. HamadehProfessor Hossam HamdyDr Sarah Ahmed HamzaDr Jalil HaririDr Marianne HattarProfessor Marianne Hattat-PollaraDr Mohamed Kamal HelmiDr Joumana HermezProfessor Claus Christian HeuckDr Ralph HibberdDr Kathleen A. HollowayDr Syed Jaffar HussainDr Mohamed Sayed HusseinDr Seif El-Din Saleh HusseinDr Abdullatif Husseini
Eastern Mediterranean Health Journal reviewers’ panel, 20111
The Eastern Mediterranean Health Journal extends sincere thanks the following experts for their generous and invaluable assistance in the review of papers considered for publication during the year 2011.
Professor Afaf Gaber IbrahimDr Mohammed F. Abdul Mohsen IbrahimDr Nahla Khamis IbrahimProfessor Carel IjsselmuidenDr Jamshaid IqbalProfessor Khalil IsmailProfessor Mohamed IsmailProfessor Mostafa Kamel IsmailDr John JabbourDr Ibrahim Ali KabbashProfessor Samir Mohamed KabilProfessor Mahmoud Raafat KandilProfessor Fawzy Megahed KhalilMr Wasiq Mehmood KhanDr Ibrahim Fahmy KharboushDr Zahra KhatamiDr Rana Amin KhatibDr Nabil KronfolDr Wesam I. KurdiMr Anthony John LauranceDr Dermot MaherDr Osama MaherProfessor Ahmed Abdel Rahman MahfouzDr Amr MahgoubDr Mamunur Rahman MalikProfessor Ahmed MandilDr Adel Mahmoud M. MansourProfessor Mona Kamal MareiDr Jose Carlos MartinesProfessor Mohamed Naguib MassoudProfessor Ghassan MatarDr Awad MatariaDr André MégarbanéProfessor Afaf I. MeleisDr Mohammed Osama MereDr Nabila MetwalliProfessor Magda Youssef MichaelProfessor Anthony B. MillerDr Julie MilstienDr Abraham MnzavaDr Atarod ModjtabaiDr Azza Hassan MohamedDr Hosam Hasan Ali MohamedProfessor Soltani MohamedDr Ezzeddine MohsniDr Ricardo MolinaProfessor Kamel MonastiriProfessor Ali MonisProfessor Tosson Aly MorsyDr A. Taher MoustafaProfessor Abu Salim MustafaDr Amr NadimProfessor Kamal K. NaguibDr Boubker NaouriProfessor Fouad Wadie NasrDr Mona NasrallahProfessor Mohamed M. NassarMr Sidrah NausheenDr Anna NorhammaProfessor Samia Ahmed NossierDr Omar ObeidProfessor Stephen Abimbola OdusanyaDr Hiroshi OgawaProfessor Tarek Ahmed OkashaDr Ikushi Onozaki
Book 17-1.indb 80 1/3/2011 1:38:50 PM

املجلد السابع عرشاملجلة الصحية لرشق املتوسطالعدد األول
81
Dr Langoya Martin OpokaProfessor Mahmoud M. OthmanDr Salah-Eddine OttmaniProfessor Vinod PaulDr Jose PostigoProfessor David B. PriceMr Abid Quddus QaziDr Farouk QureshiDr Naseem Akhtar QureshiProfessor Azza Saleh RadwanProfessor Mervat Hassan Abdul Aziz RadyDr Ahmed Ragaa Abdel Hamid RagabProfessor Wafaa Mohammad RamadanDr Mohamed RamzyProfessor Gunturu RevathiDr Camillo RibiDr Walter RiesenDr M.B. RokniDr Belgacem SabriProfessor Ali Ahmed Ali SadekDr Nahad Sadr-AzodiDr Bijan SadrizadehDr Khalid SaeedDr Osama Eisa SalamProfessor Hosny Mohamed SalamaDr Hossein Salehi
1Arranged in alphabetical order according to the family name.
Professor Raouf Mahmoud SallamDr Haytham Ibrahim SaltiProfessor Ibrahim SaltiProfessor Nuha Nuwayri SaltiDr Dalia SamhouriMr Saqer S. Al-Salem SaqerDr Ashoor R. SarhatDr Mohamed SayedProfessor Mohamed Safwat Seif El-NasrDr Akihiro SeitaDr Salaam SemaanProfessor Gamal I. SerourDr Irshad ShaikhDr Sherine ShawkyDr Olla ShideedProfessor Ahmed A. ShorrabDr Cees Th. Smit SibingaDr Durriyah SinnoDr Younis Abed Alwahhab Mohammed SkaikDr Rima Afifi SoweidDr Adrian D. StephensDr Sabira TahseenProfessor Wagdy TalaatProfessor Nazla O TamishProfessor Maha TantawyDr Afaf Abdel Fattah Tawfik
Professor Kholoud Yehia TayelDr Salwa TayelDr Mohammed Adnane TaziDr Jean-Francois TessierDr Maria Regina TorloniDr Sayenna UdumanDr Mojtaba VaismoradiDr Martin Van den BoomDr Hassan VatandoostDr Raman VelayudhanMs Joanna VogelDr Fritz WagnerDr M. Helmy WahdanDr Marian WarsameDr Momtaz WasfyDr Kris WeerasuriyaDr Samiha Samuel Wissa DossProfessor William Graham WoodProfessor Mohamed A.H. YehiaProfessor Mustafa Z. YounisProfessor Randa YoussefDr Ghazi ZaatariProfessor Abdel Rahman ZahranMr Raki ZghondiDr Hany Ziady
Note of appreciation
The scientific integrity and standard of the information disseminated through EMHJ depends greatly on the critical judgement of our reviewers listed above. We would like to extend our sincere thanks and gratitude to them all for giving voluntarily of their time so willingly.
Book 17-1.indb 81 1/3/2011 1:38:50 PM

EMHJ • Vol. 17 No. 1 • 2011 Eastern Mediterranean Health JournalLa Revue de Santé de la Méditerranée orientale
82
1. Papers submitted for publication to the Eastern Mediterranean Health Journal (EMHJ) must not have been published, accepted for publication or currently be under consideration for publication elsewhere. The World Health Organization (WHO) Regional Office for the Eastern Mediterranean reserves all rights of reproduction and republication of material that appears in the EMHJ.
2. Papers submitted for publication to the EMHJ should conform with the Uniform Requirements for Manuscripts Submitted to Biomedical Journals (URM) of the International Committee of Medical Journal Editors (ICMJE)
3. Submission: Original papers written in Arabic, English or French may be submitted for consideration by e-mail to [email protected]. Papers can also be sent to the Editor-in-chief, Eastern Mediterranean Health Journal, WHO Regional Office for the Eastern Mediterranean, PO Box 7608, Nasr City (11371), Cairo, Egypt. Abstracts of papers accepted for publication will be translated into all three languages. To ensure the correct spelling of authors’ names to accompany the Arabic abstract, authors writing in English or French but whose mother tongue is written using Arabic characters should provide their full names in Arabic script along with transliterations in English or French
4. All papers considered for publication will be peer reviewed. The Editorial Board reserves the right to accept or reject any paper based on the reviewers’ comments, scientific rigor and suitability for the journal. Papers are accepted on the understanding that they are subject to statistical and editorial revision as deemed necessary, including abridgement of the text and omission of tabular or graphic material.
5. Topics: The subject of the paper should pertain to public health or a related biomedical or technical subject within the field of interest of the WHO, and should have particular relevance to the Eastern Mediterranean Region.
6. The title of the paper should be as concise as possible, preferably not more than 15 words. The full name(s) of the author(s), institutional affiliations(s) and highest scientific degrees obtained should be provided. Please include the e-mail address and any other contact information (mailing address, fax, telephone) of the corresponding author. The number of authors should not exceed seven. All authors should have made material contribution to the design, analysis or writing of the study and have approved the final version submitted. No change in authorship will be permitted after the paper has been accepted for publication and any change before this must be agreed by all authors listed. Authors may be asked to verify their contribution. Names of other contributors may be included in the acknowledgements. Please see the ICMJE guidelines for authorship and contributorship.
7. Research articles and Reports: Papers reporting original research findingsshould follow the IMRAD format: Introduction; Methods; Results; Analysis; and Discussion. The text of Research articles and Reports should not exceed 3000 words (excluding the accompanying abstract, references, tables and figures). An abstract of not more than 150 words should be supplied, clearly and briefly stating the objectives, context, results and conclusions. The maximum number of references permitted is 25. The number of tables and figures should not exceed one per 1000 words.
8. Review articles, i.e. critical assessments of research on topics of relevance to public health in the Region. These should contain sections dealing with objectives, sources, methods of selection, compilation and interpretation of data and conclusions. The text should not exceed 3000 words (excluding the accompanying abstract, references, tables and figures), and should be accompanied by an abstract of not more than 150 words. The number of tables and figures should not exceed one per 1000 words.
9. Case reports: Only reports of cases of an unusual nature are considered for publication. Text should include an Introduction, the Report of the case(s) and a Discussion. The text should not exceed 1500 words and the number of references kept to a minimum. No abstract is required.
10. Letters to the Editor: Letters commenting on published articles are welcome. Letters will be sent to the authors of the original article for their comments, and these
will be published along with the letter. The text of letters should be kept as short as possible.
11. Short communications: Articles which do not constitute a complete research study but are of particular relevance or importance to public health issues in the Region are occasionally considered for publication. The text should not exceed 1500 words (excluding the accompanying abstract, references, tables and figures), and should be accompanied by an abstract of not more than 150 words. The number of tables and figures should not exceed one per 1000 words.
12. Ethical considerations: Where applicable, a statement must be included indicating approval for the study was granted by the ethics committee/institutional review board of the relevant institution. Authors should verify where appropriate that all persons on whom research has been carried out have given their voluntary, informed, written consent, and where participants (living or dead) were unable to give such consent, that surrogate consent was obtained. Authors may be asked to supply such consent forms. In cases where participants cannot read and write, oral consent is acceptable.
13. Conflicts of interest: Authors must provide a statement detailing any competing interests. Please see the ICMJE guidelines.
14. Manuscripts should be provided in word processed format (preferably Microsoft Word) double-spaced, A4-size. Manuscripts submitted as hard copy should be double-spaced, A4 pages typewritten or printed on one side only.
15. References: In-text citations of published works should be limited to essential up-to-date references. These should be numbered separately as they occur in the text with sequential Arabic numerals in parentheses, e.g. [1,5-8]. These references should appear in a numbered list on a separate page after the Discussion. They should contain the following elements as appropriate: name(s) and initial(s) of author(s); title of paper or book in its original language plus translation; for research articles, complete name of journal plus volume number and page range; for books and other texts, place of publication (city and country) and name of publisher (commercial or institutional); and date of publication; for texts published exclusively on the Internet, exact URL of the page cited and date when last accessed. For texts with up to 3 authors, all authors must be named. For texts with more than 3 authors, only the first author is named followed by “et al”. The following are examples of the Journal’s preferred style: Book: Al Hamza B, Smith A. The fifth sign of identity. Cairo, American University Press, 1990. Journal article: Jones A et al. One day in Tibet. Journal of tautology, 1993, 13(5):23–7. Document: Al-Itneen M, ed. The principles of uncertainty. Geneva, World Health Organization, 1985 (WHO/DOC/537). Web text: Child growth standards. Geneva, World Health Organization, 2006 (http://www.who.int/childgrowth/en/, accessed 8 October 2008).
16. Figures and tables with appropriate captions should each be on a separate page, numbered sequentially with Arabic numerals and attached at the end of the paper. Each figure and table must be referred to in the text. Where appropriate, sources should be given. If any figures, tables or other materials have been copied from other sources, authors have the sole responsibility for securing the necessary permission. In order to avoid layout problems in final production, tables and figures should be limited as far as possible. Figures must be supplied in a format which can be edited, preferably Microsoft Excel format, and figures derived from data must be accompanied by those data, e.g. Excel data sheet, to enable redrawing if necessary. Photographs and illustrations should also be sent as separate files. The preferred format is JPG or TIFF; resolution should be minimum 300 dpi. For manuscripts submitted as hard copy, it is necessary to provide two sets of original photographs and figures along with the background data.
17. Submissions that do not comply with these Guidelines will be returned to the author for correction before being considered for publication.
Guidelines for authors
Book 17-1.indb 82 1/3/2011 1:38:51 PM
املجلد السابع عرشاملجلة الصحية لرشق املتوسطالعدد األول
83
دالئل إرشادية للمؤلفني
مة للمجلة الصحية لرشق املتوسط للنرش جيب أال يكون إن األوراق البحثية املقدَّ .1قد تم نرشها من قبل، أو تم قبول نرشها، أو أهنا قيد الدراسة بغرض النرش يف أي مكان آخر )نرجو الرجوع إىل السياسة اخلاصة بأخالقيات النرش اخلاصة بنا(.وحيتفظ املكتب مادة أي وطباعة نرش إعادة يف باحلق املتوسط لرشق العاملية الصحة ملنظمة اإلقليمي
علمية تظهر يف املجلة الصحية لرشق املتوسط.
مة للنرش يف املجلة الصحية لرشق املتوسط جيب أن تـتوافق إن األوراق البحثية املقدَّ .2مة للمجالت الطبية البيولوجية التابعة للجنة بات املوحدة للمخطوطات املقدَّ مع املتطلَّ
الدولية ملحرري املجالت الطبية.
أو اإلنكليزية أو العربية باللغة املكتوبة األصلية البحثية األوراق م تقدَّ التقديم: .3يمكن كام [email protected] اإللكرتوين الربيد طريق عن للدراسة الفرنسية باملكتب املتوسط، رشق إلقليم الصحية املجلة حترير لرئيس البحثية األوراق إرسال (11371)، القاهرة، مرص. 7608، مدينة نرص: اإلقليمي لرشق املتوسط، صندوق بريد ويتم ترمجة ملخصات األوراق البحثية التي يتم قبول نرشها إىل اللغات الثالث. ولضامن يتعنيَّ عىل فإنه العربية كتابة صحيحة، بامللخصات املرفق أسامئهم املؤلفني كتابة أسامء املؤلفني الذين تكون العربية هي لغتهم األم، ويكتبون باإلنكليزية أو الفرنسية، أن يرفقوا أو اإلنكليزية باللغة العربية احلروف كتابة إىل باإلضافة بالعربية، بالكامل أسامءهم
الفرنسية.
ختضع كل األوراق البحثية املقرتح نرشها ملراجعة الزمالء. وحيتفظ جملس التحرير .4باحلق يف قبول أو رفض أي ورقة بحثية استنادًا إىل تعليامت املراجعني، والدقة العلمية للمراجعة ختضع أهنا أساس عىل البحثية الورقة قبول ويتم للمجلة. املالءمة ومدى اإلحصائية والتحريرية إذا لزم األمر، بام يف ذلك تلخيص النص وحذف اجلداول أو مادة
الرسم البياين.
أو العمومية، بالصحة البحثية الورقة موضوع يرتبط أن يتعنيَّ املوضوعات: .5موضوع طبي بيولوجي متعلق هبا، أو موضوع تقني يرتبط بمجاالت املنظمة، وذي أمهية
خاصة إلقليم رشق املتوسط.
15 كلمة، يتعنيَّ أن يكون عنوان الورقة خمترصًا قدر اإلمكان، وحيّبذ أال يزيد عىل .6عىل أن يرسل االسم الكامل للمؤلف، واملؤسسات التي يكون عضوًا فيها، وأعىل درجة األخرى واملعلومات اإللكرتوين، الربيد عنوان إرسال نرجو لذا عليها. علمية حصل الفاكس، اهلاتف(. ويتعنيَّ أال يزيد عدد الالزمة لالتصال بالكاتب )العنوان الربيدي، املؤلفني عىل سبعة، عىل أن يسهم مجيع املؤلفني بشكل مادي يف تصميم أو حتليل أو كتابة ق بالتأليف الدراسة، واملوافقة عىل النسخة األخرية. ولن يسمح بإجراء أي تغيـري يتعلَّبعد قبول الورقة للنرش، وأي تغيـري قبل ذلك جيب أن يقّره مجيع املؤلفني املدرجني. وقد يف آخرين مسامهني أي أسامء تضمني يمكن كام مسامهتهم. تأكيد املؤلفني من يطلب الشكر والتقدير. نرجو الرجوع إىل الدالئل اإلرشادية للجنة الدولية ملحرري املجالت
الطبية فيام يتعلق بالتأليف واملسامهة.
التقارير واملقاالت البحثية: وينبغي يف األوراق التي تدون النتائج البحثية األصلية .7التقارير نص يزيد أال عىل واملناقشة، والنتائج والطرق املقدمة اخلاص: الشكل اتباع واملراجع، املرفق، امللخص ذلك يتضمن )وال كلمة 3000 عن البحثية واملقاالت واجلداول، واألشكال(. ويتعنيَّ تقديم ملخص ال يتعدى 150 كلمة ليوضح األغراض عدد أقىص أن إىل باإلضافة وواضح، خمترص بشكل واخلالصة والنتائج والسياق للمراجع جيب أال يتجاوز 25 مرجعًا، وكذلك عدد اجلداول واألشكال جيب أال يتجاوز
واحدًا لكل 1000 كلمة.
املوضوعات حول للبحوث النقدي التقيـيم بمعنى املراجعات حول مقاالت .8يتناول األغراض، ن قساًم العمومية يف اإلقليم. ويتعنيَّ أن تـتضمَّ ذات الصلة بالصحة أال ويتعنيَّ واالستنتاجات. املعطيات وتفسري والتجميع االختيار، وطرق واملصادر، واجلداول، واملراجع، املرفق، امللخص ذلك يتضمن )وال كلمة 3000 النص ى يتعدَّعدد يتجاوز وأال كلمة؛ 150 عن يزيد ال ملخص يصحبها أن وعىل واألشكال(.
اجلداول واألشكال واحدًا لكل 1000 كلمة.
تقارير احلاالت: يتم دراسة نرش التقارير اخلاصة باحلاالت ذات الطبيعة غري املعتادة .9النص يتجاوز وأال واملناقشة، احلالة، وتقرير مقدمة، النص يشمل أن ويتعنيَّ فقط.
3500 كلمة مع إيراد أقل عدد من املراجع. وال يلزم يف هذه احلالة تقديم ملخص.
املنشورة املقاالت حول واملالحظات الرسائل بتلقي ب ُيَرحَّ املحرر: إىل رسالة .10يف املجلة، وسرتسل هذه الرسائل إىل مؤلفي املقاالت األصلية، للتعليق عليها. وينرش
التعليق مصاحبًا للرسالة، عىل أن يكون نص الرسائل موجزًا قدر اإلمكان.
ولكنها مكتملة، بحثية دراسة تشكل ال التي املقاالت إن املوجزة: االتصاالت .11آلخر حني من يتم اإلقليم يف العمومية الصحة ملوضوعات خاصة أمهية ذات ذلك يتضمن )وال كلمة 1500 عن النص يزيد أال ويتعنيَّ نرشها. إمكانية دراسة عن يزيد ال ملخص يصحبها وأن واألشكال( واجلداول، واملراجع، املرفق، امللخص كلمة. 1000 لكل واحد عن واألشكال اجلداول عدد يزيد أال وجيب كلمة. 150
األخالقيات جلنة بموافقة بيان يرفق ذلك، وجب متى األخالقية: االعتبارات .12األشخاص مجيع أن إثبات املؤلفني عىل ويتعنّي املعنّية. املؤسسة يف املراجعة وجملس الذين شملهم البحث، قد وافقوا موافقة واعية كتابية وطوعية، وإذا مل يتمكن املشاركون )أحياءًا كانوا أم أمواتًا( من إعطاء هذه املوافقة، يتم احلصول عىل موافقة أوليائهم. وقد يطلب من املؤلفني تقديم نامذج املوافقة هذه، وحتى يف حالة عدم إملام املشاركني بالقراءة
والكتابة، فقد تقبل املوافقة الشفهية.
املصالح يف تضارب أي يوضح بيانًا املؤلفون يقّدم أن ينبغي املصالح: تضارب .13املجالت ملحرري الدولية للجنة اإلرشادية الدالئل إىل الرجوع يرجى بالتفصيل.
الطبية.
تقديم املخطوطات يف شكل إلكرتوين )حيّبذ استخدام برنامج مايكروسوفت وورد( .14مع ترك مسافتني بني السطور. وأن يكون مقاس الورقة A4. أما بالنسبة للمخطوطات م يف شكل ورقي فيجب أيضًا ترك مسافتني بني السطور، وأن يكون حجم الورقة التي تقدَّ
A4 عىل أن تـتم الطباعة عىل وجه واحد من الصفحات.
املراجع ينبغي أن يقترص االستشهاد من نصوص أي أعامل منشورة عىل املراجع: .15يليها إعداد عربية احلديثة األساسية. ويلزم ترقيم املراجع، كلام ظهرت يف النص، وأن يف مرقمة، قائمة يف املراجع هذه تدوين ينبغي كام .[5-8 ،1] مثل: مربعة أقواس بني صفحة منفصلة، يف هناية الورقة، وأن تـتضّمن املعلومات التالية إن أمكن: اسم املؤلف، أو أسامء املؤلفني، واألحرف األوىل من أسامئهم، وعنوان الورقة البحثية أو الكتاب يف اللغة األصلية، إضافة إىل ترمجتها؛ وبالنسبة للمقاالت البحثية، يتم ذكر االسم الكامل للمجلة باإلضافة إىل رقم املجلد، وعدد الصفحات؛ وبالنسبة للكتب وسائر النصوص، يتم ذكر مكان النرش )البلد واملدينة( واسم النارش )التجاري أو املؤسسة( وتاريخ النرش؛ وبالنسبة للنصوص التي تنرش حرصًا عىل اإلنرتنت، يتم ذكر العنوان اإللكرتوين للرابط (URL) اخلاص بالصفحة املستشهد هبا وتاريخ آخر وصول هلا. بالنسبة للنصوص التي يشرتك فيها أكثر من ثالثة مؤلفني، يذكر اسم املؤلف األول فقط يتبعه كلمة "وزمالئه". يتبع: أن املتوسط لرشق الصحية املجلة تفضل الذي لألسلوب أمثلة ييل ما ويف
Book: Al Hamza B, Smith A. The fifth sign of identity. Cairo, American University Press, 1990. Journal article: Jones A et al. One day in Tibet. Journal of tautology, 1993, 13(5): 23-7 Document: Al-Itneen M, ed. The principles of uncertainty. Geneva, World Health Organization, 1985 (WHO/DOC/537) Web text: Child growth standards. Geneva, World Health Organization, 2006 (http://www.who.int/childgrowth/en/, accessed 8 October 2008)
أن ينبغي فإنه املالئمة، بالرشوح املشفوعة واجلداول، بالرسومات يتعّلق ما ويف .16ترد كل منها يف صفحة منفصلة، ومرقمة عىل التوايل باألعداد العربية، وملحقة يف هناية الورقة. كام ينبغي اإلشارة إىل كل رسم وكل جدول يشار إليه يف النص، وحّبذا لو أمكن حتديد مصدر كل رسم وكل جدول. ويف حالة نقل أي رسومات أو جداول من مواد أخرى، فإنه تقع عىل عاتق املؤلف أو املؤلفني املسؤولية الكاملة عن احلصول عىل األذون الالزمة. وُبْغَية جتنب أي مشكالت يف طريقة تنسيق املنتج النهائي، فإنه يتعنيَّ االقتصار الذي بالشكل األشكال تقديم وينبغي والرسومات. اجلداول إدراج يف اإلمكان قدر إىل املستندة لألشكال وبالنسبة إكسيل. ميكروسوفت برنامج وحيّبذ بتنقيحها، يسمح املثال سبيل عىل إكسيل بيانات قوائم مثل البيانات، هذه هبا ترفق أن فيجب بيانات، لتيسري عملية إعادة الرسم إذا لزم األمر. أما بالنسبة للصور واإليضاحات فينبغي إرساهلا عن300 الصورة وضوح يقل وأال TIFF أو JPG صورة يف وحيّبذ منفصلة، كملفات فينبغي إرفاق جمموعتني من الصور مة بشكل ورقي، املقدَّ بالنسبة للمخطوطات .dpi
واألشكال األصلية مع املعطيات األساسية.
املؤلف إىل اإلرشادية الدالئل هبذه تلتزم ال والتي املقّدمة األوراق إعادة سيتم .17للتصويب قبل دراسة نرشها.
Book 17-1.indb 83 1/3/2011 1:38:51 PM

EMHJ • Vol. 17 No. 1 • 2011 Eastern Mediterranean Health JournalLa Revue de Santé de la Méditerranée orientale
84
Directives à l’intention des auteurs
1. Les articles soumis pour publication à La Revue de Santé de la Méditerranée orientale ne doivent pas avoir été publiés, être en cours d’examen par d’autres revues, ou avoir été acceptés pour publication dans d’autres revues (veuillez vous reporter à notre Politique en matière d’éthique). Le Bureau régional de l’Organisation mondiale de la Santé (OMS) pour la Méditerranée orientale se réserve tous les droits de reproduction et de republication des matériels qui paraissent dans La Revue de Santé de la Méditerranée orientale.
2. Les articles soumis pour publication à La Revue de Santé de la Méditerranée orientale doivent être conformes aux Uniform Requirements for Manuscripts Submitted to Biomedical Journals [Exigences uniformes appliquées aux manuscrits soumis aux revues médicales, URM] de l’International Committee of Medical Journal Editors (Comité international des éditeurs de revues médicales, ICMJE).
3. Soumission : Les articles originaux rédigés en anglais, arabe ou en français peuvent être soumis pour examen par courrier électronique à l’adresse suivante : [email protected]. Les articles peuvent aussi être envoyés au Rédacteur en chef, La Revue de Santé de la Méditerranée orientale, Bureau régional de l’OMS pour la Méditerranée orientale, BP 7608, Cité Nasr (11371), Le Caire (Égypte). Les résumés des articles acceptés pour publication seront traduits dans les trois langues. Pour assurer que les noms des auteurs soient correctement écrits dans les résumés en arabe, les auteurs rédigeant en anglais ou en français mais dont la langue maternelle s'écrit en caractères arabes doivent fournir leur nom complet en écriture arabe et une translittération de leur nom en anglais ou en français.
4. Tous les articles dont la publication est envisagée seront revus par des pairs. Le Comité de rédaction se réserve le droit d’accepter ou de refuser tout article, sur la base des commentaires des réviseurs, de la rigueur scientifique et de la pertinence de l’article pour la Revue. Les articles sont acceptés sous réserve de la révision statistique et rédactionnelle dont ils feront l’objet, comme jugé nécessaire, ce qui peut amener à abréger le texte et à supprimer certaines données présentées sous forme de tableaux ou de graphiques.
5. Sujets : Le sujet de l’article doit concerner la santé publique ou un autre sujet biomédical ou technique connexe faisant partie du champ d’intérêt de l’OMS, et se rapporter plus particulièrement à la Région de la Méditerranée orientale.
6. Le titre de l’article doit être aussi concis que possible, et de préférence ne pas dépasser 15 mots. Le(s) nom(s) complet(s) du ou des auteur(s), leur(s) affiliation(s) institutionnelle(s) et l’intitulé de leur plus haut diplôme scientifique doivent être indiqués. Une adresse électronique et toute autre information permettant de contacter le ou les auteurs(s) (adresse postale, numéro de télécopie, numéro de téléphone) devront aussi être mentionnées. Le nombre des auteurs ne devrait pas être supérieur à sept. Tous les auteurs devraient avoir apporté une contribution importante à la conception, à l'analyse ou à la rédaction de l'étude et avoir approuvé la version finale soumise. Aucun changement dans les noms des auteurs ne sera autorisé après l’acceptation de l’article pour publication ; avant cette acceptation, tout changement doit être accepté par l’ensemble des auteurs figurant dans la liste. Une vérification de leur contribution peut être demandée aux auteurs. Les noms d’autres contributeurs peuvent être inclus dans les remerciements. À ce sujet, veuillez vous reporter aux ICMJE guidelines for authorship and contributorship [Directives de l’ICMJE relatives à la qualité d’auteur et de contributeur].
7. Articles et rapports de recherche : Les articles présentant des résultats de recherche originale devront suivre le format IMRAD : introduction, méthodes, résultats, analyse et discussion. Le texte des articles et des rapports de recherche ne doit pas excéder 3000 mots (résumé, références, tableaux et figures exclus) Un résumé de 150 mots maximum sera fourni et mentionnera clairement et brièvement les objectifs, le contexte, les résultats et les conclusions. Le nombre maximal de références autorisées est de 25. Il ne faut pas inclure plus d’un tableau ou d’une figure tous les 1000 mots.
8. Articles d’analyse (évaluations critiques d'études de recherche sur des sujets pertinents concernant la santé publique dans la Région). Ils doivent être composés de paragraphes traitant des objectifs, des sources, des méthodes de sélection, de la compilation et de l’interprétation des données et des conclusions. Le texte ne doit pas excéder 3000 mots (résumé, références, tableaux et figures exclus) et doit être accompagné d’un résumé de 150 mots au maximum. Il ne faut pas inclure plus d’un tableau ou figure tous les 1000 mots. 9. Études de cas : Seules les études de cas inhabituels seront examinées pour publication. Le texte doit comprendre une introduction, un exposé du/des cas et une discussion. Il ne doit pas excéder 3500 mots et le nombre de références doit être minimal. Il n’est pas nécessaire de fournir un résumé.
10. Lettres à la rédaction : Les lettres commentant des articles publiés sont les bienvenues. Elles seront envoyées aux auteurs de l’article afin qu'ils fournissent leurs
commentaires, qui seront publiés aux côtés de la lettre. Le texte des lettres doit être aussi court que possible.
11. Communications brèves : Les articles ne constituant pas une étude de recherche complète, mais présentant un intérêt ou revêtant une importance particulière pour les questions de santé publique dans la Région sont occasionnellement examinés pour publication. Le texte ne doit pas excéder 1500 mots (résumé, références, tableaux et figures exclus) et doit être accompagné d’un résumé de 150 mots au maximum. Il ne faut pas inclure plus d’un tableau ou d’une figure tous les 1000 mots.
12. Considérations éthiques : Le cas échéant, une déclaration devra être incluse, indiquant que le Comité d’éthique ou le Comité d’examen institutionnel de l’organisme concerné a donné son accord à l’étude. Les auteurs doivent vérifier, le cas échéant, que toutes les personnes sur lesquelles la recherche porte ont donné leur consentement volontaire et informé par écrit et que si certains participants (en vie ou décédés) n’ont pas pu le donner, un consentement de substitution a été obtenu. Il peut être demandé aux auteurs de fournir ce type de formulaire de consentement. Lorsque les participants ne savent ni lire ni écrire, un consentement oral est acceptable.
13. Conflits d’intérêts : Les auteurs doivent fournir une déclaration détaillant tout conflit d'intérêts. Veuillez vous reporter aux directives de l'ICMJE (ICMJE guidelines).
14. Les manuscrits doivent être fournis en format traitement de texte (Microsoft Word, de préférence), A4 avec double interlignage. Les manuscrits soumis en version papier doivent être dactylographiés ou imprimés sur le recto seulement, sur des feuilles A4 avec double interlignage.
15. Références : Les citations dans le texte de travaux publiés doivent être limitées aux références essentielles récentes. Elles doivent être numérotées séparément à l’aide de chiffres arabes indiqués entre crochets, par exemple [1,5-8], selon l’ordre dans lequel elles apparaissent dans le texte. Les références doivent figurer sous forme de liste numérotée sur une page séparée après la partie « Discussion ». Elles doivent contenir les éléments suivants, selon le cas : nom(s) et initiales du ou des auteurs ; titre de l’article ou de l’ouvrage dans sa langue originale ainsi que sa traduction ; pour les articles de recherche, le nom complet de la revue ainsi que le numéro du volume et les pages concernées ; pour les ouvrages et autres textes, le lieu de publication (ville et pays) et le nom de la maison d’édition (commerciale ou institutionnelle) ; la date de publication ; pour les textes publiées exclusivement sur Internet, l'URL exact de la page citée et la date du dernier accès. Lorsque les textes comptent moins de trois auteurs, tous les auteurs doivent être nommés. Lorsque les textes comptent plus de trois auteurs, seul le nom du premier auteur est mentionné, suivi de « et al. ». Exemples du style préféré de La Revue : Livre : Al Hamza B, Smith A. The fifth sign of identity. Cairo, American University Press, 1990. Article de Revue : Jones A et al. One day in Tibet. Journal of tautology, 1993, 13(5): 23–7. Document : Al-Itneen M, ed. The principles of uncertainty. Geneva, World Health Organization, 1985 (WHO/DOC/537). Texte Web : Child growth standards. Geneva, World Health Organization, 2006 (http: //www. who. int/childgrowth/en/, accessed 8 October 2008).
16. Les figures et les tableaux accompagnés des légendes appropriées doivent être placés chacun sur une feuille séparée, numérotés en chiffres arabes selon leur ordre et joints à la fin de l’article. Chaque figure et chaque tableau doit être référencé(e) s dans le texte, et le cas échéant, les sources doivent être indiquées. Si des figures, tableaux ou d’autres matériels ont été copiés d’autres sources, les auteurs portent l’entière responsabilité d’obtenir les autorisations nécessaires. Afin d’éviter les problèmes de mise en page lors de la production finale, le nombre de tableaux et de figures doit être aussi limité que possible. Les figures doivent être fournies dans un format permettant les modifications, de préférence Microsoft Excel, et celles qui sont établies à partir de données doivent être accompagnées de ces données, sur une fiche technique Excel par exemple, pour permettre une recomposition, le cas échéant. Les photographies et illustrations doivent être envoyées dans des fichiers séparés. Les formats préférés sont JPG et TIFF, et la résolution des images doit être de 300 dpi au minimum. Si les manuscrits sont soumis en version papier, deux jeux de photographies et de figures originales accompagnées des données de base doivent être fournis.
17. Les manuscrits ne respectant pas ces directives seront renvoyés à leur auteur pour correction avant d’être examinés en vue de la publication.
Book 17-1.indb 84 1/3/2011 1:38:51 PM

البلدان أعضاء اللجنة اإلقليمية ملنظمة الصحة العاملية لرشق املتوسط
األردن . أفغانستان . اإلمارات العربية املتحدة . باكستان . البحرين . تونس . اجلامهريية العربية الليبية . مجهورية إيران اإلسالمية اجلمهورية العربية السورية . اجلمهورية اليمنية . جيبويت . السودان . الصومال . العراق . ُعامن . فلسطني . قطر . الكويت . لبنان . مرص
املغرب . اململكة العربية السعودية
Subscriptions and Distribution Enquiries regarding subscriptions and distribution of the print edition of EMHJ should
be addressed to: Printing and Marketing of Publications at: email: [email protected]; tel: (+202) 2276 5000; fax: (+202) 2670 2492 or 2670 2494
Permissions Requests for permission to reproduce or translate articles, whether for sale or
non-commercial distribution should be addressed to EMHJ at: [email protected]
Members of the WHO Regional Committee for the Eastern Mediterranean
Afghanistan . Bahrain . Djibouti . Egypt . Islamic Republic of Iran . Iraq . Jordan . Kuwait . Lebanon Libyan Arab Jamahiriya . Morocco . Oman . Pakistan . Palestine . Qatar . Saudi Arabia . Somalia
Sudan . Syrian Arab Republic . Tunisia . United Arab Emirates . Republic of Yemen
Membres du Comité régional de l’OMS pour la Méditerranée orientale
Afghanistan . Arabie saoudite . Bahreïn . Djibouti . Égypte . Émirats arabes unis . République islamique d’Iran Iraq . Jamahiriya arabe libyenne . Jordanie . Koweït . Liban . Maroc . Oman . Pakistan . Palestine . Qatar
République arabe syrienne . Somalie . Soudan . Tunisie . République du Yémen
Correspondence
Editor-in-chiefEMHJ
WHO Regional Office for the Eastern MediterraneanP.O. Box 7608
Nasr City, Cairo 11371 Egypt
Tel: (+202) 2276 5000 Fax: (+202) 2670 2492/(+202) 2670 2494
Email: [email protected]/[email protected]
EASTERN MEDITERRANEAN HEALTH JOURNALIS the official health journal published by the Eastern Mediterranean Regional Office of the World Health Organization. It is a forum for the presentation and promotion of new policies and initiatives in health services; and for the exchange of ideas, con‑cepts, epidemiological data, research findings and other information, with special reference to the Eastern Mediterranean Region. It addresses all members of the health profession, medical and other health educational institutes, interested NGOs, WHO Col‑laborating Centres and individuals within and outside the Region.
LA REVUE DE SANTÉ DE LA MÉDITERRANÉE ORIENTALEEST une revue de santé officielle publiée par le Bureau régional de l’Organisation mondiale de la Santé pour la Méditerranée orientale. Elle offre une tribune pour la présentation et la promotion de nouvelles politiques et initiatives dans le domaine des ser‑vices de santé ainsi qu’à l’échange d’idées, de concepts, de données épidémiologiques, de résultats de recherches et d’autres informations, se rapportant plus particulièrement à la Région de la Méditerranée orientale. Elle s’adresse à tous les professionnels de la santé, aux membres des instituts médicaux et autres instituts de formation médico‑sanitaire, aux ONG, Centres collabora‑teurs de l’OMS et personnes concernés au sein et hors de la Région.
EMHJ is a trilingual, peer reviewed, open access journal and the full contents are freely available at its website: http://www/emro.who.int/emhj.htm
EMHJ is abstracted/indexed in the Index Medicus and MEDLINE (Medical Literature Analysis and Retrieval Systems on Line) and the ExtraMed‑Full text on CD‑ROM, the Cumulative Index to Nursing and Allied Health Literature (CINAHL), CAB International, Lexis Nexis, Scopus and the Index Medicus for the WHO Eastern Mediterranean Region (IMEMR).
©World Health Organization 2011 All rights reserved
Disclaimer The designations employed and the presentation of the material in this publication do not imply the expression of any opinion whatsoever on the part of the World Health Organization concerning the legal status of any country, territory, city or area or of its authorities, or concerning the delimitation of its frontiers or boundaries. Dotted lines on maps represent approximate border lines for which there may not yet be full agreement. The mention of specific companies or of certain manufacturers’ products does not imply that they are endorsed or recommended by the World Health Organization in preference to others of a similar nature that are not mentioned. All reasonable precautions have been taken by the World Health Organization to verify the information contained in this publication. However, the published material is being distributed without warranty of any kind, either express or implied. The responsibility for the interpretation and use of the material lies with the reader. In no event shall the World Health Organization be liable for damages arising from its use. The named authors alone are responsible for the views expressed in this publication.
ISSN 1020‑3397
Cover designed by Diana Tawadros Internal layout designed by Emad Marji and Diana Tawadros
Printed by WHO Regional Office for the Eastern Mediterranean
هى املجلة الرسمية التى تصدر عن املكتب اإلقليمى لرشق املتوسط بمنظمة الصحة العاملية. وهى منرب لتقديم الوبائية واملعطيات واملفاهيم اآلراء ولتبادل هلا، والرتويج الصحية اخلدمات اجلديدة ىف واملبادرات السياسات املتوسط. وهى موجهة إىل كل بإقليم رشق يتعلق منها ما املعلومات، وخاصة ونتائج األبحاث وغري ذلك من واملراكز املعنية، احلكومية املنظامت غري التعليمية، وكذا املعاهد الطبية وسائر والكليات الصحية، املهن أعضاء
املتعاونة مع منظمة الصحة العاملية واألفراد املهتمني بالصحة ىف اإلقليم وخارجه.
املجلة الصحية لرشق املتوسط
Cover 17-8.indd 2 8/8/2011 10:11:18 AM