Les fortifications modernes d'Antibes : données archéologiques récentes
Upload
univ-paris-diderotCategory
view
2download
0
MAY.2013

fast fashion
THE COMPANIES
H&M [Hennes & Mauritz] [Europe]In Few Words…
Business Model
Time Line1947 First store in Västerås, Sweden. Named "Hennes".
1974 Listed on the Stockholm Stock Exchange.1976 First store outside Scandinavia opens in London.1977 Sales of cosmetics begin.
1990-‐2000 Expansion continues in Europe and US.2004 Initiates designer and celebrities collaborations.
2006-‐2012 Worldwide expansion, including China and Mexico.
American Apparel [AMERICAN APPAREL] [America]In Few Words…
Business Model
UNIQLO [FAST RETAILING] [Asia]In Few Words…
Business Model
Fast Fashion started as a contemporary term used in the fashion industry to acknowledge the designs that move from designer's workshop to the actual ultimate customers in the fastest time as possible. Eventually, it became in a whole enterpreneur tendency which stands for the creation and evolution of companies in the pursuit of faster design, display and sales: The Fast Fashion Companies are the result of a well-‐studied strategy that suits the needs and tastes of the mordern costumer.
It is said that the era of serial production stood for the standarization of goods; later on, gobalization started to stand for the quality, and adjustments of goods to suit the actual market. Nowadays, there is a need to merge these both concepts; the result of it is a new business concept which envolves desirable products, fast production and fast replacement at affordable prices. In the fashion world, it is all known as Fast Fashion.
The Fast Fashion tendency has become a global pursuit. From Europe to America, and lastly Asia, this business style has perfectly suit the "white collars" and trendy youth market.
According to Forbes, the Fast Fashion industry has had an astonishing growth which has been reflected in the interest of multiple businessman to compete in this promising area. But not all the companies seem to have achieved the expected success in their countries. In this document, an analysis on three Fast Fashion companies is presented. These have been selected on the basis of their origin, as well as their size and representativeness in their continent [Europe, America and Asia]:
H&M is a Swedish retail-‐clothing company which is globally known for it's Fast Fashion clothing since it's introduction to the multinational business. Nowadays, it exists in 43 countries and has reached the number of 2,629 stores by the year of 2012 with an amizing growth rate and a exposed interest to expand it's services.
As Fast Fashion company, H&M is a company that distingusih itself because of their meticulous control on it's production (merchandise planning and product especifications), which is outsourced to approximatelly 800 factories over europe and Asia. In adition, H&M has occupied itself to conquer it's costumers needs by lauching special collections based on the collaborations of designers and celebrities all over the world.
Buys the Mauritz Widforss store and starts the sale of men's and children's clothoing. Renamed Hennes & Mauritz.
1968
American Apparel is a clothing manufacturer and retailer from the United States that was founded in 1989. Its modest beginning happen to change when after a succes as a wholesale brand, the company moved into the retail market; being listed as one of the 500 fastest groeing companies in US.
American Apparel distinguish itself because of its fascination with american culture and its determination to sell Made-‐in-‐USA products without exception. It performs its own design, advertising and marketing. It's public image has been a way detached from usual fashion stereotypes and has encountered many criticises due to their strongly-‐domestic image that is sometimes found tasteless.
UNIQLO is a fashion and clothing company originated in 1984 in Tokyo with one of the most important growth rates in Japan. It is owned by Fast Retailing, a company stablished in Hiroshima. It is encouraged to make clothes that trascend all categories and social groups; which has allowed them to be present in 11 countries with an steady growth.
UNIQLO has distinguished itself because of it's continuous pursuit to offer high-‐quality clothing at reasonable prices by means of an strict control of sale trends that allows them to quickly make adjustments to production. Its "MADE FOR ALL" concept allows UNIQLO to surpass the simple pursuit of fashion trends.

THE ANALYSISH&M [Hennes & Mauritz] [Europe]
Thousands € EUR Percentage % Thousands € EUR Percentage % Thousands € EUR Percentage %Net sales 108,483 100% 109,999 100% 120,799 100%Cost of sales 40,214 37% 43,852 40% 48,928 41%Gross profit 68,269 63% 66,147 60% 71,871 59%Operating expenses 43,610 40% 45,768 42% 50,117 41%Operating Income (Loss) 24,659 23% 20,379 19% 21,754 18%Interest Income 356 0.3% 568 0.5% 536 0.4%Interest Expense 7 0.006% 5 0.005% 5 0.004%Income (Loss) before Taxes 25,008 23% 20,942 19% 22,285 18%Income Tax 6,327 6% 5,121 5% 5,418 4%NET INCOME (LOSS) 18,681 17% 15,821 14% 16,867 14%Basic EPS (in USD) 11.29 14.81 9.56 12.54 13.37Diluted EPS (in USD) 11.29 14.81 9.56 12.54 13.37
Thousands € EUR Percentage % Thousands € EUR Percentage % Thousands € EUR Percentage %Cash 0% 0% 0%Short-‐Term Investments 8,167 14% 6,958 12% 2,995 5%Liquid Funds 16,691 28% 14,319 24% 14,148 24%Accounts Receivable 2,258 4% 2,337 4% 2,207 4%Liquid Assets 27,116 46% 23,614 39% 19,350 32%Prepaid Expenses 876 1% 1,110 2% 1,136 2%Other Receivables 1,453 2% 1,375 2% 1,056 2%Inventory 11,487 19% 13,819 23% 15,213 25%Tax Receivables 0% 0% 477 1%Current Assets 40,932 69% 39,918 66% 37,232 62%PP&E 15,469 26% 17,393 29% 19,131 32%Intangibles 1,198 2% 1,035 2% 1,558 3%Deferred Income Taxes 1,065 2% 1,234 2% 1,624 3%Long-‐Term Receivables 518 1% 608 1% 628 1%Non-‐Current Assets 18,250 31% 20,270 34% 22,941 38%TOTAL ASSETS 59,182 100% 60,188 100% 60,173 100%
Accounts payable 3,965 7% 4,307 7% 4,234 7%Tax liabilities 2,304 4% 1,851 3% 0 0%Other liabilities 2,202 4% 2,428 4% 2,765 5%Accrued expenses and other current liabilities 5,376 9% 6,171 10% 7,011 12%Current Liabilities 13,847 23% 14,757 25% 14,010 23%Provisions for Pensions 257 0% 377 1% 377 0.6%Deferred Tax Liability 906 2% 950 2% 1,951 3%Non-‐Current Liabilities 1,163 2% 1,327 2% 2,328 4%TOTAL LIABILITIES 15,010 25% 16,084 27% 16,338 27.2%Share capital 207 0.3% 207 0.3% 207 0.3%Reserves -‐369 -‐1% -‐487 -‐1% -‐1,900 -‐3%Retained earnings 25,653 43% 28,563 47% 28,661 48%Profit for the year 18,681 32% 15,821 26% 16,867 28%TOTAL STOCKHOLDERS’ EQUITY 44,172 75% 44,104 73% 43,535 72%TOTAL LIABILITIES AND STOCKHOLDERS’ EQUITY 59,182 100% 60,188 100% 60,173 100%
Top Bottom Vertical Key Indicators
1 2 3 Horizontal Key Indicators
Vertical & Horizontal Analysis
CONSOLIDATED INCOME STATEMENT2010 2011 2012
CONSOLIDATED BALANCE SHEET2010 2011 2012

H&M [Hennes & Mauritz] [Europe]
Top Composition
Bottom Composition
Top Composition ASSETS
Top Composition LIABILITIES + EQUITY
Bottom Composition ASSETS
Bottom Composition LIABILITIES + EQUITY
2010 2011 2012Gross profit 63% 60% 59%Operating Income (Loss) 23% 19% 18%Income (Loss) before Taxes 23% 19% 18%NET INCOME (LOSS) 17% 14% 14%
2010 2011 2012Liquid Assets 46% 39% 32%Current Assets 69% 66% 62%Non-‐Current Assets 31% 34% 38%
Current Liabilities 23% 25% 23%Non-‐Current Liabilities 2% 2% 4%TOTAL LIABILITIES 25% 27% 27.2%TOTAL STOCKHOLDERS’ EQUITY 75% 73% 72%
Comments on Vertical & Horizontal Analysis
The company shows pretty constant values on its Liabilities and Equity. The doubled increase in long term liabilities, normally reflects the investment lastly done on Non-‐Current Assets
Progress ASSETS
Although H&M has slightly reduced it's interest expense, it has also reduced their relative Gross Profit and Net Income in almost 4%, which indicates that one of the lastly presented minor problems in the company is the lack of improvement of costs
and operating expenses.
Partial Conclusions
H&M has mantained a wealthy composition of it's Financial Statements with a great. The composition of Assets vs. Liabilities+Equity projects a reasoned strategy from the company. Only in the last year, when a continuous increase in the Fixed Assets was chased, the Non-‐Current assets were higher than the Liquid Assets. Concurrently, the Non-‐Current Liabilities that were doubled-‐increased, only slightly affected the proportion of Total Liabilities. Furthermore, H&M's results continue with acceptable indicators although in the last 3 years it has suffered from a reduction on it's proportional Net Income; which can be
restored with a better management of cost of goods and operation expenses.
Non-‐Current Liabilities
CONSOLIDATED INCOME STATEMENT
There have been a slight reduction in all of the non-‐net profits, which has caused a 3% reduction in the Net Income over the last 2 years. The expenses the company need to improve are
both in cost of goods and operations.
CONSOLIDATED BALANCE SHEET
The company has lastly implemented a balanced chase on more Non-‐Current assets.
2012
Gross Profit: The most of the sales are reflected on its Gross Profit, which is a first demonstration of the companie's financial harmony.
Interest Expense: Interest does not seem to be a problem in the company.
Progress
CONSOLIDATED BALANCE SHEET2010 2011 2012
Horizontal Analysis
Retained Earnings, Total Equity
Liquid AssetsNon-‐Current Assets
Current Assets [Liquid Assets]: As expected in Fast Fashion, Liquid Assets compose the most of Assets. However, it's important to stand out the amount of Non-‐Current
Assets, that closely follows the Current ones.
Non-‐Current Assets: Due to an important investment in PP&E and the eventual
increase in Intangibles.
For 2010 and 2011, H&M kept it's Assets slightly focused on it's Liquid ones, later in 2012, the composition changed due to an important reduction of short-‐term
investments in the benefit of its Non-‐Current Assets.
Progress LIABILITIES + EQUITY
The composition of Liabilities and Equity keeps without variation throughout the 3 years, showing a healthy financing with only one normal increase of non-‐current
liabilities at the time the company invested more on its infrastructure.
Vertical AnalysisCONSOLIDATED INCOME STATEMENT
2010 2011

THE ANALYSISAmerican Apparel [American Apparel] [America]
Millions $USD Percentage % Millions $USD Percentage % Millions $USD Percentage %Net sales 532.99 100% 547.34 100% 617.31 100%Cost of sales 253.08 47% 252.44 46% 289.93 47%Gross profit 279.91 53% 294.90 54% 327.38 53%Operating expenses 329.96 62% 318.19 58% 326.42 53%Operating Income (Loss) -‐50.05 -‐9% -‐23.29 -‐4% 0.96 0.2%Interest Expense 23.75 4% 33.17 6% 41.56 7%Foreign Currency Transaction Loss/Gain -‐0.69 -‐.1% 1.68 0.3% 0.12 0%Unrealized loss (gain) 0.99 0.2% -‐23.47 -‐4% 4.13 1%Gain/Loss on extinguishment of debt 3.11 1% -‐11.59 -‐2%Other Expense/Income 0.20 0%Income (Loss) before Taxes -‐74.15 -‐14% -‐37.59 -‐7% -‐33.46 -‐5%Income Tax 12.16 2% 1.72 0.3% 3.81 1%NET INCOME (LOSS) -‐87.40 -‐16% -‐39.50 -‐7% -‐36.64 -‐6%Basic EPS (in USD) -‐1.21 -‐0.42 -‐0.35 Diluted EPS (in USD) -‐1.21 -‐0.42 -‐0.35
Millions $USD Percentage % Millions $USD Percentage % Millions $USD Percentage %Cash 7.66 2% 10.29 3% 12.85 4%Allowances 2.63 1% 2.20 1% 2.09 1%Accounts Receivable 16.69 5% 20.94 6% 22.96 7%Liquid Assets 26.98 8% 33.43 10% 37.90 12%Prepaid Expenses and other Current Assets 9.40 3% 7.63 2% 9.59 3%Inventories 178.05 54% 185.76 57% 174.23 53%Restricted Cash 0.0% 0.0% 3.73 1%Taxes Receivable and Prepaid Income Taxes 4.11 1% 5.96 2% 0.53 0.2%Deferred Income Taxes 0.63 0.2% 0.15 0.0% 0.49 0.1%Current Assets 216.54 66% 230.73 71% 224.39 68%PP&E 85.40 26% 67.44 21% 67.78 21%Deferred Income Taxes 1.70 1% 1.53 0.5% 1.26 0.4%Other Assets 24.32 7% 25.02 8% 34.78 11%Non-‐Current Assets 111.42 34% 93.99 29% 103.82 32%TOTAL ASSETS 327.95 100% 324.72 100% 328.21 100%
Bank Overdrafts 3.33 1% 1.92 1% 0.00 0.0%Revolving credit facilities. Current LT debt 138.48 42% 50.38 16% 60.56 18%Accounts payable 31.53 10% 33.92 10% 38.16 12%Accrued expenses and other current liabilities 39.03 12% 43.73 13% 41.52 13%Fair value of warrant liability 0.99 0.3% 9.63 3% 17.24 5%Income taxes payable 0.23 0.1% 2.45 1% 2.14 1%Deferred income tax liability, current 0.0% 0.15 0.0% 0.30 0.1%Current portion of capital lease obligations 0.56 0.2% 1.18 0.4% 1.70 1%Current Liabilities 214.15 65% 143.35 44% 161.61 49%Long-‐Term Debt 0.44 0.1% 97.14 30% 110.01 34%Capital Lease Obligations, Current Portion 0.54 0.2% 1.73 1% 2.84 1%Deferred Tax Liability 0.26 0.1% 0.10 0.0% 0.26 0.1%Deferred Rent, Current Portion 24.92 8% 22.23 7% 20.71 6%Other Long-‐Term Liabilities 7.99 2% 12.05 4% 10.70 3%Subordinated Notes Payable to Related Party 4.61 1% 0.0% 0.0%Non-‐Current Liabilities 38.76 12% 133.25 41.04% 144.52 44.03%TOTAL LIABILITIES 252.93 77% 276.59 85% 306.13 93%Preferred Stock 0.0% 0.0% 0.00 0.0%Common stock 0.01 0.0% 0.01 0.0% 0.01 0.0%Additional Paid-‐in Capital 153.88 47% 166.49 51% 177.08 54%Accumulated Other Comprehensive Loss -‐3.17 -‐1% -‐3.36 -‐1% -‐2.73 -‐1%Accumulated Deficit -‐73.54 -‐22% -‐112.85 -‐35% -‐150.13 -‐46%Treasury stock, 304 Shares at Cost -‐2.16 -‐1% -‐2.16 -‐1% -‐2.16 -‐1%TOTAL STOCKHOLDERS’ EQUITY 75.02 23% 48.13 15% 22.08 7%TOTAL LIABILITIES AND STOCKHOLDERS’ EQUITY 327.95 100% 324.72 100% 328.21 100%
Top Bottom Vertical Key Indicators
1 2 3 Horizontal Key Indicators
Vertical & Horizontal Analysis
CONSOLIDATED INCOME STATEMENT
CONSOLIDATED BALANCE SHEET
2010 2011 2012
2011 20122010

American Apparel [American Apparel] [America]
Top Composition
Bottom Composition
Top Composition ASSETS
Top Composition LIABILITIES + EQUITY
Bottom Composition ASSETS
Bottom Composition LIABILITIES + EQUITY
2010 2011 2012
Gross profit 53% 54% 53%Operating Income (Loss) -‐9% -‐4% 0.2%Income (Loss) before Taxes -‐14% -‐7% -‐5%NET INCOME (LOSS) -‐16% -‐7% -‐6%
2010 2011 2012Liquid Assets 8% 10% 12%Current Assets 66% 71% 68%Non-‐Current Assets 34% 29% 32%
Current Liabilities 65% 44% 49%Non-‐Current Liabilities 12% 41.04% 44.03%TOTAL LIABILITIES 77% 85% 93%TOTAL STOCKHOLDERS’ EQUITY 23% 15% 7%
Comments on Vertical & Horizontal Analysis
The company has chased an increase on it's liquid assets.
AA reduced it's Operating Expenses in 4%, which brought it a surprising reduction on
it's Net Loss of almost a 10%.
AA's Operating Expenses were reducted in 3%, but this time, the interest expense and other losses avoided a substancial
change on it's Net Income.
CONSOLIDATED BALANCE SHEET2010 2011 2012
Progress
Operating Expenses: The most of the sales of AA are consumed by it's operating expenses, which has become one of the main reasons why the company faces losses on it's final result.
Net Income: One of the company's most severe problem is the lack of Income throughout the last year, which is reflected on it's negative marginal income.
Current Assets [Invetories]: The accumulation of Inventories in AA seems to be a problem every single year in AA.
Liquid Assets: There's an important lack of liquid assets in AA, which may respond to the accumulation of Inventories that the company has not been able to confront.
There's a poor control of Assets. The company has not been able to reconstruct the composition of them and inventories are still a problem.
The company started an strategy based on the reduction of their Current Liabilities; which contempled an increase in the Paid in Capital and Non-‐Current Liabilities. At the
end, the Stockholder's Equity decreased as a result of an Accumulated Deficit.
2012
Partial Conclusions
The Gross Profit seems to be a constant, which may be an indicator that the main problems reside in the Operating
Expenses, Interest Expenses and other Losses. AA seems to have intended to reduce them, although the results are still
unpleasant.
AA has been looking for the reduction of it's current debt; unfortunatelly, this intention has also severely reduced their Equity and increased in a great amount it's long-‐term debt.
Current Liabilities
Non-‐Current Liabilities:
Horizontal Analysis
Progress ASSETS
Progress LIABILITIES + EQUITY
CONSOLIDATED BALANCE SHEET
CONSOLIDATED INCOME STATEMENT
Total Stockholder's Equity
Paid In Capital, Non-‐Current Liabilities
Vertical AnalysisCONSOLIDATED INCOME STATEMENT
2010 2011
American Apparel has faced severe problems on it's financial forces. The composition of it's Liabilities versus it's Equity, which now only compounds a 9%, has created low expectations for it's development. Furthermore, it's poor ability to control their Assets and reduce their Operating Expenses, has also result in
negative Net Income, which is as a whole alarming.

THE ANALYSISUNIQLO [FAST RETAILING] [ASIA]
Millions ¥ JPY Percentage % Millions ¥ JPY Percentage % Millions ¥ JPY Percentage %Net sales 814,811 100% 820,349 100% 928,669 100%Cost of sales 393,930 48% 394,582 48% 453,202 49%Gross profit 420,881 52% 425,767 52% 475,467 51%Operating expenses 288,503 35% 309,402 38% 349,017 38%Operating Income (Loss) 132,378 16% 116,365 14% 126,450 14%Other Income/Losses -‐15,011 -‐1.8% -‐21,952 -‐2.7% -‐2,492 -‐.3%Interest Expense 500 0.063% 532 0.067% 568 0.061%Income (Loss) before Taxes 116,867 15% 93,881 12% 123,390 13%Income Tax 54,215 7% 37,569 5% 48,964 5%NET INCOME (LOSS) 62,652 8% 56,312 7% 74,426 8%Basic EPS (in USD) 7.16 6.95 8.95Diluted EPS (in USD) 7.16 6.95 8.94
Millions ¥ JPY Percentage % Millions ¥ JPY Percentage % Millions ¥ JPY Percentage %Cash 62,466 12% 64,386 12% 132,238 22%Short-‐Term Investments 139,412 27% 137,728 26% 133,788 22%Accounts Receivable 15,201 3% 17,488 3% 19,652 3%Liquid Assets 217,079 43% 219,602 41% 285,678 48%Other Current Assets 12,233 2% 15,361 3% 12,256 2%Deferred Income Taxes 29,715 6% 31,802 6% 16,987 3%Inventory 74,079 15% 92,750 17% 98,963 17%Tax Receivables 12,455 2% 10,453 2% 10,628 2%Current Assets 345,561 68% 369,968 69% 424,512 71%PP&E 50,144 10% 58,016 11% 69,222 12%Intangibles 47,840 9% 40,751 8% 38,216 6%Investments & Other Assets 63,678 13% 65,038 12% 63,146 11%Non-‐Current Assets 161,662 32% 163,805 31% 170,584 29%TOTAL ASSETS 507,223 100% 533,773 100% 595,096 100%
Accounts payable 54,098 11% 59,395 11% 71,192 12%Short-‐Term Loans 7,414 1% 3,878 1% 2,505 0%Other liabilities 109,594 22% 104,852 20% 71,943 12%Income Taxes Payable 31,512 6% 14,721 3% 27,738 5%Current Liabilities 202,618 40% 182,846 34% 173,378 29%Provisions for Pensions 45 0.01% 63 0.01% 64 0.01%Long-‐Term Liabilities 16,636 3% 30,957 6% 26,767 4%Non-‐Current Liabilities 16,681 3% 31,020 6% 26,831 5%TOTAL LIABILITIES 219,299 43% 213,866 40% 200,209 33.6%Capital Stock 10,273 2.0% 10,273 1.9% 10,273 1.7%Retained earnings 336,739 66% 369,717 69% 419,093 70%Adjustments & Losses -‐59,025 -‐12% -‐60,079 -‐11% -‐34,474 -‐6%TOTAL STOCKHOLDERS’ EQUITY 287,987 57% 319,911 60% 394,892 66%TOTAL LIABILITIES AND STOCKHOLDERS’ EQUITY 507,286 100% 533,777 100% 595,101 100%
Top Bottom Vertical Key Indicators
1 2 3 Horizontal Key Indicators
Vertical & Horizontal Analysis
CONSOLIDATED INCOME STATEMENT2010 2011 2012
CONSOLIDATED BALANCE SHEET2010 2011 2012

UNIQLO [Fast retailing] [Asia]
Top Composition
Bottom Composition
Top Composition ASSETS
Top Composition LIABILITIES + EQUITY
Bottom Composition ASSETS
Bottom Composition LIABILITIES + EQUITY
2010 2011 2012Gross profit 52% 52% 51%
Operating Income (Loss) 16% 14% 14%
Income (Loss) before Taxes 15% 12% 13%
NET INCOME (LOSS) 8% 7% 8%
2010 2011 2012Liquid Assets 43% 41% 48%Current Assets 68% 69% 71%Non-‐Current Assets 32% 31% 29%
Current Liabilities 40% 34% 29%Non-‐Current Liabilities 3% 6% 5%TOTAL LIABILITIES 43% 40% 33.6%TOTAL STOCKHOLDERS’ EQUITY 57% 60% 66%
Comments on Vertical & Horizontal Analysis
Vertical AnalysisCONSOLIDATED INCOME STATEMENT
2010 2011 2012
CONSOLIDATED BALANCE SHEET2010 2011 2012
UNIQLO has mantained an steady and promising composition of it's Financial Statements. The composition of Assets vs. Liabilities+Equity projects a reasoned strategy from the company to reduce it's Total Liabilities even when the Non-‐Current debt has proportionally increased. Concurrently, the behaviour of Assets, although steady, shows some interesting facts: The substantial increase in it's Liquid Assets and the related tendency to reduce it's Non-‐Current Assets, which in a closer look is surprisingly related to the alarming decrease rate of it's Intagibles during the last 2 years. Furthermore, UNIQLO's results
keeps showing constant and promising indicators; which can be undrstood by a great management of cost of goods and operation expenses.
CONSOLIDATED BALANCE SHEET
The company has lastly been focusing on it's Current Assets, implementing a balanced chase on more Liquid Assets
The company shows promising values in the matter of proportion of debt and Equity. Although it had increased the level of Non-‐Current liabilities, it has reduced is total debt in
almost 10% during the last 3 years.
Progress ASSETS
UNIQLO has constant results on it's composition of assets; it keeps focusing on it's Liquid ones and there's a slight tendency in the last years to reduce it's Non-‐Current
Assets.
Interest Expense: Interest does not seem to be a problem in the company.
Progress
Progress LIABILITIES + EQUITY
The composition of Liabilities and Equity keeps without variation throughout the 3 years, showing a healthy financing that keeps being enriched with a reduction in the
proportion Total Liabilities even with higher Non-‐Current debt.
Horizontal AnalysisCONSOLIDATED INCOME STATEMENT
There have been no substantial changes on UNIQLO's result composition of the last 3 years. The slight decrease in Net
Income from 2011 was immediately solved.
Partial Conclusions
It should be pointed out the evident stability of UNIQLO's results thorughout the last 3 years, which shows practically no meaningful composition changes.
Retained Earnings
Non-‐Current Liabilities
Current Assets [Liquid Assets]: As expected in Fast Fashion, Liquid Assets compose the most of Assets.
Non-‐Current Assets: The proportion of Fixed Assets, Intangibles and Long-‐Term Investments is kept down in relation with Current Assets; which may show an special interest of the company to enforce it's Working Capital.
Gross Profit: The most of the sales are reflected on its Gross Profit, which is a first demonstration of the companie's financial harmony.

THE ANALYSISh&m [Hennes & Mauritz] [europe]
American Apparel [American Apparel] [America]cash flow analysis
As a whole, AA is a unsteady company whose Cash Flow shows a changing pattern in terms of entrance and exit of money. In the
last years, it has been too supported on financing, and the company is making strong efforts to both collect and pay the
money from it's last years of operations.
cash flow analysis
In 2012, the movements in the Cash Flow were again reconstructed showing the higher entrance of money from
Operating Activities; as well as the higher investment made on Investing Activities.
As a whole, H&M is a wealthy company whose Cash Flow is strongly supported on it's Operating activities. In the Operating section, the higher volume of the money enters from it's Profits
after finantial items; fact that has lastly allowed them to perform better in the Investment activities in the pursuit of
future benefits.
In 2010, H&M enjoyed from a properous time in the company, which allowed it to make strong Investments for the company. The obvious result was an strong amount in the exit of money.
In 2011, H&M faced a harder time in terms of profits from Operation Activities. The investment was reduced reaching less
than a half than the previous year.
In 2012, the entrance of money from Profits increased a bit; the company continued making investments but in less proportion;
which is an obvious response after strong investments.
In 2010, AA faced a hard period in which the Operating Activities registered losses due to important payments to suppliers. Furthermore, the Capital Expendintures and the
payments of obligations, resulted in a strong need of financing.In 2011, AA perceived a slightly higher amount of money from customers than what expended on it's suppliers; nevertheless, the investment on Capital Expenditures counteract the result,
which was again supported by Financing Activities.

UNIQLO [FAST RETAILING] [ASIA]cash flow analysis
companie's basic financial statements review[Europe / America/ Asia]
There has been presented the basic way on which 3 models from the same industry function in 3 different countries; comparatively it is easy to identify in coloquial terms the shining, the unsuccessful, and the conservative one:
UNIQLO is the steadiest company. It projects a good composition of it's financial statements with no big changes from year to year. In general it could be stated as a the model to follow; but it's lack of risk on assets and this straight way to operate has somehow not been beneficial to its intangibles.
UNIQLOThe Conservative Model
The Shining Model
As a whole, UNIQLO is a highly steady company, which shows a pretty similar Cash Flow composition from year to year. The higher amount of money always comes from Operating
Activities and there is a controlled exit of money in Financing Activities that allows them to perform magnificently in Investing
Activities.
AA is the least wealthy company. It has not only been projecting losses on the most of the last 3 years, but it has also adquired more debt. Although it has been working hard to chase incomes instead of loses, its results have been detached from an optimal or at least balanced state.
H&M is the whealtiest company with an special interest to continue investing. It projects an stable composition of it's financial statements that gets dynamism from year to year at the time it decides to use proportionally it's profits to perform better in the investment activities. It's not as a whole a model to follow, but it's desitions seem to possitively impact it's intangibles.
American ApparelThe Unsuccessful Model
H&M
Partial Conclusions
In 2010, UNIQLO made a great performance on the Cash Flow, the Operating activities greatly contributed to it's Net Cash and
the Investing activities coincided with the financing.
In 2011, UNIQLO's Operating Activities registered a decrease in the entrance of money, while the rest of activities performed as normal. The result was an important decrease in Net Cash, that was easily overtaken with the Cash at the beginnig of period. In 2012, the Cash Flow returned to normality in terms of
Operating Activities, which even surpass the amount of money perceibed in 2010. The Net Cash keeps being promising for the
company.

THE ANALYSIS
2010 2011 2012Net Income
Sales
2010 2011 2012
2010 2011 2012
2010 2011 2012Net Income
Equity
2010 2011 2012
2010 2011 2012
2010 2011 2012Operating Income
Assets
2010 2011 2012
2010 2011 2012
7.7% 6.9%
21.2%
-‐15.3% -‐7.2% 0.3%
-‐16.4% -‐7.2%
ROA
Financial Ratios Analysis[Europe / America/ Asia]
H&MAmerican Apparel
UNIQLO
PROFITABILITY
ROS
ROE
21.8% 17.6% 18.8%
8.0%
-‐5.9%
-‐116.5% -‐82.1% -‐165.9%
17.2% 14.4% 14.0%
Under the given years, all of the companies project a clear hierarchy of profitability. H&M with an amazing control of Sales, Assets, and Equity; UNIQLO with an outstanding balance even with the given peak in 2011; and American Apparel with a poor performance over the years with only one non-‐red numbers improvemement on it's management of Assets. Special attention should be given to the ROE; where seems to be the biggest difference between companies: Asumption: H&M has a stronger reliability on its Liabilities than any other company. Result: The Balanace's Composition of H&M shows and incredible low percentage of Total Liabilities, which make us conclude that H&M has actually had a stronger and wealthier management of it's Equity than any of the other companies studied until now.
Partial Conclusions
42.3% 35.9%
41.7% 33.9%
38.7%
36.2%
26.1% 21.8%
2010 2011 2012LiabilitiesAssets
2010 2011 2012
2010 2011 2012
2010 2011 2012LiabilitiesEquity
2010 2011 2012
2010 2011 2012
2010 2011 2012Operating IncomeInterest Expense
2010 2011 2012
2010 2011 2012
2010 2011 201227,085.0 25,161.0 23,222.032.5 30.2 27.9 *2010 2011 20122.4 87.4 62.82.4 87.4 62.8 *2010 2011 2012
142,943.0 187,122.0 251,134.01.4 1.9 2.5 *
2010 2011 2012Current Assets
Current Liabilities
2010 2011 2012
2010 2011 2012
2010 2011 2012Liquid Assets
Current Liabilities
2010 2011 2012
2010 2011 2012
1.1 1.2 1.6
1.0 1.6
3.0 2.7
2.0 1.6
0.1 0.2 0.2
264.8
1.4
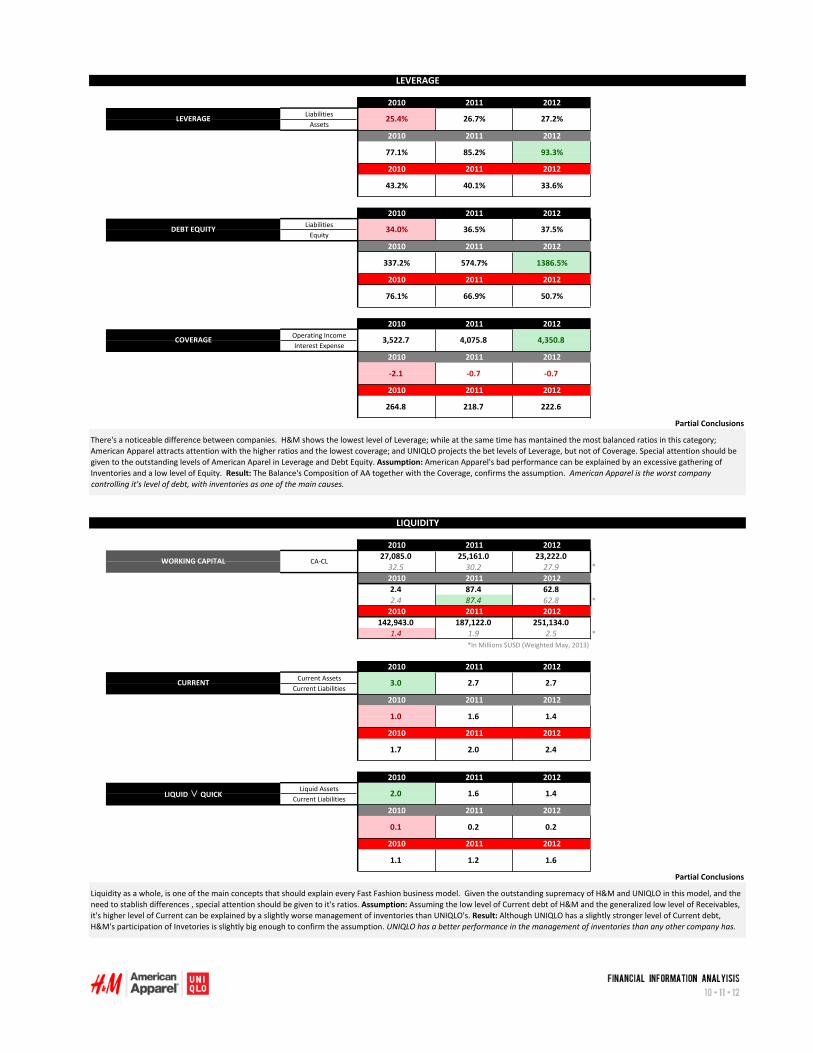
LEVERAGE
LEVERAGE
COVERAGE
43.2% 40.1% 33.6%
76.1% 66.9%
1.4
LIQUIDITY
WORKING CAPITAL
CURRENT
77.1% 85.2% 93.3%
50.7%
1386.5%
-‐2.1 -‐0.7 -‐0.7
4,350.8
337.2% 574.7%
34.0% 36.5% 37.5%
CA-‐CL
DEBT EQUITY
218.7
*In Millions $USD (Weighted May, 2013)
Partial Conclusions
Partial Conclusions
Liquidity as a whole, is one of the main concepts that should explain every Fast Fashion business model. Given the outstanding supremacy of H&M and UNIQLO in this model, and the need to stablish differences , special attention should be given to it's ratios. Assumption: Assuming the low level of Current debt of H&M and the generalized low level of Receivables, it's higher level of Current can be explained by a slightly worse management of inventories than UNIQLO's. Result: Although UNIQLO has a slightly stronger level of Current debt, H&M's participation of Invetories is slightly big enough to confirm the assumption. UNIQLO has a better performance in the management of inventories than any other company has.
There's a noticeable difference between companies. H&M shows the lowest level of Leverage; while at the same time has mantained the most balanced ratios in this category; American Apparel attracts attention with the higher ratios and the lowest coverage; and UNIQLO projects the bet levels of Leverage, but not of Coverage. Special attention should be given to the outstanding levels of American Aparel in Leverage and Debt Equity. Assumption: American Apparel's bad performance can be explained by an excessive gathering of Inventories and a low level of Equity. Result: The Balance's Composition of AA together with the Coverage, confirms the assumption. American Apparel is the worst company controlling it's level of debt, with inventories as one of the main causes.
25.4% 26.7%
3,522.7 4,075.8
LIQUID ∨ QUICK
27.2%
222.6
1.7 2.0 2.4
2.7
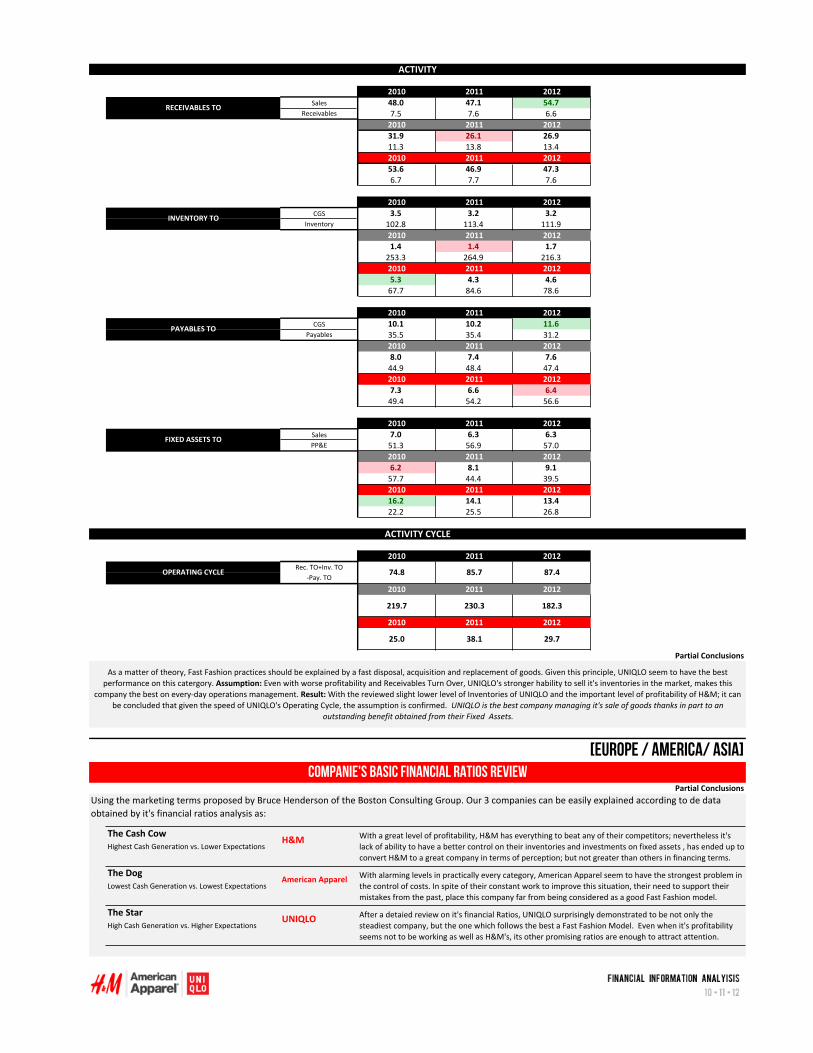
2010 2011 2012Sales 48.0 47.1 54.7
Receivables 7.5 7.6 6.62010 2011 201231.9 26.1 26.911.3 13.8 13.42010 2011 201253.6 46.9 47.36.7 7.7 7.6
2010 2011 2012CGS 3.5 3.2 3.2
Inventory 102.8 113.4 111.92010 2011 20121.4 1.4 1.7253.3 264.9 216.32010 2011 20125.3 4.3 4.667.7 84.6 78.6
2010 2011 2012CGS 10.1 10.2 11.6
Payables 35.5 35.4 31.22010 2011 20128.0 7.4 7.644.9 48.4 47.42010 2011 20127.3 6.6 6.449.4 54.2 56.6
2010 2011 2012Sales 7.0 6.3 6.3PP&E 51.3 56.9 57.0
2010 2011 20126.2 8.1 9.157.7 44.4 39.52010 2011 201216.2 14.1 13.422.2 25.5 26.8
2010 2011 2012
2010 2011 2012
2010 2011 2012
The Cash Cow Highest Cash Generation vs. Lower Expectations
The DogLowest Cash Generation vs. Lowest Expectations
The StarHigh Cash Generation vs. Higher Expectations
38.1 29.7
Rec. TO+Inv. TO -‐Pay. TO
OPERATING CYCLE
Partial Conclusions
FIXED ASSETS TO
PAYABLES TO
H&M With a great level of profitability, H&M has everything to beat any of their competitors; nevertheless it's lack of ability to have a better control on their inventories and investments on fixed assets , has ended up to convert H&M to a great company in terms of perception; but not greater than others in financing terms.
American Apparel With alarming levels in practically every category, American Apparel seem to have the strongest problem in the control of costs. In spite of their constant work to improve this situation, their need to support their mistakes from the past, place this company far from being considered as a good Fast Fashion model.
UNIQLO After a detaied review on it's financial Ratios, UNIQLO surprisingly demonstrated to be not only the steadiest company, but the one which follows the best a Fast Fashion Model. Even when it's profitability seems not to be working as well as H&M's, its other promising ratios are enough to attract attention.
[Europe / America/ Asia]companie's basic financial Ratios review
Partial ConclusionsUsing the marketing terms proposed by Bruce Henderson of the Boston Consulting Group. Our 3 companies can be easily explained according to de data obtained by it's financial ratios analysis as:
ACTIVITY CYCLE
74.8 85.7
As a matter of theory, Fast Fashion practices should be explained by a fast disposal, acquisition and replacement of goods. Given this principle, UNIQLO seem to have the best performance on this catergory. Assumption: Even with worse profitability and Receivables Turn Over, UNIQLO's stronger hability to sell it's inventories in the market, makes this
company the best on every-‐day operations management. Result: With the reviewed slight lower level of Inventories of UNIQLO and the important level of profitability of H&M; it can be concluded that given the speed of UNIQLO's Operating Cycle, the assumption is confirmed. UNIQLO is the best company managing it's sale of goods thanks in part to an
outstanding benefit obtained from their Fixed Assets.
87.4
182.3230.3219.7
INVENTORY TO
ACTIVITY
RECEIVABLES TO
25.0

the conclusionsfast fashion companies demonstrated to be an attractive business model, but not everybody seems to totally fit into it.
H&M [Hennes & Mauritz] [EUROPE]
Mean CompositionGross Profit 60%Net Income 15%Current Assets 60% to 70%Non-‐Current Assets 30% to 40%Current Liabilities 23%Non-‐Current Liabilities 2% to 4 %Liabilities 25% to 27%Stockholder's Equity 75% to 72%
American Apparel [American Apparel] [america]
Mean CompositionGross Profit 50%Net Income .-‐15% -‐ -‐5%Current Assets 70%Non-‐Current Assets 30%Current Liabilities 65% to 50%Non-‐Current Liabilities 10% to 40%Liabilities 75% to 90%Stockholder's Equity 25% to 10%
UNIQLO [Fast Retailing] [asia]
Mean CompositionGross Profit 50%Net Income 8%Current Assets 70%Non-‐Current Assets 30%Current Liabilities 40% to 30%Non-‐Current Liabilities 5%Liabilities 45% to 35%Stockholder's Equity 55% to 65%
Activity
Has become the company with overall best performance in Activity, which has allowed it to perform an operating cycle beyond compare; which puts this company in a promising
situation. UNIQLO is as in multiple indicators, the best company managing it's sale of goods thanks in part to a great benefit
obtained from their Fixed Assets.
In general although some management mistakes are evident, it is hard to stablish a single best performance overall. Each company started to work in a totally different scenarios; and what is more, each one is lastly managing its debt and inventories in their possible way. At the end, it is given that the desition of where to invest does not only depends on it's EPS (H&M with a mean of 12 USD, AA with -‐.6 USD and UNIQLO with 8 USD ); it actually depends on the risk profile of the investor and the reliability of each company's managers.
Consolidated Income Statement
Consolidated Balance Sheet
Leverage Has performed as the company with overall best Leverage but with the worst Coverage; which actually confirms American Apparel to be the worst company controlling it's level of debt, with inventories management as one of the main causes.
Consolidated Income Statement
Consolidated Balance Sheet
UNIQLO is a highly steady company, which shows a pretty similar Cash Flow composition from year to year. The higher amount of money always comes from Operating Activities and there is a controlled exit of money in Financing Activities that allows them to perform magnificently in Investing Activities, which has allowed it to decrease its level of liabilities.
In the last years, American Apparel has become in an unsteady company whose Net Income and Cash Flow shows a changing pattern in terms of entrance and exit of money. In the last years, it has been too supported on financing, and the company is making strong efforts to both collect and pay the money from it's last years of operations, which has decreased substantialy it's equity.
UNIQLO demonstrated to be the steadiest company with great promising indicators. Although it's great financing skills, it still faces a shadow from it's constant decreasing rate on Intangibles, which may become in an opportunity area to fully compete against H&M.
Vertical & Horizontal Analysis / Cash Flow / Financial Ratios
H&M demonstrated to be the wealthiest company from all of the evaluated; it's financial statement projects to have a reasoned strategy to be composed in a certain way with a last tendency to invest in Non-‐Current Assets. It is a first sight a prosperous shining company, but in a further analyisis is darken in activity operations by UNIQLO.
Consolidated Income Statement
American Apparel demonstrated to be facing hard problems in terms of financing, gathering of inventories and sale of goods. It's financial composition is actually one of the most unbalanced and unsteadiest. It has become in the Fast Fashion company with the lowest cash generation and expectations; but its managers have been working hard to contain it.
In the last years, it's Cash Flow has been strongly supported on it's Operating activities (profits); fact that has lastly allowed them to perform better in the Investment activities in the pursuit of future benefits.
Profitability, Liquidity
Has performed as the company with overall best Profitability and Liquidity, showing a strong affordability of debts together with a great management of it's equity and assets; however in a
further analysis, it was encountered an overall better performance in Inventories and Operating Cycle from UNIQLO, which has lastly taken more advantage from it's fixed assets.
After years decades of development, companies such as H&M, American Apparel and UNIQLO encountered in Fast Fashion a way to do their business. From Europe to America and Asia, it has always been talked about which one is performing best in this modern industry. This work on financial information analysis made us understand at least a part of this question.
Companies demonstrated to work diffently even with the given principles of Fast Fashion. It was encountered that the composition of Consolidated Income Statement and Balance Sheet could change a lot from company to company; and the results could give us an idea of how the company has done over the last 3 years.
Consolidated Balance Sheet
Copyright © 2022 FDOKUMEN