中期報告 - :: HKEX :: HKEXnews ::
142
中期報告 INTERIM REPORT 2021
-
Upload
khangminh22 -
Category
Documents
-
view
3 -
download
0
Transcript of 中期報告 - :: HKEX :: HKEXnews ::

中期報告INTERIM
REPORT
2021

Interim Report 2021 1
CONTENTS
Page
Financial Report (Unaudited) 2
Management Discussion and Analysis 128
Significant Events 135
Changes to Share Capital and Information of Shareholders 136
Directors, Supervisors and Staff 138
Purchasing, Selling or Redeeming the Securities 139
Review of the Unaudited Interim Results 139
Code of Corporate Governance 139
Definitions 139
Company Information 140
2 Interim Report 2021
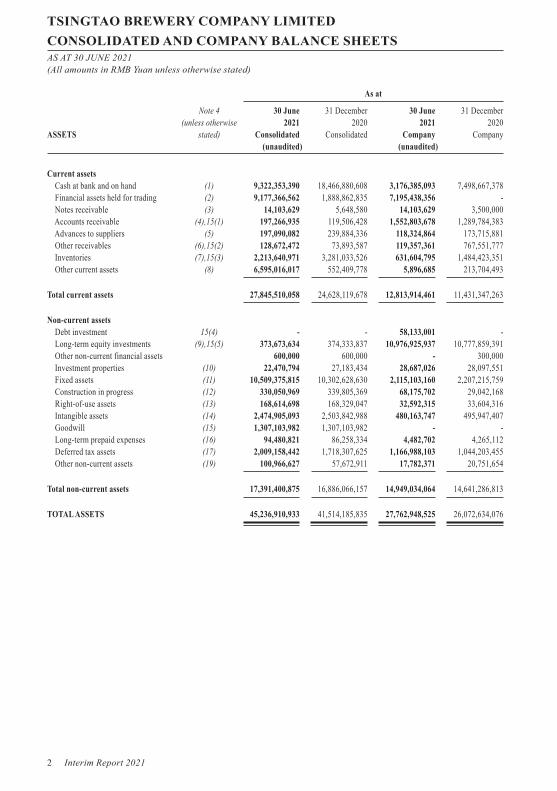
TSINGTAO BREWERY COMPANY LIMITEDCONSOLIDATED AND COMPANY BALANCE SHEETSAS AT 30 JUNE 2021(All amounts in RMB Yuan unless otherwise stated)
As at
Note 4 30 June 31 December 30 June 31 December (unless otherwise 2021 2020 2021 2020ASSETS stated) Consolidated Consolidated Company Company (unaudited) (unaudited)
Current assets Cash at bank and on hand (1) 9,322,353,390 18,466,880,608 3,176,385,093 7,498,667,378 Financial assets held for trading (2) 9,177,366,562 1,888,862,835 7,195,438,356 - Notes receivable (3) 14,103,629 5,648,580 14,103,629 3,500,000 Accounts receivable (4),15(1) 197,266,935 119,506,428 1,552,803,678 1,289,784,383 Advances to suppliers (5) 197,090,082 239,884,336 118,324,864 173,715,881 Other receivables (6),15(2) 128,672,472 73,893,587 119,357,361 767,551,777 Inventories (7),15(3) 2,213,640,971 3,281,033,526 631,604,795 1,484,423,351 Other current assets (8) 6,595,016,017 552,409,778 5,896,685 213,704,493
Total current assets 27,845,510,058 24,628,119,678 12,813,914,461 11,431,347,263
Non-current assets Debt investment 15(4) - - 58,133,001 - Long-term equity investments (9),15(5) 373,673,634 374,333,837 10,976,925,937 10,777,859,391 Other non-current financial assets 600,000 600,000 - 300,000 Investment properties (10) 22,470,794 27,183,434 28,687,026 28,097,551 Fixed assets (11) 10,509,375,815 10,302,628,630 2,115,103,160 2,207,215,759 Construction in progress (12) 330,050,969 339,805,369 68,175,702 29,042,168 Right-of-use assets (13) 168,614,698 168,329,047 32,592,315 33,604,316 Intangible assets (14) 2,474,905,093 2,503,842,988 480,163,747 495,947,407 Goodwill (15) 1,307,103,982 1,307,103,982 - - Long-term prepaid expenses (16) 94,480,821 86,258,334 4,482,702 4,265,112 Deferred tax assets (17) 2,009,158,442 1,718,307,625 1,166,988,103 1,044,203,455 Other non-current assets (19) 100,966,627 57,672,911 17,782,371 20,751,654
Total non-current assets 17,391,400,875 16,886,066,157 14,949,034,064 14,641,286,813
TOTAL ASSETS 45,236,910,933 41,514,185,835 27,762,948,525 26,072,634,076

Interim Report 2021 3
TSINGTAO BREWERY COMPANY LIMITEDCONSOLIDATED AND COMPANY BALANCE SHEETS (Cont’d)AS AT 30 JUNE 2021(All amounts in RMB Yuan unless otherwise stated)
As at
30 June 31 December 30 June 31 December 2021 2020 2021 2020LIABILITIES AND EQUITY Note 4 Consolidated Consolidated Company Company (unaudited) (unaudited)
Current liabilities Short-term borrowings (20) 450,255,705 703,273,054 - - Notes payable (21) 192,247,098 149,491,592 118,775,982 118,344,729 Accounts payable (22) 3,387,360,154 2,222,601,042 4,320,867,816 2,945,975,684 Contract liabilities (23) 5,244,815,963 6,567,320,256 3,651,224,028 4,816,661,431 Employee benefits payable (24) 1,873,598,111 1,906,199,446 625,537,989 630,441,397 Taxes payable (25) 1,216,630,502 548,026,847 391,338,521 82,987,488 Other payables (26) 5,306,657,698 3,074,878,208 2,506,397,395 1,389,865,972 Current portion of non-current liabilities (27) 46,752,841 42,089,297 12,739,516 12,694,927 Other current liabilities (23) 98,023,765 296,065,856 67,883,428 255,389,916
Total current liabilities 17,816,341,837 15,509,945,598 11,694,764,675 10,252,361,544
Non-current liabilities Lease liabilities (28) 111,535,058 115,839,869 16,031,975 17,840,026 Long-term payables (29) 288,053,679 462,046,060 - - Deferred income (30) 2,958,428,519 2,899,626,024 382,555,211 399,473,516 Long-term employee benefits payable (31) 942,091,056 991,111,582 550,748,061 543,156,836 Deferred tax liabilities (17) 163,994,685 167,564,536 - -
Total non-current liabilities 4,464,102,997 4,636,188,071 949,335,247 960,470,378
Total liabilities 22,280,444,834 20,146,133,669 12,644,099,922 11,212,831,922
Equity Share capital (32) 1,364,476,795 1,364,182,795 1,364,476,795 1,364,182,795 Capital surplus (33) 3,838,740,408 3,675,291,623 4,861,651,681 4,710,298,947 Less: Treasury stock (34) (275,682,420) (279,576,000) (275,682,420) (279,576,000) Other comprehensive income (35) (18,400,364) (19,851,339) (30,438,000) (30,438,000) Surplus reserve (36) 1,400,704,380 1,400,704,380 1,400,704,380 1,400,704,380 General reserve (37) 260,344,554 260,344,554 - - Undistributed profits (38) 15,613,028,235 14,220,864,502 7,798,136,167 7,694,630,032
Total equity attributable to shareholders of the Company 22,183,211,588 20,621,960,515 15,118,848,603 14,859,802,154 Non-controlling interests 773,254,511 746,091,651 — —
Total equity 22,956,466,099 21,368,052,166 15,118,848,603 14,859,802,154
TOTAL LIABILITIES AND EQUITY 45,236,910,933 41,514,185,835 27,762,948,525 26,072,634,076
The accompanying notes form an integral part of these financial statements.
Legal representative: Principal in charge of accounting: Head of accounting department:HUANG Kexing YU Zhuming HOU Qiuyan
4 Interim Report 2021
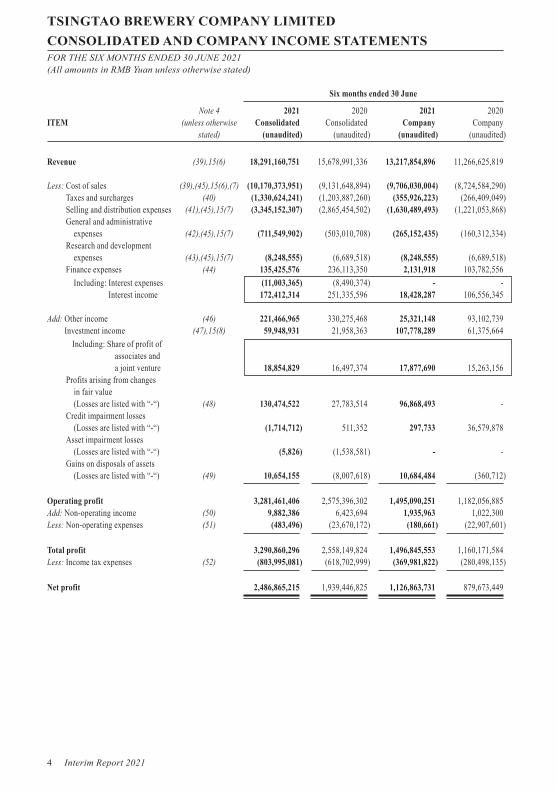
TSINGTAO BREWERY COMPANY LIMITEDCONSOLIDATED AND COMPANY INCOME STATEMENTSFOR THE SIX MONTHS ENDED 30 JUNE 2021(All amounts in RMB Yuan unless otherwise stated)
Six months ended 30 June
Note 4 2021 2020 2021 2020ITEM (unless otherwise Consolidated Consolidated Company Company stated) (unaudited) (unaudited) (unaudited) (unaudited)
Revenue (39),15(6) 18,291,160,751 15,678,991,336 13,217,854,896 11,266,625,819
Less: Cost of sales (39),(45),15(6),(7) (10,170,373,951) (9,131,648,894) (9,706,030,004) (8,724,584,290)Taxes and surcharges (40) (1,330,624,241) (1,203,887,260) (355,926,223) (266,409,049)Selling and distribution expenses (41),(45),15(7) (3,345,152,307) (2,865,454,502) (1,630,489,493) (1,221,053,868)General and administrative expenses (42),(45),15(7) (711,549,902) (503,010,708) (265,152,435) (160,312,334)Research and development expenses (43),(45),15(7) (8,248,555) (6,689,518) (8,248,555) (6,689,518)Finance expenses (44) 135,425,576 236,113,350 2,131,918 103,782,556 Including: Interest expenses (11,003,365) (8,490,374) - -
Interest income 172,412,314 251,335,596 18,428,287 106,556,345
Add: Other income (46) 221,466,965 330,275,468 25,321,148 93,102,739Investment income (47),15(8) 59,948,931 21,958,363 107,778,289 61,375,664 Including: Share of profit of
associates and a joint venture 18,854,829 16,497,374 17,877,690 15,263,156
Profits arising from changes in fair value (Losses are listed with “-“) (48) 130,474,522 27,783,514 96,868,493 -Credit impairment losses (Losses are listed with “-“) (1,714,712) 511,352 297,733 36,579,878Asset impairment losses (Losses are listed with “-“) (5,826) (1,538,581) - -Gains on disposals of assets (Losses are listed with “-“) (49) 10,654,155 (8,007,618) 10,684,484 (360,712)
Operating profit 3,281,461,406 2,575,396,302 1,495,090,251 1,182,056,885Add: Non-operating income (50) 9,882,386 6,423,694 1,935,963 1,022,300Less: Non-operating expenses (51) (483,496) (23,670,172) (180,661) (22,907,601)
Total profit 3,290,860,296 2,558,149,824 1,496,845,553 1,160,171,584Less: Income tax expenses (52) (803,995,081) (618,702,999) (369,981,822) (280,498,135)
Net profit 2,486,865,215 1,939,446,825 1,126,863,731 879,673,449

Interim Report 2021 5
TSINGTAO BREWERY COMPANY LIMITEDCONSOLIDATED AND COMPANY INCOME STATEMENTS (Cont’d)FOR THE SIX MONTHS ENDED 30 JUNE 2021(All amounts in RMB Yuan unless otherwise stated)
Six months ended 30 June
Note 4 2021 2020 2021 2020ITEM (unless otherwise Consolidated Consolidated Company Company stated) (unaudited) (unaudited) (unaudited) (unaudited)
Classified by continuity of operations Net profit from continuing operations 2,486,865,215 1,939,446,825 1,126,863,731 879,673,449 Net profit from discontinued operations - - - -
Classified by ownership of the equity Attributable to shareholders of the Company 2,415,521,329 1,854,983,102 1,126,863,731 879,673,449 Attributable to non-controlling interests 71,343,886 84,463,723 — —
Other comprehensive income, net of tax (35) 1,450,975 (3,053,718) - -
Other comprehensive income attributable to shareholders of the Company, net of tax Items that will be subsequently reclassified to profit or loss Shares of other comprehensive income of investees accounted for using the equity method that will be subsequently reclassified to profit or loss (137,707) 77,344 - - Currency translation differences 1,588,682 (3,131,062) - -
Total comprehensive income 2,488,316,190 1,936,393,107 1,126,863,731 879,673,449
Attributable to shareholders of the Company 2,416,972,304 1,851,929,384 1,126,863,731 879,673,449Attributable to non-controlling interests 71,343,886 84,463,723 — —
Earnings per shareBasic earnings per share (53) 1.780 1.373 — —Diluted earnings per share (53) 1.780 1.373 — —
The accompanying notes form an integral part of these financial statements.
Legal representative: Principal in charge of accounting: Head of accounting department:HUANG Kexing YU Zhuming HOU Qiuyan

6 Interim Report 2021
TSINGTAO BREWERY COMPANY LIMITEDCONSOLIDATED AND COMPANY CASH FLOW STATEMENTSFOR THE SIX MONTHS ENDED 30 JUNE 2021(All amounts in RMB Yuan unless otherwise stated)
Six months ended 30 June
2021 2020 2021 2020ITEM Note 4 Consolidated Consolidated Company Company (unaudited) (unaudited) (unaudited) (unaudited)
Cash flows from operating activitiesCash received from sales of goods or rendering of services 19,069,797,080 16,456,593,125 13,357,510,815 11,230,375,339Refund of taxes and surcharges 10,529,750 15,521,340 10,529,750 12,258,112Cash received relating to other operating activities (54)(a) 472,938,811 702,021,732 80,162,193 134,161,708
Sub-total of cash inflows 19,553,265,641 17,174,136,197 13,448,202,758 11,376,795,159
Cash paid for goods and services (7,392,696,835) (6,254,818,909) (8,196,163,975) (6,822,312,617)Cash paid to and on behalf of employees (2,400,191,192) (2,016,727,304) (848,912,956) (732,067,891)Payments of taxes and surcharges (2,759,812,677) (2,172,002,536) (886,697,736) (569,692,296)Cash paid relating to other operating activities (54)(b) (1,975,903,685) (1,766,090,548) (1,224,900,308) (1,098,291,567)
Sub-total of cash outflows (14,528,604,389) (12,209,639,297) (11,156,674,975) (9,222,364,371)
Net cash flows from operating activities (55)(a) 5,024,661,252 4,964,496,900 2,291,527,783 2,154,430,788
Cash flows from investing activitiesCash received from disposal of investments 1,776,085,800 842,000,000 260,675,368 208,700,000Cash received from returns on investments 41,707,649 50,336,309 776,833,007 626,562,928Net cash received from disposal of fixed assets, intangible assets and other long-term assets 14,074,578 15,512,744 6,847,302 1,525,222Cash received relating to other investing activities (54)(c) 199,654,726 184,930,632 2,755,050 543,000
Sub-total of cash inflows 2,031,522,753 1,092,779,685 1,047,110,727 837,331,150
Cash paid to acquire fixed assets, intangible assets and other long-term assets (703,675,247) (545,343,260) (90,993,631) (158,940,440)Cash paid to acquire investments (16,520,809,580) (1,229,900,000) (7,566,000,000) (301,518,181)Cash paid relating to other investing activities (54)(d) (285,307,357) (92,640,185) (1,653,700) (933,300)
Sub-total of cash outflows (17,509,792,184) (1,867,883,445) (7,658,647,331) (461,391,921)
Net cash flows from investing activities (15,478,269,431) (775,103,760) (6,611,536,604) 375,939,229

Interim Report 2021 7
TSINGTAO BREWERY COMPANY LIMITEDCONSOLIDATED AND COMPANY CASH FLOW STATEMENTS (Cont’d)FOR THE SIX MONTHS ENDED 30 JUNE 2021(All amounts in RMB Yuan unless otherwise stated)
Six months ended 30 June
2021 2020 2021 2020ITEM Note 4 Consolidated Consolidated Company Company (unaudited) (unaudited) (unaudited) (unaudited)
Cash flows from financing activitiesCash received from investment 6,226,920 - 6,226,920 -Cash received from borrowings 251,370,000 270,120,000 - -Cash received from other financing activities 4,000 - - -
Sub-total of cash inflows 257,600,920 270,120,000 6,226,920 -
Cash repayments of borrowings (501,572,470) (270,330,000) - -Cash payments for distribution of dividends, profits or interests expenses (65,873,208) (429,763,491) - (380,979,595) Including: Cash payments for
dividends, profit to minority shareholders of subsidiaries (55,687,148) (41,044,076) — —
Cash payments relating to other financing activities (54)(e) (27,931,298) (257,733,732) (9,692,907) (8,066,521)
Sub-total of cash outflows (595,376,976) (957,827,223) (9,692,907) (389,046,116)
Net cash flows from financing activities (337,776,056) (687,707,223) (3,465,987) (389,046,116)
Exchange effect on cash and cash equivalents (5,023,523) 6,580,437 (3,233,395) 4,047,533
Net increase in cash and cash equivalents (55)(a) (10,796,407,758) 3,508,266,354 (4,326,708,203) 2,145,371,434Add: Cash and cash equivalents at
beginning of period 17,643,123,424 14,557,393,355 7,469,757,605 6,043,843,854
Cash and cash equivalents at end of period (55)(b) 6,846,715,666 18,065,659,709 3,143,049,402 8,189,215,288
The accompanying notes form an integral part of these financial statements.
Legal representative: Principal in charge of accounting: Head of accounting department:HUANG Kexing YU Zhuming HOU Qiuyan

8 Interim Report 2021
TSINGTAO BREWERY COMPANY LIMITEDCONSOLIDATED STATEMENT OF CHANGES IN SHAREHOLDERS’ EQUITYFOR THE SIX MONTHS ENDED 30 JUNE 2021(All amounts in RMB Yuan unless otherwise stated)
Attributable to shareholders of the Company
Less: Other Non- Total Share Capital Treasury comprehensive Surplus General Undistributed controlling shareholders’ ITEM Note 4 capital surplus shares income reserve reserve profits interests equity
Balance at 1 January 2020 1,350,982,795 3,444,317,455 - (47,347,633) 1,400,704,380 234,715,680 12,788,210,357 741,787,822 19,913,370,856
Movements for the six months ended 30 June 2020 (unaudited)Total comprehensive income Net profit - - - - - - 1,854,983,102 84,463,723 1,939,446,825 Other comprehensive income (35) - - - (3,053,718) - - - - (3,053,718)
Total comprehensive income for the six months ended 30 June 2020 - - - (3,053,718) - - 1,854,983,102 84,463,723 1,936,393,107Profit distribution (38) Profit distribution to shareholders - - - - - - (743,040,537) (41,044,076) (784,084,613)Others (33) - (173,479,592) - - - - - (68,297,121) (241,776,713)
Balance at 30 June 2020 (unaudited) 1,350,982,795 3,270,837,863 - (50,401,351) 1,400,704,380 234,715,680 13,900,152,922 716,910,348 20,823,902,637
Balance at 31 December 2020 1,364,182,795 3,675,291,623 (279,576,000) (19,851,339) 1,400,704,380 260,344,554 14,220,864,502 746,091,651 21,368,052,166
Balance at 1 January 2021 1,364,182,795 3,675,291,623 (279,576,000) (19,851,339) 1,400,704,380 260,344,554 14,220,864,502 746,091,651 21,368,052,166
Movements for the six months ended 30 June 2021 (unaudited)Total comprehensive income Net profit - - - - - - 2,415,521,329 71,343,886 2,486,865,215 Other comprehensive income (35) - - - 1,450,975 - - - - 1,450,975
Total comprehensive income for the six months ended 30 June 2021 - - - 1,450,975 - - 2,415,521,329 71,343,886 2,488,316,190Shareholder investment and capital reduction Capital paid in by equity incentive shareholders (33) 294,000 5,932,920 (6,226,920) - - - - - - Share-based payment included in shareholders’ equity (33) - 157,486,792 - - - - - 696,173 158,182,965Profit distribution (38) Profit distribution to shareholders - - 10,120,500 - - - (1,023,357,596) (44,877,199) (1,058,114,295)Others (33) - 29,073 - - - - - - 29,073
Balance at 30 June 2021 (unaudited) 1,364,476,795 3,838,740,408 (275,682,420) (18,400,364) 1,400,704,380 260,344,554 15,613,028,235 773,254,511 22,956,466,099
The accompanying notes form an integral part of these financial statements.
Legal representative: Principal in charge of accounting: Head of accounting department:HUANG Kexing YU Zhuming HOU Qiuyan

Interim Report 2021 9
TSINGTAO BREWERY COMPANY LIMITEDCOMPANY STATEMENT OF CHANGES IN SHAREHOLDERS’ EQUITY (Cont’d)FOR THE SIX MONTHS ENDED 30 JUNE 2021(All amounts in RMB Yuan unless otherwise stated)
Less: Other Total Share Capital Treasury comprehensive Surplus Undistributed shareholders’ ITEM Note 4 capital surplus shares income reserve profits equity
Balance at 1 January 2020 1,350,982,795 4,306,633,811 - (47,445,000) 1,400,704,380 7,489,288,403 14,500,164,389
Movements for the six months ended 30 June 2020 (unaudited)Total comprehensive income Net profit - - - - - 879,673,449 879,673,449
Total comprehensive income for the six months ended 30 June 2020 - - - - - 879,673,449 879,673,449Profit distribution (38) Profit distribution to shareholders - - - - - (743,040,537) (743,040,537)Others - 5,910 - - - - 5,910
Balance at 30 June 2020 (unaudited) 1,350,982,795 4,306,639,721 - (47,445,000) 1,400,704,380 7,625,921,315 14,636,803,211
Balance at 31 December 2020 1,364,182,795 4,710,298,947 (279,576,000) (30,438,000) 1,400,704,380 7,694,630,032 14,859,802,154
Balance at 1 January 2021 1,364,182,795 4,710,298,947 (279,576,000) (30,438,000) 1,400,704,380 7,694,630,032 14,859,802,154
Movements for the six months ended 30 June 2021 (unaudited)Total comprehensive income Net profit - - - - - 1,126,863,731 1,126,863,731
Total comprehensive income for the six months ended 30 June 2021 - - - - - 1,126,863,731 1,126,863,731Shareholder investment and capital reduction Capital paid in by equity incentive shareholders (33) 294,000 5,932,920 (6,226,920) - - - - Share-based payment included in shareholders’ equity - 145,417,833 - - - - 145,417,833Profit distribution (38) Profit distribution to shareholders - - 10,120,500 - - (1,023,357,596) (1,013,237,096)Others - 1,981 - - - - 1,981
Balance at 30 June 2021 (unaudited) 1,364,476,795 4,861,651,681 (275,682,420) (30,438,000) 1,400,704,380 7,798,136,167 15,118,848,603
The accompanying notes form an integral part of these financial statements.
Legal representative: Principal in charge of accounting: Head of accounting department:HUANG Kexing YU Zhuming HOU Qiuyan

10 Interim Report 2021
TSINGTAO BREWERY COMPANY LIMITEDNOTES TO FINANCIAL STATEMENTSFOR THE SIX MONTHS ENDED 30 JUNE 2021(All amounts in RMB Yuan unless otherwise stated)
1 GENERAL INFORMATION
Tsingtao Brewery Company Limited (the “Company”) was established in the People’s Republic of China on 16 June 1993. The Company obtained business license as a Sino-foreign joint stock limited company on 27 December 1995. The registered address and head office address of the Company is Qingdao, Shandong province, the PRC, with a total share capital of RMB482,400,000 at establishment.
The Company’s H shares have been listed on the Main Board of the Stock Exchange of Hong Kong Limited since 15 July 1993, and its A shares have been listed on the Shanghai Stock Exchange since 27 August 1993. The total share capital upon issue amounted to RMB900,000,000. Subsequently, the Company increased its total share capital to RMB1,308,219,178 after issuing new RMB ordinary shares and corporate convertible bonds which were converted into H shares.
Approved by the Circular [2008] No.445 issued by the China Securities Regulatory Commission, the Company issued convertible bonds with detachable warrants subscription rights on 2 April 2008 at a total size of RMB1.5 billion with the term of 6 years. Upon the exercise period ended on 19 October 2009, 42,763,617 A shares of the Company were issued and the total number of the Company’s shares was increased from 1,308,219,178 to 1,350,982,795.
In 2020, the Company implemented equity incentive with 13,200,000 restricted shares, and the total number of shares of the Company increased from 1,350,982,795 to 1,364,182,795. For the six months ended 30 June 2021, the Company implemented equity incentive with 294,000 restricted shares, and the total number of shares of the Company increased from 1,364,182,795 to 1,364,476,795.
The Company and its subsidiaries (collectively the “Group”) are principally engaged in the production and distribution of beer products.
Subsidiaries which are included in the scope of consolidation in this period are disclosed in Note 5 and Note 6.
These financial statements have been approved for issue by the Company’s Board of Directors on 25 August 2021.
The interim financial statements are not audited.
2 SUMMARY OF SIGNIFICANT ACCOUNTING POLICIES AND ACCOUNTING ESTIMATES
The Group applied the accounting policies and accounting estimates based on its business operations characteristics, including provision of expected credit losses (“ECL”) of receivables (Note 2(9)), valuation of inventories (Note 2(10)), depreciation of fixed assets, amortisation of intangible assets and depreciation of right-of-use assets (Note 2(13),(16) and (25)), revenue recognition (Note 2(21)), etc.
The areas including significant judgments to determine the critical accounting policies of the Group are disclosed in Note 2(28).

Interim Report 2021 11
2 SUMMARY OF SIGNIFICANT ACCOUNTING POLICIES AND ACCOUNTING ESTIMATES (CONT’D)
(1) Basis of preparation
The financial statements are prepared in accordance with the Accounting Standards for Business Enterprises - Basic Standard, and the specific accounting standards and other relevant regulations issued by the Ministry of Finance on 15 February 2006 and in subsequent periods (hereafter collectively referred to as “the Accounting Standards for Business Enterprises” or “CAS”) and the disclosure requirements in the Preparation Convention of Information Disclosure by Companies Offering Securities to the Public No.15 — General Rules on Financial Reporting issued by the China Securities Regulatory Commission.
The financial statements are prepared on a going concern basis.
The new Hong Kong “Companies Ordinance” came into effect on 3 March 2014. According to the requirement of Hong Kong Companies Ordinance, there are changes to presentation and disclosures of certain information in the financial statements.
(2) Statement of compliance with the Accounting Standards for Business Enterprises
The financial statements of the Company for six months ended 30 June 2021 are in compliance with CAS, and truly and completely present the Consolidated and the Company’s financial position as at 30 June 2021 and their financial performance, cash flows and other information for the six months then ended.
(3) Accounting period
The Company’s accounting year starts on 1 January and ends on 31 December.
(4) Recording currency
The Company’s recording currency is Renminbi (RMB). The recording currency of the Company’s subsidiaries is determined based on the primary economic environment in which they operate. The recording currency of subsidiaries in Hong Kong, Macau and Vietnam is Hong Kong Dollar (HKD), Macau Pataca (MOP) and Vietnamese Dong (VND) respectively. The financial statements are presented in RMB.
(5) Business combinations
(a) Business combinations involving enterprises under common control
The consideration paid and net assets obtained by the absorbing party in a business combination are measured at the carrying amount. If the merged party was acquired by the final control party from a third party in the previous year, then the consideration was measured based on carrying amount of assets and liabilities of the merged party (including the goodwill arising from acquisition by the final control party) in the final control party’s consolidated financial statements. The difference between the carrying amount of the net assets obtained from the combination and the carrying amount of the consideration paid for the combination is treated as an adjustment to capital surplus (share premium). If the capital surplus (share premium) is not sufficient to absorb the difference, the remaining balance is adjusted against retained earnings. Costs directly attributable to the combination are included in profit or loss in the period in which they are incurred. Transaction costs associated with the issue of equity or debt securities for the business combination are included in the initially recognised amounts of the equity or debt securities.

12 Interim Report 2021
2 SUMMARY OF SIGNIFICANT ACCOUNTING POLICIES AND ACCOUNTING ESTIMATES (CONT’D)
(5) Business combinations (Cont’d)
(b) Business combinations involving enterprises not under common control
The cost of combination and identifiable net assets obtained by the acquirer in a business combination are measured at fair value at the acquisition date. Where the cost of the combination exceeds the acquirer’s interests in the fair value of the acquiree’s identifiable net assets, the difference is recognised as goodwill; where the cost of combination is lower than the acquirer’s interests in the fair value of the acquiree’s identifiable net assets, the difference is recognised in profit or loss for the current period. Costs directly attributable to the combination are included in profit or loss in the period in which they are incurred. Transaction costs associated with the issue of equity or debt securities for the business combination are included in the initially recognised amounts of the equity or debt securities.
(c) Purchase of minority equity in subsidiaries
After the acquisition of the control right over the subsidiary, the Group obtained all or part of the minority equity of the subsidiary owned by the minority shareholder of the subsidiary. In the consolidated financial statements, the assets and liabilities of the subsidiary are reflected by the amount continuously calculated from the date of purchase or combination. The capital surplus shall be adjusted according to the difference between the newly increased long-term equity investment and the net asset share of the subsidiary calculated continuously from the date of acquisition or merger based on the newly increased shareholding ratio. If the capital surplus (share premium) is not sufficient to absorb the difference, the remaining balance is adjusted against retained earnings.
(6) Preparation of consolidated financial statements
The consolidated financial statements comprise the financial statements of the Company and all of its subsidiaries.
Subsidiaries are consolidated from the date on which the Group obtains control and are de-consolidated from the date that such control ceases. For a subsidiary that is acquired in a business combination involving enterprises under common control, it is included in the consolidated financial statements from the date when it, together with the Company, comes under common control of the ultimate controlling party. The portion of the net profits realized before the combination date is presented separately in the consolidated income statement.
In preparing the consolidated financial statements, where the accounting policies and the accounting periods of the Company and subsidiaries are inconsistent, the financial statements of the subsidiaries are adjusted in accordance with the accounting policies and accounting period of the Company. For subsidiaries acquired from a business combination involving enterprises not under common control, the individual financial statements of the subsidiaries are adjusted based on the fair value of the identifiable net assets at the acquisition date.
All significant intra-group balances, transactions and unrealized profits are eliminated in the consolidated financial statements. The items which can’t be attributable to the shareholders of the Company in subsidiary’s equity, net profit or loss, and total comprehensive income of the period, are separately presented in the equity item, in net profit item and total comprehensive income item of the consolidated financial statement respectively. Elimination of intra-group unrealized profit on sale of assets by the Company to its subsidiaries should be in full of the net profit attributable to the shareholders, and elimination of intra-group unrealized profit on sale of assets by subsidiaries to the Company should be allocated between the net profit attributable to the shareholders and non-controlling interests in the ratio of their interests. Elimination of intra-group unrealized profit on sale of assets amongst the subsidiaries should be allocated between the net profit attributable to the shareholders and non-controlling interests, according to the Company’s share interest in the subsidiary of selling party.
If the Group and the Company or the subsidiaries as accounting entity are in different view in this transaction, the adjustment should be made in the Group’s view.
Interim Report 2021 13
2 SUMMARY OF SIGNIFICANT ACCOUNTING POLICIES AND ACCOUNTING ESTIMATES (CONT’D)
(7) Cash and cash equivalents
Cash and cash equivalents comprise cash on hand, deposits that can be readily drawn on demand, and short-term highly liquid investments which are readily convertible to known amounts of cash and are subject to an insignificant risk of changes in value.
(8) Foreign currency translation
(a) Foreign currency transactions
Foreign currency transactions are translated into functional currency using the exchange rates prevailing at the dates of the transactions.
At the balance sheet date, monetary items denominated in foreign currencies are translated into functional currency using the spot exchange rates on the balance sheet date. Exchange differences arising from these translations are recognised in profit or loss for the current period, except for those attributable to foreign currency borrowings that have been taken out specifically for the acquisition or construction of qualifying assets, which are capitalised as part of the cost of those assets. Non-monetary items denominated in foreign currencies that are measured at historical costs are translated at the balance sheet date using the spot exchange rates at the date of the transactions. The effect of exchange rate changes on cash is presented separately in the cash flow statement.
(b) Translation of foreign currency financial statements
The asset and liability items in the balance sheets for overseas operations are translated at the spot exchange rates on the balance sheet date. Among the shareholders’ equity items, the items other than “undistributed profits” are translated at the spot exchange rates on the transaction dates. The income and expense items in the income statements of overseas operations are translated at the spot exchange rates of the transaction dates. The differences arising from the above translation are presented separately in the shareholders’ equity. The cash flows of overseas operations are translated at the spot exchange rates on the dates of the cash flows. The effect of exchange rate changes on cash is presented separately in the cash flow statement.
(9) Financial instruments
A financial instrument is a contract that gives rise to a financial asset of one entity and a financial liability or equity instrument of another entity. When the Group becomes a party of the contract, relative financial assets or liabilities are recognised.
(a) Financial assets
(i) Classification and measurement
Based on the business mode for management of the Group and cash flow characteristics of contracts, the financial assets are classified into the following categories: (1) financial assets measured at amortised cost; (2) financial assets at fair value through other comprehensive income; (3) financial assets at fair value through profit or loss.
Financial assets are fairly valued at initial recognition. For financial assets at fair value through profit or loss, related transaction costs are recognised in profit or loss for the current period; for other financial assets, related transaction costs are recognised in the amount of initial recognition. Accounts receivable or notes receivable arising from sales of products or rendering of services (excluding or without regard to significant financing components) are initially recognised at the consideration that is entitled to be charged by the Group as expected.

14 Interim Report 2021
2 SUMMARY OF SIGNIFICANT ACCOUNTING POLICIES AND ACCOUNTING ESTIMATES (CONT’D)
(9) Financial instruments (Cont’d)
(a) Financial assets (Cont’d)
(i) Classification and measurement (Cont’d)
Debt instruments
Debt instruments held by the Group are instruments that meets the definition of financial liabilities from the perspective of the issuer, and are measured by the following three ways:
Measured at amortised cost:
The Group’s business mode of managing this type of financial assets is to collect contractual cash flows. The contractual cash flow characteristics of such financial assets are consistent with basic loan arrangement, which means the cash flow generated at certain date is only the payment for the principal and the corresponding interest based on unpaid principal. The interest income from such financial assets is recognised by effective interest method. These financial assets include cash at bank and on hand, notes receivable, accounts receivable, other receivables and debt investments. Debt investments due within one year (including one year) at the balance sheet date are listed as the current portion of non-current assets; at acquiring date, debt investments with maturities within one year (including one year) are listed as other current assets.
Measured at fair value through other comprehensive income (“FVOCI”):
The Group’s business mode of managing this type of financial assets is to collect contractual cash flows as well as capture profit by selling. The character of contractual cash flows is consist with the normal borrowing arrangement. These financial assets are measured at fair value and movements in the carrying amount are taken through other comprehensive income but the impairment loss or gain, exchange gain or loss and interest income using the effective interest rate method are recognised into current profit or loss. These financial assets are listed as other debt investment. The Group lists other debt investment due within one year (including one year) from the balance sheet date as non-current assets due within one year; as at acquiring date, other debt investments, that the due dates are within one year (including one year), are listed as other current assets.
Measured at fair value through profit or loss (“FVTPL”):
The Group lists those debt instruments that do not meet the criteria for amortised cost or FVOCI as financial assets held for trading that are measured at FVTPL. At the initial recognition, for eliminating or dramatically reducing accounting mismatch, the Group specifies parts of financial assets as those measured at fair value through current profit or loss. The Group lists those expired for more than one year from the balance sheet date and expected to be held for more than one year as other non-current financial assets.
Equity instruments
The Group recognises its equity instruments that have no control, joint control and significant influence on the fair value through profit or loss and list them as financial assets held for trading; the equity instruments that are expected to be held for more than a year from the balance sheet date are listed as other non-current financial assets.
Besides, the Group specifies certain non-tradable equity instrument investments as financial assets that are measured at fair value through other comprehensive income and presented as other equity instrument investments. The relevant dividend income of such financial assets is included in the current profit or loss.

Interim Report 2021 15
2 SUMMARY OF SIGNIFICANT ACCOUNTING POLICIES AND ACCOUNTING ESTIMATES (CONT’D)
(9) Financial instruments (Cont’d)
(a) Financial assets (Cont’d)
(ii) Impairment
In terms of financial assets measured at amortised cost and investments in debt instruments at fair value through other comprehensive income, the Group recognises their loss provision on the basis of ECL.
Considering the reasonable and supportable information that is related to past events, current situation and forecasting on future economic conditions, the Group, based on the default risk weight, calculates the probability-weighted amount of the present value of the difference between contractual cash flows receivable and cash flows expected to be received, so as to recognise the ECL.
At each balance sheet date, the Group separately calculates the ECL of financial instruments at different stage. Financial instruments whose credit risk did not increase significantly after the initial recognition belong to stage 1 and the Group calculates their loss provision based on the ECL in the next 12 months. Financial instruments whose credit risk increased significantly after the initial recognition without credit impairment yet belong to stage 2 and the Group calculates their loss provision based on the lifetime ECL. Financial instruments suffering from credit impairment since initial recognition belong to stage 3 and the Group calculates their loss provision based on the lifetime ECL.
For the financial instruments with low credit risk at the balance sheet date, the Group assumes their credit risk did not increase significantly after the initial recognition and calculates their loss provision based on the ECL in the next 12 months.
For the financial instruments at stage 1 and stage 2, and those with low credit risk, the Group calculates their interest income based on their book value before deducting provision for impairment and their effective interest rate. For the financial instruments at stage 3, the Group calculates their interest income based on their amortised cost, which is book value less the provision for impairment, and their effective interest rate.
For notes receivable, accounts receivable and contract assets formed from daily operations such as sales of goods and rendering of services, whether significant financing components exists or not, the Group calculates their loss provision based on the lifetime ECL.
When a single financial asset is unable to assess ECL at a reasonable cost, the Group classified receivables into certain groupings based on their credit risk characteristics and calculated ECL based on the grouping basis. Basis for grouping is as follows:
Bank acceptance notes Banks with low credit riskAccounts receivable DealersAccounts receivable SubsidiariesOther receivables Guarantee depositsOther receivables Receivables from subsidiariesOther receivables Receivables from other entities
For accounts receivable on the grouping basis and notes receivable formed from daily operations such as sales of goods and rendering of services, the Group calculates the ECL by referring to historical credit loss experience, considering current situation and future economic conditions, and based on the exposure at default (“EAD”) and lifetime ECL ratio. For other receivables on the grouping basis, the Group calculates the ECL by referring to historical credit loss experience, considering current situation and future economic conditions, and based on the EAD and the ECL ratio within 12 months or for the lifetime.
16 Interim Report 2021
2 SUMMARY OF SIGNIFICANT ACCOUNTING POLICIES AND ACCOUNTING ESTIMATES (CONT’D)
(9) Financial instruments (Cont’d)
(a) Financial assets (Cont’d)
(ii) Impairment (Cont’d)
The Group recognises provision for or reversal of losses in profit or loss for the current period. For debt instruments at fair value through other comprehensive income, the Group recognises impairment losses or gains into profit or loss for the current period and adjusts other comprehensive income in the meanwhile.
(iii) De-recognition of financial assets
A financial asset is derecognised when any of the below criteria is met: (1) the contractual rights to receive the cash flows from the financial asset terminate; (2) the financial asset has been transferred and the Group transfers substantially all the risks and rewards of ownership of the financial asset to the transferee; or (3) the financial asset has been transferred and the Group has not retained control of the financial asset, although the Group neither transfers nor retains substantially all the risks and rewards of ownership of the financial asset.
When the investment of other equity instruments is derecoginsed, the difference between carrying amount and the sum of the consideration received and the change of fair value accumulated in the original direct accounting of other comprehensive income shall be recognised into the retained earnings; when the recognition of other financial assets is derecoginsed, the difference between carrying amount and the sum of the consideration received and the change of fair value accumulated in the original direct accounting of other comprehensive income shall be recognised into the current profit or loss.
(b) Financial liabilities
Financial liabilities are classified into financial liabilities at amortised cost and financial liabilities that are at fair value through profit or loss at initial recognition.
Financial liabilities of the Group are mainly financial liabilities at amortised cost, including notes payable and accounts payable, other payables, borrowings, etc. These financial liabilities are recognised initially at fair value minus transaction costs incurred, and subsequently measured at amortised cost using the effective interest method. Those with maturities no more than one year are classified as current liabilities; those with maturities over one year but due within one year at the balance sheet date are classified as the current portion of non-current liabilities; others are classified as non-current liabilities.
A financial liability is derecognised or partly derecognised when the current obligation is discharged or partly discharged. The difference between the carrying amount of the derecognised part of the financial liability and the consideration paid is recognised in profit or loss.
(c) Determination of fair value of financial instruments
The fair value of a financial instrument that is traded in an active market is determined at the quoted price in the active market. The fair value of a financial instrument that is not traded in an active market is determined by using a valuation technique when it is applicable under current conditions and there are enough available data and other information to support. Those inputs should be consistent with the inputs a market participant would use when pricing the asset or liability, and should maximize the use of relevant observable inputs. When related observable inputs can’t be acquired or are not feasible to be acquired, then use unobservable inputs.
Interim Report 2021 17
2 SUMMARY OF SIGNIFICANT ACCOUNTING POLICIES AND ACCOUNTING ESTIMATES (CONT’D)
(10) Inventories
(a) Classification
Inventories comprise raw materials, packing materials, work in progress and finished goods, and are measured at the lower of cost and net realizable value.
(b) Cost formulas
Cost is determined using the weighted average method. The cost of finished goods and work in progress comprise raw materials, direct labour and systematically allocated production overhead based on the normal production capacity.
(c) Basis for determining net realizable values of inventories and method for making provision for decline in the value of inventories
Provision for decline in the value of inventories is determined at the excess amount of the carrying amounts of the inventories over their net realizable value. Net realizable value is determined based on the estimated selling price in the ordinary course of business, less the estimated costs to completion and estimated costs necessary to make the sale and related taxes.
(d) The Group adopts the perpetual inventory system.
(e) Amortisation methods of low value consumables and packaging materials
Low value consumables and packaging materials are written off once used and amortised based upon fractional method respectively.
(11) Long-term equity investments
Long-term equity investments is comprised of the Company’s long-term equity investments in its subsidiaries, and the Group’s long-term equity investments in its joint ventures and associates.
Subsidiaries are the investees over which the Company is able to exercise control. A joint venture is a joint arrangement which is structured through a separate vehicle over which the Group has jointly control together with other parties and has rights to the net assets of the arrangement based on legal forms, contractual terms and other facts and circumstances. An associates is the investee over which the Group has significant influence by participating in the financial and operating policy decisions.
Investments in subsidiaries are presented in the Company’s financial statements using the cost method, and are adjusted to the equity method when preparing the consolidated financial statements. Investments in joint ventures and associates are accounted for using the equity method.
(a) Determination of investment cost
For long-term equity investments acquired through a business combination: for long-term equity investments acquired through a business combination involving enterprises under common control, the investment cost shall be the absorbing party’s share of the carrying amount of shareholder’s equity of the party being absorbed at the combination date; for long-term equity investment acquired through a business combination involving enterprises not under common control, the investment cost shall be the combination cost.
For long-term equity investments acquired not through a business combination: for long-term equity investment acquired by payment in cash, the initial investment cost shall be the purchase price actually paid; for long-term equity investments acquired by issuing equity securities, the initial investment cost shall be the fair value of the equity securities issued.

18 Interim Report 2021
2 SUMMARY OF SIGNIFICANT ACCOUNTING POLICIES AND ACCOUNTING ESTIMATES (CONT’D)
(11) Long-term equity investments (Cont’d)
(b) Subsequent measurement and recognition of related profit or loss
Long-term equity investments accounted for using the cost method are measured at the initial investment costs, and cash dividends or profit distribution declared by the investees are recognised as investment income in profit or loss.
For long-term equity investments accounted for using the equity method, where the initial investment cost of a long-term equity investment exceeds the Group’s share of the fair value of the investee’s identifiable net assets at the acquisition date, the long-term equity investment is measured at the initial investment cost; where the initial investment cost is less than the Group’s share of the fair value of the investee’s identifiable net assets at the acquisition date, the difference is included in profit or loss and the cost of the long-term equity investment is adjusted upwards accordingly.
For long-term equity investments accounted for using the equity method, the Group recognises the investment income according to its share of net profit or loss of the investee. The Group discontinues recognising its share of net losses of an investee after the carrying amount of the long-term equity investment together with any long-term interests that, in substance, form part of the investor’s net investment in the investee are reduced to zero. However, if the Group has obligations for additional losses and the criteria with respect to recognition of provisions under the accounting standards in the contingencies are satisfied, the Group continues recognising the expected losses and the provisions. For changes in shareholders’ equity of the investee other than those arising from its net profit or loss, the Group records its proportionate share directly into capital surplus other comprehensive income, and profit distribution. The carrying amount of the investment is reduced by the Group’s share of the profit distribution or cash dividends declared by an investee. The unrealized profit or loss arising from the intra-group transactions amongst the Group and its investees is eliminated in proportion to the Group’s equity interests in the investees, and then based on which the investment income is recognised. For the loss on the intra-group transaction amongst the Group and its investees attributable to asset impairment, any unrealized loss is not eliminated.
(c) Basis for determining existence of control, jointly control or significant influence over investees
Control is the power to govern the financial and operating policies of the investee so as to obtain benefits from its operating activities and can influence the amount.
Joint control is the contractually agreed sharing of control over an economic activity, and exists only when the strategic financial and operating decisions relating to the activity require the unanimous consent of the parties sharing control.
Significant influence is the power to participate in the financial and operating policy decisions of the investee, but is not control or joint control over those policies.
(d) Impairment of long-term equity investments
The carrying amounts of long-term equity investments in subsidiaries, joint ventures and associates are reduced to the recoverable amounts when the recoverable amounts are below their carrying amounts (Note 2(18)).

Interim Report 2021 19
2 SUMMARY OF SIGNIFICANT ACCOUNTING POLICIES AND ACCOUNTING ESTIMATES (CONT’D)
(12) Investment properties
Investment properties are buildings that are held for the purpose of leasing, are measured at the initial cost. Subsequent expenditures incurred in relation to an investment property are included in the cost of the investment property when it is probable that the associated economic benefits will flow to the Group and their costs can be reliably measured; otherwise, the expenditures are recognised in profit or loss in the period in which they are occurred.
The Group adopts the cost model for subsequent measurement of investment properties. Land use rights are amortised on the straight-line basis over their useful period of 50 years. Buildings are depreciated to their estimated net residual values over their estimated useful lives. The estimated useful lives, the estimated net residual values that are expressed as a percentage of cost and the annual depreciation rates of investment properties are as follows:
Estimated Estimated Annual useful lives residual value depreciation rate
Buildings 20 - 40 years 3% to 5% 2.4% to 4.9%Land use rights 50 years - 2.0%
When an investment property is transferred to owner-occupied properties, it is reclassified as fixed asset at the date of the transfer. When an owner-occupied property is transferred out for earning rentals or for capital appreciation, the fixed asset is reclassified as investment properties at its carrying amount at the date of the transfer.
The investment property’s estimated useful life, net residual value and depreciation method applied are reviewed and adjusted as appropriate at each year end.
An investment property is derecognised when it is disposed or when it is permanently withdrawn from use and no future economic benefits are expected from its disposal. The net amount of proceeds from sale, transfer, retirement or damage of an investment property after its carrying amount and related taxes and expenses is recognised in profit or loss for the current period.
The carrying amount of investment properties shall be reduced to the recoverable amount if the recoverable amount is below the carrying amount (Note 2(18)).
(13) Fixed assets
(a) Recognition and initial measurement of fixed assets
Fixed assets comprise buildings, machinery and equipment, motor vehicles and other equipment.
Fixed assets are recognised when it is probable that the related economic benefits will flow to the Group and the costs can be reliably measured. Fixed assets purchased or constructed by the Group are initially measured at cost at the acquisition date. The fixed assets contributed by the State shareholders at the reorganization of the Company into a corporation entity are recognised based on the revaluated amounts approved by the state-owned assets administration department.
Subsequent expenditures incurred for a fixed asset are included in the cost of the fixed asset when it is probable that the associated economic benefits will flow to the Group and the related cost can be reliably measured. The carrying amount of the replaced part is derecognised. All the other subsequent expenditures are recognised in profit or loss in the period in which they are incurred.
20 Interim Report 2021
2 SUMMARY OF SIGNIFICANT ACCOUNTING POLICIES AND ACCOUNTING ESTIMATES (CONT’D)
(13) Fixed assets (Cont’d)
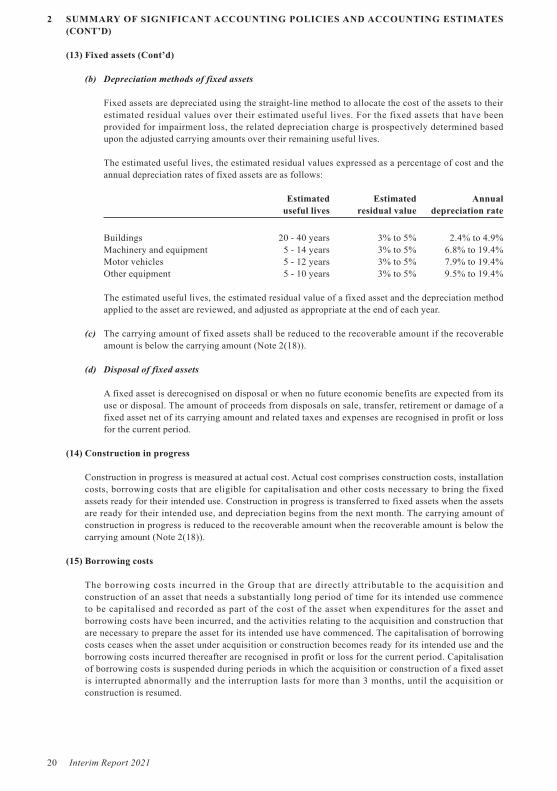
(b) Depreciation methods of fixed assets
Fixed assets are depreciated using the straight-line method to allocate the cost of the assets to their estimated residual values over their estimated useful lives. For the fixed assets that have been provided for impairment loss, the related depreciation charge is prospectively determined based upon the adjusted carrying amounts over their remaining useful lives.
The estimated useful lives, the estimated residual values expressed as a percentage of cost and the annual depreciation rates of fixed assets are as follows:
Estimated Estimated Annual useful lives residual value depreciation rate
Buildings 20 - 40 years 3% to 5% 2.4% to 4.9%Machinery and equipment 5 - 14 years 3% to 5% 6.8% to 19.4%Motor vehicles 5 - 12 years 3% to 5% 7.9% to 19.4%Other equipment 5 - 10 years 3% to 5% 9.5% to 19.4%
The estimated useful lives, the estimated residual value of a fixed asset and the depreciation method applied to the asset are reviewed, and adjusted as appropriate at the end of each year.
(c) The carrying amount of fixed assets shall be reduced to the recoverable amount if the recoverable amount is below the carrying amount (Note 2(18)).
(d) Disposal of fixed assets
A fixed asset is derecognised on disposal or when no future economic benefits are expected from its use or disposal. The amount of proceeds from disposals on sale, transfer, retirement or damage of a fixed asset net of its carrying amount and related taxes and expenses are recognised in profit or loss for the current period.
(14) Construction in progress
Construction in progress is measured at actual cost. Actual cost comprises construction costs, installation costs, borrowing costs that are eligible for capitalisation and other costs necessary to bring the fixed assets ready for their intended use. Construction in progress is transferred to fixed assets when the assets are ready for their intended use, and depreciation begins from the next month. The carrying amount of construction in progress is reduced to the recoverable amount when the recoverable amount is below the carrying amount (Note 2(18)).
(15) Borrowing costs
The borrowing costs incurred in the Group that are directly attributable to the acquisition and construction of an asset that needs a substantially long period of time for its intended use commence to be capitalised and recorded as part of the cost of the asset when expenditures for the asset and borrowing costs have been incurred, and the activities relating to the acquisition and construction that are necessary to prepare the asset for its intended use have commenced. The capitalisation of borrowing costs ceases when the asset under acquisition or construction becomes ready for its intended use and the borrowing costs incurred thereafter are recognised in profit or loss for the current period. Capitalisation of borrowing costs is suspended during periods in which the acquisition or construction of a fixed asset is interrupted abnormally and the interruption lasts for more than 3 months, until the acquisition or construction is resumed.

Interim Report 2021 21
2 SUMMARY OF SIGNIFICANT ACCOUNTING POLICIES AND ACCOUNTING ESTIMATES (CONT’D)
(15) Borrowing costs (Cont’d)
For the specific borrowings obtained for the acquisition or construction of an asset qualifying for capitalisation, the amount of borrowing costs eligible for capitalisation is determined by deducting any interests income earned from depositing the unused specific borrowings in the banks or any investment income arising on the temporary investment of those borrowings during the capitalisation period.
For the general borrowings obtained for the acquisition or construction of an asset qualifying for capitalisation, the amount of borrowing costs eligible for capitalisation is determined by applying the weighted average effective interest rate of general borrowings, to the weighted average of the excess amount of cumulative expenditures on the asset over the amount of specific borrowings. The effective interest rate is the rate at which the estimated future cash flows during the period of expected duration of the borrowings or applicable shorter period are discounted to the initial amount of the borrowings.
(16) Intangible assets
Intangible assets comprise land use rights, trademarks, marketing networks, computer software, technology known-how and others. All intangible assets are measured at cost. The intangible assets contributed by the State-owned shareholders at the time of reform of corporate system into a corporation are recognised based on the revaluated amounts approved by the state-owned assets administration department.
(a) Land use rights
Land use rights are amortised on the straight-line basis over their approved useful period from 30 to 50 years. If the acquisition costs of the land use rights and the buildings located thereon cannot be reasonably allocated between the land use rights and the buildings, all of the acquisition costs are recognised as fixed assets.
(b) Trademarks
Trademarks mainly include the “TSINGTAO BEER” trademark which was injected by the founding shareholders into the Company on 16 June 1993 as their capital contributions. The recorded value of the trademark was assessed based on the results of the valuation approved by state-owned assets administration department. Based on the forecast of beer industry and the business position of the Company, the directors are of the view that the “TSINGTAO BEER” trademark has an indefinite useful life, accordingly, it is not subject to amortisation but annual impairment assessments.
Other trademarks were acquired as a result of acquisitions of certain subsidiaries. They are amortised over their estimated useful lives ranging from 5 to 10 years.
(c) Marketing networks
Marketing networks are the distribution channel identified in the process of business combination of the Company, which are amortised over their estimated useful lives with a range of 5 - 10 years using the straight-line method.
(d) Computer software
Computer software are amortised over their estimated useful lives ranging from 5 to 10 years.
(e) Technology known-how
Technology known-how is amortised on the straight-line basis over their estimated useful lives of 10 years.
22 Interim Report 2021
2 SUMMARY OF SIGNIFICANT ACCOUNTING POLICIES AND ACCOUNTING ESTIMATES (CONT’D)
(16) Intangible assets (Cont’d)
(f) Periodical review of useful life and amortisation method
For an intangible asset with a finite useful life, review of its useful life and amortisation method is performed at each year-end, with adjustment made as appropriate.
(g) Research and development
The expenditure on an internal research and development project is classified into expenditure on the research phase and expenditure on the development phase based on its nature and whether there is material uncertainty that the research and development activities can form an intangible asset at end of the project.
Expenditure on the research phase, such as planned investigation, evaluation and selection for improvement of the beer technology, is recognised in profit or loss in the period when it is incurred. Expenditure on the development phase, such as the designing and testing for the final application of the beer technology before the large-scale production, should be capitalised only if all of the following conditions satisfied:
• The development of the beer technology has been sufficiently proved by the technical team;
• The budget relating to the beer technology improvement has been approved by the management;
• It can be demonstrated that the products due to beer technology improvement have potential market from previous marketing investigation;
• There are adequate technical and financial resources for improvement of the beer technology and the large-scale production;
• The expenditure attributable to the improvement of beer technology during its development phase can be liable measured.
Other development expenditures that do not meet the conditions above are recognised in profit or loss in the period in which they are incurred. Development costs previously recognised as expenses are not recognised as an asset in a subsequent period. Capitalised expenditure on the development phase is presented as development costs in the balance sheet and transferred to intangible assets at the date that the asset is ready for its intended use.
(h) Impairment of intangible assets
The carrying amount of intangible assets is reduced to the recoverable amount when the recoverable amount is below the carrying amount (Note 2(18)).
(17) Long-term prepaid expenses
Long-term prepaid expenses comprise the expenditure for improvements to right to use assets, and other expenditures that have been incurred but should be recognised as expenses over more than one year in the current and subsequent periods. Long-term prepaid expenses are amortised on the straight-line basis over the expected beneficial period and are presented at actual expenditure net of accumulated amortisation.

Interim Report 2021 23
2 SUMMARY OF SIGNIFICANT ACCOUNTING POLICIES AND ACCOUNTING ESTIMATES (CONT’D)
(18) Impairment of long-term assets
Fixed assets, constructions in progress, right-of-use assets, intangible assets with finite useful lives, investing properties measured at cost method and long-term equity investments in subsidiaries, joint ventures and associates are tested for impairment if there is any indication that the assets may be impaired at the balance sheet date. The intangible assets not ready for intended use yet, are treated at least annually for impairment, irrespective of whether there are any indications of impairment. If the result of the impairment test indicates that the recoverable amount of an asset is less than its carrying amount, a provision for impairment and an impairment loss are recognised for the amount by which the asset’s carrying amount exceeds its recoverable amount. The recoverable amount is the higher of an asset’s fair value less costs to sell and the present value of the future cash flows expected to be derived from the asset. Provision for asset impairment is determined and recognised on the individual asset basis. If it is not possible to estimate the recoverable amount of an individual asset, the recoverable amount of a group of assets to which the asset belongs is determined. A group of assets is the smallest group of assets that is able to generate independent cash inflows.
Goodwill separately presented in the financial statements is tested at least annually for impairment, irrespective of whether there is any indication that it may be impaired. In conducting the test, the carrying value of goodwill is allocated to the related group of assets or group of asset combinations which are expected to benefit from the synergies of the business combination. If the result of the test indicates that the recoverable amount of a group of assets or group of assets combinations, including the allocated goodwill, is lower than its carrying amount, the corresponding impairment loss is recognised. The impairment loss is first deducted from the carrying amount of goodwill that is allocated to the group of assets or group of asset combinations, and then deducted from the carrying amounts of other assets within the group of assets or groups of asset combinations in proportion to the carrying amounts of assets other than goodwill.
Once the above asset impairment loss is recognised, it will not be reversed for the value recovered in the subsequent periods.
(19) Employee benefits
Employee benefits include short-term employee benefits, post-employment benefits, termination benefits and other long-term employee benefits provided in various forms of remuneration in exchange for service rendered by employees or compensations for the termination of employment relationship.
(a) Short-term employee benefits
Short-term employee benefits include employee wages or salaries, bonus, allowances and subsidies, staff welfare, premiums or contributions on medical insurance, work injury insurance and maternity insurance, housing funds, union running costs and employee education costs. The employee benefits liabilities are recognised in the accounting period in which the service is rendered by the employees, with a corresponding charge to the profit or loss for the current period or the cost of relevant assets. Employee benefits which are non-monetary benefits are measured at fair value.
(b) Post-employment benefits
The Group classifies post-employment benefit plans as either defined contribution plans or defined benefit plans. Defined contribution plans are post-employment benefit plan under which the Group pays fixed contributions into a separate fund and will have no obligation to pay further contributions; and defined benefit plans are post-employment benefit plan that are not defined contribution plan. During the reporting period, the defined contribution plans of the Group include the basic pension and unemployment insurance paid for employees.
The employees of the Group participated in the basic pension and unemployment insurance organized and implemented by the local labour and social security departments. If the employees leave the plans prior to vesting fully in such contributions, the Group has no right to utilise such contributions under the post-employment benefit plan to reduce the existing level of contributions.
24 Interim Report 2021
2 SUMMARY OF SIGNIFICANT ACCOUNTING POLICIES AND ACCOUNTING ESTIMATES (CONT’D)
(19) Employee benefits (Cont’d)
(b) Post-employment benefits (Cont’d)
Basic pension insurance
The Group pays the basic social pension insurance to related local agencies monthly, following the demanding proportion and base. When the employees retire, the local labour and social security departments have obligations to pay the entire basic social pension. When an employee has rendered service to the Group during the accounting period, the Group should recognise liabilities and costs of assets or expenses.
Supplemental post-employment benefits
In addition to the basic social pension plans, the Group also provides supplementary post-employment benefits to those retired employees qualified for certain criteria. Such supplementary benefits are classified as defined benefit plans. The defined benefit obligation recognised in the balance sheet is the present value of the defined benefit obligation, net of the fair value of plan assets. The defined benefit obligation is calculated by a independently actuary using the Projected Unit Credit method and applying interest rate of government bonds that have similar currency and terms to maturity to those of the related pension obligation. The service cost and net interest income related to supplemental post-employment benefits are recognised as assets or expenses, and actuarial gains or losses arising from re-measurement of net defined benefit obligation is recognised as other comprehensive income.
(c) Termination benefits
The Group provides compensation for terminating the employment relationship with employees before the end of the employment contracts or as an offer to encourage employees to accept voluntary redundancy before the end of the employment contracts. The Group recognises a liability arising from compensation for termination of the employment relationship with employees, with a corresponding charge to profit or loss at the earlier of the following dates: 1) when the Group cannot unilaterally withdraw the offer of termination benefits because of an employment termination plan or a curtailment proposal; 2) when the Group recognises costs or expenses related to the restructuring that involves the payment of termination benefits.
Early retirement benefits
The Group offers early retirement benefits to those employees who accept early retirement arrangements. The early retirement benefits refer to the salaries and social security contributions to be paid to and for the employees who accept voluntary retirement before the normal retirement date prescribed by the State, as approved by the management. The Group pays early retirement benefits to those early retired employees from the early retirement date until normal retirement date. The Group accounts for the early retirement benefits in accordance with the treatment of termination benefits, in which the salaries and social security contributions to be paid to and for the early retired employees from the off-duty date to the normal retirement date are recognised as liabilities with a corresponding charge to the profit or loss for the current period. The differences arising from the changes in the respective actuarial assumptions of the early retirement benefits and the adjustments of benefit standards are recognised in profit or loss in the period in which they occur.
The termination benefits expected to be paid within one year since the balance sheet date are classified as current liabilities.

Interim Report 2021 25
2 SUMMARY OF SIGNIFICANT ACCOUNTING POLICIES AND ACCOUNTING ESTIMATES (CONT’D)
(20) Dividends distribution
Cash dividend is recognised as a liability for the period in which the dividend is approved by the shareholders’ meeting.
(21) Revenue recognition
Revenue is recognised by the Group based on the amount of consideration that is expected to be charged when clients obtain the control of relative goods and services.
Sale of goods
The Group manufactures and sells beer products to the regional dealers. Based on contracts, the Group delivers beer products to dealers. After the acceptance of the goods and signing of delivery lists by the dealers, the Group recognises the net amount after deducting consideration payable to the customer as revenue.
After signing contracts with dealers and receiving orders, the Group recognises the amount of contract consideration received from the dealers as contract liabilities before delivering products to dealers.
(22) Government Grants
Government grants are transfers of monetary or non-monetary assets from the government to the Group at nil consideration, including relocation compensation, refund of taxes and financial subsidies, etc.
A government grant is recognised when the conditions attached to it can be satisfied and the government grant can be received. For a government grant in the form of transfer of monetary assets, the grant is measured at the amount received or to be received. For a government grant in the form of transfer of non-monetary assets, it is measured at fair value; if the fair value is not reliably determinable, the grant is measured at nominal amount.
Government grants related to assets are those obtained for forming long-term assets by purchase, construction or acquisition in other ways. Grants related to income are government grants other than those related to assets.
The Group recognises government grants related to assets as deferred income and apportions to profit or loss in a systemic manner over the useful lives of the relevant assets.
For government grants related to income, where the grant is a compensation for related expenses or losses to be incurred in the subsequent periods, the grant is recognised as deferred income, and included in profit or loss over the periods in which the related costs are recognised; where the grant is a compensation for related expenses or losses already incurred by the Group, the grant is recognised immediately in profit or loss for the current period.
The Group presents similar types of government grants consistently in the financial statements.
Government grants that are related to daily activities are included in operating profit, otherwise, they are recorded in non-operating income.

26 Interim Report 2021
2 SUMMARY OF SIGNIFICANT ACCOUNTING POLICIES AND ACCOUNTING ESTIMATES (CONT’D)
(22) Government Grants (Cont’d)
The relocation compensations received directly from the government in terms of fiscal budget, which are due to the overall planning of the town, reservoir construction, shanty areas rebuilding, subsidence area management and other public interests, are recognised as payables for specific projects. The payables for specific projects, which attributes to the compensations for the losses on disposal of fixed assets and intangible assets, the expensed expenditure, the downtime losses and the new purchased and constructed assets after the relocation, in the process of the relocation and rebuilding, are transferred to deferred income and accounted for in accordance with the regulation of government grant. The excess of relocation compensation over the amount transferred to deferred income is recognised as capital surplus.
For the policy loans with favourable interest rate, the Group records the loans at the actual amounts and calculates the interests by loan principals and the favourable interest rate. The fiscal interest discounts directly received by the Group offset the relevant borrowing costs.
(23) Deferred tax assets and deferred tax liabilities
Deferred tax assets and deferred tax liabilities are calculated and recognised based on the differences arising between the tax bases of assets and liabilities and their carrying amounts (temporary differences). Deferred tax asset is recognised for the deductible losses that can be carried forward to subsequent years for deduction of the taxable profit in accordance with the tax laws. No deferred tax liability is recognised for a temporary difference arising from the initial recognition of goodwill. No deferred tax asset or deferred tax liability is recognised for the temporary differences resulting from the initial recognition of assets or liabilities due to a transaction other than a business combination, which affects neither accounting profit nor taxable profit (or deductible loss). At the balance sheet date, deferred tax assets and deferred tax liabilities are measured at the tax rates that are expected to apply to the period when the asset is realized or the liability is settled.
Deferred tax assets are only recognised for deductible temporary differences, deductible losses and tax credits to the extent that it is probable that taxable profit will be available in the future against which the deductible temporary differences, deductible losses and tax credits can be utilized.
Deferred tax liabilities are recognised for temporary differences arising from investments in subsidiaries, associates and joint ventures, except where the Group is able to control the timing of reversal of the temporary difference, and it is probable that the temporary difference will not reverse in the foreseeable future. When it is probable that the temporary differences arising from investments in subsidiaries, associates and joint ventures will be reversed in the foreseeable future and that the taxable profit will be available in the future against which the temporary differences can be utilized, the corresponding deferred tax assets are recognised.
Deferred tax assets and liabilities are offset when:
• the deferred taxes are related to the same tax payer within the Group and the same taxation authority; and
• tax payer within the Group has a legally enforceable right to offset current tax assets against current tax liabilities.

Interim Report 2021 27
2 SUMMARY OF SIGNIFICANT ACCOUNTING POLICIES AND ACCOUNTING ESTIMATES (CONT’D)
(24) Share-based payment
The restricted share incentive plan of the Group refers to share-based payment which settled with the equity instruments of the Company granted by the Group as consideration to relevant incentive participants.
For equity-settled share-based payment transactions, the Group shall measure the services received, and the corresponding increase in equity directly, at the fair value of the services received. If the equity instruments granted vest immediately, it shall be measured at fair value through current profit or loss on grant date, with a corresponding increase in capital surplus; If the equity instruments granted do not vest until the counterparty meets specified service or performance conditions, on each balance sheet date of the vesting period, the Group makes the best estimate based on the latest information of the number of employees available for exercise, or the achievement of performance conditions. On this basis, according to the fair value of equity instrument on grant date, the Group shall recognise the services to be rendered by the counterparty in current profit or loss based on the most likely outcome of exercisable equity instrument during the vesting period, with a corresponding confirmation of capital surplus.
The Group will not recognise the cost or expense for share-based payments that fail to meet the viable conditions ultimately, unless the vesting conditions are market conditions or non-viable conditions. No matter whether the market conditions or non-viable conditions are met, as long as meeting all of the non-market conditions, it will be regarded as exercisable.
If the fair value of the equity instruments granted increase after the Group modifies the terms of the share-based payment plan, the Group shall recognise the increase of services obtained according to the difference between the fair value of the equity instruments before and after the modification. If the Group cancels the granted equity instrument, it will be treated as accelerated exercise on the cancellation date, and the amount that should have been recognised during the remaining vesting period will be immediately included in the current profit or loss, and the capital surplus will be recognised accordingly.
If the Group needs to repurchase the restricted shares that failed to be unlocked and invalid at the pre agreed repurchase price, the Group shall recognise the liabilities and treasury stocks according to the number of restricted shares and the corresponding repurchase price.
(25) Leases
Leases is a contract in which the lessor transfers the use rights of assets to the lessee to obtain consideration for a certain period.
The Group as a lessee
The Group recognises the right-of-use assets at the starting date of the lease term, and recognises the lease liabilities at the present value of the outstanding lease payment. Lease payment include fixed payments and payments to be made if it is reasonably certain that the option to purchase or terminate will be exercised. The variable rent determined according to a certain proportion of sale shall be recognised in profit or loss instead of being included in the lease payment when actually incurred. The Group lists the lease liabilities paid within one year (including one year) from the balance sheet date as current portion of non-current liabilities.

28 Interim Report 2021
2 SUMMARY OF SIGNIFICANT ACCOUNTING POLICIES AND ACCOUNTING ESTIMATES (CONT’D)
(25) Leases (Cont’d)
The Group as a lessee (Cont’d)
The Group’s right-of-use assets include leased buildings, land use rights, machinery and equipment, management tools, etc. The right-of-use asset is initially measured according to the cost, which includes the initial measurement amount of the lease liability, the lease payment paid on or before the starting date of the lease term, the initial direct expense, etc., and deducts the lease incentive received. When the Group can reasonably determine the ownership of the leased asset upon expiration of the lease term, depreciation is recognised within the remaining useful life of the leased asset. If it is impossible to reasonably determine whether the ownership of the leased asset can be acquired at the end of the lease term, the depreciation is calculated within the shorter period between the lease term and the remaining useful life of the leased asset. When the recoverable amount is lower than the book value of the right-of-use assets, the Group writes down the book value to the recoverable amount.
For short-term leases, whose lease period is no more than 12 months, and low-value asset leases, which the value of brand-new individual asset is low, the Group chooses not to recognise the right-of-use assets or lease liabilities. The relevant rent expenses are recognised into the current profit or loss or the cost of relevant assets by straight-line method during each period of the lease term.
The Group shall treat the lease as a separate item, when the lease is changed and meets the following conditions: (1) The scope of leasing is expanded by adding the right to use one or more leased assets; (2) the increased consideration is equivalent to the amount of the separate price of the extended lease scope according to the contract.
The Group re-determines the lease term on the effective date of the lease change, uses the revised discount rate to discount the lease payment after the change, and remeasures the lease liabilities when the change is not accounted for as a separate lease. Unless the contract changes directly caused by the new pneumonia epidemic situation, the simplified method shall be adopted. If the change causes the scope of the lease to be narrowed or the term of the lease to be shortened, the Group will correspondingly reduce the book value of the right-of-use asset, and the relevant gains or losses from the partial or complete termination of the lease shall be included in the current profit or loss. If other changes cause the lease liabilities be remeasured, the Group adjusts the book value of the right-of-use asset accordingly.
For the rent reduction before 30 June 2021 that related to new pneumonia epidemic situation, the Group adopts the simplified method. The undiscounted amount of deduction shall be included in the current profit or loss when an agreement is reached to relieve the original payment obligation, and the lease liability shall be adjusted accordingly (Note 4(13)).
The Group as the lessor
A financial lease is a lease that substantially transfers almost all the risks and rewards related to the ownership of an asset. An operating lease is a lease other than a financial lease.
When the Group operatingly lease out self-owned buildings machinery equipments and land use rights, the rental income from the operating lease shall be recognised in accordance with the straight-line basis over the lease period. The Group will include variable rents determined based on a certain percentage of sales into rental income when they actually occur.
When a lease is changed, the Group regards it as a new lease from the effective date of the change, and treats the amount of advance or receivable lease payments related to the lease before the change as the amount of the new lease.

Interim Report 2021 29
2 SUMMARY OF SIGNIFICANT ACCOUNTING POLICIES AND ACCOUNTING ESTIMATES (CONT’D)
(26) Held for sale and discontinued operations
A non-current asset or a disposal group is classified as held for sale when all of the following conditions are satisfied: (1) the non-current asset or the disposal group is available for immediate sale in its present condition subject only to terms that are usual and customary for sales of such non-current asset or disposal group; (2) the Group has entered a legally enforceable sales agreement with other party and obtained relevant approval, and the sales transaction is expected to be completed within one year.
Non-current assets (except for financial assets and deferred tax assets) that meet the recognition criteria for held for sale are recognised at the amount equal to the lower of the fair value less costs to sell and the carrying amount. Any excess of the original carrying amount over the fair value less the costs to sell is recognised as asset impairment losses.
Such non-current assets and assets/liabilities included in disposal groups as classified as held for sale are accounted for as current assets/liabilities, and are presented separately in the balance sheet.
A discontinued operation is a component of the Group that either has been disposed of or is classified as held for sale, and is separately identifiable operationally and for financial reporting purposes, and satisfies one of the following conditions: (1) represents a separate major line of business or geographical area of operations; (2) is part of a single co-ordinated plan to dispose of a separate major line of business or geographical area of operations; and (3) is a subsidiary acquired exclusively with a view to resale.
The net profit from discontinued operations in the income statement includes operating profit or loss and disposal gains or losses of discontinued operations.
(27) Segment information
The Group identifies operating segments based on the internal organization structure, management requirements and internal reporting system, and discloses segment information of reportable segments which is determined on the basis of operating segments.
An operating segment is a component of the Group that satisfies all of the following conditions: (1) the component is able to generate revenues and incur expenses from its ordinary activities; (2) whose operating results are regularly reviewed by the Group’s management to make decisions about resources to be allocated to the segment and to assess its performance; and (3) for which the information on financial position, operating results and cash flows is available to the Group. If two or more operating segments have similar economic characteristics and satisfy certain conditions, they are aggregated into one single operating segment.
(28) Critical accounting estimates and judgments
The Group continually evaluates the critical accounting estimates and key judgments applied based on historical experience and other factors, including expectations of future events that are believed to be reasonable.
(a) Critical accounting estimates and key assumptions
The critical accounting estimates and key assumptions that have a significant risk of causing a material adjustment to the carrying amounts of assets and liabilities within the next accounting year are outlined below:

30 Interim Report 2021
2 SUMMARY OF SIGNIFICANT ACCOUNTING POLICIES AND ACCOUNTING ESTIMATES (CONT’D)
(28) Critical accounting estimates and judgments (Cont’d)
(a) Critical accounting estimates and key assumptions (Cont’d)
(i) Accounting estimates on impairment of goodwill
The Group tests annually whether goodwill has suffered any impairment. The recoverable amount of asset groups and groups of asset groups is the present value of the future cash flows expected to be derived from them. These calculations require use of estimates (Note 4(15)).
If management revises the sustainable growth rate, the gross margin or the pre-tax discount rate that is used in the calculation of the future cash flows of asset groups and groups of asset groups, and the revised gross margin is lower than the one currently used or the revised pre-tax discount rate is higher than the one currently applied, the Group would need to recognise further impairment against goodwill. If the actual gross margin is higher or pre-tax discount rate is lower than management’s estimates, the Group shall not reverse the impairment loss of goodwill previously.
(ii) Accounting estimates on impairment of fixed assets
According to the accounting policies stated in Note 2(18), the Group tests whether fixed assets have suffered any impairment on the balance sheet date. The recoverable amounts of the fixed assets have been determined based present value of the expected future cash flow to sell. These calculations require the use of accounting estimates.
For the six months ended 30 June 2021, the Group recognised impairment losses of 5,826 (For six months ended 30 June 2020: 1,538,581) for fixed assets based on such evaluation. As at 30 June 2021, the Group recognised the cumulative provision for fixed assets impairment amounting to 509,115,044 (31 December 2020: 527,812,271) (Note 4(11)).
If management revises the gross margin or the pre-tax discount rate that is used in the calculation of the future cash flows of asset groups and groups of asset groups, and the revised gross margin is lower than the one currently used or the revised pre-tax discount rate is higher than the one currently applied, the Group would need to recognise further impairment against fixed assets. If the actual gross margin is higher or pre-tax discount rate is lower than management’s estimates, the Group shall not reverse the impairment loss of fixed assets previously.
(iii) Accounting estimates on recognition of deferred tax assets
The estimates of deferred tax assets require estimates over future taxable profit and corresponding applicable income tax rates of respective years. The realization of deferred tax assets depends on the realization of sufficient profitability (taxable profit) of the Group. The change in future income tax rates and timing of reversals of taxable temporary differences would affect income tax expenses (benefits) and balances of deferred tax. Deviation of aforesaid estimates could result in material adjustment to the carrying amount of deferred income tax.
As at 30 June 2021, deferred tax assets of 2,009,158,442 have been recognised in the Group’s balance sheet. As stated in Note 4(17), the Group has unrecognised deferred tax assets aggregated to approximately 927,489,000 as at 30 June 2021, which is mainly attributable to the accumulated losses can be deducted from taxable income in the next five years according to the tax law of certain subsidiaries and the deductible temporary differences of these subsidiaries. These subsidiaries have unrecognised deferred tax assets for such deductible losses and deductible temporary differences due to the fact that there is no certainty of obtaining approval from local tax authorities or there is no certainty of their respective realization of these tax benefits through available future taxable profits of those subsidiaries concerned. In cases where the actual future taxable income is more or less than expected or approval from local tax authorities are obtained, a recognition or reversal of deferred tax assets may arise accordingly.

Interim Report 2021 31
2 SUMMARY OF SIGNIFICANT ACCOUNTING POLICIES AND ACCOUNTING ESTIMATES (CONT’D)
(28) Critical accounting estimates and judgments (Cont’d)
(a) Critical accounting estimates and key assumptions (Cont’d)
(iv) Post-retirement benefits Actuary
As stated in Note 2(19)(b), the present value of the post-retirement obligation estimated on an actuarial basis using a number of assumptions. The actuarial valuations, in which discount rate was determined by government bonds of China and the mortality rate was based on published statistics by China Life Annuitant Mortality Table 2010 - 2013, are the best estimation on the post-retirement obligation on balance sheet date. Any changes in these assumptions will have impact on the carrying amount of post-employment obligations, which will be recognised as other comprehensive income in the future.
(v) Measurement of ECL
The Group calculates the ECL through the default risk exposure and the ECL rate, and determines the ECL rate based on the probability of default and the default loss rate. When determining the ECL rate, the Group uses data such as internal historical credit loss experience and adjusts historical data in combination with current conditions and forward-looking information.
In considering forward-looking information, the Group considered various macroeconomic scenarios. The Group regularly monitors and reviews assumptions related to the calculation of ECL, including the risk of economic downturn, changes in the external market environment, changes in customer conditions, GDP, CPI, etc. The above estimation techniques and key assumptions have not changed significantly for the six months ended 30 June 2021.
3 TAXATION
(1) The main categories and rates of taxes applicable to the Group are set out below:
Category Tax base Tax rate
Enterprise income tax(a) Taxable income 3%-12%, 16.5%, 20% and 25%
Value added tax Taxable value added amount (Tax payable is calculated by 13%, 9%, (“VAT”)(b) multiplying taxable sales by the applicable tax rate and 6% and 3% deducting deductible VAT input of current period or by as levy rate multiplying the taxable sales by the applicable levy rate)
Consumption tax Sales Price of Beer Consumption Tax per Unit
More than or equal to RMB250 per ton RMB3,000 per ton Less than RMB3,000 per ton RMB220 per ton
City maintenance and Amount of VAT and consumption tax paid 5% and 7% construction tax
Education surcharge Amount of VAT and consumption tax paid 5%

32 Interim Report 2021
3 TAXATION (CONT’D)
(1) The main categories and rates of taxes applicable to the Group are set out below: (Cont’d)
(a) Enterprise income tax
(i) Hong Kong profits tax, Macau profits supplemental tax and Vietnam corporate income tax
Tsingtao Brewery Hong Kong Trading Co., Ltd. (“Hong Kong Company”) and Asia Brewery (Macau) Co., Ltd. (“Macau Company”) and Tsingtao Brewery Vietnam Co., Ltd. (“Vietnam Company”), the Company’s subsidiaries, were established in Hong Kong, Macau and Vietnam, applying Hong Kong profits tax, Macau profits supplemental tax and Vietnam enterprise income tax respectively.
Hong Kong profits tax has been provided at the rate of 16.5% on the estimated taxable income for the year. Macau profits supplemental tax is imposed on the estimated taxable profit for the year at a progressive rate scale ranging from 3% to 12%. Vietnam enterprise income tax is calculated and paid at a tax rate of 20% based on the estimated taxable income for the year
(ii) Pursuant to the Circular on the Deduction Policies of Relevant Enterprise Income Tax for Equipment and Apparatus (Cai Shui [2018] No. 54) and related regulations issued by the State Administration of Taxation, during the period from 1 January 2018 to 31 December 2020, the newly purchased equipment under RMB5 million can be recognised in cost and expense of the current period in the month after the assets are put into use, and can be deducted when calculating the taxable income. Pursuant to the Circular on the Announcement on Extending the Implementation Period of Certain Preferential Policies (Caishui [2021] No. 6) and related regulations issued by the State Administration of Taxation, the implementation period of the above-mentioned preferential policies is extended to 31 December 2023.
(b) VAT
Before 1 April 2019, the Group calculates the output VAT at the VAT rate of 16% of the sales revenue of beer and other products. The applicable VAT rates for the financial business income of Tsingtao Beer Finance Co., Ltd. (“Finance Company”) and the engineering business income of Tsingtao Beer Engineering Co., Ltd. (“Engineering Company”) are 6% and 10% respectively. Input VAT paid for the purchase of goods, machinery and equipment for production or taxable services can be deducted from output VAT. The amount of VAT payable is the balance of the current output tax less the deductible input tax.
According to the announcement on deepening the reform of value-added tax (announcement of the General Administration of Taxation of the Ministry of finance [2019] No. 39) and relevant regulations issued by the Ministry of finance, the State Administration of Taxation and the General Administration of customs, the tax rates of the Group originally applicable to the business of 16% and 10% were adjusted to 13% and 9% respectively from 1 April 2019. From 1 November 2018, the tax refund rate of the Group’s export products was changed to 16%, and from 1 April 2019 adjusted to 13%.
(c) Withholding Tax
According to Circular Guoshuihan [2008] No. 897 “Notice on the issue about withholding Enterprise Income Tax on the dividends paid by Chinese resident enterprises to overseas non-resident enterprises H-share holders” issued by State Administration of Taxation on 6 November 2008, a Chinese resident enterprise shall withhold the enterprise income tax on the basis of 10% of the dividends, when it pays dividends to its H-share holders who are overseas non-resident enterprises.

Interim Report 2021 33
4 NOTES TO THE CONSOLIDATED FINANCIAL STATEMENTS
(1) Cash at bank and on hand
30 June 31 December 2021 2020 (unaudited)
Cash on hand 241,528 252,872Bank deposits 1,327,072,651 2,894,339,144Interbank deposits(i) 7,041,028,618 14,886,572,984Deposit in central bank(ii) 921,024,730 649,651,954Other cash balances(iii) 32,985,863 36,063,654
9,322,353,390 18,466,880,608
Including: cash at bank and on hand overseas(iv) 101,699,078 87,369,362
(i) Interbank deposits represent bank deposits and its interest receivable deposited in domestic banks by Finance Company.
(ii) Deposits in central bank represent statutory deposit and its interest receivable deposited in the People’s Bank of China by Finance Company, a subsidiary of the Company. As at 30 June 2021, the statutory deposit reserves ratio of Finance Company is 6% (31 December 2020: 6%).
(iii) As at 30 June 2021, other cash balances of 32,766,553 (31 December 2020: 32,664,482) represent housing maintenance fund in the bank; the Group has no pledge as collateral for issuance of bank acceptance (31 December 2020: 3,180,000)(Note 4(21)); the remaining balances are other deposits of 219,310 (31 December 2020: 219,172).
(iv) As at 30 June 2021, cash at bank and on hand overseas represents the cash, bank deposits and its interest receivable of Hong Kong Company, Macau Company and Vietnam Company held in Hong Kong, Macau and Vietnam respectively.
Cash and cash equivalents presented in cash flow statements:
30 June 31 December 2021 2020 (unaudited)
Cash at bank and on hand 9,322,353,390 18,466,880,608Other receivables — deposit in non-financial institutions 3,124,049 1,565,622Less: Restricted deposit in central bank (921,024,730) (649,651,954)
Restricted deposit in bank (1,400,000,000) -Restricted other cash balances (32,985,863) (36,063,654)Interest receivable on deposits (124,751,180) (139,607,198)
6,846,715,666 17,643,123,424

34 Interim Report 2021
4 NOTES TO THE CONSOLIDATED FINANCIAL STATEMENTS (CONT’D)
(2) Financial assets held for trading
30 June 31 December 2021 2020 (unaudited)
Debt instruments(i) 9,177,366,562 1,888,862,835
(i) It represents the debt instruments purchased by the Group. As at 30 June 2021, the fair value is measured based on the estimation of the future cash flow.
(3) Notes receivable
30 June 31 December 2021 2020 (unaudited)
Bank acceptance notes 14,103,629 5,648,580
(a) As at 30 June 2021, the Group has no pledged notes receivable(31 December 2020: nil).
(b) As at 30 June 2021, the Group’s notes receivable which have been endorsed but not yet matured are derecognised amounting to 144,570,448 (31 December 2020: 119,095,996). There are no discounted bank acceptance notes that are not yet matured (31 December 2020: nil).
(c) Provision for bad debts
For notes receivable, irrespective of whether there is significant financing component, the Group measures loss provision according to the ECL of the lifetime.
As at 30 June 2021, the Group considers the bank acceptance notes held have no significant credit risk and will not cause major losses due to the bank default, thus no provision for bad debts is recognised.
(4) Accounts receivable
30 June 31 December 2021 2020 (unaudited)
Accounts receivable 378,594,576 302,944,075Less: Provision for bad debts (181,327,641) (183,437,647)
197,266,935 119,506,428
The majority of the Group’s domestic sales are made by advances from customers. The remains are settled by letters of credit, bank acceptance notes or providing credit terms from 30 to 100 days to dealers.

Interim Report 2021 35
4 NOTES TO THE CONSOLIDATED FINANCIAL STATEMENTS (CONT’D)
(4) Accounts receivable (Cont’d)
(a) The ageing of accounts receivable based on their recording dates is analysed below:
30 June 31 December 2021 2020 (unaudited)
Within 1 year 197,260,750 119,520,0591 to 2 years 18,498 12,1342 to 3 years - 1,6103 to 4 years 65,926 197,4404 to 5 years - 6,946Over 5 years 181,249,402 183,205,886
378,594,576 302,944,075
Accounts receivable are mainly recorded based on the dates of transaction. The ageing of accounts receivable represented on their recording dates is basically the same as the ageing represented on the dates of invoice.
(b) As at 30 June 2021, the top five accounts receivable are analysed as follows:
Provision of % of total Amount bad debts balance (unaudited) (unaudited)
Total amount of the top five accounts receivable 104,983,299 (14,996,236) 28%
(c) As at 30 June 2021, there are no accounts receivable derecognised due to the transfer of financial assets(31 December 2020: nil).
(d) Provision for bad debts
For accounts receivable, irrespective of whether there is significant financing component, the Group measures loss provision according to the ECL of the lifetime.
(i) As at 30 June 2021, accounts receivable with amounts that are individually subject to separate assessment for provision are analysed as follows:
Ending Lifetime Provision for balance ECL ratio bad debts (unaudited) (unaudited)
Gansu Nongken Brewery Co., Ltd. 14,996,236 100% (14,996,236)Beijing Tsingtao Brewery Sales Co., Ltd. (“Beijing Sales Company”) 11,245,784 100% (11,245,784)
26,242,020 (26,242,020)
As the Group has ceased all business transactions with the above companies, the Group is of the view that it is difficult to collect the receivable amount, therefore full bad debt provision has been made accordingly.

36 Interim Report 2021
4 NOTES TO THE CONSOLIDATED FINANCIAL STATEMENTS (CONT’D)
(4) Accounts receivable (Cont’d)
(d) Provision for bad debts (Cont’d)
(ii) As at 30 June 2021, accounts receivable that are subject to provision for bad debts on the grouping basis are analysed as follows:
Group — Dealers
30 June 2021(unaudited) 31 December 2020
Ending Ending balance Provision for bad debts balance Provision for bad debts
Lifetime Lifetime Amount ECL ratio Amount Amount ECL ratio Amount
Not overdue 197,199,476 - - 119,126,094 - -Overdue within 1 year 61,274 5% (3,064) 393,965 5% (19,698)Overdue within 1 -2 years 18,498 50% (9,249) 12,134 50% (6,067)Overdue 2 years or more 155,073,308 100% (155,073,308) 157,169,862 100% (157,169,862)
352,352,556 (155,085,621) 276,702,055 (157,195,627)
(iii) The provision for bad debts increased in this period is 27,990. The collecting or reversal of provisions for bad debts is 316,719, the corresponding carrying amount is 634,370, the amount of bad debts due to currency translation differences decreases by 72, and the provision for bad debts written off due to uncollectable beer sales is 1,821,205.
(5) Advances to suppliers
(a) The ageing of advances to suppliers is analysed as follows:
30 June 2021 (unaudited) 31 December 2020
% of total % of total Amount balance Amount balance
Within 1 year 175,635,144 89.1% 212,636,365 88.6%1 to 2 years 16,549,860 8.4% 22,917,470 9.6%2 to 3 years 750,501 0.4% 2,278,819 0.9%Over 3 years 4,154,577 2.1% 2,051,682 0.9%
197,090,082 100% 239,884,336 100%
As at 30 June 2021, the carrying amount of advances to suppliers over 1 year is 21,454,938 (As at 31 December 2020: 27,247,971), which have not been delivered yet due to production plan and other reason.
(b) As at 30 June 2021, the total amount of top five advances to suppliers are analysed as follows:
% of total Amount balance (unaudited)
Total amount of the top five advances to suppliers 111,249,731 56%

Interim Report 2021 37
4 NOTES TO THE CONSOLIDATED FINANCIAL STATEMENTS (CONT’D)
(6) Other receivables
30 June 31 December 2021 2020 (unaudited)
Guarantee deposits 36,231,749 30,663,930Receivables of refundable cost of land and building 17,441,647 17,441,647Dividends receivable(Note 4(9)) 12,379,306 -Reservation fund 11,262,615 10,331,110Receivables on construction and equipment(i) 9,054,157 615,830Payment on behalf for recycling bottles 5,290,571 2,141,753VAT refund 2,477,398 1,555,693Others 100,830,338 79,149,784
194,967,781 141,899,747
Less: Provision for bad debts (66,295,309) (68,006,160)
128,672,472 73,893,587
(i) It represents receivables on construction and equipment business due from third parties to the Company, which is Tsingtao Brewery Equipment Manufacturing Co., Ltd. (“Equipment Manufacturing Company”).
(a) The ageing of other receivables is analysed as follows:
30 June 31 December 2021 2020 (unaudited)
Not overdue 126,927,067 72,565,244Overdue within 1 year 1,649,762 1,194,100Overdue within 1 - 2 years 356,263 395,115Overdue 2 years or more 66,034,689 67,745,288
194,967,781 141,899,747

38 Interim Report 2021
4 NOTES TO THE CONSOLIDATED FINANCIAL STATEMENTS (CONT’D)
(6) Other receivables (Cont’d)
(b) Movement in provision for losses and carrying amount
Stage one (unaudited) Stage three (unaudited)
Lifetime ECL Next 12 months (Credit impairment losses Total ECL (Group) already occurred) (unaudited)
Ending Provision for Ending Provision for Provision for balance bad debts balance bad debts bad debts
31 December 2020 1,589,215 (260,872) 67,745,288 (67,745,288) (68,006,160)Increase in the current period 703,294 (37,393) - (15,210) (52,603)Reversals in the current period (256,064) 22,435 (114,561) 114,561 136,996Written off in the current period - - (1,626,458) 1,626,458 1,626,458Transfer to stage three (30,420) 15,210 30,420 (15,210) -
30 June 2021 2,006,025 (260,620) 66,034,689 (66,034,689) (66,295,309)
As at 30 June 2021, the Group has no other receivables in stage two. The analysis of other receivables in stage one and stage three is as follows:
(i) As at 30 June 2021, other receivables with amounts that are individually subject to separate assessment for provision are analysed as follows:
ECL ratio Ending for the next Provision for Stage three balance 12 months bad debts Reason (unaudited) (unaudited)
Receivables of refundable cost ofland use rights and building 17,441,647 100% (17,441,647) i)Receivables from other entities 48,593,042 100% (48,593,042) ii)
66,034,689 (66,034,689)
i) A land use right of the Company was expropriated by the government years ago. The government committed rendering another new land use right instead. The management considers that the possibility of obtaining new land use right is low, and therefore has transferred the cost of the expropriated land use right of 8,584,437 and cost of buildings on this land of 8,857,210 to other receivables, and full bad debt provision has been recorded accordingly.
ii) As these other receivables that are overdue 2 years or more, the Group judged that credit impairment losses had already occurred and full amount provision for bad debts had been recognised.

Interim Report 2021 39
4 NOTES TO THE CONSOLIDATED FINANCIAL STATEMENTS (CONT’D)
(6) Other receivables (Cont’d)
(b) Movement in provision for losses and carrying amount (Cont’d)
(ii) As at 30 June 2021 and 31 December 2020, other receivables of provisions for bad debts on grouping basis are in stage one, and the analysis is as follows:
30 June 2021 (unaudited) 31 December 2020
Ending Ending balance Provision for bad debts balance Provision for bad debts
% of total Provision for % of total Amount Amount balance bad debts Amount balance
Guarantee deposits 814,588 (163,129) 5% - 50% 482,989 (146,995) 5% - 50%Receivables from other entities 1,191,437 (97,491) 5% - 50% 1,106,226 (113,877) 5% - 50%
2,006,025 (260,620) 1,589,215 (260,872)
By referring to historical credit loss experience, the Group recognised provision for bad debts based on current conditions and forecasts of future economic situation.
(c) The provision for bad debts increased in the current period is 52,603. The collecting or reversal of provision for bad debts is 136,996, and its corresponding carrying amount is 370,625. No other reveivables was written off in the current period.
(d) The book balance and bad debt provision of other receivables actually written off in the current period were 1,626,458.
(e) As at 30 June 2021, the top five other receivables are analysed as follows:
% of total Provision for Nature Amount Ageing balance bad debts (unaudited) (unaudited)
No.1 Dividends receivable 12,379,306 Within six months 6% -No.2 Refundable cost of land 8,584,437 More than five years 4% (8,584,437)No.3 Payment on behalf of others 5,185,400 Within six months 3% -No.4 Receivables on materials 5,000,000 More than five years 3% (5,000,000)No.5 Receivables on materials 4,616,730 More than five years 2% (4,616,730)
35,765,873 18% (18,201,167)
(f) As at 30 June 2021, the Group does not have government grants recognised as receivable amount.

40 Interim Report 2021
4 NOTES TO THE CONSOLIDATED FINANCIAL STATEMENTS (CONT’D)
(7) Inventories
(a) Classification of inventories is as follows:
30 June 2021 (unaudited) 31 December 2020
Ending Carrying Ending Carrying balance Provision amount balance Provision amount
Raw materials 533,841,394 (959,617) 532,881,777 563,890,545 (968,968) 562,921,577Packaging materials 732,208,864 (2,517,462) 729,691,402 946,154,798 (2,517,462) 943,637,336Low-value consumables 86,881,252 - 86,881,252 74,320,823 - 74,320,823Work in process - outsourced 9,689,279 - 9,689,279 5,922,378 - 5,922,378Work in progress 393,319,687 - 393,319,687 425,004,935 - 425,004,935Finished goods 461,177,574 - 461,177,574 1,269,226,477 - 1,269,226,477
2,217,118,050 (3,477,079) 2,213,640,971 3,284,519,956 (3,486,430) 3,281,033,526
(b) The movements of inventories is as follows:
30 June 2021
Increase in Decrease in 31 December the current the current 30 June 2020 period period 2021 (unaudited) (unaudited) (unaudited)
Raw materials 563,890,545 2,324,871,337 (2,354,920,488) 533,841,394Packaging materials 946,154,798 4,577,651,393 (4,791,597,327) 732,208,864Low-value consumables 74,320,823 249,498,741 (236,938,312) 86,881,252Work in process - outsourced 5,922,378 74,575,448 (70,808,547) 9,689,279Work in progress 425,004,935 2,960,375,623 (2,992,060,871) 393,319,687Finished goods 1,269,226,477 9,291,070,168 (10,099,119,071) 461,177,574
3,284,519,956 2,217,118,050
31 December 2020
Increase in Decrease in 31 December the current the current 31 December 2019 year year 2020
Raw materials 557,229,799 4,145,708,104 (4,139,047,358) 563,890,545Packaging materials 878,527,021 8,045,479,533 (7,977,851,756) 946,154,798Low-value consumables 61,236,850 533,927,096 (520,843,123) 74,320,823Work in process - outsourced - 171,063,443 (165,141,065) 5,922,378Work in progress 407,440,587 4,878,363,825 (4,860,799,477) 425,004,935Finished goods 1,280,873,778 16,350,873,997 (16,362,521,298) 1,269,226,477
3,185,308,035 3,284,519,956
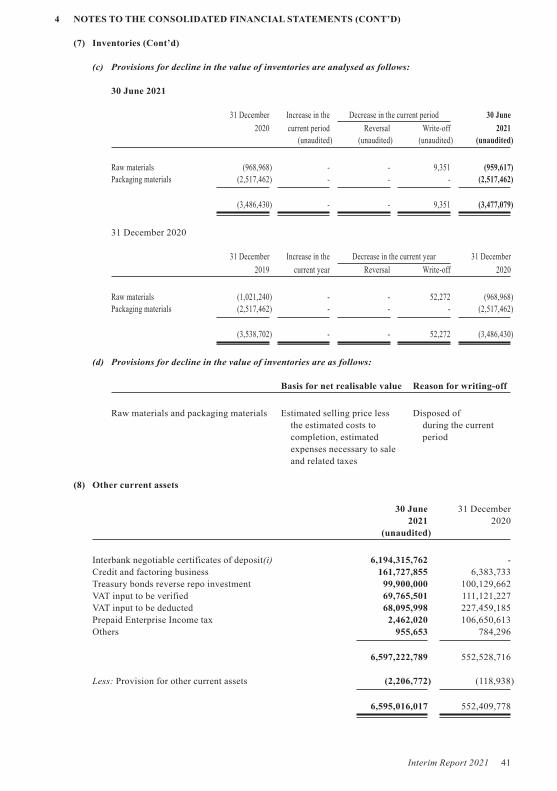
Interim Report 2021 41
4 NOTES TO THE CONSOLIDATED FINANCIAL STATEMENTS (CONT’D)
(7) Inventories (Cont’d)
(c) Provisions for decline in the value of inventories are analysed as follows:
30 June 2021
31 December Increase in the Decrease in the current period 30 June
2020 current period Reversal Write-off 2021 (unaudited) (unaudited) (unaudited) (unaudited)
Raw materials (968,968) - - 9,351 (959,617)Packaging materials (2,517,462) - - - (2,517,462)
(3,486,430) - - 9,351 (3,477,079)
31 December 2020
31 December Increase in the Decrease in the current year 31 December
2019 current year Reversal Write-off 2020
Raw materials (1,021,240) - - 52,272 (968,968)Packaging materials (2,517,462) - - - (2,517,462)
(3,538,702) - - 52,272 (3,486,430)
(d) Provisions for decline in the value of inventories are as follows:
Basis for net realisable value Reason for writing-off
Raw materials and packaging materials Estimated selling price less Disposed of the estimated costs to during the current completion, estimated period expenses necessary to sale and related taxes
(8) Other current assets
30 June 31 December 2021 2020 (unaudited)
Interbank negotiable certificates of deposit(i) 6,194,315,762 -Credit and factoring business 161,727,855 6,383,733Treasury bonds reverse repo investment 99,900,000 100,129,662VAT input to be verified 69,765,501 111,121,227VAT input to be deducted 68,095,998 227,459,185Prepaid Enterprise Income tax 2,462,020 106,650,613Others 955,653 784,296
6,597,222,789 552,528,716
Less: Provision for other current assets (2,206,772) (118,938)
6,595,016,017 552,409,778

42 Interim Report 2021
4 NOTES TO THE CONSOLIDATED FINANCIAL STATEMENTS (CONT’D)
(8) Other current assets (Cont’d)
(i) It represents the negotiable certificates of deposit issued by the Bank purchased by the Group and the purpose of holding the deposit is to obtain contract cash flow. The interbank negotiable certificates of deposit held by the Group have no significant credit risk and will not cause significant credit losses due to bank default.
(9) Long-term equity investments
30 June 31 December 2021 2020 (unaudited)
Joint Venture (a) 217,016,900 222,529,920Associates (b) 157,876,734 153,023,917
374,893,634 375,553,837Less: Provision for impairment of long-term equity investments (1,220,000) (1,220,000)
373,673,634 374,333,837
(a) Joint Venture
30 June 2021
Movements in the current period (unaudited)
Balance Share of net profit Share of other of provision 31 December or loss using the comprehensive Other equity Cash dividends 30 June for impairment 2020 equity method income changes declared 2021 at end of period (unaudited) (unaudited)
Hebei Jiahe Beer Co., Ltd. (“Hebei Jiahe Company”) 222,529,920 1,486,980 - - (7,000,000) 217,016,900 -
31 December 2020
Movements in the current year
Balance Share of net profit Share of other of provision 31 December or loss using the comprehensive Other equity Cash dividends 31 December for impairment 2019 equity method income changes declared 2020 at end of period
Hebei Jiahe Company 230,912,855 1,617,065 - - (10,000,000) 222,529,920 -
The share of equity interests and voting right held by the Company are both 50% in Hebei Jiahe Company, so the Group owns joint control over Hebei Jiahe Company and accounts for it as a joint venture.
Details of equity interests in the joint venture are disclosed in Note 6(2)(b).

Interim Report 2021 43
4 NOTES TO THE CONSOLIDATED FINANCIAL STATEMENTS (CONT’D)
(9) Long-term equity investments (Cont’d)
(b) Associates
30 June 2021
Movements in the current period (unaudited)
Share of Balance of net profit or Share of other provision for 31 December loss using the comprehensive Other equity Cash dividends 30 June impairment 2020 equity method income changes declared 2021 at end of period (unaudited) (unaudited)
Shandong Yantai Brewery Co., Ltd (“Yantai Brewery Company”) 130,899,019 14,382,317 - - (12,379,306) 132,902,030 -Qingdao Zhaoshang Logistics Company Limited. (“Zhaoshang Logistics”) 18,014,359 2,008,393 - 1,981 - 20,024,733 -Tsingtao Brewery Europe Trading Company (“European Company”) 2,890,539 977,139 (137,707) - - 3,729,971 -Liaoning Shenqing Tsingtao Brewery Company Limited. (“Liaoning Shenqing”) - - - - - - -Others 1,220,000 - - - - 1,220,000 (1,220,000)
153,023,917 17,367,849 (137,707) 1,981 (12,379,306) 157,876,734 (1,220,000)
31 December 2020
Movements in the current year
Share of Balance of net profit or Share of other provision for 31 December loss using the comprehensive Other equity Cash dividends 31 December impairment 2019 equity method income changes declared 2020 at end of period
Yantai Brewery Company 127,976,623 13,411,296 - - (10,488,900) 130,899,019 -Zhaoshang Logistics 15,181,001 2,823,069 - 10,289 - 18,014,359 -European Company 2,516,821 301,392 72,326 - - 2,890,539 -Liaoning Shenqing 54,502 (54,502) - - - - -Others 1,220,000 - - - - 1,220,000 (1,220,000)
146,948,947 16,481,255 72,326 10,289 (10,488,900) 153,023,917 (1,220,000)
Details of equity interests in the associates are disclosed in Note 6(2)(c).
Liaoning Shenqing Company’s net assets are negative due to continuous losses, and the Group has no obligation to bear additional losses. Therefore, when confirming the share of the Group on the net loss incurred, the book value of the long-term equity investment is written down to zero. As at 30 June 2021, the accumulative unconfirmed investment loss is 6,806 (31 December 2020: 10,981).

44 Interim Report 2021
4 NOTES TO THE CONSOLIDATED FINANCIAL STATEMENTS (CONT’D)
(10) Investment properties
30 June 2021
Buildings Land use rights Total
Original cost31 December 2020 66,401,478 6,146,966 72,548,444Decrease in the current period (unaudited) — Transfer to intangible assets - (4,261,245) (4,261,245)30 June 2021 (unaudited) 66,401,478 1,885,721 68,287,199
Accumulated depreciation31 December 2020 (42,051,671) (1,435,907) (43,487,578)Increase in the current period (unaudited) — Accrual (936,784) (18,858) (955,642)Decrease in the current period (unaudited) — Transfer to intangible assets - 504,247 504,24730 June 2021 (unaudited) (42,988,455) (950,518) (43,938,973)
Provision for impairment31 December 2020 (1,877,432) - (1,877,432)30 June 2021 (unaudited) (1,877,432) - (1,877,432)
Carrying amount30 June 2021 (unaudited) 21,535,591 935,203 22,470,79431 December 2020 22,472,375 4,711,059 27,183,434

Interim Report 2021 45
4 NOTES TO THE CONSOLIDATED FINANCIAL STATEMENTS (CONT’D)
(10) Investment properties (Cont’d)
31 December 2020
Buildings Land use rights Total
Original cost31 December 2019 84,224,430 8,734,452 92,958,882Increase in the current year — Transfer from fixed assets 908,328 - 908,328Decrease in the current year — Transfer to fixed assets and intangible assets (18,731,280) (2,587,486) (21,318,766)31 December 2020 66,401,478 6,146,966 72,548,444
Accumulated depreciation31 December 2019 (51,492,494) (2,612,357) (54,104,851)Increase in the current year — Accrual (1,962,424) (131,564) (2,093,988) — Transfer from fixed assets (250,124) - (250,124)Decrease in the current year — Transfer to fixed assets and intangible assets 11,653,371 1,308,014 12,961,38531 December 2020 (42,051,671) (1,435,907) (43,487,578)
Provision for impairment31 December 2019 (2,349,349) - (2,349,349)Increase in the current year — Transfer from fixed assets (263,426) - (263,426)Decrease in the current year — Transfer to fixed assets 735,343 - 735,34331 December 2020 (1,877,432) - (1,877,432)
Carrying amount31 December 2020 22,472,375 4,711,059 27,183,43431 December 2019 30,382,587 6,122,095 36,504,682
As at 30 June 2021, there is no investment property without ownership certificates (31 December 2020: nil).
(11) Fixed assets
30 June 31 December 2021 2020 (unaudited)
Fixed assets (a) 10,507,524,926 10,301,504,225Fixed assets pending for disposal (b) 1,850,889 1,124,405
10,509,375,815 10,302,628,630

46 Interim Report 2021
4 NOTES TO THE CONSOLIDATED FINANCIAL STATEMENTS (CONT’D)
(11) Fixed assets (Cont’d)
(a) Fixed assets
30 June 2021
Machinery and Other Buildings equipment Vehicles equipments Total
Original cost31 December 2020 7,500,331,895 11,328,511,203 314,061,622 992,771,926 20,135,676,646Increase in the current period (unaudited) Purchase - 29,686,286 5,251,786 22,093,198 57,031,270 Transfer from construction in progress 164,329,566 486,506,322 - 22,361,579 673,197,467Decrease in the current period (unaudited) Disposal (24,967,460) (89,850,898) (17,120,678) (4,138,545) (136,077,581) Transfer to construction in progress (60,790,643) (47,873,075) - (388,749) (109,052,467)30 June 2021 (unaudited) 7,578,903,358 11,706,979,838 302,192,730 1,032,699,409 20,620,775,335
Accumulated depreciation31 December 2020 (2,062,850,078) (6,296,074,336) (221,700,887) (725,734,849) (9,306,360,150)Increase in the current period (unaudited) Accrual (100,842,471) (294,926,816) (10,693,056) (36,705,010) (443,167,353)Decrease in the current period (unaudited) Disposal 18,441,458 63,073,073 15,519,086 3,616,906 100,650,523 Transfer to construction in progress 15,405,121 29,013,878 - 322,616 44,741,61530 June 2021 (unaudited) (2,129,845,970) (6,498,914,201) (216,874,857) (758,500,337) (9,604,135,365)
Provision for impairment31 December 2020 (141,771,916) (382,996,441) (2,718,111) (325,803) (527,812,271)Increase in the current period (unaudited) Accrual - (5,826) - - (5,826)Decrease in the current period (unaudited) Disposal 658,496 16,705,325 1,063,610 275,622 18,703,05330 June 2021 (unaudited) (141,113,420) (366,296,942) (1,654,501) (50,181) (509,115,044)
Carrying amount30 June 2021 (unaudited) 5,307,943,968 4,841,768,695 83,663,372 274,148,891 10,507,524,92631 December 2020 5,295,709,901 4,649,440,426 89,642,624 266,711,274 10,301,504,225

Interim Report 2021 47
4 NOTES TO THE CONSOLIDATED FINANCIAL STATEMENTS (CONT’D)
(11) Fixed assets (Cont’d)
(a) Fixed assets (Cont’d)
31 December 2020
Machinery and Other Buildings equipment Vehicles equipments Total
Original costAs at 31 December 2019 7,312,629,435 10,944,686,036 315,594,700 905,875,957 19,478,786,128Increase in the current year Purchase - 37,230,148 11,969,782 79,180,158 128,380,088 Transfer from construction in progress 317,781,254 815,395,506 - 30,029,822 1,163,206,582 Transfer from investment properties 18,731,280 - - - 18,731,280Decrease in the current year Disposal (5,638,626) (307,524,604) (13,502,860) (20,646,845) (347,312,935) Transfer to construction in progress (142,263,120) (161,275,883) - (1,667,166) (305,206,169) Transfer to investment properties (908,328) - - - (908,328)As at 31 December 2020 7,500,331,895 11,328,511,203 314,061,622 992,771,926 20,135,676,646
Accumulated depreciationAs at 31 December 2019 (1,905,385,451) (6,001,215,144) (210,994,112) (670,339,266) (8,787,933,973)Increase in the current year Accrual (200,024,285) (599,838,514) (22,430,473) (76,642,668) (898,935,940) Transfer from investment properties (11,653,371) - - - (11,653,371)Decrease in the current year Disposal 1,814,861 207,490,461 11,723,698 19,758,992 240,788,012 Transfer to construction in progress 52,148,044 97,488,861 - 1,488,093 151,124,998 Transfer to investment properties 250,124 - - - 250,124As at 31 December 2020 (2,062,850,078) (6,296,074,336) (221,700,887) (725,734,849) (9,306,360,150)
Provision for impairmentAs at 31 December 2019 (141,826,361) (325,414,187) (1,703,027) (426,183) (469,369,758)Increase in the current year Accrual (1,537,248) (127,036,986) (1,398,679) (580,787) (130,553,700) Transfer from investment properties (735,343) - - - (735,343)Decrease in the current year Disposal 1,438,484 69,237,533 383,595 681,167 71,740,779 Transfer to construction in progress 625,126 217,199 - - 842,325 Transfer to investment properties 263,426 - - - 263,426As at 31 December 2020 (141,771,916) (382,996,441) (2,718,111) (325,803) (527,812,271)
Carrying amountAs at 31 December 2020 5,295,709,901 4,649,440,426 89,642,624 266,711,274 10,301,504,225As at 31 December 2019 5,265,417,623 4,618,056,705 102,897,561 235,110,508 10,221,482,397

48 Interim Report 2021
4 NOTES TO THE CONSOLIDATED FINANCIAL STATEMENTS (CONT’D)
(11) Fixed assets (Cont’d)
(a) Fixed assets (Cont’d)
For six months ended 30 June 2021, fixed assets of the Group with the carrying amount of 64,310,852 (cost: 109,052,467; accumulated depreciation 44,741,615) are transferred to construction in progress to be upgraded due to technology renewal and the likes.
As at 30 June 2021, there are no fixed assets pledged as collateral for borrowings (31 December 2020: nil).
For the six months ended 30 June 2021, fixed assets accumulated depreciation are 443,167,353 (For the six months ended 30 June 2020: 441,422,289), of which 395,970,078, 6,429,808, 39,685,075 and 1,082,392 (For the six months ended 30 June 2020: 395,725,476, 3,769,283, 40,754,371 and 1,173,159) have been charged to operating cost, selling and distribution expenses, general and administrative expenses and research and development expenses respectively.
The cost of fixed assets transferred from construction in progress amounts to 673,197,467 (For the six months ended 30 June 2020: 479,805,084).
(i) Temporarily idle fixed assets
As at 30 June 2021, the buildings and the machinery and equipment with carrying amount of 49,143,555 (cost 215,745,150) are temporarily idle for the reason of products update (31 December 2020: carrying amount of 58,150,534, cost: 209,956,745). The management planned to reallocate these assets among the Group or upgrade. The detailed analysis of these assets is as follows:
30 June 2021
Accumulated Provision for Carrying Cost depreciation impairment amount (unaudited) (unaudited) (unaudited) (unaudited)
Machinery and equipment 185,469,498 (132,001,737) (7,805,001) 45,662,760Buildings 30,275,652 (16,738,960) (10,055,897) 3,480,795
215,745,150 (148,740,697) (17,860,898) 49,143,555
31 December 2020
Accumulated Provision for Carrying Cost depreciation impairment amount
Machinery and equipment 183,024,452 (120,829,814) (8,148,021) 54,046,617Buildings 26,932,293 (12,814,560) (10,013,816) 4,103,917
209,956,745 (133,644,374) (18,161,837) 58,150,534

Interim Report 2021 49
4 NOTES TO THE CONSOLIDATED FINANCIAL STATEMENTS (CONT’D)
(11) Fixed assets (Cont’d)
(a) Fixed assets (Cont’d)
(ii) Fixed assets without ownership certificates
The ownership certificates of the Group’s certain buildings have not been obtained. The analysis is as follows:
Reason for failure to acquire 30 June 31 December the ownership certificates 2021 2020
Carrying amount Carrying amount (unaudited)
In the application process 322,636,000 332,619,000Unable to obtain 62,663,000 84,764,000
385,299,000 417,383,000
According to the consultation with the Company’s legal adviser, the Company’s directors believe that there should be no substantial legal obstacles to the application of these ownership certificates or that it will not affect the Company’s normal use of these buildings, and will not have a significant impact on the normal operation of the Group, no provision for fixed assets impairment is provided.
(b) Fixed assets pending for disposal
30 June 31 December 2021 2020 (unaudited)
Machinery, equipment and buildings 1,850,889 1,124,405
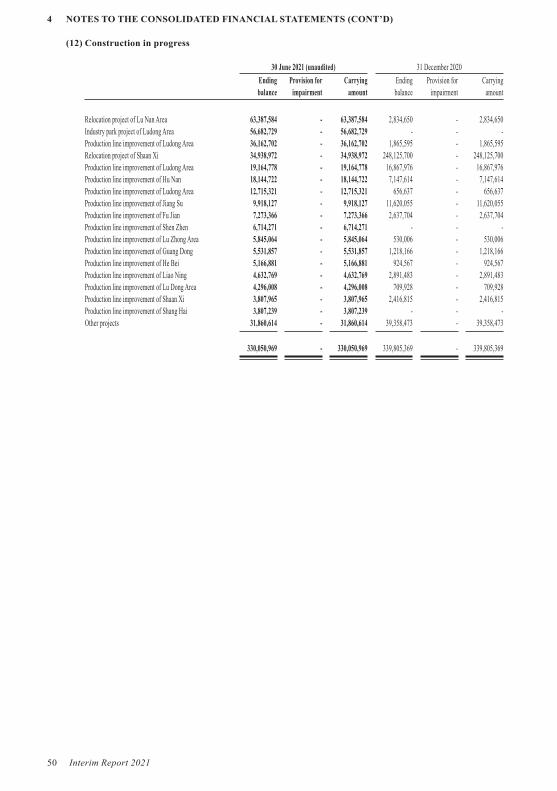
50 Interim Report 2021
4 NOTES TO THE CONSOLIDATED FINANCIAL STATEMENTS (CONT’D)
(12) Construction in progress
30 June 2021 (unaudited) 31 December 2020
Ending Provision for Carrying Ending Provision for Carrying balance impairment amount balance impairment amount
Relocation project of Lu Nan Area 63,387,584 - 63,387,584 2,834,650 - 2,834,650Industry park project of Ludong Area 56,682,729 - 56,682,729 - - -Production line improvement of Ludong Area 36,162,702 - 36,162,702 1,865,595 - 1,865,595Relocation project of Shaan Xi 34,938,972 - 34,938,972 248,125,700 - 248,125,700Production line improvement of Ludong Area 19,164,778 - 19,164,778 16,867,976 - 16,867,976Production line improvement of Hu Nan 18,144,722 - 18,144,722 7,147,614 - 7,147,614Production line improvement of Ludong Area 12,715,321 - 12,715,321 656,637 - 656,637Production line improvement of Jiang Su 9,918,127 - 9,918,127 11,620,055 - 11,620,055Production line improvement of Fu Jian 7,273,366 - 7,273,366 2,637,704 - 2,637,704Production line improvement of Shen Zhen 6,714,271 - 6,714,271 - - -Production line improvement of Lu Zhong Area 5,845,064 - 5,845,064 530,006 - 530,006Production line improvement of Guang Dong 5,531,857 - 5,531,857 1,218,166 - 1,218,166Production line improvement of He Bei 5,166,881 - 5,166,881 924,567 - 924,567Production line improvement of Liao Ning 4,632,769 - 4,632,769 2,891,483 - 2,891,483Production line improvement of Lu Dong Area 4,296,008 - 4,296,008 709,928 - 709,928Production line improvement of Shaan Xi 3,807,965 - 3,807,965 2,416,815 - 2,416,815Production line improvement of Shang Hai 3,807,239 - 3,807,239 - - -Other projects 31,860,614 - 31,860,614 39,358,473 - 39,358,473
330,050,969 - 330,050,969 339,805,369 - 339,805,369

Interim Report 2021 51
4 NOTES TO THE CONSOLIDATED FINANCIAL STATEMENTS (CONT’D)
(12) Construction in progress (Cont’d)
(a) Movement in significant construction in progress
30 June 2021
Increase in the Increase in the current period Expenditures 31 December current period -Transfer from Transfer to 30 June percentage Completion SourceName Budget 2020 - Purchase fixed assets fixed assets 2021 of budget percentage of funds (unaudited) (unaudited) (unaudited) (unaudited)
Relocation project of Lu Nan Area 751,860,000 2,834,650 60,552,934 - - 63,387,584 22% 22% Self-fundingIndustry park project of Ludong Area 246,620,000 - 56,682,729 - - 56,682,729 35% 34% Self-fundingProduction line improvement of Ludong Area 185,484,703 1,865,595 18,175,068 34,412,703 (18,290,664) 36,162,702 98% 98% Self-fundingRelocation project of Shaan Xi 546,976,250 248,125,700 271,416,951 - (484,603,679) 34,938,972 95% 95% Self-fundingProduction line improvement of Ludong Area 48,356,933 16,867,976 3,305,142 - (1,008,340) 19,164,778 80% 80% Self-fundingProduction line improvement of Hu Nan 26,096,302 7,147,614 15,814,517 6,788 (4,824,197) 18,144,722 88% 88% Self-fundingProduction line improvement of Ludong Area 27,018,124 656,637 14,667,408 547,551 (3,156,275) 12,715,321 59% 56% Self-fundingProduction line improvement of Jiang Su 14,459,531 11,620,055 1,994,461 - (3,696,389) 9,918,127 99% 94% Self-fundingProduction line improvement of Fu Jian 13,661,168 2,637,704 1,719,559 9,310,348 (6,394,245) 7,273,366 82% 81% Self-fundingProduction line improvement of Shen Zhen 14,810,918 - 8,106,253 366,253 (1,758,235) 6,714,271 96% 57% Self-fundingProduction line improvement of Lu Zhong Area 16,863,700 530,006 10,951,794 14,750 (5,651,486) 5,845,064 69% 65% Self-fundingProduction line improvement of Guang Dong 10,916,802 1,218,166 7,340,069 327,198 (3,353,576) 5,531,857 93% 81% Self-fundingProduction line improvement of He Bei 17,633,391 924,567 6,154,998 - (1,912,684) 5,166,881 56% 40% Self-fundingProduction line improvement of Liao Ning 7,024,455 2,891,483 3,275,162 152,265 (1,686,141) 4,632,769 90% 90% Self-fundingProduction line improvement of Lu Dong Area 10,684,000 709,928 6,203,232 1,162,627 (3,779,779) 4,296,008 76% 69% Self-fundingProduction line improvement of Shaan Xi 67,201,292 2,416,815 12,962,442 - (11,571,292) 3,807,965 23% 23% Self-fundingProduction line improvement of Shang Hai 3,836,000 - 3,807,239 - - 3,807,239 99% 99% Self-fundingOther projects 39,358,473 96,002,257 18,010,369 (121,510,485) 31,860,614
339,805,369 599,132,215 64,310,852 (673,197,467) 330,050,969
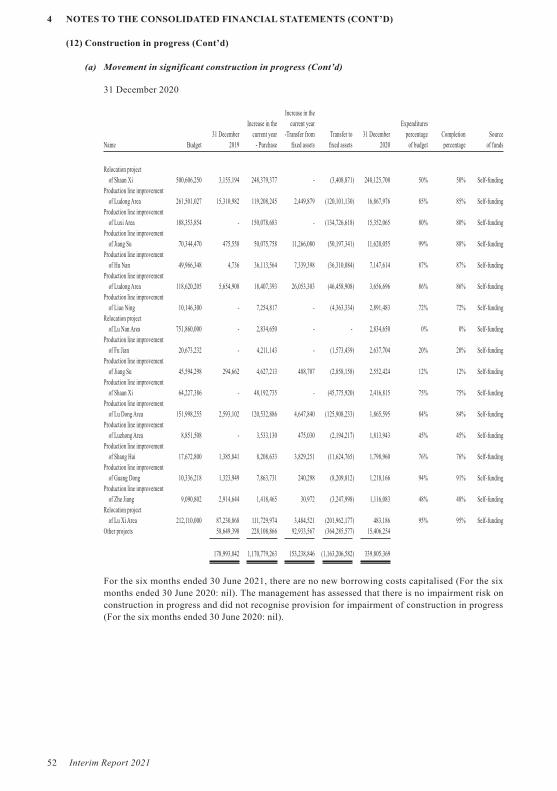
52 Interim Report 2021
4 NOTES TO THE CONSOLIDATED FINANCIAL STATEMENTS (CONT’D)
(12) Construction in progress (Cont’d)
(a) Movement in significant construction in progress (Cont’d)
31 December 2020
Increase in the Increase in the current year Expenditures 31 December current year -Transfer from Transfer to 31 December percentage Completion SourceName Budget 2019 - Purchase fixed assets fixed assets 2020 of budget percentage of funds
Relocation project of Shaan Xi 500,606,250 3,155,194 248,379,377 - (3,408,871) 248,125,700 50% 50% Self-fundingProduction line improvement of Ludong Area 261,501,027 15,310,982 119,208,245 2,449,879 (120,101,130) 16,867,976 85% 85% Self-fundingProduction line improvement of Luxi Area 188,353,854 - 150,078,683 - (134,726,618) 15,352,065 80% 80% Self-fundingProduction line improvement of Jiang Su 70,344,470 475,558 50,075,758 11,266,080 (50,197,341) 11,620,055 99% 88% Self-fundingProduction line improvement of Hu Nan 49,966,348 4,736 36,113,564 7,339,398 (36,310,084) 7,147,614 87% 87% Self-fundingProduction line improvement of Ludong Area 118,620,205 5,654,908 18,407,393 26,053,303 (46,458,908) 3,656,696 86% 86% Self-fundingProduction line improvement of Liao Ning 10,146,300 - 7,254,817 - (4,363,334) 2,891,483 72% 72% Self-fundingRelocation project of Lu Nan Area 751,860,000 - 2,834,650 - - 2,834,650 0% 0% Self-fundingProduction line improvement of Fu Jian 20,673,232 - 4,211,143 - (1,573,439) 2,637,704 20% 20% Self-fundingProduction line improvement of Jiang Su 45,594,298 294,662 4,627,213 488,707 (2,858,158) 2,552,424 12% 12% Self-fundingProduction line improvement of Shaan Xi 64,227,386 - 48,192,735 - (45,775,920) 2,416,815 75% 75% Self-fundingProduction line improvement of Lu Dong Area 151,998,255 2,593,102 120,532,886 4,647,840 (125,908,233) 1,865,595 84% 84% Self-fundingProduction line improvement of Luzhong Area 8,851,508 - 3,533,130 475,030 (2,194,217) 1,813,943 45% 45% Self-fundingProduction line improvement of Shang Hai 17,672,800 1,385,841 8,208,633 3,829,251 (11,624,765) 1,798,960 76% 76% Self-fundingProduction line improvement of Guang Dong 10,336,218 1,323,949 7,863,731 240,298 (8,209,812) 1,218,166 94% 91% Self-fundingProduction line improvement of Zhe Jiang 9,090,802 2,914,644 1,418,465 30,972 (3,247,998) 1,116,083 48% 48% Self-fundingRelocation project of Lu Xi Area 212,110,000 87,230,868 111,729,974 3,484,521 (201,962,177) 483,186 95% 95% Self-fundingOther projects 58,649,398 228,108,866 92,933,567 (364,285,577) 15,406,254
178,993,842 1,170,779,263 153,238,846 (1,163,206,582) 339,805,369
For the six months ended 30 June 2021, there are no new borrowing costs capitalised (For the six months ended 30 June 2020: nil). The management has assessed that there is no impairment risk on construction in progress and did not recognise provision for impairment of construction in progress (For the six months ended 30 June 2020: nil).

Interim Report 2021 53
4 NOTES TO THE CONSOLIDATED FINANCIAL STATEMENTS (CONT’D)
(13) Right-of-use assets
30 June 2021
Land use Machinery and Buildings rights equipment Others Total
Original cost31 December 2020 207,456,032 8,911,656 3,677,046 1,647,744 221,692,478Increase in the current period and renewal (unaudited) 29,284,292 - - 7,744 29,292,036Decrease in the current period (unaudited) (15,574,125) - - (1,522) (15,575,647) Lease change (3,713,155) - - (1,218) (3,714,373) Lease expiration (11,860,970) - - (304) (11,861,274)30 June 2021 (unaudited) 221,166,199 8,911,656 3,677,046 1,653,966 235,408,867
Accumulated depreciation31 December 2020 (49,218,680) (2,071,235) (1,440,894) (632,622) (53,363,431)Accrual (unaudited) (24,122,669) (517,794) (360,224) (291,325) (25,292,012)Decrease (unaudited) 11,860,970 - - 304 11,861,27430 June 2021 (unaudited) (61,480,379) (2,589,029) (1,801,118) (923,643) (66,794,169)
Carrying amount30 June 2021 (unaudited) 159,685,820 6,322,627 1,875,928 730,323 168,614,69831 December 2020 158,237,352 6,840,421 2,236,152 1,015,122 168,329,047
31 December 2020
Land use Machinery and Buildings rights equipments Others Total
Original cost31 December 2019 75,792,267 9,097,754 3,677,046 1,259,170 89,826,237Increase in the current year and renewal 141,280,420 - - 573,699 141,854,119Decrease in the current year (9,616,655) (186,098) - (185,125) (9,987,878) Lease change (212,652) (49,539) - (150,475) (412,666) Lease expiration (9,404,003) (136,559) - (34,650) (9,575,212)31 December 2020 207,456,032 8,911,656 3,677,046 1,647,744 221,692,478
Accumulated depreciation31 December 2019 (20,913,741) (1,115,220) (720,447) (106,394) (22,855,802)Accrual (37,708,942) (1,092,574) (720,447) (560,878) (40,082,841)Decrease 9,404,003 136,559 - 34,650 9,575,21231 December 2020 (49,218,680) (2,071,235) (1,440,894) (632,622) (53,363,431)
Carrying amount31 December 2020 158,237,352 6,840,421 2,236,152 1,015,122 168,329,04731 December 2019 54,878,526 7,982,534 2,956,599 1,152,776 66,970,435
According to the notice of “Regulations on accounting treatment of rent reduction related to new pneumonia epidemic situation” issued by the Ministry of Finance on 26 May 2021, the Group adopts the simplified method to deal with the rent reduction meeting the requirements of the notice. For the six months ended 30 June 2021, the relevant rent reduction with simplified treatment has an impact on the current profit or loss of about 0 (For the six months ended 30 June 2020: 620,000)

54 Interim Report 2021
4 NOTES TO THE CONSOLIDATED FINANCIAL STATEMENTS (CONT’D)
(14) Intangible assets
30 June 2021
Land use Technology Marketing Software rights Trademarks known-how networks and others Total
Original cost31 December 2020 2,727,839,600 449,743,612 18,629,100 974,935,670 522,371,518 4,693,519,500Increase in the current period (unaudited) Purchase 27,959,280 - - - 25,729,627 53,688,907 Transfer from investment properties 4,261,245 - - - - 4,261,245Decrease in the current year — Disposal (unaudited) (1,023,424) - - - (325,277) (1,348,701) 30 June 2021 (unaudited) 2,759,036,701 449,743,612 18,629,100 974,935,670 547,775,868 4,750,120,951
Accumulated amortisation31 December 2020 (604,484,978) (366,414,798) (18,629,100) (900,368,992) (299,778,644) (2,189,676,512)Increase in the current period (unaudited) Accrual (32,233,287) (8,072,847) - (24,516,717) (21,093,708) (85,916,559) Transfer from investment properties (504,247) - - - - (504,247)Decrease in the current year — Disposal (unaudited) 566,295 - - - 315,165 881,460 30 June 2021 (unaudited) (636,656,217) (374,487,645) (18,629,100) (924,885,709) (320,557,187) (2,275,215,858)
Carrying amount30 June 2021 (unaudited) 2,122,380,484 75,255,967 - 50,049,961 227,218,681 2,474,905,09331 December 2020 2,123,354,622 83,328,814 - 74,566,678 222,592,874 2,503,842,988
31 December 2020
Land use Technology Marketing Software rights Trademarks known-how networks and others Total
Original cost31 December 2019 2,624,663,664 449,743,612 18,629,100 974,935,670 486,832,730 4,554,804,776Increase in the current year Purchase 103,122,537 - - - 47,017,733 150,140,270 Transfer from Investment property 2,587,486 - - - - 2,587,486Decrease in the current year — Disposal (2,534,087) - - - (11,478,945) (14,013,032) 31 December 2020 2,727,839,600 449,743,612 18,629,100 974,935,670 522,371,518 4,693,519,500
Accumulated amortisation31 December 2019 (541,417,212) (342,358,212) (18,629,100) (822,501,782) (271,326,015) (1,996,232,321)Increase in the current year Accrual (62,189,744) (24,056,586) - (77,867,210) (39,825,332) (203,938,872) Transfer from Investment property (1,308,014) - - - - (1,308,014)Decrease in the current year — Disposal 429,992 - - - 11,372,703 11,802,695 31 December 2020 (604,484,978) (366,414,798) (18,629,100) (900,368,992) (299,778,644) (2,189,676,512)
Carrying amount31 December 2020 2,123,354,622 83,328,814 - 74,566,678 222,592,874 2,503,842,98831 December 2019 2,083,246,452 107,385,400 - 152,433,888 215,506,715 2,558,572,455
For the six months ended 30 June 2021, the amortisation amount of intangible assets is 85,916,559 (For six months ended 30 June 2020: 101,963,309).
As at 30 June 2021, there are no intangible assets pledged as collateral for borrowings (31 December 2020: nil).

Interim Report 2021 55
4 NOTES TO THE CONSOLIDATED FINANCIAL STATEMENTS (CONT’D)
(14) Intangible assets (Cont’d)
Buildings of certain subsidiaries of the Group were located on parcels of allocated land owned by certain local municipal governments. Most of the relevant local governments have undertaken to implement transfer procedures for these lands. Carrying amount of the buildings constructed thereon are approximately 31,212,000 as at 30 June 2021 (31 December 2020: 31,476,000). The Company’s directors consider that there is no significant impact on the operations of the Group.
Development expenditures are set out as follows:
Decrease in the current period(unaudited)
31 December Increase in the Charged to Recognised as 30 June 2020 current period profit or loss intangible assets 2021 (unaudited) (unaudited)
Beer technology improvement project - 8,248,555 8,248,555 - -
For the six months ended 30 June 2021, research and development expenditures of 8,248,555 (For six months ended 30 June 2020: 6,689,518) are recognised in profit or loss.
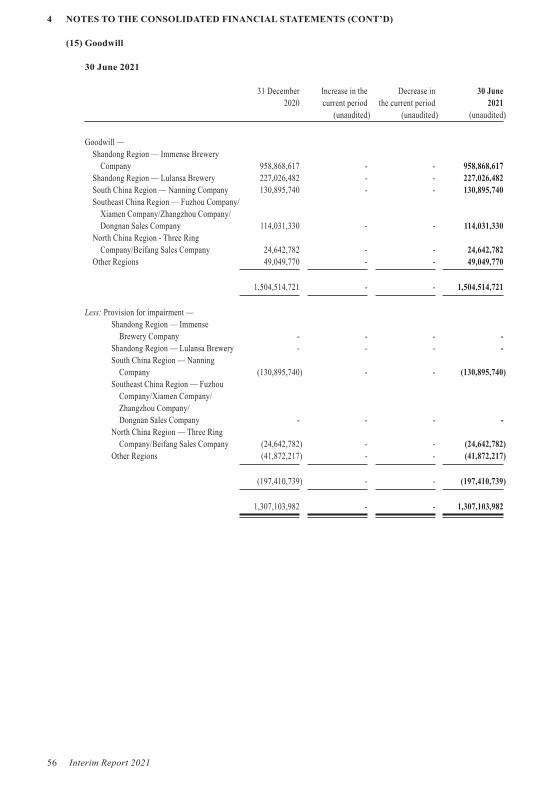
56 Interim Report 2021
4 NOTES TO THE CONSOLIDATED FINANCIAL STATEMENTS (CONT’D)
(15) Goodwill
30 June 2021
31 December Increase in the Decrease in 30 June 2020 current period the current period 2021 (unaudited) (unaudited) (unaudited)
Goodwill — Shandong Region — Immense Brewery Company 958,868,617 - - 958,868,617 Shandong Region — Lulansa Brewery 227,026,482 - - 227,026,482 South China Region — Nanning Company 130,895,740 - - 130,895,740 Southeast China Region — Fuzhou Company/ Xiamen Company/Zhangzhou Company/ Dongnan Sales Company 114,031,330 - - 114,031,330 North China Region - Three Ring Company/Beifang Sales Company 24,642,782 - - 24,642,782 Other Regions 49,049,770 - - 49,049,770
1,504,514,721 - - 1,504,514,721
Less: Provision for impairment — Shandong Region — Immense Brewery Company - - - - Shandong Region — Lulansa Brewery - - - - South China Region — Nanning Company (130,895,740) - - (130,895,740) Southeast China Region — Fuzhou Company/Xiamen Company/ Zhangzhou Company/ Dongnan Sales Company - - - - North China Region — Three Ring Company/Beifang Sales Company (24,642,782) - - (24,642,782) Other Regions (41,872,217) - - (41,872,217)
(197,410,739) - - (197,410,739)
1,307,103,982 - - 1,307,103,982
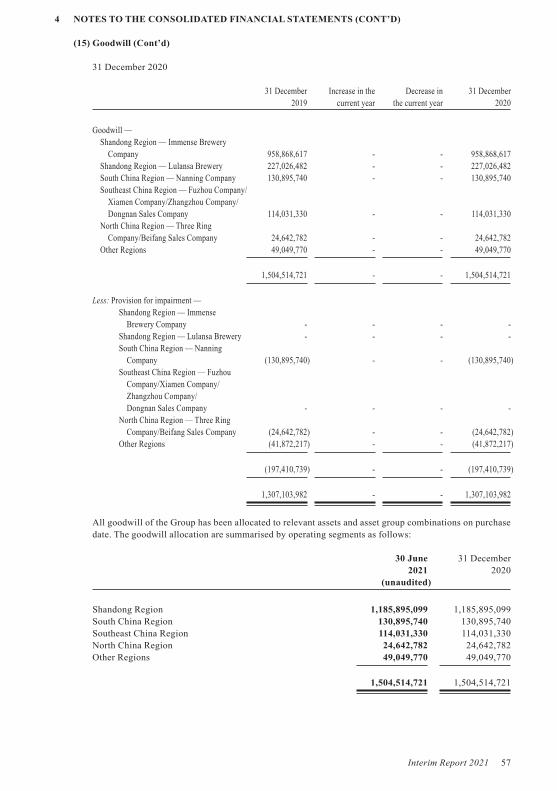
Interim Report 2021 57
4 NOTES TO THE CONSOLIDATED FINANCIAL STATEMENTS (CONT’D)
(15) Goodwill (Cont’d)
31 December 2020
31 December Increase in the Decrease in 31 December 2019 current year the current year 2020
Goodwill — Shandong Region — Immense Brewery Company 958,868,617 - - 958,868,617 Shandong Region — Lulansa Brewery 227,026,482 - - 227,026,482 South China Region — Nanning Company 130,895,740 - - 130,895,740 Southeast China Region — Fuzhou Company/ Xiamen Company/Zhangzhou Company/ Dongnan Sales Company 114,031,330 - - 114,031,330 North China Region — Three Ring Company/Beifang Sales Company 24,642,782 - - 24,642,782 Other Regions 49,049,770 - - 49,049,770
1,504,514,721 - - 1,504,514,721
Less: Provision for impairment — Shandong Region — Immense Brewery Company - - - - Shandong Region — Lulansa Brewery - - - - South China Region — Nanning Company (130,895,740) - - (130,895,740) Southeast China Region — Fuzhou Company/Xiamen Company/ Zhangzhou Company/ Dongnan Sales Company - - - - North China Region — Three Ring Company/Beifang Sales Company (24,642,782) - - (24,642,782) Other Regions (41,872,217) - - (41,872,217)
(197,410,739) - - (197,410,739)
1,307,103,982 - - 1,307,103,982
All goodwill of the Group has been allocated to relevant assets and asset group combinations on purchase date. The goodwill allocation are summarised by operating segments as follows:
30 June 31 December 2021 2020 (unaudited)
Shandong Region 1,185,895,099 1,185,895,099South China Region 130,895,740 130,895,740Southeast China Region 114,031,330 114,031,330North China Region 24,642,782 24,642,782Other Regions 49,049,770 49,049,770
1,504,514,721 1,504,514,721

58 Interim Report 2021
4 NOTES TO THE CONSOLIDATED FINANCIAL STATEMENTS (CONT’D)
(15) Goodwill (Cont’d)
The recoverable amount of asset group and asset group portfolio is based on the five-year budget approved by the management, and then estimated based on the fixed growth rate and calculated by cash flow forecasting method.
(16) Long-term prepaid expenses
30 June 2021
31 December Increase in the Amortisation in 30 June 2020 current period the current period 2021 (unaudited) (unaudited) (unaudited)
Decoration and renovation expenses 78,361,374 21,140,345 (12,447,397) 87,054,322Factory hardening expenses 3,584,280 1,032,584 (690,753) 3,926,111Gardening expenses 930,894 - (191,282) 739,612Others 3,381,786 - (621,010) 2,760,776
86,258,334 22,172,929 (13,950,442) 94,480,821
31 December 2020
31 December Increase in the Amortisation in 31 December 2019 current year the current year 2020
Decoration and renovation expenses 24,953,149 66,583,607 (13,175,382) 78,361,374Factory hardening expenses 3,517,689 1,511,550 (1,444,959) 3,584,280Gardening expenses 1,777,987 376,056 (1,223,149) 930,894Others 5,006,563 171,419 (1,796,196) 3,381,786
35,255,388 68,642,632 (17,639,686) 86,258,334

Interim Report 2021 59
4 NOTES TO THE CONSOLIDATED FINANCIAL STATEMENTS (CONT’D)
(17) Deferred tax assets and deferred tax liabilities
(a) Deferred tax assets without offsetting
30 June 2021 (unaudited) 31 December 2020
Deductible Deductible temporary temporary differences and Deferred differences and Deferred deductible losses tax assets deductible losses tax assets
Provision for asset impairment 83,096,912 20,774,228 96,219,816 24,054,954Deferred income 1,637,635,548 409,408,887 1,364,996,248 341,249,062Elimination of intra-group unrealized profit 34,714,912 8,678,728 216,300,624 54,075,156Accruals of expenses 7,126,723,988 1,781,680,997 5,868,448,752 1,467,112,188Share-based payment 429,566,488 107,391,622 177,367,392 44,341,848
9,311,737,848 2,327,934,462 7,723,332,832 1,930,833,208
Including:Expected to reverse within one year (inclusive) 1,747,731,377 1,552,562,268Expected to be reverse after one year 580,203,085 378,270,940
2,327,934,462 1,930,833,208
(b) Deferred tax liabilities without offsetting
30 June 2021 (unaudited) 31 December 2020
Taxable Taxable temporary Deferred tax temporary Deferred tax differences liabilities differences liabilities
Business combinations not under common control 447,132,736 111,783,184 491,075,772 122,768,943Depreciation of fixed assets 1,349,248,096 337,312,024 994,820,244 248,705,061Changes in fair value of debt instruments 127,366,562 31,841,641 27,042,735 6,760,684The difference between carrying amount and tax base resulted from government grants charged in profit or loss in the current period 7,335,424 1,833,856 7,421,724 1,855,431
1,931,082,818 482,770,705 1,520,360,475 380,090,119
Including: Expected to be reverse within one year (inclusive) 68,026,955 48,179,961 Expected to be reverse after one year 414,743,750 331,910,158
482,770,705 380,090,119

60 Interim Report 2021
4 NOTES TO THE CONSOLIDATED FINANCIAL STATEMENTS (CONT’D)
(17) Deferred tax assets and deferred tax liabilities (Cont’d)
(c) Deductible temporary differences and deductible losses that are not recognised as deferred tax assets are analysed as follows:
30 June 31 December 2021 2020 (unaudited)
Deductible losses 2,031,735,258 2,163,327,814Deductible temporary differences 1,678,219,926 1,645,626,327
3,709,955,184 3,808,954,141
Given the loss-making position of certain subsidiaries, whether it is probable that sufficient future taxable incomes will be available against such deductible losses is highly uncertain. Therefore, the Group has not recognised deferred tax assets of approximately 507,934,000 (31 December 2020: 540,832,000) arising from the accumulated losses that can set off against taxable incomes under tax laws in the period from 2021 to 2026. In addition, given the loss-making position of certain subsidiaries, whether it is probable that sufficient future taxable incomes will be available against temporary differences is highly uncertain. Therefore, the Group also has not recognised deferred tax assets of approximately 419,555,000 (31 December 2020: 411,407,000) arising from the deductible temporary differences.
(d) Deductible losses that are not recognised as deferred tax assets will be overdue in the following years:
30 June 31 December 2021 2020 (unaudited)
2021 347,157,321 508,799,4952022 485,363,083 492,075,9452023 564,488,756 578,997,4772024 302,166,479 310,121,9762025 216,916,859 273,332,9212026 115,642,760 —
2,031,735,258 2,163,327,814
(e) The net balances of deferred tax assets and liabilities after offsetting are as follows:
30 June 2021 (unaudited) 31 December 2020
Offsetting Offsetting amount Net amounts amount Net amounts
Deferred tax assets 318,776,020 2,009,158,442 212,525,583 1,718,307,625Deferred tax liabilities 318,776,020 163,994,685 212,525,583 167,564,536

Interim Report 2021 61
4 NOTES TO THE CONSOLIDATED FINANCIAL STATEMENTS (CONT’D)
(18) Provision for asset impairment and loss
30 June 2021
Increase in Decrease in the current period 31 December the current (unaudited) 30 June
2020 period Reversal Write-off Others 2021 (unaudited) (unaudited) (unaudited)
Provision for bad debt of accounts receivable 183,437,647 27,990 (316,719) (1,821,205) (72) 181,327,641Including: Provision for bad debt recognised
individually 26,242,020 - - - - 26,242,020Provision for bad debt recognised on grouping basis 157,195,627 27,990 (316,719) (1,821,205) (72) 155,085,621
Provision for bad debt of other receivables 68,006,160 52,603 (136,996) (1,626,458) - 66,295,309Provision for bad debt of other current asset 118,938 2,087,834 - - - 2,206,772
Subtotal 251,562,745 2,168,427 (453,715) (3,447,663) (72) 249,829,722
Provision for impairment of inventory 3,486,430 - - (9,351) - 3,477,079Provision for impairment of long-term investment 1,220,000 - - - - 1,220,000Provision for impairment of investment properties 1,877,432 - - - - 1,877,432Provision for impairment of fixed assets 527,812,271 5,826 - (18,703,053) - 509,115,044Provision for impairment of goodwill 197,410,739 - - - - 197,410,739
Subtotal 731,806,872 5,826 - (18,712,404) - 713,100,294
983,369,617 2,174,253 (453,715) (22,160,067) (72) 962,930,016
31 December 2020
Increase in 31 December the current Decrease in the current year 31 December
2019 year Reversal Write-off Others 2020
Provision for bad debt of accounts receivable 185,971,013 100,616 (543,980) (2,085,558) (4,444) 183,437,647Including: Provision for bad debt recognised
individually 26,251,710 - (9,690) - - 26,242,020Provision for bad debt recognised on grouping basis 159,719,303 100,616 (534,290) (2,085,558) (4,444) 157,195,627
Provision for bad debt of other receivables 73,364,846 512,250 (1,533,726) (4,337,210) - 68,006,160Provision for bad debt of other current asset 228,257 - (109,319) - - 118,938
Subtotal 259,564,116 612,866 (2,187,025) (6,422,768) (4,444) 251,562,745
Provisions for impairment of inventory 3,538,702 - - (52,272) - 3,486,430Provisions for impairment of long-term investment 1,220,000 - - - - 1,220,000Provisions for impairment of investment properties 2,349,349 - - - (471,917) 1,877,432Provisions for impairment of fixed assets 469,369,758 130,553,700 - (71,740,779) (370,408) 527,812,271Provisions for impairment of goodwill 197,410,739 - - - - 197,410,739
Subtotal 673,888,548 130,553,700 - (71,793,051) (842,325) 731,806,872
933,452,664 131,166,566 (2,187,025) (78,215,819) (846,769) 983,369,617

62 Interim Report 2021
4 NOTES TO THE CONSOLIDATED FINANCIAL STATEMENTS (CONT’D)
(19) Other non-current assets
30 June 31 December 2021 2020 (unaudited)
Prepayments for construction and equipment 100,966,627 57,672,911
(20) Short-term borrowings
30 June 31 December Currency 2021 2020 (unaudited)
Unsecured loan(i) HKD 249,630,000 252,480,000Inter-bank borrowing(ii) RMB 200,000,000 450,000,000Interest payable RMB 625,705 793,054
450,255,705 703,273,054
(i) As at 30 June 2021, short-term loan represents the borrowing from bank, with RMB249,630,000 (Original foreign currency: HKD300,000,000) to Hong Kong Company, a subsidiary of the Company (As at 31 December 2020: RMB252,480,000 (Original foreign currency: HKD300,000,000)).
(ii) On 25 June 2021, inter-bank borrowing has been borrowed by the Finance Company, a subsidiary of the Company and has been settled on 2 July 2021.
As at 30 June 2021, the interest rate of short-term borrowings is from 0.97% to 2.60% (31 December 2020: from 1.31% to 3.58%).
(21) Notes payable
30 June 31 December 2021 2020 (unaudited)
Trade acceptance notes 23,676,540 43,437,492Bank acceptance notes 168,570,558 106,054,100
192,247,098 149,491,592
Other cash balances of 0 (31 December 2020: 3,180,000) are pledged as collateral for the bank acceptance notes of the Group (Note 4(1)(iii)).

Interim Report 2021 63
4 NOTES TO THE CONSOLIDATED FINANCIAL STATEMENTS (CONT’D)
(22) Accounts payable
30 June 31 December 2021 2020 (unaudited)
Payable for materials and packing purchase 3,106,775,701 2,001,620,780Payable for beer purchase due to related parties(Note 8(5)) 160,693,752 140,979,145Payable for promotional goods 106,941,833 68,107,878Others 12,948,868 11,893,239
3,387,360,154 2,222,601,042
(i) Accounts payable are mainly recorded based on the dates of transactions and the ageing based on their recording dates is analysed as follows:
30 June 31 December 2021 2020 (unaudited)
Within 1 year 3,375,414,021 2,207,455,0411 to 2 years 3,114,538 6,103,7142 to 3 years 2,733,438 2,476,483Over 3 years 6,098,157 6,565,804
3,387,360,154 2,222,601,042
(ii) As at 30 June 2021, accounts payable over one year with carrying amount of 11,946,133 (31 December 2020: 15,146,001) are mainly payables for materials purchase, for which has not yet been completed.
(23) Contract liabilities
30 June 31 December 2021 2020 (unaudited)
Dealer contract liabilities 5,244,815,963 6,567,320,256
As at 30 June 2021, a majority of opening balance of contract liabilities has been transferred to revenue.
As at 30 June 2021, the Group listed the value-added tax corresponding to contract liabilities of RMB97,968,362 in other current liabilities (31 December 2020: 296,004,209)
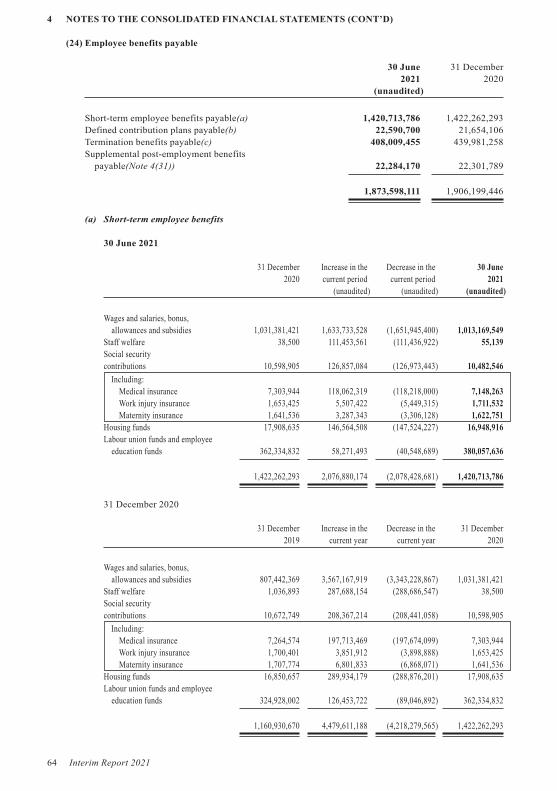
64 Interim Report 2021
4 NOTES TO THE CONSOLIDATED FINANCIAL STATEMENTS (CONT’D)
(24) Employee benefits payable
30 June 31 December 2021 2020 (unaudited)
Short-term employee benefits payable(a) 1,420,713,786 1,422,262,293Defined contribution plans payable(b) 22,590,700 21,654,106Termination benefits payable(c) 408,009,455 439,981,258Supplemental post-employment benefits payable(Note 4(31)) 22,284,170 22,301,789
1,873,598,111 1,906,199,446
(a) Short-term employee benefits
30 June 2021
31 December Increase in the Decrease in the 30 June 2020 current period current period 2021 (unaudited) (unaudited) (unaudited)
Wages and salaries, bonus, allowances and subsidies 1,031,381,421 1,633,733,528 (1,651,945,400) 1,013,169,549Staff welfare 38,500 111,453,561 (111,436,922) 55,139Social securitycontributions 10,598,905 126,857,084 (126,973,443) 10,482,546
Including: Medical insurance 7,303,944 118,062,319 (118,218,000) 7,148,263 Work injury insurance 1,653,425 5,507,422 (5,449,315) 1,711,532 Maternity insurance 1,641,536 3,287,343 (3,306,128) 1,622,751
Housing funds 17,908,635 146,564,508 (147,524,227) 16,948,916Labour union funds and employee education funds 362,334,832 58,271,493 (40,548,689) 380,057,636
1,422,262,293 2,076,880,174 (2,078,428,681) 1,420,713,786
31 December 2020
31 December Increase in the Decrease in the 31 December 2019 current year current year 2020
Wages and salaries, bonus, allowances and subsidies 807,442,369 3,567,167,919 (3,343,228,867) 1,031,381,421Staff welfare 1,036,893 287,688,154 (288,686,547) 38,500Social securitycontributions 10,672,749 208,367,214 (208,441,058) 10,598,905
Including: Medical insurance 7,264,574 197,713,469 (197,674,099) 7,303,944 Work injury insurance 1,700,401 3,851,912 (3,898,888) 1,653,425 Maternity insurance 1,707,774 6,801,833 (6,868,071) 1,641,536
Housing funds 16,850,657 289,934,179 (288,876,201) 17,908,635Labour union funds and employee education funds 324,928,002 126,453,722 (89,046,892) 362,334,832
1,160,930,670 4,479,611,188 (4,218,279,565) 1,422,262,293

Interim Report 2021 65
4 NOTES TO THE CONSOLIDATED FINANCIAL STATEMENTS (CONT’D)
(24) Employee benefits payable
(b) Defined contribution plans
30 June 2021
31 December Increase in the Decrease in the 30 June 2020 current period current period 2021 (unaudited) (unaudited) (unaudited)
Basic pension 17,600,339 226,374,721 (225,441,946) 18,533,114Unemployment insurance 4,053,767 8,711,290 (8,707,471) 4,057,586
21,654,106 235,086,011 (234,149,417) 22,590,700
31 December 2020
31 December Increase in the Decrease in the 31 December 2019 current year current year 2020
Basic pension 19,261,897 167,177,448 (168,839,006) 17,600,339Unemployment insurance 4,409,265 6,199,518 (6,555,016) 4,053,767
23,671,162 173,376,966 (175,394,022) 21,654,106
(c) Termination benefits
30 June 31 December 2021 2020 (unaudited)
Early retirement benefits(Note 4(31)) 135,918,992 133,239,157Other termination benefits(i) 272,090,463 306,742,101
408,009,455 439,981,258
(i) For the six months ended 30 June 2021, the Group has paid termination benefit of 6,374,982, mainly due to termination of labour relationship. (For the six months ended 30 June 2020: 11,069,869)

66 Interim Report 2021
4 NOTES TO THE CONSOLIDATED FINANCIAL STATEMENTS (CONT’D)
(25) Taxes payable
30 June 31 December 2021 2020 (unaudited)
Enterprise income tax 579,867,385 246,490,851Consumption tax(i) 277,251,020 203,604,649Unpaid VAT 253,459,865 36,915,626City maintenance and construction tax 31,214,539 8,168,453Education surcharge 23,309,565 7,048,785Others 51,528,128 45,798,483
1,216,630,502 548,026,847
(i) As at 30 June 2021, the Company’s individual subsidiaries have accumulated outstanding consumption tax balances from previous years amounting to approximately RMB41,883,000, and the local tax authorities have not yet required these subsidiaries to pay.
(26) Other payables
30 June 31 December 2021 2020 (unaudited)
Dividend payable 1,024,247,817 11,700,168Accruals for transportation expenses 972,052,439 343,883,695Guarantee deposits 904,163,041 800,813,929Payables for equipments and engineering construction 685,101,744 566,763,419Accruals for advertising expenses 658,237,035 370,800,664Restricted stock repurchase obligations(Note 12) (Note 4(34)) 275,682,420 279,576,000Accruals for labour expenses 121,333,182 78,609,432Compensation collected in advance for demolition project 100,000,000 106,216,173Accruals for administrative expenses 78,442,308 38,127,322Accruals for water, electricity and steam expenses 71,077,734 56,502,716Withholding social expenses for staff 16,186,818 10,185,931Absorbed deposits from related parties by Finance Company(i) 10,669,606 224,353Others 389,463,554 411,474,406
5,306,657,698 3,074,878,208
(i) It represents the principal and interest of deposits absorbed from the Company’s associates by Finance Company, a subsidiary of the Company.
As at 30 June 2021, other payables over one year with carrying amount of 656,119,046 (31 December 2020: 587,962,603) are mainly liabilities due to acquisition of subsidiaries and payables for equipments and engineering construction.

Interim Report 2021 67
4 NOTES TO THE CONSOLIDATED FINANCIAL STATEMENTS (CONT’D)
(27) Current portion of non-current liabilities
30 June 31 December 2021 2020 (unaudited)
Current portion of long-term borrowings(i) - 215,720Current portion of lease liabilities(note 4(28)) 46,752,841 41,873,577
46,752,841 42,089,297
(i) As at 31 December 2020, current portion of long-term borrowings of RMB215,720 (Original foreign currency: DKK 200,000) is guaranteed by Beijing Development and Reform Commission, which has been repaid on 1 April 2021.
(28) Lease liabilities
30 June 31 December 2021 2020 (unaudited)
Lease liabilities 158,287,899 157,713,446Less: Current portion of lease liabilities(Note 4(27)) (46,752,841) (41,873,577)
111,535,058 115,839,869
As at 30 June 2021, the Group has no liabilities that will lead to potential cash outflow at the end of the term.
(29) Long-term payables
30 June 31 December 2021 2020 (unaudited)
Payables for specific projects 288,053,679 462,046,060
Payables for specific projects mainly represent the relocation compensation received by subsidiaries from the government. As the relocation has not yet been completed, the amount was temporarily accounted for as “payables for specific projects” in accordance with the requirements under No. 3 Interpretation of Accounting Standards for Business Enterprises issued by the Ministry of Finance.
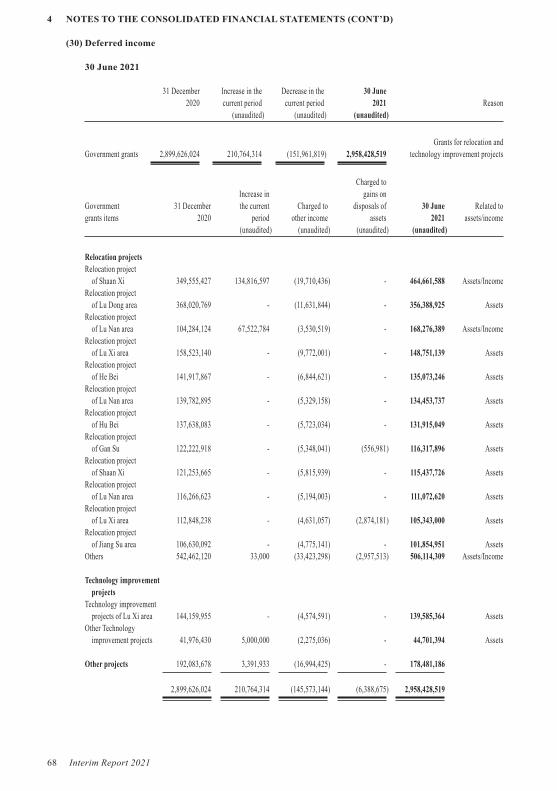
68 Interim Report 2021
4 NOTES TO THE CONSOLIDATED FINANCIAL STATEMENTS (CONT’D)
(30) Deferred income
30 June 2021
31 December Increase in the Decrease in the 30 June 2020 current period current period 2021 Reason (unaudited) (unaudited) (unaudited)
Grants for relocation and Government grants 2,899,626,024 210,764,314 (151,961,819) 2,958,428,519 technology improvement projects
Charged to Increase in gains on Government 31 December the current Charged to disposals of 30 June Related to grants items 2020 period other income assets 2021 assets/income (unaudited) (unaudited) (unaudited) (unaudited)
Relocation projectsRelocation project of Shaan Xi 349,555,427 134,816,597 (19,710,436) - 464,661,588 Assets/IncomeRelocation project of Lu Dong area 368,020,769 - (11,631,844) - 356,388,925 AssetsRelocation project of Lu Nan area 104,284,124 67,522,784 (3,530,519) - 168,276,389 Assets/IncomeRelocation project of Lu Xi area 158,523,140 - (9,772,001) - 148,751,139 AssetsRelocation project of He Bei 141,917,867 - (6,844,621) - 135,073,246 AssetsRelocation project of Lu Nan area 139,782,895 - (5,329,158) - 134,453,737 AssetsRelocation project of Hu Bei 137,638,083 - (5,723,034) - 131,915,049 AssetsRelocation project of Gan Su 122,222,918 - (5,348,041) (556,981) 116,317,896 AssetsRelocation project of Shaan Xi 121,253,665 - (5,815,939) - 115,437,726 AssetsRelocation project of Lu Nan area 116,266,623 - (5,194,003) - 111,072,620 AssetsRelocation project of Lu Xi area 112,848,238 - (4,631,057) (2,874,181) 105,343,000 AssetsRelocation project of Jiang Su area 106,630,092 - (4,775,141) - 101,854,951 AssetsOthers 542,462,120 33,000 (33,423,298) (2,957,513) 506,114,309 Assets/Income
Technology improvement projectsTechnology improvement projects of Lu Xi area 144,159,955 - (4,574,591) - 139,585,364 AssetsOther Technology improvement projects 41,976,430 5,000,000 (2,275,036) - 44,701,394 Assets
Other projects 192,083,678 3,391,933 (16,994,425) - 178,481,186
2,899,626,024 210,764,314 (145,573,144) (6,388,675) 2,958,428,519

Interim Report 2021 69
4 NOTES TO THE CONSOLIDATED FINANCIAL STATEMENTS (CONT’D)
(30) Deferred income (Cont’d)
31 December 2020
31 December Increase in the Decrease in the 31 December 2019 current year current year 2020 Reason
Grants for relocation and Government grants 2,519,926,935 663,403,883 (283,704,794) 2,899,626,024 technology improvement projects
Charged to Increase in gains on Government 31 December the current Charged to disposals of 31 December Related to grants items 2019 year other income assets 2020 assets/income
Relocation projectsRelocation project of Lu Dong area 399,039,710 - (31,018,941) - 368,020,769 AssetsRelocation project of Shaan Xi 176,686,902 178,023,196 (5,154,671) - 349,555,427 Assets/IncomeRelocation project of Lu Xi area 98,699,600 67,641,158 (7,817,618) - 158,523,140 Assets/IncomeRelocation project of He Bei 41,630,253 101,505,914 (1,218,300) - 141,917,867 AssetsRelocation project of Lu Nan area 150,441,211 - (10,658,316) - 139,782,895 AssetsRelocation project of Hu Bei 149,099,992 - (11,461,909) - 137,638,083 AssetsRelocation project of Gan Su 134,427,971 - (10,753,146) (1,451,907) 122,222,918 AssetsRelocation project of Shaan Xi 132,885,544 - (11,631,879) - 121,253,665 AssetsRelocation project of Lu Nan area 126,703,263 - (10,436,640) - 116,266,623 AssetsRelocation project of Lu Xi area 129,770,199 - (10,264,227) (6,657,734) 112,848,238 AssetsRelocation project of Jiang Su 116,180,374 - (9,550,282) - 106,630,092 AssetsRelocation project of Lu Nan area - 106,284,976 (2,000,852) - 104,284,124 Assets/IncomeOther relocation projects 611,144,937 66,000 (68,748,817) - 542,462,120 Assets/Income
Technology improvement projectsTechnology improvement projects of Lu Xi area - 145,920,000 (1,760,045) - 144,159,955 AssetsOther Technology improvement projects 25,940,543 20,000,000 (3,749,970) (214,143) 41,976,430 Assets
Other projects 227,276,436 43,962,639 (77,620,239) (1,535,158) 192,083,678
2,519,926,935 663,403,883 (273,845,852) (9,858,942) 2,899,626,024
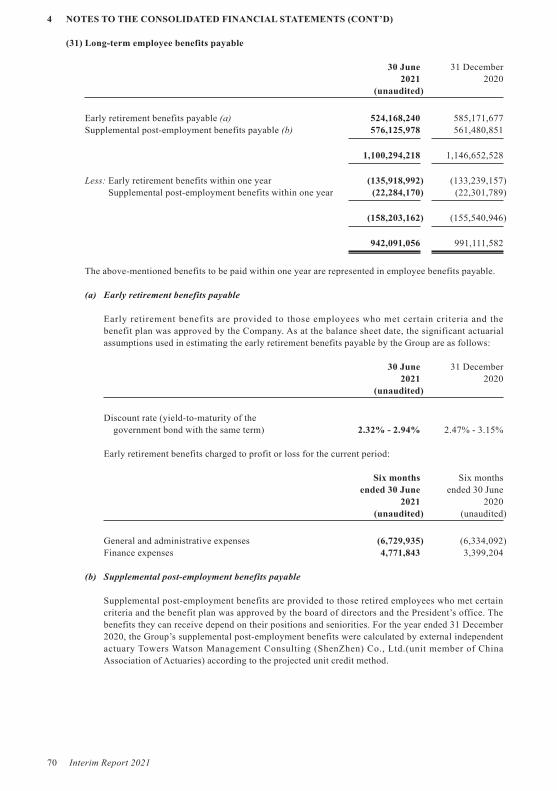
70 Interim Report 2021
4 NOTES TO THE CONSOLIDATED FINANCIAL STATEMENTS (CONT’D)
(31) Long-term employee benefits payable
30 June 31 December 2021 2020 (unaudited)
Early retirement benefits payable (a) 524,168,240 585,171,677Supplemental post-employment benefits payable (b) 576,125,978 561,480,851
1,100,294,218 1,146,652,528
Less: Early retirement benefits within one year (135,918,992) (133,239,157)Supplemental post-employment benefits within one year (22,284,170) (22,301,789)
(158,203,162) (155,540,946)
942,091,056 991,111,582
The above-mentioned benefits to be paid within one year are represented in employee benefits payable.
(a) Early retirement benefits payable
Early retirement benefits are provided to those employees who met certain criteria and the benefit plan was approved by the Company. As at the balance sheet date, the significant actuarial assumptions used in estimating the early retirement benefits payable by the Group are as follows:
30 June 31 December 2021 2020 (unaudited)
Discount rate (yield-to-maturity of the government bond with the same term) 2.32% - 2.94% 2.47% - 3.15%
Early retirement benefits charged to profit or loss for the current period:
Six months Six months ended 30 June ended 30 June 2021 2020 (unaudited) (unaudited)
General and administrative expenses (6,729,935) (6,334,092)Finance expenses 4,771,843 3,399,204
(b) Supplemental post-employment benefits payable
Supplemental post-employment benefits are provided to those retired employees who met certain criteria and the benefit plan was approved by the board of directors and the President’s office. The benefits they can receive depend on their positions and seniorities. For the year ended 31 December 2020, the Group’s supplemental post-employment benefits were calculated by external independent actuary Towers Watson Management Consulting (ShenZhen) Co., Ltd.(unit member of China Association of Actuaries) according to the projected unit credit method.

Interim Report 2021 71
4 NOTES TO THE CONSOLIDATED FINANCIAL STATEMENTS (CONT’D)
(31) Long-term employee benefits payable (Cont’d)
(b) Supplemental post-employment benefits payable (Cont’d)
(i) Supplemental post-employment benefits obligations of the Group:
30 June 31 December 2021 2020 (unaudited)
Defined benefit obligations 576,125,978 561,480,851Less: Fair value of plan assets - -
Defined benefit liabilities 576,125,978 561,480,851
(ii) The movements in supplemental post-employment benefits of the Group are as follows:
Present value of the defined benefit obligation
As at 1 January 2021 561,480,851
Amount charged to profit or loss in the current period (unaudited)— Service cost 15,249,265— Interest expense on the net defined benefit obligations 10,261,667Re-measurement amount (unaudited)— Actuarial gain (Note 4(35)) -Payment (unaudited) (10,865,805)
As at 30 June 2021 (unaudited) 576,125,978
Present value of the defined benefit obligation
As at 1 January 2020 431,634,962
Amount charged to profit or loss in the current year— Service cost 158,203,598— Interest expense on the net defined benefit obligations 10,735,000Re-measurement amount— Actuarial loss (Note 4(35)) (17,790,000)Payment (21,302,709)
As at 31 December 2020 561,480,851

72 Interim Report 2021
4 NOTES TO THE CONSOLIDATED FINANCIAL STATEMENTS (CONT’D)
(31) Long-term employee benefits payable (Cont’d)
(b) Supplemental post-employment benefits payable (Cont’d)
(iii) The significant actuarial assumptions for the present value of the defined benefit obligations of the Group are as follows:
30 June 31 December 2021 2020 (unaudited)
Discount rate 3.75% 3.75%
Mortality refers to China Life Insurance Mortality Table (2010-2013).
The salary growth rate of in-service personnel is determined by the Group’s post-employment welfare policy and the average social salary growth rate.
(iv) The sensitivity of the significant actuarial assumptions for the present value of defined benefit obligations is analysed as follows:
Impact on defined benefit obligation
Change in Increase in Decrease in assumption assumption assumption
Discount rate 0.25% Decrease by 3.52% Increase by 3.73%
The sensitivity analyses above are based on a change in an assumption while keeping all other assumptions constant. However, various assumptions may be correlated actually. When calculating the sensitivity analyses of present value of the defined benefit obligation, the same method, projected unit credit method, has been applied as well.
(v) The Group has not invested in any plan assets, and no separate trustee-administered assets to reimburse the payment of the defined benefit obligation of the Group (31 December 2020: nil).
(vi) The weighted average duration of the defined benefit obligations is 14.5 years (31 December 2020: 14.5 years).
(vii) Supplemental post-employment benefits caused many risks to the Group, and the primary risk is the fluctuation of the interest rate of government bonds. Decreasing in interest rate of government bonds results in increasing in the defined benefit obligation.

Interim Report 2021 73
4 NOTES TO THE CONSOLIDATED FINANCIAL STATEMENTS (CONT’D)
(32) Share capital
31 December Movements in the 30 June 2020 current period 2021 (unaudited) (unaudited)
RMB-denominated ordinary shares(i) 709,113,617 294,000 709,407,617Foreign shares listed overseas 655,069,178 - 655,069,178
1,364,182,795 294,000 1,364,476,795
31 December Movements in the 31 December 2019 current year 2020
RMB-denominated ordinary shares 695,913,617 13,200,000 709,113,617Foreign shares listed overseas 655,069,178 - 655,069,178
1,350,982,795 13,200,000 1,364,182,795
(i) For the restricted share incentive plan carried out by the Group, please refer to Note 12 for details
(33) Capital surplus
31 December Increase in the Decrease in the 30 June 2020 current period current period 2021 (unaudited) (unaudited) (unaudited)
Share premium (i) 3,444,813,522 5,932,920 - 3,450,746,442Other capital surplus — 230,478,101 157,515,865 - 387,993,966 Share of changes in equity other than comprehensive income and profit distribution of investees accounted for using the equity method (10,186,174) 1,981 - (10,184,193) Share-based payment included in shareholders’ equity(i) 142,725,847 157,486,792 - 300,212,639 Transfer from capital surplus recognised under the previous accounting system 93,338,214 - - 93,338,214 Others 4,600,214 27,092 - 4,627,306\
3,675,291,623 163,448,785 - 3,838,740,408

74 Interim Report 2021
4 NOTES TO THE CONSOLIDATED FINANCIAL STATEMENTS (CONT’D)
(33) Capital surplus (Cont’d)
31 December Increase in the Decrease in the 31 December 2019 current year current year 2020
Share premium 3,356,662,970 267,543,966 (179,393,414) 3,444,813,522Other capital surplus — 87,654,485 142,823,616 - 230,478,101 Share of changes of equity other than comprehensive income and profits distribution of investees accounted for using the equity method (10,196,463) 10,289 - (10,186,174) Share-based payment included in shareholders’ equity - 142,725,847 - 142,725,847 Transfer from capital surplus recognised under the previous accounting system 93,338,214 - - 93,338,214 Others 4,512,734 87,480 - 4,600,214
3,444,317,455 410,367,582 (179,393,414) 3,675,291,623
(i) As stated in Note 12, in 2021, the Company received a total of RMB6,226,920 of capital contributions from 34 incentive recipients of the restricted share incentive plan. After the recognition of the share capital of RMB294,000, the difference of RMB5,932,920 is included in the capital surplus. For the six months ended 30 June 2021, the Group recognised the general and administrative expenses of RMB123,108,005 for the restricted share incentive plan and increased the capital surplus accordingly. At the same time, the Group recognised deferred income tax assets of RMB63,049,774 for temporary differences arising from the recognition of equity incentive expenses, of which RMB27,974,814 was included in income tax expenses, RMB696,173 was recognised as minority interests, and the difference of RMB34,378,787 was included in capital surplus (2020: the Company received a total of RMB279,576,000 of capital contributions from 627 incentive participants of the restricted share incentive plan. After the recognition of the share capital of RMB13,200,000, the difference of RMB266,376,000 is included in the capital surplus. The Group recognised the general and administrative expenses of RMB127,595,083 for the restricted share incentive plan and increased the capital surplus accordingly. Meanwhile, the Group recognised deferred income tax assets of RMB44,341,848 for temporary differences arising from the recognition of equity incentive expenses, of which RMB28,856,747 was included in income tax expenses, RMB354,337 was recognised in minority interests, and the difference of RMB15,130,764 was included in capital surplus).
(34) Treasury stock
31 December Increase in the Decrease in the 30 June 2020 current period current period 2021 (unaudited) (unaudited) (unaudited)
Treasury stock(i) 279,576,000 6,226,920 (10,120,500) 275,682,420
31 December Increase in the Decrease in the 31 December 2019 current year current year 2020
Treasury stock - 279,576,000 - 279,576,000
(i) The Group recognises the repurchase obligation due to the implementation of the restricted share incentive plan, please refer to Note 12 for details.

Interim Report 2021 75
4 NOTES TO THE CONSOLIDATED FINANCIAL STATEMENTS (CONT’D)
(35) Other comprehensive income
Other comprehensive income in the balance sheet Other comprehensive income in the income statement of six months ended 30 June 2021
Less: Transfer out from which were recognised in other Attributable Attributable to The pre-tax comprehensive Attributable to to the shareholders of amount in income in the shareholders non-controlling 31 December the Company, 30 June the current previous Less: Income of the Company, interests, 2020 net of tax 2021 period periods tax expenses net of tax net of tax (unaudited) (unaudited) (unaudited) (unaudited) (unaudited) (unaudited) (unaudited)
Items that shall not be subsequently reclassified to profit or loss Changes arising from re-measurement of defined benefit plan liabilities (Note 4(31)(b)(ii)) (31,571,000) - (31,571,000) - - - - -
Items that will be subsequently reclassified to profit or loss Shares of other comprehensive income of investees accounted for using the equity method that will be subsequently reclassified to profit or loss (585,452) (137,707) (723,159) (137,707) - - (137,707) - Currency translation differences 12,305,113 1,588,682 13,893,795 1,588,682 - - 1,588,682 -
(19,851,339) 1,450,975 (18,400,364) 1,450,975 - - 1,450,975 -
Other comprehensive income in the balance sheet Other comprehensive income in the income statement of 2020
Less: Transfer out from which were recognised in other Attributable Attributable to The pre-tax comprehensive Attributable to to the shareholders of amount in income in the shareholders non-controlling 31 December the Company, 31 December the current previous Less: Income of the Company, interests, 2019 net of tax 2020 year periods tax expenses net of tax net of tax
Items that shall not be subsequently reclassified to profit or loss Changes arising from re-measurement of defined benefit plan liabilities (Note 4(31)(b)(ii)) (49,361,000) 17,790,000 (31,571,000) 17,790,000 - - 17,790,000 -
Items that will be subsequently reclassified to profit or loss Shares of other comprehensive income of investees accounted for using the equity method that will be subsequently reclassified to profit or loss (657,778) 72,326 (585,452) 72,326 - - 72,326 - Currency translation differences 2,671,145 9,633,968 12,305,113 9,633,968 - - 9,633,968 -
(47,347,633) 27,496,294 (19,851,339) 27,496,294 - - 27,496,294 -
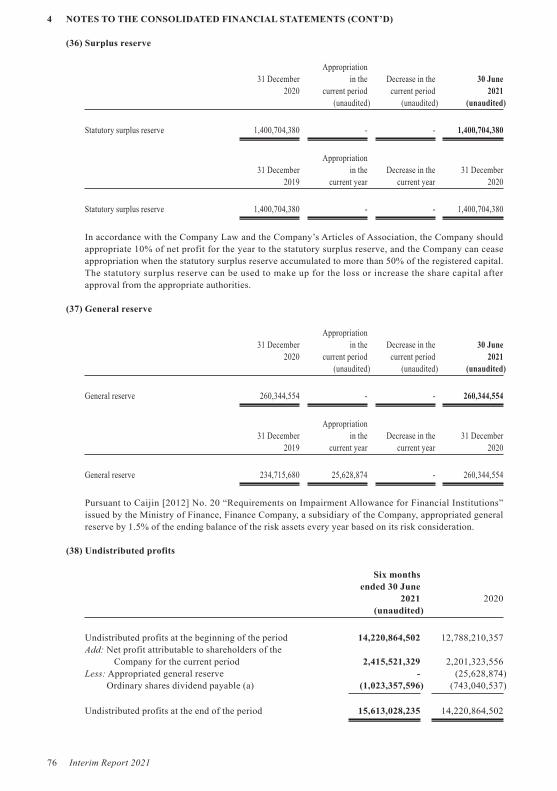
76 Interim Report 2021
4 NOTES TO THE CONSOLIDATED FINANCIAL STATEMENTS (CONT’D)
(36) Surplus reserve
Appropriation 31 December in the Decrease in the 30 June 2020 current period current period 2021 (unaudited) (unaudited) (unaudited)
Statutory surplus reserve 1,400,704,380 - - 1,400,704,380
Appropriation 31 December in the Decrease in the 31 December 2019 current year current year 2020
Statutory surplus reserve 1,400,704,380 - - 1,400,704,380
In accordance with the Company Law and the Company’s Articles of Association, the Company should appropriate 10% of net profit for the year to the statutory surplus reserve, and the Company can cease appropriation when the statutory surplus reserve accumulated to more than 50% of the registered capital. The statutory surplus reserve can be used to make up for the loss or increase the share capital after approval from the appropriate authorities.
(37) General reserve
Appropriation 31 December in the Decrease in the 30 June 2020 current period current period 2021 (unaudited) (unaudited) (unaudited)
General reserve 260,344,554 - - 260,344,554
Appropriation 31 December in the Decrease in the 31 December 2019 current year current year 2020
General reserve 234,715,680 25,628,874 - 260,344,554
Pursuant to Caijin [2012] No. 20 “Requirements on Impairment Allowance for Financial Institutions” issued by the Ministry of Finance, Finance Company, a subsidiary of the Company, appropriated general reserve by 1.5% of the ending balance of the risk assets every year based on its risk consideration.
(38) Undistributed profits
Six months ended 30 June 2021 2020 (unaudited)
Undistributed profits at the beginning of the period 14,220,864,502 12,788,210,357Add: Net profit attributable to shareholders of the Company for the current period 2,415,521,329 2,201,323,556Less: Appropriated general reserve - (25,628,874) Ordinary shares dividend payable (a) (1,023,357,596) (743,040,537)
Undistributed profits at the end of the period 15,613,028,235 14,220,864,502
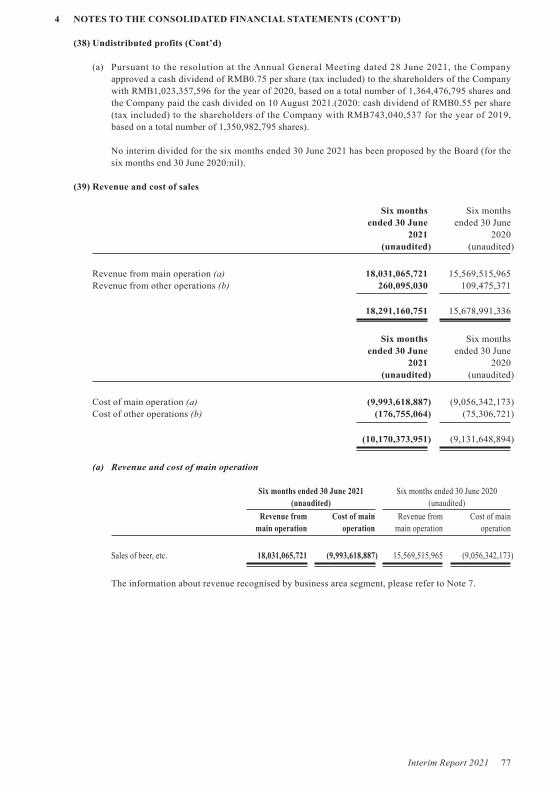
Interim Report 2021 77
4 NOTES TO THE CONSOLIDATED FINANCIAL STATEMENTS (CONT’D)
(38) Undistributed profits (Cont’d)
(a) Pursuant to the resolution at the Annual General Meeting dated 28 June 2021, the Company approved a cash dividend of RMB0.75 per share (tax included) to the shareholders of the Company with RMB1,023,357,596 for the year of 2020, based on a total number of 1,364,476,795 shares and the Company paid the cash divided on 10 August 2021.(2020: cash dividend of RMB0.55 per share (tax included) to the shareholders of the Company with RMB743,040,537 for the year of 2019, based on a total number of 1,350,982,795 shares).
No interim divided for the six months ended 30 June 2021 has been proposed by the Board (for the six months end 30 June 2020:nil).
(39) Revenue and cost of sales
Six months Six months ended 30 June ended 30 June 2021 2020 (unaudited) (unaudited)
Revenue from main operation (a) 18,031,065,721 15,569,515,965Revenue from other operations (b) 260,095,030 109,475,371
18,291,160,751 15,678,991,336
Six months Six months ended 30 June ended 30 June 2021 2020 (unaudited) (unaudited)
Cost of main operation (a) (9,993,618,887) (9,056,342,173)Cost of other operations (b) (176,755,064) (75,306,721)
(10,170,373,951) (9,131,648,894)
(a) Revenue and cost of main operation
Six months ended 30 June 2021 Six months ended 30 June 2020 (unaudited) (unaudited)
Revenue from Cost of main Revenue from Cost of main main operation operation main operation operation
Sales of beer, etc. 18,031,065,721 (9,993,618,887) 15,569,515,965 (9,056,342,173)
The information about revenue recognised by business area segment, please refer to Note 7.

78 Interim Report 2021
4 NOTES TO THE CONSOLIDATED FINANCIAL STATEMENTS (CONT’D)
(39) Revenue and cost of sales (Cont’d)
(b) Revenue and cost of other operations
Six months ended 30 June 2021 Six months ended 30 June 2020 (unaudited) (unaudited)
Revenue from Cost of other Revenue from Cost of other other operations operations other operations operations
Sale of packaging materials 60,757,242 (39,211,282) 32,104,898 (16,162,094)Sale of raw materials 58,246,953 (57,578,632) 6,090,699 (5,963,437)Catering related 45,940,202 (26,361,010) 3,904,323 (1,741,467)Construction and equipment installations 19,677,643 (17,919,121) 2,759,225 (2,058,345)Others 75,472,990 (35,685,019) 64,616,226 (49,381,378)
260,095,030 (176,755,064) 109,475,371 (75,306,721)
(40) Taxes and surcharges
Six months Six months ended 30 June ended 30 June 2021 2020 Tax base (unaudited) (unaudited)
Consumption tax 989,768,837 891,833,533 Note 3City maintenance and construction tax 148,689,170 134,417,803 Note 3Education surcharges 112,221,175 101,551,781 Note 3Real estate tax 31,494,264 26,289,767Land use tax 30,066,824 26,963,555Stamp duty 14,852,508 12,327,962Others 3,531,463 10,502,859
1,330,624,241 1,203,887,260
(41) Selling and distribution expenses
Six months Six months ended 30 June ended 30 June 2021 2020 (unaudited) (unaudited)
Handing and transportation expenses 1,199,573,036 1,154,819,231Employee benefits expenses 1,055,156,817 906,330,207Advertising related expenses 723,449,008 484,432,527Administrative expenses 92,840,489 76,891,542Labour expenses 73,358,666 54,927,719Depreciation and amortisation charges 53,474,747 56,203,797Operating lease expenses 46,945,768 40,290,899Material consumptions 37,952,289 32,154,755Other expenses 62,401,487 59,403,825
3,345,152,307 2,865,454,502

Interim Report 2021 79
4 NOTES TO THE CONSOLIDATED FINANCIAL STATEMENTS (CONT’D)
(42) General and administrative expenses
Six months Six months ended 30 June ended 30 June 2021 2020 (unaudited) (unaudited)
Employee benefits expenses 337,067,752 274,395,886Share based payment expenses 123,108,005 -Depreciation and amortisation charges 100,800,970 103,765,498Administrative expenses 40,408,138 28,997,017Agency fees 21,229,242 22,056,564Repair expenses 15,319,576 12,875,427Handling and transportation expenses 5,926,399 3,986,501Insurance expenses 4,082,217 3,985,813Material consumptions 3,704,005 3,153,174Other expenses 59,903,598 49,794,828
711,549,902 503,010,708
(43) Research and development expenses
Six months Six months ended 30 June ended 30 June 2021 2020 (unaudited) (unaudited)
Employee benefits expenses 5,493,281 4,333,559Depreciation charges 1,082,392 1,173,159Material consumptions 440,046 335,573Other expenses 1,232,836 847,227
8,248,555 6,689,518
(44) Finance expenses
Six months Six months ended 30 June ended 30 June 2021 2020 (unaudited) (unaudited)
Interest payment 11,003,365 8,490,374Less: Interest income (172,412,314) (251,335,596)Exchange losses/(gains) 5,066,278 (5,494,778)Discounting impact of the long-term employee benefits payable 15,033,510 8,761,369Interest expense on lease liabilities 3,855,069 2,032,223Others 2,028,516 1,433,058
(135,425,576) (236,113,350)

80 Interim Report 2021
4 NOTES TO THE CONSOLIDATED FINANCIAL STATEMENTS (CONT’D)
(45) Expenses by nature
The cost of sales, selling and distribution expenses, general and administrative expenses and research and development expenses in the income statement classified by nature are as follows:
Six months Six months ended 30 June ended 30 June 2021 2020 (unaudited) (unaudited)
Raw materials, packaging materials and consumables used 6,967,172,141 6,135,661,953Changes in inventories of finished goods and work in progress 839,734,151 769,101,933Finished goods purchased from outside 582,626,314 542,941,953Employee benefits expenses 2,326,860,497 2,044,235,452Handling and transportation expenses 1,245,707,713 1,242,593,037Advertising related expenses 723,342,765 484,432,527Depreciation and amortisation charges 564,939,358 563,023,629Repair expenses 178,316,824 142,729,722Labour expenses 146,918,124 122,261,352Administrative expenses 136,263,976 107,988,036Share-based payment expenses 123,108,005 -Amortisation expenses of packaging materials 97,701,204 108,946,546Other expenses 302,633,643 242,887,482
14,235,324,715 12,506,803,622
(46) Other income
Six months Six months ended 30 June ended 30 June Related to 2021 2020 assets/income (unaudited) (unaudited)
Grant for relocation projects 121,729,092 92,770,029 Assets/IncomeGrant for company development 52,216,903 202,670,399 IncomeGrant for technology improvement projects 6,849,627 1,574,401 AssetsGrant for other production and operation 40,671,343 33,260,639 Assets/Income
221,466,965 330,275,468
(47) Investment income
Six months Six months ended 30 June ended 30 June 2021 2020 (unaudited) (unaudited)
Interbank negotiable certificates of deposit investment income 38,306,182 -Investment income from long-term equity investments accounted for using the equity method 18,854,829 16,497,374Others 2,787,920 5,460,989
59,948,931 21,958,363
There is no significant restriction on transferring funds in the form of investment income.
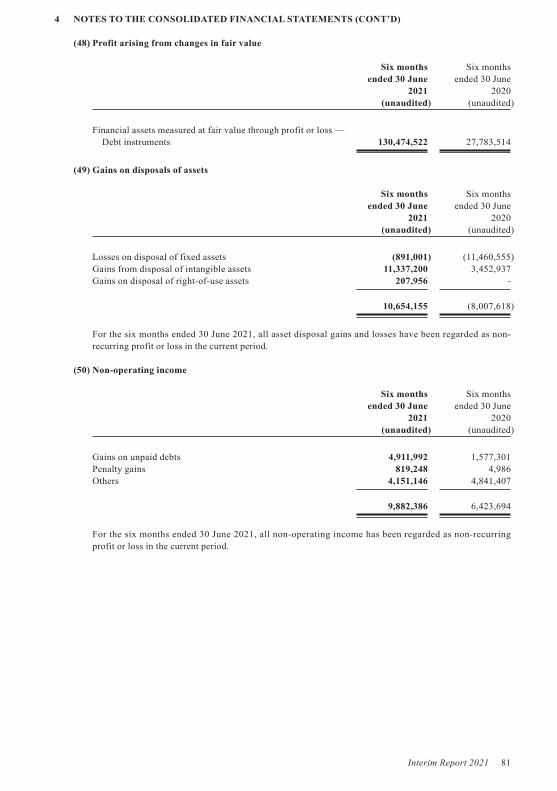
Interim Report 2021 81
4 NOTES TO THE CONSOLIDATED FINANCIAL STATEMENTS (CONT’D)
(48) Profit arising from changes in fair value
Six months Six months ended 30 June ended 30 June 2021 2020 (unaudited) (unaudited)
Financial assets measured at fair value through profit or loss — Debt instruments 130,474,522 27,783,514
(49) Gains on disposals of assets
Six months Six months ended 30 June ended 30 June 2021 2020 (unaudited) (unaudited)
Losses on disposal of fixed assets (891,001) (11,460,555)Gains from disposal of intangible assets 11,337,200 3,452,937Gains on disposal of right-of-use assets 207,956 -
10,654,155 (8,007,618)
For the six months ended 30 June 2021, all asset disposal gains and losses have been regarded as non-recurring profit or loss in the current period.
(50) Non-operating income
Six months Six months ended 30 June ended 30 June 2021 2020 (unaudited) (unaudited)
Gains on unpaid debts 4,911,992 1,577,301Penalty gains 819,248 4,986Others 4,151,146 4,841,407
9,882,386 6,423,694
For the six months ended 30 June 2021, all non-operating income has been regarded as non-recurring profit or loss in the current period.

82 Interim Report 2021
4 NOTES TO THE CONSOLIDATED FINANCIAL STATEMENTS (CONT’D)
(51) Non-operating expenses
Six months Six months ended 30 June ended 30 June 2021 2020 (unaudited) (unaudited)
Compensations, defaults and overdue fines 164,372 9,863,237Donations 11,800 13,328,950Others 307,324 477,985
483,496 23,670,172
For the six months ended 30 June 2021, all non-operating expenses have been regarded as non-recurring profit or loss in the current period.
(52) Income tax expenses
Six months Six months ended 30 June ended 30 June 2021 2020 (unaudited) (unaudited)
Current income tax calculated according to tax law and related regulations in mainland China — China enterprise income tax 1,061,024,567 849,619,347Current profits tax calculated according to tax law and related regulations in Hong Kong — Hong Kong profits tax 2,474,238 -Current profits supplemental tax calculated according to tax law and related regulations in Macau — Macau profits supplemental tax (158,016) 272,547Deferred income tax (259,345,708) (231,188,895)
803,995,081 618,702,999

Interim Report 2021 83
4 NOTES TO THE CONSOLIDATED FINANCIAL STATEMENTS (CONT’D)
(52) Income tax expenses (Cont’d)
The reconciliation from income tax calculated based on the applicable tax rates and total profit presented in the consolidated financial statements to the income tax expenses is listed below:
Six months Six months ended 30 June ended 30 June 2021 2020 (unaudited) (unaudited)
Total profit 3,290,860,296 2,558,149,824
Income tax expenses calculated at applicable tax rates 820,899,615 638,808,101Tax impact of equivalent sales and costs, expenses and losses not deductible for tax purpose 17,094,061 22,063,376Income not subject to tax (13,484,454) (10,013,778)Impact of utilisation of deductible tax losses and temporary differences from previously unrecognised deferred tax assets (58,165,322) (60,650,242)Deductible temporary differences of currently unrecognised deferred tax assets 8,746,820 7,782,065Deductible tax losses of currently unrecognised deferred tax assets 28,904,361 20,713,477
Income tax expenses 803,995,081 618,702,999
(53) Earnings per share
(a) Basic earnings per share
Basic earnings per share is calculated by dividing consolidated net profit attributable to ordinary shareholders of the Company by the weighted average numbers of ordinary shares outstanding:
Six months Six months ended 30 June ended 30 June 2021 2020 (unaudited) (unaudited)
Consolidated net profit attributable to shareholders of the Company 2,415,521,329 1,854,983,102Less: Cash dividend of restricted stocks expected to be vested in the future (10,120,500) -
Consolidated net profit attributable to ordinary shareholders of the Company 2,405,400,829 1,854,983,102
Weighted average numbers of ordinary shares outstanding 1,350,982,795 1,350,982,795
Basic earnings per share 1.780 1.373
Including: — Basic earnings per share from continuing operations 1.780 1.373

84 Interim Report 2021
4 NOTES TO THE CONSOLIDATED FINANCIAL STATEMENTS (CONT’D)
(53) Earnings per share (Cont’d)
(b) Diluted earnings per share
Diluted earnings per share is calculated by dividing net profit attributable to ordinary shareholders of the Company adjusted based on the dilutive potential ordinary share by the adjusted weighted average numbers of ordinary shares outstanding. The restricted shares incentive plan implemented by the Company has no dilutive effect on earnings per share for the six months ended 30 June 2021 (For the six months ended 30 June 2020: there were no dilutive potential ordinary shares), so diluted earnings per share equals to basic earnings per share.
(54) Notes to consolidated cash flow statement
(a) Cash received relating to other operating activities
Six months Six months ended 30 June ended 30 June 2021 2020 (unaudited) (unaudited)
Guarantee deposits 307,232,251 274,957,163Government grants 106,629,401 386,399,689Others 59,077,159 40,664,880
472,938,811 702,021,732
(b) Cash paid relating to other operating activities
Six months Six months ended 30 June ended 30 June 2021 2020 (unaudited) (unaudited)
Handling and transportation expenses 697,401,221 647,628,189Advertising related expenses 449,027,986 359,960,947Marketing and promotion expenses 411,600,122 335,010,114Administrative expenses 138,012,589 105,946,296Guarantee deposits 113,745,689 149,275,269Others 166,116,078 168,269,733
1,975,903,685 1,766,090,548
(c) Cash received relating to other investing activities
Six months Six months ended 30 June ended 30 June 2021 2020 (unaudited) (unaudited)
Interest income of Finance Company’s deposits 181,948,020 172,143,768Bidding deposits and others received 17,706,706 12,786,864
199,654,726 184,930,632
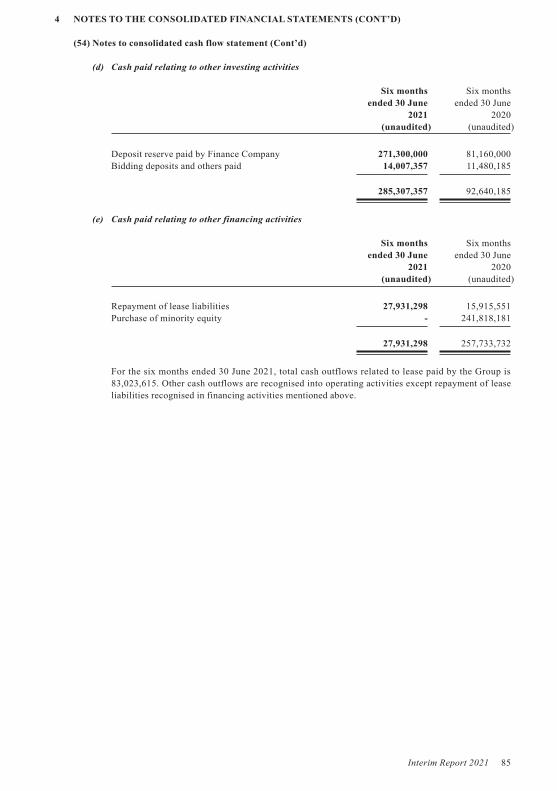
Interim Report 2021 85
4 NOTES TO THE CONSOLIDATED FINANCIAL STATEMENTS (CONT’D)
(54) Notes to consolidated cash flow statement (Cont’d)
(d) Cash paid relating to other investing activities
Six months Six months ended 30 June ended 30 June 2021 2020 (unaudited) (unaudited)
Deposit reserve paid by Finance Company 271,300,000 81,160,000Bidding deposits and others paid 14,007,357 11,480,185
285,307,357 92,640,185
(e) Cash paid relating to other financing activities
Six months Six months ended 30 June ended 30 June 2021 2020 (unaudited) (unaudited)
Repayment of lease liabilities 27,931,298 15,915,551Purchase of minority equity - 241,818,181
27,931,298 257,733,732
For the six months ended 30 June 2021, total cash outflows related to lease paid by the Group is 83,023,615. Other cash outflows are recognised into operating activities except repayment of lease liabilities recognised in financing activities mentioned above.

86 Interim Report 2021
4 NOTES TO THE CONSOLIDATED FINANCIAL STATEMENTS (CONT’D)
(55) Supplementary information to consolidated cash flow statements
(a) Supplementary information to consolidated cash flow statements
Reconciliation from net profit to cash flows from operating activities:
Six months Six months ended 30 June ended 30 June 2021 2020 (unaudited) (unaudited)
Net profit 2,486,865,215 1,939,446,825Add: Provision for asset impairment 5,826 1,538,581
Reversal for credit impairment 1,714,712 (511,352)Depreciation of right-of-use assets 25,292,012 16,295,306Depreciation of fixed assets and investment properties 444,122,995 442,534,902Amortisation of intangible assets 85,916,559 101,963,309Amortisation of long-term prepaid expenses 13,950,442 6,881,785(Gains)/loss on disposal of fixed assets and intangible assets (10,654,155) 8,007,618Profit arising from changes in fair value (130,474,522) (27,783,514)Financial expenses (148,932,204) (141,390,270)Investment income (59,948,931) (21,958,363)Increase in deferred tax assets (255,775,857) (216,247,338)Amortisation of deferred income (145,573,144) (154,919,665)Decrease in deferred tax liabilities (3,569,851) (14,941,557)Decrease in inventories 1,066,352,506 864,013,024Decrease in operating receivables 237,372,311 260,382,724Increase in operating payables 1,417,997,338 1,901,184,885
Net cash flows from operating activities 5,024,661,252 4,964,496,900
Net increase in cash and cash equivalents
Six months Six months ended 30 June ended 30 June 2021 2020 (unaudited) (unaudited)
Cash and cash equivalents at end of the period 6,846,715,666 18,065,659,709Less: Cash and cash equivalents at beginning of the period (17,643,123,424) (14,557,393,355)
Net increase in cash and cash equivalents (10,796,407,758) 3,508,266,354
(b) Cash and cash equivalents
Six months Six months ended 30 June ended 30 June 2021 2020 (unaudited) (unaudited)
Cash and cash equivalents (Note 4(1)) 6,846,715,666 18,065,659,709Including: Cash on hand 241,528 220,660
Cash at bank that can be readily drawn on demand 6,843,350,089 18,059,991,665Cash at non-financial institutions that can be readily drawn on demand 3,124,049 5,447,384
Cash and cash equivalents at end of the period 6,846,715,666 18,065,659,709

Interim Report 2021 87
4 NOTES TO THE CONSOLIDATED FINANCIAL STATEMENTS (CONT’D)
(56) Foreign currency items
30 June 2021 (unaudited)
Balance in Currency foreign exchange Balance currency rate in RMB
Cash at bank and cash on hand — USD 34,156,066 6.4601 220,651,602 HKD 72,530,968 0.8321 60,353,018 MOP 46,095,443 0.8084 37,263,556 EUR 4,219,959 7.6862 32,435,449 VND 3,018,882,528 0.0003 905,665
351,609,290
Accounts receivable — USD 4,495,458 6.4601 29,041,108 HKD 34,876,008 0.8321 29,020,326 EUR 1,859,706 7.6862 14,294,072 GBP 287,881 8.9410 2,573,944 MOP 1,559,283 0.8084 1,260,524 CAD 160,564 5.2097 836,490 VND 310,800,633 0.0003 93,240
77,119,704
Other receivables — HKD 1,251,217 0.8321 1,041,138 MOP 339,918 0.8084 274,790 VND 339,900,000 0.0003 101,970
1,417,898
Short-term borrowings — HKD 300,000,000 0.8321 249,630,000
Other payables — USD 1,334,608 6.4601 8,621,701 EUR 7,800 7.6862 59,952
8,681,653
Foreign currency monetary items mentioned above refer to all currencies except RMB (the scope is different from the foreign currency items in Note 11(1)(a)).
5 CHANGES IN CONSOLIDATION SCOPE
On 10 February 2021, the Company’s subsidiary Tsingtao Beer Culture Communication Co., Ltd. (“Culture Communication Company”) established Tsingtao Brewery fashion industry development Co., Ltd. (“Fashion Industry Company”) with a registered capital of RMB100,000,000. On 30 June 2021, the Culture Communication Company had actually contributed RMB9,100,000 in cash.
On 5 March 2021, the Company’s subsidiary Tsingtao Brewery (Taizhou) Co., Ltd. (“Taizhou Company”) completed the cancellation.

88 Interim Report 2021
6 INTERESTS IN OTHER ENTITIES
(1) Interests in subsidiaries
(a) The structure of the Group
Place of Place of Principal Registered Acquisition Name operation incorporation activities capital Share proportion method
Directly Indirectly
Shenzhen Tsingtao Brewery Shenzhen, Shenzhen, Financing 200,000,000 100% - Establishment or Huanan Holding Co., Ltd. the PRC the PRC investment (“Huanan Holding Company”)Tsingtao Brewery (Zhuhai) Co., Ltd. Zhuhai, Zhuhai, Manufacturing 60,000,000 - 100% Establishment or the PRC the PRC investmentTsingtao Brewery (Huangshi) Co., Ltd. Huangshi, Huangshi, Manufacturing 168,630,000 97.18% 2.82% Establishment or (“Huangshi Company”) the PRC the PRC investmentTsingtao Brewery (Yingcheng) Co., Ltd. Yingcheng, Yingcheng, Manufacturing 47,070,000 89.91% 10.09% Establishment or (“Yingcheng Company”) the PRC the PRC investmentShenzhen Huanan Tsingtao Brewery Guangdong, Shenzhen, Wholesale and 20,000,000 100% - Establishment or Sales Co., Ltd. (“Huanan Sales the PRC the PRC retail sale investment Company”)Tsingtao Brewery (Changsha) Co., Ltd. Changsha, Changsha, Manufacturing 68,000,000 70% 30% Establishment or (“Changsha Company”) the PRC the PRC investmentShanghai Tsingtao Brewery Huadong Shanghai, Shanghai, Wholesale and 100,000,000 100% - Establishment or (Holding) Co., Ltd. (“Huadong the PRC the PRC retail sale investment Holding Company”) Tsingtao Brewery Huadong Shanghai, Shanghai, Wholesale and 100,300,000 97.01% 2.99% Establishment or Shanghai Sales Co., Ltd. the PRC the PRC retail sale investment (“Shanghai Sales Company”)Nanjing Tsingtao Brewery Huadong Jiangsu, Nanjing, Wholesale and 1,000,000 - 100% Establishment or Sales Co., Ltd. the PRC the PRC retail sale investmentTsingtao Brewery (Wuhu) Co., Ltd. Wuhu, Wuhu, Manufacturing 314,290,000 94.27% 5.73% Establishment or (“Wuhu Company”) the PRC the PRC investmentTsingtao Brewery (Maanshan) Co., Ltd. Maanshan, Maanshan, Manufacturing 85,000,000 94.12% 5.58% Establishment or (“Maanshan Company”) the PRC the PRC investmentTsingtao Brewery (Shouguang) Co., Ltd. Shouguang, Shouguang, Manufacturing 60,606,060 99% - Establishment or (“Shouguang Company”) the PRC the PRC investmentTsingtao Brewery (Weifang) Co., Ltd. Weifang, Weifang, Manufacturing 75,000,000 100% - Establishment or (“Weifang Company”) the PRC the PRC investmentTsingtao Brewery (Xuzhou) Huaihai Jiangsu, Xuzhou, Wholesale and 131,000,000 - 100% Establishment or Sales Co., Ltd. the PRC the PRC retail sale investmentTsingtao Brewery (Xuecheng) Co., Ltd. Xuecheng, Xuecheng, Manufacturing 45,000,000 - 85% Establishment or the PRC the PRC investmentTsingtao Brewery (Tengzhou) Co., Ltd. Tengzhou, Tengzhou, Manufacturing 61,020,000 76.65% 23.35% Establishment or (“Tengzhou Company”) the PRC the PRC investmentTsingtao Brewery (Heze) Co., Ltd. Heze, Heze, Manufacturing 130,000,000 93.08% 6.92% Establishment or (“Heze Company”) the PRC the PRC investmentTsingtao Brewery (Langfang) Co., Ltd. Langfang, Langfang, Manufacturing 99,000,000 80.80% 19.20% Establishment or (“Langfang Company”) the PRC the PRC investment

Interim Report 2021 89
6 INTERESTS IN OTHER ENTITIES (CONT’D)
(1) Interests in subsidiaries (Cont’d)
(a) The structure of the Group (Cont’d)
Place of Place of Principal Registered Acquisition Name operation incorporation activities capital Share proportion method
Directly Indirectly
Tsingtao Brewery Xi’an Han’s Group Shaanxi, Xi’an, Manufacturing 287,903,022 100% - Establishment or Co., Ltd. (“Xi’an Han’s”) the PRC the PRC and Wholesale investment and retail saleTsingtao Brewery Baoji Co., Ltd. Baoji, Baoji, Manufacturing 130,000,000 - 100% Establishment or the PRC the PRC investmentTsingtao Brewery (Anshan) Co., Ltd. Anshan, Anshan, Manufacturing 50,000,000 60% - Establishment or (“Anshan Company”) the PRC the PRC investmentTsingtao Brewery (Xingkaihu) Co., Ltd. Jixi, Jixi, Manufacturing 200,000,000 100% - Establishment or (“Xingkaihu Company”) the PRC the PRC investmentTsingtao Brewery (Mishan) Co., Ltd. Mishan, Mishan, Manufacturing 118,000,000 100% - Establishment or (“Mishan Company”) the PRC the PRC investmentTsingtao Brewery (Harbin) Co., Ltd. Harbin, Harbin, Manufacturing 155,600,000 100% - Establishment or (“Harbin Company”) the PRC the PRC investmentTsingtao Brewery International Trade Qingdao, Qingdao, Wholesale and 11,000,000 100% - Establishment or Co., Ltd. (“International Trade”) the PRC the PRC retail sale investmentTsingtao Brewery (Dezhou) Co., Ltd. Dezhou, Dezhou, Manufacturing 25,000,000 100% - Establishment or (“Dezhou Company”) the PRC the PRC investmentTsingtao Brewery (Rizhao) Co., Ltd. Rizhao, Rizhao, Manufacturing 290,000,000 100% - Establishment or (“Rizhao Company”) the PRC the PRC investmentTsingtao Brewery (Luzhou) Co., Ltd. Luzhou, Luzhou, Manufacturing 111,110,000 95% - Establishment or (“Luzhou Company”) the PRC the PRC investmentHong Kong Company Hong Kong, Hong Kong, Wholesale and 40,500,000HKD 100% - Establishment or the PRC the PRC retail sale investmentTsingtao Brewery (Hanzhong) Co., Ltd. Hanzhong, Hanzhong, Manufacturing 29,410,000 34% 66% Establishment or (“Hanzhong Company”) the PRC the PRC investmentBeijing Tsingtao Brewery Beifang Sales Beijing, Beijing, Wholesale and 89,980,000 95% 5% Establishment or Co., Ltd. (“Beifang Sales Company”) the PRC the PRC retail sale investmentQingdao Guangrunlong Logistics Co., Ltd. Shandong, Qingdao, Logistics 6,184,000 100% - Establishment or (“Guangrunlong Logistics”) the PRC the PRC investmentTsingtao Brewery (Xiamen) Co., Ltd. Xiamen, Xiamen, Manufacturing 90,000,000 - 100% Establishment or (“Xiamen Company”) the PRC the PRC investmentXiamen Tsingtao Brewery Dongnan Sales Fujian, Xiamen, Wholesale and 215,000,000 100% - Establishment or Co., Ltd. (“Dongnan Sales Company”) the PRC the PRC retail sale investmentTsingtao Brewery (Jinan) Co., Ltd. Jinan, Jinan, Manufacturing 560,000,000 100% - Establishment or (“Jinan Company”) the PRC the PRC investmentTsingtao Brewery (Chengdu) Co., Ltd. Chengdu, Chengdu, Manufacturing 280,000,000 100% - Establishment or (“Chengdu Company”) the PRC the PRC investmentTsingtao Brewery (Yulin) Co., Ltd. Yulin, Yulin, Manufacturing 55,000,000 - 100% Establishment or the PRC the PRC investmentTsingtao Brewery Chengyang Sales Qingdao, Qingdao, Wholesale and 8,000,000 100% - Establishment or Co., Ltd. (“Chengyang Sales Company”) the PRC the PRC retail sale investmentTsingtao Brewery Chenzhou Sales Co., Ltd. Chenzhou, Chenzhou, Wholesale and 1,000,000 - 100% Establishment or the PRC the PRC retail sale investmentTsingtao Brewery Machinery and Qingdao, Qingdao, Construction 2,000,000 - 100% Establishment or Equipment Co., Ltd the PRC the PRC investment

90 Interim Report 2021
6 INTERESTS IN OTHER ENTITIES (CONT’D)
(1) Interests in subsidiaries (Cont’d)
(a) The structure of the Group (Cont’d)
Place of Place of Principal Registered Acquisition Name operation incorporation activities capital Share proportion method
Directly Indirectly
Tsingtao Brewery (Shijiazhuang) Shijiazhuang, Shijiazhuang, Manufacturing 321,010,000 100% - Establishment or Co., Ltd. (“Shijiazhuang Company”) the PRC the PRC investmentTsingtao Brewery (Taiyuan) Co., Ltd. Taiyuan, Taiyuan, Manufacturing 200,000,000 100% - Establishment or (“Taiyuan Company”) the PRC the PRC investmentFinance Company Qingdao, Qingdao, Financing 1,000,000,000 100% - Establishment or the PRC the PRC investmentTsingtao Brewery (Jieyang) Co., Ltd. Jieyang, Jieyang, Manufacturing 200,000,000 75% - Establishment or (“Jieyang Company”) the PRC the PRC investmentTsingtao Brewery (Shaoguan) Co., Ltd. Shaoguan, Shaoguan, Manufacturing 200,000,000 100% - Establishment or (“Shaoguan Company”) the PRC the PRC investmentTsingtao Brewery (Electronic Commerce) Qingdao, Qingdao, Wholesale and 8,000,000 100% - Establishment or Co., Ltd. (“Electornic Commerce”) the PRC the PRC retail sale investmentTsingtao Brewery (Jiujiang) Co., Ltd. Jiujiang, Jiujiang, Manufacturing 200,000,000 90% - Establishment or (“Jiujiang Company”) the PRC the PRC investmentTsingtao Brewery (Pingdu) Sales Co., Ltd. Qingdao, Qingdao, Wholesale and 5,000,000 100% - Establishment or (“Pingdu Sales Company”) the PRC the PRC retail sale investmentShanghai Tsingtao Brewery Sales Co., Ltd Shanghai, Shanghai, Wholesale and 96,300,000 - 100% Establishment or the PRC the PRC retail sale investmentTsingtao Brewery (Xuzhou) Enterprise Xuzhou, Xuzhou, Wholesale and 10,000,000 100% - Establishment or Management Service Co., Ltd. the PRC the PRC retail sale investment (“Xuzhou Enterprise Management”)Tsingtao Brewery (Luoyang) Co., Ltd. Luoyang, Luoyang, Manufacturing 200,000,000 100% - Establishment or (“Luoyang Company”) the PRC the PRC investmentTsingtao Brewery (Shanghai) industrial Shanghai, Shanghai, Wholesale and 416,800,000 100% - Establishment or Co., Ltd. (“Shanghai Industrial Company”) the PRC the PRC retail sale investmentTsingtao Brewery (Zhangjiakou) Co., Ltd. Zhangjiakou, Zhangjiakou, Manufacturing 200,000,000 100% - Establishment or (“Zhangjiakou Company”) the PRC the PRC investmentVietnam company Vietnam, Vietnam, Wholesale and 1,000,000USD - 100% Establishment or the PRC the PRC retail sale investmentTsingtao Brewery (Zaozhuang) Co., Ltd. Zaozhuang, Zaozhuang, Manufacturing 200,000,000 100% - Establishment or (“Zaozhuang Company”) the PRC the PRC investmentTsingtao Brewery (West Coast) Cultural Qingdao, Qingdao, Services 180,000,000 95% 5% Establishment or Tourism Development Co., Ltd the PRC the PRC investment (“West Coast Cultural Tourism”)Shanghai Tsingtao Catering Management Shanghai, Shanghai, Services 12,000,000 - 68% Establishment or Co., Ltd the PRC the PRC investmentFashion Industry Company Qingdao, Qingdao, Services 100,000,000 - 100% Establishment or the PRC the PRC investment

Interim Report 2021 91
6 INTERESTS IN OTHER ENTITIES (CONT’D)
(1) Interests in subsidiaries (Cont’d)
(a) The structure of the Group (Cont’d)
Place of Place of Principal Registered Acquisition Name operation incorporation activities capital Share proportion method
Directly Indirectly
Tsingtao Brewery (Sanshui) Co., Ltd. Sanshui, Sanshui, Manufacturing 5,000,000USD - 75% Business the PRC the PRC combination not under common controlTsingtao Brewery (Chenzhou) Co., Ltd. Chenzhou, Chenzhou, Manufacturing 70,000,000 88.80% 11.20% Business (“Chenzhou Company”) the PRC the PRC combination not under common controlShenzhen Tsingtao Brewery Asahi Co., Ltd. Shenzhen, Shenzhen, Manufacturing 30,000,000USD 51% - Business (“Shenzhen Asahi”) the PRC the PRC combination not under common controlNanning Tsingtao Brewery Co., Ltd. Nanning, Nanning, Manufacturing 730,000,000 - 75% Business the PRC the PRC combination not under common controlBeijing Tsingtao Brewery Three Ring Beijing, Beijing, Manufacturing 29,800,000USD 29% 25% Business Co., Ltd. (“Three Ring Company”) the PRC the PRC combination not under common controlBeijing Tsingtao Brewery Five Star Co., Ltd. Beijing, Beijing, Manufacturing 862,000,000 37.64% 25% Business (“Five Star Company”) the PRC the PRC combination not under common controlTsingtao Brewery (Weinan) Co., Ltd. Weinan, Weinan, Manufacturing 50,000,000 28% 72% Business (“Weinan Company”) the PRC the PRC combination not under common controlTsingtao Brewery (Gansu) Co., Ltd. Lanzhou, Lanzhou, Manufacturing 174,420,800 - 55.06% Business (“Gansu Nongken Company”) the PRC the PRC combination not under common controlTsingtao Brewery (Wuwei) Co., Ltd. Wuwei, Wuwei, Manufacturing 36,100,000 - 99.72% Business the PRC the PRC combination not under common controlTsingtao Brewery (Rongcheng) Co., Ltd. Rongcheng, Rongcheng, Manufacturing 20,000,000 70% - Business (“Rongcheng Company”) the PRC the PRC combination not under common control

92 Interim Report 2021
6 INTERESTS IN OTHER ENTITIES (CONT’D)
(1) Interests in subsidiaries (Cont’d)
(a) The structure of the Group (Cont’d)
Place of Place of Principal Registered Acquisition Name operation incorporation activities capital Share proportion method
Directly Indirectly
Tsingtao Brewery (Suizhou) Co., Ltd. Suizhou, Suizhou, Manufacturing 24,000,000 - 90% Business the PRC the PRC combination not under common controlTsingtao Brewery (Fuzhou) Co., Ltd. Fuzhou, Fuzhou, Manufacturing 26,828,100USD - 100% Business the PRC the PRC combination not under common controlTsingtao Brewery (Zhangzhou) Co., Ltd. Zhangzhou, Zhangzhou, Manufacturing 100,000,000 - 90% Business the PRC the PRC combination not under common controlConstruction Company Qingdao, Qingdao, Construction 13,142,176 100% - Business the PRC the PRC combination not under common controlTsingtao Brewery (Penglai) Co., Ltd. Penglai, Penglai, Manufacturing 37,500,000 80% - Business (“Penglai Company”) the PRC the PRC combination not under common controlCultural Communication Company Qingdao, Qingdao, Manufacturing 73,500,000 100% - Business the PRC the PRC combination not under common controlTsingtao Brewery Beverage Co., Ltd. Qingdao, Qingdao, Manufacturing 130,000,000 100% - Business (“Beverage Company”) the PRC the PRC combination not under common controlShandong Xin Immense Brewery Co., Ltd. Shandong, Mengyin, Manufacturing 18,760,000USD 75% 25% Business (“Immense Brewery Company”) the PRC the PRC Wholesale and combination not retail sale under common controlTsingtao Brewery (Hangzhou) Co., Ltd. Jiande, Jiande, Manufacturing 230,000,000 80% - Business (“Hangzhou Company”) the PRC the PRC combination not under common controlMacau Company Macau, Macau, Wholesale and 200,000MOP - 60% Business the PRC the PRC retail sale combination not under common controlTsingtao Brewery (Shanghai) Market Shanghai, Shanghai, Wholesale and 334,578,898 - 100% Business Service Co., Ltd. the PRC the PRC retail sale combination not under common control
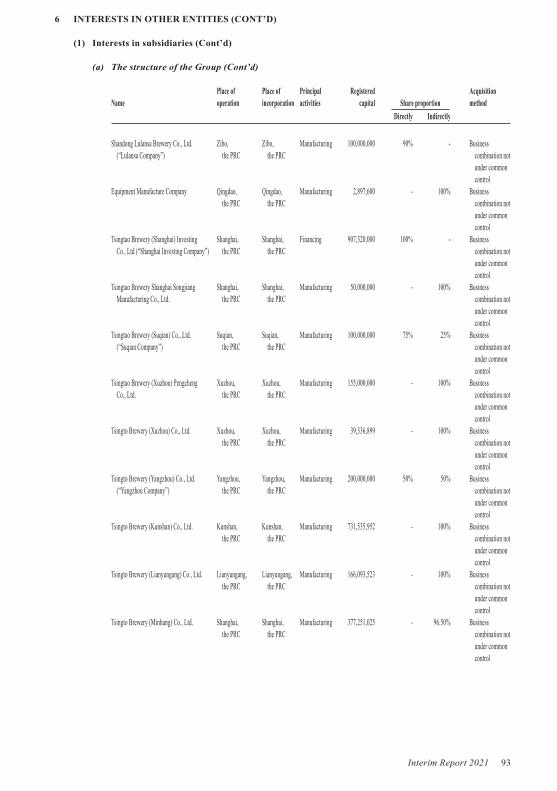
Interim Report 2021 93
6 INTERESTS IN OTHER ENTITIES (CONT’D)
(1) Interests in subsidiaries (Cont’d)
(a) The structure of the Group (Cont’d)
Place of Place of Principal Registered Acquisition Name operation incorporation activities capital Share proportion method
Directly Indirectly
Shandong Lulansa Brewery Co., Ltd. Zibo, Zibo, Manufacturing 100,000,000 90% - Business (“Lulansa Company”) the PRC the PRC combination not under common controlEquipment Manufacture Company Qingdao, Qingdao, Manufacturing 2,897,600 - 100% Business the PRC the PRC combination not under common controlTsingtao Brewery (Shanghai) Investing Shanghai, Shanghai, Financing 907,320,000 100% - Business Co., Ltd (“Shanghai Investing Company”) the PRC the PRC combination not under common controlTsingtao Brewery Shanghai Songjiang Shanghai, Shanghai, Manufacturing 50,000,000 - 100% Business Manufacturing Co., Ltd. the PRC the PRC combination not under common controlTsingtao Brewery (Suqian) Co., Ltd. Suqian, Suqian, Manufacturing 100,000,000 75% 25% Business (“Suqian Company”) the PRC the PRC combination not under common controlTsingtao Brewery (Xuzhou) Pengcheng Xuzhou, Xuzhou, Manufacturing 155,000,000 - 100% Business Co., Ltd. the PRC the PRC combination not under common controlTsingto Brewery (Xuzhou) Co., Ltd. Xuzhou, Xuzhou, Manufacturing 39,336,899 - 100% Business the PRC the PRC combination not under common controlTsingto Brewery (Yangzhou) Co., Ltd. Yangzhou, Yangzhou, Manufacturing 200,000,000 50% 50% Business (“Yangzhou Company”) the PRC the PRC combination not under common controlTsingto Brewery (Kunshan) Co., Ltd. Kunshan, Kunshan, Manufacturing 731,535,952 - 100% Business the PRC the PRC combination not under common controlTsingto Brewery (Lianyungang) Co., Ltd. Lianyungang, Lianyungang, Manufacturing 166,093,523 - 100% Business the PRC the PRC combination not under common controlTsingto Brewery (Minhang) Co., Ltd. Shanghai, Shanghai, Manufacturing 377,251,025 - 96.50% Business the PRC the PRC combination not under common control

94 Interim Report 2021
6 INTERESTS IN OTHER ENTITIES (CONT’D)
(1) Interests in subsidiaries (Cont’d)
(a) The structure of the Group (Cont’d)
Except Gansu Nongken, whose corporate category is incorporated company by shares, all of the above mentioned subsidiaries are limited liability companies.
There are no restrictions on using the assets of the Group or settling the liabilities of the Group.
(b) Subsidiaries with significant non-controlling interests
Total dividends distributed to Non-controlling the minority Share proportion of interests for the shareholders in Non-controlling Name of non-controlling six months ended six months ended interests as at subsidiaries interests 30 June 2021 30 June 2021 30 June 2021 (unaudited) (unaudited) (unaudited)
Shenzhen Asahi 49% 24,063,995 (40,870,900) 206,662,008
Summarised financial information of significant non-wholly owned subsidiaries is as follows:
As at 30 June 2021 (unaudited)
Current Non-current Total Current Non-current Total assets assets assets liabilities liabilities liabilities
Shenzhen Asahi 234,031,971 406,754,404 640,786,375 (210,223,249) (7,430,730) (217,653,979)
31 December 2020
Current Non-current Total Current Non-current Total assets assets assets liabilities liabilities liabilities
Shenzhen Asahi 253,771,498 413,666,957 667,438,455 (203,214,461) (7,352,839) (210,567,300)
Six months ended 30 June 2021 (unaudited)
Total other comprehensive Cash flows from Revenue Net profit income operating activities
Shenzhen Asahi 409,907,224 49,024,876 49,024,876 76,627,521
Six months ended 30 June 2020 (unaudited)
Total other comprehensive Cash flows from Revenue Net profit income operating activities
Shenzhen Asahi 358,727,443 42,231,113 42,231,113 48,720,976
Financial information above is the amount before offset among subsidiaries in the Group.

Interim Report 2021 95
6 INTERESTS IN OTHER ENTITIES (CONT’D)
(2) Interests in the Joint Venture and Associates
(a) Fundamental information of the significant Joint Venture and Associates
Place of Place of Strategic impact Share proportion
operation incorporation Principal activities on the Group Directly Indirectly
Joint Ventures — Hebei Jiahe Company Shijiazhuang, Shijiazhuang, Manufacturing Yes 50% - the PRC the PRC
Associates — Yantai Brewery Company Yantai, the PRC Yantai, the PRC Manufacturing Yes 39% - Zhaoshang Logistics Qingdao, the PRC Qingdao, the PRC Logistics Yes 30% - Liaoning Shenqing Shenyang, the PRC Shenyang, the PRC Wholesale and retail sale Yes 30% - European Company France France Wholesale and retail sale Yes - 40%
The equity investments above are accounted for using the equity method.
(b) Summarised financial information of the joint venture
Hebei Jiahe Company
30 June 31 December 2021 2020 (unaudited)
Current assets 111,507,100 75,750,625Including: cash and cash equivalents 45,563,946 32,858,685Non-current assets 90,248,752 90,798,553
Total assets 201,755,852 166,549,178
Current liabilities (65,044,180) (21,316,393)
Total liabilities (65,044,180) (21,316,393)
Total equity attributable to shareholders of the Company 136,711,672 145,232,785
Adjusted fair value of the identifiable net assets when obtained 69,464,910 72,841,613
Adjusted total equity attributable to shareholders of the Company 206,176,582 218,074,398
The share of net assets calculated based on the shareholding proportion(i) 103,088,291 109,037,199Adjusting item — goodwill 113,928,609 113,928,609 — unrealized profits of internal transaction - (435,888)
Book value of investment on the joint venture 217,016,900 222,529,920

96 Interim Report 2021
6 INTERESTS IN OTHER ENTITIES (CONT’D)
(2) Interests in the Joint Venture and Associates (Cont’d)
(b) Summarised financial information of the joint venture (Cont’d)
There is no quoted market price for the joint venture investment of the Group.
Hebei Jiahe Company
Six months Six months ended ended 30 June 2021 30 June 2020 (unaudited) (unaudited)
Revenue 158,303,584 183,350,951Finance expenses (221,968) (209,307)Income tax expenses (1,450,531) (3,531,910)Net profit 5,478,887 12,964,526Total comprehensive income 5,478,887 12,964,526
Adjusted fair value of the identifiable net assets when obtained (3,376,703) (3,404,413)
Adjusted total comprehensive income attributable to shareholders of the Company 2,102,184 9,560,113
Dividends received from the joint venture in the current period (7,000,000) 10,000,000
(i) The share of the net asset of the joint venture was calculated by the share proportion of the Group, based on the equity attributable to shareholders of the Company in the consolidated financial statement of the joint venture, adjusted according to the fair value of the identifiable assets and liabilities of the joint ventures at the acquisition date and conformed to accounting policies of the Group.
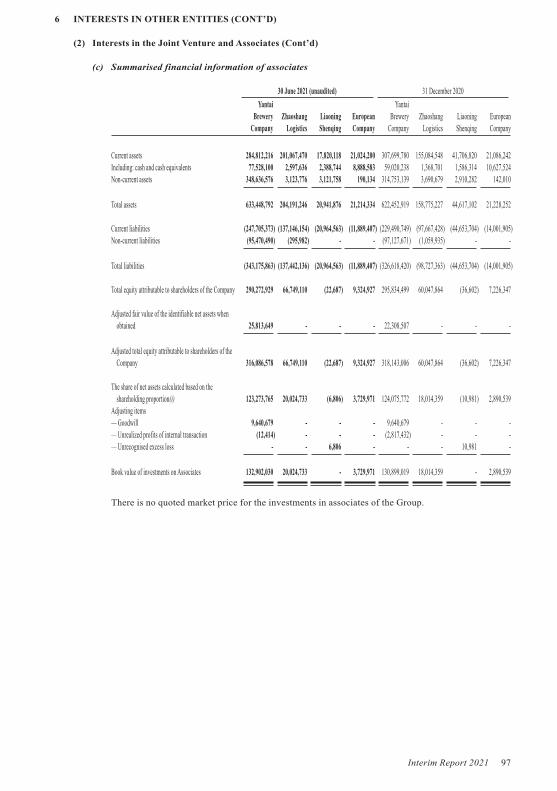
Interim Report 2021 97
6 INTERESTS IN OTHER ENTITIES (CONT’D)
(2) Interests in the Joint Venture and Associates (Cont’d)
(c) Summarised financial information of associates
30 June 2021 (unaudited) 31 December 2020
Yantai Yantai Brewery Zhaoshang Liaoning European Brewery Zhaoshang Liaoning European Company Logistics Shenqing Company Company Logistics Shenqing Company
Current assets 284,812,216 201,067,470 17,820,118 21,024,200 307,699,780 155,084,548 41,706,820 21,086,242Including: cash and cash equivalents 77,528,100 2,597,636 2,388,744 8,888,583 59,020,238 1,368,701 1,586,314 10,627,524Non-current assets 348,636,576 3,123,776 3,121,758 190,134 314,753,139 3,690,679 2,910,282 142,010
Total assets 633,448,792 204,191,246 20,941,876 21,214,334 622,452,919 158,775,227 44,617,102 21,228,252
Current liabilities (247,705,373) (137,146,154) (20,964,563) (11,889,407) (229,490,749) (97,667,428) (44,653,704) (14,001,905)Non-current liabilities (95,470,490) (295,982) - - (97,127,671) (1,059,935) - -
Total liabilities (343,175,863) (137,442,136) (20,964,563) (11,889,407) (326,618,420) (98,727,363) (44,653,704) (14,001,905)
Total equity attributable to shareholders of the Company 290,272,929 66,749,110 (22,687) 9,324,927 295,834,499 60,047,864 (36,602) 7,226,347
Adjusted fair value of the identifiable net assets when obtained 25,813,649 - - - 22,308,507 - - -
Adjusted total equity attributable to shareholders of the Company 316,086,578 66,749,110 (22,687) 9,324,927 318,143,006 60,047,864 (36,602) 7,226,347
The share of net assets calculated based on the shareholding proportion(i) 123,273,765 20,024,733 (6,806) 3,729,971 124,075,772 18,014,359 (10,981) 2,890,539Adjusting items— Goodwill 9,640,679 - - - 9,640,679 - - -— Unrealized profits of internal transaction (12,414) - - - (2,817,432) - - -— Unrecognised excess loss - - 6,806 - - - 10,981 -
Book value of investments on Associates 132,902,030 20,024,733 - 3,729,971 130,899,019 18,014,359 - 2,890,539
There is no quoted market price for the investments in associates of the Group.

98 Interim Report 2021
6 INTERESTS IN OTHER ENTITIES (CONT’D)
(2) Interests in the Joint Venture and Associates (Cont’d)
(c) Summarised financial information of associates (Cont’d)
Six months ended 30 June 2021 (unaudited) Six months ended 30 June 2020 (unaudited)
Yantai Yantai Brewery Zhaoshang Liaoning European Brewery Zhaoshang Liaoning European Company Logistics Shenqing Company Company Logistics Shenqing Company
Revenue 424,244,834 128,916,426 29,609,699 33,879,234 363,242,870 100,864,022 28,027,208 31,042,970Net profit/(loss) 26,180,241 6,694,642 13,915 2,442,847 15,686,995 4,753,539 (220,336) 3,085,546Other comprehensive income - - - (344,267) - - - 193,360Total comprehensive income 26,180,241 6,694,642 13,915 2,098,580 15,686,995 4,753,539 (220,336) 3,278,906
Total comprehensive income attributable to shareholders of the Company 26,180,241 6,694,642 13,915 2,098,580 15,686,995 4,753,539 (220,336) 3,278,906
Adjusted fair value of the identifiable net assets when obtained 3,505,142 - - - (1,930,000) - - -
Adjusted total comprehensive income attributable to shareholders 29,685,383 6,694,642 13,915 2,098,580 13,756,995 4,753,539 (220,336) 3,278,906
Dividends received from the associates in the current period 12,379,306 - - - - - - -
(i) The share of the net asset of associates was calculated by the share proportion of the Group, based on the equity attributable to the Company in the consolidated financial statement of the associates, adjusted according to the fair value of the identifiable assets and liabilities of the associates at the acquisition date and conformed to accounting policies of the Group.
(d) Excess losses of joint ventures and associated enterprises.
Accumulated unrecognised Accumulated losses at the Unrecognised unrecognised beginning of loss in the losses at the end the period current period of the period (unaudited) (unaudited)
Liaoning Shenqing 10,981 (4,175) 6,806
The Group has no unrecognised commitment related to joint venture investment and no contingent liability related to investment in joint venture.

Interim Report 2021 99
7 SEGMENT INFORMATION
As the Group is mainly engaged in the production and distribution of beer etc, the reportable segments of the Group are business units operating in different regions. Different regions require different marketing strategies, and the Group, therefore, separately manages the production and operation of each reportable segment and evaluates their operating results respectively, in order to make decisions on resources allocation and to assess their performance.
Finance Company is principally engaged in the financial businesses of wealth management and agency collection and payment for its members. Due to the unique business characteristics of Finance Company, the Group manages its operation independently and evaluates its operating results separately, to determine its resources allocation and assess its performance.
The Group identified seven reportable segments as follows:
— Shandong region segment, responsible for the production and distribution in Shandong region and surrounding regions
— South China region segment, responsible for the production and distribution in South China region— North China region segment, responsible for the production and distribution in North China region— East China region segment, responsible for the production and distribution in East China region— Southeast China region segment, responsible for the production and distribution of beer in Southeast
China region— Hong Kong, Macau and other overseas region segment, responsible for the distribution in Hong Kong
SAR, Macau SAR and other overseas regions— Finance Company segment, engaged in the financial businesses of wealth management and agency
collection and payment for its members.
Inter-segment transfer pricing is based on mutually-agreed prices.
Assets are allocated based on the operation of the segments and the physical location of the assets. Liabilities are allocated based on the operation of the segments.
(a) Segment information as at and for the six months ended 30 June 2021 is listed as follows (unaudited):
Hong Kong, Southeast Macau and Shandong South China North China East China China other overseas Finance Region Region Region Region Region Regions Company Unallocated Elimination Total
Revenue from external customers 11,144,886,789 1,523,994,869 3,248,270,608 1,576,071,560 480,114,629 309,258,467 5,306,324 3,257,505 - 18,291,160,751Inter-segment revenue 1,485,372,214 424,094,052 1,043,485,034 147,306,792 3,677,180 89,426,907 8,439,759 12,453,733 (3,214,255,671) -Cost of sales (7,782,289,120) (1,197,657,807) (2,752,813,878) (1,128,382,239) (297,598,945) (320,889,128) (20,458) (15,193,240) 3,324,470,864 (10,170,373,951)Selling and distribution expenses (2,315,743,732) (240,807,219) (444,074,086) (233,740,254) (74,109,041) (36,677,975) - - - (3,345,152,307)Interest income 34,536,445 10,835,411 25,675,939 4,739,910 953,975 499,420 167,166,261 18,247,839 (90,242,886) 172,412,314Interest expense (1,443,402) (1,901,494) (1,141,878) (7,247,560) (658,916) (1,255,239) (98,960,265) - 101,605,389 (11,003,365)Investment income of associates and a joint venture - - - - - - - 18,854,829 - 18,854,829Credit impairment reversals/(losses) 312,253 - 95,228 (6,370) - (27,990) (3,882,918) - 1,795,085 (1,714,712)Asset impairment losses - (5,826) - - - - - - - (5,826)Depreciation and amortisation (251,972,331) (84,480,257) (111,383,472) (79,774,067) (9,134,129) (1,770,829) (891,568) (29,875,355) - (569,282,008)Total profit 1,688,678,061 295,775,308 799,540,619 146,162,298 71,736,149 32,607,069 149,770,933 25,950,005 80,639,854 3,290,860,296Income tax expenses (447,554,469) (67,758,464) (190,011,705) (19,251,324) (4,618,853) (6,854,080) (38,282,448) - (29,663,738) (803,995,081)Net profit 1,241,123,592 228,016,844 609,528,914 126,910,974 67,117,296 25,752,989 111,488,485 25,950,005 50,976,116 2,486,865,215
Total assets 15,597,270,562 4,519,453,434 8,865,383,036 3,657,057,697 846,930,368 658,133,241 17,039,245,375 10,981,696,933 (16,928,259,713) 45,236,910,933
Total liabilities 11,817,545,855 1,915,136,231 5,102,745,502 3,013,882,899 596,137,190 708,813,945 14,093,746,549 1,580,833,953 (16,548,397,290) 22,280,444,834
Non-cash expenses other than depreciation and amortisation 13,996,573 701,745 3,062,025 789,964 276,661 61,611 - - - 18,888,579
Long-term equity investments in associates and a joint venture - - - - - - - 373,673,634 - 373,673,634
Additions of non-current assets(i) 371,356,594 57,142,486 343,288,695 35,083,662 4,876,727 4,119,020 234,906 26,552,619 (38,043,635) 804,611,074
(i) Non-current assets do not include financial assets, long-term equity investments and deferred tax assets.

100 Interim Report 2021
7 SEGMENT INFORMATION (CONT’D)
(b) Segment information as at and for the six months ended 30 June 2020 is listed as follows (unaudited):
Hong Kong, Southeast Macau and Shandong South China North China East China China other overseas Finance Region Region Region Region Region Regions Company Unallocated Elimination Total
Revenue from external customers 9,634,098,290 1,287,285,102 2,672,495,940 1,468,818,500 367,903,581 243,359,433 4,386,293 644,197 - 15,678,991,336Inter-segment revenue 1,083,680,119 491,798,392 902,951,316 158,750,041 3,633,310 51,444,873 12,107,363 248,755 (2,704,614,169) -Cost of sales (6,958,676,107) (1,130,460,572) (2,276,680,725) (1,094,802,111) (267,029,418) (200,414,323) (30,873) (431,194) 2,796,876,429 (9,131,648,894)Selling and distribution expenses (1,993,965,211) (216,777,063) (330,255,135) (218,523,251) (61,985,930) (43,947,912) - - - (2,865,454,502)Interest income 27,159,502 8,337,806 22,309,952 3,049,892 553,045 909,535 146,946,306 105,879,959 (63,810,401) 251,335,596Interest expense (1,645,356) (2,310,938) (5,822,824) (6,032,631) (34,800) (4,246,693) (66,724,998) - 78,327,866 (8,490,374)Investment income of associates and a joint venture - - - - - - - 16,497,374 - 16,497,374Credit impairment reversals/(losses) 1,017,305 (142) (166,562) (24,175) - (370,697) (2,674,261) - 2,729,884 511,352Asset impairment losses/(reversals) (978,368) - - (560,213) - - - - - (1,538,581)Depreciation and amortisation (246,440,841) (83,651,663) (107,154,311) (79,693,463) (19,162,124) (1,961,412) (664,864) (28,946,624) - (567,675,302)Total profit/(losses) 1,151,357,185 302,465,611 688,540,610 105,982,959 5,958,522 48,477,874 124,481,329 20,908,778 109,976,956 2,558,149,824Income tax expenses (306,831,017) (69,567,370) (157,749,865) (12,180,112) (3,299,518) (11,843,849) (31,138,862) - (26,092,406) (618,702,999)Net profit/(losses) 844,526,168 232,898,241 530,790,745 93,802,847 2,659,004 36,634,025 93,342,467 20,908,778 83,884,550 1,939,446,825
Total assets 13,125,351,478 4,367,750,711 7,872,291,796 3,615,516,553 839,978,604 653,055,456 14,376,340,989 10,495,214,153 (14,840,705,922) 40,504,793,818
Total liabilities 10,628,350,274 2,054,659,427 4,996,943,884 3,064,314,664 571,724,176 717,098,563 11,640,286,971 565,415,559 (14,557,902,337) 19,680,891,181
Non-cash expenses other than depreciation and amortisation 7,401,377 325,428 2,479,481 407,404 142,200 37,702 - - - 10,793,592
Long-term equity investments in associates and a joint venture - - - - - - - 372,733,530 - 372,733,530
Additions of non-current assets(i) 445,357,413 79,113,763 117,735,933 104,308,459 11,725,064 1,072,270 - 9,601,081 (3,774,347) 765,139,636
(i) Non-current assets do not include financial assets, long-term equity investments and deferred tax assets.
(c) The Group’s revenue from external customers in domestic and overseas markets and the total non-current assets other than financial assets and deferred tax assets located domestically and in foreign countries or geographical areas are summarised as follows:
Revenue from external customers Six months ended Six months ended 30 June 2021 30 June 2020 (unaudited) (unaudited)
Mainland China 17,957,768,054 15,381,641,740Hong Kong and Macau SAR 84,508,015 90,763,619Other overseas regions 248,884,682 206,585,977
18,291,160,751 15,678,991,336
Total non-current assets 30 June 2021 30 June 2020 (unaudited) (unaudited)
Mainland China 15,365,140,738 15,013,978,883Hong Kong and Macau SAR 16,490,335 15,513,502Other overseas regions 11,360 -
15,381,642,433 15,029,492,385

Interim Report 2021 101
8 RELATED PARTIES AND RELATED PARTY TRANSACTIONS
(1) Information of subsidiaries
The general information and other related information of the subsidiaries is set out in Note 6(1).
(2) Information of the joint venture and associates
Except for the information of the joint venture and associates disclosed in Note 6(2), the other associates having related parties transactions with the Group are set out below:
Company name Relationship with the Group
Beijing Sales Company AssociateGuangzhou General Agency Associate
(3) Information of other related parties
Relationship with the Group
Tsingtao Brewery Group Co., Ltd. Majority shareholder of the Company (“Tsingtao Brewery Group”)(i)Five subsidiaries of Fosun International Group Co., Ltd. Majority shareholder of the CompanyTsingtao Brewery Youjia Health Drinks Co., Ltd. Controlled by the same major shareholder (“Youjia Health”)(i)Tsingtao Brewery Youjia Health Drinks (Shanghai) Controlled by the same major shareholder Co., Ltd. (“Youjia Shanghai”)(i)Yunnan Dashan Beverage Co., Ltd. (“Yunnan Dashan”)(i) Controlled by the same major shareholderQingdao Smart Chain Success Delivery Technology Controlled by the same major shareholder Co., Ltd. (“Smart Chain Success Delivery”)(i)Shanghai Dasheng Smart Supply Chain Controlled by the same major shareholder Co., Ltd. (“Dasheng Smart Chain”)(i)Tsingtao Brewery Real Estate Co., Ltd. Controlled by the same major shareholder (“Tsingtao Brewery Real Estate”)(i)
(i) On 1 February 2021, the Company issued the announcement of Tsingtao Brewery Co., Ltd. on signing the related party transaction framework agreement and daily related party transaction with the controlling shareholder and its subsidiaries. The Company has considered and approved the signing of the 2021 entrusted production and sales framework agreement with Youjia health, the 2021 supply chain business service framework agreement with Smart Chain Success Delivery and the comprehensive service framework agreement with Tsingtao Brewery Group at the 14th meeting of the ninth board of directors.

102 Interim Report 2021
8 RELATED PARTIES AND RELATED PARTY TRANSACTIONS (CONT’D)
(4) Related party transactions
(a) Purchases of goods and receiving services
Six months Six months Name of Nature of Pricing ended ended related party transaction policies 30 June 2021 30 June 2020 (unaudited) (unaudited)
Yantai Brewery Company Purchase of beer Mutually-agreed prices 419,446,308 359,743,924Smart Chain Success Receiving logistics Mutually-agreed prices 185,703,920 — Delivery and warehousing services and prices approved by the board of directorsHebei Jiahe Company Purchase of beer Mutually-agreed prices 157,127,593 183,198,029Zhaoshang Logistics Receiving logistics service (including payment on behalf) Mutually-agreed prices 110,239,103 94,651,413
872,516,924 637,593,366
(b) Sales of goods and providing services
Six months Six months Name of Nature of Pricing ended ended related party transaction policies 30 June 2021 30 June 2020 (unaudited) (unaudited)
Youjia Health Sale of products Mutually-agreed prices refer to 55,259,464 — the market prices and prices approved by the board of directorsEuropean Company Sale of beer and materials Mutually-agreed prices refer to the market prices 26,528,493 21,257,079Liaoning Shenqing Sale of beer and materials Mutually-agreed prices refer to the market prices 9,089,912 28,151,444Youjia Health Provide comprehensive Mutually-agreed prices refer to services the market prices and prices approved by the board of directors 2,828,546 —Youjia Shanghai Sale of products Mutually-agreed prices refer to the market prices and prices approved by the board of directors 1,384,831 —Yunnan Dashan Sale of products Mutually-agreed prices refer to the market prices and prices approved by the board of directors 1,220,000 —

Interim Report 2021 103
8 RELATED PARTIES AND RELATED PARTY TRANSACTIONS (CONT’D)
(4) Related party transactions (Cont’d)
(b) Sales of goods and providing services (Cont’d)
Six months Six months Name of Nature of Pricing ended ended related party transaction policies 30 June 2021 30 June 2020 (unaudited) (unaudited)
Tsingtao Brewery Group Provide comprehensive Mutually-agreed prices refer to 1,191,482 — services the market prices and prices approved by the board of directorsSmart Chain Success Provide comprehensive Mutually-agreed prices refer to 753,622 — Delivery services the market prices and prices approved by the board of directorsTsingtao Brewery Provide comprehensive Mutually-agreed prices refer to 128,161 — Real Estate services the market prices and prices approved by the board of directorsDasheng Smart Chain Provide comprehensive Mutually-agreed prices refer to 112,722 — services the market prices and prices approved by the board of directorsDasheng Smart Chain Provide warehouse rental Mutually-agreed prices refer to 21,024 — service the market prices and prices approved by the board of directors
98,518,257 49,408,523
(c) Absorbed deposits from related parties
Six months Six months ended ended 30 June 2021 30 June 2020 (unaudited) (unaudited)
Yantai Brewery Company 486,300,074 390,459,903
(d) Interest expense paid to related parties
Six months Six months ended ended 30 June 2021 30 June 2020 (unaudited) (unaudited)
Yantai Brewery Company 20,458 30,873

104 Interim Report 2021
8 RELATED PARTIES AND RELATED PARTY TRANSACTIONS (CONT’D)
(4) Related party transactions (Cont’d)
(e) Financial services fee received from related parties
Six months Six months ended ended 30 June 2021 30 June 2020 (unaudited) (unaudited)
Yantai Brewery Company 4,553 2,346
(f) Key management compensation
Six months Six months ended ended 30 June 2021 30 June 2020 (unaudited) (unaudited)
Share-based payment 7,421,226 —Key management compensation paid 3,078,617 2,905,828
10,499,843 2,905,828
(g) For the six months ended 30 June 2021, there is no loan provided to the key management from the Group (For the six months ended 30 June 2020: nil).

Interim Report 2021 105
8 RELATED PARTIES AND RELATED PARTY TRANSACTIONS (CONT’D)
(5) Receivable and payable balances with related parties
Receivables from related parties:
30 June 2021 (unaudited) 31 December 2020
Ending Provision for Ending Provision for balance bad debts balance bad debts
Accounts receivable European Company 14,294,075 - 8,476,518 - Beijing Sales Company 11,245,784 (11,245,784) 11,245,784 (11,245,784)
25,539,859 (11,245,784) 19,722,302 (11,245,784)
Payables to related parties:
30 June 31 December 2021 2020 (unaudited)
Accounts payable Yantai Brewery Company 125,923,733 136,949,404 Hebei jiahe Company 34,770,019 4,029,741
160,693,752 140,979,145
Other payables Zhaoshang Logistics 81,372,856 45,086,733 Smart Chain Success Delivery 24,056,502 - Yantai Brewery Company 10,669,606 224,353
116,098,964 45,311,086
Contract liabilities and Liaoning Shenqing 3,457,033 35,310,803 other current Youjia Health 1,950,573 - liabilities Yunnan Dashan 217,100 - Youjia Shanghai 185,140 - European Company 7,772 7,868
5,817,618 35,318,671
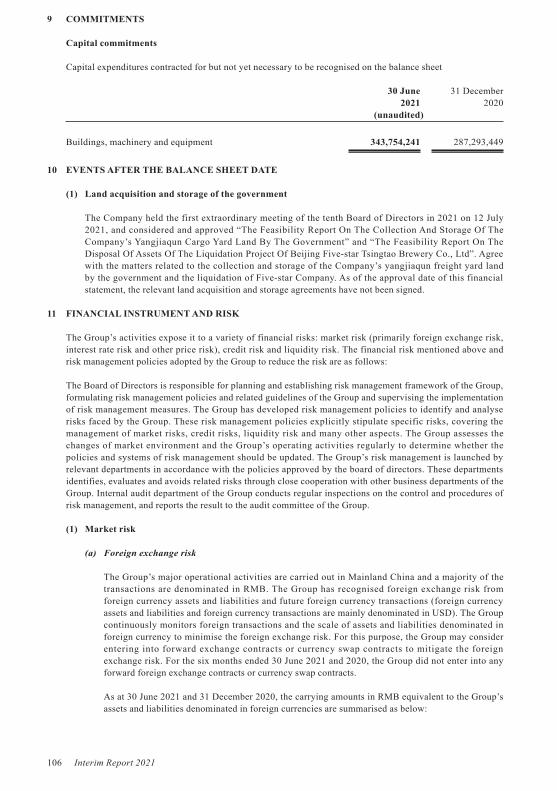
106 Interim Report 2021
9 COMMITMENTS
Capital commitments
Capital expenditures contracted for but not yet necessary to be recognised on the balance sheet
30 June 31 December 2021 2020 (unaudited)
Buildings, machinery and equipment 343,754,241 287,293,449
10 EVENTS AFTER THE BALANCE SHEET DATE
(1) Land acquisition and storage of the government
The Company held the first extraordinary meeting of the tenth Board of Directors in 2021 on 12 July 2021, and considered and approved “The Feasibility Report On The Collection And Storage Of The Company’s Yangjiaqun Cargo Yard Land By The Government” and “The Feasibility Report On The Disposal Of Assets Of The Liquidation Project Of Beijing Five-star Tsingtao Brewery Co., Ltd”. Agree with the matters related to the collection and storage of the Company’s yangjiaqun freight yard land by the government and the liquidation of Five-star Company. As of the approval date of this financial statement, the relevant land acquisition and storage agreements have not been signed.
11 FINANCIAL INSTRUMENT AND RISK
The Group’s activities expose it to a variety of financial risks: market risk (primarily foreign exchange risk, interest rate risk and other price risk), credit risk and liquidity risk. The financial risk mentioned above and risk management policies adopted by the Group to reduce the risk are as follows:
The Board of Directors is responsible for planning and establishing risk management framework of the Group, formulating risk management policies and related guidelines of the Group and supervising the implementation of risk management measures. The Group has developed risk management policies to identify and analyse risks faced by the Group. These risk management policies explicitly stipulate specific risks, covering the management of market risks, credit risks, liquidity risk and many other aspects. The Group assesses the changes of market environment and the Group’s operating activities regularly to determine whether the policies and systems of risk management should be updated. The Group’s risk management is launched by relevant departments in accordance with the policies approved by the board of directors. These departments identifies, evaluates and avoids related risks through close cooperation with other business departments of the Group. Internal audit department of the Group conducts regular inspections on the control and procedures of risk management, and reports the result to the audit committee of the Group.
(1) Market risk
(a) Foreign exchange risk
The Group’s major operational activities are carried out in Mainland China and a majority of the transactions are denominated in RMB. The Group has recognised foreign exchange risk from foreign currency assets and liabilities and future foreign currency transactions (foreign currency assets and liabilities and foreign currency transactions are mainly denominated in USD). The Group continuously monitors foreign transactions and the scale of assets and liabilities denominated in foreign currency to minimise the foreign exchange risk. For this purpose, the Group may consider entering into forward exchange contracts or currency swap contracts to mitigate the foreign exchange risk. For the six months ended 30 June 2021 and 2020, the Group did not enter into any forward foreign exchange contracts or currency swap contracts.
As at 30 June 2021 and 31 December 2020, the carrying amounts in RMB equivalent to the Group’s assets and liabilities denominated in foreign currencies are summarised as below:

Interim Report 2021 107
11 FINANCIAL INSTRUMENT AND RISK (CONT’D)
(1) Market risk (Cont’d)
(a) Foreign exchange risk (Cont’d)
30 June 2021 (unaudited)
Other foreign USD currencies Total
Financial assets denominated in foreign currency — Cash at bank and on hand 217,412,065 32,498,147 249,910,212 Accounts receivable 29,041,108 17,704,506 46,745,614
246,453,173 50,202,653 296,655,826
Financial liabilities denominated in foreign currency — Other payables 8,621,701 59,952 8,681,653
31 December 2020
Other foreign USD currencies Total
Financial assets denominated in foreign currency — Cash at bank and on hand 248,394,291 13,364,094 261,758,385 Accounts receivable 27,701,691 15,125,813 42,827,504
276,095,982 28,489,907 304,585,889
Financial liabilities denominated in foreign currency — Other payables 6,283,009 - 6,283,009 Current portion of non-current liabilities - 215,720 215,720
6,283,009 215,720 6,498,729
As at 30 June 2021, for various financial assets and liabilities denominated in USD with a recording currency of RMB, if USD had strengthened or weakened by 4% against the RMB while all other variables had been held constant, the Group’s net profit for the year would have been approximately 7,135,000 (31 December 2020: 8,094,000) higher or lower.

108 Interim Report 2021
11 FINANCIAL INSTRUMENT AND RISK (CONT’D)
(1) Market risk (Cont’d)
(b) Interest rate risk
The Group’s interest rate risk arises from interest bearing debts such as long-term bank borrowings. Financial liabilities issued at floating rates expose the Group to cash flow interest rate risk. Financial liabilities issued at fixed rates expose the Group to fair value interest rate risk. The Group determines the relative proportions of its fixed rate and floating rate contracts depending on the prevailing market conditions. As at 30 June 2021 and 31 December 2020, as the long-term bank borrowings are all interest-free and immaterial(Note 4(27)), there is no material interest rate risk in the view of the directors of the Group.
The Group’s head office continuously monitors the interest rate position of the Group. Increase in interest rate will increase the cost of new interest-bearing borrowings and therefore could have an adverse impact on the Group’s financial performance. The Group has no interest rate swap arrangement in 2020 and the current period. The management of the Group makes decisions according to the latest market conditions. The directors of the Company are of the view that future interest rate changes will not have a material adverse impact on the Group’s operating performance.
As at 30 June 2021, if the borrowing rate calculated at the floating rate rose or fell by 50 basis points and other factors remained unchanged, the Group’s net profit would decrease or increase by approximately RMB520,000 (31 December 2020: approximately RMB1,054,000).
(c) Other price risk
Other price risk of the Group mainly arises from the investment of equity instruments, where risk of price changes exists. As at 30 June 2021 and 31 December 2020, the amounts of equity instruments of the Group are both insignificant, and the directors of the Company consider that there is no significant price risk.
(2) Credit risk
The Group’s credit risk mainly arises from cash at bank and on hand, notes receivable, accounts receivable and other receivables etc. At the balance sheet date, the carrying amount of the Group’s financial assets represented its maximum credit exposure.
The Group expects that there is no significant credit risk associated with cash at bank considering they are deposited at joint-stock commercial banks with high credit rating. Management does not expect that there will be any significant credit losses from non-performance by these counterparties.
Sales are mainly settled by advances from customers, and accordingly, there is no significant credit risk related to customers.
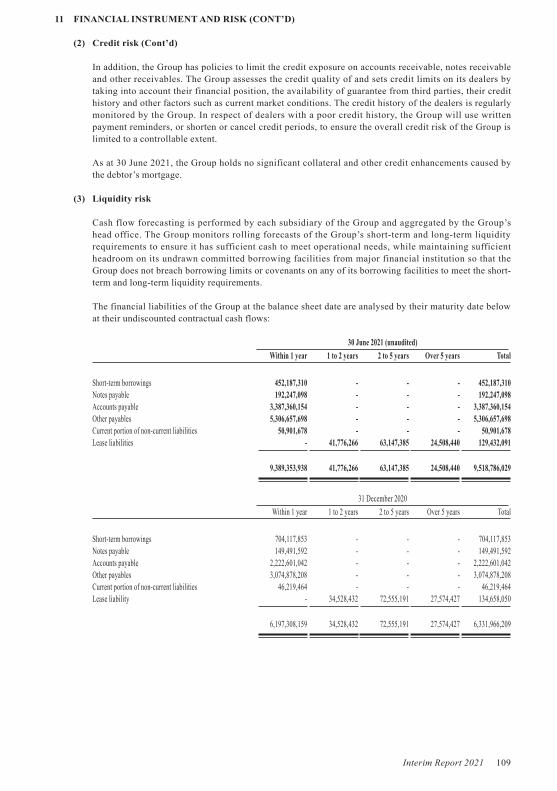
Interim Report 2021 109
11 FINANCIAL INSTRUMENT AND RISK (CONT’D)
(2) Credit risk (Cont’d)
In addition, the Group has policies to limit the credit exposure on accounts receivable, notes receivable and other receivables. The Group assesses the credit quality of and sets credit limits on its dealers by taking into account their financial position, the availability of guarantee from third parties, their credit history and other factors such as current market conditions. The credit history of the dealers is regularly monitored by the Group. In respect of dealers with a poor credit history, the Group will use written payment reminders, or shorten or cancel credit periods, to ensure the overall credit risk of the Group is limited to a controllable extent.
As at 30 June 2021, the Group holds no significant collateral and other credit enhancements caused by the debtor’s mortgage.
(3) Liquidity risk
Cash flow forecasting is performed by each subsidiary of the Group and aggregated by the Group’s head office. The Group monitors rolling forecasts of the Group’s short-term and long-term liquidity requirements to ensure it has sufficient cash to meet operational needs, while maintaining sufficient headroom on its undrawn committed borrowing facilities from major financial institution so that the Group does not breach borrowing limits or covenants on any of its borrowing facilities to meet the short-term and long-term liquidity requirements.
The financial liabilities of the Group at the balance sheet date are analysed by their maturity date below at their undiscounted contractual cash flows:
30 June 2021 (unaudited)
Within 1 year 1 to 2 years 2 to 5 years Over 5 years Total
Short-term borrowings 452,187,310 - - - 452,187,310Notes payable 192,247,098 - - - 192,247,098Accounts payable 3,387,360,154 - - - 3,387,360,154Other payables 5,306,657,698 - - - 5,306,657,698Current portion of non-current liabilities 50,901,678 - - - 50,901,678Lease liabilities - 41,776,266 63,147,385 24,508,440 129,432,091
9,389,353,938 41,776,266 63,147,385 24,508,440 9,518,786,029
31 December 2020
Within 1 year 1 to 2 years 2 to 5 years Over 5 years Total
Short-term borrowings 704,117,853 - - - 704,117,853Notes payable 149,491,592 - - - 149,491,592Accounts payable 2,222,601,042 - - - 2,222,601,042Other payables 3,074,878,208 - - - 3,074,878,208Current portion of non-current liabilities 46,219,464 - - - 46,219,464Lease liability - 34,528,432 72,555,191 27,574,427 134,658,050
6,197,308,159 34,528,432 72,555,191 27,574,427 6,331,966,209

110 Interim Report 2021
11 FINANCIAL INSTRUMENT AND RISK (CONT’D)
(3) Liquidity risk (Cont’d)
Bank borrowings are analysed by repayment terms as follows:
30 June 31 December 2021 2020 (unaudited)
Within 1 year 449,630,000 702,695,720
12 SHARE-BASED PAYMENT
(a) Restricted stocks incentive plan
On June 8 2020,the Company held the 2019 Annual General Meeting of Shareholders and the first meeting of A-share and H-share shareholders in 2020, and approved the Proposal of Tsingtao Brewery Co., Ltd. A Share Restricted stocks Incentive Plan (Draft) and its summary, the Proposal of the Implementation of Evaluation and Management Measures for the A-share Restricted Stocks Incentive Plan of Tsingtao Brewery Co., Ltd. and the Proposal for the general meeting of shareholders to authorize the board of directors to handle matters related to the A-share restricted stocks incentive plan. On 29 June 2020, the Company held the eighth extraordinary meeting of the ninth board of directors in 2020, and approved the Proposal of Tsingtao Brewery Co., Ltd. on the First Grant of A-Share Restricted Share to Incentive Participants (“Incentive Plan”). According to the incentive plan, the Company granted 13.2 million restricted stocks to 627 incentive participants. The grant date was 29 June 2020, and the grant price was RMB21.18 per share. The unlocking periods for restricted stocks granted are 24 months, 36 months, and 48 months from the equity registration date. According to the Company’s performance appraisal and personal performance appraisal, 1/3, 1/3, and 1/3 of restricted stocks will be unlocked respectively. According to the incentive plan, if the incentive object resigns before the expiration of the unlocking period, the stocks shall not be unlocked, and the Company must repurchase and cancel the restricted stocks at the corresponding repurchase price.
On 22 March 2021, the Company held the first extraordinary meeting of the ninth Board of Directors in 2021, and approved the Proposal on granting reserved part of A restricted stocks to incentive recipients (Plan for granting reserved restricted shares). According to the plan for granting reserved restricted stocks, the Company granted 300,000 restricted stocks to 35 incentive recipients, with the grant date of 22 March 2021 and the grant price of RMB21.18 per share. The unlocking periods for the restricted stocks granted are 24 months, 36 months and 48 months from the equity registration date. According to the Company’s performance assessment and individual performance assessment, 1/3, 1/3 and 1/3 of the restricted stocks will be unlocked respectively. According to the plan of granting reserved restricted stocks, if the incentive participants resign before the expiration of the unlocking period, the shares shall not be unlocked, and the Company must repurchase and cancel the corresponding restricted stocks at the corresponding repurchase price. Among the 35 incentive recipients to be granted, 1 incentive recipient has waived the subscription for personal reasons. As of 30 June 2020, the remaining 34 incentive recipients have completed the subscription payment according to the distribution plan.

Interim Report 2021 111
12 SHARE-BASED PAYMENT (CONT’D)
(a) Restricted stocks incentive plan (Cont’d)
According to the incentive plan, the Company received a total of RMB279,576,000 from the incentive recipients in 2020, and recognised liabilities of RMB279,576,000 and treasury shares of RMB279,576,000 for the repurchase obligation of restricted stocks. According to the plan for granting reserved restricted stocks, for the six months ended 30 June 2021, the Company received a total of RMB6,226,920 from the incentive recipients, and recognised a liability of RMB6,226,920 and treasury shares of RMB6,226,920 for the repurchase obligation of restricted shares.
According to the resolution of the 2020 Annual General Meeting of shareholders, the cash dividend of restricted stocks expected to be vested in the future will be RMB10,120,500 to the above incentive recipients, and the repurchase obligation will be offset accordingly. As at 30 June 2021, the restricted stocks incentive plan recognised a total of repurchase obligation liabilities of RMB275,682,420 and treasury shares of RMB275,682,420.
(b) Changes in restricted stocks during the current period
Six months ended Six months ended 30 June 30 June 2021 2020
Restricted stocks (shares) issued at the beginning of the period 13,200,000 —Restricted stocks (shares) granted this period 294,000 —Restricted stocks (shares) exercised this period - —Restricted stocks (shares) lapsed this period - —
Restricted stocks (shares) issued at the end of the period 13,494,000 —
Share-based payment expenses this year 123,108,005 —Accumulated share-based payment expenses 250,703,088 —
(c) As at 30 June 2021, the remaining period of the restricted stock incentive plan is 5.06 years until 24 July 2026.
(d) Method for determining the fair value of restricted stocks on the grant date
The Group determines the fair value of restricted stocks on the basis of the single-day closing price of the circulating shares on the date when the equity instruments are granted.
13 FAIR VALUE ESTIMATION
The level of fair value measurement is determined by the lowest level of inputs which has significant impact on fair value measurement, as a whole:
Level 1: Quoted prices (unadjusted) in active markets for identical assets or liabilities.
Level 2: Inputs other than quoted prices included within level 1 that are observable for the asset or liability, either directly or indirectly.
Level 3: Inputs for the asset or liability that are not based on observable market data.

112 Interim Report 2021
13 FAIR VALUE ESTIMATION (CONT’D)
(1) Assets measured at fair value on a recurring basis
As at 30 June 2021, the assets measured at fair value on a recurring basis are analysed below (unaudited):
Level 3
Financial assets held for trading — Debt instruments 9,177,366,562Other non-current financial assets — Equity instruments 600,000
9,177,966,562
As at 31 December 2020, the assets measured at fair value on a recurring basis are analysed below:
Level 3
Financial assets held for trading — Debt instruments 1,888,862,835Other non-current financial assets — Equity instruments 600,000
1,889,462,835
The timing of transfers is determined at the date of the event or change in circumstances that caused the transfers. There was no transfer between level 1 and 2 during the period.

Interim Report 2021 113
13 FAIR VALUE ESTIMATION (CONT’D)
(1) Assets measured at fair value on a recurring basis (Cont’d)
Changes of the above Level 3 financial assets are analysed below:
Assets still held on 30 June 2021 are recognised as movement on unrealized gains of profit or loss for the six months ended Total current 30 June 2021— profits — Profits Profit or loss 31 December accrued to current 30 June from changes 2020 Purchase Disposal profit or loss (a) 2021 in fair value (unaudited) (unaudited) (unaudited) (unaudited) (unaudited)
Financial assets held for trading — Debt instruments 1,888,862,835 8,500,000,000 (1,344,528,679) 133,032,406 9,177,366,562 127,366,562Other non-current financial assets — Equity instruments 600,000 - - - 600,000 -
1,889,462,835 8,500,000,000 (1,344,528,679) 133,032,406 9,177,966,562 127,366,562
Assets still held on 31 December 2020 are recognised as movement on unrealized gains of profit or loss for the year ended Total current 31 December 2020 — profits — Profits Profit or loss 31 December accrued to current 31 December from changes 2019 Purchase Disposal profit or loss (a) 2020 in fair value
Financial assets held for trading — Debt instruments 1,396,589,764 2,220,000,000 (1,754,769,664) 60,895,433 1,888,862,835 27,042,735Other non-current financial assets — Equity instruments 600,000 - - - 600,000 -
1,397,189,764 2,220,000,000 (1,754,769,664) 60,895,433 1,889,462,835 27,042,735
(a) Gains recognised in the current profit or loss is included in the income statement under the items of profit arising from changes in fair value and investment income respectively.
For the level 3 financial assets stated above, the management evaluates and determines its fair value based on the future cash flow.

114 Interim Report 2021
13 FAIR VALUE ESTIMATION (CONT’D)
(2) Assets and liabilities not measured at fair value but disclosed at fair value
Financial assets and financial liabilities of the Group measured at amortised cost mainly represent notes receivable, accounts receivable, other receivables, other current assets, debt investment, short-term borrowings, notes payable, accounts payable and long-term borrowings. The difference between the carrying amount and fair value of those financial assets and liabilities not measured by fair value is small.
The fair value of long-term borrowings is the present value of the contractually determined stream of future cash flows discounted at the rate of interest applied at that time by the market to instruments of comparable credit status and providing substantially the same cash flows on the same terms, which belongs to level 3.
14 CAPITAL MANAGEMENT
The Group’s objectives when managing capital are to safeguard the Group’s ability to continue as a going concern in order to provide returns for shareholders and benefits for other stakeholders and to maintain an optimal capital structure to reduce the cost of capital.
In order to maintain or adjust the capital structure, the Group may adjust the amount of dividends paid to shareholders, return capital to shareholders, issue new shares or sell assets to reduce debt.
For six months ended 30 June 2021, the Group’s strategy, which was unchanged from the prior year, was to maintain the cash balance above a certain standard to meet the Group’s business development needs. Cash balance is calculated as cash and cash equivalents less total borrowings (including short-term borrowings and current portion of long-term borrowings). The cash balance as at 30 June 2021 and 31 December 2020 are as follows:
30 June 31 December 2021 2020 (unaudited)
Cash and cash equivalents 6,846,715,666 17,643,123,424
Less: Short-term borrowings (450,255,705) (703,273,054) Current portion of long-term borrowings - (215,720)
(450,255,705) (703,488,774)
Cash balance after deducting borrowings 6,396,459,961 16,939,634,650

Interim Report 2021 115
15 NOTES TO THE COMPANY’S FINANCIAL STATEMENTS
(1) Accounts receivable
30 June 31 December 2021 2020 (unaudited)
Accounts receivable 1,609,226,746 1,346,209,651Less: Provision for bad debts (56,423,068) (56,425,268)
1,552,803,678 1,289,784,383
The majority of the Group’s domestic sales are made by advances from customers. The remains are settled by letters of credit, bank acceptance notes or providing credit terms from 30 to 100 days.
(a) The ageing of accounts receivable based on their recording dates is analysed below:
30 June 31 December 2021 2020 (unaudited)
Within 1 year 1,141,626,886 934,123,1621 to 2 years 157,399,650 138,175,3672 to 3 years 70,737,373 53,839,2783 to 4 years 91,979,203 80,548,1004 to 5 years 68,003,642 62,078,414Over 5 years 79,479,992 77,445,330
1,609,226,746 1,346,209,651
(b) As at 30 June 2021, the top five accounts receivable are analysed as follows:
Provision of % of total Amount bad debts balance (unaudited) (unaudited)
Total amount of the top five accounts receivable 566,992,319 - 35%
(c) As at 30 June 2021, there are no accounts receivable derecognised due to the transfer of financial assets (31 December 2020: nil).

116 Interim Report 2021
15 NOTES TO THE COMPANY’S FINANCIAL STATEMENTS (CONT’D)
(1) Accounts receivable (Cont’d)
(d) Provision for bad debts (Cont’d)
For accounts receivable, irrespective of whether there is significant financing component, the Company measures loss provision according to the ECL of the lifetime.
(i) As at 30 June 2021, accounts receivable with amounts that are individually subject to separate assessment for provision are analysed as follows:
Ending Lifetime Provision for balance ECL ratio bad debts Reason (unaudited) (unaudited)
Beijing Sales Company 11,245,784 100% (11,245,784) Note 4(4)(d)
(ii) As at 30 June 2021, accounts receivable by categories are analysed as follows:
Group — Subsidiaries
As at 30 June 2021, accounts receivable from subsidiaries to the Company is 1,508,708,392. The Company believes there is no significant credit risk, thus no provision for bad debts is recognised.
Group — Dealers
30 June 2021 (unaudited) 31 December 2020
Ending Ending balance Provision for bad debts balance Provision for bad debts
Lifetime Lifetime Amount ECL ratio Amount Amount ECL ratio Amount
Not overdue 44,093,690 - - 41,173,521 - -Overdue within 1 year 1,680 5% (84) - - -Overdue 2 years 45,177,200 100% (45,177,200) 45,179,484 100% (45,179,484)
89,272,570 (45,177,284) 86,353,005 (45,179,484)

Interim Report 2021 117
15 NOTES TO THE COMPANY’S FINANCIAL STATEMENTS (CONT’D)
(2) Other receivables
30 June 31 December 2021 2020 (unaudited)
Receivables from subsidiaries 57,920,894 51,297,364Dividends receivable from subsidiaries 34,049,967 700,149,831Receivables of refundable cost of land and buildings 17,441,647 17,441,647Reservation fund 10,985,305 10,182,793Guarantee deposits 4,606,773 5,592,742Others 32,780,586 21,310,745
157,785,172 805,975,122
Less: Provision for bad debts (38,427,811) (38,423,345)
119,357,361 767,551,777
(a) The ageing of accounts receivable based on their recording dates is analysed below:
30 June 31 December 2021 2020 (unaudited)
Not overdue 119,337,661 767,489,799Overdue within 1 year 13,363 51,292Overdue 1-2 years 14,013 31,536Overdue over 2 years 38,420,135 38,402,495
157,785,172 805,975,122

118 Interim Report 2021
15 NOTES TO THE COMPANY’S FINANCIAL STATEMENTS (CONT’D)
(2) Other receivables (Cont’d)
(b) Movement in provision for bad debts and carrying amount
Stage one (unaudited) Stage three (unaudited)
Next 12 months ECL Lifetime ECL (Credit impairment Total (Groups) losses already occurred) (unaudited)
Ending Provision for Ending Provision for Provision for balance bad debts balance bad debts bad debts
31 December 2020 82,828 (20,850) 38,402,495 (38,402,495) (38,423,345) Increase in the current period - - - (8,840) (8,840) Reversals in the current period (37,772) 4,334 (40) 40 4,374 Transfer to stage three (17,680) 8,840 17,680 (8,840) -
30 June 2021 27,376 (7,676) 38,420,135 (38,420,135) (38,427,811)
As at 30 June 2021, the Company has no other receivables in the stage two. The analysis of other receivables in the stage one and stage three is as follows:
(i) As at 30 June 2021, other receivables with amounts that are individually subject to separate assessment for provision are analysed as follows:
Ending Lifetime Provision forStage three balance ECL ratio bad debts Reason (unaudited) (unaudited)
Receivables of refundable cost of land and buildings 17,441,647 100% (17,441,647) Note 4(6)Receivables from other entities 20,978,488 100% (20,978,488) Note 4(6)
38,420,135 (38,420,135)

Interim Report 2021 119
15 NOTES TO THE COMPANY’S FINANCIAL STATEMENTS (CONT’D)
(2) Other receivables (Cont’d)
(b) Movement in provision for bad debts and carrying amount (Cont’d)
(ii) As at 30 June 2021 and 31 December 2020, other receivables of provisions for bad debts on grouping basis are in stage one, and the analysis is as follows:
30 June 2021 (unaudited) 31 December 2020
Ending Ending balance Provision for bad debts balance Provision for bad debts
% of total % of total Amount Amount balance Amount Amount balance
Receivables from other entities 27,376 (7,676) 5% - 50% 82,828 (20,850) 5% - 50%
(c) The provision for bad debts in the current period is 8,840; The reversal of provision for bad debts is 4,374 and its carrying amount is 37,812. No other reveivables was written off in the current period.
(d) As at 30 June 2021, the top five other receivables are analysed as follows:
% of total Provision for Nature Amount Ageing balance bad debts (unaudited) (unaudited)
No.1 Receivable of subsidiaries dividends 19,000,000 Within 1 year 12% -No.2 Receivable of subsidiaries dividends 12,379,306 Within 1 year 8% -No.3 Payment on behalf for recycling bottles 10,003,025 Within 1 year 6% -No.4 Payment on behalf for recycling bottles 4,512,595 Within 1 year 3% -No.5 Payment on behalf of others 4,022,410 More than 5 years 3% (4,022,410)
49,917,336 32% (4,022,410)
(3) Inventories
30 June 2021 (unaudited) 31 December 2020
Ending Carrying Ending Carrying balance Provision amount balance Provision amount
Raw materials 310,988,472 - 310,988,472 276,448,990 - 276,448,990Packaging materials 70,995,199 (662,025) 70,333,174 136,606,270 (662,025) 135,944,245Low-value consumables 43,833,227 - 43,833,227 41,916,164 - 41,916,164Work in progress 77,578,139 - 77,578,139 95,540,890 - 95,540,890Finished goods 126,535,279 - 126,535,279 934,573,062 - 934,573,062Work in process — outsourced 2,336,504 - 2,336,504 - - -
632,266,820 (662,025) 631,604,795 1,485,085,376 (662,025) 1,484,423,351

120 Interim Report 2021
15 NOTES TO THE COMPANY’S FINANCIAL STATEMENTS (CONT’D)
(4) Debt investment
30 June 31 December 2021 2020 (unaudited)
Entrusted loans to subsidiaries 116,500,000 58,500,000Plus: Interest on debt investment 133,001 -Less: Debt investment impairment provisions (58,500,000) (58,500,000)
58,133,001 -
The above funds are entrusted loans issued by the Company to its subsidiaries through banks or the finance company of its subsidiaries. They are unsecured RMB loans with an annual interest rate of 3.92%, and the interest is paid quarterly.
(5) Long-term equity investments
30 June 31 December 2021 2020 (unaudited)
Subsidiaries(a) 12,268,715,561 12,068,149,380Joint Ventures(b) 217,016,900 222,529,920Associates(c) 154,146,763 150,133,378
12,639,879,224 12,440,812,678Less: Provision for impairment of long-term equity investments(d) (1,662,953,287) (1,662,953,287)
10,976,925,937 10,777,859,391

Interim Report 2021 121
15 NOTES TO THE COMPANY’S FINANCIAL STATEMENTS (CONT’D)
(5) Long-term equity investments (Cont’d)
(a) Subsidiaries
Balance of provision for Cash dividends Movements in the current period (unaudited) impairment declared in
31 December Increased Reduce Dividends 30 June at end the current 2020 investment investment paid (iii) 2021 of period period (iv) (unaudited)
Shenzhen Asahi 127,416,376 - - 646,366 128,062,742 - 83,410,000Chenzhou Company 63,217,601 - - 599,824 63,817,425 - -Huanan Sales Company 48,344,844 - - 3,001,395 51,346,239 - -Huanan Investing Company 211,405,002 - - 2,521,860 213,926,862 - -Huadong Holding Company 96,855,102 - - - 96,855,102 (96,855,102) -Shouguang Company 61,239,402 - - 686,882 61,926,284 - -Five Star Company 25,170,071 - - 386,878 25,556,949 (24,656,410) -Three Ring Company 70,028,716 - - 418,059 70,446,775 (69,457,513) -Beifang Sales Company 85,255,148 - - 1,282,194 86,537,342 (83,984,000) -Xi’an Han’s 400,649,339 - - 7,302,283 407,951,622 - -Weinan Company 14,727,112 - - 820,541 15,547,653 - -Anshan Company 30,657,027 - - 639,365 31,296,392 - -Xingkaihu Company 200,311,300 - - 857,609 201,168,909 (129,430,000) -Mishan Company 118,520,000 - - - 118,520,000 (118,520,000) -Harbin Company 214,207,004 - - 649,074 214,856,078 (109,940,000) -Penglai Company 30,000,000 - - - 30,000,000 (30,000,000) -Rongcheng Company 65,814,919 - - 692,359 66,507,278 (65,103,434) -International Trade 11,210,000 - - - 11,210,000 - -Tsingtao Brewery (Laoshan) Co., Ltd. 18,089,491 - - - 18,089,491 - -Hong Kong Company 41,728,681 - - - 41,728,681 - -Taizhou Company(i) 60,375,368 - (60,375,368) - - - -Maanshan Company 80,848,634 - - 647,739 81,496,373 - -Qingdao Xianghong Shangwu Co., Ltd. 5,760,000 - - - 5,760,000 - -Dongnan Sales Company 296,762,362 - - 3,244,774 300,007,136 - -Changsha Company 48,076,304 - - 433,373 48,509,677 - -Jinan Company 560,808,675 - - 786,937 561,595,612 - -Guangrunlong Logistics 16,465,405 - - - 16,465,405 - -Chengdu Company 280,709,786 - - 639,291 281,349,077 - -Cultural Communication Company(ii) 6,177,233 70,000,000 - 886,413 77,063,646 - -Rizhao Company 339,908,047 - - 763,745 340,671,792 - -Weifang Company 74,339,686 - - 692,807 75,032,493 - -Dezhou Company 22,554,143 - - 801,988 23,356,131 - -Construction Company 2,956,965 - - 454,412 3,411,377 - -Langfang Company 80,163,205 - - 672,453 80,835,658 (51,301,600) -Heze Company 125,299,786 - - 916,657 126,216,443 - -Tengzhou Company 48,898,525 - - 389,474 49,287,999 - -Tsingtao Brewery (Shanghai) Co., Ltd. 1,570,000 - - - 1,570,000 - -Wuhu Company 274,336,696 - - 45,441 274,382,137 (274,290,000) -Shanghai Sales Company 97,300,000 - - - 97,300,000 (47,300,000) -
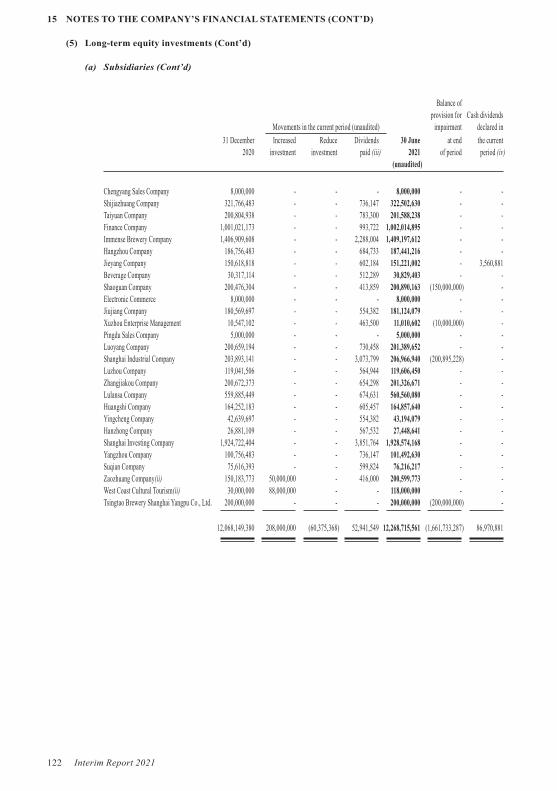
122 Interim Report 2021
15 NOTES TO THE COMPANY’S FINANCIAL STATEMENTS (CONT’D)
(5) Long-term equity investments (Cont’d)
(a) Subsidiaries (Cont’d)
Balance of provision for Cash dividends Movements in the current period (unaudited) impairment declared in
31 December Increased Reduce Dividends 30 June at end the current 2020 investment investment paid (iii) 2021 of period period (iv) (unaudited)
Chengyang Sales Company 8,000,000 - - - 8,000,000 - -Shijiazhuang Company 321,766,483 - - 736,147 322,502,630 - -Taiyuan Company 200,804,938 - - 783,300 201,588,238 - -Finance Company 1,001,021,173 - - 993,722 1,002,014,895 - -Immense Brewery Company 1,406,909,608 - - 2,288,004 1,409,197,612 - -Hangzhou Company 186,756,483 - - 684,733 187,441,216 - -Jieyang Company 150,618,818 - - 602,184 151,221,002 - 3,560,881Beverage Company 30,317,114 - - 512,289 30,829,403 - -Shaoguan Company 200,476,304 - - 413,859 200,890,163 (150,000,000) -Electronic Commerce 8,000,000 - - - 8,000,000 - -Jiujiang Company 180,569,697 - - 554,382 181,124,079 - -Xuzhou Enterprise Management 10,547,102 - - 463,500 11,010,602 (10,000,000) -Pingdu Sales Company 5,000,000 - - - 5,000,000 - -Luoyang Company 200,659,194 - - 730,458 201,389,652 - -Shanghai Industrial Company 203,893,141 - - 3,073,799 206,966,940 (200,895,228) -Luzhou Company 119,041,506 - - 564,944 119,606,450 - -Zhangjiakou Company 200,672,373 - - 654,298 201,326,671 - -Lulansa Company 559,885,449 - - 674,631 560,560,080 - -Huangshi Company 164,252,183 - - 605,457 164,857,640 - -Yingcheng Company 42,639,697 - - 554,382 43,194,079 - -Hanzhong Company 26,881,109 - - 567,532 27,448,641 - -Shanghai Investing Company 1,924,722,404 - - 3,851,764 1,928,574,168 - -Yangzhou Company 100,756,483 - - 736,147 101,492,630 - -Suqian Company 75,616,393 - - 599,824 76,216,217 - -Zaozhuang Company(ii) 150,183,773 50,000,000 - 416,000 200,599,773 - -West Coast Cultural Tourism(ii) 30,000,000 88,000,000 - - 118,000,000 - -Tsingtao Brewery Shanghai Yangpu Co., Ltd. 200,000,000 - - - 200,000,000 (200,000,000) -
12,068,149,380 208,000,000 (60,375,368) 52,941,549 12,268,715,561 (1,661,733,287) 86,970,881
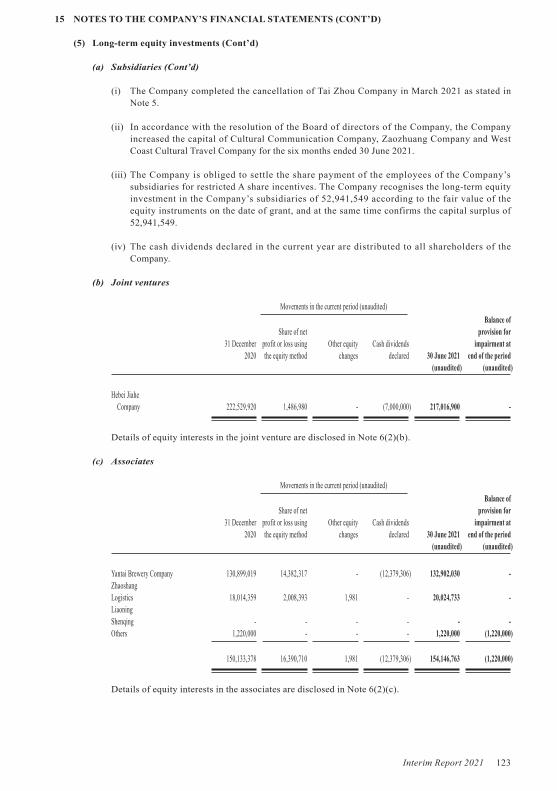
Interim Report 2021 123
15 NOTES TO THE COMPANY’S FINANCIAL STATEMENTS (CONT’D)
(5) Long-term equity investments (Cont’d)
(a) Subsidiaries (Cont’d)
(i) The Company completed the cancellation of Tai Zhou Company in March 2021 as stated in Note 5.
(ii) In accordance with the resolution of the Board of directors of the Company, the Company increased the capital of Cultural Communication Company, Zaozhuang Company and West Coast Cultural Travel Company for the six months ended 30 June 2021.
(iii) The Company is obliged to settle the share payment of the employees of the Company’s subsidiaries for restricted A share incentives. The Company recognises the long-term equity investment in the Company’s subsidiaries of 52,941,549 according to the fair value of the equity instruments on the date of grant, and at the same time confirms the capital surplus of 52,941,549.
(iv) The cash dividends declared in the current year are distributed to all shareholders of the Company.
(b) Joint ventures
Movements in the current period (unaudited)
Balance of Share of net provision for 31 December profit or loss using Other equity Cash dividends impairment at 2020 the equity method changes declared 30 June 2021 end of the period (unaudited) (unaudited)
Hebei Jiahe Company 222,529,920 1,486,980 - (7,000,000) 217,016,900 -
Details of equity interests in the joint venture are disclosed in Note 6(2)(b).
(c) Associates
Movements in the current period (unaudited)
Balance of Share of net provision for 31 December profit or loss using Other equity Cash dividends impairment at 2020 the equity method changes declared 30 June 2021 end of the period (unaudited) (unaudited)
Yantai Brewery Company 130,899,019 14,382,317 - (12,379,306) 132,902,030 -ZhaoshangLogistics 18,014,359 2,008,393 1,981 - 20,024,733 -LiaoningShenqing - - - - - -Others 1,220,000 - - - 1,220,000 (1,220,000)
150,133,378 16,390,710 1,981 (12,379,306) 154,146,763 (1,220,000)
Details of equity interests in the associates are disclosed in Note 6(2)(c).

124 Interim Report 2021
15 NOTES TO THE COMPANY’S FINANCIAL STATEMENTS (CONT’D)
(5) Long-term equity investments (Cont’d)
(d) Provision for impairment of long-term equity investments
Increase in Decrease in 31 December the current the current 2020 period period 30 June 2021 (unaudited) (unaudited) (unaudited) (unaudited)
Subsidiaries (1,661,733,287) - - (1,661,733,287)Associates (1,220,000) - - (1,220,000)
(1,662,953,287) - - (1,662,953,287)
(6) Revenue and cost of sales
Six months ended Six months ended 30 June 30 June 2021 2020 (unaudited) (unaudited)
Revenue from main operation(a) 12,388,050,985 10,509,777,602Revenue from other operations(b) 829,803,911 756,848,217
13,217,854,896 11,266,625,819
Six months ended Six months ended 30 June 30 June 2021 2020 (unaudited) (unaudited)
Cost of main operation(a) (8,900,386,788) (7,990,454,764)Cost of other operations(b) (805,643,216) (734,129,526)
(9,706,030,004) (8,724,584,290)
(a) Revenue and cost of main operation
Six months ended 30 June 2021 Six months ended 30 June 2020 (unaudited) (unaudited)
Revenue from Cost of Revenue from Cost of main operation main operation main operation main operation
Sales of beer, etc. 12,388,050,985 (8,900,386,788) 10,509,777,602 (7,990,454,764)

Interim Report 2021 125
15 NOTES TO THE COMPANY’S FINANCIAL STATEMENTS (CONT’D)
(6) Revenue and cost of sales (Cont’d)
(b) Revenue and cost of other operations
Six months ended 30 June 2021 Six months ended 30 June 2020 (unaudited) (unaudited)
Revenue from Cost of Revenue from Cost of main operation main operation main operation main operation
Sales of raw materials 804,092,989 (781,718,729) 753,645,214 (731,344,694)Others 25,710,922 (23,924,487) 3,203,003 (2,784,832)
829,803,911 (805,643,216) 756,848,217 (734,129,526)
(7) Expenses by nature
The costs of sales, selling and distribution expenses, general and administrative expenses and research and development expenses classified by nature are as follows:
Six months ended Six months ended 30 June 30 June 2021 2020 (unaudited) (unaudited)
Raw materials, packaging materials and consumables used 2,635,074,729 2,089,625,054Changes in inventories of finished goods and work in progress 826,000,534 799,704,365Finished goods purchased from outside 5,889,700,009 5,541,220,914Employee benefits expenses 939,125,904 785,719,063Handling and transportation expenses 586,068,137 470,707,337Advertising related expenses 335,034,418 149,970,341Depreciation and amortisation charges 142,784,682 135,840,008Share-based payment 70,166,456 -Administrative expenses 42,965,659 34,032,798Repair expenses 37,436,209 30,681,367Labour expenses 16,579,798 11,780,273Other expenses 88,983,952 63,358,490
11,609,920,487 10,112,640,010

126 Interim Report 2021
15 NOTES TO THE COMPANY’S FINANCIAL STATEMENTS (CONT’D)
(8) Investment income
Six months ended Six months ended 30 June 30 June 2021 2020 (unaudited) (unaudited)
Investment income from long-term equity investment accounted for using the cost method(a) 45,209,761 43,039,428Investment income from the disposal of long-term equity investments(b) 43,158,604 -Investment income from long-term equity investment accounted for using the equity method 17,877,690 15,263,156Others 1,532,234 3,073,080
107,778,289 61,375,664
There is no significant restriction on transferring funds in the form of investment income.
(a) Investment income from long-term equity investment accounted for using the cost method is the profit distribution of subsidiaries (Note 15(5)(a)).
(b) Investment income from the disposal of long-term equity investment is the income from the cancellation of Taizhou company (Note 15(5)(a)).
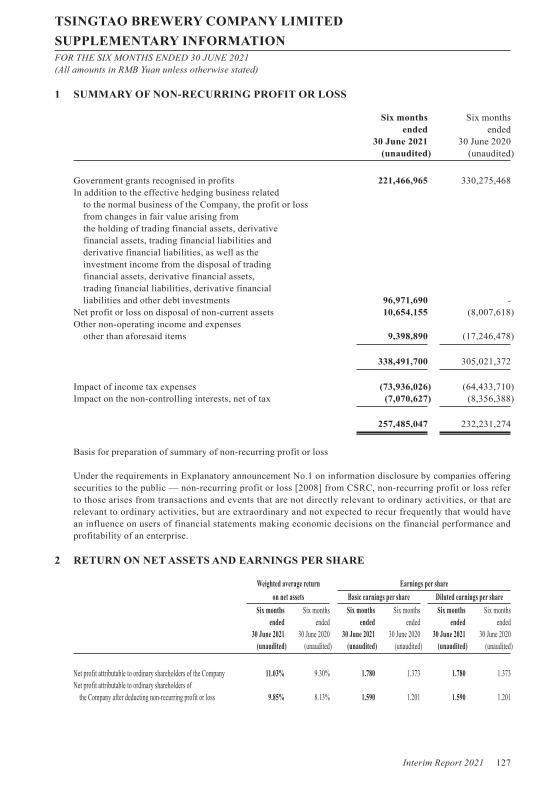
Interim Report 2021 127
TSINGTAO BREWERY COMPANY LIMITEDSUPPLEMENTARY INFORMATIONFOR THE SIX MONTHS ENDED 30 JUNE 2021(All amounts in RMB Yuan unless otherwise stated)
1 SUMMARY OF NON-RECURRING PROFIT OR LOSS
Six months Six months ended ended 30 June 2021 30 June 2020 (unaudited) (unaudited)
Government grants recognised in profits 221,466,965 330,275,468In addition to the effective hedging business related to the normal business of the Company, the profit or loss from changes in fair value arising from the holding of trading financial assets, derivative financial assets, trading financial liabilities and derivative financial liabilities, as well as the investment income from the disposal of trading financial assets, derivative financial assets, trading financial liabilities, derivative financial liabilities and other debt investments 96,971,690 -Net profit or loss on disposal of non-current assets 10,654,155 (8,007,618)Other non-operating income and expenses other than aforesaid items 9,398,890 (17,246,478)
338,491,700 305,021,372
Impact of income tax expenses (73,936,026) (64,433,710)Impact on the non-controlling interests, net of tax (7,070,627) (8,356,388)
257,485,047 232,231,274
Basis for preparation of summary of non-recurring profit or loss
Under the requirements in Explanatory announcement No.1 on information disclosure by companies offering securities to the public — non-recurring profit or loss [2008] from CSRC, non-recurring profit or loss refer to those arises from transactions and events that are not directly relevant to ordinary activities, or that are relevant to ordinary activities, but are extraordinary and not expected to recur frequently that would have an influence on users of financial statements making economic decisions on the financial performance and profitability of an enterprise.
2 RETURN ON NET ASSETS AND EARNINGS PER SHARE
Weighted average return Earnings per share
on net assets Basic earnings per share Diluted earnings per share
Six months Six months Six months Six months Six months Six months ended ended ended ended ended ended 30 June 2021 30 June 2020 30 June 2021 30 June 2020 30 June 2021 30 June 2020 (unaudited) (unaudited) (unaudited) (unaudited) (unaudited) (unaudited)
Net profit attributable to ordinary shareholders of the Company 11.03% 9.30% 1.780 1.373 1.780 1.373Net profit attributable to ordinary shareholders of the Company after deducting non-recurring profit or loss 9.85% 8.13% 1.590 1.201 1.590 1.201

128 Interim Report 2021
MANAGEMENT DISCUSSION AND ANALYSIS
(I) INTRODUCTION OF GENERAL INFORMATION OF THE COMPANY’S OPERATING ACTIVITIES DURING THE REPORTING PERIOD
In the first half of 2021, the domestic beer market saw restorative growth driven by the trend of upgraded consumption in the beer industry. In the first half of the fiscal year, China’s total beer production reached 18.89 million kl. (Data source: National Bureau of Statistics; statistical population: all industrial corporate entities with annual revenue over RMB20 million.)
During the Reporting Period, the Company firmly implemented high quality development strategy formulated by the Board of Directors. Internal growth drivers were fully activated, which accelerated the optimization of capacity and the upgrading of product mix, gave full play to the brand and quality advantages of Tsingtao Beer and proactively developed domestic and foreign markets. At the same time, by cultivating more sources of income, reducing costs and increasing efficiency, the Company achieved continuous stable growth in business performance. During the Reporting Period, the Company’s total product sales volume reached 4.769 million kl, a year-on-year increase of 8.2%, generated operating revenue of RMB18.29 billion, a year-on-year increase of 16.66%; net profits attributable to the shareholders of the listed company was RMB2.416 billion, a year-on-year increase of 30.22%.
In the first half of the year, the Company took full advantage of its sales network that covers major domestic markets, continued to strengthen traditional core markets and entered emerging markets along the strategic belt. Led by the upgrading of product mix, the Company focused on core products, took the initiative to develop a series of artistically-created products such as distinctive-flavored “Centennial Journey” and “Amber Lager”, and by virtue of a quality differentiated product mix, set the trend for ultra high-end development and product upgrade of China’s beer industry. During the Reporting Period, the Company achieved a growth of 7.8% year-on-year in revenue from beer sales per kl, with the total sales volume of its core brand, Tsingtao Beer, reached 2.528 million kl, a year-on-year increase of 20.9%. The sales volume of products of above the high end increased by 41.4% year-on year. The Company managed to maintain its competitive edge in domestic mid- and high-end beer market with its expanding high-quality development achievements.
On the international market, the Company carried out branding communication and marketing activities led by the high quality, high prices and high visibility of Tsingtao Beer. Facing the tough challenge of the pandemic on the international market, the Company made plans in advance as a fast response to continuously boost market sales and international influence. The Company achieved a year-on-year increase of 21.3% in sales volume on the overseas market.
During the Reporting Period, the Company continued to proactively implement its brand strategy of “Tsingtao Beer as Core Brand + Laoshan Beer as Second Brand”. It stepped up effort in brand communication and channel innovation, setting a new marketing trend of diversified consumption scenarios on the backdrop of consumption upgrading through pervasive all-round brand promotion. As of now, the Company has established more than 200 “TSINGTAO1903 Tsingtao Beer Bars” across the country to create new high ground for immersive beer experience and satisfy consumers’ multi-level demands for individualized, scenario-based, convenient, and high-end experience.
During the Reporting Period, the Company accelerated its digital transformation for stronger synergistic effect through large and intelligent production bases developed from industrial internet network. As a result of these efforts, Tsingtao Brewery Factory is recognised as the “Lighthouse Factory” as the world’s first industrial internet network in the beer and beverage industry; the Company has established a “charismatic quality management model based on digital end-to-end decoding”, delivered an effective charismatic quality management system that saw tangible achievements. In addition, the Company saw rapid growth in emerging business such as smart supply chain. New achievements in the development of digital supply chain were made. These contributed to the continuous improvement in the Company’s management efficiency.
During the Reporting Period, “Tsingtao Beer” continued to maintain first place in terms of brand value in China’s beer industry with a brand value of RMB198.566 billion. The total value of the Company’s brands such as “Tsingtao Beer”, “Laoshan Beer” and “Hans Beer” has exceeded RMB300 billion (Data source: World Brand Lab).
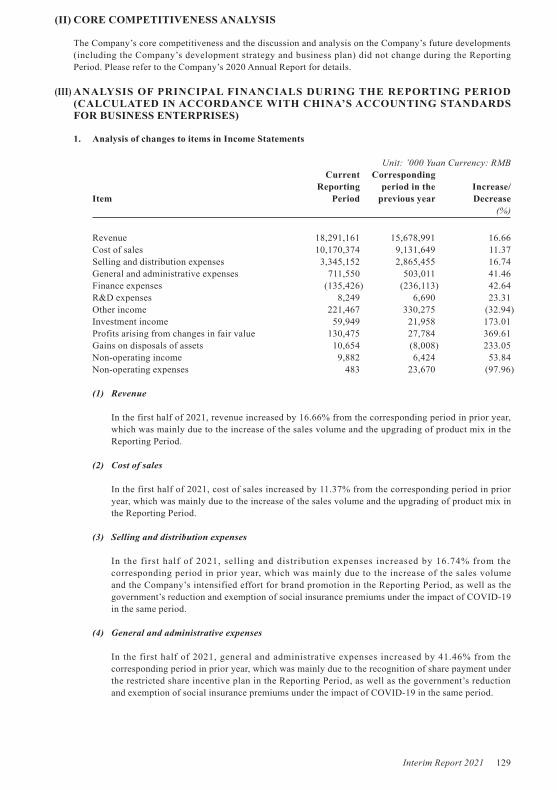
Interim Report 2021 129
(II) CORE COMPETITIVENESS ANALYSIS
The Company’s core competitiveness and the discussion and analysis on the Company’s future developments (including the Company’s development strategy and business plan) did not change during the Reporting Period. Please refer to the Company’s 2020 Annual Report for details.
(III) ANALYSIS OF PRINCIPAL FINANCIALS DURING THE REPORTING PERIOD (CALCULATED IN ACCORDANCE WITH CHINA’S ACCOUNTING STANDARDS FOR BUSINESS ENTERPRISES)
1. Analysis of changes to items in Income Statements
Unit: ’000 Yuan Currency: RMB Current Corresponding Reporting period in the Increase/Item Period previous year Decrease (%)
Revenue 18,291,161 15,678,991 16.66Cost of sales 10,170,374 9,131,649 11.37Selling and distribution expenses 3,345,152 2,865,455 16.74General and administrative expenses 711,550 503,011 41.46Finance expenses (135,426) (236,113) 42.64R&D expenses 8,249 6,690 23.31Other income 221,467 330,275 (32.94)Investment income 59,949 21,958 173.01Profits arising from changes in fair value 130,475 27,784 369.61Gains on disposals of assets 10,654 (8,008) 233.05Non-operating income 9,882 6,424 53.84Non-operating expenses 483 23,670 (97.96)
(1) Revenue
In the first half of 2021, revenue increased by 16.66% from the corresponding period in prior year, which was mainly due to the increase of the sales volume and the upgrading of product mix in the Reporting Period.
(2) Cost of sales
In the first half of 2021, cost of sales increased by 11.37% from the corresponding period in prior year, which was mainly due to the increase of the sales volume and the upgrading of product mix in the Reporting Period.
(3) Selling and distribution expenses
In the first half of 2021, selling and distribution expenses increased by 16.74% from the corresponding period in prior year, which was mainly due to the increase of the sales volume and the Company’s intensified effort for brand promotion in the Reporting Period, as well as the government’s reduction and exemption of social insurance premiums under the impact of COVID-19 in the same period.
(4) General and administrative expenses
In the first half of 2021, general and administrative expenses increased by 41.46% from the corresponding period in prior year, which was mainly due to the recognition of share payment under the restricted share incentive plan in the Reporting Period, as well as the government’s reduction and exemption of social insurance premiums under the impact of COVID-19 in the same period.

130 Interim Report 2021
(5) Finance expenses
In the first half of 2021, finance expenses increased by 42.64% from the corresponding period in prior year, which was mainly due to that the income from wealth management products and other debt instruments were included into profits arising from changes in fair value in the Reporting Period.
(6) R&D expenses
In the first half of 2021, R&D expenses increased by 23.31%, which was mainly due to that the R&D spending in the Reporting Period increased from the corresponding period in prior year.
(7) Other income
In the first half of 2021, other income decreased by 32.94% from the corresponding period in prior year, which was mainly due to that the government subsidies relating to daily operating activities received by some subsidiaries in the Reporting Period decreased from the corresponding period in prior year.
(8) Investment income
In the first half of 2021, investment income increased by 173.01% from the corresponding period in prior year, which was mainly due to that the income from interbank negotiable certificates of deposit was included into investment income in the Reporting Period.
(9) Profits arising from changes in fair value
In the first half of 2021, profits arising from changes in fair value increased by 369.61% from the corresponding period in prior year, which was mainly due to that the wealth management products and other debt instruments generated profits arising from changes in fair value in the Reporting Period.
(10) Gains on disposals of assets
In the first half of 2021, gains on disposals of assets increased by 233.05% from the corresponding period in prior year, which was mainly due to that the gains on disposals of long-term assets such as land use rights by some subsidiaries in the Reporting Period increased from the corresponding period in prior year.
(11) Non-operating income
In the first half of 2021, non-operating income increased by 53.84% from the corresponding period in prior year, which was mainly due to that the income irrelevant to daily operating activities recognised by some subsidiaries in the Reporting Period increased from the corresponding period in prior year.
(12) Non-operating expenses
In the first half of 2021, non-operating expenses decreased by 97.96% from the corresponding period in prior year, which was mainly due to that the Company proactively fulfilled its social responsibility by making donations externally to fight against COVID-19 in the same period.

Interim Report 2021 131
2. Analysis of changes to items in Cash Flow Statements
Unit: ‘000 Yuan Currency: RMB Current Corresponding Reporting period in the Increase/Item Period previous year Decrease (%)
Net cash flow from operating activities 5,024,661 4,964,497 1.21Net cash flow from investing activities (15,478,269) (775,104) (1,896.93)Net cash flow from financing activities (337,776) (687,707) 50.88
(1) Net cash flow from operating activities
In the first half of 2021, net cash flow from operating activities increased by 1.21% from the corresponding period in prior year, which was mainly due to that the cash received from the sale of commodities and labour services increased from the corresponding period in prior year due to the increase of the sales volume and the upgrading of product mix in the Reporting Period.
(2) Net cash flow from investing activities
In the first half of 2021, net cash flow from investing activities decreased by RMB14,703,165,000 from the corresponding period in prior year, which was mainly due to the increase in the cash outflow from investing activities caused by wealth management products and other debt instruments in the Reporting Period.
(3) Net cash flow from financing activities
In the first half of 2021, net cash flow from financing activities increased by 50.88% from the corresponding period in prior year, which was mainly due to the difference in the time of payment for cash dividend distributed according to the annual general meeting’s resolution in the Reporting Period and the same period.
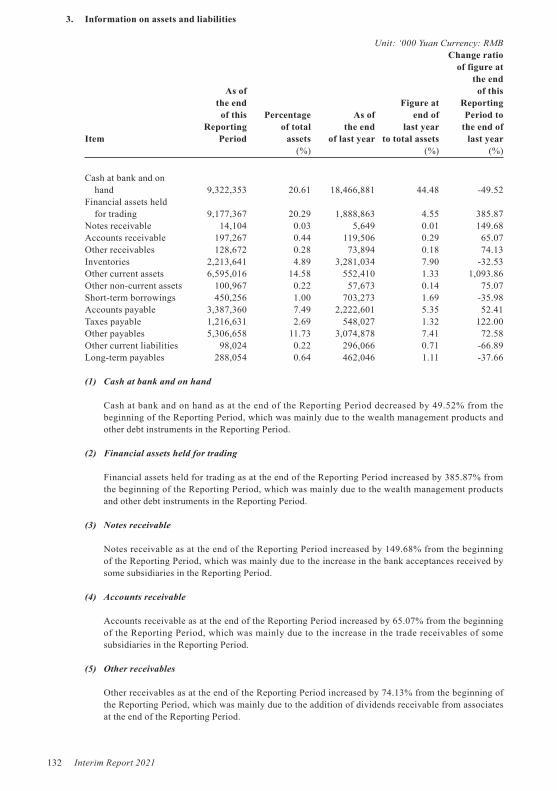
132 Interim Report 2021
3. Information on assets and liabilities
Unit: ‘000 Yuan Currency: RMB Change ratio of figure at the end As of of this the end Figure at Reporting of this Percentage As of end of Period to Reporting of total the end last year the end of Item Period assets of last year to total assets last year (%) (%) (%)
Cash at bank and on hand 9,322,353 20.61 18,466,881 44.48 -49.52Financial assets held for trading 9,177,367 20.29 1,888,863 4.55 385.87Notes receivable 14,104 0.03 5,649 0.01 149.68Accounts receivable 197,267 0.44 119,506 0.29 65.07Other receivables 128,672 0.28 73,894 0.18 74.13Inventories 2,213,641 4.89 3,281,034 7.90 -32.53Other current assets 6,595,016 14.58 552,410 1.33 1,093.86Other non-current assets 100,967 0.22 57,673 0.14 75.07Short-term borrowings 450,256 1.00 703,273 1.69 -35.98Accounts payable 3,387,360 7.49 2,222,601 5.35 52.41Taxes payable 1,216,631 2.69 548,027 1.32 122.00Other payables 5,306,658 11.73 3,074,878 7.41 72.58Other current liabilities 98,024 0.22 296,066 0.71 -66.89Long-term payables 288,054 0.64 462,046 1.11 -37.66
(1) Cash at bank and on hand
Cash at bank and on hand as at the end of the Reporting Period decreased by 49.52% from the beginning of the Reporting Period, which was mainly due to the wealth management products and other debt instruments in the Reporting Period.
(2) Financial assets held for trading
Financial assets held for trading as at the end of the Reporting Period increased by 385.87% from the beginning of the Reporting Period, which was mainly due to the wealth management products and other debt instruments in the Reporting Period.
(3) Notes receivable
Notes receivable as at the end of the Reporting Period increased by 149.68% from the beginning of the Reporting Period, which was mainly due to the increase in the bank acceptances received by some subsidiaries in the Reporting Period.
(4) Accounts receivable
Accounts receivable as at the end of the Reporting Period increased by 65.07% from the beginning of the Reporting Period, which was mainly due to the increase in the trade receivables of some subsidiaries in the Reporting Period.
(5) Other receivables
Other receivables as at the end of the Reporting Period increased by 74.13% from the beginning of the Reporting Period, which was mainly due to the addition of dividends receivable from associates at the end of the Reporting Period.

Interim Report 2021 133
(6) Inventories
Inventories as at the end of the Reporting Period decreased by 32.53% from the beginning of the Reporting Period, which was mainly due to the decrease in the goods in stock and raw materials of some subsidiaries in the peak season in the Reporting Period.
(7) Other current assets
Other current assets as at the end of the Reporting Period increased by RMB6,042,606,000 from the beginning of the Reporting Period, which was mainly due to the interbank negotiable certificates of deposit in the Reporting Period.
(8) Other non-current assets
Other non-current assets as at the end of the Reporting Period increased by 75.07% from the beginning of the Reporting Period, which was mainly due to the increase in some subsidiaries’ prepayments for projects and the procurement of equipment in the Reporting Period.
(9) Short-term borrowings
Short-term borrowings as at the end of the Reporting Period decreased by 35.98% from the beginning of the Reporting Period, which was mainly due to the decrease in the interbank borrowings of Tsingtao Brewery Finance LLC, a wholly-owned subsidiary of the Company, in the Reporting Period.
(10) Accounts payable
Accounts payable as at the end of the Reporting Period increased by 52.41% from the beginning of the Reporting Period, which was mainly due to the purchase of materials in the Reporting Period.
(11) Taxes payable
Taxes payable as at the end of the Reporting Period increased by 122.00% from the beginning of the Reporting Period, which was mainly due to the increase in the income taxes, VAT and consumption taxes payable as at the end of the Reporting Period.
(12) Other payables
Other payables as at the end of the Reporting Period increased by 72.58% from the beginning of the Reporting Period, which was mainly due to that the cash dividends to be distributed according to the resolution at the annual general meeting had yet to be paid as at the end of the Reporting Period, and the expenses to be paid increased because of the increase in the sales volume.
(13) Other current liabilities
Other current liabilities as at the end of the Reporting Period decreased by 66.89% from the beginning of the Reporting Period, which was mainly due to the decrease in some subsidiaries’ output VAT to be recognised as at the end of the Reporting Period.
(14) Long-term payables
Long-term payables as at the end of the Reporting Period decreased by 37.66% from the beginning of the Reporting Period, which was mainly due to that some subsidiaries transferred the compensation for relocation received from the government into deferred income according to the progress of the relocation projects.

134 Interim Report 2021
4. Other information
(1) Debt/Capital ratio
As at 30 June 2021, the Company’s debt/capital ratio was 0% (31 December 2020: 0%). The calculation of debt/capital ratio is: total amount of long-term borrowings/(total amount of long-term borrowings + interests attributable to the shareholders of the Company)
(2) Assets mortgage
As at 30 June 2021, the Company did not have any mortgages (31 December 2020: Nil)
(3) Risk of fluctuations in exchange rate
The Company currently relies on imported barley as its raw material. Therefore, fluctuations in the exchange rate would indirectly affect the purchase cost of raw materials. In addition, fluctuations in exchange rate would also directly affect the product export income of the Company as some beer products of the Company are exported for sale. These matters would impact the profitability of the Company to certain extents.
(4) Capital expenses
In the first half of year 2021, the Company had invested a total of approximately RMB704 million in new construction, relocation, reconstruction and expansion projects. Based on the current situation of the Company’s funds and profitability, there are sufficient self-owned funds and continuous net operating cash inflow to satisfy the Company’s needs for funds for its capital projects.
(5) Investments
See details in the notes to the financial statements of the 2021 Interim Report.
(6) Contingent liabilities
Nil.
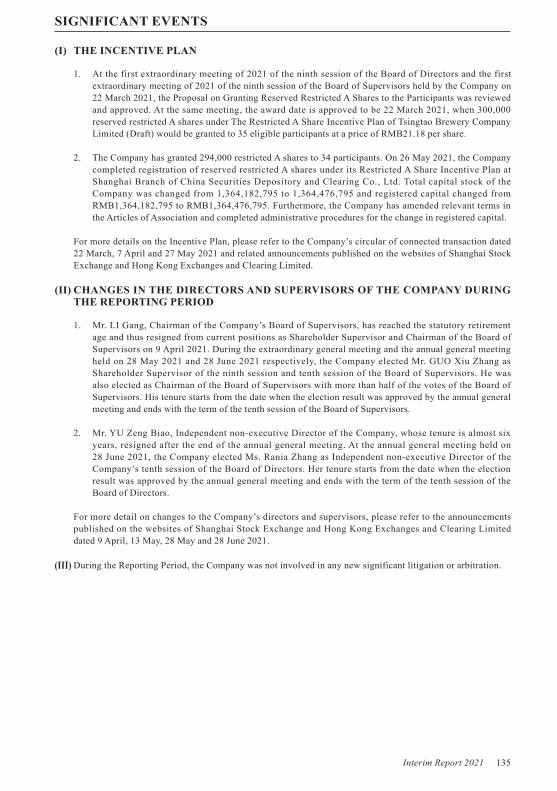
Interim Report 2021 135
SIGNIFICANT EVENTS
(I) THE INCENTIVE PLAN
1. At the first extraordinary meeting of 2021 of the ninth session of the Board of Directors and the first extraordinary meeting of 2021 of the ninth session of the Board of Supervisors held by the Company on 22 March 2021, the Proposal on Granting Reserved Restricted A Shares to the Participants was reviewed and approved. At the same meeting, the award date is approved to be 22 March 2021, when 300,000 reserved restricted A shares under The Restricted A Share Incentive Plan of Tsingtao Brewery Company Limited (Draft) would be granted to 35 eligible participants at a price of RMB21.18 per share.
2. The Company has granted 294,000 restricted A shares to 34 participants. On 26 May 2021, the Company completed registration of reserved restricted A shares under its Restricted A Share Incentive Plan at Shanghai Branch of China Securities Depository and Clearing Co., Ltd. Total capital stock of the Company was changed from 1,364,182,795 to 1,364,476,795 and registered capital changed from RMB1,364,182,795 to RMB1,364,476,795. Furthermore, the Company has amended relevant terms in the Articles of Association and completed administrative procedures for the change in registered capital.
For more details on the Incentive Plan, please refer to the Company’s circular of connected transaction dated 22 March, 7 April and 27 May 2021 and related announcements published on the websites of Shanghai Stock Exchange and Hong Kong Exchanges and Clearing Limited.
(II) CHANGES IN THE DIRECTORS AND SUPERVISORS OF THE COMPANY DURING THE REPORTING PERIOD
1. Mr. LI Gang, Chairman of the Company’s Board of Supervisors, has reached the statutory retirement age and thus resigned from current positions as Shareholder Supervisor and Chairman of the Board of Supervisors on 9 April 2021. During the extraordinary general meeting and the annual general meeting held on 28 May 2021 and 28 June 2021 respectively, the Company elected Mr. GUO Xiu Zhang as Shareholder Supervisor of the ninth session and tenth session of the Board of Supervisors. He was also elected as Chairman of the Board of Supervisors with more than half of the votes of the Board of Supervisors. His tenure starts from the date when the election result was approved by the annual general meeting and ends with the term of the tenth session of the Board of Supervisors.
2. Mr. YU Zeng Biao, Independent non-executive Director of the Company, whose tenure is almost six years, resigned after the end of the annual general meeting. At the annual general meeting held on 28 June 2021, the Company elected Ms. Rania Zhang as Independent non-executive Director of the Company’s tenth session of the Board of Directors. Her tenure starts from the date when the election result was approved by the annual general meeting and ends with the term of the tenth session of the Board of Directors.
For more detail on changes to the Company’s directors and supervisors, please refer to the announcements published on the websites of Shanghai Stock Exchange and Hong Kong Exchanges and Clearing Limited dated 9 April, 13 May, 28 May and 28 June 2021.
(III) During the Reporting Period, the Company was not involved in any new significant litigation or arbitration.
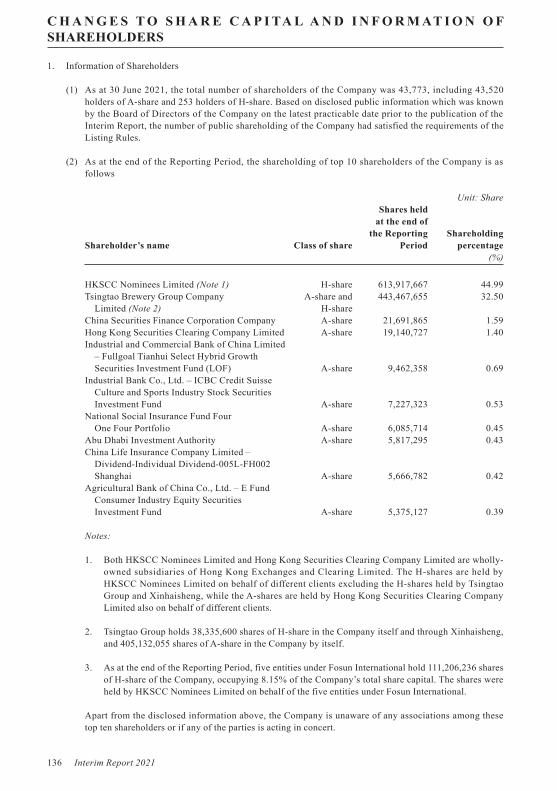
136 Interim Report 2021
C H A N G E S T O S H A R E C A P I TA L A N D I N F O R M AT I O N O F SHAREHOLDERS
1. Information of Shareholders
(1) As at 30 June 2021, the total number of shareholders of the Company was 43,773, including 43,520 holders of A-share and 253 holders of H-share. Based on disclosed public information which was known by the Board of Directors of the Company on the latest practicable date prior to the publication of the Interim Report, the number of public shareholding of the Company had satisfied the requirements of the Listing Rules.
(2) As at the end of the Reporting Period, the shareholding of top 10 shareholders of the Company is as follows
Unit: Share Shares held at the end of the Reporting Shareholding Shareholder’s name Class of share Period percentage (%)
HKSCC Nominees Limited (Note 1) H-share 613,917,667 44.99Tsingtao Brewery Group Company A-share and 443,467,655 32.50 Limited (Note 2) H-shareChina Securities Finance Corporation Company A-share 21,691,865 1.59Hong Kong Securities Clearing Company Limited A-share 19,140,727 1.40Industrial and Commercial Bank of China Limited – Fullgoal Tianhui Select Hybrid Growth Securities Investment Fund (LOF) A-share 9,462,358 0.69Industrial Bank Co., Ltd. – ICBC Credit Suisse Culture and Sports Industry Stock Securities Investment Fund A-share 7,227,323 0.53National Social Insurance Fund Four One Four Portfolio A-share 6,085,714 0.45Abu Dhabi Investment Authority A-share 5,817,295 0.43China Life Insurance Company Limited – Dividend-Individual Dividend-005L-FH002 Shanghai A-share 5,666,782 0.42Agricultural Bank of China Co., Ltd. – E Fund Consumer Industry Equity Securities Investment Fund A-share 5,375,127 0.39
Notes:
1. Both HKSCC Nominees Limited and Hong Kong Securities Clearing Company Limited are wholly-owned subsidiaries of Hong Kong Exchanges and Clearing Limited. The H-shares are held by HKSCC Nominees Limited on behalf of different clients excluding the H-shares held by Tsingtao Group and Xinhaisheng, while the A-shares are held by Hong Kong Securities Clearing Company Limited also on behalf of different clients.
2. Tsingtao Group holds 38,335,600 shares of H-share in the Company itself and through Xinhaisheng, and 405,132,055 shares of A-share in the Company by itself.
3. As at the end of the Reporting Period, five entities under Fosun International hold 111,206,236 shares of H-share of the Company, occupying 8.15% of the Company’s total share capital. The shares were held by HKSCC Nominees Limited on behalf of the five entities under Fosun International.
Apart from the disclosed information above, the Company is unaware of any associations among these top ten shareholders or if any of the parties is acting in concert.

Interim Report 2021 137
(3) Substantial Shareholders of H-share
Apart from the disclosed information below, the directors of the Company are not aware of any persons other than a director or supervisor or chief executive of the Company or his/her respective associate(s) who, as at 30 June 2021, had an interest or short position in the shares or underlying shares of the Company which was recorded in the register to be kept under Section 336 of SFO:
Number As a As a of Shares/ percentage percentage Class of underlying of the entire of all Name Nature Shares Capacity Note Shares issued capital H Shares
SASACQ Long position A-Share Corporate 405,132,055 29.69% N/A A-Share
Long position H-Share Interest of controlled 1 38,335,600 2.81% 5.85% Corporation H-Share
Hong Kong Long position H-Share Beneficial Owner 38,335,600 2.81% 5.85% Xinhaisheng H-Share Investment Limited
Guo Guangchang Long position H-Share Interest of controlled 2 111,206,236 8.15% 16.98% Corporation H-Share
Fosun International Long position H-Share Interest of controlled 2 111,206,236 8.15% 16.98% Holdings Ltd. Corporation H-Share
Fosun International Long position H-Share Interest of controlled 2 111,206,236 8.15% 16.98% Limited Corporation H-Share
Fosun Industrial Long position H-Share Beneficial Owner 80,689,626 5.91% 12.32% Holdings Limited H-Share
Baillie Gifford & Co. Long position H-Share Interest of controlled 3 34,477,701 2.53% 5.26% Corporation/ H-Share Investment manager
Notes:
(1) The 38,335,600 H-Shares which were deemed to be interested by SASACQ were held by Xinhaisheng, a wholly-owned subsidiary of Tsingtao Brewery Group, which is controlled by SASACQ. According to the latest disclosure of interest filings, SASACQ was interested in 38,335,600 H-Shares.
(2) The shares in which Mr. GUO Guangchang, Fosun International Holdings Ltd. and Fosun International Limited were deemed to be interested were held through various controlled corporations and a fund managed by the controlled corporation held by Mr. GUO Guangchang, Fosun International Holdings Ltd. and Fosun International Limited.
(3) The shares in which Baillie Gifford & Co. was deemed to be interested were held through various controlled wholly-owned subsidiaries of Baillie Gifford & Co.
(4) For the latest disclosure of interests filed for the Company’s substantial shareholders, please refer to the “Disclosure of Interests” section on the website of Hong Kong Exchanges and Clearing Limited (www.hkex.com.hk).

138 Interim Report 2021
DIRECTORS, SUPERVISORS AND STAFF
1. The shareholding of the Company’s directors, supervisors and staff
As at 30 June 2021, Mr. HUANG Ke Xing, Chairman of the Company, was deemed to hold 151,400 shares of the Company, including 1,300 outstanding A shares and 150,000 restricted A shares held by himself and 100 outstanding A shares held by his spouse. Mr. YU Zhu Ming, Executive Director and CFO of the Company, held 110,000 restricted A shares; Mr. WANG Rui Yong, Executive Director and Vice President of the Company, held 110,000 restricted A shares; HUANG Zu Jiang, Staff Supervisor of the Company, held 12,900 outstanding A shares.
As at 30 June 2021, apart from the disclosed information above, none of the directors, supervisors or senior management officers of the Company had any interests or short position in the shares, underlying shares or debentures of the Company or any associated corporations (as defined in Part XV of SFO), and such interests or short positions were recorded in the register required to be kept under Section 352 of SFO or otherwise notified to the Company and the Stock Exchange pursuant to the Model Code.
2. Model Code
The Company has adopted Model Code and Administration Regulations of Shares of the Company Held by Its Directors, Supervisors and Senior Management Officers and the Changes formulated by the Company as its code of conduct and standards in respect of securities transactions by the directors and supervisors. Specific enquiries were made with all directors and supervisors who had confirmed that they had complied with Model Code as well as its code of conduct and standards regarding securities transactions by the directors and supervisors at all applicable times during the Reporting Period.
3 Employees
As at 30 June 2021, the Company (including the subsidiaries) employs a total of 33,945 full-time employees.
The Company continued to refine the comprehensive incentive system that “is based on remuneration incentive, driven by career development incentive, concentrated by emotional incentive and centered around cultural incentive”. With the contribution of performance and job values as a measurement, the Company implemented a corporate growth-based mechanism of staff income sharing that is linked with economic benefits of the Company and productivity of all employees.
In the first half of 2021, the Company focused on the work policy of “stabilizing growth in the beer business, accelerating breakthroughs in emerging business, blazing a new trail through leaping development and undertaking the great cause by shouldering responsibilities and taking tangible steps”. Centering around the incentive of sharing growth in profits, income and sales volume, coupled with specific rewards including incentives for growth in key products and super high-end products and incentives for cost reduction and efficiency increase, the Company continued to improve the mechanism of linking total salaries with performance. These efforts have led to a substantial increase in the per capita efficiency, a stable growth in staff income and a positive development trend in the Company’s input-output efficiency, injecting strong impetus into the Company’s sustainable high-quality development.
In 2021, the Company quickened the pace of transforming training and explored empowerment modes that are more practical and more suitable for the new context. Delving into the training model of “practical research”, the Company created training-practice integrated models represented by “Practical Research on Project Management” to precisely empower the front line of business; exploring trainee-centered learning platforms, the Company enabled access to the best learning resources and the newest cases at one click, which led to the introduction of six high quality learning platforms and more than 3,100 internal and external courses; exploring the blended learning model for key management personnel, the Company upgraded Marketing EDP Training Camp and Practical Training Class for Silver Star 2.0 Reserve Cadres; exploring the development of a three-dimensional network for community learning, the Company created a featured learning community covering general managers, the middle management, key professionals and front-line employees; exploring new models of skill competitions in the next context, the Company introduced remote practical operation, virtual simulation and robot competition in the 8th Session of Professional Skill Competition, allowing 18,500 front-line employees to compete, learn and develop on new platforms.

Interim Report 2021 139
PURCHASING, SELLING OR REDEEMING THE SECURITIES
During the six months as of 30 June 2021, neither the Company nor any of its subsidiaries had purchased, sold or redeemed any of the listed securities of the Company.
REVIEW OF THE UNAUDITED INTERIM RESULTS
The Audit & Internal Control Committee of the Board has reviewed the Company’s unaudited 2021 Interim Results.
CODE OF CORPORATE GOVERNANCE
The Company was listed simultaneously on Shanghai Stock Exchange and The Stock Exchange and its corporate governance practices shall comply with the requirements of applicable laws and securities regulations of both Shanghai and Hong Kong. The Company is dedicated to maintain a high level of corporate governance and abided by all the provisions set out in the Corporate Governance Code of Appendix 14 of the Listing Rules during the Reporting Period, except the deviation from provision A.2.1 of the Corporate Governance Code.
Provision A.2.1 of the Corporate Governance Code stipulates that the roles of the Chairman of the Board and the Chief Executive Officer should be separated and not be performed by the same person. Since Mr. FAN Wei resigned from the positions of Executive Director and President of the Company on 28 February 2020 because he had reached the statutory retirement age, the position of President of the Company remains temporarily vacant as the successor of the Company’s President has been under discussion and negotiation. In order to ensure the normal operation of the Company, the Chairman of the Board has been discreetly performing the duties of the President in line with the demand of maintaining a sound and stable corporate governance structure that meets the needs of the Company.
DEFINITIONS
In this Report, the following expressions have the following respective meanings set adjacent below, unless the context requires otherwise:
the Company Means Tsingtao Brewery Company Limited
the Group Means the Company and its subsidiaries
the Board Means Board of Directors of the Company
Tsingtao Group Means Tsingtao Brewery Company Limited
SASACQ Means State-owned Assets Supervision & Administration Commission of the People’s Government of Qingdao
SSE Means Shanghai Stock Exchange
the Stock Exchange Means The Stock Exchange of Hong Kong Limited
Reporting Period Means January 1 to June 30, 2021
Model Code Means Model Code for Securities Transactions by Directors of Listed Issuers
Listing Rules Means Rules Governing the Listing of Securities on The Stock of Exchange of Hong Kong Limited
Articles of Association Means Articles of Association of the Company
Xinhaisheng Means Hong Kong Xinhaisheng Investment Development Co., Ltd.
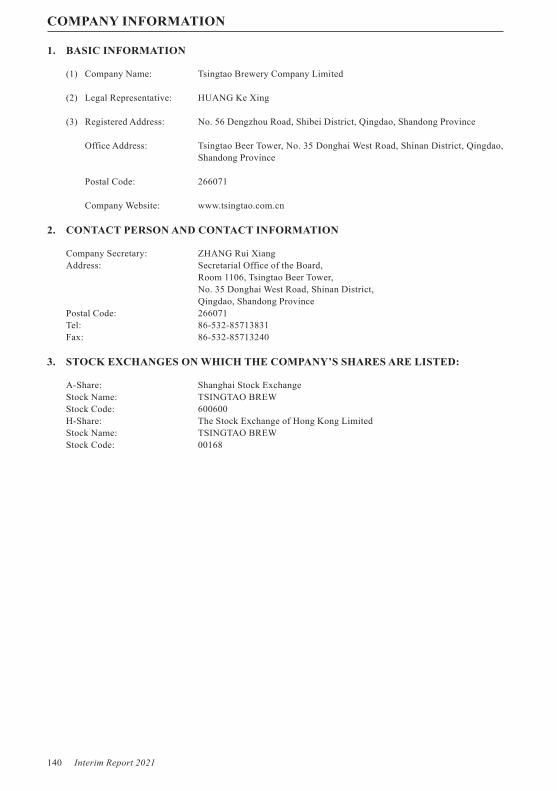
140 Interim Report 2021
COMPANY INFORMATION
1. BASIC INFORMATION
(1) Company Name: Tsingtao Brewery Company Limited
(2) Legal Representative: HUANG Ke Xing
(3) Registered Address: No. 56 Dengzhou Road, Shibei District, Qingdao, Shandong Province
Office Address: Tsingtao Beer Tower, No. 35 Donghai West Road, Shinan District, Qingdao, Shandong Province
Postal Code: 266071
Company Website: www.tsingtao.com.cn
2. CONTACT PERSON AND CONTACT INFORMATION
Company Secretary: ZHANG Rui XiangAddress: Secretarial Office of the Board, Room 1106, Tsingtao Beer Tower, No. 35 Donghai West Road, Shinan District, Qingdao, Shandong ProvincePostal Code: 266071Tel: 86-532-85713831Fax: 86-532-85713240
3. STOCK EXCHANGES ON WHICH THE COMPANY’S SHARES ARE LISTED:
A-Share: Shanghai Stock ExchangeStock Name: TSINGTAO BREWStock Code: 600600H-Share: The Stock Exchange of Hong Kong LimitedStock Name: TSINGTAO BREWStock Code: 00168

2021