) 'ED 199 976 **********************************************************
53
) 'ED 199 976 AUTHOR TITLE INSTITUTION. SPONS AGENCY BUREAU NO PUB DATE CONTRACT ROTE EDhS PRICE DESCRIPTORS ABSTRACT describes a t ephone survey to determine tile extent t which 153' , 1 Education pro ram volume dje 4:tualized. As part cflra.:=141Ve. students, handicapped migrant.;phildren.were identified in and =d lEPs prepared .0 in di ffe.rent schools. Information is presented in film headings: student charcteristics, student assessment, development of IEPs, transmission and utilization of IEP related informatioA, and continuity reflected in IEPs. Among conclusions drawn are that the different sobcols in which handidapped migrant students enroll are the' students' IEPs: lEPs ed migrants tnan for rcent of the handicapped n one of the scboo.s in which when multiple IEPs are sent in' assessment results and dixes include a description of the view guide. (CL) . r DOCUREXT RESUME EC 132 478 Pyeohar John N.; And Others . / A Study of the Implementation of P.L. 94-142 for Handicapped Migrank Children. Final Report. Research Triamle Inst., Durham, P.C..Center for Educatiohal Research and Evaluation. Office of Special Education (ED), Wadhingten, D.Z. .RTI/1544/-27-P Oct 80 . . 300-77-0529 53p/: Fdr related documeints,'see EC 132.472-417. MF01/PC03 Plus Postage. *ComplianCe (Legal): *Disabilities: Elemeitary Secondazy Eddcatiynr *Individuallzed Education Programs: *Migrant Chi/Uren: National SuVeis; Student Charateristics: Student Evaluatron ; not coAsistentAn idontifying and pAparin are dereloped'less frequently for handica nonmigiants: and although only a' small students halt, IEPs developed at more) they pnroillauring an 18 wont pert prepared,'they-reflect generel agz service contini.ty. Detailed app survey plan atelephOnein *. ,f 4 ***4************it****************************************************** * Reproductions supplied by EDRS are the best that can * from the original document. . . 0 * 9 ********************************************************************** 4
-
Upload
khangminh22 -
Category
Documents
-
view
3 -
download
0
Transcript of ) 'ED 199 976 **********************************************************
) 'ED 199 976
AUTHORTITLE
INSTITUTION.
SPONS AGENCYBUREAU NOPUB DATECONTRACTROTE
EDhS PRICEDESCRIPTORS
ABSTRACT
describes a t ephone survey to determine tile extent t which 153' ,1Education pro ram
volume dje 4:tualized.As partcflra.:=141Ve. students,
handicapped migrant.;phildren.were identified in and =d lEPs prepared .0in di ffe.rent schools. Information is presented in film headings:student charcteristics, student assessment, development of IEPs,transmission and utilization of IEP related informatioA, andcontinuity reflected in IEPs. Among conclusions drawn are that thedifferent sobcols in which handidapped migrant students enroll are
the' students' IEPs: lEPsed migrants tnan for
rcent of the handicappedn one of the scboo.s in which
when multiple IEPs aresent in' assessment results and
dixes include a description of theview guide. (CL)
. r
DOCUREXT RESUME
EC 132 478
Pyeohar John N.; And Others .
/ A Study of the Implementation of P.L. 94-142 forHandicapped Migrank Children. Final Report.Research Triamle Inst., Durham, P.C..Center forEducatiohal Research and Evaluation.Office of Special Education (ED), Wadhingten, D.Z..RTI/1544/-27-POct 80 .
.300-77-052953p/: Fdr related documeints,'see EC 132.472-417.
MF01/PC03 Plus Postage.*ComplianCe (Legal): *Disabilities: ElemeitarySecondazy Eddcatiynr *Individuallzed EducationPrograms: *Migrant Chi/Uren: National SuVeis;Student Charateristics: Student Evaluatron
;
not coAsistentAn idontifying and pAparinare dereloped'less frequently for handicanonmigiants: and although only a' smallstudents halt, IEPs developed at more)they pnroillauring an 18 wont pertprepared,'they-reflect generel agzservice contini.ty. Detailed appsurvey plan atelephOnein
*.
,f
4
***4************it******************************************************* Reproductions supplied by EDRS are the best that can* from the original document. . . 0 * 9**********************************************************************
4
j/DDPARTMENT OP HammEDUCATION &WELFAREN4ioNAL INSTITUTEOP
EDUCATION
THIS DOCUMENT HAS BEEN REPRO.OWED EXACTLY AS RECEIVED PRO*TAE PERSON OR ORGANIZATION ORIGIN-ATING iT POINTS OP vIEIN OR OPINIONSSTATED 00 NOT NECESSARILY REPRE-SENT oFFICum. Halo NM. INSTITUTE OPEDUCATION POSITIO OR POLICY
w .
4
I
I.
110
lkCenter for Educational Research and Evaluation
RT1 Project No. RTI/1544/-27 F
#
1
FINAL REPORT
October 1980
1
A. STUDY OF THE IMPLEMENTATION OF P.L. 04-142FOR HANDICAPPED-MIGRANT CHILDREN,
4
9by
John N. Pyecha, Project DirictorJune PalmourLucia Ward
o
ID Prepared for
.s, Office of Special Education .
-.
U.S.- Department of EducationC' e
k.1
;.
under
yr) Contract Ho, 300:77-0529
) 0
. . 4 .. .e ,,. .
REVEAR.CH TRAANGLE PA-RK, NORTH-CAROLI'NA 27709
2 'u .... . .
4.
r.
,1
.t
I
ve.
RESEARCH TRIANGLE INSTITUTE'CENTER FOR EDUCATIONAL RESEARCH AN EVALUATIONRESEARCH TRIANGLE PARK, NORTH CAROLINA 27709
RTI'ProjeCt No. RTI/1544/-27
IFINAL REPORT
4
A STUDY OF THE IMPLEMENTATION OF PL. 94-142FOR HANDICAMP MIGRANT CHILDREN
.
by
'John N. Pyecha', Prbject DirectorStine Palmour
Lucia Ward
I.
, Prepared for
. L
Office of Special Education
. / Department ofEducation
/ .... underCintract No. 300-77-0527
1.1
The res rch reported herein was performed pursuant.to'a contract withthe Office of Education (mu\ the Office of Special EducatiolOwithin theDepartmen of Education), U.S. Departmentof Health, Education, and Welfare.Gontrac ,rs Uniertaking, such projeCts ,under go =mot sponsorship are,.
eneefir ged to express freely their professional judgm nt in the conduct oftheProj Points of view and opinions stated do not therefore, necessarilyt esepte41icial q.s. DeparOent of Education pos ion or policy.. t
-.
r
ar.
4.
:
. .
The authors in preparing this report, wish to exiiess their special
appreciation for the cooperatiOn'aid contributions of a number of people, both
ler.° 4
V
Preface and Acknowledgements
within and,outkide the Research Triangle InstituteARTI)%
Valuable professional guidancevas provided by Drs. Linda Morra and Nancy
Safer, Office of Special' Education: Dr. Morra served as the OSE Project '
Officer during the design, and data collection phases of the study; Dr. Safer
served as the Project Officer-during the report preparation phase.
Dr. Douglas Dr and ditected the sample selection activities. -
Mrl. Betty Setzer conducted the 'telehine interviews.
Mr. Thomas Pattillo assisted in data analysis.
Mi. Jay Jaffe assisted in designing the telephone interview guides.
Mrs. Linda, Shaver was responsible for,ihe report typing and reproduction.
Dr, Roniid,Wiegerink (University of North. Carolina at Chapel Hill) re-.
viewed the report.
r
X'4
1
0.
J"4.
;
x
o
% t
o . '; %.,
- I -,
.4
4 1
4
.
3
4.*.
fvb
,
.01
TABLE OF CONTENTS .
Chapter 1: Introduction 1
I. GENERAL INTRODUCTION- i
II. STATEMENT OF PROBLEM 1
III. PURPOSE OF THE TELEPHONE SURVEY 2
IV. ORGANIZATION OF REMAINDER Or REPORT, t 4
Chapter 9T. Findings 5
I. DESCRIPTION OF STUDENT SAMPLE 5
tA. e.
. Grade Level and-School Type . . .:
t
5. t
B. Migrant Category and School Type . 6, .
C. Migrant Category band School District Enrollments 7
D. .HigraneCategory and School Enrollments 8
E. School Type and School Enrollmenis ., . 8
II. ASSESSMENT OF STUDENTS 8
III. DEVELOPHENT OF IEPs .)
10
IV. TRANSMISSION'AND UTILIZATION OF IEP:RELATED INFORMATION 11
V. CONTINUITY REFLECTED NI IEPs 12
Chaptev3: Conclusions and RecOmmepdations 20
Appendix A: Charact ristics Ale Migrant Student Population
Appendix B: ;Ascription of the Plan .6.
Appendix C: Telephone Interview ide
Appendix D: Confidentiality of Dap
O.
1:Age
(
....
. .... .
.Chapter 1.
et
4The UiS. Department of Education (ED)/ through the Bureau of Education
,AA for the Handicapped (now.the Office` of Special OicatiolOvicentradidd with the
Research Triangle Institute, under ED Contract No. 300-77-0529, to design and
conduct a sumo, 'of the contents and properties of the Individualized Educa-
tion Programs (IEPs) that are mandated by the Education for All Handicapped
'Cleedren'AcOP.L. 94-142) ..
although-the national* survey of IEPs proVfded'information'about the
implementation of the.IEP mandate'of P.L. 94 -142 for a few selected sdbpopu-
children attending schools in rural areas), a lack of relevant
design informatioq pre'Cluded the inclUaionlpf an adequate sample bf migrant
cnildrenOho' are'enrolled,in public schools--a subpopulation for which the
devIlopment of IEPs could be dspecially problematic. However,in another.. .
study it is conducting for ED, the Research Triangle Institute (RTI) idea -
tified,(a).a slumber of -special schools that serve handicapped migrant students
and (b) sample of 146 migrant students who were reported by school4staff to
be THR (trainable mebtally,retarded),or functionally disabled. '(This other.0 . .
study, a national stiptz.of the ESEA Title 7 Migrant program, is being con-
ducted for the Offices'sef Program Evaluation, ED.) With this information, it,
was practUil to deiiin. and conduct a telephone survey of the schools attended
Introduction
GENERAL INTRODUCTION
.16
by a small sample -e handicapped migrant children 'to 'explore the extent to, .
. .
whic4the IEP.man4ate'of.P.L. 94-142 is being implemented for handicapped
migraI qt:children. -Acgotdingly., BEH modified Contract Number 300-7770529 to,.- .
..
include.the designana .conduct of such a telephone survey.. . -..s
.
I
s II. STATEMENT OF PROBLEM 4.
Migrant workers end:til;iir families travel throughout the United States,
-seeking seasonal employment on .farms, filh canneries, etc. These movement
patterns take the mkgranttiaildran An and out of several school districts each
'eat, both'within'aild criss state ,boundaries. A major incentive for school, - . ".' s
s
s-i V
4... " .
A
4 .t
...
.personnel to identify handicapped migrant children and complete the time-
consuming process of developing IEPs is to include them in-their "counts" for
purposes bf receiving federal funding under P.L. 94-142. However; funding
'counts provide little incentive for personnel in those schools in which aot
student' enrolls after the December count.tdate, or in those situations where
the student is enrolldt prior to December but expected to migrate before the
count date. (Most miiration occurs during the months of March through Novell-.
ber as families follow the planting and harvesting cycles.) Even if schools
a9 initiate the referral /screening /IEP development proces's4 many of the
Migrant children included in the process will have migrated out of the district- 6
or state before an IEP has been completed. ;
The assessment andlEP process for migrant chilftenis complicated flirthqr
by two other factors. First, these children tend to migrate into rufal,areas,
thus inireasing the likelihood of their enrollment small rural school
districts that have limited Tacilities or resources for serving the handicapped.
Second, a large number the migrant children come from homes in which the
Spanish language is dominant (RTI's best estimate at this time is that ap-
proximately two-thirds of the migrant children >i* in this category), and very
few of the standardized cognitive/achievement instruments used in assessments
have included representative samples of cultures other than whites, Anglo-
Saxaa, and occasionally Black American, in their normative sampleIof the
population.' .. .;
. -..Given these considerations and the low priority that migrant. children . .
historically have been give relati4 to the provision of educational services,,
it is hypothesized that the majority of handicapped migrant children will not.%
be served in accordance with the currgpt mandates of the Act. The telephone.. .,.::::
. .
'survey was designed to shed light on the extent of this presh$ed'defidit."-, is.:...-_ . . ---. ... :'; ...;''
. '-.: "..'. ...
III. PURPOSE OF THE TELEPHONE.
SURVEY : . :","
:
. :
.., ?" ""4,
_,.. %The' primary purpose of the telephone survey was to determine t**tent.'"....,,.... .. .
tp which a sample of handicapped migrant' children, who were ideatif*ia'as4
being handicapped .in .January or February 1978, were similarlidentiii.11 in,. 4.
.
1 Appendix A provides a description of the characteritOti af.'40igrantchildrenAvthese*characteristics relate.to"the implementation,6f-te.L.,94 -142.
4. 4
- 2C e0C.
. .
and had ,IEPs prepared by, each of the schoo0 in which they,were,enrolled
during the period from January 1978 through June 19791 Asta secondary pur-
pose, the /EPs.sollected for the migrant children were to be analyzed.to
determine the extent to which the 1E4 prepared'foT the same children, but by
different schools, reflect common assessments of student needs and continuity
in the provision of services.
More specificilly, the telephone survey conducted between March and May
of 1980 was designed to answer four basic questions:
a) TO wbat.extent are migrant students, who-have been identified as
being handicapped in at least one school, similarly identified in
the other schools in which they were enrolled during the 18-month
period from January 1, 1978, thkough June 1979? .
"b) To what extent are IEPs developed for the migrant students who have
been fdeatified as being handicapped?
c) To what extant, and with what degree of utility, are migrant stu-
dents' IEPs transmitted. between themlifferent schools'in which they
enroll?
d) . To what extent do the IEPs prepared for he same migrant student;
but by different Schools, reflect common assessments of student
needs and continuity in the provision of seyices?
An'answer to the first question should provide insight into the consis-
tency with. which migrant children are identified as being handicapped by the
various schopls they attend.
-. An answer to the second question should, give some indication of the
degree to which the IEP requirement of P.L. 94-142 is met for handicapped
migrant students as they move from ..schOol to school.
An answer to the third queston should provide an indication of the
utility of, and continuity reflected in, IEPs that are transmitted between
schools..
An answer do the ferth question should provide insights as'to whether or
not IEPs for the same student tend to be consistent with regard to assessment
(
of, and planning for, the student's speciarneeds. Inconsiltenty between I.
schools in planning and providing special 4aucation programs and relatedt
services for handicapped children would tend'to constr4On the effectiveness of \1
such programs and services.
4
6
4
I
.00
.
IV. ORGANIZATION OF REMAINDER OF i-OORT
The survey findings are presented in Chapter 2. The conclusions and
recommendations derived from the survey finding's are presented in Chapter 3.
A description of the survey methodology is presented as AppendixB.
Additional supplementary 4nformation and materials are appended as
follows:
Appendix A: Characteristics of theMigrant Student Population.
Appendix C: Telephone Interview Guide,
Appendix 0: on'fidentiality-of-Data Statement.'
A
r 4.
.- 4 -
1
Chapter.2
Findings.
Survey findings: are presented and4discussed in five 'sections ,below.
Section I provides a'description of. the realized sample of 153 students.
Section II contains "findings about the extent to which sample students were4
identified across schbol enrollmenti as being in need of special education and
related services. Section III contains results about the extent_to which IEPs
were developed for students as they moved between schools and school districts.
Section I .contains findings about the'extent that IEPs and IEP-related inforT
motion e.transmitted between, and utilized by'staff of, the various schools
in which students were enrolled. Section V focuses on the degree to which the
IEPs prepared for,the same students, but by different schools, refledt common
assessments of needs and continuity in the provision of services. For reader
convenience, all referenced tables have been placed ai the edd of the"Chapter.
A
I. DESCRIPTION OF STUDENT SAMPLE
The distribution of the 153. students in the realized sample are described
in this sectionby: school type and gradi level; school type and migrant
category; migrant category and number of school district enrollments; migrant
category'and number of school enrollments; and school type and number of
school enrollments.
A. Grade Level and School Type
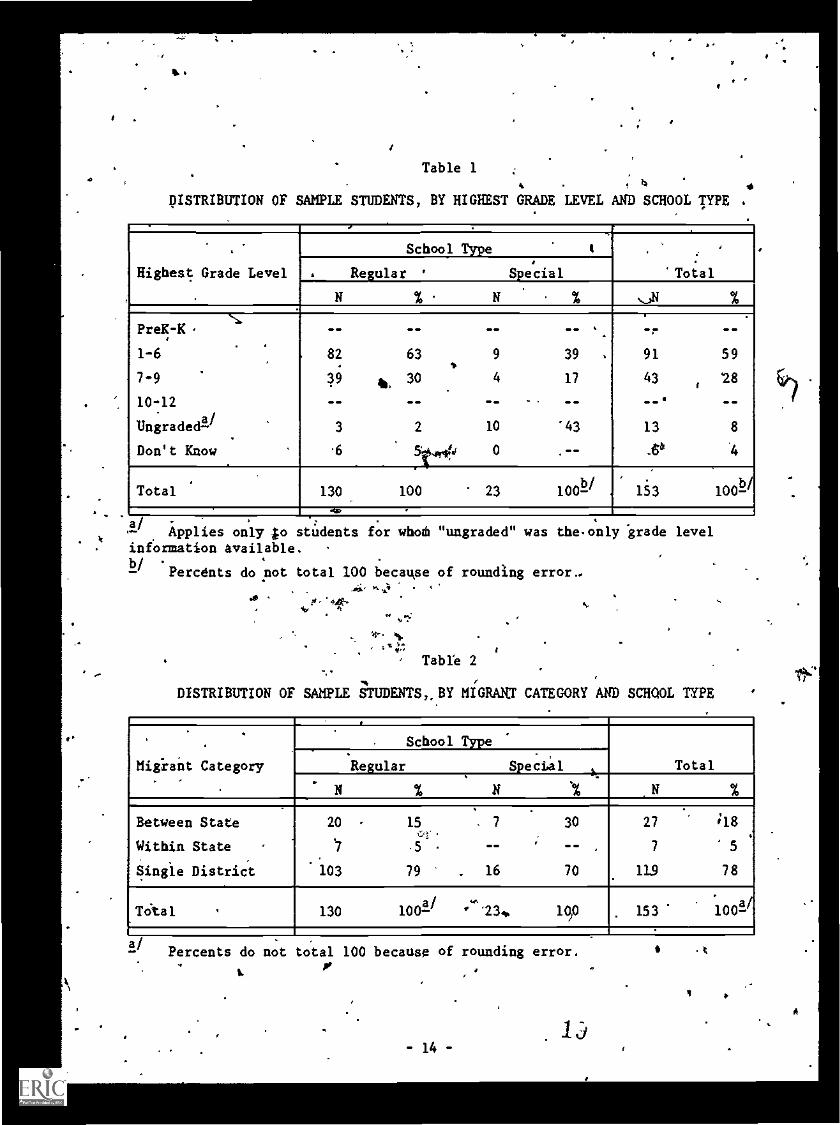
Table 1 shows the distribution of sample students Eby grade level and...
school type (i.e., whether the student was in the Regular School Component or
in. the Special School Component). Since most of the students changed grade
levels durihg the 18-month period covered in the survey, students were clas-
sified in this table by the highest grade level noted airing this period;
a\tudent who was enrolled in the second grade in January 1975 and in
the third, grade in Novembere1979 would be tabulated as a third grader. As
shown in Table 1, the majority of students(87 percent) were in grades 1-9;
there were no students in the PeK-K or grade 1O-12 range (it es-possible that
some of the students =in the "ungraded" or "don't know" category could have
4
- 5
IC
My
been' in these grade levels or in a.comparable two-age fevel).. Since regular,
'school students were sampled only in grades 2,.4, and 6 (as of 1 January 1978)
for the national evaluation of the ESEA Title I Mirant Program, the sample
could not have included studentsAn. the 10 to12,grade ranges.
B. 'Migrant Category and Scho61 Type. , . t
Table 2 gives.the distribution oE.sample students by migrant category andr ..
,l
school type. Students in.the regular ichbol sample are defined as regular .. .
school students, and students in the special school sample are defined as. -
special school students.' The migrant' categories. axe defined,as follows:
1) Single District: includes students for,whom there was no evidence
of enrollkent in more than one school district during the 18-month-.
period on which the study was focused. .
2 Within State:- includes students for whom evidence was available of '
enrollment in more than one district withih a single-state, but with
.no evidenci of enrollment outside the state.
3) Between State: includes students with qvidence of enrollment in
school districts in more than one state.
As shown in Table 2; 119 (or 78-percent) of the 153 sample students were '
enrolled ih schools ,located in only one district. The fact that about'7S
'percent of the students, did not have-school enrollments in more than one
district does not necessarily imply that these suidents do not migrate. For
examplOsome students leave school early in the. spring to travel with their,-
parents and return to the same district late in the,following fall, without an
intervening school enrollment--findings from the previously referenced national
impact study of the ESEA Title I Program (see page 1) indicate that about 40
percent of the students in this category are enrolled in district schools for
less than a full academic year. Of the 34 (or 23 peicent) students who did
attend schools in more than one district, 27 (or 79 percent) migrated between
states. Thirty percent of the specialschool students attended schools in
more than, one district, as compared to aboitt 20 percent of the regular school
sample. stp., .
These findings were surprising on two counts. First, it was anticipated
that only about SO percent of the migrants served each year by the ESEA Title /,
Migrant Program would be enrolled in a single-school dittrict during thtime
frame of the study ("settled out" migrants are eligible, for assistance for a
Ii
1M,
4.
period of five years after their last migration betweenschool districts).
Although the telephone -survey sample is not, large enough Gv support national
estimates with any reasonable 'degree coif-precision, this surprising result is. .
supported by the findings-of the previously referenced national impact study
of ,the ESA TitleoX'Higrant Program ,(see page 1). -Findings for this national
study ind;Eate that only about 25 percent of the migrant students were en-
rolled in schools in more than one school district during the r2-month period
from 1 january 1978 to l,January 1979.
Secolid, it was ant ;cipated that migrwitto.students enrolled in special
schools woad be more severely handicapped, and, therefore, migrate less often
then studens enrolledein regular schools.
The .practical implication of these findings s that 01 size of the
sample of prlmary interestfor this study (i.e., those students who migrate
between districts), is reduced to-34; a factor that severely limits the inter-,
pretition of findings. However, the critical units of analysis for this study
'ale the numbers of different. schools and school districts in which the mobile
students were enrolled; and, as'noted in subsequent subsections of this sub-
section, these numbers are substantially larger thin'34.
C. ariligradt Category and School District Enrollments
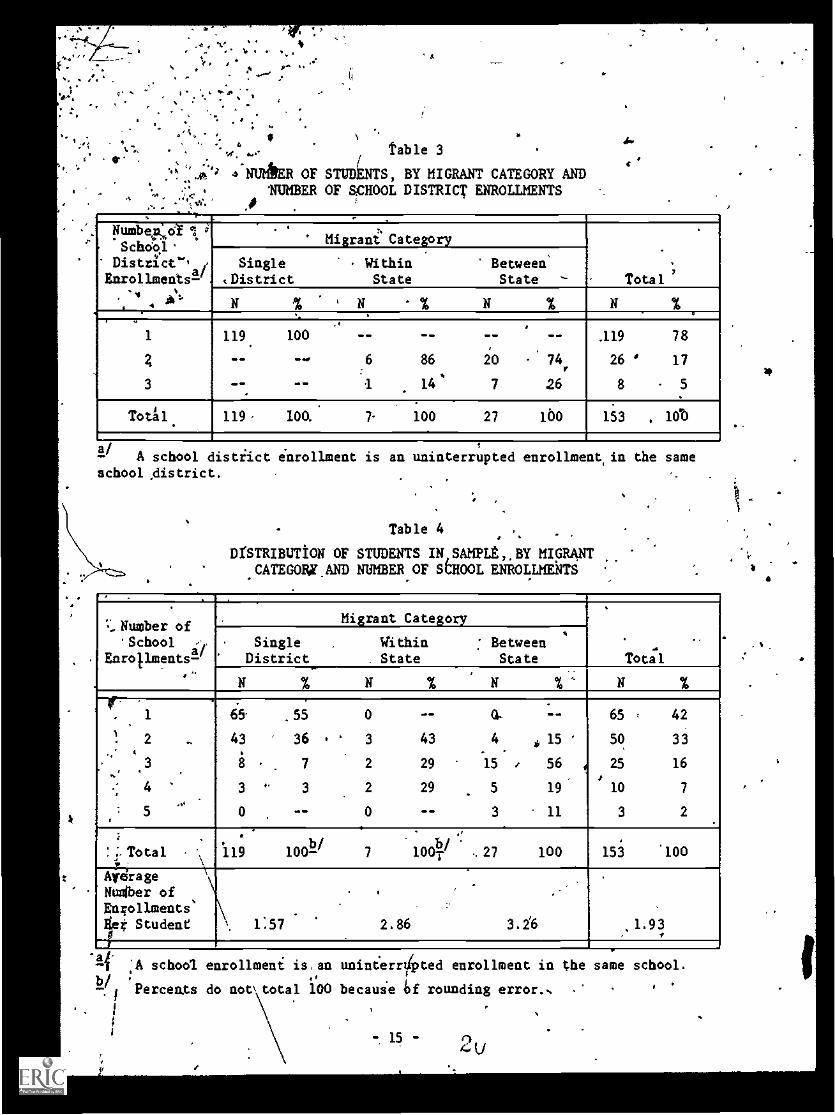
Table3 givet the distribution of sample students by migrantcategory and
number of identified school-district enrollments. A\schOol-dittrict enrollment
is defined as a period of continuous enrollment in aedistrict. The continuity
of an enrollment in,a district was broken by evidence of,enrollment in another
district, bdt not by a break in enrollment for which there was no evidence of,
enrollment in another district. For example, a student who had an identified-.
enrollmentin District A'from Janilary 1978 through Jude 1978 and from December
1978 through June 1979, but who ifad no.district enrollment(a) it 'tilled for.11
the July 1978 through November 1978 period, would have been c as being
enrolledin'a single district.. If, in this example, it hale fetermined
that the student had been enrolled in school district II dring September
through October 1978, the student would have been tOudted as having been.
. .
enrolled in threedifferent school districts (schoel district A, school die-
trict II, and again in school district A),'":e0ep though only two "different"
school: districts were.involVed..
tot
'J. 1
As dhows. in Table 3, none of the students was enrolled in more than three.
,
,.1.. districti. Note that a toter of 76'school district enrollments' ((2 x26) +
. . . .
(3 x 8) = 761 were identified for students in the two "mobile" migrant cate-en orN,
.gories.; i.e.,,the..7 students in the within-state _category had.a total of 15
.: district enrollments and the 27 students in the between-state categbry had ,a
toiaroof 61:..
)
.
,w a
Migrant Category anci.echool Enrollments
.
t The, distribution of. school enrollments for sample students iTAsented
n Table 4 by migrant Fategory.1 As noted in Table 4, the maximum numberof
school enrollments for a single student was five wi1Ii an average 'of 1.93 for
'all students. Between-state migrants had an averageof.3.26 school enrolf-
meats, as-compared to.86 and 1.57 for the within-state and single-district
students, .respectively. The. total'numben.of school enrollmdhts for the 153
sample student* was 295: This total was distributed over each of the three
mlgrant.categorien as follows: 88 for the.between-state group; 20 for the
witain-state, group; and 187 for the single-distriCt group.. .
.
`'
School Type and School Enrollments
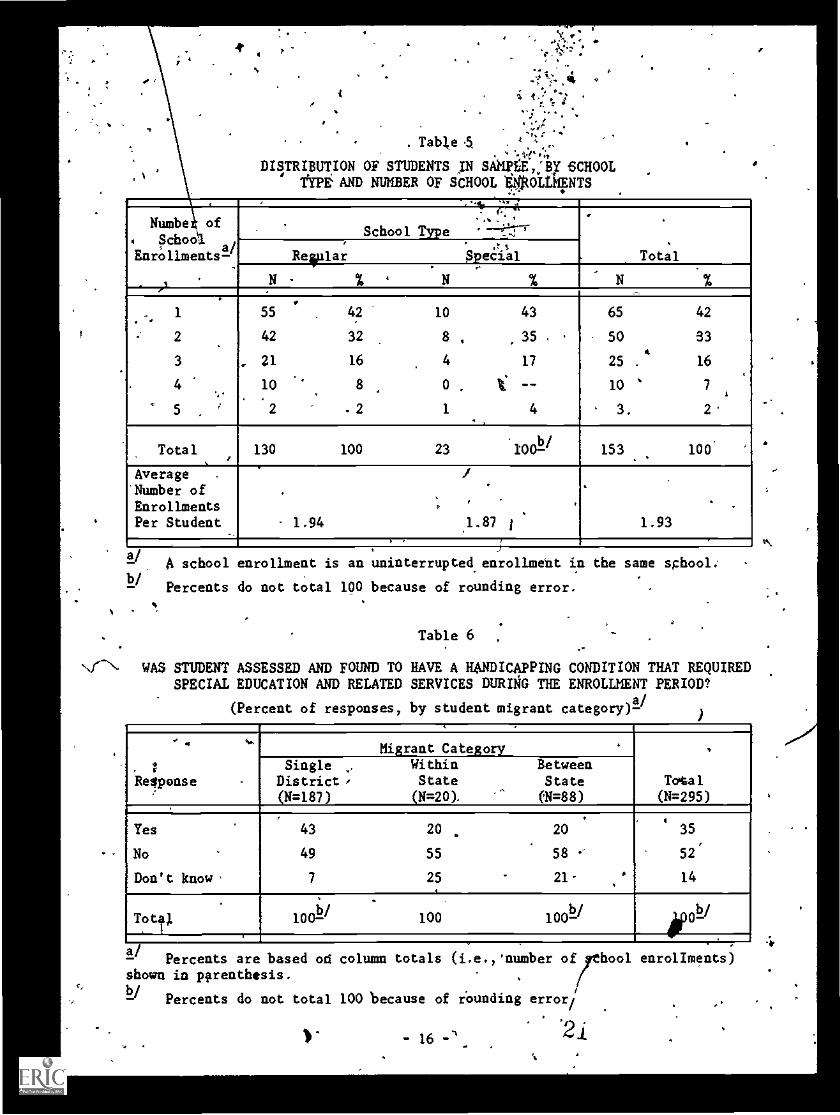
As shown in Table 5,there is little difference in the average number of
school enrollments identified for students in the Regular and Special School
Components.'
II. ASSESSMENT OF STUDENTS
1:7.
This section .presents findings about .the extent to which the sample of
migrant students were assessed and:determined to require special education and
related services in each of the schools in whilh they-were ,enrolled during the
18-month referenctperiod foeI
the study. .
Table 6 shcOWs the responses received to the following question about each
student's schbor enrollmInt: Was the student assessed and found to have a
..handicapping conditioq that required sptcial education and related services?': .
.As noted in this table, a negative responseto this question was received from. ,
just over one-half of the 295 schools in which the 153 sample students had4A school enrollment is defined as a period of continuous eni011ment in
the same school,A
,
r
/ *% .1
.4
been enrolled. As show n in Table 6, negative response's were received/ more
frequently for. students in the between: and.witkin-state migrant. categories
than for students in the s ingle-district category: Betause the percents of
"donut inde responsesoieceived to questions.about assessments,of,widin- and
between -state migrints were greater than_ those received for students in. the.1,
single district category, the number of "no" or "yes" responses for these two
groups of students could be increased significantly,
For those school enrollments inwhich sample students were not assessed
and determined to be in need of special education and related services, school
personnel were asked if student/school records indicated such a designation in
'a prior enrollment. Ass shown in Table'7, 61 percent Of the 153 enrollments
for which an assessment had not been conducted had suck. information from a
prior enrollment. Prior assessment information was less frequently available
for the- within:. and between-state categories than for the single-district
category. .
Oireralf, students in thgtsample had been identified as beingin need of
special education and related services in 80 percent of their 295 school
enrollments, either as a result of an assessment conducted during the current
enrolIkedt or through an indication in student records thii the student had,
been so identified in a prior enrollment. Therels little difference in this
finding for the within- and between-state students (65 and 69 percent, respec-
tively); however, the %ingle- distri %t students were so identified in a larger
percentage (i.e., 86 ptrcent) of their school enrollments:
Since each student 'in the total sample was identified in at least one
school enrollment as'iiiing handica0ed bvirture o( the sample selection
criteria, these results suggest tat schools generally were inconsistent in
identifying migrant children who were in need of special education and related
,services., For those student& in the within -state and between-state categories4
it i& possible that some of this 'inconsistency resulted from variations
between school districts and states in the way various handicapping Conditions
are defined, or in the cxiteria.used to determine the need for special educa-,
students in thii study
likely to be identified
conditions,
tion services. Finally, it should be' noted that the
were THRs and/or functionally disabled, and were more41
as handi6apped than childrenAth milder handicapping
- 9
14
ILW
7
III. DEVELOPMENT OFPIIEPs
I
t4..44
. fp ,
This section presents findings about the extent to which IEPs were level -''
oped for students in the sample.
As shown in Table 8, at least 72 percent of the 153 students in the
sample, had (and ,at least 14 percent did not have) one or morelElis developede
% ,
for them during the 18=month time frame for the'survey. For 14,per,sent..of th
sample students; RTI was not able to determine whether or not at lg IEP
had been developed. As would be expected, the largest percent of "40m1t know"
responses occurred with the migrant students who attended schools in more than
one disttict.2 (These' findings compile unfavorably to the findings of the. r.
National Survey, of IEPs in that about 95 percent of the target population for.
that study had IEPs.) The findings for the within- and between-state students
suggest that fewer students in these categories had at least one IEP; however,
these results should be interpreted with caution because of the large percent
of "don't know".responsei for each category.
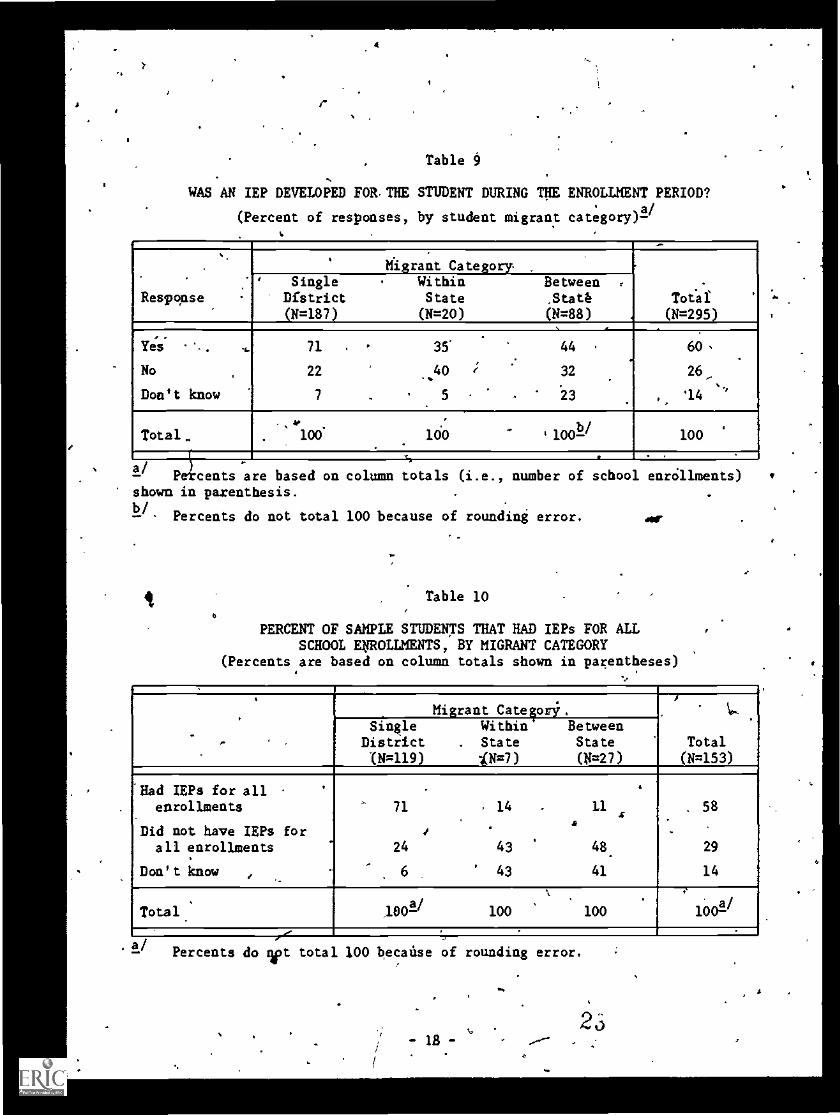
Interviewees reported that IEPs had beln developed for at least 60 percent
of the 295 school enroltmonts recorded for the 153 sample students during the
applicable 18-mone time,frame.(see Table 9).3 These findings varied by
migrant category; i.e., IEPs were reported to have been developed for a larger
percent of the school enrollments of single-district migrants (71 percent)
than for enrollments of students in the between-state (44percent) and within-.
state (35 percent) categories. Also, as noted' in Tablei90ft ,"don't know"
response was obtained for a larger percent of the enrollments of between7state
students than for:students in the other two groups.
The findings presented in Table 10 show that at least 58 percent of the
sample students had an IEP developed for each of their school enroll:lents over
the 18-month period covered by the survey. As expected, a smaller percent of
the children who attended schools in more than one district had IEPs for all
2 A "don't know" response means that noneofthe schools in which the.student had been enrolled had any knowledge that an IEP either had been or hadnot been developed (school staff were often requested to provide informationabout students who had previously been enrolled in their school but who werenot curren4ynrolled).
3 Only 135 of the 178 IEPs reported to have been developed were received byA RTI in response to a request that each student's IEP bh sent to RTI with
personally identifiable information removed.
0
A
, .- .
of their.schoOl enrollments, when compared to students in the within- and\ . 4. .
betWeen-state categories. There'is little"orno difference in these findings.
biz the two "mobile" categories (i.e., the within-state and the between-stateN
migrants), However, these differences must be interprad with caution be-, . ,- . - ...,
cause of thrIirge percent of "don't know" responses. ':,...- .: .
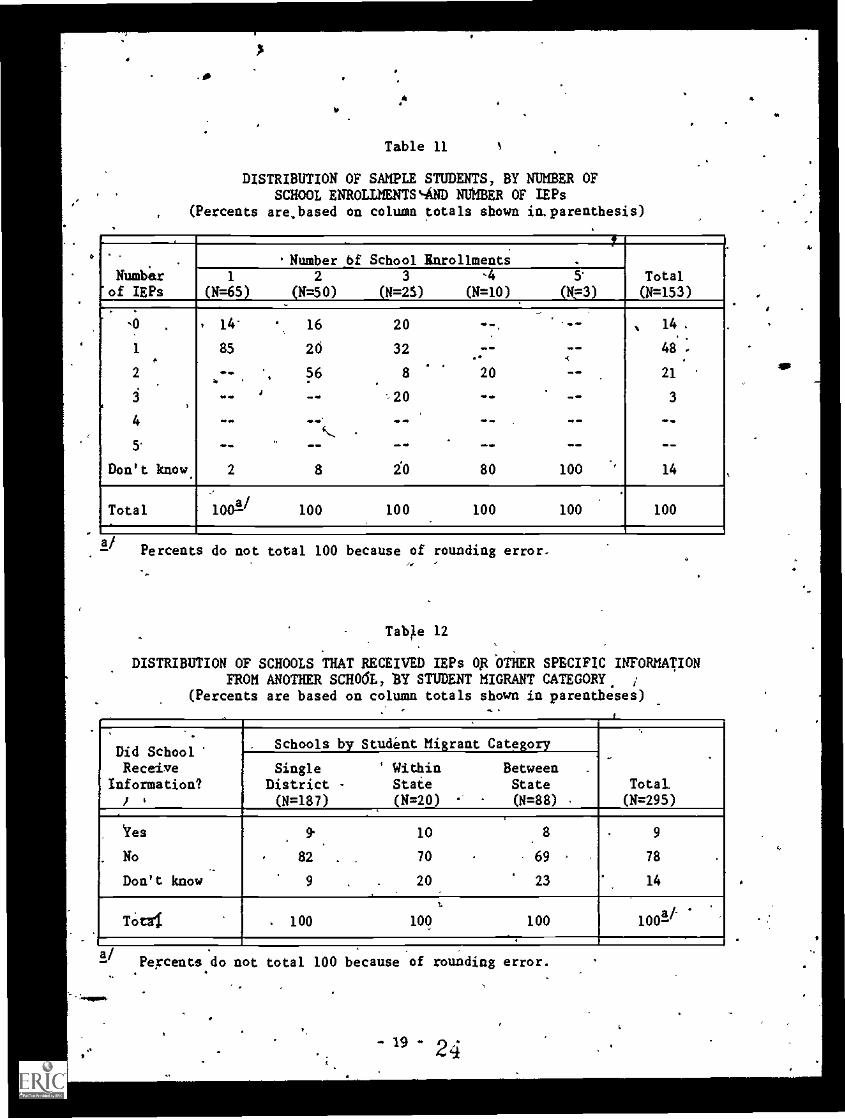
? Table ,11 presents.thejistribution of sample students cross-classifie 'by4 4 , e. , ,. /
their number of,scliool. enrollments and the. number of IEPs 5Oat were deve ped.
'.As powil in this table':85 percent of the Studentswbo.0ere enrolled i only.
one school during the'lgImonth reference period of the study had an I devel-
oped for that enrollment'onri 56 percent of those enrolled in two /different\
schools had -811, YEP develdped.ineachschool;.only 20 percent of hose with
three school enrollments hia-ah ap d'velpied for each enrollmen and none of,
'the-students:with four or five enrollments had IEPs developed for.each enroll-
ment. The "don't know".classificatytn-,includes thosechild en for whom at
,
least, one school was not able to 004i-either a definite.fly s" or a definite. i .
. . .
"no" to, the- question Ss-to whether or not ,t IEP developed for the student.
.'"
,during tfie period of enrollment at that school; therefore,'the exact 'limber of.
1- IEPs prepared for these students is not known. ."---4.
.
As was expected, there was a stropgrerationshipi, between the development, iv
of an IEP for a student at_s parthillar school and the availability at that.,t
school oftinformation:indicating that the student had been identified in' an.r .
earli,et.enrollment as being in.need of '' special education and related services.
1
It'we 'stated previously in Section II that student/school records for 80
percet of theschoor enrollbents for sample students contained information. .
4vindicating that the student had been assessed and determined to have.eneed
for special education and.related services. An IEP was developed for 178 (or,.
89 percent) ofthis set of'199 "school enrollments: \Corresponding percents' and_.
sample sizes number of schoolw 'enrorlments) for e three'migrant categories
ere 89 percent 0 = 149) for single-district mi ants; 88 percent (N = 8)
for within-state migrants; and 93 percent ,(44= 42 for.between-state migrants.i.,
1.
IV. TRANSMIiiI6N AND UTILIZATI/ON OF IEP-RELATED INFORMATION
//
Interviewees wert asked if there faai :any indication in school/student
records that the school had received. om another school or institution an LEPt.
or other spedfic information about-t e.sample student's handicapping condition.
,6
'1, a ,
.
I.
,
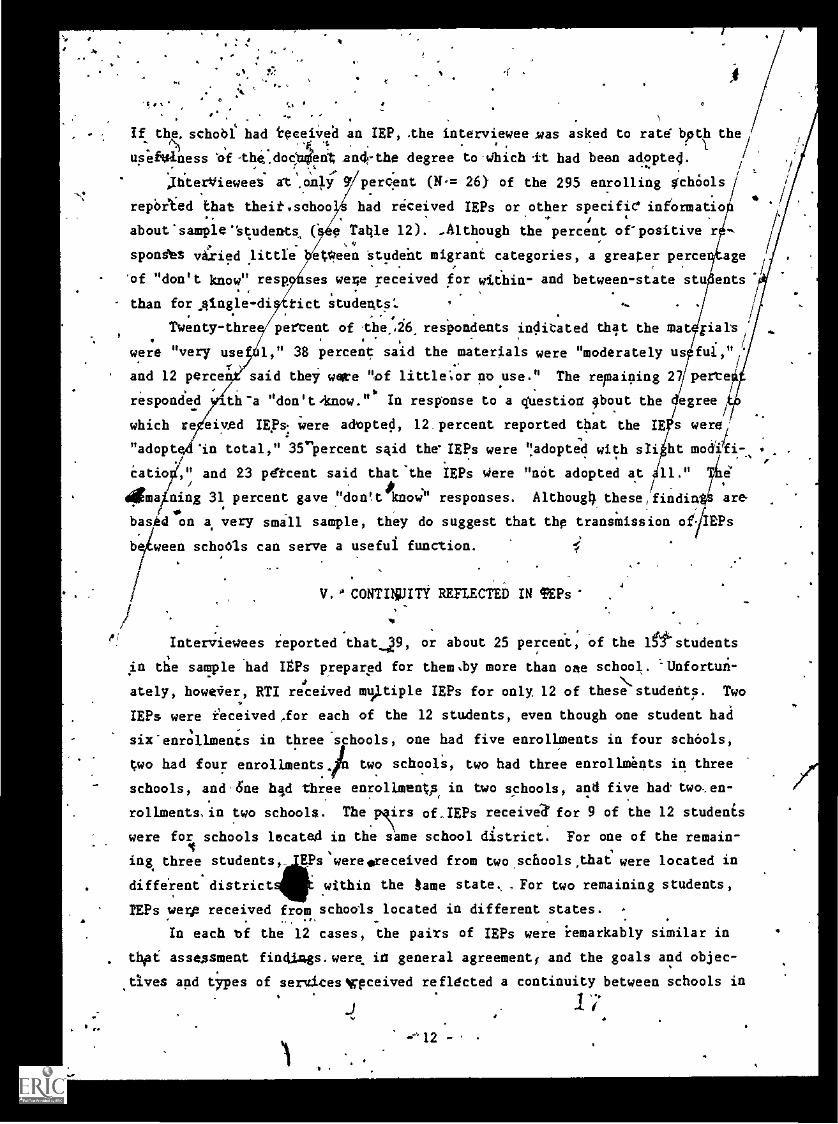
If the.schobf had irpeeived an IEP, .the interviewee mas asked to ratd both the
usefulness of -tha:doOlien and-the degree to 'Which It had been adepte4.
percent (N.= 26) of the 295 enrolling schOols
repbAed that theit.sehoo had received IEPs or other specific informatio
about-sample 'ttudents. (= 9 Tattle 12). ,Although the percent of" positive r
spondeS varied little etWeen ttudeht migrant categories, a greater perce. -
of "don't know" resp ses were received for within- and between-state stu. . -
- than for .single-di Pict students'.
percent of the,26, respondents indicated that the mat. ,
1," 38 percent said the materials were "moderately us
said they wmte "of littletor an use." The repairing 27
:fliterVieweet st.on/y 7
Twenty -thre
were "very use
and 12 perce
responded
which re
"adopt
Catio ,
4ma ning 31 percent gave "donItAtnow responses. Althoug4 theseifindin
a very small sample, they do suggest that thp transmission of- EPs
age
eats
/
.
./
Eialt
fui,"/
perte
egree
s were
ht
11." Trie
th-a "don'tdknow." In response to a qUestioh about the
eiv .ed ms: were adopted, 12.percent reported tha t the IE
in total," 35 percent said the' IEPs were ';adopted with s/i
and 23 pdlcent said that'the IEPs Were "not adopted at
based on
beiween
/I
are
schools can serve a useful function.
V. " CONTINUITY REFLECTED IN TEPs
Interviewees reported that...29, or about 25 percent, of the 10- students
An the sample had IEPs prepared for
ately, howe4er, RTI received mXtipl
IEPs were ieceived,for each of the
them .by more than one school. -Unfortun-
e IEPs for only, 12 of theseN,.
students. Two
12 students, even though one student had
six'enr011menis in threeschools, one had five enrollments in four schools,
two had four enrollments two schooli, two had three enrollments in three
schools, and.45ne had three enrollments, in two schools, and five had two,en-
rollments,in two schools. The pli\xs of.IEPs receive for 9 of the 12 students
were for schools located in the same school district. For one of the remain-
ing three students EPs'were.received from two,schools,that were located in
diffirentdistrict within the tame state, .For two remaining students,
ZEPs were received from schools located in different states.
In each bf the 12 cases, the paiTs of IEPs were remarkably similar in
Opt: assessment findings.were in general agreement, and the goals and objec-
.tIves and types of servicesmr9ceived refldcted a continuity between schools in
.4
;
I
thdprovision of special education and related servides., IEPs developed by.
schools within the same school district were slightly more similar and repre-
sented gore ''between - school cont* uity" than IEPs developed by.schools.locate0
4 t.
ygO.:
.t
in dirfirent districts. The one notable diffeience in the two IEPs available. .'
. .for each student was that the most recent IEP tended towed more detail,in the
.
listing of goals .and objectives. and in the specification of instructional'' . %.
,. ./.
. . strategies. , sk , ..
.,
4 ft
The cOntindity betweenAEPs.prepared.for seven of the twelve migrant.
:.4
:.
,- , .studentsprobably is aiefiection bt thvransiaittal of IEPs or other specifiic
infoimaadn' about the student's handicapping condition between WIOOI staffs. -
TIviis, for four'of thesestudents, interviewees indicated tha4 an IEP wi)s
.1.received-from another school and adopted in total; for one student'," the inter-
viewee indicated that an rip was received from another school And was adopted
wits slight modification; and for two students, idterviewees indicated that an
, IEP Was reAceived from another school but was not adopted at all or it was
tinknotiu whither the IEP was adopted. However, for the reqaining five students,
intervigwees.specified that.
no,IEP was, received from another,school.J
4
0
A.
V
Table 1. 4
DISTRIBUTION OF SAMPLE STUDENTS, BY HIGHEST GRADE LEVEL AND SCHOOL TYPE
- . . .
Highest Grade Level
,
School Type 4
'Total
,
. Regular ' Special
N % N . % .'N %.
'....
PreK-K
1 -6
7-9
10-12
Ungraded-a/
Don't Know :
.
.
--
. 82
39
3
.6
--
63
41, 30
2
5
$
--
9
4
--
10
0
39
17
'43
.
91
43
- -'
13
.t
1
.
--
59
28
8
4
Total 130 100 23 10014 153 100-
aApplies only ;o students for who&
information available.b/
Percents do not total 100 because
.
"ungraded" was theonly grade level
of rounding error..4
.=;
' Table 2
s.
DISTRIBUTION OF SAMPLE gTUDENTS BY MIGRAKT CATEGORY AND SCHOOL TYPE
.
.
Migrant Category.
School Type
TotalRegular Special 1.
.
N % N .N %
Between State
Within State
Single DistrictL
20
'7
103
15c'.
.5
f
79
.
.
.
7 30
16 70
27
7
119
;186
5
78
Total 130 1002/ ''''''23.. 190 153 100a"
aPercents do not total 100 because of rounding error.
- 14 -
.t
. Or
, ..1
t
. 0. Ii 4 4 .4 . ,it...,
. , W 6.0 table 3Iv.
..":2,'...;:'? 4NU11ER OF STUDENTS, BY MIGRANT CATEGORY AND.
.... 'NUMBER OF SCHOOL DISTRICT ENROLLMENTS
4
_ ,
Numben. :A 1 i
School.District',
aiEnrollments-
'
r.
Migrant Category.
Total.
Single,District
WithinState
Between'
State -
N % ' N % N % N %I
.
1
Z
3
119 100
-- -..,
-- --
--
6
1
--
86
14
-- --
20 74
7 26
.119
26
8
78
' 17
5
Totil 119- 100. 7 100 27 160 153 10,
/- A school distiict enrollment is an uninterrupted enrollment. in the sameschool district.
Table 4
DrSTRIBUTtON OF STUDENTS IN,SAMPLE,.BY MIGRANTCATEGOW.AND NUMBER OF SCHOOL ENROLLMENTS
.. .
'
v..Number of
'School ,.
Earollments-'...
.
Migrant Category.
TotalSingle
DistrictWithinState
: BetweenState
N
...
% N % N N %
1
1. 2 -
-
4
3
' 4,
...
4
65
43
8
3
0
.
°
.55
36
7
3
--
0
3
2
2
0
--
43
29
29
--
Q.
4
15
5
3
.-.
A 15
56
19
11
'
65
50
25,
10
3
42
33
16
7
2
. ,Total
7-.%
\-----
tL19
.
100-b/
7
. .
100T , 27 100 153 '100
AverageNuoiber of
Entollments'Student
\
\A, 1:57
4 I
2.86
.
..
3.2'6
.
.1.93
- 4
; A school enrollment is, an uninterrdited enrollment in the same school.,
Percents do not total 100 becaude 15f rounding error..
15 -U
I
11/
,
;40
St # ' I'
4, V IV.:.' 4.S4.. I.-;* i ;'.. 41,
i i 1..' .., r. 1: i1
Table. 4
DISTRIBUTION OF STUDENTS IN SAMPTI,2iY SCHOOLtYPEAND NUMBER OF SCHOOL 001.14ENTS
,
Numbe\lof4Ch04:4'
Enrollments 2-1.
)
.
School Type..... .
'--';'11-r-,
.
Total.
Reiplar.r,s
Special
N - % N % N.
.
1
2
3
. 4..-
5 . '
55
42
. 21
10
2
.
. 42
32
16
8
2
10
8
4
0
1
.
43
35 .
17
i ....
4
'
65
50
25
10
3.
.4
'
42
33
16
7
2.'
,
Total 130 100 23b/100 153
.100 '
Average .
Number ofEnrollmentsPer Student
.
1.94
/
,
1.87
-
1
.
.
1.93
.
. .,
.
el A school enrollment is an uninterrupted enrollment in the same school;
Percents do not total 100 because of rounding error.b/.
Table 6
J"."-N, WAS STUDENT ASSESSED AND FOUND TO HAVE A HANDICAPPING CONDITION THAT REQUIREDSPECIAL EDUCATION AND RELATED SERVICES DURING THE ENROLLMENT PERIOD?
(Percent of responses, by student migrant category)!"A .
44
'1
t
ReSponse -
Migrant Category
Total(N=295)
Single ,
District(N=187)
WithinState
(N=20).
BetweenState(N=88)
-
Yes
No
Don't know-
,
43
49
7
20
55
25
.
20
58 --
21-
4
35
52
14
Totil
,
b/100.
100 10021- 0
ti
, t
a/Percents are based od column totals (i.e.,'number of hool enrollments)
/7tshown in pfrenthesis.
Percents do not total 100 because of rounding error/
- 16 -.1
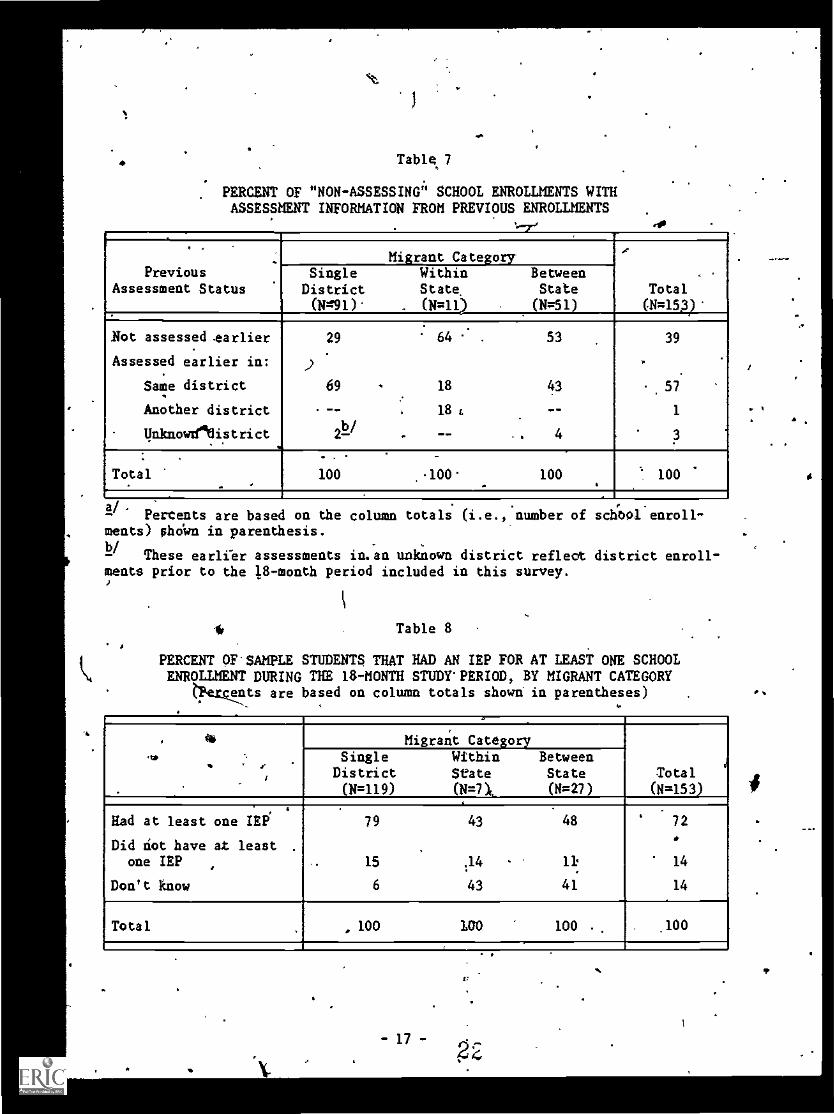
Table 7
PERCENT OF "NON- ASSESSING" SCHOOL ENROLLMENTS WITHASSESSMENT INFORMATION FROM PREVIOUS ENROLLMENTS
V.
.
PreviousAssessment Status
Migrant Category,
(N=1543)
Total
-Single
District(W-191)'
WithinState.
(N=11)
BetweenState
(N=51).
Not assessed .earlier
Assessed earlier in;
Same district
Another district
qnknowehistrict. . .
.
)
29
69
--
2b-/
.
.
64
18
18 L
--
-
..
53
43
--
4
.
39
57
1
3.
Total-
. . .
100
.
..100
_
100.
100
a/-- Percents are based on the column totals (i.e.meats) shoWn in parenthesis.b/
number of schbol enroll-
- These earlier assessments in.an unknown district reflect district enroll-ments prior to the 18-month period included in this survey.
Table 8
PERCENT OF'SAMPLE STUDENTS THAT HAD AN IEP FOR AT LEAST ONE SCHOOLENROLLMENT DURING THE 18 -MONTH STUDTPERIOD, BY MIGRANT CATEGORY
tBeccents are based on column totals shown in parentheses) .
.
rtO
.I,. ,
,
_.
- .
Migrant Category
Total(N=153)
SingleDistrict(N=119)
Within BetweenState State
(N=71. (N=27)
Had at least one IEP
Did not have at least .
one IEP
Don't know
79
15
6
43
;14
43
48
lk
41
' 72
*
14
14
Total , 100 100 100 . .100
V
- 17 -
g4-
4
fI-
Table 9
WAS AN IEP DEVELOPED FOR. THE STUDENT DURING THE ENROLLMENT PERIOD?
(Percent of responses, by student migrant category)1/
.
Response.
.
Migrant Category.
Total(N=295)
' SingleDistrict(N=187)
WithinState(N=20)
BetweenState(N=88)
e
,
Yes -'4.
No
Don't know
71 .
22
7
35".
.40 ;
5
44 .
32
23
.
60,
26_
. '14
4
Total.4
.
,*100
.
.
.100 ' 100
b/100
,
11 Pe cents are based on column totals (i.e., number of school enrollments)shown in parenthesis.b/
Percents do not total 100 because of rounding error. ar
Table 10
PERCENT OF SAMPLE STUDENTS THAT HAD IEPs FOR ALLSCHOOL ENROLLMENTS, BY MIGRANT CATEGORY
(Percents are based on column totals shown in parentheses)
.
.
.
Migrant Caterri. ....
Total
(N=153)
SingleDistrictIN=119)
Within Between4 State State
4N =7) (N=27)
'Bad !Us for allenrollments
Did not have IEPs forall enrollments
Don't know ,
'
71
24
6
.
'
. 14
43
43
&
11
48
41
44
.
58
29
14
Total.
leoei 100 100 NO/
. a/Percents do ipt total 100 because of rounding error.
- 18 -
4a.
4
.
Table 11 %
-
DISTRIBUTION OF SAMPLE STUDENTS, BY NUMBER OFSCHOOL ENROILMENTS4ND NUMBER OF IEPs
(Percents are ,,based on column totals shown imparenthesis)
. 7
. .Number,bf School EnrollmentsNumber 1 2 3 ,4 S. Total
of IEPs (N=65) (N=50) (N=2S) (f=10) (14F3) () =153)
_.
,0 . , 14" 16 20 .. ... , 14.
1.
85 26 32. .
-- . -
,48
2 -- 56 8 20 -- .21
3 -- ' -- ',20.
-- 3
(...,
S. .. . -- .. -- -_
Don't know 2 8 20 80 100 '' 14
Total 100a/ 100 100 100 100 100
a/Percents do not total 100 because of rounding error.
Table 12
DISTRIBUTION OF SCHOOLS THAT RECEIVED IEPs OR OTHER SPECIFIC INFORMATIONFROM ANOTHER SCH061., BY STUDENT MIGRANT CATEGORY.
(Percents are based on column totals shown in parentheses)
4 .
Did SchoolReceive
Information?i .
Schools by Student Migrant Category_
Total(N=295)
.
SingleDistrict -(N=187)
' WithinState(N -20)
BetweenState(N=88)
.
_
Yes
. No
Don't know
9
82 .
9 ,
10
70
. 20
8
69
23
9
78
14
,
TOtUf . 100
,
100 100
-,
.
10014
.
I 1
Percents do not total 100 because of rounding error.
-19 -24
IP
4
M Chapter 3
Conclusions and Recommendations
.
Although a generally acceptable student response rate of 78 percent was
achieved in the survey (i.e., enrollment histories were oUtaiUed for 78 percent
of the student sample), the adequacyof the survey data for achieving the
purposes of the study was significantly reduced by two factors: (1.) relayt
tively laige number of "don't.know" responses that was received to questions.
about school enrollments for the within- and between-state migrant students,
and (2) the 75 percent response,rate to RTI's request for a copy of the IEPs
that had been developed for sample students.' These limitations' preclude the
generalization of suvey findings to .form "conclusive" answers to the fOur. ,
basic study queitions for the target population. However, the findings of
this survey suggest the foil:owing answers to these questions for the realized
sample:
1) "The different schools in which handicapped migrant students enroll
are not consistent in identifying and preparing TEPs for these
students.
2) TEPs are developed less frequently for handicapped migrants than for
non-migrant students.
3) Although IEPs and/or /EP-related information are rarely transmitted'
between the schools in which'handicapped migrant students enroll,
such information can be' useful to school staff in the identification
of, and preparation of/EPs fOr, these students when they enrolldfn
their "nevi" schools.
The'sample design for this survey involVed.a small nymber of students andwas supported by an existing national probability sample that RTI had selectedfor a national study of the ESEA Title I Migrant Program. It was'not intendedthlt this probability structure result in a sample that would generate popula-tion estimates with a reasonable degree of precision--the size of the sample,which Was held to a minimum by fund limitations, was too small to warrant suchconsideration. Rather, the formal probability structure was imposed primarilyas a mechanism for'selecting a sample of representative individuals from thetarget population that would be adequate for providing insights into theanswers to the basic study questions. The general characteristics of theresulting'stedent sample (i.e., grade level and school. enrollment patterns)are similar to those of students in the national stadys. suggesting that thesurvey sample was "representative" of the target population.
7 21 -
"
Only a small percent of the handicapped students have IEPs developed
at more than One of the `schools in which they enroll during an f
18 -month period; however, when multiple IEPs are prepa red, t hey
reflect general agreement in assessment. results and'continuiti.in
the provisionof special'education and related'services:
.These findings generally support the need for a methodology whereby IEPs
and/or other information about the special needs of handicapped migrant_
students can be transmitted to staff in the various schools in which thesef/.
students enroll .1. A Aiategy.for modifying existing-Migrant Student Record
Transfer System (MSRTS) for this purpose was developed by RTI ant is described
in a report that was published by RTI in May 1979.2 It4is recoisitea4i/ihet
the.strategy outlined in that May 1979 report be considered, along with-other,
possible approaches, for implementation by ED.
air
2 John N. Pyecha. A Strategy for Using the Migrant Student Record Transfer.System (MSRTS) to B tier Serve Handicapped Migrant Children (Final Report).Research Triangle rk, N.C.: Research Triangle Institute, May 1979.
- 22.- 26I
I

'
p
,'
...,
4
4
Ao
4
r"
Appendix-A °
Characteristics of the Migrant Student Population
.-
,4
I!?
am?
4
a4
at.
: Appendix A
Characteristics of the Migrant Student,>Populationl
.
The purpose of this section is to overview the characteristics of migrant'children as these characteristics relate to the implementatidn of P.L. 94-142.Thatis, the population of migrant children is large (see subsection 1) anmobile (see subsection 2); is characterized by low attendance rate's in anumber of different schools (subsection 3); has an extremely-high schooldropout rate (subsection 4); and'suffers from a wider range of health problems,which also occur at a greater inc.dence rate, than the average American (sub-
. section 5). u-s
1. Number of Migrant Children
-As of 6 April 1979, 529,622 children of all_ ages have been eitherenrolled or re-enrolled on the Migrant Student Record Transfer System (MSRTS).While estimatesof the total number of migrant children in the United,St4esrange upward to about 900,000 (or substantially more), no reliable estimate isavailable. Approximately 600ircent of the children enrolled on MSRTS arefrom Texas, California, and Florida, the three major states serving migrantchildren.
L. Mobility
A review of the literature on migrant children. indicates that mobilityis still a way of life for most migrant children, althoUgh the frequency ofmoving appears to be reduced for-some. Most studies indicate that migrantchildren typically attendat least two schools during the year; some ihildrenattend as many as six or eight schools. It has been estimated thattfon theaverage, migrant children. attend three.different.schools each year (CaliforniaState Board of Education,'1974). This estimate has been supported by officialsof the Migrant Program Branch,-1360E, who have indicated in conversapion thatthe average number of schools attended annually by migrant childre4 ii*stillclose to three (based on data from the program's Student Eligibility form,'
'which requests information about the last\school attende). There are4periodswhen theyfare.not.enrolled at all, such as when they,are traveling, working inthe fields, needed for child cares or are making brief stopovers opsshorti-termjobs.
,
LJ11
. During site visits recently conducted by the RTI staff, SEA and LEA. personnel estimated that one-half to.two-thirdi of their.migran0 children
returned to their home school each year, and that the typical child attendsperhaps-two or three school; each year. 4r ..
. s.,, ji
While. changet in migration patternkare appArent, the signAficance'ofthese changes is not yet known. Despite some indications of a geductioa inthe mobility of some migrant children, there is an increase in the number ofchildren enrollins in ESEA Title I Migrant Programs.in most states. It is not
yet clear to what' degree this,teflects an actual increase in,tht number of
Cox, 3. L., Ppecha, 3. , alad'Cateron, B. ,Characteristics of the Migrant
Research Triange Institute, September 1976.Student Population, Study of the ESEA Title I Migrant Program, Retearch TrianglePark,:
. 2i
.
0/
migrant children; t probibly,results from a combinationof other factors,including bette'r recruitment- procedures, the downward extension of migranteducational programs -to include pre-schoolers,:a higher rate of school reten-tion (whether due tospecial educational programs or not), recent inclusion offormer migrants (thosAyho dropped out of the migrant stream to remain in the
schoolefor at least one year.) as being eligible for fund allocation, andthe 1975 shift to the.use bf the MSRTS -as a basis for distributing funds.
.. 3. School Enrollment and Attendance
. . .". t .....
. Migra4 students miss more'days of-school than nonmigrant children;the itstimatedpamber of days migrant children attended; school during theregular schen. year varies by source' and by year.
. e, ..t ., .
.
A 1971*iport baSed..4
on data from student samples its Florida, New Jersey,Texas, and California found that.the school attendance of migrant.children wasabout 85 percent of4that of Lthe national average. _The data showed that, ofthe.equivalOnt of `180 days in the school year prescribed by the .regional.iccreditiqtrassociations and accepted by :the States, the average attendanCefor
-/all 6464ents.)pas'161?days; for migrant 'elementary' students it was 14Q
days, and for migrant secondary students itdwas 137 days 4Consulting ServicesCorporation, 1971). These statistics were from sample data from three base°states and the counties_ selected for sampling in at, least two of the state's,(Florida and Texas) may have been biased by housing policies of larAe corpora-tions and.groverskin the ,counties survered. (The document reviewed did not*_,;:.
Indicate the direction of this bias.) -
Another source of information about school eurollment'and atten4t ce isthe MSRTS. Stitisticst for the 1974-75 (9/1/74 to 6/1/75) reguldr school yearindicate that on the average, migrant Children were enrolled 77 percent of thepossible 180 days, and that they attended school 93percent of the time theywere enrolled. A
.
C.1
The opinion of Title I Migrant personnel as expressed to RTI staff membersis that school attendance by migrant children is very high during the summerterm (with the majority of summer term enrollees its the pre-school to 11-year-
.
age group) but very`low during the regular school term. Attendance is low
particularly at periods of the year when the-need for agricultural workers isat a peak.>
. .
4. Dropout Rate' ..6
. .
' An extremely high dropout. rate is reported by every source dealing.
with the educatioi of migrant children. The estimate of a 90 percent dropout ,ii
rate priorto high schdol has been frequently cited during the last decade.Despite expansion of educational prograbs serving migrant childreti,'the dropoutrate does not yet seem to have been affected. A 1975 Education Briefing Paper "
of the U.S. Office of Education cites,the same above-mentioned figure, saying, y
"Nine out of 10 children of migrant farm workers never-enter high school andt
Ionly one out of 10 of those who do ever graduates."
1
. .
5. Health Problems. v
.0 . 46Data indicate that migrants not only su r from a wider range ofA:
health problems than the, averagi citizen, but that the incidence of. these
.
A-2
2:1
problems*is signific4itly h gher. Writers dealing with migrant health oftencite comparative informatio ;taken from the Natiodal Disease and TherapeuticIndex, to make this pOint. he-Index contains data from a comparative samplingof patients seen by a pri ate physician and those seen in amigkant healthproject. The comparisons revealed that infectious and parasitic diseases ofthe respiratory system a..idiseases of the,digestive system were from two to -
five times as numerous, lg migrants as among the general population. Tuber-culosis occurred 17 tip as often, veneral diseases 18 times as often, and
,infestation' with worms times more often among migrants than among nonmi-grants. The mortalityrteramong migrant mothers was four times that Of thenational average, anh he.per capita health expenditure per 1,000 births wastwice as much for.mig ants as for nonhigrants (Bove; 1972; New York State
° . Conference on MigiCant fucation, 1972).
. .
A recent educe nil needs assetpment conducted for the State of Floridaby an independenCe nsalting firm 0). A.'Lewis Associates, Inc., 1976) dealtwith gross motor a d fine motor development among migrant and nonmigrant
'childres. Grose 'm tOr deielopment is considered to be a good indicator of'-general health, p *ical maturation, aid the- quality of the environment towhich an in4vid 1 has been exposed. 'Generally, migrant students were foundto have serious oss:motor,defectsAin, several areas such as cardiovascularendurance, flex/ and balance factors. The report noted thelelOseinterrelationshi s between certain gross motor factors, and also the fact.thatthe young person s centraTItervous system is extremely vulnerable to environ-mental insult. commendations were made that "immediate attention should be
, given to the possibilitrthat nutritional deficits, health problems, and/oringestion of toxic substancds may be causally related to gross motor retarda-
.' tionamong migrant studiants."
, . I
.,41.. ; I
'1
3u*
Sf
a

I
. $
O
44 .
t .
.-Appendix B
DeicriiiioU of the Survey Plan
$
1
3i
I
.
4
4
dix B
Dediption of the Survey Plan.
Section I of this appendix discusses the target pOlOilitibn and sample
'design for the Survey of handicapped migrant children. Sections II and III
outline the data collection and confidentiality procedures, respectively.
. .
I. TARGET POPULATION AND SAMPLE. DESIGN
A. Target Population
The underlying population oiNinterest for the present study consists of
all handicapped migrant childien of legally migrant pa;ents as of 1 January
1980. Unfortunately, no Aniversal preselection factors exist: for identifying
this popdlation in a 60V effective manner. As a result, study of this popu,
lation using.survey techniques would require an expensive screening process of
eneral school-age population. However, an existing national probability
sample that RTI recently had selected from a particular subset of the popula-
tion of interest provided a feasible alternative for defining the target.
population for thi telepine survey: Specifically, RTI had identified a
sample of 146 children who were enrolled in grades 2, 4, or 6 at non-special
education schools ineJanuary-February 1978 and who were classified by these
schools as being TMR (trainable mentally retarded) or functionally disabled.
Since the 146 migrant children in this. sample were enrolled on the Migrant
Studeni.Record'Transfer Systim (MSRTS)1 data base, RTI obtained the assistance
1 The Migrant Student"Record Transfer System (Msim) is a nationwide servicethat maintains computerized containing personal, health, and educationaldata on identified &grant students. The MSRTS serves three major purposes.First, it is designed to make educational and related health information.available to any cooperating school in,46 of the states (Alaska, Hawaii, NewHampshire, and Rhode Island do not participate in MSRTS, however, Alaska is inthe pkocess of becoming involved in MSRTS) and Puerto Rico within a few daysof the child's'arrival at. the school. Second, the recorded.educational andhealth data are tabulated and analyzed to provide management information forproject managers at the local, state, and national levels. Third, the studentenrollment data recorded in the MSRTS are analyzed annually to provide anestimate of'the total number of migrant students residing (for a full year or
(continued)
. .
of M$RTS staff in providing information about the educational histories for.
these students for the 18-month reference period.
1 This sample of students was designated as the Migrant Regular Schoolt . .
Component and its target population was defined as all handiCapped leg0
migrant children enrolled in non-special education schools in the contiguohs
United States in grades 2, 4, or 6 as of January 1978. .
". To include a group of more severely handicapped students in the study,
t
t e existing sample was augmented by a small number of migrant children who
re enelled in special education schools. In planningthis augmentation
chksample, 1, was noted that:
1) Aground 60 percent of all knot migrants reside-in three states
Im.
(California, Florida, anTiexas).
2) The vast majorityjof the probability sample members. reside in these
three states partof the year. .
Therefore, in order to identify this particular sample,,RT/ professional staff
contacted 100 randomly selected public special schools in California, Florida,
and Texas to obtain a listing of migrant students currently enrolled in those
schools. This information was requested in writing and then obtained through
telephone. galls conducted in March 1980. .Thus, the target population for the
Migrant Special School Component was defined as all handicapped migrant'
children enrolled in special education schools ,in the states of C lifornia,
Florida, and texas as of March 1980 and who are known to be enrol ed on the
MSRTS by virtue of having an MSRTS identification number. '
14 (continued)for part of a year) in each state. This yearly full-time equivalent (FTE) ofmigrant student* is a major factor in determining each state's funding leyelfox: E$EA Title I migrantfunds.
Although MSRTS filesc. continually updated to reflect the receipt ofhealth services and participation in general educational programs as migrantstudents glove in and out of schools, the MSRTS does not contain information .
.,about the special needs of, and services provided to, handicapped migrants.Furthermore, the MSRTS does not contain a regular mechanism for noting theexistence of 'handicapping conditions.' Space on MSRTS forms is provided forindications of special health conditions and special educationalprograms, butthere.is no method for defining which conditions are clearly handicapping orwhich services.are clearly special services for the handicapped,' nor are theexisting headings detailed enough to enable analysts to make thesedetermina-tions by deduction.
L
E2
se
1.
B. Sampling Frame.
and Sample Selection
0
a
1.. Sample Selection for Migrant. Regular School Component
The Migrant Regular School Component was suppprted by an existing
probability sample Specificallyp iii.January-Februati 1978, the Research
Triangle Institute selected.a national probability sample of 5,762 migrant
.students in grades 2, 4, or 6 for achievement testing as part of an overall
( effort to evalpateithe ESEA Title IMigrant Program. An intermediate step was
the identification of'all migrant children in grades ,2, 4, or 6 enrolled as of
December 31, 1978, in a'probability sample'of 347 regular schools (i.e.,
special schools for handicapped children were-excluded) .in the contiguous
United States. Before testing, however, 146 of these students were identified
by their school (or teacher) as being'TMR or functionally disabled, and snbse-
'quently were excluded from any testing. As such, a ready-made probability
sample from the intended target populition for the Migrant Regular School
"Component was already in-hand.
In general terms, the sample design,for the study of the national ESEA
Title I Migrant Program was a stratifieddultistage design with counties,
public school districts, and schools at the fiiet three stagesof sample
selection. Subsequent stages of sampling depeLided on whether the eventual
migrant student'was known to the schoOl-level staff as being migrant (in which
case the student was selected at the fourth stage'of sampling), or whether a
screening process of selecting classrooms at the fourth stage and students at
the fifth stage had to be implemented. The design was intended to produce a
self weighting sample of nonhandicapped students. To achieve this, schools at
the third 'stage were selected (unconditionally) with probability proportional
to the estimated number of migrant children at the school kh January 1978 who
were expected to be enrolled in grades 2, 4, or 6. As such, moderate unequal
weighting effects could be reflected in the probability sample of handicapped
migrants for this component.2
2. Sample Selection .for Migrant Special School Component
The Migrant Special School Component' was, supported by a stratified
three-stage sample design. Specifically, the probability sample of.counties
2 - A description of the sampling frame and simple selection methodology forthe national impact study of the-ESEA--Title-I Migrant Program,is presented inAppendix A of Volume IV of the final report for that study, (B Cameron et al.,Study of the ESEA Title I Migrant Education Program. Volume IV. Research
Triangle Park, N.C.: Research Triangle Institute, t6 be published inDecember 1980).
B.3
p
0._
selected in support of the ESEA.Title I Migrant Study (limited,to Califbraa,
Texas, and Florida) served as-the'first-stage sample. A list of 100 special
education schools.in these sample counties was constructed using the current
year Curriculum Information Center (Cfb) directory of elementary and secondary
schools.' These 100 schools were located in a total of 66 school districti.
the school district administering each of the special education sttlools
in this second-stage sample was contacted to determine the number of migrant
students currently enrdlled in the school. Of the 66 districts contacted,
only 2 refused to release this information. Most district officials were very
cool4rative. Respondents were asked to identify only those children who had
MSRTS identification numbers. If thp student did not have an MSRTSD number,
they were excluded from the sampling frame. For every student with an MSRTS
ID number, the student's name, sex, and birthdate also were requested so that
that information would be available if the student were selected in the final
sample. HoweVer, some problems encountered in the listing process necessi-.
tated a change' in the procedure. Since district- and school-level officials
di not always have NUTS ID numbers noted in the records of students attend-'
ing the special schools, RTI staff had to.contact (with district-level per-
miision).the local Regional Migrant Directors in order to verify migrant
enrollment at the schools. Several, of the districis contacted did not par-
ticipate in the migrant program and, `therefore: MSRTS ID numbers were usually
not assigned to students in their district. A total of 87 handicapped migrant
students were identified in this sample of special schools.
As with the Regular .School Component, the MSRTS'ID numbers for this
sampleof 87 students were sent to the MSRTS so that educational histories on
these students could be obtained fdr the 18-month reference period. When this
-information was returned to RTI, a sample of 50 students was randomly selected
from the total sample frame.
3. Realized Sample Sizes and projected Precision
Data were collected and reported for 153, or 78 percent, of the 196
students selected into the regular and special school components. This
realized sample of 158 students includes 130 in the 'Regular SchoWcOmponent
(89 percent of the 146 sele)ted) and 23 in the Special School Component (46
percent of the 54 selected). Data were not collected and/or reported for the
43 other students for the following reasons: ' ,
I.
B.4
t. 0
4.
4
0,
a) Regular School Students--of the 16 nonrespondents in this category,
8 had no enrollment information listed on the MSRTS for the 18-month
reference period, 7 were not known to school staff, and 1 was en-'
rolled in a district that refused to participate in the survey.
b) Special School Students - -ojf the 27 nonrespondents in this category,
12 had enrollmeriti that dilly were for' one day or were not within the
range of the 18-month reference period; 10 were enrIlled in districts
that refused to participate in the survey, and 5 were not known to
school staff.
Data collected on this sample of handicapped migrant children can, in
theory, be weighted to.feflect its underlying probability mechanism and thereby
yield unbiased estimates of target populition counts andpropoitions. Sample
sizes for the respective components, however, were inadequate to warrant any
.attempt to approximate the precision of these parameter estimates. Indeed,
even the first-order probability structure of the sample data can be viewed as
of secondary importance. That is, the primary role played by imposing a
formal,probability structure is one of providing rigor in defining the intended
target populations and tie mechanism for selecting "representative: individuals
from these target populatiois. Even though the sample data were analyzed as
if they were purposively selected (and not a realization of applying a speci-
fied probability mechanism), this selection proedure was preferred (economic-
, ally and intuitively) over a purely subjective selection of target population
members.
II. DATA -COLLECTION.PROCEDURES 4
Sch;o1 enrollment histories for the 18-month period covered by the survey
were extracted for each sample student from the MSRTS by MSRTS'staff. These
histories were studied.by gn staff to identiff po-ssible missing enrollments,
as, evidenced by large time gaps between successive enrollments. RTI survey
staff, experienced in conductinvelephone interviews, telephoned schools and
pfojects to complete the brief questionnaire described below and to attempt to-
fill in these "enrollment gaps.
Procedures for conducting the telephone interviews were specified km a
telephone interview guide (see Appendix C). Prior to apy contact with school
personnel, RT/ notified and secured approval flr data collection activities
4
845 36
..--
from FEDAC, Chief State School Officers, and °the/ state and LEA persohnel as 1.4._/'
appropriate. After obtaining appropriate approvqk and before initiating the
telephone interviews, staff in the sample of special'educati9nschools located
in California, Florida, and Texas were contacted and asked to identify (by
MSRTS numbers) any currently enrolled migrant children. As discussed in the
previous section:, a sample of children from these schools augmented the sample
of handicapped children enrolled intreg ular schools. The procedures followed4
in notifying state, district,and school personnel, and 4n conducting the
telephone interviews are. described below.
/) .
A. Notifying State and Local Educhtion Agencies
The first contact with the educational hierarchy in each state was a
.mailing to the Chief Stage' School Officer (CSSO) of each of Fhe 4$' contiguous
states. (All states were contacted since it was possible that sampled students
could have been enrolled in most of the continental states at some time during
the 1$- month' enrollment period on which the survey was focused.) This mailing,
which was conducted in December 1979, included introductory materials and
details of the study effort..
The purpose of the CSSO mailout was to inform CSSOs about the study, to
secure their participation, and to determine hoW to proceed to the district-.
tlevel if,:or when, sample. students were identified as being.enrolied in dis-
tricts in their state. The mailout consisted of mletter from Dr. Edwin
Martin, Deputy Commissioner of the Bureauof Education for the Handicapped;
siimmary.desCripilon.of the project and, if applicable, a list of districts
attended in the state by sample children. CSSOs in California,.Florida, and
' Texas received a letter listing districts identified, for both the Regular and
ig)
Special School Components. Informational copies were sent to the State
Special Education Director, the State M' ant Director, and the State CEIS
Coordinator in each state. Copies .1f the California, Texas, and Florida
mailouts also were sent to the Regional Migrant DirAtors in 'these three
states. . -,.
Follow-up calls to the CSSOs yin each state were initiated in Janhry
1980, .The purpOse of these Calls was to obtain the CSSOs agreement to par- .
ticlte in the study, to determine who'would act as Project Coordinator at.
the state level, and to verify the procedure for district mailouts. In most
B.6.
A
v
-4casest-the state -level Project Coordinator agreed to contact the superinten-
dents of selected,districts in advance of the direct mailout to that district.'
'A telephone inteiviewer was trained to conduct the state-level calls and was
instructed to give piiority to taping the cssgs of the 17 states with school
districts identified in the study. Of the 48 states contacted, only one state
refused to participate. Since none of the sample students attended schools in
that state, this refusal did not represent a loss of data to the survey.
The state-level calls were docnmente4 on standard RTI telephone tracing
control forms. Following the telephone conversation, a confirmation letter
verifying Ur. state's agreement. to participate was immediately sent, to the
CSSO or to the Project Coordinator. A log was developed to record the name of
the Project Coordinator in each state and to note any special instructions
concerning RTI's mailoUt to district superintendents.
In mid-February, =flouts were sent to the superintendents of the dis-
tricts identified for both-the Regular School and the Special. School Components.0
A total of 71 school districts were identified as being attended by students
in the regular schools sample. Ten of these districts also were included in
the total number f 66 districts in'which the 100 special schools identified
for the Specill Cboosli Component were enrolled: In addition to an informa-
tional cover letter, each mailout consisted of a project summary, i confiden-
tiality-of-data statement and a copy of the letter sent to the CSSO.
Again, the Regular School Component mailout was. followed by a confirma-
tion call from RTI telephone interviewers. These calls commenced during the
first week in March 1980. The'purpose of these."calls:was to obtain permission
to conduct the interviews, to provide the district official with the names of
sample s s and of the schools that they attended in that district, and to
set up an ointment for theeactUal interview. During these calls, a deter-.
Jo urination walloade by the district official as to whether or not to respond to
. the interview at the district level or at the school level. If the district
'official designated another staff member at the district or school level to be
the respondent, the district official was,usuilly willing, to preface RTI's
call with a call to the respondent explaining the study and-the infereation
that would be requested. If a school contact to complete,an interview was
necessary, it was made byltelephone according to instructions given by the
district official. In some cases, it was necessary, at the district offi-
cial's request, to send .an introductory letter to the school prior to making
B.7 36.gi
the telephone call. The letter identified the telephone interviewer, the
agency for whom the study was being conducted, and the 'filature of the required
information.N."
One full-time interviewer and one back-up interviewer were assigned to
this task. A brief telephone guide was developed for the completion of these
initial calls and both, interviewers were trained on how to handle the' initial
district-level contacts.
B. Conducting the Telephone Interviews
All data-collection activities (telephone interviews) 'were conducted by
RTI survey personnel whO were rperienced in conducting telephone interviews
and who were thoroughly trained in the specific procedures developed for the
IEP survey. The interviews with LEA/school-level personnel served a dual
'purpose. First, 'they helped to fill in education histories; second, they
provided relevant IEP information. Although some interviews were conducted
with: staff at the school level, the 'desired infirmation was obtained mo,
frequently at, the district level. A
Appendix C contains the Interviewer Guide. This guide was supplem
by a set of general instructions and procedural reminders to intervie ers,/
along with a written summary deicribing the survey and its purposes a4dYauth-..,.
orizations, and a separate description of confidentiality prOcedurer.., TheseI>
materials were presented and discussed during training to give interviewers a
thorough understanding'of so they could answer questOni frog
School officials, as well as 6 insure that the interviewers fullxiqnderstood1
the telephone interview protocol. i,.'%
..:
The results.of each interview were recorded on a Stddent Control Form,
. %
(see attachment to Interview'Guide, AppendiX C). 'One Student Contiql Form wasIP 7 .
.
associated with each sample student. If there was more than one:
siOple student
in'a contacted school or institution, the multiple Student Contra]. 'Forms were.
aggregated and used by the interviewers during a single interview.. The various
. column headings on this form were associated with questions asked during theL./ . ., . ,
interviesg, as shown in the Interview Guide. ,
The interviewer also had a School Control Form (not shown) for each
school. This form contained a listAng of all sample students who ire/were4V,, . .
enrolled in the school; it notetralso the names of state and local officials. .
.
who had given permissidn for the stillp. As such, the School Control Form war. ..
.B.8e
-
4
AP.
7 )
used to °rightIle co tatted school official to the study interview. Also, it
was used by intervie ers to note any call-back 4nformation'and record the
status of interview completions for the school..
The interview began after the appropriate school official was: reached by
-telephone.- The interviewer introduced himself/herself, indicated thathe/she
was 'calling from RTI, and specified the purpose of the call-, _as-wairl.,as_the
authoriAppon for the interview. The interviewer then asked if the school
official had the records of the specified student(s) available, or if a call
back was preferred. Any questions that were asked ahout the -study were
answered either by the interviewer, the interviewer's supervisor, or the RTI
Project Director.
When the official agreed to-provide information to RTI and had the appro-,
appro-
priate student- records at hand, the substantive questions were asked. This
part of the interview contained nine basic steps (labeled A through I,in
Section II of the Inteview Guide) and a terminal step ,( labeled J). The.
interview guide includpd instructions to interviewers, interspe'rsed with,
verbatim comments to respondents. Specific information obtained for each
student in answer to the questions used in steps A-I were recorded on the
Student Control Form.
In step A the interviewer attempte& to verify or correct the attendance
record of the student at the subject school as reported.by MSRTS (or as pro-
vided by a previously called school; see step C). In step B, he/she obtained
a complete record of attendance of the student at the subject school through-
out the time span of interest. These steps were necessary because information
received from other schools, and information received from MSRTS, was at times :
incomplete or inaccurate with respect to school records. The specific purpose
of step B was to make certain that all dates of attendance were recorded,
since' it is not uncommon that migrant families move back to the same area or
areas in seasonal patterns. The student's date of birth was verified the
assigned grade level for. the student during his or.her enrollment period(s)
was noted.' Step C was included to verify /identify, any indications in the.\
subject stool's records concerning attendance in other schools, thus helping
to fill gaps in enrollment histories. The grade level in which the studtnel
was enrolled was requested in step D:- .
In step E, the interviewer began to retrieve information central to study
purposes, by asking .if the student had been identified as having special
8.9 4v
,
4
. .. .
education needs due.tooa handicapping condition..
.
-,6from each school for each period in which the student was eta
answer the study question concerned with the, identification
migrant students across schoOls (see question (a), Setion III of.
Step F was entered' onlksif the; answer to step E was affirmatiye. In. ,.
This information was netied
order to
icapped.
hapter'1). .
4;
step F,, the, interviewer determined whether an IEP', ormore&than one IEP, had
been develope;df' for the subject student. This information wasnecessarOlito
respond to the study question about the extent to which, IEPs are developed 'for
handicipped migrant students (see question (b), Section,III-of,Chapter 1).
Th questions in steps Gand H solicit information about the degree to
which different schools share, and find useful, -IEPs or related information.
If:the school has received-an IEP ,from another school in which one bf.fhe,
sample students was previously enrolled, questions 2 and 3 in step H solicited
information about the.utiiify of the IEP (To what extent was it useful? To
what extent was it adopted?). The questions asked in steps G and H were. ,
necessary to. respond to study question (c), Section III of Chapter 1.
In the event'that one or more IEPs was (were) developed
, the interviewer .(in step I) solicited a copy of the IEP(sY
(with personally identifying informatibn removed). In this
for the student,
from the school.r
step, the inter-,
viewer assured 'the respondent of confidentiality procedures and provided
specific instructions for processing and delivering the IEPs. In addition to
the confidentiality measure eOployed in-house at RTI, the respondent was
requested to' add a date to the IEP (where necessary) and to substitute an'* . , ,
identifying number for the student's name.lr 1
III. PROCEDURES Aik ASSURINd'CONFIDENTIALTTY.
. '
Mailingsol;pthe Chief State, School Officers and to LEA superintendent,
included ',a confidentiality -of -data statement prepar0 jointly by RTI and a. . , -
member of the Privacy and Information Rights Staff, ED (see Appendix D). The
confidentiality-of-data statement Abted that data:collectiA procedures, planned
for the survey .were in 'compliance witfi both the Privacy Act of 19/tand with
the Family Educational Rights and Privacy Act of 1974 (FERPA), that every.
.4,, 4 .. ,
precaution would be exercised to protect the identiWof.every study partici-
pant, and tilat collected raw.dath would be Used onlysby RTI personnel.4
4P
. Q
B.10 4i.
-v4
I14
As previously 4scuerill, it was requested that school staff remove all
personally identifying student information from the IEPs forwardeirto RTI.
However, proper analysis of the IEPs required the capabiliiy'to link the IEPs
collectedjumadifferent schools for the. same student, while still protecting
the, anonymity and confidentiality of data related to participating LEAs and
schools, Thip requirement Was met thrbugh the assignment of ID numbers that
permitted' RTI to' link the documents-to their associated student master
lift' linking IA numbers to the names .of students was maintained at R1 and.
treated as highly ,confidential. This list was destroyed4when data analysis
activities( were completed.Jo.
4 All handling of source documents (completed interview questionnaires and
phbtocopied IEPs)-at RTI was, done utighwthe technical supervision of profes-
sional survey staff. .These source documents were destroyed upon completion of
data analysis activities.1 ,
04
00.
0
1
4
'
taI
1P'
0
11
B.11.4
z

.
4,
/ ..
.
.
.
.
a
A
«if ...- .
.
,
e
I
.
4
r
.
1 . rI I ...
.
Appendix C1
`Telephone Interview Guide ,.
4I
o' I .
I
1
la
:43
r
I
I
I
.
;
Ir 4
. *
v
t
/
k
a
I
..I
0:
4
I
,- 0
, ... ,
,------
y4
'. Telephone Interview duidikN
. {NOTE: Geteral'instr4c,tioris which reiterate points made in,'.
training r
'are not shown herete..This:material contains the procedures to befollowed after contact is established with thl appropriate schoolofficial.) '
. r .. ,
BEGINNING THE' INTERVIEW.
MY NAME IS,- AND I. AM CA)LING FROM THE RESEARCHTRIANGLE INSTITOTE IN (RESEARCH TRIANGLE PARK) IN NORTH CAROLINA. WEARE CONDUCTING'A.tTUDY CONCERNING THE.SDUCATEON OF HANDICAPPED STUDENTS OPMIGRANT WORKER FAMILIES.' Tpg STUDY IS, BEING DONE UFDER CONTRACT WITHTHE LS. OFFICE,OF EDUCATION THROUGH THE BUREAU,OF EDUCATION FOR THEHANDICAPPED.
(For reguiaN public schools:) WE RAVE OBTAINED THE PERMISSION Op.(name of approprialte SEA Or LEA official) TO TELEPHONE YOU WITHQUESTIONS ABOUTililDW RECORDS OF (sthdetit name(s)).
et,
. WE ARE SPECIFICALLY INTERESTED IN THE STUDENT'S 'ENROLLMENT HISTORYAND ANY ippjaTiops OF SPECIAL EDUCATION AND RELATED SERVICES. IS ITPOSSIBLE:FOR YOU 1'0 AIL THE' TUBENVS RECORDS WHILE I HOLD, OR WOULD YOUPREFER THAT I CALL BARK LATER?
0
,-, . '.7
.,..
Instructions-totnteivieweiC: -
y .4.;7 ,
,t .,,, 10
'4
1. If tale"sch4oIorficial wishes to be called back later, ask'when.4oul4 be sconVedienX 'time and iecord 9n School Control Form. .
. , 4 #. 4d, I . .6
2. If the school: 6fficial'atks questions about the study,answer.these to the best .of your abiliti.based on the study summary
Is/ .
,
you have been given .k..
3. . If the'schooll;i4a.liyants'further inforthation, tell him/
her that we:will ke pleat to send him/her.a written summary descrip-tion of the suzivey'and 4 purposes.!,-If the official has specificconcerns, transfer the call to Mi. June Palmour, RTI Survey Specialist;or take the offAcill's name and telephone nuiber and have Ms. Palmouror Dr. John Pyith9 the, 9T/6-Project Director, return the call.
4 If school, official will pull the records, proceed withthe following itexview foileach student. Record responses on theStudent Contrp Form;
. DO YOU HivE THE RECORD] name(s) HANDY? (Let the Schoolofficial get the record! id front of him/her.)
ef
444
1.
- f
II. COLLECTING THE INTERVIEW DATA
Ask A-I for every sample student listed for school.
',(Conflatiihe student's date of birth and sex.)
rA. IT S UND ERSTANDING FROM THE MIGRANT STUDENT RECORD TRANSFER
SYSTEM AND OTELERSCHOOL SOURCES THAT (student name) WAS ENROLLEDIN YOUR -(SCHOOL/INSTITUTION) FROM ,(date) TO (date) (AND ALSO FROM(date) TO (date) (AND,(date) TO (date))).- CAN YOU TELL ME IFTHIS. ENROLLMENT INFORMATION IS ACCURATE ACCORDING TO THE SCHOOLRECORDS? {Record numeric code response in Column A of'StudentContrOlyorm.)
Yes; respondent confirms date(s).
2. Ns; respondent disputes one or, more dates'. IndicatedlOputed dates on Student Control Form under EnrollmentDates. Asiefor details if not spontaneously given.
3. unable to locate records of student (terminate interview).
B. .WERE THEREAHY'OTHER TIMES THIS STUDENT,WAS ENROLLED IN YOUR -
A (SCHOOL/INSTITUTION) DURING THE PERIOD FROM JANUARY 1978 THROUGHJUNE 1979? (Record numeric code of response in Column B ofStudent Control Form.)
1. Yes-4(Indicate dates on 'Student Control Form underEnrollment Dates.)
2. No.4
. .
C. / HAVE ONE MORE QUESTION ABOUT THE ENROLLMENT HISTORY, OF (studentname). DO YOUR RECORDS INDICATE OTHER SCHOOLS OR INSTITUTIONS
e// BESIDES YOURS IN WHICH THIS STUDENT HAY HAVE BEEN ENROLLED AT ANYF TIME rpm JANUARY 1978 TO JUNE 1979? (Record number code of
response in Column C of Student, Control Form.)
1. Yes (Record details in Other Schools section onStudent Control Form. After interview, seesupervisor re completion of updating of a SchoolControl Form for lip new school.)
,
dr 2. No. '
NOW I WOULD'Ilit TO ASK A COUPLE OF ADDITIONAL QUESTIONS ABOUT
name} DURINGEACH OF (HIS/HER ENROLLMENTS(HIS/HERJ.ENROLLMENT
AT YOUR SCHOOL.'
,
(NOTE: Proceed with Steps D-I for each period the student was enrolled..r
at the school.) to,
A 0
C.2.
4
.0
D. WHATLGRADE WAS THE STUDENT'IN DURING THE TIME(Record on Student Control Form:)
OF ENROLLMENT?t
E. WAS (student name) ASSESSED AND FOUND,TO HAVE A HANDICAPPINGCONDITION THAT REQUIRED SPECIAL EDUCATION AND RELATED SERVICES*WRING (E date)? (Record numeric code of response in Column Eof Student Control Form.)
1. Yes
2. NoGO TO Jr. Check for "no" responses that ate applicable, to the school enrollment period for which thestudent was reported in the national study of theMigrant Education Piogram as being handicapped. If
the responses are not consistent, tactfully explainthe inconsistency to the school official and attemptto clirify the situation.. Note any inconsistenciesin the "notes" section of the Student Control Form.
. 3. Don't know
F. WAS AN IEP DEVELOPED FOR THIS STUDENT DURING (enrollment date)?(Record numeric code of response in Column F of Studeni ControlForm.)
1. Yes
2. No
3. Don't know
G.. IS THERE ANY INDICATION IN YOUR RECORDS THAT YOUR SCHOOL EVERPROVIDED TO ANOTHER SCHOOL OR INSTITUTION AN IEP OR OTHER SPECIFICINFORMATION AlpuT THIS STUDENT'S HANDICAPPING*CONDITION?
1. , Yes
2. No'Wi .
H.1. IS THERE ANY INDICATION IN YOUR RECORDS THAT YOUR SCHOOL EVERRECEIVED FROM ANOTHER SCHOOL OR INSTITUTION AN IEP OR OTHER SPECIFICINFORMATION ABOUT THIS STUDENT'S HANDICAPPING CONDITION?
Yes-sCA TO H2 and H3.
,
k. 2. No -.4 GO TO I if answer to F was yes;otherwise GO TO Jr..
C.3
I
1142. (If an IEP was received from another school) TO WHAT EXTENT WAS ITUSEFUL?
((1. Very useful.
2. .Moderately. useful.
3. Of little or no use.
4. Don't know.
H.3Z(Ifthe IEP was received) TO WHAT DEGREE WAS rT'ADOPTED?
1. Adopted in total.
2. Adopted with slight modification. ,
3. Not adopted at all.
4. Don't know.
(Record additional. details regarding usefulness of'IiPsthe Notes section of the Student Confrol Form.)
//'
I. (If one or more IEPs were developed fore student)IN ORDER TO SATISFY THE REQUIREMENTS OF THIS SURVEY, WE WILL NEED.TO EXAMINE (THIS.IEP/THESE IEPS). WOULD YOU PLEASE PLACE THESTUDENT'S MSRTS U OTHE IEP(S)4 BLANK OUT THE STUDENT'S NAME TO ;
INSURE. PRIVACY PROTECTION, AND MAIL (IT/THEM) TO OUR,SURVEY DIRECTOR?
(Ifno; or hesitation: explain why nee ded and remind..respondent of consent of state and district officials;describe confidentiality safeguards; ask again. If
persiiteut refusal, indiCate as a note on school recordform and inform your supervisor.),
THE WAY TO PROCEED WITH THE IEP(S) WILL BE TO DELETE OR REMOVE THESTUDENT'S NAME AND HIS/HER PARENTS' SIGNATURE IF THEY APPEAR ON THEDOCUMENT. ALLOTHER INFORMATION SHOULD BE,LEFT AS IT IS. IF A DATEDOES NOT APPEAR ON THE IEP, PUT THE BEGINNING AND ENDING DATES OFTHE ENROLIMENT.PERIOD IN THE UPPER T.EFT.CORNER OF THE FIRST PAGE:SECAUSE-Tae NAME IS DELETED; IT IS EXTREMELY IMPORTANT THAT TIEPROPER CODE AMBER FOR THIS STUDENT,HE LISTED bN THE IEP IN THEUPPER LIGHT CORNER OF THE FIR.* PAGE. THAT NUMBER, READS AS FOLLOWS:(student ID) SLASH (school /D).
ARE THERE ANY QUESTIONS? . . . OK. FLEASE MAIL THE IEP(S) TOMS. ,DUNE PALMOUR, RESEARCH TRIANGLE INSTITUTE,NDOST OFFICEBOX 12194; RESEARCH TRIANGLE RAM, Ng 27709. MS. PALMOUR ISHANDLING IEP RECEIPT FROM RTI'S SURVEY OPERATIO1S CENTER.
For eachavenrolDtent period in which IEP was develdpedi cede:1. %- It'LEA/School will send IEP2' - Refusal 0 send IEP (Record details on Problem/Refusal Form.)
C.4 4 ;'' 1

J. (If information about the last enrollment period has been obtained,conclude interview; otherwise, repeit steps D - I for the nextenrollment period.) THIS CONCLUDES THE'QUEaTIONS I HAVE'FOR.YOUTODAY. THANK YOU FOR YOUR PARTICIPATION IN THIS SURVEY.
/ --(Terdinate interview.)
1.0
1r
C.5
A
1
r
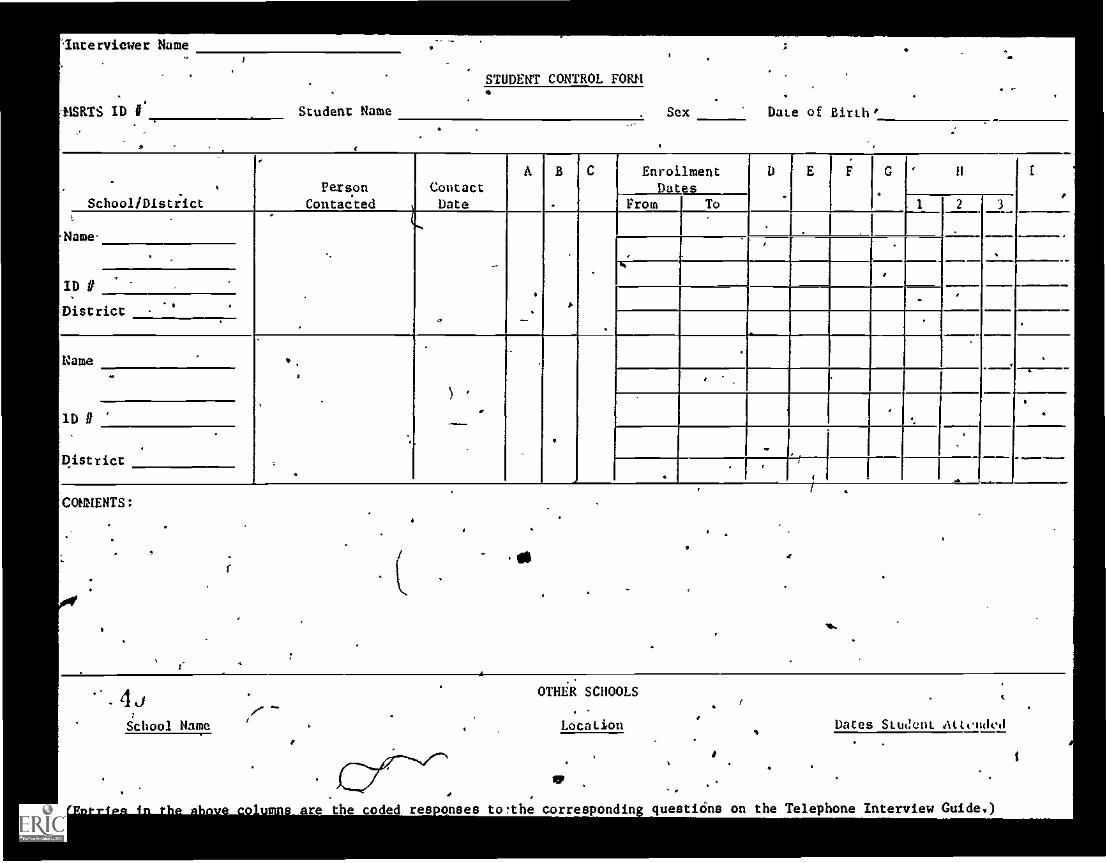
'Interviewer Name
.
'NUTS ID I Student Name
STUDENT CONTROL FORM
Sex Date of Birth'
,
School/District
.
PersonContacted
ContactDate
A.
B C EnrollmentDates _
D E F C
.
' II 1
.From To 2 3
,
Name-
..
.
.
.
.
.
.
.
.
-.
,
.
.
_
ID #.
.
.
_-. .
District
Name.
..
,
..
'..
.
.
_
.
------
.
..1D#
.
.
District _ ____ _______
.f _... .
COMIENTS:
r0
- 4 tf
School Name
OTHER SCHOOLS
Location Dates Stom!ent Attcnded
are the coded res onses to:the corresponding questions on the Telephone Interview Guide.)

4
A
1
Appendix D
Confidentiality of Data
5i
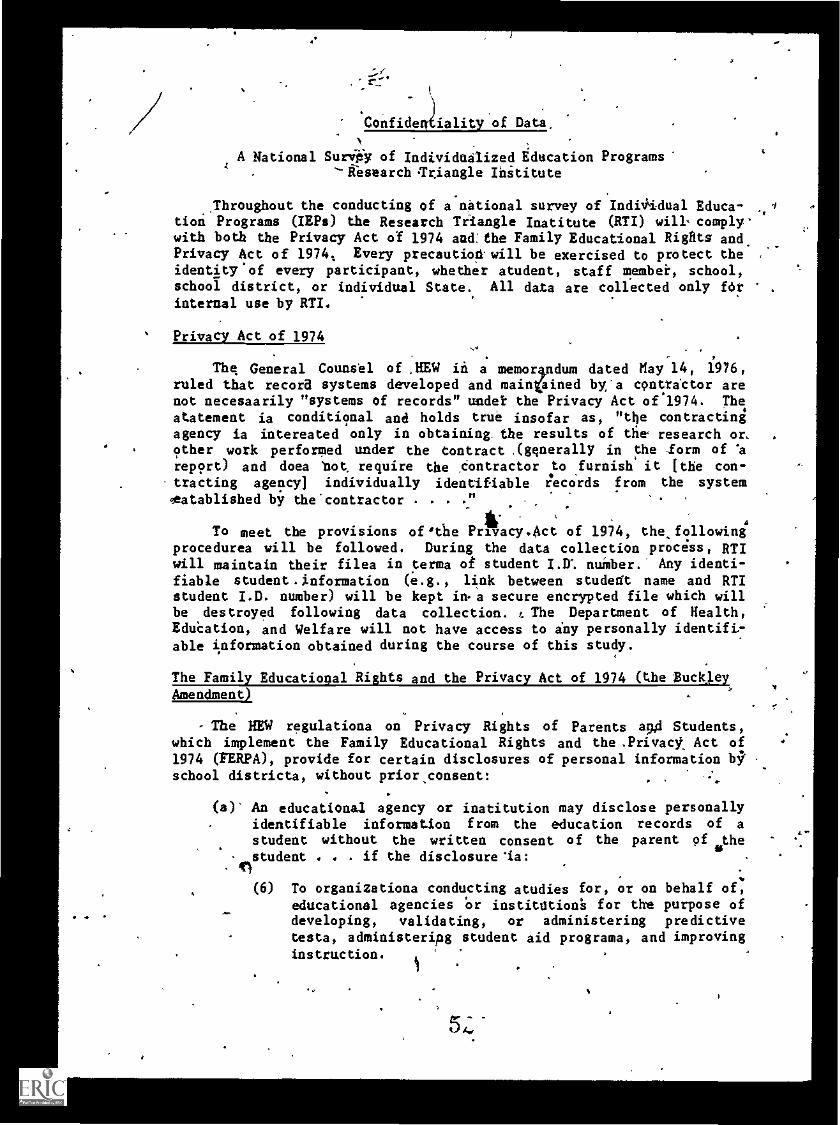
- r~
Confiderdiality of Data
A National Sur of Individualized Education ProgramsResearch Triangle Ihititute
Throughout the conducting of a national survey of Indi4idual Educa- ,ition Programs (IEPs) the Research Triangle Institute (RTI) will-comply.with both the Privacy Act of 1974 and:the Family Educational Rights and.Privacy Act of 1974: Every precaution will be exercised to protect theidentity'of every participant, whether student, staff membei, school,school district, or individual State. All data are collected only forinternal use by RTI.
Privacy Act of 1974.
Thq General Counsel of .HEW in a memorandum dated flay 14, 1976,
ruled that record systems developed and maintrained by'a cpntrictor arenot necessarily "systems of records" undet the Privacy Act of'1974. Thestatement is conditional and holds true insofar as, "the contractingagency is interested only in obtaining, the results of the research or,other work performed under the Contract .(gqnerally in the form of 'areport) and does tot, require the .contractor to .furnish it (the con-tracting agency] individually identifiable records from the system«established by the-contractor . . . ." . .
To meet the provisions ofthe Privacy.Act of 1974, the followingprocedures will be followed. During the data collection process, RTIwill maintain their files in terms of student I.D. number. Any identi-fiable student. information (e.g., link between student name and RTIstudent I.D. number) will be kept in. a secure encrypted file which willbe destroyed following data collection. t The Department of Health,EduCation, and Welfare will not have access to any personally identifi-able information obtained during the course of this study.
The Family Educational Rights and the Privacy Act of 1974 (the BuckleyAmendment)
- The HEW regulations on Privacy Rights of Parents awl Students,which implement the Family Educational Rights and the.Privact Act of1974 (FERPA), provide for certain disclosures of personal information byschool districts, without prior,consent:
(a)' An educational agency or institution may disclose personallyidentifiable information from the education records of a
student without the written consent of the parent pfathe
stuqldent . . . if the disclosure'is:
As.
(6) To organizations conducting studies for, or on behalf ofeducational agencies or institution's for the purpose ofdeveloping, validating, or administering predictivetests, administering student aid programs, and improvinginstruction.
5,
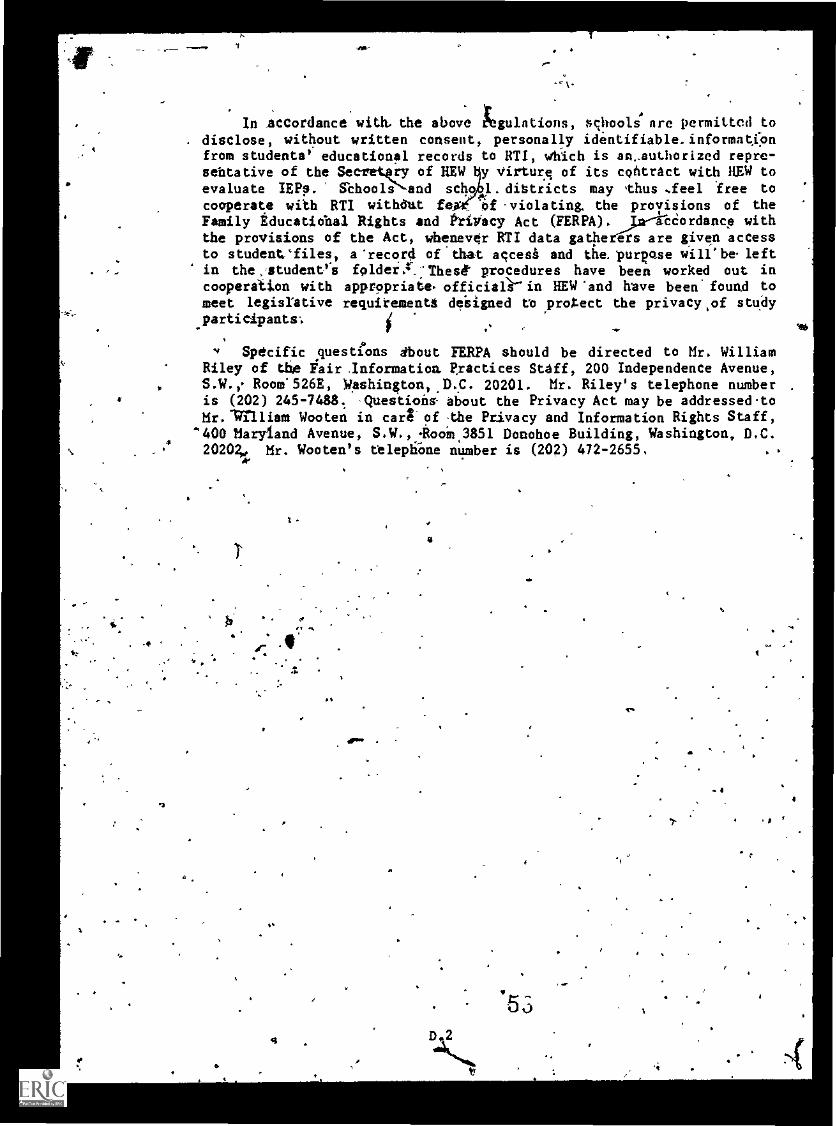
1
In Accordance with. the above kgulations, schools are permitted todisclose, without written consent, personally identifiable.informaqpnfrom studenta' educational records to RTI, which is ao_authorized repre-sehtative of the Seeretkry of HEW y Virture of its contract with HEW to
.11)
evaluate IEPp. Schools and schoel.dittricts may thus ,feel free tocooperate with RTI withdat fe', of violating, the provisions of theFamily Educational Rights and Privacy Act (FERPA). _Dt-liCordance withthe provisions of the Act, whenever RTI data gathers are given accessto student'files, a'recor0 of that aqcesi and the. purpose will'he leftin the , student''s folder.f.:Thest procedures have been worked out incooperation with appropriate. official'" in HEW'and have been.found tomeet legislative requitement* designed to protect the privacy,of study'participants;
,
v Specific .questions about FERPA should be directed to Mr. WilliamRiley of thA Fair. Information. Practices Staff, 200 Independence Avenue,S.W.,. Room.526E, Washington,.D.C. 20201. Mr. Riley's telephone numberis (202) 245-7488. Questions- about the Privacy Act may be addressedtoMr.Villiam Wooten in car; of-the Privacy and Information Rights Staff,
'400 Maryland Avenue, S.W.,:Rooi.3851 Donohoe Building, Washington, D.C.20202, Mr. Wooten's telephOne number is (202) 472-2655.
ry
t.
a
Ir.
4
l
r.

NKr'. INSTITUTE OF EDUCATION
ERIC
DATE FILMED


!['JNCLASSIF]ED - DTIC](https://static.fdokumen.com/doc/165x107/6323a138be5419ea700eb098/jnclassifed-dtic.jpg)