Maximal subgroups of the Coxeter group W(H4) and quaternions
Upload
khangminh22Category
view
1download
0
A Project Report on
Sustainable Integrated Watershed Management by using Remote sensing and GIS
Submitted in Partial fulfilment of requirement for the award of the degree of
MASTER OF TECHNOLOGY (Envlronmantal manrgament)
by Samat+ Kondamudi
Regd no,: MQSIDW37
Under the guidance of , ,, I : 1 l e e & h 4 . Dr.P.Vanbtuwerlu " Dr. S.P.Wnnl Asst. Professor Principal Scientist (Watersheds) Centre for environment and Regional Theme Coordinator Instltute of Post Graduate Studies ICRISAT and Research Patancheru, 502 324 Masab tank, Hyderabad-500028 Hyderabad-500028 Andhra Pradesh Andhra Pradesh
- Jawaharlal Nrhru Tachnological Unlvarslty
Instltute of Post Graduate Studies and Research Centre for Environment
Hyderabad-500028 Andhra Pradesh
India 3nn-2
ICRISAT CCIAR .- International Crops Research Institute for the Seml-Arid Tropics Rhnshw Hn 311
Andhrl Prldnh India
TO WHOlLlSOEVER IT MAY CONCEKN
r h ~ s I S 10 ccn~r) llial 111c project pork cnt~tlcd "Sustal~lahlc l~ l lcpr .~ lu l W.11crshcd \landgnnclit h? IISIII~ Rcn lo t csc~~s~~~g did GIS IS d ho~ialied uork o r M I K Ssl~dl l~a, Kcgd \o 0111311)311~. uhlch iia dul! conlpletcd h) lhcr r111dcr my gi~ldancu ds a pdrt or lhcr MASTER OF TECHNOLOGY in E~~r~ ronn icn~d l mandgcnicnl lo !he .leuharldl Nchm lcchnolog~c;il i Ill\crs1ly u d her irork m d efons x c apprcclaicd
,&A --- , /+' Suhrs P Urn1
CERTIFICATE
This IS to that the project entitled Sustainable Integrated
Watershed Management by uslng Remotesensing and GIS that 1s
bang submitted by K.Samatha, Regd no. 0103103137 during the year 2002-2003
In Partial fulfillment for the award of the degree MASTER OF TECHNOLOGY
in Environmental management to the Jawaharlal N e h ~ Technological
Un~verslty 1s a record of bonafide work camed out by her under our guidance and
supemslon
The results embodied in this thesis have not been submitted to any other
unlverslty or lnst~tutlon for the award of any degree or diploma
Plee*k-J.7-JJJ4 - Dr.P.Venbteswarlu Asst. Professor
~ Z i i . * a n i Prlnc~pal Scientist (Watersheds)
Centre for environment and Reg~onal Theme Coordinator Inst~tute of Post Graduate Stud~es lCRISAT and Research Patancheru, 502 324 Masab tank, Hyderabad-500028 Hyderabad-500028 Andhra Pradesh Andhra Pradesh
Acknowledgements
TO complete a task entrusted to a person, hdshe needs the overall support and
cooperaton of the people around hlrriher and thelr advises are of invaluable help The same
is the case w~th me and I take this opportunlly to thank each and every one wholeheartedly
who have directty or indirectly helped me in carrylng out this project.
On the very outset, I w~sh to place on record my deep sense of gratitude to
Dr.S.P.Wan1, Pnnclpal Scientist. GT-3, lntematlonal Crop Research lnst~tute for Semi-Arld
Crops (ICRISAT) for asstgning me thls project and for g~ving the requlslte specificat~ons. I
Immensely thank for hls guldance and continuous suggestions and feedback lhrough each
step of the project development \
It's my prevllage to express my deep sense of grat~tude to Dr.R.S.Dwivedi, Head.
Land degradat~on divis~on,Agriculture and Soils group, NRSA for his encouragement through
out the project I am also thankful to Dr.K.V. Ramana, Sclentlst 'E', Susta~nable agrlcullure
dlvls~on, NRSA.
I am also grateful to Dr. Rex Navrrao, LSU Head for accepling me as an apprentice.
I also express my grat~tude to Mr. lrshad Ahmed, Sctentilic omcer, ICRISAT, Mr. Molnuddln,
Associate(GIS), Dr. Ch. Ravlnder Reddy, Vtsitlng sclent~sl(Pathology), Dr.A.V.R.Kesava
Rao, V~sitlng scientist(Agr0 cl~matology), Y.Prabhakar Rao, Senlor Administrative Associate,
K.N.V. Satyanarayana, Senior Admtnistrat~ve Assoclate and M.Babu Rao, Senlor Research
Technician of GT-3, ICRISAT for the~r constant and tlmely help for project, whlch was help for
its successful completion.
I am also immensely thankful to Dr.P.Venkaleswarlu, Ass~stant Professor, Centre for
Environment, Institute of Postgraduate studies and Research, JNTU for his technical support
and guidance for the successful complet~on of lhe project.
I am also thankful to all the staff of Land and Water Management, GT-3, ICRISAT for
their co-operation in completing thls project successfully.
The project slte is one of the nucleus watersheds of the Andhra Pradesh Rural
Llvel~hwd Programme (APRLP)-ICRISAT project on 'Improving Rural liveli-hoods of
watershed people' funded by APRLP-DFID,U.K. The financial support for undertak~ng the
project work is greatety acknowledged. I gratefully acknowledge for the help of
Ms.T.N.Sreedev1. Addit~onal Project Coordinator. APRLP and Mr.S.P.Tucker. Project
Coord~nator, APRLP for providing necessary database.
I am also thankful for the tlmely help of Mr.T.P.Tlrnma Reddy, I.F.S., Project
Director, DWMA . Mahaboobnagar.
Last but not the least my heart felt gratitude and thanks to my parents, famlly
members and friends without whose unstained -peration and support, I would not have
completed this project
Srmaths kondrmudl
Abstract
The study deals with the sustainable management of Malleboinpalli
watershed, a part of drought prone area of Mahaboobnagar district using the
resource data base aquiring from IRS-1D PAN and LISS-Ill merged data,
drainage morphometry, hypsometry and the quantity of sediment yield and
socio-economic data from survey of the Malleboinaplli of this watershed. Base
map , contour map, slope map, drainage network and watershed boundary are
prepared from Survey of India toposheet. The remotely sensed data in the
form of geowded false colour compos~te of IRS -ID PAN and LISS-Ill satellite
sensing system, obtained from National Remote Sensing Agency is used to
prepare thematic maps of drainage network and watershed boundary, slope,
land usel land cover, geology, hydrogeomorphology, groundwater prospect, soil,
land capability and land irrigability and transport network and settlements and
village boundaries by using ARClGlS 8.1.2. The drainage morphometry
including hypsometric analysis is applied on the study area and derived the
erodability characteristics of the watershed. The acquiring of the erodability
characteristics from Hypsometric analysis is based on the contour map and
drainage map. The sediment yield is computed for the watershed by using
Gardens formula. An attempt is also made in this research work to study the
status of groundwater potentiel by the success of wells in contraction with slope
and hydrogeomorphology of the Malleboinpalli suffering from drought during
the summer season. This can be achieved by constructing the suggested water
harvesting structures for the augmentation groundwater potential. The
integrated study of all these leads to the preparation erosion intensity zone map.
Finally master action plan is prepared for both land and water resources
development by integrating all the theme maps in conjunction with the results
aquired from drainage morphometry, hypsomelly, sediment yield and socio-
economic data of the Malleboinpalli village.
COMPONENTS
ABSTRACT COMPONENTS LIST OF TABLES LlST OF FIGURES LIST OF IMAGES LlST OF PLATES
CHAPTER I - INTRODUCTION
General 1-2 Concept of Sustainable Integrated watershed 3 management Study objectives 3-4 Conceptual Framework of the Project 4 Study area Description 6% Database 8-9 Research approach 10-1 1 Organization of Thesis 11
CHAPTER-II - REVIEW OF LITERATURE
Introduction 12 Remotesensing applications in Watershed 12-19 Model Watershed Programme by ICRISAT-led 19-20 consortium Concepts of Remote sensing 20-24 Remotesemsing Advancm in Wateiahed 2527 Resource Mapplng In Watershed 27 Rde of GeoCraphic Information System(GiS) 27 Sail-Erosion- An Overview 34-39 Sediment Yeild 3943 Conservation Planning for Sedimentation in 43-49 Watershed
CHAPTER- Ill - Materials and Methodology
lntroductlon Preparation of Thematic Maps
Base map preparation Drainage network and Watershed boundary map Contour map Slope map Land uselLand cover map
Geology map Hydro geomorphology map Ground water prospect map Soil map Land capability map Land irrigability map Transportation network, Settlements and
Village boundar~es map
CHAPTER- IV - Results and discussions
Results of Thematic Mapping Drainage Morphometry lntroduction Morphometric elements Linear elements Areal elements Relief elements Hypsometric Analysis lntroduction Definition of Hypsometry Development of Hypsornetric Curve Evaluation of Hypsometric Curve Determination of stage of development of Watershed Sediment yield computation lntroductlon Vegetative Cover Factor Computation of Runoff
Rain fall Temperature
Estimation of Sediment Yield Integration and Generation of Action plan General Socioeconomic Data collection and Analysis

Ground Truth Survey Analysis General Survey Cultivation details Lively hood Analysis Trend Analysis Water Management
Integrated Approach Generation Of Action Plan
Step-1: Study of ind~vidual themes Step.2: Study of thematic maps in comb~nat~on Preparation of Erosion Intensily Map
Step:3 Development of decision rules for action Preparation of draft action plan
Water Resources Development Plan Land Resources Development Plan
Chapter - V - SumrnaryBConclusions
5.1 Summary 5.2 Conclusions
Chapter - VI - References
96-99 96 97 97-98 98 98-99 99-101 101-102 1031 27 103-108 108 109-110
plan 110-115 115 116-122 123-127
List of Tables
Decision 4.5.13 4.5.14 4.5.15 4.5.16 4.5.1 7 4.5.18
Sources and utility of data types IRS-10 PAN and LISS-Ill Imaging sensor characteristics Slope categories Land use1 Land cover Classification system Charecteristic features of Hydrogeomorhic units lnput data for the Hypsometry of watershed Swrces of Input data for estimat~on of sediment yield. Rainfall data of Malleboinpalli watershed.(1971- 2002) Temperature data of Malleboinpalli Watershed(l989-2002) Table showing of success of wells vls slope of Malleboinpalli watershed Table showing O h of success of wells vls Hydrogeomorphology of Malleboinpalli watershed Area statistics of Land use1 land cover map un~ts Area statistics of Sloping map units Area statistics of Hydrogeomwphology map units Area statistics of Groundwater potential Zones Area statistics of Soil map units Selection of soil and water conservation farm practices for land suited for cultivation (Class I to IV) Selection of soil and water conservation practices for land suited for Pasture and forest management (Class V to VII) Area statistics of Land capability classes Area statistics of Land irrigability classes Area statistics of Erosion intensity zones
rules for Land resources action plan Silvipasture Fodder and fuel Plantation Agroforestry Agro - Horticulture Intensive Agriculture Area statistics of suggested Land resource development actions
List of Images
IRS-1 D PAN Image
IRS-1D USS - Ill Image
IRS-ID PAN 6 LlSS - Ill merged image
List of Figures
Conceptual frame work of the Project
Caste wise distribution of Malleboinpalli watershed people
Rain fall variation since 30 years of Mallebolnpalli watershed
Temperature variation since 10 yean of Malleboinpalli watershed
Graph showing the relation between % of Success of wells vls sloping units
Graph showing the relation between % of success of wells vls H y d r o g m r p h l c units
Area distribution of Erosion intensity zoning
Area distribution of mapping units of various Themes
Area distribution of suggested land resource development action
List of Plates
Study area location map - map
Contour map
Slope map
Drainage network 6 Watershed boundary map
Land use1 Land cover map
Geology map
Hydro geomorphoiogy map
Soil map
Land capability mctp
Land irrlgabiiity map
Tdnsport network, settlememts and villager boundary map
Wells v k Hydrogeo~rph ic units
W l s vls Sloping unita
Ero8ion intensity zone map
Map showlng sltea for sol1 and water consewatlon Structums - -.lom+lm
1.1 General
Over exploitation of available natural resources for meeting the ever
increasing demand for food, fuel and fiber has led to serious environmental
degradation. Globally, an estimated 1,965 million ha of land is subjected to one
or other kind of degradation out of wh~ch soil erosion by water and wind
accounts for 1,904 million ha. In lndia alone, 6000 million tonnes of soil is lost
through erosion by water annually (Rao..2002). Altogether 175 million hectares
of vegetative land is degraded in some form or other (DST Report.,l990).
The estimated crop losses due to pests, flood and drought disasters
account more than 2000 million dollars every year. Based on statistics of over
170,000 borewells dug with the help of countrywide HydrogeomorphologicaI
maps, it has been observed that the success rate of finding water has gone
upto 92% compared to 45-50 percent using conventional methods(Rao.,2000). In
lndia drought is a resultant of deficient rainfall due to spatial and temporal
variations of monsoon. Drought conditions prevail whenever there is a
deficiency of 15-35 % of a normal rainfall. Generally about 100 to 160 districts
in lndia are affected by drought every year.The loss in terms of human sufferings
is unaccountable economic losses including crop losses reach upto 1500 crores
each year typically (Kondawar.. 2000).
Poverty and land degradation
"Poverty limits the oppodunities for protecting and enhancing the
environment because poor people have few options but to exploit the natural
resource base in order to attain food security, and sometimes even to survive.
Poverty also hinders effods to manage population growth because for poor
people, children represent additional sources of income. The way forward is
through sustainable and economic development, Aimed at broadly based poverty
alleviation" (CGIAR., 1994)
Watersheds are natural hydrologic entities that cover a specific arial extent
of land from which rainwater flows to a defined gully, river at any particular point.
Watershed is a planning unit for development of land and water resources. Soil,
water and vegetation are the most vital resources and a wide range of effect on
the lives of the people at large.Judicious and effective management of soil,
water and vegetation can ensure the sustained productivity of food, fuel, fodder,
forage, fiber, fruit and small timber.
Water resources delineation started with water resources regions (WRRs)
into basins, then to the catchments .These catchments are further delineated into
watersheds macro level and micro level basing on their size(Watershed Atlas.,
1990). In this present study main focus is towards sustaining natural resources
at village level micro-watershed a Nucleus watershed servlng as a benchmark
site in district.
Watershed management is the integration of technologies within the
natural boundaries of a drainage area for optimum development of land, water
and plant resources to meet the basic needs of people and animals in a
sustainable manner. Sustainable lntegrated watershed management is a pre-
requisite not only for land, water, and biomass management of degraded areas
but also for improving the livelihood of farmers as well as for conservation of
areas so that biodiversity is protected for future generations (Wan1.,2002)
The present study deals with Integration of socioewnomic database with
natural resource data which is a pre-requisite to prepare action plan keeping in
view the underlying concept of sustainability of Malleboinpalii watershed in
Mahaboobngar district. The available literature on various aspects of
Mahabwbnagar district drafted by earlier investigators revealed that area is
affected with degradation of natural resources, poverty and low crop yields.
1.2. Concept of sustainable integrated watershed management
Integrated area planning and management of any watershed
involved in developmental activities using the natural resources available in
accordance with socioeconomic conditions prevailing in that area for
sustainable development is referred as integrated sustainable watershed
management,
Naturally resources are generally land, it's related resources, surface and
subsurface water resources which could be managed sustainably
Socio-economic conditions namely demographic details, details of
cultivation and other infrastructure facilities affect the sustainable development
of natural resources. Sustainable utilization of natural resources is the driving
force behind the present planning process, since it is now widely accepted that
the future generations also have an equal claim over the use of finite
resources of the planet earth. In this context, the concept of "Sustainable
development", has gained importance. The essence of this concept is to maintain
development in a way that will not damage our environment and could fulfill the
demand of present and future generations also.
This project work aims at developing the action plan for these resources of
watershed using GIs and Remote sensing for meeting the needs of the people
through sustainable development.
1.3 Study objectives
For any developmental activities proper planning and management of the
watershed is a must. Keeping this in view an attempt is made at watershed scale
to prepare an action plan for sustainable development of land and water
resources by applying the Remote sensing and GIs techniques and related
conventional methods.
The specific objectives of the present investigation are
(1) To assess the socioeconomic profile alongwith the natural resource base
and climatic parameters.
(2) Preapare an action plan using satellite imageries and GIs for sustainable
management of natural resources in the Malleboinpalli watershed.
These are mainly based on
(1) Creation of spatial and non spatial data-base for the watershed area.
(2) Quantitative analysis of drainage basin.
(3) Estimation of sediment yield for the watenhed
(4) Hypsometty analysis for the determination of geomorphic stage of
development of the watenhed
(5) Identification of groundwater potential zones
(6) Integration of the information obtained from the analysis of satellite
data, results of hypsometry, quantity of sediment yield and socio-
economic conditions with in the watershed area.
(7). To promote the economic development of the village community,
which is directly or indirectly dependent on the watershed through
a. Optimum utilization of the watershed's natural resources like
land,Water, vegetation etc, that will mitigate the adverse effects of drought
and prevent further ecological degradation
b. Employment generation and development of the human and other
economy resources of the village in order to promote savings and
income generation activities.
(8) To suggest measures for the restoration of ecological balance in the
study area.
(9) To envisage plans to improve the economic and social conditions of the
resource poor and disadvantaged sections of the watershed community with due
consideration to social justice.
1.4 Conceptual frame work of the project
The study addressing the above issues needs elaborate data base on
natural resources, physicallterrain parameters , climate, contemporary
technology and socioeconomic profile of the study area. Analysis of the data
and integration of the same with contemporary technology will help in arriving
at the action plan for sustainable development. The conceptual frame work for
action plan preparation is given Figure N0: l . l
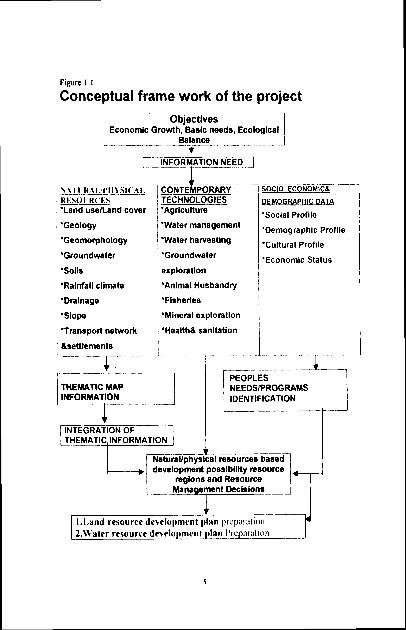
Figure I I
Conceptual frame work of the project - - - -- - - - - . -
Objectives Econorn~c Growth, Baslc needs, Ecological
Balance - _ - -- .- - t
'Geology
'Geornorphology
'Groundwater
'solis
'Rainfall climate
'Drainage
'Slope
'Transport network
&settlements - - 7 --
TECHNOLOGIES 'Agricultun
I 'Water management
I 'Water hamesting
'Groundwater
exploration
'Animal Husbandry
'Fisheries
'Mineral exploration
'Health& sanitation
+ , -_ -
THEMATIC MAP NEEDSIPROGRAMS INFORMP
-
\TION , 1 I I IDENTIFICATION
-- SOCIO ECONOMIC& - 'Soc~al Profile
'Demograph~c Profile
'Cultural Profile
'Economic Status
Management Declslonr
+ I.l.and resource de\eloprncnt plan prcp,ilal!oli 2.Hilter resource tloeloprnent plan I'~el)nralti~~l
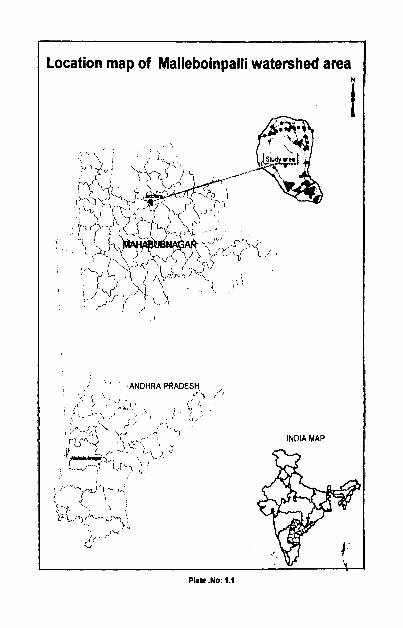
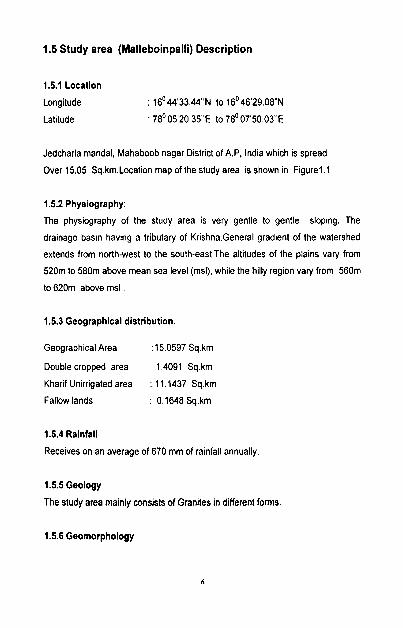
1.5 Study area (Malleboinpalli) Description
1.5.1 Location
Longitude : 16~44'33.44"~ to 16~46'29.08"~
Latitude : 78°05'20.35"~ to 78' 07'50.03"E
Jedcharla mandal, Mahaboob nagar District of A.P, India which is spread
Over 15.05 Sq.km.Location map of the study area is shown in Figurel.1
1.5.2 Physiography:
The physiography of the study area is very gentle to gentle sloping. The
drainage basin having a tributary of Krishna.General gradient of the watershed
extends from north-west to the south-east.The altitudes of the plains vary from
520m to 580m above mean sea level (msl), while the hilly region vary from 560m
to 620m above msl
1.5.3 Geographical distribution.
Geographical Area :15.0597 Sq.km
Double cropped area : 1.4091 Sq.km
Kharif Unirrigated area : 11.1437 Sq.km
Fallow lands : 0.1648 Sq.km
1.5.4 Rainfall
Receives on an average of 670 mm of rainfall annually
1.5.5 Geology
The study area mainly consists of Granites in different forms.
1.5.6 Geomorphology
The geomorphic evolution of an area is the result of interaction between
the different elements like lithology, structure,climate etc involved in the various
endogenic and exogenic processes operating from time to time.The study area
is mainly covered by different geomorphic units such as Pediplains, Pediplain
with shallow and moderate weathering, inselberg etc.
1.5.7 Demography
Study area comprises of Mallebo~npalli panchayat. Esaikunta tanda and
Nakkalabanda tanda,
1.5.8 Cropping pattern
Farmers diversify their cropping pattern through number of crops grown in
the two seasons main rainy season(kharif), post rainy season (rabi). These are
rice, sorghum, maize, castor are main crops along with these cotton, plgeon pea,
millet, horse gram, sunflower and vegetables are also cultivated in few
hectares.
1.5.9 Farmers categorization
The total households are of 539,Farmers are classified into 382 small land
holding farmers, 85 medium land holding farmers, 52 large land holding farmers.
1.5.10 Pedology
Soils in the Malleboinpallli watershed predominantly consists of red
clay loam soils, red sandy soils, saline and alkaline soils and light black soils
having the fertility varying from good to poor.
1.5.11 Geomorphlc characteristics
The geomorphic characteristics of a watershed significantly effect the
entire hydrologic cycle, which includes total run off volume, peak run off rate,
runoff duration and other hydrologic parameters. Geomorphologic analysis is
the systematic description of the watershed geometry and its stream channel
to measure the linear aspects of drainage network, Arial aspects of
dmhege basin and relief aspect of channel network are discussed in the
chapter Drainage Morphometry of results and discussions
1.5.12 Streams and water bodies
Wetershed consists of two streamlets one flowing from north to south and
another flowing from north east to south direction. Along the stream path there
are 7 tanks as follows
Naganna kunta
Singayya kunta
Nallakunta
Rekulakunta
Komanu kunta
Papanna kunta
All these for the purpose of irrigation
Ura kunta in village for domestic purpose
1.5.13 Transport network
Through the study area two state highways are passing from Hyderabad
to Kurnool and Mahaboobnagar. One railway broad guage is also passing from
Secunderabad to Kurnool
1.6 Data base
Four types of data mainly used remotesensing data, topographical data,
socioeconomic data and climatological data are used. The data sources are
detailed in the table No: 1.1
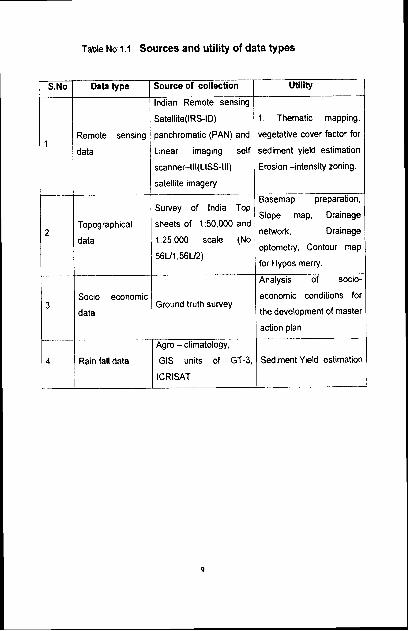
Table N0: l . l Sources and utility of data types
Topographical
data
-- .
x U r v e y of India Top' Slope map, Drainage
sheets of 1:50,000 and network, Drainage
1:25,000 scale (No optometry, Contour map
56U1,56U2) for Hypos merry.
Utility
1. Thematic mapping,
vegetative cover factor for
sediment yield estimation
Erosion -intensity zoning.
Socio economic economic conditions for 3 Ground truth suwey
the development of master
Source o f collection
Indian Remote sensing
Satellite(lRS-ID)
panchromatic (PAN) and
Linear imaging self
scanner-III(LISS-Ill)
satellite imagery
S.No
1
Data type
Remote sensing
data
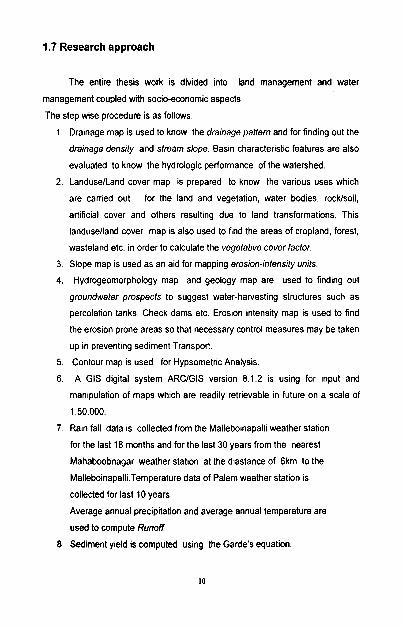
1.7 Research approach
The entire thesis work is divided into land management and water
management coupled with socioeconomic aspects
The step wise procedure is as follows.
1. Drainage map is used to know the drainage pattern and for finding out the
drainage density and stream slope. Basin characteristic features are also
evaluated to know the hydrologic performance of the watershed.
2 . LanduselLand cover map is prepared to know the various uses which
are carried out for the land and vegetation, water bodies, rocklsoil,
artificial cover and others resulting due to land transformations. This
landuselland cover map is also used to find the areas of cropland, forest,
wasteland etc, in order to calculate the vegetative cover factor.
3. Slope map is used as an aid for mapping erosion-intensity units.
4 . Hydrogeomorphology map and geology map are used to finding out
groundwater prospects to suggest water-harvesting structures such as
percolation tanks, Check dams etc. Erosion intensity map is used to find
the erosion prone areas so that necessaly control measures may be taken
up in preventing sediment Transport.
5. Contour map is used for Hypsometric Analysis.
6. A GIs digital system ARClGlS version 8.1.2 is using for input and
manipulation of maps which are readily retrievable in future on a scale of
1 :50,000.
7. Rain fall data is collected from the Malleboinapalli weather station
for the last 18 months and for the last 30 years from the nearest
Mahaboobnagar weather station at the diastance of 6km to the
Malleboinapalli.Temperature data of Palem weather station is
collected for last 10 years
Average annual precipitation and average annual temperature are
used to compute Runoff
8. Sediment yield is computed using the Garde's equation.
9. Well data is used to prepare the graphs for % of success of wells in
different slope categories and in different geomorphological units.
10. All the required socio economic dataand de collected household GPS
survey is conducted to collect the data from each and every family.
11.Socio-economic data on integrat~on with resource is used as an aid in
preparation of action plan for land and water resources development
1.8 Organization of thesis
The present thesis is organized into six chapters .in the chapter4
Introduction, the concept of sustainability, objectives of the study and research
approach discussed here. In chapter-ll - Review of Literature: concepts and
advances of Remote sensing and GIs , soil erosion, run off estimation,
sed~ment yield computation using remote sensing and GIs, Soil conservation
measures are discussed. Preparation of Thematic maps is discussed in Chapter-
Ill- Materials and Methodology. In chapter-lV Results and discussions, Results
of thematic mapplng, Drainage morphometry, Hypsometnc analysis, Sediment
yield computation, Integralion of Themes, Preparation of erosion intensity zoning
map and Generation of action plan. Chapter-V deals about the Summary and
conclusions . Finally in the chapter- VI - References are given.
Literature
2.1 Introduction
The watershed development approach in lndia was first adopted in 1974
when the Govt, of lndia enforced the scheme for 'Soil Conservation in the
watershed of river valley projects". In 1982 Govt of lndia launched another
ambitious programme for the development of dryland Agriculture on watershed
basis under which 47 Model watersheds were identified under different Agro-
climatic zones all over the country.
The acceptance of watershed as a natural hydrologic unit for multi-
resources development planning stems from the fact that sustainability of
development based on soil and land use depends on their interaction with
water in all the activities that takes place through out the watershed. Soil, water
and land use constitute natural resource base vital for human sustenance. All
forms of life derive their nutritional and other needs from the soils or soil based
other life supporting systems. The unique assemblage of soil together with water
and other resources determine developmental potential of an area Iregion.
In this chapter review of literature available from the previous work done
on Integrated watershed management, soil erosion intensity zones, computation
of run off, estimation of sediment yield and delineation of groundwater potential
zones by using Remote sensing and GIS and concepts of Remote sensing,
GIS, Soil erosion and Soil conservation measures are discussed.
2.1. Remotesensing and GIs applications in watershed.
Krishna(l996) in his case study of "Remote sensing Approach for
Watershed-based Resources Management in the Sikkim Himalaya" discussed
the usefulness of remotely sensed data for watershed management .In these
biophysical conditions were assessed based on field experience. Land uselland
cover categories, soil-physiographic unit's identified from the satellite imagery.
Analysis of micro-climatic variations, cropping pattern and associated parameters
for the preparation of action plan. Considering the socio-ewnomic needs and
owironmental conservation two tier land resource management approach is
PW0-j.
Vanna et a1.,(1998) conducted 'Integrated resource study for conservation
and menegement for Ropar wetland ecosystem". It was undertaken to analyze
physiographic, drainage, land use, and vegetation status. Various thematic maps
have been prepared using black and white aerial photographs on 1:20,000
scale and IRS-IA LISS-II False Color Composite(FCC) on 1:50,000 scale. The
water spread and qualitative turbidity level is also monitored. Keeping in view
threats of the notified area as anthropogenic pressure, industrial pollution,
sedimentation, eutrophication, illegal fishing and flooding, etc. conservation
measures were suggested.
Nag(1998) carried out "Morphomelric analysis using remote sensing
techniques in the drought affected Chakra-river basin of West Bengal': Using
satellite imageries of LANDSAT and IRS, different hydrogeomorphological units
have been delineated. Drainage details have been prepared from toposheet
and satellite imagery. The parameters worked out here included bifurcation
ratio(Rb), stream length (Lu), form factor (Rf), circulatory ratio (Rc) and drainage
density This morphometric analysis suggests that the area is covered by
fractured, resistant , permeable rocks, the drainage network not so affected by
tectonic disturbances.
Hana(1998) applied "Directional Wering in lineament Mapping for
groundwater prospecting around Bhinmal -a semi arid part of Thar desert': The
application of Directional filtering procedures on IRS LlSS I bands 4 digital
image of the study area revealed NE-SW. NW-SE and E-W trending lineaments
which are very subtle. The use of exploratory borehole litho logs and field
evidences indicated that the lineaments are long rectilinear buried and partly
exposed channels and the intersection zones are characterized by thick lenses
of coarse sand and gravel. These buried channels and zones of coarse
wdnmb h m represent potential sites for the accumulation of freshwater
during mill.
Kumar and Tomar(1998) studied 'Groundwater assessment through
h ~ I o g i c a 1 and geophysical survey- A case study in Godavan Sub
watershed, Giridih,Bihaf. In this remotely sensed data has been further sub-
divided based on the tone, texture and pattern. These units were analyzed by
eledrlcel resistivity method. Correlation between different sub-units, hydro
g m r p h k unit and top soil resistivity were attempted. The correlation and
integration of resistivity map with geomorphologic map were carried out through
'GRAM' Geographic Information system. This has helped in better
understanding the surface resistivity pattern. These sub divisions were different
geohydmlogical and recharge characteristics.Resistivity zonation map prepared
on the basis of limited field data and through interpolation /extrapolation can
be modifled I corrected with the help of information derived from remotely
sensed data to obtain more realistic picture.
Biswas et a1.,(1999) worked on "Prioritization of sub watersheds based
on morphometric analysis of drainage basin by using remote sensing and GIS
fw Nayagram block Midnapore district ". They studied rnorphometric pararneters-
stream length, bifurcation ratio, drainage density, stream frequency, texture ratio,
form factor, circulatory ratio, and elongation ratio, estimation of sediment yield by
Sediment yield index (SYI) method and prioritized all the sub watersheds under
study area
Pal (2000) studied on "Evaluation of water discharge and sediment
budget in the lesser Himalaya: Based on the morphometric and drainage
analysis, the water discharge, suspended load yield and rainfall has been
computed. Automatic water stage recorder with horizontal axes (float types)
equipment being used for water discharge during rainy season. The water
samples collected during peak runoff were analyzed to evaluate sediment
y#d daily. Drainage pattern in three catchments was mapped through the
interpretation of aerial photographs. ARer detailed analysis of the above factors
conduded that most of the suspended load was transported between June and
September and during rest of the months the concentration of sediment load
was close to zero.
Pratap et a1.,(2000) studied on "Groundwater prospect zoning using
remote sensing and GIS in Dala-renukoot Area.Uttar Pradesh". Thematic maps
in respect of geology, geomorphology, slope, drainage, land uselland cover,
lineament and lineament intersection frequency were prepared on 1:50,000
imagery by remote sensing and GIs. Each theme was assigned a weightage
depending on its influence on the movement and storage of groundwater and
each unit in every theme map is assigned a knowledge based ranking from 1
to 5 depending on its significance of groundwater occurrence.
Subbarao et a1.,(2001) studied in the ~dentification of groundwater
potential zones using Remote sensing techniques in and around Guntur Town,
Andhra Pradesh. Identified units and features by remote sensing technology
with the integrat~on of conventional information and limited ground truths are
shallow weathered Pedi plain(PPS), moderately weathered Pedi plain(PPM),
deeply weathered Pedi plain(PPD), residual hi~ls(RH), and lineaments The
results show that the PPD, PPM, PPS are good, good to moderate, moderate to
poor promising zones respectively. The RH is a poor geomorphologic unit in
respect to prospective zone as groundwater resource. Lineaments parallel to the
stream courses and intersecting-lineaments are favorable indicators for
groundwater development. They can also be utilized to augment groundwater
resource.
Sarkar et a1.,(2001) studied on "A geographic Infomation system
approach to evaluation of groundwater potentiality of Shamri micro-watershed
6, the Shimla taluk, Himachal pmdesh: The role of various parameters namely,
dminage, lineaments, lithology, slope and landuse have been emphasized for
delineation of groundwater potential zones. IRS-1C PAN and LlSS -111 FCC
merged satellite image on 1:25,000 scale and topographic maps together with
Reld traverses have been used as data source. A multi criteria evaluation
following probability weighted approach has been applied for overlay analysis
that allows a linear combination of weights of each thematic map with the
individual capability value. The resultant map indicates a high groundwater
potentiality in the flood plains, river terraces and river channels I the vicinity of
the Shamri nala.0ther sites of high potentiality include places showing break in
slopes and criss- crossing of l~neaments
Carios et a1.,(2001) used "Remote sensing data, GIs and Universal Soil
loss Equation (USLEJ model for developing maps of erosion risk in Pimcicaba
river besin, south eastern BmzA". Soil erosion losses were s~mulated with the
GIs-USLE technique for January 1978-1993.A series of thematic maps (one for
each equation factor) are created processed and analyzed using Arc-InfolGIS.
Basing on this erosion risk zonation is mapped. Soil and water conservation
practices are developed, especially for the areas of heightened erosion risk
identified
Chakrabarthy and Datta(2001) observed the indicators of land use of
watershed in arid region, Western Rajasthan using remote sensing and GIs.
Finally concluded that there is marginal improvement or land uselland cover and
vegetation vigor or biomass deteriorated over the years.
Durbude and Purandara(2001) in their case study of "Estimation of
surface funoff potential of a watershed in semi arid environment" analyzed the
study area using IRS-IB LISS-II satellite imagery for estimating the runoff
potential under geomorphic set-up. After the analysis of satellite imagery
topographical maps, ground truth data verification and runoff calculation by
SCS method, different water harvesting as well as storage structures are
proposed and the future scope for irrigation on full water irrigation are
dculated. Check dams, lift irrigation systems and storage tanks are proposed.
Wani et a1.,(2002) conducted a study on 'Spatial distribution Rainy season
Falbws in Madhya pradesh: Potential for increasing Productivity and minimizing
land degradation". It's a deductive approach including delineation of agricultural
land and forests from temporal satellite data was employed to identify kharif
fellow. Three sets of satellite data correspondin to three periods, namely mid-
kharif, late kharif, and rabi season were used. Finally it was estimated that 2.02
million ha accounting for 6.57% of the total area of the state were under
fallowing. Madhya pradesh is endowed with well distributed rains ranging from
700-1200mm. Vertisols w~th good moisture holding capacity can be used to
grow short duration soyabean by adopting sound land management
practices.This will help Increase income to the farmers besides preventing land
degradation due to runoff erosion.
Tripati and Panda(2002) conducted a study for the Nagwan watershed of
the Damodar valley Corporation, Bihar to prepare Runoff modeling. GIS is used
to extract the hydrologic parameters of the watershed from the remote sensing
and field data. DEM (Digital elevation model) for the preparation of Contour map
and EasilPace GIS software was used to extract the topographic features and
to delineate watershed and overland flow patns from the DEM. Land use
classification generated from data of Remote Sensing Satellite (IRS- IB and
LISS-11). Drainage characteristics derived from toposheet and relief of study area.
Hypsometric analysis procedure is used to determine the geomorphic stage of
development of watershed. Data extracted from all these is used in the
preparation empirical model for the surface runoff prediction. This is helpful in the
designing of conservation structures and evaluating the effect on these
structures.
Mohan and Dilip(2002) studied on 'Estimation the soil erosion potential
using Universal soil loss equation for the catchment in Yelberg of Kametaka: In
to automize the estimation of USLE parameters, a geographical
inlkmatkn system Integrated land and Water Information systems was used.
by this method annual and seasonal soil erosion rates were estimated for the
audy area. The gentle sloping topography and the soil types resulted in low
erosion rates from major portion of the watershed. Erosion potential map and rain
fall station point map is used for calculating erosion from rain fall events of
particular interest. This is useful in the evaluation of various types of
management and surface practices.
Srinivas et a1.,(2002) studied on "Assessment of soil erosion using
remote sensing and GIs in Nagapur distnct, Maharastra for prioritization and
delineation of conservation units': The rate of soil loss 1s estimated by USLE
method is helpful to evaluate the influence of different land cover and sol
management factors in quantitative estimations of soil loss of the district. The
physical and chemical data of different soil series of Nagpur district are used for
the estimation of soil erodability. Implementation of Universal Soil Loss Equation
using integration procedures of GIS enabled the prediction of potential and actual
conditions respectively. Nine units with unique combinations of soil erosion and
site characteristics are identified for conservation using multi criteria analysis in
GIs. Suitable agronomic and mechanical measures are suggested for soil
conservation based on the above characteristics in each unit.
Mani et a1,(2003) studied on 'Erosion study of aparl of Mahuji river-
Island using Remote sensing data': In this study Image processing of digital data
has been done in lLWlS software. Supervised for delineation of river from land
and then image change detection analysis has been done to find out changes
in river course from 1991 to 1997 and further from 1997 to 1998. Erosion and
deposition maps of the area have been prepared and the erosion of island is
measured at various sections at 1 km interval. Erosion of 1900 ha has been
ObSe~ed during the period of six years.
2.3 Mode4 Watershed Programme by ICRISAT Consortium
Adamha wrtenhed, Kottapalli, Rangareddy district, Andhra pndesh
Eelbe giving the focus on this Nucleus watershed Maleboinpalli ICRiSAT-
led consortium which is to provide technical backstopping to The United
Kingdom's Department for International Development (DFID)-Andhra Pradesh
Rural livelihoods Programme (APRLP) to scale up the benefits of holistic
watershed management approach through convergence for improving the
livelihoods of the rural poor, had developed and evaluated an innovative farmer
par\icipatot-y consortium model for watershed management in Kothapalli
watershed to achieve sustainable development.(Wani, et a1.,(2001)(2002))
A participatory watershed research at Kothapalli having an area of 465 ha
was taken in the ICRISAT-led consortium of watershed committee which involves
farmers, NGOs. Women's Self Help Groups(SHGs). Drought Prone Area
Pmgramming(DPAP), Central research Institute for Dryland Agriculture(CRIDA),
National Remote sensing agency (NRSA) and National Agricultural Research
System members(NARS)
The major outputs of the programme are
(1)lmproved natural resources management options evaluated and refined in
farmer fields
(2) Evaluated suitable cropping systems based in the agro ecological potential of
the region.
(3) Increased system productivity through adoption of improved soil, water,
nutrient and pest management technologies
(4) Better land treatment
A major part of the land treated with various soil 8 water conservation
measures yielded promising results. Among these the impact of check dams,
wnken pits are significant.
(5) Farmers experienced improved groundwater level in their wells through
b e a s e d recharge using hamest. In the watershed runoff soil loss
measurements are recorded using automatic hydrological gauzing stations.
(6) V- an eco-friendly technology is suggested for them to improve
availeb#ity of n u M rich compost and for providing employment opportunities.
(7) Incmawd the awareness of the People about the alternative lively-hood
o p h . (8) Inueamd cropping intensity & introduction of new crops.
With the availability of irrigation water, fertile soil, improved quality of
seed& fertilize, a major extent of land has been brought into double cropping
there by inmasing the intensity of crop.
(9) The various land treatment measures adopted for run off control have helped
in the rise of groundwater table. The area under well irr~gation boosted up by 2-3
fold.
(10) Increased productivity of crops
The use of improved seed, fertilizer, plant protection measures, t~mely
operations and soil and water conservation has boosted the productivity of
different crops.
2.4.Concepts of Remote sensing and GIs
2.4.1 lnboductlon
Watershed management requires exhaustive data and information, which
are dynamic in nature and temporally change over time &space due to natural &
external influences an agro-climatic environment. Using conventional methods, it
becomes highly difficult to collect the data from remote and inaccessible areas.
More over the collected data are often inadequate, out dated and time
consuming besides being more expensive. By the time one planning process is
completed based on a set of information, the regime of watershed undergoes
drastic changes rendering the plan worthless. Under these circumstances, more
emphasis is required to be given to develop watershed models, which can
quickly analyze the changing parameters. Remote sensing technology has
h e n s e contribution towards this in providing synoptic and unbiased information
on large areas at periodic intervals.
The technology of remote sensing has developed most rapidly when people
perceived the need to strike the appropriate balance between resource
development and environmental preservation. Today remote sensing affords a
practical means for frequent and accurate monitoring of the earth's resources
globally. The remote sensing data have been providing information necessary for
making sound decisions and policy formulations in a host of resource
development and land-use applications. The other areas of remote sensing
applications like locating forest fires, monitoring population growth and
distribution, detecting diseased crops, geological investigations, determining
location and extent of water pollutants, oil spill, ice bergs etc., have benefited
the mankind.
There are two basic processes involved in electromagnetic Remote
Sens~ng of earth resources which are data acqu~sit~on and data analysis.
A Remote Sensing System using electromagnetic radiation has four
components
1 .Source:
The source of electromagnetic radiation may be natural like the Sun's
reflected light or the Earth's emitted heat on man-made microwave radar.
2.Earth's surface interactions:
The amount of characteristics of radiation emitted or reflected from the
earth's surface is dependent upon the characteristics of the objects on the earth's
surface.
3.Atmospheric interaction:
Electromagnetic energy passing through atmosphere is distorted and
scattered.
4.Sensors:
The electromagnetic radiation that has interacted with the surface of the
earth and the atmosphere is recorded by a sensor.
Remote sensing provides a reliable base for generating information on
natural resources(Rao.,2002). The information on nature, extent, spatial
distribution, and potential and limitations of natural resources is a pre-requisite
for planning the strategy for sustainable development .In addition socio-
economic and meteorological and other related ancillary information is also
required while recommending area specific prescriptions for taking up curative
or preventive measures. By virtue of synoptic view of the study area at regular
interval, space borne multi-spectral data have been used for generating base
line information on mineral resources, soils, groundwater and surface water,
land use1 land cover, forest etc. At scales ranging from regional to micro level.
Beginning with the Landsat -MSS data with 60x80 m spatial resolutions
and four spectral bands spanning from green to near infrared In early 1970s'
the natural resources scientists had access to Landsat-(Thematic mapper )TM
data with a 30m spatial resolution and seven spectral bands spread over
between blue and thermal infrared region of the electromagnetic spectrum in
early 1980s which helped further refinement and generation of thematic
information at large scale.
Further development in the sensor technology indigenously resulted in the
launch of the state-of-the-art satell~te (IRS-IC) in December, 1995 and IRS-ID
later with the following three unique sensors.
I. W~de field sensor (W~fs) with 188 spatial, two spectral bands red and near
infrared, 180 km swath and a repet~tivity of 5 days.
II. Linear Imaging Self scanning sensor (LISS-Ill) with 23.5m spatial resolution
in the green red and near infrared region, and 70.5 in the middle infrared region
and, 140km swath.
III.Panchromatic (PAN) camera with 5.8m spatial resolution, 70km swath and
stereo capability
Imaging sensor characteristics of the IRS-ID PAN and LISS-Ill are given in the
table 2.1
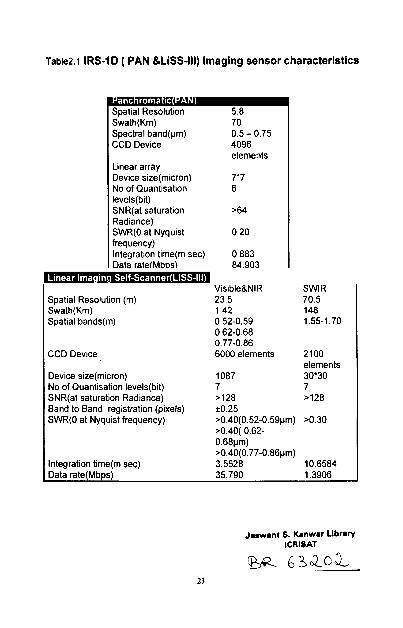
Table2.1 IRS-ID ( PAN &LiSS-Ill) Imaging sensor characteristics
Swath(Km) Spectral band(pm) CCD Device
Linear array Device size(micron) No of Quantisation levels(bit) SNR(at saturation Radiance) SWR(0 at Nyquist frequency) lntegration time(m sec) Data ratefMb~sl
70 0.5 - 0.75 4096 elements
Spatial Resolution (in) 23.5 70.5 Swath(Km) 1.42 148 Spatial bands(m) 0.52-0.59 1.55-1.70
0.62-0.68 0.77-0.86
CCD Device 6000 elements 21 00 elements
Device size(micron) 1087 30'30 No of Quantisation levels(bit) 7 7 SNR(at saturation Radiance) 2128 >I28 Band to Band registration (pixels) 20.25 SWR(0 at Nyquist frequency) >0.40(0.52-0.59pm) >0.30
>0.40( 0.62- 0.68pm) >0.40(0.77-0.86pm)
Integration time(m sec) 3.5528 10.6584 Data rate(Mbps) 35.790 1.3906
Jamant S. Kanwar Llbrary ICRISAT
For visual interpretation the standard false color composite (FCC) prints
generated from green, red and near infrared bands have been used. How ever
special products with varying combination of spectral bands have also been tried
out for specific applications.
Integration of information on natural resources, socio-economic, climatic
conditions and other related ancillary information in a holistic manner for
preparing localtion speclfic intewentlon for a given area is very crucial.
2.4.2 Basic Elements of Visual Interpretation
The satellite imagery of IRS-ID PAN and LISS-Ill merged image is visually
interpreted using SIX basic elements of image interpretation namely
1. Tonelcolor
2. Texture
3. Shape
4. Size
5. Pattern
6. Association.
Due to the effect of no terrain related factors, image interpretation is based
on relative tonal values rather than absolute tonal values. Tone or hue refers to
the relative brightness of color of objects on an image. Texture, which shows the
frequency of tonal change, is produced by the overall reflectance of the
constituents of the object. It determines the smoothness or roughness of the
object. Shape is an indicator of boundary geometry. Size of an object is a
functional scale of the image. Pattern refers to the alignment and spatial
dispersion of objects. Association is a parameter that defines the occurrence of
certain features in relation to others.
?&.Remote sensing advances in watershed
The various applications of remote sensing in watershed management are
described here
2.5.1 Surface water Inventories
High resolution and near infrared sensors such as those on IRS and
LANDSAT can be used to measure the extent of surface water because of
strong near infrared contacts between water and adjacent land .Numerous
rssults from these satellite studies indicate the water bodies as small as
0.Olsq.km that can be delineated with ease. This makes the monitoring of
surface water using repetitive remote sensing data feasible, even on small
Inaccessible watersheds
2.5.2 Flood Assessment and Plain mapping
IRSILANDSAT data are the most pertinent kinds of satellite information
for flood observations because of relatively high resolution cartographic
fidelity.and the near infrared sensors Areas inundated are detected in the
near infrared bands as areas of reduced reflectivity due to standing water,
excessive so11 moisture and vegetation moisture stress. Most important is the
fact that observations as late as two weeks after the flood crest will still show
the characteristic reduced near infrared reflectivity of the previously
inundated areas, which essentially reduces the need for obtaining satellite
observations at the time of peak flooding. Other investigations have shown
that areas likely to be flooded, known as flood prone areas, tend to have
multispectral signatures which are at times different than the signatures of
surrounding non flood prone areas.
2.5.3 Snow Mapping
The extraction of snow covered area from satellites using visible and near
Infrared imagery has been tested successfully. The extraction of snow covered
area from satellites using visible and near infrared imagery has been tested
wccedulty. The extraction of other more meaningful snow pack parameters
wch 86 water equivalent and depth is still in research stage, although water
equivdsnt values obtained by measuring the snow's attenuation of natural
gamma radiation from extremely low altitude aircraft have been very
promidno.
2.6.4 Hydrologic Land use Analysis
Knowledge of watershed land use is important because a record of
su- cover characteristics can be used to refine estimates of the quantity,
quality and timing of water yield in response to a particular precipitation event
or watershed treatment. Various watershed models require up-to-date land
use inputs for callbration purposes and hence, better stream flow simulations.
These land use requirements can be met by varlous levels of sensing data.
2.6.6 Physiographic Characterization
Physiographic observations such as basin area and shape ,stream
network organization, drainage density and pattern and specific channel
characteristics can enable an investigator to estimate the mean annual
discharge and mean annual flood flows from a watershed, as well as the
rapidity of watershed response to a particular rainfall event. In general the
kind of dynamic hydrologic information available from the respective coverage
d satellite images cannot be obtained from topographic maps. Further, in
same areas single satellite images offer more geographic information than
b available on comparable scale map.
2.6.6 Watershed models
Much of the information capable of being extracted with the Remote
wnsing approaches mentioned previously can be used in the calibration or
operation of numerical watershed models, especially in data sparse regions
.the suitable data include land use classification, stream channel and other
physiographic parameter consists of a combination of specific land uses
induding urban development, streets. Parking lots, roof tops and construction
rite. IRSilANDSAT gives automatic classification of impervious area and the
agreement with the conventional method was excellent.
2.6 Resource mapping in watershed
Remote sensing technique in evolving characteristics of the watershed
has demonstrated that this medium is very useful in providing applicable
hydrological information in spatial and temporal scale. The synoptic coverage of
satellite imagery permits fairly easy identification of basin extent, and broad
physical features such as stream network, land use, vegetation, surface water
bod~es, etc. Hydrologists and water resources engineers were long
handicapped with reliable survey data of mapping of watershed
characteristics. Satellite remote sensing now enables easy, accurate , time
and cost effective mapping and updating of several resources information of
the watershed such as stream network map, land uselland cover map, soil map,
land irr~tability map, land capability map, erosion intensity map, hydro
geomorphology map, groundwater prospect map etc. These maps and
information can be geo referenced with conventionally measured topographic
maps through Geographic lnformation system (GIs) for meaningful synthesis of
the watershed.
2.7.Role of Geographic lnformation Systems (GIs)
2.7.1 Introduction
Over the past two decades it has become increasingly apparent that
resources are becoming more scarce, the effect of human activities more
pervasive and the recognition and the prediction of causes and effects more
Complex. It has also been recognized that better resource assessment and
planning methods yield direct benefits in improved resource management and
ultimateiy in improved quality of life. Georeferenced information has always been
aiticsl to ths welfare of the country, it is the technology and methods such as
cun$uW b n d information systems and remote sensing that can provide the
means b prepare resource inventory and model process from the local to global
scab. h need for a computer based information system that efficient handling
analy8is of geo referenced data has evolved Geographical Information System
(GIs). The GIs is collection of computer hardware, software, experienced
personnel for input management data storage and retrieval, manipulation and
output of geo graphically referenced data and the corresponding attributes. A
GIs b generally designed for the collection, storage and analysis of objects and
phenomenon where geo graphical location is an ~mportant characteristics or
critical to the analysis. In other words a GIs may be defined as computer based
information system which attempts capture, store, manipulate, analysis, and
display spatially referenced and associated tabular attribute data, for handling
e W n t research, planning and management problems. Such as system will
normally embody.
* A database of spatially referenced data consisting of location and
assodated tabular database.
GIs provides an ideal environment for integration of information on
r~atural resources and ancillary information and generation of action plan taking
into account social, cultural, and economic needs of the people(Rao.D.P.,
2003).
*Appropriate software components encompassing procedures for
inbmlated transactions from input via storage and retrieval, and the adhering
menipulatin and spatial analysis facilities to output (including specialized
abwiihms for special analysis and specialized computer languages for special
qumies) and associated hardware components including high-resolution graphics
dhphy, large capacity electronic storage devices which are organized and
htdud in M efficient and effective manner to allow rapid data storage ,
rotfbval and management capabilities and facilitate the analysis.
2.7.2 Components of GIS
A GIS maybe considered as a subsystem of an information system which
it self has Rve major component subsystems including:
a Data input processing
Data storage, retrieval and database management
a Data manipulation and analysis.
Dbplay and product generation
A user interface
These main components are summarized in data input which covers all
aspacts of transforming spatial and non-spatial (textural or feature attribute)
information from both printing and digital files into a GIs database. To capture
spatially referenced data effectively, a geographical information system should
be able to provide alternative methods of data entry These usually include
diilizing (both manual and automatic), satellite images, and scanning and
keyboard entry. The data may come from many sources such as existing
analogue maps, aerial photographs, and remote sensing surveys and other
information systems. Often the data require operations of manual or automated
processing prior to encoding, including format conversion, data reduction and
generation of data, error detection and editing, merging of points into lines, edge
matching, rectification, registration and interpolation etc. The level of
measurement of these data may vely and range from categorical to ratio data
end from fuzzy and stochastic information to precisely measured data.
Database management functions control the creation of and access to the
b b b a s e 1 self For the storage, integration and manipulation of large volumes of
dWkrent data types at a variety of spatial scales and levels of resolution, a GIs
has to provide the facilities available with in a Database Management System
(DBMS). Most commercial GIs (such as, for example: ARCIINFO) have a dual
architecture. The non-spatial attribute information is stored in a relational
database management and the spatial information in a separate subsystem,
which enables to deal with spatial data and queries. Such architecture however
reduces the performance because objectives have to be retrieved and compiled
from components stored in the two subsystems. This problem is not easy to
solve. Spatial data processing is performed with vector, raster or a combination
of the geometric data formats
The most important and distinguishing feature, which a GIs has over a mere
computer mapping systems or CAD, is the abtlity to manipulate and analyze
spatial data. The manipulation and analysis procedures, which are usually
integrated in a GIs, are often limited, however to simple spatial operations such
as:
Geometric calculation operators such as distance, length, perimeter, area,
closest intersection and union.
Topological operators such as neighborhood, next ltnk in a polyline network,
left and right polygons, start and end nodes of a polyline.
Spatial comparison operators such as intersects inside, outside neighbour
etc.
Multi layer spatial overlay involving the integration of nodal, linear and
polygon layers, and to restricted forms of network analysis.
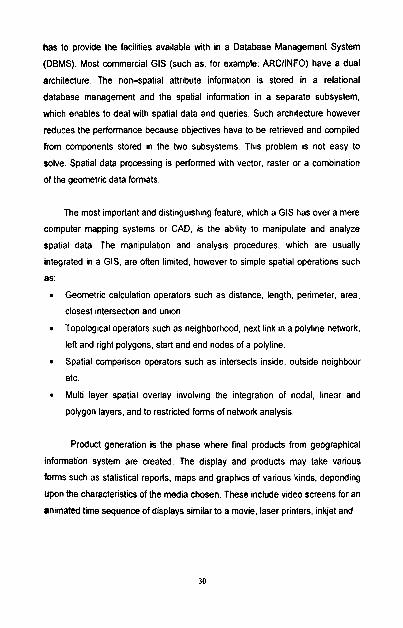
Product generation is the phase where final products from geographical
information system are created. The display and products may take various
forms such as statistical reports, maps and graphics of various kinds, depending
upon the characteristics of the media chosen. These include video screens for an
animated time sequence of displays similar to a movie, laser printers, inkjet and
electrostatic ploners, color film readers, micro film devices and photographic
media.
The final module of a geographical information system consists of
software capabilities, which simplify and organize the interaction between the
user and the GIs software via, for example menu driven common systems.
It IS noteworthy that most current GIs IS strong In the sophlstlcated forms
of spatlal analysls and declslon maklng make them best sultable for natural
resource management As ment~oned earher, the analytical poss~b~l~t~es basically
and usually refer to polygon overlay wlth loglcal operators buffering ~nventor
maps lnterpolatlons and jolnlng and slmpllfied network analysls GIs capab~l~tles
for locat~on - allocat~on problems optlmal land use allocation and management
routlng veh~cles for dellvery of goods and servlces
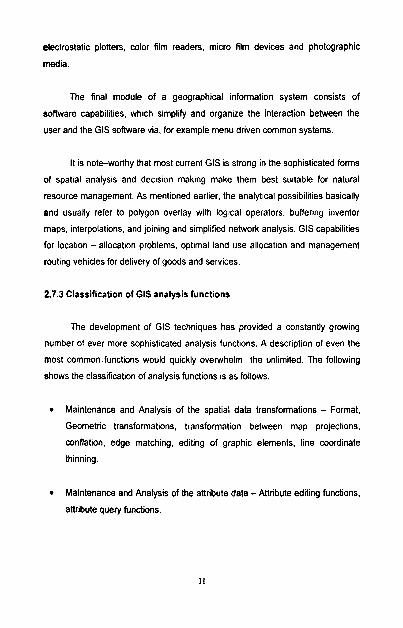
2.7.3 Classification of GIs analysis functions
The development of GIs techniques has provided a constantly growing
number of ever more sophisticated analysis functions. A description of even the
most common functions would quickly ovewhelm the unlimited. The following
shows the classification of analysis functions is as follows.
Maintenance and Analysis of the spatial data transformations - Format,
Geometric transformations, transformation between map projections,
wnflation, edge matching, editing of graphic elements, line coordinate
thinning.
Maintenance and Analysis of the attribute data -Attribute editing functions,
attribute query functjons.
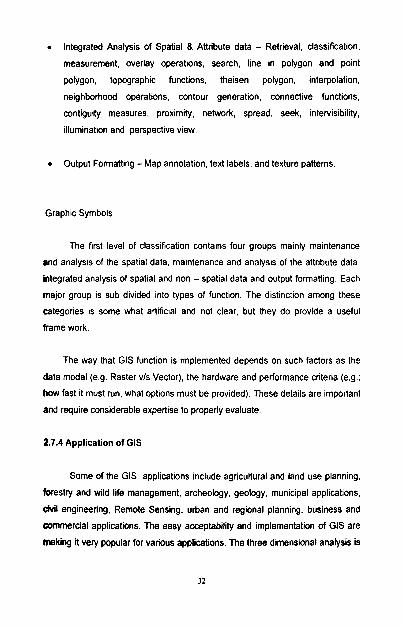
Integrated Analysis of Spatial 8 Attribute data - Retrieval, classification,
measurement, overlay operations, search, l~ne in polygon and point
polygon, topographic functions, theisen polygon, interpolation,
neighborhood operations, contour generation, connective functions,
contiguity measures, proximity, network, spread, seek, inte~isibility,
illumination and perspective view.
Output Formatting -Map annotation, text labels, and texture patterns.
Graphic Symbols
The first level of classification contains four groups mainly maintenance
and analysis of the spatial data, maintenance and analysis of the attribute data,
integrated analysis of spatial and non - spatial data and output formatting. Each
major group IS sub divided into types of function. The distinction among these
categories is some what artificial and not clear, but they do provide a useful
frame work.
The way that GIs function is implemented depends on such factors as the
data modal (e.9. Raster v/s Vector), the hardware and performance criteria (e.g.:
how fast it must run, what options must be provided). These details are important
and require considerable expertise to properly evaluate.
2.7.4 Application of GIs
Some of the GIs applications include agricultural and land use planning,
forestry and wild life management, archeology, geology, municipal applications,
6 i l engineering, Remote Sensing, urban and regional planning, business and
commercial applications. The easy acceptability and implementation of GIs are
making fi very popular for various applications. The three dimensional analysis is

having applications in terrain evaluation, highway route allocation and canal
planning etc.
2.7.5 Implementation
The implementation of a GIs is where technology and people meet; one of
the reasons for the complexity of the implementation process is that it is
necess~ty to harness the potential that people in an organization that adopt and
learn to use the technology.
The implementation of GIs can be seen as a six-phase process.
A). Awareness: People wlth in the organization become aware of GIs
technology and the potential benefits for their organization. Potential uses
and users of GIs are ~ostulated.
0). Development of systems requirement: The idea that GIs could benefit the
organization is formally acknowledged and a more systematic and formal
process is instituted to collect information about technology and to identify
the potential users and their needs. A formal need analysis if often done at
this stage.
C). System Evaluation: Alternative systems are proposed and evaluated. The
evaluation process takes into account the need analysis of the previous
phase. At the end of this phase a formal decision must be made where or
not to proceed with aquisition of GIs.
0). Development of an implementation plan: having made the decision to
proceed wlh aquisition of a system, a plan is developed to acquire the
necessary equipment and staff, make organizational charges and found the
process. This plan may be a formally accepted document or a more or less
informal series of actions.
E). System organization and start - up: The system is purchased, installed.
staff is trained, creation of database is beginning and operating procedures
begin to be established. Creation of the database is usually the most
expensive part of the implementation process. Considerable attention is
needed to establish appropriate data quality Controls to ensure that the
data entered meet the requ~red standards and those su~table updating
procedures are implemented to maintain the concurrency and integrity of
the database.
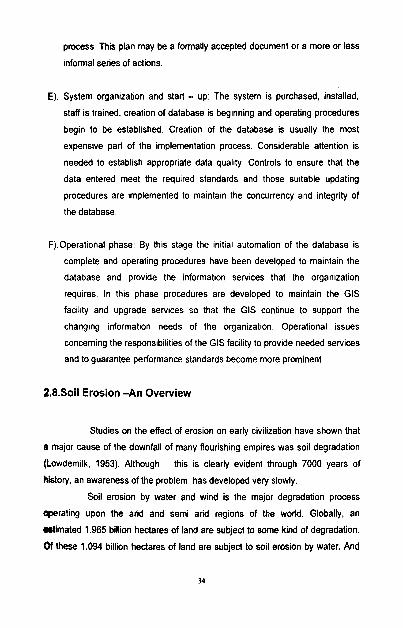
F).Operational phase: By this stage the initial automation of the database is
complete and operating procedures have been developed to malntaln the
database and provide the information services that the organization
requires. In this phase procedures are developed to maintain the GIS
facility and upgrade services so that the GIS continue to support the
changing information needs of the organization. Operat~onal issues
concerning the responsibilities of the GIS facility to provide needed services
and to guarantee performance standards become more prominent
2.8.Soil Erosion -An Overview
Studies on the effect of erosion on early civilization have shown that
a major cause of the downfall of many flourishing empires was soil degradation
(Lowdemilk, 1953). Although this is clearly evident through 7000 years of
history, an awareness of the problem has developed very slowly.
Soil erosion by water and wind is the major degradation process
operating upon the arid and semi arid regions of the world. Globally, an
&mated 1.965 billion hectares of land are subject to some kind of degradation.
Of these 1.094 billion hectares of land are subjed to soil erosion by water. And
m average of 25 billion tons of topsoil from croplands is being washed into
oceans. Soil degradation is a process by which the soils population capacity
diminishes by one or another means and finally becomes totally denuded and
not supported life of flora and fauna etc.
In India alone, out of a 329 million ha geographical area, 150 million
ha of land are affected by wind and water erosion is affected by wind and water
erosion (Rao ,2003). Soil degradation contributes to an increase in
atmospheric carbon dioxide through rapid industrialization and deforestation
have led to building up of greenhouse gases in the atmosphere resulting global
warming. Besides, another equally important aspect of the sustainability of
vegetat~on is the biodiversity that needs to be preserved. Optimal utilization of
natural resources based on their limitations and potential is a pre-requisite for
sustained agricultural production.
The process by which soil particles are removed from their original
resting places by same external agencies like wind or water is called soil erosion.
By this process, the so11 loses much of its manorial soil particles, thus becoming
useless for productive agriculture in order to keep the land productive, a good
conservation program is imperative. Soil and water conservation is the basis of
such a program, and also helps improve land impoverished by erosion and
weruse - makes it more productive so that it can support more people.
2.8.1.Effective conservation
For effective conservation of soil and water, we must treat and use the
various kinds of land according to their capability and need. To do this it is
necessary to study the land carefully, so as to be able to fit conservation
practices and structures to the various kinds of land. The primary purpose of soil
water conservation is to prevent soil erosion and heal its scars where it has
not advanced too far to respond to curative methods. This involves, in many
instances, changing the uses to which land is to fit the crop-whether cultivated
aops, trees or grazing plants to the capabilities of the soils and the water
available.
28.2. Fundamental cause
The fundamental cause of soil erosion is that rain acts upon the soil
and the study of erosion can be divided into how it will be affected by different
kinds of rain fall events and how it will vary for different conditions of soil .The
amount of erosion there fore depends upon the combination of the rain intensity
which is Erosivity and the ability of the soil to withstand the rain. In mathematical
t e n s erosion is a function of the Erosivity (of the rain ) and the Erodability (of
tfm soil )
2.8.3. Raindrop splash and surface runoff
Soil erosion is a work process in the physical sense that work is the
expenditure of energy is used in all the phases of erosion in breaking down soil
aggregates, in splashing them in air, in causing turbulence in surface runoff, in
carrying away soil particles.
Raindrop impact has other important effects as well as particle
detachment. The detached particles lead to sealing of the soil surface and hence
to lower infiltration and increased surface run-off. More important the energy
causes turbulence in run off, thus greatly increasing its capacity to scour and to
transport soil particles.
24.4. Causes of soil erosion
The causes for soil erosion are
1) The steep slopes, which accelerate erosion, near the foot of the hills due
to rainfall.
2) The way in which land is ploughed and the kind of farming which when not
done properly weakens the resistance of the soil, then soil erosion is apt
to occur. The faulty methods of cultivation are:
A) Inappropriate land and water management practices
B) Excessive use of fertilizing manures and inappropriate nutrient
practices
C) Lack of proper ploughing and land cover with crops.
D) Not adapting the method of rotat~on of crops and
3) The removal of the cover of grass and forests from the ground to use for
cultivation, makes the ground bare and uncovered there by giving rise to
soil erosion.
4) Grazing is not controlled in many places.
2.8.5. Factors affecting erosion by water
The major variables affecting soil erosion are climate, soil, vegetation, and
topography. Of these the vegetation and to some extent the soil may be
managed with ease. The climatic factors and the topographic factors except
rbpe length are difficult to control.
2.8.5.1 .Climate
Climatic factors affecting erosion are precipitation, temperature, wind,
humidity, and solar radiation. Temperature plays an important role through its
# k t in the process of weathering which leads ta disintegration of rocks. Wind
changes raindrop velocities and the angle of impact. Humidity and solar radiation
are somewhat less directly involved In that they are associated with temperature.
2.8.5.2.Soil
Physical properties of soil affect the infiltration capac~ty and the extent to
which it can be d~spersed and transported. These properties that influence
m i o n include soil structure, texture, organlc content, moisture content and
dnsity or compactness, as well as chemical and biological characteristics of the
d.
M.S.3.Vegetation
The major effects of vegetation in reducing erosion are:
1) Interception of rainfall by absorbing the energy of the raindrops and thus
reducing runoff,
2) Retardation of erosion by decreased surface velocity,
3) Physical restraint of soil movement
4) Improvement of aggregation and porosity of the soil by roots and plant
residue,
5) Increased biological activity in the soil
6) Transpiration which decreases soil moisture, resulting in increased storage
capacity.
2.8.5.4.Topography
Topography features that influence erosion are degree of slope, length
of slope and size and shape of the watershed. Qn steep slopes high velocities
cause serious erosion by scour and sediment transportation. A uniform slope
loses more soil than a concave, but less than a convex slope.
28.6. Classification of soil erosion.
The erosion from the watershed can be classified as described below.
2.8.6.1.Sheet erosion
Due to heavy rain the crust is uniformly removed like a sheet through
out the plain area. The procedure or process is insidious and can not be
noticed at all for along time and the fertility of the soil gradually decreases year
by year.
28.6.Z.RiII erosion
In the next stage when sheet erosion is allowed to continue unchecked,
h silt laden runoff forms well defined minute finger shaped grooves or rills
ovsr the entire field. Rill erosion accounts for majority of erosion from from
W i d e .
28.6.3.Gully Erosion
In this process, water flows in defined channels and as the eroding power
increases, it resuns in the land being made in the form of trench -like gullies,
which become deeper and wider as trme passes.
28.6.4.Channel Erosion
The channel erosion includes the streambed and stream bank erosion and
the flood pla~n scour. Deposition occurs in channels when the quantity of
detected soil coming from the sheet, rill and gully erosion exceeds the transport
capacity.
2.9.Sediment yeild
Sediment yield is the ' total sediment oufflow from a watershed,
measurable at a point of reference and a specified period time" (Bennet.,1974)
divided the sediment yield process into the upland phase and low land phase.
Sed~ment detachment process predominates in the upland phase, where as in
the lowland phase sediment transport and deposition are the main processes.
The study of sediment yield from the watershed is important for
various reasons like the deposition of sediment in reservoirs there by reducing its
capacity and adversely affecting its function, choking of outlets and damage to
structures due to abrasive action of sediment. The eroded sediment from
watershed may also be deposited on the riverbeds and banks there by causing
the braiding of river reach, submergence of flood plain of river during the floods
rvld reduction of clearance below bridges. On the areas like groundwater it
mul ts in lowering of water table at same places and rise at the other giving rise
k formation of arid zone and marshes respectively.
The watershed erosion also results in loss of top fertile agricultural soils,
multing in the reduction of agricultural production. Degraded watersheds are
dso found to give higher flood peaks and changes in groundwater regime.
29.1 Modeling sediment load
The estimation of soil erosion potential and its effects on soil productivity
are essential for agricultural development and regional environmental planning a
number of sediment yield models, both empirical and conceptual, are in use to
address wide ranging soil and water management problems. Most conservation
planning for erosion control in agricultural lands, construction sites, reclaimed
mines and forest management. However use of empirical model to estimate
average annual soil loss because of consideration of long time scale, small
areas, low cost, short project span and little risk of fallure (Singh, 1989).
Investigation Into such empirical models reveal that most of these models require
input parameters in terms of spatial information on land use, vegetation cover,
w i l , slope, drainage density, besides runoff and rain fall intensity. Acquisition of
such spatial information on watershed is time consuming and costly by
conventional surveys, whereas satellite data provide convenient tool to derive
these information.
The conventional hydrologic models fairly permit defining
significant model parameters from remote sensing. The following empirical
models can be interfaced with remote sensing data. The following empir~cal
models can be interfaced with remote sensing mapdata inputs and are currently
In practice.
2.9.l.l.Sediment yield Index
The traditional method followed in India for evaluating SYI for prioritization
of watersheds is as follows(Dohare et a1.,1985).
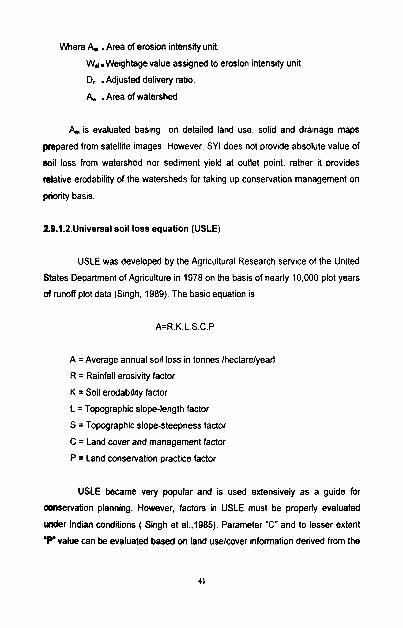
Where A, .Area of erosion intensity unit.
W, . Weightage value assigned to erosion intensity unit
D, .Adjusted delivery ratio.
.Area of watershed.
is evaluated basing on detalled land use, solid and drainage maps
prepared from satellite images. However, SYI does not provide absolute value of
soil loss from watershed nor sedlment yield at outlet point, rather it provides
relative erodability of the watersheds for taking up conservation management on
priority basis.
29.1.2.Unlversal soil loss equation (USLE)
USLE was developed by the Agricultural Research service of the United
States Department of Agriculture in 1978 on the basis of nearly 10,000 plot years
of runoff plot data (Singh, 1989). The basic equation is
A =Average annual soil loss in tonnes Ihectarelyearl
R = Rainfall erosivity factor
K = Soil erodability factor
L = Topographic slope-length factor
S = Topographic slope-steepness factor
C = Land cover and management factor
P = Land conservation practice factor
USLE became very popular and is used extensively as a guide for
Conservation planning. However, factors in USLE must be properly evaluated
under Indian conditions ( Singh et a1.,1985). Parameter 'C" and to lesser extent
'P value can be evaluated based on land uselcover information derived from the
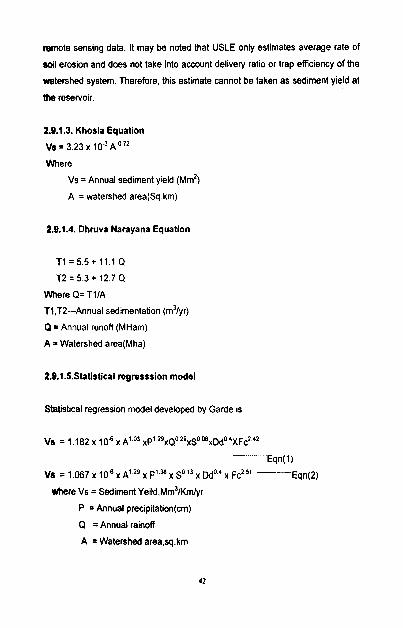
m o t e sensing data. It may be noted that USLE only estimates average rate of
soil erosion and does not take into account delivery ratio or trap efficiency of the
watershed system. Therefore, this estimate cannot be taken as sediment yield at
the reservoir.
2.9.1.3. Khosla Equation
~ ~ = 3 . 2 3 ~ 1 0 ' " ~ ~ ~
Where
Vs =Annual sediment yield ( ~ m ' )
A = watershed area(Sq.km)
2.9.1.4. Dhruva Narayana Equation
T I =5 .5+ 11.1 Q
T2 = 5.3 + 12.7 Q
Where Q= Tl/A
T1,TZ---Annual sedimentation (mllyr)
Q = Annual runoff (MHam)
A 3 Watershed area(Mha)
2.9.1.5.Statistical regresssion model
Statistical regression model developed by Garde is
VS = 1 182 x l o 6 x A' O1 XP' n x ~ 0 2 9 ~ ~ 0 M ) ~ ~ d 0 4 ~ ~ ~ 2 4 2
Eqn(l) V I =I 0 6 7 x 1 0 d x ~ 1 2 9 x ~ 1 3 8 ~ ~ 0 1 3 ~ ~ d o 4 ~ ~ ~ 2 5 1 - Eqn(2)
where Vs = Sedlment ~ e ~ l d , ~ m ~ l ~ r n l y r
P = Annual prec~p~tat~on(cm)
Q = Annual ralnoff
A =Watershed area,sq km
S = Slope of the watershed
Dd = Drainage density,km/sq.km
Fc = Vegetative cover factor
In the present project work the statistical regression model given by Garde
eta1 eqn(1) is used for computing the sed~ment yield of watershed. The strength
of this model is that ~t takes Into account dominant watershed characteristics like
contributing watershed area, slope, drainage density and vegetative cover factor
besides hydrodynamic parameter as prec~pitation and runoff. These parameters
a n be easily derived based on remote sensing mapping inputs and topographic
units.
2.lO.Consewation Planning For Sedimentation In Watershed
The key sectors for conservation planning of sediment is to handle the
wdiment where it originates and where it creates the problem. There are
several approaches based on land deposition, degree of erosion and funds
availability
Agronomic practices coupled with engineering measures answers best
many situations requiring control of soil erosion
2.10.1. Agronomic Practices
These include various methods of crop cultivation to ensure protection of
Um top soil. The various measures include contour farming, mulching, dense
growing crops, strip cropping, mixed cropping, organic matter addition and
appropriate nutrient management practices.
210.2.Contour technique
Ploughing, furrowing, trenching, bunding and vegetative hedging along
Contours are the important soil conservation measures. They control runoff and
emion, improve subsurface drainage for favorable aeration status and
workability of soil in rock zone, and conserve soil moisture. Contour methods
together could conserve more than 60% of the soil erosion and insitu soil
moisture. Greenfeild (1987) recommends the interval between the contour
rctivity In relation to slope as lOOm for 2% slope, 60m for 5% and 7m for 57% for
a vertical interval of 2,3 and 4m respectively.
2.10.3.Ploughing
Ploughing along the slope increases runoff, loses 50-80 per cent of rainfall,
decreases soil moisture, and finally erodes soil .The slmple measure is to plough
along the contour which controls the so11 erosion upto 50% at no additional cost.
Ploughing deeper for every 2-10 years IS another measure of conservation.
Depth of tillage is another aspect of Importance as it has a subtle influence on
the crop yields. It varies with crop, so11 and climate. There is much evidence that
proper tillage operation are crucial for cropping
2.10.4.Furrowing
Ploughing leaves minor furrows on the ground and they harvest ralnwater
fkws. A broad bed and furrow (BBF) system, involving graded, wide beds
separated by furrows draining into grassed waterways, is experimented by
ICRISAT with good results in the Sangameswara, Kothapalli WatershedsCNani et
a1.,2002). The BBF system is laid out on grades 0.4-0.85 for optimum
pdormance (Kampen, 1982). The raised portion acts as bund ensuring soil
stability while the shallow furrow provides drainage and aeration. The system is
llexible with variable spacing for accommodating different crops Continuous
fumrr/ing along the contoilrs and ridge development across the furrows is
nother practice adopted in low rainfall regions for cent per cent harvesting
Narrow excavation along the contour is another conservation technique. The
economical dimensions are 0.3 m width and 0.6171 depth in lands with low slopes
or good rains. The dimensions can be interchanged in gently sloping fields or
where low intensity rains are common. Wherever the degree of erosion is very
high due to soft soil, intensive rains, or high runoff and velocity, higher
dimensions of the trenching are to be adopted. The soil excavated is to be put
as a bund on the downslope side. Trenching proves to be a good conservation
technique, especially when plants are grown along the trench for utilizing the high
moisture available along the trench.
2.10.6.Bunding
This method consists of making a comparatively narrow based
embankment at intervals across the slope of the land on a level that is along
the contour. It is an important measure that conserves soil and water in arid
and semi-arid areas with high infiltration and permeability, and can be
commonly adopted on agricultural land up to a slope of about 6%.
2.10.7.Gradonl
Narrow trenches built along contours for collecting overland flow and
increasing soil moisture are known as gradoni. They are either continuous,
intermittent or built for individual plants. for dissected slopes with undulating
terrain short or individual gradoni are prepared(FA0.,1988) for uniform
slopes,continuous gradoni , synonymous to the minor trenching practice can be
carried.
2.10.8.Hedging
This method not only solves conservation problems but also produces
biomass and stabilizes the ground further by root system. Hedging gives
excellent results in catching rainwater and improving soil moisture. Hedging is
practiced from gently to moderately sloping lands for increasing crop yields.
Hedges are grown either in furrows ,trenches or on bunds. they are grown
across streams for conserving flood load. when practiced in combination with
other methods, they conserve almost all the rainwater in drought prone area.
2.10.9.Terracing
Special methodology is required on steep slope of the hills ,where the
space between contours of the activity reduces, and velocity of runoff increases
with high erosive capacity. the technology for correcting the destructive action is
known as terracing. Terracing requires good care in developing as system for
avoiding breaching during heavy rains. the effectiveness of the systems
depends also on green cover management.
2.10.10.Gully control
Gullies erode headwords of the stream by furrowing into the topsoil, as
well as downwards through deepening and widening of the stream course.
Gullies are controlled by check dams and vegetative stabilization. The selection
type of gully plugging and cover management depends upon hydraulics,
sedimentation, soils and vegetation requirement by the people. The check dams
check the velocity of water, effect the deposition of flood load, decrease the
erosive force of the water, increase the contact time of water with land surface,
and thus increase the recharge of rainwater into the ground. The check dams
may be classified as pervious and impervious depending on the design of the
structure to allow water to pass or pond. The various types of check dams are
brushwood, Rock fill, Gabion, Concrete gravity, concrete arch etc. Check dams
are constructed with local materials like earth, rock or timber. They are suitable
when the watershed is between 40 to 400 hactares.
2.lO.ll.Bank protection
The earth banks which are steeply sloping are liable to land slides and
the key to the control of this form of erosion lies with drainage, the surface
erosion of the bank is best controlled by vegetation.
2.10.12.Rainfall Erosion control with geotextiles
On steep ground with little or no covering or vegetation rainfall erosion can
be major problem. The geotextile based methods of rainfall erosion can
generally be divided into two categories.
1) Surface cover geotextiles
2) Surface reinforcement geotextile
2.10.12.1. Surface cover Geotextiles
These provide a temporary cover over the soil surface which
dissipates, the rain drop impact energy in a similar manner to foliage.
Erosion control geotextiles currently available in different forms are:
(i) paper strips held together by a knitted polymer yarn
(ii) Wood wool sandwiched between two layers of polymer knot
Both types of geotextiles are biodegradable. they are placed over
the ground surface after seeding and should ideally decompose sufficiently for
the for the seedlings to push through shortly after germination .
2.10.12.2.Surface Reinforcement Geotextile
This group of erosion control geotextile in a similar manner to plant roots
by reinforcing the soil surface and holding the soil pa~ticles together. The four
main subdivisions of surface reinforcement geotextiles are:
(i) Thick three dimensional mats
(ii) Cellular geotextiles
(iii) Geotextiles woven from thick, widely spaced yams
(iv) High profile geotextile nets
Unlike surface cover geotextiles,geotextile mats are seeded after the
geotextiles has been laid. On large ,of steep areas, it may prove more efficient to
use hydraulic seeding techniques to fill the mat with a mixture of seed, compost
and top soil. Cellular geotextile is formed from a mechanically bonded non-
woven product which has been partially impregnated with resin in order to give
it slight rigidity, but these are not suitable on slopes steeper than 45' to the
horizontal. Geotextiles woven from thickly widely spaced yarns are made from
thick open woven jute and it helps to protect slopes from erosion in a number of
different ways. Jute can absorb almost five times its own weight of water, limiting
the surface runoff and maintaining a suitable moist environment for seed
germination. Jute which is about 80% natural cellulose is biodegradable and
rots in about two years and is flexible enough to follow surface contours and its
weight will not permit it to be lifted by wind ,flowing water or growing grass.
2.10.13.Reclarnation o f Eroded areas
Reclamation measures are justified on the land that has stripped into
poor state through mis-use or neglect. Reclamation can be done by Rejuvenation
and Restoration.
2.10.13.1.Rejuvenation
The symptoms of the land requiring rejuvenation are easily recognized by
sparse vegetation ,high runoff, low filtration, high rates of soil erosion. The
corrective technique is to try to identify the limiting factor and improve it.
2.10.13.2.Restoration
When the situation is so bad that major remedial measures are required,
an attack on the water balance is frequently made by ripping or sub soiling in an
attempt to improve the infiltration. This can be very effective if it is directed
towards a particular problem such as breaking up a plough pan or a naturally
occurring obstacle to percolation like a layer of laterite. But ripping is an
expensive way of achieving what might be done equally well by a cheap surface
scarifying operation with a disc harrow or spike-tooth harrow.
Watershed management has its social and economical aspects. Soil
Conservation measures interfere with traditions and can only be successful if
accepted by the local population. If watershed is not large, the effects of soil
consewation methods may be felt in a very short time. In this present study
appropriate soil conservation measures are suggested after examining the
watershed.
Methodology r
3.1 Introduction
A detailed database on natural resources, terra~n conditions is a pre-
requisite to prepare action plan keeping in view the underlying concept of
sustainability.
Survey of India (Sol) Toposheet is a representation of the shape, size,
posit~on and relation of the physical features of an area, in addition to regional
boundaries. The synoptic coverage of satellite imagery permits fairly easy
identification and mapping of natural resources like stream network, land usel
land cover, soil characteristics, land irrigability, land capability, hydro
geomorphological characteristics and groundwater prospects of the study area
in coordination with GIs. IRS-ID PAN (Image NO:3.1) and LISS-lll(lmage
NO:3.2) images acquired from National Remote Sensing Agency (NRSA)were
used for the purpose of accurate visual interpretation image to image
georeferencing is performed in NRSA.This PAN and LISS-Ill merged image
(Image No: 3.3) is used for the present delineation of resource themes.These
maps and information georeferenced with conventionally measured
topographic maps through GIS for meaningful synthesis of resource maps of
the study area. To reduce the confusion prevailing because of the mingling of all
these features for fulfilling the basic objectives of present study.
3.2 Preparation of Thematic Layers
In this chapter the methods of preparation of thematic maps using visual
interpretation of satellite imagery and toposheet are discussed as following
Topographic sheets (Scale 1:50,000) of NOS 56 U1 and 56 L/2 are used for the
Preparation of
1.Base map
2,Drainage and watershed boundary map
3.Slope map
4.Contour map
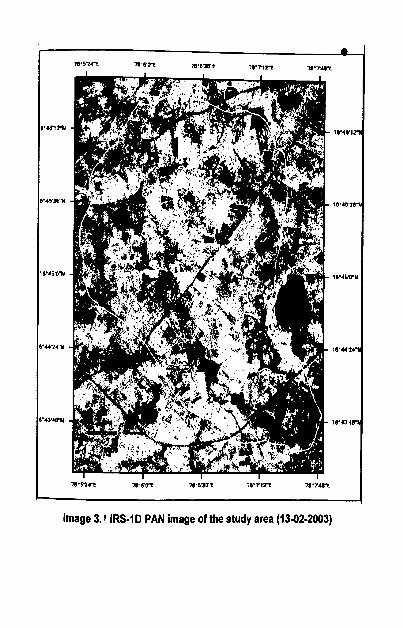
Image 3.1 IRS-ID PAN image of the study area (13-02-2003)
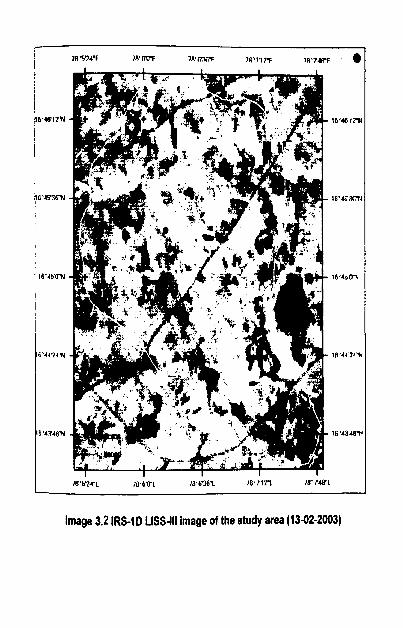
Image 3.2 IRS-ID LISS-Ill image of the study area (1342-2003)
Remotely sensed IRS-ID PAN and LISS-Ill merged data in the form of FCC was
used for the preparation of thematic maps as listed below
I .Landusellandcover
2.Geology
3.Hydrogeomorphology
4,Groundwater Prospects
5.Soil map
6.Land irrigability map
7.Land capability map
3.2.1 Base map preparation
For the preparation of thematic layers, it is necessary to prepare base
map to know what are the features in the study area and to get accurate
control points. Basemap prepared from toposheet is used for overlaying the
satellite imagery over it in order to prepare land uselland cover, drainage map,
slope map, hydrogeomorphologicaI map, soil map etc.
To get accurate ground control points certain features like road networks,
water bodies, canals, settlements, etc, on the toposheet are used for exact
matching with those on the satellite imagery.
This Malleboinapalli watershed falls under Grid no:R3 of 56U1 and Grid
no:Bl of 56U2.
Base map is shown in the plate No:4.1.1
3.2.2.Drainage and watershed boundary map
Drainage network helps in delineation of watersheds and for suggesting
various water harvesting structures and soil conservation measures. Drainage
pattern is defined as the plan, which the individual stream courses collectively
form. It refers to both spatial relations of individual streams and the overall
Pattern made by the individual drainage lines. The importance of drainage in soil
erosion is naturally well conceived as it drains the watershed not only the water
but also the precious soil along with it in the present study.
Data used
$01 toposheet. 56UlNE and 56U2SW Map scale: 1:25,000
Methodology:
A tracing film with minimum base details is overlaid on the toposheet .The
major streams and streamlets drawn out carefully.The overlay w~th these details
is placed on the post monsoon image and the extent of surface water spread in
the tanks, reservoirs and ponds is to be indicated. The extent of water spread
during rabi and kharif season demarcated using the respective season satellite
image. Watershed boundary is delineated following the drainage devide along
the stream course. This map is digitized by using AutoCAD 2000 and edited
using ARClGlS 6.1.2 as shown in plate No:4.1.2.
3.2.3. Contour map
Data source :SO1 toposheet 56 U l , 56U2 Map Scale 1: 50,000
Methodology
By placing the tracing film with minimum base details is overlaid the
toposheet drawn out the major contours which are of 520m. 540m, 560m, 580m,
having 20m altitude with each other. Alongwith these spot heights are also
noted at the lower reach and upper reach points of the drainage basin.This map
is most helpful in the hypsometry analysis.
Contour map is shown in the plate No:4.1.3
3.2.4. Slope map
Slope is very vital one for making land irrigability, land capability
assessment and in the estimation of sedimentation yield. Slope map gives an
idea of steepness of the land and reflects the quantity of erosion. Flat terrains
promote more infiltration and less runoff yielding little sediment while steep
terrains generate more runoff that could erode the soil.
Data used
SO1 Toposheet Nos : (56Ul and 56L12) Map scale 1: 50,000
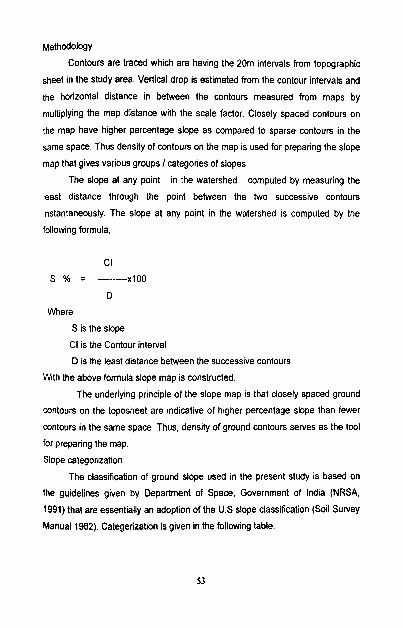
Methodology
Contoun are traced which are having the 20m intervals from topographic
sheet in the study area. Vertical drop is estimated from the contour intervals and
the horizontal distance in between the contours measured from maps by
multiplying the map distance with the scale factor. Closely spaced contours on
the map have higher percentage slope as compared to sparse contours in the
same space. Thus density of wntours on the map is used for preparing the slope
map that gives various groups I categories of slopes.
The slope at any point in the watershed computed by measuring the
least distance through the point between the two successive contours
instantaneously. The slope at any point in the watershed is computed by the
following formula,
CI S % = .------ x100
D
Where
S is the slope
CI is the Contour interval
D is the least distance between the successive contours
With the above formula slope map is constructed.
The underlying principle of the slope map is that closely spaced ground
contours on the toposheet are indicative of higher percentage slope than fewer
contours in the same space. Thus, density of ground wntours serves as the tool
for preparing the map.
Slope categorization
The classification of ground slope used in the present study is based on
the guidelines given by Department of Space, Government of India (NRSA,
1991) that are essentially an adoption of the U.S slope classification (Soil Survey
Manual 1962). Categerization is given in the following table.
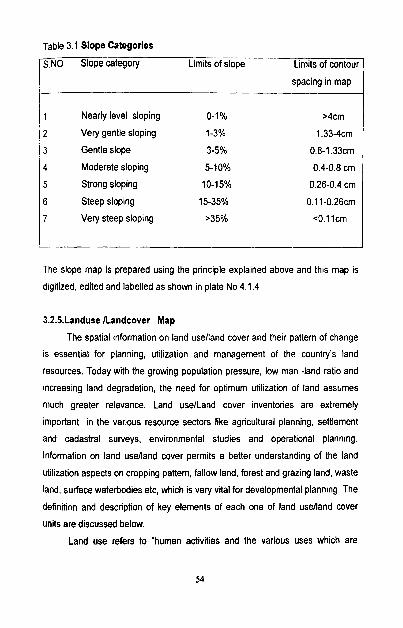
Table 3.1 Slope Categories
1 s NO Slope category L~m~ts of slope Lim~ts of contour
spacing In map
1
1 Nearly level sloping 0-1 % >4cm
2 Very gentle sloping 1-3% 1.33-4cm
3 Gentle slope 3-5% 0.8-1.33cm
4 Moderate sloping 5-10% 0.4-0.8 cm
5 Strong sloping 10-15% 0.26-0.4 cm
6 Steep sloping 15-35% 0.11-0.26cm
7 Very steep sloping >35% ~ 0 . 1 l cm
The slope map is prepared using the principle explained above and this map is
digitized, edited and labelled as shown in plate No 4.1.4
3.2.5.Landuse /Landcover Map
The spatial information on land uselland cover and their pattern of change
is essential for planning, utilization and management of the country's land
resources. Today with the growing population pressure, low man -land ratio and
~ncreasing land degradation, the need for optimum utilization of land assumes
much greater relevance. Land uselLand cover inventories are extremely
important in the various resource sectors like agricultural planning, settlement
and cadastral surveys, environmental studies and operational planning.
Information on land uselland cover permits a better understanding of the land
utilization aspects on cropping pattern, fallow land, forest and grazing land, waste
land, surface waterbodies etc, which is very vital for developmental planning. The
definition and description of key elements of each one of land uselland cover
units are discussed below.
Land use refers to "human activities and the various uses which are
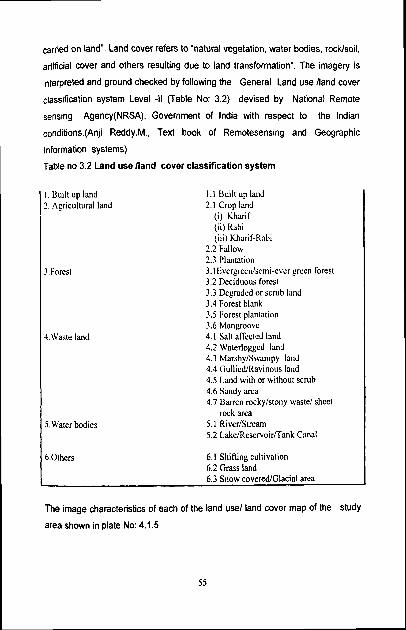
carried on land". Land cover refers to "natural vegetation, water bodies, rocklsoil,
artificial cover and others resulting due to land transformation". The imagery is
interpreted and ground checked by following the General Land use /land cover
classification system Level -11 (Table No: 3.2) devised by National Remote
sensing Agency(NRSA), Government of India with respect to the Indian
conditions.(Anji Reddy.M., Text book of Remotesensing and Geographic
Information systems)
Table no 3.2 Land use lland cover classification system
I. Built up land 2. Agricultural land
4 Waste land
5.Water bodies
I . I Built up land 2.1 Crop land
(i) Kharif (ii) Rabi (iii) Kharif-Rabi
2.2 Fallow 2.3 Plantation 3.1Evergrecdscmi-evtr green forest 3.2 Deciduous forest 3.3 Degraded or scrub land 3.4 Forest blank 3.5 Forest plantation 3.6 Mangroove 4.1 Salt affected land 4.2 Waterlogged land 4.3 MarshylSwampy land 4.4 GulliedRavinous land 4.5 Land with or without scrub 4.6 Sandy area 4.7 Barren rockyistony waste1 sheet
rock area 5.1 RiverIStream 5.2 LakelReservoirrrank Canal
6.0thers 6.1 Shifting cultivation 6.2 Grass land 6.3 Snow coveredGlacial area
The image characteristics of each of the land use1 land cover map of the study
area shown in plate No: 4.1.5
3.2.6.Geology map
Source: Geological survey of India(GS1)
The study area comprises lithological structures of Granites, basic
intrusives and intermediate lineaments. Granites are peninsular gneissic
complex in origin. Granites occurring as linear ridges, hills, inselbergs and sheet
like exposure. Granites display distinct intrusive relationship with the
metamorphosis.
The geologic structures of the given area are shown in the plate No: 4.1.6
3.2.7.Hydro Geornorphology Map
Information on landforms is an important input for land management,
soil mapping and identification of potential zones of groundwater occurrence
which are the result of manifold effects of geological and climatalogical changes.
The aspects of morphography, rnorphogenesis, morphochronology and
morphometry are vital inputs in preparation of geomorphological maps. Each
geomorphologic process develops its own particular assemblage of landforms.
Geomorphologic processes are of two types, namely the exogenetic
and endogenetic types. Examples of exogenetic or external processes. Different
landforms are identified with the aid of visual interpretation of satellite imagery
and the hydrogeomorphological map is prepared . This map makes use of runoff
that can be utilized in the areas where groundwater prospects are low by
construction of percolation tanks and other groundwater harvesting structures to
increase the water table.
Charecteristics of Hydrogeomorphological mapping units are shown in the Table
No:3:3. Hydrogeomorphologic mapping units are shown in the Plate No:4.1.7
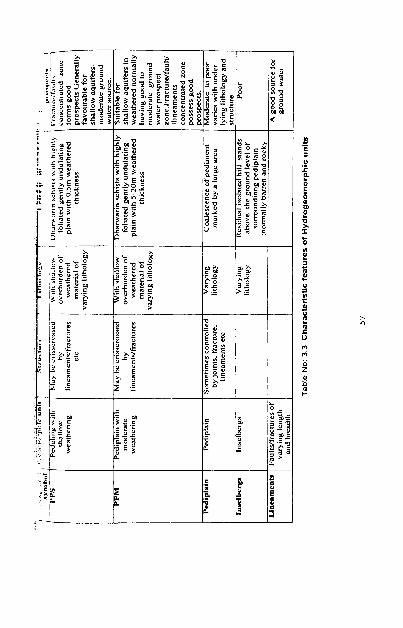
3.2.8.GroundWater Potential Map
Source :Hydrogeomorphology map,Lithology map
Methodology
For the identification of groundwater potential zones of the study area ,
the different thematic maps such as geology, geological structures and land
forms have been are integrated using visual interpretation of standard FCC
1mages.The additional details extracted from information collected during
limited ground checks are been incorporated into the map. By integrating all the
thematic maps, the hydrogeomorphic map showing the spatial distribution of the
different landforms developed over different rock types and the associated
structures has been prepared. Finally the groundwater condition of the
drainage basin is assessed as follows.
Basing on the hydrogeomorphology map groundwater prospect classes
identified are
1. Good
2. Modearate.
3. Moderate to poor
4. Poor
Delineated groundwater potential units are shown in the Plate No;4.1.8
3.2.9. Soil Map
Source: NRSA
A good understanding of soils with reference to their nature and
distribution is essential to formulate any land based production system. Soil is a
diminishing resource whose loss or degradation is slow and not readily noticed.
Among agricultural soils, suitability varies for different species. Soils are also
known for their unique behavior under irrigated and non-irrigated conditions.
Therefore, soil surveys are undertaken to plan optimum management systems
that would help in maintaining their health and preservation.

~e thodo log~
Overlays with base map details are superimposed on satellite imagery. With the
help of toposheet infomation, geology, and geomorphology and by using the
elements of image interpretation physiographic units are delineated.
Understanding the spectral signatures of soils is the key need to map soils.
Stratification based on variations in geology, landform parent material, elevation,
slope, natural vegetation etc. helps in including maximum possible soil scapes.
Sample strips are selected based on the variability of the landform, geology and
certain individual land combinations of image interpretation elements then for the
ground truth collection. In the next step classification of soils and soil units are
demarcated by drawing boundaries with the aid of check~ng and by use of key
developed. Mapping units are partly checked and partly extrapolated by
reference. Soil classes are randomly verified in the field for map validation. Soil
composition of each geomorphic unit defined by studying soil profile in the
field and classifying them upto series -one of the taxonomic units in the
hierarchical system of soil classification ,level according to soil taxonomy
based on morphological characteristics and chemical analyses data (U.S
department of agriculture,l975,1998)
When a high degree of accuracy is achieved legend is finalized. From the
satisfaction of legend and unit boundaries final drawing, digitization and final map
prepared by using is prepared as shown in plate No:4.1.9
3.2.10.Land Capability Map
Land capability maps are generated based on information on soils and
terrain conditions according to criteria given by All lndia Soil and Land use
Survey Organization (All lndia Soil and Land Use Survey ,1970). Land capability
classification is an interpretative grouping of soils mainly based on i)lnherent
soil characteristics ii) External land features iii) Environmental factors. The
grouping enable one to get a picture (i) of the hazards of the soils to various
factors which cause soil damage, deterioration or lowering in fertility and (ii)
its potentiality for production, according to those properties that determine the
ability of the land to reproduce on a virtual permanent basis.
Land capability classification serves the following objectives
(i) It indicates the hazards of soil and water erosion and difficulties to be
encountered in land use accordingly
(ii) It involves most intensive, profitable and safe use on the application
to land use pattern .
(iii) It simplistically provides technical data and indicators for application to
land use planning.
(iv) It enables the cultivators to make the use of techniques and inputs
available for agriculture as scientific and technical information is
available for each class of land.
Land is arranged in various capability classes after considering a number of soil
characteristics, associated land capability classes which are soil texture,
effective soil depth, permeability, internal drainage, soil salinity, alkalinity and
toxicity, coarse soil fragments, slope of land, effect of past erosion, natural so11
drainage,frequency of over flow etc.There are two broad groups, namely:
(i) Lands suitable for cultivation.(Class I to IV lands)
(ii) Lands not suitable for cultivation,but suitable for forestry, grassland
and wildlife (class V to VII).
In the study area 11(1), 111(2), IV(3), V1(4), Vll(5) classes of land capability are
identified. Their land capability rating is shown in the Table 3.4
Land capability map is shown in the plate No:4.1.10
3.2.ll.Land lrrigability Map
Land irrigability maps are generated based on information on soils and
terrain conditions according to criteria given by All lndia Soil and Land use
Survey Organization (All lndia Soil and Land Use Survey,1970). The
interpretation of soil and land conditions for irrigation is concerned primarily
with predicting the behavior of soils under the greatly altered water regime
brought about by the introduction of irrigation .For arriving at land irrigability
classes, soil characteristics namely effective soil depth, texture of the surface
soil, permeability, water holding capacity, course fragments, salinity and
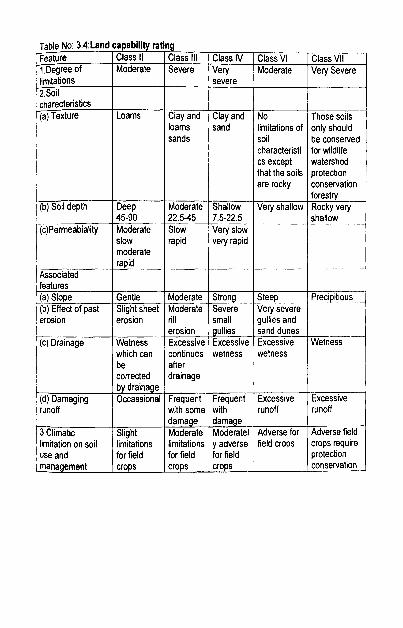
Loams
' ib) So l deoth 1 Dee0
I 1 rapid I kssoc~ated I I features
Gentle
I erosion I erosion ( (c) Dramage Wetness
wh~ch can
corrected b drama e
I (d) Damaglng Occassrona runoff
use and for field
1g Class Il l 1 Class lV 1 Class Vl Class Vll Severe 1 Very 1 Moderate I Very Severe
severe
Moderate Strong Steep Precipitious Moderate Severe Very severe rill small gull~es and erosion gullies sand dunes Excessive Excessive Excessive Wetness continues wetness wetness after drainage
pppp
Clay and Clay and No These soils loams sand limitations of only should sands soil be conserved
conservation
characteristi cs except that the soils are rocky
for wildlife watershed protection conservation forestry
Moderate Shallow Very shallow Rocky very 22.5-45 7.5-22.5 shallow Slow Very slow rapid very rapid
alkalinity, presence of hard plan in the surface, topography and surface and
subsurface drainage are considered'
Land irrigability map is shown in the plate No:4.1.11
3.2.12.Transportation Network, Settlements Location And Village
Boundaries map
Communication network plays an important role in the development of a
region. Accessibility by roads and rail is essential not only for economic
development o f an economic development and social and educational status.
Accessibility is an indicator of the level of development and development
depends on the quality of transport network. Village boundary helps in identifying
the resource potentiall limitation in respect of each village and also the alternate
development of action plan recommended for the same.
Mainly two classes of transport network namely roads and railways are
demarcated. Further, the roads are classified as metalled and unmetalled road.
Metalled roads have black top. Unmetalled roads are normally cart track and
footpath.
Data used
SO1 toposheet of 1:50,000 are the main input for mapping transport
network. However efforts to update this available information with available
details from concerned state departments were made. The digitally enhanced
satellite images are also used to extract more information on the newly
developed transport network. The settlement boundaries are taken from the
revenue maps.
Methodology
The transparent tracing film is placed over the toposheet with the help of light
table all the categories of roads are drawn; further settlement locations and block
boundaries are drawn from toposheet. Symbols are demarcated. All the railway
lines drawn as one category. Block boundaries have to be drawn from toposheet.
Symbols and legend represented in the final map. Village boundaries are
collected from revenue department and incorporated on this.This transportation
map is show11 in the Plate No:4.1.12
Discussions
4.1 Results of Thematic Mapping
4.2 Drainage Motphometry
4.3 Hypsometric Analysis
4.4 Sediment yield computation
4.5 Integration and Generation of Action plan
4,1 Results :matic Mapping
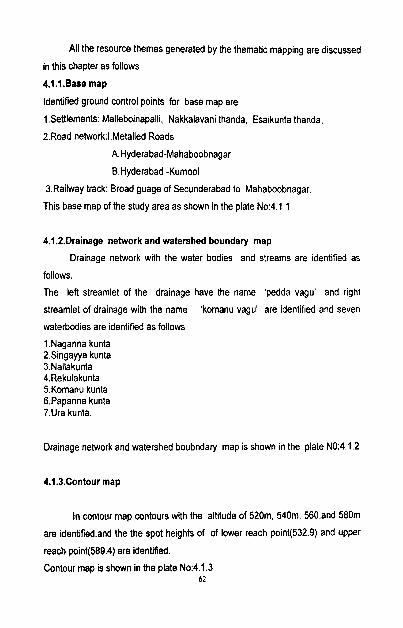
All the resource themes generated by the thematic mapping are discussed
in this chapter as follows
4.1 .I .Base map
Identified ground control points for base map are
1,Settlements: Malleboinapalli, Nakkalavani thanda. Esaikunta thanda,
2.Road network:I.Metalled Roads
A.Hyderabad-Mahaboobnagar
B.Hyderabad -Kurnool
3.Railway track: Broad guage of Secunderabad to Mahaboobnagar.
This base map of the study area as shown in the plate No:4.1.1
4.1.2.Drainage network and watershed boundary map
Drainage network with the water bodies and streams are identified as
follows
The left streamlet of the drainage have the name 'pedda vagu' and right
streamlet of drainage with the name 'komanu vagu' are identified and seven
waterbodies are identified as follows
1.Naganna kunta 2.Singayya kunta 3.Nallakunta 4.Rekulakunta 5.Komanu kunta 6.Papanna kunta 7.Ura kunta.
Drainage network and watershed boubndary map is shown in the plate NO:4.1.2
4.1.3.Contour map
In contour map contours with the altitude of 520m, 540m, 560,and 580m
are identifiedand the the spot heights of of lower reach point(532.9) and upper
reach point(589.4) are identified.
Contour map is shown in the plate No:4.1.3 62
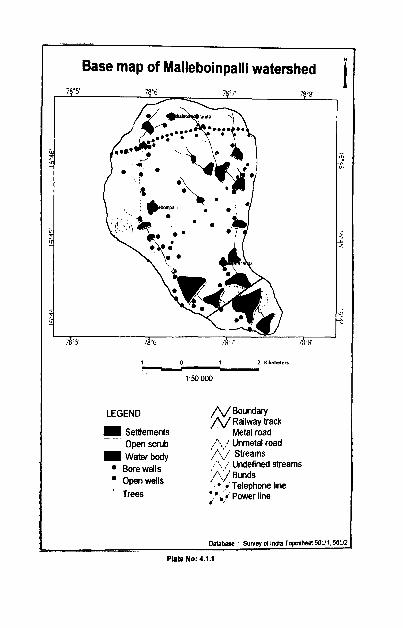
Phta No: 4.1.1
I
~ I I
I
I
I
I
I
1 ~
- - -- -
I
Base map of Malleboinpalli watershed
I 0 I 2 kbrnelem
1 50 000
LEGEND N Boundary Ra~lway track
Settlements Metal road I Open scrub ;".. ,.' Unmetal road
Water body Streams Bore wells Undefined streams
Open wells Bunds r Telephone llne
Trees :p, r Power l~ne
Databme Survey of lnda Topahad 56u1 56m L -
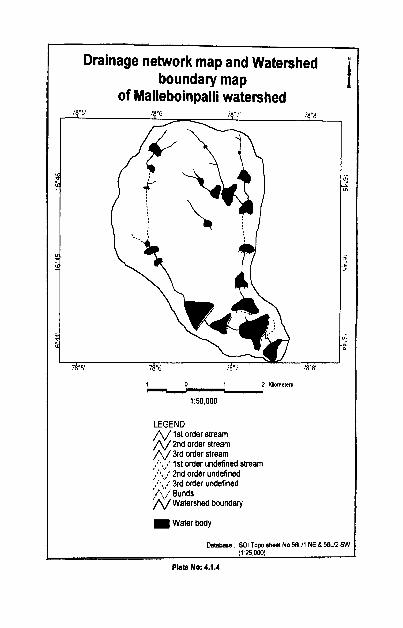
-- -- -- -
Drainage network map and Watershed boundary map
of Malleboinpalli watershed I
LEGEND 1st order stream nd order stream
Bunds N Watershed boundary
Water body
Datahe Sol Topa shwt Na WI NE & 5BLn SW (I 25 OW)
Pkta No: 4.1.4
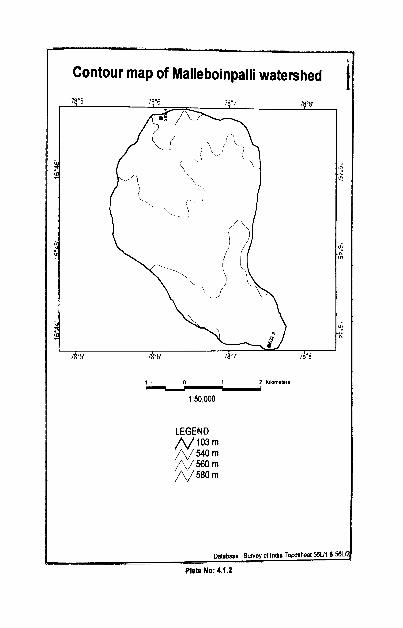
Contour map of Malleboinpalli watershed
LEGEND N 1 0 3 r n /*\/ 540 rn
560 rn f,J 580 rn
- ~. Database Survey of Inds Topheet MU1 & 5BL
Plats No: 4.1.2
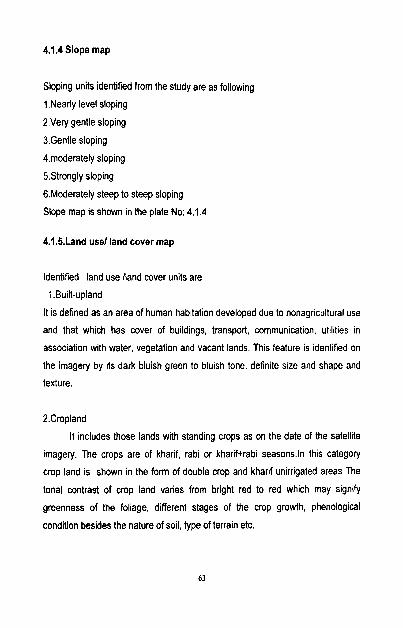
4.1.4 Slope map
Sloping units identified from the study are as following
I .Nearly level sloping
2.Very gentle sloping
3,Gentle sloping
4,moderately sloping
5.Strongly sloping
6.Moderately steep to steep sloping
Slope map is shown in the plate No: 4.1.4
4.1.5.Land use1 land cover map
Identified land use lland cover units are
1 .Built-upland
It is defined as an area of human habitation developed due to nonagricultural use
and that which has cover of buildings, transport, communication, utilities in
association with water, vegetation and vacant lands. This feature is identified on
the imagery by its dark bluish green to bluish tone, definite size and shape and
texture.
2.Cropland
It includes those lands with standing crops as on the date of the satellite
imagery. The crops are of kharif, rabi or khariftrabi seasons.ln this category
crop land is shown in the form of double crop and kharif unirrigated areas The
tonal contrast of crop land varies from bright red to red which may signify
greenness of the foliage, different stages of the crop growth, phenological
condition besides the nature of soil, type of terrain etc.
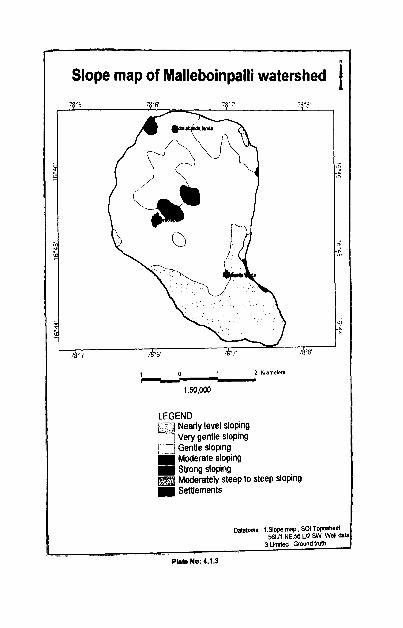
I Slope map of Malleboinpalli watershed I
LEGEND C7;7 Nearly level sloplng
1 Very gentle sloping U Gentle sloplng
Moderate sloplng Strong sloplng Moderately steep to steep SlOplng Settlements
I
I Datable 1 Slop map SO1 T o ~ h e a
W l N E 5 8 V 2 S W W d l h
I 3 bmctad Ground truth C -
Plats No: 4.1.3
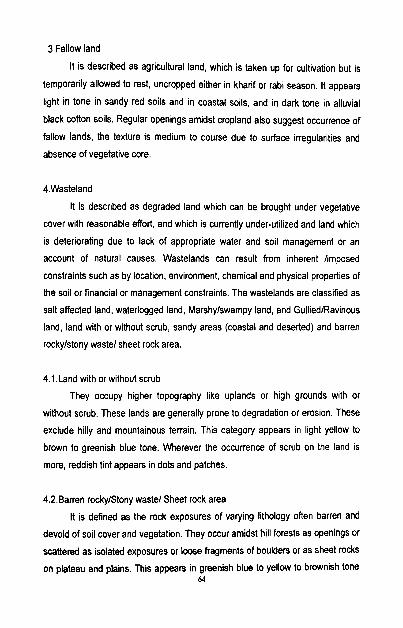
3.Fallow land
It is described as agricultural land, which is taken up for cultivation but is
temporarily allowed to rest, uncropped either in kharif or rabi season. It appears
light in tone in sandy red soils and in coastal soils, and in dark tone in alluvial
black cotton soils. Regular openings amidst cropland also suggest occurrence of
fallow lands, the texture is medium to course due to surface irregularities and
absence of vegetative core.
4.Wasteland
It is described as degraded land which can be brought under vegetative
cover with reasonable effort, and which is currently under-utilized and land which
is deteriorating due to lack of appropriate water and soil management or an
account of natural causes. Wastelands can result from inherent limposed
constraints such as by location, environment, chemical and physical properties of
the soil or financial or management constraints. The wastelands are classified as
salt affected land, waterlogged land, Marshylswampy land, and GulliedlRavinous
land, land with or without scrub, sandy areas (coastal and deserted) and barren
rockylstony wastel sheet rock area.
4.1.Land with or without scrub
They occupy higher topography like uplands or high grounds with or
without scrub. These lands are generally prone to degradation or erosion. These
exclude hilly and mountainous terrain. This category appears in light yellow to
brown to greenish blue tone. Wherever the occurrence of scrub on the land is
more, reddish tint appears in dots and patches.
4.2.Barren rockylstony wastel Sheet rock area
It is defined as the rock exposures of varying lithology often barren and
devoid of soil cover and vegetation. They occur amidst hill forests as openings or
scattered as isolated exposures or loose fragments of boulders or as sheet rocks
on plateau and plains. This appears in greenish blue to yellow to brownish tone 64
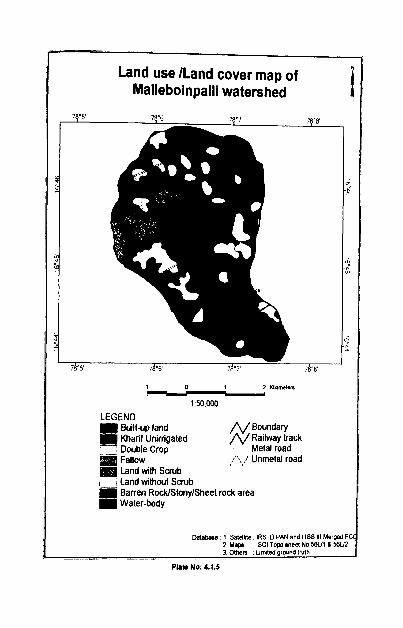
I ., ; Unmetal road
LJ Land mthwt Saub
I
Plrb No: 4.1.5
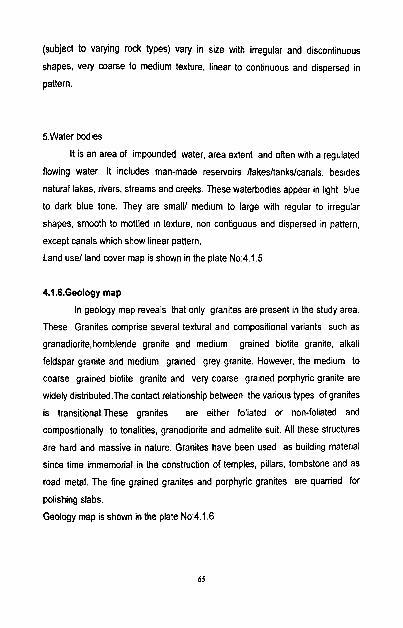
(subject to varying rock types) vary in size with irregular and discontinuous
shapes, very coarse to medium texture, linear to continuous and dispersed in
pattern.
5.Water bodies
It is an area of impounded water, area extent and often with a regulated
flowing water. It includes man-made reservoirs Ilakesltankslcanals, besides
natural lakes, riven, streams and creeks. These waterbodies appear in light blue
to dark blue tone. They are small1 medium to large with regular to irregular
shapes, smooth to mottled in texture, non contiguous and dispersed in pattern,
except canals which show linear pattern.
Land use1 land cover map is shown in the plate No:4.1.5
4.1.6.Geology map
In geology map reveals that only granites are present in the study area.
These Granites comprise several textural and compositional variants such as
granadiorite,hornblende granite and medium grained biotite granite, alkali
feldspar granite and medium grained grey granite. However, the medium to
coarse grained biotite granite and very coarse grained porphyric granite are
widely distributed.The contact relationship between the various types of granites
is transitional.These granites are either foliated or non-foliated and
compositionally to tonalities, granodiorite and admelite suit. All these structures
are hard and massive in nature. Granites have been used as building material
since time immemorial in the construction of temples, pillars, tombstone and as
road metal. The fine grained granites and porphyric granites are quarried for
polishing slabs.
Geology map is shown in the plate No:4.1.6
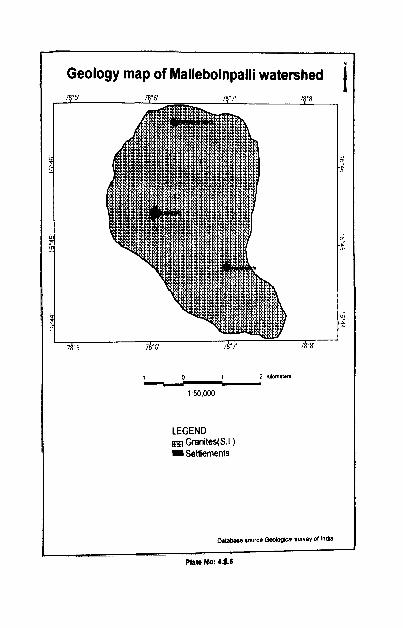
Geology map of Malleboinpalli watershed
1 0 1 2 lOlomrten
1 50 000 I
I
Ontabre source Gedwcd luww lnda
Phm No: 4+6
LEGEND Gran~tes(S L) I Settlements
i I
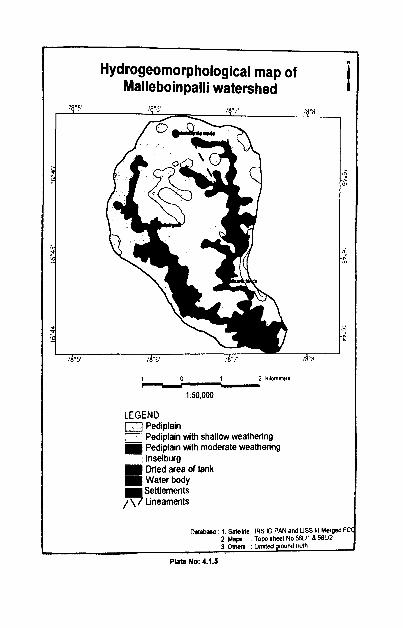
HydrogeomorphologicaI map of Malleboinpalli watershed
LEGEND a Ped~pla~n 0 Ped~plaln wth shallow weathenng
Ped~plaln wth moderate weathenng U Inselburg
Dned area of tank Water body Settlements ,!! Ltneaments
Database 1 Satsllne IRS ID PAN and USS Ill Msrpsd FC 2 M a p T o p sheet No SBUl B 58VZ
- . - - 3 Other8 hmnd prwnd lrbih
Phta No: 4.1.6
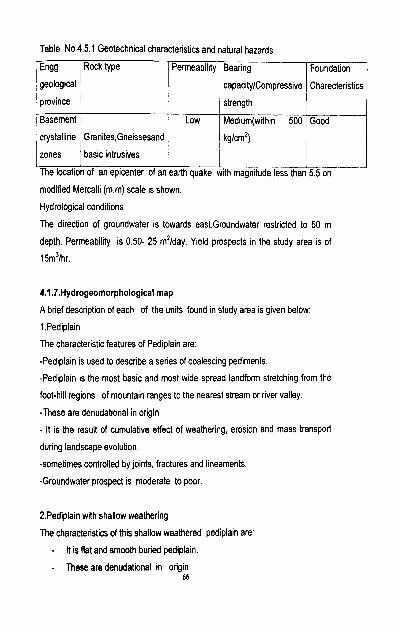
modified Mercalli (m.m) scale is shown.
Hydrological conditions
Table No 4.5.1 Geotechnical characteristics and natural hazards
The direction of groundwater is towards east.Groundwater restricted to 60 m
Engg geological
province
Basement
crystalline
zones
depth. Permeability is 0.50- 25 m21day. Yield prospects in the study area is of
15m31hr.
4.1.7.Hydrogeomorphological map
A brief description of each of the units found in study area is given below:
1 .Pediplain
The characteristic features of Pediplain are:
-Pediplain is used to describe a series of coalescing pediments.
-Pediplain is the most basic and most wide spread landform stretching from the
foot-hill regions of mountain ranges to the nearest stream or river valley.
-These are denudational in origin
- It is the result of cumulative effect of weathering, erosion and mass transport
during landscape evolution.
-sometimes controlled by joints, fractures and lineaments.
-Groundwater prospect is moderate to poor.
The location of an epicenter of an earth quake with magnitude less than 5.5 on
Rock type
Granites,Gneissesand
basic intrusives
2.Pediplain with shallow weathering
The characteristics of this shallow weathered pediplain are: - It is flat and smooth buried pediplain.
- These are denudational in origin 66
Permeability
Low
Bearing
capacitylCompressive
strength
Medium(within 500
kg/cm2)
Foundation
Charecteristics
Good
- Thickness of overburden is 0-5m
- It comprises of alluviallcolluvial soils.
- The structure may be crisscrossed by lineamentslfractures.
- Suitable for shallow aquifers in weathered zone . - Fractureslfaultl lineament concentrated zone posses good groundwater
prospect
- Normally groundwater prospect is Moderate to poor.
3.Pediplain with moderate weathering
The characteristics of moderately weathered pediplain are: - It is flat and smooth pediplain.
- These are denudational in origin
- Thickness of overburden is 5-20m
- It comprises with alluviallcolluvial soils
- The structure may be crisscrossed by lineamentslfractures
- Generally favourable for shallow aquifers
- Groundwater prospect is Moderate
4.lnselberg
The charecteristic features of Inselberg are:
-These are denudational in origin
-Having variable lithology
-Residual isolated hill standing above the ground level of sorrounding
pediplain:
-Barren and rocky
-Groundwater is poor
5.Lineaments
-These are structural in origin
-Faults /fractures of varying length and breadth
-A good source of groundwater
Hydrogeomorphology map is shown in the plate No:4.1.7
4.1.8.Groundwater prospect map
Basing on the hydrogeomorphology map groundwater prospect classes
identified are
1. Good
2. Modearate.
3. Moderate to poor
4. Poor
Delineated groundwater prospect classes are shown in the Plate No:4.1.8
4.1.9.Soil map
Identified soil map units are of following
1 .Coarse loamy typic ustothents, loamy skeletal lithic ustropepts
2.Fine loamy typic Haplostalts, loamy skeletal typic haplostalts.
3.Fine loamy typic ustropepts (sodic), fine typic ustropepts (sodic), fine loamy
fluentic ustorthents
4.Fine loamy typic ustropepts,coarse loamy typic ustifluvents
5.Fine typic ustropepts, fine vertic ustropepts
6.Loamy skeletal lithic ustorthents
7.Loamy skeletal lithic ustorthents coarse loamy typic ustorthents
&Loamy skeletal lithic ustropepts, loamy skeletal typic haplostalts
9.Loamy skeletal typic ustropepts, loamy skeletal typic haplostalts
Soil map is shown as plate No:4.1.9
4.1,lO.Land capability map
Land capability mapping units of study area are as follows
1. Good cultivable land with minor limitations.
2. Moderately good land with major limitations.
3. Fairly good land suited for occasional or limited cultivation. 68
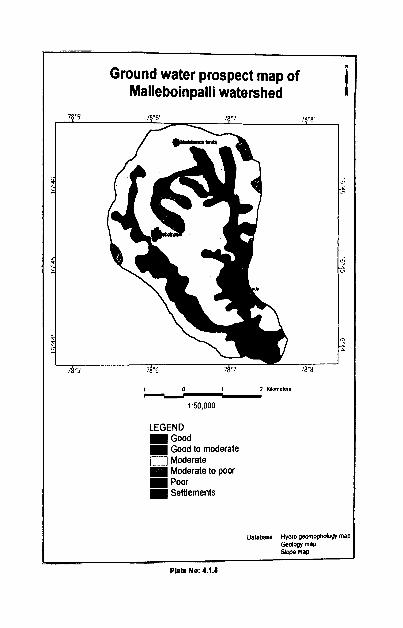
Ground water prospect map of Malleboinpalli watershed
LEGEND Good Good to moderate n Moderate Moderate to poor Poor Settlements
Databas ~ y d r o womophdw map Cddw map Slw map
P*Ia No: 4.1.8
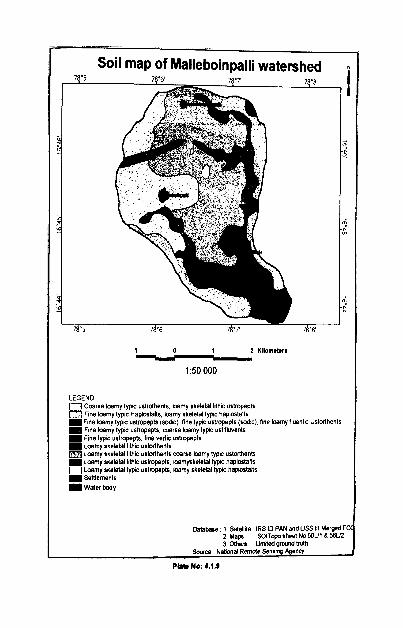
Plra No: 4.1.8
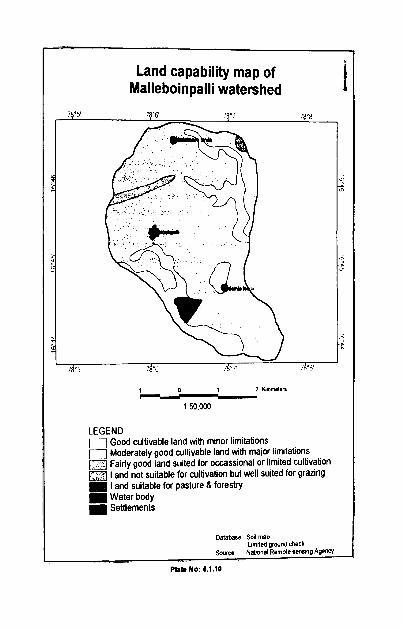
Land capability map of Malleboinpalli watershed I
LEGEND Good wltrvable land mth mlnor l~m~tat~ons 0 Moderately good wlt~vable land mth major lirnitatrons 0 Fairly good land su~ted for occass~onal or l~m~ted culbvat~on a Land not suitable for cultrvabon but well su~ted for grazlng
Land suitable for pasture 8 forestry Water body Settlements
Database So11 map iimned vwnd check
Soutce ~ a o o n 3 Rmde aens~ng Acncl -- - - -
Ph(s No: 4.1.10
4. Land not suitable for cultivation but well suited for grazing or forestry.
5. Land suitable for pasture and forestry.
Land capability map is shown in the Plate No:4.1.10
4.1.11.Land irrigability map
Land irrigability classes identified from soil map are:
1. Lands that have moderate limitation for sustained use under irrigation.
2. Lands that have severe limitation for sustained use under irrigation.
3. Lands that are marginal for sustained use under irrigation because of very
severe limitations.
4. Lands not suitable for sustained use under irrigation.
Land irrigability classes are shown in the plate No:4.1 11
4.1.12.Tansport network, settlements and village boundaries
Identified transport network involves broad gauge of railway line from
Secunderabad to Kurnool and state high ways of road network Hyderabad to
Mahaboobnagar and Hyderabad to kurnool. Three settlements identified in the
watershed area are Malleboinpalli, Nakkalabanda thanda and Esaikunta
tanda.village boundaries for these settlements are also drawn.
This transportation map is shown in the Plate No:4.1 . I2
4,2 Drain; iorphometry
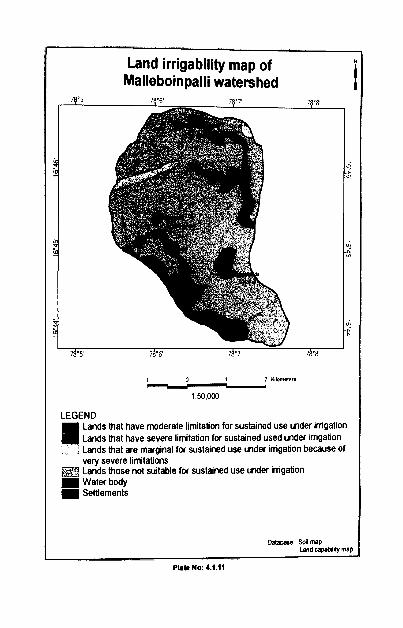
Land irrigability map of Malleboinpalli watershed
LEGEND Lands that have moderate IirnilaCon for sustained use under irrigation Lands that have severe limitation for sustained used under irrigation Lands that are marginal for sustained use under irrigation because of very severe limitations Lands those not suitable for sustained use under irrigation Water body Settlements
I m b a e scilrnap Land capabl$ map L --- ---
Phb No: 4.1.11
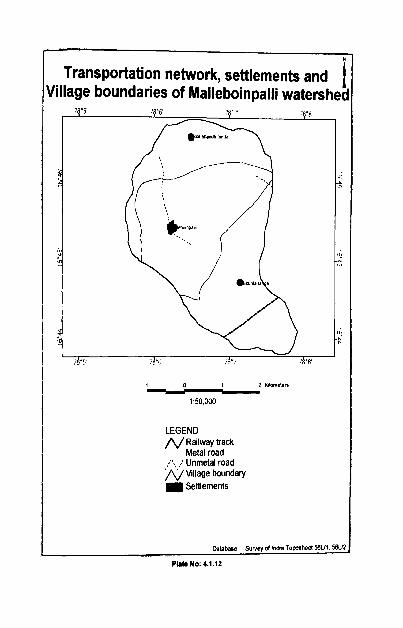
Pbb No: 4.1.12
- -
Transportation network, settlements and i Village boundaries of Malleboinpalli watershed
I
I 0 1 2 Klbmaters
1 50 000
LEGEND N Ra~lway track
Metal road ;*, ; Unmetal road N V i l l a g e boundary
Settlements
m t a s e Survey PllnCa Towkd WJl E&Q -- - -
I
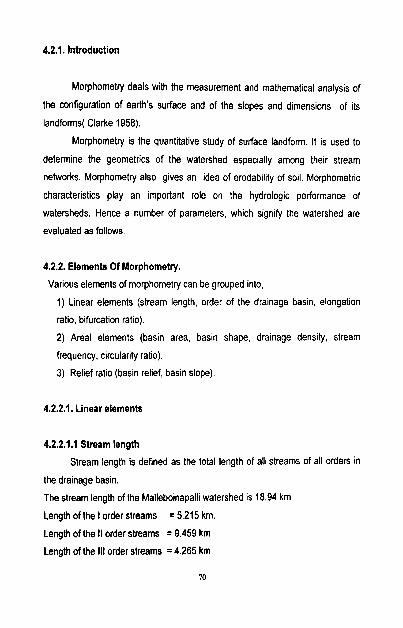
4.2.1. Introduction
Morphometry deals with the measurement and mathematical analysis of
the configuration of earth's surface and of the slopes and dimensions of its
landforms( Clarke 1958).
Morphometry is the quantitative study of surface landform. It is used to
determine the geometries of the watershed especially among their stream
networks. Morphometry also gives an idea of erodability of soil. Morphometric
characteristics play an important role on the hydrologic performance of
watersheds. Hence a number of parameters, which signify the watershed are
evaluated as follows.
4.2.2. Elements Of Morphometry.
Various elements of morphometry can be grouped into,
1) Linear elements (stream length, order of the drainage basin, elongation
ratio, bifurcation ratio).
2) Areal elements (basin area, basin shape, drainage density, stream
frequency, circularity ratio).
3) Relief ratio (basin relief, basin slope).
4.2.2.1. Linear elements
4.2.2.1.1 Stream length
Stream length is defined as the total length of all streams of all orders in
the drainage basin.
The stream length of the Malleboinapalli watershed is 18.94 km
Length of the l order streams = 5.215 km.
Length of the II order streams = 9.459 km
Length of the Ill order streams = 4.265 km
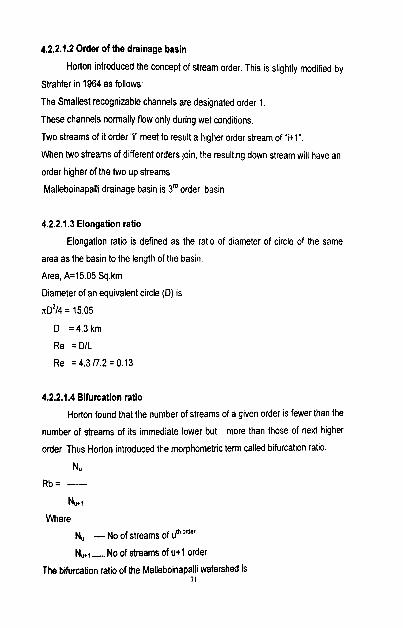
4.2.2.1.2 Order of the drainage basin
Horton introduced the concept of stream order. This is slightly modified by
Strahter in 1964 as follows:
The Smallest recognizable channels are designated order 1
These channels normally flow only during wet conditions.
Two streams of it order "i" meet to result a higher order stream of " i t l " .
When two streams of different orders join, the result~ng down stream will have an
order higher of the two up streams
Malleboinapalli drainage basin is 31d order basin
4.2.2.1.3 Elongation ratio
Elongation ratio is defined as the ratio of diameter of circle of the same
area as the basin to the length of the basin.
Area, A215.05 Sq.km
Diameter of an equivalent circle (D) is
n ~ ~ / 4 = 15.05
D = 4.3 km
Re = DIL
Re = 4 . 3 n . 2 = 0.13
4.2.2.1.4 Bifurcation ratio
Horton found that the number of streams of a given order is fewer than the
number of streams of its immediate lower but more than those of next higher
order. Thus Horton introduced the morphometric term called bifurcation ratio.
Nu Rb. ----
Nuti
Where
Nu -No of streams of um0"'
Nu+, -No of streams of u+ l order
The bifurcation ratio of the Malleboinapalli watershed is 71
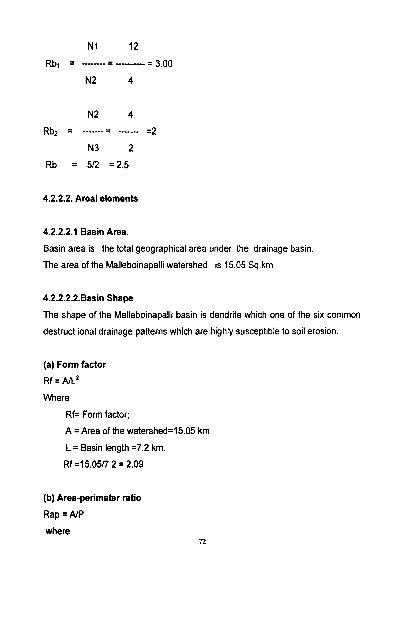
4.2.2.2. Areal elements
4.2.2.2.1 Basin Area.
Basin area is the total geographical area under the drainage basin.
The area of the Malleboinapalli watershed is 15.05 Sq.km
4.2.2.2.2.Basin Shape
The shape of the Malleboinapall~ basin is dendrite which one of the six common
destruct ional drainage patterns which are highly susceptible to soil erosion.
(a) Form factor
~f = AIL^ Where
Rf= Form factor;
A =Area of the watershed=15.05 km
L = Basin length ~ 7 . 2 km.
Rf =15.05/7.2 = 2.09
(b) Area-perimeter ratio
Rap = AIP
where
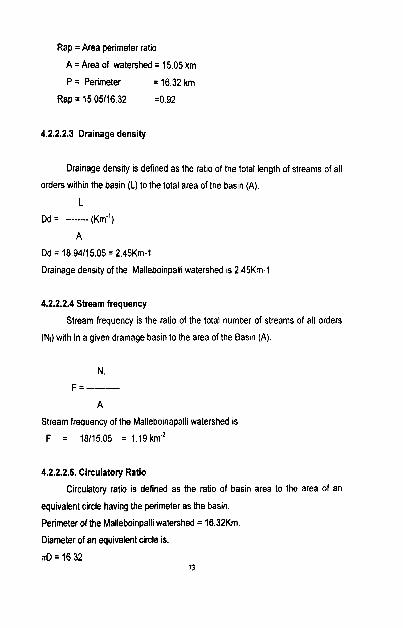
Rap = Area perimeter ratio
A = Area of watershed = 15.05 km
P = Perimeter = 16.32 km
Rap = 15.05116.32 ~ 0 . 9 2
4.2.2.2.3 Drainage density
Drainage density is defined as the ratio of the total length of streams of all
orders within the basin (L) to the total area of the basin (A).
L Dd = --.--- (~m.')
A
Dd = 18.94115.05 = 2.45Km-1
Drainage density of the Malleboinpall~ watershed is 2.45Km-1
4.2.2.2.4 Stream frequency
Stream frequency is the ratio of the total number of streams of all orders
(N,) with in a given drainage basin to the area of the Bas~n (A).
N, F . - -
A
Stream frequency of the Malleboinapalli watershed IS
F = 18115.05 = 1.19km'2
4.2.2.2.5. Circulatory Ratio
Circulatory ratio is defined as the ratio of basin area to the area of an
equivalent circle having the perimeter as the basin.
Perimeter of the Malleboinpalli watershed = 16.32Km
Diameter of an equivalent circle is,
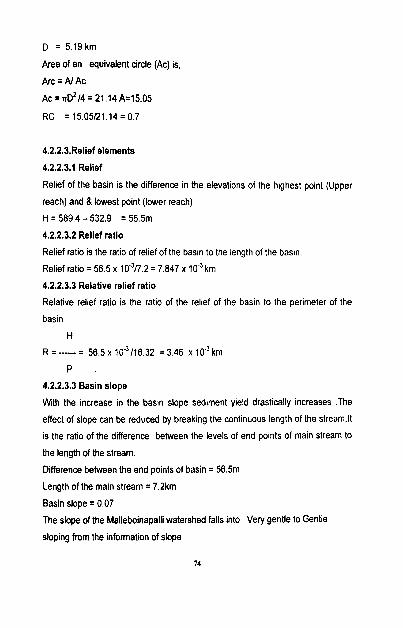
D = 5.1Qkm
Area of an equivalent circle (Ac) is,
Arc = Al Ac
Ac= nIl214 =21.14A=15.05
RC = 15.05121.14 = 0.7
4.2.2.3.Relief elements
4.2.2.3.1 Relief
Relief of the basin is the difference in the elevations of the highest point (Upper
reach) and &lowest point (lower reach)
H = 589.4 - 532.9 = 56.5111
4.2.2.3.2 Relief ratio
Relief ratio is the ratio of relief of the basin to the length of Ihe basin.
Relief ratio = 56.5 x lU'n.2 = 7.847 x 10" km
4.2.2.3.3 Relative relief ratio
Relative relief ratio is the ratio of the relief of the basin to the perimeter of the
basin
H
R = = 5 6 . 5 ~ 1U3116.32 = 3.46 x 1O"krn
P .
4.2.2.3.3 Basin slope
W~th the increase in the basin slope sediment yield drastically increases .The
effect of slope can be reduced by breaking the continuous length of the stream.lt
is the ratio of the difference between the levels of end points of main stream to
the length of the stream.
Difference between the end points of basin = 56.5m
Length of the main stream = 7.2km
Basin slope = 0.07
The slope of the Malleboinapalli watershed falls into Very gentle to Gentle
sloping from the information of slope
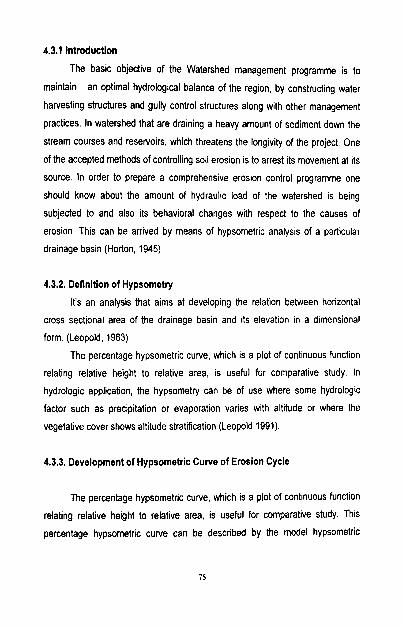
4.3.1 Introduction
The basic objective of the Watershed management programme is to
maintain an optimal hydrological balance of the region, by constructing water
harvesting structures and gully control structures along with other management
practices. In watershed that are draining a heavy amount of sediment down the
stream courses and reservoirs, which threatens the longivity of the project. One
of the accepted methods of controlling soil erosion is to arrest its movement at its
source. In order to prepare a comprehensive erosion control programme one
should know about the amount of hydraulic load of the watershed is being
subjected to and also its behavioral changes with respect to the causes of
erosion. This can be arrived by means of hypsometric analysis of a particular
drainage basin.(Horton, 1945)
4.3.2. Definition o f Hypsometry
It's an analysis that aims at developing the relation between horizontal
cross sectional area of the drainage basin and its elevation in a dimensional
form. (Leopold, 1963)
The percentage hypsometric curve, which is a plot of continuous function
relating relative height to relative area, is useful for comparative study. In
hydrologic application, the hypsometry can be of use where some hydrologic
factor such as precipitation or evaporation varies with altitude or where the
vegetative cover shows altitude stratification (Leopold 1991).
4.3.3. Development o f Hypsometric Curve of Erosion Cycle
The percentage hypsometric curve, which is a plot of continuous function
relating relative height to relative area, is useful for comparative study. This
percentage hypsometric curve can be described by the model hypsometric
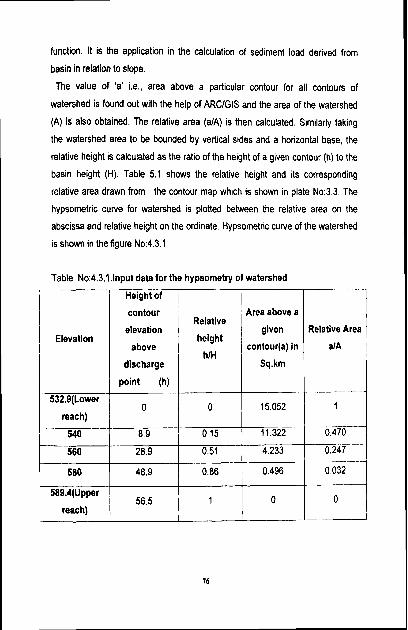
function. It is the application in the calculation of sediment load derived from
basin in relation to slope.
The value of 'a' i.e., area above a particular contour for all contours of
watershed is found out with the help of ARClGlS and the area of the watershed
(A) is also obtained. The relative area @/A) is then calculated. Similarly taking
the watershed area to be bounded by vertical sides and a horizontal base, the
relative height is calculated as the ratio of the height of a given contour (h) to the
basin height (H). Table 5.1 shows the relative height and its corresponding
relative area drawn from the contour map which is shown in plate No:3.3 The
hypsometric curve for watershed is plotted between the relative area on the
abscissa and relative height on the ordinate. Hypsometric curve of the watershed
is shown in the figure No:4.3.1
Table No:4.3.l.lnput data for the hypsometry of watershed [ / Height of I --1
reach) I I
Elevation i I
contour
elevation
above
discharge
Relative
height
hlH
Area above a
given
contour(a) in
Sq.km
Relative Area
alA
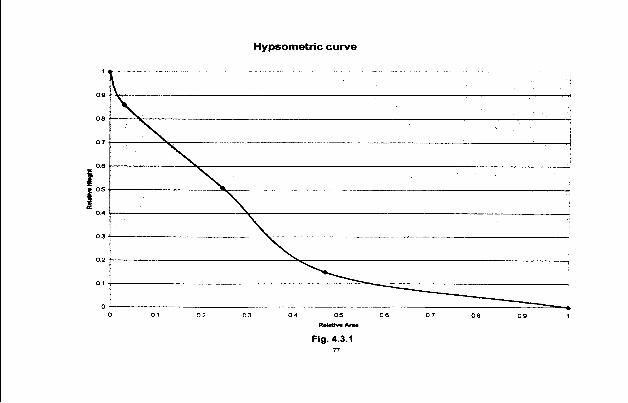
Hypsometric curve
Fig. 4.3.1 77
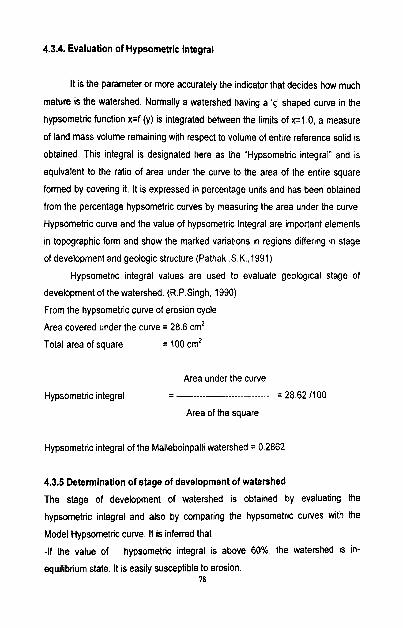
4.3.4. Evaluation of Hypsometric Integral
It is the parameter or more accurately the indicator that decides how much
mature is the watershed. Normally a watershed having a '(' shaped curve in the
hypsometric function x=f (y) is integrated between the limits of x=1.0, a measure
of land mass volume remaining with respect to volume of entire reference solid is
obtained. This integral IS designated here as the "Hypsometric integral" and is
equivalent to the ratio of area under the curve to the area of the entire square
formed by covering it. It is expressed in percentage units and has been obtained
from the percentage hypsometric curves by measuring the area under the curve.
Hypsometric curve and the value of hypsometric Integral are important elements
in topographic form and show the marked variations in regions d~ffering in stage
of development and geologic structure (Pathak .S.K.,1991)
Hypsometric integral values are used to evaluate geological stage of
development of the watershed. (R.P.Singh, 1990)
From the hypsometric curve of erosion cycle
Area covered under the curve = 28.6 cm2
Total area of square = 100 cm2
Area under the curve
Hypsometric integral = --- .- ---- - - - - - --. -- - - - - - - - - - = 28.62 I100
Area of the square
Hypsometric integral of the Malleboinpalli watershed = 0.2862
4.3.5 Determination of stage of development of watershed
The stage of development of watershed is obtained by evaluating the
hypsometric integral and also by comparing the hypsometric curves with the
Model Hypsometric curve. It is inferred that
-If the value of hypsometric integral is above 60%, the watershed IS in-
equilibrium state. It is easily susceptible to erosion. 78
-If the value is in between 35% to 60%, the watershed is in equilibrium stage. (It
is in mature stage and will be less susceptible to erosion than in equilibrium
stage). (Vintechow; 1963)
-If the value of the Hypsometric Integral is less than 35%, the watershed is in
monadnock phase i.e., it is the most stable or least susceptible to erosion among
the known stages.
Malleboinpalli watershed is in Monadnock stage.
: d computation
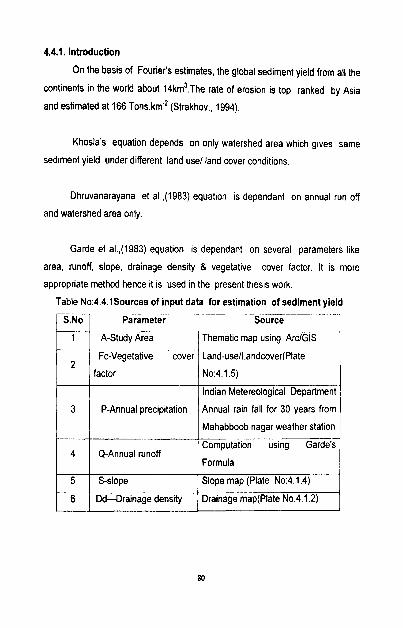
4.4.1. Introduction
On the basis of Fourier's estimates, the global sediment yield from all the
continents in the world about 14km3.~he rate of erosion is top ranked by Asia
and estimated at 166 ~ons.km" (Strakhov., 1994).
Khosla's equation depends on only watershed area which gives same
sediment yield under different land use1 land cover conditions.
Dhruvanarayana et a1.,(1983) equation is dependant on annual run off
and watershed area only
Garde et a1.,(1983) equation is dependant on several parameters like
area, runoff, slope, drainage density 8 vegetative cover factor. It is more
appropriate method hence it is used in the present thesis work
Table No:4.4.1Sources of input data for estimation of sediment yield
S.No
1
2
3
4
5
6
Parameter
A-Study Area
Fc-Vegetative cover
factor
P-Annual precipitation
Q-Annual runoff
S-slope
Dd-Drainage density
Source -. - - - - .-
Thematic map using ArclGlS
Land-uselLandcover(Plate
No:4.1.5)
Indian Metereological Department
Annual rain fall for 30 years from
Mahabboob nagar weather station - .
Computation using Garde's
Formula
Slope map (Plate No:4.1.4)
Drainage map(Plate No:4.1.2)
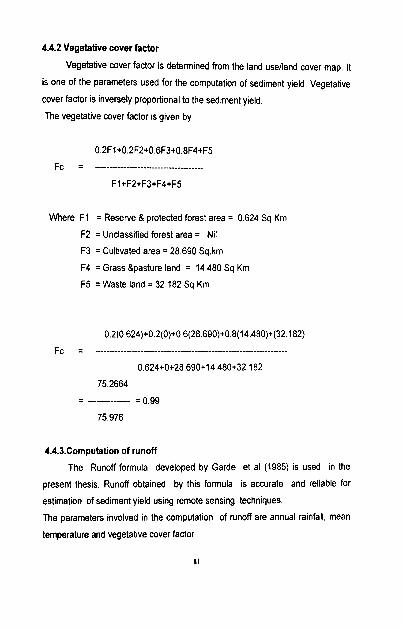
4.4.2 Vegetative cover factor
Vegetative cover factor is determined from the land uselland cover map. It
is one of the parameters used for the computation of sediment yield. Vegetative
cover factor is inversely proportional to the sediment yield.
The vegetative cover factor is given by
Where F1 = Reserve & protected forest area = 0.624 Sq.Km
F2 = Unclassified forest area = Nil
F3 = Cultivated area = 28.690 Sq.km
F4 = Grass &pasture land = 14.480 Sq Km
F5 =Waste land = 32.182 Sq Km
4.4.3.Cornputation o f runoff
The Runoff formula developed by Garde et al (1985) IS used in the
present thes~s. Runoff obtained by this formula is accurate and reliable for
estimation of sediment yield using remote sensing techniques.
The parameters involved in the computation of runoff are annual rainfall, mean
temperature and vegetative cover factor
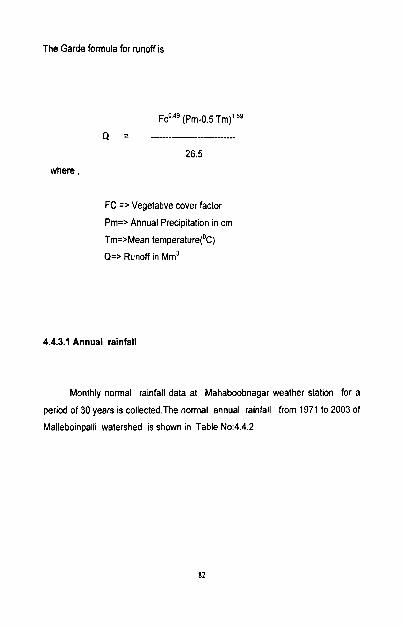
The Garde formula for runoff is
where,
FC => Vegetative cover factor
Pm=> Annual Precipitation in cm
Trn=>Mean temperature('^) Q=> Runoff in ~ r n ~
4.4.3.1 Annual rainfall
Monthly normal rainfall data at Mahaboobnagar weather station for a
period of 30 years is collected.The normal annual rainfall from 1971 to 2003 of
Malleboinpalli watershed is shown in Table No:4.4.2
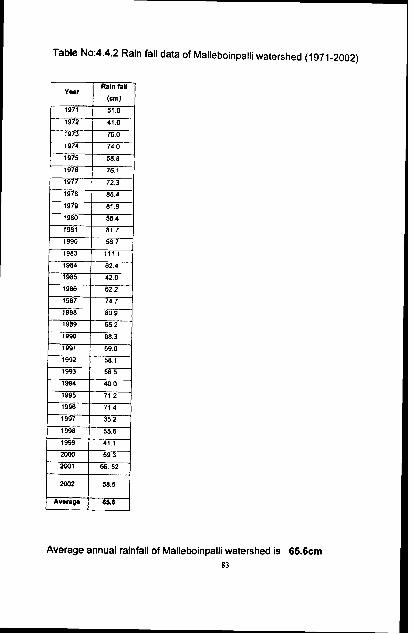
Table No:4.4.2 Rain fall data of Malleboinpalli watershed (1971-2002)
Average arinual rainfall of Malleboinpalli watershed is 65.6cm 83
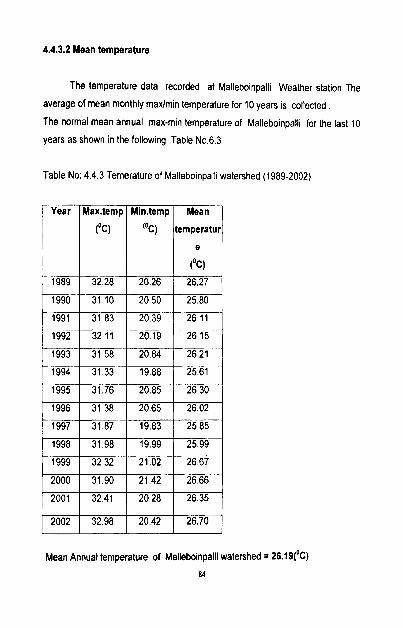
4.4.3.2 Mean temperature
The temperature data recorded at Malleboinpalli Weather station The
average of mean monthly maxlrnin temperature for 10 years is collected . The normal mean annual max-min temperature of Malleboinpalli for the last 10
years as shown in the following Table No.6.3
Table No: 4.4.3 Temerature of Malleboinpalli watershed (1989-2002)
Mean Annual temperature of Malleboinpalli watershed = 26.19('~) 84
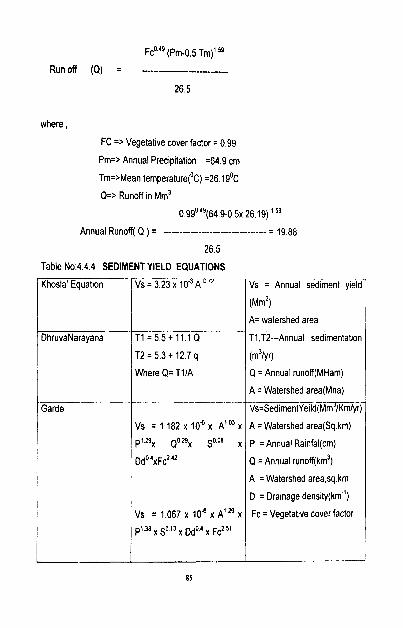
FcO." (Pm-0.5 ~ m ) ' 59
Run off (Q) = --- ------.. -..
Garde
Vs = 1 1 8 2 ~ 1 0 ~ x A " ~ X
where,
FC => Vegetative cover factor = 0.99
Pm=> Annual Precipitation =64.9 cm
Tm=>Mean temperature('^) = 2 6 . 1 9 ~ ~
Q=> Runoff in ~ m '
0.99'~'(64.9-0.5x 26.19) ' 59
Annual Runoff( Q ) = = 19.88
26.5
Table NoA4.4 SEDIMENT YIELD EQUATIONS
~ s = ~ e d i m e n t ~ d d ~ ~ m ~ m ~ T
A =Watershed area(Sq km)
P =Annual Rainfal(cm)
Q = Annual runoff(km3)
A =Watershed area,sq.km
D = Drainage density(km")
Fc = Vegetative cover factor
- - -- - . . . -. . Vs = Annual sedlment yield
(Mm2)
A= watershed area -. -
T1,TZ-.-Annual sedimentation
(m31yr) Q = Annual runoff(MHam)
A = Watershed area(Mha)
Khosla' Equation I Vs = 3.23 x 10" A '"
I DhruvaNarayana T I = 5.5 + 11.1 Q
T2 = 5.3 + 12.7 q
Where Q= Tl lA
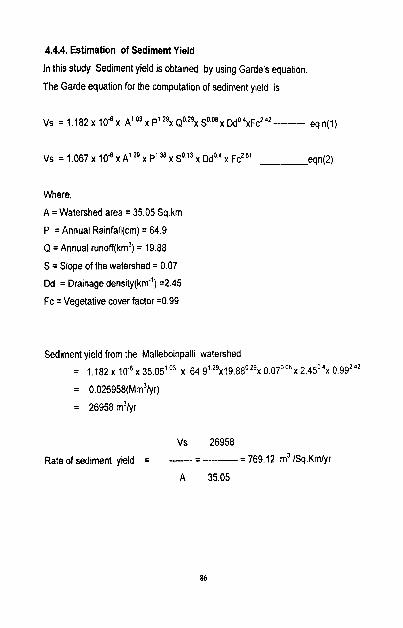
4.4.4. Estimation of Sediment Yield
In this study Sediment yield is obtained by using Garde's equation
The Garde equation for the computation of sediment yield is
Where,
A = Watershed area = 35.05 Sq.km
P =Annual Rainfall(cm) = 64.9
Q =Annual runoff(km3) = 19.88
S = Slope of the watershed = 0.07
Dd = Drainage density(km") ~ 2 . 4 5
Fc = Vegetative cover factor ~ 0 . 9 9
Sediment yield from the Malleboinpalli watershed
= 1.182 x iv6 x 35.05' O3 x 64.9' 2 9 ~ i 9 . 8 8 0 2 9 ~ o . 0 7 ~ ~ ~ ~ 2.4504x 0 . 9 9 ~ ~ ~
= 0.02695t?(~m~l~r)
= 26958 m31yr
Vs 26958
Rate of sediment yield = ----- = ------ = 769.12 m3 1Sq.Kmlyr
A 35.05
4!i Integration : rat ion o l Aetion plan
4.5.1 General
The objective of this study is to prepare action plan for the area, which is
optimally suitable to the terrain and to the productive potential of the local
resources so that the level of production is sustained without decline over time.
The various components of watershed management have to be
considered to ensure adequacy of planning to meet multitude of objectives.The
components are better appreciated when the problems of different land uses
prevalent in the watersheds are considered. Recommendations of this plan
considering the contemporary technology, resources including socio-economic
database, estimated drainage morphometric characteristics, erosion
characteristics, sediment loss, climatic and terrain parameters. Integration
of the prepared thematic maps (land uselland cover, slope, geomorphology,
groundwater potential, soils, land capabil~ty, land irrigability) is achieved
systematically through the following steps.
In the present study IRS-ID FCC and Toposheet are used in order to get
the landuseiland cover information along wrth other thematic information
required for watershed management like landuse /landcover,
hydrogeomorphology, drainage network & watershed boundary, slope, SOIL land
irrigability, land capability. The Garde et al method with the annual runoff
component is used to estimate the sediment yield of each watershed using
hypsometric analysis. In order to prepare the action plan map for both land and
water resources development of watershed, pressure of population, demand for
utilization of land use and the potential of the resources available should be
studied and demand for the optimal utilization of land units should also be
examined in the light of existing socioeconomic conditions. It is in this context
that socioeconomic data is collected by household survey and analyzed other
components of watershed management in view .
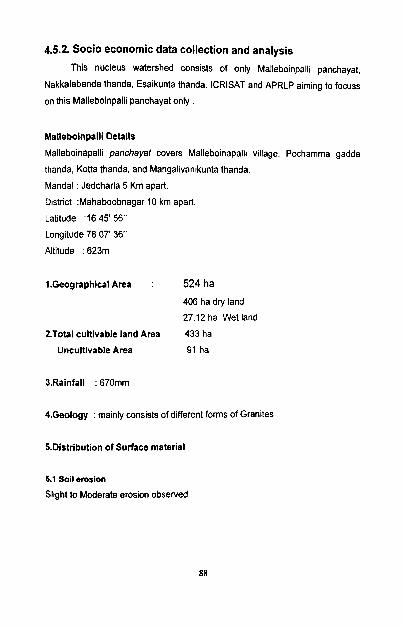
4.5.2. Socio economic data collection and analysis
This nucleus watershed consists of only Malleboinpalli panchayat,
Nakkalabanda thanda, Esaikunta thanda. ICRISAT and APRLP aiming to focuss
on this Malleboinpalli panchayat only .
Malleboinpalli Details
Malleboinapalli panchayat covers Malleboinapalli village, Pochamma gadda
thanda, Kotta thanda, and Mangalivanikunta thanda.
Mandal : Jedcharla 5 Km apart.
District :Mahaboobnagar 10 km apart.
Latitude :16 45' 56"
Longitude:76 07' 36"
Altitude : 623m
1.Geographical Area ; 524 ha
406 ha dry land
27.12 ha Wet land
2.Total cultivable land Area 433 ha
Uncultivable Area 91 ha
4.Geology : mainly consists of different forms of Granites
5.Distribution of Surface material
5.1 Soil erosion
Slight to Moderate erosion observed
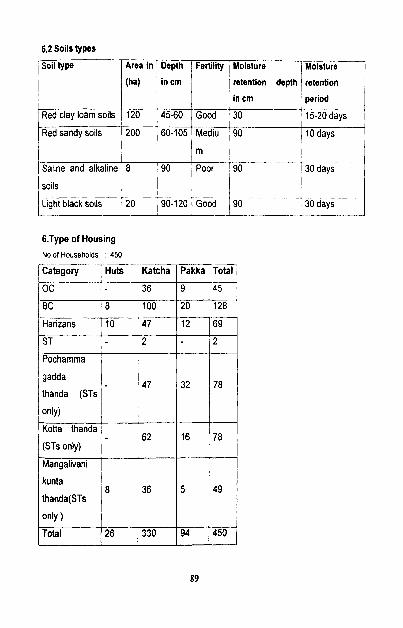
5.2 Soils types
-Soil type
Red clay loam soils
Red sandy soils
I Saline and alkaline
soils
-Light black soils
6.Type o f Housing No of Households 450
1 gadda
I thanda (STs
I only)
I I I I 1 Mangalivani I
Area in
(ha)
120
200
8
20
Total
45
128
69
2
1 Category
OC
BC I , Har~zans
r ST
: Pocharnrna
, Kotta thanda
I (STS only)
47
Depth
in crn
45-60
60-105
90
90-120
Huts
8
10
62
only )
Total
32
Fertility
Good
Mediu
rn
Poor
Good
Katcha
36
100
47
2
78
16
26
Pakka
9
20
12 -
78
Moisture
retention depth
in cm
30
90
, 90
90 . - -. - -
330
Moisture
retention
period
15-20 days
10 days
30 days'-
- ( l d a y s - - .. - - - -- --
94 450
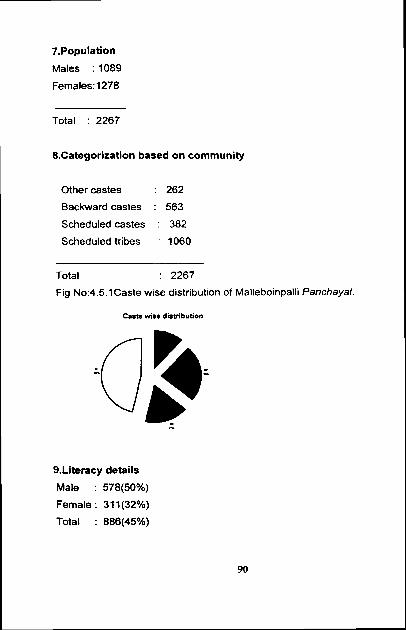
7.Population
Males : 1089
Females: 1278
Total : 2267
8.Categorization based on community
Other castes : 262
Backward castes : 563
Scheduled castes : 382
Scheduled tribes : 1060
Total : 2267
Fig No:4.5.1Caste wise distribution of Malleboinpalli Panchayat
9.Literacy details
Male : 578(50%)
Female : 31 1(32%)
Total : 886(45O/6)
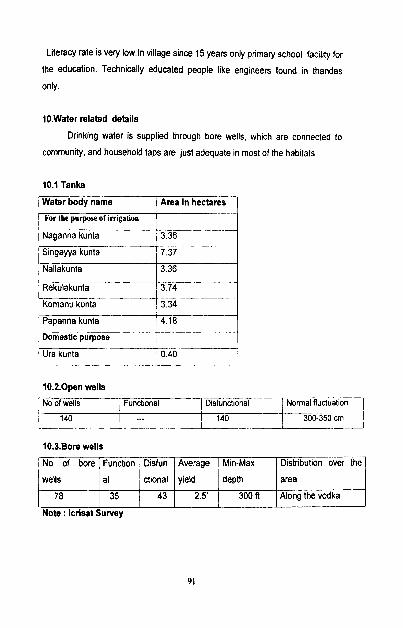
Literacy rate is very low.ln village since 15 years only primary school facility for
the education. Technically educated people like engineers found in thandas
only.
1O.Water related details
Drinking water is supplied through bore wells, which are connected to
community, and household taps are just adequate in most of the habitats
10.1 Tanks
I Water body name Area in hectares
' For the purpose of irrigation
Naganna kunta
Singayya kunta
10.2.0pen wells
Nallakunta
, Rekulakunta
Komanu kunta
t~apanna kunta
Domestic purpose
1 Ura kunta
3.36
3.74
3 34
4.18
0.40
No of wells Functional Disfunctional I Normal fluctuation-p
140
10.3.Bore wells
- 1 140 1 300-350 cm
No of bore
wells
78
Note : lcrisat Survey
Min-Max
depth
300 ft
Distribution over the
area
Along the vodka
Function
al
35
Disfun
ctional
43
Average
yield
2.5'
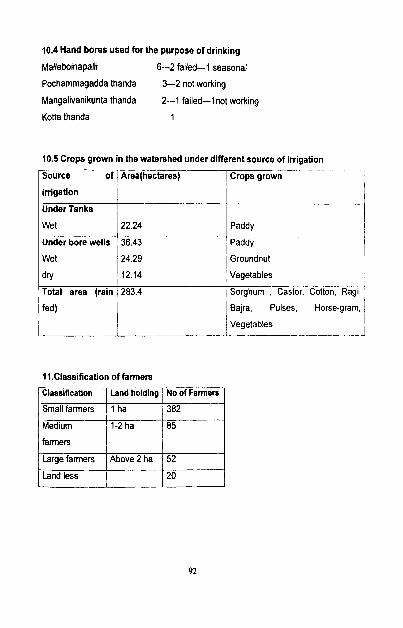
10.4 Hand bores used for the purpose of drinking
Malleboinapalli 6--2 failed--1 seasonal
Pochammagadda thanda 3-2 not working
Mangalivanikunta thanda 2--1 failed--1not working
Kotta thanda 1
10.5 Crops grown in the watershed under different source of irrigation -- -- . - . ..-
Source of I Area(hectares) I Crops grown 1 , irrigation 1 1 1
--- -- - - - Under Tanks
1 Wet 1 24.29 / Groundnut I
Wet
I Under bore wells
fed)
22 24
36 43
dry
Bajra, Pulses, Horse-gram.
Vegetables
Paddy
Paddy
1l.Classification o f farmers
I Classification Land holding No of Farmers
Medium 1-2 ha
farmers
i Large farmers Above 2 ha
Land less
12.14 Vegetables - . . -. . . -- -.
Total area (rain 1 283,4 Sorghum , Castor, Cotton, Ragi,

12.Cropping productivity
Major crops I Yield (kglha) 1 , Maize / 1250
Castor -1 l-1
Cotton
13. Livestock details
Malleboinapalli K.T P.G.T M.K.T
Cows 142 109 100 111
Goats
460 363 525
14.Econornic status
Most of the Harizans are under the BPL (Below poverty line). All these
people are land less. In village small farmers having the annual Income of less
than Rs 10,000. For the middle size farmers it is Rs 10,000 - Rs 20,000. For the
land lords which are very few in number having the income above Rs 20,000.
In Thandas there are government employees having Annual Income of
70,000Rs. Depletion of groundwater, failing of bore attempts and drying of
surfacewater bodies by hot summer results moving the people towards cities to
search for other livelihood options.This shows main effect on the cultivation by
that on economy of the people here.
15,Employment and Unemployment
In village most of the Harizans migrate to near by cities for work in
summer. Recently established Food corporation of India (FCI) plays an
important role in providing employment opportunities to the youth. Depletion of
groundwater, failing of bore attempts leading to the migration of labor ,and small
farmers. In Mangalivanikunta and Kotta thandas many people are government
employees working at somewhere having houses here.
16.Migration details
Most pathetic condition observed that IS about the migration. Most of the
people move to near by cities Jedcharla, Mahaboobnagar, Boothpoor and
Hyderabad. Their wages there for the women 50Rs per day and 70Rs per
day.for the works
17.Communication facilities
In village one post office and 10 telephone connections.
18.Health 8 Sanitation facilities
Here one primary health center and one Veterinary hospital. Only 20
latrines are observed in the village.
19.Asseb
20 members having two wheelers and 16 members having Autos (self
employment scheme) and 9 Tractors in the village.
2O.Transportation facilities
Malleboinpalli is in between the two main state ways one from Hyderabad to
Mahaboobnagar and another from Hyderabad to Kurnool. A small foot way of
1.5 Km connects village to the Mahaboobnagar Road another 2km foot way
connects second end of the village to kumwl. To the village previously there
was Government bus facility which is withdrawn later because of political
differentiations. Now Only auto facility is there for the villagers from Jedcherla,
which is mandal head quarters.
2l.Government schemes
w 30 ha of land is distributed to the among 35 members (15SC, 8 ST and rest BC with
1.68 ha balance).
I Under Balika sisu samrakshana padhakam 8 members benifitted. Under
Deepam padhakam 24 members benifitted. 12 women groups working here who
are aware of about savings and earnings.
r Loans are provided to 5 families of weaving under Self-employment scheme
Houses are constructed for under housing loan scheme for 15 members, Most
of the harizans are benifitted under this scheme.
21.1. ICRISAT Programmes
Research is going on increasing the agricultural productivity of thls area by
integrated crop management through soil observations, ensuring ava~lability of
good varieties of seeds and providing information for balanced fertilization to
the farmers
lntegrated Nutrient management
Through Nutrient Budgeting and balanced Fertilization trails, Vermicomposting
* Integrated Pest management
By applying village level HNPV production
Tropicultor was introduced for the farmers and training was also provided on
use and benefits of the tropicultor
r The farmers of the watershed were explained the benefits of Gliricid~a plants,
for which the farmers agreed to plant them, as a result 48,000 saplings were
planted on the %Id bunds of the farmers
Farmers awareness about the mixed cropping is enhanced.
* Construction of cattle pond for preserving the water and inventory on
groundwater
. Weather station and Runoff recorder was setup by the ICRISAT team and
manual rain gauges were also installed along with them.
Farmers awareness about people's participation in the application of
watershed programmes is sustainably improved..
22.lmpact by the Development programmes
Exposing farmers to new methods of technologies for managing natural
resources through training and field visits. Farmers evaluated improved crop
management practices (IPMBINM) along with improved land management
practices such as sowing on a BBF land form: flat sowing on contour and inter
cultural operations leading to good productivity of the land.
Vermi compost methodology not only increasing the nutrient supplying
capacity of the land but also generating income through Marketing.
4.5.3. Ground truth Analysis
4.5.3.1.General:
Malleboinapalli village is situated in the southern Telangana agro-eco
region under the influence of hot, semi arid region with a annual rainfall range of
500-700mm at Latitude :16' 45' 56"N and ~on~itude:78' 07'36"E aiming
location of study area.
This watershed lies in between the two major state highways Mahaboob
nagar to Hyderabad and other Hyderabad to Kurnool. There is 1.5 km and 3 km
cart tracks from the two state high ways respectively. The village is typically
varied in topography with a great deal of undulations affording a challenging
program on watershed management. It encompasses an area of totally 15.05
Sq.km. Large land holdings are more or less clustered in the south west part of
the watershed. Small land holdings are clustered in the eastern and thew south
eastern part of the village.
An assessment of hydrogeomorphology of the study area indicates the
presence of lineaments 10% of area represents good groundwater resources.
Inselberg occupy 0.34% of area and more than half of the rest(67.03%) under
Pediplain with shallow weathering conditions. 24.81% of the study area is under
the pediplain with moderate weathering. This moderately weathering pediplain is
crisscrossed by lineaments. 7.82% of the area comprises pediplain . Ground
water prospects are moderate to poor in half of the area, 20% of area with good
expectations and less than 10% of area has negligible exploitable groundwater
resources.
4.5.3.2.Suwey
First hand information was gathered from the villagers while my
socioeconomic survey. As we approach the village a typical rainfed system
ecosystem 0bSe~ed where rice and sorghum are major kharif crops. Soils are
eroded. Gliricidia on the sides of roads died. We observed that the first parcel of
the village with backward classes are of small farmers, they cultivate the land
only in rainy season. All the remaining time they just leave the land fallow. Next
to this block folward caste people occupied the village these are of medium to
high land holders. Most of these people having bore wells in their lands. Very
few of them cultivate the vegetables through bore well. Most of these people
are of literates. Third block of the village consists of Horizans. 95% of Harizans
having no single block of land. All of these are daily laborers .These people
migrate to near by towns in unseasonal conditions for works. Fourth block of
village includes thandas attached to this village are Pochamma gadda thanda,
Kotta thanda, Mangalivanikunta thanda, All these people are scheduled tribes.
They are having more or less land to cultivate .Lands of these people play main
contribution in the Malleboinapalli watershed. Pochammagadda thanda is just
attached to the village in the cart track way to wards Mahaboobnagar road.
Other two thandas are on the other side of the Mahaboobnagar state way.
4.5.3.3.Cultivation details
Rice is the major crop for food and profd. Sorghum is raised as fodder.
Castor cultivation is preferred because of monetary value and less labour
requirements. Farmers know that mixed cropping is a strategy of risk
minimization. Farmer replace rice with vegetables when water is scarce. But in
this summer all the tanks are dried. Because of the groundwater depletion and
lack of rainfall most of the land is lei? as fallow.
4.5.3.4.Lively hood analysis
An examination of livelyhood analysis reveals that the contribution of
agriculture to total income increased with farm size. Dryland farmers derive
one third of their total income from sheep rearing. Livestock significantly
contribute to the overall income of the small and marginal cultivators. Lively-
hood significantly contributes to the overall income of the small and marginal
cultivators. The drought conditions rose due to the lack of ra~nfall and depletion
of groundwater. Most of the villagers left the lands on summer of 2003 and
going for other works to the near by towns are Jedcharla and Mahaboobnagar.
Seventy percent of Harizans went for daily wage works to the near Jedcharla,
Mahaboobnagar and Bhoothpur. Recently established FCI plays an important
role in providing the employment opportunities for the youth in the watershed
area.
4.5.3.5.Trend analysis
Farmers reported a declining trend in the rainfall. The tank, stream and
wells in the village also are drying more frequently than earlier. The productivity
levels are reported to be falling overtime. They complained about the pest
incidence during recent years and declining work of labor due to migrabon.
education facilities are same as from last ten years. Thanda people having well
transportation facilities than villagers. They are bothered about the enormous
increasing of rates of vegetables mainly in summer. Health and Sanitation
facilities are increased from last 5 years. From their perception we found out that
the lands also degraded and by that low productivity from lands. Communication
facilities have increased from the time but those only used by the land lords of
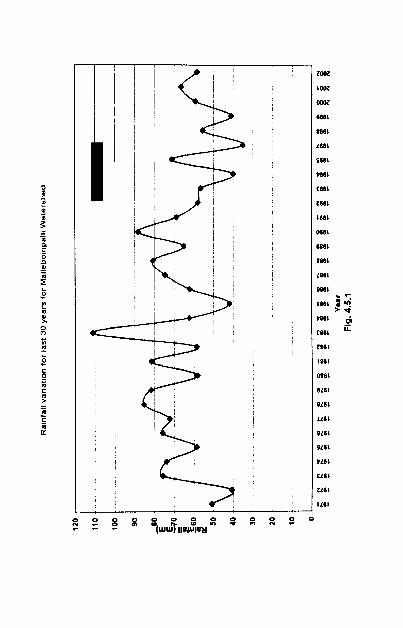
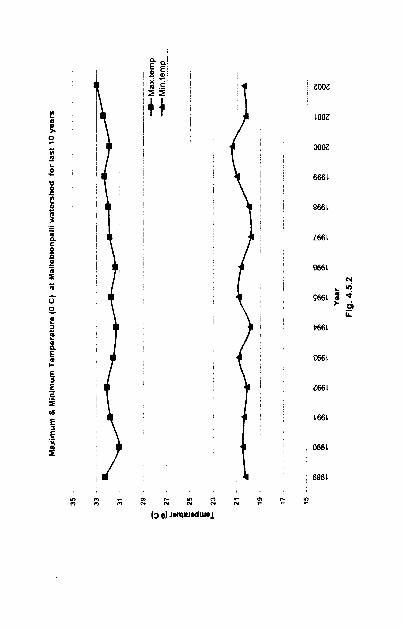
LOOZ
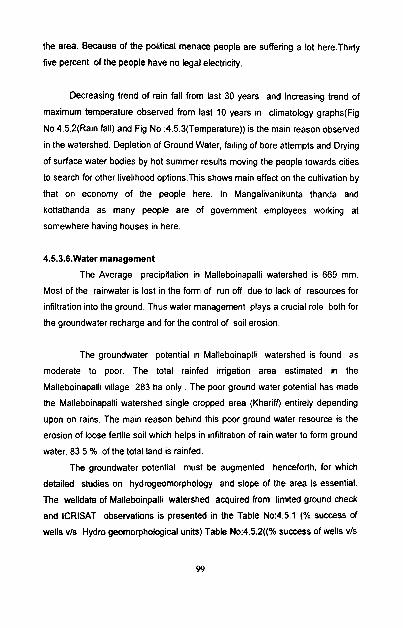
the area. Because Of the political menace people are suffering a lot here.Thirty
five percent of the people have no legal electricity.
Decreasing trend of rain fall from last 30 years and increasing trend of
maximum temperature observed from last 10 years in climatology graphs(Fig
No 4.5.2(Rain fall) and Fig No :4.5.3(Temperature)) is the main reason observed
in the watershed. Depletion of Ground Water, failing of bore attempts and Drying
of surface water bodies by hot summer results movlng the people towards cities
to search for other livelihood options.This shows main effect on the cultivation by
that on economy of the people here. In Mangalivanikunta thanda and
kottathanda as many people are of government employees working at
somewhere having houses in here.
4.5.3.6.Water management
The Average precipitation in Malleboinapalli watershed is 669 mm.
Most of the rainwater 1s lost in the form of run off due to lack of resources for
Infiltration into the ground. Thus water management plays a crucial role both for
the groundwater recharge and for the control of soil erosion.
The groundwater potential in Malleboinaplli watershed is found as
moderate to poor. The total rainfed irrigation area estimated in the
Malleboinapalli village 283 ha only . The poor ground water potential has made
the Malleboinapalli watershed single cropped area (Khariff) entirely depending
upon on rains. The main reason behind this poor ground water resource is the
erosion of loose fertile soil which helps in infiltration of rain water to form ground
water. 83.5 % of the total land is rainfed.
The groundwater potential must be augmented henceforth, for which
detailed studies on hydrogeomorphology and slope of the area is essential.
The welldata of Malleboinpalli watershed acquired from limited ground check
and ICRISAT observations is presented in the Table No:4.5.1 (% success Of
wells vls Hydro geomorphological units) Table No:4.5.2((% success of wells vls
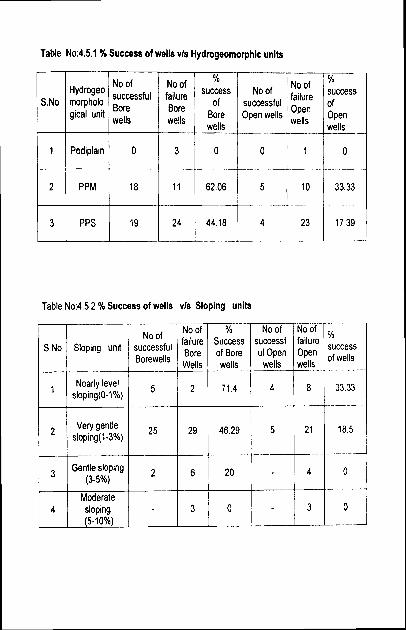
Table No:4.5.1 % Success of wells vls Hydrogeomorphic units
Open wells wells
1 Pediplain 0 3 0 0
2 PPM 18 11 62.06 5
3 PPS 19 24 44.18 4
No of failure Open wells
Yo success of Open wells
0
Table No:4.5.2 % Success of wells vls Sloping units ----
% Noof Noof % Success successf fa~lure success of Bore ul Open Open of wells
71 4 4 --.--
46 29 5 21
. - - -. - -
20 4 .. -
o 3
S No
4
Of
successful Borewells
25
Slop~ng un~t
Nearly level sloplng(o-l%)
Verygentle sloplng(1-3%)
Gentle sloplng (3- 5%)
Moderate sloping (5-10%)
Noof failure Bore Wells
2
29
6
3
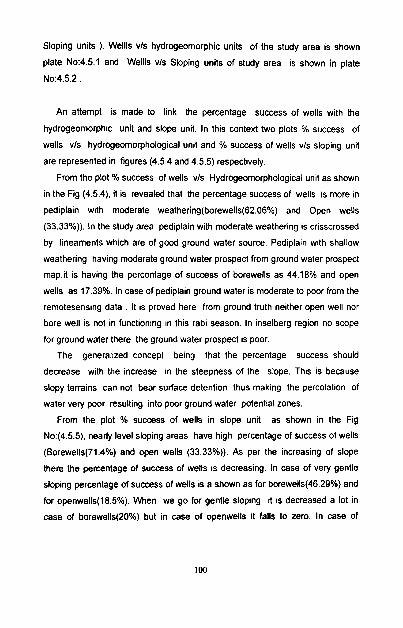
Sloping units ). Wellls vls hydrogeomorphic units of the study area is shown
plate No:4.5.1 and Wellls vls Sloping units of study area is shown in plate
No:4.5.2 .
An attempt is made to link the percentage success of wells with the
hydrogeomorphic unit and slope unit. In this context two plots % success of
wells vls hydrogeomorphological unit and % success of wells vls sloping unit
are represented in figures (4.5.4 and 4.5.5) respectively.
From the plot % success of wells vls Hydrogeomorphological unit as shown
in the Fig (4.5.4), it is revealed that the percentage success of wells is more in
pediplain with moderate weathering(borewells(62.06%) and Open wells
(33.33%)). In the study area pediplain with moderate weathering is crisscrossed
by lineaments which are of good ground water source. Pediplain with shallow
weathering having moderate ground water prospect from ground water prospect
map.it is having the percentage of success of borewells as 44.18% and open
wells as 17.39%. In case of pediplain ground water is moderate to poor from the
remotesensing data . It is proved here from ground truth neither open well nor
bore well is not in functioning in this rabi season. In inselberg region no scope
for ground water there the ground water prospect is poor.
The generalized concept being that the percentage success should
decrease with the increase in the steepness of the slope. This is because
slopy terrains can not bear surface detention thus making the percolation of
water very poor resulting into poor ground water potential zones.
From the plot % success of wells in slope unit as shown in the Fig
No:(4.5.5), nearly level sloping areas have high percentage of success of wells
(Borewells(71.4%) and open wells (33.33%)). As per the increasing of slope
there the percentage of success of wells is decreasing. In case of very gentle
sloping percentage of success of wells is a shown as for borewells(46.29%) and
for openwells(l8.5%), When we go for gentle sloping it is decreased a lot in
case of borewells(20%) but in case of openwells it falls to zero. In case of
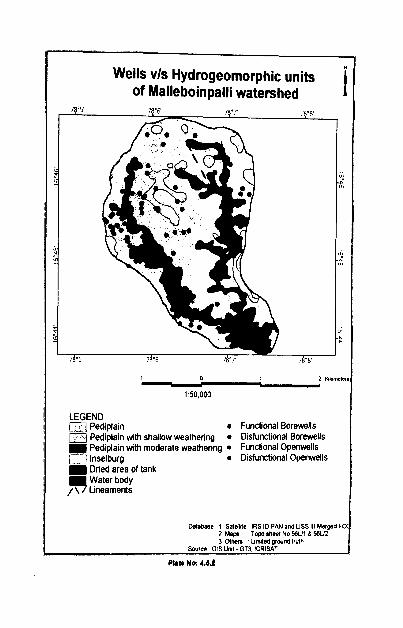
Wells vls Hydrogeomorphic units of Malleboinpalli watershed i
LEGEND 0 Ped~pla~n Funcbonal Borewells n Ped~plaln ~ t h shallow weathenng D~sfunctronal Borewells
Ped~plaln wth moderate weathenng Funcbonal Openwells C3 Inselburg D~sfunctronal Openwells
Dned area of lank Water body ,!! b n m e n t s
Databe I Sddlfle IRS ID PAN and USS Ill Mnpsd FU 2 M a p T o p sheet No MU16 MLR 3 Othm Llmlld wwnd truth
Sourm GIS URI - GT3 ICRISAT 1 Plr* No: 4.6)
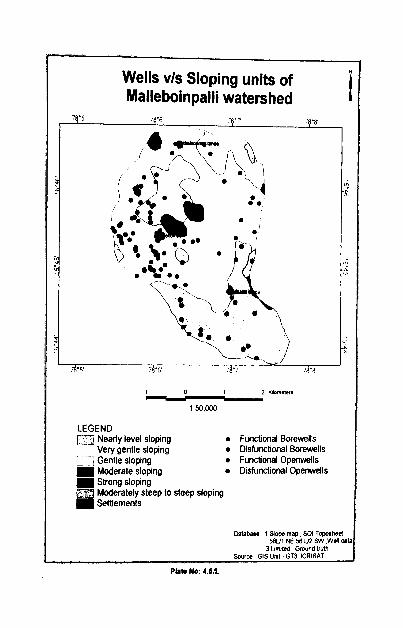
- - - I
Wells vls Sloping units of ~ Malleboinpalli watershed
LEGEND CIJ Nearly level sloplng Fmcbonal Borewells I 1 Very gentle sloplng D~sfunctronal Borewells U Gentle sloping Funcbonal Openwells
Moderate slopng Dlsfunt3onal Openwells 1 Sbmg slopng Moderately steep to steep slop~ng Settlements
I
Datlba~s 1 S l o p map SO1 Topabad Wl NE 58 V2 SW Wdl data
3 LmtW GroundVum Sourcc GlS Unt GT3 ICRISAT
Plat# No: 4 . 6 1
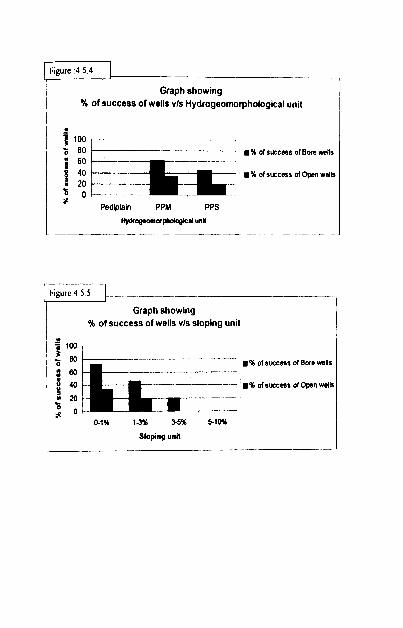
Figure 4 5 4 1 I
Graph showing % of success of wells vls HydmgeomorphologicaI unit
. - - a% of succas of Bote mlk ; '; rh-
8% of success of O p n wdk : 20 8 0
Ped~pla~n PPM PPS
Hydmp.omorphdopkal unk
:!nure 4 5 S
Graph showing % of success of wells vls sloping unit
- - .- --- 8 % ofsuccms of Bore wells
- -- 8 % ofsuccas ofopen wdh
- -- 01% 13% 34% SIC%
Sloping unit
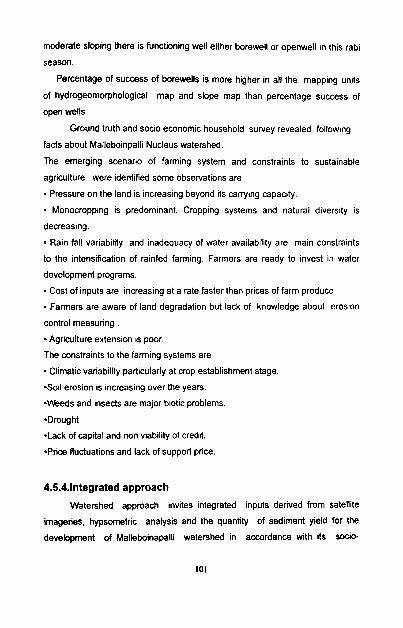
moderate sloping there is functioning well either borewell or openwell in this rabi
season.
Percentage of success of borewells is more higher in all the mapping units
of hydrogeomorphological map and slope map than percentage success of
open wells
Ground truth and socio economic household survey revealed following
facts about Malleboinpalli Nucleus watershed.
The emerging scenario of farming system and constraints to sustainable
agriculture were identified some observations are
Pressure on the land is increasing beyond its carrylng capacity.
Monocropping is predominant. Cropping systems and natural diversity is
decreasing.
Rain fall variability and inadequacy of water availability are main constraints
to the intensification of rainfed farming. Farmers are ready to invest in water
development programs.
Cost of inputs are increasing at a rate faster than prices of farm produce.
Farmers are aware of land degradation but lack of knowledge about erosion
control measuring . Agriculture extension is poor.
The constraints to the farming systems are
Climatic variability particularly at crop establishment stage.
.Soil erosion is increasing over the years.
.Weeds and insects are major biotic problems.
.Drought
.Lack of capital and non viability of credit.
.Price fluctuations and lack of support price.
4.5.4.lntegrated approach
Watershed approach invites integrated inputs derived from satellite
imageries, hypsometric analysis and the quantity of sediment yield for the
development of Malleboinapalli watershed in accordance with as socio-
economic data. This approach is the key to protect land, water and other natural
resourcesto attain good crop yields and developing the area with limited funds
by means of community's participation. The integrated management of
watenhed elicits broader information that aids in the planning of effective
watershed development schemes. In a watershed natural and human resources
are inter-dependent. Hence, the land and water resources in conjunction with
the socioeconomic data serves as a tool for watershed management.
The integrated watershed development must lead to people's self
reliance, self support and self esteem. It must enrich the life of the people and
improve its quality at gross root level. The introduction of detailed socio-
economic aspects generate public interest and augments the understanding of
a plan, the objectives of which provide protection, development and
management of the land and water resources to maximize the economic
returns.
The integrated analysis of the watershed leads to the preparation of
erosion intensity map and map showing water and land resources development
In this section of the thesis action plan for the land resources development
and water resources development are prepared by integrating the information
obtained from remote sensing, hypsometry and the concept of sed~ment yield
with the socioeconomic data using ARClGlS 8.1.2
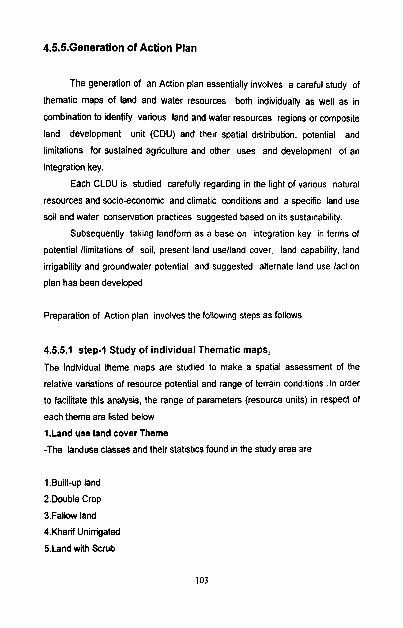
4.5.5.Generation of Action Plan
The generation of an Action plan essentially involves a careful study of
thematic maps of land and water resources both individually as well as in
combination to identify various land and water resources regions or composite
land development unit (CDU) and their spatial distribution, potential and
limitations for sustained agriculture and other uses and development of an
integration key.
Each CLDU is studied carefully regarding in the light of various natural
resources and socio-economic and climatic conditions and a specific land use
soil and water conse~ation practices suggested based on its sustalnability.
Subsequently taking landform as a base on integration key in terms of
potential /limitations of soil, present land uselland cover, land capablllty, land
irrigability and groundwater potential and suggested alternate land use laction
plan has been developed
Preparation of Action plan involves the following steps as follows
4.5.5.1 step-I Study of individual Thematic maps,
The individual theme maps are studied to make a spatial assessment of the
relative variations of resource potential and range of terrain conditions .In order
to facilitate this analysis, the range of parameters (resource units) in respect of
each theme are listed below
1.Land use land cover Theme
-The landuse classes and their statistics found in the study area are
1 .Built-up land
2.Double Crop
3.Fallow land
4.Kharif Unimgated
5.Land with Scrub
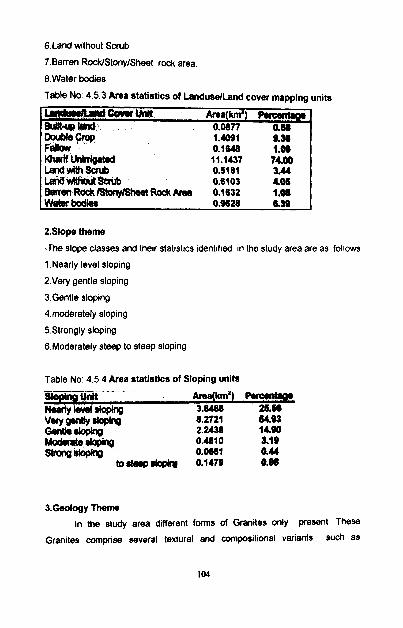
6.Land without Scnrb
7.Barren RoddStonyISheet rock area.
8. Water bodies
Table No: 4.5.3 Area statistics of LanduselLand cover mapping units
KhsrHutliied 11.1437 0.5181
LaIl6withOUtSarrb 0.6103 Barrar Radc ~~ Rock Area 0.1632 1.08
0.9628 as0
2.Slope theme
-The slope classes and their statistics identified in the study area are as follows
1 .Nearly level sloplng
2.Very gentle sloping
3.Gentie sloping
4.moderately sloplng
5.Strongly sloping
6.Moderately steep to steep sloping
Table No: 4.5.4 Area statlstlcs of Sloping units
3.Geology Theme In the study area different forms of Granites only present Thew
Granites wmprise several textural and composit~onal varlants such a8
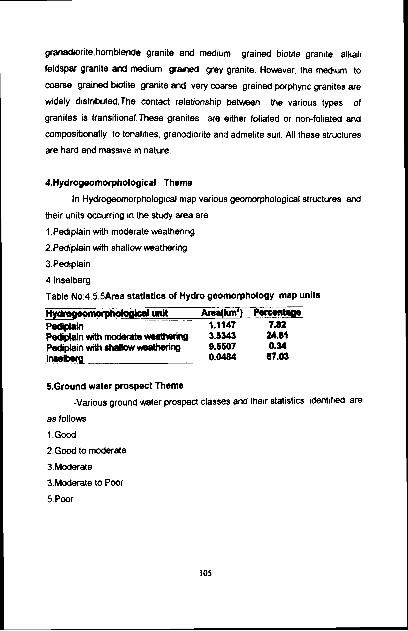
granadiorite,hornblende granite and medium gralned b~otlte granite, alkall
feldspar granite and medium grained grey granite. However, the medium to
coarse grained biotite granite and very coarse grained porphyric granites are
widely distributed.The contact relat~onship between the varlous types of
granites is transitional.These granites are either foliated or non-follated and
wrnpositionally to tonalities, granod~orite and admelite su~t. All these structures
are hard and massive in nature.
4.Hydrogeomorphological Theme
In HydrogeomorphologicaI map various geomorpholog~cal structures and
their units occurring in the study area are
1 .Pediplain with moderate weathering
2.Pediplain with shallow wather~ng
3.Pedlplain
4 Inselberg
Table No:4.5.5Area statistics of Hydro geomorphology map units
5,Ground water prospect Theme
-Various ground water prospect classes and thew statlstlcs Identified are
as follows
1 .Good
2 Good to moderate
3.Moderate
3.Moderate to Poor
5.Poor
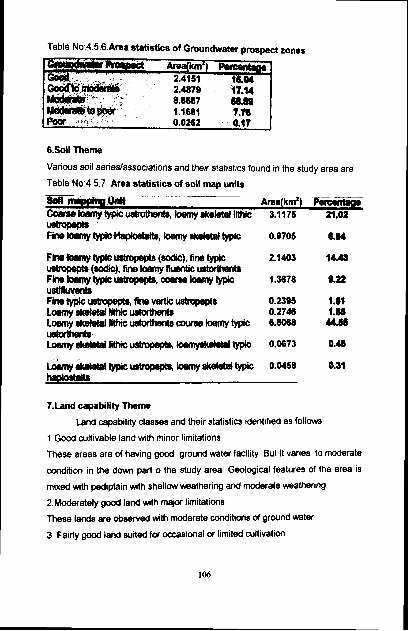
Table Nv4.5.6.Area statistics of Groundwater prospect zones
6.Soil Theme
Various so11 serieslassociat~ons and their statlst~cs found in the study area are
Table No:4.5.7. Area statistics of soil map units
w Fine Wily l)pk HlpkrWb, lony rkdrtd typic 0.9705 6.64
Fine b e m ~ typic WJIWWJ ( e l , fine typic 2.1403 14.45 Wmpepta (mdk), fine loemy fluentic uWthmb F i ~ l o s m v ( y p i c ~ . ~ k u n y t y p i c 1.3678 9.22 - llstMuven$ Fine typk -, fine vertic ucrtropeptr 0.2395 1.01 LOamy~lrthicUStorthents 0.2746 1.68 Lornry ~ t n h i c ~ c o u m , ~ typic 6.8068 44.66 liaommb ~~~~, -typio 0.0673 0.46
& W b W typic bemyakektd typic 0.0458 0.31
7.Land capability Theme
Land capability classes and their statistics identified as follows
1.Good cultivable land w'th minor limitations
These areas are of having good ground water facility But It vanes to moderate
condition in the d m part o the study area. Geolog1c.1 features of the area 1s
mixed with pediplain with shallow watherlng and moderate weathering
2 Moderately good land with major limitations
These lands are obsewed with moderate conditions of ground water
3. Fairly good land suited for occasional or limited wlt~vatim
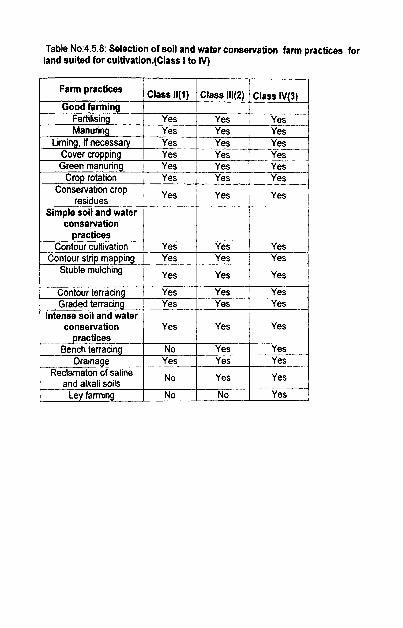
Table No:4.5.8: Selection of soil and water conservation farm practices for land suited for cultivation.(Class I to IV)
I conservation 1 I I 1 practices
Contour cultivation Contour strip mapping
Stuble mulching
I conservation / Yes 1 Yes / Yes /
Contour terracing Graded terracing
I Intense soil and water
Yes Yes
Yes
1 1
Ley farming I No / No 1 Yes
Yes Yes
practices Bench terracing
Drainage
Yes Yes
Yes
Yes Yes
Yes
Yes Yes
No Yes
Yes Yes -
Yes Yes
Yes Yes -
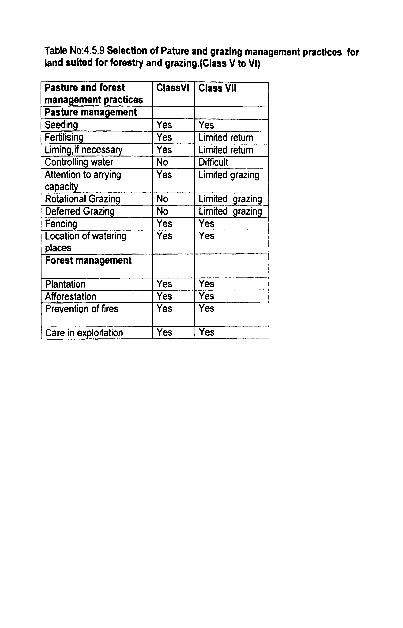
Table No:4.5.9 Selection of Pature and grazing management practices for land suited for forestry and grazing.(Class V to VI)
places Forest management
I I Care in exploitation lYes / Y e s i
Plantation Afforestation Prevention of fires
Yes Yes Yes
Yes Yes Yes
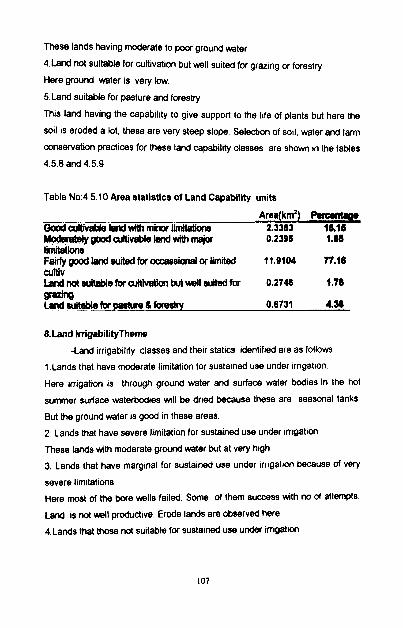
These lands having moderate to poor ground water
4.Land not suitable for cultivation but we11 suited for grazing or forestry.
Here ground water is very low.
5.Land suitable for pasture and forestry
This land having the capability to give support to the llfe of plants but here the
soil is eroded a lot, these are very steep slope Select~on of soil, water and farm
conservation practices for these land capabil~ty classes are shown in the tables
4.5.8 and 4.5.9
Table No:4.5.1O.Area statistics of Land Capability units
Ama(kmZ) - OOodfad thWe lsndwW1mlna r Im 2.3383 16.16 Mcxhte& good wltivclble land with m@jor 0.2396 1.66 lirnbbrm Fairly ~ o o d lend wited forocawional or limited 11.9104 77.18 wttiv - Lrrnd not wiWefor cultivation but well w M tor 0.2748 I .78
-Land irrigabllity classes and thew statlcs Identified are as follows
1 .Lands that have moderate llrnitat~on for sustained use under ~rrlgatlon.
Here irrigation is through ground water and surface water bodles.ln the hot
summer surface waterbodtes mll be dried because these are seasonal tanks
But the ground water IS good in these areas.
2. Lands that have severe limitation for sustained use under ~rrlgatlon.
These lands with moderate ground water but at very h~gh
3. Lands that have marginal for susta~ned use under irrlgal~on because of very
severe limitations
Here most of the bwe wells failed. Some of them success mth no of attempts
Land IS not well produdlve Erode lands are observed here
4 Lands that those nd sultable for sustained use under lrrlgatlon
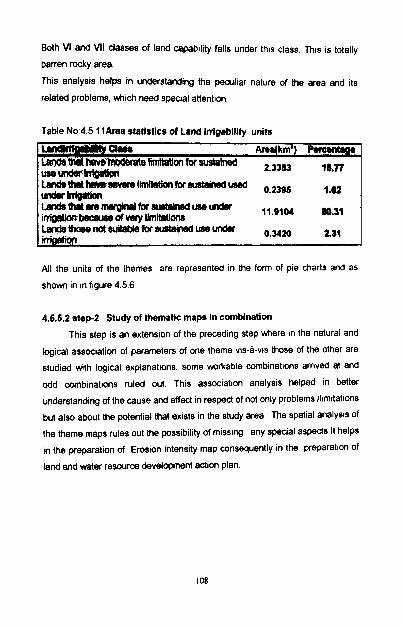
Both VI and VII classes of land capability falls under this class. Th~s IS totally
barren rocky area.
This analysis helps in understanding the pearliar nature of the area and its
related problems, which need special attent~on.
Table No:4.5.11Area statistics of Land lnigability units
LamwwmyWwr Lpndr thr\ hrvr fn&mle limnatlon for eustained , ,,., .. ..
All the units of the themes are represented In the form of pie charts and as
shown in in figure 4 5.6
4.5.5.2 step-2 Study of thematic maps in combination
This step is an extension of the preceding step where In the natural and
logical association of parameters of one theme vis-a-VIS those of the other are
studied with logical explanations, some workable cornb~nations arrived at and
odd combinations ruled out. This association analysis helped in better
understanding of the cause and effect in respect of not only problems llim~tat~ons
but also about the potential that exists in the study area. The spatlal analysls of
the theme maps rules out the possibility of missing any speclal aspects It helps
in the preparation of Erosion intensity map consequently In the preparation of
land and water resource development adion plan
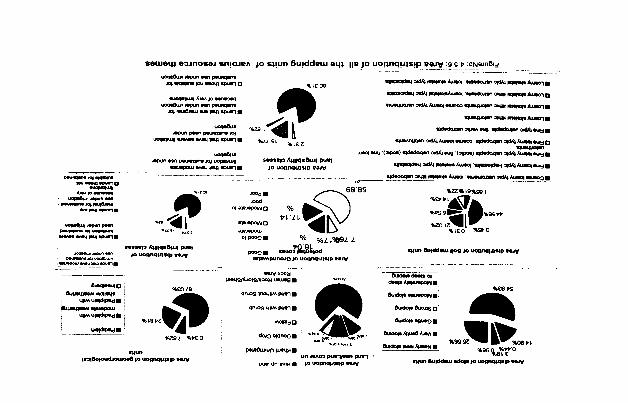

4.5.5.2.A. Preparation of Erosion Intensity zoning map
When the hypsometric analysis shows that a particular watershed is less
or moderately or easily susceptible to erosion it has to be compared with its
sediment production and has to be checked out for any differences. These
differences have to be reexamined by the overlay of landuseflandcover map
and slope map. Then the favorable units prone to each class of erosion are
demarcated. The final outcome of the above results gives the erosion intensity
map which has been categorized as zones of nil to slight erosion, slight, slight
to moderate, moderate, moderate to severe and severe erosion.
When the slope is strong and the land use is of degraded scrub land or
fallow or sandy area or land with cohesion less material the area is sa~d to be
prone to moderate to severe erosion. Whereas for the same land use ~f the
slope is gentles the erosion may be less and can be categorized under slight to
moderate erosion. In some cases though the slope is strong , the erosion may
be less due to the crop present in the areas with nearly level slope and crop
land or silvipasture or forest. Severe erosion may be encountered near the
foot of ridges, mountains which are of steep slopes and no vegetative cover at
their foct.
Erosion intensity is then prepared using the criteria discussed above. This
erosion intensity map is useful for environmental planning for a balanced setup.
In table No: 4.5.12 area statistics of various erosion intensity zones of study
area are shown. In Fig.(4.5.7) area distribution of these erosion intensity zones
are shown in the form of pie chart.This erosion intensity zoning as shown in the
Plate No:4.5.3
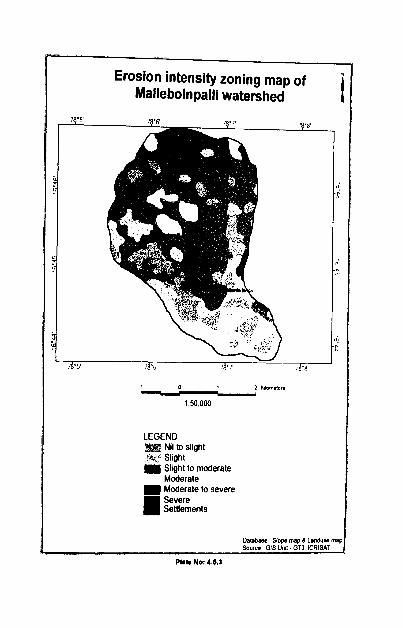
Erosion intensity zoning map of Malleboinpalli watershed
I
I
I
I
I
r
Pbb NO' 4 5 3
1 0 ? 2 IOLneIat - 1 50 000
LEGEND NII lo sl~ght
'Y: Slight Sllghl to moderate Moderate Moderate to severe
:z;;ents
DMkane Slope map B iaw map Sourca GlS Unt GT3 ICRISAT
I
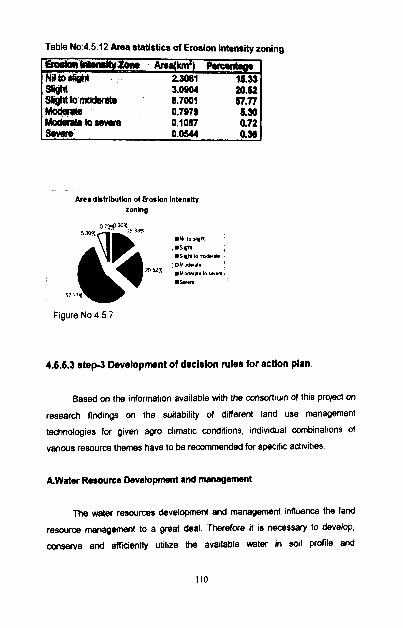
Table No:4.5.12 Area statistics of Erosion intensity zoning
Areadlstributbn of Erosbn Intensity zoning
Figure No:4.5.7
4.6.6.3 step-3 Development of decision rules for actlon plan
Based on the information available wth the wnsorttum of thls project on
research findings on the suitabil~ty of different land use management
technologies for given agro climatic conditions, lndlv~dual wmblnat~ons of
various resource themes have to be recommended for speclfic acltvtt~es.
AWater Reaoune Development and management
The water resources development and management influence the land
resource management to a great deal. Therefore ~t is necessary to develop,
conserve and efficiently utilize the available water in soil profile and
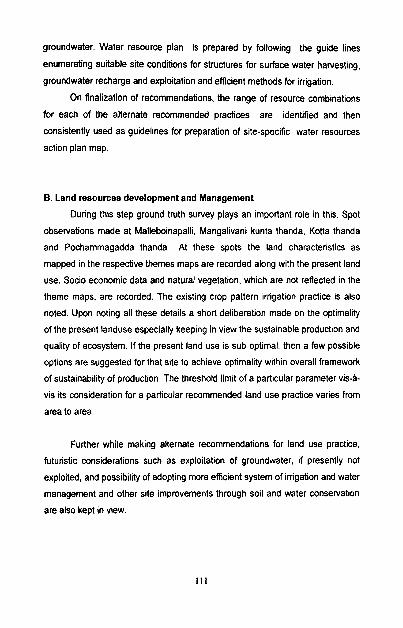
groundwater. Water resource plan is prepared by following the guide lines
enumerating suitable site conditions for structures for surface water harvesting,
groundwater recharge and exploitation and efficient methods for irrigation.
On finalization of recommendations, the range of resource combinations
for each of the alternate recommended practices are identified and then
consistently used as guidelines for preparation of site-specific water resources
action plan map.
B. Land resources development and Management
During this step ground truth survey plays an important role in this. Spot
observations made at Malleboinapalli, Mangalivani kunta thanda, Kotta thanda
and Pochammagadda thanda At these spots the land characteristics as
mapped in the respective themes maps are recorded along with the present land
use. Socio economic data and natural vegetation, which are not reflected in the
theme maps, are recorded. The existing crop pattern irrigation practice is also
noted. Upon noting all these details a short deliberation made on the optimality
of the present landuse especially keeping in view the sustainable production and
quality of ecosystem. If the present land use is sub optimal, then a few possible
options are suggested for that site to achieve optimality within overall framework
of sustainability of production. The threshold limit of a particular parameter vis-8-
vis its consideration for a particular recommended land use practice varies from
area to area.
Further while making alternate recommendations for land use practice,
futuristic considerations such as exploitation of groundwater, if presently not
exploited, and possibility of adopting more efficient system of irrigation and water
management and other site improvements through soil and water conservation
are also kept in view.
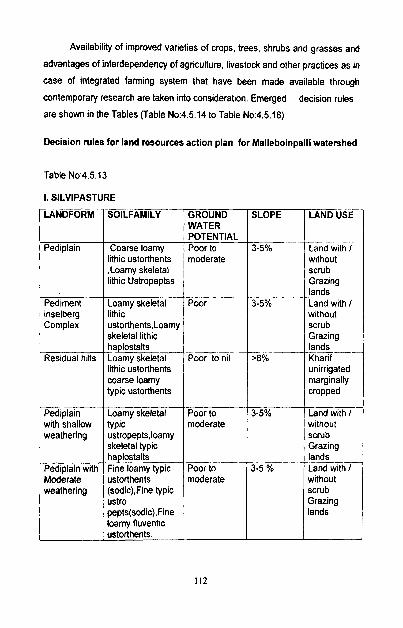
Availability of improved varieties of crops, trees, shrubs and grasses and
advantages of interdependency of agriculture, livestock and other practices as in
case of integrated farming system that have been made available through
contemporary research are taken into consideration. Emerged decision rules
are shown in the Tables (Table No:4.5.14 to Table No:4.5.18)
Decision rules for land resources action plan for Malleboinpalli watershed
Table No:4.5.13
LANDFORM
Pediplain
Pediment inselberg Complex
Residual hills
Pediplain with shallow weathering
SOILFAMILY
Coarse loamy
Pediplain with Moderate
lithic ustorthents ,Loamy skeletal lithic Ustropeptss
Loamy skeletal lithic ustorthents,Loamy skeletal lithic haplostalts Loamy skeletal lithic ustorthents coarse loamy typic ustorthents
Loamy skeletal typic ustropepts.loamy skeletal typic
weathering
GROUND WATER POTENTIAL Poor to
haplostalis Fine loamy typic ustorthents
moderate
Poor
Poor to nil
Poor to moderate
(sodic),Fine typic ustro pepts(sodic),Fine loamy fluventic ustorthents.
SLOPE
3-5%
Poor to moderate
scrub Grazing lands
LAND '~SSE
Land wit<?- I 3-5%
>8%
3-5%
without scrub 1 Grazing lands Land with I without scrub Grazing lands Kharif unirrigated marginally cropped
Land with I without scrub Grazing
3-5 % lands Land with I without
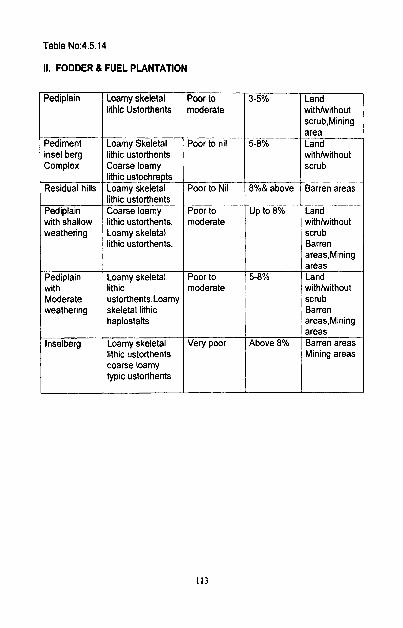
Table No:4.5.14
II. FODDER 81 FUEL PLANTATION
Pediplain
Pediment insel berg Complex
Residual hills
Pediplain with shallow weathering
Pediplain with Moderate weathering
1 lnselberg
I
Loamy skeletal lithic Ustorthents
Loamy Skeletal lithic ustorthents Coarse loamy lithic ustochrepts Loamy skeletal lithic ustorthents Coarse loamy lithic ustorthents, Loamy skeletal lithic ustorthents.
Loamy skeletal lithic ustorthents,Loamy skeletal lithic haplostalts
Loamy skeletal lithic ustorthents coarse loamy
I typic ustorthents
Poor to moderate
Poor to nil
Poor to Nil
Poor to moderate
Poor to moderate
Very poor
I
3-5%
54%
8%& above
Up to 8%
54%
Above 8%
I
Land withhvithout scrub,Mining area Land withhvithout scrub
Barren areas -
Land withlwithout scrub Barren areas,Mining areas Land withhvithout scrub Barren areas,Mining areas Barren areas Mining areas
I
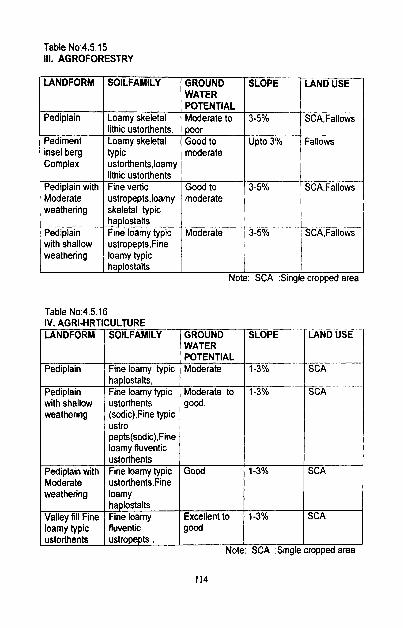
Table No:4.5.15 Ill. AGROFORESTRY
1 POTENTIAL 1 Pediplain 1 Loamy skeletal / Moderate to / 3.5% / SCA,Fallows
LANDFORM
1 haplostalts Note: SCA :Single cropped area
I
SOILFAMILY
Pediment insel berg Complex
Pediplain with Moderate weathering
Pediplain with shallow weathering
Table No:4.5.16
GROUND WATER
lithic ustorthents, Loamy skeletal typic ustorthents,loamy lithic ustorthents Fine vertic ustropepts,loamy skeletal typic haplostalts Fine loamy typic ustropepts,Fine loamy typic
/ POTENTIAL I Pediplain I Fine loamy typic I Moderate / 1-3% / SCA
IV. AGRI-HRTICULTURE
SLOPE
poor Good to moderate
- Good to moderate
Moderate
LANDFORM
pepts(sodic),Fine loamy fluventic I ustrO I
LAND USE
Pediplain with shallow weathering
Upto 3%
3-5%
- 3-5%
SOILFAMILY
Fallows
SCA,F&K
SCA.Fallows
haplosta~tb, - .
Fine loamy typic ustorthents (sodic),Fine typic
Pediplain with Moderate weathering
ustorthents I ustropepts , I 1 1 Note: SCA :Single cropped area
GROUND WATER
Valley fill Fine loamy typic
Moderate to good.
ustoihents Fine loamy typic ustorthents,Fine loamy
SLOPE
haplostalts Fine loamy fluventic
LAND USE
1-3%
Good
SCA
Excellent to good
1-3% SC A
1-3% SCA
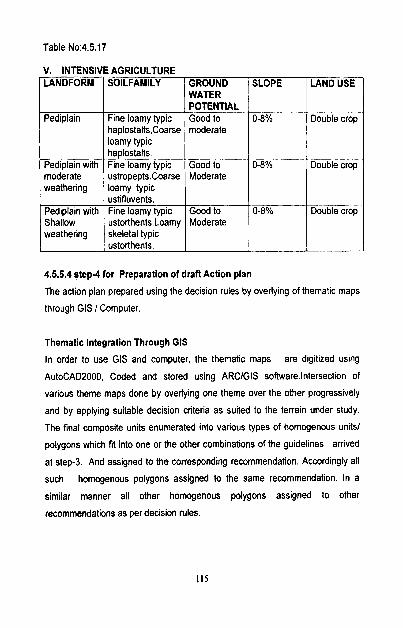
Table No:4.5.17
V. INTENSIVE AGRICULTURE LANDFORM 1 SOILFAMILY I GROUND I SLOPE I LAND USE 1
Double crop
Pediplain
4.5.5.4 step-4 for Preparation of draft Action plan
The action plan prepared using the decision rules by overlying of thematic maps
through GIs I Computer.
Fine loamy typic haplostalts,Coarse loamy typic
-
Pediplain with Shallow weathering
Thematic Integration Through GIs
In order to use GIs and computer, the thematic maps are digitized using
AutoCAD2000, Coded and stored using ARClGlS sohvare.lntersection of
various theme maps done by overlying one theme over the other progressively
and by applying suitable decision criteria as suited to the terrain under study.
The final composite units enumerated into various types of homogenous units/
polygons which fit into one or the other combinations of the guidelines arrived
at step-3. And assigned to the corresponding recommendation. Accordingly all
such homogenous polygons assigned to the same recommendation. In a
similar manner all other homogenous polygons assigned to other
recommendations as per decision rules.
WATER POTENTIAL Good to moderate
ustifluviits. Fine loamy typic ustorthents.Loamy skeletal typic ustorthents.
0-8%
Good to Moderate
Double crop
0-8% Double crop
4.5.5.4.A.Water resources development plan
In semi-arid regions proper harnessing ,exploitation and development are
important for their use and to prevent soil erosion are important. An unmanaged
watershed posses serious hurdles like tank sedimentation, depletion of
groundwater resources, lower agricultural outputs and finally affecting the
inhabitants of the watershed.
The streams of this watershed meet only limited water requirement of
forming. Major portion of the agriculture land is rainfed. Therefore, management
of water resources in the watershed is important for agricultural development.
As the rainfall pattern varies within this watershed, the water harvesting
structures are required to bring such areas under irrigation. The water harvesting
structures such as tanks can be built cheaply using stone-cement-motor lining
and thick polythene sheets.
1.Preparation of a map showing sites for soil and water conservation
structures.
Water harvesting shall allow an increasing in yield of important crops like
paddy and bringing additional area under this crop. Observations on drainage
here suggest that the first order streams are still are not disturbed and have
good potential. Therefore, ideal conditions exist for water harvesting with
suitable planning. Hydrological budgeting is also important
At this juncture, the integrated study is carried out for the conservation of
soil and water that led to the preparation of a map showing sites for soil water
conservation structures. The thematic maps such as slope map, soil map,
drainage map, hydro geomorphology map, erosion intensity map are integrated
by overlying one over the other to deduce the information that help in the
location of sites for construction of soil and water conservation structure. In the
study area activities such as percolation tanks, check dams, raven reclamation
structures, rock fill dams, contour and bench terracings and swale are
recommended at particular sites are discussed below.
1 .Nala Bunds and Percolation tanks
Nala (a natural watercourse) bunds and percolation tanks are structures
constructed across nalas for checking velocity of runoff, increasing water
percolation and improving soil moisture regime. In fact, both t e n s are
synonyms although used alternately at different places.
Objectives
To facilitate improving of runoff donated by a watershed and to encourage
underground percolation of stored water with a view to build up ground water
level in the zone of influence of nala bund I percolation tank. To hold the silt flow,
which would otherwise reach the multi-purpose reservoirs and reduce their
useful life.
Specific site conditions
The feasibility of the site for locating a nala bund depends upon the
following technical and economic considerations. The site should be selected in
relatively flatter nala reach - the slope net exceeds 2%. As for as possible, the
catchment area of the nala bund should be a1 least 40 hectares. There should be
proper site for construction of emergency spillway by the side of the nala bund
should be at least 40 hectares. There should be proper site for construction of
emergency spillway by the side of the nala bund. For this, the substrata of the
nala bund should be hard enough, preferably hard rock, and the nala bed should
have soils with adequate permeability. If there are rocky layers at greater
depths, they should be designated ones.
Design
The design is based on topographic and storage - height considerations.
With these criteria nala bund sections are designed in the light of local norms
prescribed for the, structures. In general, the top width of nala bund should not
be less then 1.0m. A free board equivalent to one-third of the impounding depth
but not less then l m is provided. The bund section should include provisions on
core wall and pebble trench on the line indicated for earthen dams. An
emergency spiliway of cut outlet type may also be provided depending upon the
drainage area.
2. Rokfill Dams
A Rockfill dam - an embankment constructed across a waterway using
variable sizes of stones or overburnt bricks - is usually a permeable type of semi
- permanent structure, such as a loose I stone checks are generally adopted for
gully control.
Objectives
For gully control to slow -down the velocity of runoff and to induce some
sedimentation before it leaves for the down stream reach.
I. To facilitate reclamation of board and shallow gullies for agricultural
purpose, provides the runoff discharge are with in limits.
2. To stabilize active gullies by encouraging vegetative growth because
of favorable moisture situation created by impounding water.
Specific site conditions
Rock fill dams are constructed in places where loose boulders are locally
and cheaply available and gullies are not wider than 10m or so. Brick dams
usually replace those dams if good quality bricks are cheaply available. In close
foundation conditions are highly unstable, gabions are preferred in place of
ordinary rockfill dams.
By and large, rockfill dams require better foundation conditions then the
earthen dams or earthen gully plugs.
3.Check dams
In general these are constructed on lower order streams up to third order.
N t h medium slopes. They are proposed where water table fluctuation is very
high land the stream is influent or intermittently effluent.the watershed area
varies widely.
The parameters to be considered are slope , soil cover and thick ness
and hydrologically conditions such as rock type, thick ness, of weathered strata,
fracture and depth to the bed rock etc, there should be some irrigation wells in
the down stream of the proposed structure. This structure serves for dual
purposes, firstly it reduces run off velocity there by minimizing erosion and
secondly allows the retained water to percolate and thus resulted in the wells
located in the gown stream of the structure.
The ideal location for the construction of Raven reclamation structures is
first order streams. At the outlets of stream check dam construction serves
better in arresting the silt. Check dams are small dams constructed to check the
sedimentlsilt, allowing clear water to the reservoir. These are preferred for steep
gradient channels and heavy sediment watershed areas. For economical
viability local materials like earth, rock, timber etc can be used for a 10-year
life span. A number of water harvesting ponds recharge the ground water and
their location will be best suitable immediately upstream to the checkdams.
Construction of swale rejuvenates wastelands especially in hilly regions.
Swale is a simple strucure built on raising ridge or small earthen bunds. Swales
are infact water absorption beds. In this process run off water flowing on steep
slope is intercepted and stagnated for some time to let it infiltrate through the
ground. The ideal location for construction of swale is along the 540m,580m
contours in the present study area, this is effective in semiarid areas. Contour
bunding is made on the land where the slope is not very steep and soil is fairly
permeable. Bench terracing consists of a series of platforms having suitable
vertical drops along the contour or on suitable graded lines across the general
slope of the land, the material excavated from the upper part is used in filling the
lower part and small bund is also raised along the outer edge of the terrace.
location of sites for construction of alternate contour bunds and bench terraces
at suitable in te~als across the general gradient of watershed. or along the
contour of 560m elevation, Location of sites for soil and water conservation
structures is shown in the plate No:4.5.4
2.Efficient irrigation system
In order to avoid water and to increase the extent of irrigation, efficient
irrigation systems should be adopted. Popular irrigation systems like Sprinkler
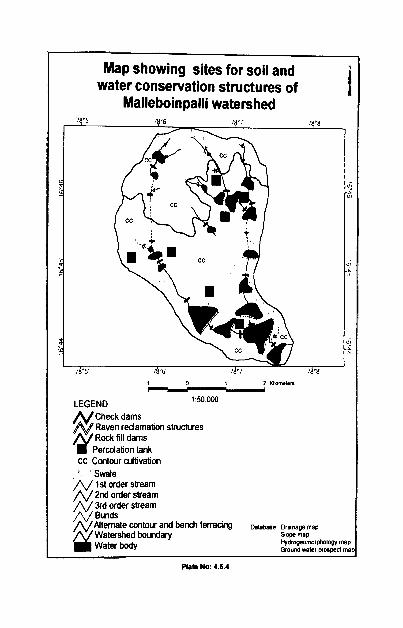
Malleboinpalli watershed
.
Phte No: 4.61
irrigation system and drip irrigation system can be adopted for better water
conservation and efficient use of available water.
2.1.Sprinkler irrigation system
Sprinkler irrigation system distributes water spraying it over the fields,
stimulating that of natural rain fall. The spray is produced by the flow of water
under pressure usually provided by pumping water from wells, tube wells,
river, canal and reservoir. It is the best method to use on soils that have steep
slopes, undulating or irregular topography and on soils that are to level. It
offers adequate distribution of water on rolling or hilly lands nlevelling for
surface irrigation is not feasible.
2.2.Drip irrigation.
It is frequent and slow application of water to the base or root
zone. It is more useful for horticulture crops more useful in arid and semi-arid
regions where water scarcity is higher. This type of irrigation is suitable to plain
area, sloping and undulating terrains
3.Recommendations for soil and water conservation
The area recieves 670 mm of of rainfall per year. Soils are of low to
medim water holding capacity. This emphasis is to be on harvesting of
rainwater and its retention in the watershed. Appropriate measures for
conservation and efficient utilization of rain water soil conservation are
needed.for this region. Low cost and small structures along with in-situ soil
moisture conservation measures are needed. The amount of potential runoff
available for harvesting in the watershed is and number of structures across
the toposequence are needed. In the watershed openwells are disfunctional
and they must be used for rainwater harvesting and recharging to improve the
groundwater potential.
By following along with the possible suggested soil and water structure
constructions out of these alternate contour and bench terracing, swale, check
dam, raven reclamation structures, rock fill dams and percolation tanks
construction following suggestions are also made for Malleboinpali watershed.
Hedging is also suggested for study area. This method not only solves
conservation problems but also produces biomass and stabilizes the ground
further by root system. Hedging gives excellent results in catching rainwater
and improving soil moisture. Hedging is practiced from gently to moderately
sloping lands for increasing crop yields. Hedges are grown either in
furrows ,trenches or on bunds. They are grown across streams for
conserving flood load. when practiced in combination with other methods,
they conserve almost all the rainwater in drought prone area.
- Digging of water collection trenches along the contour on the upper part of
the toposequence for collection and storage of runoff.
- Dry openwells could be used for recharging.
- Demarcation, stabilization and grassing of Waterways
- Digging of Silt traps in waterways
- Stabilization of bunds
- Plantation of saplings in order to increase strengthens the resistance and
stability of bunds
- Grass plantation in the waterways serve both for erosion control and as
fodder.
- Human resource development to manage integrated watershed development
projects.
-Training programmes
-Training course on participatory integrated watershed management and
in pest management.
A training course on integrated insect and disease management.
-Technology extention and public awareness
-To evaluate improved cultivan and cropping systems under farmer conditions.
-Improved cropping systems.
-Trials to evaluate /identify improved cropping systems
-Improved production practices (improved varieties, integrated nutrient,
pest, disease management and agronomy)
-Influence of top sequence demonstration of new crops and1 or improved
cultivars.
- Obse~ation on Geohydrology of the area through a study of the area on a
watershed basis using soil and water runoff recorders
-Treating the entire selected project area as a watershed has been facilitated
with the presence of major natural drains in the area.
-Water run off recorders presently help record the amount of water that is
being wasted.
-Evaluation of broad bed furrow system of cultivation.
-Continuous monitoring of micro climatic conditions of the region through
an automatic weather station.
-Nutrient budgeting
Integrated nutrient management followed in the improved system (sowing on
BBF and Gliricidia on the bunds) result a balanced budget of nutrients for the
cropping system.
-For the application of all the recommendations there is a need of good people's
participation.
4.5.5.4.B.Action Plan For Land Resources Development plan
In order to prepare the action plan for land resources development, first
the landuse Aandcover map is overlaid by slopemap and the favourable units
are demarcated and then overlaid by hydro geomorphology map and soil map
to derive the composite land development unit for giving the suggestions of
action plan to the study area. Each unit has been carefully studied for its
resource potential, pressure of potential demand for its utility in the light of its
present use. The demand for its optimal utilization is also examined in the light
of socio-economic conditions.
By following the Guidelines in accordance with socio-economic
conditions following recommendations are suggested for land resources
development plan
1. Silvipasture
2. Fodder and fuel wood plantations Silvipasture
3. Agro-forestry
4. Agro- Horticulture
5 , Intensive Agriculture
6. Tank foreshore Agriculture
7. Integration of livestock enterprise with alternate landuse system.
Description about the preferred land resource development activities followed
is as followed
1,Silvipasture
Silvipasture include combined growing of grasses and tree plants
together in a given area to meet the requirements of fodder and its related
activities .In olden days silvipasture was limited to forest area. But in the
present day context due to increase in population and other several
environmental needs, this activity has been recommended.
This system essentially consists of a top feed tree species and grasses or
legumes (preferably perennial) as understorey crop. This system is most suited
to marginal dry lands and is preferable where fodder shortages are experienced
frequently. Also, to increase fodder supply in rural areas and to improve effective
interaction between livestock raisinglanimal husbandry and crop production,
grazing and fodder resources should be created in areas accessible to villages.
North side of the village having gentle slope is suitable for the silvipasture
mainly.
One effective method will be to introduce silvipastoral land use patterns such as
growing of,
fast growing fodder shrubs and trees in croplands and pasture lands
pastures in plantations, orchards etc (Horde-pasture)
pastures in forest tree plantations
2,Fodder and fuel wood plantations
Fodder and fuel plantation is an activity normally recommended in poor
soils, any slopes and poor groundwater potential to meet primarily the
requirement of fodder for existing livestock and fuel wood for the poor people
living in the near by areas. Western, south eastern and south western s~des of
the Malleboinapalli village small pactches of land are suitable for the Gliricidia,
Pongamia, Leusena like plantation for fodder and Casuarina, Acacia and
Palma rose like species for fuel wood. All the suuggested species are drought
resistant varieties.
3.Agro- forestry
For imparting stability and providing sustainability to the farming systems
in marginal areas, a tree-cum-crop farming system could prove more useful.
Intervention of treelwoody crops with annual crops has the following basic
features.
. It is often conceived and formulated as improvement of existing land use rather
than transformation of landuse. Based on the diagnosis of the present land use
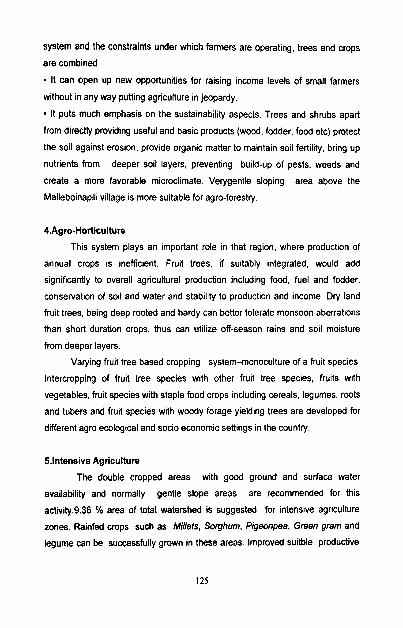
system and the constraints under which farmers are operating, trees and crops
are combined - It can open up new opportunities for raising income levels of small farmers
without in any way putting agriculture in jeopardy.
It puts much emphasis on the sustainability aspects. Trees and shrubs apart
from directly providing useful and basic products (wood, fodder, food etc) protect
the soil against erosion, provide organic matter to maintain soil fertility, bring up
nutrients from deeper soil layers, preventing build-up of pests, weeds and
create a more favorable microclimate. Verygentle sloping area above the
Malleboinaplli village is more suitable for agro-forestry.
4.Agro-Horticulture
This system plays an important role in that region, where production of
annual crops is inefficient. Fruit trees, if suitably integrated, would add
significantly to overall agricultural production including food, fuel and fodder,
conservation of soil and water and stability to production and income. Dry land
fruit trees, being deep rooted and hardy can better tolerate monsoon aberrations
than short duration crops, thus can utilize off-season rains and soil moisture
from deeper layers.
Varying fruit tree based cropping system-monoculture of a fruit species.
lntercropping of fruit tree species with other fruit tree species, fruits with
vegetables, fruit species with staple food crops including cereals, legumes, roots
and tubers and fruit species with woody forage yield~ng trees are developed for
different agro ecological and socioeconomic settings in the country.
5.lntensive Agriculture
The double cropped areas with good ground and surface water
availability and normally gentle slope areas are recommended for this
activity.9.36 % area of total watershed is suggested for intensive agriculture
zones. Rainfed uops such as Millets, Sorghum. Pigeonpea, Green gram and
legume can be successfully grown in these areas. Improved suitble productive
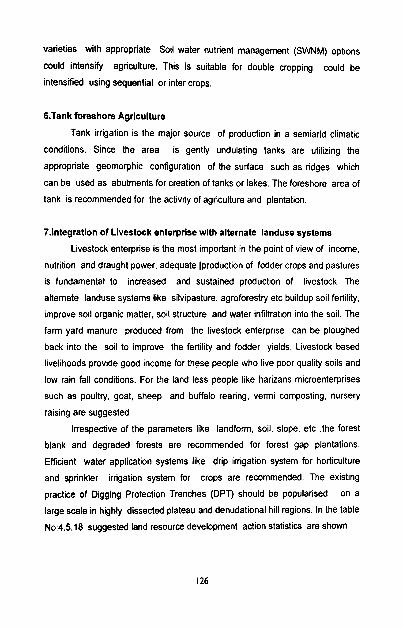
varieties with appropriate Soil water nutrient management (SWNM) options
could intensify agriculture. This is suitable for double cropping could be
intensified using sequential or inter crops.
6.Tank foreshore Agriculture
Tank irrigation is the major source of production in a semiarid climatic
conditions. Since the area is gently undulating tanks are utilizing the
appropriate geomorphic configuration of the surface such as ridges which
can be used as abutments for creation of tanks or lakes. The foreshore area of
tank is recommended for the activity of agriculture and plantation.
?.Integration of Livestock enterprise with alternate landuse systems
Livestock enterprise is the most important in the point of view of income,
nutrition and draught power, adequate [production of fodder crops and pastures
is fundamental to increased and sustained production of livestock. The
alternate landuse systems like silvipasture, agroforestry etc buildup soil fertility,
improve soil organic matler, soil structure and water infiltration into the soil. The
farm yard manure produced from the livestock enterprise can be ploughed
back into the soil to improve the fertility and fodder yields. Livestock based
livelihoods provide good income for these people who live poor quality soils and
low rain fall conditions. For the land less people like harizans microenterprises
such as poultry, goat, sheep and buffalo rearing, vermi composting, nursery
raising are suggested
Irrespective of the parameters like landform soil, slope, etc .the forest
blank and degraded forests are recommended for forest gap plantations.
Efficient water application systems like drip irrigation system for horticulture
and sprinkler irrigation system for crops are recommended. The existing
practice of Digging Protection Trenches (DPT) should be popularised on a
large scale in highly dissected plateau and denudational hill regions. In the table
No:4.5.18 suggested land resource development action statistics are shown
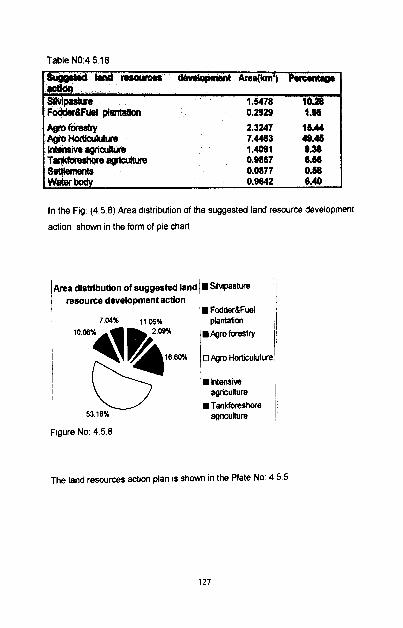
Table NO 4 5 18
su@ptd W - dwrlopmnt Area(kmZ) Pwanhgo - sMpas$tre 1.5478 1428 Fo&ler&Furd piamtion 0.2929 1.05
wfc-4ffY 2.3247 16.44 Agro Hoctiouluhxe 7.4403 49-48 IntaMivQ agrkunm 1.4091 9.36 TarJaoreshorsaaicufture 0.9867 6-66 s e a m 0.0877 0.W Water bdy 0 . W 2 8.40
In the Fig: (4.5.8) Area distribut~on of the suggested land resource development
action shown in the form of pie chart.
1 Area distribution of suggested land ; resource development action I
7.04% II.OS% 1 plantatim
F~gure No. 4.5.8
The land resources action plan IS s h m in the Plate No. 4 5.5
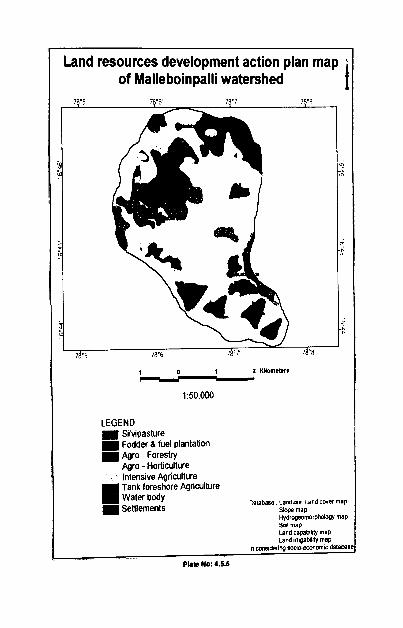
Land resources development action plan map of Malleboinpalli watershed i
LEGEND S~lwpasture Fodder 8 fuel plantat~on Agro - Forestry Agro - Hornculture lnlens~ve Agnwltwe Tank foreshore Agriculture Water body
oatabase Landme Land cover map Settlements sope map
Hydropeomorpholw mag Sal map Land capabllhl map ~and~rr~gab~lity map
In corm~denrq soawmomlc d N b - - -
Pbb No: 4.6.5
5,Swmmar :. Concl wsions
5.1 Summary
The present study deals with the application of IRS-ID PAN and LISS-III
merged data and GIs techniques for the management of Malleboinpalli watershed of Mahaboobnagar district, Andhra Pradesh with an emphasis on the
development of action plans for land and water resources for its sustainability.
This study is mainly based on the integrated approach, in which the problem of
sedimentation because of soil erosion is a focal theme. In order to implement
this approach, the input data is derived from IRS-ID satellite imagery,
hypsometry, the estimation of runoff potential and sedimentation yield and the
analysis of socioeconomic data.lRS-1D false color composite, Survey of India
Toposheet, Socio-economic survey, recorded data from weather station are the
major sources for the data used.
The results are derived from thematic mapping in the form of different
layers of Land uselLand cover, hydrogeomorphology, soil, land capability, land
irrigability, drainage map and also from hypsometry in terms of erodability
charecteristics of the study area are integrated with the estimated sediment
yield in accordance with socio-economic data using ARClGlS 8.1.2 package
available at ICRISAT. Erosion intensity zoning map, action plan for land and
water resources development and the decision rules for the implementation of
developmental activities in the study area are prepared by integrating the results
obtained from various stages of this project work.
5.2.Conclusions Although some achievements have been made in the optimum
management of natural resources through watershed approach, the coverage is
too small and the overall impact is dismal. The rate at which affected areas are
reclaimed and restored for effective production. It is therefore necessary to
manage our natural resources both land and water along the soicio-economic
resources within the natural boundaries of watershed in holistic manner. Keeping
this in view an attempt was made to evolve action plan for the development
activities of Malleboinpalli watershed. The Malleboinpalli watershed is
systematically studied for evaluating the natural resources in compatible with
the socio-economic factors through which the developmental programmes are
outlined.
The study encompasses with
(a) Remote Sensing data acquisition and analysis
(IRS-ID Pan BLISS-Ill False color composite)
(b) Drainage morphometry
(c) Hypsometric analysis
(d) Estimation of sediment yield using Garde et al method
(e) Erosion-Intensity map preparation
(f) Development of Action plan for Land and Water resources on
integration of resource data with Socio-economic data base.
Based on the analysis of the results obtained from the above steps (a), (b) and
(c) the following conclusions are drawn:
(1) The study on thematic mapping revealed that utilization of remote sensing
techniques and ArdGlS in conjunction with traditional methods have been found
a vely useful methodology to prepare various thematic maps and tabular
information in order to generate sustainable development activities for both land
and water resources. GIs through ARClGlS 8.1.2 package, the latest
technology has been demonstrated particularly to bring out the erosion-intensity
zoning map and accurate action plan maps.
(2) Malleboinpalli watershed of area 15.05 Sq.km having nearly level to gentle
sloping. It is 3rd order drainage basin with stream frequency of 1.19 km.'.~igher
the stream frequency the greater is the runoff, consequently more the sediment
yield. Shape of the basin is dendriiic infers that highly susceptible to soil erosion.
Drainage density of the basin is 2.45 km" .Sediment yield increases with
increase of the drainage density of the basin. The bifurcation ratio of the basin is
2.5, which infers that the geologic structures do not disturb the drainage pattern.
The relative relief ratio of basin 3.46 x 10" km indicates the pressure of
potential energy available for the soil erosion process.The relative relief ratio of
basin is 0.13 which indicates that the Maleboinpalli watershed is charecterised
by a strong relief having wide variety of geologic features. A circularity ratio of
0.7 signifies that the watershed is lower order in Shales and dolomites.
(3) In order to develop action plans for any given watershed and to prepare a
map showing erosion intensity zones, the characteristics of erodability must be
studied. The hypsometric characteristics developed and compared with the
model hypsometric curve finally concluded that the Malleboinpalli watershed is
in Monadnock phase i.e., it is the most stable or least susceptible to erosion.
(4) In comparision of the sediment yield of the watershed determine the priority to
evolve appropriate conservation management strategy that can be derived out
of money-time- effort making scheme. Sediment yield emphasises urgent need
of treating the subwatershed to minimise the siltation within the watershed area.
(5) In the combination of land uselland cover and slope map are integrated to
derive erosion intensity zoning map with specified decision rules, Inference from
this map is study area mainly falls into slight to moderate erosion zoning.
(6) Thematic maps such as land uselland cover, slope, groundwater prospect,
soil, land capability, land irrigability drainage network, rainfall data, results of
hypsometry, sediment yield of watershed, derived erosion intensity zoning
information and socioeconomic data pertaining to demography, cultivation and
infrastructure facilities like medical, educational, drinking water facilities
communication network and other infrastructure facilities have been integrated
with one another to form site specific action plan for land and water resources
development for each parcel of land in the study area. Decision rules are
suggested and graphical representation of action plan are presented in specified
chapters of project .
1. Akhouri Promod Krishna.,(l996): "Remote sensing approach for
watershed based resources management in the Sikkim himalaya: a
caser study ", Journal of the lndian Society of Remote Sensing, Vo1.24(2),
(P.69-83).
2. Anji Reddy.M.,(1996 ): "Hypsometric analysis of selected drianage basins
proceeds of National Conference on Hydrology", JNT University,
Hyderabad.
3. Anji Reddy. M., (2001): "Text book of Remote sensing and Geographical
Information systems ", Second edition, B.S Publications.
4. Ashok Kumar and Savita Tomar.,(1998): "Groundwater Assessment
Through HydrogeomorphologicaI and Geophysical SUN~Y-A Case Study
in Godavari Sub-watershed, Giridih, Bihar", Journal of the lndian Society
of Remote Sensing, Vo1.26(4), (P.177-183)
5. Bhuvaneswar prasad Sah.,(1996): "Assessment of a watershed
degradation and its socio economic impacts using Remotesensing and
GIs: A case study of Trijuga watershed, Nepal", Project work for M.S,
Asian institute of Technology, Bangkok, Thailand.
6. Cartos.E.P.Cerri, Jose.A.M.Dematte, Maria V.R. Ballester, Luiz A.
Martenelli. Reynoldo L. Victoria and Eric Roose.,(2001): "GIs Erosion
Risk Assessment of the Piracicaba River basin, South eastern Brazil",
Journal of the Mapping sciences and Remote sensing, Vol:38(3), (P.157-
169)
7. Chandra M0han.T and Dilip G.Durbude.,(POOl): "Estimation of soil
erosion potential using universal soil loss equation", Journal of the lndian
Society for Remote sensing, Vol: 30(4), (P. 180-189).
8. DKWM.,(2001): Project profile and Achievements, Danida assisted
Karnataka Watershed Management project, Phase -11, Karnataka, India.
9. Debasish Chakrabarthy, Dibyendu Dutta and Chandra
Sekharan.H.,(2001): ' Land use indicators of a watershed in ARID region
Western Rajasthan using Remote sensing and GIs", Journal of the Indian
society of Remote sensing, Vol:29(3), (P.115-127).
IO.Dilip..G.Durbude, Purandara.B.K, Arun Sharma.,(ZOOl): 'Estimation of
surface runoff potential of a watershed in semi-arid Environment",
Journal of the lndian Society of Remote sensing, Voi:29(1&2), (P.47-55).
11.GOI .(1990): "Watershed Atlas", Government of India.
12.Kondawar.V.K and Khanna.P.,(2000): 'Application of Remotesensing in
Techniques in Environmental management ", National Resources
Management- a new perspective, National Resources management
System(NNRMS), Dept of Space, Banglore, ( P.204-211).
13. Jayarami Reddy.P.,(1992): "A text book of Hydrology ", Lakshmi
Publications.
14.Kamaleswar Pratap.K.V, Ravindran, Prabhakaran.B.,(2000):
'Groundwater prospect zoning Using Remote Sensing and Geographical
Information System: A Case Study in Dala-Renukoot Area,Sonbhadra
District, Uttar Pradesh", Journal of the lndian Society of Remote Sensing.
Vol. 28(4), (P.249-263).
15,NNRMS.,(1992): "National resources management - a new perspective".
National Resources management System, Dept of Space, Banglore.
16.Nag.S.K.,(1998): 'Morphometric Analysis Using Remote Sensing
Techniques in the Chaka Sub-basin", Journal of the lndian society of
Remote Sensing, Vol. 26(1&2), (P.69-75).
17.0bi Reddy .G.P, et.a1.,(2000): 'Evaluation of Ground Water Potential
Zones using Remote Sensing Data- A Case Study of Gaimukh
Watershed, Bhandara District, Maharashtra", Journal of the lndian society
of Remote Sensing,Vol.28(1), (P.19-31).
18. Pankaj mani, Rakesh kumar and Chatajee.C.,(2003): " Erosion study of a
part of Majuli River-Island using Remote sensing data ", Journal of the
lndian society of Remote sensing, Vol:31(1), (P.11-18).
19.Peruma1.,(2002): 'Integrated mission for sustainable development
Application of Remote sensing and GIs for Natural resources", Geo
Spatial Today(Jun-August 2002), (P.32-35).
20. Pradip Kumar Pa1.,(2000): " Evaluation of water discharge and sediment
budget in the Himalaya", Journal of the lndian society of Remote
sensing, Vol:28(1), (P.33-45 ).
21.Rao D. P.,(2002): " Remote sensing and GIs for Sustainable development
-An overview", Geospatial Today(May-June 2002),(P. 50-52).
22.Rao.U.R.,(2000): ' Remote sensing for sustainable development -a
perspective " National Resources Management. a new perspective, Lead
article, National Resources management System(NNRMS), Dept of
Space, Banglore, ( P.l-6).
23.Rana.S.S.,(1998): "Application of Directional filtering in Lineament
mapping for Ground water Propspecting around Bhinmal- A semi Arid
part of Thar desert", Journal of the lndian Society of Remote Sensing,
V01.26(1&2), (P.28).
24.Rajesh Rajora.,(1998): "Integrated watershed management", Rawat
Publications.
25.Raju .K.,(1997):, "Kotgir watershed management using Remote sensing
techniques", Project work for M.tech, JNTU, IPGS&R.
26.Sarkar.B.C, Deota.B.S, Raju.P.L.N, and Jugran.D.K., (2001): "A
Geographic Information System Approach to Evaluation of groundwater
Potentiality of Shamri Micro-watershed in the Shimla Taluk", Journal of
the Indian society of Remote Sensing, Vol. 29(3), (P.151-161).
27.Sreeninath Dixith and Wani.S.P.,(2003): "Integrated Watershed
management through Consortium approach", Report No:6, Global Theme
-3; Water, soil and agro biodiversity and management and ecosystem
Resilience, ICRISAT and APRLP.
28.Srinivas.C.V, Maji.A.K, Obi Reddy.G.P and Chary.G.R.,(POOP):
'Assessment of soil erosion using Remote sensing and GIs in Nagpur
district Maharastra for prioritization and delineation of conservation
units ", Journal of the lndian society of Remote Sensing, Vol: 30(4),
(P.198-211).
29.Subba Rao. N and Pratap Reddy. R.,(1999): ' Ground water prospects in
developing satellite township Andhra pradesh, lndia using remote sensing
Techniques", Journal of the lndian Society of Remote sensing, Vol
27(4), (P.191).
30.Shiferaw.D, Anupama.G.V, Nageswara Ra0.G.D and Wani.S.P.,(2002): "
Socio economic charecterization and analysis of resources use patterns
in community watersheds in semi-arid lndia ", Working Paper series No:
12, Socio-economics policy, ICRISAT.
31.Subhan Khan and Rohan Ali.S.,(2002): Water resource Assessment and
management using GIs and Remote sensing in parts of Haryana and
Rajasthan", Geospatial Today(May-June 2002 ), (P. 53-54).
32,NRSA.,(1995): 'Technical guidelines for integrated sustainable
development", National Remote sensing Agency, Hyderabad.
33. Thornbury .W.D,(1990): " Principles of Geomorphology". N ley Easter
limited, New Delhi, (P. 594).
34. Tripati.M.P, Panda.R.K, Pradhan.S and Sudhakar.S et.a1.,(2002): "Runoff
Modelling of small watershed using satellite data and GIs ", Journal of the
lndian Society of Remote sensing. Vol:30(1&2), (P.39-47).
35.Varma.V.K, Rajiv Chopra, Sharrna.P.K, Charanjit Singh.,(998): "
Integrated Resource study for conservation and management of Ropar
wetland ecosystem: Punjab", Journal of the lndian Society of Remote
sensing, Vol:26(4) ,(P. 185-195).
36.Wani.S., Dwivedi.R.S and Ramana.K.V, Vadivelu.V, Navalgund .R.R. and
Pande A.B.,(2002):"Spatial distribution of Rainy season fallows in Madhya
pradesh; Potential for increasing productivity and minimizing land
degradation " . Report No:3, Global Theme -3; Water, soil and agro
biodiversity and management and ecosystem health, ICRISAT.
37.Wani.S.P and Rego.T.J..(2001): 'Proceedings of the travelling workshop-
cum- field voisit to benchmark watersheds" - Improving management of
natural resources for sustainable rainfed agriculture (27 August to 12
September 2000), ICRISAT and Asian Development Bank(ADB).
38.Wani.S.P, Reg0.T.J and Pathak.P.,(2002): 'Proceedings of the training
workshop on On-farm participatory Research Methodology" - Improving
management of natural resources for sustainable rainfed agriculture (26-
31 july 2001, Khon kean, Bangkok, Thailand), ICRISAT, ADB and
International Water Management Institute(lWM1)
39.Wani S.P. Pathak.P and Rego.T.J.,(2002):" A training manual on
integrated management of watersheds " , ICRISAT. ADB, APRLP, sir
Dorabji Tata Trust.
Copyright © 2022 FDOKUMEN


![Synthesis and Characterization of Monomeric Aryloxo Palladium Complexes of the Type [Pd(N-N)(OAr)(C6F5)].Crystal Structure of [Pd(tmeda)(C6F5)(OC6H4NO2-p)]](https://static.fdokumen.com/doc/165x107/633b8408779b2a7ca50fc452/synthesis-and-characterization-of-monomeric-aryloxo-palladium-complexes-of-the-type.jpg)