भारत के प न े का अदयतन
76
भारत के पƣन ¢ेğ का अदयतन UPDATE ON INDIAN PORT SECTOR (31.03.2019) पǐरवहन अन ु संधान Ĥभाग TRANSPORT RESEARCH WING पोत पǐरवहन मंğालय MINISTRY OF SHIPPING भारत सरकार GOVERNMENT OF INDIA नई Ǒदãलȣ NEW DELHI
-
Upload
khangminh22 -
Category
Documents
-
view
1 -
download
0
Transcript of भारत के प न े का अदयतन
भारत के प न े का अदयतन UPDATE ON INDIAN PORT SECTOR
(31.03.2019)
प रवहन अनुसंधान भाग TRANSPORT RESEARCH WING
पोत प रवहन मं ालय
MINISTRY OF SHIPPING
भारत सरकार
GOVERNMENT OF INDIA
नई द ल NEW DELHI


*****************************************************************************************
Officers associated with this publication
Sh. Sunil Kumar Singh Adviser (Statistics)
Smt. Priyanka Kulshreshtha Director
Sh. Santosh Kumar Gupta Deputy Director
Sh. Jagdish Chand Senior Statistical Officer
Smt. Savita Mittal Junior Investigator
Sh. Gopal Yadav Junior Statistical Officer

UPDATE ON INDIAN PORT SECTOR (UP TO 31.03.2019)
C O N T E N T S
Section No.
Subject Page No.
1 India’s position in World Economy and Recent Trends in
Cargo Traffic and Policy Initiatives
1-34
2 Policy and Performance of Maritime States 35-45
3 Performance Indicators of Major and Non-Major Ports 46-52
4 Private Sector/Captive/Joint Sector Port Projects 53-69
ANNEXURES
I Commodity-wise Traffic Handled at Major Ports 70
II Commodity Composition of Traffic Handled at Non-Major
Ports
71
III
Commodity-wise Capacity Available at Major Ports
72

1
1. RECENT TRENDS IN CARGO TRAFFIC AND POLICY INITIATIVES
1.1 INDIA AND WORLD ECONOMY
1.1.1 The global upswing in economic activity is strengthening. One year ago economic
activity was accelerating in almost all regions of the world and the global economy (World GDP)
was projected to grow at 3.9 percent in 2018 and 2019. One year later, much has changed: the
escalation of US–China trade tensions, macroeconomic stress in Argentina and Turkey, disruptions
to the auto sector in Germany, tighter credit policies in China, and financial tightening alongside the
normalization of monetary policy in the larger advanced economies have all contributed to a
significantly weakened global expansion, especially in the second half of 2018 (World Economic
Outlook, April, 2019). With this weakness expected to persist into the first half of 2019, the World
Economic Outlook (WEO) projects a decline in growth in 2019 for 70 percent of the global
economy (World GDP). Global GDP growth, which peaked at close to 4 percent in 2017, softened
to 3.6 percent in 2018, and is projected to decline further to 3.3 percent in 2019. Although a 3.3
percent global expansion is still reasonable, the outlook for many countries is very challenging,
with considerable uncertainties in the short term, especially as advanced economy growth rates
converge toward their modest long-term potential.
1.1.2 With improvements expected in the second half of 2019, global economic growth
(GDP growth) in 2020 is projected to return to 3.6 percent. This return is predicated on a rebound in
Argentina and Turkey and some improvement in a set of other stressed emerging market and
developing economies, and therefore subject to considerable uncertainty. Beyond 2020 growth will
stabilize at around 3.5 percent, bolstered mainly by growth in China and India and their increasing
weights in world income. Growth in advanced economies will continue to slow gradually as the
impact of US fiscal stimulus fades and growth tends toward the modest potential for the group,
given ageing trends and low productivity growth. Growth in emerging market and developing
economies will stabilize at around 5 percent; though with considerable variance between countries
as subdued commodity prices and civil strife weaken prospects for some (World Economic
Outlook, April, 2019).
1.1.3 Growth for 2018 was revised down by 0.1 percentage point relative to the October
2018 World Economic Outlook (WEO), reflecting weakness in the second half of the year, and the

2
forecasts for 2019 and 2020 are now marked down by 0.4 percentage point and 0.1 percentage point
respectively. The projected pickup in the second half of 2019 is predicated on an ongoing buildup
of policy stimulus in China, recent improvements in global financial market sentiment, the waning
of some temporary drags on growth in the euro area, and a gradual stabilization of conditions in
stressed emerging market economies, including Argentina and Turkey. Improved momentum for
emerging market and developing economies is projected to continue into 2020, primarily reflecting
developments in economies currently experiencing macroeconomic distress—a forecast subject to
notable uncertainty.
1.1.4 By contrast, activity in advanced economies is projected to continue to slow
gradually as the impact of US fiscal stimulus fades and growth tends toward the modest potential
for the group. Beyond 2020, global growth is set to plateau at about 3.6 percent over the medium
term, sustained by the increase in the relative size of economies, such as those of China and India,
which are projected to have robust growth by comparison to slower-growing advanced and
emerging market economies.
Growth across emerging market and developing economies is projected to stabilize
slightly below 5 percent, though with variations by region and country. The baseline outlook for
emerging Asia remains favorable, with China’s growth projected to slow gradually toward
sustainable levels and convergence in frontier economies toward higher income levels. For other
regions, the outlook is complicated by a combination of structural bottlenecks, slower advanced
economy growth and, in some cases, high debt and tighter financial conditions. These factors,
alongside subdued commodity prices and civil strife or conflict in some cases, contribute to
subdued medium-term prospects for Latin America; the Middle East, North Africa, and Pakistan
region; and parts of sub-Saharan Africa.
1.1.5 Global economic expansion is the main driver of world shipping demand, and 2017
will be remembered as the year when the world economy and global shipping experienced a
cyclical recovery from the historic lows of 2016, nearly a decade after the 2008–2009 global
economic and financial crisis. Main economic and shipping indicators trended upward, reflecting
growth in global investment, manufacturing activity and merchandise trade. At the same time, a
range of upside and downside risks continued to unfold, bringing major implications for shipping
and maritime trade.

3
1.1.6 Table 1 gives the growth of cargo at Indian ports and related parameters of Indian
and world trade.
Table 1: Growth in Cargo handled at Indian Ports and related parameters (in %) Parameters 2012-
13 2013-14
2014-15
2015-16
2016-17
2017-18
2018-19(P)
Trends in India’s Select : Macro Parameters I. Total Cargo 2.2 4.1 8.2 1.9 5.8 6.6 5.9 (a) Major Ports -2.6 1.8 4.7 4.2 7.0 4.8 2.9 (b) Non Major Ports 9.7 7.5 12.9 -1.1 4.2 9.0 9.9 II.GVA overall 5.4 6.1 7.2 8.0 7.9 6.9 6.6 (a) Agriculture 1.5 5.6 -0.2 0.6 6.3 5.0 2.9 (b) Industry 3.3 3.8 7.0 9.6 7.7 5.9 6.9 (c) Services 8.3 7.7 9.8 9.4 8.4 8.1 7.5 III. Foreign Trade (a) Export in $ value -1.8 4.7 -1.3 -15.5 5.2 10.0 9.1 (b) Import in $ value 0.3 -8.3 -0.5 -15.0 0.9 21.1 9.0
Trends in Select : Global Indicators IV. World Output^ 3.5 3.5 3.6 3.4 3.4 3.8 3.6 (a) Advanced Economies 1.2 1.4 2.1 2.3 1.7 2.4 2.2 (b) Developing Economies 5.3 5.1 4.7 4.3 4.6 4.8 4.5 V. World Economic Growth 2.2 2.2 2.5 2.6 2.5 3.1 3.0F (a) Advanced Economies 1.1 1.1 1.7 2.2 1.7 2.3 2.1F (b) Developing Economies 4.7 4.6 4.4 3.8 3.9 4.5 4.6F (c ) Transition Economies 3.3 2.0 0.9 -2.2 0.3 2.1 2.2F VI. World Trade Volume (Goods)
3.1 3.6 3.9 2.8 2.2 5.4 3.8
VII. Export Volume growth (Goods) (a) Advanced Economies 2.9 3.2 3.9 3.8 1.8 4.4 3.1 (b) Developing Economies 3.6 4.7 3.2 1.4 2.9 7.2 4.3 VIII. Import Volume (Goods) (a) Advanced Economies 1.7 2.5 3.9 4.9 2.5 4.3 3.3 (b) Developing Economies 5.4 5.2 4.3 -1.0 1.8 7.5 5.6 IX. World Seaborne Trade* 4.6 3.4 3.5 1.8 2.6 3.9 NA (a) Goods Loaded 4.7 3.5 3.5 1.8 2.6 4.0 NA (b) Goods Unloaded 4.4 3.4 3.5 1.8 2.6 3.8 NA I. Based on data from Major Ports and Non Major Ports II Based on Statement of Provisional estimates of Annual National Income, 2018-19 & Quarterly estimates of GDP for the fourth Quarter (Q4) of 2018-19 at constant prices, 2011-12 series & press release on estimates of GDP, Central Statistical Office, MOSPI, dated. 31.05.2019 III. Based on Department of Commerce, DGCI&S and RBI Bulletin IV,VI, VII & VIII Based on World Economic Outlook, April,2019, IMF; V & IX. Based on Review of Maritime Transport, 2018 (November), UNCTAD Note: For item Nos. IV, V, VI,VII, VIII & IX year 2012-13 refers to calendar year 2012 and so on. * growth in total goods loaded plus unloaded; NA ; Not Available (P) Provisional ^Real GDP, F- Forecast for the year 2018

4
Selected Emerging Trends Affecting Seaborne Trade
1.1.7 Maritime transport is the backbone of globalization and lies at the heart of cross-
border transport networks that support supply chains and enable international trade. An economic
sector in its own right that generates employment, income and revenue, transport – including
maritime transport – is cross-cutting and permeates other sectors and activities. Maritime transport
enables industrial development by supporting manufacturing growth; bringing together consumers
and intermediate and capital goods industries; and promoting regional economic and trade
integration. From shipbuilding to cargo routes to the future of seafaring, the maritime sector
continues to evolve in response to economic, political, demographic, and technological trends.
Understanding these trends is critical to improving the performance of the industry’s capital
investment as well as operational efficiency, and provides the backdrop for successful long-term
maritime trade strategy.
1.1.8 International seaborne trade gathered momentum, with volume expanding by 4
percent in the year 2017. This was the fastest growth in five years. Reflecting the world economic
recovery and improved global merchandise trade, UNCTAD estimates world seaborne trade
volumes at 10.7 billion tonnes in 2017. In line with developments in the world economy, demand
for shipping services improved in 2017. World seaborne trade expanded by 2.6 percent in 2016 and
growth reached to 3.9% in the year 2017. Goods total loaded volumes reached 10.7 billion tons in
the year 2017, reflecting the addition of over 410 million tons of cargo, about half of which was
attributed to tanker trade. Strong import demand in China in 2016 continued to support world
maritime seaborne trade, although overall growth was offset by limited expansion in the import
demand of other developing regions. International Seaborne Trade loaded during last 17 years may
be seen in Table 2 (a).
1.1.9 Major dry bulk commodities – coal, iron ore and grain – accounted for 42.3 per cent
of total dry cargo shipments, which were estimated at 7.6 billion tons in 2017. Containerized trade
and minor bulks represented 24.3 per cent and 25.4 per cent of the total, respectively. Remaining
volumes were made of other dry cargo, including break-bulk shipments. Tanker trade shipments
accounted for less than one third of total seaborne trade volume, in line with the persistent shift in
the structure of seaborne trade observed over the past four decades. The share of tanker trade

5
dropped from around 55 per cent in 1970 to 29.4 per cent in 2017. Between 1980 and 2017, global
tanker trade expanded at an annual average growth rate of 1.4 per cent, while major dry bulks rose
by 4.6 per cent. The fastest growing segment was containerized trade, with volumes expanding over
nearly four decades at an annual average growth rate of 8.1 per cent.
Table 2 (a) : Developments in International Seaborne Trade
(Million Tonnes Loaded) Year Oil Main Bulk# Other Dry Cargo Total
2000 2163 1295 2526 5984 2007 2747 1840 3447 8034 2008 2742 1946 3541 8229 2009 2642 2022 3194 7858 2010 2772 2259 3378 8409 2011 2794 2392 3599 8785 2012 2841 2594 3762 9197 2013 2829 2761 3924 9514 2014 2825 2988 4030 9843 2015 2932 2661 4131 10024
2016 3055 3041 4193 10289 2017 3146 3196 4360 10702
# Main bulk includes data on iron ore, grain, coal, bauxite/alumina and phosphate rock. Starting in 2006, they include data on iron ore, grain and coal only. Data relating to bauxite/alumina and phosphate are included under "Other dry cargo". Source: Review of Maritime Transport,2018,UNCTAD
1.1.10 Developing countries continue to account for most global seaborne trade flows, both
in terms of exports (goods loaded) and imports (goods unloaded). These countries shipped 60 per
cent of world merchandise trade by sea in 2017 and unloaded 63 per cent of this total. By contrast,
developed countries saw their share of both types of traffic decline over the years, representing
about one third of world seaborne imports and exports (34 per cent of goods loaded and 36 per cent,
unloaded). Transition economies continue to be heavily reliant on the export of bulky raw materials
and commodities (6 per cent), while they hold a marginal share of global seaborne imports (1 per
cent).
1.1.11 Historically, developing countries have been the main suppliers of high-volume,
low-value raw materials; this has, however, changed over the years. As shown in table 2 (b),
developing countries have emerged as prominent world exporters and importers. A milestone was
reached in 2014 when developing countries’ share of goods unloaded (imports), surpassed, for the

6
first time, the group’s share of goods loaded (exports). This shift underscores the strategic
importance of developing countries as the main driver of global seaborne trade, as well as their
growing participation in global value chains.
1.1.12 While, the participation of developing countries, notably those of East Asia, in
global value chains may have played a part in increasing their contribution to global goods
unloaded, observed deceleration over recent years in vertical specialization suggests that factors
other than participation in global value chains may also be driving growth in developing countries’
seaborne imports. Overall decline in the vertical specialization process is evident when considering
Table 2 (b): World Seaborne Trade by type of Cargo & country group, 2016 and 2017 Good loaded Good unloaded
Country Group
YEAR Total Crude Oil
Petroleum Products & gas
Dry Cargo
Total Crude Oil
Petroleum Products & gas
Dry Cargo
Millions of tons
World 2016 10288.6 1831.4 1223.7 7233.5 10279.9 1999 1235.7 7054.1 2017 10702.1 1874.9 1271.2 7555.9 10666 2035 1281.5 7349.4
Developed Economies
2016 3492.9 150.5 453 2889.4 3840.4 1001.3 507.6 2331.5 2017 3675 162.6 478.3 3034.2 3838.3 956.8 509.1 2372.5
Transition Economies
2016 637.3 176.3 40.2 420.7 59.6 0.3 4 55.3 2017 664.5 190.7 48.3 425.6 65.9 0.8 3.4 61.7
Developing Economies
2016 6158.4 1504.5 730.5 3923.4 6379.9 988.5 724.2 4667.3 2017 6362.5 1521.6 744.7 4096.2 6761.7 1077.4 769.1 4915.3
Africa 2016 692.7 271.3 58.8 362.6 492.9 38.7 80.8 373.4 2017 726.2 288 60 378.2 499.8 33.9 90.5 375.4
America 2016 1336.8 232.5 75.9 1028.4 566 51.9 128.2 385.8 2017 1379.4 227.3 71.9 1080.2 608.3 54.7 141.8 411.8
Asia 2016 4121.2 999.1 594.9 2527.2 5307.6 897 510.9 3899.7 2017 4248.8 1004.6 611.8 2632.4 5640.1 988 532.5 4119.6
Oceania 2016 7.7 1.7 0.9 5.2 13.5 0.8 4.2 8.4 2017 8 1.7 0.9 5.4 13.5 0.8 4.2 8.4

7
trade in intermediate goods. The share of intermediate imports of China as a proportion of its
exports of manufacturing goods – a measure of the reliance of the manufacturing sector on imported
inputs – has declined consistently over the last decade, from almost 60 per cent in 2002 to less than
40 per cent in 2014 (UNCTAD, 2016). The share of the value chain created by production abroad
as a percentage of global exports is estimated to have gradually diminished since 2011, suggesting
some deceleration in globalization (Berenberg and Hamburg Institute of International Economics,
2018). UNCTAD (2018c) finds that the rate of expansion of international production is slowing
down, and international production and cross-border exchanges of factors of production are
gradually shifting from tangible to intangible forms.
Seaborne Trade by Cargo Type
Crude Oil and Petroleum products
1.1.13 The year 2017 witnessed the geographical dispersion of Oil trade, as Oil trade
patterns became less concentred on usual suppliers from Western Asia and benefited from increased
trade flows from the Atlantic basin to East Asia. These trends have supported and boosted long-
houl tankers demand. Crude oil seaborne trade expanded at a slower pace 2.4 percent in 2017 as
compared with stronger growth 4 percent in 2016 (UNCTAD). UNCTAD estimated the World
crude oil trade in 2017 at 1.87 billion tons, supported by increasing exports from the United State,
rising global refining activity especially in Asia declining oil inventories and steady crude oil
shipments from Western Asia. Crude oil trade benefited from the growing export volumes
originating in the Atlantic basin and destined to Asia, most notably China, where rising demand
from independent refiners and growing state refinery capacity boosted demand growth. An
overview of global players in the oil and gas sector is presented in (table 2(c) and 2(d)). In view of
the two- digit growth rate recorded in 2016 and 9.1 per cent growth experienced in 2017, China is
clearly emerging as a leading importer of crude oil. Its main Crude Oil suppliers were Angola, the
Islamic Republic of Iron, Iraq, the Russian Federation, Saudi Arabia and the Bolivarian Republic of
Venezuela.
8
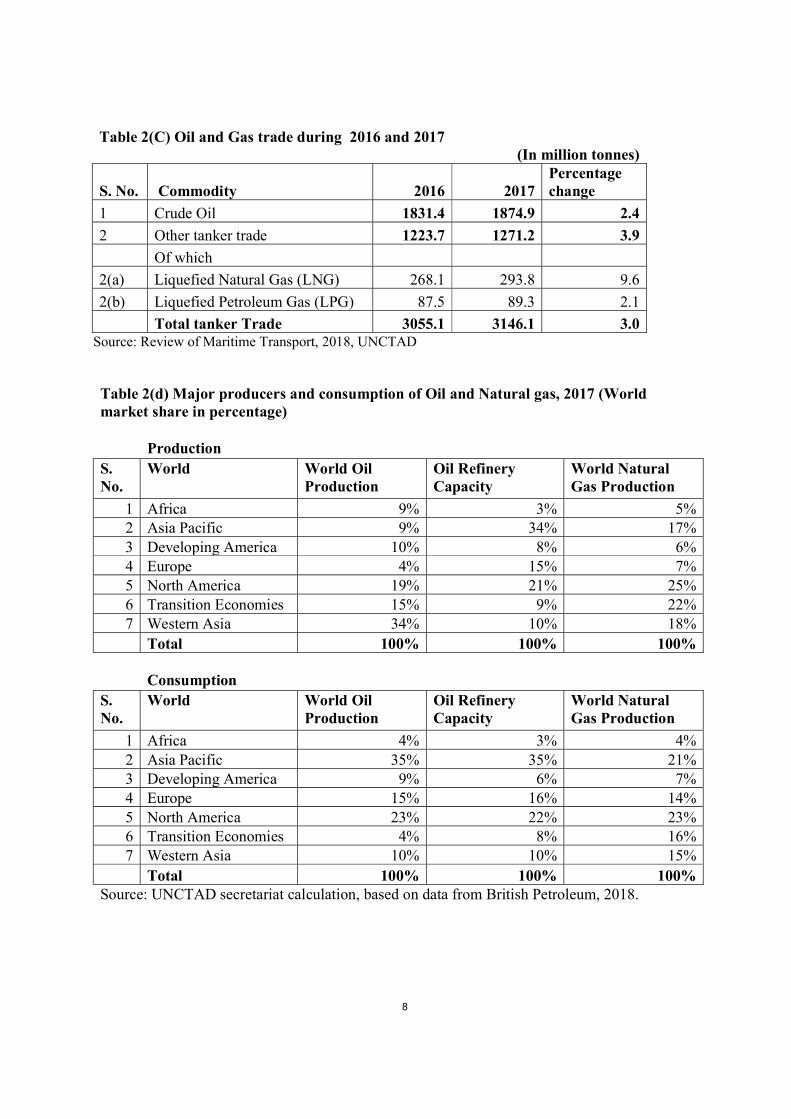
Table 2(C) Oil and Gas trade during 2016 and 2017 (In million tonnes)
S. No. Commodity 2016 2017 Percentage change
1 Crude Oil 1831.4 1874.9 2.4
2 Other tanker trade 1223.7 1271.2 3.9
Of which
2(a) Liquefied Natural Gas (LNG) 268.1 293.8 9.6
2(b) Liquefied Petroleum Gas (LPG) 87.5 89.3 2.1
Total tanker Trade 3055.1 3146.1 3.0 Source: Review of Maritime Transport, 2018, UNCTAD
Table 2(d) Major producers and consumption of Oil and Natural gas, 2017 (World market share in percentage)
Production S. No.
World World Oil Production
Oil Refinery Capacity
World Natural Gas Production
1 Africa 9% 3% 5% 2 Asia Pacific 9% 34% 17% 3 Developing America 10% 8% 6% 4 Europe 4% 15% 7% 5 North America 19% 21% 25% 6 Transition Economies 15% 9% 22% 7 Western Asia 34% 10% 18%
Total 100% 100% 100%
Consumption S. No.
World World Oil Production
Oil Refinery Capacity
World Natural Gas Production
1 Africa 4% 3% 4% 2 Asia Pacific 35% 35% 21% 3 Developing America 9% 6% 7% 4 Europe 15% 16% 14% 5 North America 23% 22% 23% 6 Transition Economies 4% 8% 16% 7 Western Asia 10% 10% 15%
Total 100% 100% 100% Source: UNCTAD secretariat calculation, based on data from British Petroleum, 2018.

9
1.1.14 Together, refined petroleum products and gas volumes increased by 3.9 per cent in
2017; growth in petroleum products was supported by rising demand in developing America and
growing intra-Asian trade. However, elevated global inventory and stocks undermined arbitrage
opportunities for some products and hindered growth during the year. At the same time, drawdowns
on inventories weighed on the import demand in some regions, including Europe (Clarksons
Research, 2018a). On the supply side, higher levels of refinery throughput lifted export volumes
from Europe and Asia, including Western Asia and China. The United States contributed to export
growth, and shipments of oil products expanded by 9.5 per cent (Clarksons Research, 2018b).
United States exports to developing America partly benefited from the continued decline in refinery
activity in Brazil, Mexico and the Bolivarian Republic of Venezuela.
Natural Gas and liquefied gases
1.1.15 Shipments of liquefied natural gas totalled 293.8 million tons in 2017, following a
9.6 per cent increase over the previous year (Clarksons Research, 2018b). Increased demand, the
highest in six years, originated mostly in Asia, where energy policy shifts are under way. Imports of
the commodity to China increased by 47.3 per cent in 2017, owing to weather conditions and
stronger demand. The country’s demand for liquefied natural gas was partly supported by the
growing importance of the environmental agenda. Further, the continued expansion of liquefied
natural gas regasification capacity in China highlights the potential for further expansion in imports
of the commodity.
1.1.16 Shipments of liquefied petroleum gas expanded at a slower pace (2.0 per cent) in
2017, down from 11.2 per cent in 2016 (Clarksons Research, 2018b). The main factors restricting
growth included a decline in Western Asian exports, which was offset somewhat by growing
exports from the United States. Demand for imports in China was key, with import volumes
expanding by 14.7 per cent. This pace is, however, less than half of that in 2016 (34.4 per cent),
reflecting the end of the recent wave of propane dehydrogenation plant expansions (Danish Ship
Finance, 2017). Imports of liquefied petroleum gas to India increased in 2017, supported by a
subsidy programme of the Government promoting households’ switch to cleaner fuels. In contrast,
imports of the commodity to Europe declined, owing in part to competition from ethane.

10
Dry Cargo Trades
Dry Bulk Shipments: Major and minor dry bulks
1.1.17 A limited expansion in 2015–2016, global dry bulk trade grew by about 4 per cent in
2017, bringing total volumes to 5.1 billion tons (UNCTAD, Review of Maritime Transport, 2018).
A sharp increase in iron ore imports to China, a rebound in global coal trade and improved growth
in minor bulk trades supported the expansion. Overall, strong import demand in China remained the
main factor behind growth in global dry bulk trade. Iron ore imports to China increased by 5 per
cent in 2017, bringing total volumes to nearly 1.1 billion tons. With a market share of more than 70
per cent, China remains the main source of global iron ore demand. A rise in steel production and
the closure of more than 100 million tons per annum of outdated steelmaking capacity in 2016–
2017 boosted the country’s demand for imports. Further, the increased use of higher grade imported
iron ore displaced domestic supplies. The leading iron ore exporters were Australia, Brazil and
South Africa; Australia and Brazil supplied over 85 per cent of the demand for imports in China.
Nevertheless, Australia is by far the largest exporter, supplying nearly two thirds of iron ore
requirements in China.
Table 2(e) Dry Bulk Trade during 2016 and 2017 (In million tonnes)
S. No. 2016 2017 Percentage change 1 Main Bulks 3040.9 3196.3 5.1 Of which 1(a) Iron Ore 1418.1 1472.7 3.9 1(b) Coal 1141.9 1208.5 5.8 1(c) Grain 480.9 515.1 7.1 2 Minor Bulks 1874.6 1916.5 2.2 Of which 2(a) Steel products 406 390 -3.9 2(b) Forest products 354.6 363.6 2.5 Total dry bulks 4915.5 5112.8 4.0 Source: Review of Maritime Transport, 2018, UNCTAD
1.1.18 Global coal trade resumed growth in 2017, increasing by 5.8 per cent following a
limited expansion in 2016 and a significant decline in 2015. Higher import demand in China, the
Republic of Korea and a number of South-East Asian countries supported the volume increase.
Coal imports to China continued to provide strong support for dry bulk shipping demand. China,

11
India, Japan, Malaysia, and the Republic of Korea are major importers of coal, while Australia and
Indonesia are major exporters of the commodity. Growing coal exports from the United States to
China are benefiting dry bulk shipping. One factor is the uncertainty over the Indian coal trade. On
the one hand, India plans to increase domestic production, which may alter the balance between
locally sourced and imported coal. On the other hand, growing demand from the steel sector in
India may boost seaborne imports of coking coal (Barry Rogliano Salles, 2018).
1.1.19 Growing manufacturing activity and construction demand supported a 2.2 per cent
increase in minor bulks commodity trade. Rising demand for commodities such as bauxite, scrap
and nickel ore pushed volumes to 1.9 billion tons. However, the large drop (less 30.8 per cent) in
exports of steel products from China due to reforms in the country’s steel sector undermined the
expansion to some extent. Bauxite shipments expanded by 19.5 per cent, accounting for 13 per cent
of minor dry bulks commodities trade in 2017. The continued rise in Chinese aluminium production
and the availability of bauxite ore, following years of export disruptions, led to an expansion in
bauxite trade. While China dominates the import side with a market share of more than two thirds,
key players on the supply side are more varied and include Australia, Brazil, Guinea and India.
Other Dry Cargo Trades
Containerized Trade
1.1.20 Following the difficult years of 2015 and 2016 when containerized trade grew
modestly at 1.1 per cent and 3.1 per cent, respectively, container market conditions improved in
2017, and strong growth in volumes was recorded across all routes. World containerized trade
volumes expanded by a strong 6.4 per cent in 2017, the fastest rate since 2011. Global volumes
reached 148 million TEUs (UNCTAD Review of Maritime Transport, 2018), supported by various
positive trends. The modest global recovery was central to the rise in containerized volumes. In
addition, factors such as a recession in Brazil and the Russian Federation, increased consumption
requirements in the United States, improved commodity prices, strong import demand from China
and the rapid growth of intra-Asian trade reflecting the effect of regional integration and
participation in global value chains, contributed to the recovery.

12
Seaborne Trade Development Forecast
1.1.21 Global seaborne trade is doing well, helped by the upswing in the world economy.
Prospects for the short and medium term are positive overall – global GDP is expected to grow by
more than 3.0 per cent over the 2018–2023 period (International Monetary Fund, 2018), and
merchandise trade volumes are set to rise by 4.4 per cent in 2018 and 4 per cent in 2019 (World
Trade Organization, 2018). In line with projected economic growth and based on the income
elasticity of seaborne trade estimated for the 2000–2017 period, UNCTAD expects world seaborne
trade volumes to expand by 4.0 per cent in 2018. According to UNCTAD projections, world
seaborne trade will expand at a compound annual growth of 3.8 per cent during that period, based
on calculated elasticities and the latest figures of GDP growth forecast by the International
Monetary Fund for 2018–2023.
1.1.22 In 2018, UNCTAD forecasts indicate that Contingent on continued economic
conditions in the global economy, volumes across all segments are set to expand; it is expected that
containerized and dry bulk commodities trades will record the fastest growth. Tanker trade volumes
should increase, although at a slightly slower pace than other cargo types. Dry bulk commodities
are projected to experience a compound annual growth rate of 4.9 per cent between 2018 and 2023,
while containerized shipments are expected to rise by 6 per cent, supported by positive economic
trends, imports of metal ores to China and steady growth on the non-mainlane trade routes. Further,
crude oil trade is forecast to grow by 1.7 per cent between 2018 and 2023, and combined petroleum
products and gas volumes, by 2.6 per cent.
1.2 India: Seaborne Cargo Traffic
1.2.1 The growth in India’s Port traffic and growth in World output, World trade volume
and World seaborne trade (loadings and unloading) since 2013-14 is given in Chart I.

13
1.3 Cargo Traffic at Indian Ports
1.3.1 During 2018-19, Major and Non-major Ports in India have accomplished a total cargo
throughput of 1280.33 million tonnes reflecting an increase of 5.9% over the corresponding period
of the previous year 2017-18 (Table 3). The growth in cargo handled at Major and Non-major ports
in 2018-19, were 2.9% and 9.9% respectively. The share of Major Port in the total traffic handled at
Indian Port decreased from 56.22% in 2017-18 to 54.60% in 2018-19. Trend in traffic handled at
Major and Non-major Ports is given below in Table 3.
Table 3- Trends in Cargo Handled at Major & Non-Major Ports (Million Tonnes)
Major/Non-Major
2013-14 2014-15 2015-16
2016-17
2017-18
2018-19(P)
Major Ports 555.50 581.34 605.89 648.47 679.47 699.10
(1.8) (4.7) (4.2) (7.0) (4.8) (2.9)
Non-Major Ports
416.97 470.89 465.87 485.21 529.09 581.22
(7.5) (12.9) -(1.1) (4.2) (9.0) (9.9)
All Ports 972.47 1052.23 1071.76 1133.69 1208.56 1280.33
(4.1) (8.2) (1.9) (5.8) (6.6) (5.9) Note: Figures in brackets indicate growth over previous year.

14
1.4 Cargo Traffic at Major Ports
1.4.1 The volume of seaborne cargo traffic handled by ports is mainly shaped by the levels
and changes in both the global and domestic activity. Cargo traffic at India’s 12 major ports during
2018-19 was 699.1 million tonnes achieving growth of 2.9% over the previous year.
1.4.2 During 2018-19, Kamarajar Port recorded highest growth in traffic 13.3 followed by
Haldia Dock Complex (HDC) (11.6%), Cochin Port (9.9%), Paradip Port (7.1%), JNPT (7.1%),
Kolkata Dock System (KDS) (6.7%), Deendayal Port (4.8%), Vishakhapatnam Port (2.8%),
Chennai Port (2.2%) and New Mangalore Port (1.1%). Major ports which recorded negative
growth in traffic during 2018-19 were: Mormugao Port (34.3%), V.O. Chidambaranar Port (6.1%)
and Mumbai Port (3.7%) (Table 4).
Table 4 : Traffic Handled at Major Ports (Thousand Tonnes)
Ports 2013-14 2014-15 2015-16 2016-17 2017-18 2018-19
(P)
% change18-19/ 17-18
1 2 3 4 5 6 7 8 Kolkata 41386 46293 50289 50951 57891 63763 10.1 Kolkata DS 12875 15283 16782 16810 17390 18551 6.7 Haldia DC 28511 31010 33507 34141 40501 45212 11.6 Paradip 68003 71011 76397 88958 102028 109275 7.1 Vizag 58504 58004 57035 61020 63537 65301 2.8 Kamarajar 27337 30251 32206 30020 30446 34497 13.3 Chennai 51105 52541 50058 50214 51881 53012 2.2 Chidambaranar 28642 32414 36849 38463 36583 34341 -6.1 Cochin 20886 21595 22095 25007 29143 32022 9.9 New Mangalore 39365 36566 35582 39936 42059 42510 1.1 Mormugao 11739 14711 20776 33181 26897 17683 -34.3 Mumbai 59184 61660 61119 63129 62902 60588 -3.7 JNPT 62333 63801 64027 62152 66004 70706 7.1 Deendayal 87005 92497 99458 105442 110099 115402 4.8 All Ports 555489 581344 605891 648473 679470 699100 2.9 Source: Major Ports (P): Provisional
1.4.3 Amongst the Major Ports, Deendayal Port handled the maximum Cargo of 115.40
million tonnes with a share of 16.5% in total cargo handled at major ports followed by Paradip Port
(15.6%), JNPT (10.1%), Vishakhapatnam Port (9.3%), Mumbai Port (8.7%), Chennai Port (7.6%),

15
Haldia Dock Complex (6.5%), NMPT (6.1%), Chidambaranar Port (4.9%), Kamarajar Port (4.9%),
Cochin Port (4.6%), Kolkata Dock System (KDS) (2.7%) and Mormugao Port (2.5%) during 2018-
19.
Commodity-wise growth of cargo traffic at Major Ports
1.4.4 At a broad commodity level, 2018-19, Fertilizer (Finished) posted highest growth of
9.5% followed by Container (8.8%). The other commodities such as Thermal coal, Coking coal,
POL and Iron Ore posted growth of 8.0%, 7.9%, 3.6% and 0.4% respectively. Cargo traffic in Food
Grain, Fertilizer Raw (Dry) and other commodities was affected in 2018-19 dropped by 66.8%,
7.2% and 5.9% respectively.
1.4.5 In terms of composition of cargo traffic handled during 2018-19 at major ports, the
largest commodity group (with share in percent in total cargo handled) was POL (31.6%) followed
by Container traffic (20.8%), Other commodities (19.8%), Coal (19.6%), Iron ore (5.9%), Fertilizer
& FRM (2.2%) in Table 5.
Table 5 : Commodity wise Traffic Handled at Major Ports (Thousand Tonnes)
Commodities
2013-14
2014-15
2015-16
2016-17
2017-18
2018-19 (P)
% change2018-19/ 2017-18
1 2 3 4 5 6 7 8 POL* 180507 181020 186360 200225 213261 220964 3.6 Iron Ore@ 23037 18002 15315 41765 41170 41343 0.4 Fertiliser# 13783 16291 16023 14057 15052 15227 1.2 1. Finished 6148 7926 8493 7043 7523 8241 9.5 2. Raw (DRY) 7635 8365 7530 7014 7529 6986 -7.2 Coal 104271 119474 134056 126177 126725 136845 8.0 1. Thermal Coal 71651 87119 100252 90329 87145 94121 8.0 2. Coking Coal 32620 32355 33804 35848 39580 42724 7.9 Food Grain** 4794 3089 2373 6504 2396 795 -66.8 Container (Tonnes) 114672 119441 123168 124663 133726 145445 8.8 Others 114425 124017 128596 135082 147140 138481 -5.9
Total 555489 581334 605891 648473 679470 699100 2.9 * Includes POL crude and POL Products only @ includes iron ore fine and pellets only # includes Fertilizer finished and FRM-Dry only ** excludes pulses P : Provisional Source: Major Ports

16
1.4.6 The Port-wise and Commodity-wise shares in total cargo traffic during 2018-19 are
depicted in the Charts II and III respectively.
Chart-II Major Ports-Portwise share in Traffic Handled during 2018-19 in India
Chart-III Major Ports-Commodity composition of Traffic Handled during 2018-19 in India
1.4.7 The Port-wise & commodity-wise traffic handled at major ports from 2015-16
onwards is given in Annex –I.

17
Container Traffic
1.4.8 Growth in container traffic (in million tonnes) which reflects largely trade in
manufactures and components, at 8.8% during 2018-19 which is much higher as compared to 7.3%
achieved in the year 2017-18. In terms of Twenty Foot Equivalent Units (TEUs), containers
handled by Major Ports during 2018-19 recorded growth of 8.1% as compared to 8.8% during
2017-18 (Table 6).
Amongst the major ports, Mumbai Port (47.8%) witnessed fall in container traffic in
container traffic in 2018-19 compared to 2017-18. JNPT continues to be the leading container
handling port in the country with a share of 42.7% in terms of tonnage and 52.0% in terms of TEUs
in the total container traffic at major ports during 2018-19. Chennai port which handled 21.5% of
container cargo is the second largest container handling port followed by Chidambaranar Port
(10.3%), Cochin Port (5.6%), Vishakhapatnam Port (5.5%) and Deendayal Port (2.7%). .
Table 6: Container Traffic at Major Ports (in thousand tonnes/TEUs)
PORT 2015-16 2016-17 2017-18 2018-19(P) % change 2018-19/ 2017-18
Tn TEU Tn TEU Tn TEU Tn TEU Tn TEU 1 2 3 4 5 6 7 8 9 10 11
Kolkatta DS 9263 578 9887 636 9760 640 9934 652 1.8 1.9 Haldia DC 1376 85 2467 136 2672 156 3140 178 17.5 14.1 Paradip 132 5 42 2 113 7 194 13 71.7 85.7 Vizag 5145 245 6428 367 6835 389 7958 450 16.4 15.7 Chennai 30207 1565 28850 1495 29905 1549 31263 1620 4.5 4.6 Kamarajar 1 0 1 0 52 3 1101 57 2017.3 1800.0 Chidambanar 12388 612 12991 642 14191 698 14955 739 5.4 5.9 Cochin 5785 419 6840 491 7694 556 8116 594 5.5 6.8 New Mangalore 1105 76 1411 95 1744 115 1920 132 10.1 14.8 Mormugao 345 26 402 30 425 32 467 37 9.9 15.6 JNPT 56791 4491 54530 4500 57866 4833 62114 5133 7.3 6.2 Mumbai 574 43 639 43 630 42 329 27 -47.8 -35.7 Deendayal 56 3 175 5 1839 117 3954 243 115.0 107.7 All Ports 123168 8148 124663 8442 133726 9137 145445 9875 8.8 8.1 Note: CP - Corresponding period of previous year; (P) - Provisional; Tn - tonnes; TEU –twenty foot equivalent unit Source: BPS and Major Ports

18
1.5 Cargo Traffic at Non-Major Ports
1.5.1 Non–major ports handled 45.4% of total maritime freight traffic of the country
during 2018-19 as compared to 43.8% during 2017-18.
1.5.2 Table 7 presents maritime state-wise share and growth of traffic handled at Non-
major Ports from 2013-14 onwards.
Table 7 : Traffic Handled by Non-Major Ports by Maritime States/UTs
(000’Tonnes)
Maritime State/UT
2013-14*
2014-15*
2015-16
2016-17
2017-18 2018-19(P)
% Change over previous year
2017-18
2018-19 (P)
Gujarat 309945 336095 339778 345739 370769 399197 7.2 7.7
(74.3) (71.4) (72.9) (71.3) (70.1) (68.7)
Maharashtra 24664 27295 28849 34894 37906 44421 8.6 17.2
(5.9) (5.8) (6.2) (7.2) (7.2) (7.6) Andhra Pradesh
58692 83418 72733 69603 86285 103333 24.0 19.8 (14.1) (17.7) (15.6) (14.3) (16.3) (17.8)
Goa 284 760 430 117 72 15 -38.5 -79.2
(0.1) (0.2) (0.1) (0.0) (0.0) (0.0)
Tamil Nadu 866 825 856 1152 1103 963 -4.3 -12.7
(0.2) (0.2) (0.2) (0.2) (0.2) (0.2)
Karnataka 509 651 835 707 681 1044 -3.7 53.4
(0.1) (0.1) (0.2) (0.1) (0.1) (0.2)
A&N 1149 1156 1323 1276 1418 1495 11.1 5.4 (0.3) (0.2) (0.3) (0.3) (0.3) (0.3)
Odisha 14371 15452 14949 22473 22595 22186 0.5 -1.8 (3.4) (3.3) (3.2) (4.6) (4.3) (3.8)
Kerala 90 159 144 140 138 201 -1.4 45.7
(0.0) (0.0) (0.0) (0.0) (0.0) (0.0)
Puducherry 6281 4958 5974 9112 8121 8369 -10.9 3.1 (1.5) (1.1) (1.3) (1.9) (1.5) (1.4)
All M. States/UTs
416970 470888 465871 485213 529088 581225 9.0 9.9
(100.0) (100.0) (100.0) (100.0) (100.0) (100.0) Note: Figure in parenthesis is the percentage share of traffic handled by the maritime state to the total traffic handled by all the maritime states; P- Provisional Source: Basic Port Statistics of India( BPS), State Maritime Board / Directorate of Port (Andhra Pradesh, Gujarat, Goa, Tamil Nadu, Karnataka, Orissa, Puducherry and Andaman &Nicobar) and PDMP (Maharashtra and Kerala) Note: *Includes 119 ('000) tonnes cargo handled at Lakshadweep during 2013-14 & 2014-15.

19
1.5.3 The growth in cargo handled by the non-major ports during 2018-19 was 9.9%
compared to 9.0% recorded in the previous year. Table 8 gives a glimpse of commodity profile of
the cargo handled. The above table reflects that Gujarat accounted for (68.7%) of the traffic
handled by the non-major ports followed by Andhra Pradesh (17.8%) and Maharashtra (7.6%).
Three maritime States, viz, Gujarat, Andhra Pradesh and Maharashtra together accounted for 94.1%
of the total cargo traffic handled by the non-major ports in 2018-19.
1.5.4 Two commodities, viz. POL and Coal accounted for 61.7 % of the total cargo handled at the
non-major ports during 2018-19 (Table 8).
Table 8: Commodity-wise Traffic Handled by Non-Major Ports
(000’Tonnes)
Commodity 2013-
14 2014-
15 2015-
16 2016-
17 2017-
18 2018-19(P)
% Change over previous year
2017-18
2018-19 (P)
POL* 169777 167278 180641 186070 193422 189570 4.0 -2.0
(40.7) (35.5) (38.8) (38.3) (36.6) (32.6) Iron Ore** 18338 26794 17383 34454 36595 42867
6.2 17.1 (4.4) (5.7) (3.7) (7.1) (6.9) (7.4)
Building Material$ 14178 14224 14173 15170 15588 15986 2.8 2.6
(3.4) (3.0) (3.0) (3.1) (2.9) (2.8) Coal@ 126321 156737 141874 133755 146684 169075
9.7 15.3 (30.3) (33.3) (30.5) (27.6) (27.7) (29.1)
Fertilizer & FRM& 12010 13952 16946 14237 11714 16087 -17.7 37.3
(2.9) (3.0) (3.6) (2.9) (2.2) (2.8) Others 76346 91903 94854 101527 125085 147640
23.2 18.0 (18.3) (19.5) (20.4) (20.9) (23.6) (25.4)
All 416970 470888 465871 485213 529088 581225 9.0 9.9
(100.0) (100.0) (100.0) (100.0) (100.0) (100.0) Note: Figure in parenthesis is the percentage share of major commodity groups in the total traffic handled by the Non major ports * includes POL crude, POL products, LPG/LNG, Naphtha and Fuel oil. @ includes Thermal Coal, Coking coal, other coal and Pet coal. $ includes Building Material and Cement/Clinker ** includes iron ore fines and Pellets & includes Fertilisers, FRM-Liquid, FRM-Dry and Rock Phosphate Source: BPS, Non Major Ports/State Maritime Boards and Port Data Management Port (PDMP)
1.5.5 The share of Maritime States/UTs in the total traffic and Commodity-wise composition of
traffic during 2018-19 is depicted in the pie Charts IV and V respectively.

20
1.5.6 Maritime State-wise & commodity-wise traffic handled at non-major ports during the last
few years is given in Annex II.
21
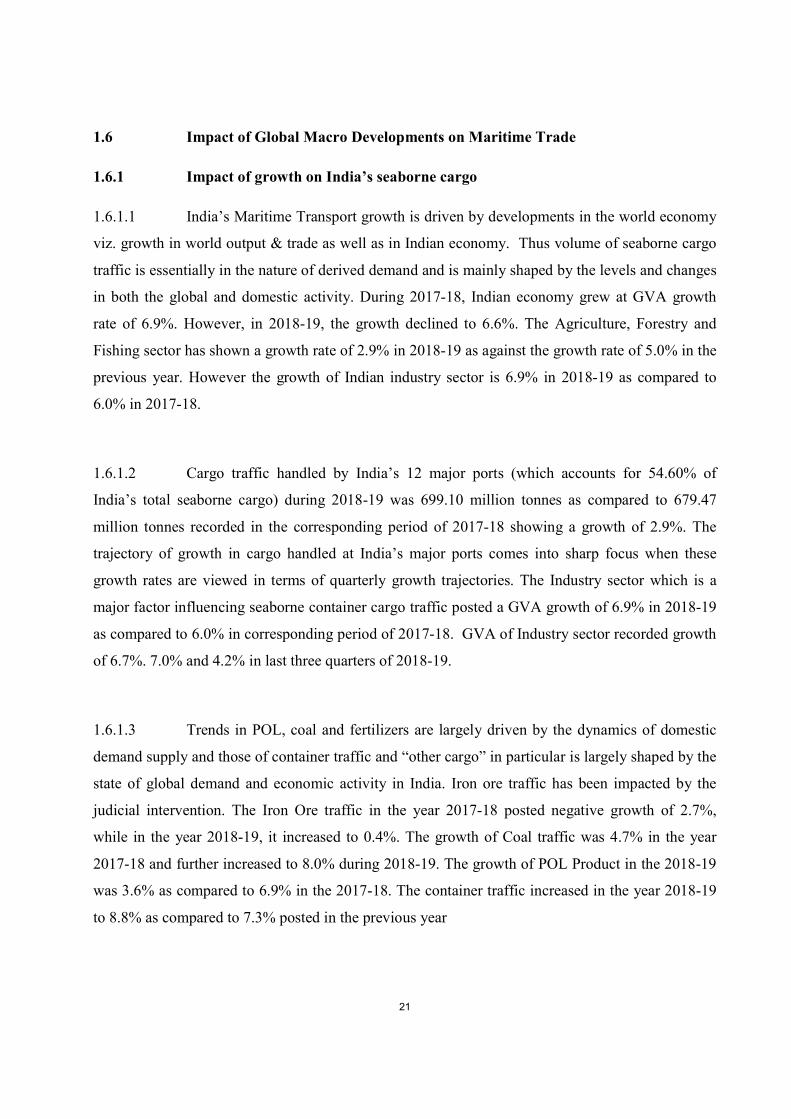
1.6 Impact of Global Macro Developments on Maritime Trade
1.6.1 Impact of growth on India’s seaborne cargo
1.6.1.1 India’s Maritime Transport growth is driven by developments in the world economy
viz. growth in world output & trade as well as in Indian economy. Thus volume of seaborne cargo
traffic is essentially in the nature of derived demand and is mainly shaped by the levels and changes
in both the global and domestic activity. During 2017-18, Indian economy grew at GVA growth
rate of 6.9%. However, in 2018-19, the growth declined to 6.6%. The Agriculture, Forestry and
Fishing sector has shown a growth rate of 2.9% in 2018-19 as against the growth rate of 5.0% in the
previous year. However the growth of Indian industry sector is 6.9% in 2018-19 as compared to
6.0% in 2017-18.
1.6.1.2 Cargo traffic handled by India’s 12 major ports (which accounts for 54.60% of
India’s total seaborne cargo) during 2018-19 was 699.10 million tonnes as compared to 679.47
million tonnes recorded in the corresponding period of 2017-18 showing a growth of 2.9%. The
trajectory of growth in cargo handled at India’s major ports comes into sharp focus when these
growth rates are viewed in terms of quarterly growth trajectories. The Industry sector which is a
major factor influencing seaborne container cargo traffic posted a GVA growth of 6.9% in 2018-19
as compared to 6.0% in corresponding period of 2017-18. GVA of Industry sector recorded growth
of 6.7%. 7.0% and 4.2% in last three quarters of 2018-19.
1.6.1.3 Trends in POL, coal and fertilizers are largely driven by the dynamics of domestic
demand supply and those of container traffic and “other cargo” in particular is largely shaped by the
state of global demand and economic activity in India. Iron ore traffic has been impacted by the
judicial intervention. The Iron Ore traffic in the year 2017-18 posted negative growth of 2.7%,
while in the year 2018-19, it increased to 0.4%. The growth of Coal traffic was 4.7% in the year
2017-18 and further increased to 8.0% during 2018-19. The growth of POL Product in the 2018-19
was 3.6% as compared to 6.9% in the 2017-18. The container traffic increased in the year 2018-19
to 8.8% as compared to 7.3% posted in the previous year

22
The quarterly growth of cargo handled by major ports in 2018-19 was 4.1%, 6.7%, 1.4% and 0.6%
respectively.
1.6.1.4 Table 9 gives Quarter wise trend in growth of cargo traffic handled at Major ports,
GVA overall and GVA of Industry sector during Q1,Q2,Q3,Q4 and annual growth of 2017-18 and
2018-19.
Table -9 - Quarter-wise trend in growth of Cargo Traffic at Major Ports and GVA Commodities/ Year 2017-18 2018-19
Q1 Q2 Q3 Q4 Annual Growth Q1 Q2 Q3 Q4
Annual Growth
POL* 8.9 5.5 6.3 7.8 6.9 0.7 5.8 -2.0 5.8 3.6 Iron Ore # 33.4 11.6 -23.8 -11.1 -2.7 -12.8 -9.1 10.0 -15.8 0.4 Coal @ -9.8 -9.9 13.9 28.4 4.7 23.7 25.9 11.8 -4.1 8.0 Fertilizer ** 6.8 -10.4 0.8 49.1 7.0 9.9 -14.4 1.5 6.5 1.2 Container In tonnes 5.6 7.6 9.4 6.8 7.3 9.8 9.4 8.6 8.6 8.8 In TEUs 6.5 7.3 7.7 10.9 8.1 6.4 9.1 9.5 7.3 8.1 Other cargo 8.8 -2.0 -2.2 -1.5 0.1 -6.5 -1.8 -10.3 -4.5 -5.9 All Cargo 5.0 1.5 4.4 8.5 4.8 4.1 6.7 1.4 0.6 2.9
GVA overall 5.9 6.6 7.3 7.9 6.9 7.7 6.9 6.3 5.7 6.6 GVA -Industry 0.8 6.9 8.0 8.1 5.9 9.8 6.7 7.0 4.2 6.9 GVA: Gross Value Addition at factor cost at 2011-12 prices. * includes POL Product and POL crude, # includes iron ore fines and pellets @ includes Thermal coal and Coking Coal, ** includes Fertilizer and FRM-dry Source: Port Data Management Portal
1.6.2 Recent Developments in Global Ocean Freight Rates
It covers the development of freight rates and transport costs in 2017 and early 2018,
describing relevant developments in maritime markets, namely supply and demand in container
ships, dry bulk carriers and tankers. It highlights significant events leading to major freight rate
fluctuations, industry trends and gives a selective outlook on future developments of freight
markets. It explores the recent trend towards consolidation that developed in the container ship
23
market, both in the form of new mergers and acquisitions, as well as through the emergence of
mega liner shipping alliances and their implication on the market.
1. Container freight rates
The container freight market improved considerably, following a difficult market
environment in 2016. As per UNCTAD Review of Maritime Transport, 2018 report, global
container demand grew at 6.4 per cent in 2017, taking total volumes to an estimated 148 million
TEUs. The strong development in global container shipping demand in 2017 reflects a fundamental
improvement in the global economic environment. Demand growth was particularly high in the first
three quarters of the year, although it slowed down in the last quarter. UNCTAD projects global
containerized trade to expand at a compound annual growth rate of 6.4 per cent in 2018 supported
by the positive economic trends.
Global supply of container ship-carrying capacity, on the other hand, grew at an estimate of
2.8 percent, bringing the total global capacity to 256 million dwt. Although supply growth was
relatively moderate, the container market continued, nevertheless, to struggle with the delivery of
mega container ships and surplus capacity among the larger vessels (exceeding 14,000 TEUs).
World fleet capacity is projected to rise by 3 per cent in 2018 (Review of Maritime Transport, October,
2018 report).
Even though the supply of global container ship capacity continued in 2017, freight rates
made a remarkable recovery from the low recorded in 2016. This performance was supported by the
upturn in the global demand for container transport services in 2017 across all trade lanes. Freight
rates on the mainlane trades routes went up, although they remained volatile, with a drop in the
second half due to low demand growth. The surge was driven mainly by positive market trends in
the developed regions.
With regard to the intra-Asian routes, the Shanghai– Singapore route averaged $148 per
TEU, compared with $70 per TEU in 2016, a 111.4 per cent increase. These rates were supported
by continued positive trends in the Chinese economy, as well as in other emerging economies in the
region. In line with developments concerning demand, supply and spot rates, the shipping charter
market also improved in 2017, as rates increased in most sectors over the year, with some volatility
and variation across vessel sizes. The 12-month charter rate increased to an average of 378 points,
compared with 325 average points in 2016 (Review of Maritime Transport, October, 2018 report).

24
Partly sustained by stronger container demand, this surge reflected the start of the new alliance
structures requiring carriers to charter vessels to fill gaps while their networks were being formed.
Another factor that drove up the rates was that carriers needed to fill short-term capacity
requirements, while awaiting the delivery of new ships.
2. Tanker freight rates
Overall, 2017 proved to be a challenging year for the tanker market, mainly because of the
pressure faced by markets from continuous growth in supply capacity, particularly in the crude
tanker sector that was matched by a relative deceleration in demand growth. It is estimated that
global tanker trade expanded at an annual average growth rate of 3.0 per cent in 2017 (Review of
Maritime Transport, October, 2018 report); the crude oil tanker fleet grew by 5 per cent and the product
tanker fleet grew by 4.2 per cent (Clarksons Research, 2018c). Rapid growth in the capacity of
tankers carrying crude oil and products has further affected market balance, particularly in the crude
oil sector.
The Baltic Exchange dirty tanker index is an index of charter rates for crude oil tankers on
selected routes published by the Baltic Exchange. The Baltic Exchange clean tanker index is an
index of charter rates for product tankers on selected routes published by the Baltic Exchange. Dirty
tankers generally carry heavier oils – heavy fuel oils or crude oil – than clean tankers. The latter
generally carry refined petroleum products such as gasoline, kerosene or jet fuels, or chemicals.
Table 10 - Baltic Exchange Rate Index
2008 2009 2010 2011 2012 2013 2014 2015 2016 2017
% chang
e 2018
(2017/16)
first half year
Dirty Tanker Index
1510 581 896 782 719 642 777 821 726 787 8 667
Clean Tanker Index
1155 485 732 720 641 605 607 638 487 606 24.0 577
Source : Review of Maritime Transport -2018

25
The Baltic index for crude oil (Baltic Exchange dirty tanker index) recorded 8 percent growth
in 2017, reaching 787 points. The Baltic Exchange clean tanker index progressed by 24 percent
from the low level of 2016, reaching 606 points (table 10). Freight rates also remained weak for
both crude and products transports during most parts of 2017.
In 2018, tanker trade volumes are projected to increase, although at a slightly slower pace
than other market segments. However, oversupply capacity should be effectively managed to
improve market balance and freight rates. Reflecting positive trends in demand and better
management of the supply side, global shipping freight rates improved, despite some variations by
market segment. The overall outlook remains positive in view of improved market fundamentals.
3. Dry bulk freight rates
The dry bulk market underwent a remarkable recovery in 2017. Growth in demand for
seaborne dry bulk surpassed the fleet growth, as demand for commodities went up, while the
surplus of vessels gradually continued to diminish. As per UNCTAD Review of Maritime Transport
report, 2018, seaborne dry cargo shipments increased by 4.4 per cent in 2017, up from 2.0 per cent
in 2016. Bulk carrier fleet growth, on the other hand, remained manageable at 3.0 per cent in 2017;
deliveries declined to almost 20 million gross tons, and scrapping activities increased to more than
8 million gross tons.
Consequently, the Baltic Exchange Dry Index rebounded, especially after having
experienced one of the weakest years in 2016 since the financial crisis. As a result, average earnings
increased in all fleet segments, averaging $10,986 per day in 2017, up by 77 per cent from the
depressed levels of 2016 (Clarksons Research, 2018b). The sector experienced a strong rebound in
charter rates as growth in demand for commodities exceeded fleet expansion.
The Capesize market improved significantly in 2017, driven largely by the surge in growth
in the iron ore imports of China and a rebound in coal trade, which helped curb the level of supply
capacity. Charter and freight rates improved substantially, as illustrated by the average Baltic
Capesize Index of the four and five time charter routes, which recorded a high daily level of
$14,227 and $15,291, respectively, twice the average rates of 2016.
26
1.6.3 Trends in Global Top 20 Cargo/Container Ports
1.6.3.1 In 2017, global port activity and cargo handling of containerized and bulk cargo
expanded rapidly, following two years of weak performance. This expansion was in line with
positive trends in the world economy and seaborne trade. Global cargo traffic boasted an increase in
volume of about 5.0% during the year 2017. However, world container terminals boasted an
increase in volume of about 5.8% during the same year 2017. As key players in international trade
and logistics and critical nodes in global supply chains, seaports continue to underpin globalized
production processes, market access and effective integration in the global economy. World
seaports are principal infrastructural assets that service shipping and trade, and their performance is
largely determined by developments in the world economy and trade. Cargo-handling activity and
throughput in global ports, which reflected a recovery in the global economy and a rebound in trade
volumes that boosted shipping demand and seaborne trade in 2017, showed overall improvement
and promising trends.
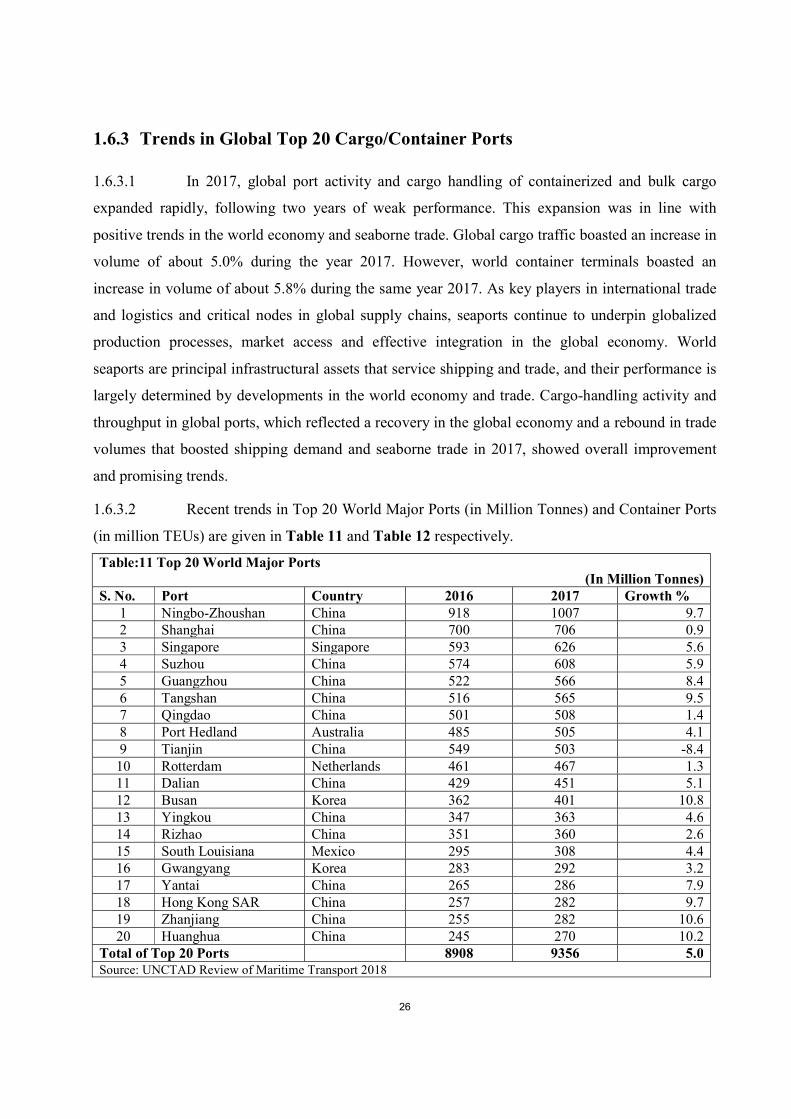
1.6.3.2 Recent trends in Top 20 World Major Ports (in Million Tonnes) and Container Ports
(in million TEUs) are given in Table 11 and Table 12 respectively.
Table:11 Top 20 World Major Ports (In Million Tonnes)
S. No. Port Country 2016 2017 Growth % 1 Ningbo-Zhoushan China 918 1007 9.7 2 Shanghai China 700 706 0.9 3 Singapore Singapore 593 626 5.6 4 Suzhou China 574 608 5.9 5 Guangzhou China 522 566 8.4 6 Tangshan China 516 565 9.5 7 Qingdao China 501 508 1.4 8 Port Hedland Australia 485 505 4.1 9 Tianjin China 549 503 -8.4 10 Rotterdam Netherlands 461 467 1.3 11 Dalian China 429 451 5.1 12 Busan Korea 362 401 10.8 13 Yingkou China 347 363 4.6 14 Rizhao China 351 360 2.6 15 South Louisiana Mexico 295 308 4.4 16 Gwangyang Korea 283 292 3.2 17 Yantai China 265 286 7.9 18 Hong Kong SAR China 257 282 9.7 19 Zhanjiang China 255 282 10.6 20 Huanghua China 245 270 10.2
Total of Top 20 Ports 8908 9356 5.0 Source: UNCTAD Review of Maritime Transport 2018

27
1.6.3.3 Growth in cargo and container traffic at world’s top major ports/container terminals
is a barometer of trends in seaborne trade. The growth in cargo traffic (million tonnes) at world’s
top 20 ports was at 5.0% in 2017 as compared to 4.2% in 2016. The growth in container traffic
(million TEUs) was 5.9% in 2017 as compared to 2.0% in 2016.
1.6.3.4 Container port throughput is driven to a large extent by developments in the world
economy and global demand, including investment, production and consumption requirements.
Trans-shipment is a major area of container port activity that results in particular from hub-and-
spoke container networks and could be enhanced by the further deployment of ultralarge container
vessels. Trends in 2016 and 2017; point to the strategic importance of containerized port activity.
Table: 12 Top 20 World Container Ports (In Million TEUS)
S. No. Port Country
2016 2017 Percentage change
1 Shanghai China 37.1 40.2 8.4 2 Singapore Singapore 30.9 33.7 9.1 3 Shenzhen China 24 25.2 5.0 4 Ningbo-Zhoushan China 21.6 24.6 13.9 5 Busan Republic of Korea 19.9 21.4 7.5 6 Hong Kong Hong Kong SAR 19.8 20.8 5.1 7 Guangzhou (Nansha) China 18.9 20.4 7.9 8 Qingdao China 18 18.3 1.7
9 Dubai United Arab
Emirates 14.8 15.4
4.1 10 Tianjin China 14.5 15.2 4.8 11 Rotterdam Netherlands 12.4 13.6 9.7 12 Port Klang Malaysia 13.2 12.1 -8.3 13 Antwerp Belgium 10 10.5 5.0 14 Xiamen China 9.6 10.4 8.3 15 Kaohsiung Taiwan Province
of China 10.5 10.2
-2.9 16 Dalian China 9.6 9.7 1.0 17 Hamburg Germany 8.9 9.6 7.9 18 Los Angeles United States 8.9 9.3 4.5 19 Tanjung Pelepas Malaysia 8.3 8.3 0.0 20 Laem Chabang Thailand 7.2 7.8 8.3
Total of Top 20 Ports 317.9 336.6 5.9 Source: UNCTAD Review of Maritime Transport 2018
28
1.7 Policy Initiatives - Central Government
1.7.1 In October 1996, the then Ministry of Surface Transport issued guidelines for Private
Sector participation in Major Ports. The guidelines were intended to precisely define the options
for the involvement of private sector in the Major Ports.
1.7.2 Government also issued guidelines on joint venture formation in Major Ports which
came into effect from 1.9.2000. In order to attract private sector investment, model bid documents
were finalized for private sector projects laying down transparent bidding procedure, qualifications
and selection criteria, bid evaluation procedure, termination payment, dispute resolution process
etc. and detailed terms and conditions of the License Agreement, to ensure bankability, uniformity
and reduction in time taken to select the private parties.
1.7.3 The Major Port Trust Act, 1963 was further amended in the year 2000 for allowing
Major Ports to form joint ventures with Non-Major/Foreign Ports as well as companies.
1.7.4 Measures for increasing the capacity of Major Ports which are under the control of
Central Government are taken as part of an ongoing process, keeping in view the demands of
maritime trade through implementation of development plans for the ports, improvement in
productivity, etc. At the end of March, 2019; the cargo handling capacity of Major Ports was
1514.09 Million Tonnes. Commodity-wise capacity of Major Ports at the end of March 2014 to
2019 is given in Annex V.
Private Sector Participation
1.7.5 With opening up of the Indian economy, the Government of India has allowed
private sector participation in Major Ports to infuse funds, induct latest technology, improve
management practices and above all addition of capacity. Foreign direct investment upto 100%
under automatic route is permitted for construction and maintenance of Ports and Harbours.
Maritime States have also identified projects for development of non-major ports for creation of
additional capacity. Private sector is envisaged to fund most of the projects through PPP or BOT or
BOOT basis. It is envisaged that private sector will mainly contribute towards the cost of
development of ports in India.

29
1.7.6 To encourage private sector participation, uniformity, clarity and transparency in the
bidding process is of the prime importance. The Ministry of Shipping has already put in place
guidelines for private sector participation. Bidding documents like Request for Qualification (RFQ),
Request for Proposal (RFP) and Model Concession Agreement (MCA) have been standardized.
Model Concession Agreement (MCA) gives the various parameters for the implementation and
maintenance of PPP projects. The PPP projects are concluded by the Major Ports as per provisions
of MCA. The MCA has been amended in January, 2018 with a view to obviate the problems being
faced in execution of PPP Projects on account of certain provisions of the earlier MCA of 2008 in
order to enhance confidence of investors and make the investments in the Port Sector attractive. At
present, a total of 43 PPP projects are operational and 13 more PPP projects are under
implementation/construction.
Areas of private investment
1.7.7 The following areas which are indicative in nature have been identified for
participation/investment by private sector:-
(a) Leasing out existing assets of the Port.
(b) Construction/creation of additional assets, such as:
Construction and operation of container terminals.
Construction and operation of bulk, break bulk, multipurpose and specialized cargo
berths.
Warehousing, container freight stations, storage facilities and tank farms.
Cranage/handling equipment.
Setting up of captive power plants.
Dry docking and ship repair facilities.
(c) Leasing of equipment for port handling and leasing of floating crafts from the private sector.
(d) Pilotage.
(e) Captive facilities for port based industries.

30
National Transport Development Policy Committee (NTDPC) 1.7.8 The Government of India had constituted National Transport Development Policy
Committee (NTDPC) in 2010 under the Chairmanship of Dr. Rakesh Mohan to formulate a long
term Transport Policy. The Committee has inter-alia made several recommendations for Port Sector
with the intent to provide a long term direction to the future development and governance of Indian
ports and to incentivize and integrate water based transport for it to play an increasing role in the
national transport network. Key recommendations of the Committee are:
a) Strategic view on port investment
(i) Mega ports 1.7.9 A key government priority should be to invest in 4 to 6 Mega ports over the next 20
years, with 2 to 3 on each coast to substantially cater to our foreign trade and the estimated
requirement of raw material imports and exports by 2030. These mega ports can be established
either by transforming some of the existing major (or non-major) ports into mega ports, if feasible,
by combining some major and minor ports, or by setting up totally new mega ports. The location of
the proposed mega ports should be harmonised with plans for the National Highway Development
Project (NHDP) as well as with the upcoming and future Dedicated Freight Corridors (DFCs).
(ii) Drafts
1.7.10 A minimum draft availability of 14 meters in Major Ports has been targeted during
the 12th Plan period. The targets for two hub ports, one each on the east coast and west coast are 17
meters. Plans to undertake capital dredging work to enhance the draft availability at channels and
berths have been formulated by each major port. Presently, 10 Major Ports have a draft of 14
meters or above. Proposals are in hand to raise the draft at Mormugao port and Kamarajar
(Ennore) port to 18 meters.
b) Strategic Institutional shift – Landlord model of port governance
1.7.11 The ports in India, essentially the major-ports, widely follow a hybrid format of the
long obsolete service port model and the preferred landlord model. The hybrid approach has
resulted in a conflict of interest between the port trusts and the private sector. There is immediate
need to make appropriate legislative and policy changes to expedite the move to the landlord model
and to transform the port trusts to statutory landlord port authorities through specific legislation. All

31
the terminal operations of port trusts would need to be corporatized as public sector corporationsby
then, both private and corporatized public-sector terminal operators would compete under the aegis
of the landlord port authority. The corporatized public sector terminal operators could potentially be
disinvested, listed, and possibly privatised at a later stage. The landlord port authority would carry
out all public sector services and operations such as the award of bids for containers and other
terminals, dredging etc.
Any progressive regulatory shift should attempt to bring in the cooperation and participation
of maritime states. New Land Policy Guidelines have since been issued in January, 2014. These
guidelines provide an open and transparent framework for managing Port Lands. The Policy will
ensure that land resources of the Ports are put to optimum use and all leasing of port lands is done
through a transparent tender-cum-auction methodology. This has brought in accountability and
minimized the element of discretion and arbitrariness at port level.
c) Role of TAMP
1.7.12 Tariff Authority for Major Ports (TAMP) regulates all tariffs in respect of Major
Port Trusts and the private operators located therein. Necessary modifications in the Tariff
Guidelines are made from time to time to promote the development of the Major Ports, Keeping in
view the interest of the various stakeholders. In order to allow the competitive market forces to play
a greater role in determination of tariff at Major Ports Trusts, the Government issued two new sets
of Tariff Guidelines namely Guidelines for Determination of Tariffs for projects at Major Ports,
2013 and Guidelines for Port Charges, 2015. These Guidelines impart flexibility to the PPP
operators as well as Major Ports owned terminals in determining their tariffs.
d) Coastal Shipping
1.7.13 With a view to promote coastal shipping, the Ministry of Shipping has taken a set of
policy initiatives. One such initiative is to have a Green Channel clearance for cargo in major Ports
as coastal cargo does not require customs clearance and only information needs to be filed with the
customs. All the Major Ports are required to identify suitable infrastructure so that Green Channel
clearance for coastal cargo can be made operational. Green Channel clearance has already become
operational in 8 Major Ports. Presently because of lack of exclusive berth, storage area and gates for
coastal cargo in the ports, there is considerable delay in clearance of these cargoes. The Ministry of
Shipping has given a policy directive to all the major ports to have exclusive berths with associated

32
storage space and separate gates for coastal cargo. A new scheme for setting up of coastal berths at
Major Ports has been approved. The Cabinet has also given approval to create a Special Purpose
Vehicle (SPV) to focus on providing different evacuation system in Major Ports and their
connectivity.
Existing Coastal Berth Scheme has been revamped under Sagarmala project to provide financial
support by way of grant to:
(a) Construction/ up-gradation of exclusive coastal berths for coastal cargo
(b) berths/Jetties for passenger ferries in Major/Non major Ports
(c) Construction of platforms/ jetties for hovercrafts/ seaplanes by ports (Major/Non-major
ports/State government) in port waters
(d) Construction of berths/jetties in National Waterways and Inland of State governments
concerned.
(e) Mechanization of Coastal berths for major ports and non-major ports
(f) Capital dredging grant for operative non-major ports and
(g) Construction of break water for existing and green filed ports
Assistance under the proposed revised scheme would be given up to 50% of the total cost of the
project subject to a maximum of Rs. 25 crores for projects of construction/ upgradation of coastal
berths.
e) Sagarmala Project
1.7.14 The project has been launched with an objective of modernizing the ports along
India’s Coastline and achieving rapid expansion of port capacity and development in land and
coastal navigation. The initiative aims at supporting port led development through appropriate
policy and institutional interventions, port infrastructure enhancement including modernization and
setting up of new ports and efficient evacuation to and from hinterland. The work under the project
will be done in close coordination with Maritime States/ UT governments.
f) A New Central Sector Scheme has been formulated for providing financial assistance
to Major Ports for Green Port Initiatives.
1.7.15 The objective of the New Central Sector Scheme is to support Major Ports by way of
financial assistance to formulate an Environmental Management and Monitoring Plan (EMMP) or
Green Plan as also to acquire equipments for monitoring the environmental pollution and take
mitigating measures to keep the pollution within accepted regulatory standards/norms. It is also
33
proposed to give financial assistance for taking up projects for energy generation from renewable
energy resources as also for other projects for addressing Green Port Initiatives like water re-
cycling, ecologically friendly garbage disposal, Green curtains, water curtains etc. Financial
assistance under the Scheme would be given in the form of grant-in-aid. It would be given to the
extent of 50% of the cost of the project with the balance to be contributed by the concerned Major
Port.
a) New Central Sector Scheme for providing assistance to Major Ports and oil handling
Non-Major Ports under State Maritime Boards/ State Government for combating oil
pollution and for mitigating measures
1.7.16 Government has formulated a new Central Sector Scheme for providing assistance to
Major Ports and 26 oil handling Non-Major Ports under State Maritime Boards/ State Governments
for combating oil pollution/spills and for mitigating measures. Financial assistance under the
Scheme would be given in the form of grant-in-aid to help these ports procure pollution response
(PR) equipments/ materials necessary for combating Tier-I oil spills in their port waters. Based on
the risk of oil spill, these Ports have been divided in 3 categories viz category A, B, & C and for
procurements of requisite Pollution Response equipments /materials. The estimated cost is Rs. 15
Cr., Rs. 2.50 cr and Rs. 1.00 cr. respectively. Assistance under the Scheme would be given upto
50% of the total cost of the procurement of pollution response (PR) equipments/ materials in 2
equal instalments and the balance 50% to be contributed by the respective port from its’ own
resources.
b) Stevedoring Policy
1.7.17 The Ministry of Shipping has formulated a new Stevedoring and Shore handling
policy for Major Ports. The policy has been prepared in consultation with Major Ports and other
Stake-holders. The policy shall come into effect in all the Major Ports except Haldia Dock Complex
(HDC) not later than 01.04.2016. The policy envisages an open and transparent auction system
based on the TAMP notified tariff to give licenses for stevedoring and shore handling on revenue
sharing basis for a period of three years. It is expected that the policy will bring in competition
amongst the service providers and enable qualitative and cost effective services to the Trade.
34
a) Benchmarking Study of Major Ports (Project UNNATI)
1.7.18 An international consultant was engaged to prepare a Quantitative Benchmarking
Module which covered the operational, financial, human resources and efficiency related
parameters for benchmarking of efficiency and productivity of Major Ports in India against
international standards and define Key Performance Indicators for the ports and terminals. The
study covered marine operations, stevedoring, jetty operations, vessel operations, Yard
performance, Labor productivity, Cargo storage (containers & dry bulk only), rake operations
(loading/unloading of rakes), maintenance (Equipment uptime and breakdowns), Gate-In and Gate-
out operations, safety, customs and penetration of IT.
1.7.19 The benchmarking study focused on identifying how efficiently capacity is utilized
and underlying operational performance metrics across commodities. The low berth productivity
and crane productivity across container terminals at Major Ports along with potential to drive 15-
20% higher volumes of coal across ports, just by replicating 'Best Demonstrated Performance
(BDP)' consistently was studied. Potential to double volumes of POL by replicating BDP and
reducing non working time and high costs of labour and maintenance dredging across ports was
also analyzed.
1.7.20 On the basis of the quantitative and qualitative benchmarking carried out, a clear
roadmap for improvement for each port has been laid out covering changes in the areas of core
business processes, equipment, organization structure, people skills, information technology and
infrastructure.
1.7.21 A total number of 116 new initiatives for 12 Major Ports has been identified which
would increase the volume of traffic significantly and also avoidance of capital expenditure. The
roadmap for improvement has been suggested along with the timelines, approach and methodology
for implementation. All the 116 recommendations are to be implemented by December 2019. Out
of these, 93 have already been implemented. The implementation of these initiatives will further
improve the efficiency and performance of the Ports of rakes), maintenance (Equipment uptime and
breakdowns), Gate-In and Gate-out operations, safety, customs and penetration of IT.
c) Coastal Transportation of Vehicles by Ro-Ro Vessels
1.7.22 To promote Coastal Transportation of vehicles by Ro-Ro Vessels, the rebate on
vessel related charge (VRC) and cargo related charge (CRC) at Major Ports has been increased
from existing 40% to 80% for two years w. e. f. 20th September, 2016.

35
2. POLICY AND PERFORMANCE OF MARITIME STATES
2.1 Ports are economic and service provision units of a remarkable importance since
they act as a place for the interchange of two transport modes, maritime and land, whether by rail or
road. Therefore, the essential aspect of ports lies in their intermodal nature. India has a coast-line of
over 7517 Kms with 12 major ports and 205 notified non-major (minor/intermediate) ports along
the coast-line and sea-islands. These 205 Non-major ports are located in Gujarat (46), Maharashtra
(48), Goa (5), Daman & Diu (2), Karnataka (9), Kerala (17), Lakshadweep (10), Tamil Nadu (16),
Puducherry (3), Andhra Pradesh (12), Orissa (13), West Bengal (1) and Andaman & Nicobar Island
(23). Out of these 205 Non-major ports, only some ports are well developed and provide all-
weather berthing facilities for cargo handling. In 2018-19, only 65 Non-major Ports were reported
to have handled cargo traffic. Chart-VI gives the geographical location of the Major and prime
Non-Major Ports. The Maritime Ports operate within the statutory framework of the Indian Ports
Act 1908 which applies to all the ports. However, the Major Ports Act 1963 applies only to Major
Ports. Each Major Port is administered by a ‘Port Trust’ except for the port of Kamarajar (Ennore)
which is a corporatized entity.
Chart - VI
Source:http://www.mapsofindia.com
36
2.2 The Major Ports are under the purview of the Centre while the Non-Major Ports are
under the purview of the States. Port development in the Central Sector has emphasized additions
to capacity as well as provision of commodity specific handling facilities (at Major Ports) as per the
Plan Schemes. With the liberalization of the economy, private sector participation in development
of Major Ports has been encouraged. The Maritime States are also actively pursuing the
development of Non-Major Ports to meet the growing needs of the sea borne trade.
2.3 Maritime States Development Council (MSDC)
2.3.1 With a view to have an integrated approach for the development of both Major and
Non-Major Ports, the Maritime States Development Council (MSDC) was constituted in May,
1997 under the Chairmanship of the Hon’ble Minister of Shipping. The Ministers in-charge of
Ports in all Maritime States, Union Territories of Puducherry, Andaman’s & Nicobar
Administration, Daman & Diu and Lakshadweep are its members. The deliberations and decisions
of the MSDC provide the institutional framework for coordinated development of Major and Non-
Major ports. So far sixteen meetings of MSDC have been held.
2.4 Maritime States – Non-Major Ports
2.4.1 Non-major ports in India collectively handled 581.23 million tonnes of traffic with a
share of 45.4% in total cargo handled during 2018-19 as compared to 529.09 million tonnes of
cargo handled in 2017-18 recording growth of 9.0%.
2.4.2 GUJARAT
2.4.2.1 The state of Gujarat is endowed with 1215 km length of coastline which constitutes
about one-sixth of the total Indian coastline. Out of 47 ports located along its coastline, 46 are non
major ports while one port, viz. Kandla is a major port. Out of 46 non-major ports, 18 non-major
ports in the State are handling cargo. The remaining 28 non-major ports are used for fishing
activities and have negligible traffic. A snap view of the location of ports in Gujarat is given in
Chart –VII.

37
Chart – VII: Gujarat: Major and Minor Ports
Source : http://www.gmbports.org/port_pog.htm
2.4.2.2 The trends in the cargo handled at both major and non-major ports of the State during
the last few years are given in Table 13.
Table 13 - Gujarat: Trends in Cargo Handled at Major & Non-Major Ports (MillionTonnes)
Major/Non-Major
2013-14 2014-15 2015-16 2016-17 2017-18 2018-19(P)
Major Ports 87.01 92.50 99.46 105.44 110.10 115.40
-(7.1) (6.3) (7.5) (6.0) (4.4) (4.8)
Non-Major Ports
309.95 336.10 339.78 345.74 370.77 399.20
(7.7) (8.4) (1.1) (1.8) (1.8) (7.2)
All Ports 396.96 428.59 439.24 451.18 480.87 514.60
(4.1) (8.0) (2.5) (2.7) (2.7) (7.0)
Figures in bracket represent percentage change over the previous year/period. (P) Provisional
2.4.2.3 It is noteworthy that all ports (major and non-major) located along the coast of
Gujarat handled 40.2% of the total cargo handled by Indian ports in 2018-19. The total cargo traffic
handled at the major and non-major ports of Gujarat during 2018-19 was of the order of 514.60

38
million tonnes as against 480.87 million tonnes in the same periods of 2017-18, reflecting an
increase of 7.0%. In particular, non-major ports of Gujarat alone handled more than two third of
total cargo traffic at India’s non-major ports during 2018-19.
2.4.2.4 Amongst the Maritime States of India, Gujarat is one of the States, which has played
a proactive role in the development of non major ports on its coastline. The share of commodity-
wise traffic handled by non-major ports of Gujarat is shown in Chart VIII.
2.4.2.5 Recent trends in cargo handled and capacity creation in non-major ports of Gujarat
are captured in the Table 14. It indicates sustained increase in cargo throughout and capacity
addition. During the year 2018-19; 19 million tonnes of capacity was added taking the total cargo
handling capacity in the non- major port sector in Gujarat to 542 million tonnes. Gujarat Maritime
Board (GMB) is the nodal agency for regulation and development of the State’s maritime activities.
The table indicates that from the year 2013-14 onwards the capacity of Non-major ports increased
every year.
Table 14 - Gujarat: Non Major Ports - Capacity & Utilization (Million Tonnes)
Item 2013-14 2014-15 2015-16 2016-17 2017-18 2018-19(P) Capacity* 387 422 466 501 523 542
(5.7) (9.0) (10.4) (7.5) (4.4) (3.6) Cargo Handled 309.95 336.09 339.78 345.74 370.77 399.20
% Utilization 80.1 79.6 72.9 69.0 70.9 73.7 * Including Lighterage Port Capacity; Figures within parenthesis indicate capacity addition in % age during the year

39
2.4.2.6 As per the port policy, Gujarat Maritime Board (GMB) has selected 11 Green Field
sites for development of new ports as “All weather Deep Water Direct Berthing Ports”. Amongst
11 ports, 6 ports are to be developed through private investment and remaining 5 ports in the joint
sector.
2.4.3 MAHARASHTRA
2.4.3.1 The State has a coastline of around 653 km, with 2 major ports viz. Mumbai and
Jawahar Lal Nehru and 48 non-major ports. Out of 48 non-major ports only 13 ports handle cargo.
Maharashtra Maritime Board (MMB) is the nodal agency for regulation and development of the
State’s maritime activities. Total cargo handled during 2018-19 was 175.72 million tonnes
compared to 166.81 million tonnes handled during 2017-18 with the growth of 5.3%. However the
share of the cargo handled at the two major Ports of Maharashtra State in the total cargo was 74.7%
while share of non-major ports was only 25.3%.
2.4.3.2 The trend in the cargo handled at both major and non-major ports of the State during
the last few years and current year is given in Table 15.
Table 15 - Maharashtra: Cargo Handled at Major & Non-Major Ports (Million Tonnes)
Major/Non-Major
2013-14 2014-15 2015-16 2016-17 2017-18 2018-19(P)
Major Ports 121.52 125.46 125.15 125.28 128.91 131.29 -(0.8) (3.2) -(0.3) (0.1) (2.9) (1.9)
Non-Major Ports
24.66 27.30 28.85 34.89 37.91 44.42 (1.9) (10.7) (5.7) (21.0) (8.6) (17.2)
All Ports 146.18 152.76 154.00 160.18 166.81 175.72 -(0.4) (4.5) (0.8) (4.0) (4.1) (5.3)
Figures in bracket represent percentage change over the previous year/period. P- Provisional.
2.4.4 GOA
2.4.4.1 Goa with a coastline of about 118 kms is criss-crossed by 7 rivers. Apart from the
major port at Mormugao, there are five non-major ports all of which are riverine ports with an
average depth of about 2 meters except Panaji (which is the lone cargo handling non-major port)
with a depth of 4 meters. In Goa State, the cargo handled at Non-major Ports was very less
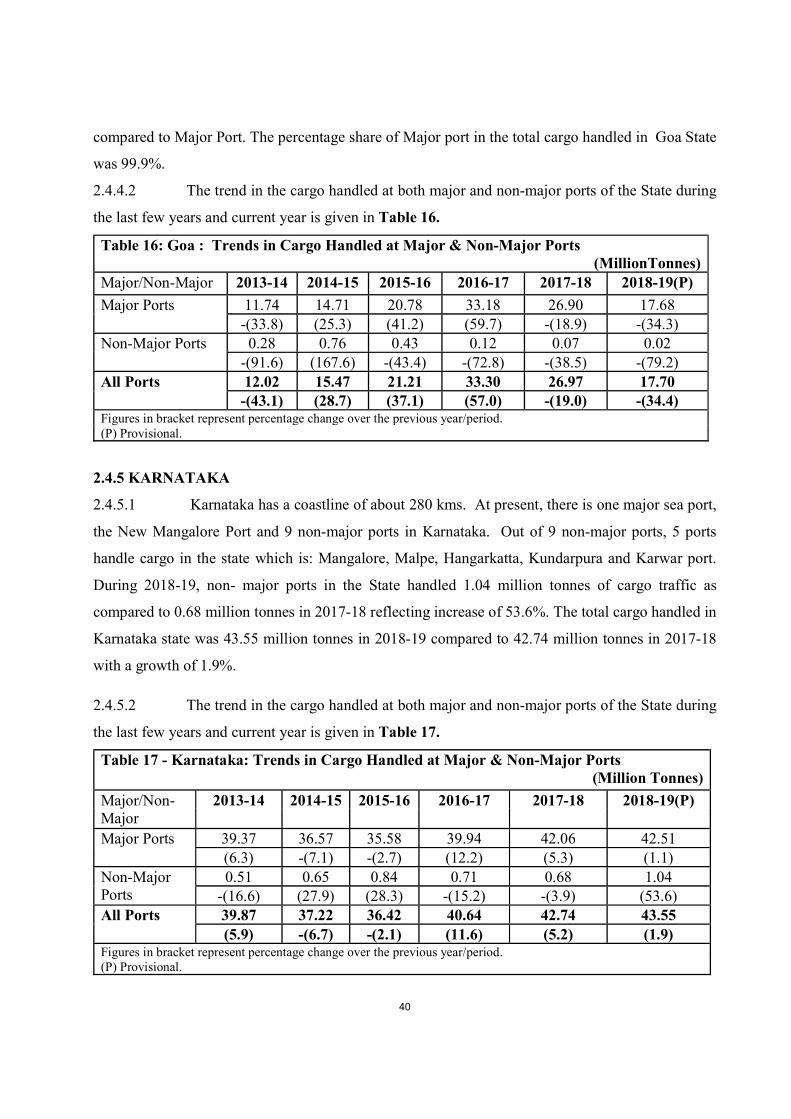
40
compared to Major Port. The percentage share of Major port in the total cargo handled in Goa State
was 99.9%.
2.4.4.2 The trend in the cargo handled at both major and non-major ports of the State during
the last few years and current year is given in Table 16.
Table 16: Goa : Trends in Cargo Handled at Major & Non-Major Ports (MillionTonnes)
Major/Non-Major 2013-14 2014-15 2015-16 2016-17 2017-18 2018-19(P)
Major Ports 11.74 14.71 20.78 33.18 26.90 17.68 -(33.8) (25.3) (41.2) (59.7) -(18.9) -(34.3)
Non-Major Ports 0.28 0.76 0.43 0.12 0.07 0.02 -(91.6) (167.6) -(43.4) -(72.8) -(38.5) -(79.2)
All Ports 12.02 15.47 21.21 33.30 26.97 17.70 -(43.1) (28.7) (37.1) (57.0) -(19.0) -(34.4)
Figures in bracket represent percentage change over the previous year/period. (P) Provisional.
2.4.5 KARNATAKA
2.4.5.1 Karnataka has a coastline of about 280 kms. At present, there is one major sea port,
the New Mangalore Port and 9 non-major ports in Karnataka. Out of 9 non-major ports, 5 ports
handle cargo in the state which is: Mangalore, Malpe, Hangarkatta, Kundarpura and Karwar port.
During 2018-19, non- major ports in the State handled 1.04 million tonnes of cargo traffic as
compared to 0.68 million tonnes in 2017-18 reflecting increase of 53.6%. The total cargo handled in
Karnataka state was 43.55 million tonnes in 2018-19 compared to 42.74 million tonnes in 2017-18
with a growth of 1.9%.
2.4.5.2 The trend in the cargo handled at both major and non-major ports of the State during
the last few years and current year is given in Table 17.
Table 17 - Karnataka: Trends in Cargo Handled at Major & Non-Major Ports (Million Tonnes)
Major/Non-Major
2013-14 2014-15 2015-16 2016-17 2017-18 2018-19(P)
Major Ports 39.37 36.57 35.58 39.94 42.06 42.51 (6.3) -(7.1) -(2.7) (12.2) (5.3) (1.1)
Non-Major Ports
0.51 0.65 0.84 0.71 0.68 1.04 -(16.6) (27.9) (28.3) -(15.2) -(3.9) (53.6)
All Ports 39.87 37.22 36.42 40.64 42.74 43.55 (5.9) -(6.7) -(2.1) (11.6) (5.2) (1.9)
Figures in bracket represent percentage change over the previous year/period. (P) Provisional.

41
2.4.6 KERALA
2.4.6.1 Kerala has a coastline of 570 kms, with one major port at Cochin and 17 other non-
major ports. The Vallarpadam Container Terminal Project in Cochin has been promoted on BOT
basis through public private participation. In Kerala, 4 non-major ports are handling cargo are
Kovalam /Vizhinjam, Kollam / Neendakara, Beypore and Azhikkal.
2.4.6.2 The trend in the cargo handled at both major and non-major ports of the State during
the last few years and current year is given in Table 18.
Table 18 - Kerala : Trends in Cargo Handled at Major & Non-Major Ports (Million Tonnes)
Major/Non-Major
2013-14 2014-15 2015-16 2016-17 2017-18 2018-19(P)
Major Ports 20.89 21.60 22.10 25.01 29.14 32.02
(5.3) (3.4) (2.3) (13.2) (16.5) (9.9)
Non-Major Ports
0.09 0.16 0.14 0.14 0.14 0.20
-(6.3) (76.7) -(9.4) -(2.8) -(1.4) (45.9)
All Ports 20.98 21.75 22.24 25.15 29.28 32.22
(5.2) (3.7) (2.2) (13.1) (16.4) (10.0) Figures in bracket represent percentage change over the previous year/period. (P) Provisional. .
2.4.7 TAMIL NADU
2.4.7.1 Tamil Nadu has a coastline of about 906 km, with 3 major ports at Chennai,
Kamarajar (Ennore) and Chidambaranar (Tuticorin) and 16 non-major ports. Out of 16 non-major
ports, only 5 ports handled Cargo are Cuddalore, Nagapattinam, Ennore, Kattupalli and
Thirukkadaiyur. A Port Policy for promoting private investment for the development of minor
ports in Tamil Nadu has been formulated. Its main objectives are to provide exclusive port
facilities for import of Coal/Naphtha/Oil/Natural Gas for shore based thermal power plants,
promote export oriented and port based industries along the coastal districts of Tamil Nadu,
encourage ship-repairing, ship-breaking and manufacture of cranes and floating cranes. In addition,
leisure tourism and water sports along the coastline are also aimed.

42
2.4.7.2 During 2018-19, the non-major ports in Tamil Nadu collectively handled 0.96
million tonnes of cargo traffic as compared to 1.10 million tonnes in 2017-18. The trend in the
cargo handled at both major and non-major ports of the State during the last few years and current
year is given in Table 19.
Table 19 - Tamil Nadu: Trends in Cargo Handled at Major & Non-Major Ports (Million Tonnes)
Major/Non-Major
2013-14 2014-15 2015-16 2016-17 2017-18 2018-19(P)
Major Ports 107.08 115.21 119.11 118.70 118.91 121.85 (7.6) (7.6) (3.4) -(0.3) (0.2) (2.5)
Non-Major Ports
0.87 0.83 0.86 1.15 1.10 0.96
-(6.9) -(4.7) (3.8) (34.6) -(4.3) -(12.7)
All Ports 107.95 116.03 119.97 119.85 120.01 122.81
(7.4) (7.5) (3.4) -(0.1) (0.1) (2.3) Figures in bracket represent percentage change over the previous year/period. (P) Provisional.
2.4.8 ANDHRA PRADESH
2.4.8.1 Andhra Pradesh has one major port at Visakhapatnam besides 12 non-major port
locations: Bhavanapadu, Meghavaram, Bheemunipatnam, Gangavaram, Kakinada SEZ, Kakinada
Deep Water, Rawa, Narsapur, Machilipatnam, Nizamapatnam, Vodarevu , Mutyalammapalem and
Krishnapatnam. Out of 12 non-major Ports; 5 Ports having cargo handled in the States are:
Kakinada Deep Water, Krishnapatnam, Gangavaram, Rawa and Kakinada Anchorage Port. In
addition, the department of ports is taking up limited operations at the Kakinada anchorage port.
2.4.8.2 Ports in Andhra Pradesh collectively handled 168.6 million tonnes of cargo during of
2018-19 compared with 149.8 million tonnes in 2017-18 thus registering increase of 12.6% in
traffic handled by major and non-major ports of Andhra Pradesh. Non-major ports in Andhra
Pradesh have shown a growth of 19.8% in 2018-19.
2.4.8.3 The trend in the cargo handled at both major and non-major ports of the state during
the last few years and current year is given in Table- 20.

43
Table 20 - Andhra Pradesh: Trends in Cargo Handled at Major & Non-Major Ports (Million Tonnes)
Major/Non-Major
2013-14 2014-15 2015-16 2016-17 2017-18 2018-19(P)
Major Ports 58.50 58.00 57.04 61.02 63.54 65.30 -(0.9) -(0.9) -(1.7) (7.0) (4.1) (2.8)
Non-Major Ports
58.69 83.42 72.73 69.60 86.29 103.33 (13.3) (42.1) -(12.8) -(4.3) (24.0) (19.8)
All Ports 117.2 141.4 129.8 130.6 149.8 168.6 (5.7) (20.7) -(8.2) (0.7) (14.7) (12.6)
Figures in bracket represent percentage change over the previous year/period. (P) Provisional.
2.4.9 ODISHA
2.4.9.1 Odisha has a Coast line of 480 Kms. from Andhra Pradesh border in Ganjam District
to West Bengal border in Balasore District. It is endowed with conducive, unique, natural and
strategic port locations. The Government of Odisha identified 14 potential sites for development of
Minor Ports. To facilitate developers for development of Minor Ports, Government of Odisha
framed the Port Policy during the year 2004.
2.4.9.2 The advantages for development of sea ports in Orissa includes availability of a vast
hinterland generating cargo, comprising of other developing Eastern and Central Indian States,
mineral rich hinterland which offers long term potential for cargo which need seaport facility in
Orissa. Paradip port is the only major port in the State under the control of Government of India
which is packed to accommodate increasing traffic. Out of 13 non-major Ports; only two ports
handled cargo traffic in Odisha which are Gopalpur and Dhamra Port.
2.4.9.3 Non-major ports in Odisha collectively handled 22.19 million tonnes of cargo during
2018-19 compared to 22.60 million tonnes in the corresponding period of 2017-18 registering a
decrease of 1.8% in traffic. However, the total cargo handled during 2018-19 was 131.46 million
tonnes compared to 124.62 million tonnes in the corresponding period of 2017-18 registering an
increase of 5.5% in traffic. The cargo handled at Major port has registered a growth of 7.1% during
2018-19 compared to same period of 2017-18.

44
2.4.9.4 The trends in the cargo handled at both major and non-major ports of the State
during the last few years and current year are given in Table 21.
Table 21 - Odisha : Trends in Cargo Handled at Major & Non-Major Ports (Million Tonnes)
Major/Non-Major
2013-14 2014-15
2015-16 2016-17 2017-18 2018-19(P)
Major Ports 68.00 71.01 76.40 88.96 102.03 109.28
(20.3) (4.4) (7.6) (16.4) (14.7) (7.1)
Non-Major Ports
14.37 15.45 14.95 22.47 22.60 22.19
(29.8) (7.5) -(3.3) (50.3) (0.5) -(1.8)
All Ports 82.37 86.46 91.35 111.43 124.62 131.46
(21.8) (5.0) (5.6) (22.0) (11.8) (5.5) Figures in bracket represent percentage change over the previous year/period. (P) Provisional.
2.4.10 WEST BENGAL
2.4.10.1 The State of West Bengal has a coastline of about 158 kms which has two Docks at
Kolkata Port Trust and Haldia Port Trust under a single major port and one non- major port. The
trends in the cargo handled at both major and non-major ports of the State during the last few years
and current year are given in Table 22.
Table 22 - West Bengal :Trends in Cargo Handled at Major & Non-Major Ports (Million Tonnes)
Major/Non-Major
2013-14 2014-15 2015-16 2016-17 2017-18 2018-19(P)
Major Ports 41.39 46.29 50.29 50.95 57.89 63.76 (3.7) (11.8) (8.6) (1.3) (13.6) (10.1)
Non-Major Ports
0 0 0 0 0 0
All Ports 41.39 46.29 50.29 50.95 57.89 63.76 (3.7) (11.9) (8.6) (1.3) (13.6) (10.1)
Figures in bracket represent percentage change over the previous year/period. P- Provisional
2.4.11 OTHER NON-MAJOR PORTS
2.4.11.1 The other non-major ports are spread across the Union Territories (UTs) of Daman
& Diu, Puducherry, Lakshadweep and Andaman & Nicobar Islands. These ports in the UTs are

45
administered through their respective Departments. Andaman & Nicobar Islands administration has
constituted a ‘Port Management Board’ for the development of ports in the Islands. The three non-
major ports of Daman & Diu and Lakshadweep are not handling any cargo traffic for the last few
years.
2.4.11.2 The trends in the cargo handled at both major and non-major ports of the Andaman
& Nicobar Islands during the last few years and current year are given in Table 23.
Table 23 - Union Territory: Trends in Cargo Handled at A & N Islands Port (Million Tonnes)
Major/Non-Major
2013-14 2014-15 2015-16 2016-17 2017-18 2018-19(P)
Andaman & 1.15 1.16 1.32 1.28 1.42 1.49
Nicobar Islands
(7.4) (0.6) (14.4) -(3.6) (11.1) (5.4)
Figures in bracket represent percentage change over the previous year/period. P-Provisional
2.4.11.3 In January 2006, the Government of Puducherry entered into a concession agreement
with private developers for the development of deep water ports on BOT basis at Puducherry and
Karaikal. The commercial operations started in April 2009.
2.4.11.4 The trends in the cargo handled at both major and non-major ports of Puducherry
during the last few years and current year are given in Table 24.
Table 24 - Union Territories: Trends in Cargo Handled at Non-Major Ports (Million Tonnes )
Major/Non-Major
2013-14 2014-15 2015-16 2016-17 2017-18 2018-19(P)
Lakshadweep 0.12 0.12 - -
-
-
Puducherry 6.28 4.96 5.97 9.11 8.12 8.37
(-9.1) (-21.1) (20.5) (52.5) (-10.9) (3.1)

46
3: PERFORMANCE INDICATORS
3.1 Capacity Utilization for Major and Non-Major Ports
3.1.1 Over the years, cargo handling capacity of major ports has steadily increased to cater
to the growing volume of internal and external trade. The capacity of the ports which was 172.59
million tonnes at the end of 1993-94 increased to a level of 1514.09 million tonnes at the end of
2018-19. The capacity of Non-Major Ports has been increased by 54.12 million tonnes to 910.32
million tonnes in 2018-19 as compared to 856.2 Million tonnes in 2017-18. The port-wise capacity
and traffic of Major and Non-Major Ports for 2018-19 is brought out in Table 25 & 26
respectively.
Table 25: Major Port-wise Capacity Utilization during 2018-19 (MillionTonnes)
S. No.
Name of Ports Capacity Traffic (P) Capacity
Utilization (%)
1 Kolkata Ports of Trust* 82.57 63.76 77.2 2 Paradip Port Trust 239.00 109.28 45.7 3 Visakhapatnam Port Trust 131.09 65.30 49.8 4 Kamarajar Ports Limited 91.00 34.50 37.9 5 Chennai Port Trust 134.00 53.01 39.6 6 V.O.Chidambaranar Port Trust 111.46 34.34 30.8 7 Cochin Port Trust 78.60 32.02 40.7 8 New Mangalore Port Trust 98.00 42.51 43.4 9 Mormugao Port Trust 63.40 17.68 27.9
10 Mumbai Port Trust 79.00 70.71 89.5 11 Jawaharlal Nehru Port Trust 138.87 60.59 43.6 12 Deendayal Port Trust 267.10 115.40 43.2
Total 1514.09 699.10 46.2 *Haldia Dock Complex included. Source: Development Wing of M/o Shipping for Capacity and Major Ports for Traffic P:-Provisional
3.1.2 The table shows that 46.2% capacity has been utilized at major Ports during 2018-
19. The highest capacity utilization i.e. 89.5% is achieved at Mumbai port followed by Kolkata Port
Trust including Haldia Dock Complex (77.2%), Visakhapatnam Port Trust (49.8%) and Paradip
Port Trust (45.7%). The least capacity utilization was at Mormugao Port Trust (27.9%) followed by
VOC Port Trust (30.8%) during 2018-19.
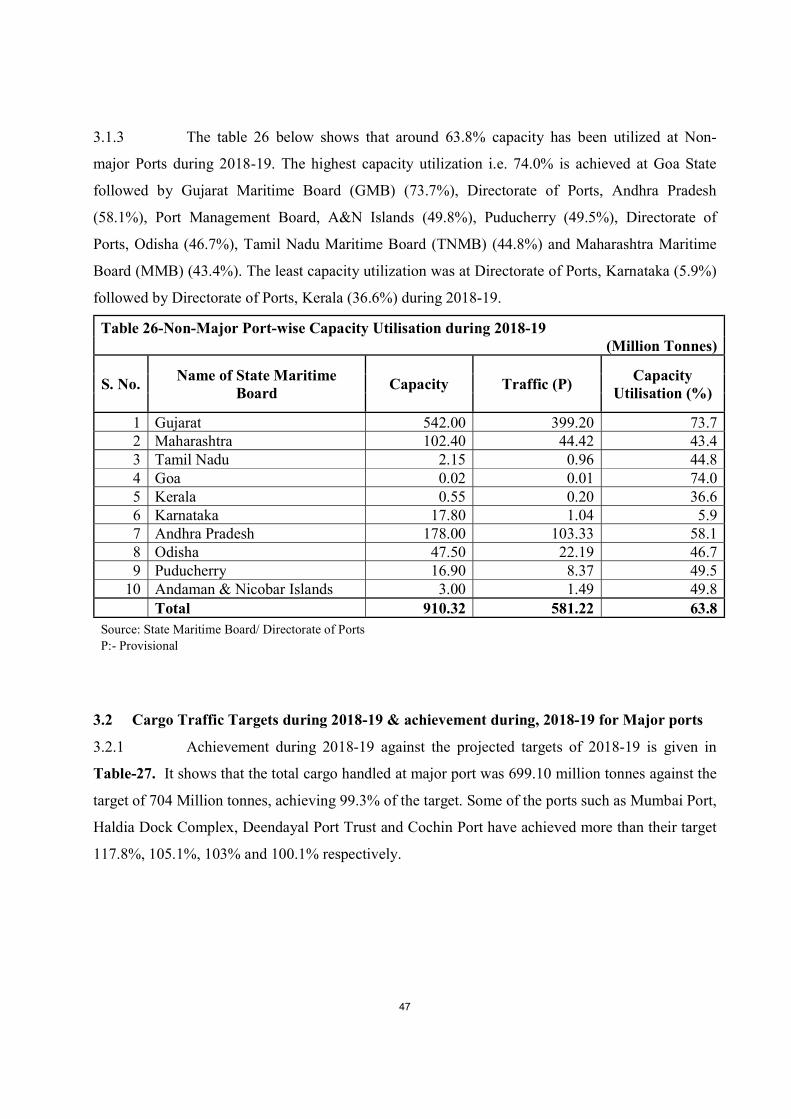
47
3.1.3 The table 26 below shows that around 63.8% capacity has been utilized at Non-
major Ports during 2018-19. The highest capacity utilization i.e. 74.0% is achieved at Goa State
followed by Gujarat Maritime Board (GMB) (73.7%), Directorate of Ports, Andhra Pradesh
(58.1%), Port Management Board, A&N Islands (49.8%), Puducherry (49.5%), Directorate of
Ports, Odisha (46.7%), Tamil Nadu Maritime Board (TNMB) (44.8%) and Maharashtra Maritime
Board (MMB) (43.4%). The least capacity utilization was at Directorate of Ports, Karnataka (5.9%)
followed by Directorate of Ports, Kerala (36.6%) during 2018-19.
Table 26-Non-Major Port-wise Capacity Utilisation during 2018-19 (Million Tonnes)
S. No. Name of State Maritime
Board Capacity Traffic (P)
Capacity Utilisation (%)
1 Gujarat 542.00 399.20 73.7 2 Maharashtra 102.40 44.42 43.4 3 Tamil Nadu 2.15 0.96 44.8 4 Goa 0.02 0.01 74.0 5 Kerala 0.55 0.20 36.6 6 Karnataka 17.80 1.04 5.9 7 Andhra Pradesh 178.00 103.33 58.1 8 Odisha 47.50 22.19 46.7 9 Puducherry 16.90 8.37 49.5
10 Andaman & Nicobar Islands 3.00 1.49 49.8 Total 910.32 581.22 63.8 Source: State Maritime Board/ Directorate of Ports P:- Provisional
3.2 Cargo Traffic Targets during 2018-19 & achievement during, 2018-19 for Major ports
3.2.1 Achievement during 2018-19 against the projected targets of 2018-19 is given in
Table-27. It shows that the total cargo handled at major port was 699.10 million tonnes against the
target of 704 Million tonnes, achieving 99.3% of the target. Some of the ports such as Mumbai Port,
Haldia Dock Complex, Deendayal Port Trust and Cochin Port have achieved more than their target
117.8%, 105.1%, 103% and 100.1% respectively.

48
Table 27: Annual Cargo Traffic Targets and Achievement during 2018-19
(In Million Tonnes)
S. No.
Name of Ports Targets
2018-19* Achieved 2018-19
% age Achievement
1 Kolkata Ports of Trust 19.0 18.6 97.6 2 Haldia Dock Complex 43.0 45.2 105.1 3 Paradip Port Trust 110.0 109.3 99.3 4 Vishakhapatnam Port Trust 66.0 65.3 98.9 5 Kamarajar Ports Limited 36.0 34.5 95.8 6 Chennai Port Trust 53.0 53.0 100.0 7 V.O.Chidambaranar Port Trust 38.0 34.3 90.4 8 Cochin Port Trust 32.0 32.0 100.1 9 New Mangalore Port Trust 44.0 42.5 96.6
10 Mormugao Port Trust 20.0 17.7 88.4 11 Mumbai Port Trust 60.0 70.7 117.8 12 Jawaharlal Nehru Port Trust 71.0 60.6 85.3 13 Deendayal Port Trust 112.0 115.4 103.0
Total 704.0 699.1 99.3 Source: *IPA and cargo traffic from all Major Ports
3.3 Port Efficiency
3.3.1 Efficiency at ports has an impact on transaction cost of shipping lines. Major
Ports have improved their efficiency of operations as reflected in select physical performance
indicators over the last several years. Some key operational indicators of physical performance
pertaining to major ports for the select years are elaborated below.
Average Turn-Round Time (TRT)
3.3.2 This parameter has improved significantly during the past one and half decades
for all the major ports. Average TRT for all major ports improved from 8.10 days in 1990-91 to
3.63 days in 2005-06. Thereafter the TRT has increased steadily to 3.84 days in 2013-14 and
further increased to 3.89 days in 2014-15. The average TRT improved in 2017-18 to 2.91 days
and further improved to 2.73 days during 2018-19. However, the TRT varied in the range
between 1.76 days at V.O. Chindambaranar Port to 4.68 days at Deendayal Port during 2018-
19. Amongst the 12 major ports, improvement in TRT during 2018-19 compared to
corresponding period of 2017-18 is reflected in all Major Ports except Deendayal Port

49
Mormugao Port and Cochin Port. Port-wise TRT for select years are given in Table 28.
Average Turn Round Time at major ports for select years since 2009-10 to 2018-19 is presented
in the Chart IX below.
Turn-Round Time - Total time spent by a ship since its entry till its departure. Table 28: Average Turn Round Time (days)
Port 2013-14 2014-15 2015-16 2016-17 2017-18 2018-19(P)
1 2 3 4 5 6 7
Kolkata D.S 4.51 4.97 4.78 4.43 3.77 3.35
Haldia D.C 3.77 3.36 3.27 5.47 3.75 3.03
Paradip 4.62 7.01 4.50 4.99 3.31 2.51
Vishakhapatnam 4.73 5.67 3.84 3.75 2.58 2.51
Kamarajar (Ennore) 4.24 4.32 6.87 2.68 2.19 1.96
Chennai 2.46 2.54 2.53 2.51 2.21 1.98
Chidambaranar (Tuticorin) 3.92 3.37 3.53 4.00 2.40 1.76
Cochin 1.76 1.69 2.18 1.99 1.87 1.94
New Mangalore 3.18 2.46 2.63 2.35 2.04 1.93
Mormugao 4.50 3.97 3.37 3.43 3.15 3.48
J.L.Nehru 2.26 2.24 2.31 1.96 2.23 2.13
Mumbai 4.25 4.09 3.29 2.48 2.76 2.69
Deendayal 5.66 4.90 4.28 4.51 4.25 4.68 All Ports 3.84 3.89 3.51 3.48 2.91 2.73 Source: Major Ports, P: Provisional,

50
Average Pre Berthing Detention Time (PBDT)
3.3.3 The average overall pre berthing detention time for all major ports declined from
2.16 days in 1990-91 to 1.63 days in 2008-09. However, in 2009-10 and 2010-11, the average
PBDT edged up to 2.16 days and 2.32 days respectively. The average overall pre berthing detention
time (PBDT) was 1.61 days during 2014-15 and decreased to 1.27 days in 2016-17. The average
PBDT was further increased to 1.39 days in 2017-18 and improved to 1.10 days in 2018-19. Port-
wise PBD for select years is indicated in Table 29.
Table 29 : Average Pre-Berthing Detention(Days)
Port 2013-14 2014-15 2015-16 2016-17 2017-18 2018-19(P)
1 2 3 4 5 6 7 Kolkata D.S 0.56 0.71 0.50 0.57 0.62 0.46 Haldia D.C 2.21 1.43 0.66 2.49 3.15 2.72 Paradip 1.94 4.11 2.05 2.47 0.87 0.30 Vishakhapatnam 1.84 2.59 1.47 1.22 2.37 1.29 Kamarajar 2.38 2.51 4.73 0.96 0.57 0.27 Chennai 0.41 0.41 0.44 0.38 0.86 0.15
Chidambaranar 1.19 1.07 1.33 1.80 1.13 0.68
Cochin 0.97 0.81 0.66 0.48 0.43 0.53 New Mangalore 0.81 0.60 0.76 0.00 1.16 1.10 Mormugao 1.47 1.61 1.38 1.67 1.31 1.24 J.L.Nehru 1.08 0.80 1.17 0.77 0.92 0.82 Mumbai 1.18 1.69 1.27 0.46 0.96 1.07 Deendayal 2.72 2.52 1.98 2.02 1.90 2.02 All Ports 1.48 1.61 1.31 1.27 1.39 1.10 Source: Major Ports, P: Provisional
3.3.4 In contrast, average PBDT on port account has seen a sharper decline from 2.10 days
in 1990-91 to 0.50 day in 2010-11. Average PBDT on port account were at 0.27 and 0.21 days in
2013-14 and 2014-15 respectively. In 2015-16 the Average PBDT on port account decreased to
0.16 days and further increased to 0.22 days and 0.53 days in 2016-17 and 2017-18 respectively.
PBDT on port account improved to 0.34 days in 2018-19. The trajectory of weighted average of pre
berthing detention time at Major ports- total and on port account since 2009-10 to 2018-19 is shown
in Chart X below.

51
Pre-Berthing Detention - The time for which a ship waits before getting entry into berth.
Average Output Per Ship Berth-day
3.3.5 During the last 25 years this indicator has seen a tremendous improvement. Average
Output per Ship-berth day has increased around six times from 3,372 tonnes in 1990-91 to 20740
tonnes in 2018-19 at Major Ports. However, average output per ship-berth day during 2018-19 is
marked by substantial variation across major ports ranging from a high 31740 tonnes in case of
Paradip Port to a low of 7765 tonnes at Kolkata Dock System. This variation reflects the type of
cargo being handled, level of mechanization and labour practices. Amongst the 12 major ports,
improvement in average Output per Ship Berth-day during 2018-19 over the corresponding period
of the previous year is visible in all the ports. Average Output per Ship-berth day during 2018-19 is
20740 tonnes compared to 20581 tonnes over the corresponding period of the previous year. Port-
wise average output per Ship-berth day for select years and latest period are given in Table 30. The
Graph of weighted average Output per Ship Berth-day (Tonnes) at Major ports since 2009-10 to
2018-19 is shown in Chart XI below.
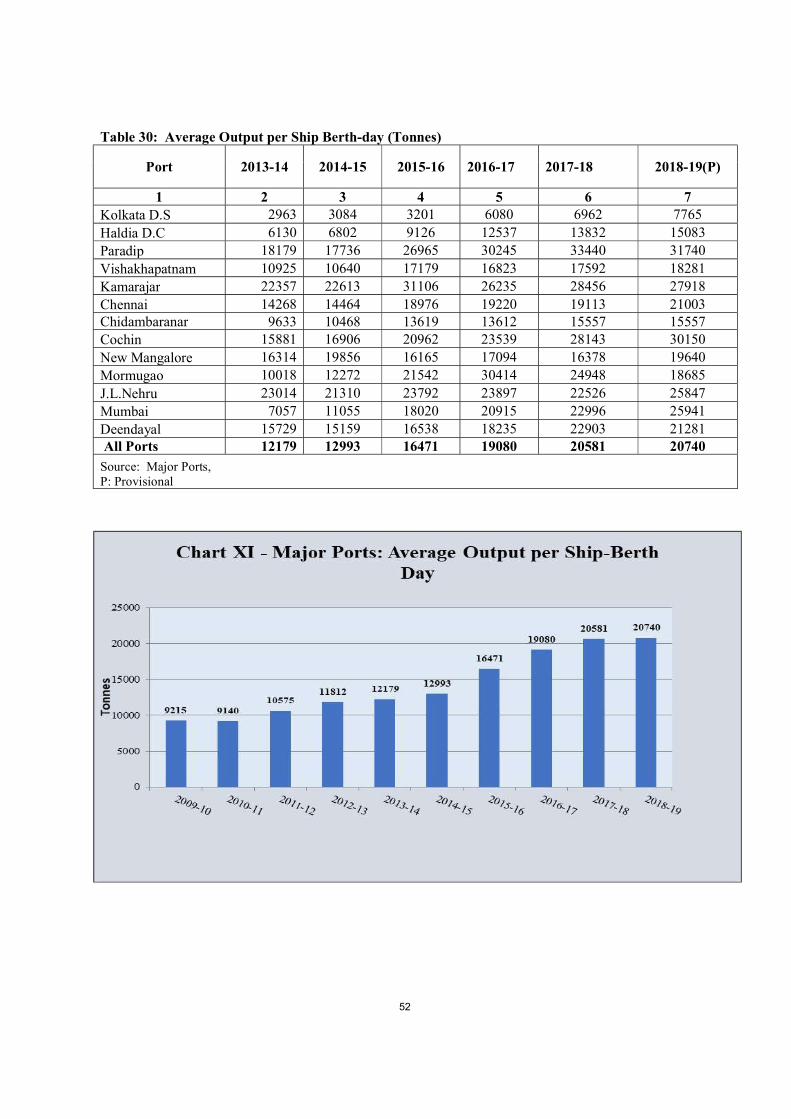
52
Table 30: Average Output per Ship Berth-day (Tonnes)
Port 2013-14 2014-15 2015-16 2016-17 2017-18 2018-19(P)
1 2 3 4 5 6 7 Kolkata D.S 2963 3084 3201 6080 6962 7765 Haldia D.C 6130 6802 9126 12537 13832 15083 Paradip 18179 17736 26965 30245 33440 31740 Vishakhapatnam 10925 10640 17179 16823 17592 18281 Kamarajar 22357 22613 31106 26235 28456 27918 Chennai 14268 14464 18976 19220 19113 21003 Chidambaranar 9633 10468 13619 13612 15557 15557 Cochin 15881 16906 20962 23539 28143 30150 New Mangalore 16314 19856 16165 17094 16378 19640 Mormugao 10018 12272 21542 30414 24948 18685 J.L.Nehru 23014 21310 23792 23897 22526 25847 Mumbai 7057 11055 18020 20915 22996 25941 Deendayal 15729 15159 16538 18235 22903 21281 All Ports 12179 12993 16471 19080 20581 20740
Source: Major Ports, P: Provisional

53
4. PRIVATE SECTOR/CAPTIVE/JOINT SECTOR PORT PROJECTS
Brief details of the ongoing Private Sector/Captive/Joint Sector Port Projects and a list of these
projects under consideration as on 31.03.2019 are brought out in Appendix-I & Appendix-II in
respect of Major Ports and in Appendix-III & Appendix-IV for Non – Major Ports.
APPENDICES
I. Ongoing Private Sector/Captive/ Joint Venture Port Projects at Major Ports
II. Under Formulation Private Sector/Captive/ Joint Venture Port Projects at Major Ports
III. Ongoing Private Sector/Captive/ Joint Venture Port Projects at Non-Major Ports
IV. Under Formulation Private Sector/Captive/ Joint Venture Port Projects at Non- Major Ports

54
Appendix – I Ongoing Private Sector/Captive/Joint venture Port Projects
(Major Ports)
Sl. No
Project Name Port Name Capacity (Million Tonnes)
Project Cost (Rs.
Crores)
Project Status
1 2 3 4 5 6 1. Development of Container Terminal
on DBFOT basis Kamarajar Port Ltd
16.8MT (Phase I -9.6
MTPA Phase II-7.2
MTPA)
1270 *Phase I-Operational since Oct’ 17.
2. Development of Multi Cargo Terminal on DBFOT basis
Kamarajar Port Ltd
2.00 151.00 Terminal operation commenced from Aug’ 17.
3. Construction of Coal Berth No.3 Kamarajar Port Ltd
9.00 255.02 Berth construction completed. Top loading facilities to be erected by TANGEDCO.
4 Construction of Coal Berth-4 Kamarajar Port Ltd
9.00 271.56 * Berth construction completed. * Top loading facilities erected is in progress.
5. Development of LNG Terminal KPL
Kamarajar Port Ltd
3.00 5151.00 Operation commenced from 26.02.2019.
6. Provide Handling Equipment at Berth No. 16 (Old Berth No. 12) for Handling Bulk Cargo & Containers under PPP Mode.
New Mangalore Port Trust
6.73 MTPA 469.46
The concession agreement has been signed on 18.03.2016 with M/s Chettinad Mangalore coal Terminal ltd. Construction works are under progress and expect to be completed by 31.05.2019.
7. Development of Bulk Coal Terminal on Captive Basis
New Mangalore Port Trust
5.4 376.52 Commercial Operation commenced from 22.06.2012.
8. Development of Barge handling facility at Bharathi Dock under PPP model
Chennai 1.35 MTPA
27.29 Project awarded to CBTPL (construction of IMC Ltd.) on 30.01.2013, but due to non-fulfillment of conditions precedent, termination order issued in Feb-2016. Consequently, the PPP operator initiated arbitration proceedings. The Arbitral award was issued by the tribunal on 30.03.2018.

55
The Claimant has filed appeal against the arbitral ward and hearing is going on. Work was awarded as in-house project on 31.03.2018 and the work is in progress.
9. Development of EQ-1A berth on south side of EQ-1 berth in Inner Harbour for handling Thermal coal and Steam coal at IH.
Visakhapatnam 7.36 313.39 Project terminated as per the provisions of Concession agreement. Concessionaire M/s. SVCPTL invoked arbitration on post termination and the Arbitration process is under progress.
10. Installation of mechanized Fertilizer handling facilities at EQ-7 at IH.
Visakhapatnam 5.21 217.58 This can be deleted, since the concession agreement stands cancelled by an agreement of “Deed of mutual cancellation” on 21.02.2017
11. Up-gradation of the existing facility (OHC) and creating new facility (WQ-1) for iron ore handling.
Visakhapatnam 16.20 580.89 1). The Completion certificate for Phase-I, of the subject project was issued on 29.09.2018 by Independent Engineer (M/s. Mecon Ltd). 2). VPT Board in the meeting held on 21.02.2019 has received to accept the opinion of the Expert on the issue of phase-II development and to discharge the concessionaire from the obligation contained at Appendix-4 at Project requirements at Para (B) & (D) duly returning the additional bank guarantee of Rs. 25 crores. 3). Since, Phase-II is discharge from the obligation of the concessionaire, the obligation of the concessionaire, the revised capacity is 16.20 MTPA and the estimated project cost is Upfront fee- 185.87 crs. Phase-I 395.02 Crs. Total: 580.89 Crs. Instead of 845.41 Crores.
12. Extension of existing Container terminal in outer harbor.
Visakhapatnam 0.54 MTEUs
633.11 Concessionaire was awarded on 02.03.2019.
13. Multipurpose Clean Cargo Berth on BOT basis. ( PPP Operation : PICTPL)
Paradip Port trust
5 430.78 Completion certificate has issued to M/s. PICTCL on 03.04.2019 and terminal is now operational.
14. New Iron Ore Berth on BOT basis. Paradip Port trust
10 740.19 Work is progress. Scheduled date of completion April 2019. Actual completion by Sept 2019.
15. Mechanization of EQ-1,2 &3 (3Berths) for handling export Coal Cargo (PPP Operator : JSW)
Paradip Port trust
30 1437.76 Work is progress stipulated completion December, 2020.

56
16. Development of new Coal Berth for handling Import Coal Cargo. (PPP Operator; Kakinada Port JV)
Paradip Port trust
10 655.56 Stipulated completion April, 2021.
17. Development of fourth container terminal
JNPT 60 7915.00 The work of Ist phase having investment about Rs. 4719 cr. Commissioned December, 2017.The work of Phase-II development will commenced from December, 2019 and will be commissioned in December, 2022
18. Redevelopment of Berths 8,9 and Barge Berths at the Port of Mormugao, Goa on DBFOT basis
Mormugao 19.22 MTPA
1145.36 Letter of Award is issued to M/s Sterlite Port Ltd., Tuticorin n 29.03.2016. Concession Agreement signed on 2.09.2016 with M/s Goa Sea Port Pvt. Ltd (GSPPL), SPV of M/s Sterlite Port limitedPublic hearing conducted from 29th April2017 to 5th May 2017.Application for the Environment clearance has been made to MoEF&CC along with CRZ recommendation of GCZMA on 25.03.2019. Environmental Clearance is awaited.
19. Construction and operation of general cargo berth no. 5 & 6 at Mormugao Port, Goa on BOOT basis
Mormugao 19.6 MTPA
250 Operational since 19.06.2004
20. Development of a Coal Import Terminal at Berth No. 7 at Mormugao Port on DBFOT basis
Mormugao 13.7 MTPA
406 Operation since 06.06.2014
21. Construction of North Cargo berth-II for handling bulk cargoes on DBFOT basis-Tuticorin
VOCPT 7.00 335 M/s TCTPCL failed to restore the performance security BG within 30 days from encashment as per the concession agreement and not commenced the balance works for commencement of full-fledged commercial operation. Port issued consultation notice to M/s TCTPL on 01.09.2018 as per the concession agreement. A meeting with M/S TCTPL and lenders held on 15.11.2018 as a part of remedial process of the concession agreement. Since the director of M/S TCTPL had not attended the meeting another meeting along with his presence will be convened shortly. Meeting was held on 18.12.2018. Port informed M/S remodify concessionaire Event of Default at the earliest. Meeting with lenders held on 12.02.2019 wherein port requested the lenders for replacement of the concessionaire

57
for commencement of commercial operation by a new operator as pe clause 15.4 of concession agreement
22. Construction dedicated berth for handling coastal cargo at V.O.C. Port Trust
VOCPT 1 38.91 Completed on 19.12.2017
23.
Design, Construction and maintenance of Truck parking terminal at the Port Land opposite to Fisheries college in V.O. Chidambaram port. (Sagarmala Project)
VOCPT - 23.69 Completed on 06.12.2017
23. Up gradation of CJ-I and CJ-II (berth construction)
VOCPT 18.00 97.76 90% work has been completed in CJ-I. CJ-II will started after operation of CJ_I
24. Construction of shallow draught berth for handling construction material on PPP mode
VOCPT 2.00 65.37 Port gave time up to 27.07.2018 to take over the project site assets and fulfill conditions precedent as per CA. . The concessionaire requested the Port to grant additional time to fulfill the conditions precedent. . Port granted extension of time up to 15.09.2018 still the conditions precedent has not been fulfilled. Since the firm failed to fulfill the condition precedent. The matter placed before the action will be taken as per Board directions. The concessionaire has not fulfilled the condition precedent even at the expiry of extended period. Further as approval by the competent authority additional time of 10 days has been given to VJR on fulfilled the condition precedent till date. In response to Port’s letter, Concessionaire has furnished their additional document regarding conditions precedence on 02.11.2018. On scrutiny of the documents, Finance/Legal sections have recommended that the concessionaire has not fulfilled the conditions precedent Clause 3.1 (a) iv, v, vi, vii & ix. In this regard, as per C.A. Article – 3of clause 3.6 in the event that, the condition precedents are not complied with within the time (including the extended time, if any) in terms of C.A article 3.2 to 3.5 this Agreement shall be liable to be terminated. Port legal wing opined to obtain legal opinion from ASG, Delhi before terminating of CA.
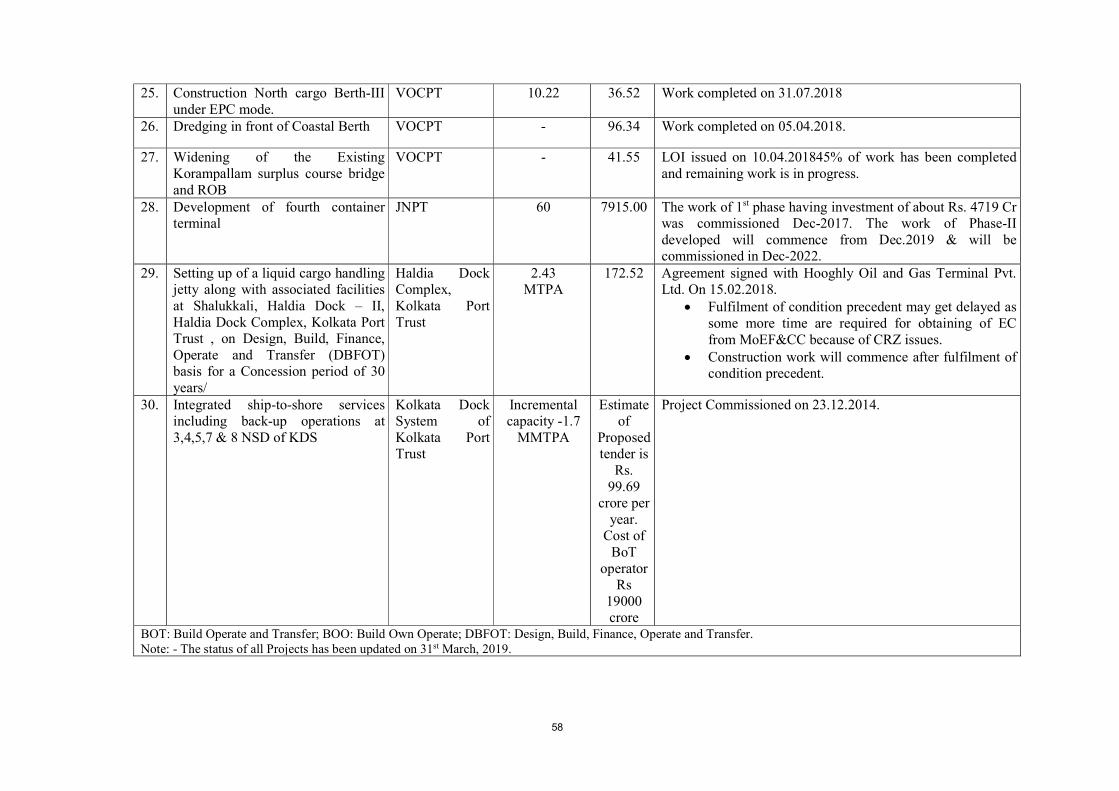
58
25. Construction North cargo Berth-III under EPC mode.
VOCPT 10.22 36.52 Work completed on 31.07.2018
26. Dredging in front of Coastal Berth VOCPT - 96.34 Work completed on 05.04.2018.
27. Widening of the Existing Korampallam surplus course bridge and ROB
VOCPT - 41.55 LOI issued on 10.04.201845% of work has been completed and remaining work is in progress.
28. Development of fourth container terminal
JNPT 60 7915.00 The work of 1st phase having investment of about Rs. 4719 Cr was commissioned Dec-2017. The work of Phase-II developed will commence from Dec.2019 & will be commissioned in Dec-2022.
29. Setting up of a liquid cargo handling jetty along with associated facilities at Shalukkali, Haldia Dock – II, Haldia Dock Complex, Kolkata Port Trust , on Design, Build, Finance, Operate and Transfer (DBFOT) basis for a Concession period of 30 years/
Haldia Dock Complex, Kolkata Port Trust
2.43 MTPA
172.52 Agreement signed with Hooghly Oil and Gas Terminal Pvt. Ltd. On 15.02.2018.
Fulfilment of condition precedent may get delayed as some more time are required for obtaining of EC from MoEF&CC because of CRZ issues.
Construction work will commence after fulfilment of condition precedent.
30. Integrated ship-to-shore services including back-up operations at 3,4,5,7 & 8 NSD of KDS
Kolkata Dock System of Kolkata Port Trust
Incremental capacity -1.7
MMTPA
Estimate of
Proposed tender is
Rs. 99.69
crore per year.
Cost of BoT
operator Rs
19000 crore
Project Commissioned on 23.12.2014.
BOT: Build Operate and Transfer; BOO: Build Own Operate; DBFOT: Design, Build, Finance, Operate and Transfer. Note: - The status of all Projects has been updated on 31st March, 2019.

59
Appendix – II Private Sector/Captive/Joint Venture Port Projects Under Formulation
(Major Ports)
Sl. No
Project Port Name Capacity (Million Tonnes)
Project Cost
(Rs. In crores)
Project Status
1 2 3 4 5 6 1. Mechanization of CQ-1 &2( 2
Berths) for handling (Capacity – 20 MTPA)
Paradip Port
20 MT
1103 To be initiated after commissioning of Development of New Coal Berth based on Techno-Economic viability.
2. Optimization of inner harbor and construction of western dock on Captive Basis (2X Rs. 655Cr.)
Paradip Port
30 MT
2725 RFQ applications were invited and bids received on 12/10/2018, the same are under evaluation. PPPAC memo submitted for MOS for appraisal on 19.01.2019. Comments for ministry of Finance, NITI AAYOG and MOS has been received on 02.04.2019 and the compliance are under preparation.
3. Construction of Outer Harbour Paradip Port
144 MT
8767 DPR has been submitted by the consultant HUWE Engineering project (P) Ltd. It has been recommended that, PPP may expend its inner harbor capacity to the maximum before going for the proposed Outer harbor facilities in the 2nd phase as the project would not be presently viable being dependent on a single commodity viz. Coal. Subsequently, this has been approved by Ministry and PPP has initiated proposal for inner harbor expansion including development of Western Dock.
4.
Barge handling facilities at Khori Creek
Kandla 4
100 Under planning stage.
5. Construction of T shape Jetty at Tekra (Phase-II)
Kandla 14
1500 The scheme will spill over in 13th five year plan. Under planning stage.
6. Setting up of barge jetty at Tuna on captive use basis
Kandla 1.5
22 EOI invited. Only M/s Shree Renuka Sugars has submitted application till due date. Committee recommended the proposal submitted by M/s Shree Ranuka Sugars and also recommended to put up to the Board for approval.
7. Construction of barge jetty at Tuna on BOT basis
Kandla 5.49 255.3 Feasibility Report, RFQ and TAMP proposal under approval.
8. Strengthening of oil jetty 1 at KPT
Kandla 0.78 14.29 LOA issued to M/s Indiana build infrastructure Pvt. Ltd., Mumbai on 18.03.14. Work order issued on 20.5.2014. Work has been completed.

60
9. Development of Port based multi-product SEZ
Kandla - 1095 In-principle approval from MoS for formation of SPV is awaited. Concurrence of GoG is still awaited. KPT has appointed NIO, Mumbai for carrying out EIA studies.
10. Capital dredging of the dock basin in front of Coal Jetty-I, Coal Jetty –II, Berth 3 & 4, Berth -7, Berth-8, Berth- 9, NCB –I,NCB-II, and NCB –III up to (-) 16.50 m depth and approach Chennai up to (-) 17.20 m depth for a length of 10,350 m and widening of Port entrance channel from existing 153 m to 230m.
VOCPT 51.95 MTPA
3090.28 Revised PIB Memo submitted on: 17.04.2018 Issued of LOA for Dredging June, 2018 Completion for work Jan, 2021 (28 months) Subsequently, revised PIB memo was submitted to Ministry on 09.05.2018. The EAC meeting for the project was held on 10.08.2018. The EAC committee directed VOCPT to resubmit the EC & CRZ application after compliance of the observations made by Regional Office, MoEF&CC. The final revised PIB Memo incorporating the queries of Ministries/ Departments was submitted to MoS on 11.02.2018 for further process. The proposal of PIB Memo for “Deepening of the dock basin and the channel to (-) 16.50m and (-) 17.20m” was reviewed by the Secretary, Shipping on 10.10.2018 and it has been decided to review the proposal by IIT(M), Chennai and to submit the fresh DPR considering the present study reports of Bore hole data and bathymetry survey including Seismic refraction survey. IIT(M), Chennai is on the job. As per the meeting, Port engaged Back Hoe (BH) Dredger for a period of 43 days and Trailer suction Hopper dredger for a period of 19 days through M/s. DCI as a measure of maintenance dredging to remove the loose materials, spillages and patches in the Inner Harbour and channel land and the work is completed on 17.12.2018. Period of Deployment of BH: 19.10.208 to 30.11.2018 943 days) Period of Deployment of TSHD: 29.11.2018 to 17.12.2018 9 19 days). After removal of the loose materials at berth face , Port Declared the draught of 11.70m from existing 10.90m on 30.11.2018 at berth 7, declare the dredger the draught of 14.20 m from existing 14.00 m at berth 8 on 31.12.2018 M/s. IITM Chennai had been engaged for preparation of revised DPR for maintenance and Capital Dredging. After submission of DPR, port will submit the Dredging proposal for approval.
11. Development of Outer Harbour at Chennai Port (previously called Development of Mega Container Terminal). Under PPP mode on DBFOT basis.
Chennai Port Trust
(32 MTPA) 5100 Mega container terminal project failed to take off due to low revenue share quoted by bidders and subsequent invitation did not receive offers. Even after restructured as Outer Harbor terminal there was no response to bid invitation on account on high capital cost and long gestation period. Meanwhile, Navy Commissioned a study through IIT-

61
M for developing berths at new Outer Harbour. Further, Navy informed vide lr dt: 20.02.2019 that Feasibility of development of Naval Jetty as per the Conceptual Project report submitted by IIT-M is being examined by Navy and the decision will be conveyed subsequently.
12. Development of Rajiv Gandhi Dry Port and Multi Modal Logistic Hub for Chennai Port in SIPCOT industrial park at Mappedu, Sriperrumbudur; under PPP modeHuhhhhhhhjh
Chennai Port Trust
18.45 MTPA 415 121.74 acres of land at Mappedu acquired for long terms(99 years) lease from Sipcot, GoTN. Due to global recession and poor road connectivity PPP bids failed. Bids invited on land lease model were also fruitful as SIPCOT imposed sub-lease charges. NHAI & MoRTH have appointed consultant M/s. Howe for preparing Feasibility report to develop Multi Modal Logistic Park at 80 acres of lands owned by ChPT at Mappedu. The consultant has submitted inception report. Further a meeting was held on 01.03.2019 wherein a presentation was made by the consultant. MOS through SDVL appointed consultant M/s. Crisil Risk & Infrastructure Solutions Ltd., Gurgaon for preparation of Feasibility Report and the consultant had submitted draft Feasibility report on 01.20.2019 and as presentation on DFR on 14.02.2019.
13. Development of Dry Dock/ Ship Repair facility at Timber pond/Boat basin in Chennai Port
Chennai Port Trust
315 Open tenders were invited during December 2013 and November 2014 based on the Land lease Model for the Dry dock Facility failed to yield any response. Subsequently, as ICG offered to develop the Dry Dock on a 30 years lease, a draft MoU was sent to ICG during march 2015 and is still under the consideration of MoD. Recently ICG has informed that MoD(fin) has cleared the timeline. As requested by ICG further extension upto 31.05.2019 has been granted. Meanwhile IPA has appointed Consultant M/s. Royal Haskoning to explore the opportunity for development of ship repair facilities for DBFOT on PPP (Feasibility Report) in 3 ports viz., ChPT, JNPT and VoCPT. The consultant has submitted inception report and Marked assessment report on 05.03.2019
14. Development of Bharthi Dock -2(BD-II) as co- terminal in Chennai Port Trust
Chennai Port Trust
5MTPA 180 After examine options, it was decided to develop a coal Terminal through PPP mode to subject to favorable recommendations from the empowered committee constituted by Hon’ble Supreme Court. The port is taking measures to comply with the recommendations of the Empowered Committee. After requirements on the EC report satisfied, TNPCB will be approached for resumption of Pollution free coal handling at this port. Meanwhile, EoI was called for developing a Bulk Cargo Terminal at BD-II as a captive facility and firms submitted the proposal. On
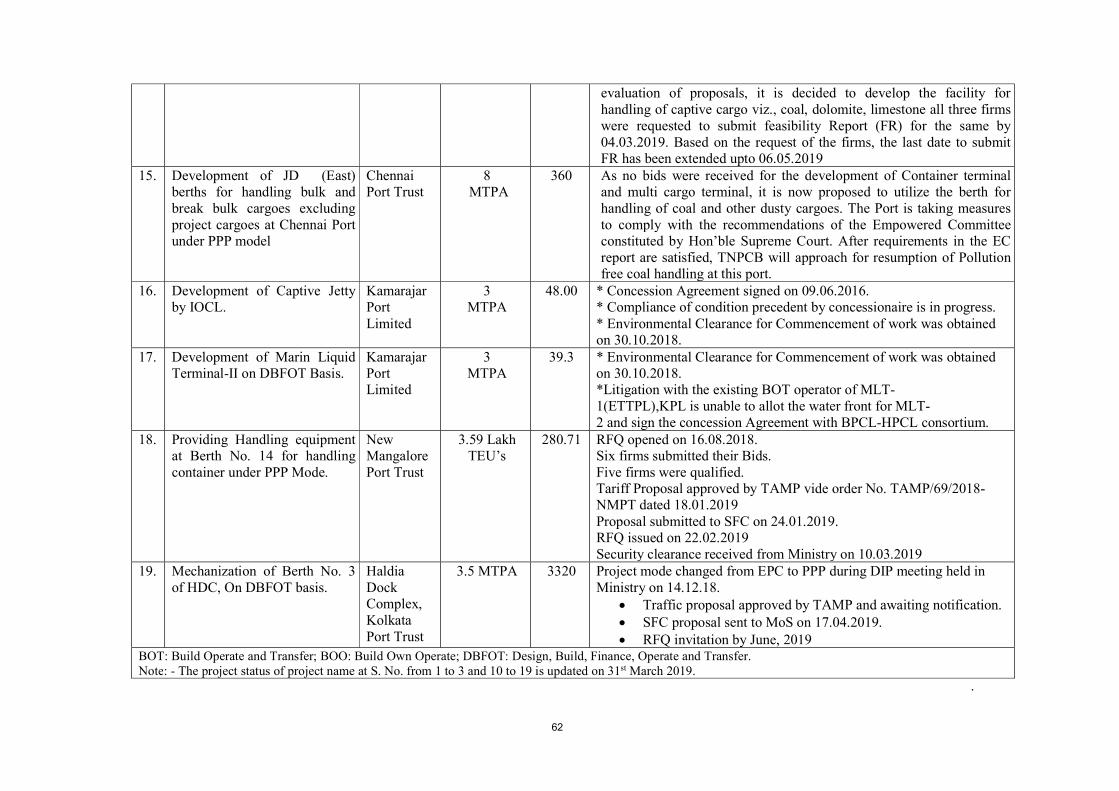
62
evaluation of proposals, it is decided to develop the facility for handling of captive cargo viz., coal, dolomite, limestone all three firms were requested to submit feasibility Report (FR) for the same by 04.03.2019. Based on the request of the firms, the last date to submit FR has been extended upto 06.05.2019
15. Development of JD (East) berths for handling bulk and break bulk cargoes excluding project cargoes at Chennai Port under PPP model
Chennai Port Trust
8 MTPA
360 As no bids were received for the development of Container terminal and multi cargo terminal, it is now proposed to utilize the berth for handling of coal and other dusty cargoes. The Port is taking measures to comply with the recommendations of the Empowered Committee constituted by Hon’ble Supreme Court. After requirements in the EC report are satisfied, TNPCB will approach for resumption of Pollution free coal handling at this port.
16. Development of Captive Jetty by IOCL.
Kamarajar Port Limited
3 MTPA
48.00 * Concession Agreement signed on 09.06.2016. * Compliance of condition precedent by concessionaire is in progress. * Environmental Clearance for Commencement of work was obtained on 30.10.2018.
17. Development of Marin Liquid Terminal-II on DBFOT Basis.
Kamarajar Port Limited
3 MTPA
39.3 * Environmental Clearance for Commencement of work was obtained on 30.10.2018. *Litigation with the existing BOT operator of MLT- 1(ETTPL),KPL is unable to allot the water front for MLT- 2 and sign the concession Agreement with BPCL-HPCL consortium.
18. Providing Handling equipment at Berth No. 14 for handling container under PPP Mode.
New Mangalore Port Trust
3.59 Lakh TEU’s
280.71 RFQ opened on 16.08.2018. Six firms submitted their Bids. Five firms were qualified. Tariff Proposal approved by TAMP vide order No. TAMP/69/2018-NMPT dated 18.01.2019 Proposal submitted to SFC on 24.01.2019. RFQ issued on 22.02.2019 Security clearance received from Ministry on 10.03.2019
19. Mechanization of Berth No. 3 of HDC, On DBFOT basis.
Haldia Dock Complex, Kolkata Port Trust
3.5 MTPA 3320 Project mode changed from EPC to PPP during DIP meeting held in Ministry on 14.12.18.
Traffic proposal approved by TAMP and awaiting notification. SFC proposal sent to MoS on 17.04.2019. RFQ invitation by June, 2019
BOT: Build Operate and Transfer; BOO: Build Own Operate; DBFOT: Design, Build, Finance, Operate and Transfer. Note: - The project status of project name at S. No. from 1 to 3 and 10 to 19 is updated on 31st March 2019.
.

63
Appendix – III
Ongoing Private Sector/Captive/Joint venture Port Projects (Non-Major Ports)
Sl. No
Project Name State/ Ports Maritime Board
Capacity (Million Tonnes)
Project Cost (Rs. In Crore)
Project Status
1 2 3 4 5 6 1. HPCL-Mittal Pipeline Ltd. Modhava Coast of
Dist Kutch 6 MMPTA 2781.37 Proposal submitted to GoG for In-Principal
2.
HPCL- Rajasthan Refinary Ltd.
Modhava Coast of Dist Kutch
9 MMPT 1400 Permission given by GMB for initial survey and investigation
3. Adani Cement Ltd. Kori Creek Dist Kutch 1.8 MMPTA 845.4 In-principal approval as granted recently by GMB. 4. Shree Cement Ltd. Modhava near Mundra
Port Dist Kh 6 MMPTA 242 Proposal submitted to GoG for In-principal approval.
5. Ahir Salt and Allied Product Pvt. Ltd.
Mithirohar, near Kandla Port Trust.
Dist Kutch.
0.7 MMPTA 192.06 In-principal Approval was granted on 17 February 2019.
6. Bhadreshwar Bhadreshwar, Near Port Mundra Dist
Kutch
2 MMPTA Permission given be GMB for initial survey and investigation.
7. Development of Multipurpose Private Jetty at Navlakhi Port by DMCC Oil Terminal (Navlakhi) Ltd.
Navlakhi 4.0 MMTPA 330 MOEF, Govt. of India has issued EC/CRZ clearance. Draft license agreement is under approval.
8. Development of the existing port facilities (Private Jetty) at Victor port by OM Sai Navigations Pvt. Ltd.
Victor (Pipavav)
0.5 MMTPA 29 Environment/CRZ clearance is awaited.
9. Multipurpose jetty terminal at village change (Tal. Uran, Dist. Raigad) in Karanja creek by M/s Karanja Terminal & Logistics Pvt.Ltd.
Karanja (Maharashtra)
4.8 1000 The jetty facility is ready and awaiting Customer clearance. It is expected to commence operations by October-2018. Port capacity will be 4.8 MTPA in FY-2017-18. The ultimate capacity of 8.48 MTPA will be achieved by FY-2032.
10. Expansion of existing captive jetty facilities at village Vave(
Dharamtar 35.0 280 Construction of berth and related facilities, in progress. Out of proposed 1750 Mtrs. Of quay length, about 1000

64
Tal. Pen,Dist. Raigad) in Dharamtar creek by M/s JSW Dharamtar Port Pvt Ltd
mtrs. Is ready. While, the capacity of 2017-18 is 15 MTPA, the projected capacity of 35 MTPA will be achieved by FY2022.
11. Expansion of JSW Jaigad Port in Ratnagiri district by JSW Jaigarh Port Ltd.
Jaigad 80.0 2800 Two berths in Phase-1 and two berths in Phase-11(Total 04 berths) are operational. Construction of three berths in phase-II including LNG Terminal is in progress. Construction of two berths is yet to commence. The current capacity of 2017-18 is 50 MTPA and expected capacity is 80 MTPA will be achieved by FY 2022.
12. Establishing a captive port at Parangipettai by M/s IL &FS Limited
Parangipettai Tamil Nadu
13 MMTPA
1349 Port has been notified. Construction of Port Structure Commenced.
13. Captive Port facility M/s. Udangudi Power Corporation Limited.
Udangudi in Thoothukudi
6 MMTPA
1254.61 Port has been notified. Construction of Port Structure Commenced.
14. Kakinada Deep Water Port, in East Godavari District, Andhra Pradesh
Kakinada Deep Water Port, (Andhra Pradesh)
25 1320 Under Operation
15. Development of Gangavaram Port in Visakhapatnam District Andhra Pradesh
Gangavaram Port
64 2970 Under Operation
16. Development of Krishnapatnam Port in SPS Nellore District Andhra Pradesh Stat
Krishnapatnam Port Andhra Pradesh
82 7200 Under Operation
17. Phase-II Development of Krishnapatnam
Krishnapatnam Port 44.3 MTPA of Non-
Container cargo+3.3MTEUpa of container
cargo.
10800 75% work completed.
18. AnarkAluminium Ltd Nakkapalli 5 M.T 479 Not Operational
19. --- Bhavanapadu ** 645 M.T 2362 --- ** Vide communication available in records with Government of A.P.
20. --- Calingapatnam ** 645 M.T 2362 Not Operational

65
21. KSEZ KSEZ 37.93 M.T Unknown Not Operational
22. Developmentof KaraikalPort through private investment on BOT basis
Karaikal, Puducherry
Phase – 2A 21.5
Phase 2AE 6.5
1600
500
Phase -2A and 2AE Works are in progress.
23. Development of Pondicherry Port as a Feeder Port to Chennai Port in association with Chennai Port Trust
Pondicherry
0.40
NIL
Cargo handling operations on regular basis to commence soon after dredging works under “Sagarmala” are completed.
24. Captive Port owned by M/s Chemplast Sanmar, Chennai
Captive Marine Terminal Facility, Karaikal.
NIL NIL Commercial operations commenced in September 2007 and are functioning.
25. The Dhamra Port Company Limited
Odisha 45 MMT 6915.17 2nd Phase expansion in progress.
26 Expansion, Development and Operation of Gopalpur Port
Gopalpur Port Ltd (Odisha)
20 20 1. All Weather Direct Berthing Port declared open for commercial Traffic with effect from 29th March 2013.
2. Port Operational suspended with effect from 12th Oct 2013 due to the effect of very severe cyclone “Phalen”
3. Port Re-commissioned its commercial Traffic with effect from 30th Oct, 2015.
4. Work on additional 2 Berths Construction, Completion of Breakwater, stockyards, Development of Internal Roads, and Railway siding underway.
27. Construction of Oil Spill vessel
Panaji Port N.A. 4.18 Under construction
28. Construction of Terminal Building
Panaji Port N.A. 28.06 Construction work is in Progress.
29. E.I.A. Study of Sal Panaji Port N.A. 1.08 Work Under Process, 50% Payment already made. 30. E.I.A. Study of Talpona Panaji Port N.A. 0.85 Work Under Process, 75% Payment already made. 31. E.I.A. Study of Galgibag Panaji Port N.A. 0.7 Work Under Process, 50% Payment already made. 32. Repairs of Marine Slipway Panaji Port N.A. 0.30 Work in progress. 33. Divar Ferry Ramp Panaji Port N.A. 0.24 90% work Completed. Source: Maritime States/Maritime Boards. Note: The project status of Project name at S. No. 1 to 8 and 12 to 33 is updated on 31st March 2019.

66
Appendix – IV
Private Sector/Captive/Joint Venture Port Projects Under Formulation (Non-Major Ports)
Sl. No
Project State/ Ports Maritime Board
Capacity (Million Tonnes)
Project Cost (Rs. In Crore)
Project Status
1 2 3 4 5 6 1. HPCL- Rajasthan
Refinary Ltd. Modhava Coast of
Dist Kutch 9 MMPTA 43129
2. Adani Cement Ltd. Koir creek Dist Kutch.
1.8 MMTPA
845.4
3. Shree Cement Limited Modhava near Mundra Por Dist
Kutch
6 MMTPA 242
4. Ahir Salt and Allied Product Pvt. Ltd
Mithirohar, near Kandla Port Trust
Dist Kutch
0.7 MMTPA
192.06 0
5. Bhadareshwar Vidute Pvt. Ltd.
Bhadreshwar, near Mundra Dist Kutch
2MMPTA
6. Construction of captive jetty at village Nandgaon (Tal. Satpati, Dist. Palghar) by JSW Infrastructure Ltd.
SatpatiNawapur Maharashtra
8.0 3048 All project related studies completed. Project has received EC on 9.12.2016. Project could not move ahead due to a legal matter pending in the court.
7. Construction of captive jetty at village Korlai (Tal. Murud-Janjira, Dist. Raigad) in Revdanda creek by M/s indo Energy International Ltd.
Revdanda Maharashtra
11.75 437 All project related studies completed. Proposal for EC under consideration of MCZMA for onward submission to MoEE.
8. Construction of captive jetty at village Vaghveera (Tal. Alibag Dist. Raigad) in Dharamtar creek by M/s Gajanana Industries Ltd.
Dharamtar Maharashtra
1.0 28 Letter of Intent (Lol) issued to Project Proponent (PP) on 07.06.2017. PP to prepare DPR and obtain EC with 24 months from data of Lol.

67
9. Construction of captive jetty at village Nate (Tal. Rajapur, Dist. Ratnagiri) by M/sI-Log Ports Ltd.
Jaitapur 5.0 135 All project related studies are completed. Proposal for EC under consideration of MCZMA
10. Construction of multi purpose jetty at village Aronda- Kiranpani (Tal. Sawantwadi,Dist. Sindhu durg) by M/S White Orchid Estate Pvt. Ltd.
Kiranpan 0.5 28 Consideration of jetty facilities completed. However, port operations are kept in abeyance due to legal matters pending in the court/ NGT.
11. Development of port at Redi (Tal. Vengurla, Dist. Sawantwadi) by Redi port Ltd.
Redi 5.16 716 As per the directions of the State Government vide letter dtd. 3.1.2018, two jetties have been handed over back to M/s Redi Port Ltd.(RPL). The Port operator is required to obtain Environment clearance for new port construction. Redi port will have a capacity of 5.16 MTPA in Phase-I (2014-17) which will ultimately reach up to 33.38 MTPA in Phase-V (2032-46)
12. Development of port at Vijaydurg (Tal. Devgad, Dist. Sawantwadi) by Vijaydurg port Pvt. Ltd.
Vijaydurg 12.94 1059 The project proponent has obtained Terms of Reference (ToR) from MoEF vide letter did. 28.04.2015. The PP is required to revise DPR as per the recommendations in ToR and conduct EIA/ EMP studies for submission of proposal for EC. Currently, the Zero Date for the project has been extended up to 30.04.2019. It is estimated that if the construction of the port starts in FY-18, the Phase-I will be completed by FY-22 to achieve Port capacity of 12.94 MTPA. During the meeting held on 25.7.2017 under chairmanship of Hon. Chief Minister, GoM and in the presence of Hon. Union Minister of Shipping, it has been decided to develop Vijaydurg Port jointly by MbPT, MMB and Goa Port Trust. Goa Port Trust has appointed M/s Tata Consulting Engr. As consultant to prepare Techno-Economic Feasibility Study Report.
13. Construction of 9 Jetties under Sagarmala Project
Panaji Port N.A. 73.04 Preparation of Detailed Project Report (DPR) under progress.
14. Construction of 4 floating Jetties in Mandovi and Chapora River
Panaji Port N.A. 12.0 Tender has been floated and work awarded to Marine tec India Pvt. Ltd. Through MPT.

68
15. Consultancy financial and trasaction advisory services for development of Maritime aschool on PPP Model.
Panaji Port N.A. 0.24 Work in progress.
16. Construction of 3 Ferry Boats
Panaji Port N.A. 2.2 File Submitted for Expenditure sanction.
17. Construction of Sarmanas & Betim Ramp and Beautification of Panaji Ferry Ramp.
Panaji Port N.A. 1.5 Expenditure sanction obtained from Finance Department.
18.
Captive port facility by M/s. Coastal Tamil Nadu Power Ltd.
Panaiyur Kancheepuram (Tamil Nadu)
13 MMTPA
1832 Port has been notified. Statutory clearances pending.
19. Captive port by M/s Chettinad Power corporation Ltd.
Tharangambadi Taluk in Nagapattinam District
3.5 MMPTA
1000 Port has been notified. Statutory clearances pending.
20. Development of Machilipatnam Deep Water Port in Krishna District, Andhra Pradesh
Machilipatnm Port (Andhra Pradesh)
45
6778 Land acquisition is in progress. Project yet to be grounded.
21. Development of Bhavanapadu Port in Srikakulam District, Andhra Pradesh State.
Bhavanapadu Port, 30.57 3390 M/s. Adani Ports SEZ Ltd. Is the lowest bidder as a Concessionaire for development of Port. A letter of Award (LOA) has been issued to M/s Adani Ports SEZ Ltd., Ahmadabad during March 2018.
22. Development of Commercial Port at Kona Village of East Godavari District of Andhra Pradesh State.
Kakinada SEZ Port 16 2123 CA entered with Development Kakinada Gateway port Ltd., on 21.11.2018. Financial closure is in progress
23. 2nd stage Development of Karwar Port
Karnataka Ports & IWT Department
20 199.4 Inviting tender is deferred
24. Development of Modern Sea Port at Tadri
Karnataka Infrastructure Development
34.40 380 IDD has prepared DPR and EIA studies report.

69
Department
25. Development of port and setting up Free trade & warehousing Zone at Belekeri
M/o Shipping Govt of India
10 172 Government of Karnataka has prepared RFP & Draft Concessional Agreement for development port & setting up of free trade & ware Housing Zone at Belekeri Port. Government of India is also prepared Techno Economical Feasibility Report (TEFR) for development of Belekeri Port as a satellite Port to NMPT at Keni near Belekeri. State Government has conveyed its willingness along with NOC to GOI.
26. Development of captive jetty at Pavinkurva, Kumta
Karnataka Port & Inland Water Transport Deportment
10 160 M/s JSW, Mumbai has submitted proposal to develop Pavinkurve port under Swiss challenge method. Government of Karnataka has considered this proposal and M/s JSW, Mumbai prepared and submitted the DPR. The i-deck, the State Government under is to review and update the DPR. M/s JSW has prepared final DPR and submitted to same.
27. Development of Bulk Liquid Berth for handling L.N.G.
Karaikal Port Puducherry
5.0 2.61 Obtained Environmental Clearance from MoEF & CC: Government of Puducherry has issued “NOC” for LNG facility.
Source: Maritime States/Maritime Boards. Note: The project status of Project name at S. No. from 1 to 5 and 13 to 27 updated on 31st March 2019.
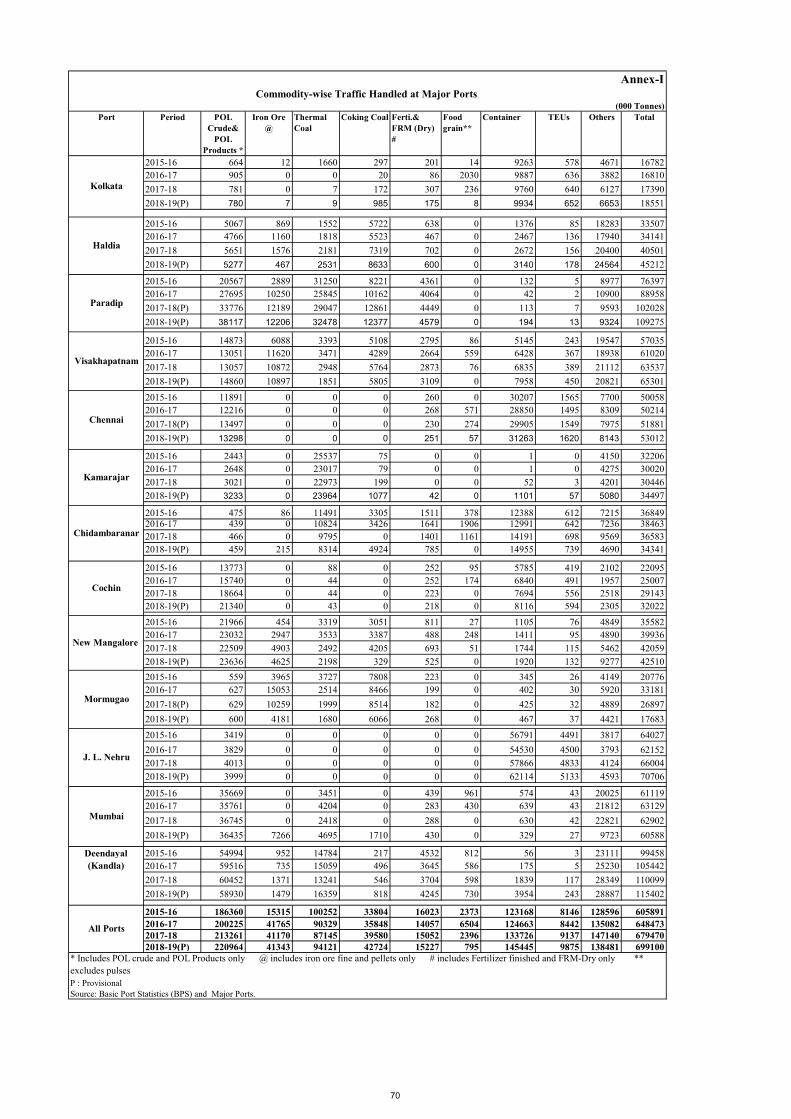
2015-16 664 12 1660 297 201 14 9263 578 4671 167822016-17 905 0 0 20 86 2030 9887 636 3882 16810
2017-18 781 0 7 172 307 236 9760 640 6127 17390
2018-19(P) 780 7 9 985 175 8 9934 652 6653 18551
2015-16 5067 869 1552 5722 638 0 1376 85 18283 335072016-17 4766 1160 1818 5523 467 0 2467 136 17940 34141
2017-18 5651 1576 2181 7319 702 0 2672 156 20400 40501
2018-19(P) 5277 467 2531 8633 600 0 3140 178 24564 45212
2015-16 20567 2889 31250 8221 4361 0 132 5 8977 763972016-17 27695 10250 25845 10162 4064 0 42 2 10900 88958
2017-18(P) 33776 12189 29047 12861 4449 0 113 7 9593 102028
2018-19(P) 38117 12206 32478 12377 4579 0 194 13 9324 109275
2015-16 14873 6088 3393 5108 2795 86 5145 243 19547 570352016-17 13051 11620 3471 4289 2664 559 6428 367 18938 61020
2017-18 13057 10872 2948 5764 2873 76 6835 389 21112 63537
2018-19(P) 14860 10897 1851 5805 3109 0 7958 450 20821 65301
2015-16 11891 0 0 0 260 0 30207 1565 7700 500582016-17 12216 0 0 0 268 571 28850 1495 8309 50214
2017-18(P) 13497 0 0 0 230 274 29905 1549 7975 51881
2018-19(P) 13298 0 0 0 251 57 31263 1620 8143 53012
2015-16 2443 0 25537 75 0 0 1 0 4150 322062016-17 2648 0 23017 79 0 0 1 0 4275 30020
2017-18 3021 0 22973 199 0 0 52 3 4201 30446
2018-19(P) 3233 0 23964 1077 42 0 1101 57 5080 34497
2015-16 475 86 11491 3305 1511 378 12388 612 7215 368492016-17 439 0 10824 3426 1641 1906 12991 642 7236 384632017-18 466 0 9795 0 1401 1161 14191 698 9569 365832018-19(P) 459 215 8314 4924 785 0 14955 739 4690 34341
2015-16 13773 0 88 0 252 95 5785 419 2102 220952016-17 15740 0 44 0 252 174 6840 491 1957 250072017-18 18664 0 44 0 223 0 7694 556 2518 291432018-19(P) 21340 0 43 0 218 0 8116 594 2305 32022
2015-16 21966 454 3319 3051 811 27 1105 76 4849 355822016-17 23032 2947 3533 3387 488 248 1411 95 4890 39936
2017-18 22509 4903 2492 4205 693 51 1744 115 5462 42059
2018-19(P) 23636 4625 2198 329 525 0 1920 132 9277 42510
2015-16 559 3965 3727 7808 223 0 345 26 4149 207762016-17 627 15053 2514 8466 199 0 402 30 5920 33181
2017-18(P) 629 10259 1999 8514 182 0 425 32 4889 26897
2018-19(P) 600 4181 1680 6066 268 0 467 37 4421 17683
2015-16 3419 0 0 0 0 0 56791 4491 3817 64027
2016-17 3829 0 0 0 0 0 54530 4500 3793 62152
2017-18 4013 0 0 0 0 0 57866 4833 4124 66004
2018-19(P) 3999 0 0 0 0 0 62114 5133 4593 70706
2015-16 35669 0 3451 0 439 961 574 43 20025 611192016-17 35761 0 4204 0 283 430 639 43 21812 63129
2017-18 36745 0 2418 0 288 0 630 42 22821 62902
2018-19(P) 36435 7266 4695 1710 430 0 329 27 9723 60588
2015-16 54994 952 14784 217 4532 812 56 3 23111 994582016-17 59516 735 15059 496 3645 586 175 5 25230 105442
2017-18 60452 1371 13241 546 3704 598 1839 117 28349 110099
2018-19(P) 58930 1479 16359 818 4245 730 3954 243 28887 115402
2015-16 186360 15315 100252 33804 16023 2373 123168 8146 128596 6058912016-17 200225 41765 90329 35848 14057 6504 124663 8442 135082 6484732017-18 213261 41170 87145 39580 15052 2396 133726 9137 147140 6794702018-19(P) 220964 41343 94121 42724 15227 795 145445 9875 138481 699100
Annex-ICommodity-wise Traffic Handled at Major Ports
(000 Tonnes)POL
Crude& POL
Products *
Thermal Coal
Iron Ore @
Coking Coal Ferti.& FRM (Dry) #
Port
P : ProvisionalSource: Basic Port Statistics (BPS) and Major Ports.
Food grain**
Container TEUs Others TotalPeriod
Chidambaranar
All Ports
Haldia
Kolkata
Paradip
Visakhapatnam
Chennai
Kamarajar
Deendayal (Kandla)
Cochin
* Includes POL crude and POL Products only @ includes iron ore fine and pellets only # includes Fertilizer finished and FRM-Dry only ** excludes pulses
Mumbai
J. L. Nehru
New Mangalore
Mormugao
70

Commodity Composition of Traffic Handled at Non- Major Ports.
Maritime Status / UTs
2 3 4 5 6 7 8 9 102015-16 174875 7511 9075 65903 10331 47930 24153 3397782016-17 180315 9379 9730 62421 8704 53124 22066 3457392017-18 188465 11584 10509 65962 5475 66312 22462 3707692018-19(P) 185998 12762 11024 75410 7792 74985 31226 3991972015-16 3225 7611 2243 12173 151 0 3446 288492016-17 2161 15049 2506 11137 243 0 3798 348942017-18 2528 13378 2125 15481 870 0 3524 379062018-19(P) 1196 16956 2252 18091 502 0 5424 444212015-16 1428 1620 1978 46203 5956 1807 13741 727332016-17 2712 2983 1656 39521 4870 4246 13615 696032017-18 1449 5949 1731 45262 5106 7793 18995 862852018-19(P) 1398 8130 1694 56312 6900 8835 20065 1033332015-16 0 260 0 170 0 0 0 4302016-17 0 117 0 0 0 0 0 1172017-18 0 72 0 0 0 0 0 722018-19(P) 0 0 0 0 0 0 15 152015-16 546 0 4 0 30 0 276 8562016-17 302 0 0 0 36 0 814 11522017-18 424 0 4 0 32 0 643 11032018-19(P) 574 0 56 0 48 0 285 9632015-16 82 0 81 0 57 0 615 8352016-17 111 0 86 0 40 0 470 7072017-18 182 0 44 0 36 0 419 6812018-19(P) 164 0 44 0 49 0 787 10442015-16 267 69 312 4658 421 0 247 59742016-17 272 499 756 6967 63 0 555 91122017-18 156 696 822 6094 62 1 290 81212018-19(P) 18 440 527 6338 285 0 761 83692015-16 0 312 0 12767 0 0 1870 149492016-17 0 6427 50 13709 281 0 2006 224732017-18 0 4916 29 13860 134 0 3656 225952018-19(P) 0 4579 59 12924 510 0 4113 221862015-16 19 0 1 0 0 0 124 1442016-17 19 0 0 0 0 0 121 1402017-18 22 0 0 0 0 0 116 1382018-19(P) 19 0 0 0 0 25 157 2012015-16 199 0 479 0 0 374 271 13232016-17 178 0 386 0 0 442 270 12762017-18 196 0 324 25 0 485 388 14182018-19(P) 203 0 329 0 0 619 343 14952015-16 180641 17383 14173 141874 16946 50111 44743 4658702016-17 186070 34454 15170 133755 14237 57812 43715 4852132017-18 193422 36595 15588 146684 11715 74591 50493 5290882018-19(P) 189570 42867 15986 169075 16087 84465 63176 581225
(P) Provisional
Source: BPS, Non Major Ports/State Maritime Boards and Port Data Management Port (PDMP)
@ includes Thermal Coal, Coking coal, other coal and Pet coal$ includes Building Material and Cement/Clinker** includes iron ore fines and Pellets
^ includes Fertilisers, FRM-Liquid, FRM_Dry and Rock Phosphate
All Non Major Ports
Others Total
1
Puducherry
No traffic was handled at Daman & Diu and Lakshadweep.* includes POL crude, POL products, LPG/LNG, Naphtha and Fuel oil.
Tamil Nadu
Karnataka
Annex-II
Period POL * Iron Ore **Building
Material $Coal @
Fertiliser & FRM ^
Container
Odisha
Kerala
Andaman & Nicobar
(000 Tonnes)
Gujarat
Maharashtra
Andhra Pradesh
Goa
71

(In Million Tonnes)
Commodities KDS HDC PPT VPT EPL ChPT V.O.C. CoPT NMPT MoPT MbPT KPT/DPT JNPT Total1 2 3 4 5 6 7 8 9 10 11 12 13 14 15
POLAs on 31.3.13 4.50 17.00 43.00 17.65 3.00 17.67 2.30 19.01 49.17 1.50 32.00 66.60 5.50 278.90As on 31.3.14 4.50 17.00 43.00 25.65 3.00 17.67 2.30 24.01 49.17 1.50 32.00 66.60 5.50 291.90As on 31.3.15 4.50 17.00 53.00 27.49 4.00 17.67 2.30 24.01 49.17 1.50 32.00 66.60 6.50 305.74As on 31.3.16 4.50 17.00 54.50 27.49 4.00 17.67 3.15 24.01 49.17 1.50 34.50 70.82 6.50 314.81As on 31.3.17 9.10 18.00 54.50 27.49 4.00 17.67 3.15 30.26 49.17 1.50 44.50 89.02 6.50 354.86As on 31.3.18As on 31.3.19Iron Ore As on 31.3.13 - 6.00 4.50 12.50 6.00 8.00 - - 7.50 27.50 - - - 72.00As on 31.3.14 - 6.00 4.50 12.50 6.00 8.00 - - 7.50 27.50 - - - 72.00As on 31.3.15 - 6.00 4.50 12.50 6.00 8.00 - - 7.50 27.50 - - - 72.00As on 31.3.16 - 6.00 6.39 12.50 6.00 8.00 7.50 27.50 73.89As on 31.3.17 6.00 6.39 12.50 6.00 8.00 7.50 27.50 73.89As on 31.3.18As on 31.3.19CoalAs on 31.3.13 - 7.00 20.00 - 21.00 - 12.55 - 5.40 - - - - 65.95As on 31.3.14 - 7.00 20.00 - 21.00 - 12.55 - 5.40 - - - - 65.95As on 31.3.15 - 7.00 21.00 - 24.00 - 12.55 - 5.40 4.61 - - - 74.56As on 31.3.16 - 9.00 21.00 - 32.00 - 24.18 - 5.40 8.94 - - - 100.52As on 31.3.17 10.00 32.00 32.00 26.82 7.67 8.94 117.43As on 31.3.18As on 31.3.19FertiliserAs on 31.3.13 - - 7.50 1.00 - - - 0.80 - - - - - 9.30As on 31.3.14 - - 7.50 1.00 - - - 0.80 - - - 2.00 - 11.30As on 31.3.15 - - 7.50 1.00 - - - 0.80 - - - 2.00 - 11.30As on 31.3.16 - - 7.50 1.87 - - - 0.80 - - - 2.00 - 12.17As on 31.3.17 8.00 1.87 1.13 2.00 13.00As on 31.3.18As on 31.3.19Break-Bulk CargoAs on 31.3.13 6.74 12.75 27.30 33.50 1.00 17.92 13.49 12.35 14.70 7.40 11.53 19.42 0.90 179.00As on 31.3.14 6.74 15.75 33.80 47.09 1.00 17.92 22.21 12.35 15.70 7.65 11.53 26.52 * 0.90 219.16As on 31.3.15 6.74 15.75 33.80 53.09 3.00 17.92 24.70 12.35 15.70 10.15 11.53 45.63 0.90 251.26As on 31.3.16 6.74 29.89 37.55 59.69 3.00 22.92 24.70 12.35 15.70 10.85 14.83 51.04 0.90 290.16As on 31.3.17 7.25 31.89 42.55 62.69 5.00 22.92 28.70 12.68 23.29 12.10 20.83 52.04 0.90 322.84As on 31.3.18As on 31.3.19ContainerAs on 31.3.13 5.90 4.00 - 2.68 - 42.00 5.00 12.50 - - 1.00 7.20 59.48 @ 139.76As on 31.3.14 5.90 4.00 - 2.68 - 42.45 5.00 12.50 - - 1.00 7.20 59.48 @ 140.21As on 31.3.15 9.86 4.00 - 2.68 - 42.45 5.00 12.50 - - 1.00 7.20 71.97@ 156.66As on 31.3.16 9.86 4.00 6.20 44.85 7.23 12.50 7.20 81.97 173.81As on 31.3.17 9.86 4.00 6.20 10.00 44.85 7.23 12.50 7.20 81.97 183.81As on 31.3.18As on 31.3.19TOTAL `As on 31.3.13 17.14 46.75 102.30 67.33 31.00 85.59 33.34 44.66 76.77 36.40 44.53 93.22 65.88 744.91As on 31.3.14 17.14 49.75 108.80 88.92 31.00 86.04 42.06 49.66 77.77 36.65 44.53 102.32 65.88 800.52As on 31.3.15 21.10 49.75 119.80 96.76 37.00 86.04 44.55 49.66 77.77 43.76 44.53 121.43 79.37 871.52As on 31.3.16 21.10 65.89 126.94 107.75 45.00 93.44 59.26 49.66 77.77 48.79 49.33 131.06 89.37 965.36As on 31.3.17** 26.21 69.89 143.44 110.75 57.00 93.44 65.90 56.57 87.63 50.04 65.33 150.26 89.37 1065.83As on 31.3.18 31.57 51.00 239.00 131.09 84.00 134.00 94.83 74.50 98.00 63.00 79.00 253.20 118.00 1451.19As on 31.3.19 31.57 51.00 239.00 131.09 91.00 134.00 111.46 78.60 98.00 63.40 79.00 267.10 138.87 1514.09
Source : Development Wing - Department of Shipping.
Annexure-III
Commodity-Wise Capacity Available at Major Ports
Figure in the parenthesis indicate the number of berths. BJ Barge jetties, T-Transhippers, A-Anchorages, SBM-Single Buoy Mooring(*) Port capacity re-reted by Ministry based on Berthing Policy as per international norms.
@ : Capacity of JNP Container Termnal (3berths), NSICT (2berths), GTIPL (3berths) and shallow water berth (1 no) has been taken as 21.57 MT, 17.40 MT, 31.80 MT and 1.20 MT respectively.* After accounting the capacity due to productivity, addition of berth No. 13 & 15,MHC, Floating cranes
**Port capacity re-rated by Ministry based on berthing policy as per international norms. Major Ports re-rated capacity during 2016-17 was 1359 MTPA
72