UNIVERSITAS PADJADJARAN FAKULTAS EKONOMI DAN BISNIS...
33
131 17 APPENDIX KUESIONER PENELITIAN Assalamu'alaikum warahmatullahi wabarakatuh Kepada responden yang terhormat, perkenalkan sayar Muhammad Radian Suriaatmaja, mahasiswa S1 program studi Manajemen Universitas Padjadjaran yang tengah menyusun skripsi sebagai syarat utama meraih gelar sarjana strata satu atau (S1). Adapun judul dari penelitian yang tengah saya lakukan adalah “ The Influence of Religiosity and Corporate Reputation on Consumer Loyalty in (Survey on Consumers of An Islamic Bank in Bandung)” atau dalam Bahasa Indonesia “Pengaruh Religiusitas dan Reputasi Perusahaan terhadap Loyalitas Konsumen (Survey Pada Konsumen Sebuah Bank Syariah di Kota Bandung) Melalui kuesioner ini saya minta kesediaan dari Bapak/Ibu/Saudara/i yang merupakan 1. Beragama Islam 2. Berdomisili di Kota Bandung 3. Menggunakan tabungan BSM Bank Syariah Mandiri Agar dapat meluagkan waktunya untuk menjawab pertanyaan-pertanyaan yang ada pada penelitian ini. Seluruh jawaban yang telah dari Bapak/Ibu/Saudara/I berikan akan dipergunakan akan digunakan di ranah akademik Atas partisipasi dari Bapak/Ibu/Saudara/i, saya ucapkan terimakasih Hormat Saya, M. Radian Suriaatmaja UNIVERSITAS PADJADJARAN FAKULTAS EKONOMI DAN BISNIS PROGRAM STUDI MANAJEMEN
Transcript of UNIVERSITAS PADJADJARAN FAKULTAS EKONOMI DAN BISNIS...

131
17 APPENDIX
KUESIONER PENELITIAN
Assalamu'alaikum warahmatullahi wabarakatuh
Kepada responden yang terhormat, perkenalkan sayar Muhammad
Radian Suriaatmaja, mahasiswa S1 program studi Manajemen Universitas
Padjadjaran yang tengah menyusun skripsi sebagai syarat utama meraih gelar
sarjana strata satu atau (S1). Adapun judul dari penelitian yang tengah saya
lakukan adalah “ The Influence of Religiosity and Corporate Reputation on
Consumer Loyalty in (Survey on Consumers of An Islamic Bank in Bandung)”
atau dalam Bahasa Indonesia “Pengaruh Religiusitas dan Reputasi
Perusahaan terhadap Loyalitas Konsumen (Survey Pada Konsumen Sebuah
Bank Syariah di Kota Bandung)
Melalui kuesioner ini saya minta kesediaan dari Bapak/Ibu/Saudara/i yang
merupakan
1. Beragama Islam
2. Berdomisili di Kota Bandung
3. Menggunakan tabungan BSM Bank Syariah Mandiri
Agar dapat meluagkan waktunya untuk menjawab pertanyaan-pertanyaan yang
ada pada penelitian ini. Seluruh jawaban yang telah dari Bapak/Ibu/Saudara/I
berikan akan dipergunakan akan digunakan di ranah akademik
Atas partisipasi dari Bapak/Ibu/Saudara/i, saya ucapkan terimakasih
Hormat Saya,
M. Radian Suriaatmaja
UNIVERSITAS PADJADJARAN
FAKULTAS EKONOMI DAN BISNIS
PROGRAM STUDI MANAJEMEN
132
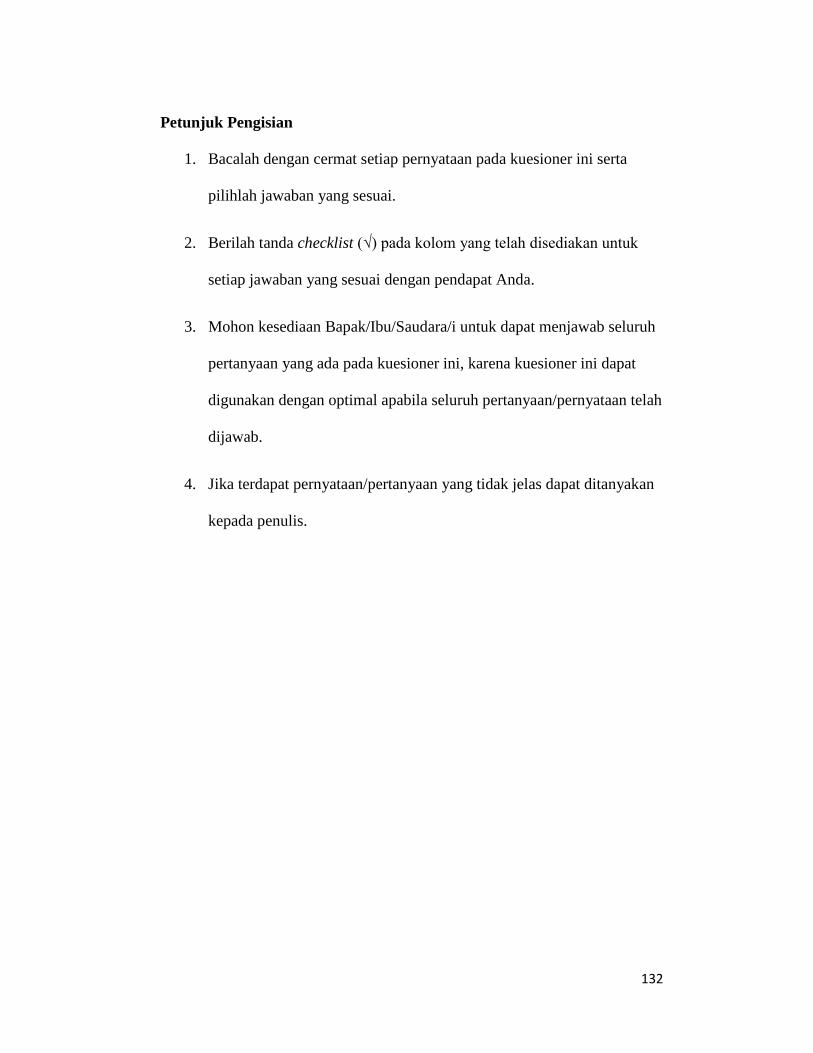
Petunjuk Pengisian
1. Bacalah dengan cermat setiap pernyataan pada kuesioner ini serta
pilihlah jawaban yang sesuai.
2. Berilah tanda checklist (√) pada kolom yang telah disediakan untuk
setiap jawaban yang sesuai dengan pendapat Anda.
3. Mohon kesediaan Bapak/Ibu/Saudara/i untuk dapat menjawab seluruh
pertanyaan yang ada pada kuesioner ini, karena kuesioner ini dapat
digunakan dengan optimal apabila seluruh pertanyaan/pernyataan telah
dijawab.
4. Jika terdapat pernyataan/pertanyaan yang tidak jelas dapat ditanyakan
kepada penulis.
133
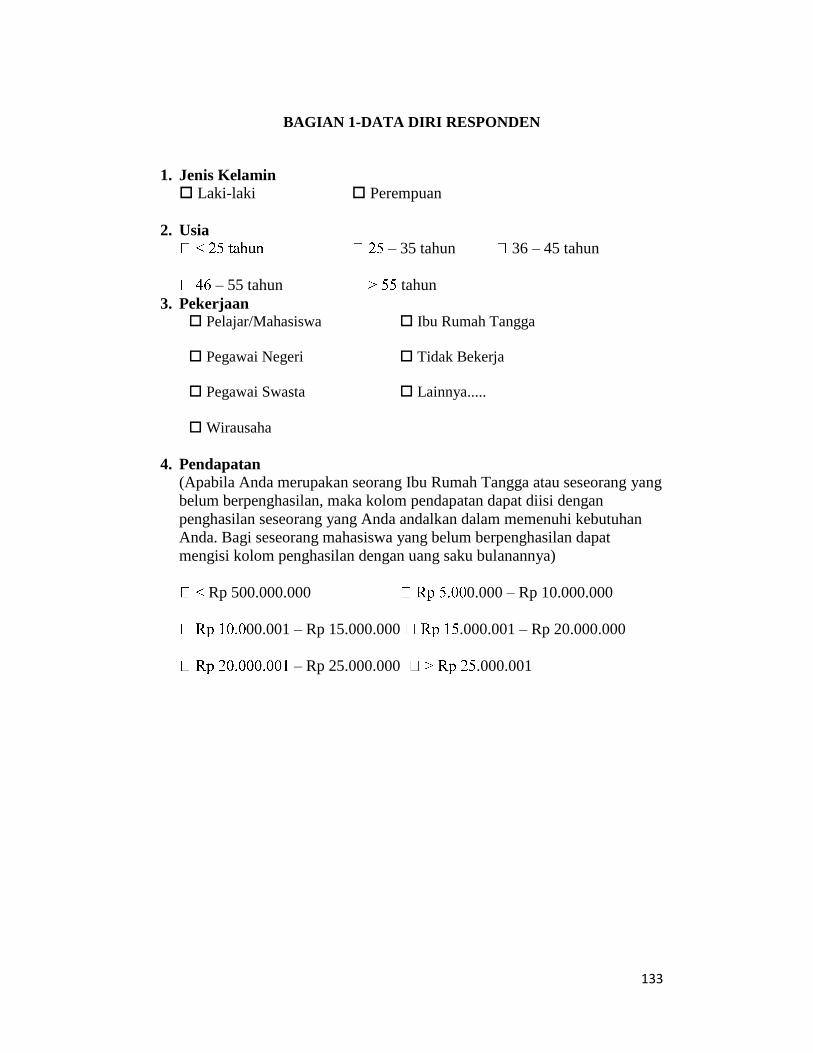
BAGIAN 1-DATA DIRI RESPONDEN
1. Jenis Kelamin
Laki-laki Perempuan
2. Usia
– 35 tahun 36 – 45 tahun
– 55 tahun tahun
3. Pekerjaan Pelajar/Mahasiswa Ibu Rumah Tangga
Pegawai Negeri Tidak Bekerja
Pegawai Swasta Lainnya.....
Wirausaha
4. Pendapatan
(Apabila Anda merupakan seorang Ibu Rumah Tangga atau seseorang yang
belum berpenghasilan, maka kolom pendapatan dapat diisi dengan
penghasilan seseorang yang Anda andalkan dalam memenuhi kebutuhan
Anda. Bagi seseorang mahasiswa yang belum berpenghasilan dapat
mengisi kolom penghasilan dengan uang saku bulanannya)
Rp 500.000.000 0.000 – Rp 10.000.000
00.001 – Rp 15.000.000 .000.001 – Rp 20.000.000
– Rp 25.000.000 .000.001

134
BAGIAN 2 – Pengaruh Religiusitas dan Reputasi Perusahaan terhadap Loyalitas
Konsumen.
Berikanlah respon terhadap pernyataan-pernyataan berikut terkait religiusitas anda.
Berikanlah tanda silang (X) pada salah satu kotak pilihaan sebagai respon
anda dari masing-masing pernyataan berikut
Religiusitas Sangat
Tidak Setuju
Tidak
Setuju
Netral Setuju Sangat
Setuju
1
Saya sering membaca buku mengenai
Islam STS TS CS S SS
22
2
Saya bersemangat untuk memahami
ajaran-ajaran Islam STS TS CS S SS
3
3
Saya yakin Islam bisa memberikan
jawaban mengenai makna kehidupan STS TS CS S SS
4
4
Saya menjadikan Islam melatarbelakangi
seluruh pendekatan saya dalam hidup
terutama di bidang ekonomi
STS TS CS S SS
5
5
Saya menjadikan Islam mempegaruhi
seluruh urusan kehidupan saya terutama
dalam urusan keuangan
STS TS CS S SS
6
6
Saya sering meluangkan waktu untuk
merenung secaara mendalam mengenai
agama Islam
STS TS CS S SS

135
REPUTASI PERUSAHAAN (CORPORATE REPUTATION)
Bacalah pernyataan-pernyataan di bawah ini dan berikan respon anda terhadap
Reputasi Bank Mandiri Syariah
Berikanlah tanda silang (X) pada salah satu kotak pilihaan sebagai respon
anda dari masing-masing pernyataan berikut
Reputasi Perusahaan Sangat
Tidak
Setuju
Tidak
Setuju
Netral Setuju Sangat
Setuju
1
1
Saya memiliki rasa suka terhadap Bank
Syariah Mandiri STS TS CS S SS
2
Saya memiliki rasa kagum terhadap
Bank Syariah Mandiri STS TS CS S SS
3
Saya memiliki rasa percaya kepada Bank
Syariah Mandiri STS TS CS S SS
4
Menurut saya Bank Syariah Mandiri
memberikan pelayanan tabungan yang
sesuai dengan yang dijanjikan
STS TS CS S SS
5
Menurut saya pelayanan tabungan BSM
Bank Syariah Mandiri memiliki kualitas
yang tinggi
STS TS CS S SS
6
Menurut saya tabungan BSM Bank
Syariah Mandiri memberikan
keuntungan berupa bagi hasil yang tinggi
STS TS CS S SS
7
Menurut saya Bank Syariah Mandiri
selalu melakukan inovasi dalam
memperbaiki pelayanan tabungan BSM
STS TS CS S SS
8
Bank Syariah Mandiri mendukung hal
positif di masyarakat dengan mendukung
pertumbuhan Usaha Mikro Kecil dan
Menengah (UMKM)
STS TS CS S SS
9
Bank Syariah Mandiri menunjukan
kepedulian terhadap lingkunan dengan
melakukan penghijauan lingkungan
melalui program CSR
STS TS CS S SS
10
Bank Syariah Mandiri mempelakukan
umat dengan baik dengan menyalurkan
bantuan CSR kepada masjid-masjid
STS TS CS S SS

136
LOYALITAS KONSUMEN (CONSUMER LOYALTY)
Bacalah pernyataan-pernyataan di bawah ini dan berikanlah respon anda terhadap
loyalitas (kesetiaan) anda sebagai konsumen Bank Mandiri Syariah
Berikanlah tanda silang (X) pada salah satu kotak pilihaan sebagai respon
anda dari masing-masing pernyataan berikut
Loyalitas Konsumen Sangat
Tidak
Setuju
Tidak
Setuju
Netral Setuju Sangat
Setuju
1
1
Menurut saya tingkat pelayanan tabungan BSM
Bank Syariah Mandiri lebih baik dibandingkan bank
lain
STS TS CS S SS
2
2
Menurut saya tingkat bagi hasil yang saya terima
dari tabungan BSM Bank Syariah Mandiri lebih
besar dibandingkan tabungan bank lain
STS TS CS S SS
3
3
Menurut saya tabungan BSM Bank Syariah Mandiri
lebih baik dibandingkan tabungan bank lain STS TS CS S SS
4
Saya memiliki rasa ketertarikan pada tabungan
BSM Bank Syariah Mandiri karena pelayanan yang
diberikan Bank Syariah Mandiri kepada saya baik
STS TS CS S SS
5
Saya merasa senang menggunakan tabungan BSM
Bank Syariah Mandiri karena pelayanan yang
diberikan Bank Syariah Mandiri kepada saya baik
STS TS CS S SS
6
Saya merasa tertarik pada tabungan BSM Bank
Syariah karena pelayanan yang diberikan Bank
Syariah Mandiri kepada saya baik
STS TS CS S SS
7
Saya berniat untuk tetap menggunakan tabungan
BSM bank Syariah Mandiri di masa yang akan
datang
STS TS CS S SS
8
Saya berniat menggunakan produk-produk lain
selain tabungan yang disediakan oleh Bank Syariah
Mandiri
STS TS CS S SS
9
9
Saya berniat merekomendasikan tabungan BSM
Bank Syariah Mandiri kepada orang lain STS TS CS S SS
10
Saya tetap menggunakan tabungan BSM Bank
Syariah Mandiri walaupun biaya administrasi
tabungan mengalami kenaikan
STS TS CS S SS
11
Saya memberitahukan hal positif
mengenaikeunggulan tabungan BSM Bank Mandiri
Syariah kepada orang lain meskipun adanya isu
negative mengenai Bank Syariah Mandiri
STS TS CS S SS
12
Saya menjadikan tabungan Bank Syariah Mandiri
sebagai pilihan utama meskipun adanya tawaran-
tawaran menarik dari bank lain
STS TS CS S SS

137
LAMPIRAN OUTPUT MODEL STRUKTURAL
T-valueS
STANDARDIZED
138
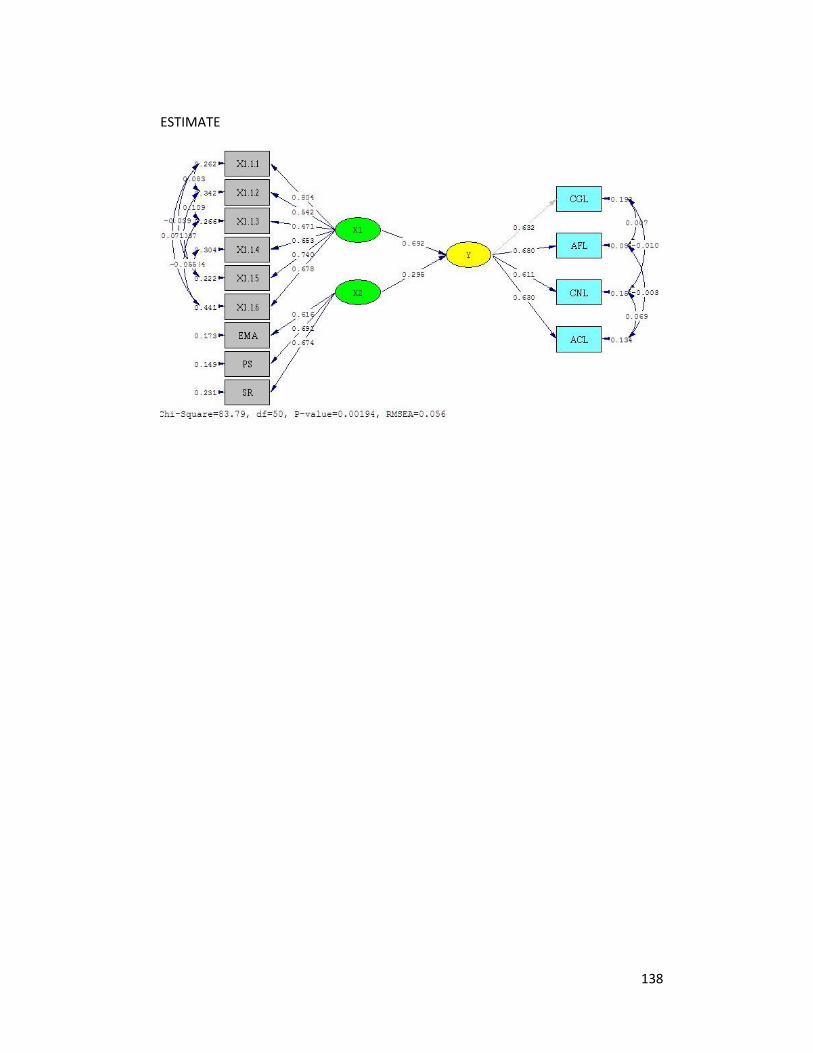
ESTIMATE

139
DATE: 8/21/2018
TIME: 14:28
L I S R E L 8.80
BY
Karl G. Jöreskog & Dag Sörbom
This program is published exclusively by
Scientific Software International, Inc.
7383 N. Lincoln Avenue, Suite 100
Lincolnwood, IL 60712, U.S.A.
Phone: (800)247-6113, (847)675-0720, Fax: (847)675-2140
Copyright by Scientific Software International, Inc., 1981-2006
Use of this program is subject to the terms specified in the
Universal Copyright Convention.
Website: www.ssicentral.com
The following lines were read from file C:\Users\User\Documents\Data
Statistik\LISREL\MODEL STRUKTURAL.SPJ:
Raw Data from file 'C:\Users\User\Documents\Data Statistik\LISREL\MODEL
STRUKTURAL.psf'
Sample Size = 218
Latent Variables Y X1 X2
Relationships
CGL = 0.373*Y
AFL = Y
CNL = Y
ACL = Y
X1.1.1 = X1
X1.1.2 = X1
X1.1.3 = X1
X1.1.4 = X1
X1.1.5 = X1
X1.1.6 = X1
EMA = X2
PS = X2
SR = X2
Y = X1 X2
Set the Variance of X1 to 1.000
Set the Variance of X2 to 1.000
Set the Error Covariance of ACL and CNL Free
Set the Error Covariance of X1.1.2 and X1.1.1 Free
Set the Error Covariance of X1.1.3 and X1.1.2 Free
Set the Error Covariance of X1.1.5 and X1.1.1 Free
Set the Error Covariance of X1.1.5 and X1.1.2 Free

140
Set the Error Covariance of X1.1.5 and X1.1.4 Free
Set the Error Covariance of X1.1.6 and X1.1.1 Free
Set the Error Covariance of X1.1.6 and X1.1.3 Free
Path Diagram
Number of Decimals = 3
Admissibility Check = Off
End of Problem
Sample Size = 218
Covariance Matrix
CGL AFL CNL ACL X1.1.1 X1.1.2
-------- -------- -------- -------- -------- --------
CGL 0.327
AFL 0.265 0.589
CNL 0.225 0.444 0.552
ACL 0.227 0.460 0.454 0.627
X1.1.1 0.286 0.481 0.410 0.449 0.906
X1.1.2 0.191 0.338 0.286 0.299 0.506 0.629
X1.1.3 0.123 0.251 0.264 0.231 0.351 0.357
X1.1.4 0.229 0.348 0.306 0.352 0.515 0.353
X1.1.5 0.230 0.383 0.339 0.375 0.555 0.368
X1.1.6 0.263 0.384 0.326 0.355 0.614 0.347
EMA 0.139 0.259 0.271 0.256 0.216 0.286
PS 0.116 0.265 0.246 0.254 0.202 0.277
SR 0.146 0.284 0.273 0.296 0.247 0.275
Covariance Matrix
X1.1.3 X1.1.4 X1.1.5 X1.1.6 EMA PS
-------- -------- -------- -------- -------- --------
X1.1.3 0.486
X1.1.4 0.338 0.731
X1.1.5 0.365 0.589 0.770
X1.1.6 0.249 0.430 0.512 0.904
EMA 0.203 0.227 0.191 0.164 0.552
PS 0.159 0.190 0.213 0.162 0.428 0.626
SR 0.193 0.215 0.222 0.218 0.406 0.470
Covariance Matrix
SR
--------
SR 0.685

141
Number of Iterations = 13
LISREL Estimates (Maximum Likelihood)
Measurement Equations
CGL = 0.373*Y, Errorvar.= 0.189 , R² = 0.423
(0.0194)
9.733
AFL = 0.705*Y, Errorvar.= 0.0950 , R² = 0.839
(0.0637) (0.0184)
11.061 5.168
CNL = 0.630*Y, Errorvar.= 0.156 , R² = 0.716
(0.0602) (0.0210)
10.481 7.456
ACL = 0.654*Y, Errorvar.= 0.201 , R² = 0.679
(0.0638) (0.0256)
10.256 7.864
X1.1.1 = 0.800*X1, Errorvar.= 0.269 , R² = 0.704
(0.0562) (0.0421)
14.246 6.387
X1.1.2 = 0.546*X1, Errorvar.= 0.338 , R² = 0.468
(0.0514) (0.0384)
10.614 8.807
X1.1.3 = 0.469*X1, Errorvar.= 0.265 , R² = 0.454
(0.0439) (0.0286)
10.688 9.237
X1.1.4 = 0.653*X1, Errorvar.= 0.304 , R² = 0.583
(0.0520) (0.0375)
12.546 8.123
X1.1.5 = 0.735*X1, Errorvar.= 0.228 , R² = 0.703
(0.0518) (0.0368)
14.180 6.210
X1.1.6 = 0.678*X1, Errorvar.= 0.442 , R² = 0.509
(0.0597) (0.0516)
11.356 8.574
EMA = 0.617*X2, Errorvar.= 0.172 , R² = 0.689
(0.0432) (0.0240)

142
14.270 7.167
PS = 0.689*X2, Errorvar.= 0.151 , R² = 0.758
(0.0451) (0.0258)
15.289 5.877
SR = 0.675*X2, Errorvar.= 0.230 , R² = 0.665
(0.0485) (0.0305)
13.918 7.536
Error Covariance for ACL and CNL = 0.0445
(0.0183)
2.427
Error Covariance for X1.1.2 and X1.1.1 = 0.0830
(0.0260)
3.189
Error Covariance for X1.1.3 and X1.1.2 = 0.107
(0.0243)
4.401
Error Covariance for X1.1.5 and X1.1.1 = -0.034
(0.0220)
-1.536
Error Covariance for X1.1.5 and X1.1.2 = -0.036
(0.0199)
-1.824
Error Covariance for X1.1.5 and X1.1.4 = 0.107
(0.0304)
3.519
Error Covariance for X1.1.6 and X1.1.1 = 0.0749
(0.0336)
2.231
Error Covariance for X1.1.6 and X1.1.3 = -0.057
(0.0236)
-2.407

143
Structural Equations
Y = 0.673*X1 + 0.280*X2, Errorvar.= 0.289 , R² = 0.709
(0.0838) (0.0629) (0.0650)
8.033 4.441 4.450
Correlation Matrix of Independent Variables
X1 X2
-------- --------
X1 1.000
X2 0.460 1.000
(0.063)
7.301
Covariance Matrix of Latent Variables
Y X1 X2
-------- -------- --------
Y 0.994
X1 0.802 1.000
X2 0.590 0.460 1.000
Goodness of Fit Statistics
Degrees of Freedom = 54
Minimum Fit Function Chi-Square = 107.382 (P = 0.000)
Normal Theory Weighted Least Squares Chi-Square = 101.674 (P = 0.000)
Estimated Non-centrality Parameter (NCP) = 47.674
90 Percent Confidence Interval for NCP = (23.077 ; 80.084)
Minimum Fit Function Value = 0.495
Population Discrepancy Function Value (F0) = 0.220
90 Percent Confidence Interval for F0 = (0.106 ; 0.369)
Root Mean Square Error of Approximation (RMSEA) = 0.0638
90 Percent Confidence Interval for RMSEA = (0.0444 ; 0.0827)
P-Value for Test of Close Fit (RMSEA < 0.05) = 0.114
Expected Cross-Validation Index (ECVI) = 0.810
90 Percent Confidence Interval for ECVI = (0.696 ; 0.959)
ECVI for Saturated Model = 0.839
ECVI for Independence Model = 19.727
Chi-Square for Independence Model with 78 Degrees of Freedom = 4254.840
Independence AIC = 4280.840
Model AIC = 175.674
Saturated AIC = 182.000
Independence CAIC = 4337.838
144
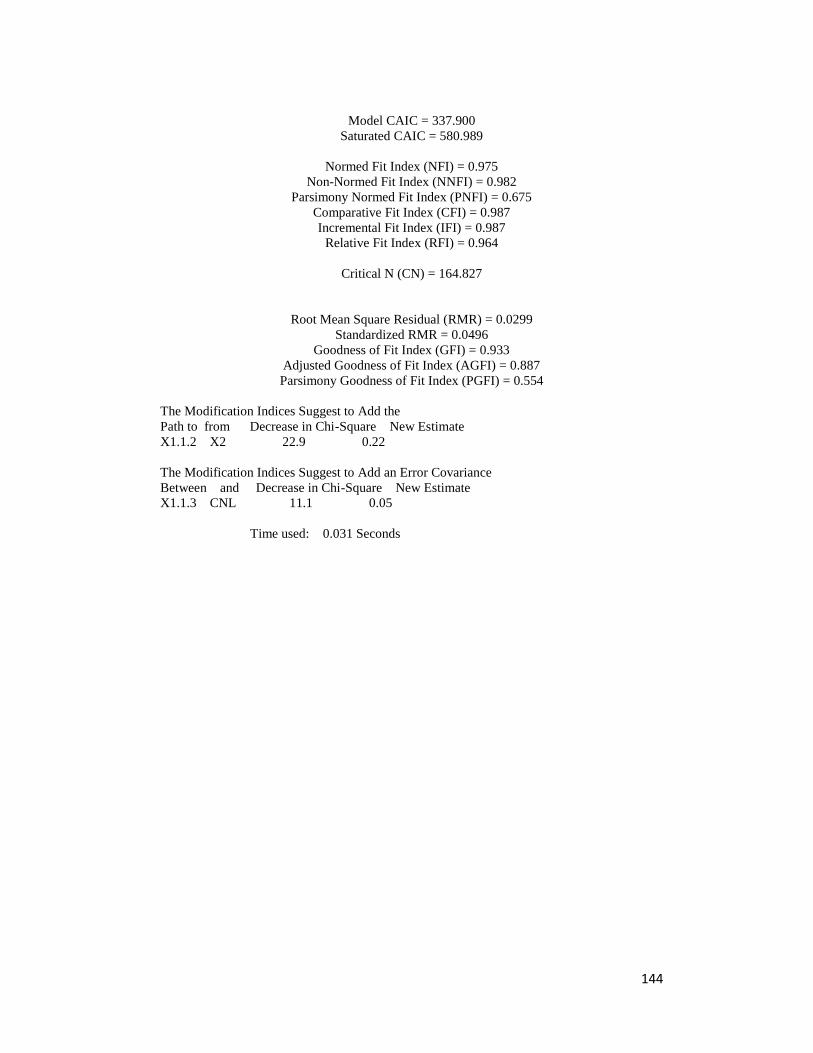
Model CAIC = 337.900
Saturated CAIC = 580.989
Normed Fit Index (NFI) = 0.975
Non-Normed Fit Index (NNFI) = 0.982
Parsimony Normed Fit Index (PNFI) = 0.675
Comparative Fit Index (CFI) = 0.987
Incremental Fit Index (IFI) = 0.987
Relative Fit Index (RFI) = 0.964
Critical N (CN) = 164.827
Root Mean Square Residual (RMR) = 0.0299
Standardized RMR = 0.0496
Goodness of Fit Index (GFI) = 0.933
Adjusted Goodness of Fit Index (AGFI) = 0.887
Parsimony Goodness of Fit Index (PGFI) = 0.554
The Modification Indices Suggest to Add the
Path to from Decrease in Chi-Square New Estimate
X1.1.2 X2 22.9 0.22
The Modification Indices Suggest to Add an Error Covariance
Between and Decrease in Chi-Square New Estimate
X1.1.3 CNL 11.1 0.05
Time used: 0.031 Seconds

145
LAMPIRAN OUTPUT CFA VARIABEL X1
STANDARDIZED
T-valueS

146
DATE: 8/19/2018
TIME: 3:09
L I S R E L 8.80
BY
Karl G. Jöreskog & Dag Sörbom
This program is published exclusively by
Scientific Software International, Inc.
7383 N. Lincoln Avenue, Suite 100
Lincolnwood, IL 60712, U.S.A.
Phone: (800)247-6113, (847)675-0720, Fax: (847)675-2140
Copyright by Scientific Software International, Inc., 1981-2006
Use of this program is subject to the terms specified in the
Universal Copyright Convention.
Website: www.ssicentral.com
The following lines were read from file C:\Users\User\Documents\Data
Statistik\LISREL\RELIGIOSITY.SPJ:
Raw Data from file 'C:\Users\User\Documents\Data Statistik\LISREL\Religiosity.psf'
Latent Variables X1
Relationships
X1.1.1-X1.1.6=X1
Path Diagram
Number of Decimals = 3
Admissibility Check = Off
End of Problem
Sample Size = 218

147
Covariance Matrix
X1.1.1 X1.1.2 X1.1.3 X1.1.4 X1.1.5 X1.1.6
-------- -------- -------- -------- -------- --------
X1.1.1 0.906
X1.1.2 0.506 0.629
X1.1.3 0.351 0.357 0.486
X1.1.4 0.515 0.353 0.338 0.731
X1.1.5 0.555 0.368 0.365 0.589 0.770
X1.1.6 0.614 0.347 0.249 0.430 0.512 0.904
Number of Iterations = 8
LISREL Estimates (Maximum Likelihood)
Measurement Equations
X1.1.1 = 0.776*X1, Errorvar.= 0.303 , R² = 0.665
(0.0547) (0.0367)
14.188 8.257
X1.1.2 = 0.556*X1, Errorvar.= 0.320 , R² = 0.491
(0.0486) (0.0341)
11.431 9.384
X1.1.3 = 0.480*X1, Errorvar.= 0.256 , R² = 0.474
(0.0430) (0.0270)
11.167 9.453
148
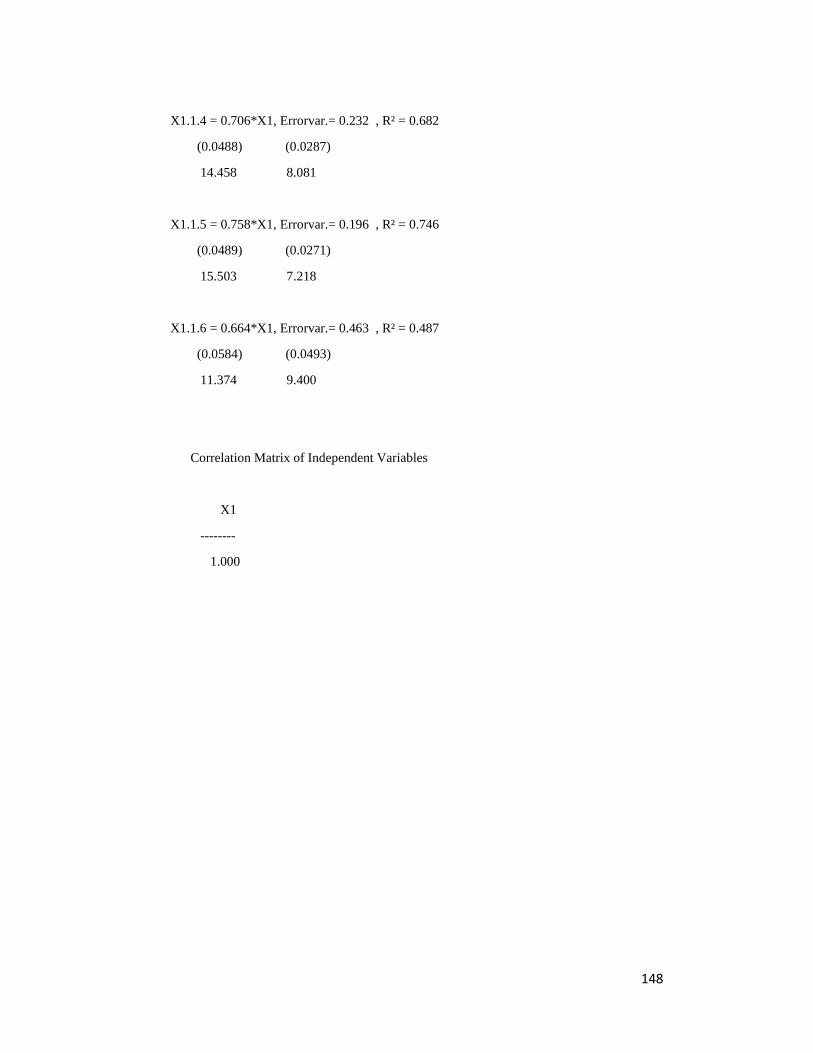
X1.1.4 = 0.706*X1, Errorvar.= 0.232 , R² = 0.682
(0.0488) (0.0287)
14.458 8.081
X1.1.5 = 0.758*X1, Errorvar.= 0.196 , R² = 0.746
(0.0489) (0.0271)
15.503 7.218
X1.1.6 = 0.664*X1, Errorvar.= 0.463 , R² = 0.487
(0.0584) (0.0493)
11.374 9.400
Correlation Matrix of Independent Variables
X1
--------
1.000
149
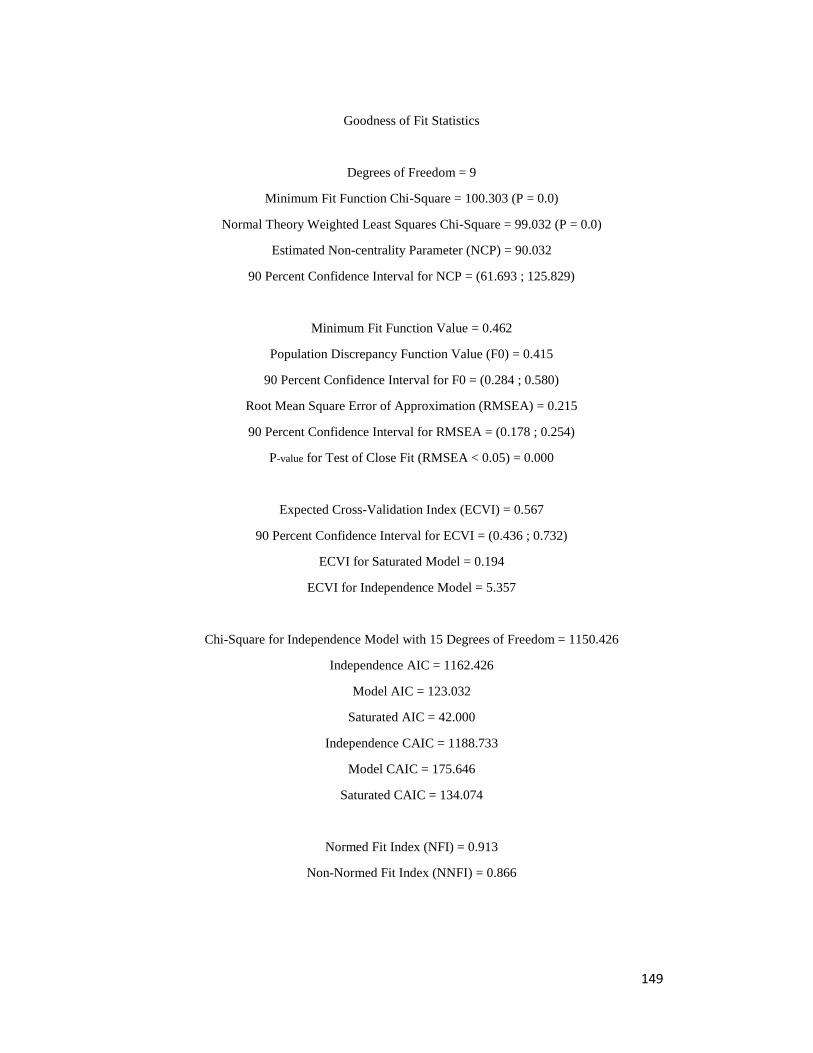
Goodness of Fit Statistics
Degrees of Freedom = 9
Minimum Fit Function Chi-Square = 100.303 (P = 0.0)
Normal Theory Weighted Least Squares Chi-Square = 99.032 (P = 0.0)
Estimated Non-centrality Parameter (NCP) = 90.032
90 Percent Confidence Interval for NCP = (61.693 ; 125.829)
Minimum Fit Function Value = 0.462
Population Discrepancy Function Value (F0) = 0.415
90 Percent Confidence Interval for F0 = (0.284 ; 0.580)
Root Mean Square Error of Approximation (RMSEA) = 0.215
90 Percent Confidence Interval for RMSEA = (0.178 ; 0.254)
P-value for Test of Close Fit (RMSEA < 0.05) = 0.000
Expected Cross-Validation Index (ECVI) = 0.567
90 Percent Confidence Interval for ECVI = (0.436 ; 0.732)
ECVI for Saturated Model = 0.194
ECVI for Independence Model = 5.357
Chi-Square for Independence Model with 15 Degrees of Freedom = 1150.426
Independence AIC = 1162.426
Model AIC = 123.032
Saturated AIC = 42.000
Independence CAIC = 1188.733
Model CAIC = 175.646
Saturated CAIC = 134.074
Normed Fit Index (NFI) = 0.913
Non-Normed Fit Index (NNFI) = 0.866

150
Parsimony Normed Fit Index (PNFI) = 0.548
Comparative Fit Index (CFI) = 0.920
Incremental Fit Index (IFI) = 0.920
Relative Fit Index (RFI) = 0.855
Critical N (CN) = 47.874
Root Mean Square Residual (RMR) = 0.0439
Standardized RMR = 0.0622
Goodness of Fit Index (GFI) = 0.868
Adjusted Goodness of Fit Index (AGFI) = 0.692
Parsimony Goodness of Fit Index (PGFI) = 0.372
The Modification Indices Suggest to Add an Error Covariance
Between and Decrease in Chi-Square New Estimate
X1.1.2 X1.1.1 19.1 0.11
X1.1.3 X1.1.2 27.3 0.11
X1.1.5 X1.1.1 10.9 -0.09
X1.1.5 X1.1.2 18.6 -0.10
X1.1.5 X1.1.4 39.7 0.15
X1.1.6 X1.1.1 23.3 0.15
X1.1.6 X1.1.3 11.4 -0.09
Time used: 0.031 Seconds

151
LAMPIRAN OUTPUT CFA VARIABEL X2
STANDARDIZED
T-valueS
152
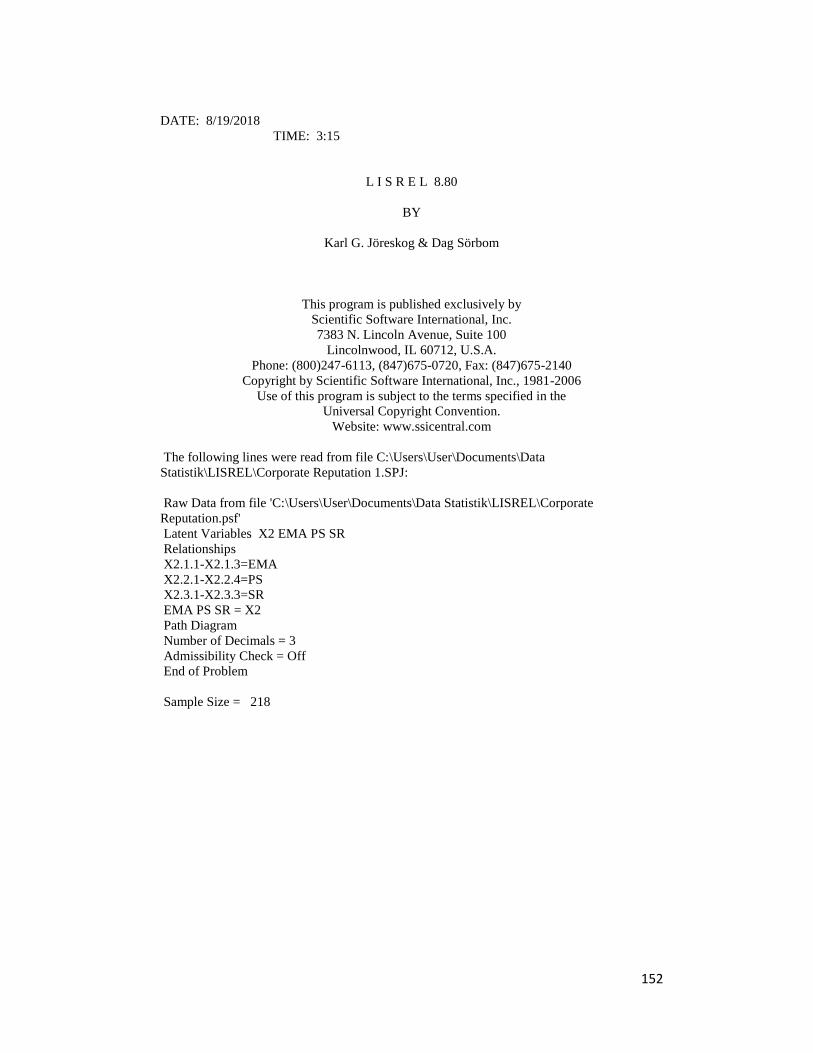
DATE: 8/19/2018
TIME: 3:15
L I S R E L 8.80
BY
Karl G. Jöreskog & Dag Sörbom
This program is published exclusively by
Scientific Software International, Inc.
7383 N. Lincoln Avenue, Suite 100
Lincolnwood, IL 60712, U.S.A.
Phone: (800)247-6113, (847)675-0720, Fax: (847)675-2140
Copyright by Scientific Software International, Inc., 1981-2006
Use of this program is subject to the terms specified in the
Universal Copyright Convention.
Website: www.ssicentral.com
The following lines were read from file C:\Users\User\Documents\Data
Statistik\LISREL\Corporate Reputation 1.SPJ:
Raw Data from file 'C:\Users\User\Documents\Data Statistik\LISREL\Corporate
Reputation.psf'
Latent Variables X2 EMA PS SR
Relationships
X2.1.1-X2.1.3=EMA
X2.2.1-X2.2.4=PS
X2.3.1-X2.3.3=SR
EMA PS SR = X2
Path Diagram
Number of Decimals = 3
Admissibility Check = Off
End of Problem
Sample Size = 218

153
Covariance Matrix
X2.1.1 X2.1.2 X2.1.3 X2.2.1 X2.2.2 X2.2.3
-------- -------- -------- -------- -------- --------
X2.1.1 0.675
X2.1.2 0.521 0.763
X2.1.3 0.443 0.492 0.617
X2.2.1 0.408 0.437 0.476 0.799
X2.2.2 0.395 0.496 0.458 0.636 0.762
X2.2.3 0.319 0.430 0.347 0.474 0.495 0.757
X2.2.4 0.393 0.526 0.446 0.641 0.650 0.583
X2.3.1 0.403 0.488 0.417 0.518 0.508 0.427
X2.3.2 0.324 0.423 0.358 0.454 0.440 0.441
X2.3.3 0.360 0.484 0.393 0.454 0.456 0.414
Covariance Matrix
X2.2.4 X2.3.1 X2.3.2 X2.3.3
-------- -------- -------- --------
X2.2.4 0.741
X2.3.1 0.527 0.818
X2.3.2 0.491 0.584 0.794
X2.3.3 0.504 0.628 0.621 0.888
Number of Iterations = 18
LISREL Estimates (Maximum Likelihood)
Measurement Equations
X2.1.1 = 0.658*EMA, Errorvar.= 0.242 , R² = 0.642
(0.0289)
8.387
X2.1.2 = 0.772*EMA, Errorvar.= 0.167 , R² = 0.781
(0.0531) (0.0264)
14.532 6.338
X2.1.3 = 0.658*EMA, Errorvar.= 0.185 , R² = 0.700
(0.0482) (0.0239)
13.649 7.729
X2.2.1 = 0.773*PS, Errorvar.= 0.201 , R² = 0.748
(0.0222)
9.064

154
X2.2.2 = 0.783*PS, Errorvar.= 0.149 , R² = 0.805
(0.0415) (0.0176)
18.863 8.433
X2.2.3 = 0.676*PS, Errorvar.= 0.301 , R² = 0.603
(0.0468) (0.0308)
14.444 9.769
X2.2.4 = 0.835*PS, Errorvar.= 0.0448 , R² = 0.940
(0.0378) (0.0114)
22.106 3.939
X2.3.1 = 0.792*SR, Errorvar.= 0.191 , R² = 0.767
(0.0280)
6.816
X2.3.2 = 0.750*SR, Errorvar.= 0.231 , R² = 0.710
(0.0477) (0.0298)
15.719 7.746
X2.3.3 = 0.800*SR, Errorvar.= 0.248 , R² = 0.721
(0.0503) (0.0327)
15.914 7.588
Structural Equations
EMA = 0.879*X2, Errorvar.= 0.227 , R² = 0.773
(0.0754) (0.0553)
11.665 4.096
PS = 0.910*X2, Errorvar.= 0.172 , R² = 0.828
(0.0677) (0.0465)
13.445 3.709
SR = 0.859*X2, Errorvar.= 0.261 , R² = 0.739
(0.0683) (0.0544)
12.588 4.802
Correlation Matrix of Independent Variables
X2
--------
1.000
155
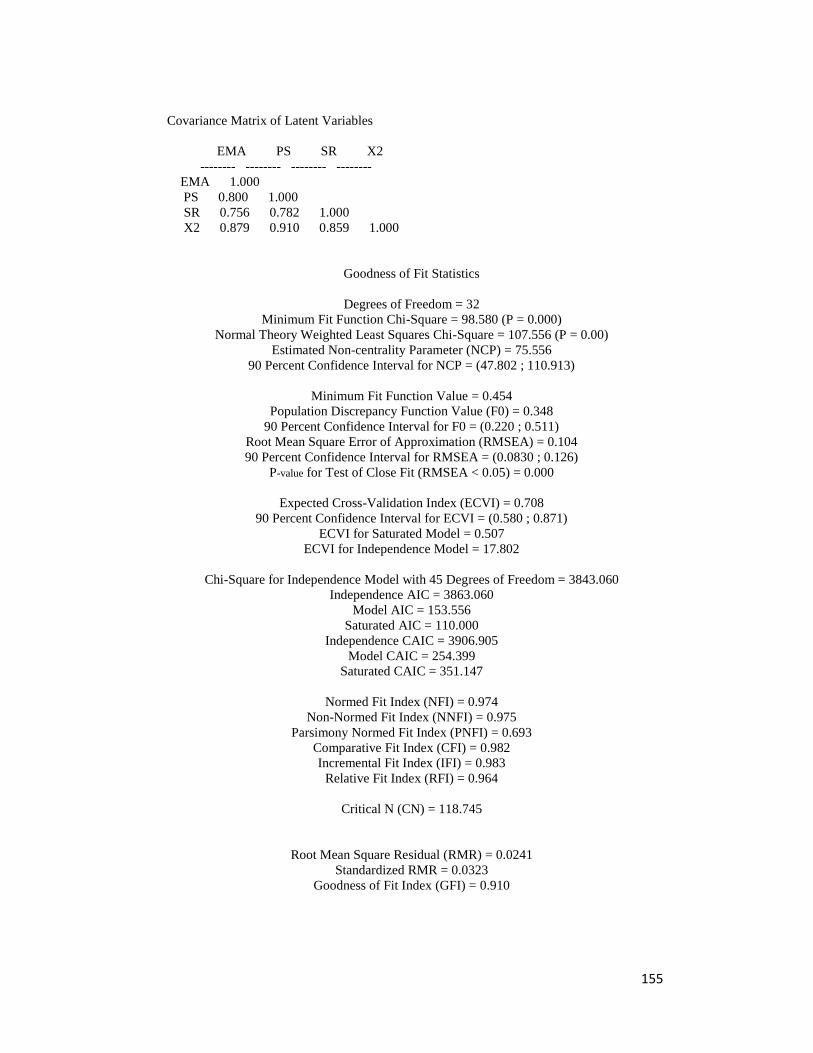
Covariance Matrix of Latent Variables
EMA PS SR X2
-------- -------- -------- --------
EMA 1.000
PS 0.800 1.000
SR 0.756 0.782 1.000
X2 0.879 0.910 0.859 1.000
Goodness of Fit Statistics
Degrees of Freedom = 32
Minimum Fit Function Chi-Square = 98.580 (P = 0.000)
Normal Theory Weighted Least Squares Chi-Square = 107.556 (P = 0.00)
Estimated Non-centrality Parameter (NCP) = 75.556
90 Percent Confidence Interval for NCP = (47.802 ; 110.913)
Minimum Fit Function Value = 0.454
Population Discrepancy Function Value (F0) = 0.348
90 Percent Confidence Interval for F0 = (0.220 ; 0.511)
Root Mean Square Error of Approximation (RMSEA) = 0.104
90 Percent Confidence Interval for RMSEA = (0.0830 ; 0.126)
P-value for Test of Close Fit (RMSEA < 0.05) = 0.000
Expected Cross-Validation Index (ECVI) = 0.708
90 Percent Confidence Interval for ECVI = (0.580 ; 0.871)
ECVI for Saturated Model = 0.507
ECVI for Independence Model = 17.802
Chi-Square for Independence Model with 45 Degrees of Freedom = 3843.060
Independence AIC = 3863.060
Model AIC = 153.556
Saturated AIC = 110.000
Independence CAIC = 3906.905
Model CAIC = 254.399
Saturated CAIC = 351.147
Normed Fit Index (NFI) = 0.974
Non-Normed Fit Index (NNFI) = 0.975
Parsimony Normed Fit Index (PNFI) = 0.693
Comparative Fit Index (CFI) = 0.982
Incremental Fit Index (IFI) = 0.983
Relative Fit Index (RFI) = 0.964
Critical N (CN) = 118.745
Root Mean Square Residual (RMR) = 0.0241
Standardized RMR = 0.0323
Goodness of Fit Index (GFI) = 0.910

156
Adjusted Goodness of Fit Index (AGFI) = 0.845
Parsimony Goodness of Fit Index (PGFI) = 0.529
The Modification Indices Suggest to Add the
Path to from Decrease in Chi-Square New Estimate
X2.1.1 PS 8.2 -0.23
The Modification Indices Suggest to Add an Error Covariance
Between and Decrease in Chi-Square New Estimate
X2.1.3 X2.1.2 8.7 -0.08
X2.2.1 X2.1.2 27.4 -0.09
X2.2.1 X2.1.3 19.3 0.07
X2.2.2 X2.2.1 12.6 0.06
X2.2.3 X2.2.1 11.0 -0.06
X2.2.3 X2.2.2 8.1 -0.05
X2.2.4 X2.1.2 11.0 0.04
X2.2.4 X2.2.3 22.4 0.07
Time used: 0.016 Seconds
157
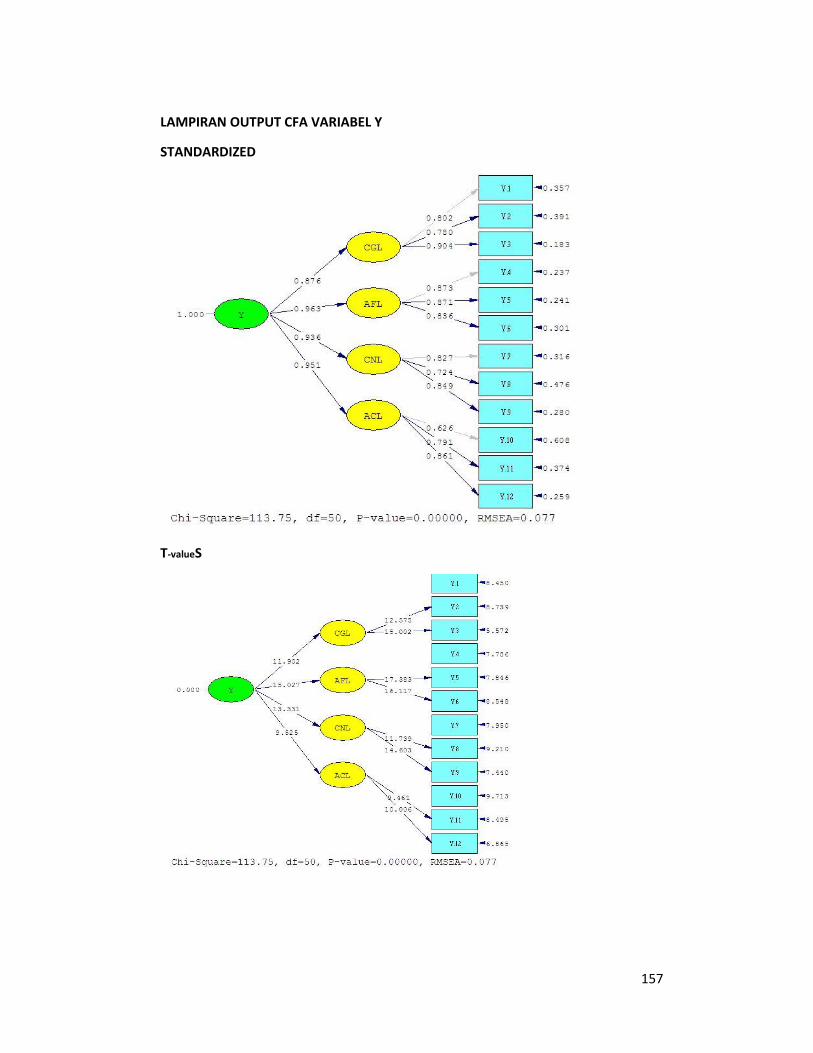
LAMPIRAN OUTPUT CFA VARIABEL Y
STANDARDIZED
T-valueS

158
DATE: 8/19/2018
TIME: 3:26
L I S R E L 8.80
BY
Karl G. Jöreskog & Dag Sörbom
This program is published exclusively by
Scientific Software International, Inc.
7383 N. Lincoln Avenue, Suite 100
Lincolnwood, IL 60712, U.S.A.
Phone: (800)247-6113, (847)675-0720, Fax: (847)675-2140
Copyright by Scientific Software International, Inc., 1981-2006
Use of this program is subject to the terms specified in the
Universal Copyright Convention.
Website: www.ssicentral.com
The following lines were read from file C:\Users\User\Documents\Data
Statistik\LISREL\Consumer Loyalty.SPJ:
Raw Data from file 'C:\Users\User\Documents\Data
Statistik\LISREL\Consumer Loyalty 1.psf'
Latent Variables Y CGL AFL CNL ACL
Relationships
Y.1-Y.3=CGL
Y.4-Y.6=AFL
Y.7-Y.9=CNL
Y.10-Y.12=ACL
CGL AFL CNL ACL = Y
Path Diagram
Number of Decimals = 3
Admissibility Check = Off
End of Problem
Sample Size = 218

159
Covariance Matrix
Y.1 Y.2 Y.3 Y.4 Y.5 Y.6
-------- -------- -------- -------- -------- --------
Y.1 0.772
Y.2 0.487 0.833
Y.3 0.548 0.574 0.757
Y.4 0.444 0.438 0.492 0.672
Y.5 0.405 0.386 0.448 0.536 0.652
Y.6 0.545 0.472 0.569 0.526 0.509 0.832
Y.7 0.389 0.365 0.407 0.428 0.424 0.435
Y.8 0.350 0.357 0.362 0.407 0.408 0.402
Y.9 0.459 0.439 0.456 0.455 0.484 0.553
Y.10 0.310 0.351 0.383 0.363 0.302 0.396
Y.11 0.420 0.402 0.434 0.425 0.459 0.532
Y.12 0.515 0.472 0.543 0.516 0.522 0.622
Covariance Matrix
Y.7 Y.8 Y.9 Y.10 Y.11 Y.12
-------- -------- -------- -------- -------- --------
Y.7 0.636
Y.8 0.433 0.755
Y.9 0.494 0.464 0.791
Y.10 0.383 0.434 0.438 0.905
Y.11 0.410 0.437 0.508 0.459 0.803
Y.12 0.478 0.431 0.571 0.484 0.571 0.905
Number of Iterations = 21

160
LISREL Estimates (Maximum Likelihood)
Measurement Equations
Y.1 = 0.705*CGL, Errorvar.= 0.275 , R² = 0.643
(0.0326)
8.450
Y.2 = 0.712*CGL, Errorvar.= 0.326 , R² = 0.609
(0.0566) (0.0373)
12.575 8.739
Y.3 = 0.786*CGL, Errorvar.= 0.138 , R² = 0.817
(0.0524) (0.0248)
15.002 5.572
Y.4 = 0.716*AFL, Errorvar.= 0.160 , R² = 0.763
(0.0205)
7.786
Y.5 = 0.703*AFL, Errorvar.= 0.157 , R² = 0.759
(0.0405) (0.0201)
17.383 7.846
Y.6 = 0.762*AFL, Errorvar.= 0.251 , R² = 0.699
(0.0473) (0.0293)
16.117 8.548
Y.7 = 0.660*CNL, Errorvar.= 0.201 , R² = 0.684
(0.0253)
7.950
Y.8 = 0.629*CNL, Errorvar.= 0.360 , R² = 0.524
(0.0536) (0.0391)
11.739 9.210
Y.9 = 0.755*CNL, Errorvar.= 0.221 , R² = 0.720
(0.0517) (0.0297)
14.603 7.440

161
Y.10 = 0.596*ACL, Errorvar.= 0.550 , R² = 0.392
(0.0567)
9.713
Y.11 = 0.709*ACL, Errorvar.= 0.301 , R² = 0.626
(0.0749) (0.0354)
9.461 8.495
Y.12 = 0.819*ACL, Errorvar.= 0.235 , R² = 0.741
(0.0818) (0.0342)
10.006 6.865
Structural Equations
CGL = 0.876*Y, Errorvar.= 0.232 , R² = 0.768
(0.0736) (0.0480)
11.902 4.843
AFL = 0.963*Y, Errorvar.= 0.0724 , R² = 0.928
(0.0641) (0.0313)
15.027 2.313
CNL = 0.936*Y, Errorvar.= 0.123 , R² = 0.877
(0.0702) (0.0405)
13.331 3.038
ACL = 0.951*Y, Errorvar.= 0.0951 , R² = 0.905
(0.0999) (0.0433)
9.525 2.195
Correlation Matrix of Independent Variables
Y
--------
1.000

162
Covariance Matrix of Latent Variables
CGL AFL CNL ACL Y
-------- -------- -------- -------- --------
CGL 1.000
AFL 0.844 1.000
CNL 0.820 0.902 1.000
ACL 0.833 0.916 0.891 1.000
Y 0.876 0.963 0.936 0.951 1.000
Goodness of Fit Statistics
Degrees of Freedom = 50
Minimum Fit Function Chi-Square = 116.159 (P = 0.000)
Normal Theory Weighted Least Squares Chi-Square = 113.751 (P = 0.000)
Estimated Non-centrality Parameter (NCP) = 63.751
90 Percent Confidence Interval for NCP = (36.547 ; 98.678)
Minimum Fit Function Value = 0.535
Population Discrepancy Function Value (F0) = 0.294
90 Percent Confidence Interval for F0 = (0.168 ; 0.455)
Root Mean Square Error of Approximation (RMSEA) = 0.0767
90 Percent Confidence Interval for RMSEA = (0.0580 ; 0.0954)
P-value for Test of Close Fit (RMSEA < 0.05) = 0.0109
Expected Cross-Validation Index (ECVI) = 0.782
90 Percent Confidence Interval for ECVI = (0.657 ; 0.943)
ECVI for Saturated Model = 0.719
ECVI for Independence Model = 23.467
Chi-Square for Independence Model with 66 Degrees of Freedom = 5068.246
Independence AIC = 5092.246
Model AIC = 169.751
Saturated AIC = 156.000
Independence CAIC = 5144.860
Model CAIC = 292.516
Saturated CAIC = 497.991
Normed Fit Index (NFI) = 0.977
Non-Normed Fit Index (NNFI) = 0.983
Parsimony Normed Fit Index (PNFI) = 0.740
Comparative Fit Index (CFI) = 0.987

163
Incremental Fit Index (IFI) = 0.987
Relative Fit Index (RFI) = 0.970
Critical N (CN) = 143.273
Root Mean Square Residual (RMR) = 0.0283
Standardized RMR = 0.0358
Goodness of Fit Index (GFI) = 0.920
Adjusted Goodness of Fit Index (AGFI) = 0.875
Parsimony Goodness of Fit Index (PGFI) = 0.590
The Modification Indices Suggest to Add the
Path to from Decrease in Chi-Square New Estimate
Y.4 ACL 12.2 -0.58
Y.6 CGL 19.9 0.44
Y.6 ACL 18.4 0.80
The Modification Indices Suggest to Add an Error Covariance
Between and Decrease in Chi-Square New Estimate
Y.5 Y.4 25.7 0.09
Y.6 Y.5 8.5 -0.06
Y.10 Y.5 11.3 -0.08
Y.10 Y.8 9.0 0.10
Time used: 0.031 Seconds