The Predictive Value of Analyst
35
The Predictive Value of The Predictive Value of Analyst Analyst Kelompok 3: Kelompok 3: Irma Irma Herlina Helmi Herlina Helmi Desirizta Sari Steviani Desirizta Sari Steviani
description
The Predictive Value of Analyst. Kelompok 3: Irma Herlina Helmi Desirizta Sari Steviani. OUTLINE. 1. Introduction. 2. Literature Review. 3. Samples & Methodology. 4. Estimation Results. 5. Accuracy Results & Correlation Result. 6. Sensitivity Analyses. 7. Summary. Introduction. - PowerPoint PPT Presentation
Transcript of The Predictive Value of Analyst

The Predictive Value of The Predictive Value of AnalystAnalyst
Kelompok 3:Kelompok 3:IrmaIrma
Herlina HelmiHerlina HelmiDesirizta Sari StevianiDesirizta Sari Steviani
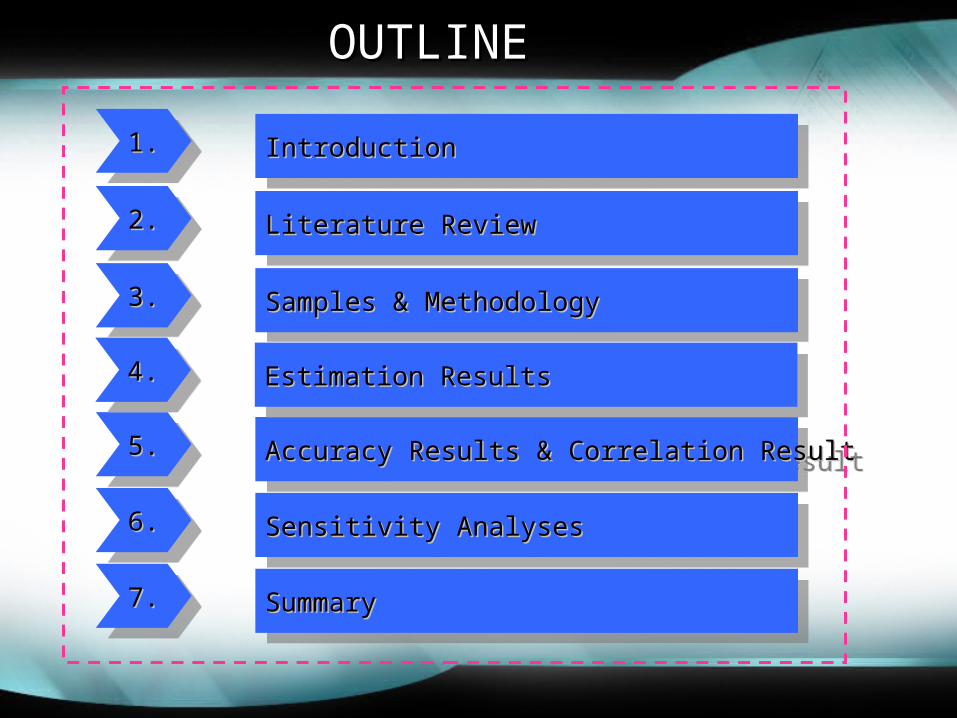
OUTLINEOUTLINE
1.1.1.1.IntroductionIntroductionIntroductionIntroduction
2.2.2.2.Literature ReviewLiterature ReviewLiterature ReviewLiterature Review
3.3.3.3.Samples & MethodologySamples & MethodologySamples & MethodologySamples & Methodology
5.5.5.5.Accuracy Results & Correlation ResultAccuracy Results & Correlation ResultAccuracy Results & Correlation ResultAccuracy Results & Correlation Result
4.4.4.4.Estimation ResultsEstimation ResultsEstimation ResultsEstimation Results
6.6.6.6.Sensitivity AnalysesSensitivity AnalysesSensitivity AnalysesSensitivity Analyses
7.7.7.7.SummarySummarySummarySummary

Introduction• Para peneliti telah mengidentifikasi karakteristik analis yang memungkinkan
untuk membedakan antara ramalan/prediksi laba yang lebih akurat atau kurang akurat dengan menggunakan prosedur in-sample.
– Mikhail et al. (1997) mengidentifikasi pengalaman analis sebagai karakteristik penting.
– Clement (1999) menyarankan pengalaman analis ditambah jumlah perusahaan, jumlah industri, dan ukuran dari lembaga perantara (broker).
– Jacob et al. (1999) menunjukkan frekuensi peramalan adalah karakteristik analis lainnya.

Introduction• Beberapa penelitian menunjukkan bahwa forecast age / waktu peramalan
juga penting untuk membedakan ramalan laba yang lebih akurat atau kurang akurat (O’Brien 1988, Brown 1991, Stickel 1992, Sinha et al. 1997).
• Lebih tepatnya, meramal tanggal berikutnya akan menjadi lebih akurat, daripada meramal lebih awal.
• Penemuan ini konsisten dengan dugaan bahwa setiap ramalan analis menggunakan ramalan sebelumnya ditambah informasi baru yang diperoleh.
• Semua penelitian karakteristik analis (Mikhail et al. 1997, Clement 1999, Jacob et al. 1999) menggunakan forecast age sebagai variabel kontrol dalam model mereka.

Introduction• Meskipun fokus pada analis sebagai sumber dari prediksi laba dibatasi
(Schipper 1991), kemampuan prediksi merupakan hal penting karena merupakan kriteria dari relevansi informasi (FASB, 1980), dan model penilaian memasukkan prediksi laba (Ohlson, 1995).
• Dua keuntungan dari mengidentifikasi karakteristik analis adalah (1) memperoleh consensus estimate yang lebih akurat, dan (2) memperoleh consensus estimate yang lebih mendekati perkiraan
ekspektasi pasar modal.
• Studi ini fokus pada dua keuntungan tersebut yang tidak ada pada penelitian sebelumnya.

Introduction• Dari literatur yang ada dikembangkan model enam faktor dari keakuratan
ramalan analis individu (Model), yang terdiri dari forecast age dan lima faktor karakteristik analis.
• Lima faktor karakteristik analis tersebut adalah: pengalaman analis, jumlah industri, jumlah perusahaan, ukuran broker, dan frekuensi ramalan.
• Peneliti mengestimasi Model setiap tahun dengan menggunakan regresi ordinary least squares (OLS) dan diterapkan kedalam enam faktor yang ada di Model untuk tahun berikutnya.

Introduction
• Peneliti membandingkan Model dengan single-factor model yang menggunakan forecast age (Age), variabel kontrol dari Model.
• Peneliti mengestimasi Age dengan menentukan bobot tertinggi (terendah) untuk ramalan analis yang terkini/most recent (terdahulu/least recent).
• Dengan menggunakan prosedur bobot dan analis yang sama digunakan untuk membentuk Model .
• Peneliti menguji perbandingan kemampuan prediksi Model dan Age dalam dua bentuk konteks: (1) keakuratan prediksi jumlah laba di triwulan berikutnya dan (2) korelasi abnormal return akumulatif selama tiga hari di sekitar
pengumuman laba. (-1, +1) dengan earning surprise, yang dikondisikan pada Model dan Age yang berdasarkan consensus estimate.
Literatur Review
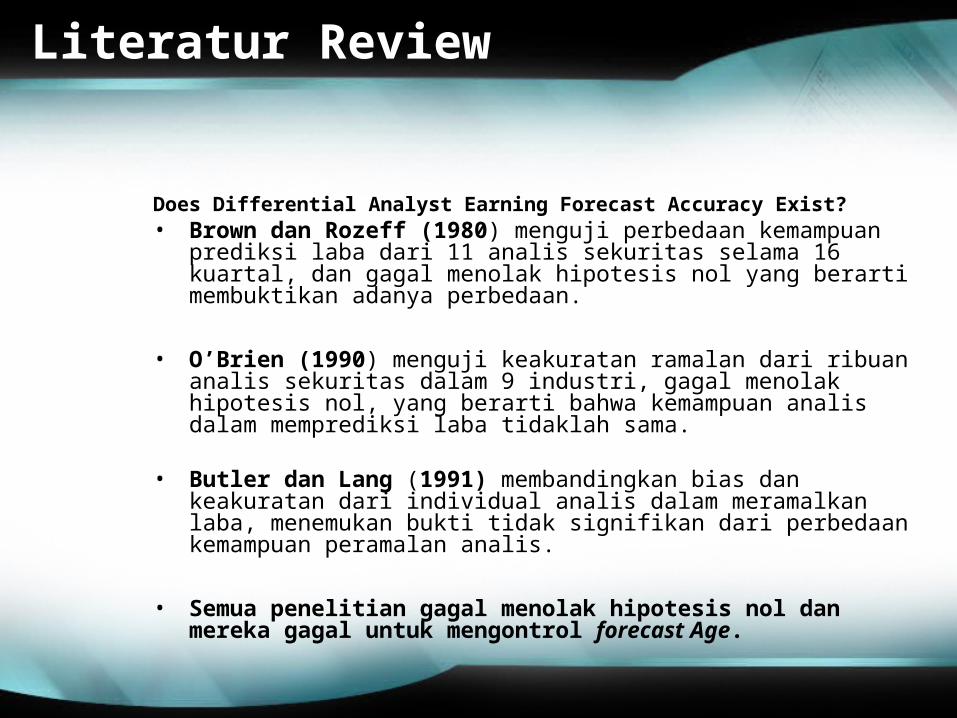
Does Differential Analyst Earning Forecast Accuracy Exist?• Brown dan Rozeff (1980) menguji perbedaan kemampuan prediksi
laba dari 11 analis sekuritas selama 16 kuartal, dan gagal menolak hipotesis nol yang berarti membuktikan adanya perbedaan.
• O’Brien (1990) menguji keakuratan ramalan dari ribuan analis sekuritas dalam 9 industri, gagal menolak hipotesis nol, yang berarti bahwa kemampuan analis dalam memprediksi laba tidaklah sama.
• Butler dan Lang (1991) membandingkan bias dan keakuratan dari individual analis dalam meramalkan laba, menemukan bukti tidak signifikan dari perbedaan kemampuan peramalan analis.
• Semua penelitian gagal menolak hipotesis nol dan mereka gagal untuk mengontrol forecast Age.

Literatur Review
Does Differential Analyst Earning Forecast Accuracy Exist?• Stikel (1992) membuat kontrol yang kuat untuk forecast age, dimana
para analis melakukan eksperimen dan kontrol terhadap perusahaan yang sama dan membuat ramalan laba dalam waktu yang bersamaan.
• Membandingkan keakuratan ramalan dari anggota Institutional Investor All-American Reserch Team dengan analis lainnya, ditemukan bahwa anggota tim lebih akurat dari pada analis lainnya.
• Sinha et al. (1997) menguji keakuratan peramalan dari ribuan analis di 14 industri dengan menggunakan metodologi O’Brien, hasilnya gagal menemukan perbedaan keakuratan peramalan.
• Studi mendokumentasikan perbedaan dalam akurasi peramalan analis.
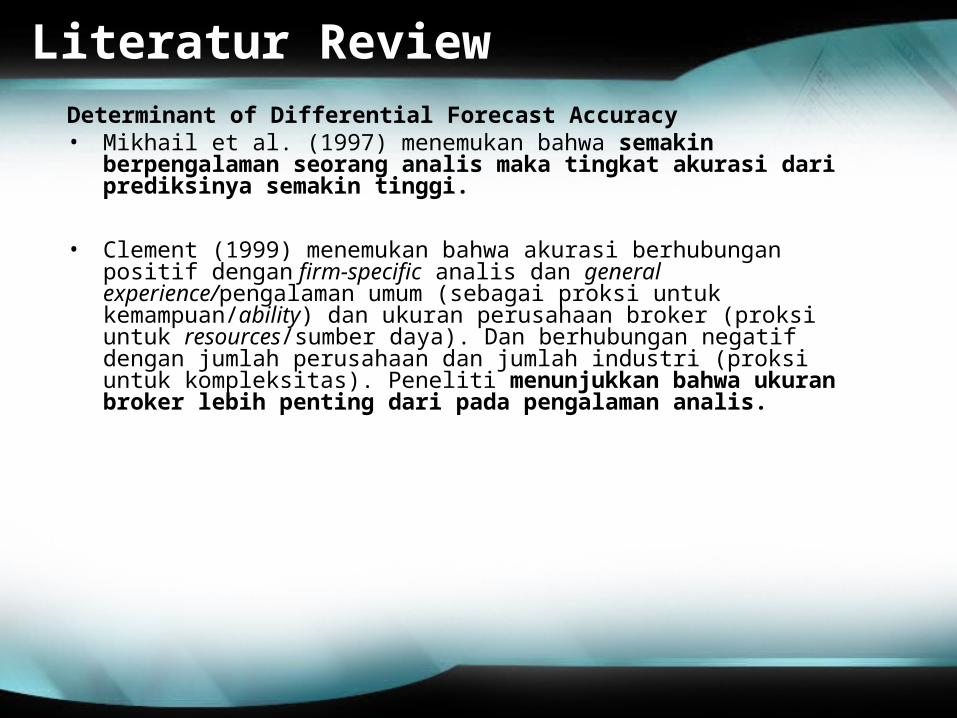
Literatur ReviewDeterminant of Differential Forecast Accuracy• Mikhail et al. (1997) menemukan bahwa semakin berpengalaman seorang
analis maka tingkat akurasi dari prediksinya semakin tinggi.
• Clement (1999) menemukan bahwa akurasi berhubungan positif dengan firm-specific analis dan general experience/pengalaman umum (sebagai proksi untuk kemampuan/ability) dan ukuran perusahaan broker (proksi untuk resources/sumber daya). Dan berhubungan negatif dengan jumlah perusahaan dan jumlah industri (proksi untuk kompleksitas). Peneliti menunjukkan bahwa ukuran broker lebih penting dari pada pengalaman analis.

Literatur ReviewDeterminant of Differential Forecast Accuracy• Jacob et al. (1999) menemukan bahwa kemampuan analis dan karakteristik
broker berpengaruh positif dengan keakuratan prediksi, sementara pengalaman (learning-by-doing) berkorelasi positif dengan keakuratan prediksi hanya jika kemampuan firm-specific analis tidak dikontrol. Setelah membuat kontrol, mereka menegaskan hasil Clement bahwa ukuran broker lebih penting daripada pengalaman, tetapi menunjukkan bahwa frekuensi peramalan lebih penting dari pada ukuran broker.
• Konsisten dengan tiga studi karakteristik analis diatas, penelitian ini menggunakan forecast age sebagai variabel kontrol.

Literatur Review
Evaluating Pedictive Ability• Foster (1977) menyarankan penggunaan dua kriteria dalam menilai
kemampuan prediksi sebuah model: (1) mana yang merupakan prediktor terbaik, (2) model mana yang paling baik menangkap ekspektasi laba
investor. Hasilnya menunjukkan bahwa seasonally differenced first-order autoagressive model adalah model terbaik untuk kriteria pertama dan kedua.
• Fried dan Givoly (1982) serta Brown et al. (1987a, 1987b), menggunakan kriteria Foster untuk mengevaluasi financial analyst vs model prediksi time-series. Ditemukan bahwa prediksi laba tahunan financial analyst lebih akurat dibanding model time-series, dan earnings surprises pada ramalan analis lebih tinggi korelasinya dengan pergerakan harga saham abnormal.

Literatur ReviewEvaluating Pedictive Ability• O’Brien (1988) menunjukkan bahwa meskipun ramalan analis lebih akurat
dari model time-series, earnings surprises yang dikondisikan pada model tersebut menghasilkan korelasi yang tidak lebih tinggi dengan pergerakan harga saham abnormal pada waktu pengumuman laba kuartalan.
• Hopwood dan McKeown (1990) memperoleh hasil yang sama dengan O’Brien (1988) pada saat mereka menguji ramalan kuartalan, memperoleh hasil yang sama dengan Fried dan Givoly serta Brown et al. dengan ramalan tahunan.
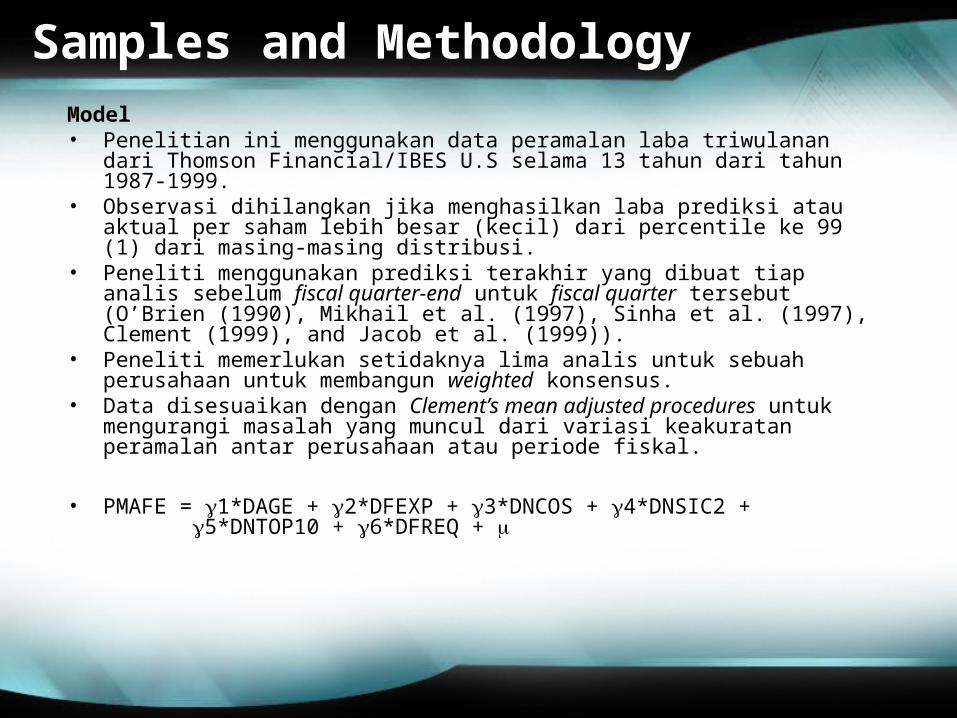
Samples and MethodologyModel• Penelitian ini menggunakan data peramalan laba triwulanan dari Thomson
Financial/IBES U.S selama 13 tahun dari tahun 1987-1999. • Observasi dihilangkan jika menghasilkan laba prediksi atau aktual per saham
lebih besar (kecil) dari percentile ke 99 (1) dari masing-masing distribusi. • Peneliti menggunakan prediksi terakhir yang dibuat tiap analis sebelum fiscal
quarter-end untuk fiscal quarter tersebut (O’Brien (1990), Mikhail et al. (1997), Sinha et al. (1997), Clement (1999), and Jacob et al. (1999)).
• Peneliti memerlukan setidaknya lima analis untuk sebuah perusahaan untuk membangun weighted konsensus.
• Data disesuaikan dengan Clement’s mean adjusted procedures untuk mengurangi masalah yang muncul dari variasi keakuratan peramalan antar perusahaan atau periode fiskal.
• PMAFE = 1*DAGE + 2*DFEXP + 3*DNCOS + 4*DNSIC2 + 5*DNTOP10 + 6*DFREQ +
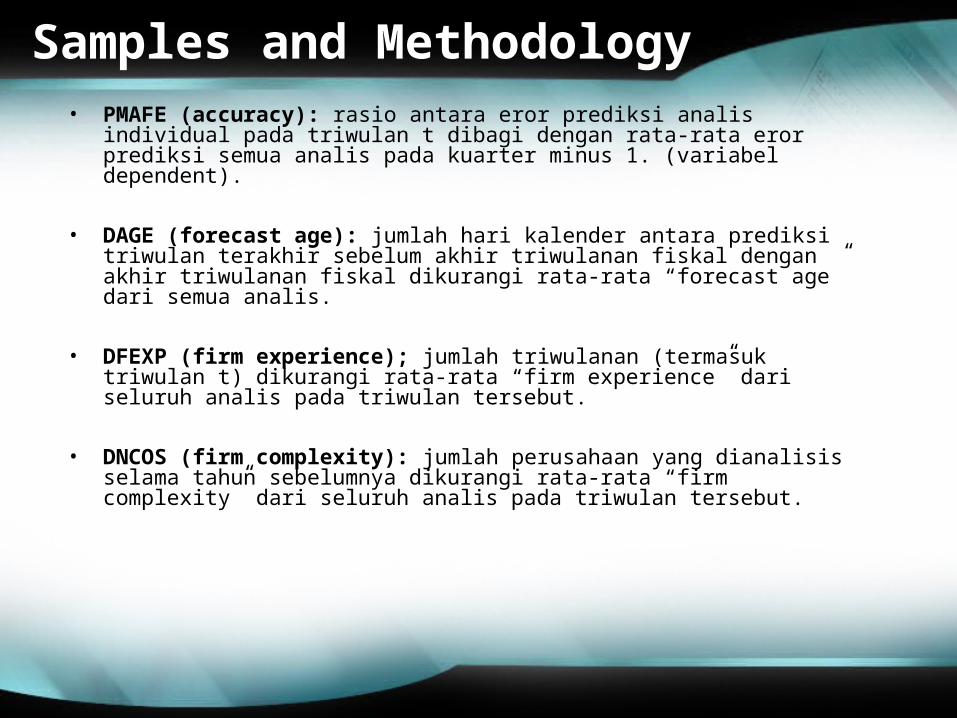
Samples and Methodology• PMAFE (accuracy): rasio antara eror prediksi analis individual pada triwulan t
dibagi dengan rata-rata eror prediksi semua analis pada kuarter minus 1. (variabel dependent).
• DAGE (forecast age): jumlah hari kalender antara prediksi triwulan terakhir sebelum akhir triwulanan fiskal dengan akhir triwulanan fiskal dikurangi rata-rata “forecast age” dari semua analis.
• DFEXP (firm experience); jumlah triwulanan (termasuk triwulan t) dikurangi rata-rata “firm experience” dari seluruh analis pada triwulan tersebut.
• DNCOS (firm complexity): jumlah perusahaan yang dianalisis selama tahun sebelumnya dikurangi rata-rata “firm complexity” dari seluruh analis pada triwulan tersebut.
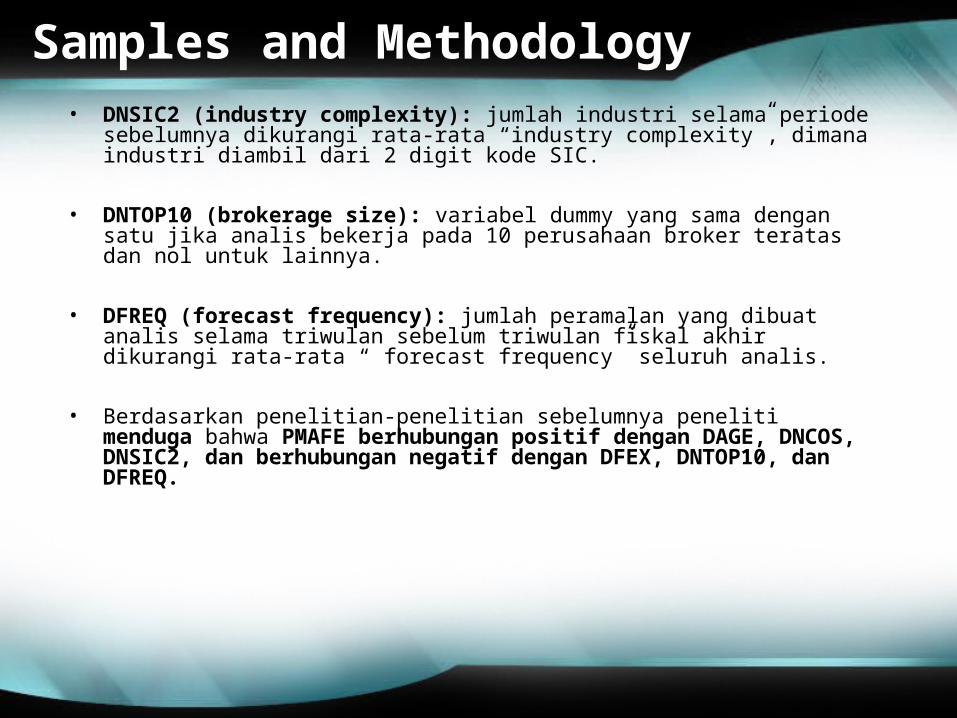
Samples and Methodology• DNSIC2 (industry complexity): jumlah industri selama periode sebelumnya
dikurangi rata-rata “industry complexity”, dimana industri diambil dari 2 digit kode SIC.
• DNTOP10 (brokerage size): variabel dummy yang sama dengan satu jika analis bekerja pada 10 perusahaan broker teratas dan nol untuk lainnya.
• DFREQ (forecast frequency): jumlah peramalan yang dibuat analis selama triwulan sebelum triwulan fiskal akhir dikurangi rata-rata “ forecast frequency” seluruh analis.
• Berdasarkan penelitian-penelitian sebelumnya peneliti menduga bahwa PMAFE berhubungan positif dengan DAGE, DNCOS, DNSIC2, dan berhubungan negatif dengan DFEX, DNTOP10, dan DFREQ.
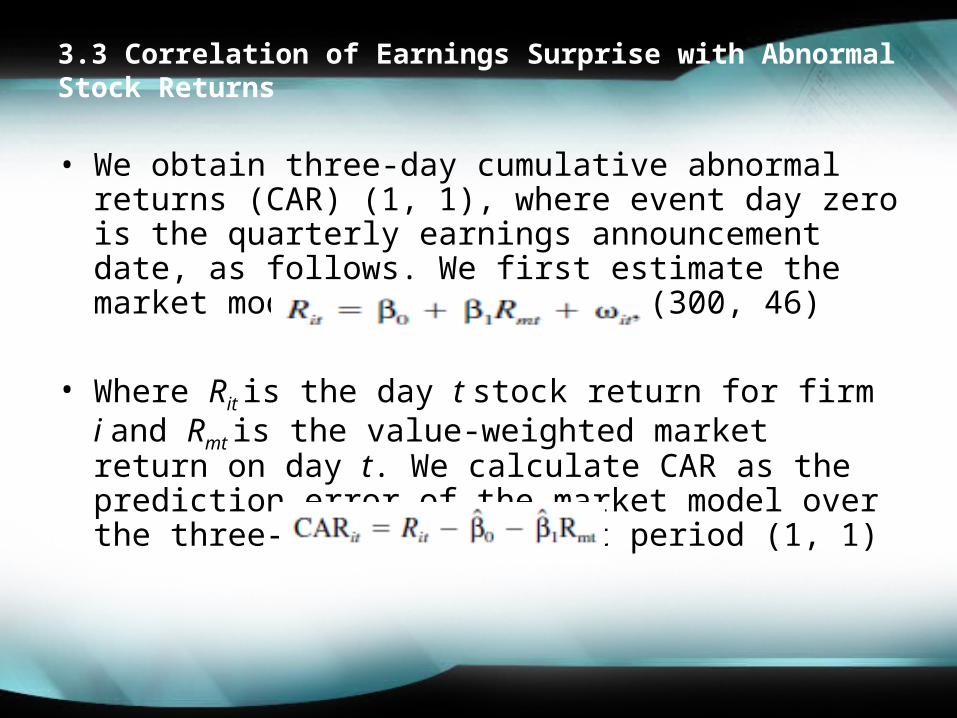
3.3 Correlation of Earnings Surprise with Abnormal Stock Returns
• We obtain three-day cumulative abnormal returns (CAR) (1, 1), where event day zero is the quarterly earnings announcement date, as follows. We first estimate the market model over the period (300, 46)
• Where Rit is the day t stock return for firm i and Rmt is the value-weighted market return on day t. We calculate CAR as the prediction error of the market model over the three-day trading event period (1, 1)
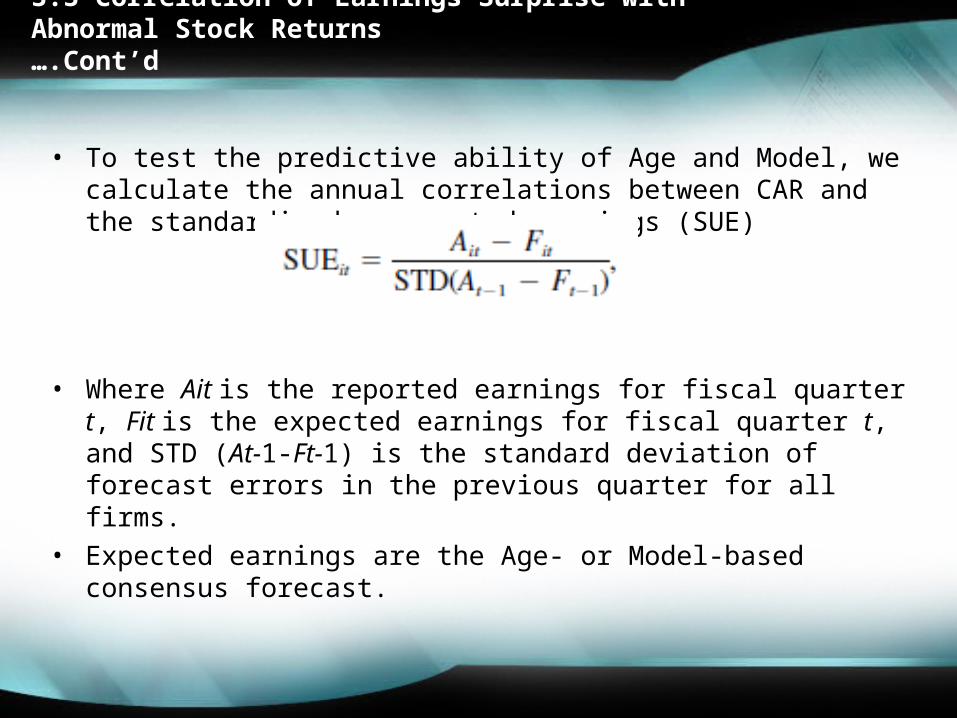
• To test the predictive ability of Age and Model, we calculate the annual correlations between CAR and the standardized unexpected earnings (SUE)
• Where Ait is the reported earnings for fiscal quarter t, Fit is the expected earnings for fiscal quarter t, and STD (At-1-Ft-1) is the standard deviation of forecast errors in the previous quarter for all firms.
• Expected earnings are the Age- or Model-based consensus forecast.
3.3 Correlation of Earnings Surprise with Abnormal Stock Returns ….Cont’d

RESULT

ESTIMATION RESULT
• Sample consists of 172,837 observations. • Panel A of Table 1 contains summary statistics of the dependent
variable, PMAFE, and the six independent variables.• Panel B of Table 1 presents Pearson correlation coefficients between
PMAFE and the six factors.
Summary Statistics and Correlation Coefficient

• The first (third) quartile of PMAFE is 0.464 (0.273), indicating that the analyst at the 25th (75th) percentile of this variable’s distribution makes a quarterly forecast that is 46.4 percent (27.3%) more (less) accurate than average.
• the first (third) quartile of DAGE is 13.692 (13.889), showing that the analyst at the 25th (75th) percentile of the distribution makes a forecast that is 13.692 (13.889) days more (less) recent than average
• Consistent with past research, PMAFE is correlated significantly negatively with DFEXP, DNTOP10, and DFREQ, and significantly positively with DAGE and DNSIC2.
• Unexpectedly, PMAFE is correlated negatively with DNCOS, but the relation is insignificant

Ordinary Least Square Results
• Table 2 presents ordinary least squares (OLS) estimation results for
1. Each of 13 years, 1987–99.
2. A pooled temporal, cross-sectional OLS.
3. An average (mean) of the 13 yearly coefficient estimates.• The expected sign of the coefficient estimate is designated above
each independent variable.
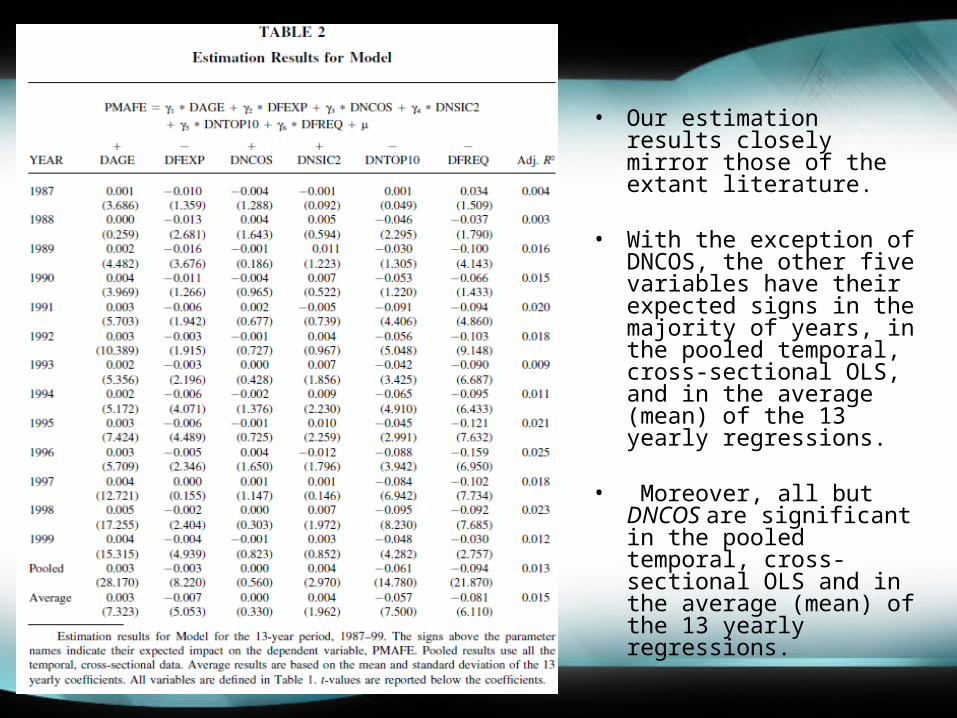
• Our estimation results closely mirror those of the extant literature.
• With the exception of DNCOS, the other five variables have their expected signs in the majority of years, in the pooled temporal, cross-sectional OLS, and in the average (mean) of the 13 yearly regressions.
• Moreover, all but DNCOS are significant in the pooled temporal, cross-sectional OLS and in the average (mean) of the 13 yearly regressions.
ACCURACY RESULTS
• Model applies parameter estimates of the 1994 regression to each analyst using the six factors pertaining to all analysts following all firms at the end of the second fiscal quarter in 1995
• The analysts that Model expects to be successively more accurate get successively higher weights, so the analyst whose estimated PMAFE is smallest (largest) gets the largest (smallest) weight.
• Age assigns a weight of 5/15 to the analyst whose forecast is most recent, 4/15 to the analyst whose forecast is second most recent, . . . , and 1/15 to the analyst whose forecast is fifth most recent (i.e., the most dated)

• Model is more accurate in four years (1994, 1996,1997 and 1998)
• Age is more accurate in six years (1988–1992, 1995); and they are identical to two decimal places in two years (1993 and 1999).
• The average errors of Age and Model of 5.37 and 5.38 cents are insignificantly different from each other (p-value 0.23).

• As a validity check, we compare the predictive accuracy of the single most recent forecast (Most), the mean forecast (Mean), and the single least recent forecast (Least) with Age and Model.
• We do not tabulate these results for simplicity but we summarize them as follow:
1. Most is significantly more accurate than Least (i.e., the average errors are 5.39 and 6.53, respectively, and the p-value of the difference is 0.0048);
2. Model and Age are significantly more accurate than Mean, which has an average error of 5.54 (the p-values of the differences of Model with Mean and Age with Mean are less than 0.0001)
3. Model, Age, and Mean are significantly more accurate than Least (p-values of differences of Model with Least and Age with Least both are less than 0.0001; p-value of the difference of Mean with Least 0.012)
• Consistent with evidence that predictive accuracy is enhanced by aggregating several analyst earnings forecasts and taking their mean rather than relying solely on the single most recent forecast, there are no significant differences between Most and Age, Most and Model, and Most and Mean
ACCURACY RESULTS ………………Cont’d
CORRECTION RESULTS
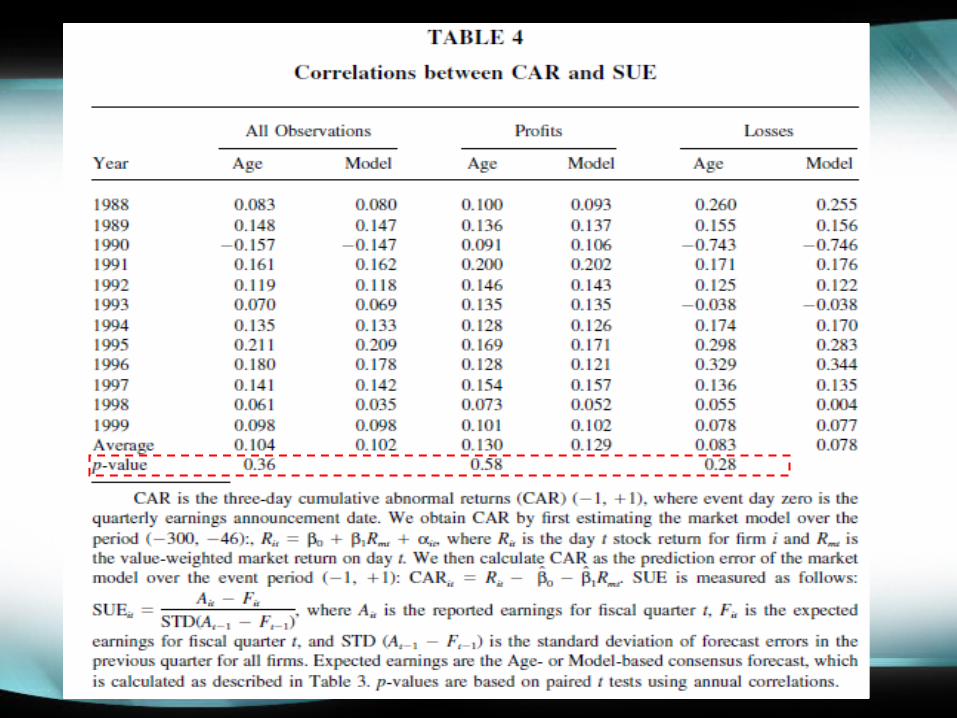
• Table 4 provides the correlation results.• The correlation between the three-day CAR (1, 1)
around the quarterly earnings announcement date and the earnings surprise based on Model is indistinguishable from the correlation based on Age.
• Model has a higher positive correlation than Age in two years (1991 and 1997Age has a higher positive correlation than Model in eight years (1988–1989, 1992– 1996, and 1998); and they are identical to the third decimal place in 1999.
• The average correlations for Age and Model are 0.104 and 0.102, which are insignificantly different from each other (p-value 0.36).

Sensitivity Analysis
Profits Vs Losses is more difficult for to analysis to
predict earnings
Profits Vs Losses is more difficult for to analysis to
predict earnings
Evidence in:• Table 4 model does not generate consensus forecast
that are more representative of market
expectations than does Age when firm report profits or losses
Evidence in:• Table 4 model does not generate consensus forecast
that are more representative of market
expectations than does Age when firm report profits or losses
Evidence in:• Table 3 model does not generate consensus forecast
that are more accurate than Age for firm reporting profits or losses
Evidence in:• Table 3 model does not generate consensus forecast
that are more accurate than Age for firm reporting profits or losses

Nonlinear Weighting SchemesNonlinear Weighting Schemes
Forecast error results for both Age and Model under the convex and
Concave weighting schemes
Forecast error results for both Age and Model under the convex and
Concave weighting schemes
Results: invariant to weighting scheme
Results: invariant to weighting scheme

Cont…Cont…
The correlation between CAR and SUE
The correlation between CAR and SUE
Use of non linear weighting schemes yields
results similar those using a linear
weighting scheme
Use of non linear weighting schemes yields
results similar those using a linear
weighting scheme

Model Track Record Vs Age
• Accuracy and correlation results when Model beat Age
& Age beat Model in the
previous year
• Accuracy and correlation results when Model beat Age
& Age beat Model in the
previous year

Model Differs From Age: Extreme QuartilesModel Differs From Age: Extreme Quartiles
Provides accuracy evidence for extreme quartiles
combined, cases where Model exceeds Age & where Age
exceeds Model
Provides accuracy evidence for extreme quartiles
combined, cases where Model exceeds Age & where Age
exceeds Model
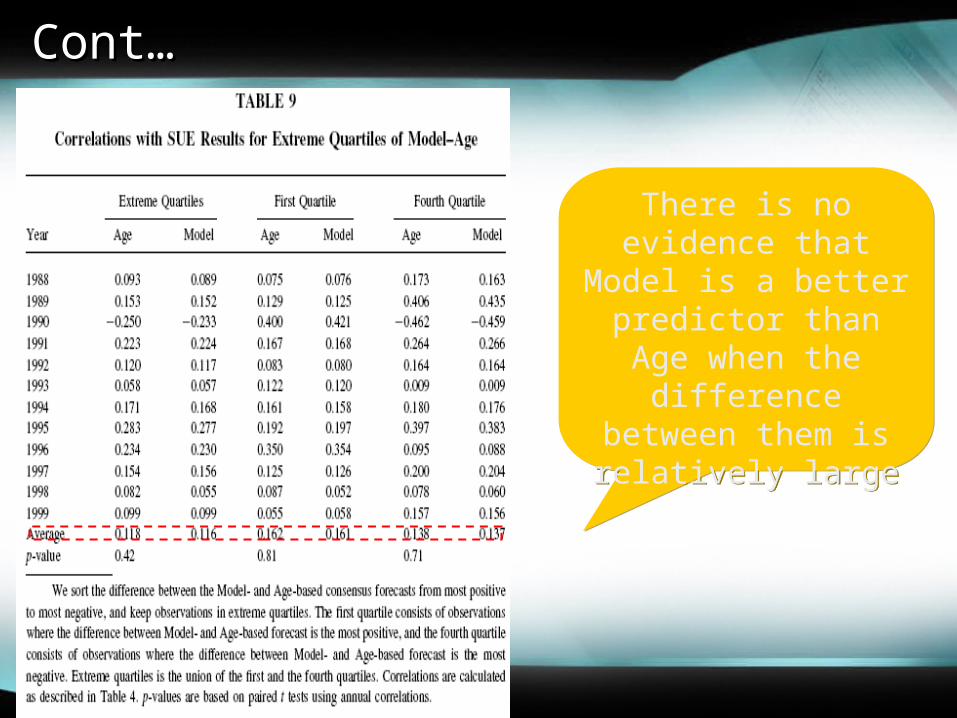
Cont…Cont…
There is no evidence that Model is a better
predictor than Age when the difference between them is relatively large
There is no evidence that Model is a better
predictor than Age when the difference between them is relatively large
SummarySummary
• This paper examining whether or not analyst characteristics have incremental predictive ability vis-a-vis forecast age, the control variable of all these studies, using two types of out-of-sample evidence.
• The findings do not imply that prior research documenting incremental explanatory power of analyst characteristic variables is suspect.
• The results are subject to some caveats. • Focus on short-term earnings forecasts (the next
quarterly number) in spite of the fact that long-term earnings forecasts are more important for the purpose of valuing firms.
• These results may not apply to long term forecasts.