Manajemen Perguruan Tinggi
49
1 Manajemen Pendidikan Tinggi Nizam dan T. Bassaruddin Direktorat Kelembagaan dan Kerja Sama Direktorat Jenderal Pendidikan Tinggi Kementerian Pendidikan dan Kebudayaan Republik Indonesia
-
Upload
truongdung -
Category
Documents
-
view
238 -
download
2
Transcript of Manajemen Perguruan Tinggi

1
Manajemen Pendidikan Tinggi
Nizam dan T. BassaruddinDirektorat Kelembagaan dan Kerja Sama
Direktorat Jenderal Pendidikan TinggiKementerian Pendidikan dan Kebudayaan Republik Indonesia

Peluang dan TantanganPendidikan Tinggi di Indonesia
DIREKTORAT JENDERAL PENDIDIKAN TINGGI
Kementerian Pendidikan dan Kebudayaan
22

Wake up calls
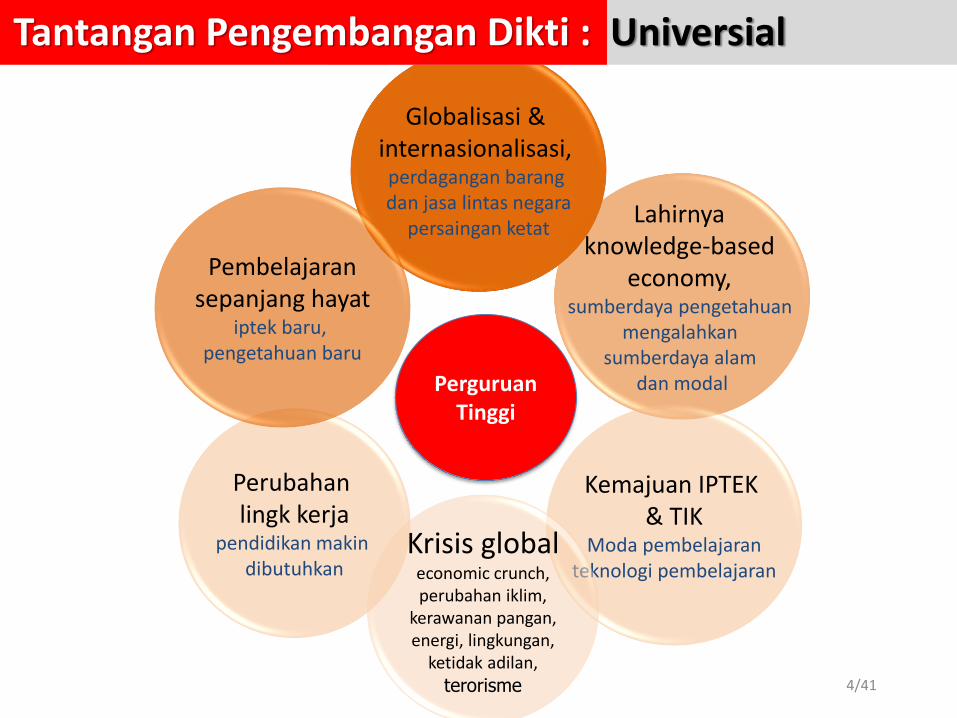
4/41
Globalisasi & internasionalisasi, perdagangan barang dan jasa lintas negara
persaingan ketatLahirnya
knowledge-based economy,
sumberdaya pengetahuanmengalahkan
sumberdaya alamdan modal
Kemajuan IPTEK & TIK
Moda pembelajaranteknologi pembelajaran
Perubahan lingk kerja
pendidikan makindibutuhkan
Pembelajaransepanjang hayat
iptek baru, pengetahuan baru
PerguruanTinggi
Krisis globaleconomic crunch,perubahan iklim,
kerawanan pangan,energi, lingkungan,
ketidak adilan,
terorisme
Tantangan Pengembangan Dikti : Universial
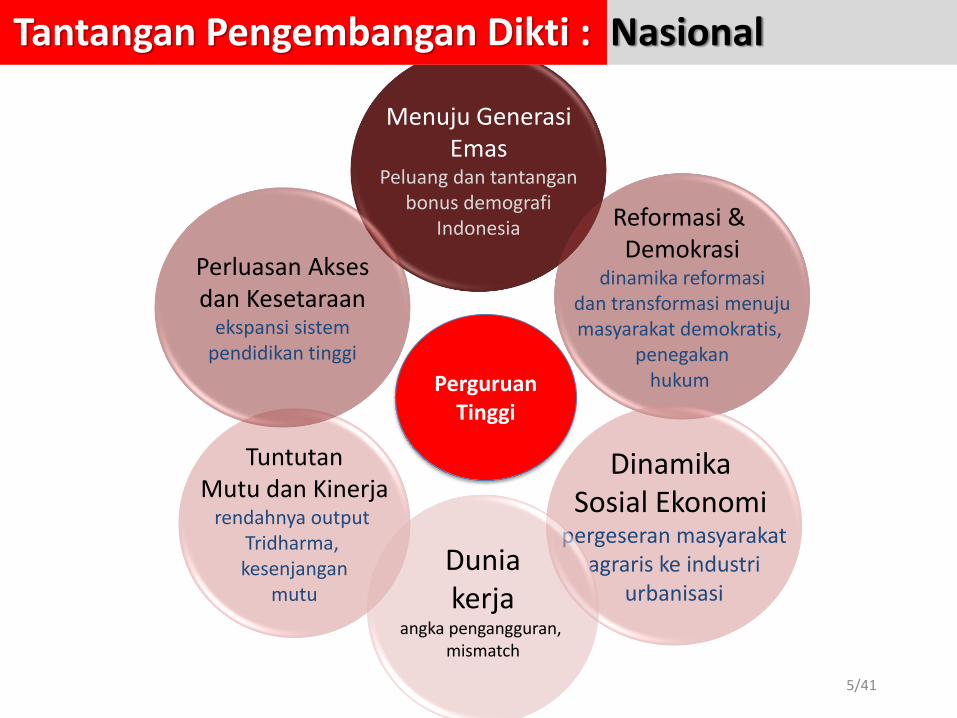
5/41
Menuju GenerasiEmas
Peluang dan tantanganbonus demografi
Indonesia Reformasi & Demokrasi
dinamika reformasidan transformasi menujumasyarakat demokratis,
penegakanhukum
Dinamika Sosial Ekonomi
pergeseran masyarakatagraris ke industri
urbanisasi
TuntutanMutu dan Kinerja
rendahnya output Tridharma, kesenjangan
mutu
Perluasan Aksesdan Kesetaraan
ekspansi sistempendidikan tinggi
PerguruanTinggi
Duniakerja
angka pengangguran, mismatch
Tantangan Pengembangan Dikti : Nasional

Asian Century
30
1.1 Introduction
Just over two decades ago, the Australian Government commissioned a study of Australia and the Northeast Asian ascendancy (Garnaut 1989). Since then, Asia has continued to change at an unprecedented pace and scale. This White Paper looks at the group of nations that stretch from India through Southeast Asia to Northeast Asia, including Indonesia, other Association of Southeast Asian Nations (ASEAN) members, China and Japan.
Asia is a region of great diversity—across ethnic groups, languages, history, institutions and natural endowments. Its transformation into the world’s most dynamic economic region has been a defining development of our time.
Over the past 20 years, one-third of the world’s population has re-engaged with the global economy and more are set to do so (Chart 1.1). Living standards for billions of people in Asia have improved at a rate not previously experienced in human history.
Chart 1.1: Asia’s rising Share of world output
Note: GDP is adjusted for purchasing power parity (2011 prices). See glossary for the definition of country groupings in this chart.
Source: Conference Board (2012).
Between 2000 and 2006, around a million people were lifted out of poverty every week in East Asia alone (Gill & Kharas 2007). Japan, the Republic of Korea (South Korea), Singapore and, more recently, China and India doubled their income per person within a decade. Some went on to repeat this achievement two or three times. To put this into perspective, it took the United Kingdom over 50 years to double its income per person during the epoch-defining Industrial Revolution (Maddison 2010).
This chapter looks at Asia’s success to date and how it has shaped the world.
0
25
50
75
100
0
25
50
75
100
1950 1970 1990 2010
Per centPer cent
Asia North America and Europe Rest of the world

Asia continue to rise
50
2.1 Introduction
Embracing more than half of the globe’s population, the transformation now underway in Asia is happening within compressed time frames (Chart 2.1).
Chart 2.1: Asia’s economic resurgence is set to continue
Note: Bubble area reflects the size of GDP. GDP adjusted for purchasing power parity (2011 prices). See
glossary for definition of Asia and description of Treasury projections. See Appendix A for a description of Asia’s resurgence to date. Sources: Maddison (2010), Conference Board (2012), IMF (2012c) and Treasury projections.
Average living standards are set to improve dramatically and transform the way people live and work. Asia’s economies are projected to expand at a strong rate. The region’s expansion and development will change the contours of Asia and the globe—opening up exciting new opportunities, while also posing some challenges.
2.2 Asia’s rise has further to go
Building on settings that support prosperity, the region is set to continue its rapid growth into the next decade. Asia will change the shape of the global economy. Fast-growing Asian economies will be the engines of world economic growth as their share of global output rises (Chart 2.2).
1820 1870 1913 1950
1970
1990
2010
2025
0
5,000
10,000
15,000
20,000
0
5,000
10,000
15,000
20,000 Income per person US$ Income per person US$

Demographic dividend
32
Asia’s demographic dividend
In the early stages of their take-off, many economies in Asia faced a favourable set of circumstances as large numbers of young people approached working age, boosting the productive capacity of economies.
The region’s ability to capitalise on its favourable demographics has been a key factor underpinning Asia’s stellar income growth over the past four decades.
An East Asian baby boom, which started in Japan in the late 1940s, sparked a series of demographic and social changes that helped shape the region’s economic growth trajectory.
As the large ‘boom’ cohorts reached prime working and saving age (Chart 1.2), the productive capacity of economies such as Japan and South Korea expanded. During this phase—from 1965 to 1990—East Asia’s working-age population grew nearly four times faster than its dependent population (Bloom & Williamson 1997).
Chart 1.2: Asia’s demographic dividend Share of working-age population
Source: UN (2011b).
Demography is not destiny. Indeed, despite having experienced similar demographic transitions, Latin America as a whole was unable to achieve a demographic dividend in the 1960s to the 1990s (Bloom & Canning 2004, cited in Wei & Hao 2012). To take advantage of the favourable window provided by a youthful workforce, East Asian economies invested in physical capital, job training and technological progress. With the benefits of a good education, East Asia’s large numbers of working-age people became a huge productive workforce.
40
50
60
70
80
40
50
60
70
80
1950 1975 2000 2025
Per centPer cent
Australia ChinaJapan MalaysiaThailand
40
50
60
70
80
40
50
60
70
80
1950 1975 2000 2025
Per centPer cent
India Indonesia
Philippines South Korea
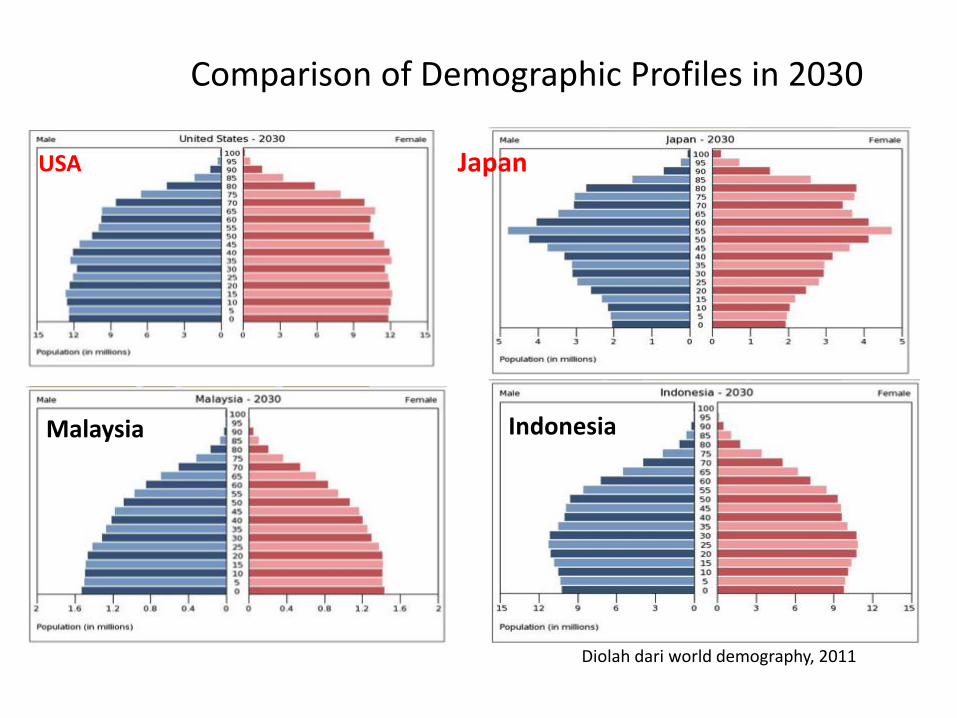
Comparison of Demographic Profiles in 2030
USA Japan
Malaysia Indonesia
Diolah dari world demography, 2011
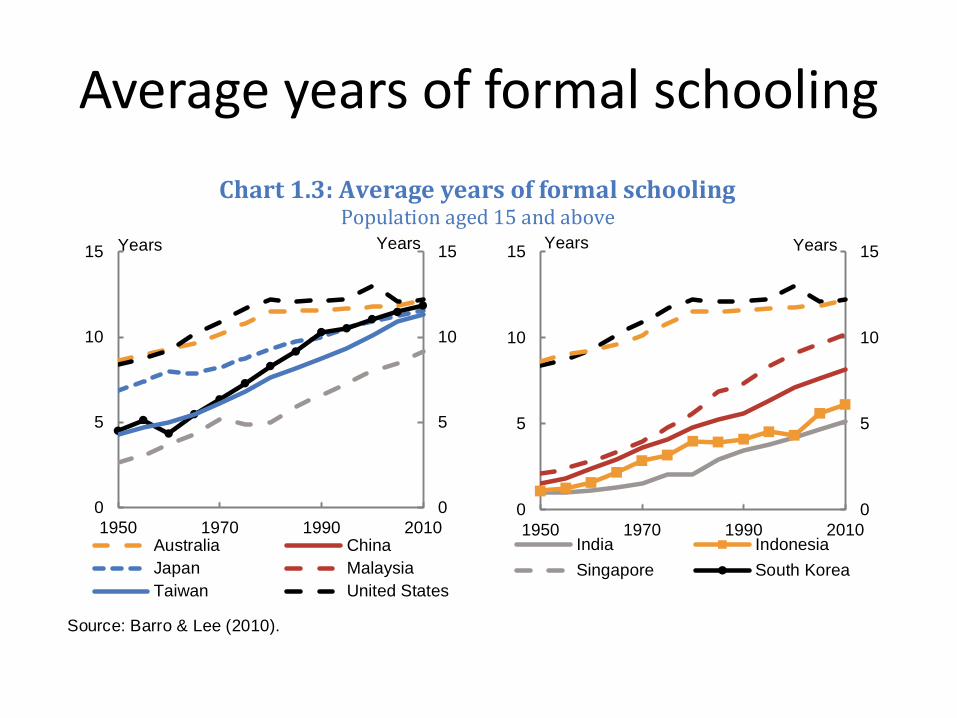
Average years of formal schooling
34
Many countries started investing in their people, building on a strong base. Primary education was compulsory in many East Asian economies and by 1960 was prevalent in China, Hong Kong, Japan, Singapore, South Korea and Taiwan (Tilak 2002). Some who did not start from as strong a base also improved access to primary education sharply—primary school net enrolment rates are currently nearly 90 per cent in the Philippines and are close to universal in Cambodia and Indonesia (World Bank 2012d).
But the most profound changes occurred in secondary and higher education. Average years of formal education were extended across the region, as more people stayed in education for longer (Chart 1.3).
Chart 1.3: Average years of formal schooling Population aged 15 and above
Source: Barro & Lee (2010).
Between 1970 and 2001, secondary school enrolment rates in some of the region’s largest developing countries—Indonesia, Malaysia, Thailand and China—more than doubled (World Bank 2007). Higher education enrolment rates in the region have increased considerably since the 1970s, in countries such as Hong Kong (increased by a factor of 8), Malaysia (increased by a factor of 10) and Thailand (increased by a factor of 16). South Korea is a standout performer, with almost universal post-secondary education (World Bank 2012d).
As participation improved, the focus in many countries shifted to quality. Today, four of the world’s five highest performing education systems are in Hong Kong, Shanghai, Singapore and South Korea (OECD 2010c).
In the more populous developing countries, such as India and Indonesia, efforts to increase access to, and the quality of, education continue. In both these countries, the task is complicated by the diversity and size of their education systems.
India, which has the second-largest education system in the world, has made large strides in improving school enrolment rates and reducing socioeconomic, caste and gender gaps in enrolments at the primary level, but significant challenges remain.
0
5
10
15
0
5
10
15
1950 1970 1990 2010
Years
Australia China
Japan Malaysia
Taiwan United States
Years
0
5
10
15
0
5
10
15
1950 1970 1990 2010
Years
India Indonesia
Singapore South Korea
Years

Output per person
55
Chart 2.6: Output per person Per cent of United States output per person
Note: GDP adjusted for purchasing power parity (2011 prices). Sources: UN (2011b), Conference Board (2012), IMF (2012c), Maddison (2010) and Treasury projections.
With few exceptions, economies in Asia have been rapidly catching up with the productivity levels of more advanced economies. They have introduced markets to allocate resources efficiently, harnessed domestic savings for capital investment, and adopted existing technologies and foreign investment to create productivity growth. A few, of course, have already reached, or are close to, the global technological frontier.
But the fruits of adopting new technology and adapting it will become harder to harvest. A point will come, though it’s still some way off, where the growth of labour productivity in developing Asian economies will slow—opportunities for gains from importing foreign technology and for shifting workers from agriculture to industry will diminish.
High levels of capital investment have been a considerable support for labour productivity growth in the region, but the next phase of such growth will likely draw from a wider set of sources—including investment in skills and education, further urbanisation, capitalising on further opportunities for deeper integration into the global economy and the rapid growth of other emerging economies.
The outlook for Asia is optimistic and it is shifting the global economy
While the shape of the Asian century is not set in stone, there are good reasons to be optimistic. Many nations in the region have only just begun to catch up to the productivity levels enjoyed in advanced economies, promising strong income growth for decades to come. Even if there are economic cycles, as is likely, they will occur around a trend of rising income.
0
20
40
60
80
100
0
20
40
60
80
100
1950 1965 1980 1995 2010 2025
Per centPer cent
China India Indonesia Japan South Korea

Kunci kemajuan: SDM dan IPTEK

1
10
20
30
40
50
58
20: Acceptance of foreign ideas
28: Attitudes toward Globalization
28: Atracting & retaining talents
8: Average working hours: 2100 hrs/yr
27: Brain drain 27: Values System of Society
SEBAGAI INDIVIDU & SEBAGAI KELOMPOK MASYARAKAT(Hasil Survey IMD tahun 2012 dari 59 Negara Terkemuka)
32: Workers motivation 32: Employee training
34: Entrepreneurship 34: Social system sesponsibility
39: Auditing & accounting practices implementation
44: Ethical practices
31: Flexibility & adaptability
31: Corporate value toward employee
33: Emphasis on cus-tomer’s satisfaction
33: Image of Indonesia abroad
36: Values System of Society
41: Competent Senior Manager
41: Adaptability of com-panies to market change
45: Quality of skilled labor 47: Labor relations 47: International
experiences47: Efficiency of large
companies
48: Efficiency of SME’s 52: Productivity of agricultures (PPP)
52: Productivity of Industry (PPP)
58: Labor productivity 58: Overall productivity Indonesia
57: Productivity of Services (PPP)
Peringkat Produktivitas SDM IndonesiaKondisi

GORONTALO14,90
SULSEL14,67
PDB Daerah per Kapita 2010 (juta rupiah)
PAPUA31,57
PAPUA BRT29,62
DKI JKT89,74
KALTIM90,37
KEPRI42,65
RIAU61,88
JATIM20,77BANTEN
16,04
KALSEL16,14
JABAR17,90
D.I.Y.13,19
JATENG13,72
BABEL21,01
SUMUT21,24
NAD17,24
BALI17,14
NTB10,91
NTT5,92
SUMBAR18,00
JAMBI17,40
LAMPUNG14,10
SUMSEL21,18
BENGKULU10,51
KALBAR13,76
MALUT5,19
MALUKU5,27
SULTENG13,99
SULTRA14,90
SULBAR9.48
SULUT16,22
KALTENG9,68
Tiga Tertinggi
KALTIM Rp 90,37 juta USD 10.095
DKI Jakarta Rp 89,74 juta USD 9.996
RIAU Rp 61,88 juta USD 6.913
Tiga Terendah
NTT Rp 5,92 juta
MALUT Rp 5,19 juta
MALUKU Rp 5,27 juta

26.30 27.0934.96
13.9910.94
20.28
46.27 136.61
13.79 17.37 13.07 6.16
1,2173,701
482 243 143 125
6 Koridor dalam tahun 2010
KE SUMATERA
KE JAWA
KE KALIMANTAN
KE SULAWESI
KEBALI - NUSA TENGGARA
KEPAPUA-
MALUKU
Sentra Produksi dan Pengolahan Hasil
Bumi dan Lumbung Energi Nasional
Pendorong Industri dan Jasa Nasional
Pusat Produksi dan Pengolahan Hasil
Tambang dan Lumbung Energi
Nasional
Pusat Produksi dan Pengolahan Hasil
Pertanian, Perkebunan,
Perikanan, Migas dan Pertambangan
Nasional
Pintu GerbangPariwisata dan
Pendukung Pangan Nasional
Pusat Pengembangan
Pangan, Perikanan, Energi dan
Pertambangan NasionaL
PDB2010
(RpTriliun)
Penduduk2010
(Jutajiwa)
PDB/Kapita2010
(RpJuta)
Contoh 1 Penggalian Nilai Tambah: KAKAO
Standar penyerap
an
Ke-butuhan
Ke-cocokan
rasa
Ke-cocokan bahan baku
Keekonomian
Iklim dan energi
tersedia
Infra struktur
SDM &tradisi
berkebun masyara
kat
Karakter lahan &
iklim
Perda-gangan
Trans-portasi
Con-sumer goods
Pengo-lahan Coklat Kon-
sumsi
Bahan baku utama
Trans-portasi
Budi DayaSultra
EKSPOR EKSPORBibit
Sultra
• Keanekaragaman tanah, posisi, hasilkan keberagaman buah & biji
• Iklim tropika basah hasilkan panen yang tidak seragam sepanjang tahun
• Ketergantungan waktu pada alam
• Perlu pasokan bahan baku yang seragam (kering, ukuran, berat, rasa)
• Perlu pasokan secara rutin dan berkelanjutan
• Perlu ketepatan waktu cukup umur agar tepat kandungannya
Pertanian Tradisionil Industri Pengolahan
Gap yang perlu diatasi melalui
inovasi teknologi
Pengolahan Cacao Powder
& Butter
Outlet Kreatif
Industri Kecil
Panen
Penyim-panan
Penge-ringan
Fermen-tasi
INOVASI NILAI TAMBAH
Rp 15.000 –Rp 25.000/kg
Rp 20.000 –Rp 30.000/kg

Contoh 2 Penggalian Nilai Tambah:BATUBARA
Menjadi Ideal Finished ProductAR Calorie >6000 kcal/kgTM < 10%
INOVASI NILAI
TAMBAH
Menjadi Ideal Finished ProductAR Calorie >5300 kcal/kgTM < 15%
Low rank coal (lignite):ROMAR Calorie 2200 - 3700 kcal/kg TM 40-60%
Medium rank coal (sub-bituminous)ROMAR Calorie 4100-5300 kcal/kgTM < 30%
+25%
+75%Kualitas Medium& Rendah
Kualitas Tinggi
BatubaraIndonesia
US$ 30-40/ton
US$ 60-90/ton
Coal Upgrading Meningkatkan kualitasdengan biaya + US$ 12/ton
US$ 60-90/ton
262 juta ton di 2010, menjadi >500 juta ton di 2025
KebutuhanInternasional
&Nasional

194,2 1.336,3 1.186,2 225,7 48,4 27,0 64,3 88,5
Brazil China India Indonesia Korea Malaysia Thailand Vietnam
593,000
7,657,000
4,010,000
603,0001,225,000
90,000 265,000
SDM Populasi Sarjana Teknik
3,0535,730
3,380 2,671
25,309
3,333 4,121
Population, 2008 (mio)
Populasi ST
ST/1 juta
penduduk
Dari berbagai sumber, dari tahun 2004 2007
2025:7.500?
USA: 1.571.900 ST
(2008)= 5.174 ST/1
juta penduduk
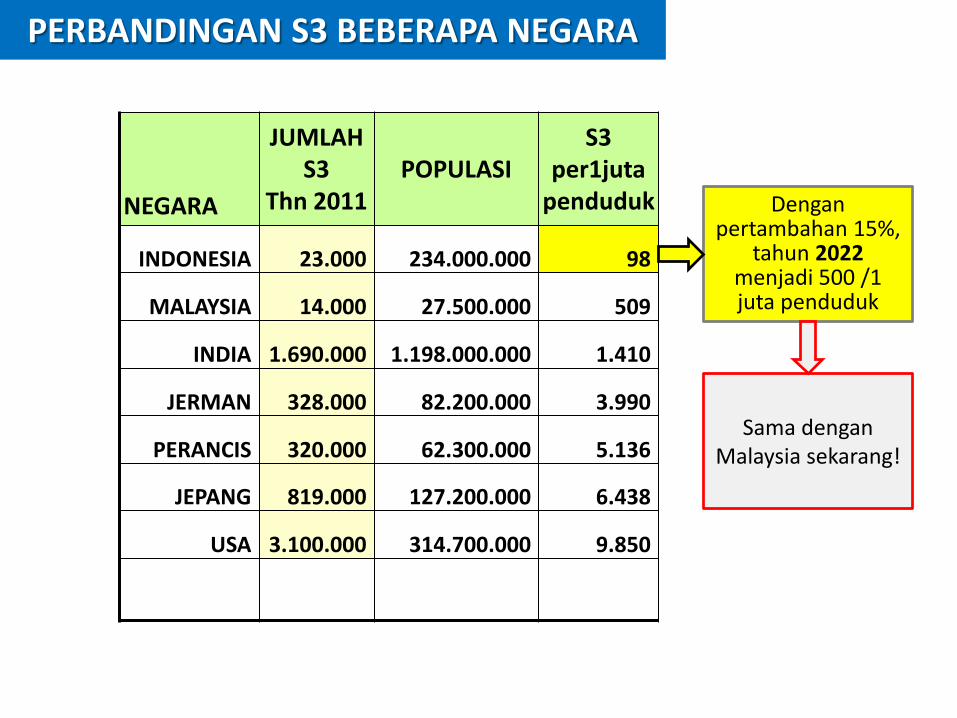
PERBANDINGAN S3 BEBERAPA NEGARA
NEGARA
JUMLAH S3
Thn 2011POPULASI
S3 per1juta
penduduk
INDONESIA 23.000 234.000.000 98
MALAYSIA 14.000 27.500.000 509
INDIA 1.690.000 1.198.000.000 1.410
JERMAN 328.000 82.200.000 3.990
PERANCIS 320.000 62.300.000 5.136
JEPANG 819.000 127.200.000 6.438
USA 3.100.000 314.700.000 9.850
Dengan pertambahan 15%,
tahun 2022 menjadi 500 /1 juta penduduk
Sama dengan Malaysia sekarang!

S3 TSP Bila Pertambahan 15%/ Tahun
2011 2012 2013 2014 2015 2016 2017 2018 2019 2020 2021 2022 2023 2024 2025
14 15 15 16 17 17 18 19 20 21 22 2324
2526
3 4 4 5 5 6 78 9
1112
1416
1820
% S3 TSP(15%)/ S3 Total (10%)
S3 TSP per 1 juta penduduk
Pertumbuhan perbandingan S3 TSP / Total:
25%di 2024
Penambahan
20 S3 TSP/1 juta pop
/tahundi 2025
Perbandingan
Negara(2008)
Perbandingan
S3 TSP/S3 Total
Penambahan
S3 TSP/1 juta pop
Australia 39 % 95USA 36 % 65Korea Selatan 33 % 60Jepang 40 % 45China 60 % 28Indonesia 25 % 2
3.220 S3-TSP 22.587 S3-TSP
%

Reformasi Melalui Kepemimpinandan Manajemen Pendidikan Tinggi
DIREKTORAT JENDERAL PENDIDIKAN TINGGI
Kementerian Pendidikan dan Kebudayaan
2121

22
Kedaulatan Teknologimelalui Inovasi
Kedaulatan Industri danEkonomi
melalui SDM Unggul
Daya saing Industridan Ekonomimelalui SDM
Terampil
Pengembangan SDM & IPTEKSKEMA
• Pengembangan 10-20 PT Riset dan PusatPenelitian secara NasionalPT
Riset
• Satu PT & 2 Politeknik Unggul di tiapProvinsi (100 Politeknik baru)
PTPendidikan
danPoliteknik
• Satu Akademi Komunitas di tiapKab/Kota (521 AkademiKomunitas)
AkademiKomunitasutk Tenaga
Terampil Setempat
• Perbaikan rasio SMK:SMA, penguatan mutu danrelevansi SMK
Sekolah MenengahKejuruan
• Peningkatan mutu, penguatan relevansi, dan sertifikasilembaga kursus
Kursus/Pendidikan Non Formal utk Meningkatkan
Kompetensi Naker Setempat

SYARAT SUKSES
http://blog.readytomanage.com/wp-content/uploads/2012/07/leadership-management-cartoon.jpg
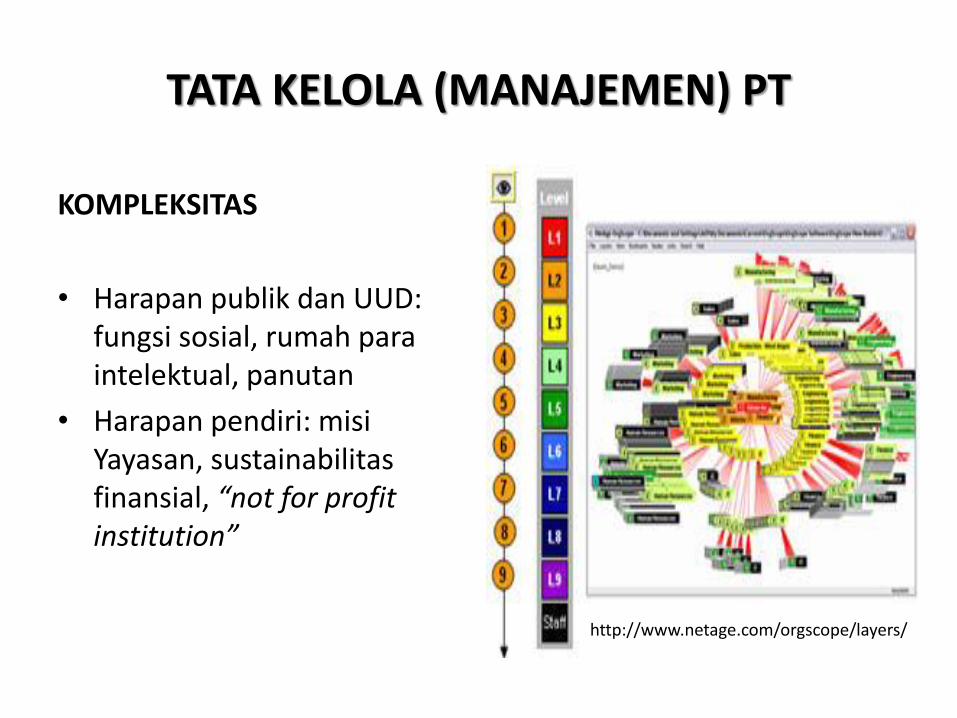
TATA KELOLA (MANAJEMEN) PT
KOMPLEKSITAS
• Harapan publik dan UUD: fungsi sosial, rumah paraintelektual, panutan
• Harapan pendiri: misiYayasan, sustainabilitasfinansial, “not for profit institution”
http://www.netage.com/orgscope/layers/
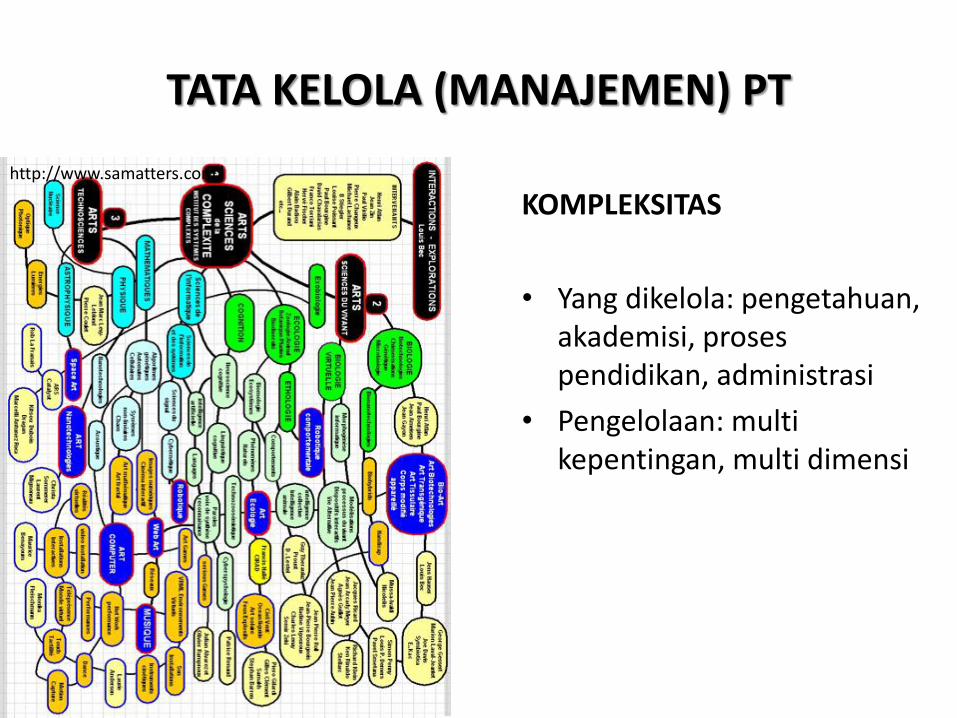
TATA KELOLA (MANAJEMEN) PT
KOMPLEKSITAS
• Yang dikelola: pengetahuan, akademisi, prosespendidikan, administrasi
• Pengelolaan: multi kepentingan, multi dimensi
http://www.samatters.com/

• Prinsip: antara kolegial, birokratik, korporatik, entrepreneurial
• Pimpinan PT sebagaiacademic leader daninstitutional leader
TATA KELOLA (MANAJEMEN) PT
KOMPLEKSITAS
http://stephenskolas.blogspot.com/p/program.html

McNay (1995; 1998)
Control of practice
Control of policy
loose
loose
tight
tight
Budaya Perguruan Tinggi
BureaucraticCollegial
Entrepre-neurial
Corporate

Budaya Collegial
• Kepemimpinan didasarkan pada kepercayaan masyarakat akademis
• Penekanan pada otonomi institusi dan kebebasan akademik
• aspek di luar akademis dipandang sebagai faktor eksternal
• Cocok untuk organisasi kecil
• Budaya “pribadi”
• Contoh: banyak PTN “tua” di Indonesia, Oxbridge

Budaya Birokratis
• Penekanan pada prosedur, peraturan dan kendali organisasi
• Pengambila keputusan terpusat, lamban, keputusan didasarkan pada komisi, panitia, pokja, dsb.
• Pengaruh external besar melalui jalur administrasi (pemerintah, yayasan)
• Berfungsi baik pada kondisi stabil, efisiensi rendah
• Budaya ‘model’
• Banyak PTN dan PTS kita, University of London,

Budaya Entrepreneurial
• Kekuasaan terpusat tapi didelegasikan
• Pimpinan mempunyai kebebasan menjalankan organisasi tapi kinerjanya dimonitor ketat
• Pengguna/pasar menjadi faktor eksternal yang dominan
• Budaya “tugas”
• Beberapa BHMN kita (?), University of Phoenix

Budaya Korporasi
• Kekuasaan terpusat, rektor sebagai “chief executive”
• Jejaring kekuasan, pimpinan di”select” bukan di”elect”, mencari professional
• Input external masuk melalui jalur management
• Resiko lemahnya kendali pada eksekutif
• Budaya “kekuasaan”
• Binus (?) South Bank University?

Rektor sebagai Academic Leader
• Membawa Institusi PT menjadi pilar peradaban bangsa
• Facilitating
• Empowering
• Enabling
• Harmonising/synchronising

Rector sebagai institutional leader
• Budaya mutu
• Good university governance
– Transparency
– Accountability
– Efficient & effectivity
• Mengelola sumber daya (man, money, machine, method) secara efektif dan efisien
• Menggalang sumber daya dan dukungan
• PT wajib dikelola dengan prinsip good governance
• Management PT menjadi fungsi penting dalam peningkatan mutu akademik
• Dasar pengelolaan:
Perubahan peraturan dan perundangan (setelah UU No 12/2012)
– PP No 4 Tahun 2014
– Termasuk penekanan pada penjaminan mutu internal
• Mengurangi resiko kesalahan pengelolaan
TATA KELOLA (MANAJEMEN) PT

LINGKUP TATA KELOLA PT
Planning
Management
By Bureau
of Planning
Academic
Human Resources
Financial
Rev. gen
Asset
Procurement
Security
IT
Managements
Monitoring &
Evaluation
Management
by SPI & SPM
PLAN
ACTION
DO
CHECK

• Manajemen area fungsional– Manajemen program
akademik (tri-dharma)– Manajemen sumber daya
• Keuangan (SDU)• Dosen dan Karyawan (SDM)• Sarana dan prasarana (SDF)
• Manajemen Data/Informasi – Termasuk Knowledge
Management System
• Manajemen Mutu – Khususnya Sistem Penjaminan
Mutu Internal
LINGKUP TATA KELOLA PT
http://www.resultsresults.co.uk/

Kaitan dengan Topik GUG
• Tiga level issues– Governance: menyangkut kebijakan tentang arah dan
pengembangan institusi– Management: kebijakan detil dan pengendalian atas
pengelolaan institusi PDCA– Administration: pelaksanaan kebijakan dan putusan yang telah
ditetapkan
• Pembagian kewenangan antara PT dan Badan Penyelenggara– Diatur di statuta– Prinsip: kejelasan kewenangan (tidak tumpang tindih)
• Peran dan fungsi struktur di setiap lini organisasi PT• Pro-kon tentang sentralisasi vs desentralisasi
– Tergantung budaya organisasi

OTONOMI DAN AKUNTABILITAS
Direktorat Kelembagaan dan Kerjasama Ditjen Dikti Kemdikbud - Page 38
• Otonomi merupakan kodrat perguruan tinggi;• Otonomi dilaksanakan berdasarkan prinsip good university governance;• Akuntabilitas salah satu yang terpenting; tanpa akuntabilitas, otonomi
menjadi anarki.
Manajemen Area Fungsional – Program Akademik
• Manajemen Program Studi, meliputi:
– Kurikulum
• Pengembangan, review
– Siklus proses pendidikan
• Rekruitmen mhs, perencanaan studi, evaluasi kemajuan, yudisium, kelulusan, wisuda
– Proses PBM
• Kalender akademik, penawaran mata kuliah, penjadwalan kuliah, evaluasi perkuliahan
• Kegiatan lab/studio/lapangan
– Bimbingan

Manajemen Area Fungsional – Program Akademik
• Kemahasiswaan– Konseling, Pengembangan diri mahasiswa, Tracer Study,
Beasiswa
• Manajemen program penelitian dan pengabdian masyarakat– Pengembangan kapasitas institusi; manajemen HAKI;
Prinsip Triple Helix
• Prinsip– Merit akademik, transparansi, keadilan (fairness, equity),
akuntabilitas
• Kelembagaan– Bidang akademik dan kemahasiswaan
Manajemen Sumber Daya

Manajemen Sumber Daya
• Manajemen Keuangan– Perencanaan dan penganggaran– Sistem akuntansi, pelaporan dan audit– Penggalangan & pengelolaan dana
• Unit usaha (komersial, akademik, pendukung)
• Tatakelola keuangan– Proses penetapan dan perubahan
anggaran– Pertanggungjawaban – Kewenangan (Badan Penyelenggara
dan Eksekutif)
• Prinsip– Akuntabilitas, efisiensi
http://ks-beskid.at.ua/

Manajemen Sumber DayaManusia
• Dosen dan Karyawan
– Siklus sistem pengelolaan SDM• Recruitment, penugasan, promosi/demosi, purnabakti
– Remunerasi, sistem benefits• SDM adalah asset utama institusi
– Professional development (PD)• Re-training, mengikuti perkembangan
http://www.technologyreview360.com/
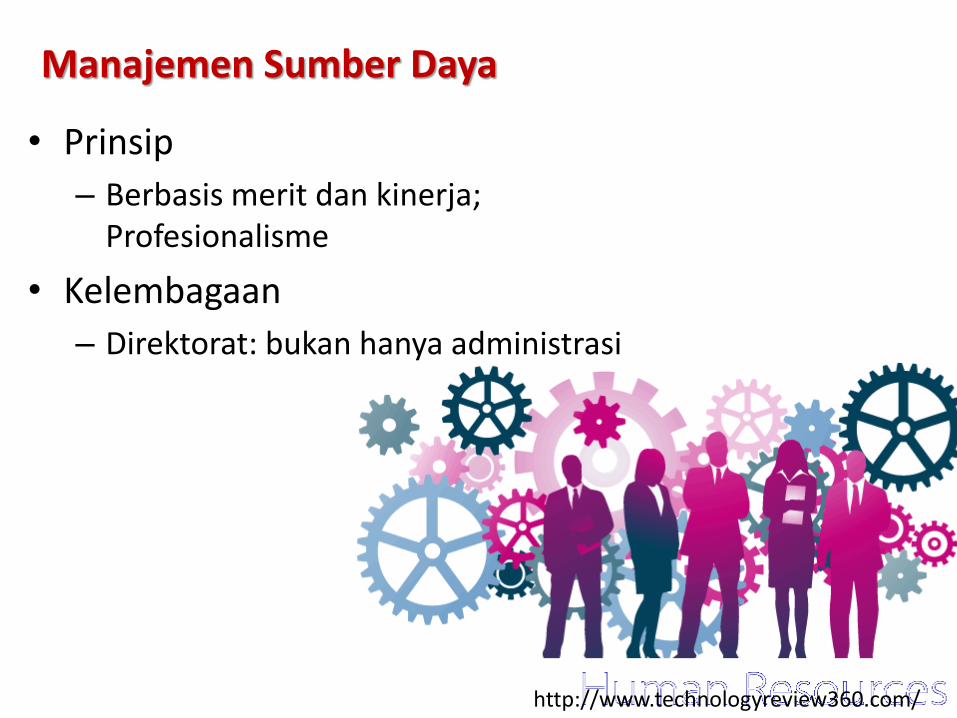
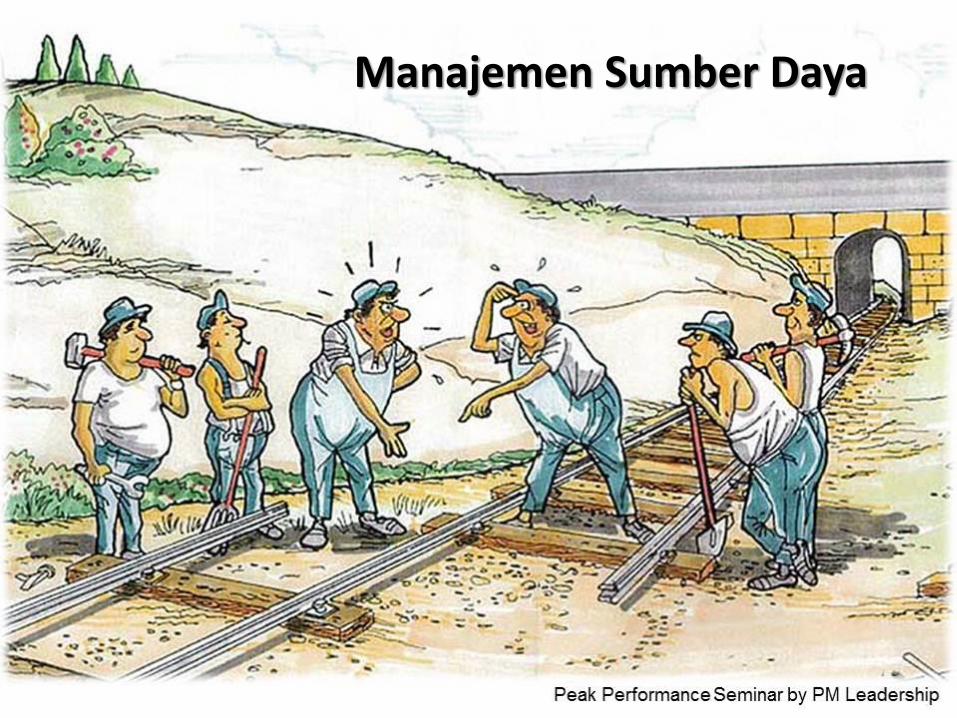
Manajemen Sumber Daya
• Prinsip
– Berbasis merit dan kinerja; Profesionalisme
• Kelembagaan
– Direktorat: bukan hanya administrasi
http://www.technologyreview360.com/
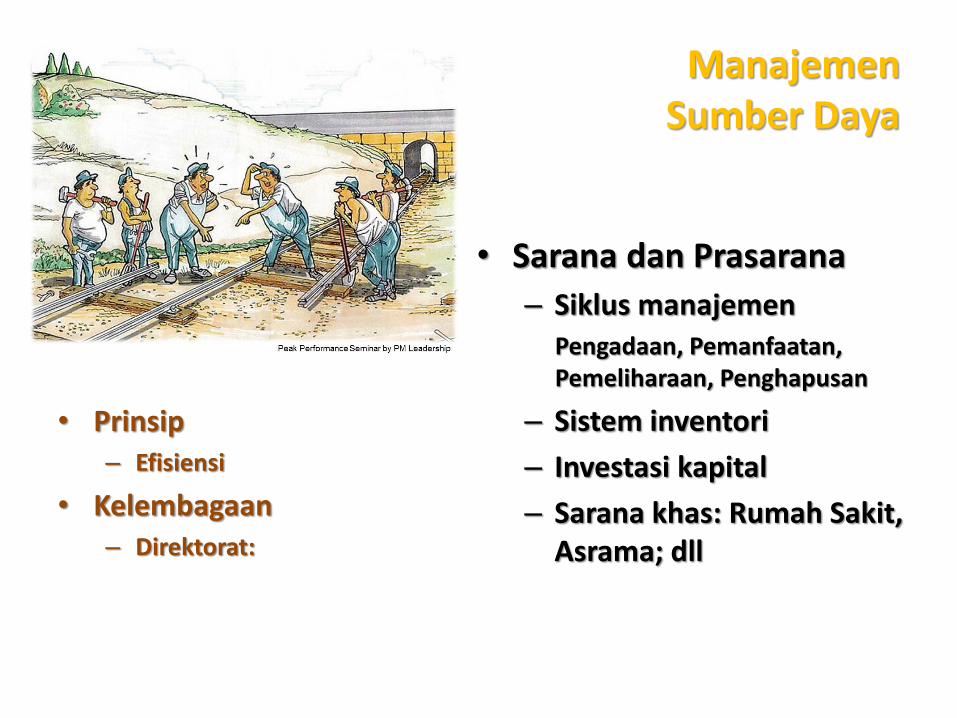
Manajemen Sumber Daya
• Prinsip– Efisiensi
• Kelembagaan– Direktorat:
• Sarana dan Prasarana
– Siklus manajemenPengadaan, Pemanfaatan, Pemeliharaan, Penghapusan
– Sistem inventori
– Investasi kapital
– Sarana khas: Rumah Sakit, Asrama; dll
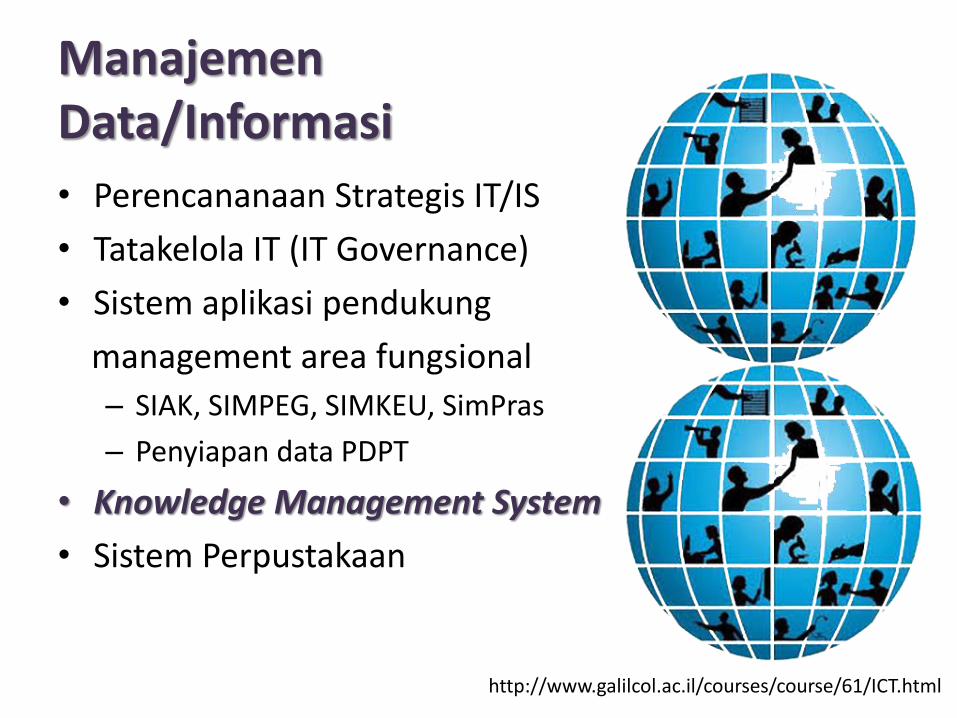
ManajemenData/Informasi
• Perencananaan Strategis IT/IS
• Tatakelola IT (IT Governance)
• Sistem aplikasi pendukung
management area fungsional
– SIAK, SIMPEG, SIMKEU, SimPras
– Penyiapan data PDPT
• Knowledge Management System
• Sistem Perpustakaan
http://www.galilcol.ac.il/courses/course/61/ICT.html

Manajemen Mutu
• Kebijakan mutu (quality policy)
• Kelembagaan SPMI
• Manual mutu
• Standard
• Audit mutu
• Personalia
• Peningkatan mutu berkelanjutan

Penutup
Mutu manajemen PT sangat penting dalam mendorong mutu akademik
Dikelola secara dan oleh professional
Perguruan tinggi harus akuntabel pada stakeholders (internal dan external)
Akuntabilitas publik adalah suatu keharusan
Penegakan prinsip good university governance
Perlu melibatkan professional
Khususnya administrator dan manager

Kemajuan Pendidikan TinggiKunci Kemajuan Bangsa
Kemajuan Pendidikan Tinggidimulai dari dalam institusi
Terima Kasih