dari spektrum frekuensi ini harus benar -benar terkendali ...

Copyright © 2003 Pearson Education, Inc., Modified Slide 1-1
M najemen Keuangan
Disarikan dari Daftar Pustaka / Bacaan : • S. Munawir ; Analisa Laporan Keuangan , Yogyakarta • Bambang Riyanto ; Dasar-Dasar Pembelanjaan Perusahaan , BPFE • J. Fred Weston & Thomas E.Copeland ; Majemen Keuangan • Jemes O.Gill ; Dasar-Dasar Analisis Keuangan , PPm, 2002 • Suad Husnah , Suwarsono ; Studi Kelayakan Proyek , UPP AMP
YKPN, 1994. • Lawence J. Gitman, Principles of Managerial Finance, Sixth Edition,
New York, Harper Collins Publisher
Copyright © 2003 Pearson Education, Inc., Modified Slide 1-2
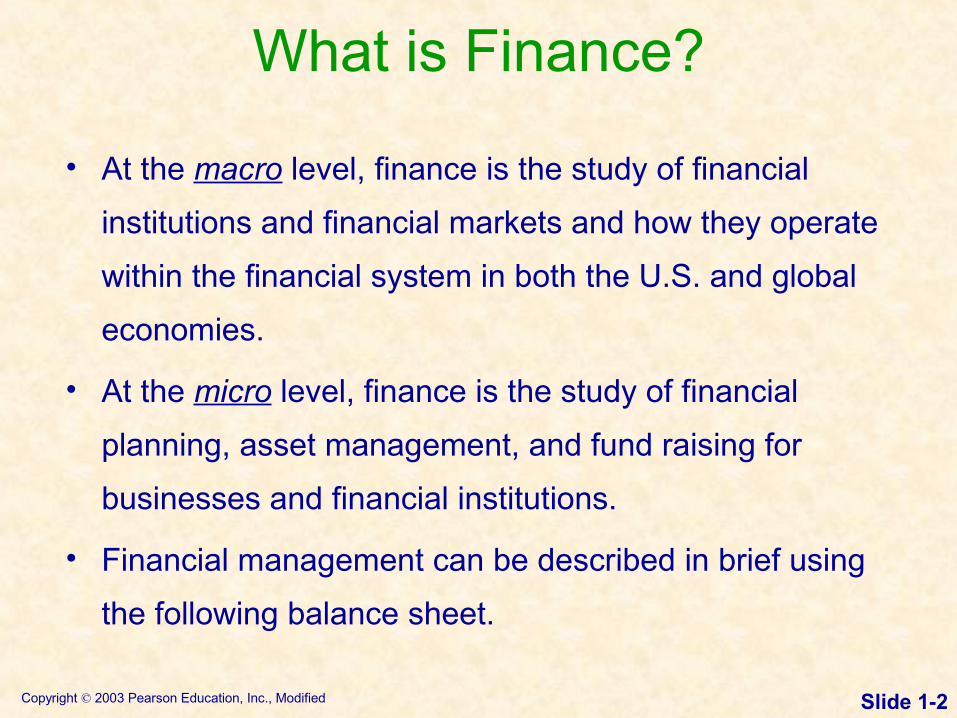
What is Finance?
• At the macro level, finance is the study of financial
institutions and financial markets and how they operate
within the financial system in both the U.S. and global
economies.
• At the micro level, finance is the study of financial
planning, asset management, and fund raising for
businesses and financial institutions.
• Financial management can be described in brief using
the following balance sheet.

Copyright © 2003 Pearson Education, Inc., Modified Slide 1-3
Investment Decisions
• What is the optimal firm size?• What specific assets should be
acquired?• What assets (if any) should be reduced
or eliminated?
Most important of the three Most important of the three decisions.decisions.

Copyright © 2003 Pearson Education, Inc., Modified Slide 1-4
Financing Decisions
• What is the best type of financing? • What is the best financing mix?• What is the best dividend policy?• How will the funds be physically acquired?
Determine how the assetsDetermine how the assets

Copyright © 2003 Pearson Education, Inc., Modified Slide 1-5
Asset Management Decisions
• How do we manage existing assets efficiently?• Financial Manager has varying degrees of
operating responsibility over assets.• Greater emphasis on current asset
management than fixed asset management.
Copyright © 2003 Pearson Education, Inc., Modified Slide 1-6
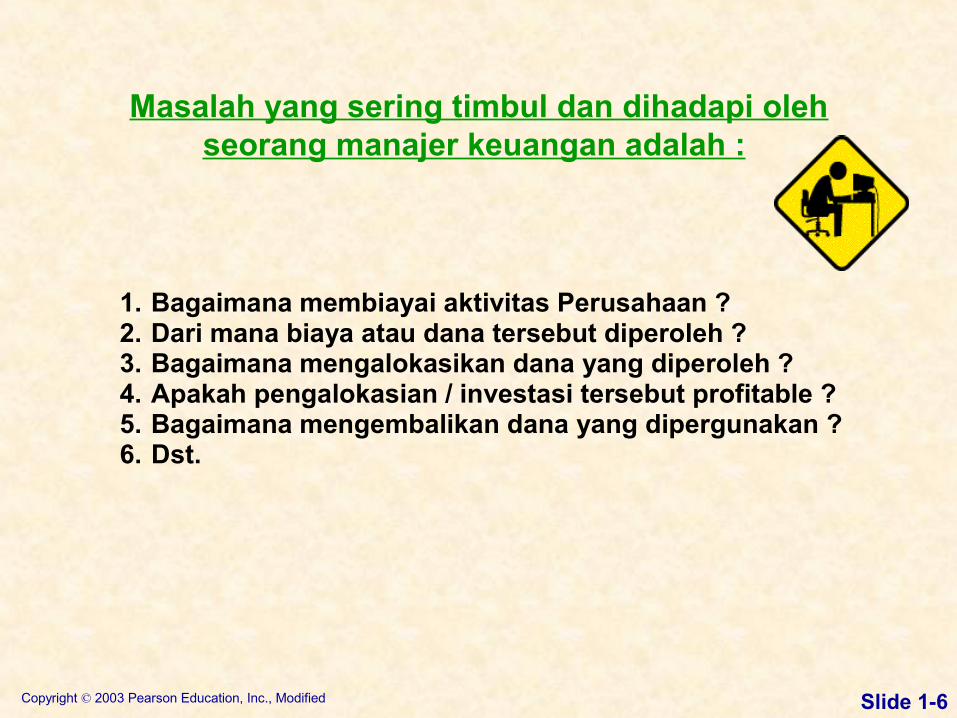
Masalah yang sering timbul dan dihadapi oleh seorang manajer keuangan adalah :
1. Bagaimana membiayai aktivitas Perusahaan ? 2. Dari mana biaya atau dana tersebut diperoleh ? 3. Bagaimana mengalokasikan dana yang diperoleh ? 4. Apakah pengalokasian / investasi tersebut profitable ? 5. Bagaimana mengembalikan dana yang dipergunakan ? 6. Dst.

Copyright © 2003 Pearson Education, Inc., Modified Slide 1-7
Career Opportunities

Copyright © 2003 Pearson Education, Inc., Modified Slide 1-8
Role of Finance in a Typical Business Organization
Board of Directors
President
VP: Sales VP: Finance VP: Operations
Treasurer Controller
Credit Manager
Inventory Manager
Capital Budgeting Director
Cost Accounting
Financial Accounting
Tax Department

Copyright © 2003 Pearson Education, Inc., Modified Slide 1-9
Keputusan KeuanganUntuk individu : 1. Keputusan konsumsi 2. Keputusan investasi 3. Keputusan pendanaan Untuk perusahaan : 1. Keputusan pendanaan sisi pasiva 2. Keputusan investasi sisi aktiva 3. Keputusan/kebijakan deviden ( pembagian laba ) sisi pasiva
Kekhususan keputusan keuangan perusahaan : 1. Perusahaan dapat dimiliki oleh lebih dari satu orang 2. Ada peraturan-peraturan untuk perusahaan namun tidak berlaku
untuk individu 3. Penggunaan prinsip-prinsip akuntansi

Copyright © 2003 Pearson Education, Inc., Modified Slide 1-10
Tujuan Keputusan Keuangan :Pengelolaan keuangan yang baik
Memaksimumkan Nilai PerusahaanYakni, harga yang bersedia dibayar oleh pembeli
apabila perusahaan tersebut dijual
Meningkatkan kemakmuran pemilik

Copyright © 2003 Pearson Education, Inc., Modified Slide 1-11
Nilai Perusahaan Nilai di masa datang : P1 = Po + r ( Po ), atau P1 = Po ( 1 + r ) P2 = P1 ( 1 + r ) = Po ( 1 + r ) ( 1 + r ) = Po ( 1 + r ) 2 Pn = Po ( 1 + r ) n Nilai saat ini : Pn Po = -------------- ( 1 + r ) n Dengan bentuk lain :
π 1 π 2 π n PV = ----------- + ------------ + ………+ ----------- ( 1+ r )1 ( 1+ r )2 ( 1+ r )n TR t – TC t = ∑ ------------------ ( 1 + r ) t

Copyright © 2003 Pearson Education, Inc., Modified Slide 1-12
Laba Perusahaan Laba Bisnis >< Laba Ekonomi • Laba Bisnis : Pendapatan perusahaan dikurangi dengan biaya
eksplisit / biaya akuntansi. Biaya eksplisit adalah biaya yang benar-benar menjadi pengeluaran perusahaan untuk membeli atau menyewa semua input yang diperlukan dalam proses produksi.
• Laba Ekonomi : Pendapatan perusahaan dikurangi dengan
biaya eksplisit maupun implisit. Biaya implisit adalah biaya ‘opportunity’.
Copyright © 2003 Pearson Education, Inc., Modified Slide 1-13
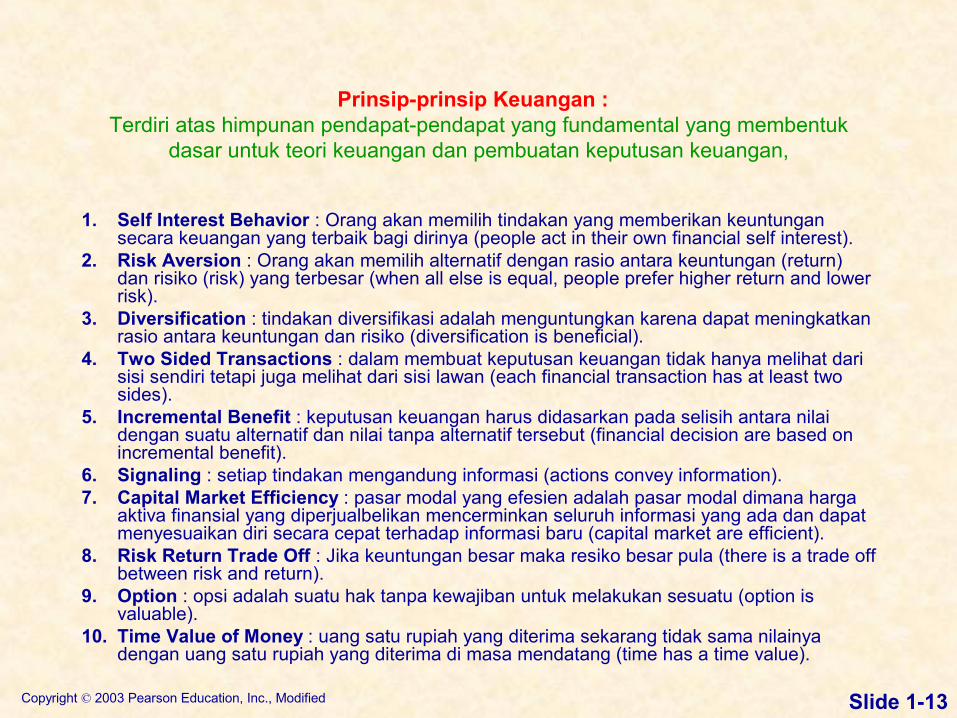
Prinsip-prinsip Keuangan : Terdiri atas himpunan pendapat-pendapat yang fundamental yang membentuk
dasar untuk teori keuangan dan pembuatan keputusan keuangan,
1. Self Interest Behavior : Orang akan memilih tindakan yang memberikan keuntungan secara keuangan yang terbaik bagi dirinya (people act in their own financial self interest).
2. Risk Aversion : Orang akan memilih alternatif dengan rasio antara keuntungan (return) dan risiko (risk) yang terbesar (when all else is equal, people prefer higher return and lower risk).
3. Diversification : tindakan diversifikasi adalah menguntungkan karena dapat meningkatkan rasio antara keuntungan dan risiko (diversification is beneficial).
4. Two Sided Transactions : dalam membuat keputusan keuangan tidak hanya melihat dari sisi sendiri tetapi juga melihat dari sisi lawan (each financial transaction has at least two sides).
5. Incremental Benefit : keputusan keuangan harus didasarkan pada selisih antara nilai dengan suatu alternatif dan nilai tanpa alternatif tersebut (financial decision are based on incremental benefit).
6. Signaling : setiap tindakan mengandung informasi (actions convey information).7. Capital Market Efficiency : pasar modal yang efesien adalah pasar modal dimana harga
aktiva finansial yang diperjualbelikan mencerminkan seluruh informasi yang ada dan dapat menyesuaikan diri secara cepat terhadap informasi baru (capital market are efficient).
8. Risk Return Trade Off : Jika keuntungan besar maka resiko besar pula (there is a trade off between risk and return).
9. Option : opsi adalah suatu hak tanpa kewajiban untuk melakukan sesuatu (option is valuable).
10. Time Value of Money : uang satu rupiah yang diterima sekarang tidak sama nilainya dengan uang satu rupiah yang diterima di masa mendatang (time has a time value).

Copyright © 2003 Pearson Education, Inc., Modified Slide 1-14
Obviously, $10,000 today$10,000 today.
You already recognize that there is TIME TIME VALUE TO MONEYVALUE TO MONEY!!
The Interest RateThe Interest Rate
Which would you prefer -- $10,000 today $10,000 today or $10,000 in 5 years$10,000 in 5 years?

Copyright © 2003 Pearson Education, Inc., Modified Slide 1-15
Computational Aids
Figure 5.2
Copyright © 2003 Pearson Education, Inc., Modified Slide 1-16
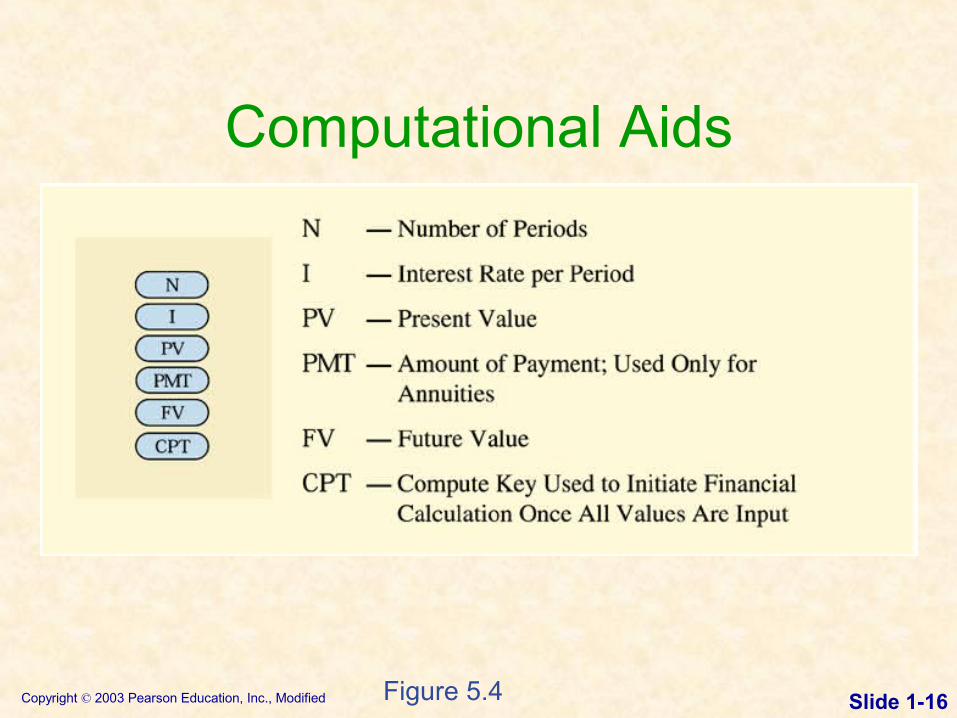
Computational Aids
Figure 5.4

Copyright © 2003 Pearson Education, Inc., Modified Slide 1-17
Simple Interest
• With simple interest, you don’t earn interest on interest.
Year 1: 5% of $100 = $5 + $100 = $105Year 2: 5% of $100 = $5 + $105 = $110Year 3: 5% of $100 = $5 + $110 = $115Year 4: 5% of $100 = $5 + $115 = $120Year 5: 5% of $100 = $5 + $120 = $125

Copyright © 2003 Pearson Education, Inc., Modified Slide 1-18
Compound Interest• With compound interest, a depositor earns interest on
interest!Year 1: 5% of $100.00 = $5.00 + $100.00 = $105.00Year 2: 5% of $105.00 = $5.25 + $105.00 = $110.25Year 3: 5% of $110.25 = $5 .51+ $110.25 = $115.76Year 4: 5% of $115.76 = $5.79 + $115.76 = $121.55Year 5: 5% of $121.55 = $6.08 + $121.55 = $127.63

Copyright © 2003 Pearson Education, Inc., Modified Slide 1-19
FVFV11 = P0(1+i)1
FVFV22 = P0(1+i)2
General Future Value Future Value Formula:FVFVnn = P0 (1+i)n
or FVFVnn = P0 (FVIFFVIFi,n) -- See Table ISee Table I
General Future Value FormulaGeneral Future Value Formula
etc.

Copyright © 2003 Pearson Education, Inc., Modified Slide 1-20
FVIFFVIFi,n is found on Table I at the end of the book or on the card insert.
Valuation Using Table IValuation Using Table I
Period 6% 7% 8%1 1.060 1.070 1.0802 1.124 1.145 1.1663 1.191 1.225 1.2604 1.262 1.311 1.3605 1.338 1.403 1.469

Copyright © 2003 Pearson Education, Inc., Modified Slide 1-21
FVFV22 = $1,000 (FVIFFVIF7%,2)= $1,000 (1.145)= $1,145$1,145 [Due to Rounding]
Using Future Value TablesUsing Future Value Tables
Period 6% 7% 8%1 1.060 1.070 1.0802 1.124 1.145 1.1663 1.191 1.225 1.2604 1.262 1.311 1.3605 1.338 1.403 1.469

Copyright © 2003 Pearson Education, Inc., Modified Slide 1-22
• Calculation based on Table I:FVFV55 = $10,000 (FVIFFVIF10%, 5)
= $10,000 (1.611)= $16,110$16,110 [Due to Rounding]
Story Problem SolutionStory Problem Solution◆ Calculation based on general formula:
FVFVnn = P0 (1+i)n FVFV55 = $10,000 (1+ 0.10)5
= $16,105.10$16,105.10
Copyright © 2003 Pearson Education, Inc., Modified Slide 1-23
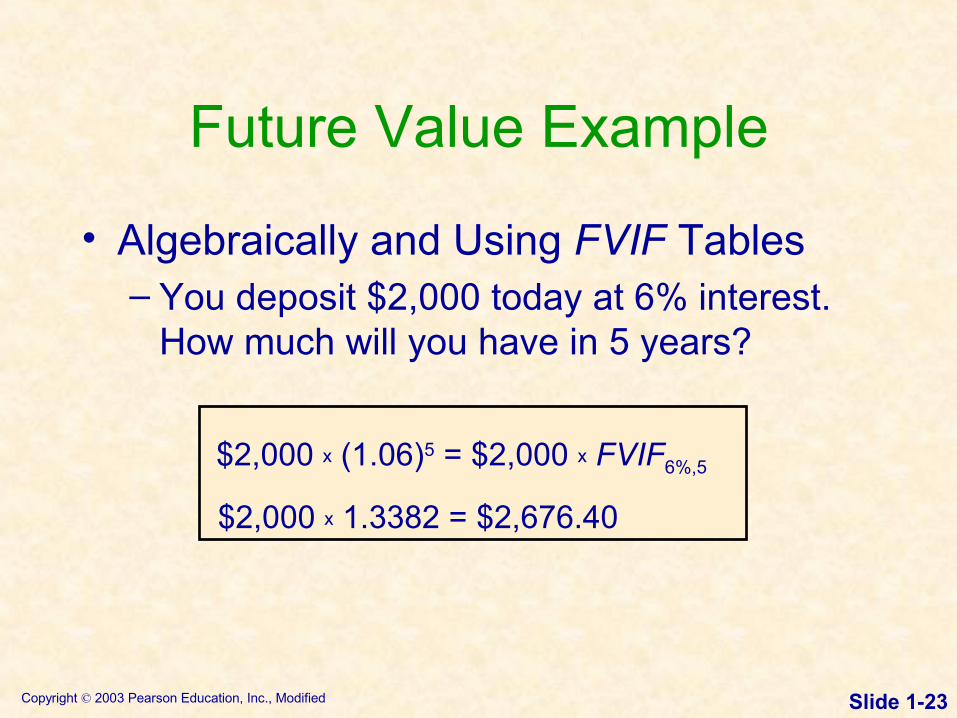
• Algebraically and Using FVIF Tables– You deposit $2,000 today at 6% interest.
How much will you have in 5 years?
$2,000 x (1.06)5 = $2,000 x FVIF6%,5
$2,000 x 1.3382 = $2,676.40
Future Value Example

Copyright © 2003 Pearson Education, Inc., Modified Slide 1-24
Microsoft® Excel Function
= FV(interest, periods, pmt, PV)
= FV(.06, 5, , 2000)
Future Value Example
• Using Microsoft® Excel– You deposit $2,000 today at 6% interest.
How much will you have in 5 years?

Copyright © 2003 Pearson Education, Inc., Modified Slide 1-25
A Graphic View of Future Value
Figure 5.5

Copyright © 2003 Pearson Education, Inc., Modified Slide 1-26

Copyright © 2003 Pearson Education, Inc., Modified Slide 1-27
Present Value• Present value is the current dollar value of a future
amount of money.• It is based on the idea that a dollar today is worth
more than a dollar tomorrow.• It is the amount today that must be invested at a
given rate to reach a future amount.• It is also known as discounting, the reverse
of compounding.• The discount rate is often also referred to as the
opportunity cost, the discount rate, the required return, and the cost of capital.

Copyright © 2003 Pearson Education, Inc., Modified Slide 1-28
PVPV00 = FVFV11 / (1+i)1
PVPV00 = FVFV22 / (1+i)2
General Present Value Present Value Formula:PVPV00 = FVFVnn / (1+i)n
or PVPV00 = FVFVnn (PVIFPVIFi,n) -- See Table IISee Table II
General Present Value Formula
General Present Value Formula
etc.

Copyright © 2003 Pearson Education, Inc., Modified Slide 1-29
PVIFPVIFi,n is found on Table II at the end of the book or on the card insert.
Valuation Using Table IIValuation Using Table II
Period 6% 7% 8% 1 .943 .935 .926 2 .890 .873 .857 3 .840 .816 .794 4 .792 .763 .735 5 .747 .713 .681

Copyright © 2003 Pearson Education, Inc., Modified Slide 1-30
PVPV22 = $1,000$1,000 (PVIF7%,2)= $1,000$1,000 (.873)= $873$873 [Due to Rounding]
Using Present Value TablesUsing Present Value Tables
Period 6% 7% 8%1 .943 .935 .9262 .890 .873 .8573 .840 .816 .7944 .792 .763 .7355 .747 .713 .681
Copyright © 2003 Pearson Education, Inc., Modified Slide 1-31
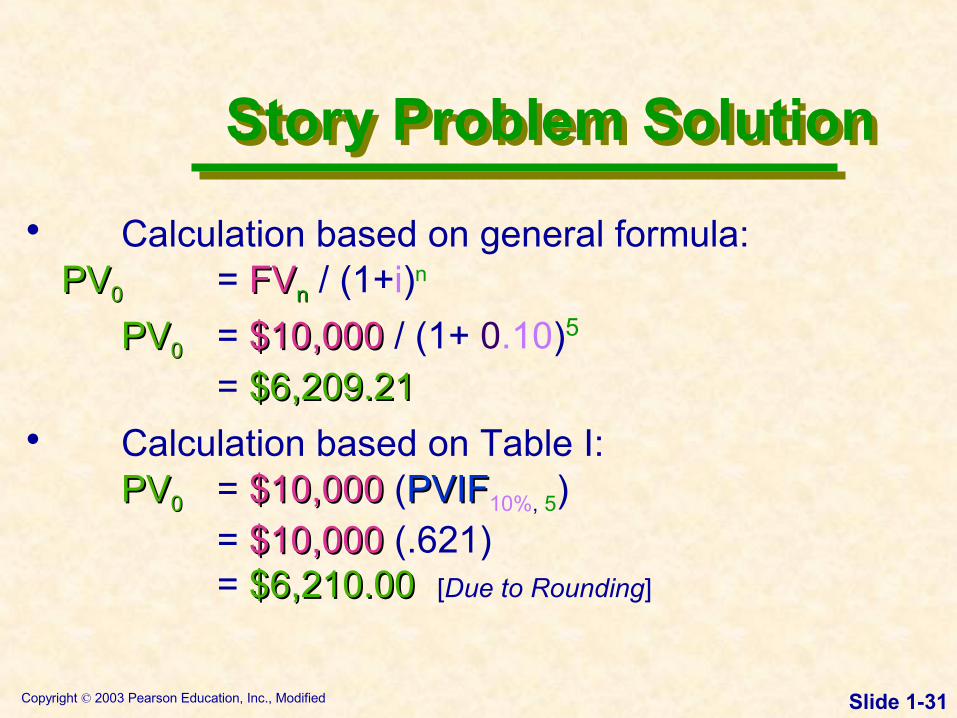
• Calculation based on general formula: PVPV00 = FVFVnn / (1+i)n
PVPV00 = $10,000$10,000 / (1+ 0.10)5
= $6,209.21$6,209.21• Calculation based on Table I:
PVPV00 = $10,000$10,000 (PVIFPVIF10%, 5)= $10,000$10,000 (.621)= $6,210.00$6,210.00 [Due to Rounding]
Story Problem SolutionStory Problem Solution

Copyright © 2003 Pearson Education, Inc., Modified Slide 1-32
$2,000 x [1/(1.06)5] = $2,000 x PVIF6%,5
$2,000 x 0.74758 = $1,494.52
Present Value Example
• Algebraically and Using PVIF Tables– How much must you deposit today in order to
have $2,000 in 5 years if you can earn 6% interest
on your deposit?

Copyright © 2003 Pearson Education, Inc., Modified Slide 1-33
Microsoft® Excel Function
=PV(interest, periods, pmt, FV)
=PV(.06, 5, , 2000)
Present Value Example
• Using Microsoft® Excel– How much must you deposit today in order
to have $2,000 in 5 years if you can earn 6% interest on your deposit?

Copyright © 2003 Pearson Education, Inc., Modified Slide 1-34
A Graphic View of Present Value
Figure 5.6

Copyright © 2003 Pearson Education, Inc., Modified Slide 1-35
Evolusi Teori Keuangan :
1. Konsep Pasar Modal Sempurna (Perfect Capital Markets) : 2. Analisis Arus Kas Yang Didiskonto (Discounted Cash Flow = DFC
Analysis) – John Burr Williams (1938) dan Myron J Gordon (1962) 3. Teori Struktur Modal dari Modigliani dan Miller (Capital Structure
Theory) – Franco Modigliani dan Merton Miller (1958- 1963). 4. Teori Dividen dari Modigliani dan Miller (Dividend Theory) –
Merton H Miller dan Franco Modigliani (1961). 5. Teori Portfolio dan Capital Asset Pricing Model (CAPM). 6. Teori Opsi 7. Efisiensi pasar dan risk return trade off 8. Teori Agen 9. Teori Informasi Asymetrik

Copyright © 2003 Pearson Education, Inc., Modified Slide 1-36
Aktivitas Utama Manajemen Keuangan
AktivaPerusahaan
Manajer Keuangan Pasar
Keuangan
12
34
5
Pasar Finansial Jangka pendek = Pasar uang Jangka panjang = Pasar modal

Copyright © 2003 Pearson Education, Inc., Modified Slide 1-37
Perbandingan investasi dan pendanaan di pasar uang dan pasar modal
Pemilik Dana
Pemilik Dana
Yang memerlukan Dana
Pemilik dana menerima 11 - 13 %
Perusahaan membayar 18 - 19 %
Pemilik dana menerima
15 %dan
Perusahaan membayar 15 % + Biaya Emisi

Copyright © 2003 Pearson Education, Inc., Modified Slide 1-38
Lembaga Keuangan dalam Sistem Keuangan Indonesia Sistem Moneter 1. Otoritas Moneter : Bank Sentral 2. Bank Pencipta uang giral : Bank Umum Di luar sistem moneter 1. Bukan bank pencipta uang giral : Bank Perkreditan Rakyat 2. Lembaga pembiayaan :
• Perusaahaan modal ventura • Perusaahaan sewa guna ( leasing ) • Perusaahaan anjak piutang • Perusaahaan kartu kredit • Perusaahaan pembiayaan konsumen • Perusaahaan pegadaiaan
3. Perusaahaan Asuransi • Asuransi sosial • Asuransi jiwa dan atau Asuransi kerugian • Reasuransi • Broker asuransi dan Broker reasuransi • Penilai kerugian asuransi • Konsultan aktuaria
4. Dana pensiun • Dana pensiun pemberi kerja • Dana pensiun lembaga keuangan
5. Lembaga di bidang pasar modal • Bursa efek • Lembaga kliring penyelesaian dan penyimpanan • Perusahaan reksa dana • Perusahaan efek ( penjamin emisi, pedagan perantara, manajer investasi ) • Lembaga penunjang pasar modal ( biro adm. Efek, tempat penitipan harta, wali
amanat ) 6. Lainnya
• Pialang pasar uang

Copyright © 2003 Pearson Education, Inc., Modified Slide 1-39

Copyright © 2003 Pearson Education, Inc., Modified Slide 1-40
Primary Activities of the Financial Manager
Copyright © 2003 Pearson Education, Inc., Modified Slide 1-41
Goal of the FirmWhat About Stakeholders?
• Stakeholders include all groups of individuals who have a direct economic link to the firm including:
– Employees– Customers– Suppliers– Creditors– Owners
• The "Stakeholder View" prescribes that the firm make a conscious effort to avoid actions that could be detrimental to the wealth position of its stakeholders.• Such a view is considered to be "socially responsible."

Copyright © 2003 Pearson Education, Inc., Modified Slide 1-42
Goal of the FirmMaximize Shareholder Wealth!!!
• It can also be described using the following flow chart:

Copyright © 2003 Pearson Education, Inc., Modified Slide 1-43
• Ethics programs seek to:
• reduce litigation and judgment costs
• maintain a positive corporate image
• build shareholder confidence
• gain the loyalty and respect of all stakeholders
• The expected result of such programs is to positively affect the
firm's share price.
Ethics & Share Price
Copyright © 2003 Pearson Education, Inc., Modified Slide 1-44
The Agency Issue
• Whenever a manager owns less than 100% of the
firm’s equity, a potential agency problem exists.
• In theory, managers would agree with shareholder
wealth maximization.
• However, managers are also concerned with their
personal wealth, job security, fringe benefits, and
lifestyle.
• This would cause managers to act in ways that do not
always benefit the firm shareholders.
The Problem

Copyright © 2003 Pearson Education, Inc., Modified Slide 1-45
Financial Institutions and Markets
• Most successful firms have ongoing needs for funds.
• Funds can be obtained from external sources in three ways:
– Through financial institutions
– Through financial markets
– Through private placements

Copyright © 2003 Pearson Education, Inc., Modified Slide 1-46
• Financial institutions serve as intermediaries by channeling
the savings of individuals, businesses, and governments into
loans or investments.
• Some institutions pay savers directly for deposited funds
while others may provide services for a fee.
• Some institutions accept customers’ deposits and lend it to
other customers; others invest customers’ savings in earning
assets such as real estate or stocks or bonds.
Financial Institutions

Copyright © 2003 Pearson Education, Inc., Modified Slide 1-47
The Relationship between Financial Institutions and Financial Markets
Copyright © 2022 FDOKUMEN