Late Holocene Heavy Metals Record of Jakarta Bay Sediments ...
12
Bulletin of the Marine Geology, Vol. 33, No. 2, December 2018, pp. 119 to 130 119 Late Holocene Heavy Metals Record of Jakarta Bay Sediments Rekam Jejak Logam Berat Holosen Akhir dalam Sedimen Teluk Jakarta Rina Zuraida 1 , Riza Rahardiawan 1 , Yani Permanawati 1 , Indra Adhirana 1 , Andrian Ibrahim 2 , Nazar Nurdin 1 , Haryadi Permana 3 1 Marine Geological Institute of Indonesia, Jl. Junjunan No. 236 Bandung, 40174 Indonesia, Energy and Mineral Resources Research and Development Agency 2 Geological Survey Center, Jl. Diponegoro 57, Bandung, INDONESIA 3 Research Center for Geotechnology, Kompleks LIPI, Jl. Sangkuriang, Bandung 40135, INDONESIA Corresponding author : [email protected] (Received 06 August 2018; in revised form 13 August 2018 accepted 25 October 2018) ABSTRACT: This paper reports copper, zinc, lead, cadmium, and chromium records of Jakarta Bay sediment since 500 AD of a 150 cm long gravity core (TJ–17, 106.902488°E, 5.99381°S). The core was acquired from the eastern part of Jakarta Bay in 2010 onboard RV Geomarin I by the Marine Geological Institute–MEMR. We applied core scanning, grain size and elemental analyses to track environmental changes. Core scanning was conducted by multi sensor core logger, grain size analysis was carried out by sieving and pipette methods and heavy metal concentration was analyzed using atomic absorption spectrometry on bulk samples. The results yield baseline values of Cu at 12.88 ppm, Zn at 95.5 ppm, and at Cr 60.13 ppm. Vertical record of heavy metals show three stages of environmental changes in the region: (I) 476–933 AD, (II) 933 – 1799 AD, and (III) 1799 – 1991 AD. These changes are interpeted as related to land use changes caused by human activity in the West Java region since Tarumanagara to modern Indonesia. Keywords: heavy metals, Jakarta Bay, land use changes, anthropogenic activities ABSTRAK: Makalah ini melaporkan hasil penelitian kandungan tembaga, seng, timbal, kadmium dan krom dalam sedimen Teluk Jakarta sejak 500 M dari sampel sedimen yang diambil dengan gravity core sepanjang 150 cm di bagian timur Teluk Jakarta (TJ–17, 106.902488°BT, 5.99381°LS). Sampel diambil pada tahun 2010 dengan menggunakan KR Geomarin I oleh Pusat Penelitian dan Pengembangan Geologi Kelautan–KESDM. Analisis sampel terdiri atas core scanning, analisis besar butir dan unsur untuk menelusuri perubahan lingkungan di darat. Core scanning dilakukan dengan menggunakan multi sensor core logger, analisis besar butir dengan menggunakan metoda ayakan dan pipet, dan analisis kandungan logam berat dilakukan dengan metoda atomic absorption spectrometry pada bulk sample. Hasil analisis memberikan nilai rona awal (baseline values) untuk Cu adalah 12.88 ppm, Zn 95.5 ppm, dan Cr 60.13 ppm. Rekaman logam berat secara vertikal menunjukkan tiga tahap perubahan lingkungan: (I) 476 – 933 M, (II) 933 – 1799 M, and (III) 1799 – 1991 M. Perubahan ini diinterpretasikan sebagai perubahan tata guna lahan akibat aktivitas manusia di daerah Jawa Barat sejak Kerajaan Tarumanagara hingga Indonesia modern. Kata kunci: logam berat, Teluk Jakarta, perubahan tata guna lahan, aktivitas manusia INTRODUCTION The term heavy metal usually indicates elements with densities heavier than 5 g/cm 3 (Järup, 2003). Thus, some of trace elements, composing approximately 0.1% of the lithosphere, can be considered as heavy metals (Callender, 2003). Existing studies show that increase of heavy metal within sediments can be related to anthropogenic activities (Zhao et al., 2017; Decena et al., 2018). An increase of industrial activities in a region is usually followed by increase of waste disposal, either in solid, liquid or gaseous forms. Crounse et al. (1983) identified severe abdominal pain and anemia that is caused by copper poisoning. Heavy metals disposed to the water bodies will ultimately be brought to the sea and deposited within the marine sediments that could be ingested by organisms and thus transferring the metals to the food chain (Calmano et al., 1996). Even though geological condition of a region influence heavy metal concentration within the sedimen (Howarth and Thornton, 1983), enrichment of certain heavy metals such as lead, mercury, cadmium, zinc and copper in an
Transcript of Late Holocene Heavy Metals Record of Jakarta Bay Sediments ...

Bulletin of the Marine Geology, Vol. 33, No. 2, December 2018, pp. 119 to 130
119
Late Holocene Heavy Metals Record of Jakarta Bay Sediments
Rekam Jejak Logam Berat Holosen Akhir dalam Sedimen Teluk Jakarta
Rina Zuraida1, Riza Rahardiawan1, Yani Permanawati1, Indra Adhirana1, Andrian Ibrahim2, Nazar Nurdin1, Haryadi Permana3
1 Marine Geological Institute of Indonesia, Jl. Junjunan No. 236 Bandung, 40174 Indonesia, Energy and Mineral Resources Research and Development Agency
2 Geological Survey Center, Jl. Diponegoro 57, Bandung, INDONESIA3 Research Center for Geotechnology, Kompleks LIPI, Jl. Sangkuriang, Bandung 40135, INDONESIA
Corresponding author : [email protected]
(Received 06 August 2018; in revised form 13 August 2018 accepted 25 October 2018)
ABSTRACT: This paper reports copper, zinc, lead, cadmium, and chromium records of Jakarta Baysediment since 500 AD of a 150 cm long gravity core (TJ–17, 106.902488°E, 5.99381°S). The core wasacquired from the eastern part of Jakarta Bay in 2010 onboard RV Geomarin I by the Marine GeologicalInstitute–MEMR. We applied core scanning, grain size and elemental analyses to track environmentalchanges. Core scanning was conducted by multi sensor core logger, grain size analysis was carried out bysieving and pipette methods and heavy metal concentration was analyzed using atomic absorptionspectrometry on bulk samples. The results yield baseline values of Cu at 12.88 ppm, Zn at 95.5 ppm, and at Cr60.13 ppm. Vertical record of heavy metals show three stages of environmental changes in the region: (I)476–933 AD, (II) 933 – 1799 AD, and (III) 1799 – 1991 AD. These changes are interpeted as related to landuse changes caused by human activity in the West Java region since Tarumanagara to modern Indonesia.
Keywords: heavy metals, Jakarta Bay, land use changes, anthropogenic activities
ABSTRAK : Makalah ini melaporkan hasil penelitian kandungan tembaga, seng, timbal, kadmium dan kromdalam sedimen Teluk Jakarta sejak 500 M dari sampel sedimen yang diambil dengan gravity core sepanjang 150 cm dibagian timur Teluk Jakarta (TJ–17, 106.902488°BT, 5.99381°LS). Sampel diambil pada tahun 2010 denganmenggunakan KR Geomarin I oleh Pusat Penelitian dan Pengembangan Geologi Kelautan–KESDM. Analisissampel terdiri atas core scanning, analisis besar butir dan unsur untuk menelusuri perubahan lingkungan di darat.Core scanning dilakukan dengan menggunakan multi sensor core logger, analisis besar butir dengan menggunakanmetoda ayakan dan pipet, dan analisis kandungan logam berat dilakukan dengan metoda atomic absorptionspectrometry pada bulk sample. Hasil analisis memberikan nilai rona awal (baseline values) untuk Cu adalah 12.88ppm, Zn 95.5 ppm, dan Cr 60.13 ppm. Rekaman logam berat secara vertikal menunjukkan tiga tahap perubahanlingkungan: (I) 476 – 933 M, (II) 933 – 1799 M, and (III) 1799 – 1991 M. Perubahan ini diinterpretasikan sebagaiperubahan tata guna lahan akibat aktivitas manusia di daerah Jawa Barat sejak Kerajaan Tarumanagara hinggaIndonesia modern.
Kata kunci: logam berat, Teluk Jakarta, perubahan tata guna lahan, aktivitas manusia
INTRODUCTIONThe term heavy metal usually indicates elements
with densities heavier than 5 g/cm3 (Järup, 2003). Thus,some of trace elements, composing approximately0.1% of the lithosphere, can be considered as heavymetals (Callender, 2003). Existing studies show thatincrease of heavy metal within sediments can be relatedto anthropogenic activities (Zhao et al., 2017; Decena etal., 2018). An increase of industrial activities in a regionis usually followed by increase of waste disposal, eitherin solid, liquid or gaseous forms. Crounse et al. (1983)
identified severe abdominal pain and anemia that iscaused by copper poisoning.
Heavy metals disposed to the water bodies willultimately be brought to the sea and deposited withinthe marine sediments that could be ingested byorganisms and thus transferring the metals to the foodchain (Calmano et al., 1996). Even though geologicalcondition of a region influence heavy metalconcentration within the sedimen (Howarth andThornton, 1983), enrichment of certain heavy metalssuch as lead, mercury, cadmium, zinc and copper in an
120 Rina Zuraida et al.
estuary is almost always related to anthropogenicactivities (Forstner, 1983).
One of Indonesian water bodies that is mostaffected by human activities is Jakarta Bay that bordersthe northern part of Indonesian Capital, Jakarta. Despiteproviding the livelihood for local fishermen (Putri et al.,2015), the bay also acts as waste disposal fromsurrounding areas (Cordova et al., 2016) that istransported by thirteen natural rivers belonging to
Ciliwung-Cisadane Watershed flowing into the bay(Rochyatun and Rozak, 2007). The bay also acts asmeans of transportation, as well as site of leisure. Thoseactivities affect the environment of the bay. Such impactwas observed by Farhan and Lim (2012) who found theinverse effect of urban pressures and pollutants fromfour main rivers in Jakarta Bay on the environment.During wet season (northwest monsoon), increase riverdischarge and runoff from Jakarta coastal plain thatcoincides with high tides would lead enchanced thepossibility of flooding event.
Riverine runoff of an area is affected by land usechanges, as was observed in Nyando river basin, Kenya,by Kundu and Olang (2011). Changes in land cover dueto human activities are found to increase sedimentationin several deltas of norther Java (Lavigne and Gunnell,2006). Increasing open spaces inland would increasesediment volume flowing into the river that in turnwould increase deposition of sediment, as well as heavymetals, in the bay.
To date, heavy metal analysis for environmentalpurposes are usually limited to surface sediment(Permanawati et al., 2013) or by concentrating theanalysis on the silt and clay fractions of marine surfacesediment (Zhuang and Gao, 2014). Previous study onhistorical heavy metal record from Jakara Bay wasconcentrated on tracing the impact of stricterenvironmental regulations on heavy metalcontamination from the Bay (Hosono et al., 2011). Theobjective of this study is to determine the baseline valueof heavy metal concentration in the bay from longsediment core sample and to identify environmentalchanges of Jakarta Bay and surrounding area.
METHODSThis study uses one 150-cm core taken from the
western part of Jakarta Bay (TJ-17) during Geomarin Icruise in September 2010 as part of thematic mapping
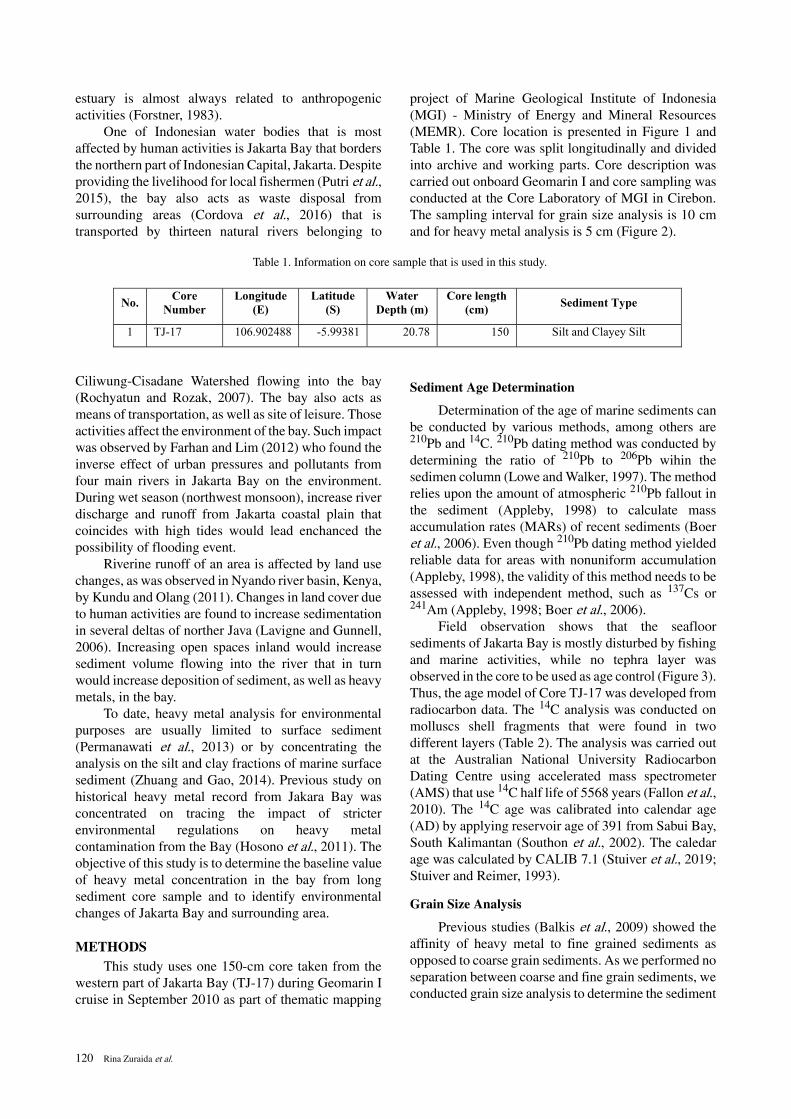
project of Marine Geological Institute of Indonesia(MGI) - Ministry of Energy and Mineral Resources(MEMR). Core location is presented in Figure 1 andTable 1. The core was split longitudinally and dividedinto archive and working parts. Core description wascarried out onboard Geomarin I and core sampling wasconducted at the Core Laboratory of MGI in Cirebon.The sampling interval for grain size analysis is 10 cmand for heavy metal analysis is 5 cm (Figure 2).
Sediment Age Determination
Determination of the age of marine sediments canbe conducted by various methods, among others are210Pb and 14C. 210Pb dating method was conducted bydetermining the ratio of 210Pb to 206Pb wihin thesedimen column (Lowe and Walker, 1997). The methodrelies upon the amount of atmospheric 210Pb fallout inthe sediment (Appleby, 1998) to calculate massaccumulation rates (MARs) of recent sediments (Boeret al., 2006). Even though 210Pb dating method yieldedreliable data for areas with nonuniform accumulation(Appleby, 1998), the validity of this method needs to beassessed with independent method, such as 137Cs or241Am (Appleby, 1998; Boer et al., 2006).
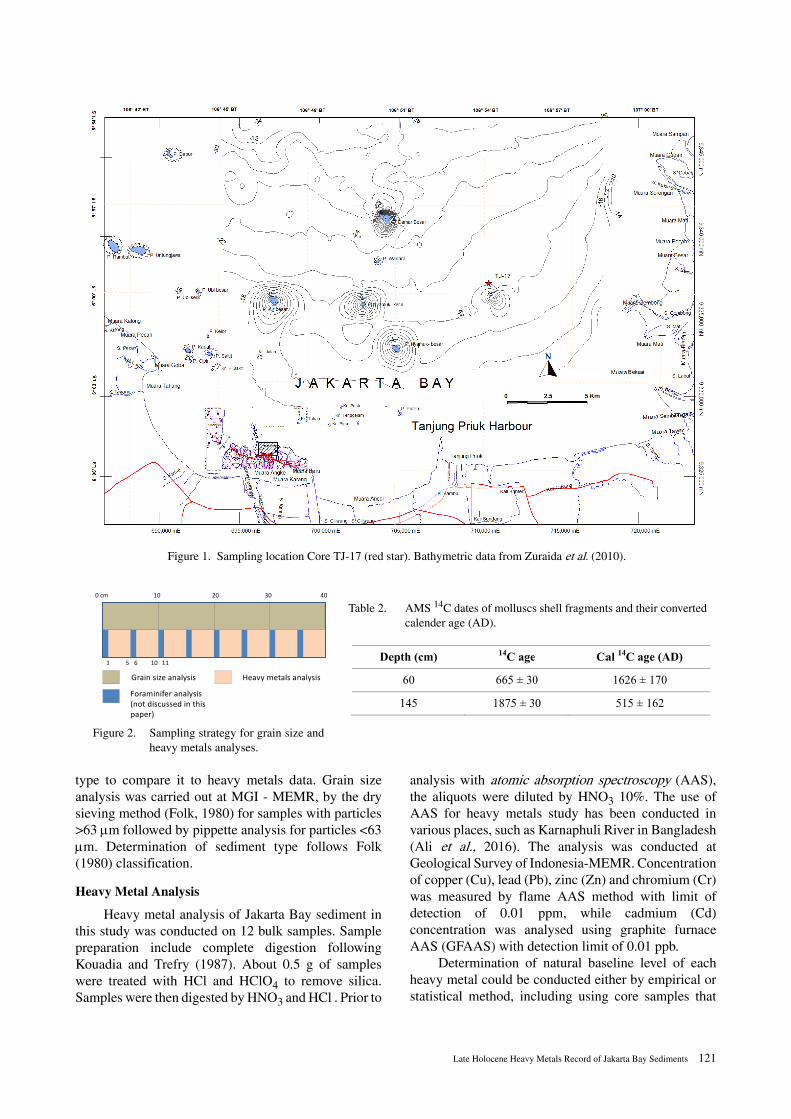
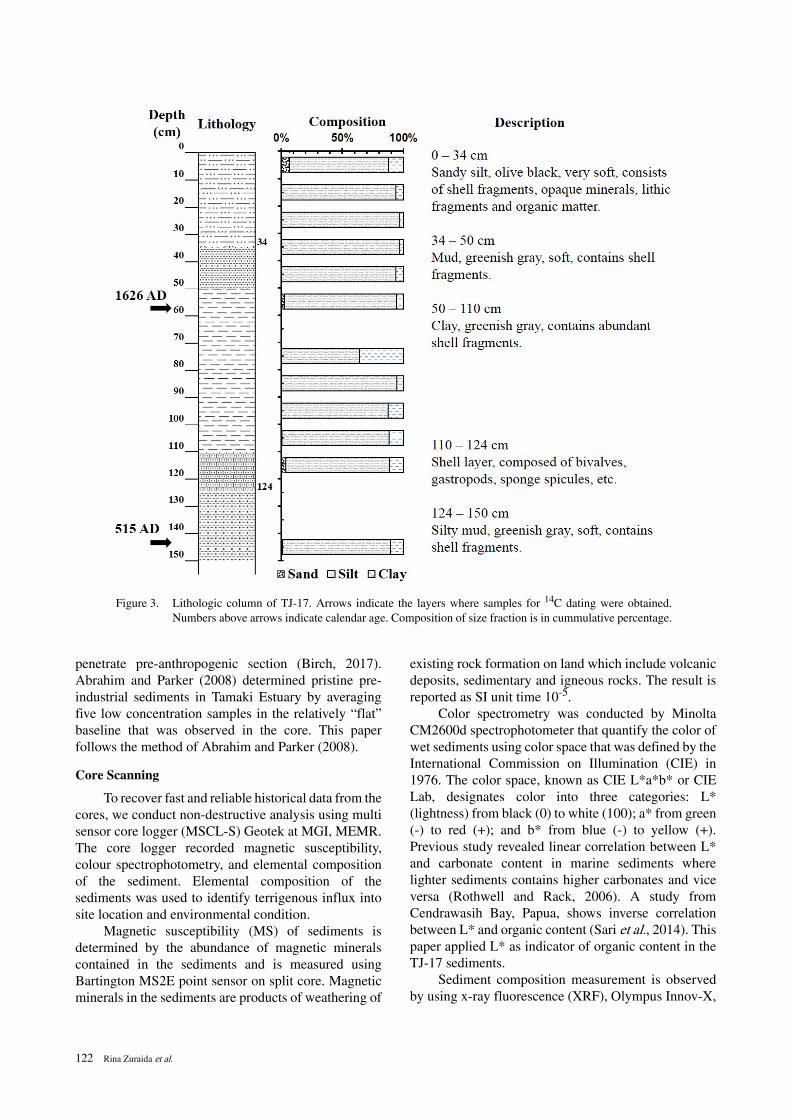
Field observation shows that the seafloorsediments of Jakarta Bay is mostly disturbed by fishingand marine activities, while no tephra layer wasobserved in the core to be used as age control (Figure 3).Thus, the age model of Core TJ-17 was developed fromradiocarbon data. The 14C analysis was conducted onmolluscs shell fragments that were found in twodifferent layers (Table 2). The analysis was carried outat the Australian National University RadiocarbonDating Centre using accelerated mass spectrometer(AMS) that use 14C half life of 5568 years (Fallon et al.,2010). The 14C age was calibrated into calendar age(AD) by applying reservoir age of 391 from Sabui Bay,South Kalimantan (Southon et al., 2002). The caledarage was calculated by CALIB 7.1 (Stuiver et al., 2019;Stuiver and Reimer, 1993).
Grain Size Analysis
Previous studies (Balkis et al., 2009) showed theaffinity of heavy metal to fine grained sediments asopposed to coarse grain sediments. As we performed noseparation between coarse and fine grain sediments, weconducted grain size analysis to determine the sediment
No. Core Number
Longitude (E)
Latitude (S)
Water Depth (m)
Core length (cm) Sediment Type
1 TJ-17 106.902488 -5.99381 20.78 150 Silt and Clayey Silt
Table 1. Information on core sample that is used in this study.
Late Holocene Heavy Metals Record of Jakarta Bay Sediments 121
type to compare it to heavy metals data. Grain sizeanalysis was carried out at MGI - MEMR, by the drysieving method (Folk, 1980) for samples with particles>63 μm followed by pippette analysis for particles <63μm. Determination of sediment type follows Folk(1980) classification.
Heavy Metal Analysis
Heavy metal analysis of Jakarta Bay sediment inthis study was conducted on 12 bulk samples. Samplepreparation include complete digestion followingKouadia and Trefry (1987). About 0.5 g of sampleswere treated with HCl and HClO4 to remove silica.Samples were then digested by HNO3 and HCl . Prior to
analysis with atomic absorption spectroscopy (AAS),the aliquots were diluted by HNO3 10%. The use ofAAS for heavy metals study has been conducted invarious places, such as Karnaphuli River in Bangladesh(Ali et al., 2016). The analysis was conducted atGeological Survey of Indonesia-MEMR. Concentrationof copper (Cu), lead (Pb), zinc (Zn) and chromium (Cr)was measured by flame AAS method with limit ofdetection of 0.01 ppm, while cadmium (Cd)concentration was analysed using graphite furnaceAAS (GFAAS) with detection limit of 0.01 ppb.
Determination of natural baseline level of eachheavy metal could be conducted either by empirical orstatistical method, including using core samples that
Deepth (cm)
60
145
14C age
665 ± 30
1875 ± 3
e Ca
0
0
al 14C age (AD
1626 ± 170
515 ± 162
D)
Figure 1. Sampling location Core TJ-17 (red star). Bathymetric data from Zuraida et al. (2010).
Grain size analysis
Foraminifer analysis(not discussed in thispaper)
Heavy metals analysis
0 cm
1
10 20 30 40
5 6 10 11
Figure 2. Sampling strategy for grain size andheavy metals analyses.
Table 2. AMS 14C dates of molluscs shell fragments and their convertedcalender age (AD).
122 Rina Zuraida et al.
penetrate pre-anthropogenic section (Birch, 2017).Abrahim and Parker (2008) determined pristine pre-industrial sediments in Tamaki Estuary by averagingfive low concentration samples in the relatively „flat‰baseline that was observed in the core. This paperfollows the method of Abrahim and Parker (2008).
Core Scanning
To recover fast and reliable historical data from thecores, we conduct non-destructive analysis using multisensor core logger (MSCL-S) Geotek at MGI, MEMR.The core logger recorded magnetic susceptibility,colour spectrophotometry, and elemental compositionof the sediment. Elemental composition of thesediments was used to identify terrigenous influx intosite location and environmental condition.
Magnetic susceptibility (MS) of sediments isdetermined by the abundance of magnetic mineralscontained in the sediments and is measured usingBartington MS2E point sensor on split core. Magneticminerals in the sediments are products of weathering of
existing rock formation on land which include volcanicdeposits, sedimentary and igneous rocks. The result isreported as SI unit time 10-5.
Color spectrometry was conducted by MinoltaCM2600d spectrophotometer that quantify the color ofwet sediments using color space that was defined by theInternational Commission on Illumination (CIE) in1976. The color space, known as CIE L*a*b* or CIELab, designates color into three categories: L*(lightness) from black (0) to white (100); a* from green(-) to red (+); and b* from blue (-) to yellow (+).Previous study revealed linear correlation between L*and carbonate content in marine sediments wherelighter sediments contains higher carbonates and viceversa (Rothwell and Rack, 2006). A study fromCendrawasih Bay, Papua, shows inverse correlationbetween L* and organic content (Sari et al., 2014). Thispaper applied L* as indicator of organic content in theTJ-17 sediments.
Sediment composition measurement is observedby using x-ray fluorescence (XRF), Olympus Innov-X,
Figure 3. Lithologic column of TJ-17. Arrows indicate the layers where samples for 14C dating were obtained.Numbers above arrows indicate calendar age. Composition of size fraction is in cummulative percentage.

Late Holocene Heavy Metals Record of Jakarta Bay Sediments 123
scanner that is attached to the MSCL-S. The XRFscanner can measure wide range of major, minor andtrace elements and comparable to traditional laboratoryinstrument (Kenna et al., 2010) and report the result inppm. Paleoenvironmental condition was determinedfrom magnetic susceptibility and elemental ratios of Ti/Ca, Fe/Ca and Fe/Ti (Blanchett, 2010; Croudace et al.,2006).
The intensity of heavy metal in a given sedimentcan be expressed by various methods, such asGeoaccumulation Index (Igeo). Igeo involves simplecalculation that includes multiplication factor to reducelithogenic effect (Kowalska et al., 2018). Igeo wasapplied to quantify the level of heavy metal pollution inmarine sediments of Laizhou Bay and Zhangzi Island ofChina (Zhuang and Gao, 2014). The calculation of Igeois:
where Cm is concentration of heavy metal m inboth sample and background. The background valuesthat are used vary from global value of heavy metal inshale (Zahra et al., 2014) to the baseline value of theelement (Abrahim and Parker, 2008). Barbieri (2016)defined background values as „Natural contents ofsubstance in the soil completely dependent on thecompositional and mineralogical characteristic of theparent/source geological material‰ and baseline valuesas „Actual mostly diffuse range of concentration of angiven element in a specific area dependent both on thenature of the parent geological/source material and onthe historic diffuse release into the environment ofcontaminants from anthropogenic sources‰.
RESULTS
Age Model
The age model for core TJ-17 that is located to thewest of Muara Gembong was developed in three partsbased on the assumption that the rate of sedimentationin the area is linear. The rate of sedimentation between60 and 145 cm was calculated by assuming linearsedimentation rate (LSR) between two 14C age controlsthat gave a rate of sedimentation during this time as 0.07cm/year. Sedimentation rate between 0 and 60 cm wasdetermined by assuming that the core top is moderndeposit (equal or younger than 1950. See Fallon et al.,2010), while the bottom part was calculated byassuming LSR (Figures 4a and 4b). The age yielded by14C dating allows us to reconstruct changes in heavymetal concentration in the Jakarta Bay for the last twomillenia.
Sediment Grain Size
Grain size analysis on core samples yielded thepredominance of silt and clayey silt on all of thesamples (Figure 3). Macroscopic observation indicatesthat samples containing sand and gravel are mostlycomposed of biogenic carbonates and thus are notconsidered in the classification of sediment type.
Heavy Metal Concentrations
Copper concentration rose from 12.30 to 29.70ppm, with average value of 17.66 ppm, and highestconcentration was reached at 1895 AD. The patternshows stepwise increase of Cu that consists of threestages: (1) 476–933 AD where concentration rangesbetween 12.3 and 15.5 ppm with an average of 13.6ppm; (2) 933–1799 AD where concentration ranges15.3–19.1 ppm and an average of 16.9 pp; and (3)1799–1991 AD where concentration ranges 19.4–29.7ppm with an average of 25 ppm.
a
0
500
1000
1500
2000
0 50 100 150 200
Age�(AD)
Depth�(cm)
Age�Model
b
0
0.02
0.04
0.06
0.08
0.1
0.12
0.14
0.16
0.18
400 600 800 1000 1200 1400 1600 1800 2000
Sed.�Rate�(cm/yr)
Age�(AD)
Sed.�Rate
Figure 4. Age model for TJ-17 based on two 14C ages (a) and sedimentation rate of core TJ-17 (b).

124 Rina Zuraida et al.
Lead fluctuates between 17.9 – 39.1 ppm, with anaverage of 23 ppm. Two strong peaks are detected at541 AD (39.1ppm) and 1703 AD (31.6 ppm), and oneweak peak at 1129 AD (26.4 ppm). Those peaks showweak cyclicity with a period of approximately 600years.
Zinc concentration ranges between 85.8 – 149.9ppm, an average of 122.8 ppm and maximumconcentration was detected at 1959 AD. This metal alsoshows stepwise within similar intervals of Cu withconcentration range of: (1) 85.8 – 105.2 ppm with anaverage of 98.5 ppm; (2) 115.9 – 141.4 ppm with anaverage of 132.2 ppm; and (3) 115.7 – 149.9 ppm withan average of 129.9 ppm.
Cadmium concentration ranges between 0.015 –0.15 ppm with an average of 0.064 ppm and maximumlevel was reached at 1703 AD. The pattern show strongcyclicity from the base of the core to 1735 AD withconcentrations vary between 0.015 – 0.15 ppm and anaverage of 0.068 ppm. From 1735 to 1991, Cdconcntrations show narrow fluctuation between0.03–0.075 ppm and an average of 0.05 ppm.
Concentration of Cr ranges between 54.54–207.75ppm with an average of 100.74 ppm and highestconcentration was detected at the core top (1991 AD).The metal shows similar stepwise increase like Cu andZn within the same periods: (1) the concentrationranges 54.54–107.79 ppm with an average of 71.95ppm; (2) 73.18–132.1 ppm with an average of 99.73ppm; and (3) 108.43–207.75 ppm with and average of141.84 ppm.
Baseline Levels
Baseline level of certain heavy metal can becalculated providing the vertical distribution of thatmetal shows relatively stable concentration in the lowerpart of the core before increasing to the surface.
Calculation of baseline level followed Abrahim andParker (2008) by averaging five low concentration ofeach heavy metal.
Heavy metal records from core TJ-17 exhibitrelatively stable concentrations of Cu, Zn and Cr thatincrease upwards (Figure 5), while Pb and Cd higherfluctuation on the lower part of the core. Baseline levelsof Cu, Zn, and Cr are 12.88 ppm, 95.5 ppm, and 60.13ppm, respectively (Table 3). The baseline levels for Pband Cd can not be calculated as there is no baseline thatcan be observed (Figure 5).
Calculated baseline levels followed the order:Zn>Cr>Cu. Baseline level of Zn is nearly equal to Zn inshale (Table 3), while baseline levels of Cr and Cu arebelow geochemical background. We compare our datawith stream sediment sampling from Citarum river thatwas conducted in 2015 by Center for Geological Survey(Table 3) to assess the influence of local geology. Thecomparison shows that baseline levels of Zn, Cr and Cuare much lower than stream sediments which might berelated to sediment deposition within dams andfloodgates along the river.
Geoaccumulation Index (Igeo)
Calculation of Igeo applied background value ofeach heavy metal instead of baseline value consideringno baseline value can be calculated for Pb and Cd. Weemployed geochemical background value of the fiveheavy metals in the shale (Turekian and Wedepohl,1961) for the calculation following Zahra et al. (2014).Igeo is then categorized into six classes that reflectsediment quality (Zahra et al., 2014). Mean Igeo of TJ-17 shows that Igeo of five metals that were analysed arebelow 0 that correspond to class 0 (Table 3). Thesediment quality of this class is considered unpolluted.
0
500
1000
1500
20000 50 100 150 200 250
Cr (ppm)
0
500
1000
1500
2000
0 0.1 0.2
Cd (ppm)
0
500
1000
1500
200050 100 150 200
Zn (ppm)
0 20 40
Pb (ppm)
0
500
1000
1500
20000 20 40
Age
(AD)
Cu (ppm)
Figure 5. Concentration of Cu, Pb, Zn, Cd and Cr of discrete samples analysed by AAS.
Late Holocene Heavy Metals Record of Jakarta Bay Sediments 125
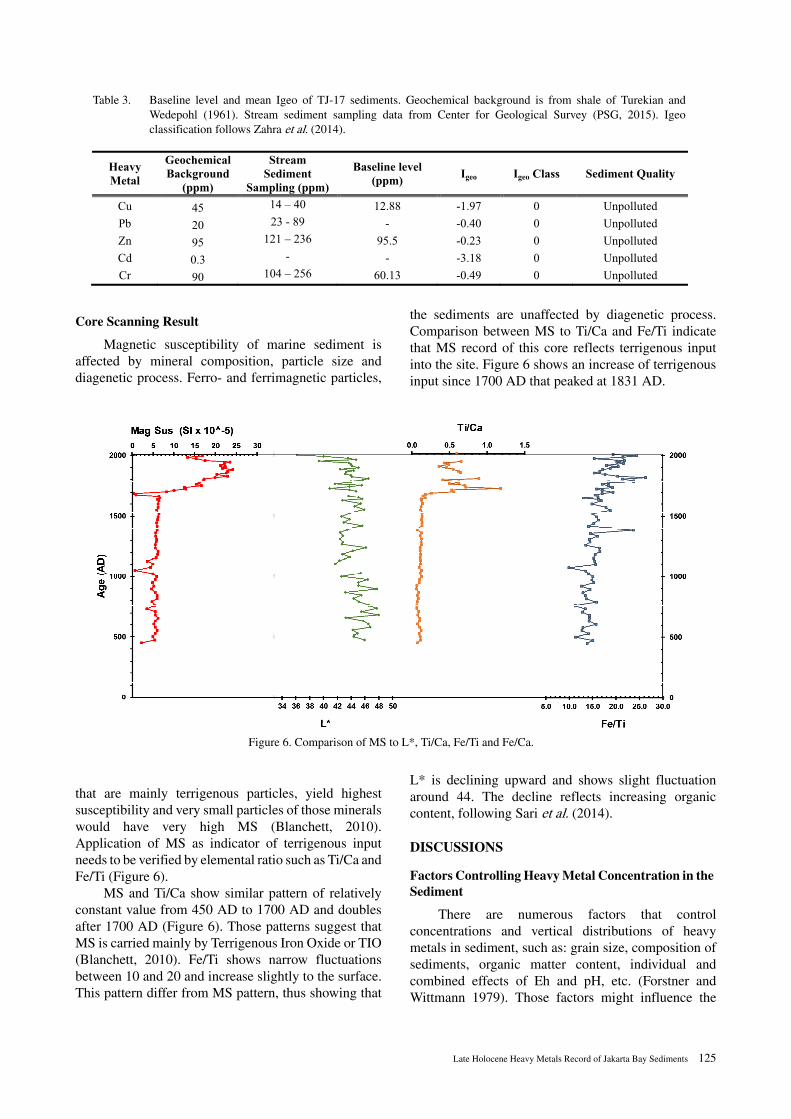
Core Scanning Result
Magnetic susceptibility of marine sediment isaffected by mineral composition, particle size anddiagenetic process. Ferro- and ferrimagnetic particles,
that are mainly terrigenous particles, yield highestsusceptibility and very small particles of those mineralswould have very high MS (Blanchett, 2010).Application of MS as indicator of terrigenous inputneeds to be verified by elemental ratio such as Ti/Ca andFe/Ti (Figure 6).
MS and Ti/Ca show similar pattern of relativelyconstant value from 450 AD to 1700 AD and doublesafter 1700 AD (Figure 6). Those patterns suggest thatMS is carried mainly by Terrigenous Iron Oxide or TIO(Blanchett, 2010). Fe/Ti shows narrow fluctuationsbetween 10 and 20 and increase slightly to the surface.This pattern differ from MS pattern, thus showing that
the sediments are unaffected by diagenetic process.Comparison between MS to Ti/Ca and Fe/Ti indicatethat MS record of this core reflects terrigenous inputinto the site. Figure 6 shows an increase of terrigenousinput since 1700 AD that peaked at 1831 AD.
L* is declining upward and shows slight fluctuationaround 44. The decline reflects increasing organiccontent, following Sari et al. (2014).
DISCUSSIONS
Factors Controlling Heavy Metal Concentration in the Sediment
There are numerous factors that controlconcentrations and vertical distributions of heavymetals in sediment, such as: grain size, composition ofsediments, organic matter content, individual andcombined effects of Eh and pH, etc. (Forstner andWittmann 1979). Those factors might influence the
Heavy Metal
Geochemical Background
(ppm)
Stream Sediment
Sampling (ppm)
Baseline level (ppm) Igeo Igeo Class Sediment Quality
Cu 45 14 – 40 12.88 -1.97 0 Unpolluted Pb 20 23 - 89 - -0.40 0 Unpolluted Zn 95 121 – 236 95.5 -0.23 0 Unpolluted Cd 0.3 - - -3.18 0 Unpolluted Cr 90 104 – 256 60.13 -0.49 0 Unpolluted
Table 3. Baseline level and mean Igeo of TJ-17 sediments. Geochemical background is from shale of Turekian andWedepohl (1961). Stream sediment sampling data from Center for Geological Survey (PSG, 2015). Igeoclassification follows Zahra et al. (2014).
Figure 6. Comparison of MS to L*, Ti/Ca, Fe/Ti and Fe/Ca.

126 Rina Zuraida et al.
bonding and enrichment of heavy metal in marinesediment if the depositional environment, characterizedby the chemical composition, salinity, pH, redoxpotential and hydrodynamic conditions, are favourable(Kljakovic-Gaspic et al., 2008).
It is understood that sediment grain size andcomposition can influence heavy metal concentration.Jakarta Bay sediment is demonstrated to be composedmainly of silt and clayey silt (Figure 3) that might bindheavy metal to the sediments. Sediment composition isaffected by local geology that influences naturalbackground level. Heavy metal concentration (Figure5) and XRF scanning of TJ-17 (Figure 6) show thatdrastic increase of terrigenous influx is notcomplemented by strong concentration increase of allheavy metal, thus suggesting partial contribution ofterrigenous influx in the variation of heavy metalconcentration in study area.
Positive correlation betwen organic content andCu, Zn and Cr was observed in Arabian Sea (Shetye etal., 2009), while correlation between organic contentand Pb was reported from India (Sudhanandh et al.,2011). Slight increase of organic content in TJ-17 thatcorresponds with increasing Cu, Zn, and Cr (Figure 5and Figure 6) indicates that Cu, Zn and Cr accumulationin Jakarta Bay sediment is partially controlled byorganic content.
Heavy Metal As a Reflection of Anthropogenic Activities Since 500 AD
Heavy metal records of Cu, Zn and Cr can bedivided into three periods that are characterised bystepwise increase: (I) 476 – 933 AD, (II) 933 – 1799AD, and (III) 1799 – 1991 AD. Period I is characterisedby increase of Cu, Zn and Cr followed by slight declinebefore the end of the period (Figure 5). This periodmight be related to the development of agriculturalirrigation and drainage ditches between 450 – 500 ADordered by Purnawarman, the third king ofTarumanegara (Walker and Santoso, 1977). The slightdecline might indicate limited change of landcover inthe region that was indicated by low terrigenous input tosite TJ-17.
The second period, Period II, is typically identifiedby 20% increase in Zn concentration before decliningupward (Figure 5). During this period, Cu, Pb, and Crshow slight increase, while Cd exhibit cyclicalfluctuation. The increase of heavy metals might berelated to agricultural activities during those period.The slight decrease of Zn between 1600 and 1800 ADmight be related to the destruction in the region causedby wars between Europeans and local rulers obstructingdevelopment of agriculture in the region as wasdecribed by Ricklefs (2005).
The third period, Period III, is characterised byincrease of Cu, Pb, Zn, and Cr while Cd content is lowerthan Period II (Figure 5). The early Period III might berelated to the start of cultuurestelsel or compulsorycultivation (Lavigne and Gunnell, 2006) that increasemetal content. Sharp increase of heavy metal in latePeriod III is interpreted as the result of the developmentof modern Indonesia that resulted in landcover changesuch as for agriculture, housing, recreation, fuelconsumption, industrial activities, etc.
CONCLUSIONVertical distribution of heavy metals from site TJ-
17 yields local baseline levels of: Cu, Zn, and Cr are12.88 ppm, 95.5 ppm, and 60.13 ppm. No baselinelevels can be calculated for Pb and Cd due to higherconcentrations of both metals in the lower part of thecore. Igeo calculation indicates that the sediments of siteTJ-17 is relatively unpolluted. Our data suggested thatheavy metal contents in study area are influenced byterrigenous input and organic content.
Based on stepwise increase of Cu, Zn and Cr, wecan differentiate three periods of human activities: (I)476 – 933 AD, (II) 933 – 1799 AD, and (III) 1799 –1991 AD. Sharp increase of heavy metals in late PeriodIII was related increasing human activities in modernIndonesia.
ACKNOWLEDGEMENTThe sampling campaign was conducted during
Environmental Geological and Geological HazardSurvey of Jakarta Bay in 2010 on board R.V. GeomarinI funded by Marine Geological Institute. Heavy metaland grain size analyses were funded by MGI, corescanning activities were funded by MGI and SINasproject from Geotek-LIPI in 2012. 14C dating wasfunded by SINas project from Geotek-LIPI in 2013.The authors would like to thank the Jakarta Bay 2010team for their works. The authors also thank GeomarinI captain and crews for their help. Great appreciation isgiven to Prof. Wahyu Hantoro for his input.
REFERENCESAbrahim, G.M.S., and Parker, R.J., 2008. Assessment
of heavy metal enrichment factors and thedegree of contamination in marine sedimentsfrom Tamaki Estuary, Auckland, New Zealand.Environmental Monitoring and Assessment,136: 227–238, doi: 10.1007/s10661-007-9678-2.
Ali, Mir M., Ali, M.L., Islam, Md.S., and Rahman,Md.Z., 2016. Preliminary assessment of heavymetals in water and sediment of KarnaphuliRiver, Bangladesh. Environmental

Late Holocene Heavy Metals Record of Jakarta Bay Sediments 127
Nanotechnology, Monitoring & Management,5: 27–35.
Appleby, P.G., 1998. Dating recent sediments by210Pb: Problems and solutions. In E. Ilus(Editor), Dating of sediments and determinationrate. Helsinki: STUK (Finland Radiation andNuclear Safety Authority), STUK-A145, 7-24.
Balkis, N., Aksu, A., Oku, E., and Apak, R., 2009.Heavy metal concentrations in water, suspendedmatter, and sediment from Gökova Bay, Turkey.Environmental Monitoring Assessment,167(1–4): 359–370, doi: 10.1007/s10661-009-1055-x.
Barbieri, M., 2016. The Importance of EnrichmentFactor (EF) and Geoaccumulation Index (Igeo)to Evaluate the Soil Contamination. Journal ofGeology and Geophysics, 5(1): 1-4, doi:10.4172/2381-8719.1000237.
Birch, G., 2017. Determination of sediment metalbackground concentrations and enrichment inmarine environments – A critical review.Science of The Total Environment, 580: 813-831, doi: 10.1016/j.scitotenv.2016.12.028.
Blanchet, C.L. 2010. Combining MagneticSusceptibility and XRF Measurements: A toolfor paleo-environmental reconstructions[powerpoint presentation]. Presentation at XRFWorkshop.
Boer, W., van den Bergh, G.D., de Haas, H., de Stigter,H.C., Gieles, R., and van Weering, Tj.C.E.,2006. Validation of accumulation rates in TelukBanten (Indonesia) from commonly applied210Pb models, using the 1883 Krakatau tephraas time marker. Marine Geology, 227(3–4):263-277,https://doi.org/10.1016/j.margeo.2005.12.002.
Callender, E., 2003. Heavy Metals in the Environment– Historical Trends. In: H.D. Holland and K.K.Turekian (Editors), Treatise on Geochemistry,9: 67-105, https://doi.org/10.1016/B0-08-043751-6/09161-1.
Calmano, W., Ahlf, E., and Forstner, U., 1996.Sediment quality and assessment: chemical andbiological approaches. In: W. Calmano, and U.Forstner (Editors), Sediments and toxicsubstances: environmental effects andecotoxicity. Springer, Berlin, 1-35.
Cordova, M.R., Purbonegoro, T., Puspitasari, R., andHendarti, D., 2016. Assessing ContaminationLevel of Jakarta Bay Nearshore Sedimentsusing Green Mussel (Perna Viridis) Larvae.Marine Research Indonesia, 14(2): 67-76.
Croudace, I.W., Rindby, A., Rothwell R.G. 2006.ITRAX: Description and evaluation of a newmulti-function X-ray core scanner. Di dalam:Rothwell RG. (ed.) New Techniques inSediment Core Analysis. Geological Society.London (GB): Special Publications, 267: 51-63.
Crounse, R.G., Pories, W.J., Bromley, R.G., andMauger, R.L., 1983. Geochemistry and Man:Health amd Disease, 2. Essential elements. In: I.Thornton (Editor), Applied EnvironmentalGeochemistry. Academic Press, London, 267-308.
Decena, S.C.P., Arguelles, M.S., and Robel, L.L.,2018. Assessing Heavy Metal Contamination inSurface Sediments in an Urban River in thePhilippines. Pol. J. Environ. Stud., 27(5): 1983-1995, doi: 10.15244/pjoes/75204.
Fallon, S.J., Fifield, L.K., and Chappell, J.M., 2010.The next chapter in radiocarbon dating at theAustralian National University: Status report onthe single stage AMS. Nuclear Instruments andMethods in Physics Research Section B: BeamInteractions with Materials and Atoms,268(7–8): 898-901.
Farhan, A.R., and Lim, S., 2012. Vulnerabilityassessment of ecological conditions in SeribuIslands, Indonesia. Ocean & CoastalManagement, 65: 1-14, https://doi.org/10.1016/j.ocecoaman.2012.04.015.
Folk, R.L., 1980. Petrology of Sedimentary Rocks.Hemphill, Austin Texas, 182p.
Forstner, U., 1983. Assessment of Metal Pollution inRivers and Estuaries. In: I. Thornton (Editor),Applied Environmental Geochemistry.Academic Press, London, 395-424.
Forstner, U., and Wittmann, G.T.W., 1979. Metalpollution in the aquatic environment. Springer,Berlin, 508p.
Hosono, T., Su, C-C., Delinom, R., Umezawa, Y.,Toyota, T., Kaneko, S., and Taniguchi, M.,2011. Decline in heavy metal contamination inmarine sediments in Jakarta Bay, Indonesia dueto increasing environmental regulations.Estuarine, Coastal and Shelf Science, 92(2):297-306, doi: 10.1016/j.ecss.2011.01.010.
Howarth, R.J., and Thornton, I., 1983. Regionalgeochemical mapping and its application toenvironmental studies in I. Thornton (Editor).Applied Environmental Geochemistry.Academic Press, London, 41-73.
Järup, L., 2003. Hazards of heavy metalcontamination. British Medical Bulletin,

128 Rina Zuraida et al.
68(1): 167-182, https://doi.org/10.1093/bmb/ldg032.
Kenna, T.C., Nitsche, F.O., Herron, M.M., Mailloux,B.J., Peteet, D., Sritrairat, S., Sands, E., andBaumgarten, J., 2010. Evaluation andcalibration of a Field Portable X-RayFluorescence spectrometer for quantitativeanalysis of siliciclastic soils and sediments.Journal of Analytical Atomic Spectrometry,211: 395 – 405, doi: 10.1039/c0ja00133c.
Kljakovic-Gaspic, Z., Bogner, D., and Ujevic, I., 2008.Trace metals (Cd, Pb, Cu, Zn and Ni) insediment of the submarine pit Dragon ear(Soline Bay, Rogoznica, Croatia).Environmental Geology, 58: 751-760, doi:10.1007/s00254-008-1549-9.
Kouadia, L., and Trefry, J.H., 1987. Sediment tracemetal contamination in the Ivory Coast, WestAfrica. Water, Air and Soil Pollution, 32: 145-154.
Kowalska, J.B., Mazurek, R., Gasiorek, R., andZaleski, T., 2018. Pollution indices as usefultools for the comprehensive evaluation of thedegree of soil contamination–A review.Environmental Geochemistry and Health,https://doi.org/10.1007/s10653-018-0106-z.
Kundu, P.M., and Olang, L.O., 2011. The impact ofland use change on runoff and peak flooddischarges for the Nyando River in LakeVictoria drainage basin, Kenya. WITTransactions on Ecology and the Environment,153: 83-94, doi: 10.2495/WS110081.
Lavigne, F., and Gunnell, Y., 2006. Land cover changeand abrupt environmental impacts on Javanvolcanoes, Indonesia: a long-term perspectiveon recent events. Regional EnvironmentalChange, 6: 86-100.
Lowe, J.J., and Walker, M.J.C., 1997. ReconstructingQuaternary Environments (2nd edition). Harlow:Addison Longman.
Permanawati, Y., Zuraida, R., and Ibrahim, A., 2013.Kandungan Logam Berat (Cu, Pb, Zn, Cd, danCr) Dalam Air Dan Sedimen Di Perairan TelukJakarta. Jurnal Geologi Kelautan, 4(1): 9-16.
Pusat Survei Geologi (PSG), 2015. Atlas GeokimiaJawa Bagian Barat. Kementerian Energi DanSumber Daya Mineral. Badan Geologi.
Putri, A., Pearson, S., and Windupranata, W., 2015.Sustaining the Environments – Sustaining theLivelihoods: Insights from the Coast of Jakarta,Indonesia. Proceedings of the 15th Indonesian
Scholars International Convention. London,11p.
Ricklefs, M.C., 2005. Sejarah Indonesia Moderen.Serambi, 135-259.
Rochyatun, E., and Rozak, A., 2007. Monitoring ofheavy metal concentration in the sediment ofJakarta Bay. Makara Sains. 11: 28-36 (inBahasa Indonesia).
Rothwell, R.G., and Rack, F.R., 2006. New techniquesin sediment core analysis: an introduction. In:R.G. Rothwell (Editor), New Techniques inSediment Core Analysis. Geological Society,London, Special Publications, 267: 1-29.
Sari, T.A., Atmodjo, W., and Zuraida, R., 2014. StudiBahan Organik Total (BOT) Sedimen DasarLaut di Perairan Nabire, Teluk Cendrawasih,Papua. Jurnal Oseanografi, 3(1): 81-86.
Shetye, S.S., Sudhakar, M., Mohan, R., and Tyagi, A.,2009. Implications of organic carbon, traceelemental and CaCO3 variations in a sedimentcore from Arabian Sea. Indian Journal ofScience, 38: 432-438.
Southon, J., Kashgarian, M., Fontugne, M., Metivier,B., and Yim, W.W-S., 2002. Marine reservoircorrections for the Indian Ocean and SoutheastAsia. Radiocarbon, 44: 167-180.
Stuiver, M., and Reimer, P.J., 1993. Extended 14C database and revised CALIB 3.0 14C age calibrationprogram. Radiocarbon, 35: 215-230.
Stuiver, M., Reimer, P.J., and Reimer, R.W., 2019.CALIB 7.1 [WWW program] at http://calib.org,accessed 2019-2-19.
Sudhanandh, V.S., Udayakumar, P., Ouseph, P.P.,Amaldev, S., and Narendra Babu, K., 2011.Dispersion and Accumulation Trend of HeavyMetals in Coastal and Estuarine Sediments andits Textural Characteristics, a case Study inIndia. Journal of Human Ecology, 36: 85-90.
Turekian, K.K., and Wedepohl, K.H., 1961.Distribution of the elements in some major unitsof the earth's crust. Geological Society ofAmerica Bulletin, 72: 175-92.
Walker, M.J., and Santoso, S., 1977. Romano-IndianRouletted Pottery in Indonesia. AsianPerspectives, XX: 228-235.
Zahra, A., Hashm, M.Z., Malik, R.N., and Ahmed, Z.,2014. Enrichment and geo-accumulation ofheavy metals and risk assessment of sedimentsof the Kurang Nallah-Feeding tributary of theRawal Lake Reservoir, Pakistan. Science of theTotal Environment. Elsevier, 470-471: 925-933.

Late Holocene Heavy Metals Record of Jakarta Bay Sediments 129
Zhao, G., Ye, S., Yuan, H., Ding, X., and Wang, J.,2017. Surface Sediment Properties and HeavyMetal Pollution Assessment In The Pearl RiverEstuary, China. Environmental SciencePollution Research, 24: 2966-2979, doi:10.1007/s11356-016-8003-4.
Zhuang, W., and Gao, X., 2014. Integrated Assessmentof Heavy Metal Pollution in the SurfaceSediments of the Laizhou Bay and the CoastalWaters of the Zhangzi Island, China:Comparison among Typical Marine SedimentQuality Indices. PLoS ONE, 9(4): e94145,doi:10.1371/journal.pone.0094145.
Zuraida, R., Rahardiawan, R., Subarsyah, Dewi, K.T.,Widi, H.C., Soeprapto, T.A., Yayu, N.,Adhirana, I., Permanawati, Y., Ibrahim, A.,Saefudin, A., Subekti, A., Mulyono, Supriyatna,Heriyanto, and Eko, R.D., 2010. PenelitianLingkungan dan Kebencanaan GeologiKelautan Perairan Teluk Jakarta (Tanjung Kait –Muara Gembong). Pusat Penelitian danPengembangan Geologi Kelautan, Bandung,Badan Penelitian dan Pengembangan Energidan Sumberdaya Mineral, Departemen Energidan Sumberdaya Mineral. Internal report.Unpublished.

130 Rina Zuraida et al.