Lapindo Brantas
27
1 Au di ti ng th e Hot Mud Eru pt io n In Sid oar jo , East Jav a, Ind on esi a with Environmental Perspectives 1 Introdu ct ion Th e mu d e r up t io n t h at s t arte d in Porong, Dis t r ic t o f S id oa r jo , East J a v a on Ma y 29, 2006 at 5,000 m 3/day (currently reachi ng 170 ,000 m 3/day) at an expl oration wel l owne d by PT La pindo Branta s Inc. (L BI ) was a tra gic e ve nt to b e sure . The cata strophe a nd its ha ndli ng indica te a num ber of issu es. First, it is the result of the ne glige nce of a ce rtain comp an y. The com pa ny, L BI, a pu bl ic com pa ny liste d in De lawa re, USA , contracte d the un-reput a ble com pa ny whi ch most l ikely its own sub sidi ary to do th e e xplorati on. The com pa ny exp lored th e we ll us ing risky an d care les s tech ni que s such a s drilling throug h an ove rpress ure form at ion wi thou t adequate casing and drilling a high risk exploration well close to a densely populated area without in- de pth an d comp rehen sive survey and risk asse ssm ent . Furtherm ore, the dri lling process was done by inexpe ri enced a nd i ncom pete nt pe rsonnel using inade quate e quipm ent. Secondl y, the gove rnme nt’s res ponse in ha ndl ing the im pact of m ud i s ve ry sl ow. Th e Go v e r nment ac t e d s lo w ly in h e lp in g t h e v ic t im s an d r e lo ca t in g t h em an d t h e v it a l inf rastructures, such a s ga s pi pe and el ectricity power transm issi on, to the sa fe a reas . Th e vic t ims, who have lost more t han 11 t housands homes and t wo dozen business tha t have b ee n buried i n m ore than 6 s q km und er 20 m deep covering ni ne village s in Si doa rj o area , coul d not be helped im m edi ate ly due to the absen ce of protecti on of prope rty righ ts. Moreover, the choke d-of f of tran sp ortation to the m ain sea port of Ta n ju n g Pe r a k a n d J uan d a Airp o r t, nea r S u r a b a y a , t h e ca p it a l o f Ea st J a v a , h as a ls o ne ga tively affec te d the econom y of hinte rl an d in the sou the rn pa rt of Eas t J ava . A ll of thes e governmen tal delays i nduce d wi de -sprea d nega tive im pacts to the en vironme nt and economy. Furthermore, the little progress in prosecution of who are responsible for the drilling fail ure is also the ind ica tion of the gove rnm e nt’s slow res pon se . I t took nine m onths f or the police to com plete the inves tigat ion; however, the ca se has yet to go to trial. Only i ndivi dua l em pl oyee an d contract or, not the c om pa ny, are be ing probe d as suspects. 1 A pa pe r pre pa red for the El e ven th Mee ting of INTOSAI-WGEA, Arush a, Tanza nia, on J une 28 , 2007.
Transcript of Lapindo Brantas
7/29/2019 Lapindo Brantas
http://slidepdf.com/reader/full/lapindo-brantas 1/27
1
Auditing the Hot Mud Erupt ion In Sidoar jo, East Java, Indonesia
with Environmental Perspectives1
Introduction
The mud eruption that started in Porong, District of Sidoarjo, East Java on May
29, 2006 at 5,000 m3/day (currently reaching 170,000 m3/day) at an exploration well
owned by PT Lapindo Brantas Inc. (LBI) was a tragic event to be sure. The
catastrophe and its handling indicate a number of issues. First, it is the result of the
negligence of a certain company. The company, LBI, a public company listed in
Delaware, USA, contracted the un-reputable company which most likely its own
subsidiary to do the exploration. The company explored the well using risky and
careless techniques such as drilling through an overpressure formation without
adequate casing and drilling a high risk exploration well close to a densely populated
area without in-depth and comprehensive survey and risk assessment. Furthermore,
the drilling process was done by inexperienced and incompetent personnel using
inadequate equipment.
Secondly, the government’s response in handling the impact of mud is very slow.
The Government acted slowly in helping the victims and relocating them and the vital
infrastructures, such as gas pipe and electricity power transmission, to the safe areas.
The victims, who have lost more than 11 thousands homes and two dozen business
that have been buried in more than 6 sq km under 20 m deep covering nine villages in
Sidoarjo area, could not be helped immediately due to the absence of protection of
property rights. Moreover, the choked-off of transportation to the main seaport of
Tanjung Perak and Juanda Airport, near Surabaya, the capital of East Java, has also
negatively affected the economy of hinterland in the southern part of East Java. All of
these governmental delays induced wide-spread negative impacts to the environment
and economy.
Furthermore, the little progress in prosecution of who are responsible for thedrilling failure is also the indication of the government’s slow response. It took nine
months for the police to complete the investigation; however, the case has yet to go to
trial. Only individual employee and contractor, not the company, are being probed as
suspects.
1 A paper prepared for the Eleventh Meeting of INTOSAI-WGEA, Arusha, Tanzania, on June 28,2007.
7/29/2019 Lapindo Brantas
http://slidepdf.com/reader/full/lapindo-brantas 2/27
2
The absence of effective, low cost of enforcement of contract caused a slower
response in helping the victims. On 4 December 2006, six months after the eruption
occurred, LBI agreed to buy the entire victim’s destroyed properties and pay the
compensation cost. The implementation of the agreement was very slow. Few dozen
victims have begun to receive compensation promised by LBI.
The slow response of the government is partly because the LBI is owned by the
family of Mr. Aburizal Bakrie, the Coordinating Minister for Social Affair whose in-
charge in coordinating the handling of the eruption. The minister is a prominent
member of the leading political party. The Bakrie group is a local business
conglomerate that has interest in many business sectors, mainly trading and
plantations. LBI is the first interest of the group in oil exploration and exploitation.
The Source of Disaster
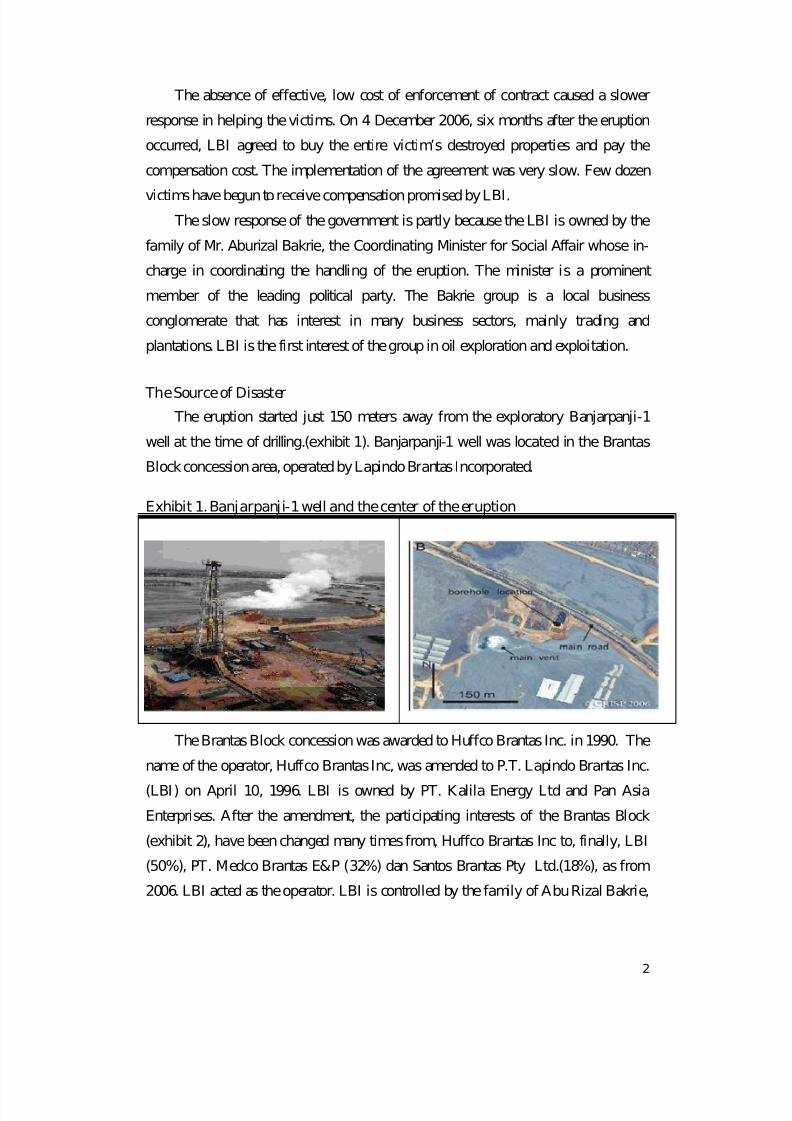
The eruption started just 150 meters away from the exploratory Banjarpanji-1
well at the time of drilling.(exhibit 1). Banjarpanji-1 well was located in the Brantas
Block concession area, operated by Lapindo Brantas Incorporated.
Exhibit 1. Banjarpanji-1 well and the center of the eruption
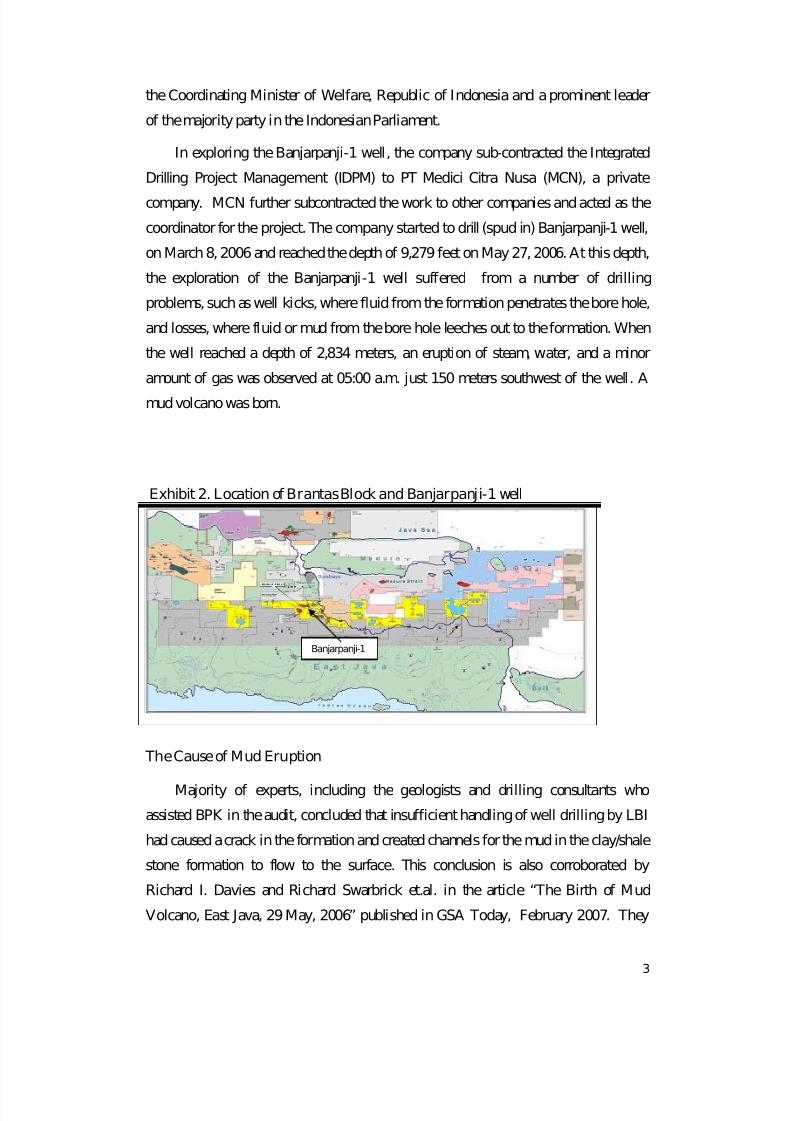
The Brantas Block concession was awarded to Huffco Brantas Inc. in 1990. The
name of the operator, Huffco Brantas Inc, was amended to P.T. Lapindo Brantas Inc.
(LBI) on April 10, 1996. LBI is owned by PT. Kalila Energy Ltd and Pan Asia
Enterprises. After the amendment, the participating interests of the Brantas Block
(exhibit 2), have been changed many times from, Huffco Brantas Inc to, finally, LBI
(50%), PT. Medco Brantas E&P (32%) dan Santos Brantas Pty Ltd.(18%), as from
2006. LBI acted as the operator. LBI is controlled by the family of Abu Rizal Bakrie,
7/29/2019 Lapindo Brantas
http://slidepdf.com/reader/full/lapindo-brantas 3/27
3
the Coordinating Minister of Welfare, Republic of Indonesia and a prominent leader
of the majority party in the Indonesian Parliament.
In exploring the Banjarpanji-1 well, the company sub-contracted the Integrated
Drilling Project Management (IDPM) to PT Medici Citra Nusa (MCN), a private
company. MCN further subcontracted the work to other companies and acted as the
coordinator for the project. The company started to drill (spud in) Banjarpanji-1 well,
on March 8, 2006 and reached the depth of 9,279 feet on May 27, 2006. At this depth,
the exploration of the Banjarpanji-1 well suffered from a number of drilling
problems, such as well kicks, where fluid from the formation penetrates the bore hole,
and losses, where fluid or mud from the bore hole leeches out to the formation. When
the well reached a depth of 2,834 meters, an eruption of steam, water, and a minor
amount of gas was observed at 05:00 a.m. just 150 meters southwest of the well. A
mud volcano was born.
Exhibit 2. Location of Brantas Block and Banjarpanji-1 well
The Cause of Mud Eruption
Majority of experts, including the geologists and drilling consultants who
assisted BPK in the audit, concluded that insufficient handling of well drilling by LBI
had caused a crack in the formation and created channels for the mud in the clay/shale
stone formation to flow to the surface. This conclusion is also corroborated by
Richard I. Davies and Richard Swarbrick et.al. in the article “The Birth of Mud
Volcano, East Java, 29 May, 2006” published in GSA Today, February 2007. They
Banjarpanji-1
7/29/2019 Lapindo Brantas
http://slidepdf.com/reader/full/lapindo-brantas 4/27
4
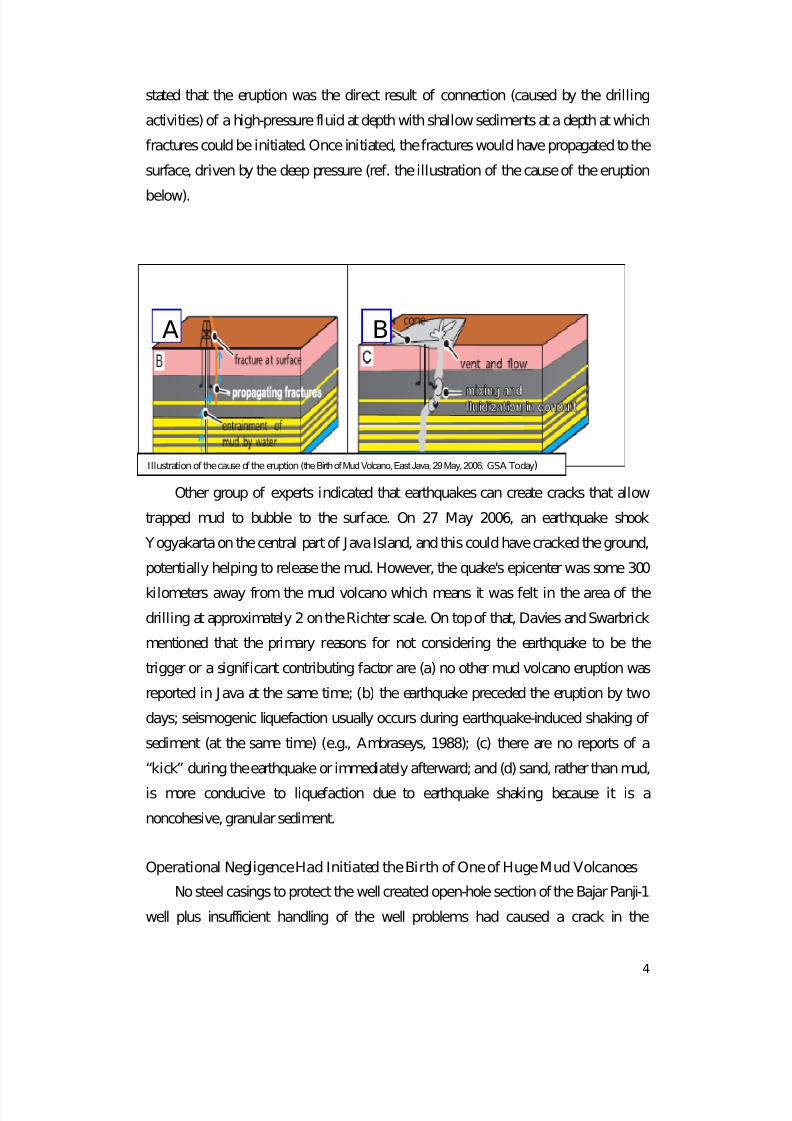
stated that the eruption was the direct result of connection (caused by the drilling
activities) of a high-pressure fluid at depth with shallow sediments at a depth at which
fractures could be initiated. Once initiated, the fractures would have propagated to the
surface, driven by the deep pressure (ref. the illustration of the cause of the eruption
below).
Other group of experts indicated that earthquakes can create cracks that allow
trapped mud to bubble to the surface. On 27 May 2006, an earthquake shook
Yogyakarta on the central part of Java Island, and this could have cracked the ground,
potentially helping to release the mud. However, the quake's epicenter was some 300
kilometers away from the mud volcano which means it was felt in the area of the
drilling at approximately 2 on the Richter scale. On top of that, Davies and Swarbrick
mentioned that the primary reasons for not considering the earthquake to be the
trigger or a significant contributing factor are (a) no other mud volcano eruption was
reported in Java at the same time; (b) the earthquake preceded the eruption by two
days; seismogenic liquefaction usually occurs during earthquake-induced shaking of
sediment (at the same time) (e.g., Ambraseys, 1988); (c) there are no reports of a
“kick” during the earthquake or immediately afterward; and (d) sand, rather than mud,
is more conducive to liquefaction due to earthquake shaking because it is a
noncohesive, granular sediment.
Operational Negligence Had Initiated the Birth of One of Huge Mud Volcanoes
No steel casings to protect the well created open-hole section of the Bajar Panji-1
well plus insufficient handling of the well problems had caused a crack in the
Illustration of the cause of the eruption (the Birth of Mud Volcano, East Java, 29 May, 2006, GSA Today)
A B
7/29/2019 Lapindo Brantas
http://slidepdf.com/reader/full/lapindo-brantas 5/27
5
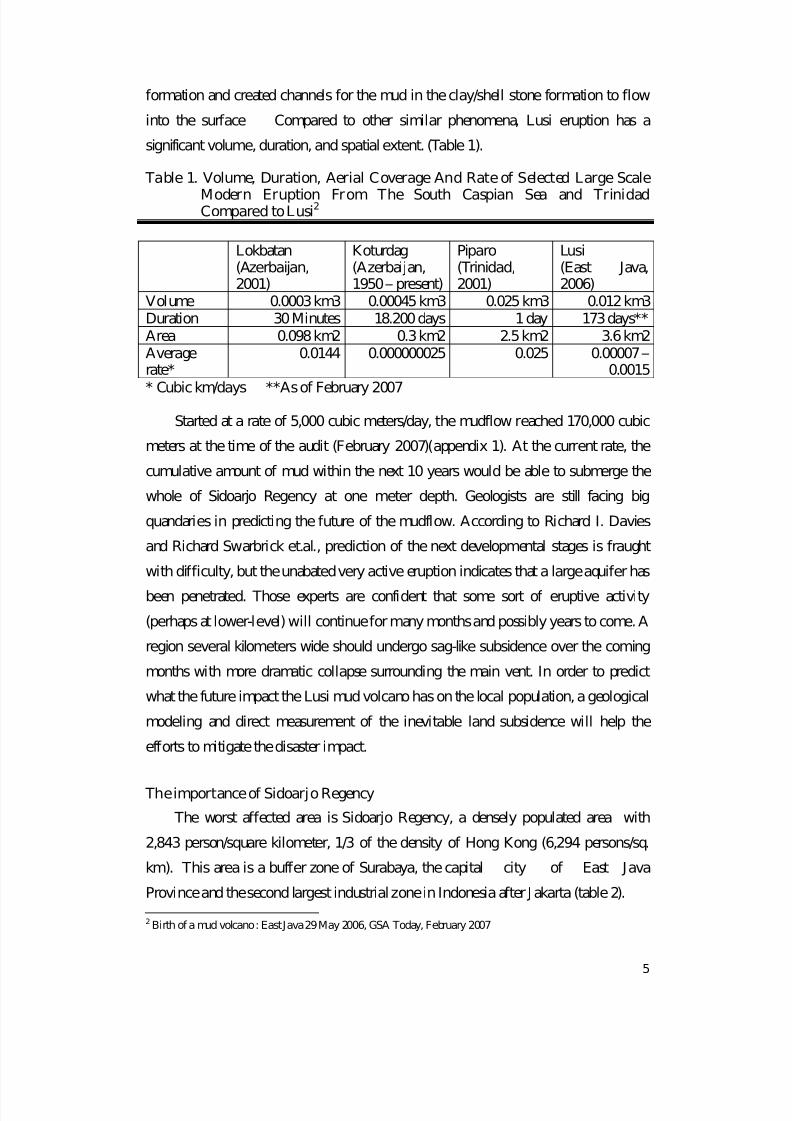
formation and created channels for the mud in the clay/shell stone formation to flow
into the surface Compared to other similar phenomena, Lusi eruption has a
significant volume, duration, and spatial extent. (Table 1).
Table 1. Volume, Duration, Aerial Coverage And Rate of Selected Large Scale
Modern Eruption From The South Caspian Sea and TrinidadCompared to Lusi2
Lokbatan(Azerbaijan,2001)
Koturdag(Azerbaijan,1950 – present)
Piparo(Trinidad,2001)
Lusi(East Java,2006)
Volume 0.0003 km3 0.00045 km3 0.025 km3 0.012 km3Duration 30 Minutes 18.200 days 1 day 173 days**Area 0.098 km2 0.3 km2 2.5 km2 3.6 km2Averagerate*
0.0144 0.000000025 0.025 0.00007 –0.0015
* Cubic km/days **As of February 2007
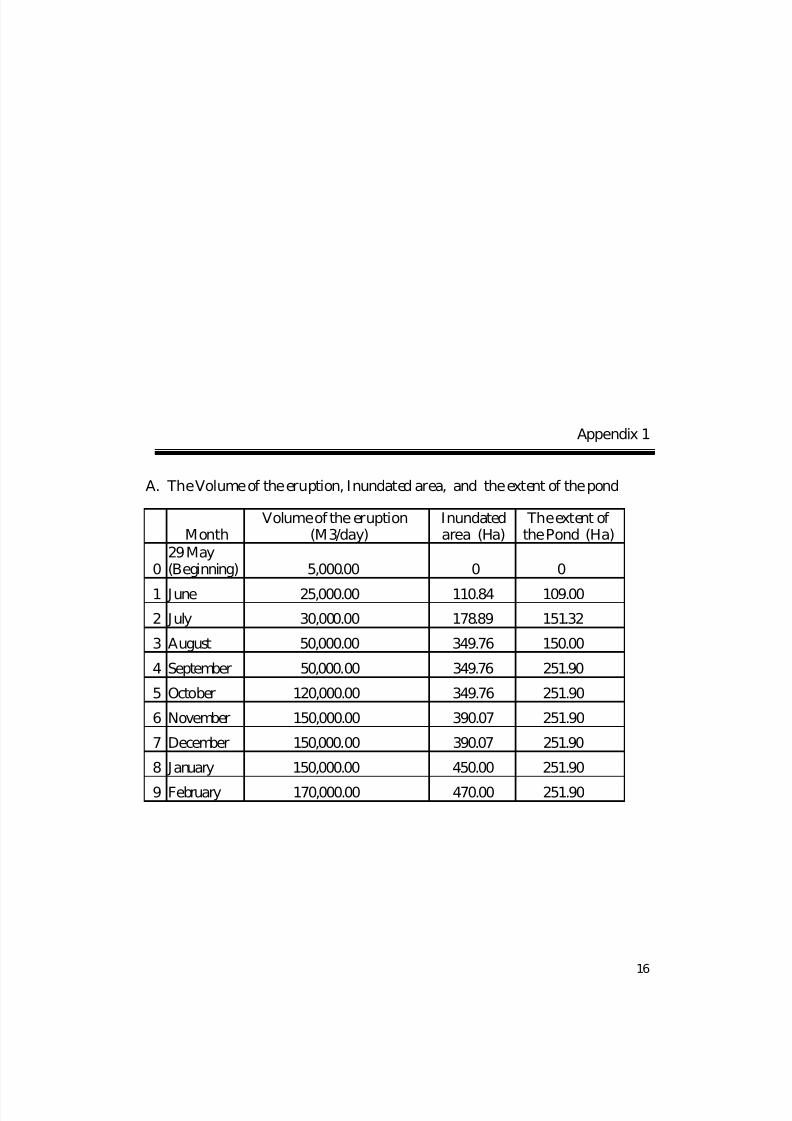
Started at a rate of 5,000 cubic meters/day, the mudflow reached 170,000 cubic
meters at the time of the audit (February 2007)(appendix 1). At the current rate, the
cumulative amount of mud within the next 10 years would be able to submerge the
whole of Sidoarjo Regency at one meter depth. Geologists are still facing big
quandaries in predicting the future of the mudflow. According to Richard I. Davies
and Richard Swarbrick et.al., prediction of the next developmental stages is fraught
with difficulty, but the unabated very active eruption indicates that a large aquifer has
been penetrated. Those experts are confident that some sort of eruptive activity
(perhaps at lower-level) will continue for many months and possibly years to come. A
region several kilometers wide should undergo sag-like subsidence over the coming
months with more dramatic collapse surrounding the main vent. In order to predict
what the future impact the Lusi mud volcano has on the local population, a geological
modeling and direct measurement of the inevitable land subsidence will help the
efforts to mitigate the disaster impact.
The importance of Sidoarjo Regency
The worst affected area is Sidoarjo Regency, a densely populated area with
2,843 person/square kilometer, 1/3 of the density of Hong Kong (6,294 persons/sq.
km). This area is a buffer zone of Surabaya, the capital city of East Java
Province and the second largest industrial zone in Indonesia after Jakarta (table 2).
2 Birth of a mud volcano : East Java 29 May 2006, GSA Today, February 2007
7/29/2019 Lapindo Brantas
http://slidepdf.com/reader/full/lapindo-brantas 6/27
6
Table 2. The Characteristics of Sidoarjo Regency
1. Area of the land :a. Rice field 28,763 Ha
b. Sugar cane plantation 8,000 Hac. Fishpond 15,729 Had. Others (manufacturing and residence) 10,998 Ha
Total the area of land 63,490 Ha2. Population 1,682,000 persons3. Population Density (in 2003) 2,843 persons/sq. km
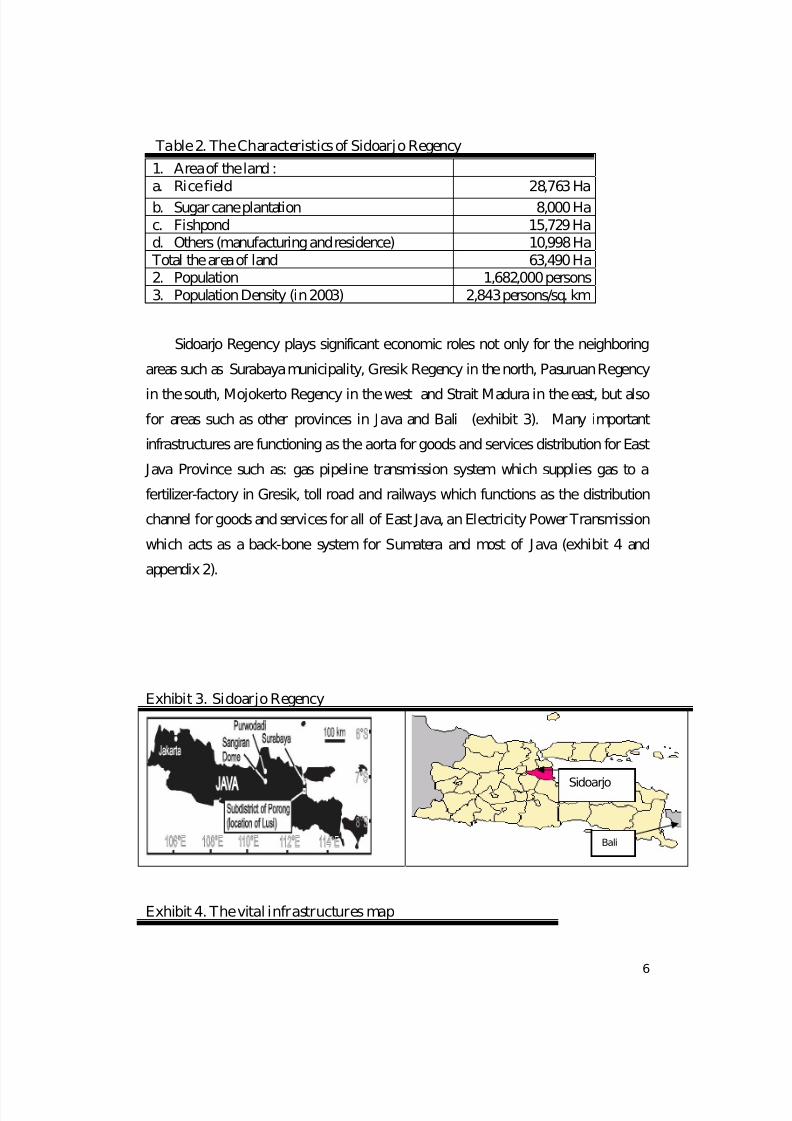
Sidoarjo Regency plays significant economic roles not only for the neighboring
areas such as Surabaya municipality, Gresik Regency in the north, Pasuruan Regency
in the south, Mojokerto Regency in the west and Strait Madura in the east, but also
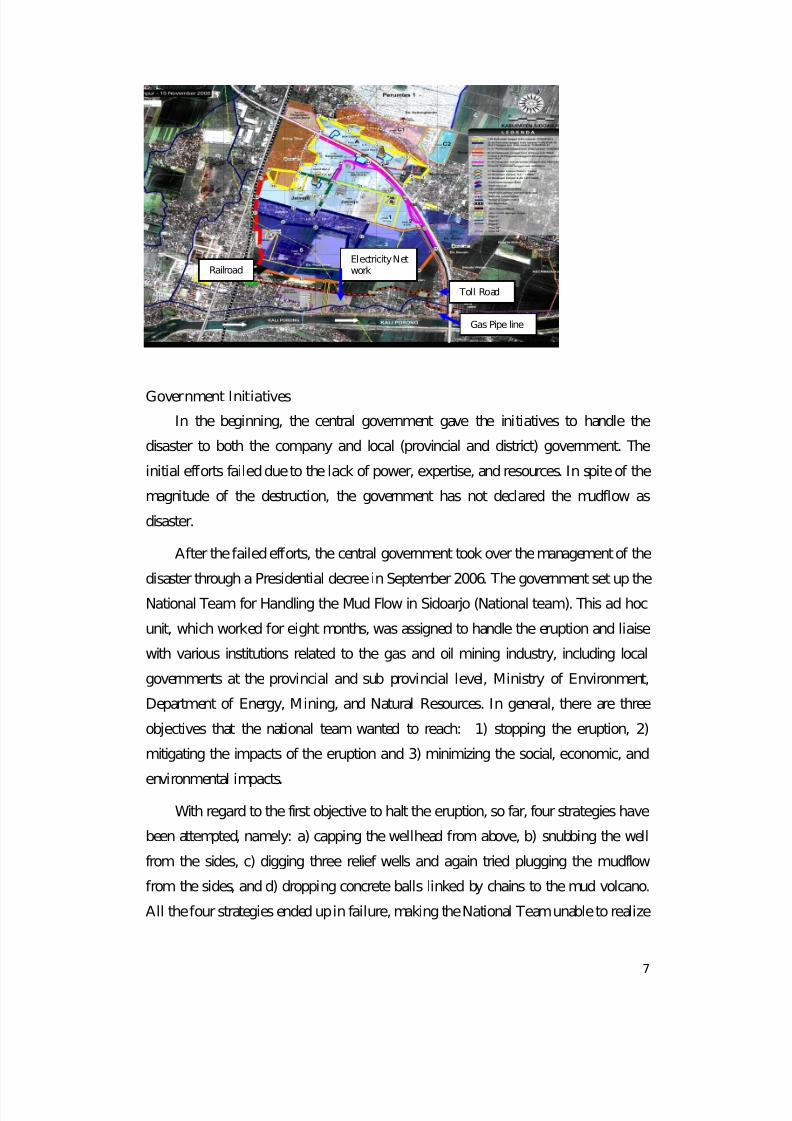
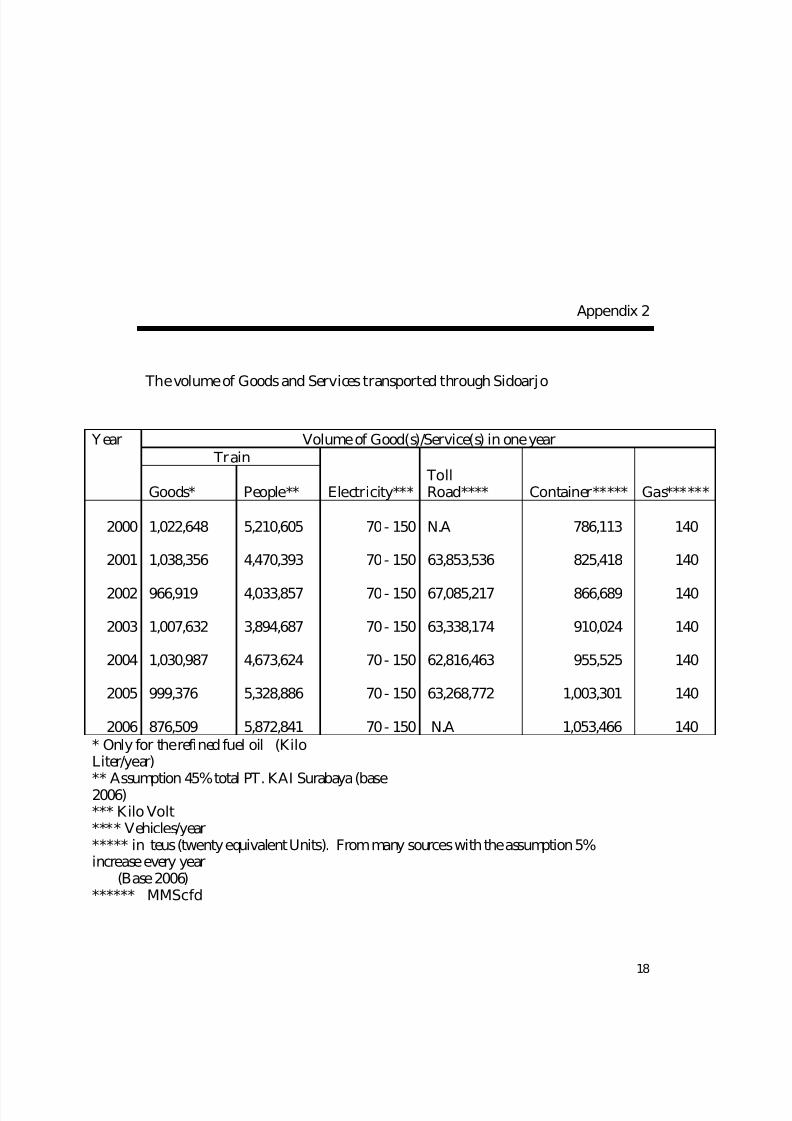
for areas such as other provinces in Java and Bali (exhibit 3). Many important
infrastructures are functioning as the aorta for goods and services distribution for East
Java Province such as: gas pipeline transmission system which supplies gas to a
fertilizer-factory in Gresik, toll road and railways which functions as the distribution
channel for goods and services for all of East Java, an Electricity Power Transmission
which acts as a back-bone system for Sumatera and most of Java (exhibit 4 and
appendix 2).
Exhibit 3. Sidoarjo Regency
Exhibit 4. The vital infrastructures map
Sidoarjo
Bali
7/29/2019 Lapindo Brantas
http://slidepdf.com/reader/full/lapindo-brantas 7/27
7
Government Initiatives
In the beginning, the central government gave the initiatives to handle the
disaster to both the company and local (provincial and district) government. The
initial efforts failed due to the lack of power, expertise, and resources. In spite of the
magnitude of the destruction, the government has not declared the mudflow as
disaster.
After the failed efforts, the central government took over the management of the
disaster through a Presidential decree in September 2006. The government set up the
National Team for Handling the Mud Flow in Sidoarjo (National team). This ad hoc
unit, which worked for eight months, was assigned to handle the eruption and liaise
with various institutions related to the gas and oil mining industry, including local
governments at the provincial and sub provincial level, Ministry of Environment,
Department of Energy, Mining, and Natural Resources. In general, there are three
objectives that the national team wanted to reach: 1) stopping the eruption, 2)
mitigating the impacts of the eruption and 3) minimizing the social, economic, and
environmental impacts.
With regard to the first objective to halt the eruption, so far, four strategies have
been attempted, namely: a) capping the wellhead from above, b) snubbing the well
from the sides, c) digging three relief wells and again tried plugging the mudflow
from the sides, and d) dropping concrete balls linked by chains to the mud volcano.
All the four strategies ended up in failure, making the National Team unable to realize
Gas Pipe line
Toll Road
RailroadElectricity Network
7/29/2019 Lapindo Brantas
http://slidepdf.com/reader/full/lapindo-brantas 8/27
8
its first aim, even after spending US$ 21.83 million. Currently, the government is
considering to use a new but untested strategy, namely, to plug the mud by building a
dam around the crater. The amassing mud will be used to counterweight against the
out flowing mud from the mouth of the volcano. Many experts, however, believe the
flow is unstoppable.
The efforts at mitigating the impacts of the eruption had realized some
achievements. A network of dams and barriers has been erected to contain the mud.
On September 26, 2006 barriers failed, resulting in the flooding of more villages.
Further strengthening of the dam system appeared to contain the sludge and since the
end of September no further reports on breaches have been released. However, the
government was blamed for not effectively relocating infrastructure and for delay in
determining the alternative route for transportation of goods and services. This delay
caused excessive traffic along public roads, causing increased transportation costs.
The third objective had been realized with some successes. As the company is
expected to fully compensate the victims and some of the clear cost, the National
Team facilitated an agreement between the company and the mud eruption victims. In
December 2006, the government declared that LBI, the operator of the well, would
have to pay US$351 million in compensation to people whose houses had been
destroyed by the mud. In addition, the company was expected to pay about US$182
million for efforts to stop the mud between January and March 2007. As of the time of the audit (February 2007), the company had compensated refugees in 9 villages. The
company has given US$ 1.837.400,00 for living allowance, US$ 1.794.000,00 for
renting allowance, and US$ 164.000,00 for moving allowance (appendix 3). In
addition to that, the company also has given US$ 292.631,58 to 21 families to replace
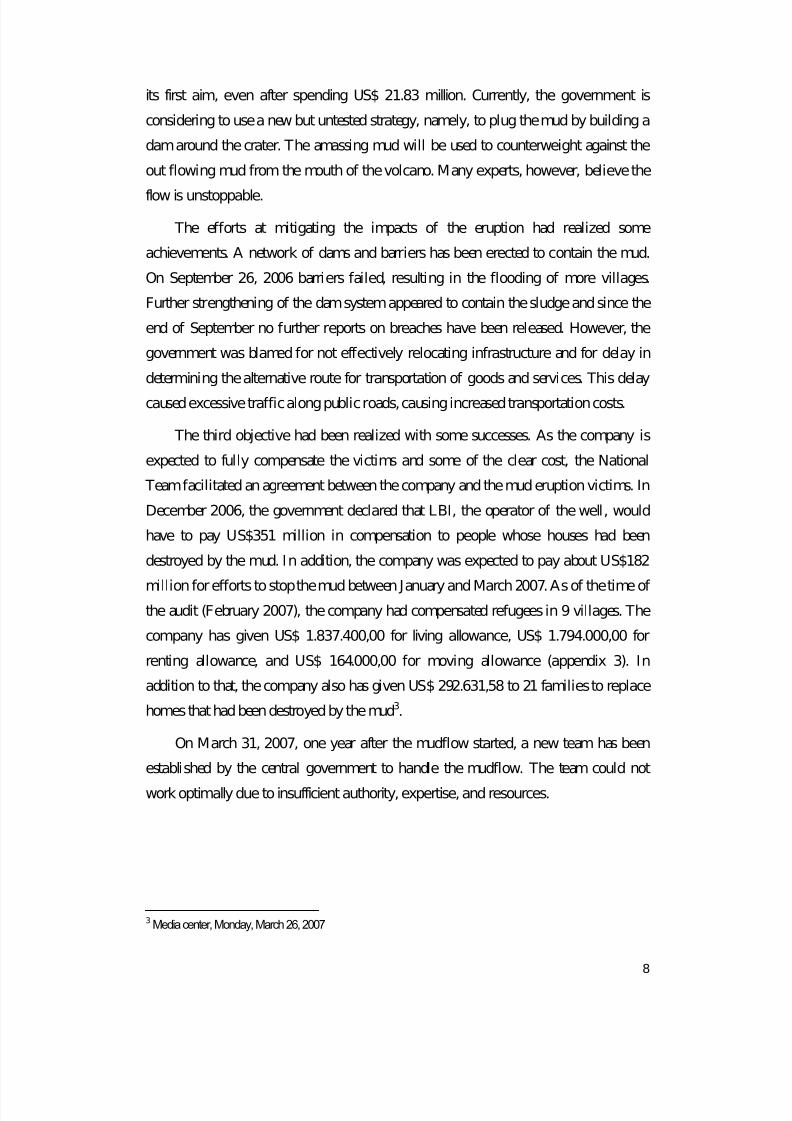
homes that had been destroyed by the mud3.
On March 31, 2007, one year after the mudflow started, a new team has been
established by the central government to handle the mudflow. The team could not
work optimally due to insufficient authority, expertise, and resources.
3 Media center, Monday, March 26, 2007
7/29/2019 Lapindo Brantas
http://slidepdf.com/reader/full/lapindo-brantas 9/27
9
Damage and L oss Assessment
The mud eruption has become an ecological disaster that shows no slowing
down. At the beginning of the eruption, the volume of flow was 5,000 meter
cubic/day and as of February, it reached 170,000 meter cubic /day. The
unprecedented event had made a river of mud on the surface, flooding and
submerging the surrounding areas. The hot torrential mudflow has buried 9 villages,
10,426 units of houses, 18 schools, 2 local government offices, 15 places of worship,
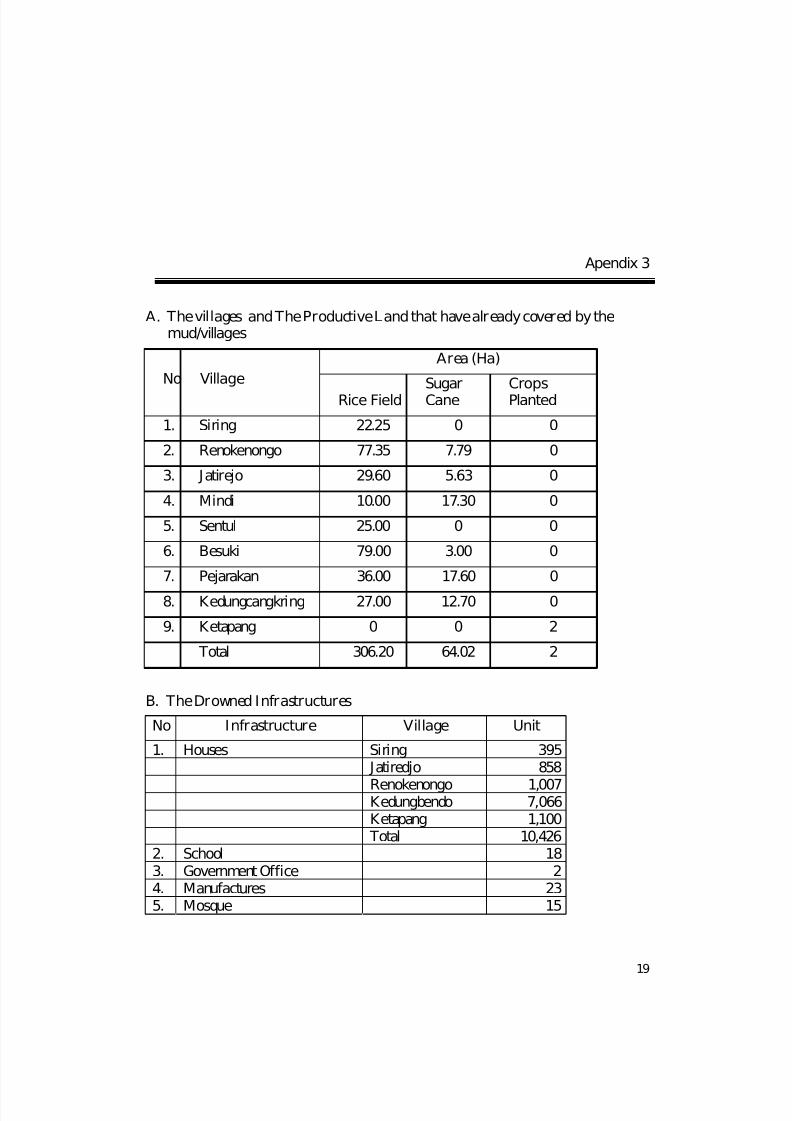
23 factories, and displaced 26,317 people. It has already inundated and contaminated
306 Ha of paddy fields, 64 Ha of sugar cane field, and 2 Ha of various crops
(Appendix 3). The total area that has been inundated is 470 Ha (exhibit 5), which is
equivalent in size to the Kingdom of Monaco. (Appendix 1). At present, the sludge is
still flowing despite all efforts to halt it.
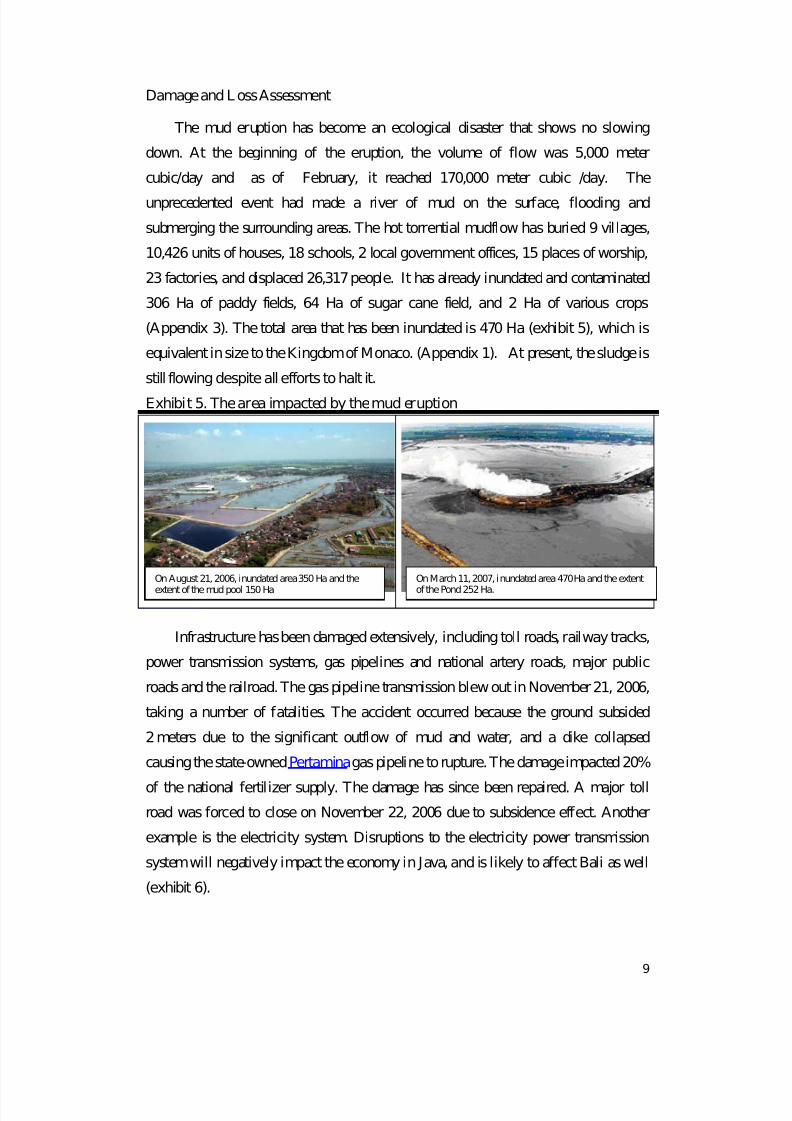
Exhibit 5. The area impacted by the mud eruption
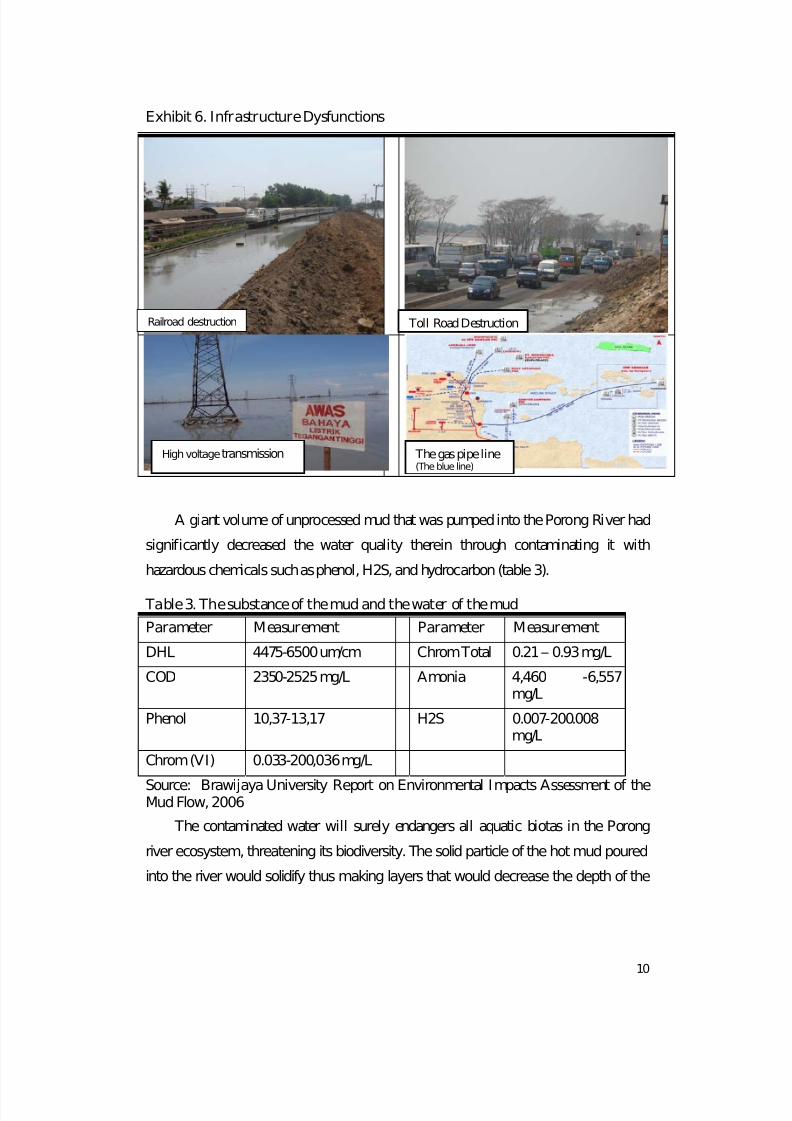
Infrastructure has been damaged extensively, including toll roads, railway tracks,
power transmission systems, gas pipelines and national artery roads, major public
roads and the railroad. The gas pipeline transmission blew out in November 21, 2006,
taking a number of fatalities. The accident occurred because the ground subsided
2 meters due to the significant outflow of mud and water, and a dike collapsed
causing the state-ownedPertaminagas pipeline to rupture. The damage impacted 20%
of the national fertilizer supply. The damage has since been repaired. A major toll
road was forced to close on November 22, 2006 due to subsidence effect. Another
example is the electricity system. Disruptions to the electricity power transmission
system will negatively impact the economy in Java, and is likely to affect Bali as well
(exhibit 6).
On August 21, 2006, inundated area 350 Ha and the
extent of the mud pool 150 Ha
On March 11, 2007, inundated area 470 Ha and the extent
of the Pond 252 Ha.
7/29/2019 Lapindo Brantas
http://slidepdf.com/reader/full/lapindo-brantas 10/27
10
Exhibit 6. Infrastructure Dysfunctions
A giant volume of unprocessed mud that was pumped into the Porong River had
significantly decreased the water quality therein through contaminating it with
hazardous chemicals such as phenol, H2S, and hydrocarbon (table 3).
Table 3. The substance of the mud and the water of the mud
Parameter Measurement Parameter Measurement
DHL 4475-6500 um/cm Chrom Total 0.21 – 0.93 mg/L
COD 2350-2525 mg/L Amonia 4,460 -6,557mg/L
Phenol 10,37-13,17 H2S 0.007-200.008mg/L
Chrom (VI) 0.033-200,036 mg/L
Source: Brawijaya University Report on Environmental Impacts Assessment of theMud Flow, 2006
The contaminated water will surely endangers all aquatic biotas in the Porong
river ecosystem, threatening its biodiversity. The solid particle of the hot mud poured
into the river would solidify thus making layers that would decrease the depth of the
Railroad destruction Toll Road Destruction
High voltagetransmission The gas pipe line(The blue line)
7/29/2019 Lapindo Brantas
http://slidepdf.com/reader/full/lapindo-brantas 11/27
11
estuary. This sedimentation effect to Porong river will put Surabaya municipality and
other areas at an increased risk of flooding.
In the long run, the mud and the water of the mud will threaten the lives of the
people who depend on the river for their daily needs. The contaminated fish, through
the food chain, will impact the health of the people.
The eruption also puts the region at increased risk of subsidence. In several
places around the mud eruption hole, many houses have fissures and many land
surfaces have shifted down around 1-5 meters. In the future, the subsidence effect
could destroy local infrastructure such as the houses, roads, bridges, and the gas pipe.
The unabated mudflow and the resulting floods had induced further ramifications
that have lowered the life-supporting capacity of the submerged area, disrupted
economic activities, thus reducing the economic capacities of the affected regions.
The ecological disaster has brought about social and economic losses to the people in
the Sidoarjo Regency and surrounding regions. The economic losses and financial
costs are summarized in Table 4.
Table 4 : Economic and Financial Costs to Sidoarjo and the SurroundingRegions in the period of 2006 – 2015
(US$ thousand)
Direct Economic Cost 2,093,722.53Indirect Economic Cost 779,730.53Economic Cost for Recovering 589,385.26
Total Economic Cost 3,462,838.32Financial Cost 516,290.76Gap (Economic Cost v.s. Financial Cost) 2,946,547.56Note :
1. Economic Cost : The value of the negative effect to the assets and people’sincome
2. Financial Cost : The value of cash that has been paid plus commitments3. US$ 1 =Rp9.500,00
Source: Brawijaya University Report on Economy Impacts Assessment of the MudFlow, 2006
7/29/2019 Lapindo Brantas
http://slidepdf.com/reader/full/lapindo-brantas 12/27
12
It should be noted that the difference between economic costs and financial costs
to Sidoarjo totaled to US$ 2,946,547,560.00 The gap has to be borne by the people in
and around Sidoarjo regency. This gap has decreased their quality of life and slowed
the development of the regency. Higher inflation has been also observed. The biggest
part of the economic costs have and would be borne by the people (84 %), whilst the
remaining portions were borne by the government (7%), Private Companies (6%) and
State-owned enterprises (3 %) (Appendix 4).
The Roles of BPK
BPK audited the hot mud flow in Sidoarjo with the assistance of the
environmental, geology and regional economy consultants. The main purpose of this
audit is to assess the activities in the exploration of the Banjarpanji-1 well, including
the concession granting process, the subsequent disaster management processes, and
the overall impact to the economy and the environment. The audit focused on
evaluating whether all of the activities are in accordance with the law and regulations.
Moreover, the audit also used risk based audit methodologies in selecting key areas to
be audited. With this approach, the audit has selected the activities above to be the key
areas.
Relating to the environmental aspect, BPK focused the audit on the impact of the
National Team activities in mitigating the impacts of the eruption. BPK-RI evaluated
the impact of building the mud embankments, efforts to terminate eruption, efforts to
dispose of the mud in the river. BPK also conducted limited research with
environmental consultants in order to assess the quality of the river. BPK also
attempted to forecast the impact to environment for the next ten years. In doing this,
BPK and the consultants made many assumptions in order to predict the
environmental impact in the next two and ten years.
Audit Results and Recommendations
BPK found the following aspects that need to be improved by the government in
managing the mud flow in Sidoarjo :
• Some regulations related to the exploration of gas or oil wells have not
sufficiently protected the people and the environment. Current regulation only
7/29/2019 Lapindo Brantas
http://slidepdf.com/reader/full/lapindo-brantas 13/27
13
requires the company that wants to explore a gas and oil well to have shallow
survey efforts instead of in-depth survey efforts including important impact
and risk evaluation.
• There are weaknesses in government monitoring system on oil and gas
exploration and exploitation to enforce the rules and regulations and contracts.
The monitoring system needs to be revised and improved in order to ensure
the exploration and exploitation processes conducted by the production
sharing companies, are done prudently in accordance to the best practices.
• The government responses to address the mudflow disaster have been very
slow. This has exacerbated the negative impacts of the mishap to the society,
environment, and economy.
• In handling the eruption, the government has never conducted a thorough risk
assessment in order to develop detailed action plans or activities. Many of the
activities including the building of the mud dams were based on temporary
(short term) plans.
• There is no consistent result from the researchers about the toxic sludge and
water of the mud. The researchers’ opinions are divided into two main groups.
One group said that there is no toxic chemical substance in the mud, while
another group said there were toxic chemicals in the mud. However, people in
nearby villages complained that toxic sludge and water have invaded their
drinking water, river, agriculture fields, fish ponds, marine ecosystem, and
homes.
In order to improve the quality of the handling of the eruption, BPK made the
following recommendations:
• The Government together with other related entities or people should thoroughly
investigate the causes of the eruption and prosecute those responsible for causing
it.
• The government should officially declare the mudflow as a disaster and take over
the management of the disaster to handle the mishap and mitigate its social and
environmental impacts.
7/29/2019 Lapindo Brantas
http://slidepdf.com/reader/full/lapindo-brantas 14/27
14
• The government should immediately help the disaster victims, restore their
livelihood, and restore the economy activities of the province by rebuilding and
relocating the damaged infrastructures.
• The government should conduct a comprehensive research to ensure the toxicity
of the sludge and water.
• The Government should revise and upgrade the policy implementation and
monitoring system of the oil and gas exploration and exploitation activities in
order to protect the people’s life, the environment, and the economy..
• Based on Indonesia’s experiences on previous natural disasters and this man-made
mishap, the government should develop a comprehensive disaster policy and build
its institutional capacity to cope with those unexpected problems.
Lessons learnt
Handling the Eruption
• The continuous and uncertain status of this particular disaster requires the phases
of handling the disaster to be simultaneously conducted. The rehabilitation and
reconstruction phases have to be done in the same time when the mud still
continues to erupt and give impacts to the surrounding. In this kind of condition,
the disaster management has to be supported not only with a sufficient amount of
fund, but also skillful, competent, and dedicated people which could work under
uncertainty situation. The government needs to make a comprehensive assessment
in order to develop a comprehensive and systematic strategy in managing the
eruption.
• Moreover, the government should develop disaster regulation(s) or procedure(s)
that can be followed by government institutions in handling disasters on this order.
When the mud erupted, the government gave all responsibility to the company to
handle things. It did not effectively evaluate the magnitude of the disaster.
7/29/2019 Lapindo Brantas
http://slidepdf.com/reader/full/lapindo-brantas 15/27
15
Furthermore the audit showed that the slow reactive actions from the government
in fact caused additional losses.
Auditing the Handling of the Eruption
• BPK-RI hired environmental and regional-economic experts to assist the audit
team in analyzing the environmental and economy impacts of the eruption.
However, it could not discharge the responsibility of BPK-RI to draw audit
conclusions. For future audits, BPK-RI needs to have a panel of experts to ensure
the rightness and the sufficiency of the methodology and assumptions used by the
experts in an audit project including the validity of the data and information.
Furthermore, BPK-RI needs auditors with environmental expertise to anticipate
the increasing demand of audit with environmental perspectives from the
stakeholders. Continuous professional educations for auditors were needed to cope
with the most recent environmental issues.
• Auditing comprehensive activities for mitigating the impacts of the eruption
needed a lot of resources. Therefore, BPK-RI should select the key activities that
provide the highest impact to the environment, society and economy. BPK-RI has
to develop and increase the institutional capability to anticipate more complicated
audit tasks.
Conclusion
Defective policies and deficient implementation of the policies have created
opportunities for conflict of interest to flourish. This, in turn, has impaired the
governance as shown by inconclusive actions by the government towards the private
sector linked to the disaster.
In the future, BPK should be more concerned with the environmental
perspectives in conducting any audit. In doing this, BPK should be equipped by
sophisticated and applicable methodologies and supported by highly competent
auditors with environmental expertise.
The government should re-orient their strategies to overcome the disaster
impacts comprehensively, as recommended by BPK.
7/29/2019 Lapindo Brantas
http://slidepdf.com/reader/full/lapindo-brantas 16/27
16
Appendix 1
A. The Volume of the eruption, Inundated area, and the extent of the pond
Month Volume of the eruption
(M3/day) Inundatedarea (Ha)
The extent of the Pond (Ha)
029 May(Beginning) 5,000.00 0 0
1 June 25,000.00 110.84 109.00
2 July 30,000.00 178.89 151.32
3 August 50,000.00 349.76 150.00
4 September 50,000.00 349.76 251.90
5 October 120,000.00 349.76 251.90
6 November 150,000.00 390.07 251.90
7 December 150,000.00 390.07 251.90
8 January 150,000.00 450.00 251.90
9 February 170,000.00 470.00 251.90
7/29/2019 Lapindo Brantas
http://slidepdf.com/reader/full/lapindo-brantas 17/27
17
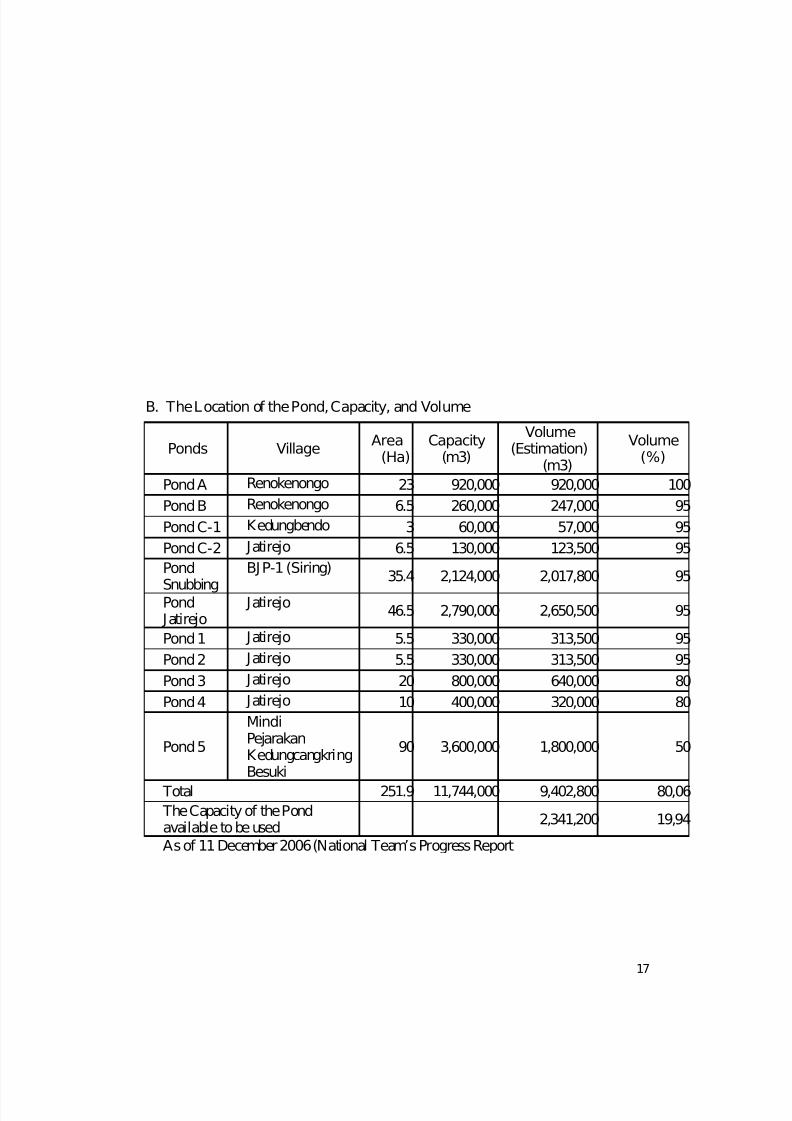
B. The Location of the Pond, Capacity, and Volume
Ponds VillageArea
(Ha)Capacity
(m3)
Volume(Estimation)
(m3)
Volume(%)
PondA Renokenongo 23 920,000 920,000 100
PondB Renokenongo 6.5 260,000 247,000 95
PondC-1 Kedungbendo 3 60,000 57,000 95
PondC-2 Jatirejo 6.5 130,000 123,500 95
Pond
Snubbing
BJP-1 (Siring)35.4 2,124,000 2,017,800 95
Pond Jatirejo
Jatirejo46.5 2,790,000 2,650,500 95
Pond1 Jatirejo 5.5 330,000 313,500 95
Pond2 Jatirejo 5.5 330,000 313,500 95
Pond3 Jatirejo 20 800,000 640,000 80
Pond4 Jatirejo 10 400,000 320,000 80
Pond5
MindiPejarakanKedungcangkringBesuki
90 3,600,000 1,800,000 50
Total 251.9 11,744,000 9,402,800 80,06
The Capacity of the Pondavailable to be used
2,341,200 19,94
As of 11 December 2006 (National Team’s Progress Report
7/29/2019 Lapindo Brantas
http://slidepdf.com/reader/full/lapindo-brantas 18/27
18
Appendix 2
The volume of Goods and Services transported through Sidoarjo
Year Volume of Good(s)/Service(s) in one year
Train
Goods* People** Electricity*** TollRoad**** Container***** Gas******
2000 1,022,648 5,210,605 70 - 150 N.A 786,113 140
2001 1,038,356 4,470,393 70 - 150 63,853,536 825,418 140
2002 966,919 4,033,857 70 - 150 67,085,217 866,689 140
2003 1,007,632 3,894,687 70 - 150 63,338,174 910,024 140
2004 1,030,987 4,673,624 70 - 150 62,816,463 955,525 140
2005 999,376 5,328,886 70 - 150 63,268,772 1,003,301 140
2006 876,509 5,872,841 70 - 150 N.A 1,053,466 140
* Only for the refined fuel oil (KiloLiter/year)
** Assumption 45% total PT. KAI Surabaya (base2006)*** Kilo Volt**** Vehicles/year***** in teus (twenty equivalent Units). From many sources with the assumption 5%increase every year
(Base 2006)****** MMScfd
7/29/2019 Lapindo Brantas
http://slidepdf.com/reader/full/lapindo-brantas 19/27
19
Apendix 3
A. The villages and The Productive Land that have already covered by themud/villages
Area (Ha)
No Village
Rice FieldSugarCane
CropsPlanted
1. Siring 22.25 0 0
2. Renokenongo 77.35 7.79 0
3. Jatirejo 29.60 5.63 0
4. Mindi 10.00 17.30 0
5. Sentul 25.00 0 0
6. Besuki 79.00 3.00 0
7. Pejarakan 36.00 17.60 0
8. Kedungcangkring 27.00 12.70 0
9. Ketapang 0 0 2
Total 306.20 64.02 2
B. The Drowned Infrastructures
No Infrastructure Village Unit
1. Houses Siring 395 Jatiredjo 858
Renokenongo 1,007Kedungbendo 7,066Ketapang 1,100
Total 10,4262. School 183. Government Office 24. Manufactures 235. Mosque 15

7/29/2019 Lapindo Brantas
http://slidepdf.com/reader/full/lapindo-brantas 20/27
20
7/29/2019 Lapindo Brantas
http://slidepdf.com/reader/full/lapindo-brantas 21/27
21
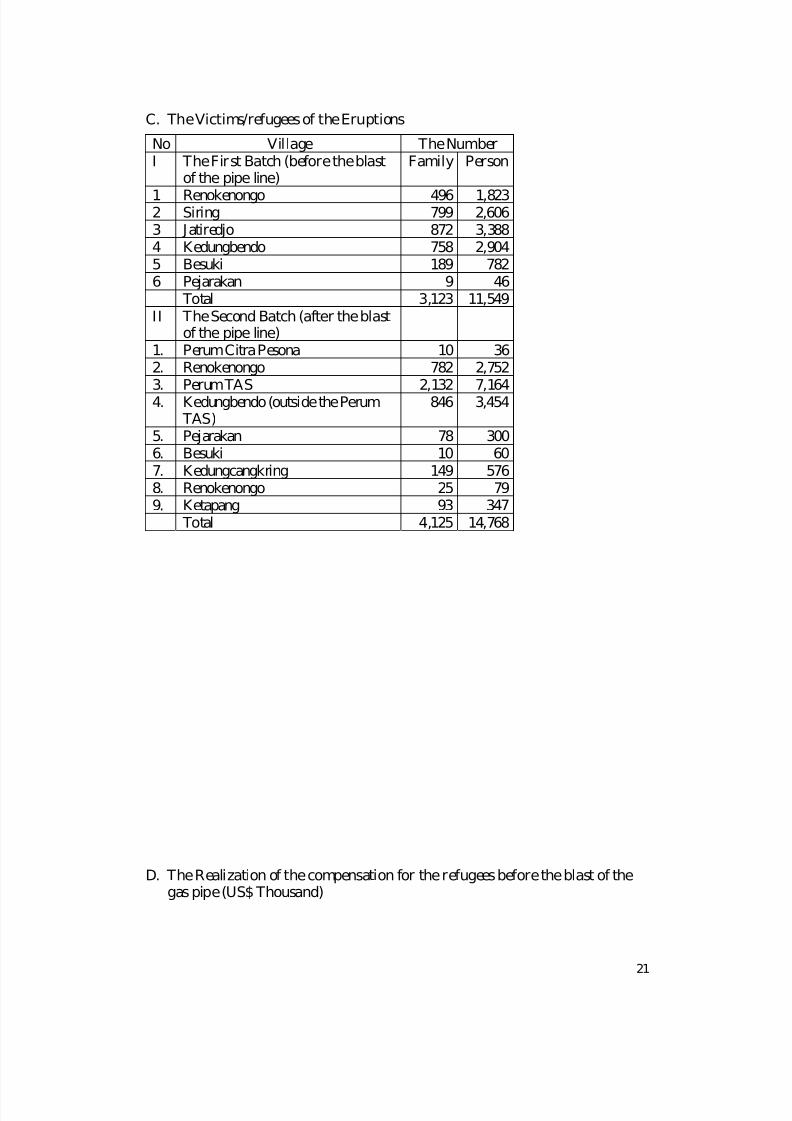
C. The Victims/refugees of the Eruptions
No Village The NumberI The First Batch (before the blast
of the pipe line)Family Person
1 Renokenongo 496 1,8232 Siring 799 2,6063 Jatiredjo 872 3,3884 Kedungbendo 758 2,9045 Besuki 189 7826 Pejarakan 9 46
Total 3,123 11,549II The Second Batch (after the blast
of the pipe line)1. Perum Citra Pesona 10 362. Renokenongo 782 2,7523. Perum TAS 2,132 7,1644. Kedungbendo (outside the Perum
TAS)846 3,454
5. Pejarakan 78 3006. Besuki 10 607. Kedungcangkring 149 5768. Renokenongo 25 799. Ketapang 93 347
Total 4,125 14,768
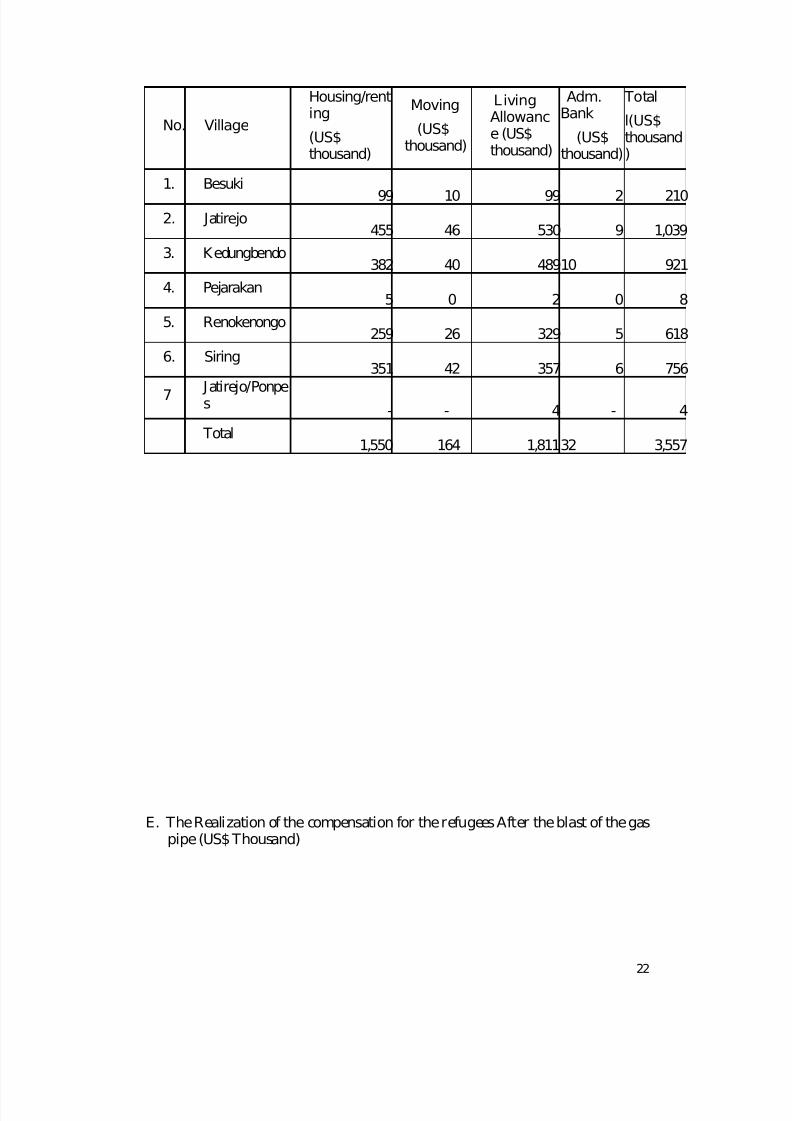
D. The Realization of the compensation for the refugees before the blast of thegas pipe (US$ Thousand)
7/29/2019 Lapindo Brantas
http://slidepdf.com/reader/full/lapindo-brantas 22/27
22
No. Village
Housing/renting
(US$thousand)
Moving
(US$thousand)
LivingAllowance (US$thousand)
Adm.Bank
(US$thousand)
Total
l(US$thousand)
1. Besuki
99 10 99 2 2102. Jatirejo
455 46 530 9 1,039
3. Kedungbendo382 40 489 10 921
4. Pejarakan5 0 2 0 8
5. Renokenongo259 26 329 5 618
6. Siring351 42 357 6 756
7 Jatirejo/Ponpes- - 4 - 4
Total1,550 164 1,811 32 3,557
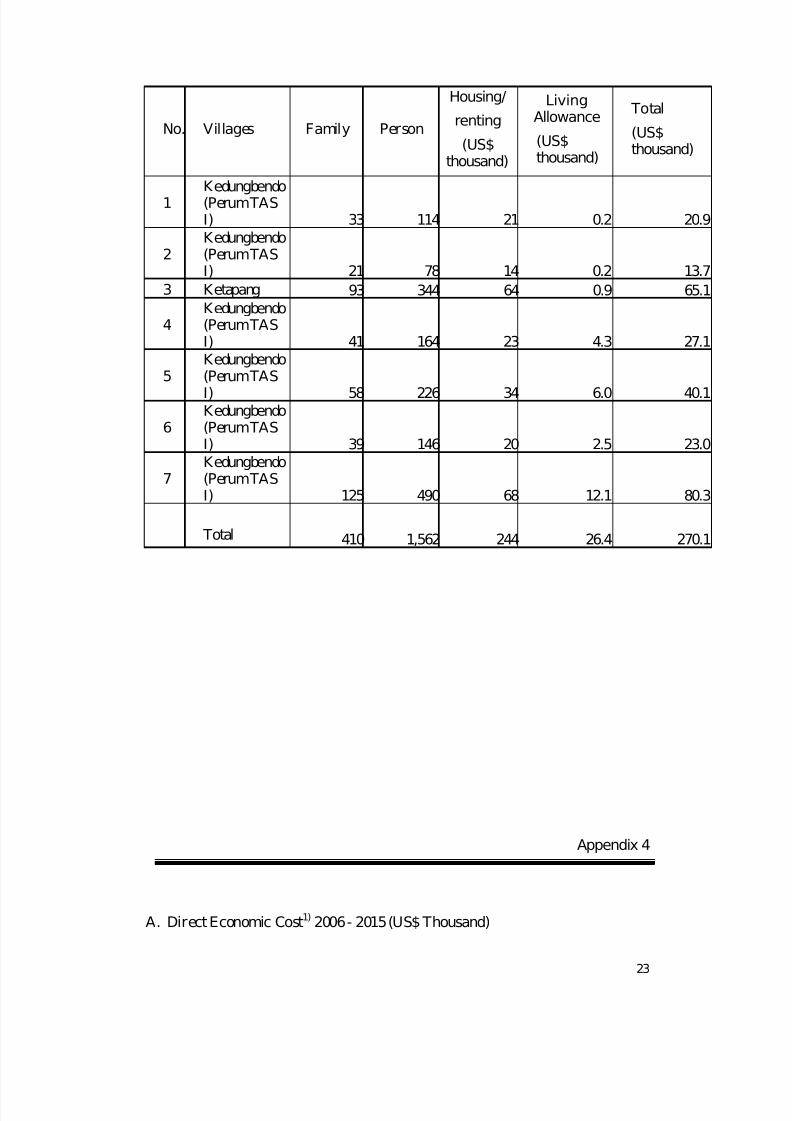
E. The Realization of the compensation for the refugees After the blast of the gaspipe (US$ Thousand)
7/29/2019 Lapindo Brantas
http://slidepdf.com/reader/full/lapindo-brantas 23/27
23
No. Villages Family Person
Housing/
renting
(US$thousand)
LivingAllowance
(US$thousand)
Total
(US$thousand)
1Kedungbendo(Perum TASI) 33 114 21 0.2 20.9
2Kedungbendo(Perum TASI) 21 78 14 0.2 13.7
3 Ketapang 93 344 64 0.9 65.1
4Kedungbendo(Perum TASI) 41 164 23 4.3 27.1
5Kedungbendo(Perum TAS
I) 58 226 34 6.0 40.1
6Kedungbendo(Perum TASI) 39 146 20 2.5 23.0
7Kedungbendo(Perum TASI) 125 490 68 12.1 80.3
Total 410 1,562 244 26.4 270.1
Appendix 4
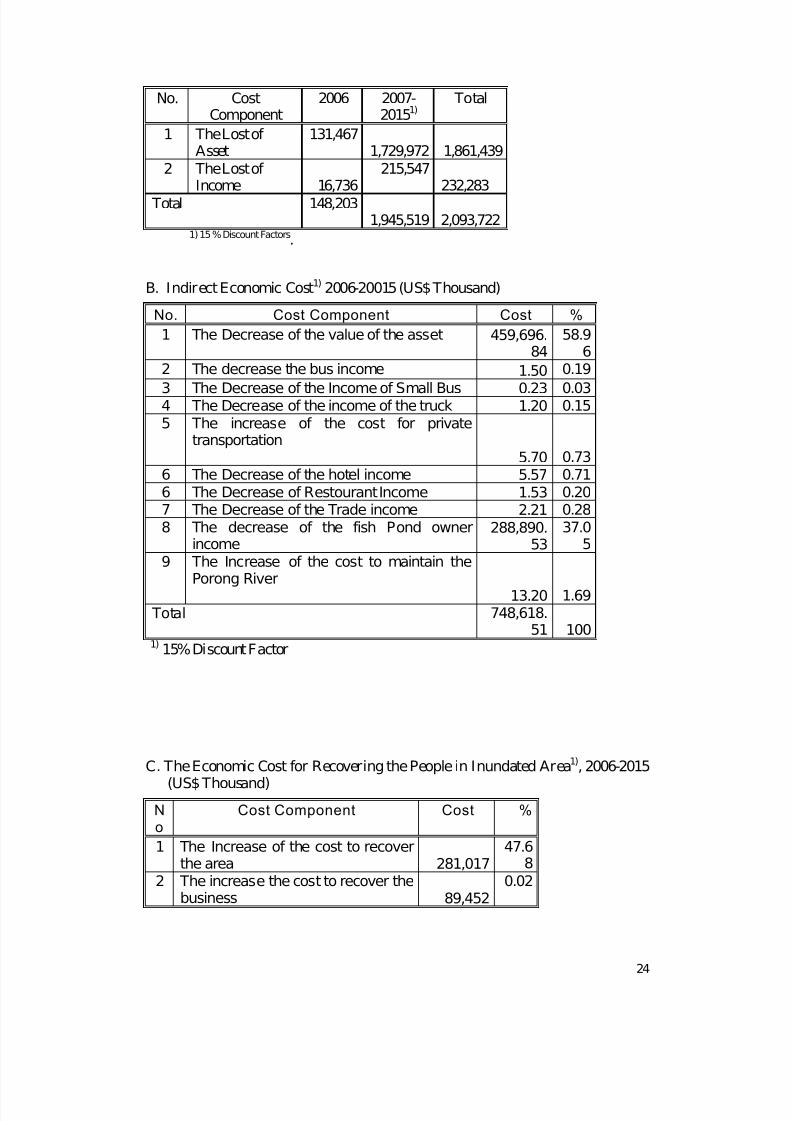
A. Direct Economic Cost1) 2006 - 2015 (US$ Thousand)
7/29/2019 Lapindo Brantas
http://slidepdf.com/reader/full/lapindo-brantas 24/27
24
No. CostComponent
2006 2007-20151)
Total
1 The Lost of Asset
131,4671,729,972 1,861,439
2 The Lost of Income 16,736
215,547232,283
Total 148,2031,945,519 2,093,722
1) 15 % Discount Factors.
B. Indirect Economic Cost1) 2006-20015 (US$ Thousand)
No. Cost Component Cost %
1 The Decrease of the value of the asset 459,696.84
58.96
2 The decrease the bus income 1.50 0.19
3 The Decrease of the Income of Small Bus 0.23 0.034 The Decrease of the income of the truck 1.20 0.155 The increase of the cost for private
transportation5.70 0.73
6 The Decrease of the hotel income 5.57 0.716 The Decrease of Restourant Income 1.53 0.207 The Decrease of the Trade income 2.21 0.288 The decrease of the fish Pond owner
income288,890.
5337.0
59 The Increase of the cost to maintain the
Porong River13.20 1.69
Total 748,618.51 100
1) 15% Discount Factor
C. The Economic Cost for Recovering the People in Inundated Area1), 2006-2015
(US$ Thousand)
No
Cost Component Cost %
1 The Increase of the cost to recoverthe area 281,017
47.68
2 The increase the cost to recover thebusiness 89,452
0.02

7/29/2019 Lapindo Brantas
http://slidepdf.com/reader/full/lapindo-brantas 25/27
25
3 The increase the cost to recover thepublic infrastructure
218,91737.1
4 Total
589,385 1001) 15% Discount Factor
7/29/2019 Lapindo Brantas
http://slidepdf.com/reader/full/lapindo-brantas 26/27
26
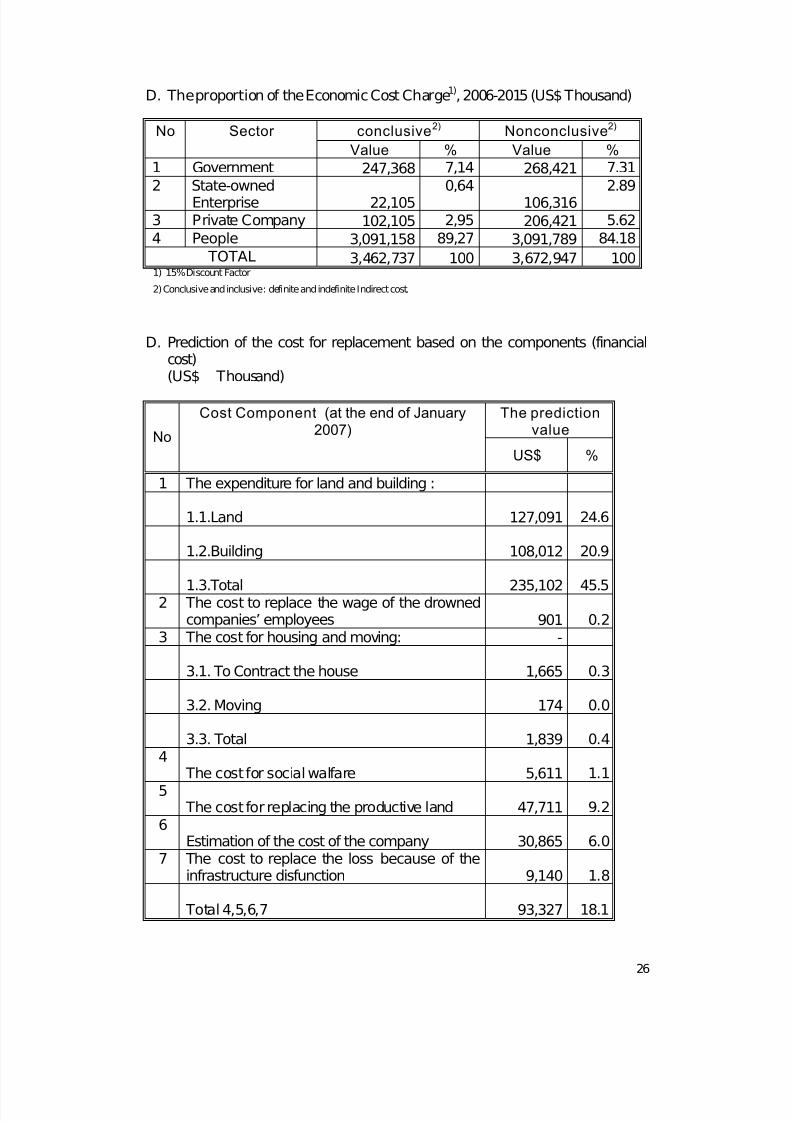
D. The proportion of the Economic Cost Charge1), 2006-2015 (US$ Thousand)
1) 15% Discount Factor 2) Conclusive and inclusive : definite and indefinite Indirect cost,
D. Prediction of the cost for replacement based on the components (financialcost) (US$ Thousand)
The predictionvalueNo
Cost Component (at the end of January2007)
US$ %
1 The expenditure for land and building :
1.1.Land 127,091 24.6
1.2.Building 108,012 20.9
1.3.Total 235,102 45.52 The cost to replace the wage of the drowned
companies’ employees 901 0.23 The cost for housing and moving: -
3.1. To Contract the house 1,665 0.3
3.2. Moving 174 0.0
3.3. Total 1,839 0.44
The cost for social walfare 5,611 1.1
5 The cost for replacing the productive land 47,711 9.2
6Estimation of the cost of the company 30,865 6.0
7 The cost to replace the loss because of theinfrastructure disfunction 9,140 1.8
Total 4,5,6,7 93,327 18.1
conclusive2) Nonconclusive2) No Sector
Value % Value %1 Government 247,368 7,14 268,421 7.31
2 State-ownedEnterprise 22,105
0,64106,316
2.89
3 Private Company 102,105 2,95 206,421 5.62
4 People 3,091,158 89,27 3,091,789 84.18
TOTAL 3,462,737 100 3,672,947 100
7/29/2019 Lapindo Brantas
http://slidepdf.com/reader/full/lapindo-brantas 27/27
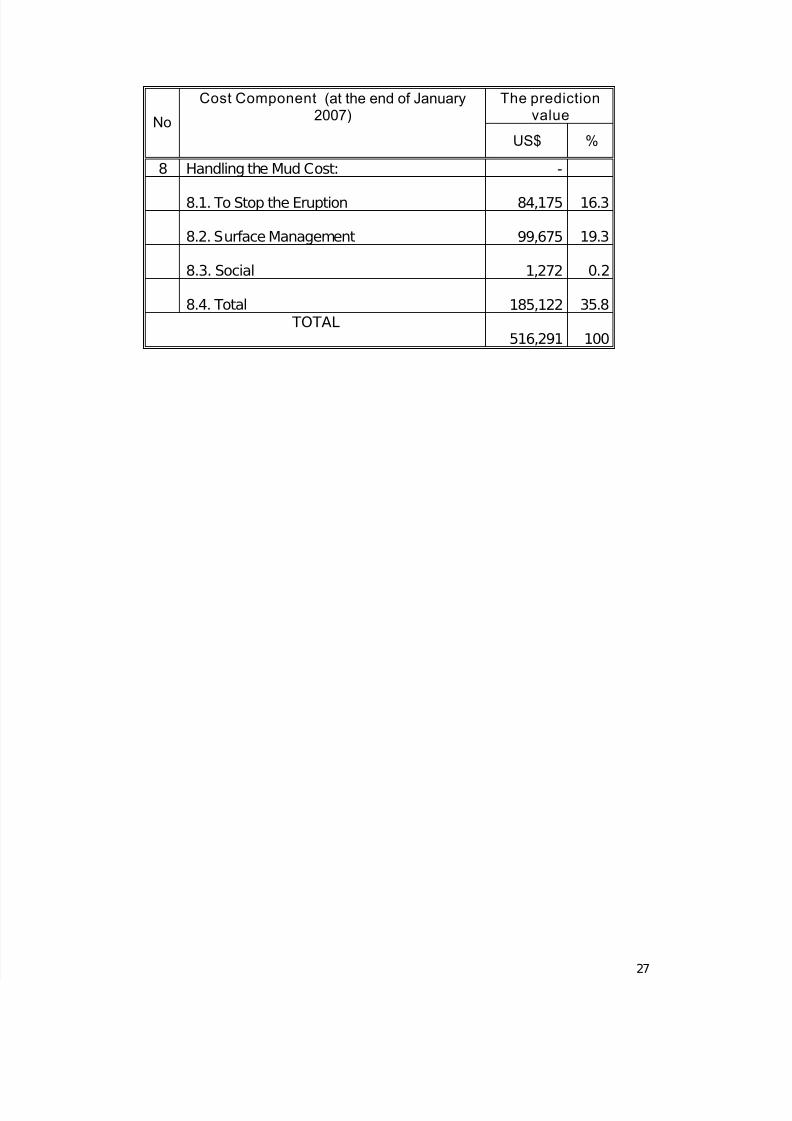
The predictionvalueNo
Cost Component (at the end of January2007)
US$ %
8 Handling the Mud Cost: -
8.1. To Stop the Eruption 84,175 16.3
8.2. Surface Management 99,675 19.3
8.3. Social 1,272 0.2
8.4. Total 185,122 35.8 TOTAL
516,291 100