LAMPIRAN 1 - eprints.umk.ac.id · Pengembangan Karir Pertanyaan SS S N TS STS 1. Apakah prestasi...
31
LAMPIRAN 1 KUESIONER
Transcript of LAMPIRAN 1 - eprints.umk.ac.id · Pengembangan Karir Pertanyaan SS S N TS STS 1. Apakah prestasi...

LAMPIRAN 1
KUESIONER
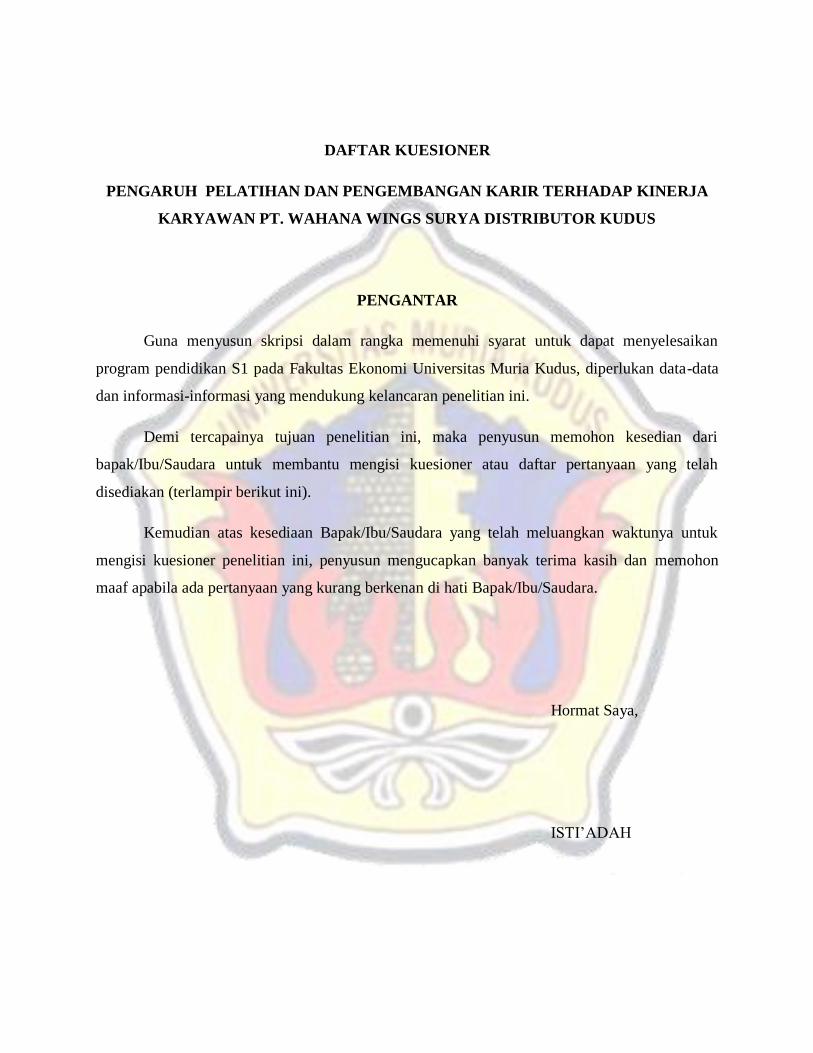
DAFTAR KUESIONER
PENGARUH PELATIHAN DAN PENGEMBANGAN KARIR TERHADAP KINERJA
KARYAWAN PT. WAHANA WINGS SURYA DISTRIBUTOR KUDUS
PENGANTAR
Guna menyusun skripsi dalam rangka memenuhi syarat untuk dapat menyelesaikan
program pendidikan S1 pada Fakultas Ekonomi Universitas Muria Kudus, diperlukan data-data
dan informasi-informasi yang mendukung kelancaran penelitian ini.
Demi tercapainya tujuan penelitian ini, maka penyusun memohon kesedian dari
bapak/Ibu/Saudara untuk membantu mengisi kuesioner atau daftar pertanyaan yang telah
disediakan (terlampir berikut ini).
Kemudian atas kesediaan Bapak/Ibu/Saudara yang telah meluangkan waktunya untuk
mengisi kuesioner penelitian ini, penyusun mengucapkan banyak terima kasih dan memohon
maaf apabila ada pertanyaan yang kurang berkenan di hati Bapak/Ibu/Saudara.
Hormat Saya,
ISTI’ADAH

KUESIONER
I. PROFIL RESPONDEN
1. Nama :
2. JeniskelaminAnda:
1. Pria 2. Wanita
3. UsiaAnda : 1. < 21tahun 3. 26-30 tahun 5. >35 tahun
2. 21-25 tahun 4. 31-35 tahun
II. PETUNJUK PENGISIAN KUESIONER
Kuesioner di bawah ini memuat sejumlah pertanyaan. Silahkan Anda memberikan
tanda checklist (√) pada kotak jawaban yang Anda pilih yang menunjukkan seberapa
besar tingkat persetujuan atau ketidaksetujuan Anda terhadap tersebut.
Keterangan:
SS = Sangat Setuju
S = Setuju
N = Netral
TS = Tidak Setuju
STS = Sangat Tidak Setuju
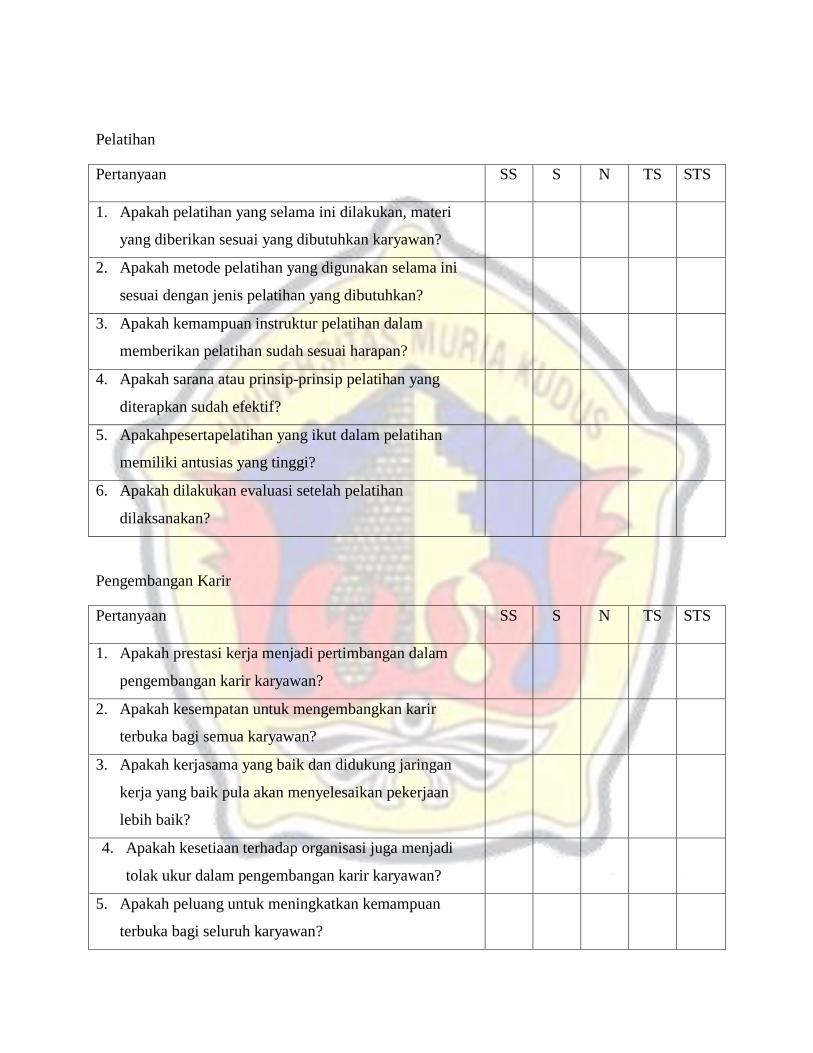
Pelatihan
Pertanyaan
SS S N TS STS
1. Apakah pelatihan yang selama ini dilakukan, materi
yang diberikan sesuai yang dibutuhkan karyawan?
2. Apakah metode pelatihan yang digunakan selama ini
sesuai dengan jenis pelatihan yang dibutuhkan?
3. Apakah kemampuan instruktur pelatihan dalam
memberikan pelatihan sudah sesuai harapan?
4. Apakah sarana atau prinsip-prinsip pelatihan yang
diterapkan sudah efektif?
5. Apakahpesertapelatihan yang ikut dalam pelatihan
memiliki antusias yang tinggi?
6. Apakah dilakukan evaluasi setelah pelatihan
dilaksanakan?
Pengembangan Karir
Pertanyaan
SS S N TS STS
1. Apakah prestasi kerja menjadi pertimbangan dalam
pengembangan karir karyawan?
2. Apakah kesempatan untuk mengembangkan karir
terbuka bagi semua karyawan?
3. Apakah kerjasama yang baik dan didukung jaringan
kerja yang baik pula akan menyelesaikan pekerjaan
lebih baik?
4. Apakah kesetiaan terhadap organisasi juga menjadi
tolak ukur dalam pengembangan karir karyawan?
5. Apakah peluang untuk meningkatkan kemampuan
terbuka bagi seluruh karyawan?

Kinerja
Pertanyaan
SS S N TS STS
1. Apakah anda setuju melaksanakan pekerjaan harus
sesuai dengan tingkat pencapaian hasil kerja?
2. Apakah anda setuju dibutuhkan ketelitian dan
kerapihan dalam kinerja anda?
3. Apakah anda bekerja dengan ketepatan waktu dalam
menyeesaikan pekerjaan?
4. Apakah anda bekerja sesuai dengan waktu bekerja
yang ditentukan perusahaan?
5. Apakah anda bekerja dengan kemampuan
berkomunikasi yang baik dengan rekan kerja serta
melaksanakan perintah kerja dengan baik?

LAMPIRAN 2
HASIL TRY OUT (20 RESPONDEN)
VALIDITAS DAN RELIABILITAS

DATA INPUT JAWABAN 20 RESPONDEN (TRY OUT)
NO
Pelatihan (X1)
Pengembangan
Karir (X2) Kinerja (Y)
1 2 3 4 5 6 X1 1 2 3 4 5 X2 1 2 3 4 5 Y
1 3 3 3 3 4 4 20 5 4 5 4 5 23 4 5 4 4 4 21
2 4 3 4 4 5 4 24 4 3 4 5 4 20 5 5 5 5 5 25
3 3 3 3 3 4 4 20 5 5 4 4 4 22 5 4 4 4 5 22
4 4 4 4 3 5 5 25 4 4 4 4 4 20 5 5 5 5 5 25
5 4 3 3 3 4 4 21 4 2 3 2 3 14 2 2 1 2 2 9
6 5 5 4 4 5 5 28 5 4 4 5 5 23 4 4 4 4 5 21
7 5 4 4 4 5 4 26 4 4 5 4 4 21 4 4 3 3 4 18
8 3 4 4 2 4 5 22 2 4 3 4 3 16 4 4 5 5 5 23
9 5 4 4 4 5 5 27 5 4 5 4 4 22 5 5 5 4 4 23
10 4 4 4 5 5 4 26 5 4 5 4 4 22 5 4 3 4 4 20
11 4 4 3 4 4 4 23 4 3 5 3 3 18 5 4 3 4 4 20
12 3 3 3 4 4 4 21 4 2 2 1 1 10 1 2 2 1 2 8
13 4 4 2 4 5 5 24 5 3 4 3 2 17 5 4 3 4 3 19
14 4 4 3 3 4 5 23 5 3 4 4 3 19 5 5 4 4 5 23
15 2 1 1 1 2 1 8 2 2 4 2 3 13 5 4 4 4 5 22
16 5 4 5 5 4 4 27 3 4 4 4 4 19 4 4 3 3 4 18
17 4 4 4 3 3 4 22 5 4 5 3 4 21 4 4 4 4 4 20
18 1 2 2 2 1 2 10 2 1 1 1 2 7 2 1 2 1 1 7
19 5 5 4 4 5 5 28 5 4 5 3 4 21 5 4 4 4 5 22
20 5 4 4 4 5 5 27 5 2 2 4 3 16 4 4 4 4 4 20

LAMPIRAN 3
HASIL OUT PUT SPSS TRY OUT

Scale: ALL VARIABLES
Case Processing Summary
N %
Cases Valid 20 100.0
Excludeda 0 .0
Total 20 100.0
a. Listwise deletion based on all variables in the procedure.
Reliability Statistics
Cronbach's Alpha N of Items
.938 6
Item Statistics
Mean Std. Deviation N
X1_1 3.85 1.089 20
X1_2 3.60 .940 20
X1_3 3.40 .940 20
X1_4 3.45 .999 20
X1_5 4.15 1.089 20
X1_6 4.15 1.040 20
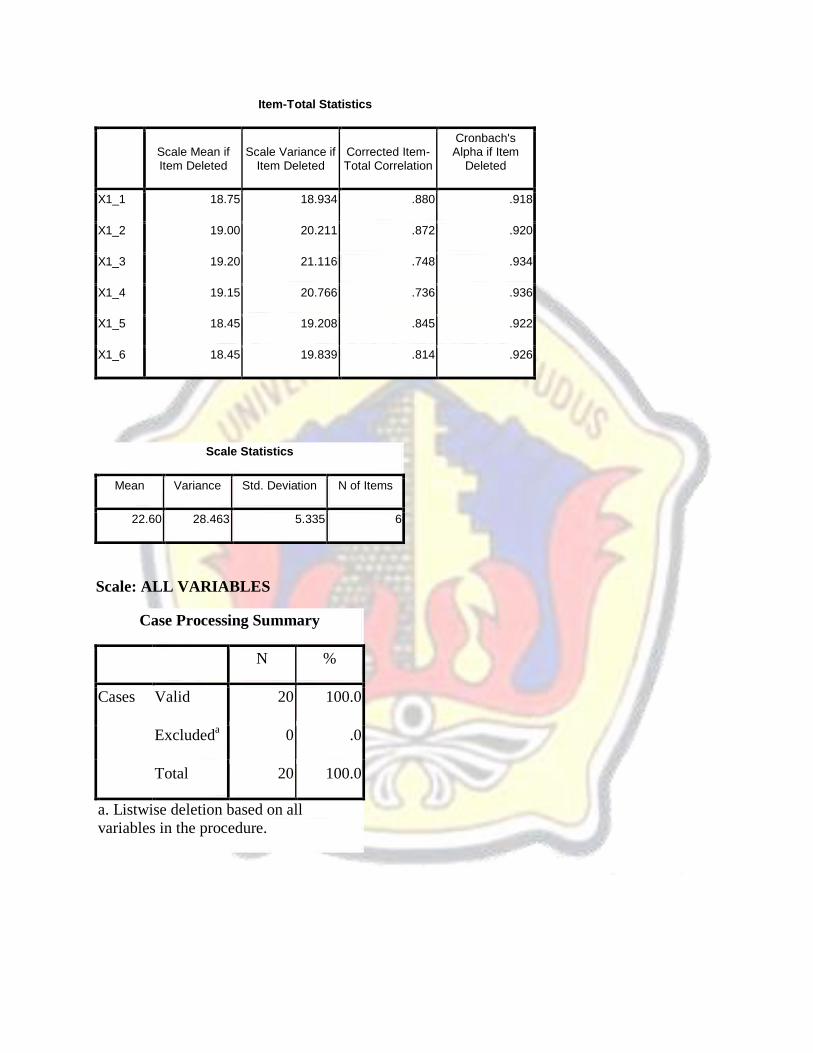
Item-Total Statistics
Scale Mean if Item Deleted
Scale Variance if Item Deleted
Corrected Item-Total Correlation
Cronbach's Alpha if Item
Deleted
X1_1 18.75 18.934 .880 .918
X1_2 19.00 20.211 .872 .920
X1_3 19.20 21.116 .748 .934
X1_4 19.15 20.766 .736 .936
X1_5 18.45 19.208 .845 .922
X1_6 18.45 19.839 .814 .926
Scale Statistics
Mean Variance Std. Deviation N of Items
22.60 28.463 5.335 6
Scale: ALL VARIABLES
Case Processing Summary
N %
Cases Valid 20 100.0
Excludeda 0 .0
Total 20 100.0
a. Listwise deletion based on all
variables in the procedure.

Reliability Statistics
Cronbach's
Alpha N of Items
.870 5
Item Statistics
Mean
Std.
Deviation N
X2_1 4.15 1.089 20
X2_2 3.30 1.031 20
X2_3 3.90 1.165 20
X2_4 3.40 1.142 20
X2_5 3.45 .999 20
Item-Total Statistics
Scale Mean if
Item Deleted
Scale
Variance if
Item Deleted
Corrected
Item-Total
Correlation
Cronbach's
Alpha if Item
Deleted
X2_1 14.05 14.261 .484 .892
X2_2 14.90 12.516 .802 .817
X2_3 14.30 12.221 .718 .837
X2_4 14.80 12.379 .715 .837
X2_5 14.75 12.829 .784 .823
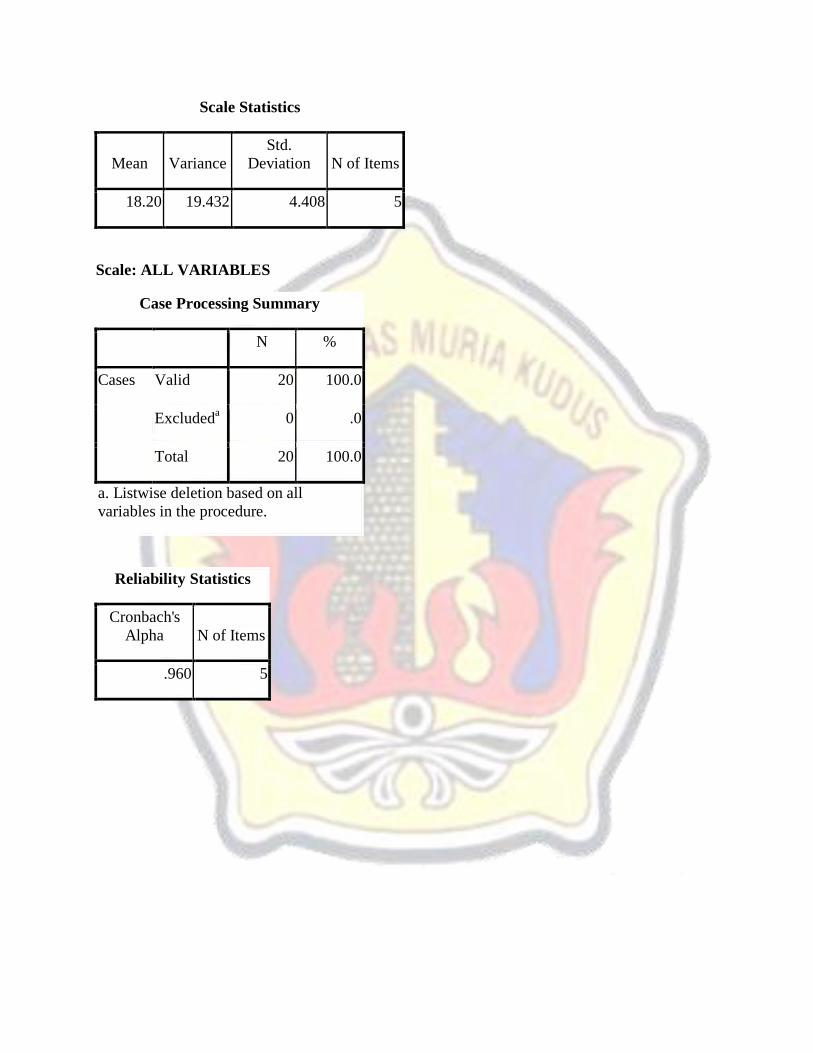
Scale Statistics
Mean Variance
Std.
Deviation N of Items
18.20 19.432 4.408 5
Scale: ALL VARIABLES
Case Processing Summary
N %
Cases Valid 20 100.0
Excludeda 0 .0
Total 20 100.0
a. Listwise deletion based on all
variables in the procedure.
Reliability Statistics
Cronbach's
Alpha N of Items
.960 5

Item Statistics
Mean
Std.
Deviation N
Y_1 4.15 1.182 20
Y_2 3.90 1.071 20
Y_3 3.60 1.095 20
Y_4 3.65 1.137 20
Y_5 4.00 1.170 20
Item-Total Statistics
Scale Mean if
Item Deleted
Scale
Variance if
Item Deleted
Corrected
Item-Total
Correlation
Cronbach's
Alpha if Item
Deleted
Y_1 15.15 17.713 .852 .956
Y_2 15.40 18.147 .909 .947
Y_3 15.70 18.432 .846 .957
Y_4 15.65 17.397 .939 .941
Y_5 15.30 17.484 .893 .949
Scale Statistics
Mean Variance
Std.
Deviation N of Items
19.30 27.589 5.253 5

LAMPIRAN 4
DATA INPUT JAWABAN 70 RESPONDEN

N0
Jenis
Kelamin
Umur
Pelatihan (X1) Pengembangan Karir
(X2) Kinerja (Y)
1 2 3 4 5 6 X1 1 2 3 4 5 X2 1 2 3 4 5 Y
1 Pria 21-25th 4 4 5 4 3 4 24 3 4 4 4 4 19 4 3 4 4 4 19
2 Pria 26-30th 4 5 5 5 5 5 29 5 4 5 5 5 24 5 5 5 5 5 25
3 Pria 26-30th 4 4 4 4 4 5 25 5 4 5 4 5 23 5 5 5 5 5 25
4 Wanita 26-30th 3 5 5 5 5 5 28 5 5 4 5 5 24 4 5 5 5 5 24
5 Pria <21th 1 2 1 3 2 3 12 2 1 3 1 2 9 3 1 1 2 2 9
6 Pria 21-25th 3 3 3 3 3 4 19 3 3 2 3 3 14 4 3 4 4 4 19
7 Wanita 21-25th 4 4 4 5 5 5 27 5 4 5 5 5 24 5 5 5 5 5 25
8 Pria 26-30th 5 5 4 5 5 5 29 5 5 4 5 5 24 4 5 5 5 5 24
9 Wanita 26-30th 2 2 3 1 1 2 11 2 2 1 1 2 8 1 2 3 4 1 11
10 Pria 26-30th 4 4 4 4 5 4 25 4 4 5 4 5 22 5 4 5 5 4 23
11 Pria 21-25th 4 4 4 4 4 5 25 4 4 4 4 5 21 5 5 5 5 5 25
12 Wanita 21-25th 5 5 4 5 5 5 29 5 5 5 5 5 25 5 5 5 5 5 25
13 Pria 21-25th 4 4 4 4 4 4 24 4 4 5 3 4 20 5 4 4 4 5 22
14 Wanita 21-25th 5 4 4 3 3 4 23 5 4 4 5 5 23 5 4 4 4 4 21
15 Pria >35th 5 4 4 3 3 5 24 5 5 4 5 4 23 5 5 5 5 5 25
16 Pria 31-35th 4 4 5 5 4 5 27 3 4 4 5 5 21 4 4 5 5 5 23
17 Pria 21-25th 4 5 4 4 3 5 25 4 5 4 3 3 19 3 3 5 5 5 21
18 Wanita 21-25th 5 4 4 5 5 5 28 4 5 5 5 5 24 5 5 5 5 5 25
19 Wanita 21-25th 4 4 4 4 5 5 26 5 4 4 5 5 23 4 5 5 5 5 24
20 Wanita 21-25th 2 1 2 2 3 1 11 1 2 2 1 2 8 2 3 3 1 3 12
21 Pria 26-30th 5 5 4 5 5 5 29 3 5 5 4 5 22 5 4 4 5 5 23
22 Pria 26-30th 4 5 5 5 5 5 29 5 5 4 5 5 24 5 5 5 5 5 25
23 Pria <21th 4 5 5 4 3 4 25 3 4 4 4 5 20 5 4 4 4 4 21
24 Pria 26-30th 4 4 4 3 4 4 23 3 4 4 5 5 21 4 5 5 4 4 22
25 Pria 21-25th 2 3 2 3 3 4 17 3 3 2 3 3 14 3 3 3 4 4 17
26 Pria 21-25th 3 4 4 4 5 4 24 4 5 4 3 3 19 5 5 5 3 5 23
27 Wanita 26-30th 4 4 5 3 3 4 23 3 4 4 3 3 17 3 3 3 3 4 16
28 Pria 26-30th 2 3 2 3 3 4 17 3 2 2 3 3 13 3 3 3 3 4 16
29 Pria 21-25th 2 3 2 3 3 3 16 3 2 2 4 3 14 4 3 4 3 3 17
30 Pria 26-30th 4 4 4 5 3 4 24 5 4 5 4 3 21 5 4 5 5 4 23
31 Wanita 21-25th 2 2 3 3 4 4 18 3 2 2 3 3 13 4 3 5 5 4 21
32 Wanita 26-30th 4 5 4 5 4 5 27 5 4 4 5 5 23 3 5 5 5 5 23
33 Pria <21th 5 4 5 4 4 4 26 5 4 4 5 5 23 5 5 5 5 4 24
34 Pria <20th 4 5 4 5 5 5 28 5 4 5 5 5 24 5 5 5 5 5 25
35 Pria 26-30th 3 4 2 3 3 4 19 3 4 2 3 4 16 3 4 4 5 4 20
36 Wanita 21-25th 5 5 5 5 5 5 30 5 4 5 5 5 24 5 5 5 5 5 25

37 Pria 21-25th 4 4 5 5 5 5 28 5 5 4 5 5 24 5 5 5 5 5 25
38 Pria 26-30th 4 4 4 5 5 5 27 5 5 4 5 5 24 5 5 5 5 4 24
39 Pria 21-25th 4 4 5 4 4 5 26 4 4 5 4 4 21 4 4 5 5 5 23
40 Pria 26-30th 2 2 2 3 3 4 16 4 2 3 3 3 15 4 3 3 3 4 17
41 Wanita 31-35th 5 4 4 3 4 4 24 4 4 5 4 3 20 5 3 4 5 4 21
42 Pria 31-35th 4 4 5 4 5 5 27 4 4 4 5 5 22 5 5 4 5 5 24
43 Pria 21-25th 3 4 2 4 3 4 20 4 2 3 4 4 17 3 3 4 4 4 18
44 Pria 26-30th 5 4 5 5 5 5 29 5 5 4 5 5 24 5 5 5 5 5 25
N0 Jenis
Kelamin Umur
Pelatihan (X1) Pengembangan Karir (X2) Kinerja (Y)
1 2 3 4 5 6 X1 1 2 3 4 5 X2 1 2 3 4 5 Y
45 Wanita >35th 1 2 2 1 2 4 12 2 3 2 2 1 10 1 2 2 3 2 10
46 Pria <21th 4 5 4 5 5 5 28 5 4 5 5 5 24 5 5 5 5 5 25
47 Wanita 21-25th 4 4 4 4 4 4 24 4 4 4 4 4 20 4 4 4 4 4 20
48 Wanita <21th 2 1 2 3 1 2 11 2 2 3 3 3 13 2 2 3 1 2 10
49 Wanita 21-25th 4 5 4 5 5 4 27 3 4 4 3 5 19 4 4 5 5 4 22
50 Pria 21-25th 3 3 3 3 4 4 20 4 4 4 3 3 18 4 3 3 4 3 17
51 Pria 26-30th 5 4 4 5 5 4 27 3 5 3 5 5 21 5 4 4 5 5 23
52 Pria 26-30th 4 5 4 5 5 5 28 4 4 4 5 5 22 5 5 5 4 5 24
53 Wanita 26-30th 5 5 5 5 5 5 30 5 5 4 5 4 23 5 5 5 5 5 25
54 Pria 21-25th 4 4 5 4 4 4 25 4 4 5 4 4 21 4 4 4 4 5 21
55 Pria 26-30th 2 2 2 3 3 4 16 3 3 2 4 4 16 4 3 4 5 4 20
56 Pria 21-25th 4 4 5 3 4 4 24 5 4 4 5 4 22 4 5 4 5 4 22
57 Pria 21-25th 4 4 5 3 3 4 23 3 4 3 3 4 17 3 4 5 4 4 20
58 Wanita 21-25th 4 4 5 3 4 5 25 5 4 4 4 4 21 4 3 4 4 5 20
59 Wanita 26-30th 3 1 2 1 2 3 12 2 3 1 2 2 10 2 1 2 3 2 10
60 Pria 26-30th 2 4 5 3 3 4 21 3 4 4 3 4 18 3 4 4 4 5 20
61 Pria 26-30th 4 5 5 5 5 5 29 4 4 4 5 5 22 5 5 5 5 5 25
62 Pria 26-30th 2 4 2 3 3 4 18 3 3 3 4 4 17 4 3 3 3 4 17
63 Wanita 31-35th 4 5 5 4 3 4 25 5 4 4 3 3 19 4 4 4 5 4 21
64 Pria 21-25th 2 3 3 3 3 3 17 3 4 2 3 3 15 4 3 3 4 3 17
65 Pria 26-30th 4 5 4 5 5 4 27 4 5 4 5 5 23 5 4 5 5 4 23
66 Wanita 26-30th 4 5 4 5 4 5 27 5 4 5 4 5 23 5 5 5 5 5 25
67 Wanita 31-35tn 4 5 5 5 5 5 29 5 5 4 5 5 24 5 5 4 5 5 24
68 Wanita <21th 4 4 4 3 4 3 22 3 4 4 3 4 18 4 4 4 4 4 20
69 Pria 21-25th 5 5 5 5 5 5 30 4 4 5 5 5 23 5 4 5 5 5 24
70 Pria 26-30th 4 4 4 4 5 4 25 3 3 4 5 5 20 4 4 5 4 4 21

LAMPIRAN 5
HASIL REGRESI
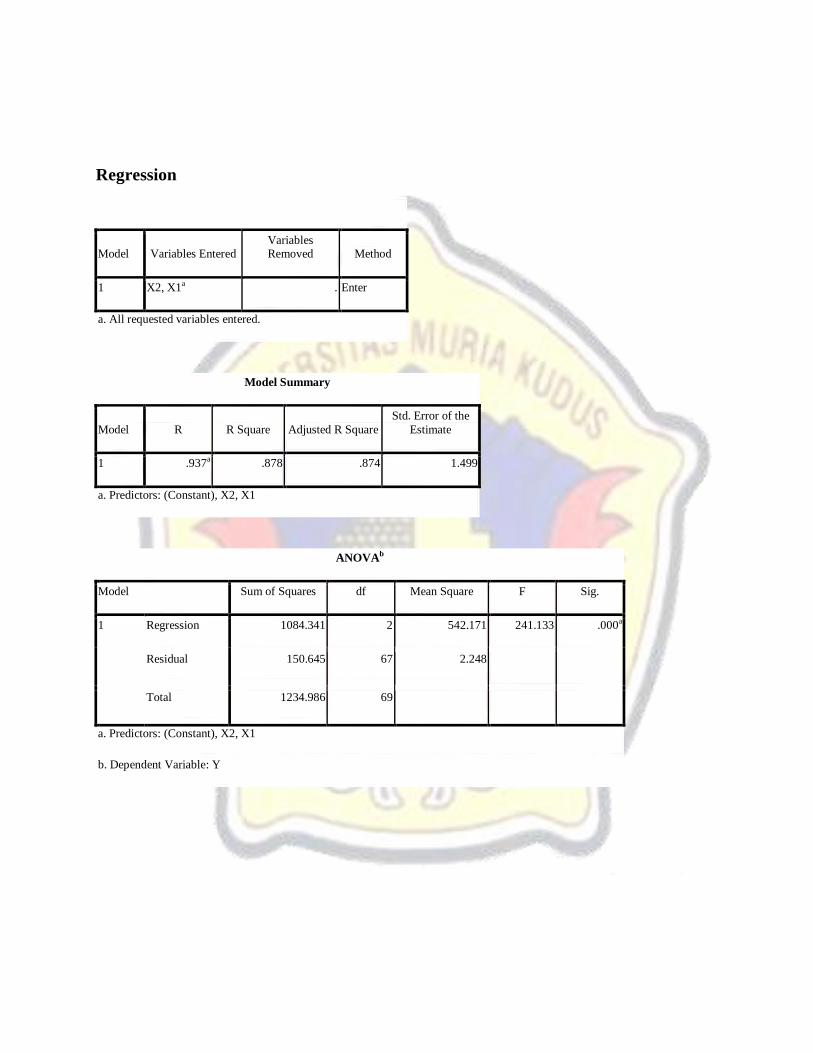
Regression
Model Variables Entered Variables Removed Method
1 X2, X1a . Enter
a. All requested variables entered.
Model Summary
Model R R Square Adjusted R Square
Std. Error of the
Estimate
1 .937a .878 .874 1.499
a. Predictors: (Constant), X2, X1
ANOVAb
Model Sum of Squares df Mean Square F Sig.
1 Regression 1084.341 2 542.171 241.133 .000a
Residual 150.645 67 2.248
Total 1234.986 69
a. Predictors: (Constant), X2, X1
b. Dependent Variable: Y

Coefficientsa
Model
Unstandardized Coefficients
Standardized
Coefficients
t Sig. B Std. Error Beta
1 (Constant) 3.164 .832 3.801 .000
X1 .358 .103 .449 3.483 .001
X2 .481 .124 .502 3.893 .000
a. Dependent Variable: Y

LAMPIRAN 6
FREKUENSI DATA
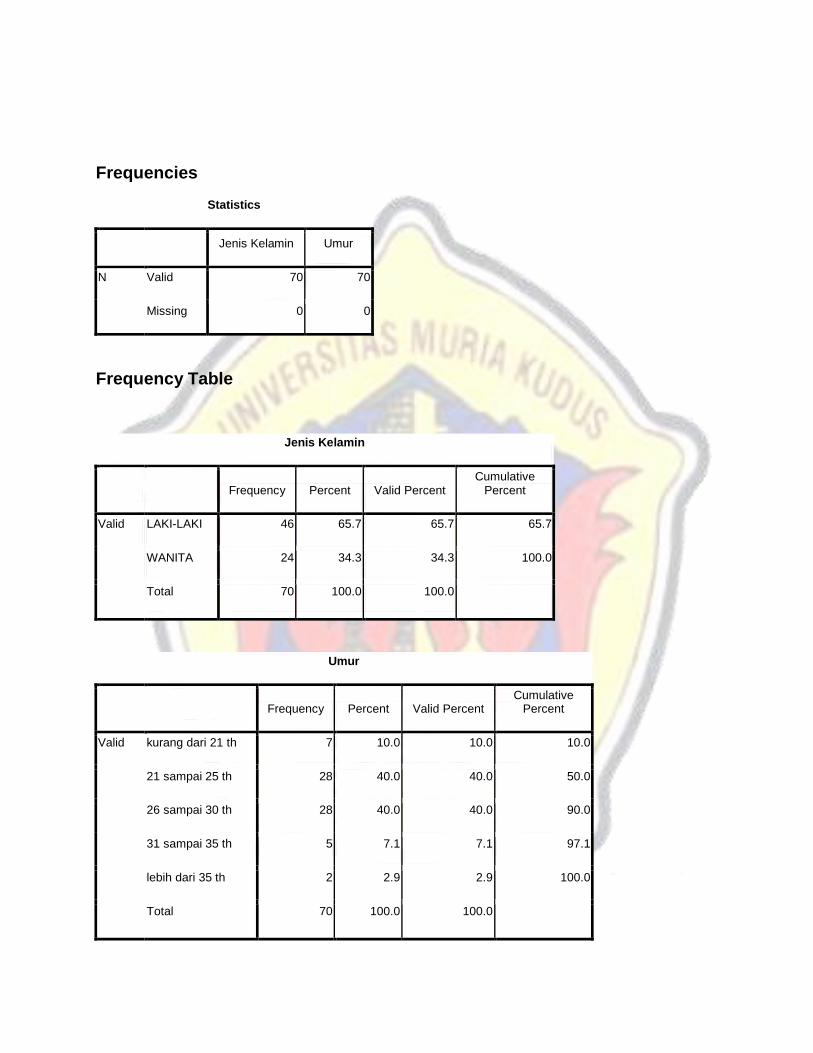
Frequencies
Statistics
Jenis Kelamin Umur
N Valid 70 70
Missing 0 0
Frequency Table
Jenis Kelamin
Frequency Percent Valid Percent
Cumulative Percent
Valid LAKI-LAKI 46 65.7 65.7 65.7
WANITA 24 34.3 34.3 100.0
Total 70 100.0 100.0
Umur
Frequency Percent Valid Percent
Cumulative Percent
Valid kurang dari 21 th 7 10.0 10.0 10.0
21 sampai 25 th 28 40.0 40.0 50.0
26 sampai 30 th 28 40.0 40.0 90.0
31 sampai 35 th 5 7.1 7.1 97.1
lebih dari 35 th 2 2.9 2.9 100.0
Total 70 100.0 100.0

Frequencies
Statistics
X1_1 X1_2 X1_3 X1_4 X1_5 X1_6
N Valid 70 70 70 70 70 70
Missing 0 0 0 0 0 0
Frequency Table
X1_1
Frequency Percent Valid Percent
Cumulative Percent
Valid STS 2 2.9 2.9 2.9
TS 12 17.1 17.1 20.0
N 7 10.0 10.0 30.0
S 36 51.4 51.4 81.4
SS 13 18.6 18.6 100.0
Total 70 100.0 100.0
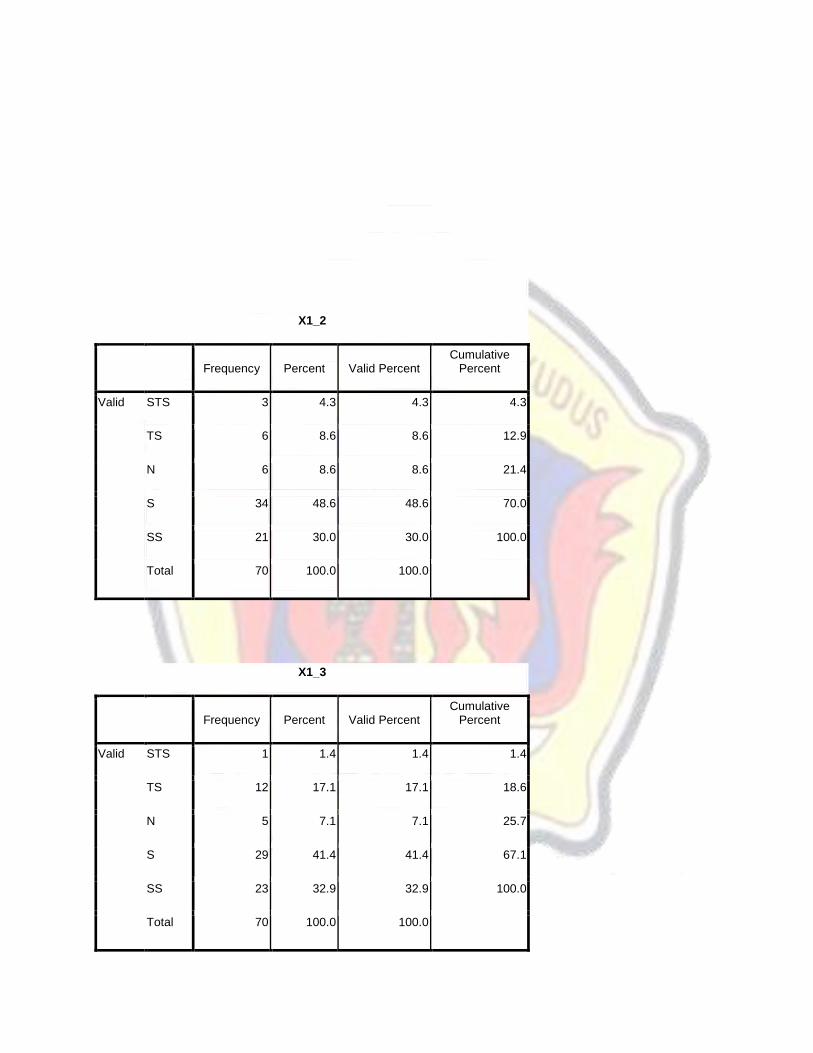
X1_2
Frequency Percent Valid Percent
Cumulative Percent
Valid STS 3 4.3 4.3 4.3
TS 6 8.6 8.6 12.9
N 6 8.6 8.6 21.4
S 34 48.6 48.6 70.0
SS 21 30.0 30.0 100.0
Total 70 100.0 100.0
X1_3
Frequency Percent Valid Percent
Cumulative Percent
Valid STS 1 1.4 1.4 1.4
TS 12 17.1 17.1 18.6
N 5 7.1 7.1 25.7
S 29 41.4 41.4 67.1
SS 23 32.9 32.9 100.0
Total 70 100.0 100.0

X1_4
Frequency Percent Valid Percent
Cumulative Percent
Valid STS 3 4.3 4.3 4.3
TS 1 1.4 1.4 5.7
N 23 32.9 32.9 38.6
S 17 24.3 24.3 62.9
SS 26 37.1 37.1 100.0
Total 70 100.0 100.0
X1_5
Frequency Percent Valid Percent
Cumulative Percent
Valid STS 2 2.9 2.9 2.9
TS 3 4.3 4.3 7.1
N 21 30.0 30.0 37.1
S 17 24.3 24.3 61.4
SS 27 38.6 38.6 100.0
Total 70 100.0 100.0

X1_6
Frequency Percent Valid Percent
Cumulative Percent
Valid STS 1 1.4 1.4 1.4
TS 2 2.9 2.9 4.3
N 5 7.1 7.1 11.4
S 32 45.7 45.7 57.1
SS 30 42.9 42.9 100.0
Total 70 100.0 100.0
Frequencies
Statistics
X2_1 X2_2 X2_3 X2_4 X2_5
N Valid 70 70 70 70 70
Missing 0 0 0 0 0

Frequency Table
X2_1
Frequency Percent Valid Percent
Cumulative Percent
Valid STS 1 1.4 1.4 1.4
TS 5 7.1 7.1 8.6
N 21 30.0 30.0 38.6
S 18 25.7 25.7 64.3
SS 25 35.7 35.7 100.0
Total 70 100.0 100.0
X2_2
Frequency Percent Valid Percent
Cumulative Percent
Valid STS 1 1.4 1.4 1.4
TS 8 11.4 11.4 12.9
N 7 10.0 10.0 22.9
S 38 54.3 54.3 77.1
SS 16 22.9 22.9 100.0
Total 70 100.0 100.0
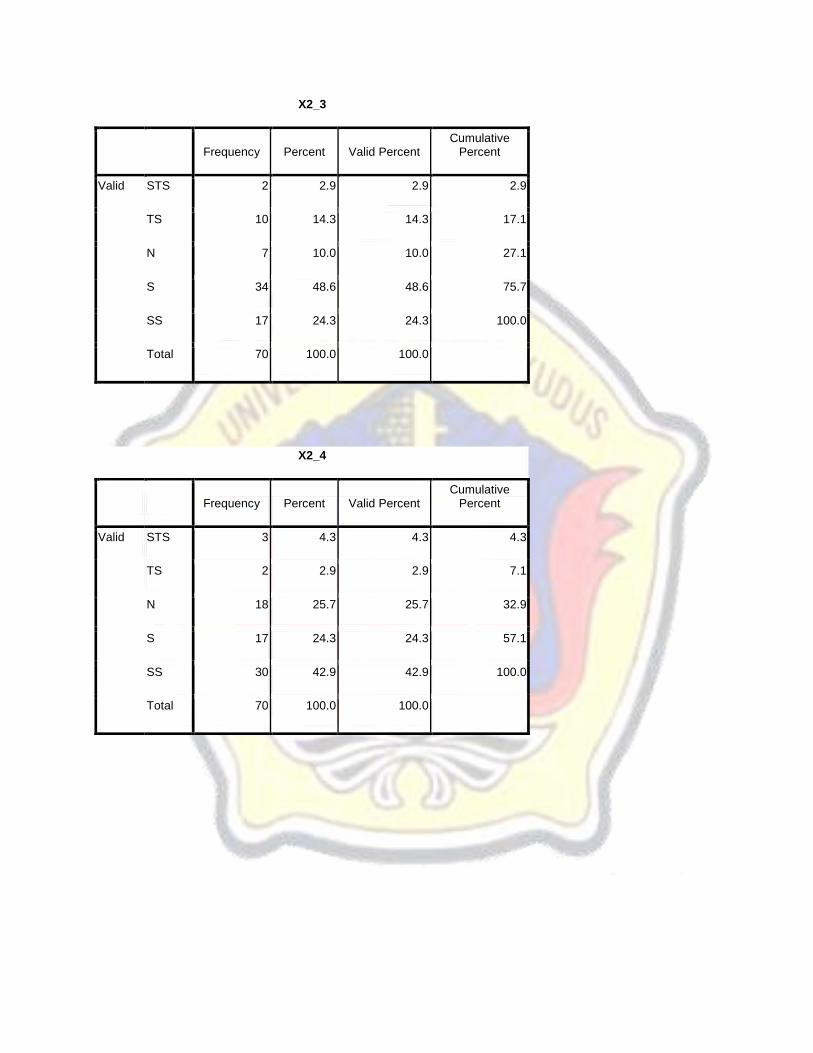
X2_3
Frequency Percent Valid Percent
Cumulative Percent
Valid STS 2 2.9 2.9 2.9
TS 10 14.3 14.3 17.1
N 7 10.0 10.0 27.1
S 34 48.6 48.6 75.7
SS 17 24.3 24.3 100.0
Total 70 100.0 100.0
X2_4
Frequency Percent Valid Percent
Cumulative Percent
Valid STS 3 4.3 4.3 4.3
TS 2 2.9 2.9 7.1
N 18 25.7 25.7 32.9
S 17 24.3 24.3 57.1
SS 30 42.9 42.9 100.0
Total 70 100.0 100.0
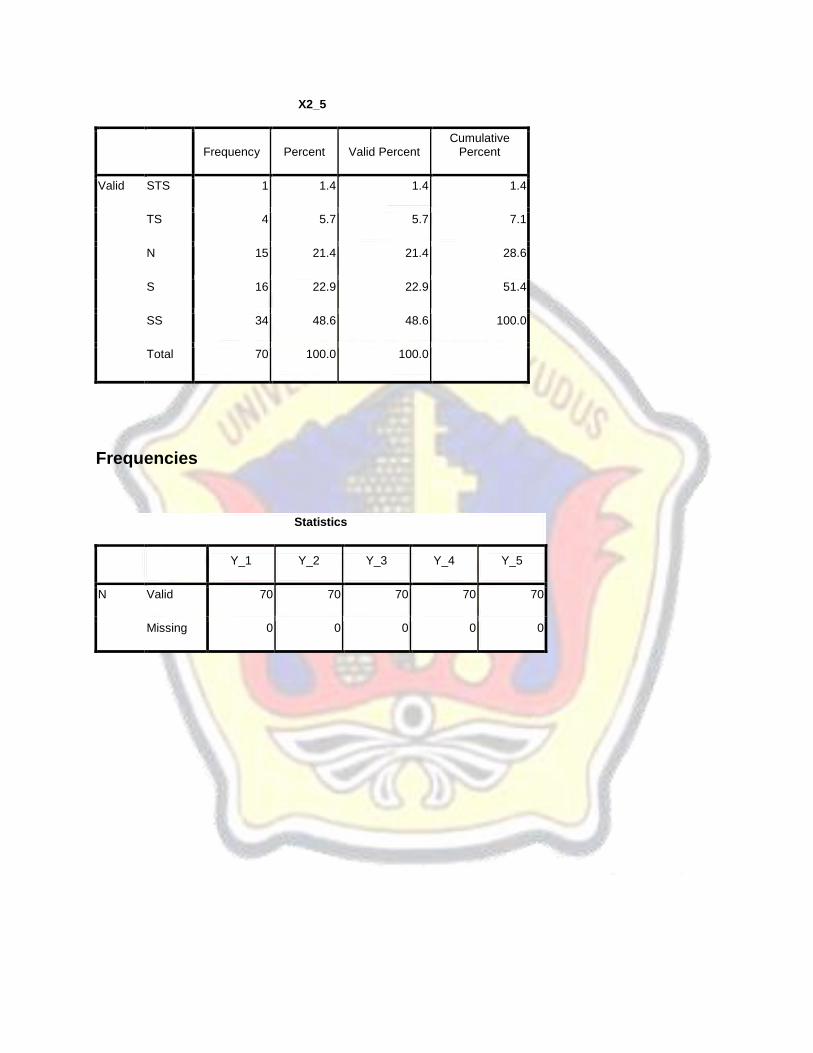
X2_5
Frequency Percent Valid Percent
Cumulative Percent
Valid STS 1 1.4 1.4 1.4
TS 4 5.7 5.7 7.1
N 15 21.4 21.4 28.6
S 16 22.9 22.9 51.4
SS 34 48.6 48.6 100.0
Total 70 100.0 100.0
Frequencies
Statistics
Y_1 Y_2 Y_3 Y_4 Y_5
N Valid 70 70 70 70 70
Missing 0 0 0 0 0

Frequency Table
Y_1
Frequency Percent Valid Percent
Cumulative Percent
Valid STS 2 2.9 2.9 2.9
TS 3 4.3 4.3 7.1
N 10 14.3 14.3 21.4
S 23 32.9 32.9 54.3
SS 32 45.7 45.7 100.0
Total 70 100.0 100.0
Y_2
Frequency Percent Valid Percent
Cumulative Percent
Valid STS 2 2.9 2.9 2.9
TS 3 4.3 4.3 7.1
N 17 24.3 24.3 31.4
S 20 28.6 28.6 60.0
SS 28 40.0 40.0 100.0
Total 70 100.0 100.0

Y_3
Frequency Percent Valid Percent
Cumulative Percent
Valid STS 1 1.4 1.4 1.4
TS 2 2.9 2.9 4.3
N 10 14.3 14.3 18.6
S 21 30.0 30.0 48.6
SS 36 51.4 51.4 100.0
Total 70 100.0 100.0
Y_4
Frequency Percent Valid Percent
Cumulative Percent
Valid STS 2 2.9 2.9 2.9
TS 1 1.4 1.4 4.3
N 8 11.4 11.4 15.7
S 19 27.1 27.1 42.9
SS 40 57.1 57.1 100.0
Total 70 100.0 100.0

Y_5
Frequency Percent Valid Percent
Cumulative Percent
Valid STS 1 1.4 1.4 1.4
TS 4 5.7 5.7 7.1
N 4 5.7 5.7 12.9
S 27 38.6 38.6 51.4
SS 34 48.6 48.6 100.0
Total 70 100.0 100.0