KUESIONER PENELITIAN - repository.wima.ac.idrepository.wima.ac.id/1149/7/Lampiran.pdfmemiliki...
75
KUESIONER PENELITIAN Responden yang terhormat, Perkenankanlah kami, mahasiswa Jurusan Manajemen Fakultas Bisnis Universitas Katolik Widya Mandala Surabaya, mohon bantuan Anda untuk meluangkan waktu mengisi/menjawab daftar pernyataan di bawah ini dengan jujur dan sesuai dengan keinginan Anda. Data yang kami perolehakan kami gunakan untuk menyusun skripsi yang berjudul PENGARUH PERCEIVED VALUE DAN PERCEIVED RISK TERHADAP EVALUATION BRAND YANG MEMPENGARUHI PURCHASE INTENTION PADA CARREFOUR DI SURABAYA Atas waktu yang Anda luangkan, kami ucapkan banyak terima kasih. Apakah anda ingin membeli private brand di Carrefour? a. ingin b. Tidak ingin JenisKelamin: a. Pria b. Wanita Usia : a. 20-30 b. 31-40 c. 41-50
Transcript of KUESIONER PENELITIAN - repository.wima.ac.idrepository.wima.ac.id/1149/7/Lampiran.pdfmemiliki...

KUESIONER PENELITIAN
Responden yang terhormat,
Perkenankanlah kami, mahasiswa Jurusan Manajemen Fakultas Bisnis
Universitas Katolik Widya Mandala Surabaya, mohon bantuan Anda untuk
meluangkan waktu mengisi/menjawab daftar pernyataan di bawah ini
dengan jujur dan sesuai dengan keinginan Anda. Data yang kami
perolehakan kami gunakan untuk menyusun skripsi yang berjudul
PENGARUH PERCEIVED VALUE DAN PERCEIVED RISK
TERHADAP EVALUATION BRAND YANG MEMPENGARUHI
PURCHASE INTENTION PADA CARREFOUR DI SURABAYA Atas
waktu yang Anda luangkan, kami ucapkan banyak terima kasih.
Apakah anda ingin membeli private brand di Carrefour?
a. ingin
b. Tidak ingin
JenisKelamin:
a. Pria
b. Wanita
Usia :
a. 20-30
b. 31-40
c. 41-50

Apakah anda berdomisili di Surabaya ?
a. YA
b. TIDAK
Cara pengisian kuesioner :
Berikan tand pada kolom yang di pilih.
STS : sangat tidak setuju
TS : Tidak setuju
N : netral
S : Setuju
SS : Sangat setuju
A. Perceived risk
No Pernyataan STS TS N S SS
1 Harga private brand Carrefour lebih
murah daripada national brand
2 Membeli Carrefour brand dapat
menghemat keuangan saya
3 Perfoma private brand sebanding
dengan national brand
4 Private brand memiliki kemasan yang
baik
5 Private brand memiliki tingkat cacat
produk yang rendah

B. Perceived value
C. Brand evaluation
No Pernyataan STS TS N S SS
1 Private brand akan memberikan nilai
fungsional yang baik
2 Saya akan merasa nyaman ketika
membeli private brand Carrefour
3 Saya merasa puas jika menggunakan
private brand
4 Saya membeli private brand karena
orang disekitar saya membeli private
brand Carrefour
5 Saya merasa konsumen ritel beralih
menggunakan private brand
No Pernyataan STS TS N S SS
1 Saya merasa private brand Carrefour
mempunyai image yang baik
2 Produk private brand Carrefour
memiliki keunggulan disbanding
dengan national brand
3 Kualitas private brand tidak kalah
dengan national brand
4 Saya ingin membeli Private brand
Carrefour memiliki mutu yang baik
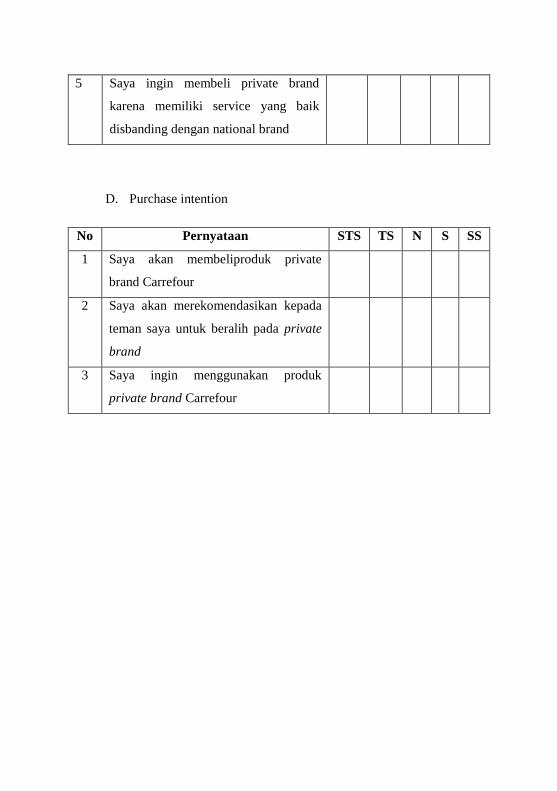
D. Purchase intention
No Pernyataan STS TS N S SS
1 Saya akan membeliproduk private
brand Carrefour
2 Saya akan merekomendasikan kepada
teman saya untuk beralih pada private
brand
3 Saya ingin menggunakan produk
private brand Carrefour
5 Saya ingin membeli private brand
karena memiliki service yang baik
disbanding dengan national brand
LAMPIRAN 1
DATE: 6/26/2014
TIME: 19:16
L I S R E L 8.70
BY
Karl G. Jöreskog & Dag Sörbom
This program is published exclusively by
Scientific Software International, Inc.
7383 N. Lincoln Avenue, Suite 100
Lincolnwood, IL 60712, U.S.A.
Phone: (800)247-6113, (847)675-0720, Fax: (847)675-2140
Copyright by Scientific Software International, Inc., 1981-2004
Use of this program is subject to the terms specified in the
Universal Copyright Convention.
Website: www.ssicentral.com

The following lines were read from file F:\skripsi david\rawdata.spl:
Raw Data from File rawdata.psf
Latent Variables: X1 X2 Y1 Y2
Relationships:
X11 X12 X13 X14 X15 = X1
X21 X22 X23 X24 X25 = X2
Y11 Y12 Y13 Y14 Y15 = Y1
Y21 Y22 Y23 = Y2
Y1 = X1 X2
Y2 = X1 X2 Y1
options rs ef sc
Path Diagram
End of Problems
Sample Size = 20

Covariance Matrix
Y11 Y12 Y13 Y14 Y15 Y21
-------- -------- -------- -------- -------- --------
Y11 0.98
Y12 0.67 0.91
Y13 0.50 0.50 0.96
Y14 0.73 0.65 0.76 1.08
Y15 0.62 0.49 0.59 0.67 0.90
Y21 0.88 0.79 0.58 0.85 0.77 1.32
Y22 0.74 0.70 0.67 0.80 0.67 0.91
Y23 0.83 0.74 0.74 0.91 0.74 0.91
X11 0.67 0.66 0.59 0.73 0.62 0.87
X12 0.72 0.74 0.64 0.79 0.65 0.95
X13 0.81 0.74 0.65 0.79 0.74 1.00
X14 0.66 0.63 0.53 0.68 0.59 0.85
X15 0.74 0.71 0.67 0.81 0.72 0.89
X21 0.69 0.58 0.49 0.56 0.63 0.84
X22 0.71 0.74 0.67 0.81 0.70 0.92
X23 0.81 0.81 0.81 0.92 0.77 1.02

X24 0.69 0.58 0.65 0.75 0.66 0.83
X25 0.86 0.81 0.66 0.86 0.75 1.09
Covariance Matrix
Y22 Y23 X11 X12 X13 X14
-------- -------- -------- -------- -------- --------
Y22 1.15
Y23 0.97 1.30
X11 0.81 0.85 0.99
X12 0.89 0.95 0.77 1.16
X13 0.87 0.92 0.85 0.83 1.29
X14 0.76 0.88 0.76 0.78 0.84 1.09
X15 0.90 1.00 0.82 0.84 0.87 0.78
X21 0.75 0.77 0.73 0.72 0.81 0.71
X22 0.90 1.03 0.83 0.93 0.90 0.81
X23 1.04 1.18 0.93 1.05 0.96 0.91
X24 0.74 0.82 0.69 0.75 0.82 0.72
X25 0.90 0.99 0.84 0.95 1.00 0.86

Covariance Matrix
X15 X21 X22 X23 X24 X25
-------- -------- -------- -------- -------- --------
X15 1.16
X21 0.82 1.03
X22 0.96 0.81 1.19
X23 1.08 0.88 1.11 1.42
X24 0.76 0.64 0.78 0.81 0.96
X25 0.92 0.81 0.93 1.04 0.85 1.28
Number of Iterations = 42
LISREL Estimates (Maximum Likelihood)
Measurement Equations
Y11 = 0.83*Y1, Errorvar.= 0.30 , R² = 0.69
(0.034)
8.90

Y12 = 0.76*Y1, Errorvar.= 0.33 , R² = 0.64
(0.056) (0.036)
13.68 9.15
Y13 = 0.71*Y1, Errorvar.= 0.45 , R² = 0.53
(0.060) (0.048)
11.94 9.47
Y14 = 0.88*Y1, Errorvar.= 0.30 , R² = 0.72
(0.058) (0.034)
15.12 8.70
Y15 = 0.75*Y1, Errorvar.= 0.34 , R² = 0.62
(0.056) (0.037)
13.36 9.22
Y21 = 0.98*Y2, Errorvar.= 0.35 , R² = 0.74
(0.036)
9.61
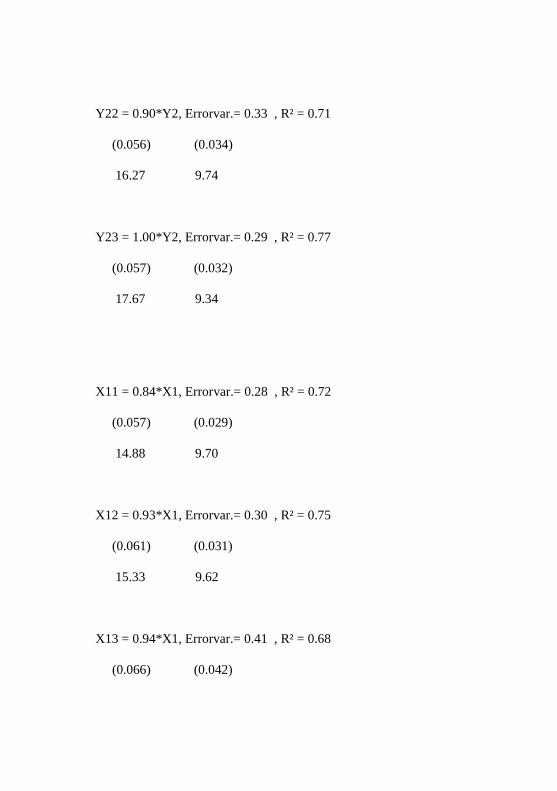
Y22 = 0.90*Y2, Errorvar.= 0.33 , R² = 0.71
(0.056) (0.034)
16.27 9.74
Y23 = 1.00*Y2, Errorvar.= 0.29 , R² = 0.77
(0.057) (0.032)
17.67 9.34
X11 = 0.84*X1, Errorvar.= 0.28 , R² = 0.72
(0.057) (0.029)
14.88 9.70
X12 = 0.93*X1, Errorvar.= 0.30 , R² = 0.75
(0.061) (0.031)
15.33 9.62
X13 = 0.94*X1, Errorvar.= 0.41 , R² = 0.68
(0.066) (0.042)
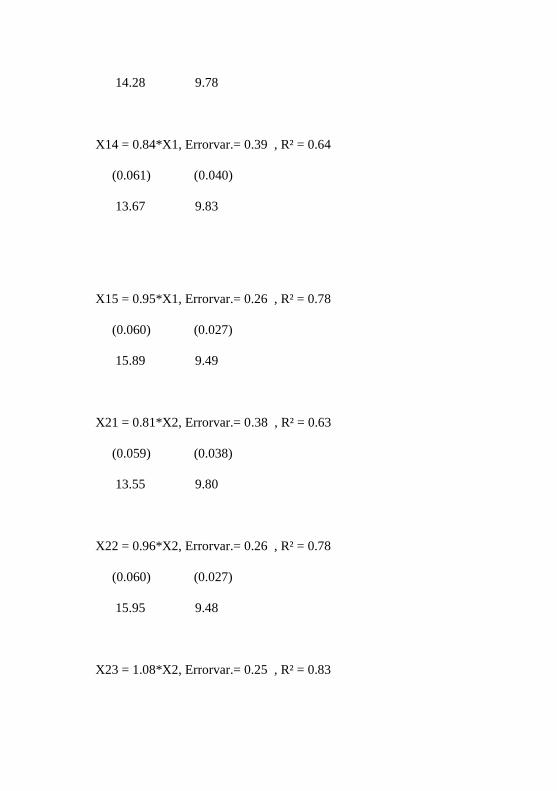
14.28 9.78
X14 = 0.84*X1, Errorvar.= 0.39 , R² = 0.64
(0.061) (0.040)
13.67 9.83
X15 = 0.95*X1, Errorvar.= 0.26 , R² = 0.78
(0.060) (0.027)
15.89 9.49
X21 = 0.81*X2, Errorvar.= 0.38 , R² = 0.63
(0.059) (0.038)
13.55 9.80
X22 = 0.96*X2, Errorvar.= 0.26 , R² = 0.78
(0.060) (0.027)
15.95 9.48
X23 = 1.08*X2, Errorvar.= 0.25 , R² = 0.83

(0.065) (0.027)
16.69 9.23
X24 = 0.81*X2, Errorvar.= 0.31 , R² = 0.68
(0.057) (0.031)
14.32 9.74
X25 = 1.00*X2, Errorvar.= 0.29 , R² = 0.77
(0.063) (0.030)
15.80 9.52
Structural Equations
Y1 = 0.45*X1 + 0.52*X2, Errorvar.= 0.054 , R² = 0.95
(0.23) (0.23) (0.021)
2.00 2.28 2.61
Y2 = 0.23*Y1 + 0.40*X1 + 0.40*X2, Errorvar.= -0.048 , R² = 1.05
(0.18) (0.18) (0.19) (0.013)
1.24 2.21 2.13 -3.61
W_A_R_N_I_N_G : Error variance is negative.
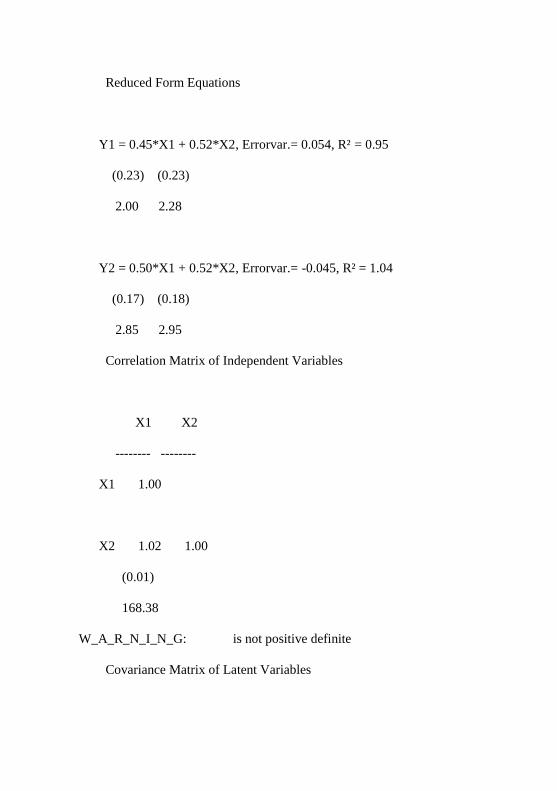
Reduced Form Equations
Y1 = 0.45*X1 + 0.52*X2, Errorvar.= 0.054, R² = 0.95
(0.23) (0.23)
2.00 2.28
Y2 = 0.50*X1 + 0.52*X2, Errorvar.= -0.045, R² = 1.04
(0.17) (0.18)
2.85 2.95
Correlation Matrix of Independent Variables
X1 X2
-------- --------
X1 1.00
X2 1.02 1.00
(0.01)
168.38
W_A_R_N_I_N_G: is not positive definite
Covariance Matrix of Latent Variables

Y1 Y2 X1 X2
-------- -------- -------- --------
Y1 1.00
Y2 1.01 1.00
X1 0.98 1.03 1.00
X2 0.98 1.03 1.02 1.00
W_A_R_N_I_N_G: Matrix above is not positive definite
Goodness of Fit Statistics
Degrees of Freedom = 129
Minimum Fit Function Chi-Square = 417.19 (P = 0.0)
Normal Theory Weighted Least Squares Chi-Square = 461.16 (P = 0.0)
Estimated Non-centrality Parameter (NCP) = 332.16
90 Percent Confidence Interval for NCP = (270.39 ; 401.51)
Minimum Fit Function Value = 2.10
Population Discrepancy Function Value (F0) = 1.67
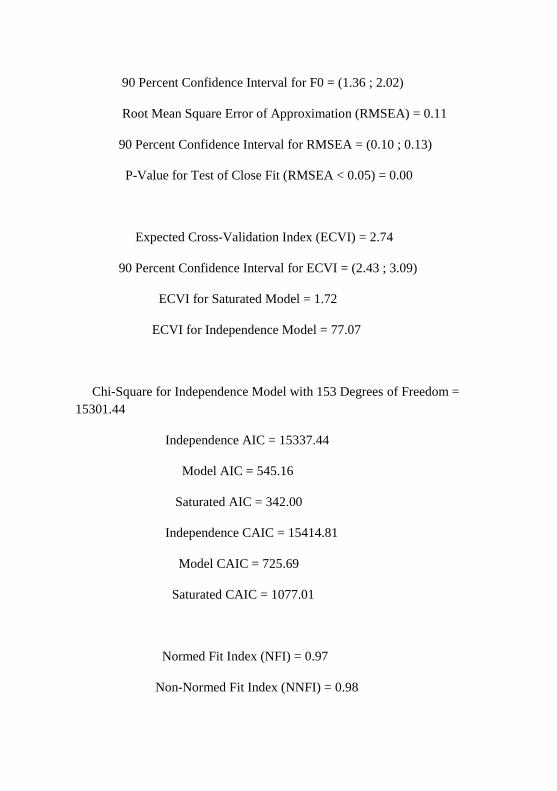
90 Percent Confidence Interval for F0 = (1.36 ; 2.02)
Root Mean Square Error of Approximation (RMSEA) = 0.11
90 Percent Confidence Interval for RMSEA = (0.10 ; 0.13)
P-Value for Test of Close Fit (RMSEA < 0.05) = 0.00
Expected Cross-Validation Index (ECVI) = 2.74
90 Percent Confidence Interval for ECVI = (2.43 ; 3.09)
ECVI for Saturated Model = 1.72
ECVI for Independence Model = 77.07
Chi-Square for Independence Model with 153 Degrees of Freedom =
15301.44
Independence AIC = 15337.44
Model AIC = 545.16
Saturated AIC = 342.00
Independence CAIC = 15414.81
Model CAIC = 725.69
Saturated CAIC = 1077.01
Normed Fit Index (NFI) = 0.97
Non-Normed Fit Index (NNFI) = 0.98

Parsimony Normed Fit Index (PNFI) = 0.82
Comparative Fit Index (CFI) = 0.98
Incremental Fit Index (IFI) = 0.98
Relative Fit Index (RFI) = 0.97
Critical N (CN) = 81.75
Root Mean Square Residual (RMR) = 0.039
Standardized RMR = 0.035
Goodness of Fit Index (GFI) = 0.80
Adjusted Goodness of Fit Index (AGFI) = 0.73
Parsimony Goodness of Fit Index (PGFI) = 0.60
Fitted Covariance Matrix
Y11 Y12 Y13 Y14 Y15 Y21
-------- -------- -------- -------- -------- --------
Y11 0.98
Y12 0.63 0.91
Y13 0.59 0.54 0.96

Y14 0.73 0.67 0.63 1.08
Y15 0.62 0.57 0.53 0.66 0.90
Y21 0.82 0.75 0.71 0.87 0.74 1.32
Y22 0.75 0.69 0.65 0.80 0.68 0.89
Y23 0.83 0.77 0.72 0.89 0.76 0.99
X11 0.68 0.63 0.59 0.73 0.62 0.85
X12 0.75 0.69 0.65 0.80 0.68 0.94
X13 0.76 0.70 0.66 0.81 0.69 0.95
X14 0.68 0.62 0.58 0.72 0.61 0.85
X15 0.77 0.71 0.66 0.82 0.70 0.96
X21 0.65 0.60 0.56 0.70 0.59 0.82
X22 0.78 0.72 0.67 0.83 0.70 0.97
X23 0.87 0.80 0.76 0.93 0.79 1.09
X24 0.65 0.60 0.57 0.70 0.59 0.82
X25 0.80 0.74 0.69 0.86 0.73 1.01
Fitted Covariance Matrix
Y22 Y23 X11 X12 X13 X14
-------- -------- -------- -------- -------- --------

Y22 1.15
Y23 0.91 1.30
X11 0.78 0.87 0.99
X12 0.87 0.96 0.78 1.16
X13 0.87 0.97 0.79 0.87 1.29
X14 0.78 0.86 0.71 0.78 0.78 1.09
X15 0.88 0.98 0.80 0.88 0.89 0.79
X21 0.75 0.83 0.69 0.77 0.77 0.69
X22 0.89 0.99 0.83 0.92 0.92 0.82
X23 1.01 1.12 0.93 1.03 1.04 0.93
X24 0.75 0.84 0.70 0.77 0.78 0.69
X25 0.92 1.03 0.86 0.95 0.95 0.85
Fitted Covariance Matrix
X15 X21 X22 X23 X24 X25
-------- -------- -------- -------- -------- --------
X15 1.16
X21 0.78 1.03
X22 0.93 0.78 1.19

X23 1.05 0.87 1.04 1.42
X24 0.79 0.65 0.78 0.88 0.96
X25 0.97 0.80 0.96 1.08 0.81 1.28
Fitted Residuals
Y11 Y12 Y13 Y14 Y15 Y21
-------- -------- -------- -------- -------- --------
Y11 0.00
Y12 0.04 0.00
Y13 -0.09 -0.04 0.00
Y14 0.00 -0.02 0.13 0.00
Y15 0.00 -0.08 0.05 0.01 0.00
Y21 0.07 0.04 -0.12 -0.03 0.03 0.00
Y22 -0.01 0.01 0.02 -0.01 -0.01 0.02
Y23 0.00 -0.03 0.02 0.02 -0.01 -0.08
X11 -0.01 0.03 0.00 0.00 0.00 0.02
X12 -0.03 0.05 -0.01 -0.02 -0.03 0.01
X13 0.06 0.04 0.00 -0.02 0.06 0.05
X14 -0.01 0.01 -0.06 -0.04 -0.02 0.00

X15 -0.02 0.01 0.00 -0.01 0.02 -0.07
X21 0.04 -0.02 -0.08 -0.13 0.04 0.02
X22 -0.06 0.03 0.00 -0.02 -0.01 -0.05
X23 -0.06 0.00 0.05 -0.02 -0.02 -0.07
X24 0.03 -0.03 0.08 0.05 0.06 0.01
X25 0.06 0.07 -0.04 0.00 0.02 0.08
Fitted Residuals
Y22 Y23 X11 X12 X13 X14
-------- -------- -------- -------- -------- --------
Y22 0.00
Y23 0.07 0.00
X11 0.02 -0.02 0.00
X12 0.02 -0.01 -0.01 0.00
X13 0.00 -0.05 0.05 -0.04 0.00
X14 -0.02 0.02 0.05 0.00 0.05 0.00
X15 0.02 0.02 0.02 -0.04 -0.02 -0.01
X21 0.00 -0.07 0.03 -0.04 0.03 0.02
X22 0.00 0.03 0.00 0.01 -0.02 -0.01

X23 0.04 0.07 -0.01 0.02 -0.08 -0.01
X24 -0.01 -0.02 -0.01 -0.02 0.04 0.03
X25 -0.02 -0.04 -0.02 0.00 0.05 0.01
Fitted Residuals
X15 X21 X22 X23 X24 X25
-------- -------- -------- -------- -------- --------
X15 0.00
X21 0.04 0.00
X22 0.02 0.03 0.00
X23 0.03 0.01 0.07 0.00
X24 -0.03 -0.01 0.00 -0.06 0.00
X25 -0.05 0.00 -0.03 -0.04 0.04 0.00
Summary Statistics for Fitted Residuals
Smallest Fitted Residual = -0.13
Median Fitted Residual = 0.00
Largest Fitted Residual = 0.13

Stemleaf Plot
-12|44
-10|
- 8|732
- 6|75177332
- 4|841744321
- 2|9962998777553321111
- 0|998877663333332110099887775554322221000000000000000000
0|11222244556789011237777889
2|011133445558900233556899
4|01124702333444579
6|555602
8|35
10|
12|1
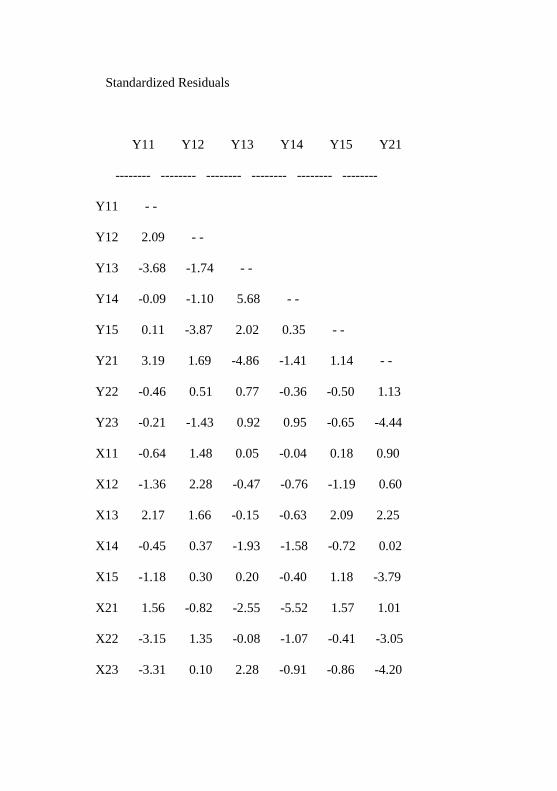
Standardized Residuals
Y11 Y12 Y13 Y14 Y15 Y21
-------- -------- -------- -------- -------- --------
Y11 - -
Y12 2.09 - -
Y13 -3.68 -1.74 - -
Y14 -0.09 -1.10 5.68 - -
Y15 0.11 -3.87 2.02 0.35 - -
Y21 3.19 1.69 -4.86 -1.41 1.14 - -
Y22 -0.46 0.51 0.77 -0.36 -0.50 1.13
Y23 -0.21 -1.43 0.92 0.95 -0.65 -4.44
X11 -0.64 1.48 0.05 -0.04 0.18 0.90
X12 -1.36 2.28 -0.47 -0.76 -1.19 0.60
X13 2.17 1.66 -0.15 -0.63 2.09 2.25
X14 -0.45 0.37 -1.93 -1.58 -0.72 0.02
X15 -1.18 0.30 0.20 -0.40 1.18 -3.79
X21 1.56 -0.82 -2.55 -5.52 1.57 1.01
X22 -3.15 1.35 -0.08 -1.07 -0.41 -3.05
X23 -3.31 0.10 2.28 -0.91 -0.86 -4.20

X24 1.57 -1.20 3.19 2.43 2.77 0.52
X25 2.82 3.21 -1.38 -0.09 0.82 4.38
Standardized Residuals
Y22 Y23 X11 X12 X13 X14
-------- -------- -------- -------- -------- --------
Y22 - -
Y23 3.53 - -
X11 1.26 -1.45 - -
X12 1.29 -0.44 -0.69 - -
X13 0.07 -2.44 2.36 -1.78 - -
X14 -0.90 0.82 2.37 -0.11 1.96 - -
X15 1.21 1.07 1.15 -2.41 -0.86 -0.61
X21 -0.10 -3.32 1.63 -2.11 1.39 0.83
X22 0.20 2.04 -0.29 0.82 -1.14 -0.53
X23 2.27 4.29 -0.44 1.14 -4.13 -0.73
X24 -0.67 -1.02 -0.41 -1.20 1.77 1.34
X25 -1.31 -2.27 -0.96 0.10 2.21 0.51

Standardized Residuals
X15 X21 X22 X23 X24 X25
-------- -------- -------- -------- -------- --------
X15 - -
X21 2.21 - -
X22 1.57 1.37 - -
X23 2.12 0.39 4.51 - -
X24 -1.64 -0.43 -0.24 -3.48 - -
X25 -2.97 0.21 -1.79 -2.44 1.93 - -
Summary Statistics for Standardized Residuals
Smallest Standardized Residual = -5.52
Median Standardized Residual = 0.00
Largest Standardized Residual = 5.68
Stemleaf Plot
- 5|5

- 4|9421
- 3|987533100
- 2|544431
- 1|988766544443222211100
- 0|9999887777766655554444444432211111100000000000000000000
0|1111122223444555688888999
1|011111223333445666667789
2|000111222233344488
3|2225
4|345
5|7
Largest Negative Standardized Residuals
Residual for Y13 and Y11 -3.68
Residual for Y15 and Y12 -3.87
Residual for Y21 and Y13 -4.86
Residual for Y23 and Y21 -4.44
Residual for X15 and Y21 -3.79
Residual for X21 and Y14 -5.52
Residual for X21 and Y23 -3.32
Residual for X22 and Y11 -3.15

Residual for X22 and Y21 -3.05
Residual for X23 and Y11 -3.31
Residual for X23 and Y21 -4.20
Residual for X23 and X13 -4.13
Residual for X24 and X23 -3.48
Residual for X25 and X15 -2.97
Largest Positive Standardized Residuals
Residual for Y14 and Y13 5.68
Residual for Y21 and Y11 3.19
Residual for Y23 and Y22 3.53
Residual for X23 and Y23 4.29
Residual for X23 and X22 4.51
Residual for X24 and Y13 3.19
Residual for X24 and Y15 2.77
Residual for X25 and Y11 2.82
Residual for X25 and Y12 3.21
Residual for X25 and Y21 4.38
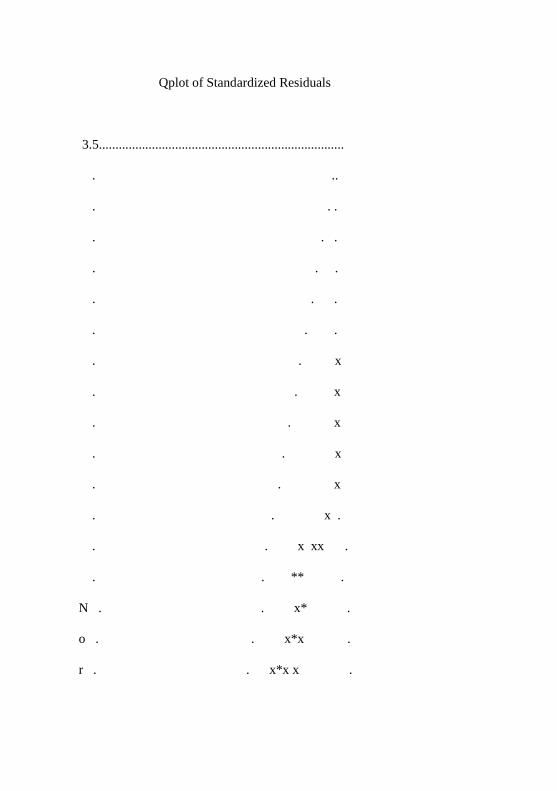
Qplot of Standardized Residuals
3.5..........................................................................
. ..
. . .
. . .
. . .
. . .
. . .
. . x
. . x
. . x
. . x
. . x
. . x .
. . x xx .
. . ** .
N . . x* .
o . . x*x .
r . . x*x x .

m . . *xx* .
a . . xx*x .
l . . x*x .
. xxxxx .
Q . xx** .
u . x*xx .
a . *x. .
n . x**x .
t . x** . .
i . xx* . .
l . x*xx . .
e . x xxx . .
s . x xx . .
. xxx x . .
x * . .
x . .
x . .
x . .
x . .
x . .

x . .
. . .
. . .
. . .
. . .
. . .
-3.5..........................................................................
-3.5 3.5
Standardized Residuals
The Modification Indices Suggest to Add an Error Covariance
Between and Decrease in Chi-Square New Estimate
Y13 Y11 13.5 -0.11
Y14 Y13 32.2 0.17
Y15 Y12 15.0 -0.10
Y21 Y11 15.1 0.09
Y21 Y13 21.9 -0.13
Y23 Y21 19.7 -0.12
Y23 Y22 12.4 0.09
X21 Y14 26.1 -0.13

X21 Y23 8.0 -0.07
X22 Y11 9.7 -0.07
X23 Y11 11.1 -0.07
X23 Y13 9.1 0.08
X23 Y23 21.3 0.09
X23 X13 15.7 -0.10
X23 X22 20.4 0.09
X24 Y13 10.7 0.09
X24 X23 12.1 -0.07
X25 Y21 18.5 0.10
Standardized Solution
LAMBDA-Y
Y1 Y2
-------- --------
Y11 0.83 - -
Y12 0.76 - -

Y13 0.71 - -
Y14 0.88 - -
Y15 0.75 - -
Y21 - - 0.98
Y22 - - 0.90
Y23 - - 1.00
LAMBDA-X
X1 X2
-------- --------
X11 0.84 - -
X12 0.93 - -
X13 0.94 - -
X14 0.84 - -
X15 0.95 - -
X21 - - 0.81
X22 - - 0.96
X23 - - 1.08
X24 - - 0.81

X25 - - 1.00
BETA
Y1 Y2
-------- --------
Y1 - - - -
Y2 0.23 - -
GAMMA
X1 X2
-------- --------
Y1 0.45 0.52
Y2 0.40 0.40
Correlation Matrix of ETA and KSI
Y1 Y2 X1 X2
-------- -------- -------- --------
Y1 1.00
Y2 1.01 1.00
X1 0.98 1.03 1.00
X2 0.98 1.03 1.02 1.00
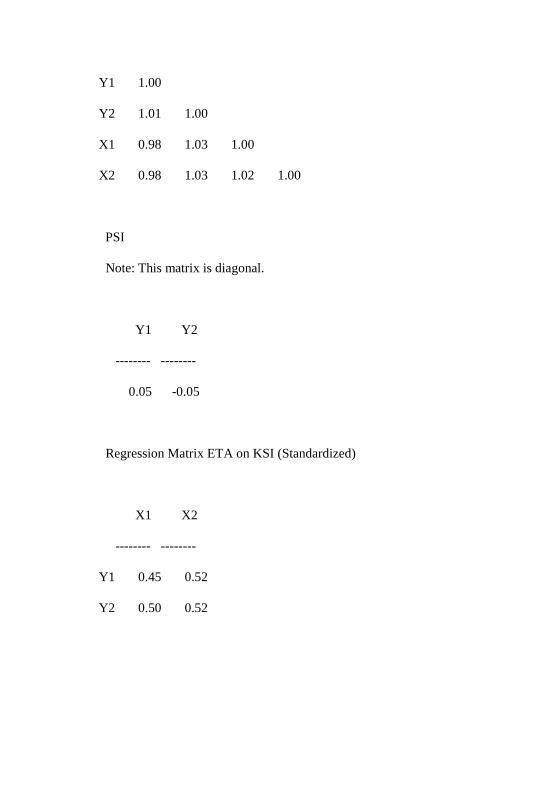
PSI
Note: This matrix is diagonal.
Y1 Y2
-------- --------
0.05 -0.05
Regression Matrix ETA on KSI (Standardized)
X1 X2
-------- --------
Y1 0.45 0.52
Y2 0.50 0.52

Completely Standardized Solution
LAMBDA-Y
Y1 Y2
-------- --------
Y11 0.83 - -
Y12 0.80 - -
Y13 0.73 - -
Y14 0.85 - -
Y15 0.79 - -
Y21 - - 0.86
Y22 - - 0.84
Y23 - - 0.88
LAMBDA-X
X1 X2
-------- --------

X11 0.85 - -
X12 0.86 - -
X13 0.82 - -
X14 0.80 - -
X15 0.88 - -
X21 - - 0.80
X22 - - 0.88
X23 - - 0.91
X24 - - 0.83
X25 - - 0.88
BETA
Y1 Y2
-------- --------
Y1 - - - -
Y2 0.23 - -
GAMMA

X1 X2
-------- --------
Y1 0.45 0.52
Y2 0.40 0.40
Correlation Matrix of ETA and KSI
Y1 Y2 X1 X2
-------- -------- -------- --------
Y1 1.00
Y2 1.01 1.00
X1 0.98 1.03 1.00
X2 0.98 1.03 1.02 1.00
PSI
Note: This matrix is diagonal.
Y1 Y2
-------- --------
0.05 -0.05

THETA-EPS
Y11 Y12 Y13 Y14 Y15 Y21
-------- -------- -------- -------- -------- --------
0.31 0.36 0.47 0.28 0.38 0.26
THETA-EPS
Y22 Y23
-------- --------
0.29 0.23
THETA-DELTA
X11 X12 X13 X14 X15 X21
-------- -------- -------- -------- -------- --------
0.28 0.25 0.32 0.36 0.22 0.37

THETA-DELTA
X22 X23 X24 X25
-------- -------- -------- --------
0.22 0.17 0.32 0.23
Regression Matrix ETA on KSI (Standardized)
X1 X2
-------- --------
Y1 0.45 0.52
Y2 0.50 0.52
Total and Indirect Effects
Total Effects of KSI on ETA
X1 X2
-------- --------
Y1 0.45 0.52

(0.23) (0.23)
2.00 2.28
Y2 0.50 0.52
(0.17) (0.18)
2.85 2.95
Indirect Effects of KSI on ETA
X1 X2
-------- --------
Y1 - - - -
Y2 0.10 0.12
(0.10) (0.10)
1.04 1.12
Total Effects of ETA on ETA
Y1 Y2
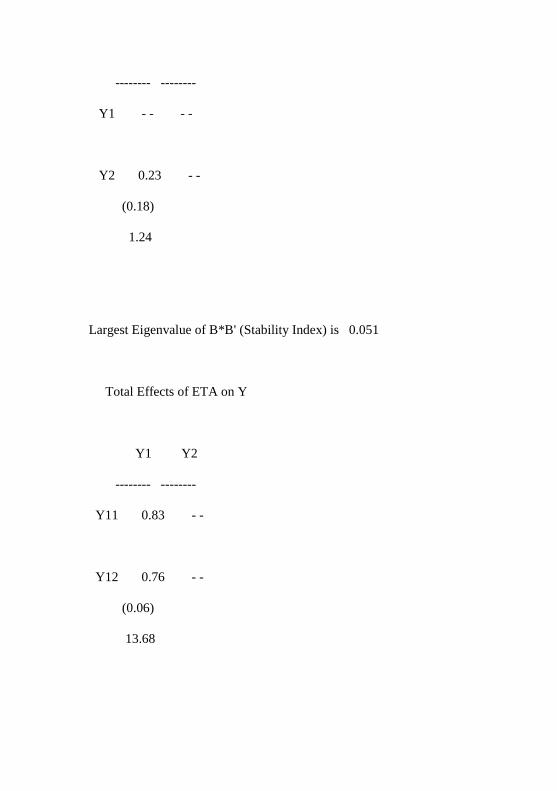
-------- --------
Y1 - - - -
Y2 0.23 - -
(0.18)
1.24
Largest Eigenvalue of B*B' (Stability Index) is 0.051
Total Effects of ETA on Y
Y1 Y2
-------- --------
Y11 0.83 - -
Y12 0.76 - -
(0.06)
13.68
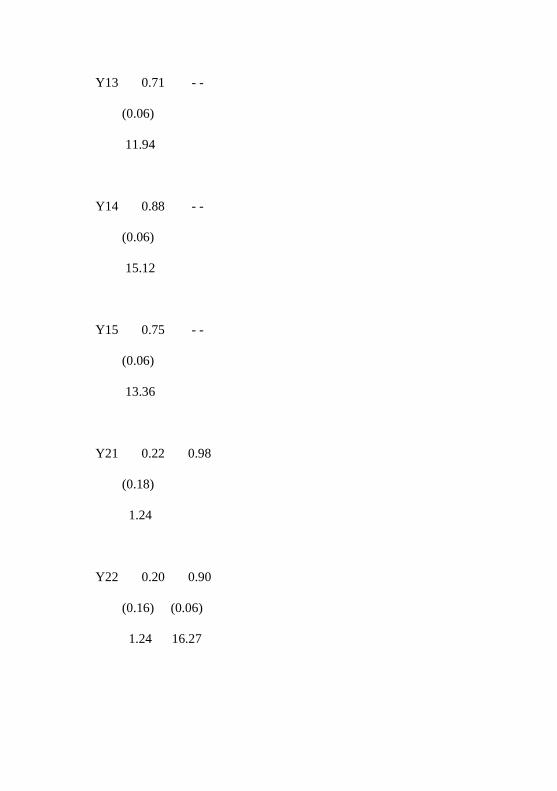
Y13 0.71 - -
(0.06)
11.94
Y14 0.88 - -
(0.06)
15.12
Y15 0.75 - -
(0.06)
13.36
Y21 0.22 0.98
(0.18)
1.24
Y22 0.20 0.90
(0.16) (0.06)
1.24 16.27
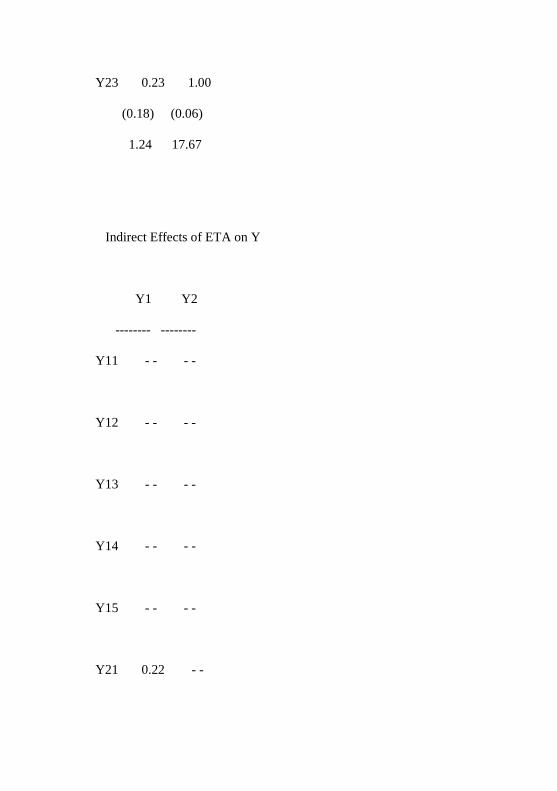
Y23 0.23 1.00
(0.18) (0.06)
1.24 17.67
Indirect Effects of ETA on Y
Y1 Y2
-------- --------
Y11 - - - -
Y12 - - - -
Y13 - - - -
Y14 - - - -
Y15 - - - -
Y21 0.22 - -

(0.18)
1.24
Y22 0.20 - -
(0.16)
1.24
Y23 0.23 - -
(0.18)
1.24
Total Effects of KSI on Y
X1 X2
-------- --------
Y11 0.37 0.43
(0.19) (0.19)
2.00 2.28

Y12 0.34 0.39
(0.17) (0.17)
2.00 2.27
Y13 0.32 0.37
(0.16) (0.16)
1.99 2.26
Y14 0.40 0.46
(0.20) (0.20)
2.00 2.28
Y15 0.34 0.39
(0.17) (0.17)
2.00 2.27
Y21 0.49 0.51
(0.17) (0.17)
2.85 2.95
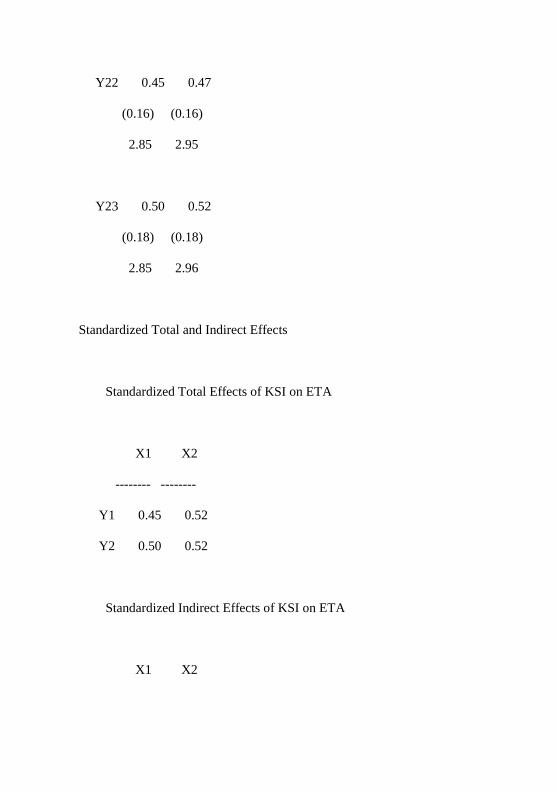
Y22 0.45 0.47
(0.16) (0.16)
2.85 2.95
Y23 0.50 0.52
(0.18) (0.18)
2.85 2.96
Standardized Total and Indirect Effects
Standardized Total Effects of KSI on ETA
X1 X2
-------- --------
Y1 0.45 0.52
Y2 0.50 0.52
Standardized Indirect Effects of KSI on ETA
X1 X2

-------- --------
Y1 - - - -
Y2 0.10 0.12
Standardized Total Effects of ETA on ETA
Y1 Y2
-------- --------
Y1 - - - -
Y2 0.23 - -
Standardized Total Effects of ETA on Y
Y1 Y2
-------- --------
Y11 0.83 - -
Y12 0.76 - -
Y13 0.71 - -
Y14 0.88 - -
Y15 0.75 - -

Y21 0.22 0.98
Y22 0.20 0.90
Y23 0.23 1.00
Completely Standardized Total Effects of ETA on Y
Y1 Y2
-------- --------
Y11 0.83 - -
Y12 0.80 - -
Y13 0.73 - -
Y14 0.85 - -
Y15 0.79 - -
Y21 0.19 0.86
Y22 0.19 0.84
Y23 0.20 0.88
Standardized Indirect Effects of ETA on Y
Y1 Y2

-------- --------
Y11 - - - -
Y12 - - - -
Y13 - - - -
Y14 - - - -
Y15 - - - -
Y21 0.22 - -
Y22 0.20 - -
Y23 0.23 - -
Completely Standardized Indirect Effects of ETA on Y
Y1 Y2
-------- --------
Y11 - - - -
Y12 - - - -
Y13 - - - -
Y14 - - - -
Y15 - - - -
Y21 0.19 - -

Y22 0.19 - -
Y23 0.20 - -
Standardized Total Effects of KSI on Y
X1 X2
-------- --------
Y11 0.37 0.43
Y12 0.34 0.39
Y13 0.32 0.37
Y14 0.40 0.46
Y15 0.34 0.39
Y21 0.49 0.51
Y22 0.45 0.47
Y23 0.50 0.52
Completely Standardized Total Effects of KSI on Y
X1 X2
-------- --------

Y11 0.38 0.43
Y12 0.36 0.41
Y13 0.33 0.38
Y14 0.38 0.44
Y15 0.36 0.41
Y21 0.43 0.44
Y22 0.42 0.44
Y23 0.44 0.46
Time used: 0.359 Seconds

LAMPIRAN 2
P R E L I S 2.70
BY
Karl G. Jöreskog & Dag Sörbom
This program is published exclusively by
Scientific Software International, Inc.
7383 N. Lincoln Avenue, Suite 100
Lincolnwood, IL 60712, U.S.A.
Phone: (800)247-6113, (847)675-0720, Fax: (847)675-2140
Copyright by Scientific Software International, Inc., 1981-2004
Use of this program is subject to the terms specified in the
Universal Copyright Convention.
Website: www.ssicentral.com
The following lines were read from file F:\skripsi david\rawdata.PR2:
!PRELIS SYNTAX: Can be edited
SY='F:\skripsi david\rawdata.PSF'
NS 1 2 3 4 5 6 7 8 9 10 11 12 13 14 15 16 17 18
OU MA=CM X

Total Sample Size = 200
Univariate Summary Statistics for Continuous Variables
Variable Mean St. Dev. T-Value Skewness Kurtosis Minimum Freq.
Maximum Freq.
-------- ---- -------- ------- -------- -------- ------- ----- ------- -----
X11 3.435 0.995 48.805 0.050 -0.896 1.982 42 5.045
32
X12 3.385 1.078 44.398 0.100 -1.121 1.971 54 5.035
38
X13 3.320 1.138 41.274 0.136 -1.278 1.931 63 4.978
44
X14 3.345 1.045 45.281 0.097 -1.037 1.926 50 4.973
36
X15 3.400 1.075 44.726 0.109 -1.098 2.001 55 5.081
36
X21 3.300 1.012 46.094 0.126 -0.956 1.926 50 4.962
31
X22 3.480 1.089 45.200 0.019 -1.148 1.970 48 5.034
45
X23 3.515 1.190 41.762 -0.027 -1.399 1.956 56 5.018
60

X24 3.350 0.981 48.295 0.103 -0.868 1.971 46 5.029
27
X25 3.340 1.132 41.737 0.166 -1.244 1.983 65 5.055
40
Y11 3.300 0.992 47.025 0.130 -0.905 1.942 49 4.982
28
Y12 3.365 0.952 49.988 0.072 -0.764 1.917 38 4.958
29
Y13 3.350 0.981 48.295 0.070 -0.828 1.883 40 4.926
33
Y14 3.405 1.037 46.415 0.045 -1.005 1.915 44 4.971
39
Y15 3.360 0.951 49.951 0.070 -0.747 1.896 37 4.937
30
Y21 3.355 1.147 41.367 0.126 -1.296 1.954 63 5.011
45
Y22 3.440 1.073 45.323 0.050 -1.109 1.967 49 5.031
41
Y23 3.445 1.142 42.673 0.048 -1.283 1.963 56 5.026
49
Test of Univariate Normality for Continuous Variables

Skewness Kurtosis Skewness and Kurtosis
Variable Z-Score P-Value Z-Score P-Value Chi-Square P-Value
X11 0.296 0.768 -4.687 0.000 22.057 0.000
X12 0.590 0.555 -7.830 0.000 61.663 0.000
X13 0.804 0.421 -12.124 0.000 147.633 0.000
X14 0.574 0.566 -6.412 0.000 41.440 0.000
X15 0.643 0.521 -7.397 0.000 55.124 0.000
X21 0.746 0.456 -5.346 0.000 29.137 0.000
X22 0.110 0.913 -8.383 0.000 70.290 0.000
X23 -0.161 0.872 -20.392 0.000 415.865 0.000
X24 0.607 0.544 -4.406 0.000 19.785 0.000
X25 0.979 0.328 -10.907 0.000 119.926 0.000
Y11 0.769 0.442 -4.787 0.000 23.508 0.000
Y12 0.426 0.670 -3.507 0.000 12.480 0.002
Y13 0.416 0.677 -4.043 0.000 16.519 0.000
Y14 0.267 0.789 -5.972 0.000 35.742 0.000
Y15 0.413 0.680 -3.371 0.001 11.537 0.003

Y21 0.745 0.456 -12.909 0.000 167.196 0.000
Y22 0.295 0.768 -7.592 0.000 57.727 0.000
Y23 0.285 0.776 -12.344 0.000 152.448 0.000
Relative Multivariate Kurtosis = 0.932
Test of Multivariate Normality for Continuous Variables
Skewness Kurtosis Skewness and Kurtosis
Value Z-Score P-Value Value Z-Score P-Value Chi-Square P-
Value
------ ------- ------- ------- ------- ------- ---------- -------
41.068 4.519 0.000 335.642 -7.394 0.000 75.096 0.000
Histograms for Continuous Variables
X11
Frequency Percentage Lower Class Limit
42 21.0 1.982
••••••••••••••••••••••••
0 0.0 2.289
0 0.0 2.595
61 30.5 2.901
•••••••••••••••••••••••••••••••••••

0 0.0 3.207
0 0.0 3.513
65 32.5 3.820
••••••••••••••••••••••••••••••••••••••
0 0.0 4.126
0 0.0 4.432
32 16.0 4.738 ••••••••••••••••••
X12
Frequency Percentage Lower Class Limit
54 27.0 1.971
•••••••••••••••••••••••••••••••••••••
0 0.0 2.277
0 0.0 2.583
53 26.5 2.890
••••••••••••••••••••••••••••••••••••
0 0.0 3.196
0 0.0 3.503
55 27.5 3.809
••••••••••••••••••••••••••••••••••••••

0 0.0 4.115
0 0.0 4.422
38 19.0 4.728
••••••••••••••••••••••••••
X13
Frequency Percentage Lower Class Limit
63 31.5 1.931
••••••••••••••••••••••••••••••••••••••
0 0.0 2.236
0 0.0 2.540
0 0.0 2.845
54 27.0 3.150
••••••••••••••••••••••••••••••••
0 0.0 3.454
39 19.5 3.759 •••••••••••••••••••••••
0 0.0 4.064
0 0.0 4.368
44 22.0 4.673
••••••••••••••••••••••••••
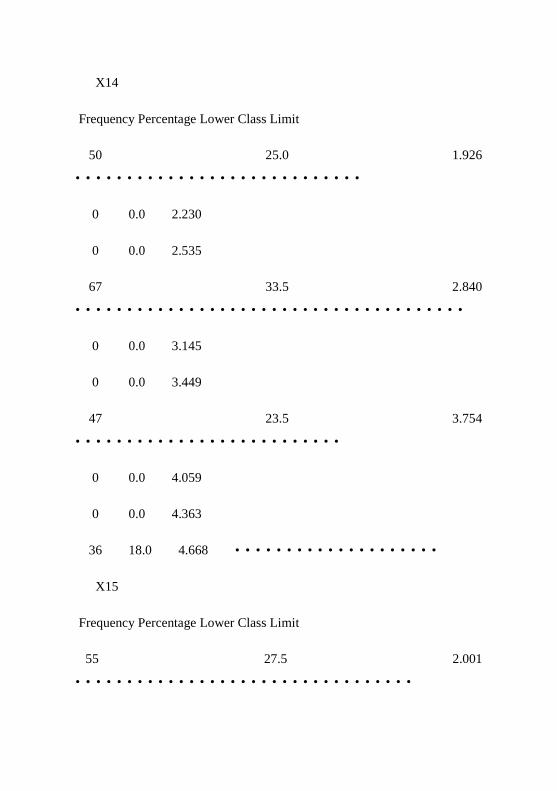
X14
Frequency Percentage Lower Class Limit
50 25.0 1.926
••••••••••••••••••••••••••••
0 0.0 2.230
0 0.0 2.535
67 33.5 2.840
••••••••••••••••••••••••••••••••••••••
0 0.0 3.145
0 0.0 3.449
47 23.5 3.754
••••••••••••••••••••••••••
0 0.0 4.059
0 0.0 4.363
36 18.0 4.668 ••••••••••••••••••••
X15
Frequency Percentage Lower Class Limit
55 27.5 2.001
•••••••••••••••••••••••••••••••••

0 0.0 2.309
0 0.0 2.617
46 23.0 2.925
•••••••••••••••••••••••••••
0 0.0 3.233
0 0.0 3.541
63 31.5 3.849
••••••••••••••••••••••••••••••••••••••
0 0.0 4.157
0 0.0 4.465
36 18.0 4.773 •••••••••••••••••••••
X21
Frequency Percentage Lower Class Limit
50 25.0 1.926
••••••••••••••••••••••••••
0 0.0 2.229
0 0.0 2.533
71 35.5 2.837
••••••••••••••••••••••••••••••••••••••
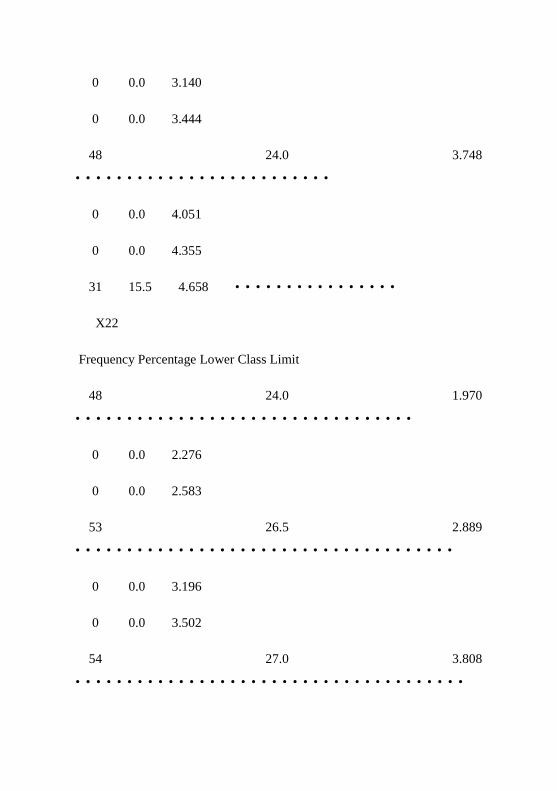
0 0.0 3.140
0 0.0 3.444
48 24.0 3.748
•••••••••••••••••••••••••
0 0.0 4.051
0 0.0 4.355
31 15.5 4.658 ••••••••••••••••
X22
Frequency Percentage Lower Class Limit
48 24.0 1.970
•••••••••••••••••••••••••••••••••
0 0.0 2.276
0 0.0 2.583
53 26.5 2.889
•••••••••••••••••••••••••••••••••••••
0 0.0 3.196
0 0.0 3.502
54 27.0 3.808
••••••••••••••••••••••••••••••••••••••

0 0.0 4.115
0 0.0 4.421
45 22.5 4.728
•••••••••••••••••••••••••••••••
X23
Frequency Percentage Lower Class Limit
56 28.0 1.956
•••••••••••••••••••••••••••••••••••
0 0.0 2.262
0 0.0 2.568
45 22.5 2.875
••••••••••••••••••••••••••••
0 0.0 3.181
0 0.0 3.487
39 19.5 3.793
••••••••••••••••••••••••
0 0.0 4.099
0 0.0 4.406

60 30.0 4.712
••••••••••••••••••••••••••••••••••••••
X24
Frequency Percentage Lower Class Limit
46 23.0 1.971
••••••••••••••••••••••••••
0 0.0 2.277
0 0.0 2.583
65 32.5 2.889
••••••••••••••••••••••••••••••••••••••
0 0.0 3.195
0 0.0 3.500
62 31.0 3.806
••••••••••••••••••••••••••••••••••••
0 0.0 4.112
0 0.0 4.418
27 13.5 4.724 •••••••••••••••
X25
Frequency Percentage Lower Class Limit
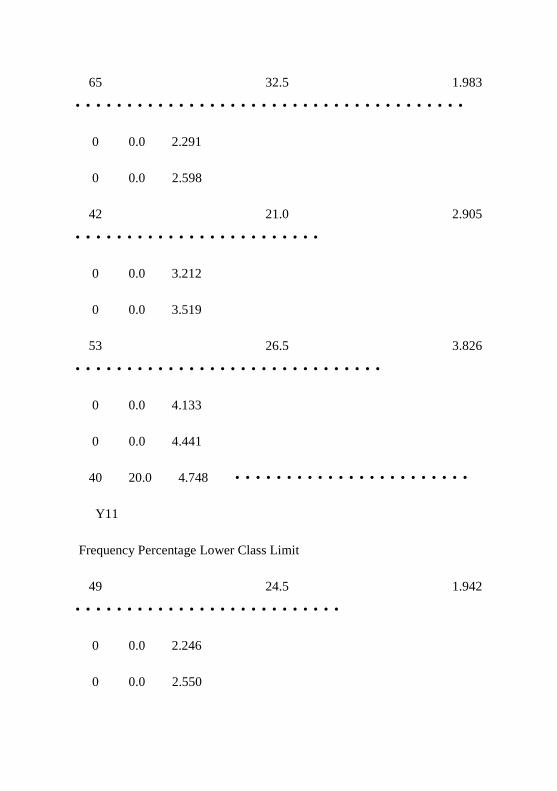
65 32.5 1.983
••••••••••••••••••••••••••••••••••••••
0 0.0 2.291
0 0.0 2.598
42 21.0 2.905
••••••••••••••••••••••••
0 0.0 3.212
0 0.0 3.519
53 26.5 3.826
••••••••••••••••••••••••••••••
0 0.0 4.133
0 0.0 4.441
40 20.0 4.748 •••••••••••••••••••••••
Y11
Frequency Percentage Lower Class Limit
49 24.5 1.942
••••••••••••••••••••••••••
0 0.0 2.246
0 0.0 2.550

70 35.0 2.854
••••••••••••••••••••••••••••••••••••••
0 0.0 3.158
0 0.0 3.462
53 26.5 3.766
••••••••••••••••••••••••••••
0 0.0 4.070
0 0.0 4.374
28 14.0 4.678 •••••••••••••••
Y12
Frequency Percentage Lower Class Limit
38 19.0 1.917 ••••••••••••••••••
0 0.0 2.222
0 0.0 2.526
80 40.0 2.830
••••••••••••••••••••••••••••••••••••••
0 0.0 3.134
0 0.0 3.438

53 26.5 3.742
•••••••••••••••••••••••••
0 0.0 4.046
0 0.0 4.350
29 14.5 4.654 •••••••••••••
Y13
Frequency Percentage Lower Class Limit
40 20.0 1.883 ••••••••••••••••••
0 0.0 2.188
0 0.0 2.492
83 41.5 2.796
••••••••••••••••••••••••••••••••••••••
0 0.0 3.101
0 0.0 3.405
44 22.0 3.709 ••••••••••••••••••••
0 0.0 4.013
0 0.0 4.318
33 16.5 4.622 •••••••••••••••

Y14
Frequency Percentage Lower Class Limit
44 22.0 1.915 •••••••••••••••••••••••
0 0.0 2.220
0 0.0 2.526
70 35.0 2.831
••••••••••••••••••••••••••••••••••••••
0 0.0 3.137
0 .0 3.443
47 23.5 3.748
•••••••••••••••••••••••••
0 0.0 4.054
0 0.0 4.359
39 19.5 4.665 •••••••••••••••••••••
Y15
Frequency Percentage Lower Class Limit
37 18.5 1.896 ••••••••••••••••
0 0.0 2.200

0 0.0 2.504
84 42.0 2.808
••••••••••••••••••••••••••••••••••••••
0 0.0 3.113
0 0.0 3.417
49 24.5 3.721 ••••••••••••••••••••••
0 0.0 4.025
0 0.0 4.329
30 15.0 4.633 •••••••••••••
Y21
Frequency Percentage Lower Class Limit
63 31.5 1.954
••••••••••••••••••••••••••••••••••••••
0 0.0 2.260
0 0.0 2.565
48 24.0 2.871
••••••••••••••••••••••••••••
0 0.0 3.177
0 0.0 3.482

44 22.0 3.788
••••••••••••••••••••••••••
0 0.0 4.094
0 0.0 4.399
45 22.5 4.705
•••••••••••••••••••••••••••
Y22
Frequency Percentage Lower Class Limit
49 24.5 1.967
•••••••••••••••••••••••••••••••••
0 0.0 2.274
0 0.0 2.580
55 27.5 2.886
••••••••••••••••••••••••••••••••••••••
0 0.0 3.193
0 0.0 3.499
55 27.5 3.805
••••••••••••••••••••••••••••••••••••••
0 0.0 4.112

0 0.0 4.418
41 20.5 4.724
••••••••••••••••••••••••••••
Y23
Frequency Percentage Lower Class Limit
56 28.0 1.963
••••••••••••••••••••••••••••••••••••••
0 0.0 2.270
0 0.0 2.576
48 24.0 2.882
••••••••••••••••••••••••••••••••
0 0.0 3.189
0 0.0 3.495
47 23.5 3.801
•••••••••••••••••••••••••••••••
0 0.0 4.107
0 0.0 4.414
49 24.5 4.720
•••••••••••••••••••••••••••••••••

Covariance Matrix
X11 X12 X13 X14 X15 X21
-------- -------- -------- -------- -------- --------
X11 0.991
X12 0.724 1.163
X13 0.812 0.798 1.294
X14 0.723 0.740 0.798 1.091
X15 0.767 0.767 0.803 0.734 1.156
X21 0.706 0.687 0.779 0.688 0.796 1.025
X22 0.771 0.874 0.859 0.768 0.905 0.767
X23 0.860 0.981 0.884 0.864 1.017 0.837
X24 0.654 0.713 0.791 0.693 0.712 0.620
X25 0.790 0.897 0.958 0.821 0.840 0.764
Y11 0.639 0.683 0.793 0.631 0.704 0.664
Y12 0.638 0.716 0.732 0.609 0.676 0.561
Y13 0.551 0.600 0.615 0.489 0.627 0.476
Y14 0.689 0.745 0.756 0.645 0.769 0.555
Y15 0.597 0.625 0.717 0.567 0.688 0.612

Y21 0.827 0.910 0.969 0.806 0.823 0.807
Y22 0.759 0.841 0.821 0.711 0.843 0.717
Y23 0.781 0.889 0.847 0.836 0.942 0.715
Covariance Matrix
X22 X23 X24 X25 Y11 Y12
-------- -------- -------- -------- -------- --------
X22 1.186
X23 1.053 1.417
X24 0.731 0.744 0.962
X25 0.850 0.938 0.803 1.281
Y11 0.666 0.755 0.662 0.823 0.985
Y12 0.711 0.761 0.545 0.772 0.642 0.906
Y13 0.629 0.771 0.618 0.592 0.476 0.474
Y14 0.764 0.858 0.713 0.797 0.700 0.625
Y15 0.663 0.732 0.634 0.712 0.612 0.473
Y21 0.848 0.936 0.784 1.052 0.851 0.752
Y22 0.833 0.975 0.692 0.828 0.708 0.674
Y23 0.974 1.128 0.769 0.906 0.788 0.701
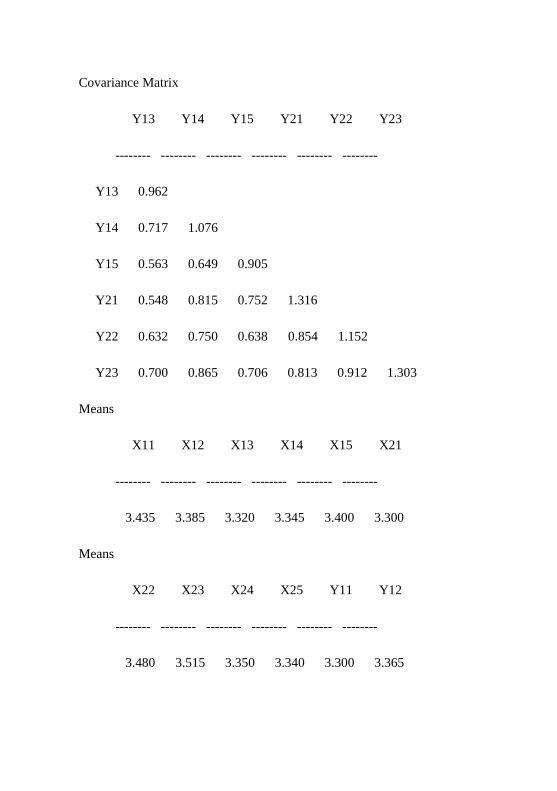
Covariance Matrix
Y13 Y14 Y15 Y21 Y22 Y23
-------- -------- -------- -------- -------- --------
Y13 0.962
Y14 0.717 1.076
Y15 0.563 0.649 0.905
Y21 0.548 0.815 0.752 1.316
Y22 0.632 0.750 0.638 0.854 1.152
Y23 0.700 0.865 0.706 0.813 0.912 1.303
Means
X11 X12 X13 X14 X15 X21
-------- -------- -------- -------- -------- --------
3.435 3.385 3.320 3.345 3.400 3.300
Means
X22 X23 X24 X25 Y11 Y12
-------- -------- -------- -------- -------- --------
3.480 3.515 3.350 3.340 3.300 3.365
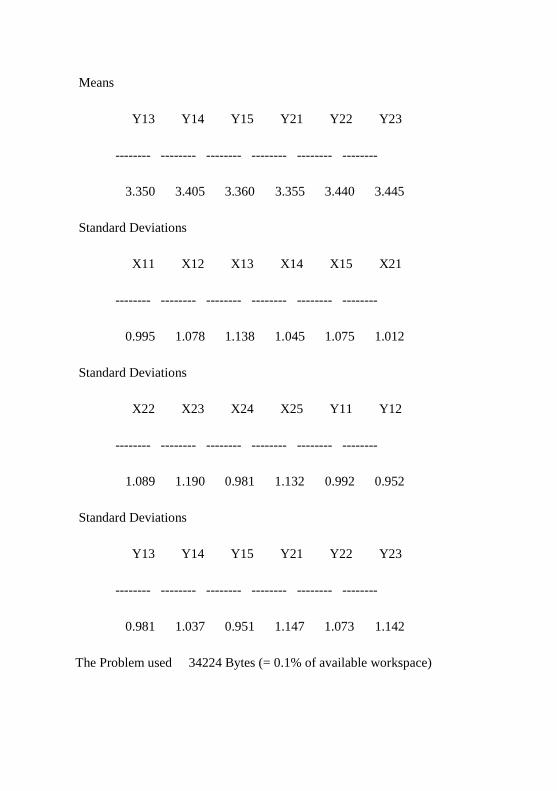
Means
Y13 Y14 Y15 Y21 Y22 Y23
-------- -------- -------- -------- -------- --------
3.350 3.405 3.360 3.355 3.440 3.445
Standard Deviations
X11 X12 X13 X14 X15 X21
-------- -------- -------- -------- -------- --------
0.995 1.078 1.138 1.045 1.075 1.012
Standard Deviations
X22 X23 X24 X25 Y11 Y12
-------- -------- -------- -------- -------- --------
1.089 1.190 0.981 1.132 0.992 0.952
Standard Deviations
Y13 Y14 Y15 Y21 Y22 Y23
-------- -------- -------- -------- -------- --------
0.981 1.037 0.951 1.147 1.073 1.142
The Problem used 34224 Bytes (= 0.1% of available workspace)