
Gamper econ adapt
15
BOOSTING RESILIENCE THROUGH INNOVATIVE RISK GOVERNANCE Catherine Gamper Public Governance and Territorial Development Directorate Storm Surge, Norfolk, United Kingdom, December 2013
-
Upload
oecd-environment -
Category
Environment
-
view
270 -
download
0
Transcript of Gamper econ adapt
BOOSTING RESILIENCE THROUGH
INNOVATIVE RISK GOVERNANCE
Catherine Gamper Public Governance and Territorial Development Directorate
Storm Surge, Norfolk, United Kingdom, December 2013
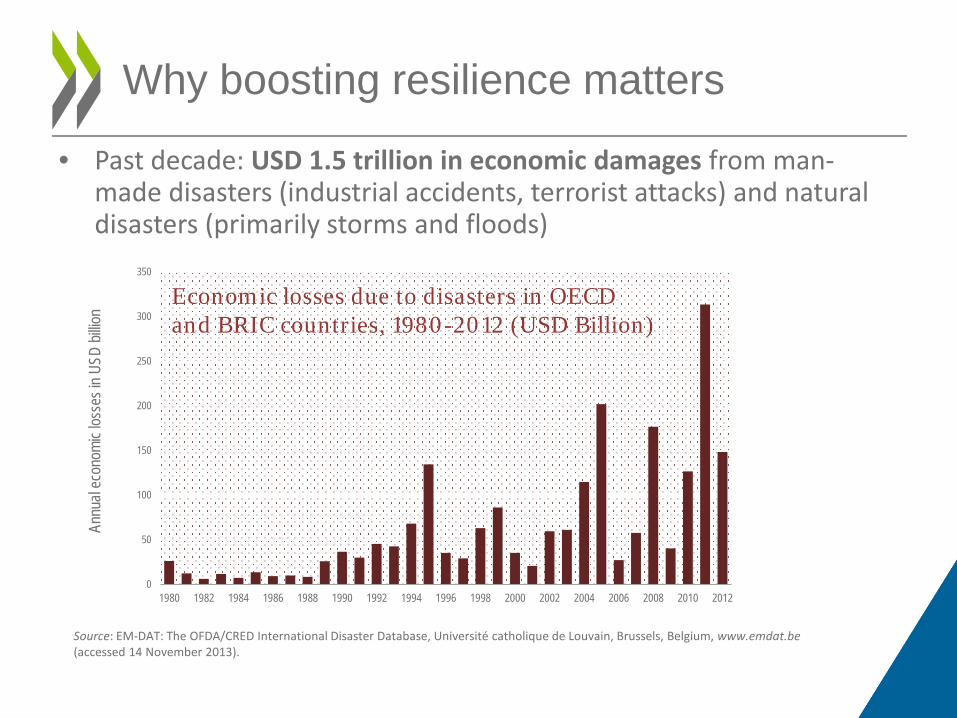
• Past decade: USD 1.5 trillion in economic damages from man-made disasters (industrial accidents, terrorist attacks) and natural disasters (primarily storms and floods)
Why boosting resilience matters
0
50
100
150
200
250
300
350
1980 1982 1984 1986 1988 1990 1992 1994 1996 1998 2000 2002 2004 2006 2008 2010 2012
Annu
al ec
onom
ic los
ses i
n USD
billio
n
Source: EM-DAT: The OFDA/CRED International Disaster Database, Université catholique de Louvain, Brussels, Belgium, www.emdat.be (accessed 14 November 2013).
Economic losses due to disasters in OECD and BRIC countries, 1980-2012 (USD Billion)
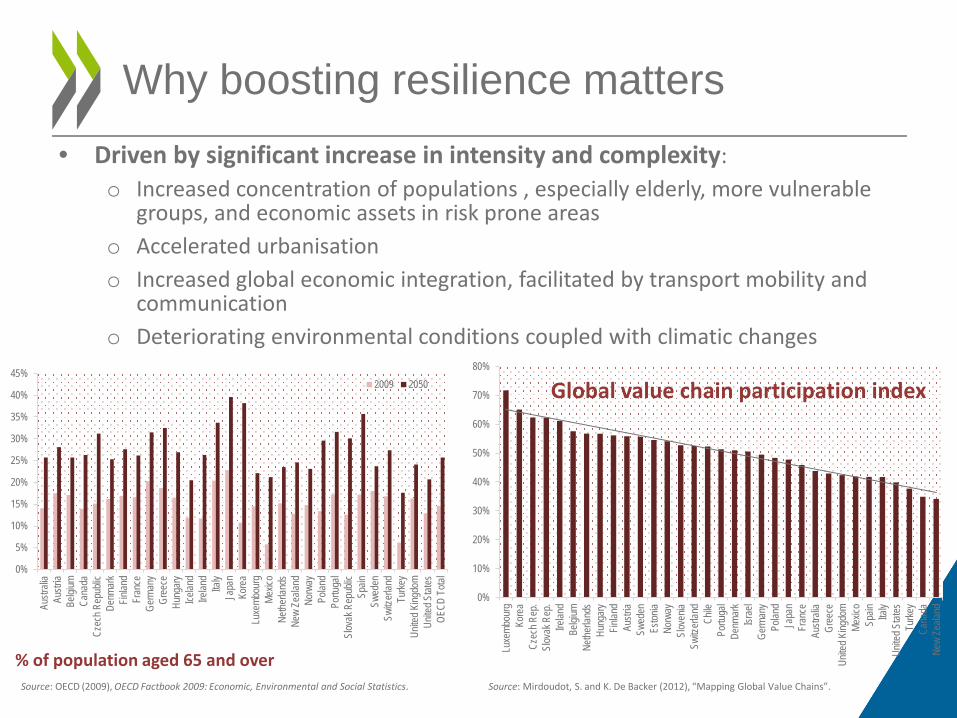
• Driven by significant increase in intensity and complexity: o Increased concentration of populations , especially elderly, more vulnerable
groups, and economic assets in risk prone areas o Accelerated urbanisation o Increased global economic integration, facilitated by transport mobility and
communication o Deteriorating environmental conditions coupled with climatic changes
Why boosting resilience matters
0%
5%
10%
15%
20%
25%
30%
35%
40%
45%
Austr
alia
Austr
iaBe
lgium
Cana
daCz
ech R
epub
licDe
nmar
kFin
land
Fran
ceGe
rman
yGr
eece
Hung
ary
Icelan
dIre
land
Italy
Japa
nKo
rea
Luxe
mbou
rgMe
xico
Nethe
rland
sNe
w Ze
aland
Norw
ayPo
land
Portu
gal
Slov
ak R
epub
licSp
ainSw
eden
Switz
erlan
dTu
rkey
Unite
d King
dom
Unite
d Stat
esOE
CD T
otal
% of population aged 65 and over
2009 2050
Source: OECD (2009), OECD Factbook 2009: Economic, Environmental and Social Statistics.
0%
10%
20%
30%
40%
50%
60%
70%
80%
Luxe
mbou
rgKo
rea
Czec
h Rep
.Sl
ovak
Rep
.Ire
land
Belgi
umNe
therla
nds
Hung
ary
Finlan
dAu
stria
Swed
enEs
tonia
Norw
aySl
oven
iaSw
itzer
land
Chile
Portu
gal
Denm
ark
Israe
lGe
rman
yPo
land
Japa
nFr
ance
Austr
alia
Gree
ceUn
ited K
ingdo
mMe
xico
Spain Ita
lyUn
ited S
tates
Turke
yCa
nada
New
Zeala
nd
Global value chain participation index
Source: Mirdoudot, S. and K. De Backer (2012), “Mapping Global Value Chains”.
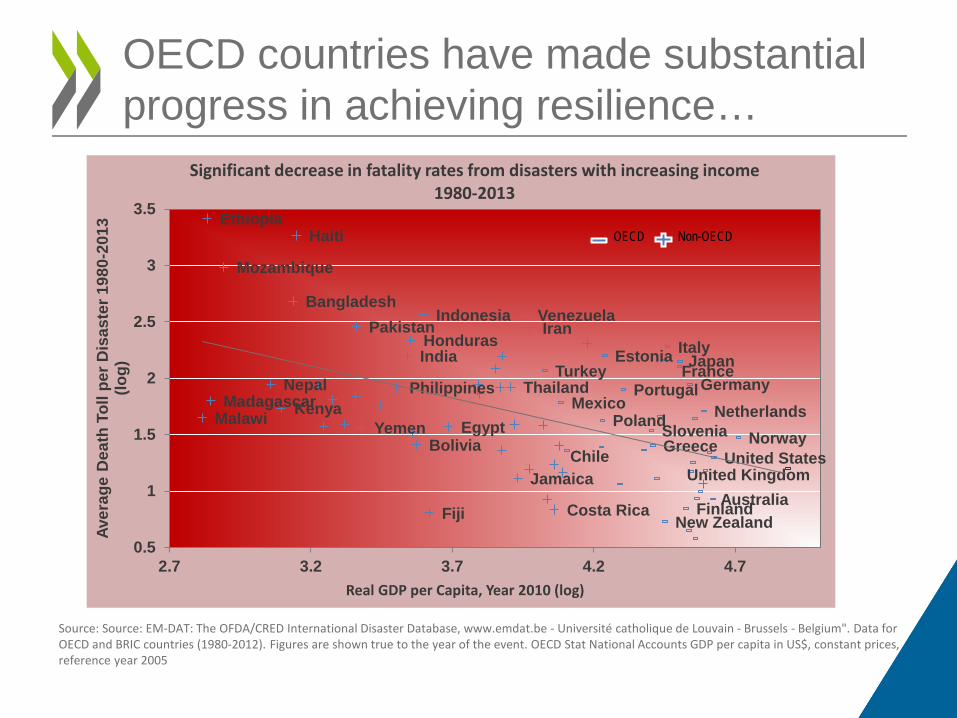
OECD countries have made substantial progress in achieving resilience…
Source: Source: EM-DAT: The OFDA/CRED International Disaster Database, www.emdat.be - Université catholique de Louvain - Brussels - Belgium". Data for OECD and BRIC countries (1980-2012). Figures are shown true to the year of the event. OECD Stat National Accounts GDP per capita in US$, constant prices, reference year 2005
Australia
Bangladesh
Bolivia Chile
Costa Rica
Egypt
Estonia
Ethiopia
Fiji Finland
France Germany
Greece
Haiti
Honduras India
Indonesia Iran
Italy
Jamaica
Japan
Kenya Madagascar Malawi
Mexico
Mozambique
Nepal Netherlands
New Zealand
Norway
Pakistan
Philippines
Poland
Portugal
Slovenia
Thailand Turkey
United Kingdom United States
Venezuela
Yemen
0.5
1
1.5
2
2.5
3
3.5
2.7 3.2 3.7 4.2 4.7
Aver
age
Dea
th T
oll p
er D
isas
ter 1
980-
2013
(lo
g)
Real GDP per Capita, Year 2010 (log)
Significant decrease in fatality rates from disasters with increasing income 1980-2013
OECD Non-OECD
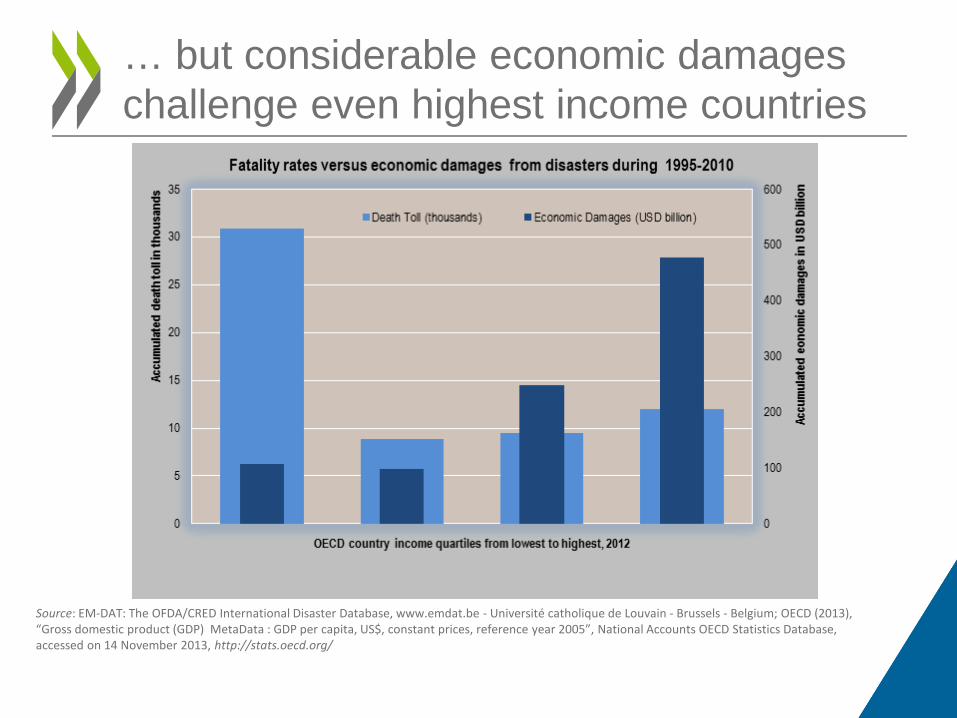
… but considerable economic damages challenge even highest income countries
Source: EM-DAT: The OFDA/CRED International Disaster Database, www.emdat.be - Université catholique de Louvain - Brussels - Belgium; OECD (2013), “Gross domestic product (GDP) MetaData : GDP per capita, US$, constant prices, reference year 2005”, National Accounts OECD Statistics Database, accessed on 14 November 2013, http://stats.oecd.org/
• Some disasters caused economic losses in excess of 20% of GDP (Chile, NZ), with local economies especially affected
• Shocks propagate across economic sectors and geographic boundaries through interconnected economies
• Considerable uncertainty challenges good policy making for resilience
Why boosting resilience matters
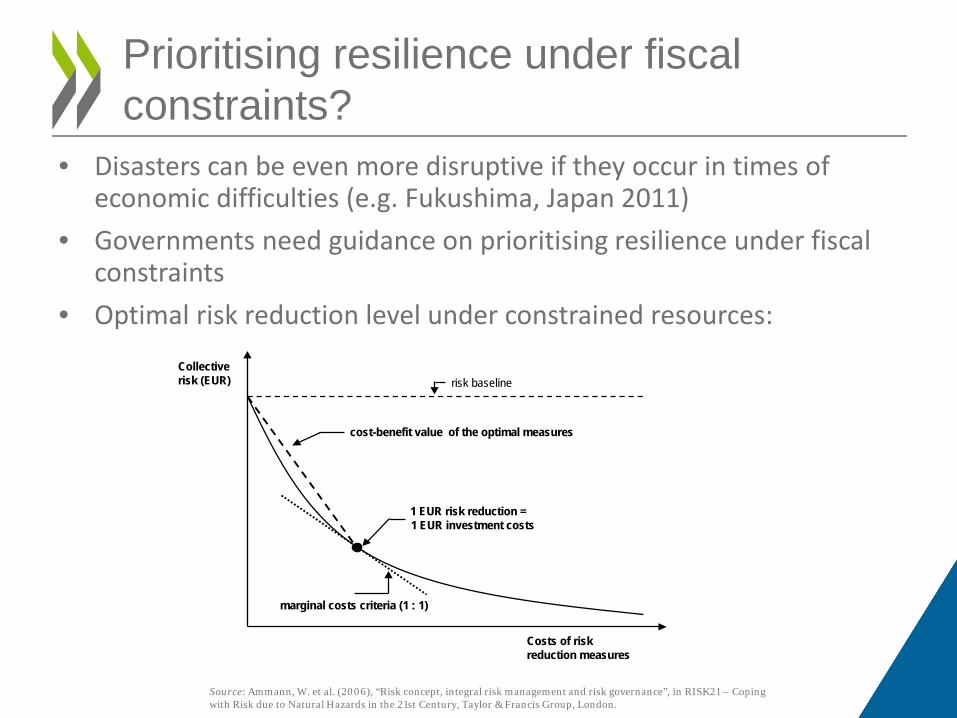
• Disasters can be even more disruptive if they occur in times of economic difficulties (e.g. Fukushima, Japan 2011)
• Governments need guidance on prioritising resilience under fiscal constraints
• Optimal risk reduction level under constrained resources:
Prioritising resilience under fiscal constraints?
Source: Ammann, W. et al. (2006), “Risk concept, integral risk management and risk governance”, in RISK21 – Coping with Risk due to Natural Hazards in the 21st Century, Taylor & Francis Group, London.
Collective risk (EUR) risk baseline
cost-benefit value of the optimal measures
marginal costs criteria (1 : 1)
Costs of risk reduction measures
1 EUR risk reduction = 1 EUR investment costs
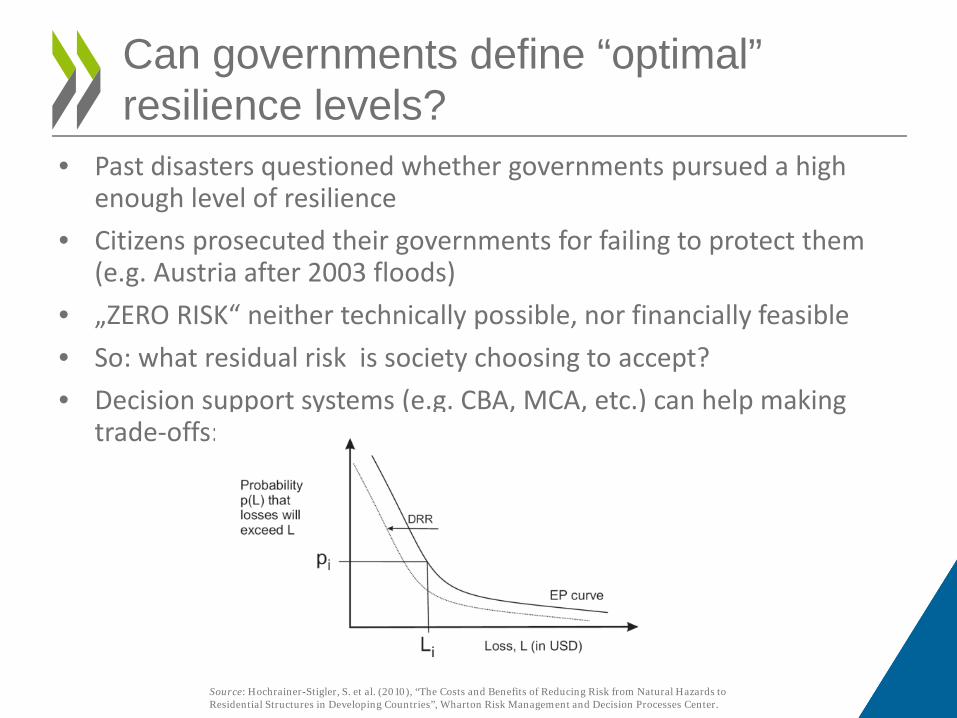
• Past disasters questioned whether governments pursued a high enough level of resilience
• Citizens prosecuted their governments for failing to protect them (e.g. Austria after 2003 floods)
• „ZERO RISK“ neither technically possible, nor financially feasible • So: what residual risk is society choosing to accept? • Decision support systems (e.g. CBA, MCA, etc.) can help making
trade-offs:
Can governments define “optimal” resilience levels?
Source: Hochrainer-Stigler, S. et al. (2010), “The Costs and Benefits of Reducing Risk from Natural Hazards to Residential Structures in Developing Countries”, Wharton Risk Management and Decision Processes Center.
• The UK Health and Safety Executive (HSE) determines acceptable levels of risk with regard to work related hazards based on the criteria elaborated by the HSE
• Iceland includes definitions of acceptable risk levels for snow avalanches and landslides in national law (The Ministry of the Environment, 2000)
• Liu and Xie (2008) propose different acceptable earthquake risk levels in China based on city size and probable earthquake intensity
How have countries used concepts of acceptable risk levels?
• Improved disaster risk management framework conditions: o General level of social and economic welfare o Facilitating institutional environment
• Concrete and successful disaster risk management measures: o Increased understanding of risks o Central government leadership o Mainstreaming of disaster risk management across public
policy areas o High level of risk awareness and information sharing
OECD countries have made substantial progress in achieving resilience…
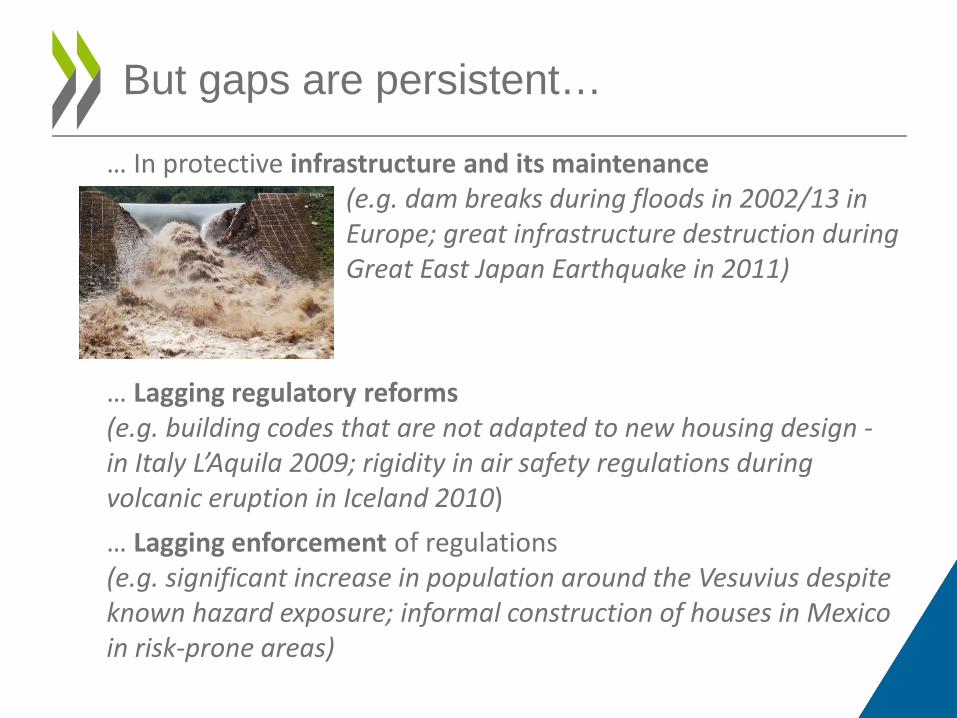
… In protective infrastructure and its maintenance (e.g. dam breaks during floods in 2002/13 in Europe; great infrastructure destruction during Great East Japan Earthquake in 2011) … Lagging regulatory reforms (e.g. building codes that are not adapted to new housing design - in Italy L’Aquila 2009; rigidity in air safety regulations during volcanic eruption in Iceland 2010) … Lagging enforcement of regulations (e.g. significant increase in population around the Vesuvius despite known hazard exposure; informal construction of houses in Mexico in risk-prone areas)
But gaps are persistent…
… Private sector–gaps in business continuity planning (e.g. large bankruptcy rate during Great East Japan Earthquake 2011; UK floods 2007 – average of 9 days of interruption); … Individual households do not invest in self-protection (e.g. 84% of population affected by UK floods 2007 believe nothing they can do to protect better; only a fifth of population of Istanbul took protective action after the Marmara EQ in 1999; in Germany only 25% of HH insured against flood risk) … Low levels of international collaboration (e.g. lack of incentives to share information; lack of appreciation of benefits of joint investments; diverging capacity levels across borders)
… but also among non-governmental stakeholders
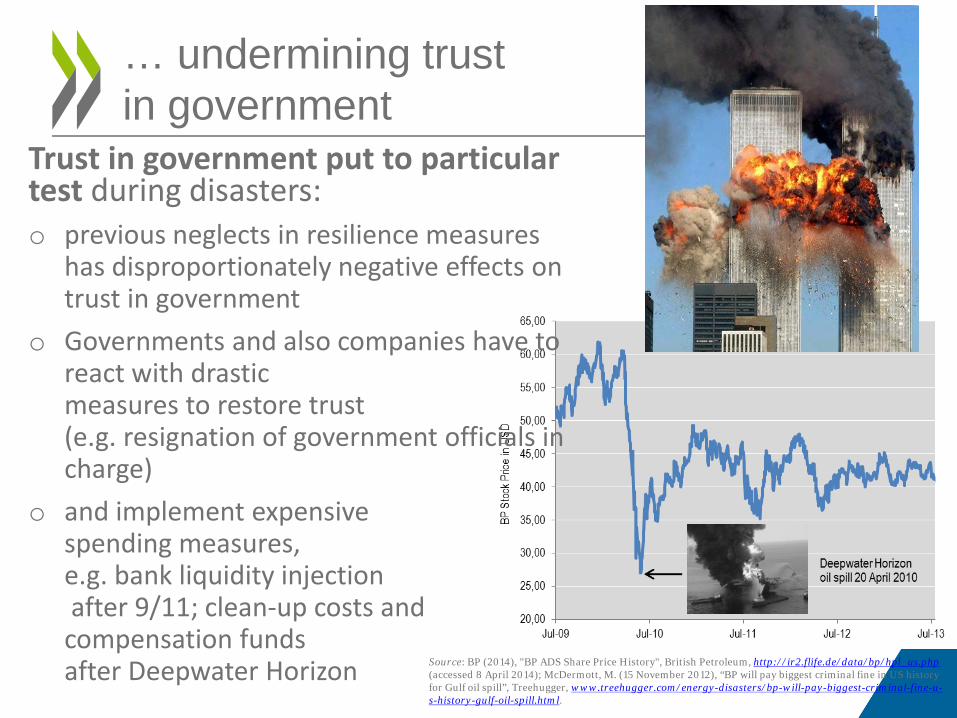
… undermining trust in government
Source: BP (2014), "BP ADS Share Price History", British Petroleum, http://ir2.flife.de/data/bp/hpl_us.php (accessed 8 April 2014); McDermott, M. (15 November 2012), “BP will pay biggest criminal fine in US history for Gulf oil spill”, Treehugger, www.treehugger.com/energy-disasters/bp-will-pay-biggest-criminal-fine-u-s-history-gulf-oil-spill.html.
Trust in government put to particular test during disasters: o previous neglects in resilience measures
has disproportionately negative effects on trust in government
o Governments and also companies have to react with drastic measures to restore trust (e.g. resignation of government officials in charge)
o and implement expensive spending measures, e.g. bank liquidity injection after 9/11; clean-up costs and compensation funds after Deepwater Horizon
• Shortcomings in risk governance may be an important and often overlooked cause
→ Risk governance mechanisms determine whether an actor participates in putting resilience measures in place; for example:
o Households may decide not to self-protect in expectation of governments doing so for them
o Local governments may not build protective measures as result of other jurisdictions benefiting but not contributing to the costs
o Central government actors reluctant to invest in resilience – ex-ante investments not visible and levels of rewards low
o Countries may not collaborate because of disincentives for data-sharing
Why do resilience gaps persist?
For further information please contact: [email protected] Or consult: http://www.oecd.org/gov/risk/boosting-resilience-through-innovative-risk-management.htm