DAFTAR PUSTAKA - Diponegoro University | Institutional...
31
DAFTAR PUSTAKA 1. Murray, Robert K. Daryl K. Granner; Victor W. Rodwell. Biokimia Harper Ed.27. Jakarta.EGC;2009 : 152-94 2. Katzung BG. Agents Used in Hyperlipidemia. In Basic and Clinical Pharmacology 10 th Ed. Mc Graw-Hill. New York.2007 : 479-89 3. Crowin EJ, Schmitz G, Hans L. Buku Saku Patofisiologi. Jakarta.EGC;2010 : 562-63 4. Michael H. Farmakologi dan Toksikologi. Jakarta.EGC;2009 : 163-65 5. Hopler JD, April HV. Pedoman Obat Untuk Perawat. Jakarta.EGC;2005 : 603-5 6. James Joyce, Baker CSH. Prinsip-Prinsip Sains Untuk Keperawatan. Jakarta.Erlangga;2008 : 170-71 7. Morgan GE, Mikhail MS, Murray MJ, Larson CP. Nonvolatile anaesthesic agents. In : Morgan GE, Mikhail MS, Murray MJ, Larson CP. Clinical Anesthesiologi 4 th ed. New York;Lange Medical Books/McGraw-Hill Medical Publishing Edition, 2006 : 164 8. Stoelting, Hiller. Pharmacology and Physiology in Anesthesic Practice. 4 th Ed. Philadelpia : Williams and Wilkins; 2006 : 514-54 9. Reves GJ, Glass ASP, Lubarsky AD . Nonbarbiturate Intravenous Anesthesic. In: Miller DR . Anesthesia. 5 th Ed. Philadelpia : Churchill Livingstone; 2000: 229-27
Transcript of DAFTAR PUSTAKA - Diponegoro University | Institutional...

DAFTAR PUSTAKA
1. Murray, Robert K. Daryl K. Granner; Victor W. Rodwell. Biokimia
Harper Ed.27. Jakarta.EGC;2009 : 152-94
2. Katzung BG. Agents Used in Hyperlipidemia. In Basic and Clinical
Pharmacology 10th
Ed. Mc Graw-Hill. New York.2007 : 479-89
3. Crowin EJ, Schmitz G, Hans L. Buku Saku Patofisiologi.
Jakarta.EGC;2010 : 562-63
4. Michael H. Farmakologi dan Toksikologi. Jakarta.EGC;2009 : 163-65
5. Hopler JD, April HV. Pedoman Obat Untuk Perawat. Jakarta.EGC;2005 :
603-5
6. James Joyce, Baker CSH. Prinsip-Prinsip Sains Untuk Keperawatan.
Jakarta.Erlangga;2008 : 170-71
7. Morgan GE, Mikhail MS, Murray MJ, Larson CP. Nonvolatile anaesthesic
agents. In : Morgan GE, Mikhail MS, Murray MJ, Larson CP. Clinical
Anesthesiologi 4th
ed. New York;Lange Medical Books/McGraw-Hill
Medical Publishing Edition, 2006 : 164
8. Stoelting, Hiller. Pharmacology and Physiology in Anesthesic Practice. 4th
Ed. Philadelpia : Williams and Wilkins; 2006 : 514-54
9. Reves GJ, Glass ASP, Lubarsky AD . Nonbarbiturate Intravenous
Anesthesic. In: Miller DR . Anesthesia. 5th
Ed. Philadelpia : Churchill
Livingstone; 2000: 229-27
10. Munir A. Karya Akhir: Kadar gula darah penderita diabetes melitus
dengan anestesi ketamin (penelitian pendahuluan). Semarang: Fakultas
Kedokteran Universitas Diponegoro.2005
11. Otoide VO, Omuemu C, Ojobo S. Elevated serum glucose levels
following ketamine intravenous anaesthesia : a report of 2 cases.
International Journal of Obstetric Anaesthesia ( serial on line ) 2001 Jul
(cited 2002 Mar 1); 10 (3) (3 screen). Available from URL : http : //
www.sciencedirect.com.
12. Barash P. Clinical Anesthesia. 4th
Ed, Philadelpia : lipincott
Company;2001: 1201 – 2.
13. Leksana. Cairan Tubuh. Terapi Cairan dan Elektrolit, Semarang; 2004 : 1-
14
14. Pradian E. The Effect of Dextrose to Blood of Glucose and Ketone Bodies
Level in Pediatric Patient Underwent Labioplasty. The Indonesian Jurnal
of Anesthesiology and critical Care, Bandung;2004 : 109-117
15. Robert K. Fluid and Electrolytes : Parenteral fluid therapy. Pediatric in
Review; 2001 :22 (11).
16. Pediatric Surgery Chapter 15. (2005, Oktober 17). Primary Surgery
Volume one: non trauma. http:/www.meb.uni-
bonn.de/dtc/primsurg/index.html.
17. Berry FA. Hypoglycemia and Hypergycemia: is there a problem? Eg J
Anesth 2001;18: 157-62 Stoelting RK. Pharmacology and Physiology in

Anerstetic practice. 3rd
ed, Lippincot-Raven, Philadelpia, New York, 1999:
302-11
18. Waxman K Physiologic respone to injury. In : Shoemarker WC, Holbrook
PR, Ayres SM, Grenvik A. Critical Care. W.B.Saunders company,
Philadelpia, London, Toronto,2000 : 277-82
19. Stoelting RK. Pharmacology and Physiology in anesthetic practice. 3rd
Ed,
Lippincot-Raven, Philadelphia, New York, 1999 : 302-11
20. Lunn JN, Chandrata L, Suyono J. Catatan Kuliah Anestesi. Jakarta.
EGC;2004 : 56-57
21. Hirota K, Lambert DG. Ketamine : It’s Mechanism of Action and Unusual
Clinical Uses. British Journal of Anesthesia; 1996 : 441-4.
22. WHO. Research uidline for evaluating the safety and efficacy of herbal
medicine. Manila : WHO Regional Office for The Western Pacific ;
1993.3.
23. Pratamaningtias E. Pengaruh Ketamin Dosis 1mg/kgBB terhadap Kadar
Glukosa Darah (Thesis).Semarang. Universitas diponegoro;2005.
24. Iswantoro OA. Perubahan Kadar Gula Darah pada Pasien Pediatric yang
Diinduksi Anastesi Umum (Thesis).Semarang. Universitas
Diponegoro;2009.
25. Surjandhari WJ. Perbandingan Dosis Induksi Ketamin 1mg/kgBB dan
2mg/kgbb Terhadap Kadar Glukosa Darah (Thesis).Semarang. Universitas
Diponegoro;2005.

26. Meutia YB. Perbandingan Dosis Induksi Ketamin 1mg/kgBB dan 2
mg/kgBB terhadap Tekanan Darah dan Frekuensi Denyut Jantung
(Thesis).Semarang. Universitas Diponegoro; 2007.
27. Khoroni MA. Pengaruh Ketamin Sebagai Anestikum terhadap Kadar Gula
Darah pada Pennderita Diabetes Melitus (Thesis).Semarang. Universitas
Diponegoro; 2005.
28. Schteingrat DE. Konsep Klinis Proses-Proses Penyakit Ed.4.
Jakarta.EGC:1995 : 1109-22
29. Guyton AC, Hall JE. Buku Ajar Fisiologi Kedokteran Ed.9.
Jakarta.EGC;1995 : 957-73, 1063-76, 1023-37
30. Vander A, Sherman J, Luciano D. Human Phisiology : the mechanism of
body function. New York: McGraw-Hill Companies Inc, 2001 : 594-607
31. Marieb EN. Human anatomy and physiology 5th
. San Fransisco :
Benjamin Cummings 2001 : 636-7
32. Sharma I, Sharma vp, Kaul HL. Effect of ketamine on blood sugar and
liver function indian journal of anesthesia. URL.
http://medind.nic.in/imvw23115.html.1985.
33. Oberoi Gs, Saxena N, Kaul HL. Effect of ketamine infusion on metabolic
profile jurnal of anesthesiology clinical pharmacology.
URL.http//medind.nic.in/imvw22673.html.1986
34. Reyes Toso CF, Lineares FM, Rodriguez RR. Blood sugar concentration
during ketamine or penthobarbitone anesthesia in rats with or without
alpha and betha adregenic blockade medicine.
URL.hhtp//www.nobi…/quenry.fogi/cmd=retrieve&db=pubmed&list_uids
=8728870&dopt=abstract. 1995.
35. Guyton AC, Hall JE. Buku ajar fisiologi kedokteran . Edisi:9.
Jakarta.EGC, 1996. 1063-76, 1203-37.
36. Huang MT, Lee CF, Dobson GP. Ephinefrin enhaces glycogen turnover
and depress glucose uptake in vivo in rats heart.
URL.http//www.nobi…/query.fogi?cmd=retrivive&db=pubmed&dopt=abs
track&list_uids=933715.1997.
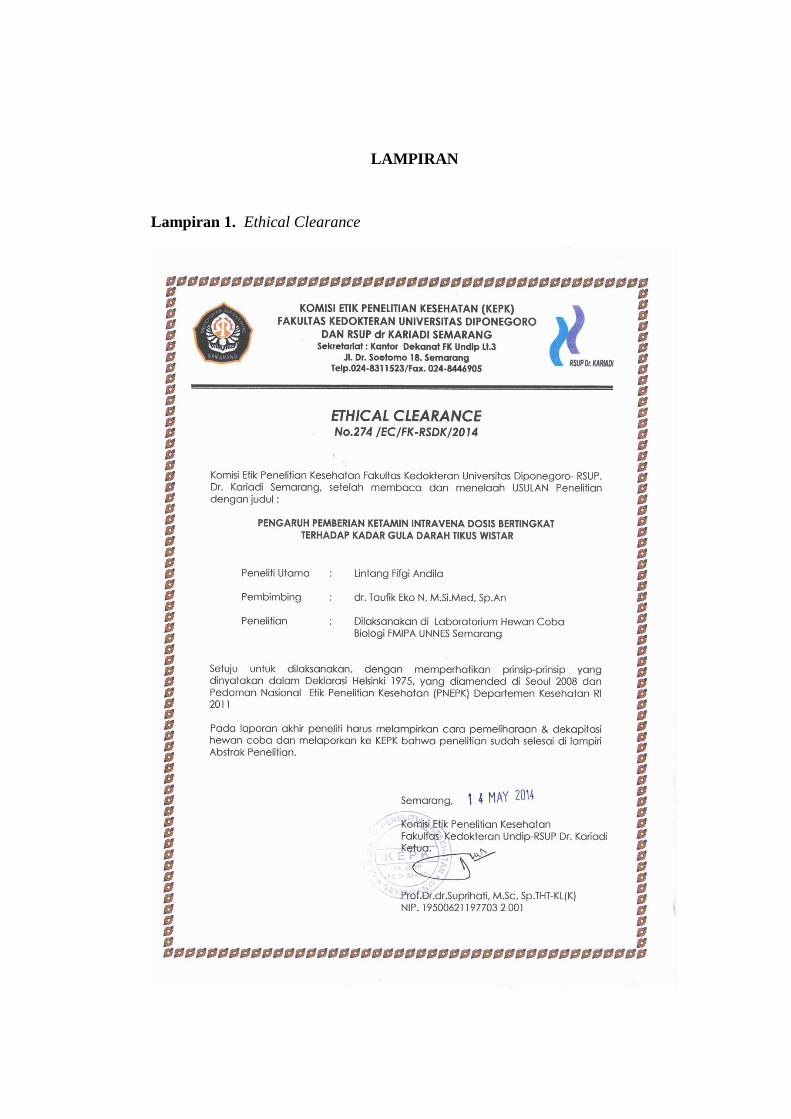
LAMPIRAN
Lampiran 1. Ethical Clearance
Lampiran 2. Surat ijin melakukan penelitian di Laboratorium Jurusan Biologi
FMPA Universitas Negeri Semarang

Lampiran 3 . Data SPSS
Explore
Case Summaries
5 5 5 5
108.20 108.80 110.40 121.60
16.346 8.106 35.090 13.259
111.00 105.00 112.00 131.00
85 104 62 103
123 123 146 131
5 5 5 5
110.40 128.60 135.80 134.20
20.936 2.881 7.050 6.535
120.00 128.00 138.00 137.00
80 125 125 125
131 133 143 141
5 5 5 5
120.80 137.20 138.40 137.40
14.360 8.349 4.980 5.079
121.00 135.00 140.00 138.00
104 129 130 130
135 146 142 144
5 5 5 5
135.40 140.40 141.80 144.20
26.857 12.033 7.855 5.215
136.00 137.00 143.00 146.00
98 127 131 138
173 153 150 151
20 20 20 20
118.70 128.75 131.60 134.35
21.575 14.832 21.222 11.310
122.00 129.00 139.00 137.50
80 104 62 103
173 153 150 151
N
Mean
Std. Deviation
Median
Minimum
Maximum
N
Mean
Std. Deviation
Median
Minimum
Maximum
N
Mean
Std. Deviation
Median
Minimum
Maximum
N
Mean
Std. Deviation
Median
Minimum
Maximum
N
Mean
Std. Deviation
Median
Minimum
Maximum
Kelompok
Kontrol
Ketamin 1
Ketamin 2
Ketamin 3
Total
5 menit ke-1 5 menit ke-2 5 menit ke-3 5 menit ke-4

Tests of Normality
.217 5 .200* .902 5 .421
.277 5 .200* .909 5 .464
.239 5 .200* .876 5 .291
.217 5 .200* .964 5 .837
.339 5 .061 .703 5 .010
.245 5 .200* .931 5 .601
.254 5 .200* .824 5 .126
.252 5 .200* .862 5 .237
.208 5 .200* .936 5 .638
.223 5 .200* .938 5 .649
.268 5 .200* .806 5 .090
.185 5 .200* .946 5 .712
.361 5 .032 .765 5 .041
.266 5 .200* .924 5 .558
.191 5 .200* .975 5 .904
.235 5 .200* .935 5 .634
Kelompok
Kontrol
Ketamin 1
Ketamin 2
Ketamin 3
Kontrol
Ketamin 1
Ketamin 2
Ketamin 3
Kontrol
Ketamin 1
Ketamin 2
Ketamin 3
Kontrol
Ketamin 1
Ketamin 2
Ketamin 3
5 menit ke-1
5 menit ke-2
5 menit ke-3
5 menit ke-4
Statist ic df Sig. Statist ic df Sig.
Kolmogorov-Smirnova
Shapiro-Wilk
This is a lower bound of the true significance.*.
Lilliefors Significance Correctiona.
Test of Homogeneity of Variance
.359 3 16 .783
.202 3 16 .894
.202 3 11.015 .893
.353 3 16 .787
4.193 3 16 .023
1.558 3 16 .238
1.558 3 11.367 .253
3.926 3 16 .028
7.083 3 16 .003
6.233 3 16 .005
6.233 3 5.446 .033
6.788 3 16 .004
6.392 3 16 .005
.680 3 16 .577
.680 3 6.343 .594
5.705 3 16 .007
Based on Mean
Based on Median
Based on Median and
with adjusted df
Based on trimmed mean
Based on Mean
Based on Median
Based on Median and
with adjusted df
Based on trimmed mean
Based on Mean
Based on Median
Based on Median and
with adjusted df
Based on trimmed mean
Based on Mean
Based on Median
Based on Median and
with adjusted df
Based on trimmed mean
5 menit ke-1
5 menit ke-2
5 menit ke-3
5 menit ke-4
Levene
Statist ic df1 df2 Sig.
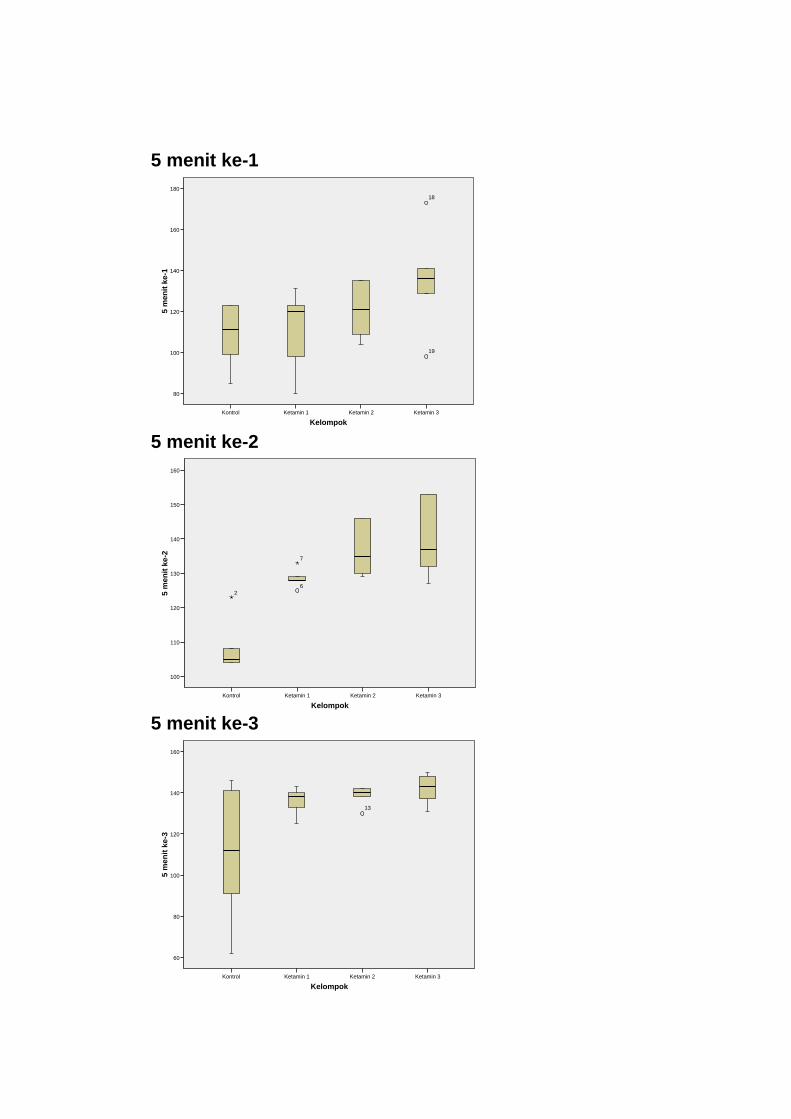
5 menit ke-1
5 menit ke-2
5 menit ke-3
Kelompok
Ketamin 3Ketamin 2Ketamin 1Kontrol
5 m
en
it k
e-1
180
160
140
120
100
80
18
19
Kelompok
Ketamin 3Ketamin 2Ketamin 1Kontrol
5 m
en
it k
e-2
160
150
140
130
120
110
100
7
2
6
Kelompok
Ketamin 3Ketamin 2Ketamin 1Kontrol
5 m
en
it k
e-3
160
140
120
100
80
60
13

5 menit ke-4
Kontrol NPar Tests
Friedman Test
Kelompok
Ketamin 3Ketamin 2Ketamin 1Kontrol
5 m
en
it k
e-4
160
150
140
130
120
110
100
12
11
Ranks
1.90
2.10
2.60
3.40
5 menit ke-1
5 menit ke-2
5 menit ke-3
5 menit ke-4
Mean Rank
Test Sta tisticsa
5
4.102
3
.251
N
Chi-Square
df
Asymp. Sig.
Friedman Testa.
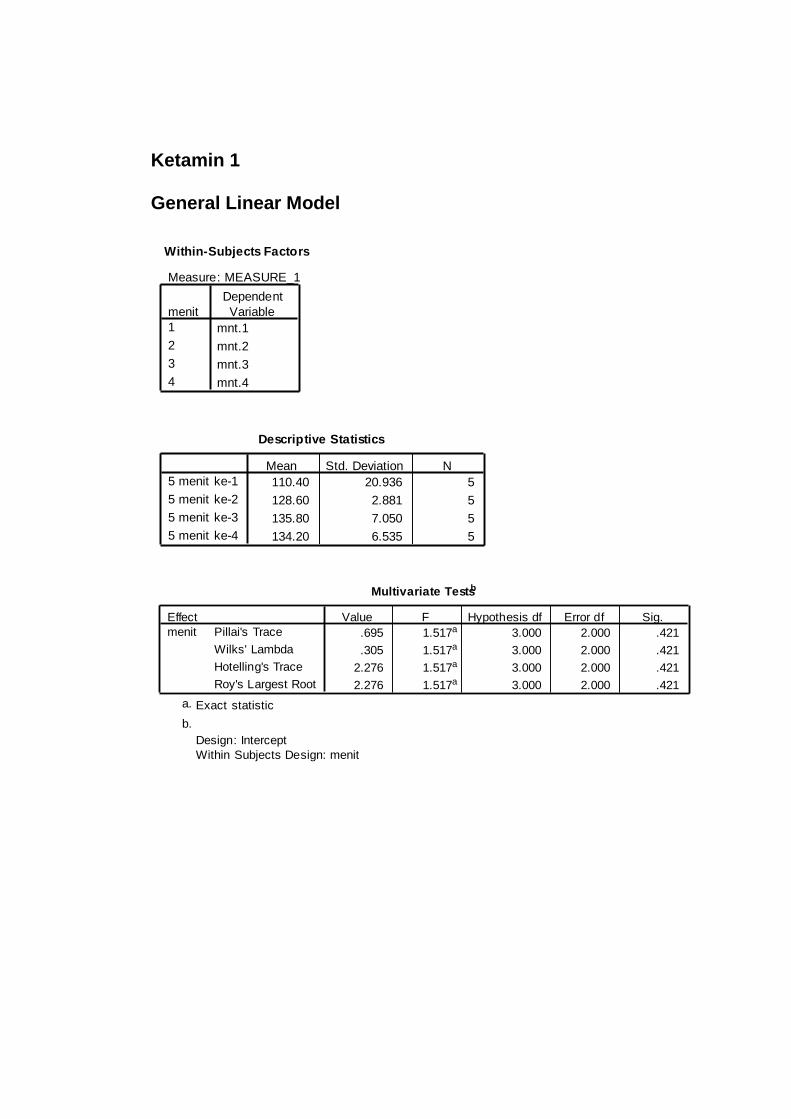
Ketamin 1 General Linear Model
Within-Subjects Factors
Measure: MEASURE_1
mnt.1
mnt.2
mnt.3
mnt.4
menit
1
2
3
4
Dependent
Variable
Descriptive Statistics
110.40 20.936 5
128.60 2.881 5
135.80 7.050 5
134.20 6.535 5
5 menit ke-1
5 menit ke-2
5 menit ke-3
5 menit ke-4
Mean Std. Deviation N
Multivariate Testsb
.695 1.517a 3.000 2.000 .421
.305 1.517a 3.000 2.000 .421
2.276 1.517a 3.000 2.000 .421
2.276 1.517a 3.000 2.000 .421
Pillai's Trace
Wilks' Lambda
Hotelling's Trace
Roy's Largest Root
Effect
menit
Value F Hypothesis df Error df Sig.
Exact statistica.
Design: Intercept
Within Subjects Design: menit
b.
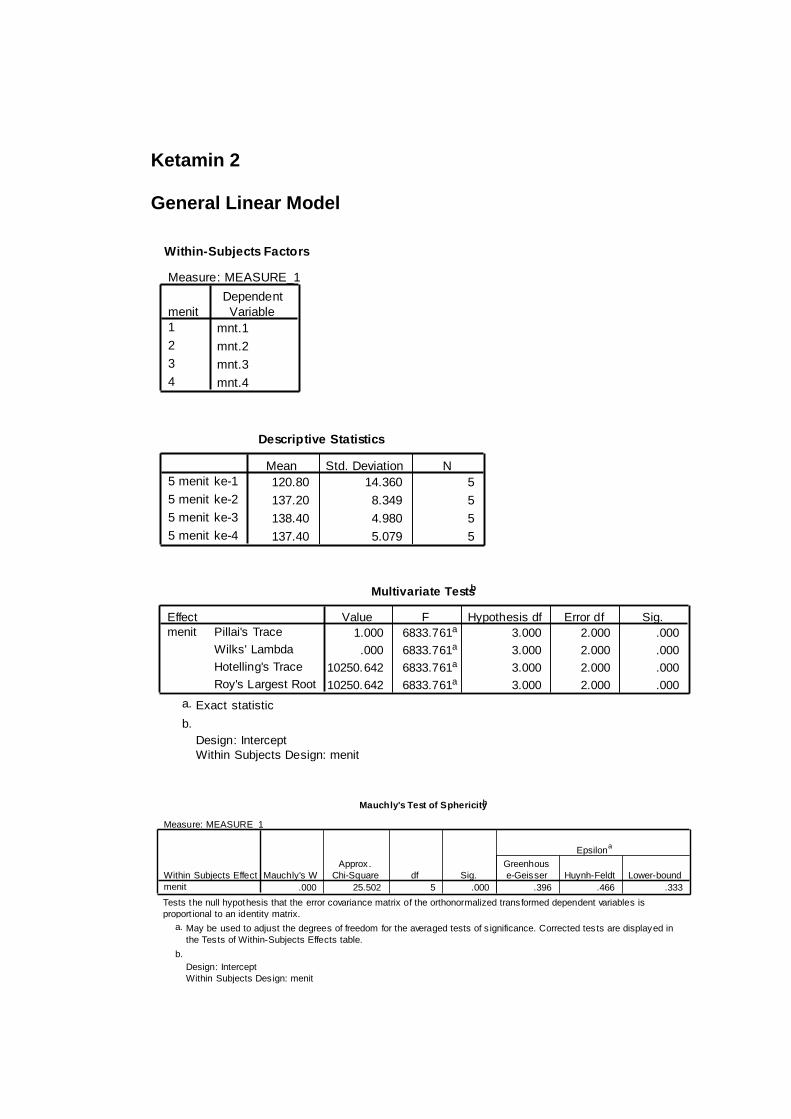
Ketamin 2 General Linear Model
Within-Subjects Factors
Measure: MEASURE_1
mnt.1
mnt.2
mnt.3
mnt.4
menit
1
2
3
4
Dependent
Variable
Descriptive Statistics
120.80 14.360 5
137.20 8.349 5
138.40 4.980 5
137.40 5.079 5
5 menit ke-1
5 menit ke-2
5 menit ke-3
5 menit ke-4
Mean Std. Deviation N
Multivariate Testsb
1.000 6833.761a 3.000 2.000 .000
.000 6833.761a 3.000 2.000 .000
10250.642 6833.761a 3.000 2.000 .000
10250.642 6833.761a 3.000 2.000 .000
Pillai's Trace
Wilks' Lambda
Hotelling's Trace
Roy's Largest Root
Effect
menit
Value F Hypothesis df Error df Sig.
Exact statistica.
Design: Intercept
Within Subjects Design: menit
b.
Mauchly's Test of Sphericityb
Measure: MEASURE_1
.000 25.502 5 .000 .396 .466 .333
Within Subjects Effect
menit
Mauchly's W
Approx.
Chi-Square df Sig.
Greenhous
e-Geisser Huynh-Feldt Lower-bound
Epsilona
Tests the null hypothesis that the error covariance matrix of the orthonormalized transformed dependent variables is
proport ional to an identity matrix.
May be used to adjust the degrees of freedom for the averaged tests of s ignificance. Corrected tests are displayed in
the Tests of Within-Subjects Effects table.
a.
Design: Intercept
Within Subjects Design: menit
b.
Estimated Marginal Means
menit
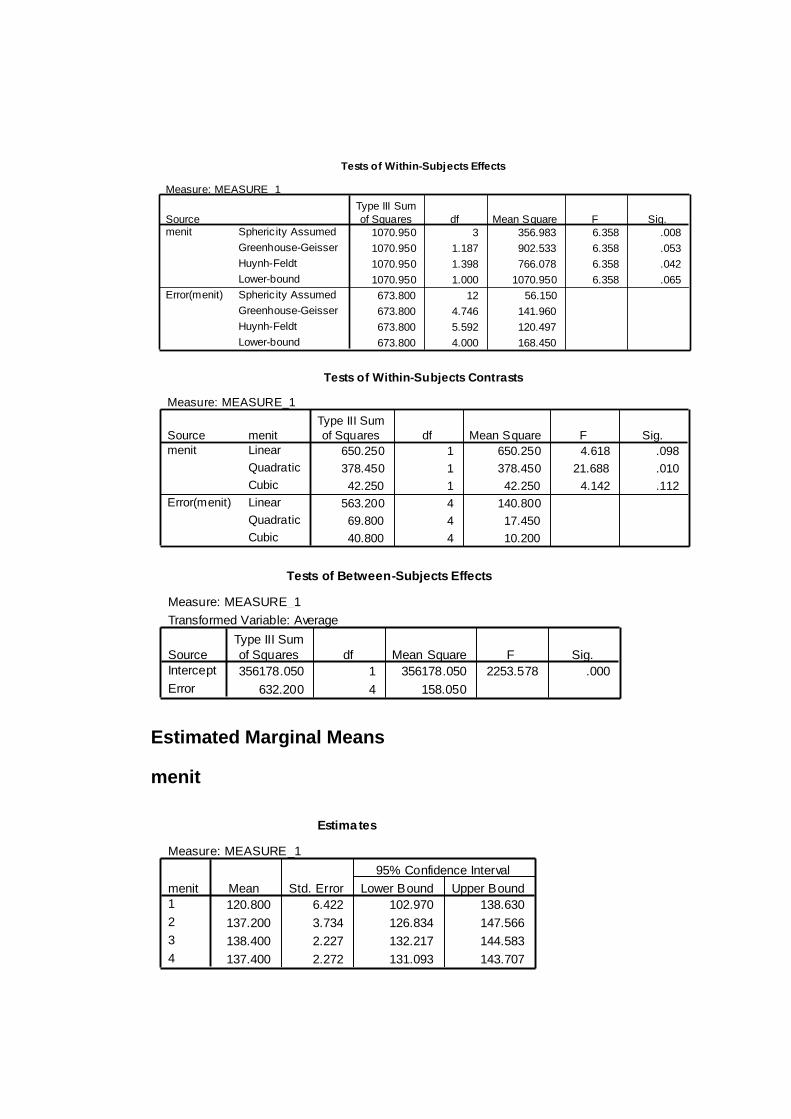
Tests of Within-Subjects Effects
Measure: MEASURE_1
1070.950 3 356.983 6.358 .008
1070.950 1.187 902.533 6.358 .053
1070.950 1.398 766.078 6.358 .042
1070.950 1.000 1070.950 6.358 .065
673.800 12 56.150
673.800 4.746 141.960
673.800 5.592 120.497
673.800 4.000 168.450
Spheric ity Assumed
Greenhouse-Geisser
Huynh-Feldt
Lower-bound
Spheric ity Assumed
Greenhouse-Geisser
Huynh-Feldt
Lower-bound
Sourcemenit
Error(menit)
Type III Sum
of Squares df Mean Square F Sig.
Tests of Within-Subjects Contrasts
Measure: MEASURE_1
650.250 1 650.250 4.618 .098
378.450 1 378.450 21.688 .010
42.250 1 42.250 4.142 .112
563.200 4 140.800
69.800 4 17.450
40.800 4 10.200
menit
Linear
Quadratic
Cubic
Linear
Quadratic
Cubic
Source
menit
Error(menit)
Type III Sum
of Squares df Mean Square F Sig.
Tests of Between-Subjects Effects
Measure: MEASURE_1
Transformed Variable: Average
356178.050 1 356178.050 2253.578 .000
632.200 4 158.050
Source
Intercept
Error
Type III Sum
of Squares df Mean Square F Sig.
Estimates
Measure: MEASURE_1
120.800 6.422 102.970 138.630
137.200 3.734 126.834 147.566
138.400 2.227 132.217 144.583
137.400 2.272 131.093 143.707
menit
1
2
3
4
Mean Std. Error Lower Bound Upper Bound
95% Confidence Interval
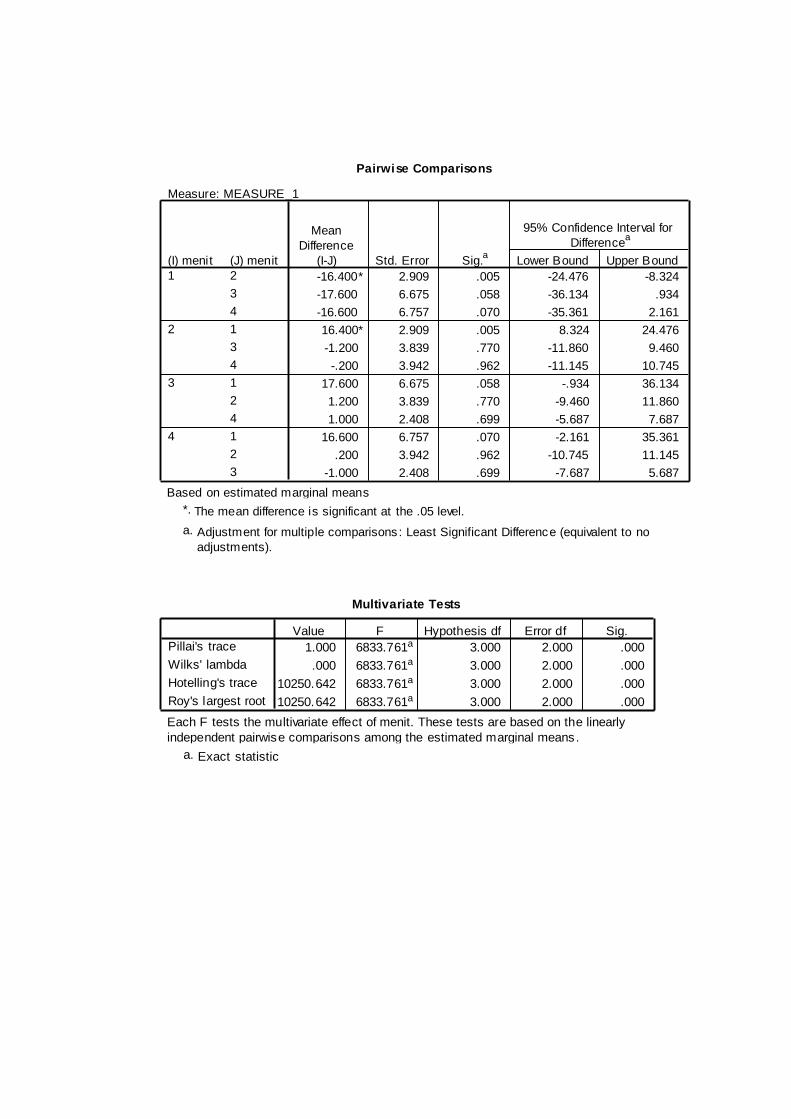
Pairwise Comparisons
Measure: MEASURE_1
-16.400* 2.909 .005 -24.476 -8.324
-17.600 6.675 .058 -36.134 .934
-16.600 6.757 .070 -35.361 2.161
16.400* 2.909 .005 8.324 24.476
-1.200 3.839 .770 -11.860 9.460
-.200 3.942 .962 -11.145 10.745
17.600 6.675 .058 -.934 36.134
1.200 3.839 .770 -9.460 11.860
1.000 2.408 .699 -5.687 7.687
16.600 6.757 .070 -2.161 35.361
.200 3.942 .962 -10.745 11.145
-1.000 2.408 .699 -7.687 5.687
(J) menit
2
3
4
1
3
4
1
2
4
1
2
3
(I) menit
1
2
3
4
Mean
Difference
(I-J) Std. Error Sig.a
Lower Bound Upper Bound
95% Confidence Interval for
Differencea
Based on estimated marginal means
The mean difference is significant at the .05 level.*.
Adjustment for multiple comparisons: Least Significant Difference (equivalent to no
adjustments).
a.
Multivariate Tests
1.000 6833.761a 3.000 2.000 .000
.000 6833.761a 3.000 2.000 .000
10250.642 6833.761a 3.000 2.000 .000
10250.642 6833.761a 3.000 2.000 .000
Pillai's trace
Wilks' lambda
Hotelling's trace
Roy's largest root
Value F Hypothesis df Error df Sig.
Each F tests the multivariate effect of menit. These tests are based on the linearly
independent pairwise comparisons among the estimated marginal means.
Exact statistica.

Ketamin 3 General Linear Model
Within-Subjects Factors
Measure: MEASURE_1
mnt.1
mnt.2
mnt.3
mnt.4
menit
1
2
3
4
Dependent
Variable
Descriptive Statistics
135.40 26.857 5
140.40 12.033 5
141.80 7.855 5
144.20 5.215 5
5 menit ke-1
5 menit ke-2
5 menit ke-3
5 menit ke-4
Mean Std. Deviation N
Multivariate Testsb
.574 .897a 3.000 2.000 .566
.426 .897a 3.000 2.000 .566
1.345 .897a 3.000 2.000 .566
1.345 .897a 3.000 2.000 .566
Pillai's Trace
Wilks' Lambda
Hotelling's Trace
Roy's Largest Root
Effect
menit
Value F Hypothesis df Error df Sig.
Exact statistica.
Design: Intercept
Within Subjects Design: menit
b.
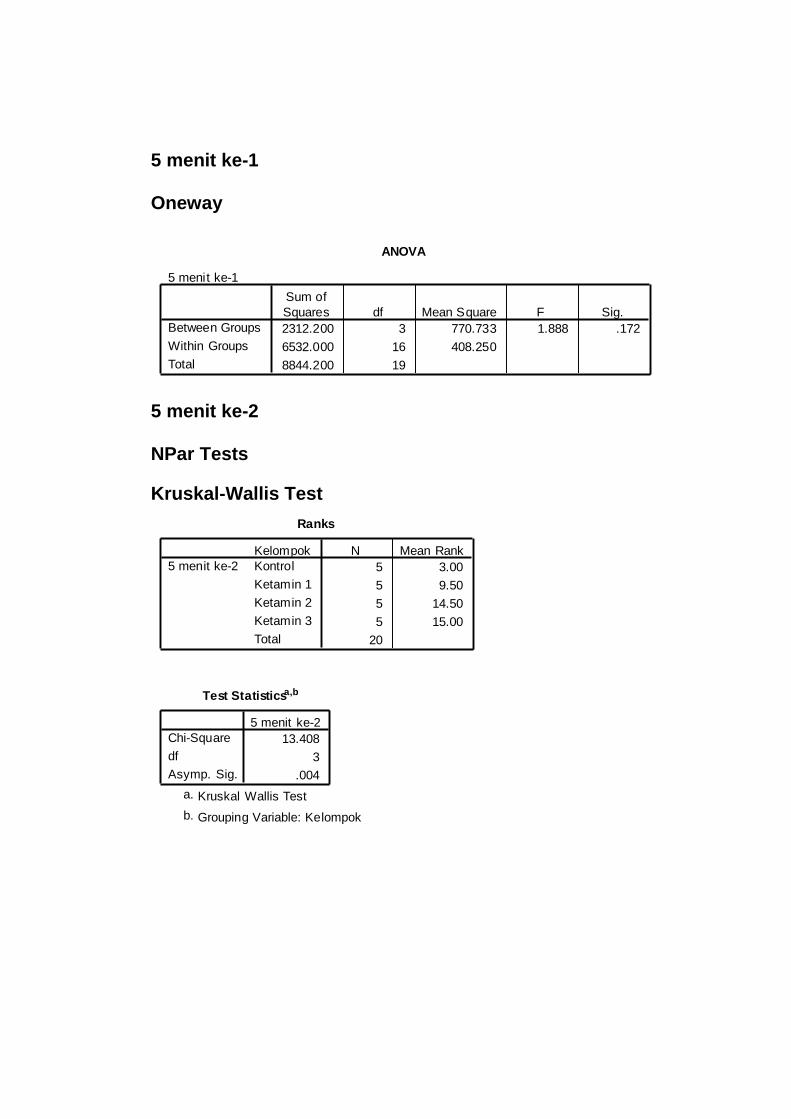
5 menit ke-1 Oneway
5 menit ke-2 NPar Tests
Kruskal-Wallis Test
ANOVA
5 menit ke-1
2312.200 3 770.733 1.888 .172
6532.000 16 408.250
8844.200 19
Between Groups
Within Groups
Total
Sum of
Squares df Mean Square F Sig.
Ranks
5 3.00
5 9.50
5 14.50
5 15.00
20
Kelompok
Kontrol
Ketamin 1
Ketamin 2
Ketamin 3
Total
5 menit ke-2
N Mean Rank
Test Statisticsa,b
13.408
3
.004
Chi-Square
df
Asymp. Sig.
5 menit ke-2
Kruskal Wallis Testa.
Grouping Variable: Kelompokb.
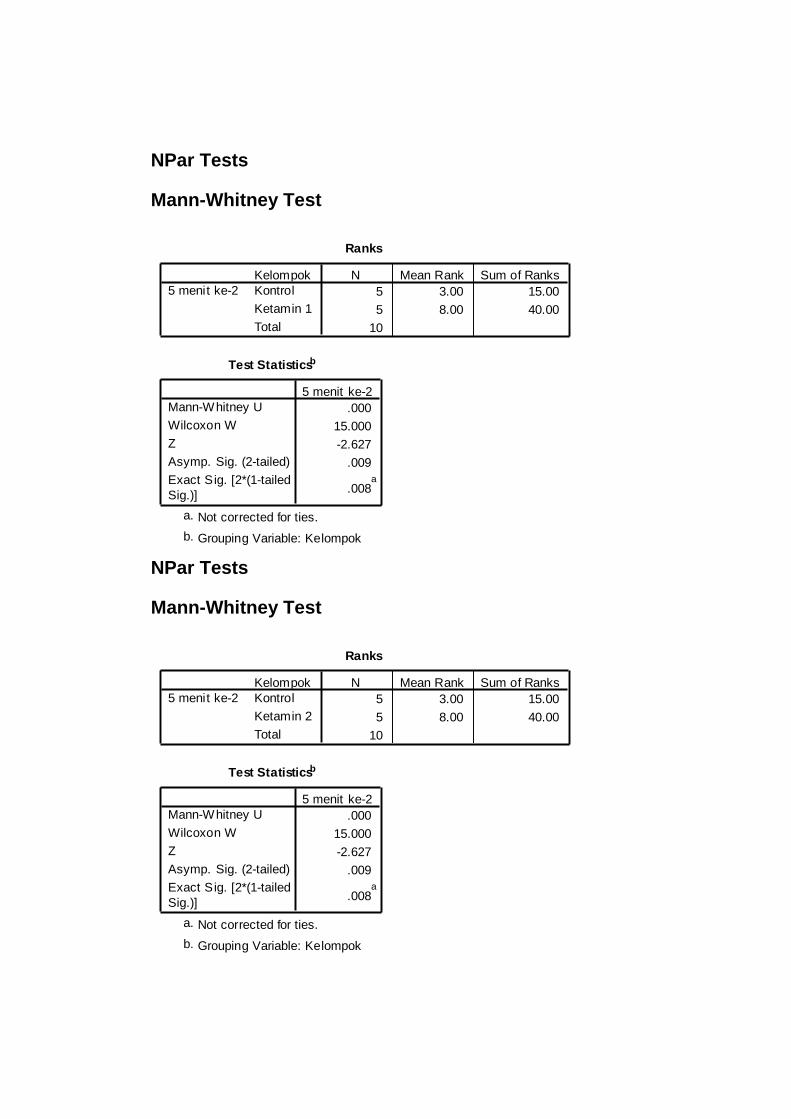
NPar Tests
Mann-Whitney Test
NPar Tests
Mann-Whitney Test
Ranks
5 3.00 15.00
5 8.00 40.00
10
Kelompok
Kontrol
Ketamin 1
Total
5 menit ke-2
N Mean Rank Sum of Ranks
Test Statisticsb
.000
15.000
-2.627
.009
.008a
Mann-Whitney U
Wilcoxon W
Z
Asymp. Sig. (2-tailed)
Exact Sig. [2*(1-tailed
Sig.)]
5 menit ke-2
Not corrected for ties.a.
Grouping Variable: Kelompokb.
Ranks
5 3.00 15.00
5 8.00 40.00
10
Kelompok
Kontrol
Ketamin 2
Total
5 menit ke-2
N Mean Rank Sum of Ranks
Test Statisticsb
.000
15.000
-2.627
.009
.008a
Mann-Whitney U
Wilcoxon W
Z
Asymp. Sig. (2-tailed)
Exact Sig. [2*(1-tailed
Sig.)]
5 menit ke-2
Not corrected for ties.a.
Grouping Variable: Kelompokb.
NPar Tests
Mann-Whitney Test
NPar Tests
Mann-Whitney Test
Ranks
5 3.00 15.00
5 8.00 40.00
10
Kelompok
Kontrol
Ketamin 3
Total
5 menit ke-2
N Mean Rank Sum of Ranks
Test Statisticsb
.000
15.000
-2.627
.009
.008a
Mann-Whitney U
Wilcoxon W
Z
Asymp. Sig. (2-tailed)
Exact Sig. [2*(1-tailed
Sig.)]
5 menit ke-2
Not corrected for ties.a.
Grouping Variable: Kelompokb.
Ranks
5 3.50 17.50
5 7.50 37.50
10
Kelompok
Ketamin 1
Ketamin 2
Total
5 menit ke-2
N Mean Rank Sum of Ranks
Test Statisticsb
2.500
17.500
-2.108
.035
.032a
Mann-Whitney U
Wilcoxon W
Z
Asymp. Sig. (2-tailed)
Exact Sig. [2*(1-tailed
Sig.)]
5 menit ke-2
Not corrected for ties.a.
Grouping Variable: Kelompokb.

NPar Tests
Mann-Whitney Test
NPar Tests
Mann-Whitney Test
Ranks
5 4.00 20.00
5 7.00 35.00
10
Kelompok
Ketamin 1
Ketamin 3
Total
5 menit ke-2
N Mean Rank Sum of Ranks
Test Statisticsb
5.000
20.000
-1.576
.115
.151a
Mann-Whitney U
Wilcoxon W
Z
Asymp. Sig. (2-tailed)
Exact Sig. [2*(1-tailed
Sig.)]
5 menit ke-2
Not corrected for ties.a.
Grouping Variable: Kelompokb.
Ranks
5 5.00 25.00
5 6.00 30.00
10
Kelompok
Ketamin 2
Ketamin 3
Total
5 menit ke-2
N Mean Rank Sum of Ranks
Test Statisticsb
10.000
25.000
-.525
.599
.690a
Mann-Whitney U
Wilcoxon W
Z
Asymp. Sig. (2-tailed)
Exact Sig. [2*(1-tailed
Sig.)]
5 menit ke-2
Not corrected for ties.a.
Grouping Variable: Kelompokb.

5 menit ke-3 NPar Tests
Kruskal-Wallis Test
5 menit ke-4 NPar Tests
Kruskal-Wallis Test
Ranks
5 7.40
5 9.70
5 11.00
5 13.90
20
Kelompok
Kontrol
Ketamin 1
Ketamin 2
Ketamin 3
Total
5 menit ke-3
N Mean Rank
Test Statisticsa,b
3.161
3
.367
Chi-Square
df
Asymp. Sig.
5 menit ke-3
Kruskal Wallis Testa.
Grouping Variable: Kelompokb.
Ranks
5 4.80
5 9.10
5 11.30
5 16.80
20
Kelompok
Kontrol
Ketamin 1
Ketamin 2
Ketamin 3
Total
5 menit ke-4
N Mean Rank

NPar Tests
Mann-Whitney Test
NPar Tests
Mann-Whitney Test
Test Statisticsa,b
10.764
3
.013
Chi-Square
df
Asymp. Sig.
5 menit ke-4
Kruskal Wallis Testa.
Grouping Variable: Kelompokb.
Ranks
5 4.20 21.00
5 6.80 34.00
10
Kelompok
Kontrol
Ketamin 1
Total
5 menit ke-4
N Mean Rank Sum of Ranks
Test Statisticsb
6.000
21.000
-1.375
.169
.222a
Mann-Whitney U
Wilcoxon W
Z
Asymp. Sig. (2-tailed)
Exact Sig. [2*(1-tailed
Sig.)]
5 menit ke-4
Not corrected for ties.a.
Grouping Variable: Kelompokb.
Ranks
5 3.60 18.00
5 7.40 37.00
10
Kelompok
Kontrol
Ketamin 2
Total
5 menit ke-4
N Mean Rank Sum of Ranks

NPar Tests
Mann-Whitney Test
NPar Tests
Mann-Whitney Test
Test Statisticsb
3.000
18.000
-2.009
.045
.056a
Mann-Whitney U
Wilcoxon W
Z
Asymp. Sig. (2-tailed)
Exact Sig. [2*(1-tailed
Sig.)]
5 menit ke-4
Not corrected for ties.a.
Grouping Variable: Kelompokb.
Ranks
5 3.00 15.00
5 8.00 40.00
10
Kelompok
Kontrol
Ketamin 3
Total
5 menit ke-4
N Mean Rank Sum of Ranks
Test Statisticsb
.000
15.000
-2.652
.008
.008a
Mann-Whitney U
Wilcoxon W
Z
Asymp. Sig. (2-tailed)
Exact Sig. [2*(1-tailed
Sig.)]
5 menit ke-4
Not corrected for ties.a.
Grouping Variable: Kelompokb.
Ranks
5 4.80 24.00
5 6.20 31.00
10
Kelompok
Ketamin 1
Ketamin 2
Total
5 menit ke-4
N Mean Rank Sum of Ranks
NPar Tests
Mann-Whitney Test
NPar Tests
Mann-Whitney Test
Test Statisticsb
9.000
24.000
-.736
.462
.548a
Mann-Whitney U
Wilcoxon W
Z
Asymp. Sig. (2-tailed)
Exact Sig. [2*(1-tailed
Sig.)]
5 menit ke-4
Not corrected for ties.a.
Grouping Variable: Kelompokb.
Ranks
5 3.50 17.50
5 7.50 37.50
10
Kelompok
Ketamin 1
Ketamin 3
Total
5 menit ke-4
N Mean Rank Sum of Ranks
Test Statisticsb
2.500
17.500
-2.102
.036
.032a
Mann-Whitney U
Wilcoxon W
Z
Asymp. Sig. (2-tailed)
Exact Sig. [2*(1-tailed
Sig.)]
5 menit ke-4
Not corrected for ties.a.
Grouping Variable: Kelompokb.
Ranks
5 3.70 18.50
5 7.30 36.50
10
Kelompok
Ketamin 2
Ketamin 3
Total
5 menit ke-4
N Mean Rank Sum of Ranks

Test Statisticsb
3.500
18.500
-1.892
.059
.056a
Mann-Whitney U
Wilcoxon W
Z
Asymp. Sig. (2-tailed)
Exact Sig. [2*(1-tailed
Sig.)]
5 menit ke-4
Not corrected for ties.a.
Grouping Variable: Kelompokb.

Tabel deskriptif
5 menit ke
1 2 3 4
Kontrol 108,2
16,346 108,8 8,106
110,4
35,090
121,6
13,259
Ketamin 1 110,4
20,936 128,6 2,881 135,8 7,050 134,2 6,535
Ketamin 2 120,8
14,360 137,2 8,349 138,4 4,980 137,4 5,079
Ketamin 3 135,4
26,857
140,4
12,033 141,8 7,855 144,2 5,215
Tabel Uji Normalitas dan Homogenitas
Waktu Kelompok Saphiro-Wilk Levene statistic
Sig. Sig.
5 menit ke-1 Kontrol 0,421
0,783 Ketamin 1 0,464
Ketamin 2 0,291
Ketamin 3 0,837
5 menit ke-2 Kontrol 0,010
0,023 Ketamin 1 0,601
Ketamin 2 0,126
Ketamin 3 0,237
5 menit ke-3 Kontrol 0,638
0,003 Ketamin 1 0,649
Ketamin 2 0,090
Ketamin 3 0,712
5 menit ke-4 Kontrol 0,041
0,005 Ketamin 1 0,558
Ketamin 2 0,904
Ketamin 3 0,634

Tabel Uji Beda Berpasangan
Kelompok Friedman Test Repeated ANOVA
p p
Kontrol 0,251
Ketamin 1 0,421
Ketamin 2 0,000*
Ketamin 3 0,566
Tabel Uji Post Hoc Ketamin 2
Kelompok 5 menit ke-2 5 menit ke-3 5 menit ke-4
5 menit ke-1 0,005* 0,058 0,070
5 menit ke-2 – 0,770 0,962
5 menit ke-3 – 0,699
Tabel Uji One Way ANOVA 5 menit ke-1
Kelompok Mean SD p
Kontrol 108,2 16,346
0,172 Ketamin 1 110,4 20,936
Ketamin 2 120,8 14,360
Ketamin 3 135,4 26,857
Dari tabel uji One Way ANOVA didapatkan nilai p > 0,05 atau tidak
signifikan.
Tabel Uji Kruskal-Wallis 5 menit ke-2
Kelompok Mean SD p
Kontrol 108,8 8,106
0,004* Ketamin 1 128,6 2,881
Ketamin 2 137,2 8,349
Ketamin 3 140,4 12,033
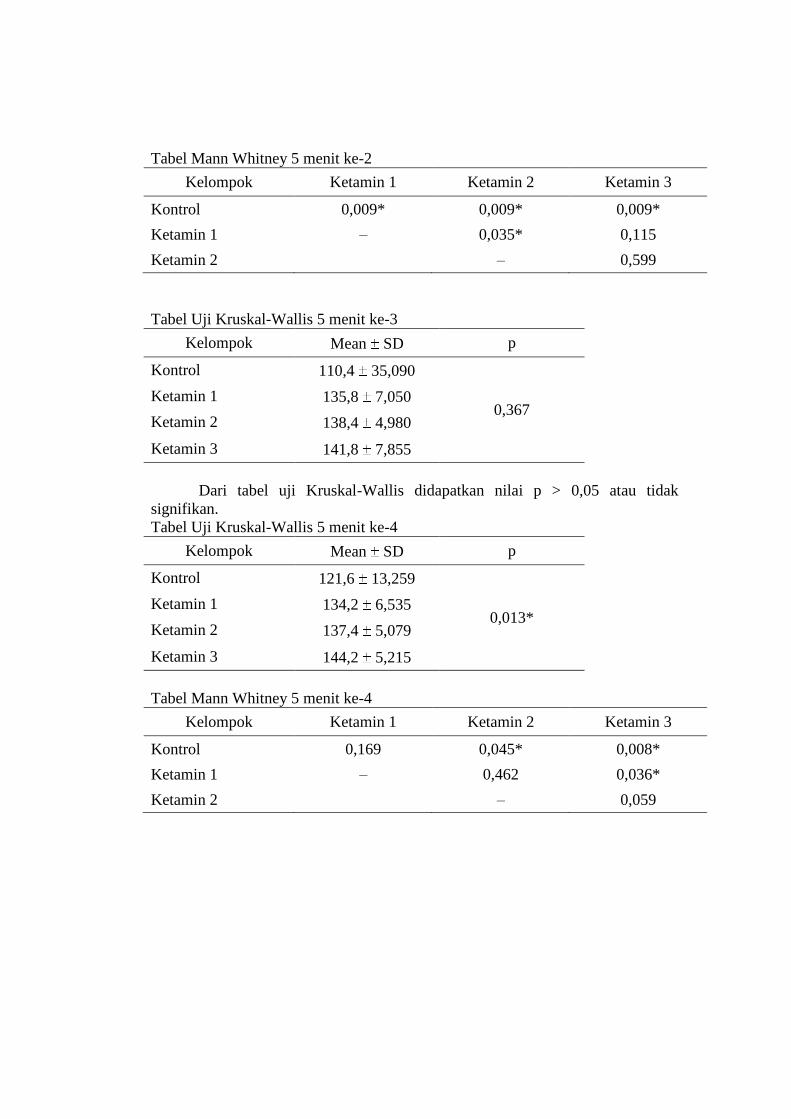
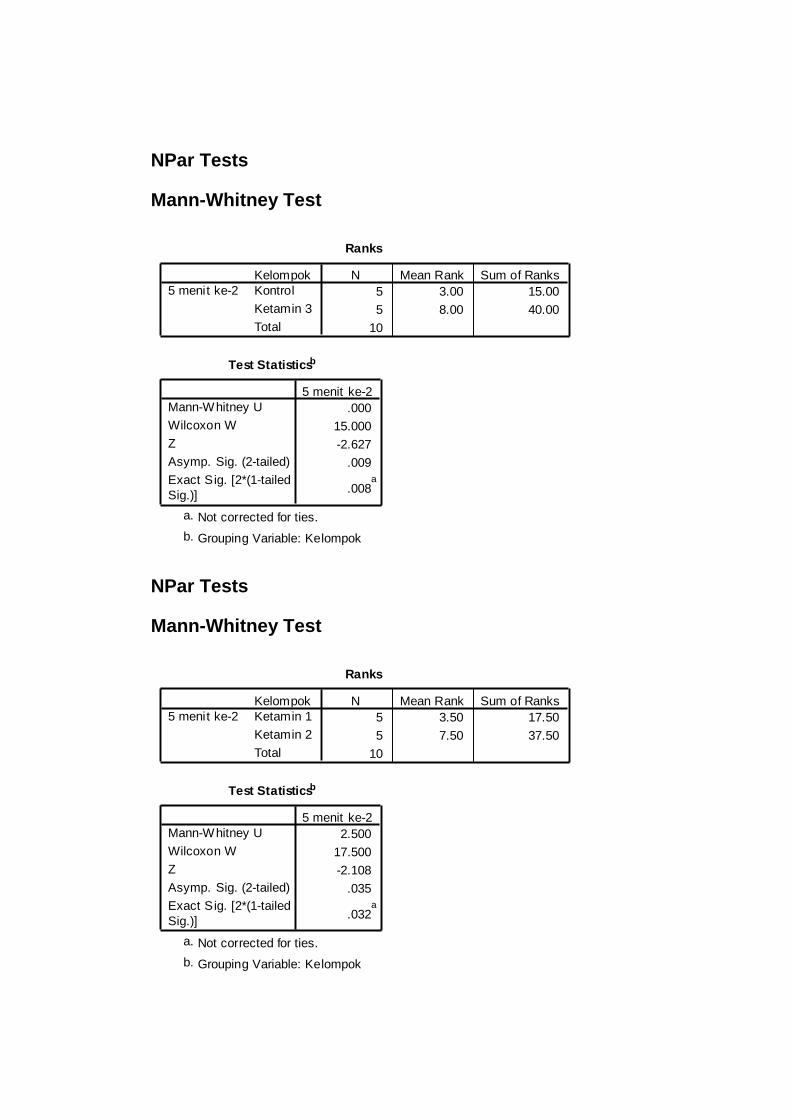
Tabel Mann Whitney 5 menit ke-2
Kelompok Ketamin 1 Ketamin 2 Ketamin 3
Kontrol 0,009* 0,009* 0,009*
Ketamin 1 – 0,035* 0,115
Ketamin 2 – 0,599
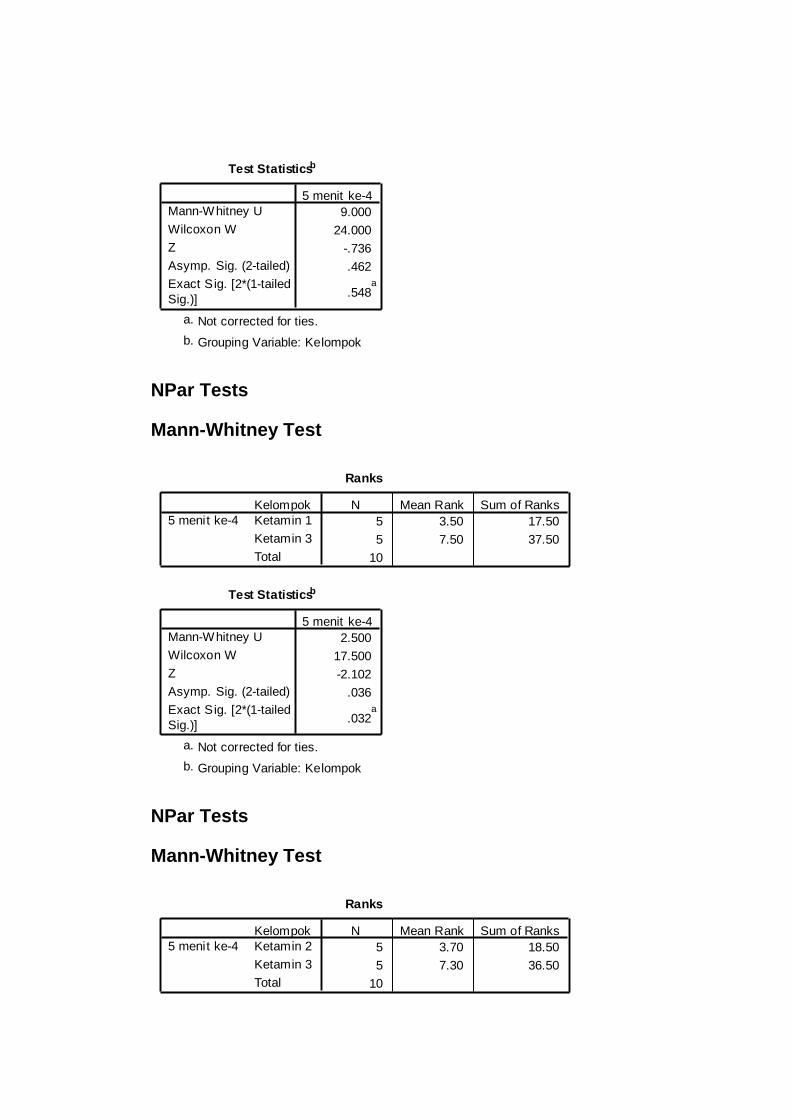
Tabel Uji Kruskal-Wallis 5 menit ke-3
Kelompok Mean SD p
Kontrol 110,4 35,090
0,367 Ketamin 1 135,8 7,050
Ketamin 2 138,4 4,980
Ketamin 3 141,8 7,855
Dari tabel uji Kruskal-Wallis didapatkan nilai p > 0,05 atau tidak
signifikan.
Tabel Uji Kruskal-Wallis 5 menit ke-4
Kelompok Mean SD p
Kontrol 121,6 13,259
0,013* Ketamin 1 134,2 6,535
Ketamin 2 137,4 5,079
Ketamin 3 144,2 5,215
Tabel Mann Whitney 5 menit ke-4
Kelompok Ketamin 1 Ketamin 2 Ketamin 3
Kontrol 0,169 0,045* 0,008*
Ketamin 1 – 0,462 0,036*
Ketamin 2 – 0,059
Lampiran 4. Biodata Mahasiswa
BIODATA MAHASISWA
Nama : Lintang Fifgi Andila
NIM : 22010110120081
Tempat/tanggal lahir : Jakarta 24 Juli 1992
Jenis Kelamin : Perempuan
Alamat : Jl. Raya Kaliwadas No.05 Bumiayu,Brebes
Nomor Telepon : 081225026093
e-mail : [email protected]
Riwayat Pendidikan Formal
1. SD : SD Kalierang 1 Bumiayu Lulus tahun: 2004
2. SMP : SMP N 1 Bumiayu Lulus tahun: 2007
3. SMA : SMA N 1 Bumiayu Lulus tahun: 2010
4. FK UNDIP : Masuk tahun: 2010
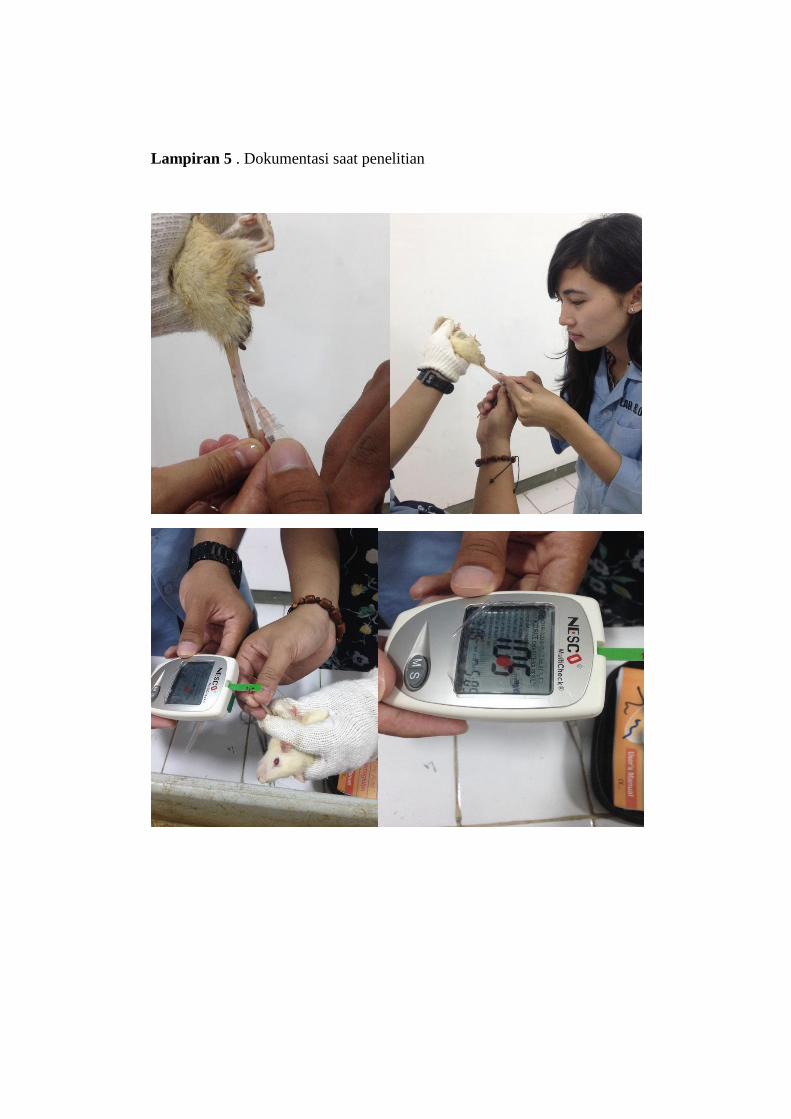
Lampiran 5 . Dokumentasi saat penelitian