99 Sekaran, U. (2006). . Erlangga,...
67
Universitas Esa Unggul 99 Sekaran, U. (2006). Metodologi Penelitian Bisnis. Erlangga, Jakarta. Soejadi. (1996). Pedoman Penilaian Kinerja Rumah Sakit. Kartika Bina, Jakarta Sugiarto, E. (1999). Psikologi Pelayanan dalam Industri Jasa. Jakarta: PT Gramedia Pustaka Utama. Sugiyono. (2004). Metode Penelitian Bisnis: Penerbit CV. Alfabeta: Bandung Sugiyono. (2007). “Metode Penelitian Kuantitatif Kualitatif dan R&D”. Bandung: Alfabeta Supranto, J. (1997). Pengukuran Tingkat Kepuasan Pelanggan Untuk Menaikkan Pangsa Pasar. Penerbit Rineka Cipta, Jakarta Tjiptono, F. (1997). Prinsip-Prinsip Total Quality Service. Yogyakarta : Andi Offset Tjiptono, F. (2006). Pemasaran Jasa, Bayumedia, Malang Jawa Timur. Umar, H. (2009). Metode Penelitian Untuk Skripsi dan Tesis. Edisi Kedua. Jakarta : PT. Raja Grafindo Persada Undang-Undang R.I no.38 tahun 2014, tentang Keperawatan Undang-Undang R.I no.44 tahun 2009, tentang Rumah Sakit’ Utama, A. (2003). Analisis Pengaruh Persepsi Kualitas Pelayanan Terhadap Kepuasan Pelanggan Rumah Sakit Umum Cakra Husada Klaten. OPSI, Vol. 1, No. 2, Desember 2003: 96 – 110 Utama, S. (2003). Memahami Fenomena Kepuasan Pasien Rumah Sakit: Fakultas Kesehatan Masyarakat Universitas Sumatera Utara Viktor. (2008). Dikutip Dalam Gunawan., & Djati. (2011). Kualitas Layanan dan Loyalitas Pasien (Studi pada Rumah Sakit Umum Swasta di Kota Singaraja–Bali) Wijanto, S.H. (2008). Structural Equation Modeling dengan LISREL 8.8 Konsep dan Tutorial. Yogyakarta : Graha Ilmu. Williams, J. R. (2005). Medical Ethics Manual. Ethics Unit of the World Medical Association, Wijayanti, A. (2008). Strategi Meningkatkan Loyalitas Melalui Kepuasan Pelanggan (Studi Kasus: Produk Kartu Prabayar Mentari – Indosat Wilayah Semarang). Tesis, Program Magister Manajemen Universitas Diponegoro, Semarang. Wijono, D. (1999). Manajemen Mutu Pelayanan Kesehatan. Buku 1. Airlangga University Press, Surabaya,.
Transcript of 99 Sekaran, U. (2006). . Erlangga,...
Universitas Esa Unggul
99
Sekaran, U. (2006). Metodologi Penelitian Bisnis. Erlangga, Jakarta.
Soejadi. (1996). Pedoman Penilaian Kinerja Rumah Sakit. Kartika Bina, Jakarta
Sugiarto, E. (1999). Psikologi Pelayanan dalam Industri Jasa. Jakarta: PT
Gramedia Pustaka Utama.
Sugiyono. (2004). Metode Penelitian Bisnis: Penerbit CV. Alfabeta: Bandung
Sugiyono. (2007). “Metode Penelitian Kuantitatif Kualitatif dan R&D”. Bandung:
Alfabeta
Supranto, J. (1997). Pengukuran Tingkat Kepuasan Pelanggan Untuk Menaikkan
Pangsa Pasar. Penerbit Rineka Cipta, Jakarta
Tjiptono, F. (1997). Prinsip-Prinsip Total Quality Service. Yogyakarta : Andi
Offset
Tjiptono, F. (2006). Pemasaran Jasa, Bayumedia, Malang Jawa Timur.
Umar, H. (2009). Metode Penelitian Untuk Skripsi dan Tesis. Edisi Kedua. Jakarta
: PT. Raja Grafindo Persada
Undang-Undang R.I no.38 tahun 2014, tentang Keperawatan
Undang-Undang R.I no.44 tahun 2009, tentang Rumah Sakit’
Utama, A. (2003). Analisis Pengaruh Persepsi Kualitas Pelayanan Terhadap
Kepuasan Pelanggan Rumah Sakit Umum Cakra Husada Klaten. OPSI,
Vol. 1, No. 2, Desember 2003: 96 – 110
Utama, S. (2003). Memahami Fenomena Kepuasan Pasien Rumah Sakit: Fakultas
Kesehatan Masyarakat Universitas Sumatera Utara
Viktor. (2008). Dikutip Dalam Gunawan., & Djati. (2011). Kualitas Layanan dan
Loyalitas Pasien (Studi pada Rumah Sakit Umum Swasta di Kota
Singaraja–Bali)
Wijanto, S.H. (2008). Structural Equation Modeling dengan LISREL 8.8 Konsep
dan Tutorial. Yogyakarta : Graha Ilmu.
Williams, J. R. (2005). Medical Ethics Manual. Ethics Unit of the World Medical
Association,
Wijayanti, A. (2008). Strategi Meningkatkan Loyalitas Melalui Kepuasan
Pelanggan (Studi Kasus: Produk Kartu Prabayar Mentari – Indosat
Wilayah Semarang). Tesis, Program Magister Manajemen Universitas
Diponegoro, Semarang.
Wijono, D. (1999). Manajemen Mutu Pelayanan Kesehatan. Buku 1. Airlangga
University Press, Surabaya,.
Universitas Esa Unggul
100
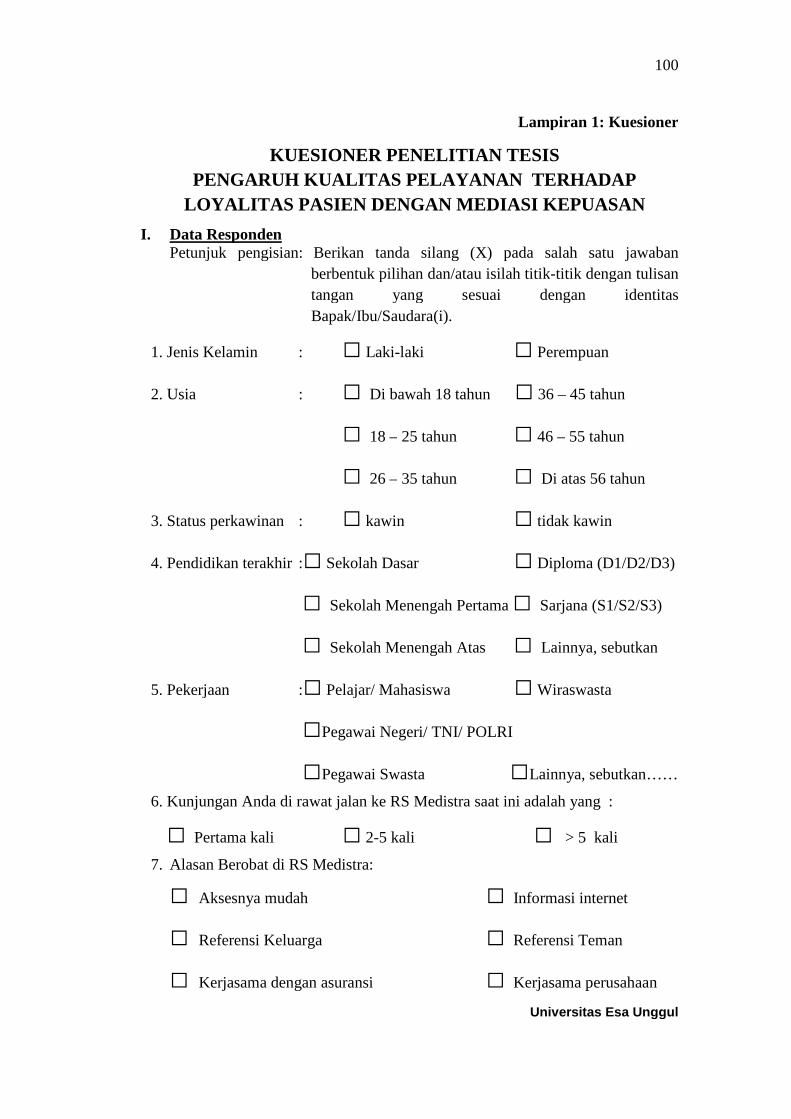
Lampiran 1: Kuesioner
KUESIONER PENELITIAN TESIS
PENGARUH KUALITAS PELAYANAN TERHADAP
LOYALITAS PASIEN DENGAN MEDIASI KEPUASAN
I. Data RespondenPetunjuk pengisian: Berikan tanda silang (X) pada salah satu jawaban
berbentuk pilihan dan/atau isilah titik-titik dengan tulisan
tangan yang sesuai dengan identitas
Bapak/Ibu/Saudara(i).
1. Jenis Kelamin : □ Laki-laki □ Perempuan
2. Usia : □ Di bawah 18 tahun □ 36 – 45 tahun
□ 18 – 25 tahun □ 46 – 55 tahun
□ 26 – 35 tahun □ Di atas 56 tahun
3. Status perkawinan : □ kawin □ tidak kawin
4. Pendidikan terakhir :□ Sekolah Dasar □ Diploma (D1/D2/D3)
□ Sekolah Menengah Pertama □ Sarjana (S1/S2/S3)
□ Sekolah Menengah Atas □ Lainnya, sebutkan
5. Pekerjaan :□ Pelajar/ Mahasiswa □ Wiraswasta
□Pegawai Negeri/ TNI/ POLRI
□Pegawai Swasta □Lainnya, sebutkan……
6. Kunjungan Anda di rawat jalan ke RS Medistra saat ini adalah yang :
□ Pertama kali □ 2-5 kali □ > 5 kali
7. Alasan Berobat di RS Medistra:
□ Aksesnya mudah □ Informasi internet
□ Referensi Keluarga □ Referensi Teman
□ Kerjasama dengan asuransi □ Kerjasama perusahaan
Universitas Esa Unggul
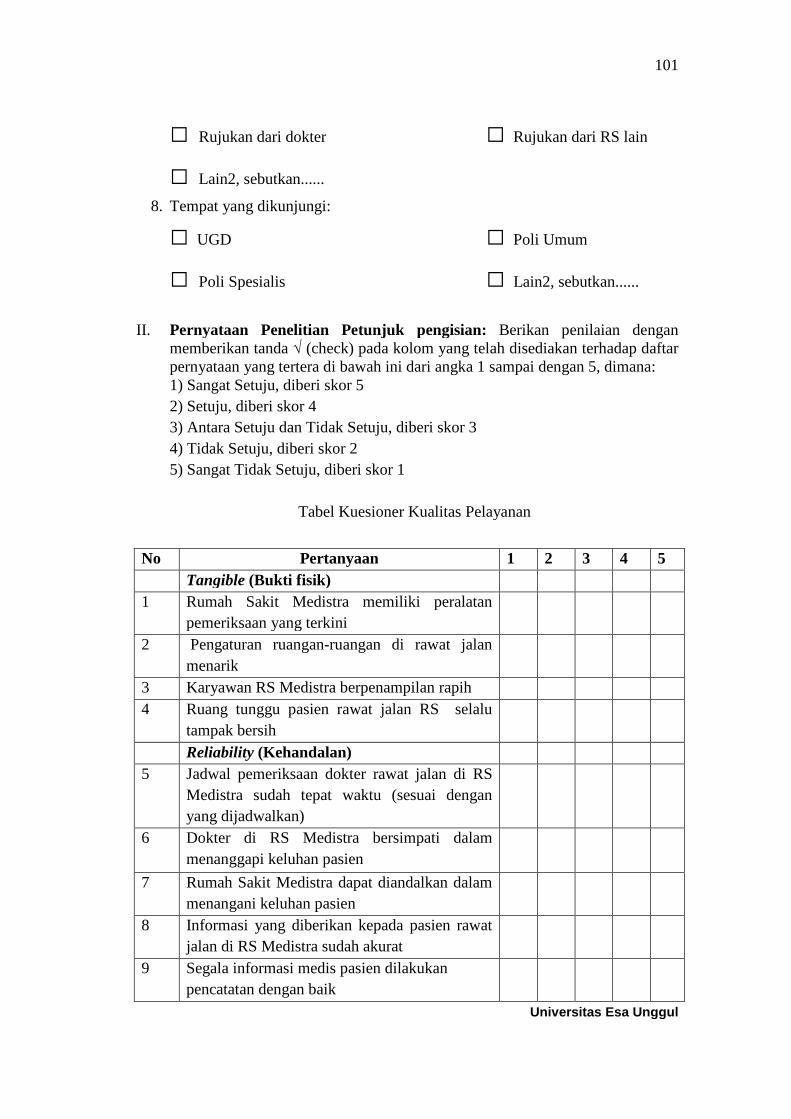
101
□ Rujukan dari dokter □ Rujukan dari RS lain
□ Lain2, sebutkan......
8. Tempat yang dikunjungi:
□ UGD □ Poli Umum
□ Poli Spesialis □ Lain2, sebutkan......
II. Pernyataan Penelitian Petunjuk pengisian: Berikan penilaian denganmemberikan tanda √ (check) pada kolom yang telah disediakan terhadap daftarpernyataan yang tertera di bawah ini dari angka 1 sampai dengan 5, dimana:1) Sangat Setuju, diberi skor 5
2) Setuju, diberi skor 4
3) Antara Setuju dan Tidak Setuju, diberi skor 3
4) Tidak Setuju, diberi skor 2
5) Sangat Tidak Setuju, diberi skor 1
Tabel Kuesioner Kualitas Pelayanan
No Pertanyaan 1 2 3 4 5
Tangible (Bukti fisik)
1 Rumah Sakit Medistra memiliki peralatan
pemeriksaan yang terkini
2 Pengaturan ruangan-ruangan di rawat jalan
menarik
3 Karyawan RS Medistra berpenampilan rapih
4 Ruang tunggu pasien rawat jalan RS selalu
tampak bersih
Reliability (Kehandalan)
5 Jadwal pemeriksaan dokter rawat jalan di RS
Medistra sudah tepat waktu (sesuai dengan
yang dijadwalkan)
6 Dokter di RS Medistra bersimpati dalam
menanggapi keluhan pasien
7 Rumah Sakit Medistra dapat diandalkan dalam
menangani keluhan pasien
8 Informasi yang diberikan kepada pasien rawat
jalan di RS Medistra sudah akurat
9 Segala informasi medis pasien dilakukan
pencatatan dengan baik
Universitas Esa Unggul
102
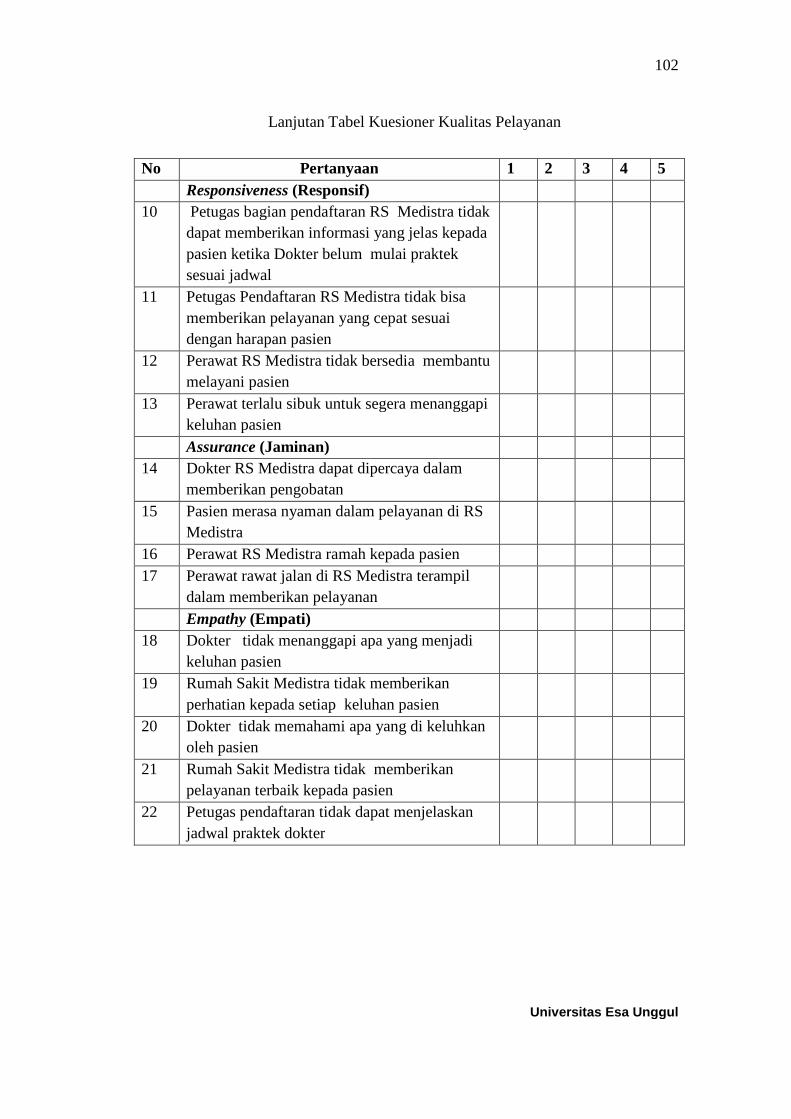
Lanjutan Tabel Kuesioner Kualitas Pelayanan
No Pertanyaan 1 2 3 4 5
Responsiveness (Responsif)
10 Petugas bagian pendaftaran RS Medistra tidak
dapat memberikan informasi yang jelas kepada
pasien ketika Dokter belum mulai praktek
sesuai jadwal
11 Petugas Pendaftaran RS Medistra tidak bisa
memberikan pelayanan yang cepat sesuai
dengan harapan pasien
12 Perawat RS Medistra tidak bersedia membantu
melayani pasien
13 Perawat terlalu sibuk untuk segera menanggapi
keluhan pasien
Assurance (Jaminan)
14 Dokter RS Medistra dapat dipercaya dalam
memberikan pengobatan
15 Pasien merasa nyaman dalam pelayanan di RS
Medistra
16 Perawat RS Medistra ramah kepada pasien
17 Perawat rawat jalan di RS Medistra terampil
dalam memberikan pelayanan
Empathy (Empati)
18 Dokter tidak menanggapi apa yang menjadi
keluhan pasien
19 Rumah Sakit Medistra tidak memberikan
perhatian kepada setiap keluhan pasien
20 Dokter tidak memahami apa yang di keluhkan
oleh pasien
21 Rumah Sakit Medistra tidak memberikan
pelayanan terbaik kepada pasien
22 Petugas pendaftaran tidak dapat menjelaskan
jadwal praktek dokter
Universitas Esa Unggul
103
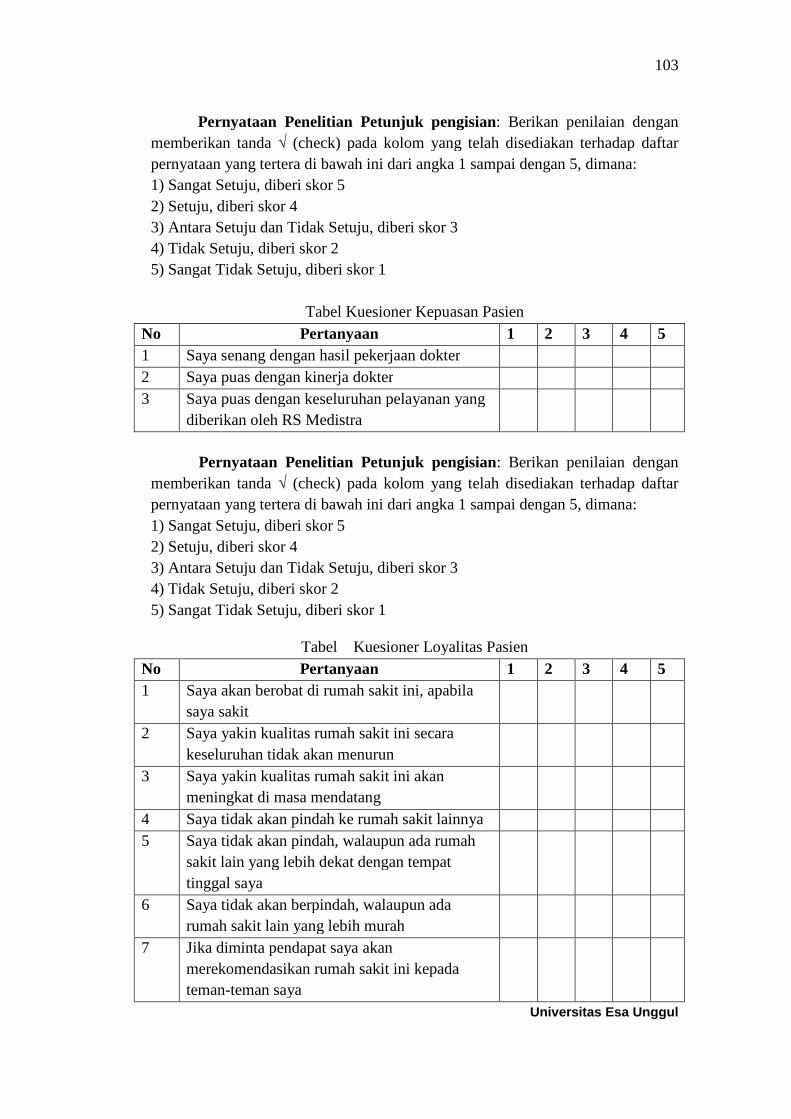
Pernyataan Penelitian Petunjuk pengisian: Berikan penilaian dengan
memberikan tanda √ (check) pada kolom yang telah disediakan terhadap daftar
pernyataan yang tertera di bawah ini dari angka 1 sampai dengan 5, dimana:
1) Sangat Setuju, diberi skor 5
2) Setuju, diberi skor 4
3) Antara Setuju dan Tidak Setuju, diberi skor 3
4) Tidak Setuju, diberi skor 2
5) Sangat Tidak Setuju, diberi skor 1
Tabel Kuesioner Kepuasan Pasien
No Pertanyaan 1 2 3 4 5
1 Saya senang dengan hasil pekerjaan dokter
2 Saya puas dengan kinerja dokter
3 Saya puas dengan keseluruhan pelayanan yang
diberikan oleh RS Medistra
Pernyataan Penelitian Petunjuk pengisian: Berikan penilaian dengan
memberikan tanda √ (check) pada kolom yang telah disediakan terhadap daftar
pernyataan yang tertera di bawah ini dari angka 1 sampai dengan 5, dimana:
1) Sangat Setuju, diberi skor 5
2) Setuju, diberi skor 4
3) Antara Setuju dan Tidak Setuju, diberi skor 3
4) Tidak Setuju, diberi skor 2
5) Sangat Tidak Setuju, diberi skor 1
Tabel Kuesioner Loyalitas Pasien
No Pertanyaan 1 2 3 4 5
1 Saya akan berobat di rumah sakit ini, apabila
saya sakit
2 Saya yakin kualitas rumah sakit ini secara
keseluruhan tidak akan menurun
3 Saya yakin kualitas rumah sakit ini akan
meningkat di masa mendatang
4 Saya tidak akan pindah ke rumah sakit lainnya
5 Saya tidak akan pindah, walaupun ada rumah
sakit lain yang lebih dekat dengan tempat
tinggal saya
6 Saya tidak akan berpindah, walaupun ada
rumah sakit lain yang lebih murah
7 Jika diminta pendapat saya akan
merekomendasikan rumah sakit ini kepada
teman-teman saya
Universitas Esa Unggul
104
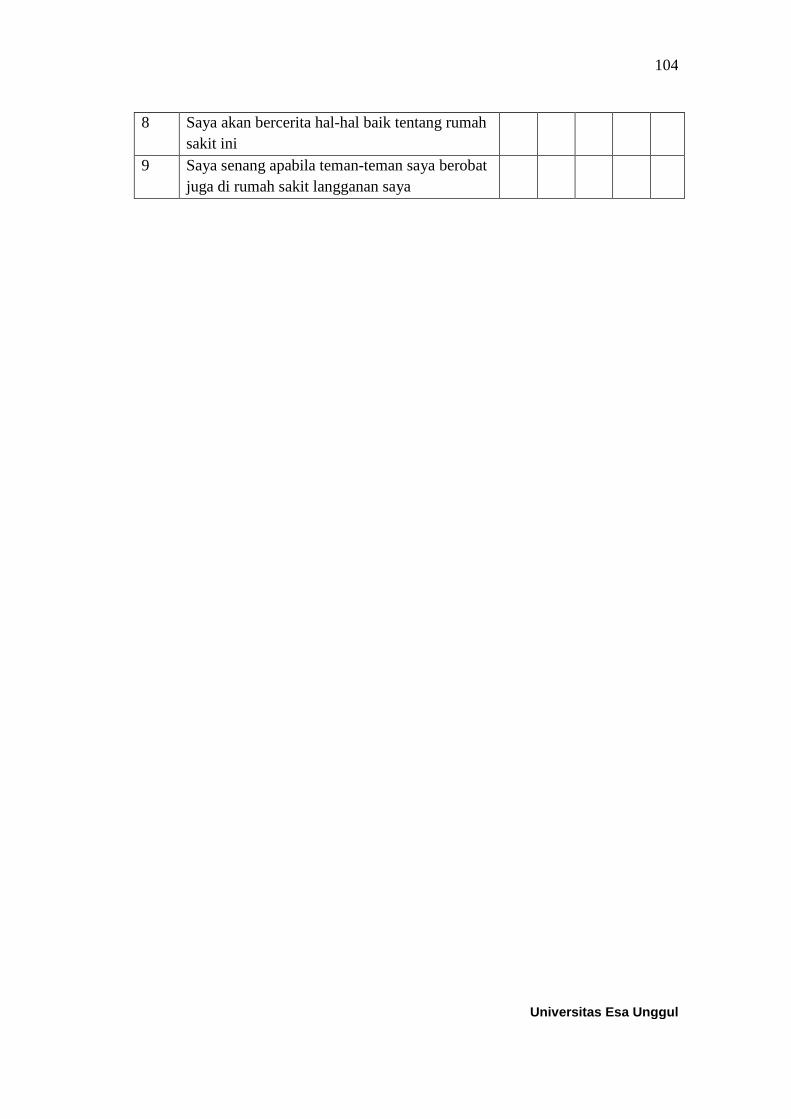
8 Saya akan bercerita hal-hal baik tentang rumah
sakit ini
9 Saya senang apabila teman-teman saya berobat
juga di rumah sakit langganan saya
Universitas Esa Unggul
105
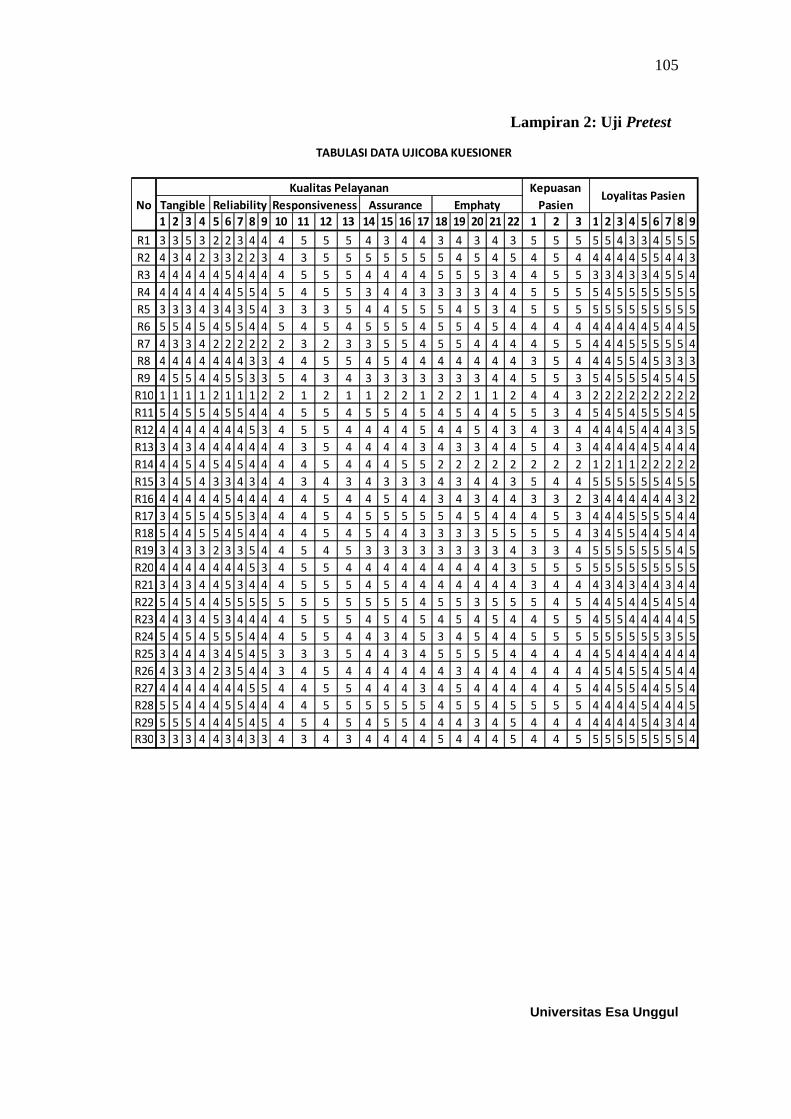
Lampiran 2: Uji Pretest
1 2 3 4 5 6 7 8 9 10 11 12 13 14 15 16 17 18 19 20 21 22 1 2 3 1 2 3 4 5 6 7 8 9
R1 3 3 5 3 2 2 3 4 4 4 5 5 5 4 3 4 4 3 4 3 4 3 5 5 5 5 5 4 3 3 4 5 5 5
R2 4 3 4 2 3 3 2 2 3 4 3 5 5 5 5 5 5 5 4 5 4 5 4 5 4 4 4 4 4 5 5 4 4 3
R3 4 4 4 4 4 5 4 4 4 4 5 5 5 4 4 4 4 5 5 5 3 4 4 5 5 3 3 4 3 3 4 5 5 4
R4 4 4 4 4 4 4 5 5 4 5 4 5 5 3 4 4 3 3 3 3 4 4 5 5 5 5 4 5 5 5 5 5 5 5
R5 3 3 3 4 3 4 3 5 4 3 3 3 5 4 4 5 5 5 4 5 3 4 5 5 5 5 5 5 5 5 5 5 5 5
R6 5 5 4 5 4 5 5 4 4 5 4 5 4 5 5 5 4 5 5 4 5 4 4 4 4 4 4 4 4 4 5 4 4 5
R7 4 3 3 4 2 2 2 2 2 2 3 2 3 3 5 5 4 5 5 4 4 4 4 5 5 4 4 4 5 5 5 5 5 4
R8 4 4 4 4 4 4 4 3 3 4 4 5 5 4 5 4 4 4 4 4 4 4 3 5 4 4 4 5 5 4 5 3 3 3
R9 4 5 5 4 4 5 5 3 3 5 4 3 4 3 3 3 3 3 3 3 4 4 5 5 3 5 4 5 5 5 4 5 4 5
R10 1 1 1 1 2 1 1 1 2 2 1 2 1 1 2 2 1 2 2 1 1 2 4 4 3 2 2 2 2 2 2 2 2 2
R11 5 4 5 5 4 5 5 4 4 4 5 5 4 5 5 4 5 4 5 4 4 5 5 3 4 5 4 5 4 5 5 5 4 5
R12 4 4 4 4 4 4 4 5 3 4 5 5 4 4 4 4 5 4 4 5 4 3 4 3 4 4 4 4 5 4 4 4 3 5
R13 3 4 3 4 4 4 4 4 4 4 3 5 4 4 4 4 3 4 3 3 4 4 5 4 3 4 4 4 4 4 5 4 4 4
R14 4 4 5 4 5 4 5 4 4 4 4 5 4 4 4 5 5 2 2 2 2 2 2 2 2 1 2 1 1 2 2 2 2 2
R15 3 4 5 4 3 3 4 3 4 4 3 4 3 4 3 3 3 4 3 4 4 3 5 4 4 5 5 5 5 5 5 4 5 5
R16 4 4 4 4 4 5 4 4 4 4 4 5 4 4 5 4 4 3 4 3 4 4 3 3 2 3 4 4 4 4 4 4 3 2
R17 3 4 5 5 4 5 5 3 4 4 4 5 4 5 5 5 5 5 4 5 4 4 4 5 3 4 4 4 5 5 5 5 4 4
R18 5 4 4 5 5 4 5 4 4 4 4 5 4 5 4 4 3 3 3 3 5 5 5 5 4 3 4 5 5 4 4 5 4 4
R19 3 4 3 3 2 3 3 5 4 4 5 4 5 3 3 3 3 3 3 3 3 4 3 3 4 5 5 5 5 5 5 5 4 5
R20 4 4 4 4 4 4 4 5 3 4 5 5 4 4 4 4 4 4 4 4 4 3 5 5 5 5 5 5 5 5 5 5 5 5
R21 3 4 3 4 4 5 3 4 4 4 5 5 5 4 5 4 4 4 4 4 4 4 3 4 4 4 3 4 3 4 4 3 4 4
R22 5 4 5 4 4 5 5 5 5 5 5 5 5 5 5 5 4 5 5 3 5 5 5 4 5 4 4 5 4 4 5 4 5 4
R23 4 4 3 4 5 3 4 4 4 4 5 5 5 4 5 4 5 4 5 4 5 4 4 5 5 4 5 5 4 4 4 4 4 5
R24 5 4 5 4 5 5 5 4 4 4 5 5 4 4 3 4 5 3 4 5 4 4 5 5 5 5 5 5 5 5 5 3 5 5
R25 3 4 4 4 3 4 5 4 5 3 3 3 5 4 4 3 4 5 5 5 5 4 4 4 4 4 5 4 4 4 4 4 4 4
R26 4 3 3 4 2 3 5 4 4 3 4 5 4 4 4 4 4 4 3 4 4 4 4 4 4 4 5 4 5 5 4 5 4 4
R27 4 4 4 4 4 4 4 5 5 4 4 5 5 4 4 4 3 4 5 4 4 4 4 4 5 4 4 5 5 4 4 5 5 4
R28 5 5 4 4 4 5 5 4 4 4 4 5 5 5 5 5 5 4 5 5 4 5 5 5 5 4 4 4 4 5 4 4 4 5
R29 5 5 5 4 4 4 5 4 5 4 5 4 5 4 5 5 4 4 4 3 4 5 4 4 4 4 4 4 4 5 4 3 4 4
R30 3 3 3 4 4 3 4 3 3 4 3 4 3 4 4 4 4 5 4 4 4 5 4 4 5 5 5 5 5 5 5 5 5 4
TABULASI DATA UJICOBA KUESIONER
No
Kualitas Pelayanan Kepuasan
PasienLoyalitas Pasien
Tangible Reliability Responsiveness Assurance Emphaty
Universitas Esa Unggul
106
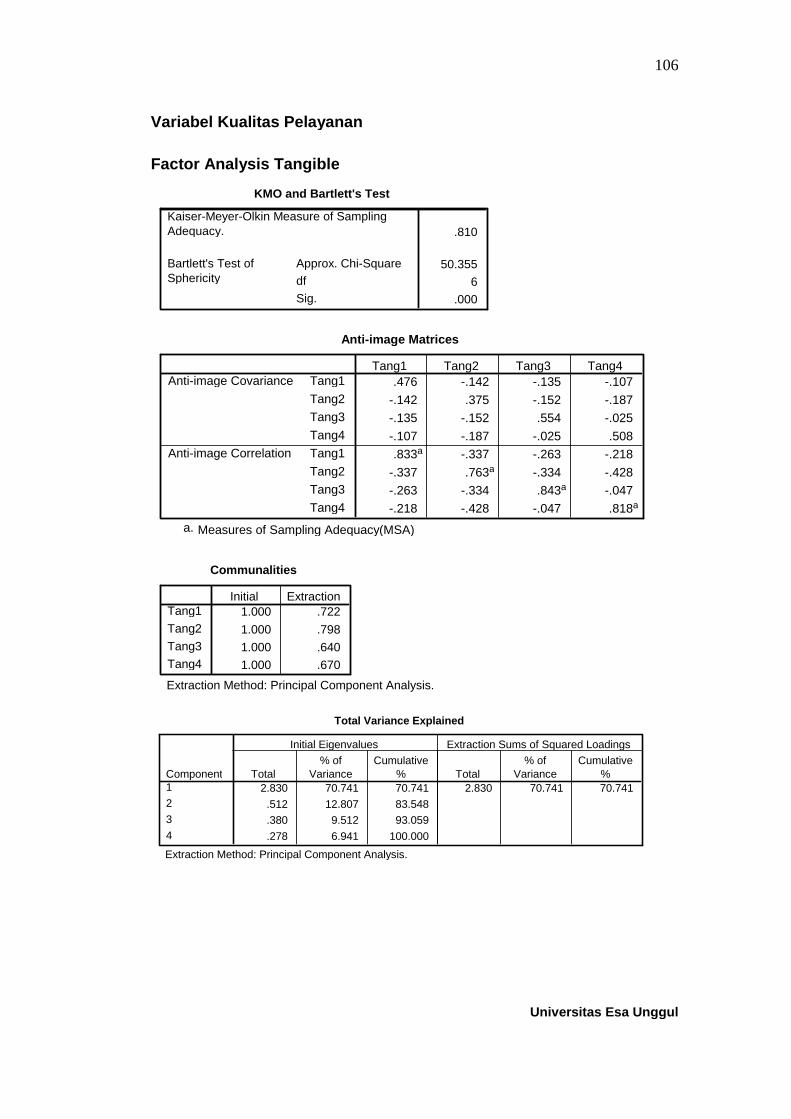
Variabel Kualitas Pelayanan
Factor Analysis Tangible
KMO and Bartlett's Test
.810
50.355
6
.000
Kaiser-Meyer-Olkin Measure of SamplingAdequacy.
Approx. Chi-Square
df
Sig.
Bartlett's Test ofSphericity
Anti-image Matrices
.476 -.142 -.135 -.107
-.142 .375 -.152 -.187
-.135 -.152 .554 -.025
-.107 -.187 -.025 .508
.833a -.337 -.263 -.218
-.337 .763a -.334 -.428
-.263 -.334 .843a -.047
-.218 -.428 -.047 .818a
Tang1
Tang2
Tang3
Tang4
Tang1
Tang2
Tang3
Tang4
Anti-image Covariance
Anti-image Correlation
Tang1 Tang2 Tang3 Tang4
Measures of Sampling Adequacy(MSA)a.
Communalities
1.000 .722
1.000 .798
1.000 .640
1.000 .670
Tang1
Tang2
Tang3
Tang4
Initial Extraction
Extraction Method: Principal Component Analysis.
Total Variance Explained
2.830 70.741 70.741 2.830 70.741 70.741
.512 12.807 83.548
.380 9.512 93.059
.278 6.941 100.000
Component1
2
3
4
Total% of
VarianceCumulative
% Total% of
VarianceCumulative
%
Initial Eigenvalues Extraction Sums of Squared Loadings
Extraction Method: Principal Component Analysis.
Universitas Esa Unggul
107
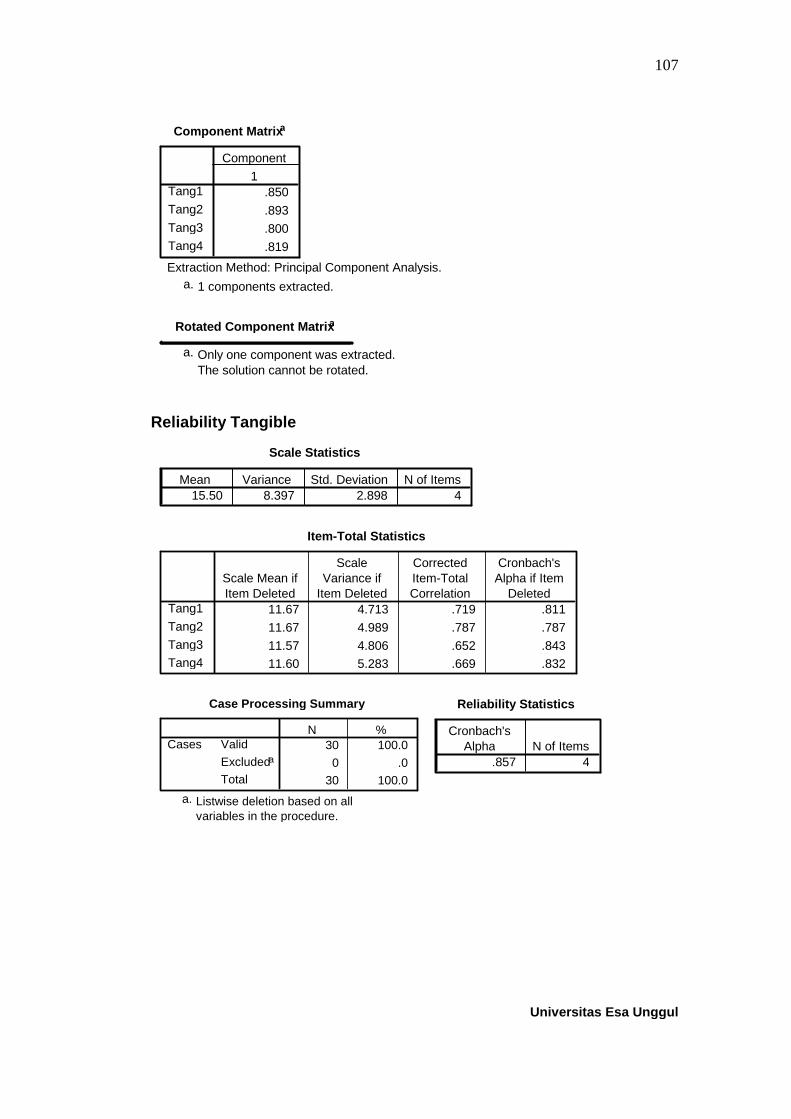
Reliability Statistics
.857 4
Cronbach'sAlpha N of Items
Component Matrixa
.850
.893
.800
.819
Tang1
Tang2
Tang3
Tang4
1
Component
Extraction Method: Principal Component Analysis.
1 components extracted.a.
Rotated Component Matrixa
Only one component was extracted.The solution cannot be rotated.
a.
Reliability Tangible
Scale Statistics
15.50 8.397 2.898 4
Mean Variance Std. Deviation N of Items
Item-Total Statistics
11.67 4.713 .719 .811
11.67 4.989 .787 .787
11.57 4.806 .652 .843
11.60 5.283 .669 .832
Tang1
Tang2
Tang3
Tang4
Scale Mean ifItem Deleted
ScaleVariance if
Item Deleted
CorrectedItem-TotalCorrelation
Cronbach'sAlpha if Item
Deleted
Case Processing Summary
30 100.0
0 .0
30 100.0
Valid
Excludeda
Total
CasesN %
Listwise deletion based on allvariables in the procedure.
a.

Universitas Esa Unggul
109
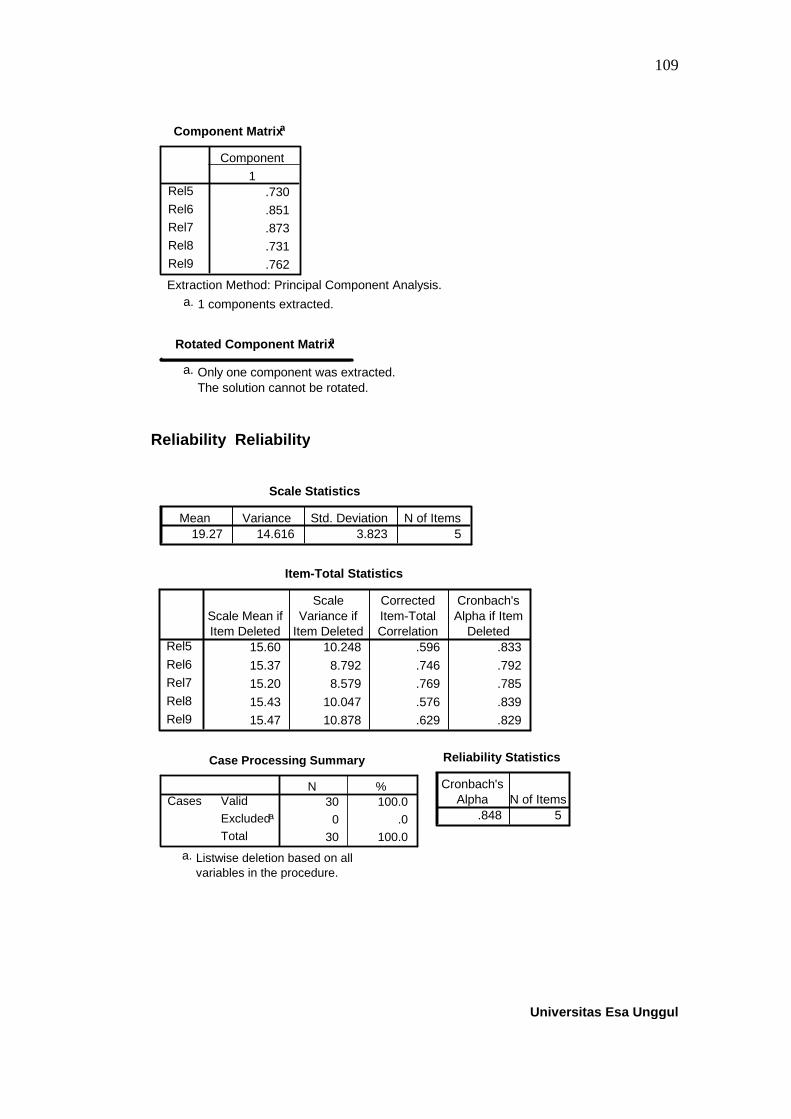
Reliability Statistics
.848 5
Cronbach'sAlpha N of Items
Component Matrixa
.730
.851
.873
.731
.762
Rel5
Rel6
Rel7
Rel8
Rel9
1
Component
Extraction Method: Principal Component Analysis.
1 components extracted.a.
Rotated Component Matrixa
Only one component was extracted.The solution cannot be rotated.
a.
Reliability Reliability
Scale Statistics
19.27 14.616 3.823 5
Mean Variance Std. Deviation N of Items
Item-Total Statistics
15.60 10.248 .596 .833
15.37 8.792 .746 .792
15.20 8.579 .769 .785
15.43 10.047 .576 .839
15.47 10.878 .629 .829
Rel5
Rel6
Rel7
Rel8
Rel9
Scale Mean ifItem Deleted
ScaleVariance if
Item Deleted
CorrectedItem-TotalCorrelation
Cronbach'sAlpha if Item
Deleted
Case Processing Summary
30 100.0
0 .0
30 100.0
Valid
Excludeda
Total
CasesN %
Listwise deletion based on allvariables in the procedure.
a.
Universitas Esa Unggul
110
Rotated Component Matrixa
Only one component was extracted.The solution cannot be rotated.
a.
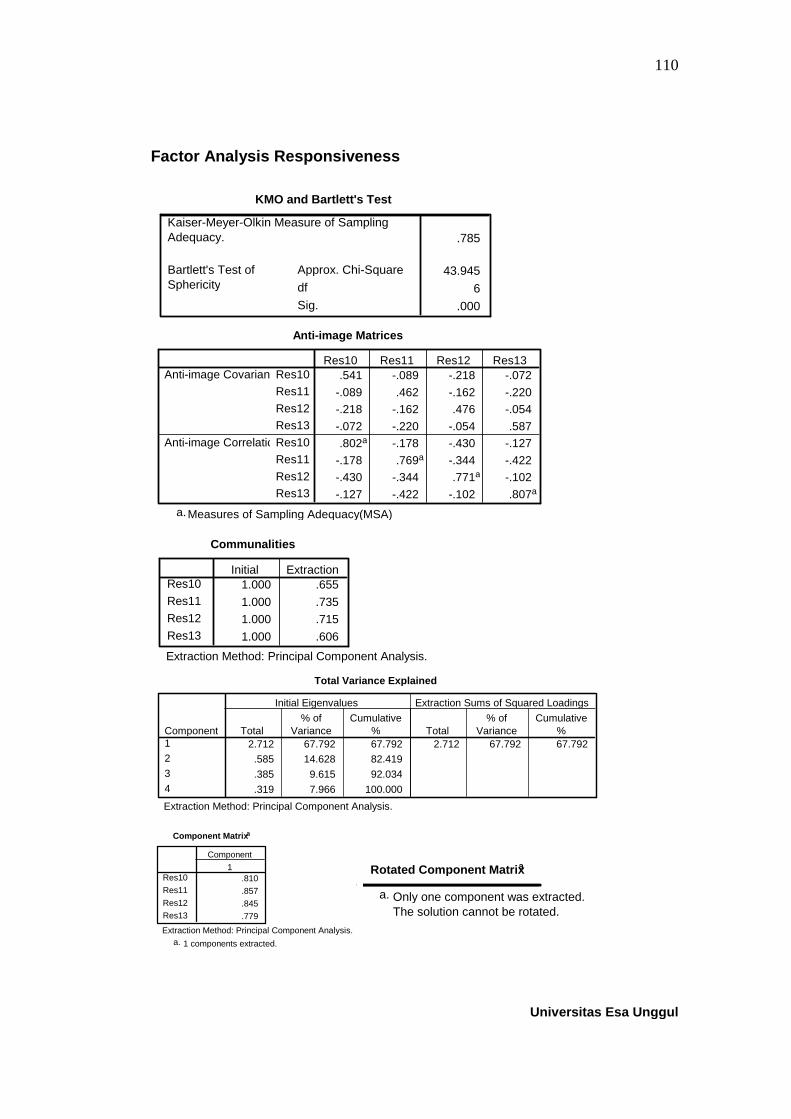
Factor Analysis Responsiveness
KMO and Bartlett's Test
.785
43.945
6
.000
Kaiser-Meyer-Olkin Measure of SamplingAdequacy.
Approx. Chi-Square
df
Sig.
Bartlett's Test ofSphericity
Anti-image Matrices
.541 -.089 -.218 -.072
-.089 .462 -.162 -.220
-.218 -.162 .476 -.054
-.072 -.220 -.054 .587
.802a -.178 -.430 -.127
-.178 .769a -.344 -.422
-.430 -.344 .771a -.102
-.127 -.422 -.102 .807a
Res10
Res11
Res12
Res13
Res10
Res11
Res12
Res13
Anti-image Covariance
Anti-image Correlation
Res10 Res11 Res12 Res13
Measures of Sampling Adequacy(MSA)a.
Communalities
1.000 .655
1.000 .735
1.000 .715
1.000 .606
Res10
Res11
Res12
Res13
Initial Extraction
Extraction Method: Principal Component Analysis.
Total Variance Explained
2.712 67.792 67.792 2.712 67.792 67.792
.585 14.628 82.419
.385 9.615 92.034
.319 7.966 100.000
Component1
2
3
4
Total% of
VarianceCumulative
% Total% of
VarianceCumulative
%
Initial Eigenvalues Extraction Sums of Squared Loadings
Extraction Method: Principal Component Analysis.
Component Matrixa
.810
.857
.845
.779
Res10
Res11
Res12
Res13
1
Component
Extraction Method: Principal Component Analysis.
1 components extracted.a.


Universitas Esa Unggul
112
Rotated Component Matrixa
Only one component was extracted.The solution cannot be rotated.
a.
Factor Analysis Assurance
KMO and Bartlett's Test
.810
61.053
6
.000
Kaiser-Meyer-Olkin Measure of SamplingAdequacy.
Approx. Chi-Square
df
Sig.
Bartlett's Test ofSphericity
Anti-image Matrices
.439 -.121 -.064 -.163
-.121 .411 -.184 -.016
-.064 -.184 .347 -.145
-.163 -.016 -.145 .439
.841a -.284 -.163 -.372
-.284 .803a -.487 -.037
-.163 -.487 .783a -.372
-.372 -.037 -.372 .821a
Ass14
Ass15
Ass16
Ass17
Ass14
Ass15
Ass16
Ass17
Anti-image Covariance
Anti-image Correlation
Ass14 Ass15 Ass16 Ass17
Measures of Sampling Adequacy(MSA)a.
Communalities
1.000 .737
1.000 .736
1.000 .798
1.000 .723
Ass14
Ass15
Ass16
Ass17
Initial Extraction
Extraction Method: Principal Component Analysis.
Total Variance Explained
2.995 74.877 74.877 2.995 74.877 74.877
.428 10.690 85.566
.344 8.605 94.172
.233 5.828 100.000
Component1
2
3
4
Total% of
VarianceCumulative
% Total% of
VarianceCumulative
%
Initial Eigenvalues Extraction Sums of Squared Loadings
Extraction Method: Principal Component Analysis.
Component Matrixa
.859
.858
.893
.850
Ass14
Ass15
Ass16
Ass17
1
Component
Extraction Method: Principal Component Analysis.
1 components extracted.a.

Universitas Esa Unggul
113
Reliability Statistics
.885 4
Cronbach'sAlpha N of Items
Reliability Assurance
Scale Statistics
16.23 8.392 2.897 4
Mean Variance Std. Deviation N of Items
Item-Total Statistics
12.23 4.944 .747 .853
12.07 4.961 .736 .857
12.13 5.085 .798 .837
12.27 4.616 .731 .863
Ass14
Ass15
Ass16
Ass17
Scale Mean ifItem Deleted
ScaleVariance if
Item Deleted
CorrectedItem-TotalCorrelation
Cronbach'sAlpha if Item
Deleted
Case Processing Summary
30 100.0
0 .0
30 100.0
Valid
Excludeda
Total
CasesN %
Listwise deletion based on allvariables in the procedure.
a.

Universitas Esa Unggul
114
Factor Analysis Emphaty
KMO and Bartlett's Test
.812
65.029
10
.000
Kaiser-Meyer-Olkin Measure of SamplingAdequacy.
Approx. Chi-Square
df
Sig.
Bartlett's Test ofSphericity
Anti-image Matrices
.363 -.140 -.194 .000 -.100
-.140 .402 -.103 -.130 -.049
-.194 -.103 .459 -.031 .036
.000 -.130 -.031 .540 -.232
-.100 -.049 .036 -.232 .567
.786a -.367 -.475 .001 -.220
-.367 .842a -.239 -.279 -.103
-.475 -.239 .808a -.063 .071
.001 -.279 -.063 .811a -.420
-.220 -.103 .071 -.420 .811a
Emp18
Emp19
Emp20
Emp21
Emp22
Emp18
Emp19
Emp20
Emp21
Emp22
Anti-image Covariance
Anti-image Correlation
Emp18 Emp19 Emp20 Emp21 Emp22
Measures of Sampling Adequacy(MSA)a.
Communalities
1.000 .741
1.000 .745
1.000 .623
1.000 .578
1.000 .542
Emp18
Emp19
Emp20
Emp21
Emp22
Initial Extraction
Extraction Method: Principal Component Analysis.
Total Variance Explained
3.228 64.560 64.560 3.228 64.560 64.560
.776 15.526 80.086
.416 8.316 88.402
.330 6.593 94.995
.250 5.005 100.000
Component1
2
3
4
5
Total% of
VarianceCumulative
% Total% of
VarianceCumulative
%
Initial Eigenvalues Extraction Sums of Squared Loadings
Extraction Method: Principal Component Analysis.

Universitas Esa Unggul
115
Reliability Statistics
.861 5
Cronbach'sAlpha N of Items
Component Matrixa
.861
.863
.789
.760
.736
Emp18
Emp19
Emp20
Emp21
Emp22
1
Component
Extraction Method: Principal Component Analysis.
1 components extracted.a.
Rotated Component Matrixa
Only one component was extracted.The solution cannot be rotated.
a.
Reliability Emphaty
Scale Statistics
19.53 12.878 3.589 5
Mean Variance Std. Deviation N of Items
Item-Total Statistics
15.60 8.110 .763 .810
15.60 8.110 .763 .810
15.73 8.133 .660 .839
15.63 8.999 .625 .845
15.57 9.289 .596 .852
Emp18
Emp19
Emp20
Emp21
Emp22
Scale Mean ifItem Deleted
ScaleVariance if
Item Deleted
CorrectedItem-TotalCorrelation
Cronbach'sAlpha if Item
Deleted
Case Processing Summary
30 100.0
0 .0
30 100.0
Valid
Excludeda
Total
CasesN %
Listwise deletion based on allvariables in the procedure.
a.

Universitas Esa Unggul
116
Rotated Component Matrixa
Only one component was extracted.The solution cannot be rotated.
a.
Variabel Kepuasan Pasien
Factor Analysis Kepuasan Pasien
KMO and Bartlett's Test
.695
21.215
3
.000
Kaiser-Meyer-Olkin Measure of SamplingAdequacy.
Approx. Chi-Square
df
Sig.
Bartlett's Test ofSphericity
Anti-image Matrices
.659 -.233 -.175
-.233 .599 -.246
-.175 -.246 .645
.716a -.370 -.268
-.370 .670a -.395
-.268 -.395 .703a
KP1
KP2
KP3
KP1
KP2
KP3
Anti-image Covariance
Anti-image Correlation
KP1 KP2 KP3
Measures of Sampling Adequacy(MSA)a.
Communalities
1.000 .660
1.000 .718
1.000 .673
KP1
KP2
KP3
Initial Extraction
Extraction Method: Principal Component Analysis.
Total Variance Explained
2.051 68.382 68.382 2.051 68.382 68.382
.515 17.174 85.556
.433 14.444 100.000
Component1
2
3
Total% of
VarianceCumulative
% Total% of
VarianceCumulative
%
Initial Eigenvalues Extraction Sums of Squared Loadings
Extraction Method: Principal Component Analysis.
Component Matrixa
.813
.847
.821
KP1
KP2
KP3
1
Component
Extraction Method: Principal Component Analysis.
1 components extracted.a.

Universitas Esa Unggul
117
Reliability Statistics
.767 3
Cronbach'sAlpha N of Items
Reliability Kepuasan Pasien
Scale Statistics
12.60 4.386 2.094 3
Mean Variance Std. Deviation N of Items
Item-Total Statistics
8.40 2.317 .580 .710
8.33 2.161 .633 .651
8.47 2.051 .592 .700
KP1
KP2
KP3
Scale Mean ifItem Deleted
ScaleVariance if
Item Deleted
CorrectedItem-TotalCorrelation
Cronbach'sAlpha if Item
Deleted
Case Processing Summary
30 100.0
0 .0
30 100.0
Valid
Excludeda
Total
CasesN %
Listwise deletion based on allvariables in the procedure.
a.

Universitas Esa Unggul
118
Variabel Loyalitas Pasien
Factor Analysis Loyalitas Pasien
KMO and Bartlett's Test
.882
221.009
36
.000
Kaiser-Meyer-Olkin Measure of SamplingAdequacy.
Approx. Chi-Square
df
Sig.
Bartlett's Test ofSphericity
Anti-image Matrices
.131 -.076 -.045 .032 -.059 -.047 .015 -.011 -.107
-.076 .319 .003 -.062 .018 .021 -.009 -.032 .002
-.045 .003 .179 -.093 .055 -.040 .005 -.056 -.009
.032 -.062 -.093 .164 -.106 -.022 -.079 .067 .002
-.059 .018 .055 -.106 .226 -.060 .019 -.004 .008
-.047 .021 -.040 -.022 -.060 .254 .014 -.078 .065
.015 -.009 .005 -.079 .019 .014 .449 -.156 -.050
-.011 -.032 -.056 .067 -.004 -.078 -.156 .326 -.053
-.107 .002 -.009 .002 .008 .065 -.050 -.053 .324
.858a -.373 -.295 .217 -.345 -.259 .063 -.052 -.519
-.373 .939a .011 -.272 .068 .075 -.024 -.099 .006
-.295 .011 .885a -.543 .275 -.188 .019 -.234 -.036
.217 -.272 -.543 .810a -.550 -.107 -.290 .292 .011
-.345 .068 .275 -.550 .865a -.251 .059 -.017 .029
-.259 .075 -.188 -.107 -.251 .925a .043 -.271 .228
.063 -.024 .019 -.290 .059 .043 .907a -.407 -.132
-.052 -.099 -.234 .292 -.017 -.271 -.407 .885a -.162
-.519 .006 -.036 .011 .029 .228 -.132 -.162 .893a
LP1
LP2
LP3
LP4
LP5
LP6
LP7
LP8
LP9
LP1
LP2
LP3
LP4
LP5
LP6
LP7
LP8
LP9
Anti-im
age
Cova
riance
Anti-im
age
Corr
ela
tion
LP
1
LP
2
LP
3
LP
4
LP
5
LP
6
LP
7
LP
8
LP
9
Measures of Sampling Adequacy(MSA)a.
Communalities
1.000 .850
1.000 .709
1.000 .819
1.000 .740
1.000 .708
1.000 .742
1.000 .543
1.000 .634
1.000 .610
LP1
LP2
LP3
LP4
LP5
LP6
LP7
LP8
LP9
Initial Extraction
Extraction Method: Principal Component Analysis.

Universitas Esa Unggul
119
Total Variance Explained
6.355 70.608 70.608 6.355 70.608 70.608
.719 7.987 78.594
.544 6.041 84.636
.410 4.551 89.187
.324 3.595 92.781
.261 2.902 95.683
.186 2.071 97.754
.126 1.402 99.156
.076 .844 100.000
Component1
2
3
4
5
6
7
8
9
Total% of
VarianceCumulative
% Total% of
VarianceCumulative
%
Initial Eigenvalues Extraction Sums of Squared Loadings
Extraction Method: Principal Component Analysis.
Component Matrixa
.922
.842
.905
.860
.841
.861
.737
.796
.781
LP1
LP2
LP3
LP4
LP5
LP6
LP7
LP8
LP9
1
Component
Extraction Method: Principal Component Analysis.
1 components extracted.a.
Rotated Component Matrix a
Only one component was extracted.The solution cannot be rotated.
a.

Universitas Esa Unggul
120
Reliability Statistics
.947 9
Cronbach'sAlpha N of Items
Reliability Loyalitas Pasien
Scale Statistics
37.90 46.231 6.799 9
Mean Variance Std. Deviation N of Items
Item-Total Statistics
33.83 35.316 .893 .934
33.77 37.564 .796 .940
33.60 35.834 .872 .936
33.67 35.471 .813 .939
33.60 37.007 .792 .940
33.53 37.499 .816 .939
33.70 37.666 .679 .946
33.77 37.633 .744 .943
33.73 36.961 .724 .944
LP1
LP2
LP3
LP4
LP5
LP6
LP7
LP8
LP9
Scale Mean ifItem Deleted
ScaleVariance if
Item Deleted
CorrectedItem-TotalCorrelation
Cronbach'sAlpha if Item
Deleted
Case Processing Summary
30 100.0
0 .0
30 100.0
Valid
Excludeda
Total
CasesN %
Listwise deletion based on allvariables in the procedure.
a.

Universitas Esa Unggul
121
Lampiran 3: Uji ANOVA
Frequency Table Identitas Responden


Universitas Esa Unggul
123
Oneway

Universitas Esa Unggul
124
Post Hoc Tests
Homogeneous Subsets

Universitas Esa Unggul
125

Universitas Esa Unggul
126

Universitas Esa Unggul
127
Oneway

Universitas Esa Unggul
128
Post Hoc Tests
Homogeneous Subsets

Universitas Esa Unggul
129

Universitas Esa Unggul
130

Universitas Esa Unggul
131
Oneway

Universitas Esa Unggul
132
Post Hoc Tests
Homogeneous Subsets

Universitas Esa Unggul
133

Universitas Esa Unggul
134

Universitas Esa Unggul
135
1 2 3 4 5 6 7 8 9 10 11 12 13 14 15 16 17 18 19 20 21 22 1 2 3 1 2 3 4 5 6 7 8 9
R1 4 4 4 4 3 4 4 4 5 4 4 3 3 3 3 3 3 3 3 3 4 4 2 2 2 4 4 4 4 4 4 4 4 4
R2 4 4 4 4 4 4 4 4 4 4 4 4 4 4 4 4 4 4 4 4 4 4 4 4 4 5 5 5 5 5 5 5 5 5
R3 4 4 4 4 4 4 4 4 4 4 4 4 4 4 4 4 4 4 4 4 1 1 4 4 4 3 3 2 3 3 2 2 3 4
R4 3 3 2 4 4 4 3 4 4 5 4 2 2 3 3 3 3 3 3 3 1 1 4 4 4 3 4 3 4 3 3 4 3 4
R5 2 2 2 2 2 2 2 2 2 2 2 2 2 2 2 2 2 2 2 2 4 4 1 1 1 1 1 1 1 1 1 1 1 1
R6 3 4 5 4 3 3 3 3 3 3 3 2 2 2 3 3 3 3 4 3 3 3 1 1 1 5 4 4 4 3 4 3 4 4
R7 4 4 4 4 4 4 4 4 4 4 4 4 4 4 4 4 4 4 4 4 2 2 1 1 1 4 4 4 4 3 4 3 4 3
R8 4 4 4 4 4 4 4 4 4 4 4 4 4 5 5 5 5 5 5 5 2 2 1 1 1 4 2 4 3 3 4 4 4 3
R9 4 4 4 4 3 3 3 3 3 3 3 2 4 2 4 4 4 1 3 3 3 3 4 4 4 4 4 4 4 4 4 4 4 4
R10 4 4 4 4 4 4 5 5 3 3 4 4 4 3 3 3 3 3 3 3 4 4 1 1 1 1 1 1 1 1 1 1 1 1
R11 4 4 4 4 4 4 5 5 3 3 4 4 4 3 3 2 3 3 3 4 3 3 1 1 1 4 4 3 3 4 4 3 5 5
R12 4 4 4 4 4 4 4 4 4 4 4 4 4 4 4 4 4 4 4 4 5 5 4 4 4 5 5 4 4 4 4 4 4 3
R13 3 4 5 4 3 3 3 2 2 4 4 4 4 4 4 4 4 4 4 4 4 4 5 5 5 4 5 2 5 2 5 2 5 3
R14 2 2 2 2 3 3 2 4 4 3 2 3 3 2 2 2 2 2 2 2 2 2 2 2 4 4 4 4 4 4 4 2 4 4
R15 4 4 4 4 4 4 4 4 4 4 4 4 4 4 4 4 4 4 4 4 2 2 2 2 4 4 4 4 4 2 4 4 4 4
R16 2 2 2 2 2 2 2 2 2 2 2 2 2 2 2 2 2 2 2 2 5 5 4 2 2 4 3 4 3 3 3 2 4 5
R17 2 2 2 2 2 2 2 2 2 2 2 2 2 2 2 2 2 2 2 2 2 2 2 2 2 1 1 1 1 1 1 1 1 1
R18 5 5 5 5 2 2 2 2 2 2 2 5 5 5 5 5 5 5 5 5 2 2 2 2 2 5 1 1 1 1 1 1 1 1
R19 4 4 4 4 4 4 3 4 4 4 5 4 4 2 2 2 2 2 2 2 2 2 2 2 2 4 4 4 4 3 4 4 4 4
R20 4 5 4 3 4 4 3 4 4 4 5 4 4 2 2 2 2 2 2 2 2 2 2 2 2 4 3 4 3 3 5 3 4 3
R21 4 4 4 4 4 4 4 4 4 4 4 4 4 4 4 4 4 4 4 4 5 5 4 3 4 4 4 4 3 3 5 4 4 4
R22 5 5 5 5 5 5 5 5 5 5 5 5 5 5 5 5 5 5 5 5 5 5 5 4 5 4 4 4 4 4 4 4 4 4
R23 5 5 5 5 5 5 5 5 5 5 5 5 5 5 5 5 5 5 5 5 4 4 4 4 5 4 4 4 4 4 4 4 4 4
R24 5 5 5 5 5 5 5 5 5 5 5 5 5 5 5 5 5 5 5 5 5 5 4 4 4 1 4 3 3 4 3 3 2 2
R25 1 1 1 1 1 1 1 1 1 1 1 1 1 1 1 1 1 1 1 1 1 1 5 5 5 5 5 5 5 5 5 5 5 5
R26 5 5 5 5 3 3 3 3 3 3 3 3 3 3 3 3 3 3 3 3 4 4 1 1 1 4 4 5 5 5 5 2 2 4
R27 3 3 3 3 4 4 4 4 4 4 4 3 3 4 4 2 2 3 3 3 4 4 4 4 4 3 4 4 4 2 4 2 2 3
R28 4 4 4 4 3 3 3 3 3 3 3 3 3 3 3 3 3 3 3 3 3 3 3 4 4 4 4 4 4 2 4 5 4 4
R29 4 4 4 4 4 4 4 4 4 4 4 4 4 5 5 5 5 5 5 5 4 4 2 2 2 4 4 4 4 3 3 4 3 2
R30 5 5 5 5 3 3 5 4 4 4 5 5 5 5 5 5 5 5 5 5 4 4 5 5 5 3 4 2 4 3 4 4 3 4
R31 4 4 4 4 4 4 4 4 4 4 4 5 5 4 4 4 4 4 4 4 5 5 4 4 5 5 3 4 3 3 3 3 4 3
R32 3 3 3 3 3 3 3 3 3 3 3 3 3 3 3 3 3 3 3 3 3 3 4 4 4 4 4 3 4 3 3 4 4 2
R33 5 5 5 5 5 5 5 5 5 5 5 5 5 5 5 5 5 5 5 5 5 5 5 5 5 4 5 3 3 4 4 4 3 5
R34 4 4 4 4 4 4 4 4 4 4 4 4 4 5 5 5 5 5 5 5 2 2 5 5 5 5 5 5 5 5 5 5 5 5
R35 4 4 4 4 4 4 4 4 4 4 4 4 4 4 4 4 4 4 4 4 2 2 4 3 3 5 5 4 4 4 3 3 3 4
R36 3 3 3 3 3 3 3 3 3 3 3 4 4 3 3 3 3 3 3 3 2 2 4 4 4 4 5 2 3 3 3 4 4 3
R37 2 2 2 2 2 2 2 2 2 2 2 2 2 2 2 2 2 2 2 2 2 2 4 5 4 3 3 3 3 3 3 3 3 3
R38 5 5 5 5 4 4 4 4 4 4 4 4 4 5 5 5 5 5 5 5 2 2 5 5 4 3 4 3 3 5 4 3 3 3
R39 4 4 4 4 4 4 4 4 4 4 4 4 4 4 4 4 4 4 4 4 5 5 5 5 5 3 3 3 2 3 3 3 3 4
R40 4 4 4 4 4 4 4 4 4 4 4 4 4 4 4 4 4 4 4 4 4 4 5 4 4 3 3 3 4 5 5 5 5 1
R41 4 4 4 4 4 4 4 4 4 4 4 3 3 4 4 4 4 4 4 4 3 3 5 5 4 2 3 3 3 2 3 3 4 3
R42 5 5 5 5 5 5 5 5 5 5 5 5 5 4 4 4 4 4 4 4 4 4 2 2 2 4 3 4 3 4 4 3 4 3
R43 5 5 5 5 4 4 4 4 4 4 4 4 4 5 5 5 5 5 5 5 4 4 5 5 5 1 3 4 4 3 3 2 5 3
R44 4 4 4 4 4 4 4 4 4 4 4 4 4 4 4 4 4 4 4 4 4 4 4 4 4 3 3 5 2 4 5 4 2 3
R45 4 4 4 4 4 4 4 4 4 4 4 4 4 4 4 4 4 4 4 4 3 3 5 5 5 4 4 2 4 3 3 4 3 2
R46 5 5 5 5 3 3 3 3 3 3 3 3 3 4 4 4 4 4 4 4 4 4 5 5 5 3 3 4 3 4 4 3 3 2
R47 4 4 3 4 4 4 3 4 3 3 3 3 4 4 4 4 2 2 4 3 4 4 4 4 4 1 2 2 3 2 3 2 2 4
R48 4 4 4 4 2 2 2 2 2 2 2 2 2 4 4 4 4 4 4 4 2 2 3 2 3 2 2 3 4 2 4 4 3 4
R49 1 1 1 1 1 1 1 1 1 1 1 2 2 2 2 2 2 2 2 2 1 1 2 2 2 2 2 2 2 2 2 2 2 2
R50 4 4 4 4 4 4 4 4 4 4 4 4 4 4 4 4 4 4 4 4 4 4 3 3 4 5 5 4 4 3 3 4 2 3
TABULASI DATA MENTAH KUESIONER
No
Service Quality Kepuasan
PasienLoyalitas Pasien
Tangible Reliability Responsivene Assurance Emphaty
Lampiran 4: Hasil Kuesioner

Universitas Esa Unggul
136
Lampiran 4: Hasil Kuesioner
1 2 3 4 5 6 7 8 9 10 11 12 13 14 15 16 17 18 19 20 21 22 1 2 3 1 2 3 4 5 6 7 8 9
R51 4 4 4 4 4 4 4 4 4 4 4 4 4 4 4 4 4 4 4 4 4 4 4 4 4 3 3 2 2 3 4 3 3 4
R52 4 4 4 4 4 4 4 4 4 4 4 4 4 4 4 4 4 4 4 4 4 4 4 4 4 1 2 3 4 3 3 4 3 5
R53 4 4 4 4 3 4 3 3 3 3 2 4 4 4 4 4 4 4 4 4 2 2 4 4 4 3 3 4 3 4 3 3 2 4
R54 5 5 5 5 5 5 5 5 5 5 5 4 4 4 4 4 4 4 4 4 2 2 5 5 5 2 4 1 4 2 5 5 5 5
R55 4 4 4 4 4 4 4 4 4 4 4 4 4 4 4 4 4 4 4 4 4 4 4 3 5 3 3 3 2 3 3 4 3 4
R56 2 2 2 2 2 2 2 2 2 2 2 2 2 2 2 2 2 2 2 2 4 4 4 4 4 4 4 3 2 3 4 5 4 4
R57 4 4 4 4 4 4 4 4 4 4 4 4 4 3 3 3 3 3 3 3 3 3 4 3 4 4 3 2 4 3 4 4 2 4
R58 5 5 5 5 5 5 5 5 5 5 5 5 5 5 5 5 5 5 5 5 5 5 5 5 5 3 4 2 4 2 4 4 3 4
R59 5 5 5 5 4 4 4 4 4 4 4 4 4 5 5 5 5 5 5 5 4 4 4 4 4 3 2 3 2 1 3 4 2 4
R60 4 4 4 4 4 4 4 4 4 4 4 4 4 4 4 4 4 4 4 4 4 4 4 4 4 3 2 4 4 3 2 3 2 3
R61 5 5 5 5 5 5 5 5 5 5 5 5 5 5 5 5 5 5 5 5 2 2 3 3 3 2 3 2 3 2 3 4 2 4
R62 2 2 2 2 2 2 2 2 2 2 2 2 2 2 2 2 2 2 2 2 4 4 5 5 5 2 5 1 2 4 1 4 1 4
R63 1 1 1 1 1 1 1 1 1 1 1 1 1 1 1 1 1 1 1 1 1 1 2 2 5 3 3 3 4 3 2 3 3 4
R64 1 1 1 1 1 1 1 1 1 1 1 1 1 1 1 1 1 1 1 1 1 1 1 1 2 3 4 4 2 3 3 3 2 3
R65 4 4 4 4 4 4 4 4 4 4 4 4 4 3 3 3 3 3 3 3 1 1 4 4 4 4 4 1 3 2 3 5 1 5
R66 1 1 1 1 1 1 1 1 1 1 1 1 1 1 1 1 1 1 1 1 4 4 1 4 4 2 5 2 3 4 4 4 4 4
R67 3 3 3 3 3 3 3 3 3 3 3 3 3 3 3 3 3 3 3 3 3 3 3 3 3 2 5 2 2 4 4 2 3 5
R68 3 3 3 3 3 3 3 3 3 3 3 3 3 3 3 3 3 3 3 3 4 4 4 4 4 1 3 2 3 2 4 4 2 4
R69 3 3 3 3 3 3 3 3 3 3 3 3 3 3 3 3 3 3 3 3 3 3 3 3 3 2 3 4 2 4 3 5 5 4
R70 3 3 3 3 3 3 3 3 3 3 3 3 3 3 3 3 3 3 3 3 3 3 3 3 3 3 3 2 4 3 4 3 1 3
R71 3 3 3 3 3 3 3 3 3 3 3 3 3 3 3 3 3 3 3 3 3 3 4 4 4 1 2 4 4 3 5 4 2 3
R72 3 3 3 3 3 3 3 3 3 3 3 3 3 3 3 3 3 3 3 3 3 3 3 3 3 3 4 2 3 3 3 5 1 4
R73 4 4 4 4 3 3 3 3 3 3 3 4 4 5 5 5 5 5 5 5 5 5 4 4 5 2 4 2 5 3 4 4 3 4
R74 4 4 4 4 4 4 4 4 4 4 4 3 3 4 4 4 4 4 4 4 4 4 4 4 4 3 4 2 3 5 3 4 3 4
R75 4 4 4 4 3 3 3 3 3 3 3 3 3 4 4 4 4 4 4 4 4 4 1 1 5 4 3 1 4 3 4 4 3 4
R76 4 4 4 4 4 4 4 4 4 4 4 4 4 4 4 4 4 4 4 4 4 4 4 5 5 2 3 3 4 4 4 5 4 4
R77 4 4 4 4 4 4 4 4 4 4 4 4 4 4 4 4 4 4 4 4 4 4 4 4 4 4 3 4 3 4 4 4 4 5
R78 5 5 5 5 4 4 4 4 4 4 4 5 5 4 4 4 4 4 4 4 3 3 4 4 4 5 3 4 3 5 4 5 5 5
R79 5 5 5 5 4 4 4 4 4 4 4 5 5 4 4 4 4 4 4 4 4 4 5 4 5 5 4 5 5 5 4 5 4 5
R80 4 4 4 4 4 4 4 4 4 4 4 4 4 4 4 4 4 4 4 4 4 4 5 5 5 4 5 5 4 5 5 4 5 5
R81 4 4 4 4 4 4 4 4 4 4 4 4 4 4 4 4 4 4 4 4 4 4 4 5 4 4 3 4 4 4 4 3 3 5
R82 5 5 5 5 5 5 5 5 5 5 5 4 4 4 4 4 4 4 4 4 4 4 5 5 4 3 3 4 3 5 5 5 5 5
R83 4 4 4 4 4 4 4 4 4 4 4 4 4 4 4 4 4 4 4 4 4 4 5 4 5 5 5 5 5 5 5 5 5 5
R84 4 4 4 4 4 4 4 4 4 4 4 4 4 3 3 3 3 3 3 3 4 4 4 4 4 3 3 3 5 4 3 5 4 5
R85 4 4 4 4 4 4 4 4 4 4 4 4 4 4 4 4 4 4 4 4 3 3 4 4 5 4 3 4 4 4 4 4 4 4
R86 4 4 4 4 5 5 5 5 5 5 5 5 5 5 5 5 5 5 5 5 4 4 5 5 4 4 4 3 3 5 5 5 4 5
R87 4 4 4 4 3 3 3 3 3 3 3 4 4 4 4 4 4 4 4 4 3 3 3 4 4 5 5 4 4 5 4 5 4 5
R88 4 4 4 4 4 4 4 4 4 4 4 4 4 4 4 4 4 4 4 4 3 3 4 5 3 5 5 5 5 5 5 5 5 5
R89 4 4 4 4 4 4 4 4 4 4 4 4 4 4 5 5 5 5 5 5 5 5 4 5 4 5 5 4 4 5 5 4 5 5
R90 4 4 4 4 4 4 4 4 4 4 4 5 5 4 4 4 4 4 4 4 4 4 4 4 5 5 5 5 5 5 5 5 5 5
R91 1 1 1 1 1 1 1 1 1 1 1 1 1 1 1 1 1 1 1 1 1 1 1 1 1 4 4 4 4 4 4 4 4 4
R92 4 4 4 4 4 4 4 4 4 4 4 4 4 4 4 4 4 4 4 4 4 4 4 3 3 4 3 3 3 2 2 3 2 2
R93 5 5 5 5 4 4 4 4 4 4 4 4 4 5 5 5 5 5 5 5 4 4 4 3 5 4 3 4 4 4 4 4 4 4
R94 4 4 4 4 4 4 4 4 4 4 4 4 4 4 4 4 4 4 4 4 4 4 3 4 4 5 4 5 4 4 4 4 5 5
R95 4 4 4 4 4 4 4 4 4 4 4 4 4 4 4 4 4 4 4 4 4 4 3 4 4 4 4 4 4 5 5 4 5 5
R96 4 4 4 4 4 4 4 4 4 4 4 4 4 4 4 4 4 4 4 4 3 3 4 3 3 4 4 3 3 4 4 3 3 4
R97 5 5 5 5 5 5 5 5 5 5 5 5 5 5 5 5 5 5 5 5 5 5 5 5 5 5 3 3 3 4 4 4 4 4
R98 5 5 5 5 4 4 4 4 4 4 4 4 4 5 5 5 5 5 5 5 5 5 5 4 4 4 5 5 4 5 3 5 2 3
R99 4 4 4 4 4 4 4 4 4 4 4 4 4 5 5 5 5 5 5 5 4 4 5 3 3 3 4 3 4 5 4 4 5 5
R100 5 5 5 5 5 5 5 5 5 5 5 5 5 4 4 4 4 4 4 4 4 4 4 4 3 5 3 4 4 4 3 4 4 5
TABULASI DATA MENTAH KUESIONER
No
Service Quality Kepuasan
PasienLoyalitas Pasien
Tangible Reliability Responsivene Assurance Emphaty

Universitas Esa Unggul
137
Lampiran 4: Hasil Kuesioner
1 2 3 4 5 6 7 8 9 10 11 12 13 14 15 16 17 18 19 20 21 22 1 2 3 1 2 3 4 5 6 7 8 9
R101 3 4 5 4 2 4 4 4 4 4 4 4 2 4 4 4 4 1 4 4 4 3 4 4 4 4 4 3 3 5 4 4 4 5
R102 4 4 3 4 4 3 3 3 3 3 5 4 2 4 4 4 4 1 4 2 2 4 3 4 4 5 5 4 4 4 4 5 4 5
R103 4 4 4 4 4 5 4 2 4 4 3 4 4 3 3 3 3 3 3 3 3 4 3 4 4 5 3 3 5 4 5 5 5 5
R104 3 4 5 4 2 4 4 2 4 4 4 4 4 3 3 4 4 3 1 1 2 4 4 5 5 5 3 4 3 5 3 5 4 5
R105 4 4 3 4 4 5 4 2 4 4 5 4 2 2 3 3 3 2 4 3 3 3 4 5 5 5 3 3 5 5 4 5 3 5
R106 4 4 4 4 2 3 4 4 3 3 3 4 4 4 4 4 2 2 4 4 4 4 5 4 4 5 4 5 5 5 5 4 4 5
R107 3 4 5 4 2 4 4 4 3 3 4 4 4 4 4 4 4 2 4 4 4 4 4 4 4 4 3 3 3 4 4 4 4 5
R108 4 4 4 4 2 3 3 3 3 3 3 3 3 3 3 3 4 1 4 3 3 3 4 4 3 4 4 4 3 4 5 4 5 4
R109 3 4 5 4 2 4 4 2 2 3 2 5 4 4 3 4 3 3 4 4 4 3 5 4 3 2 1 1 3 2 1 1 2 1
R110 4 4 3 4 4 5 4 2 4 4 2 3 3 4 3 3 4 3 4 2 2 4 4 4 3 5 5 5 4 5 3 4 5 5
R111 4 4 4 4 4 3 4 3 4 4 4 4 2 4 4 4 3 2 3 3 3 4 3 3 3 3 3 3 3 3 3 3 4 5
R112 3 3 3 3 3 3 4 4 3 3 5 4 2 4 4 4 5 3 3 3 3 3 3 3 3 4 4 4 4 4 4 4 4 5
R113 4 4 4 4 2 4 4 4 4 3 4 4 2 3 3 4 3 1 1 1 2 4 4 3 3 3 2 2 2 2 2 2 2 5
R114 3 4 5 4 2 3 4 4 4 3 5 4 2 2 3 3 4 3 4 3 3 3 5 4 3 4 4 3 4 4 3 3 4 5
R115 3 3 3 4 3 4 4 4 4 3 3 4 4 4 4 4 4 3 4 4 4 4 4 4 4 4 3 4 3 4 3 3 5 4
R116 3 3 2 3 3 5 4 2 4 4 4 4 4 4 4 4 4 2 4 4 4 4 3 3 3 4 3 3 5 5 4 3 5 5
R117 2 2 2 2 2 2 2 2 2 2 2 2 2 2 2 2 2 2 2 2 2 2 5 5 5 3 3 4 4 5 4 3 2 2
R118 3 4 5 4 2 3 4 4 4 4 5 4 2 3 3 3 4 2 4 4 4 3 4 5 5 3 4 3 5 4 4 4 5 5
R119 4 4 4 4 2 4 4 4 3 3 4 4 2 3 3 4 4 4 4 2 2 4 4 5 5 5 5 3 3 4 5 4 3 5
R120 3 4 5 4 2 3 3 3 3 3 5 4 2 2 3 3 3 3 3 3 3 4 4 4 4 5 5 3 3 5 5 4 4 5
R121 4 4 3 4 4 4 4 2 4 3 3 4 4 4 4 4 4 3 3 3 3 3 3 4 4 4 3 4 3 4 4 3 3 3
R122 4 4 4 4 4 2 5 4 4 4 4 4 4 4 4 4 4 3 4 4 4 3 4 5 5 5 4 5 5 5 5 5 4 5
R123 3 3 3 3 3 2 3 3 4 4 3 3 3 4 4 4 4 3 4 2 2 4 4 4 5 4 4 4 4 3 4 4 4 5
R124 4 4 4 4 2 4 4 2 3 3 4 4 2 3 3 3 4 4 3 3 3 4 5 4 4 5 4 5 4 5 5 5 4 5
R125 3 4 5 4 2 5 4 2 3 3 2 5 4 4 4 4 4 4 3 3 3 3 4 4 4 5 5 5 5 5 5 3 5 5
R126 4 4 4 4 4 3 4 4 4 4 4 3 3 3 3 4 4 4 4 4 4 4 4 4 4 5 5 5 5 5 5 5 5 5
R127 5 5 4 4 4 5 5 5 5 5 5 4 4 4 2 5 4 5 5 4 4 5 5 5 5 5 4 5 5 5 4 5 3 5
R128 4 5 5 5 4 5 5 4 4 5 4 4 5 5 4 5 4 4 4 5 4 5 4 5 5 4 1 3 3 4 4 4 4 4
R129 4 4 4 4 4 4 4 4 4 4 4 4 4 4 4 4 4 4 4 4 4 4 4 4 4 5 4 5 3 5 4 5 4 5
R130 4 4 4 3 4 5 4 4 4 4 4 5 4 4 4 5 3 4 4 4 3 4 4 5 4 3 3 3 3 3 3 3 3 5
R131 5 5 5 5 5 5 4 5 5 5 5 5 5 5 4 5 4 4 5 5 4 5 4 5 5 3 4 4 4 4 4 4 4 4
R132 5 5 4 4 4 5 5 5 5 5 5 4 5 5 4 5 5 5 5 4 4 4 5 5 4 5 4 4 4 5 5 4 5 5
R133 4 4 4 4 4 4 4 4 4 4 4 3 4 4 3 4 4 3 4 3 4 4 4 4 4 5 5 3 5 5 5 3 5 5
R134 2 4 4 4 4 4 4 4 5 4 4 4 4 4 4 5 5 4 4 4 4 4 4 4 4 5 5 3 4 5 4 4 5 5
R135 2 4 4 4 2 5 4 4 4 4 4 4 4 4 4 4 4 4 4 4 4 4 4 4 4 4 4 5 4 5 5 5 5 5
R136 2 5 5 5 5 5 5 5 5 5 5 5 5 2 5 5 5 5 5 5 5 5 5 5 5 4 4 5 4 5 5 5 5 5
R137 2 5 4 4 4 5 3 4 4 4 4 4 4 3 4 4 4 4 4 4 4 4 4 4 4 5 4 5 5 5 5 5 5 5
R138 2 2 4 4 4 4 2 4 4 4 4 4 4 4 2 4 4 4 3 4 4 4 4 5 5 3 3 2 3 5 3 3 5 2
R139 5 5 5 5 5 5 5 5 5 5 5 5 5 5 5 5 5 5 5 4 4 4 5 5 5 5 5 3 5 5 3 5 5 5
R140 4 4 4 4 4 3 4 4 4 4 4 4 4 4 4 4 4 4 3 4 4 4 4 4 4 5 3 4 4 5 5 2 4 5
R141 4 4 4 5 4 5 5 5 5 5 5 4 5 5 5 5 5 5 5 5 5 5 5 5 5 5 5 4 5 5 4 5 4 5
R142 4 4 4 4 4 4 4 5 5 4 4 4 4 4 4 4 4 4 4 4 4 4 4 4 4 4 5 4 3 5 3 4 4 5
R143 4 4 5 4 4 4 3 4 5 5 5 4 4 4 4 4 4 4 4 3 4 4 4 4 4 4 3 3 3 4 4 4 4 4
R144 4 4 4 4 4 4 4 4 4 5 5 4 4 4 4 4 4 4 4 4 4 4 4 4 4 5 3 4 4 5 5 4 4 5
R145 4 5 4 4 5 4 4 4 4 5 4 5 4 4 5 4 4 5 4 4 5 5 5 4 4 3 3 3 3 4 4 3 3 5
R146 4 2 2 2 4 2 2 5 3 4 2 1 2 2 3 1 1 1 1 1 1 1 1 1 1 2 2 2 2 2 2 2 2 2
R147 4 4 4 5 5 4 5 5 5 5 5 5 5 5 5 5 4 4 4 5 5 5 5 5 5 5 5 4 5 5 5 5 5 5
R148 4 4 4 4 4 4 4 4 4 4 4 4 4 4 3 4 4 4 3 3 3 4 4 4 4 5 3 4 5 5 5 4 5 5
R149 4 4 4 4 4 4 4 4 4 4 4 4 4 4 4 4 4 3 4 4 4 4 4 4 4 4 3 4 5 4 4 4 4 5
R150 5 4 4 4 4 4 4 5 5 4 4 4 4 4 4 5 4 4 4 4 4 4 4 4 4 3 4 2 2 5 4 2 2 5
TABULASI DATA MENTAH KUESIONER
No
Service Quality Kepuasan
PasienLoyalitas Pasien
Tangible Reliability Responsivene Assurance Emphaty

Universitas Esa Unggul
138
Lampiran 4: Hasil Kuesioner
1 2 3 4 5 6 7 8 9 10 11 12 13 14 15 16 17 18 19 20 21 22 1 2 3 1 2 3 4 5 6 7 8 9
R151 4 4 3 4 4 4 4 4 4 4 4 3 4 4 3 4 4 3 3 3 3 3 4 4 4 5 5 5 5 5 3 3 5 5
R152 4 4 4 4 4 4 4 4 4 4 4 4 4 4 4 4 4 4 4 4 4 4 4 4 4 3 1 3 4 5 5 3 4 5
R153 5 4 5 4 4 4 4 4 4 4 4 2 4 4 2 4 4 4 4 4 4 4 4 4 4 3 4 4 4 5 4 3 4 5
R154 5 5 5 5 5 5 4 5 5 5 5 4 5 5 4 5 4 4 4 5 4 4 4 5 5 4 4 5 5 4 3 3 4 5
R155 4 4 4 4 4 4 4 4 4 4 4 4 4 4 3 4 3 3 4 3 4 4 4 4 4 3 3 3 4 2 4 2 4 2
R156 4 4 5 4 4 5 4 5 5 5 5 4 5 4 4 4 4 4 4 4 4 4 4 4 4 3 3 4 4 4 4 4 4 4
R157 4 4 5 4 3 4 4 5 5 5 4 4 3 4 2 5 4 2 4 4 4 5 4 4 4 5 4 4 2 4 5 4 2 2
R158 5 5 5 4 4 5 5 5 5 5 5 5 5 5 5 5 5 5 5 5 4 5 5 5 5 5 5 5 5 5 5 5 5 5
R159 4 4 4 4 4 4 4 4 4 4 4 4 4 4 4 4 3 4 4 4 4 4 4 4 4 5 5 5 5 5 5 5 5 5
R160 4 4 4 4 4 4 4 5 5 4 4 3 4 4 4 5 4 3 4 4 3 4 4 4 4 3 3 3 3 3 3 5 2 3
R161 4 5 4 4 4 4 4 4 4 4 4 4 4 4 4 4 4 4 4 4 4 4 4 5 4 5 1 4 3 4 5 2 5 5
R162 5 5 5 4 4 4 4 5 5 5 5 3 4 4 4 4 3 4 4 3 4 4 4 4 3 4 3 3 4 3 4 3 4 5
R163 4 4 4 4 4 4 4 4 4 4 4 4 4 4 4 4 4 4 4 4 4 4 4 4 4 4 4 4 4 4 4 4 3 4
R164 5 5 5 4 5 5 3 5 5 4 4 4 5 5 3 5 4 4 4 4 3 4 5 5 3 4 3 4 5 4 3 4 2 4
R165 4 4 4 4 4 5 4 4 4 5 4 3 4 4 3 5 4 3 4 3 4 5 4 4 3 4 4 4 4 5 3 3 3 4
R166 4 4 4 5 5 5 4 5 5 5 5 5 5 5 4 5 4 4 4 4 4 5 4 4 4 4 4 4 4 5 4 5 4 5
R167 4 4 4 4 4 5 4 5 5 4 4 4 4 4 5 4 4 4 4 4 4 5 4 5 5 5 4 4 4 5 4 4 4 5
R168 5 5 5 5 5 5 4 5 5 5 5 5 5 5 5 5 5 4 4 4 4 5 5 5 5 5 4 5 5 5 4 5 4 5
R169 5 5 5 5 5 5 5 5 5 5 5 5 5 5 5 5 5 5 5 5 5 5 5 5 5 5 5 5 5 5 4 4 4 5
R170 5 5 5 5 5 5 5 5 5 5 5 4 5 4 5 5 5 3 5 4 4 5 5 5 5 5 5 5 5 5 5 5 4 5
TABULASI DATA MENTAH KUESIONER
No
Service Quality Kepuasan
PasienLoyalitas Pasien
Tangible Reliability Responsivene Assurance Emphaty

Universitas Esa Unggul
139
CFA SQ (Service Quality)
Structural Model Berdasarkan T-Value
Structural Model Berdasarkan Standard Solution
DATE: 7/11/2015
TIME: 11:15

Universitas Esa Unggul
140
L I S R E L 8.54
BY
Karl G. Jöreskog & Dag Sörbom
This program is published exclusively by
Scientific Software International, Inc.
7383 N. Lincoln Avenue, Suite 100
Lincolnwood, IL 60712, U.S.A.
Phone: (800)247-6113, (847)675-0720, Fax: (847)675-2140
Copyright by Scientific Software International, Inc., 1981-2002
Use of this program is subject to the terms specified in the
Universal Copyright Convention.
Website: www.ssicentral.com
The following lines were read from file G:\Prast Esa Ungul\Data.LS8:
SYSTEM FILE from file 'G:\Prast Esa Ungul\\Data.DSF'
Latent Variables SQ KP LP
Relationship:
SQ1-SQ5 = SQ
Set the error covariance between SQ3 and SQ2 to 0.17
Set the error covariance between SQ4 and SQ1 to 0.10
Set the error covariance between SQ4 and SQ2 to -0.08
Set the error covariance between SQ4 and SQ3 to -0.06
Set the error covariance between SQ5 and SQ2 to -0.06
Set the error covariance between SQ5 and SQ3 to -0.06
Set the error covariance between SQ5 and SQ4 to 0.20
Options: sc
Path Diagram
End of Problem
Sample Size = 170
Covariance Matrix
SQ1 SQ2 SQ3 SQ4 SQ5
-------- -------- -------- -------- --------
SQ1 1.00
SQ2 0.80 1.00
SQ3 0.84 0.93 1.00
SQ4 0.81 0.75 0.81 1.00
SQ5 0.74 0.73 0.77 0.86 1.00
Number of Iterations = 8
LISREL Estimates (Maximum Likelihood)
Measurement Equations
SQ1 = 0.88*SQ, Errorvar.= 0.26 , R² = 0.75
(0.063) (0.029)
13.97 8.82
SQ2 = 0.87*SQ, Errorvar.= 0.31 , R² = 0.71
(0.065) (0.021)
13.42 14.72

Universitas Esa Unggul
141
SQ3 = 0.93*SQ, Errorvar.= 0.16 , R² = 0.84
(0.060) (0.016)
15.45 10.02
SQ4 = 0.86*SQ, Errorvar.= 0.37 , R² = 0.67
(0.067) (0.026)
12.79 14.04
SQ5 = 0.85*SQ, Errorvar.= 0.33 , R² = 0.68
(0.066) (0.031)
12.96 10.61
Error Covariance for SQ3 and SQ2 = 0.17
Error Covariance for SQ4 and SQ1 = 0.10
Error Covariance for SQ4 and SQ2 = -0.08
Error Covariance for SQ4 and SQ3 = -0.06
Error Covariance for SQ5 and SQ2 = -0.06
Error Covariance for SQ5 and SQ3 = -0.06
Error Covariance for SQ5 and SQ4 = 0.20
Correlation Matrix of Independent Variables
SQ
--------
1.00
Goodness of Fit Statistics
Degrees of Freedom = 5
Minimum Fit Function Chi-Square = 27.39 (P = 0.00)
Normal Theory Weighted Least Squares Chi-Square = 19.54 (P = 0.0015)
Estimated Non-centrality Parameter (NCP) = 14.54
90 Percent Confidence Interval for NCP = (4.55 ; 32.08)
Minimum Fit Function Value = 0.16
Population Discrepancy Function Value (F0) = 0.086
90 Percent Confidence Interval for F0 = (0.027 ; 0.19)
Root Mean Square Error of Approximation (RMSEA) = 0.13
90 Percent Confidence Interval for RMSEA = (0.073 ; 0.19)
P-Value for Test of Close Fit (RMSEA < 0.05) = 0.014
Expected Cross-Validation Index (ECVI) = 0.23
90 Percent Confidence Interval for ECVI = (0.17 ; 0.34)
ECVI for Saturated Model = 0.18
ECVI for Independence Model = 6.55
Chi-Square for Independence Model with 10 Degrees of Freedom = 1097.60
Independence AIC = 1107.60
Model AIC = 39.54
Saturated AIC = 30.00
Independence CAIC = 1128.28
Model CAIC = 80.90
Saturated CAIC = 92.04
Normed Fit Index (NFI) = 0.98

Universitas Esa Unggul
142
Non-Normed Fit Index (NNFI) = 0.96
Parsimony Normed Fit Index (PNFI) = 0.49
Comparative Fit Index (CFI) = 0.98
Incremental Fit Index (IFI) = 0.98
Relative Fit Index (RFI) = 0.95
Critical N (CN) = 94.10
Root Mean Square Residual (RMR) = 0.056
Standardized RMR = 0.052
Goodness of Fit Index (GFI) = 0.95
Adjusted Goodness of Fit Index (AGFI) = 0.84
Parsimony Goodness of Fit Index (PGFI) = 0.32
The Modification Indices Suggest to Add an Error Covariance
Between and Decrease in Chi-Square New Estimate
SQ3 SQ2 9.0 0.03
Standardized Solution
LAMBDA-X
SQ
--------
SQ1 0.88
SQ2 0.87
SQ3 0.93
SQ4 0.86
SQ5 0.85
PHI
SQ
--------
1.00
Completely Standardized Solution
LAMBDA-X
SQ
--------
SQ1 0.87
SQ2 0.84
SQ3 0.92
SQ4 0.82
SQ5 0.83
PHI
SQ
--------
1.00
THETA-DELTA
SQ1 SQ2 SQ3 SQ4 SQ5
-------- -------- -------- -------- --------
SQ1 0.25
SQ2 - - 0.29
SQ3 - - 0.16 0.16
SQ4 0.09 -0.07 -0.06 0.33
SQ5 - - -0.06 -0.06 0.18 0.32
Time used: 0.047 Seconds

Universitas Esa Unggul
143
CFA Kepuasan Pasien (KP)
Structural Model Berdasarkan T-Value
Structural Model Berdasarkan Standard Solution

Universitas Esa Unggul
144
DATE: 8/11/2015
TIME: 11:18
L I S R E L 8.54
BY
Karl G. Jöreskog & Dag Sörbom
This program is published exclusively by
Scientific Software International, Inc.
7383 N. Lincoln Avenue, Suite 100
Lincolnwood, IL 60712, U.S.A.
Phone: (800)247-6113, (847)675-0720, Fax: (847)675-2140
Copyright by Scientific Software International, Inc., 1981-2002
Use of this program is subject to the terms specified in the
Universal Copyright Convention.
Website: www.ssicentral.com
The following lines were read from file G:\Prast Esa Ungul\Data.LS8:
SYSTEM FILE from file 'G:\Prast Esa Ungul\\Data.DSF'
Latent Variables SQ KP LP
Relationship:
KP1-KP3 = KP
Options: sc
Path Diagram
End of Problem
Sample Size = 170
Covariance Matrix
KP1 KP2 KP3
-------- -------- --------
KP1 1.00
KP2 0.86 1.00
KP3 0.72 0.80 1.00
Number of Iterations = 0
LISREL Estimates (Maximum Likelihood)
Measurement Equations
KP1 = 0.88*KP, Errorvar.= 0.23 , R² = 0.77
(0.062) (0.036)
14.15 6.45
KP2 = 0.97*KP, Errorvar.= 0.050 , R² = 0.95
(0.058) (0.032)
16.80 1.58
KP3 = 0.82*KP, Errorvar.= 0.32 , R² = 0.68
(0.064) (0.042)
12.86 7.76

Universitas Esa Unggul
145
Correlation Matrix of Independent Variables
KP
--------
1.00
Goodness of Fit Statistics
Degrees of Freedom = 0
Minimum Fit Function Chi-Square = 0.0 (P = 1.00)
Normal Theory Weighted Least Squares Chi-Square = 0.00 (P = 1.00)
The Model is Saturated, the Fit is Perfect !
Standardized Solution
LAMBDA-X
KP
--------
KP1 0.88
KP2 0.97
KP3 0.82
PHI
KP
--------
1.00
Completely Standardized Solution
LAMBDA-X
KP
--------
KP1 0.88
KP2 0.97
KP3 0.82
PHI
KP
--------
1.00
THETA-DELTA
KP1 KP2 KP3
-------- -------- --------
0.23 0.05 0.32
Time used: 0.047 Seconds
Time used: 0.031 Seconds

Universitas Esa Unggul
146
CFA Loyalitas Pasien (LP)
Structural Model Berdasarkan T-Value

Universitas Esa Unggul
147
Structural Model Berdasarkan Standard Solution

Universitas Esa Unggul
148
DATE: 8/11/2015
TIME: 11:26
L I S R E L 8.54
BY
Karl G. Jöreskog & Dag Sörbom
This program is published exclusively by
Scientific Software International, Inc.
7383 N. Lincoln Avenue, Suite 100
Lincolnwood, IL 60712, U.S.A.
Phone: (800)247-6113, (847)675-0720, Fax: (847)675-2140
Copyright by Scientific Software International, Inc., 1981-2002
Use of this program is subject to the terms specified in the
Universal Copyright Convention.
Website: www.ssicentral.com
The following lines were read from file G:\Prast Esa Ungul\Data.LS8:
SYSTEM FILE from file 'G:\Prast Esa Ungul\\Data.DSF'
Latent Variables SQ KP LP
Relationship:
LP1-LP9 = LP
Options: sc
Path Diagram
End of Problem
Sample Size = 170
Covariance Matrix
LP1 LP2 LP3 LP4 LP5 LP6
-------- -------- -------- -------- -------- --------
LP1 1.00
LP2 0.50 1.00
LP3 0.59 0.41 1.00
LP4 0.48 0.48 0.54 1.00
LP5 0.56 0.51 0.61 0.50 1.00
LP6 0.47 0.42 0.53 0.51 0.57 1.00
LP7 0.41 0.48 0.41 0.45 0.48 0.48
LP8 0.50 0.40 0.51 0.52 0.57 0.59
LP9 0.46 0.42 0.40 0.46 0.57 0.50
Covariance Matrix
LP7 LP8 LP9
-------- -------- --------
LP7 1.00
LP8 0.41 1.00
LP9 0.48 0.53 1.00
Number of Iterations = 5
LISREL Estimates (Maximum Likelihood)
Measurement Equations

Universitas Esa Unggul
149
LP1 = 0.71*LP, Errorvar.= 0.50 , R² = 0.50
(0.069) (0.061)
10.21 8.17
LP2 = 0.63*LP, Errorvar.= 0.60 , R² = 0.40
(0.072) (0.070)
8.79 8.52
LP3 = 0.72*LP, Errorvar.= 0.48 , R² = 0.52
(0.069) (0.059)
10.50 8.08
LP4 = 0.70*LP, Errorvar.= 0.52 , R² = 0.48
(0.070) (0.063)
9.95 8.24
LP5 = 0.79*LP, Errorvar.= 0.37 , R² = 0.63
(0.066) (0.050)
11.93 7.48
LP6 = 0.73*LP, Errorvar.= 0.47 , R² = 0.53
(0.069) (0.058)
10.60 8.04
LP7 = 0.63*LP, Errorvar.= 0.61 , R² = 0.39
(0.072) (0.071)
8.70 8.54
LP8 = 0.72*LP, Errorvar.= 0.48 , R² = 0.52
(0.069) (0.059)
10.50 8.07
LP9 = 0.68*LP, Errorvar.= 0.54 , R² = 0.46
(0.071) (0.065)
9.59 8.34
Correlation Matrix of Independent Variables
LP
--------
1.00
Goodness of Fit Statistics
Degrees of Freedom = 27
Minimum Fit Function Chi-Square = 37.70 (P = 0.083)
Normal Theory Weighted Least Squares Chi-Square = 36.56 (P = 0.10)
Estimated Non-centrality Parameter (NCP) = 9.56
90 Percent Confidence Interval for NCP = (0.0 ; 29.49)
Minimum Fit Function Value = 0.22
Population Discrepancy Function Value (F0) = 0.057
90 Percent Confidence Interval for F0 = (0.0 ; 0.17)
Root Mean Square Error of Approximation (RMSEA) = 0.046
90 Percent Confidence Interval for RMSEA = (0.0 ; 0.080)
P-Value for Test of Close Fit (RMSEA < 0.05) = 0.54
Expected Cross-Validation Index (ECVI) = 0.43
90 Percent Confidence Interval for ECVI = (0.37 ; 0.55)

Universitas Esa Unggul
150
ECVI for Saturated Model = 0.53
ECVI for Independence Model = 8.91
Chi-Square for Independence Model with 36 Degrees of Freedom = 1488.45
Independence AIC = 1506.45
Model AIC = 72.56
Saturated AIC = 90.00
Independence CAIC = 1543.67
Model CAIC = 147.00
Saturated CAIC = 276.11
Normed Fit Index (NFI) = 0.97
Non-Normed Fit Index (NNFI) = 0.99
Parsimony Normed Fit Index (PNFI) = 0.73
Comparative Fit Index (CFI) = 0.99
Incremental Fit Index (IFI) = 0.99
Relative Fit Index (RFI) = 0.97
Critical N (CN) = 211.51
Root Mean Square Residual (RMR) = 0.036
Standardized RMR = 0.036
Goodness of Fit Index (GFI) = 0.95
Adjusted Goodness of Fit Index (AGFI) = 0.92
Parsimony Goodness of Fit Index (PGFI) = 0.57
Standardized Solution
LAMBDA-X
LP
--------
LP1 0.71
LP2 0.63
LP3 0.72
LP4 0.70
LP5 0.79
LP6 0.73
LP7 0.63
LP8 0.72
LP9 0.68
PHI
LP
--------
1.00
Completely Standardized Solution
LAMBDA-X
LP
--------
LP1 0.71
LP2 0.63
LP3 0.72
LP4 0.70
LP5 0.79
LP6 0.73
LP7 0.63
LP8 0.72
LP9 0.68

Universitas Esa Unggul
151
PHI
LP
--------
1.00
THETA-DELTA
LP1 LP2 LP3 LP4 LP5 LP6
-------- -------- -------- -------- -------- --------
0.50 0.60 0.48 0.52 0.37 0.47
THETA-DELTA
LP7 LP8 LP9
-------- -------- --------

Universitas Esa Unggul
152
Full Model
Structural Model Berdasarkan T-Value

Universitas Esa Unggul
153
Structural Model Berdasarkan Standard Solution

Universitas Esa Unggul
154
DATE: 8/11/2015
TIME: 11:29
L I S R E L 8.54
BY
Karl G. Jöreskog & Dag Sörbom
This program is published exclusively by
Scientific Software International, Inc.
7383 N. Lincoln Avenue, Suite 100
Lincolnwood, IL 60712, U.S.A.
Phone: (800)247-6113, (847)675-0720, Fax: (847)675-2140
Copyright by Scientific Software International, Inc., 1981-2002
Use of this program is subject to the terms specified in the
Universal Copyright Convention.
Website: www.ssicentral.com
The following lines were read from file G:\Prast Esa Ungul\Data.LS8:
SYSTEM FILE from file 'G:\Prast Esa Ungul\\Data.DSF'
Latent Variables SQ KP LP
Relationship:
SQ1-SQ5 = SQ
KP1-KP3 = KP
LP1-LP9 = LP
KP = SQ
LP SQ KP
Set the error covariance between SQ3 and SQ2 to 0.17
Set the error covariance between SQ4 and SQ1 to 0.10
Set the error covariance between SQ4 and SQ2 to -0.08
Set the error covariance between SQ4 and SQ3 to -0.06
Set the error covariance between SQ5 and SQ2 to -0.06
Set the error covariance between SQ5 and SQ3 to -0.06
Set the error covariance between SQ5 and SQ4 to 0.20
Options: sc ef
Path Diagram
End of Problem
Sample Size = 170
Covariance Matrix
KP1 KP2 KP3 LP1 LP2 LP3
-------- -------- -------- -------- -------- --------
KP1 1.00
KP2 0.86 1.00
KP3 0.72 0.80 1.00
LP1 0.16 0.18 0.18 1.00
LP2 0.24 0.27 0.29 0.50 1.00
LP3 0.18 0.18 0.15 0.59 0.41 1.00
LP4 0.29 0.31 0.35 0.48 0.48 0.54
LP5 0.37 0.41 0.33 0.56 0.51 0.61
LP6 0.24 0.29 0.29 0.47 0.42 0.53
LP7 0.33 0.38 0.43 0.41 0.48 0.41
LP8 0.22 0.28 0.25 0.50 0.40 0.51
LP9 0.29 0.33 0.32 0.46 0.42 0.40
SQ1 0.39 0.33 0.26 0.25 0.05 0.19
SQ2 0.41 0.38 0.28 0.23 0.13 0.23
SQ3 0.45 0.42 0.34 0.29 0.12 0.21
SQ4 0.47 0.40 0.37 0.21 0.11 0.18
SQ5 0.49 0.42 0.40 0.18 0.13 0.21

Universitas Esa Unggul
155
Covariance Matrix
LP4 LP5 LP6 LP7 LP8 LP9
-------- -------- -------- -------- -------- --------
LP4 1.00
LP5 0.50 1.00
LP6 0.51 0.57 1.00
LP7 0.45 0.48 0.48 1.00
LP8 0.52 0.57 0.59 0.41 1.00
LP9 0.46 0.57 0.50 0.48 0.53 1.00
SQ1 0.23 0.19 0.23 0.20 0.16 0.20
SQ2 0.25 0.28 0.25 0.27 0.24 0.28
SQ3 0.27 0.28 0.27 0.28 0.27 0.26
SQ4 0.22 0.23 0.20 0.23 0.19 0.18
SQ5 0.23 0.28 0.26 0.23 0.21 0.17
Covariance Matrix
SQ1 SQ2 SQ3 SQ4 SQ5
-------- -------- -------- -------- --------
SQ1 1.00
SQ2 0.80 1.00
SQ3 0.84 0.93 1.00
SQ4 0.81 0.75 0.81 1.00
SQ5 0.74 0.73 0.77 0.86 1.00
Number of Iterations = 13
LISREL Estimates (Maximum Likelihood)
Measurement Equations
KP1 = 0.89*KP, Errorvar.= 0.21 , R² = 0.79
(0.033)
6.44
KP2 = 0.96*KP, Errorvar.= 0.071 , R² = 0.93
(0.051) (0.028)
18.84 2.49
KP3 = 0.83*KP, Errorvar.= 0.31 , R² = 0.69
(0.056) (0.040)
14.71 7.81
LP1 = 0.70*LP, Errorvar.= 0.51 , R² = 0.49
(0.062)
8.23
LP2 = 0.63*LP, Errorvar.= 0.60 , R² = 0.40
(0.082) (0.071)
7.67 8.54
LP3 = 0.71*LP, Errorvar.= 0.49 , R² = 0.51
(0.083) (0.060)
8.66 8.16
LP4 = 0.70*LP, Errorvar.= 0.51 , R² = 0.49
(0.082) (0.062)
8.46 8.26
LP5 = 0.80*LP, Errorvar.= 0.37 , R² = 0.63
(0.083) (0.049)
9.58 7.48

Universitas Esa Unggul
156
LP6 = 0.73*LP, Errorvar.= 0.47 , R² = 0.53
(0.083) (0.058)
8.81 8.08
LP7 = 0.64*LP, Errorvar.= 0.60 , R² = 0.40
(0.082) (0.070)
7.74 8.52
LP8 = 0.72*LP, Errorvar.= 0.48 , R² = 0.52
(0.083) (0.059)
8.74 8.12
LP9 = 0.68*LP, Errorvar.= 0.54 , R² = 0.46
(0.082) (0.064)
8.26 8.34
SQ1 = 0.87*SQ, Errorvar.= 0.26 , R² = 0.74
(0.063) (0.029)
13.86 8.98
SQ2 = 0.87*SQ, Errorvar.= 0.31 , R² = 0.71
(0.065) (0.021)
13.38 14.97
SQ3 = 0.94*SQ, Errorvar.= 0.16 , R² = 0.85
(0.060) (0.016)
15.53 10.02
SQ4 = 0.86*SQ, Errorvar.= 0.36 , R² = 0.67
(0.067) (0.026)
12.82 14.06
SQ5 = 0.85*SQ, Errorvar.= 0.33 , R² = 0.69
(0.066) (0.031)
12.99 10.74
Error Covariance for SQ3 and SQ2 = 0.17
Error Covariance for SQ4 and SQ1 = 0.10
Error Covariance for SQ4 and SQ2 = -0.08
Error Covariance for SQ4 and SQ3 = -0.06
Error Covariance for SQ5 and SQ2 = -0.06
Error Covariance for SQ5 and SQ3 = -0.06
Error Covariance for SQ5 and SQ4 = 0.20
Structural Equations
KP = 0.48*SQ, Errorvar.= 0.77 , R² = 0.23
(0.079) (0.11)
6.08 7.08
LP = 0.34*KP + 0.19*SQ, Errorvar.= 0.78 , R² = 0.22
(0.092) (0.090) (0.16)
3.72 2.16 4.98

Universitas Esa Unggul
157
Reduced Form Equations
KP = 0.48*SQ, Errorvar.= 0.77, R² = 0.23
(0.079)
6.08
LP = 0.36*SQ, Errorvar.= 0.87, R² = 0.13
(0.086)
4.17
Correlation Matrix of Independent Variables
SQ
--------
1.00
Covariance Matrix of Latent Variables
KP LP SQ
-------- -------- --------
KP 1.00
LP 0.44 1.00
SQ 0.48 0.36 1.00
Goodness of Fit Statistics
Degrees of Freedom = 116
Minimum Fit Function Chi-Square = 184.60 (P = 0.00)
Normal Theory Weighted Least Squares Chi-Square = 162.06 (P = 0.0031)
Estimated Non-centrality Parameter (NCP) = 46.06
90 Percent Confidence Interval for NCP = (16.47 ; 83.70)
Minimum Fit Function Value = 1.09
Population Discrepancy Function Value (F0) = 0.27
90 Percent Confidence Interval for F0 = (0.097 ; 0.50)
Root Mean Square Error of Approximation (RMSEA) = 0.048
90 Percent Confidence Interval for RMSEA = (0.029 ; 0.065)
P-Value for Test of Close Fit (RMSEA < 0.05) = 0.54
Expected Cross-Validation Index (ECVI) = 1.40
90 Percent Confidence Interval for ECVI = (1.22 ; 1.62)
ECVI for Saturated Model = 1.81
ECVI for Independence Model = 24.22
Chi-Square for Independence Model with 136 Degrees of Freedom = 4059.61
Independence AIC = 4093.61
Model AIC = 236.06
Saturated AIC = 306.00
Independence CAIC = 4163.92
Model CAIC = 389.09
Saturated CAIC = 938.78
Normed Fit Index (NFI) = 0.95
Non-Normed Fit Index (NNFI) = 0.98
Parsimony Normed Fit Index (PNFI) = 0.81
Comparative Fit Index (CFI) = 0.98
Incremental Fit Index (IFI) = 0.98
Relative Fit Index (RFI) = 0.95

Universitas Esa Unggul
158
Critical N (CN) = 142.30
Root Mean Square Residual (RMR) = 0.052
Standardized RMR = 0.052
Goodness of Fit Index (GFI) = 0.89
Adjusted Goodness of Fit Index (AGFI) = 0.86
Parsimony Goodness of Fit Index (PGFI) = 0.68
The Modification Indices Suggest to Add an Error Covariance
Between and Decrease in Chi-Square New Estimate
SQ3 LP1 8.2 0.05
SQ3 SQ2 10.0 0.02
Standardized Solution
LAMBDA-Y
KP LP
-------- --------
KP1 0.89 - -
KP2 0.96 - -
KP3 0.83 - -
LP1 - - 0.70
LP2 - - 0.63
LP3 - - 0.71
LP4 - - 0.70
LP5 - - 0.80
LP6 - - 0.73
LP7 - - 0.64
LP8 - - 0.72
LP9 - - 0.68
LAMBDA-X
SQ
--------
SQ1 0.87
SQ2 0.87
SQ3 0.94
SQ4 0.86
SQ5 0.85
BETA
KP LP
-------- --------
KP - - - -
LP 0.34 - -
GAMMA
SQ
--------
KP 0.48
LP 0.19

Universitas Esa Unggul
159
Correlation Matrix of ETA and KSI
KP LP SQ
-------- -------- --------
KP 1.00
LP 0.44 1.00
SQ 0.48 0.36 1.00
PSI
Note: This matrix is diagonal.
KP LP
-------- --------
0.77 0.78
Regression Matrix ETA on KSI (Standardized)
SQ
--------
KP 0.48
LP 0.36
Completely Standardized Solution
LAMBDA-Y
KP LP
-------- --------
KP1 0.89 - -
KP2 0.96 - -
KP3 0.83 - -
LP1 - - 0.70
LP2 - - 0.63
LP3 - - 0.71
LP4 - - 0.70
LP5 - - 0.80
LP6 - - 0.73
LP7 - - 0.64
LP8 - - 0.72
LP9 - - 0.68
LAMBDA-X
SQ
--------
SQ1 0.86
SQ2 0.84
SQ3 0.92
SQ4 0.82
SQ5 0.83
BETA
KP LP
-------- --------
KP - - - -
LP 0.34 - -
GAMMA
SQ
--------
KP 0.48
LP 0.19

Universitas Esa Unggul
160
Correlation Matrix of ETA and KSI
KP LP SQ
-------- -------- --------
KP 1.00
LP 0.44 1.00
SQ 0.48 0.36 1.00
PSI
Note: This matrix is diagonal.
KP LP
-------- --------
0.77 0.78
THETA-EPS
KP1 KP2 KP3 LP1 LP2 LP3
-------- -------- -------- -------- -------- --------
0.21 0.07 0.31 0.51 0.60 0.49
THETA-EPS
LP4 LP5 LP6 LP7 LP8 LP9
-------- -------- -------- -------- -------- --------
0.51 0.37 0.47 0.60 0.48 0.54
THETA-DELTA
SQ1 SQ2 SQ3 SQ4 SQ5
-------- -------- -------- -------- --------
SQ1 0.26
SQ2 - - 0.29
SQ3 - - 0.16 0.15
SQ4 0.09 -0.07 -0.06 0.33
SQ5 - - -0.06 -0.06 0.18 0.31
Regression Matrix ETA on KSI (Standardized)
SQ
--------
KP 0.48
LP 0.36
Total and Indirect Effects
Total Effects of KSI on ETA
SQ
--------
KP 0.48
(0.08)
6.08
LP 0.36
(0.09)
4.17

Universitas Esa Unggul
161
Indirect Effects of KSI on ETA
SQ
--------
KP - -
LP 0.17
(0.05)
3.24
Total Effects of ETA on ETA
KP LP
-------- --------
KP - - - -
LP 0.34 - -
(0.09)
3.72
Largest Eigenvalue of B*B' (Stability Index) is 0.117
Total Effects of ETA on Y
KP LP
-------- --------
KP1 0.89 - -
KP2 0.96 - -
(0.05)
18.84
KP3 0.83 - -
(0.06)
14.71
LP1 0.24 0.70
(0.06)
3.72
LP2 0.22 0.63
(0.06) (0.08)
3.64 7.67
LP3 0.24 0.71
(0.07) (0.08)
3.73 8.66
LP4 0.24 0.70
(0.06) (0.08)
3.72 8.46
LP5 0.27 0.80
(0.07) (0.08)
3.80 9.58
LP6 0.25 0.73
(0.07) (0.08)
3.75 8.81
LP7 0.22 0.64
(0.06) (0.08)
3.65 7.74

Universitas Esa Unggul
162
LP8 0.25 0.72
(0.07) (0.08)
3.74 8.74
LP9 0.23 0.68
(0.06) (0.08)
3.70 8.26
Indirect Effects of ETA on Y
KP LP
-------- --------
KP1 - - - -
KP2 - - - -
KP3 - - - -
LP1 0.24 - -
(0.06)
3.72
LP2 0.22 - -
(0.06)
3.64
LP3 0.24 - -
(0.07)
3.73
LP4 0.24 - -
(0.06)
3.72
LP5 0.27 - -
(0.07)
3.80
LP6 0.25 - -
(0.07)
3.75
LP7 0.22 - -
(0.06)
3.65
LP8 0.25 - -
(0.07)
3.74
LP9 0.23 - -
(0.06)
3.70
Total Effects of KSI on Y
SQ
--------
KP1 0.43
(0.07)
6.08

Universitas Esa Unggul
163
KP2 0.47
(0.07)
6.26
KP3 0.40
(0.07)
5.96
LP1 0.25
(0.06)
4.17
LP2 0.23
(0.06)
4.06
LP3 0.26
(0.06)
4.19
LP4 0.25
(0.06)
4.17
LP5 0.29
(0.07)
4.28
LP6 0.26
(0.06)
4.21
LP7 0.23
(0.06)
4.07
LP8 0.26
(0.06)
4.20
LP9 0.24
(0.06)
4.14
Standardized Total and Indirect Effects
Standardized Total Effects of KSI on ETA
SQ
--------
KP 0.48
LP 0.36
Standardized Indirect Effects of KSI on ETA
SQ
--------
KP - -
LP 0.17

Universitas Esa Unggul
164
Standardized Total Effects of ETA on ETA
KP LP
-------- --------
KP - - - -
LP 0.34 - -
Standardized Total Effects of ETA on Y
KP LP
-------- --------
KP1 0.89 - -
KP2 0.96 - -
KP3 0.83 - -
LP1 0.24 0.70
LP2 0.22 0.63
LP3 0.24 0.71
LP4 0.24 0.70
LP5 0.27 0.80
LP6 0.25 0.73
LP7 0.22 0.64
LP8 0.25 0.72
LP9 0.23 0.68
Completely Standardized Total Effects of ETA on Y
KP LP
-------- --------
KP1 0.89 - -
KP2 0.96 - -
KP3 0.83 - -
LP1 0.24 0.70
LP2 0.22 0.63
LP3 0.24 0.71
LP4 0.24 0.70
LP5 0.27 0.80
LP6 0.25 0.73
LP7 0.22 0.64
LP8 0.25 0.72
LP9 0.23 0.68
Standardized Indirect Effects of ETA on Y
KP LP
-------- --------
KP1 - - - -
KP2 - - - -
KP3 - - - -
LP1 0.24 - -
LP2 0.22 - -
LP3 0.24 - -
LP4 0.24 - -
LP5 0.27 - -
LP6 0.25 - -
LP7 0.22 - -
LP8 0.25 - -
LP9 0.23 - -

Universitas Esa Unggul
165
Completely Standardized Indirect Effects of ETA on Y
KP LP
-------- --------
KP1 - - - -
KP2 - - - -
KP3 - - - -
LP1 0.24 - -
LP2 0.22 - -
LP3 0.24 - -
LP4 0.24 - -
LP5 0.27 - -
LP6 0.25 - -
LP7 0.22 - -
LP8 0.25 - -
LP9 0.23 - -
Standardized Total Effects of KSI on Y
SQ
--------
KP1 0.43
KP2 0.47
KP3 0.40
LP1 0.25
LP2 0.23
LP3 0.26
LP4 0.25
LP5 0.29
LP6 0.26
LP7 0.23
LP8 0.26
LP9 0.24
Completely Standardized Total Effects of KSI on Y
SQ
--------
KP1 0.43
KP2 0.47
KP3 0.40
LP1 0.25
LP2 0.23
LP3 0.26
LP4 0.25
LP5 0.29
LP6 0.26
LP7 0.23
LP8 0.26
LP9 0.24
Time used: 0.109 Seconds