


Bahasa
Halaman
Hukum


Make it happen through CREATE for Strategic Management, at
www.McGrawHillCreate.com/Rothaermel
Where do I fi nd cases to incorporate into my class?
You can access the full-length cases that accompany Strategic Management by Frank T. Rothaermel through McGraw-Hill’s custom-publishing program, CREATE (McGrawHillCreate.com/Rothaermel).
Through CREATE, you will be able to select from 24 author-written cases that go specifi cally with this textbook as well as cases from Harvard, Ivey Darden, NACRA, and much more! You can:
■ Assemble your own course, selecting the chapters, cases, and readings that will work best for you.
■ Or choose from several ready-to-go, author-recommended complete course solutions, which include chapters, cases, and readings, pre-loaded in CREATE. Among the pre-loaded solutions, you’ll fi nd options for undergrad, MBA, accelerated, and other strategy courses.
How do I access these materials?
You will fi nd detailed instructions on how to select content for your course at McGrawHillCreate.com/Rothaermel.
In addition, the case matrix that accompanies the textbook (and is also available at the Create landing page) gives an overview of the 24 author-written cases and how they fi t with the 12 text chapters.
Using these resources, you can easily:
■ Select and arrange the content you want for your course and your students
■ Combine material from different sources and even upload your own content
■ Choose the format you want (print or e-book)
■ Update your course materials as often as you like
■ Receive your PDF review copy in minutes or a print review copy in just a few days.
Want help getting started?
For more information, please contact your local McGraw-Hill Learning Technology Consultant or email [email protected]
YourVision…YourVoice…YourCourse…YourWay
WWW.YAZDANPRESS.COMWWW.YAZDANPRESS.COM

Connect® Strategic Management offers a variety of tools and content
to enhance productivity and increase student performance.Available for Rothaermel 2e, Connect Strategic Management is an integrated technology solution that increases student engagement and comprehension, automates assignment delivery and grading, and monitors whether learning objectives are met through a variety of reports. Connect Strategic Management provides a wide array of tools and content to improve student performance.
LEARNSMART ADVANTAGE
LearnSmart®
LearnSmart is the most widely used and intelligent adaptive learning resource that is proven to strengthen memory recall, improve course retention, and boost grades.
Distinguishing what students know from what they don’t, and honing in on concepts they are most likely to forget, LearnSmart continuously adapts to each student’s needs by building an individual learning path so students study smarter and retain more knowledge.
SmartbookTM
Fueled by LearnSmart, SmartBook is the fi rst and only adaptive reading experience available today. Distinguishing what students know from what they don’t, and honing in on concepts they are most likely to forget, SmartBook personalizes content for each student—in a continu-ously adapting reading experience.
As a result of the adaptive reading experience found in SmartBook, students are more likely to retain knowledge, stay in class, and get better grades. This revolutionary technology is available only from McGraw-Hill Education and for hundreds of course areas as part of the LearnSmart Advantage series.
CONNECT FEATURES
Running CaseStudents will begin by reviewing a specifi c company and the company's applied strategy using appropriate tools (e.g. PESTEL, Porter's Five Forces, VRIO, SWOT, and others). The analysis will progress from a broad global view, to an industry view, to a strategic group view, and then focus on the company itself, moving from a broad perspective to the appropriate company-level perspective. Students will develop a strategic analysis for the company and consider several scenarios for the company to improve its competitive advantage. The scenarios will include a fi nancial analysis and justifi cation and ultimately provide a specifi c recommendation.
Interactive ApplicationsInteractive Applications offer a variety of automatically graded exercises that require students to apply key concepts. Whether the assign-ment includes a drag and drop, video case, or decision generator, these applications provide instant feedback and progress tracking for students, and detailed results for the instructor.
and much more…
For more information, contact your McGraw-Hill Learning Technology Consultant or visit
www.McGrawHillConnect.com
WWW.YAZDANPRESS.COMWWW.YAZDANPRESS.COM
Frank T. Rothaermel Georgia Institute of Technology
SECOND EDITION
WWW.YAZDANPRESS.COMWWW.YAZDANPRESS.COM

STRATEGIC MANAGEMENT, SECOND EDITION
Published by McGraw-Hill Education, 2 Penn Plaza, New York, NY 10121. Copyright © 2015 by McGraw-Hill
Education. All rights reserved. Printed in the United States of America. Previous edition © 2013. No part
of this publication may be reproduced or distributed in any form or by any means, or stored in a database or
retrieval system, without the prior written consent of McGraw-Hill Education, including, but not limited to,
in any network or other electronic storage or transmission, or broadcast for distance learning.
Some ancillaries, including electronic and print components, may not be available to customers outside the
United States.
This book is printed on acid-free paper.
1 2 3 4 5 6 7 8 9 0 DOW/DOW 1 0 9 8 7 6 5 4
ISBN 978-0-07-764506-9 (student edition)
MHID 0-07-764506-5 (student edition)
ISBN 978-0-07-764517-5 (instructor’s edition)
MHID 0-07-764517-0 (instructor’s edition)
Senior Vice President, Products & Markets: Kurt L. Strand
Vice President, Content Production & Technology Services: Kimberly Meriwether David
Managing Director: Paul Ducham
Executive Brand Manager: Michael Ablassmeir
Executive Director of Development: Ann Torbert Senior Development Editor: Laura Griffin
Marketing Manager : Elizabeth Trepkowski Director, Content Production: Terri Schiesl Content Project Manager: Harvey Yep
Senior Buyer: Debra R. Sylvester
Design: Matt Diamond
Cover Image: Veer Senior Content Licensing Specialist: Jeremy Cheshareck
Typeface: 10/12 Times Roman
Compositor: Laserwords Private Limited
Printer: R. R. Donnelley
All credits appearing on page or at the end of the book are considered to be an extension of the copyright
page.
Library of Congress Cataloging-in-Publication Data
Rothaermel, Frank T.
Strategic management / Frank T. Rothaermel, Georgia Institute of Technology.—Second edition.
pages cm
Revised edition of the work, Strategic management : concepts.
Includes bibliographical references and index.
ISBN-13: 978-0-07-764506-9 (student edition : alk. paper)
ISBN-10: 0-07-764506-5 (student edition : alk. paper)
ISBN-13: 978-0-07-764517-5 (instructor’s edition : alk. paper)
ISBN-10: 0-07-764517-0 (instructor’s edition : alk. paper)
1. Strategic planning. I. Title.
HD30.28.R6646 2015
658.4’012—dc23
2013044736
The Internet addresses listed in the text were accurate at the time of publication. The inclusion of a website
does not indicate an endorsement by the authors or McGraw-Hill Education, and McGraw-Hill Education
does not guarantee the accuracy of the information presented at these sites.
www.mhhe.com
WWW.YAZDANPRESS.COMWWW.YAZDANPRESS.COM

To my eternal family for their love, support, and sacrifice: Kelleyn, Harris, Winston, Roman, and Adelaide
— FRANK T. ROTHAERMEL
DEDICATION
WWW.YAZDANPRESS.COMWWW.YAZDANPRESS.COM
vi
PART ONE / STRATEGY ANALYSIS 1
CHAPTER 1 What Is Strategy, and Why Is It Important? 2
CHAPTER 2 Strategic Leadership: Managing the Strategy Process 28
CHAPTER 3 External Analysis: Industry Structure, Competitive Forces, and Strategic Groups 56
CHAPTER 4 Internal Analysis: Resources, Capabilities, and Core Competencies 96
CHAPTER 5 Competitive Advantage, Firm Performance, and Business Models 128
PART TWO / STRATEGY FORMULATION 161
CHAPTER 6 Business Strategy: Differentiation, Cost Leadership, and Integration 162
CHAPTER 7 Business Strategy: Innovation and Entrepreneurship 198
CHAPTER 8 Corporate Strategy: Vertical Integration and Diversification 240
CHAPTER 9 Corporate Strategy: Mergers and Acquisitions, Strategic Alliances 276
CHAPTER 10 Global Strategy: Competing Around the World 306
PART THREE / STRATEGY IMPLEMENTATION 341
CHAPTER 11 Organizational Design: Structure, Culture, and Control 342
CHAPTER 12 Corporate Governance and Business Ethics 376
PART FOUR / MINICASES 405
HOW TO CONDUCT A CASE ANALYSIS 457
PART FIVE / CASES (All available through McGraw-Hill Create, www.McGrawHillCreate.com/Rothaermel)
CONTENTS IN BRIEF
WWW.YAZDANPRESS.COMWWW.YAZDANPRESS.COM

vii
MINICASES /
1 Does Facebook Have a Strategy? 406
2 Michael Phelps: The Greatest Olympian 408
3 Teach For America: Inspiring Future Leaders 410
4 Strategy and Serendipity: A Billion-Dollar Bonanza 412
5 The Wonder from Sweden: Is IKEA’s Success Sustainable? 413
6 Starbucks: Re-creating Its Uniqueness 416
7 LVMH in China: Building Its Empire of Desire 418
8 GE under Jack Welch vs. Jeffrey Immelt 421
9 Competing on Business Models: Google vs. Microsoft 424
10 From Good to Great to Gone: The Rise and Fall of Circuit City 427
11 China’s Li Ning Challenges Nike and adidas 429
12 Which Automotive Technology Will Win? 432
13 Is Porsche Killing the Golden Goose? 434
14 The Rise of Samsung Electronics 437
15 Yummy Yum!’s Competitive Advantage in China 440
16 BYD—“Build Your Dreams” in America 444
17 Alibaba and China’s E-Commerce: “Open Sesame” Comes True 446
18 The Premature Death of a Google Forerunner at Microsoft 449
19 Sony’s Structure and Competitive Disadvantage 451
20 UBS’s Billion-Dollar Ethics Scandals 454
MINICASES AND FULL-LENGTH CASES
FULL-LENGTH CASES MARKED WITH A ➼ WERE AUTHORED OR CO-AUTHORED SPECIFICALLY FOR THIS BOOK BY FRANK T. ROTHAERMEL.
FULL-LENGTH CASES /
(All available through McGraw-Hill Create, www.McGrawHillCreate.com/Rothaermel )
Facebook (in 2013): Will Wall Street Hit the “Like” Button? ➼
Tesla Motors (in 2013): Will Sparks Fly in the Automobile Industry? ➼
Tesla Motors (in 2011) and the U.S. Auto Industry ➼
Tesla Motors (in 2009) and the U.S. Auto Industry ➼
The Movie Exhibition Industry 2013
Apple (in 2013): How to Sustain a Competitive Advantage? ➼
Apple (in 2011) after Steve Jobs ➼
Make or Break at RIM (in 2013): Launching BlackBerry 10 ➼
McDonald’s (in 2013): How to Win Again? ➼
Amazon.com (in 2013): Will Amazon Kindle Another Fire? ➼
Best Buy’s Turn-Around Strategy (2013) ➼
Best Buy after Circuit City (in 2011): What’s Next? ➼
UPS in India (in 2011)—A Package Deal? ➼
Microsoft and Xbox (in 2012): The Battle for the Living Room
Grok (in 2013): Action Intelligence for Fast Data ➼
Numenta (in 2010): The Age of Truly Intelligent Machines? ➼
Genentech (in 2011): After the Acquisition by Roche ➼
Merck (in 2009): Open for Innovation? ➼
Healthymagination at GE (in 2011) ➼
Better World Books (in 2013): Social Entrepreneurship and the Triple Bottom Line ➼
Better World Books (in 2009): Social Entrepreneurship and the Triple Bottom Line ➼
Tropical Salvage’s Growth Strategy (in 2010): From Recession to Expansion
InterfaceRAISE (in 2010): Raising the Bar in Sustainability Consulting ➼
Siemens Energy (in 2010): How to Engineer a Green Future? ➼
IBM (in 2010) and the Emerging Cloud-Computing Industry ➼
Infosys Consulting in the U.S. (in 2010): What to Do Now? ➼
Bank of America (in 2010) and the New Financial Landscape ➼
WWW.YAZDANPRESS.COMWWW.YAZDANPRESS.COM

viii
PART ONE / STRATEGY ANALYSIS 1
CHAPTER 1
WHAT IS STRATEGY, AND WHY IS IT IMPORTANT? 2
CHAPTERCASE 1
Apple: Once the World’s Most Valu-able Company 3
1.1 What Strategy Is: Gaining and Sustaining Competitive Advantage 4
What Is Competitive Advantage? 5
Industry vs. Firm Effects in Determining Performance 9
1.2 Stakeholders and Competitive Advantage 10Stakeholder Strategy 11
Stakeholder Impact Analysis 13
1.3 The AFI Strategy Framework 171.4 Implications for the Strategist 19
CHAPTERCASE 1 / Consider This... 19
CHAPTER 2
STRATEGIC LEADERSHIP: MANAGING THE STRATEGY
PROCESS 28
CHAPTERCASE 2
PepsiCo’s Indra Nooyi: “Performance with a Purpose” 29
2.1 Vision, Mission, and Values 30Vision and Mission 30
Living the Values 35
2.2 Strategic Leadership 35What Do Strategic Leaders Do? 37
How Do You Become an Effective and Ethical Strategic
Leader? 37
Formulating Strategy Across Levels: Corporate, Business,
and Functional Managers 39
2.3 The Strategic Management Process 41Top-Down Strategic Planning 41
Scenario Planning 42
Strategy as Planned Emergence: Top-Down and
Bottom-Up 44
2.4 Implications for the Strategist 48
CHAPTERCASE 2 / Consider This... 48
CHAPTER 3
EXTERNAL ANALYSIS: INDUSTRY STRUCTURE,
COMPETITIVE FORCES, AND STRATEGIC
GROUPS 56
CHAPTERCASE 3
Tesla Motors and the U.S. Automo-tive Industry 57
3.1 The PESTEL Framework 58Political/Legal Factors 59
Economic Factors 60
Sociocultural Factors 63
Technological Factors 64
Ecological Factors 64
3.2 Industry Structure and Firm Strategy: The Five Forces Model 64
Competition in the Five Forces Model 65
The Threat of Entry 67
The Power of Suppliers 71
The Power of Buyers 72
The Threat of Substitutes 74
Rivalry among Existing Competitors 75
Adding a Sixth Force: The Strategic Role of
Complements 80
3.3 Changes over Time: Industry Dynamics 823.4 Explaining Performance Differences
Within the Same Industry: Strategic Groups 83
Mapping Strategic Groups 84
Mobility Barriers 86
3.5 Implications for the Strategist 86
CHAPTERCASE 3 / Consider This... 88
CHAPTER 4
INTERNAL ANALYSIS: RESOURCES, CAPABILITIES,
AND CORE COMPETENCIES 96
CHAPTERCASE 4
Nike’s Core Competency: The Risky Business of Fairy Tales 97
4.1 Looking Inside the Firm for Core Competencies 100
CONTENTS
WWW.YAZDANPRESS.COMWWW.YAZDANPRESS.COM

4.2 The Resource-Based View 102Two Critical Assumptions 104
The VRIO Framework 104
How to Sustain a Competitive Advantage 108
4.3 The Dynamic Capabilities Perspective 1134.4 The Value Chain Analysis 1154.5 Implications for the Strategist 117
Using SWOT Analysis to Combine External and Internal
Analysis 117
CHAPTERCASE 4 / Consider This... 120
CHAPTER 5
COMPETITIVE ADVANTAGE, FIRM PERFORMANCE,
AND BUSINESS MODELS 128
CHAPTERCASE 5
Assessing Competitive Advantage: Apple vs. BlackBerry 129
5.1 Competitive Advantage and Firm Performance 131
Accounting Profitability 131
Shareholder Value Creation 136
Economic Value Creation 139
The Balanced Scorecard 143
The Triple Bottom Line 146
5.2 Business Models: Putting Strategy into Action 148
Different Business Models 150
5.3 Implications for the Strategist 151
CHAPTERCASE 5 / Consider This... 152
PART TWO / STRATEGY FORMULATION 161
CHAPTER 6
BUSINESS STRATEGY: DIFFERENTIATION, COST
LEADERSHIP, AND INTEGRATION 162
CHAPTERCASE 6
P&G’s Strategic Position Weakens 163
6.1 Business-Level Strategy: How to Compete for Advantage 165
Strategic Position 166
Generic Business Strategies 166
6.2 Differentiation Strategy: Understanding Value Drivers 168
Product Features 169
Customer Service 171
Complements 171
6.3 Cost-Leadership Strategy: Understanding Cost Drivers 172
Cost of Input Factors 173
Economies of Scale 174
Learning Curve 176
Experience Curve 178
6.4 Business-Level Strategy and the Five Forces: Benefits and Risks 178
Cost-Leadership Strategy: Benefits and Risks 178
Differentiation Strategy: Benefits and Risks 180
6.5 Integration Strategy: Combining Cost Leadership and Differentiation 181
Value and Cost Drivers of Integration Strategy 183
Integration Strategy Gone Bad: “Stuck in the
Middle” 185
6.6 The Dynamics of Competitive Positioning 1866.7 Implications for the Strategist 189
CHAPTERCASE 6 / Consider This... 189
CHAPTER 7
BUSINESS STRATEGY: INNOVATION AND
ENTREPRENEURSHIP 198
CHAPTERCASE 7
Wikipedia: The Free Encyclopedia 199
7.1 Competition Driven by Innovation 200The Innovation Process 202
7.2 Strategic and Social Entrepreneurship 2047.3 Innovation and the Industry Life Cycle 206
Introduction Stage 207
Growth Stage 209
Shakeout Stage 211
Maturity Stage 212
Decline Stage 212
Crossing the Chasm 213
7.4 Types of Innovation 219Incremental vs. Radical Innovation 220
Architectural vs. Disruptive Innovation 222
The Internet as Disruptive Force: The Long Tail 225
Open Innovation 227
7.5 Implications for the Strategist 230
CHAPTERCASE 7 / Consider This... 231
CONTENTS ix
WWW.YAZDANPRESS.COMWWW.YAZDANPRESS.COM

CHAPTER 8
CORPORATE STRATEGY: VERTICAL INTEGRATION
AND DIVERSIFICATION 240
CHAPTERCASE 8
Refocusing GE: A Future of Clean-Tech and Health Care? 241
8.1 What Is Corporate Strategy? 2428.2 The Boundaries of the Firm 244
Firms vs. Markets: Make or Buy? 245
Alternatives on the Make-or-Buy
Continuum 247
8.3 Vertical Integration along the Industry Value Chain 250
Types of Vertical Integration 251
Benefits and Risks of Vertical Integration 252
Alternatives to Vertical Integration 255
8.4 Corporate Diversification: Expanding Beyond a Single Market 256
Types of Corporate Diversification 257
Leveraging Core Competencies for Corporate
Diversification 260
Corporate Diversification and Firm Performance 263
8.5 Implications for the Strategist 266
CHAPTERCASE 8 / Consider This... 267
CHAPTER 9
CORPORATE STRATEGY: MERGERS
AND ACQUISITIONS, STRATEGIC
ALLIANCES 276
CHAPTERCASE 9
How Buzz Lightyear, Iron Man, and Darth Vader Joined Mickey’s Family 277
9.1 Mergers and Acquisitions 278Merging With Competitors 278
Why Do Firms Make Acquisitions? 280
M&A and Competitive Advantage 282
9.2 Strategic Alliances 283Why Do Firms Enter Strategic Alliances? 284
Governing Strategic Alliances 288
Alliance Management Capability 291
9.3 Implications for the Strategist 294
CHAPTERCASE 9 / Consider This... 296
CHAPTER 10
GLOBAL STRATEGY: COMPETING AROUND THE
WORLD 306
CHAPTERCASE 10
Hollywood Goes Global 307
10.1 What Is Globalization? 309Stages of Globalization 310
10.2 Going Global: Why? 313Advantages of Expanding Internationally 313
Disadvantages of Expanding Internationally 315
10.3 Going Global: Where and How? 318Where in the World to Compete? The CAGE Distance
Framework 318
How Do MNEs Enter Foreign Markets? 321
10.4 Cost Reductions vs. Local Responsiveness: The Integration-Responsiveness Framework 322
International Strategy 323
Multidomestic Strategy 325
Global-Standardization Strategy 325
Transnational Strategy 326
10.5 National Competitive Advantage: World Leader-ship in Specific Industries 327
Porter’s Diamond Framework 329
10.6 Implications for the Strategist 331
CHAPTERCASE 10 / Consider This... 332
PART THREE / STRATEGY IMPLEMENTATION 341
CHAPTER 11
ORGANIZATIONAL DESIGN: STRUCTURE, CULTURE,
AND CONTROL 342
CHAPTERCASE 11
Zappos: Designed to Deliver Happiness 343
11.1 How to Organize for Competitive Advantage 345Organizational Inertia and the Failure of Established
Firms 346
The Key Elements of Organizational Structure 346
Assembling the Pieces: Mechanistic vs. Organic
Organizations 349
11.2 Matching Strategy and Structure 351Simple Structure 351
Functional Structure 351
x CONTENTS
WWW.YAZDANPRESS.COMWWW.YAZDANPRESS.COM

Multidivisional Structure 355
Matrix Structure 357
11.3 Organizational Culture: Values, Norms, and Artifacts 359
Where Do Organizational Cultures Come From? 360
How Does Organizational Culture Change? 361
Organizational Culture and Competitive Advantage 361
11.4 Strategic Control-and-Reward Systems 363Input Controls 364
Output Controls 364
11.5 Implications for the Strategist 365
CHAPTERCASE 11 / Consider This... 367
CHAPTER 12
CORPORATE GOVERNANCE AND BUSINESS
ETHICS 376
CHAPTERCASE 12
HP’s Boardroom Soap Opera Continues 377
12.1 The Shared Value Creation Framework 380Public Stock Companies and Shareholder
Capitalism 380
Creating Shared Value 381
12.2 Corporate Governance 383Agency Theory 385
The Board of Directors 386
Other Governance Mechanisms 388
12.3 Strategy and Business Ethics 39212.4 Implications for the Strategist 395
CHAPTERCASE 12 / Consider This... 396
PART FOUR / MINICASES 405
1 Does Facebook Have a Strategy? 4062 Michael Phelps: The Greatest Olympian 4083 Teach For America: Inspiring Future Leaders 4104 Strategy and Serendipity: A Billion-Dollar
Bonanza 4125 The Wonder from Sweden: Is IKEA’s Success
Sustainable? 4136 Starbucks: Re-creating Its Uniqueness 4167 LVMH in China: Building Its Empire of Desire 418
8 GE under Jack Welch vs. Jeffrey Immelt 421 9 Competing on Business Models: Google vs.
Microsoft 42410 From Good to Great to Gone: The Rise and Fall of
Circuit City 42711 China’s Li Ning Challenges Nike and adidas 42912 Which Automotive Technology Will Win? 43213 Is Porsche Killing the Golden Goose? 43414 The Rise of Samsung Electronics 43715 Yummy Yum!’s Competitive Advantage in
China 44016 BYD—“Build Your Dreams” in America 44417 Alibaba and China’s E-Commerce: “Open
Sesame” Comes True 44618 The Premature Death of a Google Forerunner at
Microsoft 44919 Sony’s Structure and Competitive
Disadvantage 45120 UBS’s Billion-Dollar Ethics Scandals 454
HOW TO CONDUCT A CASE ANALYSIS 457
PART FIVE / FULL-LENGTH CASES
(All available through McGraw-Hill Create, www.McGrawHillCreate.com/Rothaermel)
Facebook (in 2013): Will Wall Street Hit the “Like” Button? ➼
Tesla Motors (in 2013): Will Sparks Fly in the Automobile Industry? ➼
Tesla Motors (in 2011) and the U.S. Auto Industry ➼
Tesla Motors (in 2009) and the U.S. Auto Industry ➼
The Movie Exhibition Industry 2013 Apple (in 2013): How to Sustain a Competitive
Advantage? ➼
Apple (in 2011) after Steve Jobs ➼
Make or Break at RIM (in 2013): Launching BlackBerry 10 ➼
McDonald’s (in 2013): How to Win Again? ➼
CONTENTS xi
FULL-LENGTH CASES MARKED WITH A ➼ WERE AUTHORED OR CO-AUTHORED SPECIFICALLY FOR THIS BOOK BY FRANK T. ROTHAERMEL.
WWW.YAZDANPRESS.COMWWW.YAZDANPRESS.COM

Amazon.com (in 2013): Will Amazon Kindle Another Fire? ➼
Best Buy’s Turn-Around Strategy (2013) ➼
Best Buy after Circuit City (in 2011): What’s Next? ➼
UPS in India (in 2011)—A Package Deal? ➼
Microsoft and Xbox (in 2012): The Battle for the Living Room
Grok (in 2013): Action Intelligence for Fast Data ➼
Numenta (in 2010): The Age of Truly Intelligent Machines? ➼
Genentech (in 2011): After the Acquisition by Roche ➼
Merck (in 2010): Open for Innovation? ➼
Healthymagination at GE (in 2011) ➼
Better World Books (in 2013): Social Entrepreneurship and the Triple Bottom Line ➼
Better World Books (in 2009): Social Entrepreneurship and the Triple Bottom Line ➼
Tropical Salvage’s Growth Strategy (in 2010): From Recession to Expansion
InterfaceRAISE (in 2010): Raising the Bar in Sustainability Consulting ➼
Siemens Energy (in 2010): How to Engineer a Green Future? ➼
IBM (in 2010) and the Emerging Cloud-Computing Industry (in 2010) ➼
Infosys Consulting in the U.S. (in 2010): What to Do Now? ➼
Bank of America (in 2010) and the New Financial Landscape ➼
Photo Credits 468
Name Index I-1
Company Index I-5
Subject Index I-10
xii CONTENTS
WWW.YAZDANPRESS.COMWWW.YAZDANPRESS.COM

xiii
CHAPTERCASES /
1 Apple: Once the World’s Most Valuable Company 3
2 PepsiCo’s Indra Nooyi: “Performance with a Purpose” 29
3 Tesla Motors and the U.S. Automotive Industry 57
4 Nike’s Core Competency: The Risky Business of Fairy Tales 97
5 Assessing Competitive Advantage: Apple vs. BlackBerry 129
6 P&G’s Strategic Position Weakens 1637 Wikipedia: The Free Encyclopedia 1998 Refocusing GE: A Future of Clean-Tech and
Health Care? 2419 How Buzz Lightyear, Iron Man, and Darth Vader
Joined Mickey’s Family 27710 Hollywood Goes Global 30711 Zappos: Designed to Deliver Happiness 34312 HP’s Boardroom Soap Opera Continues 377
CHAPTERCASES AND STRATEGY HIGHLIGHTS
STRATEGY HIGHLIGHTS /
1.1 JetBlue: “Stuck in the Middle”? 71.2 BP: “Lack of Business Integrity”? 172.1 Merck: Reconfirming Its Core Values 362.2 Starbucks’ CEO: “It’s Not What We Do” 463.1 How the Eurozone Crisis Is Hurting
Companies 623.2 The Five Forces in the Airline Industry 664.1 Applying VRIO: The Rise and Fall of
Groupon 1094.2 Bill “Lucky” Gates 1115.1 Interface: The World’s First Sustainable
Company 1475.2 Threadless: Leveraging Crowdsourcing to
Design Cool T-Shirts 1496.1 Trimming Fat at Whole Foods Market 1706.2 Ryanair: Lower Cost than the Low-Cost
Leader! 1737.1 Apple Leverages Network Effects to Propel
Growth 2087.2 GE’s New Innovation Mantra: Disrupt
Yourself! 2258.1 Toyota Locks Up Lithium for Car Batteries 2498.2 The Tata Group: Integration at the Corporate
Level 2609.1 Food Fight: Kraft’s Hostile Takeover of
Cadbury 2819.2 Strategic Alliances to Challenge Amazon 28510.1 Does GM’s Future Lie in China? 31410.2 Walmart Retreats from Germany 31611.1 W. L. Gore & Associates: Informality and
Innovation 34811.2 USA Today: Leveraging Ambidextrous
Organizational Design 35412.1 GE’s Board of Directors 38812.2 Did Goldman Sachs and the “Fabulous Fab”
Commit Securities Fraud? 393
WWW.YAZDANPRESS.COMWWW.YAZDANPRESS.COM
xiv
Frank T. Rothaermel Georgia Institute of Technology
FRANK T. ROTHAERMEL (PHD) is a professor of strategic man-
agement and holds the Russell and Nancy McDonough Chair in the
Scheller College of Business at the Georgia Institute of Technol-
ogy. Frank is also an Alfred P. Sloan Industry Studies Fellow. He
received a National Science Foundation (NSF) CAREER award,
which “is a Foundation-wide activity that offers the National Sci-
ence Foundation’s most prestigious awards in support of . . . those
teacher-scholars who most effectively integrate research and edu-
cation” (NSF CAREER Award description). Frank is also the area
coordinator for Strategic Management.
Frank’s research interests lie in the areas of strategy, innovation,
and entrepreneurship. To inform his research, he has conducted
extensive field work and executive training with leading corpora-
tions such as Amgen, Daimler, Eli Lilly, Equifax, GE Energy, GE
Healthcare, Hyundai Heavy Industries (South Korea), Kimberly-
Clark, Microsoft, McKesson, NCR, Turner (TBS), among others.
BusinessWeek named Frank one of Georgia Tech’s Prominent Fac-
ulty in its national survey of business schools. The Kauffman Foundation views Frank as
one of the world’s 75 thought leaders in entrepreneurship and innovation.
Frank has published some 30 articles in leading academic journals such as the Academy of Management Journal, Academy of Management Review, Organization Science, Strategic Management Journal, and elsewhere. Some of his academic articles are highly cited. Frank
currently serves (or served) on the editorial boards of the Academy of Management Journal, Academy of Management Review, Organization Science, Strategic Management Journal, and
Strategic Organization. Frank regularly translates his research findings for wider audiences
in articles in Forbes, MIT Sloan Management Review, The Wall Street Journal, and elsewhere.
He has received several recognitions for his research, including the Sloan Industry Stud-
ies Best Paper Award, the Academy of Management Newman Award, the Strategic Man-
agement Society Conference Best Paper Prize, the DRUID Conference Best Paper Award,
and the Israel Strategy Conference Best Paper Prize. He is also the inaugural recipient of
the Byars Faculty Excellence Award.
Frank has a wide range of teaching experience, including at the Georgia Institute of
Technology, Georgetown University, ICN Business School (France), Michigan State Uni-
versity, Politecnico di Milano (Italy), St. Gallen University (Switzerland), and the Univer-
sity of Washington. He received numerous teaching awards for excellence in the classroom.
Frank holds a PhD degree in strategic management from the University of Washington,
an MBA from the Marriott School of Management at Brigham Young University, and an
M.Sc. (Diplom-Volkswirt) in economics from University of Duisburg, Germany. He was a
visiting professor at the University of St. Gallen, Switzerland, and an Erasmus Scholar at
Sheffield Hallam University, UK. Frank is a member of the Academy of Management, the
Industry Studies Association (Founding Member), and the Strategic Management Society.
VISIT THE AUTHOR AT: www.ftrStrategy.com
ABOUT THE AUTHOR
WWW.YAZDANPRESS.COMWWW.YAZDANPRESS.COM

xv
The market responded very positively to the first edition, and I’m grateful for that strong
vote of confidence. In this second edition, I built upon the unique strengths of this text and
continue to improve it based on hundreds of insightful reviews and important feedback
from professors, students, and professionals. The vision for this text is to provide students
with core concepts, frameworks, and analysis techniques in strategy that will integrate
their functional course offerings and help them become managers who make well-rea-
soned strategic decisions. It is a research-based strategy text for the issues that managers
face in a globalized and turbulent 21 st century, blending theory, empirical research, and
practical applications in a student-accessible form.
The competition in the strategy textbook market can be separated into two overarch-
ing categories: traditional strategy books, which are the first-generation texts (from the
1980s); and more recent, research-based strategy books, which are the second-generation
texts (from the 1990s). This new text is different—a third-generation strategy text, posi-
tioned to compete successfully with the primary first- and second-generation incumbents.
The third-generation approach you will find here combines the student accessibility and
application-oriented frameworks found in first-generation texts with the strategy research
in the second-generation texts.
This text synthesizes and integrates theory, empirical research, and practical appli-
cations in a unique combination of rigor and relevance. With a single strong voice, the
chapters weave together classic and cutting-edge theory with in-chapter cases and strategy
highlights, to demonstrate how companies gain and sustain competitive advantage. The
strategic intent for the book is to combine quality and value with user-friendliness.
In particular, the content of this product is based on the principles discussed next, each
of which provides a value-added dimension for instructors or students, or both.
■ Synthesis and integration of rigorous and relevant strategy material . For example, the
text includes strategy material that has stood the test of time (such as the resource-based
view and Porter’s five forces model) as well as up-to-date strategy material and current
research (such as the dynamic capabilities perspective and the triple bottom line).
It also includes student-accessible coverage of strategic management research. It
draws on articles published in the leading academic journals (for instance, Strategic Management Journal, Academy of Management Journal/Review, Organization Sci-ence, Management Science, Journal of Management, and so on). Although academic
theory and empirical research form the foundation of the text, I also have integrated
insights from leading practitioner outlets (such as Harvard Business Review, Sloan Management Review, California Management Review ) to enhance the application of
concepts. To weave in current examples and developments, I draw on The Wall Street Journal, Bloomberg Businessweek, Fortune, Forbes, and others . In sum, theory is
brought to life via the embedded examples within each framework and concept.
■ The comprehensive yet concise presentation of core concepts, frameworks, and techniques . Although comprehensive, the text does not include every single idea ever
introduced to the strategy field. Many students don’t read the assigned readings in
their strategy textbooks because the books contain too much information, presented in
a disjointed fashion. Many strategy books read more like a literature review, without
addressing what the research findings mean and why they are important for manag-
ers. This jumble prevents students from seeing the bigger strategic picture. They may
see the trees, but they fail to see the forest. In contrast, this text will be an enjoyable
PREFACE
WWW.YAZDANPRESS.COMWWW.YAZDANPRESS.COM

read for students—clear, concise, and filled with examples from companies today’s
students know—while at the same time providing the content and value-add that
instructors expect. It has one vision and one voice! ■ Combination of traditional and contemporary chapters . As a review of the chapter-
contents listing will demonstrate, the text includes the traditional chapters needed in
the core strategy course. In addition, it includes three contemporary standalone chapters that reviewers and users have identified as providing additional value:
● Chapter 2, “Strategic Leadership: Managing the Strategy Process,” discusses the
roles of leaders in setting strategy within three different models: top-down plan-
ning, scenario planning, and strategy as planned emergence. This chapter allows for
a thorough discussion of the role of vision, mission, and values; customer versus
product-oriented missions; the combination of intended and emergent strategies;
and the importance of long-term success in anchoring a firm in ethical values.
● Chapter 5, “Competitive Advantage, Firm Performance, and Business Models,”
neatly ends the analysis section of the book by providing five approaches to mea-
suring firm performance and assessing competitive advantage. It looks at three tra-
ditional approaches to measure performance (accounting profitability, economic
value creation, and shareholder value creation) and at two holistic approaches
(the balanced scorecard and the triple bottom line). Instructors can easily cover as
many of the approaches as desired for their course and its goals. A new addition
is the detailed discussion of business models. Putting strategy into action through
innovative business models is becoming more and more important across all types
of industries.
● Chapter 7, Innovation and Strategic Entrepreneurship, addresses the important
topics of innovation and strategic entrepreneurship as aspects of business strat-
egy. Driven by Schumpeter’s “perennial gale of creative destruction,” competi-
tion seems more heated than ever, with innovation playing a key role in gaining
and sustaining competitive advantage. This chapter addresses various aspects of
innovation, beginning with the industry life cycle (ILC) and the modes of com-
petition and business-level strategies at various stages in the life cycle. Given the
importance of different customer preferences at different stages of the ILC, it
introduces the crossing-the-chasm framework and illustrates it with an application
to the smartphone industry. Using tools and concepts of strategic management, it
explores four types of innovation, social entrepreneurship, and the Internet as a
disruptive force. This chapter especially will engage students and provide much
food for thought in their jobs and careers.
■ Up-to-date examples and discussion of current topics within a global context. Having
spoken to hundreds of students around the world, I want to minimize the frustration
they express in seeing the same, out-of-date examples in so many of their (generic and
boiler-plate) business-school textbooks. The book has been written for today’s students
to reflect the turbulence and dynamism that they will face as managers. I have drawn
on up-to-date examples to illustrate how companies apply strategy concepts in today’s
business world. Although this text contains a standalone chapter on Global Strategy, examples throughout the book reflect the global nature of competition and the impor-
tance of emerging economies such as the BRIC countries and highlights non-U.S. com-
petitors such as Lenovo, Siemens, the Tata Group, and BYD in globalized industries.
Each chapter contains two Strategy Highlight boxes. These in-chapter examples
apply a specific concept to a specific company. They are right-sized for maximum
student appeal—long enough to contain valuable insights, and short enough to
xvi PREFACE
WWW.YAZDANPRESS.COMWWW.YAZDANPRESS.COM

encourage student reading. For a list of the Strategy Highlight companies and topics,
see page xiii.
I also have drawn topics and examples from recent and seminal business bestsell-
ers, such as The Black Swan; Built to Last; Co-opetition; Crossing the Chasm; Good Strategy, Bad Strategy; Good to Great; Great by Choice; How the Mighty Fall; In the Plex; Innovator’s Dilemma (and Solution); Innovator’s DNA; Lean In; Playing to Win; Predictably Irrational; Steve Jobs; The Long Tail; The Wide Lens; Wisdom of the Crowds; World 3.0; and Why Smart Executives Fail; among others. I have included
these ideas to expose students to topics that today’s managers talk about. Being con-
versant with these concepts from business bestsellers will help today’s students inter-
view better and effortlessly join the discourse in the corporate world.
■ Use of the AFI strategy framework. The book demonstrates that “less is more”
through a focused presentation of the relevant strategy content using A nalysis, F or-
mulation, and I mplementation as a guiding framework. This model (see Exhibit 1.5
on page 18) integrates process schools of strategy (based on organization theory,
psychology, and sociology) with content schools of strategy (based on economics).
Process and content can be viewed as the “yin and yang” of strategy. Current strategy
textbooks typically favor one or the other but do not integrate them, which leads to
an unbalanced and incomplete treatment of strategic management. The AFI strategy
strives for beauty through balance, which is lacking in most current strategy texts
on the market. The model also emphasizes that gaining and sustaining competitive
advantage is accomplished in an iterative and recursive fashion. The framework offers
a repository for theoretical strategy knowledge that is well translated for student con-
sumption, and it provides a toolkit for practicing managers.
■ High-quality cases, well integrated with textbook chapters. Cases are a fundamental
ingredient in teaching strategy. My interactions with colleagues, reviewers, and focus
group participants in the course of writing and developing chapters indicate varying
instructor needs for top-notch, up-to-date cases that are well-integrated with the con-
tent presented. Within this text itself are two types of cases:
● ChapterCases begin and end each chapter, framing the chapter topic and content.
The case at the beginning of the chapter highlights a strategic issue that a well-
known company faced and relates that company to a concept to be taught in the
chapter. The end of each chapter returns to the ChapterCase, in a recapitulation of
the case titled “Consider This. . .”. Here, we ask students to reconsider the case,
applying concepts and information presented in the chapter, along with additional
information about the focus company.
● 20 MiniCases, (following Chapter 12), all based on original research, provide
a decision scenario that a company’s manager might face. With suggested links
to related chapters, they offer dynamic opportunities to apply strategy concepts
by assigning them as add-ons to chapters, either as individual assignments or as
group work, or by using them for class discussion.
I have taken pride in authoring all of the ChapterCases and MiniCases. This
additional touch allows quality control and ensures that chapter content and cases
use one voice and are closely interconnected. Both types of case materials come
with sets of questions to stimulate class discussion or provide guidance for written
assignments. The instructor resources offer sample answers that apply chapter con-
tent to the cases.
■ In addition to these in-text cases, 24 full-length Cases, authored or co-authored by
me specifically to accompany this textbook, are available through McGraw-Hill’s
PREFACE xvii
WWW.YAZDANPRESS.COMWWW.YAZDANPRESS.COM

custom-publishing Create™ program. Full-length cases NEW to the second edition
address strategic issues at Facebook, McDonald’s, BlackBerry, and Amazon. Among
the others, the cases about BetterWorldBooks, Tesla Motors, Numenta, Best Buy, and
Apple have been updated and revised for the new edition. Also available are three
full-length cases—about Microsoft, Tropical Salvage, and the movie industry—
authored by other strategic-management instructors. Robust case teaching notes and
financial data are available for all full-length cases accessed through Create.
■ Direct applications of strategy to careers and lives . The examples in the book discuss
products and services from companies with which students are familiar, such as Face-
book, Starbucks, Apple, and Zipcar. Use of such examples aids in making strategy rel-
evant to students’ lives and helps them internalize strategy concepts and frameworks.
This edition also provides a stronger focus on practice/applications. Each chapter now
closes with a section titled Implications for the Strategist that highlights practical implica-
tions of the concepts and frameworks discussed and allows the student to build a cumula-
tive toolkit in strategic management. It bridges the gap to practical application and makes
the reader more confident in using the tools presented.
In addition, at the end of each chapter’s homework materials is an innovative text fea-
ture, titled my Strategy, which personalizes strategy concepts through direct application of
the chapter topic to students’ lives. Questions asked in these sections include: What is your positioning strategy in the job market? How will you differentiate yourself, and at what cost? and How much is an MBA worth to you? Such questions encourage students to think
through strategic issues related to their budding careers. You may choose to make this
feature a regular part of the course, or you may prefer to let students explore these items
outside of the regular coursework. Either way, the my Strategy feature demonstrates oppor-
tunities to personalize strategy as students plan or enhance careers following completion of
the strategy course and their degrees.
For details about changes made in the second edition, see the list that follows.
What’s New in the Second Edition
I have revised and updated the second edition in the following ways, many of which were
inspired by conversations and feedback from users and reviewers of the first edition.
CHANGES MADE THROUGHOUT
■ ChapterCases and Strategy Highlights throughout have been either completely revised
and updated or are new, as detailed in the following chapter-by-chapter entries.
■ All major text examples have been updated or are new, with more in-depth discussion.
■ More global coverage is included throughout, with a stronger China focus (both on
the country as well as its global competitors).
■ Additional coverage and discussion of more diverse strategic leaders has been included.
■ Chapters now consistently contain two Strategy Highlight features per chapter.
■ Chapters now contain a stronger practice/application focus throughout. Each chapter
now closes with a section discussing practical Implications for the Strategist. ■ Following Chapter 12 are 20 MiniCases—13 are brand-new MiniCases, many of
which focus on China and Chinese companies competing in the West, and the remain-
ing 7 are updated from the first edition.
xviii PREFACE
WWW.YAZDANPRESS.COMWWW.YAZDANPRESS.COM
■ Four brand-new full-length Cases (Facebook, McDonald’s, BlackBerry, and Amazon)
are available through McGraw-Hill Create (including financial data in e-format for
analysis available through McGraw-Hill Connect).
■ There is continued focus on providing a streamlined presentation by dropping some
material when adding new content. This focus results in a fast-paced, reader-friendly
text.
CHAPTER 1
■ New ChapterCase about Apple’s rise and current challenges to sustain a competitive
advantage.
■ Draws on Rumelt’s insightful book Good Strategy, Bad Strategy to more clearly delin-
eate the concept of strategy.
■ Sharpened the definitions of strategy and competitive advantage. Part of this involved
removing the section on “strategy as a theory of how to compete.”
■ Moved all stakeholder material (from Chapter 12) into Chapter 1.
■ Now includes an extensive discussion of stakeholder strategy and corporate social
responsibility in Chapter 1, to provide the foundation for that concept throughout the
chapters.
■ Moved a revised section of “Formulating Strategy Across Levels” to Chapter 2.
■ Moved discussion on business models to Chapter 5, where it could be expanded.
■ New Strategy Highlight 1.1 discussing the difficulty JetBlue experienced in trying to
combine two different competitive strategies (low cost and differentiation).
■ New Strategy Highlight 1.2 about BP’s 2010 Gulf Coast oil spill and systemic safety
issues over the last decade.
■ New discussion and ethical/social issues questions about stakeholder relationships.
■ Two new small-group exercises (one on black swan events and the other about the
dangers of unclear choice of strategy).
CHAPTER 2
■ New ChapterCase, about Indra Yoori as a strategic leader.
■ Tightened chapter by moving/deleting section on strategic intent, thereby more
closely linking discussions of vision and mission.
■ Added extended coverage of strategic leadership (previously in Chapter 12) into
Chapter 2, to highlight the role of strategic leaders early on in the chapters.
■ Added a revised and updated section on formulating strategy across business levels
(from Chapter 1 in 1e), with more examples provided; leads into coverage of the stra-
tegic management and types of strategic planning.
■ Emphasized the role of strategic leaders in shaping strategy formulation and the strat-
egy process.
■ New Strategy Highlight 2.1 on Merck’s core values and the development of drugs to
treat river blindness and the challenges with the Vioxx recall.
■ Added new ethical/social issues question asking students to identify whether actual com-
pany vision/mission statements are customer- or product-oriented, or a combination.
■ Added a new small-group exercise related to STEM (science, technology, engineer-
ing, and math) disciplines and U.S. competitiveness.
PREFACE xix
WWW.YAZDANPRESS.COMWWW.YAZDANPRESS.COM

CHAPTER 3
■ New ChapterCase about Tesla Motors and the U.S. automotive industry.
■ Sharpened the PESTEL discussion by subsuming Political/Legal factors and updating
examples.
■ Added new Strategy Highlight 3.1 on the Eurozone crisis (in the PESTEL discussion).
■ Significantly expanded discussion of Porter’s five forces to allow for in-depth treat-
ment with current example (including new Strategy Highlight 3.2 on the five forces in
the airline industry).
■ Added B-section titled “Competition in the Five Forces Model” to highlight two key
assumptions in this model.
■ Subsumed structure-conduct-performance (SCP) model under “Rivalry among Exist-
ing Competitors” following Porter’s seminal work in Competitive Strategy. ■ Expanded discussion of SWOT with application example.
■ Added new C-heads under threat of entry: network effects, economies of scale, cus-
tomer switching costs, capital requirements, advantages independent of size, govern-
ment policy, and threat of retaliation.
■ Expanded the section on rivalry among existing competitors: Moved the discussion
of industry structure and types into this section (the fifth force), in the subsection on
competitive industry structure.
■ Added Exhibit 3.4, “The Five Forces Competitive Analysis Checklist.”
■ Added small-group exercise (ethical/social issues) asking students to propose new
guidelines for helping Kraft promote food to children in a socially responsible way.
CHAPTER 4
■ New ChapterCase 4: Nike’s Core Competency: The Risky Business of Fairy Tales
■ Changes in chapter sequence: (1) Moved the section on how to sustain a competitive
advantage to precede the value chain section. (2) Also moved the section on dynamic
capabilities to earlier in the chapter; now precedes the value chain analysis.
■ In the value chain analysis section, provided examples for low-cost and differentiated
value chain.
■ New Strategy Highlight 4.1: Applying VRIO: The rise and fall of Groupon.
■ Discussed Circuit City as an in-text example of what happens when not reinvesting,
honing, and upgrading core competencies.
■ Expanded discussion of SWOT and added analysis of McDonald’s in the implications
for the strategist section.
■ Used a new example for path dependence—why the U.S. carpet industry is based in
Georgia.
■ Added activities, capabilities, dynamic capabilities, and isolating mechanisms as key terms.
■ Sharpened definitions and treatment of differences among resource, capability, and
core competence in both text and art.
■ New discussion question asks students to conduct a value chain analysis for McDonald’s
and then analyze whether changes in its priorities affected its value chain.
■ Small-Group Exercise 2 asks students to build on the Groupon Strategy Highlight in
the chapter in ways that will build dynamic capabilities and make its competencies
more difficult to imitate.
xx PREFACE
WWW.YAZDANPRESS.COMWWW.YAZDANPRESS.COM

CHAPTER 5
■ New ChapterCase, focusing on Apple vs. BlackBerry.
■ Rearranged topics in first section (on firm performance), to put accounting profitabil-
ity first, followed by shareholder value creation, and then economic value creation,
balanced scorecard, and triple bottom line.
■ Used Apple and BlackBerry data to analyze and compare profitability.
■ Updated exhibits related to accounting profitability (e.g., stock market valuations of
Amazon, Apple, Google, Microsoft, and Samsung; market capitalization of Apple).
■ In shareholder value section, added key term market capitalization. ■ Added section on corporate social responsibility, in triple bottom line section.
■ Added section on business models (razor-razor blade; subscription-based; pay as you
go; freemium).
■ In the business models section, added a detailed discussion of business model innova-
tion, an in-text example about Zipcar, and a Strategy Highlight about Threadless.
■ Revised the economic value creation discussion to focus on two companies, with the
same costs but slightly different strategies. Added two new exhibits showing eco-
nomic value creation for two different firms (situations)—Exhibits 5.5 and 5.6.
■ New discussion question related to the Threadless Strategy Highlight.
■ Added a new small-group exercise asking students to prepare a presentation in sup-
port of the triple-bottom-line approach.
CHAPTER 6
■ New ChapterCase, about recent strategic initiatives at P&G that were intended to help
strengthen its competitive position, including bringing back A. G. Lafley.
■ New Strategy Highlight 6.1 on Whole Foods (was the ChapterCase in 1e).
■ Revised integration strategy example uses stores (Nordstrom, Target, Walmart) rather
than cosmetics companies.
■ Moved discussion of integration strategy at the corporate level to Chapter 8.
■ Added new heading for stuck in the middle (“Integration Strategy ‘Gone Bad’”) and
used JCPenney as a text example.
■ Moved discussion of mass customization into the section on integrated strategy.
■ Clarified Exhibit 6.6 on effects of learning and experience.
■ Reconceptualized the exhibit on value and cost drivers (now Exhibit 6.10).
■ Changed ethical/social issue questions about scale of production and learning curves
to a discussion question.
■ Added a new ethical/social issue question relating to Whole Foods’ business strategy
and healthy foods.
CHAPTER 7
■ Updated ChapterCase about Wikipedia.
■ New section on the innovation process, introducing the “four I’s”—idea, invention,
innovation, imitation.
■ Expanded section on entrepreneurship, including corporate and social entrepreneurship.
■ Expanded the discussion of the industry life cycle section, including a subsection on
the “shakeout stage.”
PREFACE xxi
WWW.YAZDANPRESS.COMWWW.YAZDANPRESS.COM
■ Added a new application of the industry life cycle to the smartphone industry in
emerging and developed economies.
■ Added Geoffrey Moore’s “crossing the chasm” framework (unique to this text),
including a text example of the application of this model to innovation in the smart-
phone industry.
■ Added a subsection, including exhibits, on closed versus open innovation.
■ Updated the discussion on accelerating technological change and moved the exhibit
(from Chapter 1 in 1e).
■ Clarified the text and retitled the exhibit on product and process innovation and the
emergence of an industry standard, to make clear that this concept applies throughout
the entire industry life cycle.
■ New key terms added: first-mover advantages, invention, patent, crossing the chasm, innovation ecosystem, organizational inertia, Pareto principle, closed innovation, open innovation.
■ Added a discussion question asking students to think about the effect of the Internet
on retailing and how retailers might respond.
■ Added a discussion question asking students to explore stories about low-tech
innovations.
■ Added a small-group exercise related to P&G’s Connect 1 Develop open innovation
system.
CHAPTER 8
■ In the discussion of transaction cost economics, clarified the discussion on economies
of scale and economies of scope. Also, changed discussion of the scope of the firm to
the boundaries of the firm. ■ Added new Exhibit 8.1 showing internal and external transaction costs, to aid students
in understanding this somewhat abstract but critical concept in corporate strategy.
■ Moved discussion of integration strategy at the corporate level to this chapter, where it
now appears as Strategy Highlight 8.2 on the Tata Group, a multinational conglomerate.
■ Added Exhibit 8.12 on dynamic corporate strategy, contrasting Nike and adidas.
■ In Exhibit 8.2, added “Transaction-specific investments” in the Advantages/Firm box.
■ Deleted all references to horizontal integration. ■ Added as key terms internal transaction costs, external transaction costs, core com-
petence-market matrix, and strategic alliances. ■ Expanded Discussion Question 2 to apply it to Delta’s vertical integration decision.
■ Expanded Ethical/Social Issues Question 1 to ask students how firms can outsource
HR management systems but continue to show their commitment to employees.
CHAPTER 9
■ New ChapterCase about Disney and its serial acquisitions of Pixar, Marvel, and Lucas
Films. Expanded and updated the discussion of M&A and its strategic alliances.
■ Moved discussion of principal–agent problems to first in the list of reasons for mergers.
■ Added discussion of real-options perspective into the section on strategic alliances.
■ Added discussion of the new build-borrow-or-buy framework (Capron and Mitchell),
with accompanying exhibit, in the Implications for the Strategist section.
xxii PREFACE
WWW.YAZDANPRESS.COMWWW.YAZDANPRESS.COM

■ Added examples of serial acquisitions (e.g., Google bought YouTube; Google bought
Waze to pre-empt Apple and FB; Google acquired Motorola’s cell phone unit to be able
to integrate hardware with software; Facebook bought Instagram; Yahoo bought Tumblr).
■ Added as key terms: co-opetition, build-borrow-or-buy framework. ■ Added discussion question about expected failure rates when merging with competi-
tors as opposed to acquiring smaller companies.
■ Added new ethical/social issues question about IKEA’s strategic use of nonequity alli-
ances and stakeholder partnerships.
■ Added a new small-group exercise about the wave of consolidations in the U.S. office
furniture-manufacturing industry located primarily in Michigan.
■ Revised the second small-group exercise about social media usage in 2012 by the For-
tune Global 100 companies.
CHAPTER 10
■ Updated the ChapterCase with new data about the global appeal of Hollywood mov-
ies especially in regard to China.
■ Revised the discussion of the integration-responsiveness framework to use more
traditional terminology: international strategy, multidomestic strategy, global-
standardization strategy, transnational strategy.
■ Changed discussion of the stages of globalization from a Strategy Highlight box to text.
■ Added discussion of Ghemawat’s World 3.0 framework.
■ Clarified discussion of the disadvantages of expanding internationally.
■ Added the CAGE (cultural, administrative, geographic, and economic) distance
framework by Ghemawat (unique to this strategy text), with an accompanying exhibit.
■ Streamlined coverage of Hofstede’s national culture model.
■ Added MTV as an example of an ineffective global-standardization strategy: started
with global strategy, moved to multidomestic, now moving to transnational strategy.
■ Added new Exhibit 10.6 to show dynamic strategic positioning for MTV Music Channel.
■ Added as key terms: CAGE distance framework, multidomestic strategy. ■ Added Discussion Question 3 about Ghemawat argument that the world isn’t “flat”
but is “semi-globalized.”
■ Added a new Ethical/Social Issues section question asking students to predict the per-
sistence of Globalization 3.0 and to project what Globalization 4.0 might look like.
■ Added Small-Group Exercise 1 about employment changes as U.S. companies
become more globalized.
■ Added new my Strategy feature about a personal strategy for building the three com-
ponents of a global mind-set.
CHAPTER 11
■ Introduced new model of how to assess strategic initiatives in regard to time horizon
and resources required.
■ Expanded discussion of SWOT implementation with application example (McDonald’s)
in the “Implications for the Strategist” section.
■ Added and discussed key term: core rigidity. ■ Added new Discussion Question 2 asking students to describe the values, norms, and
artifacts of an organization with which they are familiar.
PREFACE xxiii
WWW.YAZDANPRESS.COMWWW.YAZDANPRESS.COM

■ Added new Ethical/Social Issues section question about organization culture and
sports teams.
■ Added a new small-group exercise asking students to think about how a university
might apply the ROWE theory.
CHAPTER 12
■ New ChapterCase on the continuing boardroom soap opera at Hewlett-Packard (high-
lighting how much HP deviated from its celebrated HP Way, shown in Exhibit 12.1).
■ Strengthened the focus on the board of directors as a key corporate governance
mechanism.
■ Expanded the discussion of corporate governance and moved it to earlier in the chap-
ter. Expansion includes more on agency theory (with related exhibit), adverse selec-
tion, moral hazard.
■ Integrated discussion (and related exhibit) of a survey about attitudes toward corpo-
rate social responsibility across the globe.
■ Added new discussion of Porter’s shared value creation framework (unique to this
text).
■ Added current examples: Galleon Group’s founder, Raj Rajaratnam; Carl Icahn’s
attempted LBO of Dell; Fabrice Tourre of Goldman Sachs.
■ Added as key terms: shared value creation framework, adverse selection, moral haz-ard, leveraged buyout.
■ Added new Strategy Highlight 12.2 on securities fraud by Fabrice Tourre at Goldman
Sachs, and the resulting revision to Goldman’s code of conduct.
■ Moved section on strategic leadership to Chapter 2.
■ Moved stakeholder impact analysis to Chapter 1.
■ Moved discussion of corporate social responsibility to Chapters 1 and 5.
■ Added new discussion question about the Business Roundtable’s recommendation
that the CEO not also serve as chairman of the board.
■ Added new discussion question about how Nike might apply the shared value creation
framework to global economic and social needs.
■ Revised questions related to Small-Group Exercise 2 about the female and minority
participation on corporate boards.
MINICASES
■ Added 13 brand-new MiniCases, many of which focus on China and Chinese compa-
nies competing in the West.
■ Updated seven MiniCases from the first edition.
FULL-LENGTH CASES
■ Added four brand-new, full-length Cases: Facebook, McDonald’s, BlackBerry, and
Amazon.
■ Revised and updated: BetterWorldBooks, Tesla Motors, Numenta, Best Buy, and Apple.
■ All cases —including the new and revised cases plus all cases from the first edition
that were authored by Frank Rothaermel— are available through McGraw-Hill Create. Cases include financial data in e-format for analysis.
xxiv PREFACE
WWW.YAZDANPRESS.COMWWW.YAZDANPRESS.COM

Instructor Resources
Multiple high-quality, fully integrated resources are available to make your teaching life easier:
■ Connect, McGraw-Hill’s online assignment and assessment system, offers a wealth
of content for both students and instructors. Students will find interactive applica-
tions, chapter quizzes, templates for financial analysis, video cases, and—new in this
edition—SmartBook and LearnSmart. Instructors will find tested and effective tools
that enable automatic grading and student-progress tracking and reporting, and a trove
of content to support teaching:
● The Instructors Manual (IM) includes thorough coverage of each chapter. New
in this edition, we offer two versions of the IM, for newer and experienced faculty.
Included in both versions are the appropriate level of theory, recent application or
company examples, teaching tips, PowerPoint references, critical discussion top-
ics, and answers to end-of-chapter exercises.
● The PowerPoint (PPT) slides provide comprehensive lecture notes, video links,
and company examples not found in the textbook. There will be instructor media-
enhanced slides as well as notes with outside application examples.
● The Test Bank includes 100–150 questions per chapter, in a range of formats and
with a greater-than-usual number of comprehension, critical-thinking, and appli-
cation (or scenario-based) questions. It’s tagged by learning objective, Bloom’s
Taxonomy levels, and AACSB compliance requirements.
● Links to videos that relate to concepts from chapters. The video links include
sources such as Big Think, Stanford University’s Entrepreneurship Corner, The McKinsey Quarterly, ABC, BBC, CBS, CNN, ITN/Reuters, MSNBC, NBC, PBS,
and YouTube . ■ The Online Learning Center (OLC), located at www.mhhe.com/ftrStrategy2e,
offers resources for both instructors and students:
● At the instructors’ portion of the OLC, which is password-protected, instructors
can access all of the teaching resources described earlier, a Case Matrix relating
cases to concepts within the chapters, and comprehensive Case Teaching Notes,
including case financial analysis.
● At the students’ portion of the OLC, students can take chapter quizzes to review
concepts and click on links to videos that relate back to concepts covered in the
chapter and/or cases.
Frank Rothaermel was closely involved in developed all ancillaries, to ensure full inte-
gration with the strategy content in the text.
TEGRITY CAMPUS
Tegrity Campus makes class time available 24/7 by automatically capturing every lecture
in a searchable format for students to review when they study and complete assignments.
With a simple one-click start-and-stop process, you capture all computer screens and cor-
responding audio. Students can replay any part of any class with easy-to-use browser-
based viewing on a PC or Mac.
Tegrity Campus’ unique search feature helps students efficiently find what they need,
when they need it, across an entire semester of class recordings. Help turn all your stu-
dents’ study time into learning moments immediately supported by your lecture.
To learn more about Tegrity, watch a two-minute Flash demo at http://tegritycampus.
mhhe.com .
PREFACE xxv
WWW.YAZDANPRESS.COMWWW.YAZDANPRESS.COM

SIMULATIONS
■ McGraw-Hill has two current strategy simulations—Business Strategy Game and
GLO-BUS—that can be used with the textbook.
■ For more information, contact your local McGraw-Hill sales representative.
MCGRAW-HILL CUSTOMER CARE CONTACT INFORMATION
At McGraw-Hill, we understand that getting the most from new technology can be chal-
lenging. That’s why our services don’t stop after you purchase our products. You can
e-mail our Product Specialists 24 hours a day, seven days a week, to get product-training
online. Or you can search our knowledge bank of Frequently Asked Questions on our sup-
port website. For Customer Support, call 800-331-5094, e-mail hmsupport@mcgraw-hill.
com , or visit www.mhhe.com/support . One of our Technical Support Analysts will be able
to assist you in a timely fashion.
ASSURANCE OF LEARNING READY
Many educational institutions today are focused on the notion of assurance of learning, an important element of many accreditation standards. Strategic Management is designed
specifically to support your assurance of learning initiatives with a simple yet powerful
solution.
Each chapter in the book begins with a list of numbered learning objectives, which
appear throughout the chapter as well as in the end-of-chapter assignments. Every Test
Bank question for Strategic Management maps to a specific chapter learning objective
in the textbook. Each Test Bank question also identifies topic area, level of difficulty,
Bloom’s Taxonomy level, and AACSB skill area. You can use our Test Bank software, EZ Test and EZ Test Online, or Connect Management to easily search for learning objectives
that directly relate to the learning objectives for your course. You can then use the reporting
features of EZ Test to aggregate student results in a similar fashion, making the collection
and presentation of Assurance of Learning data simple and easy.
AACSB STATEMENT
McGraw-Hill/Irwin is a proud corporate member of AACSB International. Understanding
the importance and value of AACSB accreditation, Strategic Management recognizes the
curricula guidelines detailed in the AACSB standards for business accreditation by con-
necting selected questions in the Test Bank to the general knowledge and skill guidelines
in the AACSB standards.
The statements contained in Strategic Management are provided only as a guide for
the users of this textbook. The AACSB leaves content coverage and assessment within
the purview of individual schools, the mission of the school, and the faculty. While Stra-tegic Management and the teaching package make no claim of any specific AACSB quali-
fication or evaluation, we have within Strategic Management labeled selected questions
according to six of the general knowledge and skills areas.
xxvi PREFACE
WWW.YAZDANPRESS.COMWWW.YAZDANPRESS.COM

Acknowledgments
Any list of acknowledgments will almost always be incomplete, but I would like to thank
some special people without whom this text would not have been possible. First and fore-
most, my wife Kelleyn, and our children: Harris, Winston, Roman, and Adelaide. Over the
last few years, I have worked longer hours than when I was a graduate student to conduct
the research and writing necessary for this text and accompanying case studies and other
materials. I sincerely appreciate the sacrifice this has meant for my family.
I was also fortunate to work with McGraw-Hill, and the best editorial and market-
ing team that one can imagine: Michael Ablassmeir (Executive Brand Manager), Paul
Ducham (Managing Director), Ann Torbert (Executive Director of Development), Laura
Griffin (Senior Development Editor), Elizabeth Trepkowski (Marketing Manager), Emily
Hatteberg (Content Development Editor), Harvey Yep (Content Project Manager), and
Matt Diamond (Designer). Thank you to senior management at McGraw-Hill Education
who assembled this fine team.
I was more than fortunate to work with a number of great colleagues on various
resources that accompany this text. Their names and the resources they helped with follow:
■ Marne Arthaud-Day (Kansas State University) on some Cases and Case Teaching Notes
■ John Burr (Purdue University) on some Cases and Teaching Notes
■ Anne Fuller (California State University, Sacramento), Connect digital co-author
■ Syeda Noorein Inamdar (San Jose State University) on videos for the chapters and MiniCases
■ Carol Jacobson (Purdue University) on end-of-chapter material ■ David R. King (Iowa State University) on some Case Teaching Notes
■ Louise Nemanich (Arizona State University) on the Instructor Resource Manual ■ Charles Newman (University of Maryland University College), on videos for the full-
length Cases
■ Chris Papenhausen (University of Massachusetts, Dartmouth) on Strategic Financial Analysis
■ Robert Porter (University of Central Florida) on the Running Case in Connect ■ Marta Szabo White (Georgia State University) on the PowerPoint Slide Decks
■ Erin Zimmer (Northwood University) on some Cases and Case Teaching Notes
Over the years, I have been privileged to work with Karyn Lu, a superb copyeditor, on
my scholarly research papers, and on this project. Karyn has been much more than a copy-
editor, she has been a sounding board for ideas and has helped to make the delivery of the
content as user-friendly as possible. Karyn was also instrumental in launching the social
media support for professors and students on www.ftrStrategy , the Facebook strategy blog,
and the Twitter feed for this text, a novel addition in the strategy content market.
I would also like to thank Kelly Byrom for sharing her expertise in creating a sophisti-
cated graphic design for the exhibits; Melissa Appleyard (Portland State University) and
Carol Jacobson (Purdue University) for providing solid content and editorial suggestions;
and Andrea Meyer and Laura Winig for superb case content editing.
The Georgia Institute of Technology provided a conducive intellectual environment
and superb institutional support to make this project possible. I thank Russell and Nancy
McDonough for generously funding the endowed chair that I am honored to hold. I’m grate-
ful for Dean Salbu and Senior Associate Dean Narasimhan for providing the exceptional
PREFACE xxvii
WWW.YAZDANPRESS.COMWWW.YAZDANPRESS.COM

leadership that allows faculty to fully focus on research, teaching, and service. I have been
at Georgia Tech for over a decade, and could not have had better colleagues—all of whom
are not only great scholars but also fine individuals whom I’m fortunate to have as friends:
Marco Ceccagnoli, Annamaria Conti, Stuart Graham, Matt Higgins, David Ku, Jay Lee,
John McIntyre, Alex Oettl, Henry Sauermann, Jerry Thursby, Marie Thursby, and Uriel
Stettner at Georgia Tech. We have a terrific group of current and former PhD students,
many of whom had a positive influence on this project, including Shanti Agung (Drexel
University), Drew Hess (University of Virginia), Kostas Grigoriou (Florida International
University), Jaiswal Mayank, Nicola McCarthy, German Retana (INCAE Business School,
Costa Rica), Briana Sell, Jose Urbina, Carrie Yang, and Wei Zhang (Singapore Manage-
ment University).
I’d also like to thank the students at Georgia Tech, in the undergraduate and full-time
day MBA, and the evening and executive MBA programs, as well as the executive MBA
students from the ICN Business School in Nancy, France, on whom the materials were
beta-tested. Their feedback helped fine-tune the content and delivery. Last, but certainly
not least, I wish to thank the reviewers and focus group attendees who shared their exper-
tise with us, from the very beginning when we developed the prospectus to the final text
and cases that you hold in your hands. The reviewers have given us the greatest gift of
all—the gift of time! These very special people are listed starting on page xxxi.
I have long yearned to write a text that shows students and managers how exciting stra-
tegic management can be, but that at the same time presents the recent developments in
the field, including the rigor upon which concepts and frameworks are now built, to make
better strategic decisions in a turbulent and dynamic world. I’m fortunate that I had the
support of many people to make this vision become a reality, and I’m truly grateful.
Frank T. Rothaermel
Georgia Institute of Technology
Web: http://ftrStrategy.com
Strategy Blog: http://www.facebook.com/ftrStrategy
Twitter: @ftrStrategy
xxviii PREFACE
WWW.YAZDANPRESS.COMWWW.YAZDANPRESS.COM
xxix
This book has gone through McGraw-Hill Education’s thorough development process.
Over the course of several years, the project has benefited from numerous developmental
focus groups and symposiums, from hundreds of reviews from reviewers across the coun-
try, and from beta-testing of the first-edition manuscript on a variety of campuses. The
author and McGraw-Hill wish to thank the following people who shared their insights,
constructive criticisms, and valuable suggestions throughout the development of this proj-
ect. Your contributions have improved this product.
Second Edition
REVIEWERS
Todd Alessandri
Northeastern University
Cory J. Angert
University of Houston-Downtown
Asli Arikan
The Ohio State University
Jeffery Bailey
University of Idaho
Kevin Banning
Auburn University at Montgomery
Jeff Barden
Oregon State University
Patricia Beckenholdt
University of Maryland University College
John Burr
Purdue University
Richard A. L. Caldarola
Troy University
Brent Clark
University of South Dakota
Timothy S. Clark
Northern Arizona University
Anne N. Cohen
University of Minnesota
Brian Connelly
Auburn University
W. J. Conwell
University of Texas at El Paso
Cynthia S. Cycyota
United States Air Force Academy
Samuel DeMarie
Iowa State University
Irem Demirkan
Northeastern University
Geoffrey Desa
San Francisco State University
Edward Desmarais
Salem State University
Michael E. Dobbs
Eastern Illinois University
William J. Donoher
Missouri State University
Tom Douglas
University of Maryland University College and Colorado State University
Stephen A. Drew
Florida Gulf Coast University
Derrick E. D’Souza
University of North Texas
Helen Eckmann
Brandman University
Linda Edelman
Bentley University
Alan Ellstrand
University of Arkansas-Fayetteville
David Epstein
University of Houston-Downtown
James Fiet
University of Louisville
William Foxx
Troy University
Patrick Greek
Macomb Community College
Shirley A. Green
Indian River State College
Regina A. Greenwood
Nova Southeastern University
Robert D. Gulbro
Athens State University
Craig Gustin
Arizona State University
Ahma Hassan
Morehead State University
Scott D. Hayward
Appalachian State University
Theodore T. Herbert
Rollins College
Scott Hicks
Liberty University
Glenn Hoetker
Arizona State University
R. Michael Holmes, Jr.
Florida State University
Tammy Huffman
Utah Valley University
THANK YOU . . .
WWW.YAZDANPRESS.COMWWW.YAZDANPRESS.COM

Syeda Noorein Inamdar
San Jose State University
Ana Elisa Iglesias
Tulane University
Sean Jasso
University of California, Riverside
Mahesh P. Joshi
George Mason University
Brent Kinghorn
Missouri State University
Frank Kozak
Bowling Green State University
Mario Krenn
Louisiana State University
Melody LaPreze
Missouri State University
Hun Lee
George Mason University
Tammy G. Hunt
University of North Carolina Wilmington
Charles J. F. Leflar
University of Arkansas-Fayetteville
Aristotle T. Lekacos
Stony Brook University
Tatiana S. Manolova
Bentley University
Daniel B. Marin
Louisiana State University
Sarah Marsh
Northern Illinois University
Patricia Matuszek
Troy University-Montgomery
Jeffrey E. McGee
The University of Texas at Arlington
Mike Montalbano
Bentley University
Todd Moss
Oregon State University
John Mullane
Middle Tennessee State University
Chandran Mylvaganam
Northwood University-Michigan
Charles Newman
University of Maryland University College
Jill Novak
Indian River State College
Frank Novakowski
Davenport University
Jeffrey R. Nystrom
University of Colorado Denver
Kenny (Kyeungrae) Oh
University of Missouri-St. Louis
Kevin J. O’Mara
Elon University
Eren Ozgen
Troy University-Dothan
Mark Packard
University of Missouri-Columbia
Clifford R. Perry
Florida International University
Antoaneta Petkova
San Francisco State University
Erin Pleggenkuhle-Miles
University of Nebraska-Omaha
Robert Porter
The University of Central Florida
Vasudevan Ramanujam
Case Western Reserve University
Christopher Reutzel
Utah State University
Gary B. Roberts
Kennesaw State University
Elton Scifres
Stephen F. Austin State University
Tim Schoenecker
Southern Illinois University-Edwardsville
Wendell Seaborne
Franklin University
Deborah Searcy
Florida Atlantic University
Jennifer Sexton
Florida State University
Eugene Simko
Monmouth University
Ned Smith
University of Michigan
Mark Starik
San Francisco State University
Mohan Subramaniam
Boston College
Ram Subramanian
Montclair State University
Jing’an Tang
Sacred Heart University
Paul W. Thurston, Jr.
Siena College
Jorge Walter
The George Washington University
Marta Szabo White
Georgia State University
Carolyn Wiethoff
Indiana University
Beth Woodard
Belmont University
Chuanyin Xie
The University of Tampa
SYMPOSIUM ATTENDEES
M. David Albritton
Northern Arizona University
xxx THANK YOU . . .
WWW.YAZDANPRESS.COMWWW.YAZDANPRESS.COM

Melissa Appleyard
Portland State University
LaKami T. Baker
Auburn University
James W. Bronson
University of Wisconsin-Whitewater
Barry Bunn
Valencia College
Janice F. Cerveny
Florida Atlantic University
Brian Connelly
Auburn University
John E. Gentner
University of Dayton
Theodore A. Khoury
Portland State University
Jerry Kopf
Radford University
Hun Lee
George Mason University
Rick McPherson
University of Washington
John M. Mezias
University of Miami
Don O. Neubaum
Oregon State University
Charles Newman
University of Maryland University College
Frank Novakowski
Davenport University
Don A. Okhomina
Fayetteville State University
Clifford R. Perry
Florida International University
Carolyn Wiethoff
Indiana University
Scott Williams
Wright State University
Cathy Coleman Wood
University of Tennessee
First Edition
REVIEWERS
Joshua R. Aaron
East Carolina University
Moses Acquaah
University of North Carolina at Greensboro
Garry Adams
Auburn University
Todd Alessandri
Northeastern University
Brent B. Allred
The College of William & Mary
Semiramis Amirpour
University of Texas at El Paso
Melissa Appleyard
Portland State University
Marne Arthaud-Day
Kansas State University
Bindu Arya
University of Missouri-St. Louis
Seung Bach
California State University, Sacramento
David Baker
Kent State University
Dennis R. Balch
University of North Alabama
Edward R. Balotsky
Saint Joseph’s University
Kevin Banning
Auburn University at Montgomery
Geoff Bell
University of Minnesota, Duluth
Heidi Bertels
City University of New York
Tim Blumentritt
Kennesaw State University
William C. Bogner
Georgia State University
Dorothy Brawley
Kennesaw State University
Michael G. Brizek
South Carolina State University
James W. Bronson
University of Wisconsin-Whitewater
Jill A. Brown
Bentley University
Clint Chadwick
University of Alabama in Huntsville
Kenneth H. Chadwick
Nicholls State University
Betty S. Coffey
Appalachian State University
Anne N. Cohen
University of Minnesota
Susan K. Cohen
University of Pittsburgh
Parthiban David
American University
Darla Domke-Damonte
Coastal Carolina University
Stephen A. Drew
Florida Gulf Coast University
Arthur J. Duhaime III
Nichols College
David Duhon
University of Southern Mississippi
Danielle Dunne
Fordham University
Alan Ellstrand
University of Arkansas-Fayetteville
David Epstein
University of Houston Downtown
THANK YOU . . . xxxi
WWW.YAZDANPRESS.COMWWW.YAZDANPRESS.COM

Michael M. Fathi
Georgia Southwestern State University
Kevin Fertig
University of Illinois at Urbana, Champaign
Robert S. Fleming
Rowan University
Daniel Forbes
University of Minnesota
Isaac Fox
University of Minnesota
Susan Fox-Wolfgramm
Hawaii Pacific University
Steven A. Frankforter
Winthrop University
Anne W. Fuller
California State University, Sacramento
Venessa Funches
Auburn University, Montgomery
Jeffrey Furman
Boston University
J. Michael Geringer
California Polytechnic State University, San Luis Obispo
Debbie Gilliard
Metropolitan State College of Denver
Michelle Gittelman
Rutgers University
Devi R. Gnyawali
Virginia Tech
Sanjay Goel
University of Minnesota Duluth
Steve Gove
Virginia Tech
Michael Gunderson
University of Florida
Craig Gustin
American InterContinental University
Stephen F. Hallam
University of Akron
Jon Timothy Heames
West Virginia University
Richard A. Heiens
University of South Carolina, Aiken
Duane Helleloid
University of North Dakota
Andrew M. Hess
University of Virginia
Ken Hess
Metropolitan State University
Phyllis Holland
Valdosta State University
Stephen V. Horner
Arkansas State University
George Hruby
Cleveland State University
Tammy Hunt
University of North Caro-lina Wilmington
Syeda Noorein Inamdar
San Jose State University
John G. Irwin
Troy University
Carol K. Jacobson
Purdue University
Scott Johnson
Oklahoma State University
Mahesh P. Joshi
George Mason University
Necmi Karagozoglu
California State University, Sacramento
J. Kay Keels
Coastal Carolina University
Franz Kellermanns
University of North Carolina, Charlotte
Jerry Kopf
Radford University
Bruce C. Kusch
Brigham Young University, Idaho
K. Blaine Lawlor
University of West Florida
Marty Lawlor
Rochester Institute of Technology
John Lawrence
University of Idaho
Jon Lehman
Vanderbilt University
David Leibsohn
California State University, Fullerton
Jun Lin
State University of New York (SUNY), New Paltz
Joseph Mahoney
University of Illinois at Urbana-Champaign
Paul Mallette
Colorado State University
Daniel B. Marin
Louisiana State University
Louis Martinette
University of Mary Washington
Anthony U. Martinez
San Francisco State University
David Major
Indiana University
David McCalman
University of Central Arkansas
Jeffrey E. McGee
The University of Texas at Arlington
Michael Merenda
University of New Hampshire
Grant Miles
University of North Texas
xxxii THANK YOU . . .
WWW.YAZDANPRESS.COMWWW.YAZDANPRESS.COM

Michael Miller
University of Illinois at Chicago
Elouise Mintz
Saint Louis University
Gwen Moore
University of Missouri-St. Louis
James P. Morgan
Webster University, Fort Leonard Wood
Richard T. Mpoyi
Middle Tennessee State University
Chandran Mylvaganam
Northwood University-Michigan
Louise Nemanich
Arizona State University
Frank Novakowski
Davenport University
Kevin J. O’Mara
Elon University
Chris Papenhausen
University of Massachu-setts, Dartmouth
James M. Pappas
Oklahoma State University
Ronaldo Parente
Florida International University
Srikanth Paruchuri
Pennsylvania State University
Keith Perry
San Jose State University
Christine Cope Pence
University of California, Riverside
Luis A. Perez-Batres
Central Michigan University
JoDee Phillips
Kaplan University
Michael Pitts
Virginia Commonwealth University
Robert Porter
University of Central Florida
Richard A. Quinn
University of Central Florida
Vasudevan Ramanujam
Case Western Reserve University
Annette L. Ranft
University at Tennessee
Gary B. Roberts
Kennesaw State University
Simon Rodan
San Jose State University
Yassir M. Samra
Manhattan College
Michael D. Santoro
Lehigh University
Gary Scudder
Vanderbilt University
Jim Sena
California Polytechnic State University, San Luis Obispo
Anju Seth
Virginia Tech
Deepak Sethi
Old Dominion University
Mark Sharfman
University of Oklahoma
Thomas Shirley
San Jose State University
Eugene Simko
Monmouth University
Faye A. Sisk
Mercer University, Atlanta
Lise Anne D. Slatten
University of Louisiana, Lafayette
Garry D. Smith
Mississippi State University
James D. Spina
University of Maryland
Jing’an Tang
Sacred Heart University
Linda F. Tegarden
Virginia Tech
Thuhang Tran
Middle Tennessee State University
Kim K. J. Tullis
University of Central Oklahoma
Beverly B. Tyler
North Carolina State University
Isaiah O. Ugboro
North Carolina A&T State University
Bruce Walters
Louisiana Tech University
Jia Wang
California State University, Fresno
Andrew Ward
Lehigh University
Vincent Weaver
Greenville Technical College
Joel West
Claremont Graduate University
Laura Whitcomb
California State University, Los Angeles
Margaret White
Oklahoma State University
Marta Szabo White
Georgia State University
Ross A. Wirth
Franklin University
Michael J. Zhang
Sacred Heart University
Zhe Zhang
Eastern Kentucky University
Yanfeng Zheng
The University of Hong Kong
Arvids A. Ziedonis
University of Oregon
THANK YOU . . . xxxiii
WWW.YAZDANPRESS.COMWWW.YAZDANPRESS.COM

T Tesla Motors and the U.S.
Automotive Industry
THE BIG THREE GM, Ford, and Chryslerdominated the U S car market throughout most of the 20th century Having enjoyed protection behind high entry barriers, GM once held more than a 50 percent U S market share and was highly prof table for many decades, until about 1980 Ford and Chrysler both also did well during this period However, as competition in the industry became increasingly global, foreign carmakers entered the U S market, at first mainly by importing vehicles from overseas plants Among the first were German carmakers Volkswagen (now also owner of the Porsche and Audi brands), Daimler, and BMW, as well as Japanese carmakers Honda, Toyota, and Nissan These foreign entrants intensified competition, threatened the Big Three’s market share, and led to political pressure to impose import restrictions in the 1980s Not to be stopped, the new players responded by buil import restrictions Hyundai and Kia h ing and selling cars
A though globa the way for sign fic
k t th ld
PayPal The sale of both companies amounted to close to $2 billion, which allowed Musk to focus on his lifelong passions in science, engineering, and space Musk is founder of and currently runs three different companies: SpaceX (which made history in May 2012 as the first private company to deliver a cargo payload to the International Space Station with its Dragon spacecraft), SolarC ty (basically the Walmart of solar panel insta lations for business and residential customers), and Tesla Motors, an allelectric American car company It is Tesla where Mr Musk is currently focusing most of his attention
As we have discussed, the U S automotive industry is characterized by high entry barriers However,
CHAPTER CASE 3
xxxiv
Twenty MiniCases, with suggested links to related chapters, follow Chapter 12. These short cases focus on a decision scenario that a company’s manager might face. They offer dynamic opportunities to apply strategy concepts by assigning them as add-ons to chapters, either as individual assignments or as group work, or by using them for class discussion. In this second edition, half of the MiniCases focus on global companies.
Features That Engage Students and
427
Mini Case 10
IN THE 1990S Circuit City was the largest and most
successful consumer electronics retai er in the Un ted
States Indeed Circuit City was so successful it was
included as one of only 11 companies featured in
Jim Coll ns’ bestseller Good to Great To qualify for
th s august group of h gh performers a company had
to attain “extraordinary results averaging cumula
tive stock returns 6 9 times the general market in the
15 years following their transition points ” 1 Indeed
Circuit City was the best performing company on
Collins’ good to great list ou performing the stock
market 18 5 t mes during the 1982 1997 period
How did Circuit City become so successful? The
company was able to build and refine a set of core
competencies that enabled it to create a higher eco
nomic value than its competitors In particular Circuit
City created world class competenc es in effic ent
and effective logist cs exper ise It deployed sophis i
cated point of sale and inventory racking technology
supported by IT investments hat enabled the firm to
connect the flow of information among geographi
cally dispersed s ores Th s expertise in turn a lowed
deta led tracking of customer preferences and enabled
Circuit City to respond quickly to changing rends
The company also relied on highly motiva ed we l
trained sales personnel to provide superior service and
thus build and maintain customer loyalty These core
competencies enabled Circuit City to implement a
“4S business model” service se ection sav ngs and
satisfaction that it applied to big t cket consumer
electronics with an unmatched degree of consistency
throughout the United States
Perhaps even more mportant during the company’s
high performance run many capable competi ors
were unable to replicate C rcuit C ty’s core competen
cies Further underscor ng Circuit City’s superior per
formance s the fact as Jim Collins described it hat
“if you had to choose between $1 inves ed in Circuit
City or $1 inves ed in General Electric on the day that
the legendary Jack Welch took over GE in 1981 and
he d [that investment] to January 1 2000 you would
have been better off with Circuit C ty by [a factor of]
From Good to Great to Gone:
The Rise and Fall of Circuit City
F ank T Rothaermel prepared this Min Case from public sources It is devel-
oped for the purpo e of class discu sion It is not intended to be used for
any kind of endorsement source of da a or depic ion of efficient or inef-
ficient management All opinions expressed and all er o s and omissions are
en irely the au hor’s © Rothaermel 2014
SOURCE http //www wired com/gadge lab/2009 03/ci cuit city st/
l
h s a ic d
y y g y ,
d A ALTHOUGH TESLA MOTORS has been successful in entering the U S automotive market using innovative new technology, its continued success w ll depend on other firm and industry factors While industry forces have been favorable for a long time in the U S automotive industry, recent dynamics have lowered the profit potential of competing in this industry and thus reduced its attractiveness Now that Tesla Motors has demonstrated how new technology can be used to circumvent entry barriers, other new ventures may soon follow Moreover, the incumbent firms are also adopting the new technology by introducing hybrid or all electric cars, further increasing rivalry in the industry
Another external industry force that Tesla Motors must address is the bargaining power of suppliers Lithium ion battery packs are key components for Tesla’s electric engines They are supplied by only a few technology firms such as Panasonic in Japan Given that these sources are few, the bargaining power of suppliers in the electric car segment is quite high, further limiting the industry’s prof t potential As a consequence of the strong bargaining power of suppliers combined
In addition, when demand is slowing, excess capacity tends to develop in the automotive industry, and the incumbent car companies begin to initiate a cut throat price competition to move inventory Although both GM and Chrysler went into Chapter 11 bankruptcy, neither exited the industry but rather restructured, causing excess capacity to remain in the industry Finally, complementary products and services such as battery charging and service stations, which are not yet ubiquitous, are needed to help consumers overcome anxieties concerning electric vehicle ownership
Questions
Thinking about Chapter Case 3, answer the following questions
1. Which PESTEL factors are the most salient for the electric vehicle segment of the car industry? Do you see a future for electric vehicles in the U S ? Why or why not?
CHAPTER CASE 3 Consider This ...
h 3_ 6 095 nd 8
ChapterCases bookend the chapter topic and focus on companies and industries of interest to students. The opening state-ment lays out a situation or issue that the chapter will address. The “Consider
This…” section at the end of the chap-ter introduces additional information, plus concepts and information from the chap-ter to extend and complete the Chapter-Case example. Questions in the “Consider This…” section are good jumping-off points for class discussion.
WWW.YAZDANPRESS.COMWWW.YAZDANPRESS.COM
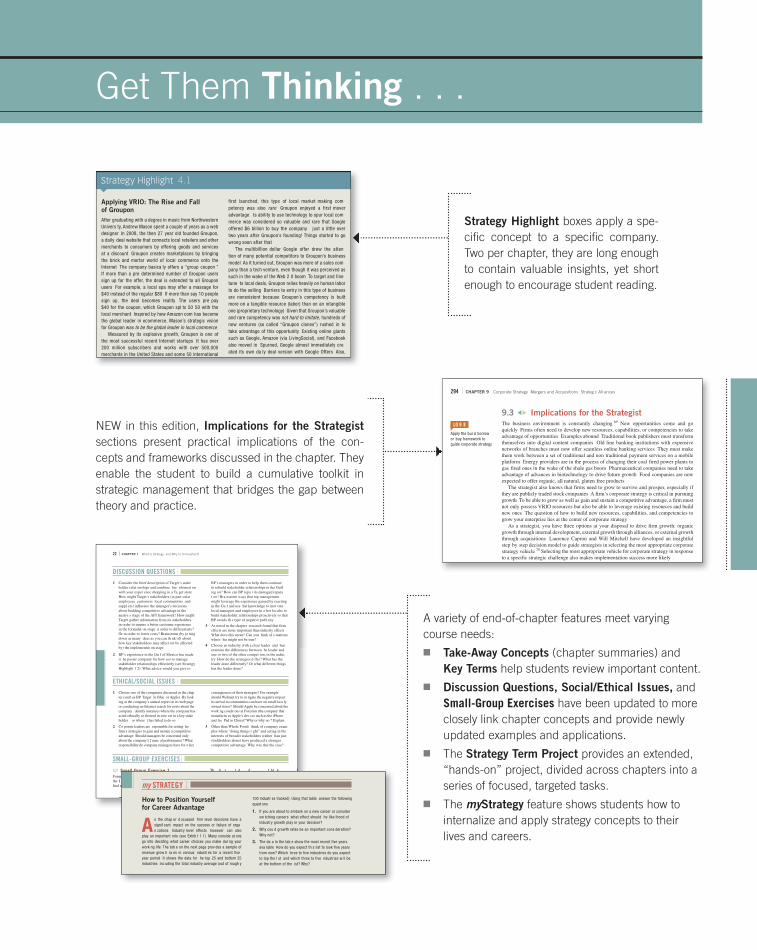
Applying VRIO: The Rise and Fall
of Groupon
After graduating with a degree in music from Northwestern Univers ty, Andrew Mason spent a couple of years as a web designer In 2008, the then 27 year old founded Groupon, a daily deal website that connects local retailers and other merchants to consumers by offering goods and services at a discount Groupon creates marketplaces by bringing the brick and mortar world of local commerce onto the Internet The company basica ly offers a “group coupon ” If more than a pre determined number of Groupon users sign up for the offer, the deal is extended to all Groupon users For example, a local spa may offer a massage for $40 instead of the regular $80 If more than say 10 people sign up, the deal becomes reality The users pre pay $40 for the coupon, which Groupon spl ts 50 50 with the local merchant Inspired by how Amazon com has become the global leader in ecommerce, Mason’s strategic vision for Groupon was to be the global leader in local commerce
Measured by its explosive growth, Groupon is one of the most successful recent Internet startups It has over 200 million subscribers and works with over 500,000 merchants in the United States and some 50 international
first launched, this type of local market making competency was also rare Groupon enjoyed a first mover advantage ts ability to use technology to spur local commerce was considered so valuable and rare that Google offered $6 billion to buy the company just a little over two years after Groupon’s founding! Things started to go wrong soon after that
The multibillion dollar Google offer drew the attention of many potential competitors to Groupon’s business model As it turned out, Groupon was more of a sales company than a tech venture, even though it was perceived as such in the wake of the Web 2 0 boom To target and finetune ts local deals, Groupon relies heavily on human labor to do the selling Barriers to entry in this type of business are nonexistent because Groupon’s competency is built more on a tangible resource (labor) than on an intangible one (proprietary technology) Given that Groupon’s valuable and rare competency was not hard to imitate, hundreds of new ventures (so called “Groupon clones”) rushed in to take advantage of this opportunity Existing online giants such as Google, Amazon (via LivingSocial), and Facebook also moved in Spurned, Google almost immediately created its own da ly deal version with Google Offers Also,
4.1
294 CHAPTER 9 Corporate Strategy Mergers and Acquisitions Strateg c All ances
9.3 Implications for the Strategist
The business environment is constantly changing 69 New opportunities come and go
quickly Firms often need to develop new resources, capabilities, or competencies to take
advantage of opportunities Examples abound Traditional book publishers must transform
themselves into digital content companies Old line banking institutions with expensive
networks of branches must now offer seamless online banking services They must make
them work between a set of traditional and non traditional payment services on a mobile
platform Energy providers are in the process of changing their coal fired power plants to
gas fired ones in the wake of the shale gas boom Pharmaceutical companies need to take
advantage of advances in biotechnology to drive future growth Food companies are now
expected to offer organic, all natural, gluten free products
The strategist also knows that firms need to grow to survive and prosper, especially if
they are publicly traded stock companies A firm’s corporate strategy is critical in pursuing
growth To be able to grow as well as gain and sustain a competitive advantage, a firm must
not only possess VRIO resources but also be able to leverage existing resources and build
new ones The question of how to build new resources, capabilities, and competencies to
grow your enterprise lies at the center of corporate strategy
As a strategist, you have three options at your disposal to drive firm growth: organic
growth through internal development, external growth through alliances, or external growth
through acquisitions Laurence Capron and Will Mitchell have developed an insightful
step by step decision model to guide strategists in selecting the most appropriate corporate
strategy vehicle 70 Selecting the most appropriate vehicle for corporate strategy in response
to a specific strategic challenge also makes implementation success more likely
LO 9 8
Apply the bui d borrowor buy framework to guide corporate strategy
Get Them Thinking . . .
Strategy Highlight boxes apply a spe-cifi c concept to a specifi c company. Two per chapter, they are long enough to contain valuable insights, yet short enough to encourage student reading.
NEW in this edition, Implications for the Strategist sections present practical implications of the con-cepts and frameworks discussed in the chapter. They enable the student to build a cumulative toolkit in strategic management that bridges the gap between theory and practice.
A variety of end-of-chapter features meet varying course needs:
■ Take-Away Concepts (chapter summaries) and Key Terms help students review important content.
■ Discussion Questions, Social/Ethical Issues, and Small-Group Exercises have been updated to more closely link chapter concepts and provide newly updated examples and applications.
■ The Strategy Term Project provides an extended, “hands-on” project, divided across chapters into a series of focused, targeted tasks.
■ The myStrategy feature shows students how to internalize and apply strategy concepts to their lives and careers.
22 CHAPTER 1 What Is Strategy and Why Is It Important?
1 Consider the brief description of Target’s stake
holder relat onships and combine hat nformat on
with your exper ence shopping in a Ta get store
How might Target’s stakeholders (in part cular
employees customers local communities and
suppl ers) influence the manager’s decisions
about building competitive advantage in the
analys s stage of the AFI framework? How might
Target gather information from its stakeholders
in order to inspire a better customer experience
in the formulat on stage n order to differentiate?
Or in order to lower costs? Brainstorm (by jo ting
down as many deas as you can th nk of) about
how key stakeholders may affect (or be affected
by) the implementat on stage
2 BP’s experience in the Gu f of Mexico has made
it he poster company for how not to manage
stakeholder relationships effectively (see Strategy
Highlight 1 2) What advice would you give to
BP’s managers in order to help them continue
to rebuild stakeholder relationships in the Gulf
reg on? How can BP repa r its damaged reputa
t on? Bra nstorm ways that top management
might leverage the experience gained by reacting
in the Gu f and use hat knowledge to mot vate
local managers and employees in o her locales to
build stakeholder relationships proactively so that
BP avoids th s type of negative publ city
3 As noted in the chapter research found that firm
effects are more important than industry effects
What does this mean? Can you hink of s tuations
where his might not be true?
4 Choose an industry with a clear leader and hen
examine the differences between he leader and
one or two of the other compet tors in the indus
try How do the strategies d ffer? What has the
leader done differently? Or what different things
has the leader done?
DISCUSSION QUESTIONS
//// Small Group Exercise 1
Form
the I
find n
Th h t l d d f bl k
SMALL-GROUP EXERCISES
1 Choose one of the companies discussed in the chap
ter (such as BP Target Je Blue or Apple) By look
ing at the company’s annual report on its web page
or conducting an Internet search for news about the
company dentify instances where the company has
acted ethically or showed its inte est in a key stake
holder or where t has failed to do so
2 Co porate leaders are esponsible for setting he
firm’s strategies to gain and sustain a competitive
advantage Should managers be concerned only
about the company’s f nanc al performance? What
responsibility do company managers have for o her
consequences of their strategies? For example
should Walmart try to m tigate the negative impact
its arrival in communities can have on small loca ly
owned stores? Should Apple be concerned about the
work ng condit ons at Foxconn (the company that
manufactu es Apple’s dev ces such as the iPhone
and he Pad in China)? Why or why no ? Explain
3 Other than Whole Foods think of company exam
ples where “doing things r ght” and acting in the
interests of broader stakeholders (rather han just
stockholders alone) have produced a stronger
competitive advantage Why was this the case?
ETHICAL/SOCIAL ISSUES
Small Group Exercise 1
m
I
n
Th h t l d d f bl k
How to Position Yourself
for Career Advantage
As the chap er d scussed firm level decisions have a signif cant mpact on the success or failure of organ zations Industry level effects however can also
play an important role (see Exhib t 1 1) Many conside at ons go into deciding what career choices you make dur ng your work ng life The tab e on the next page prov des a sample of revenue grow h ra es in various ndustr es for a recent fiveyear period It shows the data for he top 25 and bottom 25 industries inc uding the total industry average (out of rough y
100 industr es tracked) Using that table answer the following quest ons
1. If you are about to embark on a new career or consider sw tching careers what effect should he like ihood of industry growth play in your decision?
2. Why cou d growth rates be an important cons deration? Why not?
3. The da a in the tab e show the most recent five years ava lable How do you expect th s list to look five years from now? Which hree to five industries do you expect to top the l st and which three to five ndustries w ll be at the bottom of the ist? Why?
my STRATEGY
WWW.YAZDANPRESS.COMWWW.YAZDANPRESS.COM

Connect Strategic Management offers a variety of tools and content
to enhance productivity and increase student performance.
Available for Rothaermel, 2e, Connect is an integrated technology solution that increases student engagement and compre-hension, automates assignment delivery and grading, and through a variety of reports monitors whether learning objectives are met. Connect Strategic Management provides a wide array of tools and content to improve student performance.
LearnSmart®
LearnSmart is the most widely used and intelligent adap-tive learning resource that is proven to strengthen memory recall, improves course retention, and boost grades.
Distinguishing what students know from what they don’t, and honing in on concepts they are most likely to forget, LearnSmart continuously adapts to each student’s needs by building an individual learning path so students study smarter and retain more knowledge.
SmartbookTM
Fueled by LearnSmart—SmartBook is the fi rst and only adaptive reading experience available today.
Assessing what a student knows or doesn't know, and focusing on the concepts the student is likely to forget, SmartBook personalizes content for each student in a continuously adapting reading experience. Reading is no longer a passive and linear experience, but an engaging and dynamic one, through which students are more likely to master and retain important concepts, coming to class better prepared. Valuable reports provide instructors in-sight as to how students are progressing through textbook content, which is useful for shaping in-class time and as-sessments.
As a result of the adaptive reading experience found in SmartBook, students are more likely to retain knowledge, stay in class, and get better grades. This revolutionary technology is available only from McGraw-Hill Education and for hundreds of course areas as part of the LearnSmart Advantage series.
LEARNSMART ADVANTAGE
WWW.YAZDANPRESS.COMWWW.YAZDANPRESS.COM

CONNECT FEATURES
Running Case
Students will begin by reviewing a specifi c company and the company's applied strategy using appropriate tools (e.g., PESTEL, Porter's Five Forces, VRIO, SWOT, and others). The analysis will progress from a broad global view, to an industry view, to a strategic group view, and then focus on the company itself, moving from a broad perspective to the appropriate company-level perspective. Students will develop a strategic analysis for the company and consider several scenarios for the company to improve its competitive advantage. The scenarios will include a fi nancial analysis and justifi cation and ultimately provide a specifi c recommendation.
Interactive Applications
Interactive Applications offer a variety of automatically graded exercises that require students to apply key con-cepts. Whether the assignment includes a drag and drop, video case, timeline/sequencing, or case analysis, these applications provide instant feedback and progress track-ing for students, and detailed results for the instructor.
Resources for Analysis
Resources for student analysis of industries, companies, and strategies include:
■ Templates for strategic fi nancial analysis and a How to do a case analysis guide, complete with fi nancial ratios used to compare performance between fi rms.
■ A fi nancial review activity—for students who wish to refresh or extend their working knowledge of major fi nancial measures in a strategic framework.
Connect Instructor’s Manual
New to this edition is a guidebook to walk instructors through the various Connect content available with 2e. It comes complete with general Connect recommendations, screen shots of interactive applications to reference for use with chap-ters, and suggested follow-up activities.
For more information, contact your McGraw-Hill Learning Technology Consultant or visit
www.McGrawHillConnect.com
WWW.YAZDANPRESS.COMWWW.YAZDANPRESS.COM

WWW.YAZDANPRESS.COMWWW.YAZDANPRESS.COM

1
PART 1
Strategy Analysis
CHAPTER 1 What Is Strategy, and Why Is It Important? 2
CHAPTER 2 Strategic Leadership: Managing the Strategy Process 28
CHAPTER 3 External Analysis: Industry Structure, Competitive Forces, and Strategic Groups 56
CHAPTER 4 Internal Analysis: Resources, Capabilities, and Core Competencies 96
CHAPTER 5 Competitive Advantage, Firm Performance, and Business Models 128
The AFI Strategy Framework
1. What Is Strategy, and Why Is It Important?
3. External Analysis: Industry Structure, Competitive Forces, and Strategic Groups4. Internal Analysis: Resources, Capabilities, and Core Competencies5. Competitive Advantage, Firm Performance, and Business Models
6. Business Strategy: Differentiation, Cost Leadership, and Integration7. Business Strategy: Innovation and Entrepreneurship
8. Corporate Strategy: Vertical Integration and Diversification
9. Corporate Strategy: Mergers and Acquisitions, Strategic Alliances
10. Global Strategy: Competing Around the World
11. Organizational Design: Structure, Culture, and Control
Getting
Started
External and
Internal
Analysis
Formulation:
Business
Strategy
Formulation:
Corporate
Strategy
Implementation
Gaining &
Sustaining
Competitive
Advantage
12. Corporate Governance and Business Ethics
2. Strategic Leadership: Managing the Strategy Process
Part 1:
S trategy Analysis
Part 1:
S trategy Analysis
Part 2:
S trategy Formulation
Part 2:
S trategy Formulation
Part 3:
S trategy Implementation
WWW.YAZDANPRESS.COMWWW.YAZDANPRESS.COM
2
Chapter 1
What Is Strategy, and Why Is It Important?
Chapter Outline
1.1 What Strategy Is: Gaining and Sustaining
Competitive AdvantageWhat Is Competitive Advantage?Industry vs. Firm Effects in Determining Firm Performance
1.2 Stakeholders and Competitive AdvantageStakeholder StrategyStakeholder Impact Analysis
1.3 The AFI Strategy Framework
1.4 Implications for the Strategist
Learning Objectives
After studying this chapter, you should be able to:
LO 1-1 Explain the role of strategy in a firm’s quest for competitive advantage.
LO 1-2 Define competitive advantage, sustainable competitive advantage, competitive disad-vantage, and competitive parity.
LO 1-3 Differentiate the roles of firm effects and industry effects in determining firm performance.
LO 1-4 Evaluate the relationship between stake-holder strategy and sustainable competitive advantage.
LO 1-5 Conduct a stakeholder impact analysis.
WWW.YAZDANPRESS.COMWWW.YAZDANPRESS.COM

3
OApple: Once the World’s
Most Valuable Company
ON AUGUST 20, 2012, Apple’s stock market valu-ation reached $623 billion, making it the most valu-able public company of all time.1 A mere 15 years earlier, Apple would likely have gone bankrupt if archrival Microsoft (which enjoyed the same position with a valuation of $615 billion in December 1999) had not invested $150 million in Apple. How did Apple become so successful?
Apple became the world’s most successful com-pany due to a powerful competitive strategy. That strategy, conceptualized by co-founder Steve Jobs, combines innovation in products, services, and business models. From near-bankruptcy in 1997, Apple’s revitalization really took off in the fall of 2001 when it introduced the iPod, a portable digital music player. Eighteen months later, Apple soared even higher when it opened the online store iTunes, quickly followed by its first retail stores. Apple’s stores now earn the highest sales per square foot of any retail outlets, including luxury stores such as Tiffany & Co. jewelry or LVMH, purveyor of fine hand-bags and other luxury goods.
Apple didn’t stop there. In 2007, the company revolutionized the smartphone market with the introduction of the iPhone. Just three years later, Apple created the tablet computer industry by intro-ducing the iPad, thus beginning to reshape the publishing and media industries. Further, for each of its iPod, iPhone, and iPad lines of businesses,
CHAPTERCASE 1
Apple followed up with incremental product innova-tions extending each product category. By combin-ing tremendous brain power, intellectual property, and iconic brand value, Apple has enjoyed dra-matic increases in revenues. More traditional firms such as Exxon Mobil and GE—each at one time the world’s most valuable company—can now only dream of such results.
In the fall of 2012, investors’ expectations of Apple’s future growth potential in burgeoning industries such as the mobile Internet, TV, and other media propelled its share price to over $700. Some analysts contend that Apple may become the first $1 trillion company on the planet. What will it take to achieve that? To do so, Apple must continue to find new industries to revolutionize, while at the same time increase its global market penetration in emerging economies such as China and India.2
After reading this chapter, you will find more about this case, along with related questions, on page 19.
WHY WAS APPLE so successful? Why did Microsoft’s once superior market valu-
ation evaporate? Why did Apple’s competitors such as Sony, Dell, Hewlett-Packard
(HP), Nokia, and BlackBerry struggle? What must Apple do to sustain its competitive
advantage, especially in light of strong performances by competitors such as Google,
Amazon, and Samsung? For that matter, why is any company successful? What enables
some firms to gain and then sustain their competitive advantage over time? Why do once-
great firms fail? How can a firm’s managers influence performance? These are the big
WWW.YAZDANPRESS.COMWWW.YAZDANPRESS.COM
4 CHAPTER 1 What Is Strategy, and Why Is It Important?
questions that define strategic management. Answering these questions requires integrat-
ing the knowledge you’ve obtained in your studies of various business disciplines to under-
stand what leads to superior performance.
Strategic management is the integrative management field that combines analysis, formulation, and implementation in the quest for competitive advantage. Mastery of strate-
gic management enables you to view a firm in its entirety. It also enables you to think like
a general manager to help position your firm for superior performance. The AFI strategy framework (shown on page 1) embodies this view of strategic management.
In this chapter, we lay the groundwork for the study of strategic management. We’ll
introduce some foundational ideas about strategy and competitive advantage and then con-
sider the role of business in society. Next, we take a closer look at the components of
the AFI framework and provide an overview of the entire strategic management process.
We conclude this introductory chapter, as we do with all others in this text, with a sec-
tion entitled Implications for the Strategist. Herein, we provide practical applications and
considerations of the material developed in the chapter. Let’s begin the exciting journey to
understand strategic management and competitive advantage.
1.1 What Strategy Is: Gaining and Sustaining
Competitive Advantage
Strategy is a set of goal-directed actions a firm takes to gain and sustain superior perfor-
mance relative to competitors.3 To achieve superior performance, companies compete for
resources: New ventures compete for financial and human capital. Existing companies
compete for profitable growth. Charities compete for donations, and social networks com-
pete for members. In any competitive situation, a good strategy enables a firm to achieve
superior performance.
A good strategy consists of three elements:4
1. A diagnosis of the competitive challenge. This element is accomplished through
strategy analysis of the firm’s external and internal environments (Part 1 of the AFI
framework).
2. A guiding policy to address the competitive challenge. This element is accomplished
through strategy formulation, resulting in the firm’s corporate, business, and functional
strategies (Part 2 of the AFI framework).
3. A set of coherent actions to implement the firm’s guiding policy. This element is
accomplished through strategy implementation (Part 3 of the AFI framework).
Let’s revisit ChapterCase 1 and see how these three elements
manifest themselves in a good strategy.
THE COMPETITIVE CHALLENGE. First, consider the diag-
nosis of the competitive challenge. ChapterCase 1 briefly traces
Apple’s renewal from the year 2001, when it hit upon the product
and business-model innovations of the iPod/iTunes combination.
Prior to that, Apple was merely a niche player in the desktop-
computing industry, and struggling financially. Steve Jobs turned
the sinking company around by focusing on only two computer
models (one laptop and one desktop) in each of two market seg-
ments (the professional market and the consumer market) as
strategic management
An integrative management field that combines analysis, formulation, and implementation in the quest for competitive advantage.
LO 1-1
Explain the role of strategy in a firm’s quest for competitive advantage.
strategy The set of goal-directed actions a firm takes to gain and sustain superior performance relative to competitors.
WWW.YAZDANPRESS.COMWWW.YAZDANPRESS.COM
CHAPTER 1 What Is Strategy, and Why Is It Important? 5
opposed to dozens of non-differentiated products within each segment. This streamlining
of its product lineup enhanced Apple’s strategic focus. Even so, the outlook for Apple was
grim. Jobs believed that Apple, with less than 5 percent market share, could not win in the
personal computer industry where desktops and laptops had become commoditized gray
boxes. In that world, Microsoft, Intel, and Dell were the star performers. Jobs needed to
create the “next big thing.”5
A GUIDING POLICY. Next, let’s consider the guiding policy. In this case, Apple shifted
its competitive focus away from personal computers to mobile devices. In doing so, Apple
disrupted several industries through its product and business-model innovations. Simply
put, a business model explains how the firm intends to make money. Combining hard-
ware (i.e., the iPod) with a complementary service product (i.e., the iTunes Store) enabled
Apple to devise a new business model. Users could now download individual songs legally
(at 99 cents) rather than buying an entire CD or downloading the songs illegally using
Napster and other file-sharing services. The availability of the iTunes Store drove sales
of iPods. Along with rising sales for the new iPod and iTunes products, demand rose for
iMacs. The new products helped disrupt the existing personal computer market, because
people wanted to manage their music and photos on a computer that worked seamlessly
with their mobile devices. The success of the iPod/iTunes business model innovation was
then leveraged to develop and launch the iPhone and the iPad.
COHERENT ACTIONS. Finally, Apple implemented its guiding policy with a set of
coherent actions. Apple’s coherent actions took a two-pronged approach: First, it stream-
lined its product lineup through a simple rule6—“we will make only one laptop and one
desktop model for each of the two markets we serve, professional and consumer.” Second,
it disrupted the industry status quo through a potent combination of product and business
model innovations, executed at planned intervals. These actions allowed Apple to create a
string of temporary competitive advantages. Taken together, this string of temporary com-
petitive advantages enabled the company to sustain its superior performance over a number
of years.
A good strategy is more than a mere goal or a company slogan. First, a good strategy
defines the competitive challenges facing an organization through a critical and honest
assessment of the status quo. Second, a good strategy provides an overarching approach
(policy) on how to deal with the competitive challenges identified. Last, a good strategy
requires effective implementation through a coherent set of actions.
WHAT IS COMPETITIVE ADVANTAGE?
Competitive advantage is always relative, not absolute. To assess competitive advantage,
we compare firm performance to a benchmark—that is, either the performance of other
firms in the same industry or an industry average. A firm that achieves superior perfor-
mance relative to other competitors in the same industry or the industry average has a
competitive advantage.7 Apple, for instance, has achieved a competitive advantage over
Google, Samsung, Nokia, and BlackBerry in the smartphone industry and over Micro-
soft, Amazon, Samsung, and HP in the tablet computer industry. A firm that is able to
outperform its competitors or the industry average over a prolonged period of time has a
sustainable competitive advantage.However, past performance is no guarantee of future performance. As noted in Chapter-
Case 1, Microsoft was once the most valuable company in the world, but has struggled to
keep up with Apple. Microsoft, as well as Google, Samsung, Amazon, and others, is work-
ing hard to neutralize Apple’s competitive advantage. Amazon’s Kindle line of tablets and
LO 1-2
Define competitive advantage, sustainable competitive advantage, competitive disadvantage, and competitive parity.
competitive
advantage Superior performance relative to other competitors in the same industry or the industry average.
sustainable
competitive
advantage
Outperforming competitors or the industry average over a prolonged period of time.
WWW.YAZDANPRESS.COMWWW.YAZDANPRESS.COM
6 CHAPTER 1 What Is Strategy, and Why Is It Important?
Microsoft’s Surface tablet computer compete against Apple’s iPad. The question is whether
Apple can continue to maintain a competitive advantage in the face of increasingly strong
competition and rapidly changing industry environments. We provide an update on the
ChapterCase in the “Consider This . . .” section at the end of this chapter.
If a firm underperforms its rivals or the industry average, it has a competitive disadvantage. For example, a 15 percent return on invested capital may sound like supe-
rior firm performance. In the energy industry, though, where the average return on invested
capital is often above 20 percent, such a return puts a firm at a competitive disadvantage.
In contrast, if a firm’s return on invested capital is 2 percent in a declining industry such as
newspaper publishing, where the industry average has been negative (–5 percent) for the
last few years, then the firm has a competitive advantage. Should two or more firms per-
form at the same level, they have competitive parity. In Chapter 5, we’ll discuss in greater
depth how to evaluate and assess competitive advantage and firm performance.
To gain a competitive advantage, a firm needs to provide either goods or services con-
sumers value more highly than those of its competitors, or goods or services similar to
the competitors’ at a lower price.8 The rewards of superior value creation and capture are
profitability and market share. Steve Jobs wanted to “put a ding in the universe”—making
a difference by delivering products and services people love. Mark Zuckerberg built Face-
book to make the world more open and connected. Google co-founders Larry Page and
Sergey Brin were motivated to create a better search engine in order to make the world’s
information universally accessible. For Jobs, Zuckerberg, Page, Brin, and numerous other
entrepreneurs and businesspeople, creating shareholder value and making money is the
consequence of filling a need and providing a product, service, or experience consum-
ers wanted, at a price they could afford. The important point here is that strategy is about
creating superior value, while containing the cost to create it. Managers achieve this com-
bination of value and cost through strategic positioning. That is, they stake out a unique
position within an industry that allows the firm to provide value to customers, while con-
trolling costs. The greater the difference between value creation and cost, the greater the
firm’s economic contribution and the more likely it will gain competitive advantage.
Strategic positioning requires trade-offs, however. As a low-cost retailer, Walmart has a
clear strategic profile and serves a specific market segment. Upscale retailer Nordstrom’s
has also built a clear strategic profile by providing superior customer service to a specific
market segment (luxury). Although these companies are in the same industry, their cus-
tomer segments overlap very little, and they are not direct competitors. That is because
Walmart and Nordstrom’s each has chosen a distinct but different strategic position.
The managers make conscious trade-offs that enable each company to strive for com-
petitive advantage in the retail industry, using different competitive strategies: leadership
versus differentiation. In regard to the customer service dimension, Walmart provides
acceptable service by low-skill employees in a big-box retail outlet offering “everyday
low prices,” while Nordstrom’s provides a superior customer experience by professional
sales people in a luxury setting. A clear strategic profile—in terms of product differen-
tiation, cost, and customer service—allows each retailer to meet specific customer needs.
Competition focuses on creating value for customers (through lower prices or better ser-
vice and selection, in this example) rather than destroying rivals. Even though Walmart and
Nordstrom’s compete in the same industry, both can win if they achieve a clear strategic
position through a well-executed competitive strategy.
Since clear strategic positioning requires trade-offs, strategy is as much about decid-
ing what not to do, as it is about deciding what to do.9 Because resources are limited,
managers must carefully consider their strategic choices in the quest for competitive
advantage. Trying to be everything to everybody will likely result in inferior performance.
competitive
disadvantage
Underperformance relative to other competitors in the same industry or the industry average.
competitive parity
Performance of two or more firms at the same level.
WWW.YAZDANPRESS.COMWWW.YAZDANPRESS.COM

CHAPTER 1 What Is Strategy, and Why Is It Important? 7
Strategy Highlight 1.1 shows how JetBlue ran into trouble by trying to combine two dif-
ferent competitive strategies at the same time—a cost-leadership strategy, focused on low
cost, and a differentiation strategy, focused on delivering unique features and service.
Although the idea of combining different business strategies seems appealing, it is actu-
ally quite difficult to execute an integrated cost-leadership and differentiation position.
JetBlue: “Stuck in the Middle”?
Entrepreneur David Neeleman, at the age of 25, co-founded Morris Air, a charter air service that in 1993 was purchased by Southwest Airlines (SWA). Morris Air was a low-fare air-line that pioneered many cost-saving practices that later became standard in the industry, such as e-ticketing. After working as an airline executive for SWA, Neeleman founded another airline, JetBlue Airways, in 1998. When Neeleman established JetBlue, his strategy was to provide air travel at even lower costs than SWA. At the same time, he wanted to offer better service and more amenities.
JetBlue copied and improved upon many of SWA’s cost-reducing activities. For example, it started out by using just one type of airplane (the Airbus A320) to lower the costs of aircraft maintenance and pilot training. It also chose to fly point to point, directly connecting highly traf-ficked city pairs. In contrast, legacy airlines such as Delta, United, or American use a hub-and-spoke system; such systems connect many different locations via layovers at airport hubs. The point-to-point business model focuses on directly connecting fewer but more highly trafficked city pairs. The point-to-point system lowers costs by not offering baggage transfers and schedule coordination with other airlines. In addition, JetBlue flew longer distances
and transported more passengers per flight than SWA, fur-ther driving down its costs. Initially, JetBlue enjoyed the lowest cost per available seat-mile (an important perfor-mance metric in the airline industry) in the United States.
At the same time, JetBlue also attempted to enhance its differential appeal by driving up its perceived value. Its intent was to combine high-touch (to enhance the cus-tomer experience) and high-tech (to drive down costs). Some of JetBlue’s value-enhancing features included high-end 100-seat Embraer regional jets with leather seats, individual TV screens with popular movie and tele-vision programming, 100 channels of XM Satellite Radio, and free in-flight Wi-Fi capabilities, along with friendly and attentive on-board service and other amenities. Also, because one-third of customers prefer speaking to a live reservation agent, despite a highly functional website for reservations and other travel-related services, JetBlue decided to employ stay-at-home parents in the United States instead of following industry best practice by out-sourcing its reservation system to India. The company suggests this “home sourcing” is more productive than outsourcing; it also says that customers’ appreciation of the reservation experience more than makes up for the wage differential between the U.S. and India. To sum it up, JetBlue’s “Customer Bill of Rights” declared its dedication to “bringing humanity back to air travel.”
In early 2007, however, JetBlue’s reputation for out-standing customer service took a major hit: Several flights were delayed due to a snowstorm in which the airline kept passengers on board the aircraft; some sat on the tarmac for up to nine hours. Many wondered whether JetBlue was losing its magic touch. In May 2007, David Neeleman left JetBlue. Ever the entrepreneur, he went on to found Azul, a Brazilian airline, in 2008. For JetBlue, trying to combine a cost-leadership position with a differentiation strategy has meant that despite enjoying some early years of com-petitive advantage, it is now struggling to maintain that advantage.10
1.1
WWW.YAZDANPRESS.COMWWW.YAZDANPRESS.COM
8 CHAPTER 1 What Is Strategy, and Why Is It Important?
Cost leadership and differentiation are distinct strategic positions. Pursuing them at the
same time results in trade-offs that work against each other. For instance, higher perceived
customer value (e.g., providing leather seats throughout the entire aircraft and free Wi-Fi)
comes with higher costs. JetBlue continues to pursue an integration strategy today, attempt-
ing to be both a cost leader and differentiator. Many firms that attempt such an integration strategy end up being stuck in the middle; that is, the managers have failed to carve out a
clear strategic position. In their attempt to be everything to everybody, these firms end up
being neither a low-cost leader nor a differentiator. This common strategic failure contrib-
uted to JetBlue’s competitive disadvantage in recent years.
The key to successful strategy is to combine a set of activities to stake out a unique position within an industry. Competitive advantage has to come from performing differ-
ent activities or performing the same activities differently than rivals are doing. Ideally,
these activities reinforce one another rather than create trade-offs. For instance, Walmart’s
strategic activities strengthen its position as cost leader: Big retail stores in rural locations,
extremely high purchasing power, sophisticated IT systems, regional distribution centers,
low corporate overhead, and low base wages and salaries combined with employee profit
sharing reinforce each other, to maintain the company’s cost leadership.
In addition, operational effectiveness, marketing skills, and other functional expertise
all strengthen a unique strategic position. Those capabilities, though, do not substitute
for competitive strategy. Competing to be similar but just a bit better than your competi-
tor is likely to be a recipe for cut-throat competition and low profit potential. Let’s take
this idea to its extreme in a quick thought experiment: If all firms in the same industry
pursued a low-cost position through application of competitive benchmarking, all firms
would have identical cost structures. None could gain a competitive advantage. Everyone
would be running faster, but nothing would change in terms of relative strategic positions.
There would be little if any value creation for customers because companies would have
no resources to invest in product and process improvements. Moreover, the least-efficient
firms would be driven out, further reducing customer choice.
To gain a deeper understanding of what strategy is, it may be helpful to think about
what strategy is not.11 Be on the lookout for the following major hallmarks of what strat-
egy is NOT:
1. Grandiose statements are not strategy. You may have heard firms say things like, “Our
strategy is to win” or “We will be #1.” Such statements of desire, on their own, are not
strategy. They provide little managerial guidance and frequently fail to address the
economic fundamentals. As we will discuss in the next chapter, an effective vision and
mission can lay the foundation upon which to craft a good strategy. This foundation
must be backed up by strategic actions that allow the firm to address a competitive
challenge.
2. A failure to face a competitive challenge is not strategy. If the firm does not define a
clear competitive challenge, managers have no way of assessing whether they are mak-
ing progress in addressing it. Managers at the now-defunct video rental chain Block-
buster, for example, failed to address the competitive challenges posed by new players
such as Netflix, Redbox, Amazon Prime, and Hulu.
3. Operational effectiveness, competitive benchmarking, or other tactical tools are not strategy. People casually refer to a host of different policies and initiatives as some
sort of strategy: pricing strategy, Internet strategy, alliance strategy, operations strat-
egy, IT strategy, brand strategy, marketing strategy, HR strategy, China strategy,
WWW.YAZDANPRESS.COMWWW.YAZDANPRESS.COM

CHAPTER 1 What Is Strategy, and Why Is It Important? 9
and so on. All these elements may be a necessary part of a firm’s functional and
global initiatives to support its competitive strategy, but these elements are not suf-ficient to achieve competitive advantage. In this text, though, we will reserve the
term strategy for describing the firm’s overall efforts to gain and sustain competitive advantage.
INDUSTRY VS. FIRM EFFECTS IN DETERMINING PERFORMANCE
Firm performance is determined primarily by two factors: industry and firm effects.
Industry effects describe the underlying economic structure of the industry. They attri-
bute firm performance to the industry in which the firm competes. The structure of an
industry is determined by elements common to all industries such as entry and exit barri-
ers, number and size of companies, and types of products and services offered. In a series
of empirical studies, academic researchers have found that the industry a firm is in deter-
mines about 20 percent of a firm’s profitability.12 In Chapter 3, when studying external
analysis, we’ll gain a deeper understanding of an industry’s underlying structure and how
it affects firm performance.
Firm effects attribute firm performance to the actions managers take. In Chapter 4,
we’ll take a close look inside the firm to understand why firms within the same industry
differ, and how differences among firms can lead to competitive advantage.
For now, the key point is that managers’ actions tend to be more important in determin-
ing firm performance than the forces exerted on the firm by its external environment.13
Empirical research studies indicate that a firm’s strategy can explain up to 55 percent of its
performance.14 Exhibit 1.1 shows these findings.
Although a firm’s industry environment is not quite as important as the firm’s strategy
within its industry, they jointly determine roughly 75 percent of overall firm performance.
The remaining 25 percent is partly attributed to business cycles and other effects.
Competition—the ongoing struggle among firms to gain and sustain competitive
advantage—does not take place in isolation. Managers therefore must understand the rela-
tionship between strategic management and the role of business in society, which we will
turn to next.
LO 1-3
Differentiate the roles of firm effects and industry effects in determining firm performance.
industry effects Firm performance attributed to the structure of industry in which the firm competes.
firm effects Firm performance attributed to the actions managers take.
EXHIBIT 1.1 /Industry, Firm, and Other Effects Explaining Superior Firm Performance
Up to 55%
~25%
~20%
Other Effects
(Business Cycle Effects,Unexplained Variance)
Firm Effects
Industry Effects
WWW.YAZDANPRESS.COMWWW.YAZDANPRESS.COM

10 CHAPTER 1 What Is Strategy, and Why Is It Important?
1.2 Stakeholders and Competitive Advantage
Companies with successful strategies generate value for society. When firms compete in
their own self-interest while obeying the law and acting ethically, they ultimately create
value. In so doing, they make society better.15 Value creation lays the foundation for the
benefits that successful economies can provide: education, public safety, and health care,
among others. Superior performance allows a firm to reinvest some of its profits and to
grow, which in turn provides more opportunities for employment and fulfilling careers. In
ChapterCase 1, we saw that Apple created tremendous value for both its shareholders and
customers, along with creating jobs.
In contrast, strategic mistakes can be expensive. Once a leading technology company,
Hewlett-Packard was known for innovation, resulting in superior products. The “HP way
of management” included lifetime employment, generous benefits, work/life balance, and
freedom to explore ideas, among other perks. However, HP has not been able to address
the competitive challenges of mobile computing or business IT services effectively. As a
result, HP’s stakeholders suffered. Shareholder value was destroyed. The company also
had to lay off tens of thousands of employees in recent years. Its customers no longer
received the innovative products and services that made HP famous.
The examples of Apple and HP illustrate the relationship between individual firms and
society at large. Recently, this relationship received more critical scrutiny due to some
major shocks to free-market capitalism.
In the first decade of the 21st century, several black swan events eroded the public’s
trust in business as an institution and capitalism as an economic system.16 In the past, most
people assumed that all swans are white, so when they first encountered swans that were
black, they were surprised. Today, the metaphor of a black swan describes the high impact of a highly improbable event. Examples of black swan events include the
fall of the Berlin Wall and the subsequent collapse of the Soviet Union, the
9/11 terrorist attacks, the Fukushima nuclear disaster in Japan, and the Arab
Spring. Such events were considered to be highly improbable and thus unex-
pected, but when they did occur, each had a very profound impact.17
The implicit trust relationship between the corporate world and society
at large has deteriorated due to the arrival of several black swans. One of the
first black swan events of the century occurred when the accounting scan-
dals at Enron, Arthur Andersen, WorldCom, Tyco, Adelphia, and Parmalat
(of Italy) came to light. Those events led to bankruptcies, large-scale job loss, and billions
of dollars in shareholder-value destruction. As a result, the public’s trust in business and
free-market capitalism began to erode.
Another black swan event occurred in the fall of 2008 with the global financial crisis,
which shook the entire free-market system to its core.18 A real estate bubble had developed
in the United States, fueled by cheap credit and the availability of subprime mortgages.
When that bubble burst, many entities faced financial stress or bankruptcy—those who
had unsustainable mortgages, investors holding securities based on those mortgages, and
the financial institutions that had sold the securities. Some went under, and others were
sold off at fire-sale prices. Home foreclosures skyrocketed as a large number of borrowers
defaulted on their mortgages. House prices in the U.S. plummeted by roughly 30 percent.
The Dow Jones Industrial Average (DJIA) lost about half its market value, plunging the
United States into a deep recession.
The impact was worldwide. The freezing of capital markets during the global financial
crisis triggered a debt crisis in Europe. Some European governments (notably Greece)
defaulted on government debt; other countries were able to repay their debts only through
black swan events
Incidents that describe highly improbable but high-impact events.
LO 1-4
Evaluate the relationship between stakeholder strategy and sustainable competitive advantage.
WWW.YAZDANPRESS.COMWWW.YAZDANPRESS.COM

CHAPTER 1 What Is Strategy, and Why Is It Important? 11
the assistance of other, more solvent European countries. This severe financial crisis not
only put Europe’s common currency, the euro, at risk, but also led to a prolonged and deep
recession in Europe.
Back in the United States, the Occupy Wall Street protest movement was born in 2011
out of dissatisfaction with the capitalist system. Issues of income disparity, corporate eth-
ics, corporate influence on governments, and ecological sustainability were key drivers.
The Occupy movement, organized through social media platforms such as Twitter and
Facebook, eventually expanded around the world.
Although these black swan events differed in their specifics, two common features are
pertinent to our study of strategic management.19 First, these events demonstrate that manage-
rial actions can affect the economic well-being of large numbers of people around the globe.
The second pertinent feature relates to stakeholders—organizations, groups, and indi-
viduals that can affect or be affected by a firm’s actions.20 This leads us to stakeholder strategy, which we discuss next.
STAKEHOLDER STRATEGY
Stakeholders have a vested claim or interest in the performance and continued survival of
the firm. Stakeholders can be grouped by whether they are internal or external to a firm.
As shown in Exhibit 1.2, internal stakeholders include stockholders, employees (including
executives, managers, and workers), and board members. External stakeholders include
customers, suppliers, alliance partners, creditors, unions, communities, media, and govern-
ments at various levels.
All stakeholders make specific contributions to a firm, which in turn provides different
types of benefits to different stakeholders. Employees contribute their time and talents
to the firm, receiving wages and salaries in exchange. Shareholders contribute capital in
the hope that the stock will rise and the firm will pay dividends. Communities provide
real estate, infrastructure, and public safety. In return, they expect that companies will
pay taxes, provide employment, and not pollute the environment. The firm, therefore, is
embedded in a multifaceted exchange relationship with a number of diverse internal and
external stakeholders.
stakeholders
Organizations, groups, and individuals that can affect or are affected by a firm’s actions.
EXHIBIT 1.2 /Internal and External Stakeholders in an Exchange Relationship with the Firm
External
Stakeholders
• Customers
• Media
• Suppliers
• Alliance Partners
• Creditors
• Unions
• Communities
• Governments
Internal
Stakeholders
Be
ne
fits
B
en
efi
ts
Be
ne
fits
B
en
efi
ts
Co
ntr
ibu
tio
ns
Co
ntr
ibu
tio
ns
• Employees
• Stockholders
• Board Members
A B
B A
WWW.YAZDANPRESS.COMWWW.YAZDANPRESS.COM

12 CHAPTER 1 What Is Strategy, and Why Is It Important?
If any of the stakeholders withholds participation in the firm’s exchange relationships,
it can have severe negative performance implications. The aerospace company, Boeing,
for example, has a long history of acrimonious labor relations, leading to walk-outs and
strikes. This in turn has not only delayed production of airplanes but also raised costs.
More recently, borrowers who purchased subprime mortgages are stakeholders (in this
case, customers) of financial institutions. When they defaulted in large numbers, they
threatened the survival of these financial institutions and, ultimately, of the entire finan-
cial system.
Stakeholder strategy is an integrative approach to managing a diverse set of stake-
holders effectively in order to gain and sustain competitive advantage.21 The unit
of analysis is the web of exchange relationships a firm has with its stakeholders (see
Exhibit 1.2). Stakeholder strategy allows firms to analyze and manage how various exter-
nal and internal stakeholders interact to jointly create and trade value.22 A core tenet of
stakeholder strategy is that a single-minded focus on shareholders alone exposes a firm
to undue risks that can undermine economic performance and can even threaten the very
survival of the enterprise. The strategist’s job, therefore, is to understand the complex
web of exchange relationships among different stakeholders. By doing so, the firm can
proactively shape the various relationships in order to maximize the joint value created,
and manage the distribution of this larger pie in a fair and transparent manner. Effec-
tive stakeholder management is an example of the actions managers can take in order to
improve firm performance, thereby enhancing its competitive advantage and the likeli-
hood of the continued survival of the firm.23
The Target Corporation has gathered numerous awards that reflect its strong relation-
ship with its stakeholders. It has been named on lists such as Best Places to Work, Most
Ethical Companies, Best in Class for Corporate Governance, and Grassroots Innovation.
In 2013, Target again held its position in the top 50 of Fortune’s Most Admired Compa-
nies List. Since its founding, Target has contributed 5 percent of its profits to education,
the arts, and social services in the communities in which it operates and reached the
milestone of contributing $4 million per week in 2012. To demonstrate its commitment
to minorities and women, Target launched a program to bring minority- and women-
owned businesses into its supply chain. Volunteerism and corporate giving strengthen the
relationship Target has with its employees, consumers, local communities, and suppliers.
These actions, along with many others, can help Target sustain its competitive advantage
as a retailer.
Strategy scholars have provided several arguments as to why effective stakeholder man-
agement can benefit firm performance:24
■ Satisfied stakeholders are more cooperative and thus more likely to reveal information
that can further increase the firm’s value creation or lower its costs.
■ Increased trust lowers the costs for firms’ business transactions.
■ Effective management of the complex web of stakeholders can lead to greater organi-
zational adaptability and flexibility.
■ The likelihood of negative outcomes can be reduced, creating more predictable and
stable returns.
■ Firms can build strong reputations that are rewarded in the marketplace by business
partners, employees, and customers. Most managers do care about public perception
of the firm, as evidenced by high-profile rankings such as the “World’s Most Admired
Companies” published annually by Fortune.25 As a case in point, Apple has come in
first for the last few years.
stakeholder strategy
An integrative approach to managing a diverse set of stakeholders effectively in order to gain and sustain competitive advantage.
WWW.YAZDANPRESS.COMWWW.YAZDANPRESS.COM

CHAPTER 1 What Is Strategy, and Why Is It Important? 13
STAKEHOLDER IMPACT ANALYSIS
The key challenge of stakeholder management is to effectively balance the needs of vari-
ous stakeholders. The firm of course needs to ensure that its primary stakeholders—the
firm’s shareholders and other investors—achieve their objectives. At the same time, the
firm wants to recognize and address the needs of other stakeholders—employees, suppli-
ers, and customers—in an ethical and fair manner, so that they too are satisfied. This all
sounds good in theory, but how can managers go about this in practice?
Stakeholder impact analysis provides a decision tool with which managers can rec-
ognize, prioritize, and address the needs of different stakeholders. This tool helps the firm
achieve a competitive advantage while acting as a good corporate citizen. Stakeholder
impact analysis takes managers through a five-step process of recognizing stakeholders’
claims. In each step, managers must pay particular attention to three important stakeholder
attributes: power, legitimacy, and urgency.26
■ A stakeholder has power over a company when it can get the company to do something
that it would not otherwise do.
■ A stakeholder has a legitimate claim when it is perceived to be legally valid or other-
wise appropriate.
■ A stakeholder has an urgent claim when it requires a company’s immediate attention
and response.
Exhibit 1.3 depicts the five steps in stakeholder impact analysis and the key questions to
be asked. Let’s look at each step in detail.
STEP 1: IDENTIFY STAKEHOLDERS. In step 1, the firm asks, “Who are our stake-
holders?” In this step, the firm focuses on stakeholders that currently have, or potentially
can have, a material effect on a company. This prioritization identifies the most powerful
stakeholders (both internal and external) and their needs. For public-stock companies, key
LO 1-5
Conduct a stakeholder impact analysis.
stakeholder impact
analysis A decision tool with which managers can recognize, prioritize, and address the needs of different stakeholders, enabling the firm to achieve competitive advantage while acting as a good corporate citizen.
EXHIBIT 1.3 / Stakeholder Impact Analysis
STEP 2
STEP 1 Who are our stakeholders?
What are our stakeholders’ interests and claims?
What opportunities and threats do our stakeholders present?
What economic, legal, ethical, and philanthropic responsibilitiesdo we have to our stakeholders?
What should we do to effectively address thestakeholder concerns?
STEP 3
STEP 4
STEP 5
H
H
H
H
WWW.YAZDANPRESS.COMWWW.YAZDANPRESS.COM

14 CHAPTER 1 What Is Strategy, and Why Is It Important?
stakeholders are the shareholders and other suppliers of capital. If shareholders are not sat-
isfied with returns to investment, they will sell the company’s stock, leading to depreciation
in the firm’s market value.
A second group of stakeholders includes customers, suppliers, and unions. Any of
these groups, if their needs are not met, can materially affect the company’s operations.
For example, the bankruptcy of Hostess Brands—the maker of Twinkies (an American
snack cake)—is partially attributed to the unions’ unwillingness to accept further conces-
sions.27 Local communities and the media are also powerful stakeholders that can materi-
ally affect the smooth operation of the firm.
STEP 2: IDENTIFY STAKEHOLDERS’ INTERESTS. In step 2, the firm asks, “What
are our stakeholders’ interests and claims?” Managers need to specify and assess the
interests and claims of the pertinent stakeholders using the power, legitimacy, and urgency
criteria introduced earlier. As the legal owners, shareholders have the most legitimate
claim on a company’s profits. However, the separation between ownership (by sharehold-
ers) and control of the firm (by professional managers) has been blurring. Many compa-
nies incentivize top executives by paying part of their overall compensation with stock
options. They also turn employees into shareholders through employee stock ownership plans (ESOPs). These plans allow employees to purchase stock at a discounted rate or use
company stock as an investment vehicle for retirement savings. For example, Coca-Cola,
Google, Microsoft, Southwest Airlines, Starbucks, Walmart, and Whole Foods all offer
ESOPs. Clearly, the claims and interests of stakeholders who are employed by the com-
pany, and who depend on the company for salary and other benefits, will be somewhat
different from those of stakeholders who merely own stock. The latter are investors who
are primarily interested in the increased value of their stock holdings through appreciation
and dividend payments. Executives, managers, and workers tend to be more interested in
career opportunities, job security, employer-provided health care, paid vacation time, and
other perks.
Even within stakeholder groups there can be significant variation in the power a stake-
holder may exert on the firm. For example, public companies pay much more attention to
large institutional investors than to the millions of smaller, individual investors. Institu-
tional investors have considerable sway because of the size of their assets under manage-
ment (AUM). For example, TIAA-CREF28 has assets under management of $440 billion,
CalPERS29 has $220 billion in AUM, and The Vanguard Group has $1.6 trillion. Although
both individual and institutional investors can claim the same legitimacy as stockholders,
institutional investors have much more power over a firm. They can buy and sell a large
number of shares at once, or exercise block-voting rights in the corporate-governance pro-
cess (which we’ll discuss in detail in Chapter 12). These abilities make institutional inves-
tors much more potent stakeholders.
STEP 3: IDENTIFY OPPORTUNITIES AND THREATS. In step 3, the firm asks,
“What opportunities and threats do our stakeholders present?” Since stakeholders have a
claim on the company, opportunities and threats are two sides of the same coin. Consumer
boycotts, for example, can be a credible threat to a company’s behavior. Some consumers
boycotted Nestlé products due to the firm’s promotion of infant formula over breast milk
in developing countries. PETA30 called for a boycott of McDonald’s due to alleged animal-
rights abuses.
In the best-case scenario, managers transform such threats into opportunities. Sony
Corp., for example, was able to do just that.31 In 2001, the Dutch government blocked
WWW.YAZDANPRESS.COMWWW.YAZDANPRESS.COM

CHAPTER 1 What Is Strategy, and Why Is It Important? 15
Sony’s entire holiday season shipment of PlayStation game systems (valued at roughly
$500 million) into the European Union due to a small but legally unacceptable amount of
toxic cadmium discovered in one of the system’s cables. This incident led to an 18-month
investigation in which Sony inspected over 6,000 supplier factories around the world to
track down the source of the problem. The findings allowed Sony to redesign and develop
a cutting-edge supplier management system that now adheres to a stringent extended value
chain responsibility.
STEP 4: IDENTIFY SOCIAL RESPONSIBILITIES. In step 4, the firm asks, “What
economic, legal, ethical, and philanthropic responsibilities do we have to our stakehold-
ers?” To identify these responsibilities more effectively, scholars have advanced the notion
of corporate social responsibility (CSR). This framework helps firms recognize and
address the economic, legal, ethical, and philanthropic expectations that society has of the
business enterprise at a given point in time.32 According to the CSR perspective, managers
need to realize that society grants shareholders the right and privilege to create a publicly
traded stock company. Therefore, the firm owes something to society.33 Moreover, CSR
provides managers with a conceptual model that more completely describes a society’s
expectations and can guide strategic decision making more effectively. In particular, CSR
has four components: economic, legal, ethical, and philanthropic responsibilities.
Economic Responsibilities. The business enterprise is first and foremost an economic
institution. Investors expect an adequate return for their risk capital. Creditors expect the
firm to repay its debts. Consumers expect safe products and services at appropriate prices
and quality. Suppliers expect to be paid in full and on time. Governments expect the firm
to pay taxes and to manage natural resources such as air and water under a decent steward-
ship. To accomplish all this, firms must obey the law and act ethically in their quest to gain
and sustain competitive advantage.
Legal Responsibilities. Laws and regulations are a society’s codified ethics, embody-
ing notions of right and wrong. They also establish the rules of the game. For example,
business as an institution can function because property rights exist and contracts can be
enforced in courts of law. Managers must ensure that their firms obey all the laws and regu-
lations, including but not limited to labor, consumer, and environmental laws.
One far-reaching piece of U.S. legislation, for example, is the Accounting Reform and
Investor Protection Act (commonly known as the Sarbanes–Oxley Act or SOX), passed
in response to the accounting scandals mentioned earlier. Among different stipulations,
Sarbanes–Oxley increases a CEO’s and CFO’s personal responsibility for the accuracy of
reported accounting data. It also strengthens the independence of accounting firms (they
are no longer allowed to provide consulting services to the firms they audit) and affords
stronger protection for whistleblowers.
Due to a firm’s significant legal responsibilities, many companies appoint compliance
officers; some even have an office of corporate citizenship. At GE, for example, a vice
president leads the office of corporate citizenship. Its compliance group is comprised of
more than 1,000 experienced lawyers, located at the various GE businesses throughout
the globe. Their mission is to help GE achieve a competitive advantage with “unyielding
integrity and compliance to the law.”34
Ethical Responsibilities. Legal responsibilities, however, often define only the minimum
acceptable standards of firm behavior. Frequently, managers are called upon to go beyond
corporate social
responsibility (CSR)
A framework that helps firms recognize and address the economic, legal, social, and philanthropic expectations that society has of the business enterprise at a given point in time.
WWW.YAZDANPRESS.COMWWW.YAZDANPRESS.COM

16 CHAPTER 1 What Is Strategy, and Why Is It Important?
EXHIBIT 1.4 /The Pyramid of Corporate Social ResponsibilitySOURCE: Adapted from A. B. Carroll (1991), “The pyramid of corporate social responsibility: Toward the moral management of organizational stakeholders,” Business Horizons, July–August: 42.
Philanthropic Responsibilities
EthicalResponsibilities
Legal Responsibilities
Economic Responsibilities
Corporate
citizenship
Do what is
right, just, and fair
Laws and regulations are society’s
codified ethics
Define minimum acceptable standard
Gain and sustain competitive advantage
what is required by law. The letter of the law cannot address or anticipate all possible busi-
ness situations and newly emerging concerns like Internet privacy or advances in genetic
engineering and stem-cell research.
A firm’s ethical responsibilities, therefore, go beyond its legal responsibilities. They
embody the full scope of expectations, norms, and values of its stakeholders. Managers are
called upon to do what society deems just and fair. Starbucks, for example, developed an
ethical sourcing policy to help source coffee of the highest quality, while adhering to fair
trade and responsible growing practices.
Philanthropic Responsibilities. Philanthropic responsibilities are often subsumed under the
idea of corporate citizenship, reflecting the notion of voluntarily giving back to society.
Over the years, Microsoft’s corporate philanthropy program has donated more than $3 bil-
lion in cash and software to people who can’t afford computer technology.35
The pyramid in Exhibit 1.4 summarizes the four components of corporate social respon-
sibility.36 Economic responsibilities are the foundational building block, followed by legal,
ethical, and philanthropic responsibilities. Note that society and shareholders require eco-
nomic and legal responsibilities. Ethical and philanthropic responsibilities result from
a society’s expectations toward business. The pyramid symbolizes the need for firms to
carefully balance their social responsibilities. Doing so ensures not only effective strategy
implementation, but also long-term viability.
STEP 5: ADDRESS STAKEHOLDER CONCERNS. Finally, in step 5, the firm asks,
“What should we do to effectively address any stakeholder concerns?” In the last step in
stakeholder impact analysis, managers need to decide the appropriate course of action for
the firm, given all of the preceding factors. Thinking about the attributes of power, legiti-
macy, and urgency helps to prioritize the legitimate claims and to address them accord-
ingly. Strategy Highlight 1.2 describes how the U.S. government legitimized claims by
thousands of businesses and individuals in the aftermath of the BP oil spill in the Gulf of
Mexico, causing the claims to become of great urgency to BP.
WWW.YAZDANPRESS.COMWWW.YAZDANPRESS.COM

CHAPTER 1 What Is Strategy, and Why Is It Important? 17
1.3 The AFI Strategy Framework
How do firms go about creating strategies that enhance their chances of achieving superior
performance? A successful strategy details a set of actions that managers take to gain and
sustain competitive advantage. Effectively managing the strategy process is the result of
three broad tasks:
1. Analyze (A)
2. Formulate (F)
3. Implement (I)
The tasks of analyze, formulate, and implement are the pillars of research and knowl-
edge about strategic management. Although we will study each of these tasks one at a time,
they are highly interdependent and frequently happen simultaneously. Effective managers
do not formulate strategy without thinking about how to implement it, for instance. Like-
wise, while implementing strategy, managers are constantly analyzing the need to adjust to
changing circumstances.
We’ve captured these interdependent relationships in the AFI strategy framework shown
in Exhibit 1.5. We want this framework to do two things: (1) to explain and predict differences
in firm performance, and (2) to help managers formulate and implement a strategy that results
in superior performance. In each of the three broad management tasks, managers focus on
specific questions, listed below. We address these questions in specific chapters, as indicated.
AFI strategy
framework
A model that links three interdependent strategic management tasks—analyze, formulate, and implement—that, together, help managers plan and implement a strategy that can improve performance and result in competitive advantage.
BP: “Lack of Business Integrity”?
On April 20, 2010, an explosion occurred on BP’s Deep-water Horizon oil drilling rig off the Louisiana coastline, killing 11 workers. The subsequent oil spill continued unabated for over three months. It released an estimated 5 million barrels of crude oil into the Gulf of Mexico, caus-ing the largest environmental disaster in U.S. history. The cleanup alone cost BP $14 billion, and two of its employ-ees even faced manslaughter charges.
Technical problems aside, many experts argued that BP’s problems were systemic, because management had repeatedly failed to put an adequate safety culture in place. In 2005, for example, BP experienced a catastrophic accident at a Texas oil refinery, which killed 15 workers. A year later, a leaking BP pipeline caused the largest oil spill ever on Alaska’s North Slope. BP’s strategic focus on cost reductions, initiated a few years earlier, may have signifi-cantly compromised safety across the board.
In the aftermath of the Gulf oil spill, BP faced thou-sands of claims by many small business owners in the tourism and seafood industries. These business owners were not powerful individually, and pursuing valid legal claims meant facing protracted and expensive court
proceedings. As a collective organized in a potential class-action lawsuit, however, they were powerful. More-over, their claims were backed by the U.S. government, which has the power to withdraw BP’s business license or cancel current permits and withhold future ones. Col-lectively, the small business owners along the Gulf Coast became powerful BP stakeholders, with a legitimate claim that needed to be addressed. In response, BP agreed to pay out $8 billion to settle their claims. Taken together, the monetary damages of the Deepwater Horizon disaster alone have cost BP about $22 billion to date, not to men-tion the loss in reputation and goodwill.
Even so, this was not the end of the story for BP. Addi-tional fines of up to $20 billion may still come if BP is found to have committed “gross negligence.” Moreover, claiming that BP displayed a “lack of business integrity” in handling the Gulf oil spill, the Environmental Protection Agency (EPA) banned BP from any new contracts with the U.S. government. If the EPA decision stands, the ban would put BP at a major competitive disadvantage. It would be unable to acquire new leases for oil field exploration in the U.S., or to continue as a major supplier of refined fuel to the armed forces.37
1.2
WWW.YAZDANPRESS.COMWWW.YAZDANPRESS.COM

18 CHAPTER 1 What Is Strategy, and Why Is It Important?
Strategy Analysis (A) Topics and Questions ■ Strategic leadership and the strategy process: What roles do strategic leaders play?
What are the firm’s vision, mission, and values? What is the firm’s process for creating strategy and how does strategy come about? (Chapter 2)
■ External analysis: What effects do forces in the external environment have on the firm’s potential to gain and sustain a competitive advantage? (Chapter 3)
■ Internal analysis: What effects do internal resources, capabilities, and core competencies have on the firm’s potential to gain and sustain a competitive advantage? (Chapter 4)
■ Competitive advantage, firm performance, and business models: How does the firm make money? How can it assess and measure competitive advantage? What is the rela-tionship between competitive advantage and firm performance? (Chapter 5)
Strategy Formulation ( F ) Topics and Questions ■ Business strategy: How should the firm compete: cost leadership, differentiation, or
integration? (Chapters 6 and 7)
■ Corporate strategy: Where should the firm compete: industry, markets, and geography?
(Chapters 8 and 9)
■ Global strategy: How and where (local, regional, national, and international) should the firm compete: local, national, or international? (Chapter 10)
Strategy Implementation (I ) Topics and Questions ■ Organizational design: How should the firm organize to put the formulated strategy
into practice? (Chapter 11)
■ Corporate governance and business ethics: What type of corporate governance is most effective? How does the firm anchor strategic decisions in business ethics? (Chapter 12)
EXHIBIT 1.5 / The AFI Strategy Framework
1. What Is Strategy, and Why Is It Important?
3. External Analysis: Industry Structure, Competitive Forces, and Strategic Groups4. Internal Analysis: Resources, Capabilities, and Core Competencies
6. Business Strategy: Differentiation, Cost Leadership, and Integration7. Business Strategy: Innovation and Entrepreneurship
8. Corporate Strategy: Vertical Integration and Diversification
9. Corporate Strategy: Mergers and Acquisitions, Strategic Alliances
10. Global Strategy: Competing Around the World
11. Organizational Design: Structure, Culture, and Control
Getting
Started
External and
Internal
Analysis
Formulation:
Business
Strategy
Formulation:
Corporate
Strategy
Implementation
Gaining &
Sustaining
Competitive
Advantage
12. Corporate Governance and Business Ethics
2. Strategic Leadership: Managing the Strategy Process
Part 1:
S trategy Analysis
Part 1:
S trategy Analysis
Part 2:
S trategy Formulation
Part 2:
S trategy Formulation
Part 3:
S trategy Implementation
5. Competitive Advantage, Firm Performance, and Business Models
WWW.YAZDANPRESS.COMWWW.YAZDANPRESS.COM

CHAPTER 1 What Is Strategy, and Why Is It Important? 19
The AFI strategy framework shown in Exhibit 1.5 will be repeated at the beginning of
each part of this book, to help contextualize where we are in our study of the firm’s quest
to gain and sustain competitive advantage.
In addition, the strategy process map, presented inside the back cover, illustrates the
steps in the AFI framework in more detail. The different background shades correspond
to each step in the AFI framework. This strategy process map highlights the key strategy
concepts and frameworks we’ll cover in each chapter. It also serves as a checklist when
you conduct a strategic management analysis.
1.4 Implications for the Strategist
The strategist realizes that the difference between success and failure lies in a firm’s strat-
egy. Applying the tools and frameworks developed in this text will allow you to help your
firm be more successful. Moreover, you can also apply the strategic management toolkit to
your own career to pursue your professional goals (see the myStrategy modules at the end
of each chapter). Basically, strategy is the science of success and failure.The strategist also appreciates the fact that competition is everywhere. The strategist
knows that the principles of strategic management can be applied universally to all orga-
nizations. Strategists work in organizations from government to free enterprise, from pub-
licly owned companies to privately owned ones, from for-profit to nonprofit organizations,
and in developed as well as emerging economies. The strategist also knows that firm per-
formance is determined by a set of interdependent factors, including firm and industry
effects. The strategist is empowered by the fact that the actions he or she creates have more
influence on firm performance than the external environment.
To be more effective, the strategist follows a three-step process:
1. Analyze the external and internal environments.
2. Formulate appropriate business and corporate strategies.
3. Implement the formulated strategies through structure, culture, and controls.
Keep in mind that the strategist is making decisions under conditions of uncertainty and
complexity. As the strategist is following the AFI steps, he or she maintains an awareness
of key stakeholders and how they can affect or be affected by the decisions that are made.
The strategist then monitors and evaluates the progress toward key strategic objectives and
makes adjustments by fine-tuning the strategy as necessary. We discuss how this is done in
the next chapter where we focus on strategic leaders and the strategic management process.
N NOT LONG AFTER Apple became the world’s most valuable company, signs of trouble emerged. Although Apple enforced its intellectual property in a legal dispute with Samsung, it entered into a licensing agreement with HTC, a Taiwanese maker of mobile phones. Some argue that Apple under Steve Jobs’ leadership would never have entered any agreements that would allow
direct competitors to benefit from Apple’s proprietary tech-nology. Despite Apple’s court-room victory against Samsung, Samsung sold more smartphones than Apple in 2012. With its Galaxy S3 model running on Google’s Android system, sales prove that Samsung has a viable competitor against Apple’s
CHAPTERCASE 1 Consider This . . .
WWW.YAZDANPRESS.COMWWW.YAZDANPRESS.COM

20 CHAPTER 1 What Is Strategy, and Why Is It Important?
iPhone 5. In 2013, Samsung introduced the new Galaxy S4 model, further intensifying the head-on competition with Apple.
Uncharacteristically, Apple botched the product launch for the iPhone 5. The embedded Apple map app was far inferior to Google maps, which was used in earlier versions of the iPhone. Subsequently, Apple’s top management team also experienced sudden turn-over, with some of its executives being forced out. In one instance, CEO Tim Cook asked Scott Forstall, vice president of iPhone and iOS Software and a Steve Jobs protégé, to leave after Forstall refused to sign an apology letter to customers for the shortcomings on the iPhone 5’s mapping service. The head of Apple’s famed retail operations was also forced out after only six months on the job.
After reaching $658 billion in market valuation and becoming the world’s most valuable company, by March 2013 Apple’s share price had dropped more than 45 percent, wiping out close to $290 billion in shareholder value. Clearly, while it is difficult to gain a
competitive advantage in the first place, it is that much more difficult to sustain it.38
Questions
Thinking about ChapterCase 1, answer the following questions.
1. Explain Apple’s success over the last decade. Think about which industries it has disrupted and how. Also take a look at Apple’s main competitors.
2. Is Apple’s success attributable to industry effects or firm effects, or a combination of both? Explain.
3. Apply the three-step process for developing a good strategy outlined above (diagnose the com-petitive challenge, derive a guiding policy, and implement a set of coherent actions) to Apple’s situation today. Which recommendations would you have for Apple to outperform its competitors in the future?
4. Why do you think it is so hard not only to gain but also to sustain a competitive advantage?
This chapter defined strategy and competitive advan-
tage and discussed the role of business in society. It
also set the stage for further study of strategic man-
agement, as summarized by the following learning
objectives and related take-away concepts.
LO 1-1 / Explain the role of strategy in a
firm’s quest for competitive advantage.
■ Strategy is the set of goal-directed actions a firm
takes to gain and sustain superior performance
relative to competitors.
■ A good strategy enables a firm to achieve superior
performance. It consists of three elements:
1. A diagnosis of the competitive challenge.
2. A guiding policy to address the competitive
challenge.
3. A set of coherent actions to implement the
firm’s guiding policy.
■ A successful strategy requires three integrative
management tasks—analysis, formulation, and
implementation.
LO 1-2 / Define competitive advantage, sus-
tainable competitive advantage, competitive
disadvantage, and competitive parity.
■ Competitive advantage is always judged relative
to other competitors or the industry average.
■ To obtain a competitive advantage, a firm must
either create more value for customers while
keeping its cost comparable to competitors, or it
must provide the value equivalent to competitors
but at a lower cost.
■ A firm able to outperform competitors for pro-
longed periods of time has a sustained competi-
tive advantage.
TAKE-AWAY CONCEPTS
WWW.YAZDANPRESS.COMWWW.YAZDANPRESS.COM

CHAPTER 1 What Is Strategy, and Why Is It Important? 21
■ A firm that continuously underperforms its
rivals or the industry average has a competitive
disadvantage.
■ Two or more firms that perform at the same level
have competitive parity.
■ An effective strategy requires that strategic
trade-offs be recognized and addressed—for
example, between value creation and the costs
to create the value.
LO 1-3 / Differentiate the roles of firm effects
and industry effects in determining firm
performance.
■ A firm’s performance is more closely related to
its managers’ actions (firm effects) than to the
external circumstances surrounding it (industry
effects).
■ Firm and industry effects, however, are interde-
pendent. Both are relevant in determining firm
performance.
LO 1-4 / Evaluate the relationship between
stakeholder strategy and sustainable competi-
tive advantage.
■ Stakeholders are individuals or groups that
have a claim or interest in the performance and
continued survival of the firm. They make spe-
cific contributions for which they expect rewards
in return.
■ Internal stakeholders include stockholders,
employees (for instance, executives, managers,
and workers), and board members.
■ External stakeholders include customers, suppli-
ers, alliance partners, creditors, unions, communi-
ties, and governments at various levels.
■ Several recent black swan events eroded the pub-
lic’s trust in business as an institution and free-
market capitalism as an economic system.
■ The effective management of stakeholders, the
organization, groups, or individuals that can mate-
rially affect or are affected by the action of a firm,
is necessary to ensure the continued survival of
the firm and to sustain any competitive advantage.
LO 1-5 / Conduct a stakeholder impact
analysis.
■ Stakeholder impact analysis considers the needs
of different stakeholders, which enables the firm
to perform optimally and to live up to the expec-
tations of good citizenship.
■ In a stakeholder impact analysis, managers pay
particular attention to three important stakeholder
attributes: power, legitimacy, and urgency.
■ Stakeholder impact analysis is a five-step
process that answers the following questions for
the firm:
1. Who are our stakeholders?
2. What are our stakeholders’ interests and
claims?
3. What opportunities and threats do our stake-
holders present?
4. What economic, legal, and ethical responsibili-
ties do we have to our stakeholders?
5. What should we do to effectively address the
stakeholder concerns?
AFI strategy framework
Black swan events
Competitive advantage
Competitive disadvantage
Competitive parity
KEY TERMS
Corporate social
responsibility (CSR)
Firm effects
Industry effects
Stakeholder
Stakeholder impact analysis
Stakeholder strategy
Strategic management
Strategy
Sustainable competitive advantage
WWW.YAZDANPRESS.COMWWW.YAZDANPRESS.COM

22 CHAPTER 1 What Is Strategy, and Why Is It Important?
1. Consider the brief description of Target’s stake-
holder relationships and combine that information
with your experience shopping in a Target store.
How might Target’s stakeholders (in particular,
employees, customers, local communities, and
suppliers) influence the manager’s decisions
about building competitive advantage in the
analysis stage of the AFI framework? How might
Target gather information from its stakeholders
in order to inspire a better customer experience
in the formulation stage in order to differentiate?
Or in order to lower costs? Brainstorm (by jotting
down as many ideas as you can think of) about
how key stakeholders may affect (or be affected
by) the implementation stage.
2. BP’s experience in the Gulf of Mexico has made
it the poster company for how not to manage
stakeholder relationships effectively (see Strategy
Highlight 1.2). What advice would you give to
BP’s managers in order to help them continue
to rebuild stakeholder relationships in the Gulf
region? How can BP repair its damaged reputa-
tion? Brainstorm ways that top management
might leverage the experience gained by reacting
in the Gulf and use that knowledge to motivate
local managers and employees in other locales to
build stakeholder relationships proactively so that
BP avoids this type of negative publicity.
3. As noted in the chapter, research found that firm
effects are more important than industry effects.
What does this mean? Can you think of situations
where this might not be true?
4. Choose an industry with a clear leader, and then
examine the differences between the leader and
one or two of the other competitors in the indus-
try. How do the strategies differ? What has the
leader done differently? Or what different things
has the leader done?
DISCUSSION QUESTIONS
//// Small-Group Exercise 1
Form small groups of three to four students. Search
the Internet on the following topic and debate your
findings.
The chapter includes a discussion of black swan
events that were improbable and unexpected yet had
an extreme impact on the well-being of individuals,
firms, and nations. Nassim Nicholas Taleb, author of
SMALL-GROUP EXERCISES
1. Choose one of the companies discussed in the chap-
ter (such as BP, Target, JetBlue, or Apple). By look-
ing at the company’s annual report on its web page
or conducting an Internet search for news about the
company, identify instances where the company has
acted ethically or showed its interest in a key stake-
holder—or where it has failed to do so.
2. Corporate leaders are responsible for setting the
firm’s strategies to gain and sustain a competitive
advantage. Should managers be concerned only
about the company’s financial performance? What
responsibility do company managers have for other
consequences of their strategies? For example,
should Walmart try to mitigate the negative impact
its arrival in communities can have on small locally
owned stores? Should Apple be concerned about the
working conditions at Foxconn (the company that
manufactures Apple’s devices such as the iPhone
and the iPad in China)? Why or why not? Explain.
3. Other than Whole Foods, think of company exam-
ples where “doing things right” and acting in the
interests of broader stakeholders (rather than just
stockholders alone) have produced a stronger
competitive advantage. Why was this the case?
ETHICAL/SOCIAL ISSUES
WWW.YAZDANPRESS.COMWWW.YAZDANPRESS.COM

CHAPTER 1 What Is Strategy, and Why Is It Important? 23
The Black Swan, has argued that policymakers and
decision makers need to focus on building more robust
organizations or systems rather than on improving
predictions of events. This notion is reflected in the
response to the predicted increase in powerful storms
and storm surges. Hurricanes Katrina (which devas-
tated New Orleans and parts of the Gulf Coast) and
Sandy (which wreaked havoc on the New Jersey coast)
have stimulated discussions about how to not only
build a more resilient infrastructure and buildings, but
also develop more flexible and effective responses.
Each group should search the Internet about options
and plans to (1) build more sustainable communities
that will help threatened areas cope with superstorms,
storm surges, or drought conditions, and (2) organize
responses to black swan events (such as natural disas-
ters or terrorist attacks) more effectively. Brainstorm
additional recommendations that you might make to
policymakers.
//// Small-Group Exercise 2
JetBlue was discussed as an example of a company
with an unclear strategy. It was stuck in the middle
because it failed to straddle both a low-cost and dif-
ferentiated position at the same time (Strategy High-
light 1.1). Scan the current mainstream media for
examples of companies that are launching new prod-
ucts or services. Identify whether the company seems
to be emphasizing ways that it has lowered costs (and
will compete on the basis of price) or ways that it
is adding features (and will compete on the basis of
uniqueness). Or, does the company seem to be trying
to do both? Discuss this within your group and pre-
pare a three-minute summary to present to the class
that illustrates the company’s approach.
STRATEGY TERM PROJECT
//// Project Overview
The goal of the strategy term project is to give you
practical experience with the elements of strate-
gic management. Each end-of-chapter assignment
requires data collection and analysis relating the mate-
rial discussed in the chapter to the firm you select here
for study throughout the course. At the end of each
chapter, we make additional stages of a strategic anal-
ysis available. The goal of this term-long project is to
give you a tangible application of many of the con-
cepts discussed in the text. By the end of the project,
you will not only have practice in using key strategic
management components and processes to increase
your understanding of the material, but you will also
be able to conduct a complete strategic management
analysis of any company.
//// Module 1: Initial Firm Selection
and Review
In this first module, you will identify a firm to study
for this project. We suggest you select one company
and use it for each module in this term project. Choose
a firm that you find interesting or one that is part of an
industry you would like to know more about. Through-
out the modules, you will be required to obtain and
analyze a significant amount of data about the firm.
Therefore, a key criterion is also to choose a firm that
has data available for you to gather.
The primary approach to this project is to select a
publicly held firm. Many large firms such as Apple,
Coca-Cola, and GE have been widely reported on in
the business and popular press, and a wealth of infor-
mation is available on them. Other medium-sized
public firms such as GameStop, Netflix, and Under
Armour can be used as example firms for this proj-
ect. One cautionary note: For firms that are less than
three years public or in industries that are not well-
defined, it will take some additional reflection to prop-
erly identify such items as competitors and suppliers.
But if it is a firm you are truly motivated to study, the
effort can be quite rewarding.
Relevant data on all public firms can be freely
obtained using web services such as Edgar (www.
sec.gov/edgar.shtml). (For guidance on how to pull
data from the Securities and Exchange Commission
[SEC] website, go to the OLC connected with this
product at www.mhhe.com/ftrStrategy2e.) Annual
WWW.YAZDANPRESS.COMWWW.YAZDANPRESS.COM

24 CHAPTER 1 What Is Strategy, and Why Is It Important?
reports for firms also are a treasure-trove of informa-
tion. These reports and other quarterly update mate-
rials are often available from the firm’s own website
(look for “about us” or “investor relations” tabs,
often located at the bottom of the company’s web-
site). Additionally, most university and public librar-
ies have access to large databases of articles from
many trade publications. (Factiva and ABI/Proquest
are two examples.) Company profiles of a variety of
publicly listed firms are available at reliable websites
such as Hoovers.com and finance.yahoo.com. Also,
many industries have quite active trade associations
that will have websites and publications that can also
be useful in this process. Your local librarian can
likely provide you with some additional resources
that may be licensed for library use or that are oth-
erwise not available online. Examples of these are
Value Line Ratings & Reports and Datamonitor.
A second approach to this project is to select a
smaller firm in your area. These firms may have cov-
erage in the local press. However, if the firm is not
public, you will need to ensure you have access to a
wide variety of data from the firm. If this is a firm for
which you have worked or where you know people,
please check ahead of time to be sure the firm is will-
ing to share its information with you. This approach
can work well, especially if the firm is interested in
a detailed analysis of its strategic position. But to be
successful with this project, be sure you will have
access to a broad range of data and information (per-
haps including interviews of key managers at the
firm).
If you are in doubt on how to select a firm, check with your instructor before proceeding. In some instances, your instructor will assign firms to the study groups.
For this module, complete or answer the following:
1. Provide a brief history of the company.
2. List the top management of the firm and
note what experience and leadership skills
they bring to the firm. If it is a larger con-
glomerate, list both the corporate and business
managers.
3. What is the principal business model of the firm?
(How does the firm make most of its profits?)
How to Position Yourself
for Career Advantage
As the chapter discussed, firm-level decisions have a significant impact on the success or failure of orga-nizations. Industry-level effects, however, can also
play an important role (see Exhibit 1.1). Many considerations go into deciding what career choices you make during your working life. The table on the next page provides a sample of revenue growth rates in various industries for a recent five-year period. It shows the data for the top-25 and bottom-25 industries, including the total industry average (out of roughly
100 industries tracked). Using that table, answer the following questions.
1. If you are about to embark on a new career or consider switching careers, what effect should the likelihood of industry growth play in your decision?
2. Why could growth rates be an important consideration? Why not?
3. The data in the table show the most recent five years available. How do you expect this list to look five years from now? Which three to five industries do you expect to top the list, and which three to five industries will be at the bottom of the list? Why?
my STRATEGY
WWW.YAZDANPRESS.COMWWW.YAZDANPRESS.COM

CHAPTER 1 What Is Strategy, and Why Is It Important? 25
Top-25 and Bottom-25 Industries (by Revenue Growth Rates), 2007–201139
Rank Industry Name Growth in Revenue Average for All Industries 7.38%
1 Semiconductor equip. 55.88% 75 Telecom. equipment 4.18%
2 Power 43.06% 76 Retail (hardlines) 3.83%
3 Semiconductor 41.30% 77 Shoe 3.50%
4 Public/private equity 39.94% 78 Building materials 2.82%
5 Drug 34.97% 79 Toiletries/cosmetics 2.56%
6 Chemical (basic) 33.40% 80 Restaurant 2.45%
7 Precious metals 32.31% 81 Furn./home furnishings 1.89%
8 Petroleum (producing) 32.22% 82 Automotive 1.66%
9 Metals and mining (div.) 31.59% 83 Cable TV 1.53%
10 Steel 30.89% 84 Electric utility (west) 1.24%
11 Biotechnology 26.94% 85 Funeral services 1.09%
12 Chemical (specialty) 25.69% 86 Human resources 0.01%
13 Electrical equipment 25.14% 87 R.E.I.T. 0.01%
14 Auto parts 23.94% 88 Bank 0.00%
15 Precision instrument 23.36% 89 Bank (midwest) 0.00%
16 Pipeline MLPs 22.83% 90 Insurance (life) 0.00%
17 E-commerce 21.87% 91 Reinsurance 0.00%
18 Petroleum (integrated) 20.81% 92 Thrift 0.00%
19 Property management 19.80% 93 Beverage 20.59%
20 Foreign electronics 17.51% 94 Natural gas utility 20.95%
21 Educational services 17.27% 95 Electric utility (east) 23.29%
22 Diversified co. 17.24% 96 Newspaper 25.01%
23 Oil field services/equip. 17.02% 97 Telecom. utility 26.90%
24 Insurance (prop./cas.) 17.00% 98 Publishing 26.93%
25 Coal 16.91% 99 Homebuilding 29.29%
1. Apple’s valuation is in absolute dollars,
not in real (inflation-adjusted) dollars. When
adjusted for inflation since 1999, Microsoft’s
record market valuation would be roughly
$850 billion in 2012; see “From pipsqueak to
powerhouse,” The Economist, August 21, 2012.
2. This ChapterCase is based on: Isaacson,
W. (2011), Steve Jobs (New York: Simon &
Schuster); “An iPopping phenomenon,” The Economist, March 24, 2012; “iRational?”
The Economist, March 24, 2012; “Apple
market value hits record high,” The Wall Street Journal, August 20, 2012; “GiantApple,” The Economist, August 21, 2012.
3. This section draws on: Porter, M. E. (1980),
Competitive Strategy: Techniques for Analyzing
Competitors (New York: The Free Press);
Porter, M. E. (1996), “What is strategy?” Har-vard Business Review, November–December:
61–78; and Rumelt, R. (2011), Good Strategy, Bad Strategy: The Difference and Why It Mat-ters (New York: Crown Business).
4. Rumelt, R. (2011), Good Strategy, Bad Strategy.
5. Rumelt, R. (2011), Good Strategy, Bad Strategy, p. 14.
6. Sull, D., and K. E. Eisenhardt (2012),
“Simple rules for a complex world,” Harvard Business Review, September.
7. This section draws on: Porter, M. E.
(1980), Competitive Strategy: Techniques
for Analyzing Competitors (New York: The
Free Press); Porter, M. E. (1996), “What is
strategy?” Harvard Business Review, Novem-
ber–December: 61–78; and Porter, M. E.
(2008), “The five competitive forces that shape
strategy,” Harvard Business Review, January:
78–93.
8. This section draws on: Porter, M. E. (1980),
Competitive Strategy: Techniques for Analyz-ing Competitors (New York: The Free Press);
Porter, M. E. (1996), “What is strategy?”
Harvard Business Review, November–
December: 61–78; and Porter, M. E. (2008),
“The five competitive forces that shape
strategy,” Harvard Business Review, January:
78–93.
ENDNOTES
WWW.YAZDANPRESS.COMWWW.YAZDANPRESS.COM

26 CHAPTER 1 What Is Strategy, and Why Is It Important?
9. Porter, M. E. (1996), “What is strategy?”;
and Rumelt, R. (2011), Good Strategy, Bad Strategy.
10. Neeleman, D. (2003), Entrepreneurial
Thought Leaders Lecture, Stanford Technol-ogy Ventures Program, April 30; Friedman, T.
(2005), The World Is Flat: A Brief History of the Twenty-First Century (New York: Farrar,
Strauss and Giroux); Bryce, D. J., and J. H.
Dyer (2007), “Strategies to crack well-guarded
markets,” Harvard Business Review, May;
“Held hostage on the tarmac: Time for a pas-
senger bill of rights?” The New York Times, February 16, 2007; and “Can JetBlue weather
the storm?” Time, February 21, 2007.
11. Porter, M. E. (1980), Competitive Strat-egy; Porter, M. E. (1996), “What is strategy?”
Harvard Business Review, November–
December: 61–78; and Rumelt, R. (2011),
Good Strategy, Bad Strategy.
12. This interesting debate unfolds in the fol-
lowing articles, among others: Hansen, G. S.,
and B. Wernerfelt (1989), “Determinants of
firm performance: The relative importance
of economic and organizational factors,”
Strategic Management Journal 10: 399–411;
Rumelt, R. P. (1991), “How much does indus-
try matter?” Strategic Management Journal 12: 167–185; Roquebert, J. A., R. L. Phil-
lips, and P. A. Westfall (1996), “Markets vs.
management: What ‘drives’ profitability?”
Strategic Management Journal 17: 653–664;
McGahan, A. M., and M. E. Porter (1997),
“How much does industry matter, really?”
Strategic Management Journal 18: 15–30;
Hawawini, G., V. Subramanian, and P. Verdin
(2003), “Is performance driven by industry-
or firm-specific factors? A new look at the
evidence,” Strategic Management Journal 24:
1–16; and Misangyi, V. F., H. Elms,
T. Greckhamer, and J. A. Lepine (2006),
“A new perspective on a fundamental debate:
A multilevel approach to industry, corporate,
and business unit effects,” Strategic Manage-ment Journal 27: 571–590.
13. Ibid.
14. Ibid.
15. Smith, A. (1776), An Inquiry into the Nature and Causes of the Wealth of Nations, 5th ed. (published 1904) (London: Methuen
and Co.).
16. This discussion draws on: Porter, M. E.,
and M. R. Kramer (2006), “Strategy and soci-
ety: The link between competitive advantage
and corporate social responsibility,” Harvard Business Review, December: 80–92; Porter,
M. E., and M. R. Kramer (2011), “Creating
shared value: How to reinvent capitalism—and
unleash innovation and growth,” Harvard Business Review, January–February; Carroll,
A. B., and A. K. Buchholtz (2012), Business & Society. Ethics, Sustainability, and Stakeholder
Management (Mason, OH: South-Western
Cengage); and Parmar, B. L., R. E. Freeman,
J. S. Harrison, A. C. Wicks, L. Purnell, and
S. De Colle (2010), “Stakeholder theory: The
state of the art,” Academy of Management Annals 4: 403–445.
17. Talib, N. N. (2007), The Black Swan: The Impact of the Highly Improbable (New York:
Random House).
18. See the discussion by: Lowenstein, R.
(2010), The End of Wall Street (New York:
Penguin Press); Paulson, H. M. (2010), On the Brink: Inside the Race to Stop the Collapse of the Global Financial System (New York: Busi-
ness Plus); and Wessel, D. (2010), In FED We Trust: Ben Bernanke’s War on the Great Panic
(New York: Crown Business).
19. Parmar, B. L., R. E. Freeman, J. S.
Harrison, A. C. Wicks, L. Purnell, and S. De
Colle (2010), “Stakeholder theory: The state
of the art,” Academy of Management Annals
4: 403–445.
20. Freeman, E. R. (1984), Strategic Man-agement: A Stakeholder Approach (Boston,
MA: Pitman); Freeman, E. R., and J. McVea
(2001), “A stakeholder approach to strategic
management,” in Hitt, M. A., E. R. Freeman,
and J. S. Harrison (eds.), The Handbook of Strategic Management (Oxford, UK: Black-
well), pp. 189–207; and Phillips, R. (2003),
Stakeholder Theory and Organizational Ethics
(San Francisco: Berrett-Koehler).
21. To acknowledge the increasing impor-
tance of stakeholder strategy, the Strategic
Management Society (SMS)—the leading
association for academics, business execu-
tives, and consultants interested in strategic
management—has recently created a stake-holder strategy division; see http://
strategicmanagement.net/. Also see: Ander-
son, R. C. (2009), Confessions of a Radical Industrialist: Profits, People, Purpose—Doing Business by Respecting the Earth (New York:
St. Martin’s Press); Sisodia, R. S., D. B. Wolfe,
and J. N. Sheth (2007), Firms of Endearment: How World-Class Companies Profit from Passion and Purpose (Upper Saddle River,
NJ: Prentice-Hall Pearson); and Svendsen, A.
(1998), The Stakeholder Strategy: Profiting from Collaborative Business Relationships
(San Francisco: Berrett-Koehler).
22. Parmar, B. L., R. E. Freeman, J. S.
Harrison, A. C. Wicks, L. Purnell, and S. De
Colle (2010), “Stakeholder theory,” p. 406.
23. Ibid.
24. Ibid.
25. Fortune 2011 The World’s Most Admired Companies, http://money.cnn.com/magazines/
fortune/mostadmired/2011/full_list/.
26. Mitchell, R. K., B. R. Agle, and D. J.
Wood (1997), “Toward a theory of stakeholder
identification and salience,” Academy of Man-agement Review 22: 853–886; and Eesley, C.,
and M. J. Lenox (2006), “Firm responses to
secondary stakeholder action,” Strategic Man-agement Journal 27: 765–781.
27. “The media choke on a Twinkie,” The Wall Street Journal, November 27, 2012.
28. TIAA-CREF is an acronym for Teachers
Insurance and Annuity Association–College
Retirement Equities Fund.
29. CalPERS is an acronym for California
Public Employees’ Retirement System.
30. People for the Ethical Treatment of
Animals (PETA) is an animal-rights
organization.
31. This example is drawn from: Esty, D. C.,
and A. S. Winston (2006), Green to Gold: How Smart Companies Use Environmental Strategy to Innovate, Create Value, and Build Competitive Advantage (Hoboken, NJ: Wiley).
32. This discussion draws on: Carroll, A. B.,
and A. K. Buchholtz (2012), Business & Soci-ety. Ethics, Sustainability, and Stakeholder Management (Mason, OH: South-Western
Cengage); Carroll, A. B. (1991), “The pyra-
mid of corporate social responsibility: Toward
the moral management of organizational
stakeholders,” Business Horizons, July–
August: 39–48; and Carroll, A. B. (1979),
“A three-dimensional, conceptual model of
corporate social performance,” Academy of Management Review 4: 497–505.
33. For an insightful but critical treatment of
this topic, see the 2003 Canadian documentary
film The Corporation.
34. www.ge.com.
35. Gates, B. (2008), “How to help those left
behind,” Time, August 11.
36. Carroll, A. B. (1991), “The pyramid of
corporate social responsibility,” pp. 39–48.
37. “BP, plaintiffs reach settlement in Gulf
oil spill,” The Wall Street Journal, March 4,
2012; “BP and the Deepwater Horizon disas-
ter,” The Economist, November 15, 2012;
“BP slapped with record fine,” The Wall Street Journal, November 15, 2012; “U.S. govern-
ment slams BP’s ‘lack of business integrity,’”
The Wall Street Journal, November 28, 2012.
38. “Apple wins big in patent case,” The Wall Street Journal, August 24, 2012; “Apple
shake-up signals Tim Cook era,” The Wall Street Journal, October 30, 2012; “Apple,
HTC settle patent dispute, sign licensing
pact,” The Wall Street Journal, November 11,
2012; “Eddy Cue: Apple’s rising Mr. Fix-It,”
The Wall Street Journal, November 28, 2012.
39. Compiled from Value Line data by
A. Damodaran, NYU, http://people.stern.nyu.
edu/adamodar/New_Home_Page/datafile/
histgr.html.
WWW.YAZDANPRESS.COMWWW.YAZDANPRESS.COM

WWW.YAZDANPRESS.COMWWW.YAZDANPRESS.COM

28
Strategic Leadership: Managing the Strategy Process
Chapter 2
Chapter Outline
2.1 Vision, Mission, and Values Vision and Mission Living the Values
2.2 Strategic Leadership What Do Strategic Leaders Do? How Do You Become an Effective and Ethical Strategic Leader? Formulating Strategy Across Levels
2.3 The Strategic Management Process Top-Down Strategic Planning Scenario Planning Strategy as Planned Emergence
2.4 Implications for the Strategist
Learning Objectives
After studying this chapter, you should be able to:
LO 2-1 Describe the roles of vision, mission, and values in the strategic management process.
LO 2-2 Evaluate the strategic implications of product-oriented and customer-oriented vision statements.
LO 2-3 Explain why anchoring a firm in ethical values is essential for long-term success.
LO 2-4 Outline how managers become strategic leaders.
LO 2-5 Describe the roles of corporate, business, and functional managers in strategy formulation and implementation.
LO 2-6 Evaluate top-down strategic planning, scenario planning, and strategy as planned emergence.
WWW.YAZDANPRESS.COMWWW.YAZDANPRESS.COM

29
A
PepsiCo’s Indra Nooyi:
“Performance with a
Purpose”
A S CHIEF EXECUTIVE Officer (CEO) of PepsiCo, Indra Nooyi is one of the world’s most powerful busi-ness leaders. A native of Chennai, India, Ms. Nooyi holds multiple degrees: a bachelor’s degree in phys-ics, chemistry, and mathematics from Madras Chris-tian College, an MBA from the Indian Institute of Management, and a master’s degree from Yale Uni-versity. Prior to joining PepsiCo in 1994, Ms. Nooyi worked for Johnson & Johnson, Boston Consulting Group, Motorola, and ABB. Ms. Nooyi is not your typical Fortune 500 CEO, though: She is well known for walking around the office barefoot and singing—a remnant from her lead role in an all-girls rock band in high school.
It should come as no surprise, therefore, that Ms. Nooyi has been shaking things up at PepsiCo, a company with roughly $70 billion in annual revenues and some 300,000 employees worldwide. She took the lead role in spinning off Taco Bell, Pizza Hut, and KFC in 1997. Later, she masterminded the acquisi-tions of Tropicana in 1998 and Quaker Oats (includ-ing Gatorade) in 2001. As CEO, Ms. Nooyi declared PepsiCo’s vision to be “Performance with a Purpose,” as defined by three dimensions:
1. Human sustainability. PepsiCo’s strategic intent is to make its product portfolio healthier to com-bat obesity. It wants to reduce the salt and fat in its “fun foods” such as Frito-Lay and Doritos, and to include healthy choices such as Quaker Oats products and Tropicana fruit juices in its lineup. Ms. Nooyi is convinced that if food and beverage companies do not make their products healthier, they will face stricter regulation and lawsuits, as tobacco companies did. Ms. Nooyi’s goal is to increase PepsiCo’s revenues for nutritious foods from $10 billion today to $30 billion by 2020.
2. Environmental sustainability. PepsiCo has insti-tuted various initiatives to ensure that its operations
don’t harm the natural environment. The com-pany has programs in place to reduce water and energy use, increase recycling, and promote sustainable agriculture. The goal is to transform PepsiCo into a company with a net-zero impact on the environment. Ms. Nooyi believes that young people today will not patronize a company that does not have a strategy that also addresses ecological sustainability.
3. The whole person at work. PepsiCo wants to cre-ate a corporate culture in which employees do not “just make a living, but also have a life.” Ms. Nooyi argues that this type of culture allows employees to unleash both their mental and emotional energies.
PepsiCo’s vision of performance with a purpose acknowledges the importance of corporate social responsibility and stakeholder strategy. Ms. Nooyi is convinced that companies have a duty to society to “do better by doing better.” She subscribes to a triple-bottom-line approach to competitive advan-tage, which considers not only economic but also social and environmental performance. Ms. Nooyi declares that the true profits of an enterprise are not just “revenues minus costs” but “revenues minus costs minus costs to society.” Problems such as pol-lution or the increased cost of health care to combat obesity impose costs on society (externalities) that companies typically do not bear. As Indra Nooyi sees it, the time when corporations can just pass on their externalities to society is nearing an end. 1
After reading this chapter, you will find more about this
case, along with related questions, on page 48.
CHAPTER CASE 2
WWW.YAZDANPRESS.COMWWW.YAZDANPRESS.COM

30 CHAPTER 2 Strategic Leadership: Managing the Strategy Process
HOW DO STRATEGIC LEADERS like Indra Nooyi develop and implement a vision
for their company to achieve strategic goals? How do they use vision, mission, and
values to guide and motivate employees? In Chapter 2, we move from thinking about why
strategy is important to considering how firms and other organizations define their vision,
mission, and values, and how strategic leaders manage the strategy process.
An effective strategy process can lay the foundation on which to build a sustain-
able competitive advantage. The first step in the strategy process is to define an orga-
nization’s vision, mission, and values. With those guiding principles in place, we then
consider how strategic leaders formulate strategy across different levels: corporate,
business, and functional. Next, we introduce three complementary frameworks of the
strategy-creation process: strategic planning, scenario planning, and strategy as planned
emergence. Finally, we conclude with practical Implications for the Strategist.
2.1 Vision, Mission, and Values
The first steps in the strategic management process are to define a firm’s vision, mission,
and values. An effective strategic management process is the method put in place by
strategic leaders to conceive and implement a strategy. It can lay the foundation for a sus-
tainable competitive advantage. Strategic leadership pertains to executives’ use of power
and influence to direct the activities of others when pursuing an organization’s goals. 2 As
described in ChapterCase 2, Indra Nooyi is demonstrating strategic leadership when defin-
ing goals and putting systems, structures, and incentives in place to achieve the vision of
“performance with a purpose.”
To begin the strategic management process, strategic leaders ask the following questions:
■ What do we want to accomplish ultimately? What is our vision?
■ How do we accomplish our goals? What is our mission?
■ What guardrails do we put in place to act ethically and legally as we pursue our vision
and mission? What are our values?
VISION AND MISSION
To answer questions about vision, mission, and values, strategic leaders need to begin with
the end in mind. Think of building a house. The future owner must communicate her vision
to the architect, who draws up a blueprint of the home. The process is iterated a couple of
times until all the homeowner’s ideas have been translated into the blueprint. Only then
does the building of the house begin. The same holds for strategic success. Indra Nooyi has
a clear picture in mind of what PepsiCo will look like in the future:
Performance with a purpose means delivering sustainable growth by investing in a health-ier future for people and our planet. . . . We will continue to build a portfolio of enjoyable and healthier foods and beverages, find innovative ways to reduce the use of energy, water and packaging, and provide a great workplace for our associates. . . . Because a healthier future for all people and our planet means a more successful future for PepsiCo. This is our promise. 3
Such a statement about what an organization ultimately wants to accomplish is its
vision . It captures the company’s aspiration. An effective vision pervades the organiza-
tion with a sense of winning and motivates employees at all levels to aim for the same
target, while leaving room for individual and team contributions. Employees in vision-
ary companies tend to feel like part of something bigger than themselves. An inspiring
vision helps employees find meaning in their work, beyond monetary rewards. It allows
LO 2-1
Describe the roles of vision, mission, and values in the strategic management process.
WWW.YAZDANPRESS.COMWWW.YAZDANPRESS.COM

CHAPTER 2 Strategic Leadership: Managing the Strategy Process 31
employees to experience a greater sense of purpose and taps into
people’s intrinsic motivations to make the world a better place
through their work activities. 4 This greater individual purpose
can in turn lead to higher organizational performance. 5 Basing
actions on its vision, a firm will build the necessary resources and
capabilities through continuous organizational learning, includ-
ing learning from failure, to translate into reality what begins as
a stretch goal. 6
To provide meaning for employees in pursuit of the organi-
zation’s ultimate goals, vision statements should be forward-
looking and inspiring. Consider, for example, the vision of the
organization Teach For America (TFA): One day, all children in this nation will have the opportunity to attain an excellent education. That vision effectively and clearly commu-
nicates what TFA ultimately wants to accomplish, while providing an inspiring target to
aim for. It’s not surprising that vision statements can be inspiring and motivating in the
nonprofit sector. Many people would find meaning in wanting to help children attain an
excellent education (TFA) or wanting to be always there, touching the lives of people in
need (American Red Cross). But what about for-profit firms?
The main difference in the visions of for-profit firms is the metric by which the orga-
nization assesses successful performance. TFA measures its organizational success by the
impact its teachers have on student performance. In the for-profit sector, many companies
measure success primarily by financial performance. Other visionary companies, includ-
ing 3M, General Electric, Merck, Nordstrom, Procter & Gamble (P&G), and Walmart,
provide more aspirational ideas that are not exclusively financial. 7 Visionary companies
often are able not only to gain a competitive advantage, but also to outperform their com-
petitors over the long run. Tracking the stock market performance of companies over many
decades, strategy scholars found that these visionary companies outperformed their peers
by a wide margin. This goes to show that a truly meaningful and inspiring vision makes
employees feel they are part of something bigger. In turn, this is highly motivating and can
improve financial performance.
Building on the vision, organizations establish a mission, which describes what an
organization actually does—that is, the products and services it plans to provide, and the
markets in which it will compete. Although the terms vision and mission are often used
interchangeably, they are different: Vision defines what an organization wants to accom-
plish ultimately, and thus the goal can be described by the verb “ to. ” For instance, TFA’s
vision is to attain an excellent education for all children. In contrast, mission describes
what an organization does; it defines the means “ by ” which vision is accomplished.
Accordingly, TFA’s mission is achieved by enlisting our nation’s most promising future leaders in the effort (we will be able to attain an excellent education for all children). Exhibit 2.1 presents TFA’s vision, mission, and values. (See MiniCase 4 for a detailed
discussion on how Teach For America inspires future leaders.)
strategic management
process Method put in place by strategic leaders to conceive and implement a strategy, which can lay the foundation for a sustainable competitive advantage.
strategic leadership
Executives’ use of power and influence to direct the activities of others when pursuing an organization’s goals.
vision A statement about what an organization ultimately wants to accomplish; it captures the company’s aspiration.
mission Description of what an organization actually does—the products and services it plans to provide, and the markets in which it will compete.
WWW.YAZDANPRESS.COMWWW.YAZDANPRESS.COM

32 CHAPTER 2 Strategic Leadership: Managing the Strategy Process
To be effective, firms need to back up their visions and missions with strategic commitments, actions that are costly, long-term–oriented, and difficult to reverse. 8 For
instance, the vision of EADS, the parent company of Airbus, is to be the world’s leading aerospace company. Airbus translates this ultimate goal into its mission by manufacturing the world’s best aircraft, with passengers at heart and airlines in mind. Airbus spent 10 years and
$15 billion to develop the A380 super jumbo, which can accommodate over 850 passengers
and fly almost 10,000 miles (a sufficient range to fly non-stop from New York to Singapore).
The company’s vision is backed up by a powerful strategic commitment. Without such commit-
ments, a firm’s vision and mission statements are just words. However noble the mission state-
ment, companies will not achieve competitive advantage without strategic actions to back it up.
So, we must ask, do vision statements help firms gain and sustain competitive advan-
tage? The effectiveness of vision statements differs based on whether they are customer-oriented or product-oriented. Customer-oriented vision statements allow companies to adapt
to changing environments, while product-oriented vision statements often do not. Given
that our environments are ever-changing, increased strategic flexibility is often a necessary
condition to achieve competitive advantage. 9 Let’s look at both types of vision statements.
PRODUCT-ORIENTED VISION STATEMENTS. A product-oriented vision defines
a business in terms of a good or service provided. Product-oriented visions tend to force
managers to take a more myopic view of the competitive landscape. As an example, let’s
consider the strategic decisions of U.S. railroad companies. Railroads are in the business
of moving goods and people from point A to point B by rail. When they started, their
short-distance competition was the horse or horse-drawn carriage. There was little long-
distance competition (e.g., ship canals and good roads) to cover the U.S. from coast to
strategic
commitments
Actions that are costly, long-term–oriented, and difficult to reverse.
LO 2-2
Evaluate the strategic implications of product-oriented and customer-oriented vision statements.
EXHIBIT 2.1 / Teach For America: Vision, Mission, and Values
VISION One day, all children in this nation will have the opportunity to attain an excellent education.
MISSION Teach For America is growing the movement of leaders who work to ensure that kids growing up in poverty get an excellent education.
CORE VALUES Transformational Change: We seek to expand educational opportunity in ways that are life-changing for children and transforming for our country. Given our deep belief in children and communities, the magnitude of educational inequity and its consequences, and our optimism about the solvability of the problem, we act with high standards, urgency, and a long-term view.
Leadership: We strive to develop and become the leaders necessary to realize educational excellence and equity. We establish bold visions and invest others in working towards them. We work in purposeful, strategic, and resourceful ways, define broadly what is within our control to solve, and learn and improve constantly. We operate with a sense of possibility, persevere in the face of challenges, ensure alignment between our actions and beliefs, and assume personal responsibility for results.
Team: We value and care about each other, operate with a generosity of spirit, and have fun in the process of working together. To maximize our collective impact, we inspire, challenge, and support each other to be our best and sustain our effort.
Diversity: We act on our belief that the movement to ensure educational equity will succeed only if it is diverse in every respect. In particular, we value the perspective and credibility that individuals who share the racial and economic backgrounds of the students with whom we work can bring to our organization, classrooms, and the long-term effort for change.
Respect & Humility: We value the strengths, experiences, and perspectives of others, and we recognize our own limitations. We are committed to partnering effectively with families, schools, and communities to ensure that our work advances the broader good for all children.
SOURCE: www.teachforamerica.org .
WWW.YAZDANPRESS.COMWWW.YAZDANPRESS.COM

CHAPTER 2 Strategic Leadership: Managing the Strategy Process 33
coast. Due to their monopoly, especially in long-distance travel, these companies were
initially extremely profitable. Not surprisingly, the early U.S. railroad companies saw their
vision as being in the railroad business, clearly a product-based definition.
However, the railroad companies’ monopoly did not last, as technological innovations
changed the transportation business dramatically. After the introduction of the automobile and
the commercial jet, consumers had a wider range of choices to meet their long-distance trans-
portation needs. Rail companies were slow to respond; they did not redefine their business in
terms of services provided to the consumer. Had they envisioned themselves as serving the
full range of transportation needs of people across America (a customer-oriented vision), they
might have become successful forerunners of modern logistics companies like FedEx or UPS.
Recently, the railroad companies seem to be learning some lessons: CSX Railroad is
now redefining itself as a green-transportation alternative. It claims it can move one ton of
freight 423 miles on one gallon of fuel. However, its vision remains product-oriented: to be the safest, most progressive North American railroad.
CUSTOMER-ORIENTED VISION STATEMENTS. A customer-oriented vision defines
a business in terms of providing solutions to customer needs. For example, “We are in the
business of providing solutions to professional communication needs.” Companies that
have customer-oriented visions tend to be more flexible when adapting to changing envi-
ronments. In contrast, companies that define themselves based on product-oriented state-
ments (e.g., “We are in the typewriter business”) tend to be less flexible and thus more
likely to fail. The lack of an inspiring need-based vision can cause the long-range problem
of failing to adapt to a changing environment.
It is important not to confuse customer-oriented vision statements with listening to your
customer. They are not the same thing. Customer-oriented visions identify a critical need
but leave open the means of how to meet that need. It is critical not to define how a cus-
tomer need will be met. The future is unknowable, and innovation may provide new ways
to meet needs that we cannot fathom today. Even if customer needs are unchanging, the
means of meeting those needs can certainly change over time. An organization’s vision
should be flexible, to allow for change and adaptation.
Think about the customer need for personal mobility. A little over 100 years ago, this
need was met by horse-drawn buggies, horseback riding, or by trains for long distances.
But Henry Ford had a different idea. In fact, he is famous for saying, “If I had listened to
my customers, I would have built a better horse and buggy.” 10 Instead, Henry Ford’s origi-
nal vision was to make the automobile accessible to every American. He succeeded, and
the automobile dramatically changed how mobility was achieved.
Fast-forward to today: Ford Motor Company’s vision is to provide personal mobility for people around the world. Note that it does not even mention the automobile. By focusing
on the consumer need for personal mobility, Ford is leaving the door open for exactly how
it will fulfill that need. Today, it’s mostly with traditional cars and trucks propelled by gas-
powered internal combustion engines, with some hybrid electric vehicles in its lineup. In
the near future, Ford is likely to provide vehicles powered by alternative energy sources
such as electric power or hydrogen. In the far-reaching future, perhaps Ford will get into
the business of individual flying devices. Throughout all of this, its vision would still
be relevant and compel its managers to engage in future markets. In contrast, a product-
oriented vision would have greatly constrained Ford’s degree of strategic flexibility.
Sometimes, effective vision statements work through metaphors (implied comparisons).
Metaphors can help employees make appropriate decisions when faced with day-to-day situa-
tions that can sometimes be novel or stressful. Let’s look at Disney’s customer- oriented vision—
to make people happy. 11 Disney translates this vision through the metaphor that its theme parks
are like stage performances. Employees are not simply employees, but cast members of a
WWW.YAZDANPRESS.COMWWW.YAZDANPRESS.COM

34 CHAPTER 2 Strategic Leadership: Managing the Strategy Process
show. Similarly, visitors to the park are not customers, but audience members. Disney’s meta-
phor has implications for employee behavior. Rather than interviewing for a job, for instance,
candidates audition for a role. Any time a Disney park employee is in uniform, he or she is “on
stage,” delivering a performance. Even street sweepers (often college students on break) are
part of the cast. Because they have the closest contact with guests, street sweepers are trained
in great detail. They are evaluated not only on street-sweeping performance, but also on their
knowledge about rides, parades, and restaurant and restroom locations. Like cast members in a
theater company, Disney employees pull off daily performances with a “the show must go on”
attitude that allows them to fulfill Disney’s vision to make people happy. Exhibit 2.2 provides
additional examples of companies with customer-oriented vision statements.
MOVING FROM PRODUCT-ORIENTED TO CUSTOMER-ORIENTED VISION
STATEMENTS. In some cases, product-oriented vision statements do not interfere with
the firm’s success in achieving superior performance and competitive advantage. Consider
Intel Corporation, one of the world’s leading silicon innovators. Intel’s early vision was to be the preeminent building-block supplier of the PC industry. Intel designed the first commer-
cial microprocessor chip in 1971 and set the standard for microprocessors in 1978. During
the personal computer (PC) revolution in the 1980s, microprocessors became Intel’s main
line of business. Intel’s customers were original equipment manufacturers that produced
consumer end-products, such as computer manufacturers HP, IBM, Dell, and Compaq.
In the Internet age, though, the standalone PC as the end-product has become less
important. Customers want to stream video and share photos online. These activities con-
sume a tremendous amount of computing power. To reflect this shift, Intel in 1999 changed
its vision to focus on being the preeminent building-block supplier to the Internet economy. Although its product-oriented vision statements did not impede performance or competi-
tive advantage, in 2008 Intel fully made the shift to a customer-oriented vision: to delight our customers, employees, and shareholders by relentlessly delivering the platform and technology advancements that become essential to the way we work and live. Part of this
shift was reflected by the hugely successful “Intel Inside” advertising campaign in the
1990s that made Intel a household name worldwide.
Intel accomplished superior firm performance over decades through continuous adap-
tations to changing market realities. Its formal vision statement lagged behind the firm’s
strategic transformations. Intel regularly changed its vision statement after it had accom-
plished each successful transformation. 12 In such a case, vision statements and firm perfor-
mance are clearly not related to one another.
Taken together, empirical research shows that sometimes vision statements and firm
performance are associated with one another. A positive relationship between vision
Amazon: To be earth’s most customer centric company; to build a place where people can come to find and discover anything they might want to buy online.
eBay: To provide a global trading platform where practically anyone can trade practically anything.
GE: To turn imaginative ideas into leading products and services that help solve some of the world’s toughest problems.
Google: To organize the world’s information and make it universally accessible and useful.
IBM: To be the best service organization in the world.
Microsoft: To enable people and businesses throughout the world to realize their full potential.
Nike: To bring inspiration and innovation to every athlete in the world.
Walmart: To give ordinary folk the chance to buy the same thing as rich people.
EXHIBIT 2.2 /
Companies with Customer-Oriented Vision Statements
WWW.YAZDANPRESS.COMWWW.YAZDANPRESS.COM
CHAPTER 2 Strategic Leadership: Managing the Strategy Process 35
statements and firm performance is more likely to exist under certain circumstances: if the
visions are customer-oriented; if internal stakeholders are invested in defining and revising
the visions; and if organizational structures such as compensation systems are aligned with
the firm’s vision statement. 13 The upshot is that an effective vision statement can lay the
foundation upon which to craft a strategy that creates competitive advantage.
LIVING THE VALUES
Organizational values are the ethical standards and norms that govern the behavior of indi-
viduals within a firm or organization. Strong ethical values have two important functions. First,
they form a solid foundation on which a firm can build its vision and mission, and thus lay the
groundwork for long-term success. Second, values serve as the guardrails put in place to keep the
company on track when pursuing its vision and mission in its quest for competitive advantage.
The values espoused by a company provide answers to the question, how do we accom-plish our goals? They help individuals make choices that are both ethical and effective in
advancing the company’s goals. As discussed in Strategy Highlight 2.1 (next page), the
pharmaceutical company Merck provides an example of how values can drive strategic
decision making, and what can happen if a company deviates from its core values.
There’s one last point to make about organizational values. Without commitment and
involvement from top managers, any statement of values remains merely a public relations
exercise. Employees tend to follow values practiced by strategic leaders. They observe the
day-to-day decisions of top managers and quickly decide whether managers are merely paying
lip service to the company’s stated values. True values must be lived with integrity, especially
by the top management team. Unethical behavior by top managers is like a virus that spreads
quickly throughout an entire organization. It is imperative that strategic leaders set an example
of ethical behavior by living the values. Since strategic leaders have such a strong influence
in setting an organization’s vision, mission, and values, we next discuss strategic leadership.
2.2 Strategic Leadership
Executives whose vision and actions enable their organizations to achieve competitive
advantage demonstrate strategic leadership —the behaviors and styles of executives that
influence others to achieve the organization’s vision and mission. 14 Merck’s then-CEO
Raymond Gilmartin, for example, demonstrated strategic leadership in reconfirming the
company’s core value that patients come before profits by voluntarily withdrawing Vioxx
from the market. Strategic leadership typically resides in executives who have overall
profit-and-loss responsibility for an entire organization . These executives may be the CEO,
or other members of the top-management team.
Although the effect of strategic leaders varies across industries and time, they do matter
to firm performance. 15 Just think of great business founders and their impact on the orga-
nizations they built: Jack Ma at Alibaba, Jeff Bezos at Amazon, Robin Li at Baidu, Mark
Zuckerberg at Facebook, Sergei Brin and Larry Page at Google, Bill Gates at Microsoft,
Richard Branson at Virgin Group, and John Mackey at Whole Foods, among many others.
There are also strategic leaders who have shaped and revitalized existing businesses: Allan
Mulally at Ford, Chung Mong-Koo at Hyundai, Irene Rosenfelt at Kraft Foods, Sheryl
Sandberg at Facebook, Don Thompson at McDonald’s, Yun Jong-Yong at Samsung, How-
ard Schultz at Starbucks, Ratan Tata at the Tata Group, and Marissa Mayer at Yahoo. 16
At the other end of the spectrum, unfortunately, are CEOs whose decisions have led to a
massive destruction of shareholder value: Brian Dunn at Best Buy, Charles Prince at Citi-
group, Richard Wagoner at GM, Robert Nardelli at The Home Depot (and later Chrysler),
Ron Johnson at JCPenney, Richard Fuld at Lehman Brothers, Ed Zander at Motorola, and
Gerald Levin at Time Warner.
LO 2-3
Explain why anchoring a firm in ethical values is essential for long-term success.
organizational
values Ethical standards and norms that govern the behavior of individuals within a firm or organization.
LO 2-4
Outline how managers become strategic leaders.
strategic leadership
The behaviors and styles of executives that influence others to achieve the organization’s vision and mission.
WWW.YAZDANPRESS.COMWWW.YAZDANPRESS.COM

36 CHAPTER 2 Strategic Leadership: Managing the Strategy Process
Merck: Reconfirming Its Core Values
Merck’s vision is to preserve and improve human life. The words of founder George W. Merck still form the basis of the company’s values today: We try to never forget that medicine is for the people. It is not for profits. The profits follow, and if we have remembered that, they have never failed to appear. The better we have remembered it, the larger they have been. 17
Guided by these ethical principles, Merck’s strategic leaders decided to help end river blindness in Africa. For centuries, river blindness—a parasitic disease that leads to loss of eyesight—plagued remote communities in Africa and other parts of the world, with no cure. In 1987, Ray Vagelos, a former Merck scientist turned CEO, announced that the company would donate its recently discovered drug Mectizan, without charge, to treat river blindness. Merck’s executives formed a novel private-public partner-ship called the Mectizan Donation Program (MDP), set up to distribute the drug in remote areas, where health ser-vices are often not available.
By 2012, Merck had donated more than one billion treatments to about 120,000 communities, primarily in Africa but also in Latin America and the Middle East. As a result, no new cases of river blindness have been reported, and the disease has effectively been eradi-cated. Merck’s current CEO Kenneth Frazier summarizes the effect of the company’s value-driven actions as fol-lows: “We are humbled by the great work of the alliance of partners to protect future generations from a disease that carries devastating implications for people, families, healthcare systems and local economies.” 18
In the case of Vioxx, though, Merck’s values were brought into question. Vioxx was a painkiller developed to produce fewer gastrointestinal side-effects than traditional products like aspirin or Advil. The Food and Drug Admin-istration (FDA) approved the new drug in 1999 to treat rheumatoid arthritis and other acute pain conditions. Merck engaged in heavy direct-to-consumer advertising via TV ads and other media outlets. Moreover, it is common indus-try practice for pharma companies to induce doctors to heavily prescribe newly launched drugs by offering consult-ing contracts and other perks such as attending seminars at exotic resort destinations. Merck applied these industry practices when marketing Vioxx. Merck’s new drug was a blockbuster, generating revenues of $2.5 billion a year by 2002 and growing fast.
Allegations began to appear, however, that Vioxx caused heart attacks and strokes. Critics alleged that Merck had sup-pressed evidence about Vioxx’s dangerous side-effects from clinical trials before it was approved. Merck’s CEO at the time, Raymond Gilmartin, described the situation:
. . . a telephone call from our head of research started a chain of events that put to test the conviction in our core beliefs. He told me that our long-term safety study of Vioxx was showing an increased risk of cardiovascular events compared to placebo, and the trial was being discontin-ued. We agreed that whatever course of action we decided to take would be based on what we believed the science said about what was in the best interests of patients.
After analyzing the data further and consulting with outside experts, the Merck scientists recommended that we voluntarily withdraw the drug. They said that it might be possible to go to the FDA, add warnings to the label, and keep Vioxx on the market, but they believed that the most responsible course of action in the interests of the patient was to voluntarily withdraw the drug. I, along with the rest of my management team and the board, agreed with the recommendation, and the drug was withdrawn. 19
Reconfirming its core value that patients come before prof-its, Merck announced the voluntary withdrawal of Vioxx from the market. The September 30, 2004, recall had a dramatic impact on Merck’s stock price and adversely affected the sales of Merck’s other drugs. Shares fell 27 percent to $33, eradi-cating $27 billion in market value almost overnight. That loss in shareholder value was much greater than the estimated net present value of the profits that Merck would have obtained from continued sales of Vioxx. Merck has been burdened by lawsuits ever since, and legal liabilities have cost the company up to $30 billion thus far. Some corporate social responsibility experts argue that Merck should have never put Vioxx on the market in the first place, or that it should have at least pro-vided up-front, clear assessments of the risks associated with Vioxx, including increased risks of heart attack and strokes. 20
2.1
Merck CEO Kenneth Frazier
WWW.YAZDANPRESS.COMWWW.YAZDANPRESS.COM

CHAPTER 2 Strategic Leadership: Managing the Strategy Process 37
Why do some leaders create great companies or manage them to greatness, while others
destroy them? To answer that question, let’s first consider what strategic leaders actually do.
WHAT DO STRATEGIC LEADERS DO?
What do strategic leaders do, and what makes some strategic leaders more effective than
others? In a recent study of over 350 CEOs, strategy scholars found that they spend, on
average, 67 percent of their time in meetings, 13 percent working alone, 7 percent on
e-mail, 6 percent on phone calls, 5 percent on business meals, and 2 percent on public
events such as ribbon-cutting for a new factory (see Exhibit 2.3 ). 21 Other studies have
also found that most managers prefer oral communication: CEOs spend most of their time
“interacting— talking, cajoling, soothing, selling, listening, and nodding—with a wide
array of parties inside and outside the organization.” Surprisingly given the advances in
information technology, CEOs today spend most of their time in face-to-face meetings.
They consider face-to-face meetings most effective in getting their message across and
obtaining the information they need. Not only do meetings present data through presenta-
tions and verbal communications, but they enable CEOs to pick up on rich nonverbal cues
such as facial expressions, body language, and mood, that are not apparent to them if they
use e-mail or Skype, for example. 22
HOW DO YOU BECOME AN EFFECTIVE AND ETHICAL STRATEGIC LEADER?
How do you become an ethical and effective strategic leader? Is it innate? Can it be
learned? According to the upper-echelons theory, 23 organizational outcomes including
strategic choices and performance levels reflect the values of the top management team
(the individuals at the upper echelons, or levels, of an organization). The theory states that
executives interpret situations through the lens of their unique perspectives, shaped by
personal circumstances, values, and experiences. Their leadership actions reflect charac-
teristics of age, education, and career experiences, filtered through personal interpretations
of the situations they face. The upper-echelons theory favors the idea that strong leadership
is the result of both innate abilities and learning.
upper-echelons
theory A conceptual framework that views organizational outcomes—strategic choices and performance levels—as reflections of the values of the members of the top management team, who interpret situations through the lens of their unique perspectives.
EXHIBIT 2.3 /
How CEOs Spend Their Days SOURCE: Author’s depiction of data from O. Bandiera, A. Prat, and R. Sadun (2012), “Managerial capital at the top: Evidence from the time use of CEOs,” London School
of Economics and Harvard
Business School Working
Paper.
67%
13%
7%
6%
2% 5%
Face-to-Face Meetings
Working Alone
Calls
Public Events
Business Meals
WWW.YAZDANPRESS.COMWWW.YAZDANPRESS.COM

38 CHAPTER 2 Strategic Leadership: Managing the Strategy Process
In the bestseller Good to Great, Jim Collins identified great companies as those that
transitioned from average performance to sustained competitive advantage. He measured
that transition as “cumulative stock returns of 6.9 times the general market in the fifteen
years following their transition points.” 24 Examples of companies having made the transition
from good to great include health care company Abbott Laboratories, personal care products
company Kimberly-Clark, Gillette (now a subsidiary of Procter & Gamble), grocery chain
Kroger, steel maker Nucor, tobacco company Philip Morris, and drug retailing chain Wal-
greens. Collins found consistent patterns of leadership among the companies he studied, as
pictured in the Level-5 leadership pyramid in Exhibit 2.4 . 25 The pyramid is a conceptual
framework that shows leadership progression through five distinct, sequential levels. Collins
found that all the companies he identified as great were led by Level-5 executives.
According to the Level-5 leadership pyramid, effective strategic leaders go through a
natural progression of five different levels. Each level builds upon the previous one; the
manager can move on to the next level of leadership only when the current level has been
mastered. Characteristics of the five levels are:
■ The Level-1 manager is a highly capable individual who makes productive contribu-
tions through motivation, talent, knowledge, and skills.
■ The Level-2 manager masters the skills required at Level 1, but is also a contribut-
ing team member who works effectively with others to achieve synergies and team
objectives.
■ The Level-3 manager is a well-rounded and highly capable manager, who “does things
right.” He or she is an effective team player and organizes resources effectively to
achieve predetermined goals.
Level-5 leadership
pyramid A conceptual framework of leadership progression with five distinct, sequential levels.
EXHIBIT 2.4 / Strategic Leaders: The Level-5 Pyramid
Builds enduring greatness through a combination of willpowerand humility.
Presents compelling vision and mission to guide groups toward superior performance. Does the right things.
Is efficient and effective in organizing resources to accomplish stated goals and objectives. Does things right.
Uses high level of individual capability to work effectively with others in order to achieve team objectives.
Makes productive contributions through motivation, talent, knowledge, and skills.
Level 5:
Executive
Level 4:
Effective Leader
Level 3:
Competent Manager
Level 2:
Contributing Team Member
Level 1:
Highly Capable Individual
SOURCE: Adapted from J. Collins (2001), Good to Great: Why Some Companies Make the Leap . . . And Others Don’t (New York: HarperCollins), p. 20.
WWW.YAZDANPRESS.COMWWW.YAZDANPRESS.COM

CHAPTER 2 Strategic Leadership: Managing the Strategy Process 39
■ At Level 4, the effective Level-3 manager becomes a leader who determines what
the right decisions are. The Level-4 manager effectively communicates a compelling
vision and mission to guide the firm toward superior performance. He or she “does the
right things.”
■ Finally, the Level-5 manager reaches a leadership pinnacle, turning into a strategic
leader. An effective strategic leader is an executive that builds enduring greatness into
the organizations he or she leads. Indeed, Collins goes so far as to argue that the great-
ness of a strategic leader can truly be judged only if the organizations are able to sus-
tain a competitive advantage in the years after the successful executive has departed
from the organization.
FORMULATING STRATEGY ACROSS LEVELS: CORPORATE, BUSINESS, AND FUNCTIONAL MANAGERS
According to the upper-echelons theory, it is the top management team that primarily
determines whether a firm is able to gain and sustain a competitive advantage through the
strategies they pursue. Given their importance, we need to gain a deeper understanding of
how strategies are formed.
Strategy formulation concerns the choice of strategy in terms of where and how to com-pete. It is helpful to break down strategy formulation into three distinct areas—corporate,
business, and functional:
■ Corporate strategy concerns questions relating to where to compete (industry, markets,
and geography).
■ Business strategy concerns the question of how to compete (cost leadership, differen-
tiation, or integration).
■ Functional strategy concerns the question of how to implement business strategy.
Exhibit 2.5 shows the three areas of strategy formulation.
Although we generally speak of the firm in an abstract form, it is individuals who make
strategic decisions—whether at the corporate, business, or functional level. Corporate
LO 2-5
Describe the roles of corporate, business, and functional managers in strategy formulation and implementation.
EXHIBIT 2.5 / Strategy Formulation and Implementation Across Levels: Corporate, Business, and Functional Strategy
SBU 1
Business Strategy
How to compete?
SBU 2
Business Strategy
How to compete?
SBU 3
Business Strategy
How to compete?
Headquarters
Corporate Strategy
Where to compete?
Business Function 1
Functional Strategy
How to implementbusiness strategy?
Business Function 2
Functional Strategy
How to implementbusiness strategy?
Business Function 3
Functional Strategy
How to implementbusiness strategy?
Business Function 4
Functional Strategy
How to implementbusiness strategy?
D
D D D D
D D
WWW.YAZDANPRESS.COMWWW.YAZDANPRESS.COM
40 CHAPTER 2 Strategic Leadership: Managing the Strategy Process
executives at headquarters formulate corporate strategy. Examples of corporate executives
are Mukesh Ambani (Reliance Industries), Maria das Graças Silva Foster (Petrobras-Petróleo
Brasil), Jeffrey Immelt (GE), Virginia Rometty (IBM), and Ursula Burns (Xerox). Corpo-
rate executives need to decide in which industries, markets, and geographies their companies
should compete. They need to formulate a strategy that can create synergies across busi-
ness units that may be quite different, and determine the boundaries of the firm by deciding
whether to enter certain industries and markets and whether to sell certain divisions. They are
responsible for setting overarching strategic objectives and allocating scarce resources among
different business divisions, monitoring performance, and making adjustments to the over-
all portfolio of businesses as needed. The objective of corporate-level strategy is to increase
overall corporate value so that it is higher than the sum of the individual business units.
Business strategy occurs within strategic business units, or SBUs, the standalone divi-
sions of a larger conglomerate, each with its own profit-and-loss responsibility. General
managers in SBUs must answer business strategy questions relating to how to compete
in order to achieve superior performance. Within the guidelines received from corporate
headquarters, they formulate an appropriate generic business strategy (cost leadership, dif-
ferentiation, or integration) in their quest for competitive advantage.
Within each strategic business unit are various business functions: accounting, finance,
human resources, product development, operations, manufacturing, marketing, and cus-
tomer service. Each functional manager is responsible for decisions and actions within
a single functional area. These decisions aid in the implementation of the business-level
strategy, made at the level above.
In ChapterCase 2, we saw how Indra Nooyi determined PepsiCo’s corporate strategy.
She wants to reposition PepsiCo toward a more sustainable future by focusing not only
on economic but also social and environmental contributions. As chief executive officer,
Ms. Nooyi is the corporate executive responsible for the performance of the entire organi-
zation. She makes a wide range of corporate strategy decisions:
■ What types of products PepsiCo offers
■ Where in the value chain (ranging from raw materials to retailing of the final product)
to participate
■ What industries (e.g., beverages and foods) to compete in
■ Where in the world to compete
For the time being, Ms. Nooyi has decided that PepsiCo creates more value when both
the beverage and snack foods division are together in one corporation, rather than split up
into two companies. In contrast, PepsiCo’s archrival, Coca-Cola, focuses on only the non-
alcoholic beverages line of business.
As a company, PepsiCo is organized on both a geographic and a product basis. Along the
geographic dimension, PepsiCo consists of a number of standalone business divisions in
the Americas, Europe, Africa, and the Middle East. 26 PepsiCo’s revenues are split roughly
50–50 between the U.S. and international sales. Along the product dimension, PepsiCo’s
Americas division is split into two product units, Americas beverages and Americas foods.
A general manager leads each geographic and product division. He or she has profit-and-
loss (P&L) responsibility for his or her region and product line. These SBU managers in
turn report to PepsiCo’s CEO.
To implement specific business strategies, PepsiCo’s regional and product leaders rely
on functional managers, who are responsible for a particular business function such as
bottling, supply chain management, marketing, retail, or customer service. The functional
managers receive strategic directives from their respective regional and product leaders,
and implement these directives within the business activities they are responsible for.
strategic business
unit (SBU)
A standalone division of a larger conglomerate, with its own profit-and-loss responsibility.
WWW.YAZDANPRESS.COMWWW.YAZDANPRESS.COM

CHAPTER 2 Strategic Leadership: Managing the Strategy Process 41
2.3 The Strategic Management Process
We have gained some insight into the corporate, business, and functional levels into which
strategy is broken down. Next, we turn to the process or method by which strategic leaders
formulate and implement strategy. When strategizing for competitive advantage, manag-
ers rely on three different approaches: (1) strategic planning, (2) scenario planning, and
(3) strategy as planned emergence. This order also indicates how these approaches were
developed over time. Strategic planning was the first framework, before scenario planning
was introduced, and strategy as planned emergence is the most recent addition. As you’ll
see, the first two are relatively formal, “rational” top-down planning approaches. Although
the third approach also begins with a strategic plan, it is a less formal and less stylized
approach to the development of strategy.
TOP-DOWN STRATEGIC PLANNING
The prosperous decades after World War II resulted in the tremendous growth of corpora-
tions. As company executives needed a way to manage ever more complex firms more
effectively, they began to use strategic planning. Top-down strategic planning is a ratio-
nal, top-down process through which executives attempt to program future success. 27 In
this approach, all strategic intelligence and decision-making responsibilities are concen-
trated in the office of the CEO. The CEO, much like a military general, leads the company
strategically through competitive battles.
Exhibit 2.6 shows the three steps of analysis, formulation, and implementation in a tra-
ditional top-down strategic planning process. Strategic planners provide careful analyses
of internal and external data and apply it to all quantifiable areas: prices, costs, margins,
market demand, head count, and production runs. Five-year plans, revisited regularly, pre-
dict future sales based on anticipated future growth. Top executives tie the allocation of the
annual corporate budget to the strategic plan and monitor ongoing performance accord-
ingly. Based on a careful analysis of these data, top managers reconfirm or adjust the
company’s vision, mission, and values before formulating corporate, business, and func-
tional strategies. Appropriate organizational structures and controls as well as governance
mechanisms aid in effective implementation.
In this process, the formulation of strategy is
separate from implementation, and thinking
about strategy is separate from doing it . Infor-
mation flows one way only: top-down.
At times, strategic leaders impose their
visions onto a company’s strategy, structure,
and culture from the top down in order to cre-
ate and enact a desired future state. Under its
co-founder and longtime CEO, Steve Jobs,
Apple was one of the few successful tech com-
panies using a top-down strategic planning
process. 28 Jobs felt that he knew best what the
next big thing should be. Under his top-down,
autocratic leadership, Apple did not engage in
market research, because Jobs firmly believed
that “people don’t know what they want until
you show it to them.” 29 Since Jobs’ death,
Apple’s strategy process has become more
LO 2-6
Evaluate top-down strategic planning, scenario planning, and strategy as planned emergence.
Top-down strategic
planning A rational, top-down process through which management can program future success; typically concentrates strategic intelligence and decision-making responsibilities in the office of the CEO.
EXHIBIT 2.6 / Top-Down Strategic Planning in the AFI Framework
• Structure, Culture, & Control
• Corporate Governance & Business Ethics
• Corporate Strategy
• Business Strategy
• Functional Strategy
Analysis
Formulation
Implementation
• Vision, Mission, and Values
• External Analysis
• Internal Analysis
D
D
WWW.YAZDANPRESS.COMWWW.YAZDANPRESS.COM

42 CHAPTER 2 Strategic Leadership: Managing the Strategy Process
flexible under its new CEO Tim Cook, and the company is now trying to incorporate the
possibilities of different future scenarios and bottom-up strategic initiatives. 30
Top-down strategic planning rests on the assumption that we can predict the future from
the past. The approach works reasonably well when the environment does not change much.
One major shortcoming of the strategic planning approach is that we simply cannot know
the future. Strategic leaders’ visions of the future can be downright wrong; unforeseen events
can make even the most scientifically developed and formalized plans obsolete. Thus, many
companies are now using a more flexible approach in their strategic management process.
SCENARIO PLANNING
Given that the only constant is change, should managers even try to strategically plan for
the future? The answer is yes—but they also need to expect that unpredictable events will
happen. We can compare strategic planning in a fast-changing environment to a fire depart-
ment operation. 31 There is no way to know where and when the next emergency will arise,
nor can we know its magnitude beforehand. Nonetheless, fire chiefs put contingency plans
in place to address a wide range of emergencies along different dimensions.
In the same way, scenario planning asks those “what if” questions. Similar to top-
down strategic planning, scenario planning also uses a rational, scientific approach to the
strategy process. In addition, in scenario planning managers envision different scenarios,
to anticipate plausible futures. For example, new laws might restrict carbon emissions
or expand employee health care. Demographic shifts may alter the ethnic diversity of a
nation; changing tastes or economic conditions will affect consumer behavior. How would
any of these changes affect a firm, and how should it respond? Scenario planning takes
place at both the corporate and business levels of strategy.
Typical scenario planning addresses both optimistic and pessimistic futures. For
instance, strategy executives at UPS recently identified six issues as critical to shaping
its future competitive scenarios: (1) the price of oil; (2) climate change; (3) trade barriers
(such as “buy American” or “buy Chinese” clauses in new laws around the world); (4) the
emerging BRIC (Brazil, Russia, India, and China) economies; (5) political instability; and
(6) online commerce worldwide. 32 Managers then formulated strategies they could activate
and implement should the envisioned optimistic or pessimistic scenarios begin to appear.
Exhibit 2.7 shows the use of scenario planning with the AFI strategy framework. The goal
is to create strategic plans that are more flexible, and thus more effective, than those created
through the more static strategic planning approach. In the analysis stage, managers brain-
storm to identify possible future scenarios. Input from several different hierarchies within the
organization and from different functional areas such as R&D, manufacturing, and marketing
and sales is critical. UPS executives considered how they would compete if the price of a
barrel of oil was $45, or $125, or even $200. Managers may also attach probabilities (highly
likely versus unlikely, or 85 percent likely versus 2 percent likely) to different future states.
Although managers often tend to overlook pessimistic future scenarios, it is imperative
to consider negative scenarios more carefully. An exporter such as Boeing, Harley-Davidson,
or John Deere would want to analyze the impact of shifts in exchange rates on sales and
production costs: What if the euro depreciated to $1 per euro, or the Chinese yuan depre-
ciated rather than appreciated? How would Disney and other theme park operators com-
pete if the dollar were to appreciate so much as to make visits by foreign tourists to its
California and Florida theme parks prohibitively expensive? Other problems to consider
could include how to maintain liquidity when credit and equity markets are tight. Manag-
ers might also consider how black swan events (discussed in Chapter 1) might affect their
strategic planning. The BP oil spill was such a black swan for many businesses on the Gulf
Coast, including the tourism, fishing, and energy industries.
scenario planning
Strategy-planning activity in which managers envision different what-if scenarios to anticipate plausible futures.
WWW.YAZDANPRESS.COMWWW.YAZDANPRESS.COM

CHAPTER 2 Strategic Leadership: Managing the Strategy Process 43
In the formulation stage in scenario planning , management teams develop different
strategic plans to address possible future scenarios. This kind of what-if exercise forces
managers to consider contingency plans before events occur. Each plan relies on an entire
set of analytical tools (which will be introduced in upcoming chapters). They capture the
firm’s internal and external environments and answer several key questions:
■ What resources and capabilities do we need to compete successfully in with each
future scenario?
■ What strategic initiatives should we put in place to respond to each respective scenario?
■ How can we shape our expected future environment?
By formulating responses to the varying scenarios, managers build a portfolio of future
options. Managers continue to integrate additional information over time, which in turn
influences future decisions. Finally, they transform the most viable options into full-
fledged, detailed strategic plans that can be activated and executed as needed. The sce-
narios and planned responses promote strategic flexibility for the organization.
In the implementation stage, managers execute the dominant strategic plan, the option
that top managers decide most closely matches the current reality. If the situation changes,
managers can quickly retrieve and implement any of the alternate plans developed in the
formulation stage. The firm’s subsequent performance in the marketplace gives managers
real-time feedback about the effectiveness of the dominant strategic plan. If performance
feedback is positive, managers continue to pursue the dominant strategic plan, fine-tuning
it in the process. If performance feedback is negative, or if reality changes, managers con-
sider whether to modify further the dominant strategic plan in order to enhance firm per-
formance, or to activate an alternative strategic plan.
dominant strategic
plan The strategic option that top managers decide most closely matches the current reality and which is then executed.
EXHIBIT 2.7 /
Scenario Planning Within the AFI Strategy Framework
Fe
ed
back Loop
Monitoring Performan
ce
Analysis
Formulation
Implementation
Develop Strategic
Plans to Address
Future Scenarios
Execute Dominant
Strategic Plan
Disca
rd D
omin
ant
Plan if
Nece
ssary
Create StrategicOptions
Through Developing
Alternative Plan(s)
Identify Multiple
Future Scenarios
Activate and Execute
Ne
w Plan if Necessary
WWW.YAZDANPRESS.COMWWW.YAZDANPRESS.COM

44 CHAPTER 2 Strategic Leadership: Managing the Strategy Process
The circular nature of the scenario-planning model in Exhibit 2.7 highlights the con-
tinuous interaction among analysis, formulation, and implementation. Through this inter-
active process, managers can adjust and modify their actions as new realities emerge. The
interdependence among analysis, formulation, and implementation also enhances organi-
zational learning and flexibility.
STRATEGY AS PLANNED EMERGENCE: TOP-DOWN AND BOTTOM-UP
Critics of top-down and scenario planning argue that strategic planning is not the same
as strategic thinking. 33 In fact, they argue the strategic planning processes are often too
regimented and confining. As such, they do not allow for the necessary strategic thinking.
Managers doing strategic planning may also fall prey to an illusion of control —that is, the
hard numbers in a strategic plan can convey a false sense of security. According to critics
of strategic planning, in order to be successful, a strategy should be based on an inspiring
vision and not on hard data alone. They advise that managers should focus on all types of
information sources, including soft sources that can generate new insights, such as per-
sonal experience or the experience of front-line employees. The important work, according
to this viewpoint, is to synthesize all available input from different internal and external
sources into an overall strategic vision. This vision in turn should then guide the firm’s
strategy (as discussed earlier in this chapter).
These critics, most notably Henry Mintzberg, propose a third approach to the strategic
management process. In contrast to the two rational planning approaches just discussed,
this one is a less formal and less stylized approach to the development of strategy. To
reflect the reality that strategy can be planned or emerge from the bottom up, Exhibit 2.8
shows a more integrative approach to strategy-making.
According to this more holistic model, the strategy process also begins with a top-down
strategic plan. Top-level executives design an intended strategy —the outcome of a rational
and structured, top-down strategic plan. In today’s complex and uncertain world, however,
unpredictable events can have tremendous effects. In 1990, online retailing was nonexis-
tent. Today, almost all Internet users have engaged in online retailing. As a total of all sales,
online retailing was almost 10 percent (in 2012), and continues to grow fast. 34 Given the
dramatic success of Amazon as the world’s leading online retailer and eBay as the world’s
EXHIBIT 2.8 /
Realized Strategy Is a Combination of Top-Down Intended Strategy and Bottom-Up Emergent Strategy SOURCE: Adapted from H. Mintzberg and A. McHugh (1985), “Strategy formation in an adhocracy,” Administrative
Science Quarterly 30: 162.
RealizedStrategy
Unrealized Strategy
• Unpredictable Events
Intended Strategy
• Top-Down Strategic Plan
Bottom-UpEmergent Strategy
• Autonomous Actions
• Serendipity
• Resource Allocation
Process (RAP)
WWW.YAZDANPRESS.COMWWW.YAZDANPRESS.COM
CHAPTER 2 Strategic Leadership: Managing the Strategy Process 45
largest online marketplace, brick-and-mortar companies such as Best Buy, Radio Shack,
JCPenney, and Sears have all been forced to respond and adjust their strategies in order to
avoid bankruptcy. Exhibit 2.8 illustrates how parts of a firm’s intended strategy fall by the
wayside due to unpredictable events and thus turn into unrealized strategy. A firm’s realized strategy is generally a combination of its top-down strategic inten-
tions and bottom-up emergent strategy. An emergent strategy describes any unplanned
strategic initiative undertaken by mid-level employees of their own volition. If successful,
emergent strategies have the potential to influence and shape a firm’s strategy.
The strategic initiative is a key feature in the strategy as a planned emergence model. A
strategic initiative is any activity a firm pursues to explore and develop new products and
processes, new markets, or new ventures. Strategic initiatives can come from anywhere.
They could be the result of a response to external trends (such as online retailing) or come
from internal sources. As such, strategic initiatives can be the result of top-down planning
by executives, or they can also emerge through a bottom-up process. (The black arrows in
Exhibit 2.8 represent different strategic initiatives.) In particular, strategic initiatives can
bubble up from deep within a firm through:
■ Autonomous actions by lower-level employees
■ Serendipity (random events, pleasant surprises, accidental happenstances)
■ The resource allocation process (RAP) 35
Strategy Highlight 2.2 illustrates that successful emergent strategies are sometimes the
result of serendipity combined with autonomous actions of lower-level employees. (See
MiniCase 4, which describes the serendipitous discovery of Viagra.)
Functional managers (such as Diana, the Starbucks store manager featured in Strategy
Highlight 2.2) are much closer to the final products, services, and customers than corpo-
rate- or business-level managers. As a result, functional managers may initiate strategic
initiatives based on autonomous actions that can influence the direction of the company.
To be successful, however, top-level executives need to support emergent strategies that
they believe fit with the firm’s vision and mission. Diana’s autonomous actions might not
have succeeded (or even got her in trouble) if she did not garner the support of a senior
Starbucks executive (Howard Behar). This executive championed her initiative and helped
persuade other top executives. Consider the following examples, in which the impetus for
strategic initiatives all emerged from the bottom up through autonomous actions:
■ The Internet company Google organizes the work of its engineers according to a 70-20-
10 rule. The majority of the engineers’ work time (70 percent) is focused on its main
business (search and ads). 36 Google also allows its engineers to spend one day a week
(20 percent) on ideas of their own choosing, and the remainder (10 percent) on total
wild cards (such as a driverless car). Google reports that half of its new products came
from the 20 percent rule. Examples of innovations that resulted from the 20 percent
rule include Gmail, Google Maps, Google News, and Orkut. 37
■ In 2001, a mid-level engineer at General Electric proposed buying Enron Wind, a
division that was up for sale as part of Enron’s bankruptcy proceedings. Then-CEO
Jack Welch didn’t want anything with the name Enron on it, given Enron’s large-scale
intended strategy The outcome of a rational and structured top-down strategic plan.
realized strategy Combination of intended and emergent strategy.
emergent strategy Any unplanned strategic initiative undertaken by mid-level employees of their own volition.
strategic initiative Any activity a firm pursues to explore and develop new products and processes, new markets, or new ventures.
WWW.YAZDANPRESS.COMWWW.YAZDANPRESS.COM
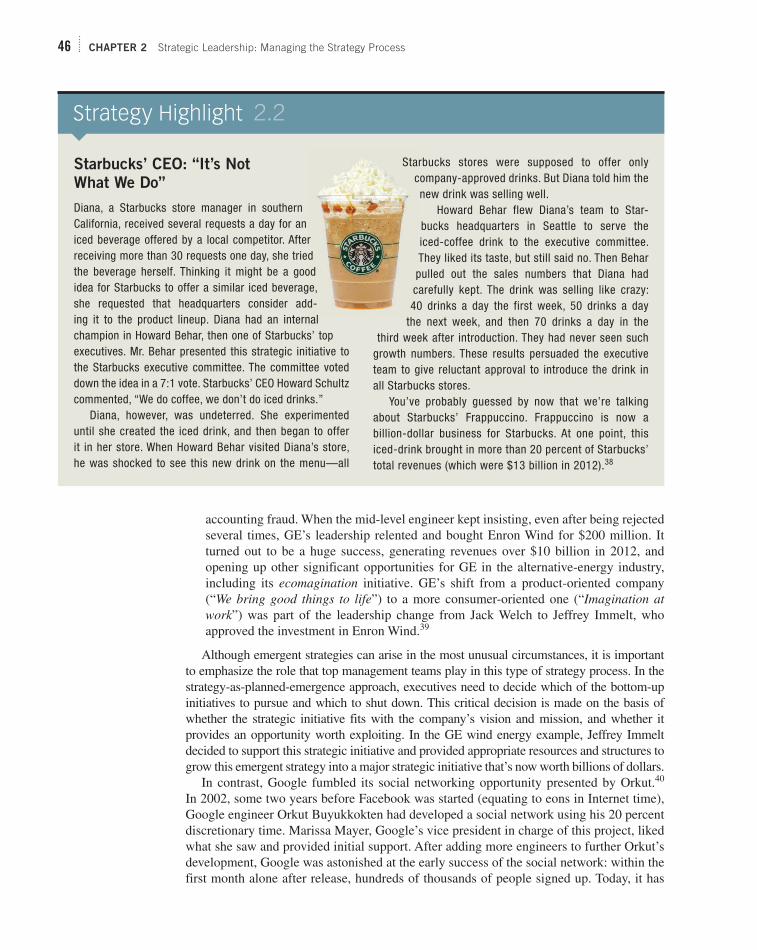
46 CHAPTER 2 Strategic Leadership: Managing the Strategy Process
accounting fraud. When the mid-level engineer kept insisting, even after being rejected
several times, GE’s leadership relented and bought Enron Wind for $200 million. It
turned out to be a huge success, generating revenues over $10 billion in 2012, and
opening up other significant opportunities for GE in the alternative-energy industry,
including its ecomagination initiative. GE’s shift from a product-oriented company
(“ We bring good things to life ”) to a more consumer-oriented one (“ Imagination at work ”) was part of the leadership change from Jack Welch to Jeffrey Immelt, who
approved the investment in Enron Wind. 39
Although emergent strategies can arise in the most unusual circumstances, it is important
to emphasize the role that top management teams play in this type of strategy process. In the
strategy-as-planned-emergence approach, executives need to decide which of the bottom-up
initiatives to pursue and which to shut down. This critical decision is made on the basis of
whether the strategic initiative fits with the company’s vision and mission, and whether it
provides an opportunity worth exploiting. In the GE wind energy example, Jeffrey Immelt
decided to support this strategic initiative and provided appropriate resources and structures to
grow this emergent strategy into a major strategic initiative that’s now worth billions of dollars.
In contrast, Google fumbled its social networking opportunity presented by Orkut. 40
In 2002, some two years before Facebook was started (equating to eons in Internet time),
Google engineer Orkut Buyukkokten had developed a social network using his 20 percent
discretionary time. Marissa Mayer, Google’s vice president in charge of this project, liked
what she saw and provided initial support. After adding more engineers to further Orkut’s
development, Google was astonished at the early success of the social network: within the
first month alone after release, hundreds of thousands of people signed up. Today, it has
Starbucks’ CEO: “It’s Not
What We Do”
Diana, a Starbucks store manager in southern California, received several requests a day for an iced beverage offered by a local competitor. After receiving more than 30 requests one day, she tried the beverage herself. Thinking it might be a good idea for Starbucks to offer a similar iced beverage, she requested that headquarters consider add-ing it to the product lineup. Diana had an internal champion in Howard Behar, then one of Starbucks’ top executives. Mr. Behar presented this strategic initiative to the Starbucks executive committee. The committee voted down the idea in a 7:1 vote. Starbucks’ CEO Howard Schultz commented, “We do coffee, we don’t do iced drinks.”
Diana, however, was undeterred. She experimented until she created the iced drink, and then began to offer it in her store. When Howard Behar visited Diana’s store, he was shocked to see this new drink on the menu—all
Starbucks stores were supposed to offer only company-approved drinks. But Diana told him the new drink was selling well.
Howard Behar flew Diana’s team to Star-bucks headquarters in Seattle to serve the iced-coffee drink to the executive committee. They liked its taste, but still said no. Then Behar pulled out the sales numbers that Diana had carefully kept. The drink was selling like crazy: 40 drinks a day the first week, 50 drinks a day
the next week, and then 70 drinks a day in the third week after introduction. They had never seen such
growth numbers. These results persuaded the executive team to give reluctant approval to introduce the drink in all Starbucks stores.
You’ve probably guessed by now that we’re talking about Starbucks’ Frappuccino. Frappuccino is now a billion-dollar business for Starbucks. At one point, this iced-drink brought in more than 20 percent of Starbucks’ total revenues (which were $13 billion in 2012). 38
2.2
WWW.YAZDANPRESS.COMWWW.YAZDANPRESS.COM

CHAPTER 2 Strategic Leadership: Managing the Strategy Process 47
a mere 30 million users (mostly in Brazil and India), which pales in comparison to Face-
book’s over 1 billion users worldwide.
Why did Google fumble its lead over Facebook? Google had a huge opportunity to
become the leader in social networking because MySpace imploded after it was acquired by
News Corp. Despite initial support, Google’s top executives felt that social networking did
not fit its vision to organize the world’s information and make it universally accessible and useful. Google relied on highly complex and proprietary algorithms to organize the knowl-
edge available on the Internet and serve up targeted search ads. Social networking software,
in comparison, is fairly pedestrian. Google’s co-founders, Sergey Brin and Larry Page, both
exceptional computer scientists, looked down on social networking. They felt their Page-
Rank algorithm that accounts for hundreds of variables and considers all available websites
was far superior in providing objective recommendations to users’ search queries than sub-jective endorsements by someone’s (online) friends. As a consequence, they snubbed social
networking. Moreover, given the many different projects Google was pursuing at that time,
Orkut was ranked as a low priority by Google’s top executives. Starved of further resources,
the social networking site withered, making Facebook the undisputed leader.
In 2011, Google launched Google Plus, its newest social networking service. By inte-
grating all its services such as Gmail, YouTube, Chrome, and others into one user interface
(and requiring users of even just one Google product to sign in to its portal), the company
hopes to catch up with Facebook. Not being able to access Facebook users’ activities limits
Google’s ability to serve targeted ads, and thus cuts into its main line of business. AdWords
is Google’s main online advertising product and garners some 85 percent of Google’s total
revenues of $50 billion (in 2012). 41
Finally, bottom-up strategies can also emerge as a consequence of the firm’s resource
allocation process (RAP). 42 The way a firm allocates its resources can be critical in shaping
its realized strategy. 43 Intel Corp. illustrates this concept. 44 Intel was founded in 1968 to
produce DRAM (dynamic random-access memory) chips. From the start, producing these
chips was the firm’s top-down strategic plan, and initially it worked well. In the 1980s,
Japanese competitors brought better-quality chips to the market at lower cost, threatening
Intel’s position and strategic plan. However, Intel was able to pursue a strategic transfor-
mation due to the way it set up its resource allocation process. In a sense, Intel was using
functional-level managers to drive business and corporate strategies in a bottom-up fash-
ion. In particular, during this time Intel had only a few “fabs” (fabrication plants to produce
silicon-based products). It would have taken several years and billions of dollars to build
additional capacity by bringing new fabs online.
With constrained production capacity, Intel had implemented the production-decision
rule to maximize margin-per-wafer-start. Each time functional managers initiated a new
production run, they were to consider the profit margins for DRAM chips and for semicon-
ductors (the “brains” of personal computers); they then could produce whichever product delivered the higher margin. By following this simple rule, front-line managers shifted
Intel’s production capacity away from the lower-margin DRAM business to the higher-
margin semiconductor business. The firm’s focus on semiconductors emerged from the
bottom up, based on resource allocation. Indeed, by the time top management finally
approved the de facto strategic switch, the company’s market share in DRAM had dwin-
dled to less than 3 percent. 45
Taken together, a firm’s realized strategy is frequently a combination of top-down stra-
tegic intent and bottom-up emergent strategies, as Exhibit 2.8 shows. This type of strategy
process is called planned emergence . In that process, organizational structure and sys-
tems allow bottom-up strategic initiatives to emerge and be evaluated and coordinated by
top management. 46
planned emergence
Strategy process in which organizational structure and systems allow bottom-up strategic initiatives to emerge and be evaluated and coordinated by top management.
WWW.YAZDANPRESS.COMWWW.YAZDANPRESS.COM

48 CHAPTER 2 Strategic Leadership: Managing the Strategy Process
2.4 Implications for the Strategist
Two ingredients are needed to create a powerful foundation upon which to formulate and
implement a strategy in order to gain and sustain a competitive advantage: First, the firm
needs an inspiring vision and mission backed up by ethical values. Second, the firm needs
an effective strategic management process.
Each of the three strategy processes introduced in this chapter has its strengths and
weaknesses. The effectiveness of the chosen strategy process is contingent upon the rate
of change in the internal and external environments of the firm. In a slow-moving environ-
ment, top-down strategic planning might be the most effective approach. Besides the rate
of change, a second dimension is firm size. Larger firms tend to use either a top-down stra-
tegic planning process or scenario planning. For a nuclear power provider such as Areva in
France that provides over 75 percent of the country’s energy and has the long-term backing
of the state, for instance, using a top-down strategy approach might work well. Given that
nuclear accidents are rare, but when they occur they have a tremendous impact (such as
in Chernobyl, Russia, and Fukushima, Japan), Areva might use scenario planning to pre-
pare for black swan events. In fast-moving environments, in contrast, Internet companies
such as Alibaba, eBay, Facebook, Google, Dropbox, Pinterest, or Twitter tend to use the
strategy-as-planned-emergence process.
Another important implication of our discussion is that all employees should be involved
in setting an inspiring vision and mission to create more meaningful work. Belief in a
company’s vision and mission motivates its employees. Moreover, every employee plays
a strategic role. Lower-level employees focus mainly on strategy implementation when a
firm is using top-down or scenario planning. As the examples, however, have shown, any employee (even at the entry level) can have great ideas that might become strategic initia-tives with the potential to transform companies.
Here we conclude our discussion of the strategic management process, which marks the
end of the “getting started” portion of the AFI framework. The next chapter moves us into the
analysis part of the framework, where we begin by studying external and internal analyses.
M MANY OBSERVERS APPLAUD Indra Nooyi for taking a stakeholder strategy approach by making PepsiCo’s strategic vision Performance with a Purpose. Although Ms. Nooyi has defined an inspiring vision for PepsiCo, financial performance seems to be lagging, especially in comparison with its archrival Coca-Cola, which has done well by continuing to concentrate on its core business in soda and other non-alcoholic beverages. In particular, critics allege that Ms. Nooyi has not paid enough attention to the company’s flagship beverage business: Pepsi-Cola fell to No. 3 in U.S. soda sales, behind Coke and Diet Coke. As a result, PepsiCo’s stock
has underperformed archrival Coca-Cola in recent years.
Some critics even go so far as to call for the replace-ment of Ms. Nooyi. They also propose splitting PepsiCo into two standalone companies. One would focus on beverages (Pepsi, Gatorade, Tropicana); the other would focus on snack foods (Frito-Lay, Doritos). This move would unlock additional profit potential, the argument goes, because well-performing snack foods would no longer need to subsidize underperforming beverages.
CHAPTER CASE 2 Consider This . . .
WWW.YAZDANPRESS.COMWWW.YAZDANPRESS.COM

CHAPTER 2 Strategic Leadership: Managing the Strategy Process 49
Questions
Thinking about ChapterCase 2, answer the following questions.
1. What “grade” would you give Ms. Nooyi for her job performance as a strategic leader? What are her strengths and weaknesses? Where would you place Ms. Nooyi on the Level-5 pyramid of strate-gic leadership (see Exhibit 2.4 ), and why? Support your answers.
2. What should a strategic leader like Ms. Nooyi do if his or her vision does not seem to lead to an immediate (financial) competitive advantage? What would be your top-three recommendations? Support your arguments.
3. If you were a member of PepsiCo’s board of direc-tors, would you be concerned with Ms. Nooyi’s and/or PepsiCo’s performance? If you were con-cerned, what course of action would you recom-mend? Would you go so far as to endorse Ms. Nooyi’s replacement with a new CEO who would focus more on PepsiCo’s stock market perfor-mance? Why or why not?
4. Do you agree with Ms. Nooyi’s critics that Pep-siCo should be split up into two companies—one focusing on beverages, and one focusing on snack foods? What would be the advantages and disadvantages of such a move?
This chapter explained the role of vision, mission, and
values in the strategic management process. It provided
an overview of strategic leadership and explained dif-
ferent processes to create strategy, as summarized by
the following learning objectives and related take-
away concepts.
LO 2-1 / Describe the roles of vision, mission,
and values in the strategic management process.
■ A vision captures an organization’s aspirations.
An effective vision inspires and motivates mem-
bers of the organization.
■ A mission statement describes what an organiza-
tion actually does—what its business is—and
why and how it does it.
■ Values define the ethical standards and norms that
should govern the behavior of individuals within
the firm.
LO 2-2 / Evaluate the strategic implications
of product-oriented and customer-oriented
vision statements.
■ Product-oriented vision statements define a busi-
ness in terms of a good or service provided.
■ Customer-oriented vision statements define business
in terms of providing solutions to customer needs.
■ Customer-oriented vision statements provide
managers with more strategic flexibility than
product-oriented missions.
■ To be effective, visions and missions need
to be backed up by hard-to-reverse strategic
commitments.
LO 2-3 / Explain why anchoring a firm
in ethical values is essential for long-term
success.
■ Employees tend to follow values practiced by
strategic leaders. Without commitment from top
managers, statements of values remain merely
public relations exercises.
■ Ethical values are the guardrails that help keep
the company on track when pursuing its mission
and its quest for competitive advantage.
LO 2-4 / Outline how managers become
strategic leaders.
■ To become an effective strategic leader, a man-
ager needs to develop skills to move sequentially
through five different leadership levels: highly
capable individual, contributing team mem-
ber, competent manager, effective leader, and
executive.
TAKE-AWAY CONCEPTS
WWW.YAZDANPRESS.COMWWW.YAZDANPRESS.COM

50 CHAPTER 2 Strategic Leadership: Managing the Strategy Process
LO 2-5 / Describe the roles of corporate,
business, and functional managers in strategy
formulation and implementation.
■ Corporate executives must provide answers to the
question of where to compete (in industries, mar-
kets, and geographies), and how to create syner-gies among different business units.
■ General managers in strategic business units
must answer the strategic question of how to compete in order to achieve superior perfor-
mance. They must manage and align the firm’s
different functional areas for competitive
advantage.
■ Functional managers are responsible for imple-menting business strategy within a single func-
tional area.
LO 2-6 / Evaluate top-down strategic
planning, scenario planning, and strategy
as planned emergence.
■ Top-down strategic planning is a sequential, lin-
ear process that works reasonably well when the
environment does not change much.
■ In scenario planning, managers envision what-if
scenarios and prepare contingency plans that can
be called upon when necessary.
■ Strategic initiatives can be the result of top-down
planning or can emerge through a bottom-up
process from deep within the organization. They
have the potential to shape a firm’s strategy.
■ A firm’s realized strategy is generally a com-
bination of its top-down intended strategy and
bottom-up emergent strategy, resulting in planned
emergence.
Dominant strategic plan
Emergent strategy
Intended strategy
Level-5 leadership pyramid
Mission
Organizational values
Planned emergence
Realized strategy
Scenario planning
Strategic business unit (SBU)
Strategic commitments
Strategic initiative
Strategic leadership
Strategic management process
Top-down strategic planning
Upper-echelons theory
Vision
KEY TERMS
1. What characteristics does an effective mission
statement have?
2. In what situations is top-down planning likely
to be superior to bottom-up emergent strategy
development?
3. This chapter introduces three different levels
appropriate for strategic considerations (see
Exhibit 2.5 ). In what situations would some
of these levels be more important than others?
For example, what issues might be considered
by the corporate level? What do you see as
the primary responsibilities of corporate-level
executives? When might the business-level
managers bear more responsibility for consider-
ing how to respond to an issue? In what
situations might the functional-level managers
have a primary responsibility for considering
an issue? How should the organization ensure
the proper attention to each level of strategy
as needed?
4. Identify an industry that is undergoing intense
competition or is being featured in the business
press. Discuss how scenario planning might be
used by competitors to prepare for future events.
Can some industries benefit more than others
from this type of process? Explain why.
DISCUSSION QUESTIONS
WWW.YAZDANPRESS.COMWWW.YAZDANPRESS.COM

CHAPTER 2 Strategic Leadership: Managing the Strategy Process 51
Vision/Mission Statement Company Type of Statement
a. To be earth’s most customer centric company; to build a place where people can come to find and discover anything they might want to buy online.
b. To be the most respected global financial services company.
c. To provide personal vehicle owners and enthusiasts with the vehicle related products and knowledge that fulfill their wants and needs at the right price.
d. To provide technology advancing every company, products enhancing every home, and innovation improving every life.
e. To become the Beauty company most women turn to worldwide.
f. To provide a global trading platform where practically anyone can trade practically anything.
g. To operate the best specialty retail business in America, regardless of the product we sell.
h. To combine aggressive strategic marketing with quality products and services at competitive prices to provide the best insurance value for consumers.
i. To be the most respected global financial services company.
j. To nourish and delight everyone we serve.
k. To help our clients make distinctive, lasting, and substantial improvements in their performance and to build a great firm that attracts, develops, excites, and retains exceptional people.
l. To be America’s best run, most profitable automotive retailer.
m. [To] use our pioneering spirit to responsibly deliver energy to the world.
n. [To] provide high-quality [chocolate] products while conducting our business in a socially responsible and environmentally sustainable manner.
o. Bringing the best to everyone we touch
p. [To provide] high value-added supply chain, transportation, business and related information services through focused operating companies.
q. [To provide] convenience and low prices.
r. To become the first platform of choice for sharing data, to be an enterprise that has the happiest employees, and to last at least 102 years.
s. To organize the world’s information and make it universally accessible and useful.
t. To give ordinary folk the chance to buy the same thing as rich people.
u. To give the people the power to share and make the world more open and connected.
1. Over 50,000 people lost their jobs and many their
life savings in the Enron debacle. Some of those
at Enron who were closely involved in the scan-
dal, such as Jeffrey Skilling (CEO) and Andrew
Fastow (CFO), are serving significant prison sen-
tences. Why do you think only one employee ini-
tially came forward to report the irregularities and
help with the investigation? What responsibility do
lower-level executives bear for not reporting such
questionable practices by the firm’s leadership?
2. The list below shows a sample of various vision/
mission statements. Guess the company, and iden-
tify whether the statements are customer-oriented,
product-oriented, or a combination.
ETHICAL/SOCIAL ISSUES
WWW.YAZDANPRESS.COMWWW.YAZDANPRESS.COM

52 CHAPTER 2 Strategic Leadership: Managing the Strategy Process
//// Small-Group Exercise 1
A popular topic in education and public policy is the
need to support the STEM disciplines (Science, Tech-
nology, Engineering, Mathematics) as the key to U.S.
competitiveness. These disciplines generate innova-
tive ideas and build new companies—and perhaps new
industries. As you have learned in this chapter, inno-
vative ideas can help sustain competitive advantage.
Many American businesses, however, are concerned
about whether there will be an adequate supply of
STEM workers in the future because the growth in job
opportunities for STEM occupations is expected to be
nearly three times as fast as for non-STEM occupa-
tions. A key advocate for federal support for funding
STEM education is the STEM Education Coalition,
which expresses its mission as “to ensure that STEM
education is recognized as a national policy priority.”
The skills and expertise of the STEM occupations
will be critical in dealing with the National Intelli-
gence Council’s Global Trends 2030 initiatives, which
will confront the global community over the next 15
years. In particular, the key trends include a need for
new communication and manufacturing technologies,
cyber-security, health care advances and preparations
to manage pandemic threats, innovative and sustainable
designs for infrastructure improvements, and improve-
ments in the production and management of food,
water, and energy that will meet the needs of a growing
population. Business organizations may find opportu-
nities to build sustainable competitive advantages by
responding to these trends, but they will need adequate
STEM expertise in order to create innovative and
appropriate responses to these challenges. With inno-
vation and cooperation, these trends can be confronted
peacefully in order to benefit geopolitical stability.
1. Discuss within your group methods that the
STEM Education Coalition might use to gain
partners, particularly business organizations, that
will help them make sure STEM education is a
national policy priority. Given the budget crisis,
how can they persuade congressional representa-
tives to support funding?
2. How does funding for STEM education affect job
opportunities for business majors?
3. Although group members may not be STEM
majors, brainstorm ideas about how you might
advise businesses to modify their operations or
to expand/transform their operations in order to
find opportunities in the Global Trends over the
next 15 years. Choose a business of interest to the
group. Then consider scenarios in which the busi-
ness may thrive as one of the five trends develop.
For example, the majority of businesses might
want to ask, “What if threats to cyber-security
increase?” Or, “What if water resources become
more scarce? How would this affect production
or demand for the goods produced?” Your group
may also consider businesses or industries that
may decline as a result of the trends.
4. What additional developmental opportunities
might prepare business majors for playing key
roles in facing the Global Trends 2030? What skills
will you need in order to manage effectively the
STEM employees who are central to innovation?
//// Small-Group Exercise 2
In many situations, promising ideas emerge from the
lower levels of an organization, only to be discarded
before they can be implemented. It was only extraor-
dinary tenacity (and indeed, disregard) for the policy
of selling only corporate-approved drinks that permit-
ted the Frappuccino to “bloom” within Starbucks (see
Strategy Highlight 2.2).
Some scholars have suggested that companies set
aside up to 2 percent of their budgets for any man-
ager with budget control to be able to invest in new
ideas within the company. 47 Thus, someone with a
$100,000 annual budget to manage would be able to
invest $2,000 in cash or staff time toward such a proj-
ect. Multiple managers could go in together for some-
what larger funds or time amounts. Through such a
process, the organization could generate a network of
“angel investors.” Small funds or staff time could be
invested into a variety of projects. Approval mecha-
nisms would be easier for these small “seed-stock”
ideas, to give them a chance to develop before going
for bigger funding at the top levels of the organization.
What would be some problems that would need to
be addressed to introduce this angel-network idea into a
firm? Use a firm someone in your group has worked for
or knows well to discuss possible issues of widely dis-
tributing small funding level approvals across the firm.
SMALL-GROUP EXERCISES
WWW.YAZDANPRESS.COMWWW.YAZDANPRESS.COM

CHAPTER 2 Strategic Leadership: Managing the Strategy Process 53
STRATEGY TERM PROJECT
//// Module 2: Mission, Goals, and the
Strategic Management Process
1. Search for a vision, mission statement, and state-
ment of values for your chosen firm. Note that not
all organizations publish these statements specifi-
cally, so you may need to make inferences from
the available information. Relevant information
is often available at the firm’s website (though it
may take some searching) or is contained in its
annual reports. You may also interview a manager
of the firm or contact Investor Relations. You may
also be able to compare the official statement with
the business press coverage of the firm.
2. Identify the major goals of the company. What
are its short-term versus long-term goals? What
resources must the firm acquire to achieve its
long-term goals?
3. Trace any changes in strategy that you can iden-
tify over time. Try to determine whether the stra-
tegic changes of your selected firm are a result of
intended strategies, emergent strategies, or some
combination of both.
How Much Are Your Values
Worth to You?
H ow much are you willing to pay for the job you want? This may sound like a strange question, since your employer will pay you to work, but think again. Con-
sider how much you value a specific type of work, or how much you would want to work for a specific organization because of its values.
A recent study shows scientists who want to continue engaging in research will accept some $14,000 less in annual salary to work at an organization that permits them to publish their findings in academic journals, implying that some scientists will “pay to be scientists.” This find-ing appears to hold in the general business world, too. In a recent survey, 97 percent of Stanford MBA students indi-cated they would forgo some 14 percent of their expected salary, or about $11,480 a year, to work for a company that matches their own values with concern for stakeholders and sustainability. According to Monster.com , an online career service, about 92 percent of all undergraduates want to work for a “green” company. These diverse examples demonstrate
that people put a real dollar amount on pursuing careers in sync with their values.
On the other hand, certain high-powered jobs such as management consulting or investment banking pay very well, but their high salaries come with strings attached. Professionals in these jobs work very long hours, including weekends, and often take little or no vacation time. These workers “pay for pay” in that they are often unable to form stable relationships, have little or no leisure time, and some-times even sacrifice their health. People “pay for”—make certain sacrifices for—what they value, because strategic decisions require important trade-offs. 48
1. Identify your personal values. How do you expect these values to affect your work life or your career choice?
2. How much less salary would (did) you accept to find employment with a company that is aligned with your values?
3. How much are you willing to “pay for pay” if your dream job is in management consulting or investment banking?
my STRATEGY
WWW.YAZDANPRESS.COMWWW.YAZDANPRESS.COM

54 CHAPTER 2 Strategic Leadership: Managing the Strategy Process
1. This ChapterCase is based on: “PepsiCo
shakes it up,” BusinessWeek, August 14,
2006; “The Pepsi challenge,” The Economist, August 17, 2006; “Keeping cool in hot
water,” BusinessWeek, June 11, 2007; “Pepsi
gets a makeover,” The Economist, March 25,
2010; “Indra Nooyi on Performance with
Purpose 2009,” PepsiCo Video, http://bit.
ly/Ubhvs8 ; “Conversation with Indra Nooyi
Yale SOM ’80”; “PepsiCo wakes up and
smells the cola,” The Wall Street Journal, June 28, 2011; “Should Pepsi break up? The Economist, October 11, 2011; “As Pepsi
struggles to regain market share, Indra
Nooyi’s job is on the line,” The Economist, May 17, 2012; and www.wolframalpha.com .
2. Finkelstein, S., D. C. Hambrick, and A. A.
Cannella (2008), Strategic Leadership: Theory and Research on Executives, Top Manage-ment Teams, and Boards (Oxford, UK: Oxford
University Press); and Yulk, G. (1998), Lead-ership in Organizations, 4th ed. (Englewood
Cliff, NJ: Prentice-Hall).
3. http://www.pepsico.com/Purpose/
Overview.html .
4. Frankl, V. E. (1984), Man’s Search for Meaning.
5. Pink, D. H. (2011). The Surprising Truth About What Motivates Us (New York: River-
head Books).
6. Hamel, G., and C. K. Prahalad (1989),
“Strategic intent,” Harvard Business Review
(May–June): 64–65; Hamel, G., and C. K.
Prahalad (1994), Competing for the Future
(Boston, MA: Harvard Business School
Press); and Collins, J. C., and J. I. Porras
(1994), Built to Last: Successful Habits of Visionary Companies (New York: Harper
Collins).
7. Collins, J. C., and J. I. Porras (1994),
Built to Last: Successful Habits of Visionary Companies.
8. Dixit, A., and B. Nalebuff (1991), Thinking Strategically: The Competitive Edge in Busi-ness, Politics, and Everyday Life (New York:
Norton); and Brandenburger, A. M., and B.
J. Nalebuff (1996), Co-opetition (New York:
Currency Doubleday).
9. Germain, R., and M. B. Cooper (1990),
“How a customer mission statement affects
company performance,” Industrial Marketing Management 19(2), 47–54; Bart, C. K. (1997),
“Industrial firms and the power of mission,”
Industrial Marketing Management 26 (4):
371–383; and Bart, C. K. (2001), “Measur-
ing the mission effect in human intellectual
capital,” Journal of Intellectual Capital 2(3):
320–330.
10. “The three habits . . . of highly irritating
management gurus,” The Economist, October
22, 2009.
11. The Disney and Subway discussion is
based on: Heath, C., and D. Heath (2007),
Made to Stick, pp. 60–61.
12. Burgelman, R. A., and A. S. Grove
(1996), “Strategic dissonance,” California Management Review 38: 8–28; and Grove,
A. S. (1996), Only the Paranoid Survive: How to Exploit the Crisis Points that Chal-lenge Every Company (New York: Currency
Doubleday).
13. Bart, C. K., and M. C. Baetz (1998), “The
relationship between mission statements and
firm performance: An exploratory study,”
Journal of Management Studies 35: 823–853.
14. Finkelstein, S., D. C. Hambrick, and A. A.
Cannella (2008), Strategic Leadership, p. 4.
15. Hambrick, D. C., and E. Abrahamson
(1995), “Assessing managerial discretion
across industries: A multimethod approach,”
Academy of Management Journal 38:
1427–1441.
16. “The 100 best performing CEOs in the
World,” Harvard Business Review, January–
February 2013.
17. As quoted in: Collins, J. (2009), How the Mighty Fall. And Why Some Companies Never Give In (New York: Harper Collins), p. 53.
18. http://www.merck.com/about/featured-
stories/mectizan1.html .
19. Gilmartin, R. V. (2011), “The Vioxx recall
tested our leadership,” Harvard Business Review Blog Network, October 6.
20. The Merck River Blindness case and the
quote by CEO Kenneth Frazier are drawn
from: http://www.merck.com/about/featured-
stories/mectizan1.html . This Vioxx example
is drawn from: “Jury finds Merck liable in
Vioxx death and awards $253 million,” The
New York Times, August 19, 2005; Heal, G.
(2008), When Principles Pay: Corporate Social Responsibility and the Bottom Line
(New York: Columbia Business School); and
Collins, J. (2009), How the Mighty Fall: And Why Some Companies Never Give In (New
York: Harper Collins).
21. Bandiera, O., A. Prat, and R. Sadun
(2012), “Managerial capital at the top: Evi-
dence from the time use of CEOs,” London School of Economics and Harvard Business School Working Paper; and “In defense of the
CEO,” The Wall Street Journal, January 15,
2013. The patterns of how CEOs spend their
time have held in a number of different studies
across the world.
22. Finkelstein, S., D. C. Hambrick, and A. A.
Cannella (2008), Strategic Leadership, p. 17.
23. Hambrick, D. C. (2007), “Upper echelons
theory: An update,” Academy of Management Review 32: 334–343; and Hambrick, D. C.,
and P. A. Mason (1984), “Upper echelons:
The organization as a reflection of its top
managers,” Academy of Management Review
9: 193–206.
24. Collins, J. (2001), Good to Great: Why Some Companies Make the Leap . . . And Oth-ers Don’t (New York: HarperCollins), p. 3.
25. Ibid.
26. PepsiCo, Inc. 2011 Annual Report.
27. This discussion is based on: Mintzberg,
H. (1993), The Rise and Fall of Strategic Planning: Reconceiving Roles for Planning, Plans, and Planners (New York: Simon &
Schuster); and Mintzberg, H. (1994), “The fall
and rise of strategic planning,” Harvard Busi-ness Review (January–February): 107–114.
28. Isaacson, W. (2011), Steve Jobs (New
York: Simon & Schuster). See also: Isaacson,
W. (2012), “The real leadership lessons of
Steve Jobs,” Harvard Business Review (April).
29. Jobs, S. (1998), “There is sanity return-
ing,” BusinessWeek, May 25.
30. “CEO Tim Cook pushes employee-
friendly benefits long shunned by Steve Jobs,”
The Wall Street Journal, November 12, 2012.
31. Grove, A. S. (1996), Only the Paranoid Survive.
32. Personal communication with UPS strat-
egy executives during onsite visit in corporate
headquarters, June 17, 2009.
33. Mintzberg, H. (1993), The Rise and Fall of Strategic Planning; and Mintzberg,
H. (1994), “The fall and rise of strategic
planning.”
34. Data from the U.S. census bureau,
reported in “E-commerce,” The Economist, April 6, 2013.
35. Arthur, B. W. (1989), “Competing
technologies, increasing returns, and lock-
in by historical events,” Economic Journal 99: 116–131; and Brown, S. L., and K. M.
Eisenhardt (1998), Competing on the Edge: Strategy as Structured Chaos (Boston, MA:
Harvard Business School Press); Bower, J.
L. (1970), Managing the Resource Alloca-tion Process (Boston, MA: Harvard Business
School Press); Bower, J. L., and C. G. Gilbert
(2005), From Resource Allocation to Strat-egy (Oxford, UK: Oxford University Press);
Burgelman, R. A. (1983), “A model of the
interaction of strategic behavior, corporate
context, and the concept of strategy,” Academy
ENDNOTES
WWW.YAZDANPRESS.COMWWW.YAZDANPRESS.COM

CHAPTER 2 Strategic Leadership: Managing the Strategy Process 55
of Management Review 8: 61–71; and Burgel-
man, R. A. (1983), “A process model of inter-
nal corporate venturing in a major diversified
firm,” Administrative Science Quarterly 28:
223–244.
36. Levy, S. (2011), In the Plex: How Google Thinks, Works, and Shapes Our Lives (New
York: Simon & Schuster).
37. Mayer, M. (2006), “Nine lessons learned
about creativity at Google,” presentation at
Stanford Technology Ventures Program,
May 17.
38. Based on Howard Behar (retired Presi-
dent, Starbucks North America and Starbucks
International) (2009), Impact Speaker Series
Presentation, College of Management,
Georgia Institute of Technology, October 14.
See also Behar, H. (2007), It’s Not About the Coffee: Leadership Principles from a Life at Starbucks (New York: Portfolio).
39. John Rice (GE Vice Chairman, President,
and CEO, GE Technology Infrastructure)
(2009), presentation at Georgia Institute of
Technology, May 11.
40. This case vignette is drawn from: Levy,
S. (2011), In the Plex: How Google Thinks, Works, and Shapes Our Lives (New York:
Simon & Schuster).
41. Google’s 10-K report. U.S. Securities and
Exchange Commission (SEC), Washington,
D.C., December 31, 2012.
42. Bower, J. L. (1970), Managing the Resource Allocation Process (Boston, MA:
Harvard Business School Press); Bower, J.
L., and C. G. Gilbert (2005), From Resource Allocation to Strategy (Oxford, UK: Oxford
University Press); Burgelman, R. A. (1983),
“A model of the interaction of strategic
behavior, corporate context, and the concept
of strategy,” Academy of Management Review
8: 61–71; and Burgelman, R. A. (1983), “A
process model of internal corporate venturing
in a major diversified firm,” Administrative Science Quarterly 28: 223–244.
43. Bower, J. L., and C. G. Gilbert (2005),
From Resource Allocation to Strategy.
44. Burgelman, R. A. (1994), “Fading memo-
ries: A process theory of strategic business
exit in dynamic environments,” Administrative Science Quarterly 39: 24–56.
45. Burgelman, R. A., and A. S. Grove
(1996), “Strategic dissonance,” California Management Review 38: 8–28.
46. Grant, R. M. (2003), “Strategic planning
in a turbulent environment: Evidence from the
oil majors,” Strategic Management Journal 24:
491–517; Brown, S. L., and K. M. Eisenhardt
(1997), “The art of continuous change: Link-
ing complexity theory and time-based evolu-
tion in relentlessly shifting organizations,”
Administrative Science Quarterly 42: 1–34;
Farjourn, M. (2002), “Towards an organic per-
spective on strategy,” Strategic Management Journal 23: 561–594; Mahoney, J. (2005),
Economic Foundation of Strategy (Thousand
Oaks, CA: Sage); and Burgelman, R. A., and
A. S. Grove (2007), “Let chaos reign, then
rein in chaos – repeatedly: Managing strategic
dynamics for corporate longevity,” Strategic Management Journal 28: 965–979.
47. Hamel, G. (2007), The Future of Manage-ment (Boston, MA: Harvard Business School
Publishing).
48. This my Strategy module is based on:
Stern, S. (2004), “Do scientists pay to be
scientists?” Management Science 50(6):
835–853; and Esty, D. C., and A. S. Winston
(2009), Green to Gold: How Smart Compa-nies Use Environmental Strategy to Innovate, Create Value, and Build Competitive Advan-tage, revised and updated (Hoboken, NJ: John
Wiley).
WWW.YAZDANPRESS.COMWWW.YAZDANPRESS.COM

56
Chapter 3
External Analysis: Industry Structure, Competitive Forces, and Strategic Groups
Chapter Outline
3.1 The PESTEL Framework Political/Legal Factors Economic Factors Sociocultural Factors Technological Factors Ecological Factors
3.2 Industry Structure and Firm Strategy: The
Five Forces Model Competition in the Five Forces Model The Threat of Entry The Power of Suppliers The Power of Buyers The Threat of Substitutes Rivalry among Existing Competitors Adding a Sixth Force: The Strategic Role of Complements
3.3 Changes over Time: Industry Dynamics
3.4 Explaining Performance Differences Within
the Same Industry: Strategic Groups Mapping Strategic Groups Mobility Barriers
3.5 Implications for the Strategist
Learning Objectives
After studying this chapter, you should be able to:
LO 3-1 Generate a PESTEL analysis to evaluate the impact of external forces on the firm.
LO 3-2 Apply Porter’s five competitive forces to explain the profit potential of different industries.
LO 3-3 Explain how competitive industry structure shapes rivalry among competitors.
LO 3-4 Describe the strategic role of complements in creating positive-sum co-opetition.
LO 3-5 Appraise the role of industry dynamics and industry convergence in shaping the firm’s external environment.
LO 3-6 Generate a strategic group model to reveal performance differences between clusters of firms in the same industry.
WWW.YAZDANPRESS.COMWWW.YAZDANPRESS.COM
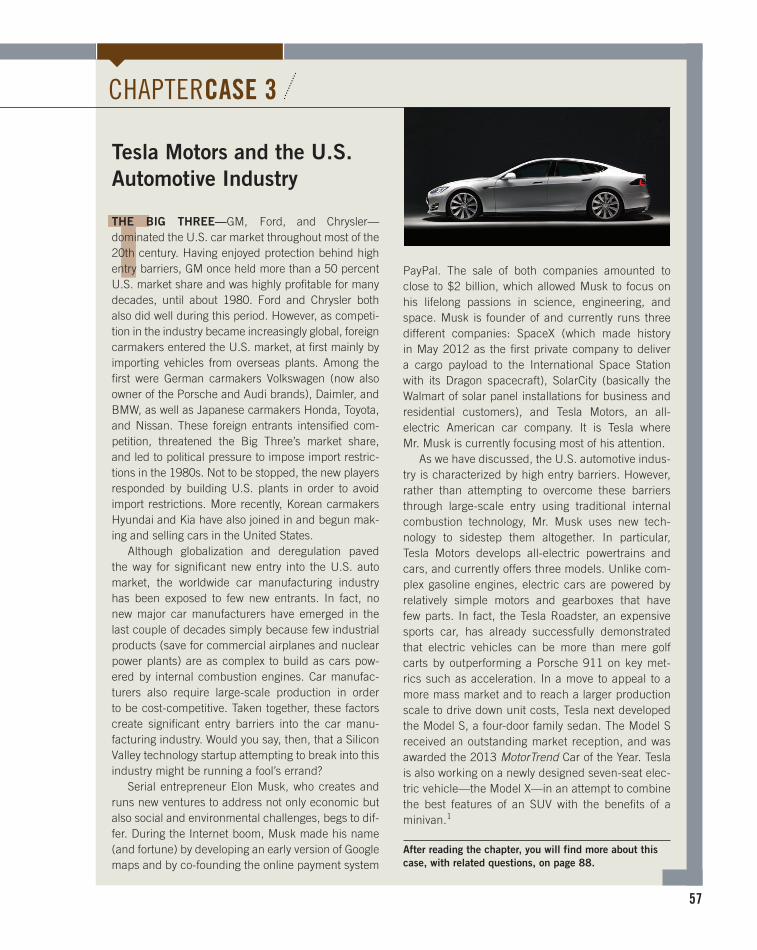
57
T Tesla Motors and the U.S.
Automotive Industry
THE BIG THREE —GM, Ford, and Chrysler—dominated the U.S. car market throughout most of the 20th century. Having enjoyed protection behind high entry barriers, GM once held more than a 50 percent U.S. market share and was highly profitable for many decades, until about 1980. Ford and Chrysler both also did well during this period. However, as competi-tion in the industry became increasingly global, foreign carmakers entered the U.S. market, at first mainly by importing vehicles from overseas plants. Among the first were German carmakers Volkswagen (now also owner of the Porsche and Audi brands), Daimler, and BMW, as well as Japanese carmakers Honda, Toyota, and Nissan. These foreign entrants intensified com-petition, threatened the Big Three’s market share, and led to political pressure to impose import restric-tions in the 1980s. Not to be stopped, the new players responded by building U.S. plants in order to avoid import restrictions. More recently, Korean carmakers Hyundai and Kia have also joined in and begun mak-ing and selling cars in the United States.
Although globalization and deregulation paved the way for significant new entry into the U.S. auto market, the worldwide car manufacturing industry has been exposed to few new entrants. In fact, no new major car manufacturers have emerged in the last couple of decades simply because few industrial products (save for commercial airplanes and nuclear power plants) are as complex to build as cars pow-ered by internal combustion engines. Car manufac-turers also require large-scale production in order to be cost-competitive. Taken together, these factors create significant entry barriers into the car manu-facturing industry. Would you say, then, that a Silicon Valley technology startup attempting to break into this industry might be running a fool’s errand?
Serial entrepreneur Elon Musk, who creates and runs new ventures to address not only economic but also social and environmental challenges, begs to dif-fer. During the Internet boom, Musk made his name (and fortune) by developing an early version of Google maps and by co-founding the online payment system
PayPal. The sale of both companies amounted to close to $2 billion, which allowed Musk to focus on his lifelong passions in science, engineering, and space. Musk is founder of and currently runs three different companies: SpaceX (which made history in May 2012 as the first private company to deliver a cargo payload to the International Space Station with its Dragon spacecraft), SolarCity (basically the Walmart of solar panel installations for business and residential customers), and Tesla Motors, an all-electric American car company. It is Tesla where Mr. Musk is currently focusing most of his attention.
As we have discussed, the U.S. automotive indus-try is characterized by high entry barriers. However, rather than attempting to overcome these barriers through large-scale entry using traditional internal combustion technology, Mr. Musk uses new tech-nology to sidestep them altogether. In particular, Tesla Motors develops all-electric powertrains and cars, and currently offers three models. Unlike com-plex gasoline engines, electric cars are powered by relatively simple motors and gearboxes that have few parts. In fact, the Tesla Roadster, an expensive sports car, has already successfully demonstrated that electric vehicles can be more than mere golf carts by outperforming a Porsche 911 on key met-rics such as acceleration. In a move to appeal to a more mass market and to reach a larger production scale to drive down unit costs, Tesla next developed the Model S, a four-door family sedan. The Model S received an outstanding market reception, and was awarded the 2013 MotorTrend Car of the Year. Tesla is also working on a newly designed seven-seat elec-tric vehicle—the Model X—in an attempt to combine the best features of an SUV with the benefits of a minivan. 1
After reading the chapter, you will find more about this
case, with related questions, on page 88.
CHAPTER CASE 3
WWW.YAZDANPRESS.COMWWW.YAZDANPRESS.COM
58 CHAPTER 3 External Analysis: Industry Structure, Competitive Forces, and Strategic Groups
THE TESLA MOTORS Chapter Case illustrates that competitive forces in an indus-
try have a direct bearing on a firm’s profit potential. Globalization led to extensive
entry by foreign car manufacturers, increasing the number of competitors in the U.S. auto
industry, and with it, competitive rivalry. The Japanese automakers, for example, were suc-
cessful in the U.S. market because their cars were generally of better quality, their produc-
tion systems were more efficient, and they were more responsive to changes in customer
preferences. Today, Korean carmakers are attempting to duplicate this feat. At the same
time, U.S. automakers Ford and GM are experiencing a resurgence. Moreover, technologi-
cal innovations have allowed startups such as Tesla Motors to enter the electric car seg-
ment (or strategic group), effectively circumventing high entry barriers into the broader
automotive market. With more firms vying for a share of the U.S. auto market, competitive
intensity is sure to increase.
In this chapter, we present a set of frameworks to analyze the firm’s external environment —that is, the industry in which the firm operates, and the competitive forces
that surround the firm from the outside. We move from a more macro perspective to a more
micro understanding of how the external environment affects a firm’s quest for competitive
advantage.
We begin with the PESTEL framework, which allows us to scan, monitor, and evaluate
changes and trends in the firm’s macroenvironment. Next, we study Porter’s five forces
model of competition, which allows us to determine an industry’s profit potential. Depend-
ing on the firm’s strategic position, these forces can affect its performance in a positive
or negative fashion. We then move from a static analysis of a firm’s industry environment
to a dynamic understanding of how industries and competition change over time. Finally,
we will introduce the strategic group model as a final framework to help us understand
performance differences between clusters of firms in the same industry before developing
practical Implications for the Strategist.
3.1 The PESTEL Framework
A firm’s external environment consists of all the forces that can affect its potential to gain
and sustain a competitive advantage. By analyzing the forces in the external environment,
managers can mitigate threats and leverage opportunities. One common approach to under-
standing how external forces impinge upon a firm is to consider the source or proximity of
these forces. For example, external forces in the firm’s general environment are ones that
managers have little direct influence over, such as macroeconomic factors (e.g., interest or
currency exchange rates) . In contrast, external factors in the firm’s task environment are
ones that managers do have some influence over, such as the composition of their strategic
groups (a set of close rivals) or the structure of the industry . We will now take a look at
each of these environmental layers in detail, moving from a firm’s general environment to
its task environment (following along in Exhibit 3.1 , we will be working from the outer
ring to the inner ring).
The PESTEL model groups the forces in the firm’s general environment into six
segments: political, economic, sociocultural, technological, ecological, and legal, which together form the acronym PESTEL. Although many of the PESTEL factors
are interdependent, the PESTEL model provides a relatively straightforward way
to scan, monitor, and evaluate the important external factors and trends that might
impinge upon a firm. As markets have opened up and international trade has increased
LO 3-1
Generate a PESTEL analysis to evaluate the impact of external forces on the firm.
PESTEL model
A framework that categorizes and analyzes an important set of external forces (political, economic, sociocultural, technological, ecological, and legal) that might impinge upon a firm. These forces are embedded in the global environment and can create both opportunities and threats for the firm.
WWW.YAZDANPRESS.COMWWW.YAZDANPRESS.COM

CHAPTER 3 External Analysis: Industry Structure, Competitive Forces, and Strategic Groups 59
in recent decades, the PESTEL forces have become more global. As a consequence,
these forces are embedded in the global environment and can create both opportuni-
ties and threats.
POLITICAL/LEGAL FACTORS
Since they are closely related, we will consolidate the discussion of political and legal
factors. The political environment describes the processes and actions of government
bodies that can influence the decisions and behavior of firms. 2 Governments, for
example, can affect firm performance by exerting political pressure on companies.
In Strategy Highlight 1.2, we saw how the U.S. government exerted political pres-
sure upon BP in the aftermath of the Gulf of Mexico oil spill. In overseas markets,
BP also faced political pressure. After a disagreement with its Russian partners, the
government exerted political pressure upon BP to sell its stake in its joint venture with
TNK, a local Russian oil company. State-owned Rosneft, a large, fully integrated oil
company, then acquired the TNK-BP joint venture, originally formed to explore new
oil reserves in Siberia. 3
The legal environment captures the official outcomes of political processes as mani-
fested in laws, mandates, regulations, and court decisions—all of which can have a direct
bearing on a firm’s profit potential. In fact, regulatory changes tend to affect entire indus-
tries at once. Many industries in the United States have been deregulated over the last few
decades, including airlines, telecom, energy, and trucking, among others. In theory, remov-
ing or reducing government regulations tends to lead to new firm entry, intensified com-
petition, innovation, and higher value at lower prices for consumers. One exception to this
rule is the finance industry, where the repeal of the Glass–Steagall Act in 1999 removed
Political Economic
Sociocultural
TechnologicalEcological
Legal
Firm
Strategic Group
Industry
Global World
Global World
EXHIBIT 3.1 / The Firm Embedded in Its External Environment: Global World, PESTEL Forces, Industry, and Strategic Group
WWW.YAZDANPRESS.COMWWW.YAZDANPRESS.COM

60 CHAPTER 3 External Analysis: Industry Structure, Competitive Forces, and Strategic Groups
any separation between traditional and investment banking. This led to skewed incentives
and undue risk-taking by many of the world’s largest financial institutions, contributing
to the global financial crisis. As a political and legal response, the finance industry was
re-regulated when the Dodd–Frank Wall Street Reform and Consumer Protection Act was
signed into law in 2010.
Taken together, political/legal environments can have a direct bearing on a firm’s perfor-
mance. Governments often combine political and legal factors to achieve desired changes
in consumer behavior. For example, to induce consumers to buy zero-emission vehicles,
the U.S. government offers a $7,500 federal tax credit with the purchase of a new electric
vehicle such as the Tesla Model S. While these political/legal factors are located in the
firm’s general environment, where managers traditionally wield little influence, firms are
nevertheless becoming more proactive in their attempts to shape and influence this realm.
They do so by applying non-market strategies —that is, through lobbying, contributions,
litigation, and so on, in ways that are favorable to the firm. 4
ECONOMIC FACTORS
Economic factors in a firm’s external environment are largely macroeconomic, affecting
economy-wide phenomena. Managers need to consider how the following five macroeco-
nomic factors can affect firm strategy:
■ Growth rates
■ Interest rates
■ Levels of employment
■ Price stability (inflation and deflation)
■ Currency exchange rates
GROWTH RATES. The overall economic growth rate is a measure of the change in the
amount of goods and services produced by a nation’s economy. It indicates what stage
of the business cycle the economy is in—that is, whether business activity is expanding
(boom) or contracting (recession). In periods of economic expansion, consumer and busi-
ness demands are rising, and competition among firms frequently decreases. Basically,
the rising tide of economic growth “lifts all boats.” During these economic boom cycles,
businesses expand operations to satisfy demand and are more likely to be profitable. The
reverse is generally true for recessionary periods, although certain companies that focus
on low-cost solutions may benefit from economic contractions because demand for their
products or services rises in such times. For customers, expenditures on luxury products
are often the first to be cut during recessionary periods (for instance, you might switch
from a $4 Venti latte at Starbucks to a $2 alternative from McDonald’s).
Occasionally, boom periods can overheat and lead to speculative bubbles. Between
1995 and 2000, for example, the United States witnessed such a bubble, propelled by new
companies seeking to capture business opportunities on the Internet. The market for dot-
com companies was characterized by “irrational exuberance,” 5 with the NASDAQ stock
index peaking at its all-time high of 5,132 points on March 10, 2000. Hundreds of dot-com
businesses were founded during this time, but very few survived the burst of the bubble.
Among the survivors are today’s powerhouses of the Internet economy including Google,
Amazon, and eBay.
In the early 2000s, the United States saw yet another bubble—this time in housing. 6
Easy credit, made possible by the availability of subprime mortgages and other financial
WWW.YAZDANPRESS.COMWWW.YAZDANPRESS.COM
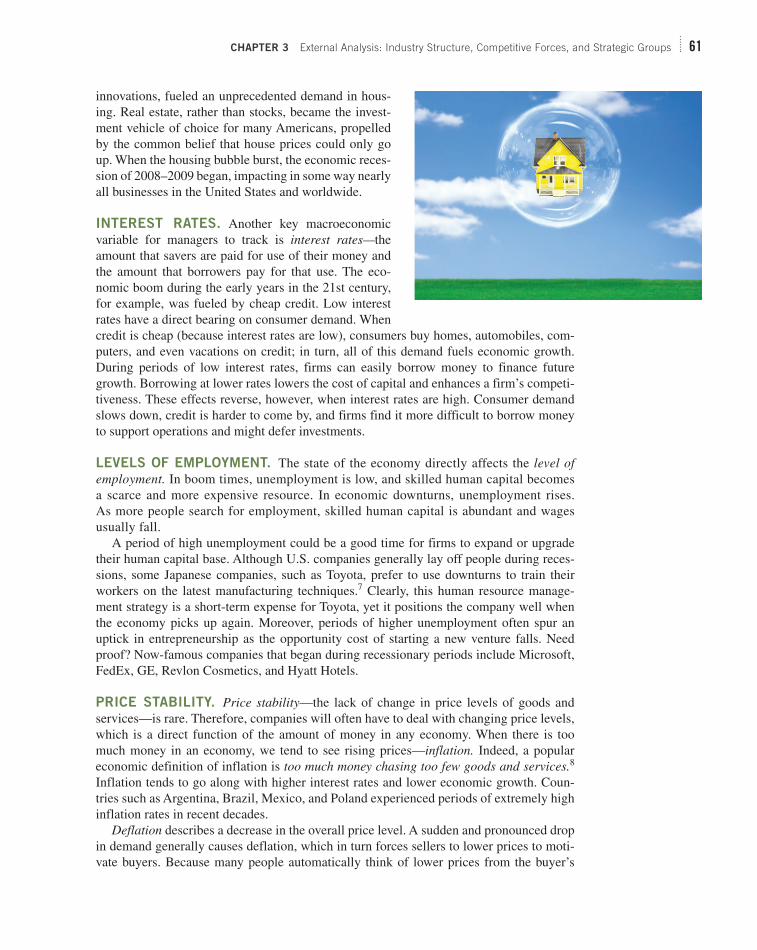
CHAPTER 3 External Analysis: Industry Structure, Competitive Forces, and Strategic Groups 61
innovations, fueled an unprecedented demand in hous-
ing. Real estate, rather than stocks, became the invest-
ment vehicle of choice for many Americans, propelled
by the common belief that house prices could only go
up. When the housing bubble burst, the economic reces-
sion of 2008–2009 began, impacting in some way nearly
all businesses in the United States and worldwide.
INTEREST RATES. Another key macroeconomic
variable for managers to track is interest rates— the
amount that savers are paid for use of their money and
the amount that borrowers pay for that use. The eco-
nomic boom during the early years in the 21 st century,
for example, was fueled by cheap credit. Low interest
rates have a direct bearing on consumer demand. When
credit is cheap (because interest rates are low), consumers buy homes, automobiles, com-
puters, and even vacations on credit; in turn, all of this demand fuels economic growth.
During periods of low interest rates, firms can easily borrow money to finance future
growth. Borrowing at lower rates lowers the cost of capital and enhances a firm’s competi-
tiveness. These effects reverse, however, when interest rates are high. Consumer demand
slows down, credit is harder to come by, and firms find it more difficult to borrow money
to support operations and might defer investments.
LEVELS OF EMPLOYMENT. The state of the economy directly affects the level of employment. In boom times, unemployment is low, and skilled human capital becomes
a scarce and more expensive resource. In economic downturns, unemployment rises.
As more people search for employment, skilled human capital is abundant and wages
usually fall.
A period of high unemployment could be a good time for firms to expand or upgrade
their human capital base. Although U.S. companies generally lay off people during reces-
sions, some Japanese companies, such as Toyota, prefer to use downturns to train their
workers on the latest manufacturing techniques. 7 Clearly, this human resource manage-
ment strategy is a short-term expense for Toyota, yet it positions the company well when
the economy picks up again. Moreover, periods of higher unemployment often spur an
uptick in entrepreneurship as the opportunity cost of starting a new venture falls. Need
proof? Now-famous companies that began during recessionary periods include Microsoft,
FedEx, GE, Revlon Cosmetics, and Hyatt Hotels.
PRICE STABILITY. Price stability —the lack of change in price levels of goods and
services—is rare. Therefore, companies will often have to deal with changing price levels,
which is a direct function of the amount of money in any economy. When there is too
much money in an economy, we tend to see rising prices— inflation. Indeed, a popular
economic definition of inflation is too much money chasing too few goods and services. 8 Inflation tends to go along with higher interest rates and lower economic growth. Coun-
tries such as Argentina, Brazil, Mexico, and Poland experienced periods of extremely high
inflation rates in recent decades.
Deflation describes a decrease in the overall price level. A sudden and pronounced drop
in demand generally causes deflation, which in turn forces sellers to lower prices to moti-
vate buyers. Because many people automatically think of lower prices from the buyer’s
WWW.YAZDANPRESS.COMWWW.YAZDANPRESS.COM

62 CHAPTER 3 External Analysis: Industry Structure, Competitive Forces, and Strategic Groups
point of view, a decreasing price level seems at first glance to be attractive. However, defla-
tion is actually a serious threat to economic growth because it distorts expectations about
the future. 9 For example, once price levels start falling, companies will not invest in new
production capacity or innovation because they expect a further decline in prices . In recent
decades, the Japanese economy has been plagued with persistent deflation.
CURRENCY EXCHANGE RATES. The currency exchange rate determines how many
dollars one must pay for a unit of foreign currency. It is a critical variable for any company
that either buys or sells products and services across national borders. If the U.S. dollar
depreciates (declines in value), for example, it takes more dollars to buy one euro, which
in turn makes European imports such as LVMH luxury accessories or BMW automobiles
more expensive for U.S. buyers. By the same token, U.S. exports such as Boeing aircraft or
John Deere tractors benefit from a weaker U.S. dollar, because it makes their products rela-
tively cheaper when exported to Europe. This process reverses when the dollar appreciates
(increases in value) against the euro. In a similar fashion, as the Chinese yuan appreciates
in value, it will make Chinese goods imported into the U.S. relatively more expensive. At
the same time, Chinese purchasing power increases, which in turn allows their businesses
to purchase more U.S. capital goods such as sophisticated machinery and other cutting-
edge technologies.
In summary, economic factors affecting businesses are ever-present and rarely static.
Managers need to fully appreciate the power of these factors, in both domestic and global
markets, in order to assess their effects on firm performance. Strategy Highlight 3.1 shows
how the European debt crisis—an external economic factor—is hurting large and small
companies alike across the globe.
How the Eurozone Crisis Is Hurting
Companies
In the wake of the recent global financial crisis (2008–2012), the European sovereign-debt crisis has taken center stage. It is negatively affecting companies across the globe. What is the Eurozone crisis, and how does it affect business? The euro is the common currency used by 17 of the 27 member states of the European Union (EU), an economic and political union of more than 500 mil-lion people. In the 1950s, in response to extreme forms of nationalism and the resulting world wars that had devas-tated the continent, the first steps were taken to create a supra-national EU. Heavy industries such as coal and steel became economically integrated. In 1992, after almost 40 years of continued economic integration, peace, and prosperity, the European leaders initiated further steps toward political and economic integration. In 1999, the
euro was introduced as a common currency and a single EU market was created, allowing for free movements of people and capital, as well as goods and services. At the time, the vision was to create a “United States of Europe” with far-reaching economic and political integration to subsume individual nation states.
Although the euro is a common currency administered by the European Central Bank (ECB), the EU does not have budgetary authority. Each nation state runs its own fis-cal budget. By 2009, it was clear that several European countries had taken on too much debt and were unable to repay their credit obligations. Borrowing costs and inter-est rates for the most indebted countries (Portugal, Italy, Ireland, Greece, and Spain—combined under the unfortu-nate moniker PIIGS) skyrocketed. With the risk of sovereign countries defaulting on their debts, investors panicked. Moreover, if one or more of the indebted countries were to be forced out of the Eurozone, they would likely fall
3.1
WWW.YAZDANPRESS.COMWWW.YAZDANPRESS.COM
CHAPTER 3 External Analysis: Industry Structure, Competitive Forces, and Strategic Groups 63
into economic isolation and decline. The combined effect of the unpaid loans and economic decline could lead to a collapse of the banking system, not only in Europe but also with repercussions in the United States due to the interdependencies of world finance.
Because the euro is a common currency, the affected countries could no longer devalue their own currencies in order to improve competitiveness. To get a handle on the budget deficit, European countries, with help from the International Monetary Fund (IMF), enacted strict austerity programs. As government budgets tightened, public sector workers such as teachers and police were laid off, public services were cut drastically, and pensions were renego-tiated. Tightened capital markets made it difficult, if not impossible, for private sector companies to finance their continued operations. In the deep recession that followed, demand for goods and services collapsed, and some coun-tries faced depression-like unemployment figures. In most EU countries, unemployment has been persistently above 10 percent in recent years; in Spain and Greece, that num-ber rose to above 20 percent. Youth unemployment (for
those under 25) in Spain soared to over 50 percent. It is not uncommon to see Spanish medical doctors working in low-level nursing home jobs in Germany.
When banks are not providing credit to companies, their continued operation is threatened and recession deepens. Major European airlines such as Air France rely on debt financing to purchase new aircraft. However, due to the current credit crunch, European orders for Airbus, Boeing, and Embraer (a Brazilian aerospace company) have collapsed. Even companies located as far away as China have been hurt by the Eurozone crisis as their European orders for goods ranging from sneakers and toys to scooters and electronics have evaporated. The credit crunch has also had a negative impact on the majority of small and medium-sized enterprises in Europe, which find it difficult to obtain bank loans. This situation is particularly harmful because most of the firms are private and rely on debt rather than equity financing. As we can see, the macroeconomic effects of the Eurozone crisis have significant microeconomic consequences. 11
SOCIOCULTURAL FACTORS
Sociocultural factors capture a society’s cultures, norms, and values. Because sociocul-
tural forces not only are constantly in flux but also differ across groups, managers need to
closely monitor such trends and consider the implications for firm strategy. In recent years,
for example, a growing number of U.S. consumers have become more health-conscious
about what they eat. This trend led to a boom for businesses such as Subway and Whole
Foods. At the same time, traditional fast-food companies such as McDonald’s and Burger
King, along with grocery chains such as Albertsons and Kroger, have all had to scramble to
provide healthier choices in their product offerings.
Demographic trends are also important sociocultural forces. These trends capture
population characteristics related to age, gender, family size, ethnicity, sexual orientation,
religion, and socioeconomic class. Like other sociocultural factors, demographic trends
present opportunities but can also pose threats. The most recent U.S. census revealed that
51 million Americans (16.4 percent of the total population) are Hispanic. It is now the
second-largest ethnic group in the United States, and growing fast. On average, Hispanics
are also younger and their incomes are climbing quickly. This trend is not lost on compa-
nies trying to benefit from this opportunity. For example, MundoFox and ESPN Deportes
(specializing in soccer) have joined Univision and NBC’s Telemundo in the Spanish-
language television market. In the United States, Univision is now the fifth most popular
network overall, just behind the four major English-language networks (ABC, NBC, CBS,
and Fox). Likewise, advertisers are pouring dollars into the Spanish-language networks to
promote their products and services. 10
WWW.YAZDANPRESS.COMWWW.YAZDANPRESS.COM

64 CHAPTER 3 External Analysis: Industry Structure, Competitive Forces, and Strategic Groups
TECHNOLOGICAL FACTORS
Technological factors capture the application of knowledge to create new processes and
products. Recent innovations in process technology include lean manufacturing, Six
Sigma quality, and biotechnology. The nanotechnology revolution, which is just begin-
ning, promises major upheaval for a vast array of industries ranging from tiny medical
devices to new-age materials for earthquake-resistant buildings. 12 Recent product innova-
tions include the smartphone, computer tablets, and high-performing electric cars such
as the Tesla Roadster. Recent service innovations include social media and online search
engines. If one thing seems certain, technological progress is relentless and seems to be
picking up speed over time. 13 Not surprisingly, changes in the technological environment
bring both opportunities and threats for companies.
Let’s think about the rapid progress in mobile computing. BlackBerry, once an undis-
puted leader in the smartphone industry, did not recognize early enough or act upon
changes in the external environment. Consumer preferences changed quickly as the iPhone
and later the iPad became available. Professionals brought their own Apple devices to
work instead of using company-issued BlackBerrys. Although the Canadian technology
company made a valiant effort to make up lost ground with its new BlackBerry 10 operat-
ing system and several new models, it was too little, too late. Given the importance of a
firm’s innovation strategy to competitive advantage, we discuss the effect of technological
factors in greater detail in Chapter 7.
ECOLOGICAL FACTORS
Ecological factors concern broad environmental issues such as the natural environment,
global warming, and sustainable economic growth. Organizations and the natural environ-
ment coexist in an interdependent relationship. Managing these relationships in a responsi-
ble and sustainable way directly influences the continued existence of human societies and
the organizations we create. Managers can no longer separate the natural and the business
worlds; they are inextricably linked. 14
Business organizations have contributed to the pollution of air, water, and land, as well
as depletion of the world’s natural resources. BP’s infamous oil spill in the Gulf of Mexico
destroyed fauna and flora along the U.S. shoreline from Texas to Florida. This disaster led
to a decrease in fish and wildlife populations, triggered a decline in the fishery and tourism
industries, and threatened the livelihood of thousands of people. It also cost BP more than
$40 billion and one half of its market value (see Strategy Highlight 1.2).
The relationship between organizations and the natural environment does not necessar-
ily need to be in conflict, however. Ecological factors can also provide business opportu-
nities. As we saw in ChapterCase 3, Tesla Motors is addressing environmental concerns
regarding the carbon emissions of gasoline-powered cars by building zero-emission
battery-powered vehicles. The question of how to generate the power needed to charge the
batteries in a sustainable way, however, still needs to be addressed.
3.2 Industry Structure and Firm Strategy:
The Five Forces Model
We now move one step closer to the firm (in the center of Exhibit 3.1 ) and come to the
industry in which it competes. An industry is a group of (incumbent) companies that face
more or less the same set of suppliers and buyers. Firms competing in the same industry
tend to offer similar products or services to meet specific customer needs. Although the
LO 3-2
Apply Porter’s five competitive forces to explain the profit potential of different industries.
WWW.YAZDANPRESS.COMWWW.YAZDANPRESS.COM

CHAPTER 3 External Analysis: Industry Structure, Competitive Forces, and Strategic Groups 65
PESTEL framework allows us to scan, monitor, and evaluate the external environment
to identify opportunities and threats, industry analysis provides a more rigorous basis
not only to identify an industry’s profit potential (the level of profitability that can be
expected for the average firm), but also to derive implications for one firm’s strategic posi-
tion within an industry. A firm’s strategic position relates to its ability to create value for
customers ( V ) while containing the cost to do so ( C ). Competitive advantage flows to the
firm that is able to create as large a gap as possible between the value the firm’s product or
service generates and the cost required to produce it ( V 2 C ).
Michael Porter developed the highly influential five forces model to help managers
understand the profit potential of different industries and how they can position their
respective firms to gain and sustain competitive advantage. 15 By combining theory from
industrial organization economics with hundreds of detailed case studies, Porter derived
two key insights that form the basis of his seminal five forces model:
1. Rather than defining competition narrowly as the firm’s closest competitors to explain
and predict a firm’s performance, competition must be viewed more broadly to encom-
pass not only direct rivals but also a set of other forces in an industry: buyers, suppliers,
potential new entry of other firms, and the threat of substitutes.
2. The profit potential of an industry is neither random nor entirely determined by industry-
specific factors. Rather, it is a function of the five forces that shape competition: threat of entry, power of suppliers, power of buyers, threat of substitutes, and rivalry among existing firms.
COMPETITION IN THE FIVE FORCES MODEL
The first major insight this model provides is the fact that while a firm’s ability to create
as large a gap as possible between the value ( V ) the firm’s product or service gener-
ates and the cost ( C ) to produce it is essential to create economic value ( V 2 C ), the
firm must also be able to capture a significant share of it to gain and sustain competi-
tive advantage. What does this mean? In Porter’s five forces model, competition is not defined narrowly as the firm’s closest competitors (e.g., Nike versus Under Armour,
Amazon versus Netflix, Merck versus Pfizer, and so on) but rather more broadly to
include other forces in an industry: buyers, suppliers, potential new entry of other firms,
and the threat of substitutes. Competition describes the tug-of-war between these forces
to capture as much as possible of the economic value created in an industry. The focal
firm’s managers, therefore, must be concerned not only about the intensity of rivalry
among direct competitors, but also about the strength of the other competitive forces
that are attempting to extract part or all of the economic value the firm creates. When
faced with competition in this broader sense, strategy explains how a firm is able to
achieve superior performance. The airline industry provides an illustrative example in
Strategy Highlight 3.2. 16
industry A group of (incumbent) companies that face more or less the same set of suppliers and buyers; these firms tend to offer similar products or services to meet specific customer needs.
industry analysis A method to (1) identify an industry’s profit potential and (2) derive implications for a firm’s strategic position within an industry.
strategic position A firm’s strategic profile based on value creation and cost. The goal is to generate as large a gap as possible between the value the firm’s product or service creates and the cost required to produce it ( V 2 C ).
five forces model
A framework developed by Michael Porter that identifies five forces that determine the profit potential of an industry and shape a firm’s competitive strategy.
WWW.YAZDANPRESS.COMWWW.YAZDANPRESS.COM

66 CHAPTER 3 External Analysis: Industry Structure, Competitive Forces, and Strategic Groups
The Five Forces in the Airline Industry
Although many of the mega airlines such as American, Delta, and United have lost billions of dollars over the last few decades and continue to struggle to make a profit, other players in this industry have been quite profitable because they were able to extract some of the value cre-ated. The nature of rivalry among airlines is incredibly intense, as consumers primarily make decisions based on price. In inflation-adjusted dollars, ticket prices have been falling since industry deregulation in 1978. Thanks to Internet travel sites such as Orbitz, Travelocity, and Kayak, price comparisons are effortless. Consumers benefit from cut-throat price competition between carriers and capture significant value. Low switching costs and nearly perfect information combine to strengthen buyer power. More-over, large corporate customers such as McKinsey or IBM, which contract with airlines to serve all of their employ-ees’ travel needs, are rather powerful buyers and further reduce profit margins for air carriers.
Entry barriers are relatively low, resulting in a num-ber of new airlines popping up. To enter the industry (on a small scale, serving a few select cities), a prospective new entrant needs only a couple of airplanes which can be rented, a few pilots and crew members, some routes connecting city pairs, and gate access in airports. Indeed, despite notoriously low industry profitability, Virgin Amer-ica entered the U.S. market in 2007. Virgin America is the brainchild of Sir Richard Branson, founder and chairman of the Virgin Group, a UK conglomerate of hundreds of companies using the Virgin brand, including the interna-tional airline Virgin Atlantic. Its business strategy is to
offer low-cost service between major metropolitan cities on the American East and West Coasts.
In the airline industry, the supplier power is also strong. The providers of airframes (e.g., Boeing or Airbus), makers of aircraft engines (e.g., GE or Rolls-Royce), air-craft maintenance companies (e.g., Goodrich), caterers (e.g., Marriott), labor unions, and airports controlling gate access all bargain away the profitability of airlines.
To make matters worse, substitutes are also readily available: If prices are seen as too high, customers can drive their cars or use the train or bus. As an example, the route between Atlanta and Orlando (roughly 400 miles) used to be one of the busiest and most profitable ones for Delta. Given the increasing security delays at airports, more and more people now prefer to drive. Taken together, the competitive forces are quite unfavorable for gener-ating a profit potential in the airline industry: low entry barriers, high supplier power, high buyer power combined with low customer switching costs, and the availability of low-cost substitutes. This type of hostile environment leads to intense rivalry among existing airlines and low overall industry profit potential.
As we have seen, despite all this, the surprise finding is that while the mega airlines themselves (i.e., American, Delta, and United) frequently struggle to make a profit, the other players in the industry—such as the suppliers of aircraft engines, aircraft maintenance companies, IT com-panies providing reservation and logistics services, cater-ers, airports, and so on—are actually quite profitable, all extracting significant value from the air transportation industry. 17 Customers also are better off, as ticket prices have decreased and travel choices increased.
3.2
The air transportation industry in the Strategy Highlight 3.2 example shows that the
five forces framework is a powerful and versatile tool to analyze industries because it
takes a broader perspective and enables managers to evaluate fundamental forces beyond
direct rivalry that shape firm-level performance outcomes. The five forces model allows
managers to analyze all players using a wider industry lens, which in turn enables a deeper
understanding of an industry’s profit potential. Moreover, a five forces analysis provides
the basis for how a firm should position itself to gain and sustain a competitive advantage.
We are now ready to take a closer look at each of the five competitive forces.
The five forces model enables managers to not only understand their industry environ-
ment but also shape their firm’s strategy. As a rule of thumb, the stronger the five forces, the lower the industry’s profit potential —making the industry less attractive for competi-
tors. The reverse is also true: the weaker the five forces, the greater the industry’s profit
WWW.YAZDANPRESS.COMWWW.YAZDANPRESS.COM

CHAPTER 3 External Analysis: Industry Structure, Competitive Forces, and Strategic Groups 67
potential —making the industry more attractive. Therefore, from the perspective of a man-
ager of an existing (incumbent) firm competing for advantage in an established industry,
the company should be positioned in a way that relaxes the constraints of strong forces and
leverages weak forces. The goal of crafting a strategic position is of course to improve the
firm’s ability to achieve a competitive advantage.
We next discuss each of the five competitive forces in detail, and will take up the
topic of competitive positioning in Chapter 6 when studying business-level strategy. As
Exhibit 3.2 shows, Porter’s model identifies five key competitive forces that managers
need to consider when analyzing the industry environment and formulating competitive
strategy:
1. Threat of entry
2. Power of suppliers
3. Power of buyers
4. Threat of substitutes
5. Rivalry among existing competitors
THE THREAT OF ENTRY
The threat of entry describes the risk that potential competitors will enter the industry.
Potential new entry depresses industry profit potential in two major ways.
First, with the threat of additional capacity coming into an industry, incumbent firms
may lower prices to make entry appear less attractive to the potential new competitors,
which would in turn reduce the overall industry’s profit potential, especially in industries
with slow or no overall growth in demand. For example, demand for new microwaves is
more or less constrained by the replacement rate for older models and how many new
households are created. Since this market grows slowly, if at all, any additional entry
would likely lead to excess capacity and lower prices overall.
threat of entry The risk that potential competitors will enter an industry.
Rivalry
among
Existing
Competitors
Bargaining Power
of Suppliers
Bargaining
Power of Buyers
Threat of New
Entrants
Threat of Substitute
Products or Services
EXHIBIT 3.2 / Porter’s Five Forces Model SOURCE: Michael E. Porter, “The five competitive forces that shape strategy,” Harvard Business Review, January 2008.
WWW.YAZDANPRESS.COMWWW.YAZDANPRESS.COM

68 CHAPTER 3 External Analysis: Industry Structure, Competitive Forces, and Strategic Groups
Second, the threat of entry by additional competitors may force incumbent firms to
spend more to satisfy their existing customers. Larger investments in value creation further
reduce an industry’s profit potential if prices cannot be raised. For example, entry barriers
to specialty coffee retailing are relatively low, which explains the large number of smaller,
regional chains such as Peet’s Coffee (with less than 200 stores, mostly on the West Coast)
and a few smaller national players such as Caribou Coffee (with 415 stores throughout
most of the United States). Low entry barriers in turn force large incumbent firms such
as Starbucks (with over 13,000 stores in the U.S.) to constantly spend more money on
upgrading the ambience and service offerings in their stores. While this raises the value of
Starbucks’ offering in the eyes of the consumers, it lowers the company’s profit margin.
Rather than lowering prices, Starbucks has chosen to constantly upgrade and refresh its
stores and service offerings to prevent others from entering the industry or from rapidly
expanding (i.e., moving beyond a small niche competitor like Peet’s to become a national
competitor like Caribou Coffee). In terms of existing national competitors, Starbucks also
attempts to prevent the smaller entities from becoming larger, because this would increase
competitive rivalry and erode industry profit potential.
Of course, the more profitable an industry, the more attractive it is for new competitors
to enter. There are, however, a number of important barriers to entry that raise the costs
for potential competitors, which reduces the threat of entry. Entry barriers , which are
advantageous for incumbent firms, are obstacles that determine how easily a firm can enter
an industry. Incumbent firms can benefit from several important sources of entry barriers:
■ Economies of scale
■ Network effects
■ Customer switching costs
■ Capital requirements
■ Advantages independent of size
■ Government policy
■ Credible threat of retaliation
ECONOMIES OF SCALE. Economies of scale are cost advantages that accrue for firms
with larger output because they can spread fixed costs over more units, can employ tech-
nology more efficiently, can benefit from a more specialized division of labor, and can
demand better terms from their suppliers. These factors in turn drive down the cost per
unit, allowing large incumbent firms to enjoy a cost advantage over new entrants who can-
not muster such scale.
Take the example of the car industry in ChapterCase 3. Entry barriers into the broad auto-
mobile industry seem almost insurmountable because of the need for large-scale produc-
tion in order to be efficient. Many industry analysts argue that to be viable, a car company
must be able to produce and sell some 5 million cars per year. 18 This fact explains in part
why Fiat, an Italian carmaker selling an estimated 2.5 million vehicles per year, purchased
a majority of the shares in Chrysler, selling less than 2 million vehicles per year. Given
the industry structure in the automobile business, entering the auto manufacturing industry
doesn’t seem advisable. Yet Tesla Motors is joining the fray. How can it sidestep such insur-
mountable entry barriers? The answer: technology. Rather than attempting to compete head-
on in internal combustion engines, Tesla Motors is entering the all-electric car segment, a
much less crowded niche in the overall car industry. Expanding its product lineup beyond
the Roadster (over $100K sticker price) by offering a seven-seat family sedan (Model S,
roughly $50K) with a much broader customer appeal, Tesla is hoping to benefit from econo-
mies of scale in this market niche.
entry barriers
Obstacles that determine how easily a firm can enter an industry. Entry barriers are often one of the most significant predictors of industry profit potential.
WWW.YAZDANPRESS.COMWWW.YAZDANPRESS.COM

CHAPTER 3 External Analysis: Industry Structure, Competitive Forces, and Strategic Groups 69
New entry into the automotive industry, even in niche segments, has significant compet-
itive implications for the existing firms within the industry. Competitive intensity increases
when new firms such as Tesla Motors enter the industry. Incumbent firms such as GM and
Nissan are responding to the new entrants by introducing innovations of their own, such as
the Chevy Volt (a plug-in hybrid) and the Nissan Leaf (an all-electric car). Consumers are
likely to benefit from an increase in competitive intensity if more innovative and efficient
electric cars are introduced with lower prices. Only time will tell if these new entrants will
mature to become full-fledged industrial enterprises and be strong enough to push some
incumbents out of the industry, or whether they themselves will vanish.
NETWORK EFFECTS. The threat of potential entry
is reduced when network effects are present. Network effects describe the positive effect that one user of a
product or service has on the value of that product or
service for other users. When network effects are pres-
ent, the value of the product or service increases with
the number of users.
For example, customers of online auctions are
attracted to eBay because they can benefit from net-
work effects. With more than 100 million active users,
buyers are more likely to find the item they are look-
ing for on eBay, while at the same time sellers are
more likely to find buyers for the items they are offer-
ing. The ability to create markets where supply and
demand will clear (where quantity supplied and quan-
tity demanded are equal) is a positive function of the number of users. Having secured a
larger number of users, network effects give eBay an advantage over any potential new
entrant. In a similar fashion, Facebook, with over one billion active users worldwide,
enjoys tremendous network effects, making it difficult for new entrants such as Google
Plus to compete effectively. We will discuss network effects in more detail in Chapter 7.
CUSTOMER SWITCHING COSTS. Switching costs are incurred by moving from one
supplier to another. Changing vendors may require the buyer to alter product specifica-
tions, retrain employees, and/or modify existing processes. Switching costs are therefore
one-time sunk costs, which can be quite significant and a formidable barrier to entry.
For example, when a firm has been using enterprise resource planning (ERP) software
from SAP for many years, it will incur significant switching costs when implementing
a new ERP system from Oracle. Likewise, switching from using a PC with a Microsoft
Windows operating system to a Mac with Apple iOS will require many hours of learning the
new operating system and software applications. Since Apple has been the smaller player
in the PC market for many decades, it invested much more to entice users to switch from
Microsoft Windows to Apple iOS than the other way around. Lowering customer switching
costs allowed Apple to gain market share at the expense of Microsoft and PC makers such
as Dell and HP. In a similar fashion, the threat of potential new entry is high when customer
switching costs are low. When entering the smartphone market with its iPhone, Apple was
able to lower switching costs with an intuitive interface and user-friendly design.
CAPITAL REQUIREMENTS. Capital requirements describe the “price of the entry
ticket” into a new industry. How much capital is required to compete in this industry, and
which companies are willing and able to make such investments? Frequently related to
WWW.YAZDANPRESS.COMWWW.YAZDANPRESS.COM

70 CHAPTER 3 External Analysis: Industry Structure, Competitive Forces, and Strategic Groups
economies of scale, capital requirements may encompass investments to set up plants with
dedicated machinery, run a production process, and cover start-up losses.
In the aircraft manufacturing industry, at least for large commercial jets, Boeing and
Airbus are the only competitors. There is not a significant threat of entry because entering
the airframe manufacturing industry requires huge capital investments. In fact, Airbus was
only able to overcome these tremendous barriers to entry with the help of direct subsidies
from several European governments including France, Germany, Spain, and the UK.
In such cases, the likelihood of entry is determined by not only the level of capital
investment required to enter the industry, but also the expected return on investment. The
potential new entrant must carefully weigh the required capital investments, the cost of
financing, and the expected return.
For example, in the southeastern United States, TV cable company Comcast has entered
the business for residential and commercial telephone services and Internet connectivity
(as an ISP, Internet service provider), emerging as a direct competitor for AT&T. Comcast
also acquired NBC Universal, combining delivery and content. AT&T responded to Com-
cast’s threat by introducing U-verse, a product combining high-speed Internet access with
cable TV and telephone service, all provided over its super-fast fiber-optic network.
Taken together, the threat of entry is high when capital requirements are low in com-
parison to the expected returns. If an industry is attractive enough, efficient capital markets
are likely to provide the necessary funding to enter an industry. Capital, unlike propri-
etary technology and industry-specific know-how, is a resource that can be relatively easily
acquired in the face of attractive returns.
ADVANTAGES INDEPENDENT OF SIZE. Incumbent firms often possess cost and
quality advantages that are independent of size. These advantages can be based on brand
loyalty, proprietary technology, preferential access to raw materials and/or distribution
channels, favorable geographic locations, and cumulative learning and experience effects.
Apple’s Mac-brand customers are among the most loyal product fans. New entrants will
have great difficulty attracting Mac users to their computer products, because Mac fans
seem to have a personal identification and bond with the products that goes beyond the
product features.
Patents and trade secrets, such as the original Coke formula, are examples of propri-
etary technology and know-how that can also reduce the threat of entry. The value of trade
secrets to a firm is reflected in the efforts to improve cyber-security so that trade secrets
cannot be stolen by hacking into corporate computers.
Preferential access to raw materials such as diamond mines can bestow absolute cost
advantages on incumbent companies. For many decades, De Beers, a global diamond min-
ing and trading company, held a virtual monopoly in both access to diamond mines and
the distribution channels in the diamond trade, which in turn reduced the threat of entry.
Favorable locations, such as Silicon Valley for software companies, often present advan-
tages that other locales cannot match easily, such as access to human and venture capital,
as well as world-class research and engineering institutions.
Finally, incumbent firms often benefit from cumulative learning and experience effects
accrued over long periods of time. Leading industrial engineering companies such as
Siemens and GE have many decades of experience in solving the toughest engineering
problems. Attempting to obtain such deep knowledge within a shorter time frame is often
costly, if not impossible, which in turn constitutes a formidable barrier to entry.
GOVERNMENT POLICY. Frequently government policies restrict or prevent new
entrants. Until recently, India did not allow foreign retailers such as Walmart or IKEA
to own stores and compete with domestic companies, in order to protect the country’s
WWW.YAZDANPRESS.COMWWW.YAZDANPRESS.COM

CHAPTER 3 External Analysis: Industry Structure, Competitive Forces, and Strategic Groups 71
millions of small vendors and wholesalers. China frequently requires foreign companies to
enter joint ventures with domestic ones and to share technology. In the U.S., many states
have restrictive licensing policies that limit the sale of liquor. City agencies such as the
New York City Taxi and Limousine Commission severely limit operating licenses, thereby
preventing entry into an industry with otherwise low entry barriers.
In contrast, deregulations in industries such as airlines, telecommunications, and truck-
ing have generated significant new entries. Therefore, the threat of entry is high when
restrictive government policies do not exist, or when industries become deregulated.
CREDIBLE THREAT OF RETALIATION. Potential new entrants must also anticipate
how incumbent firms will react. A credible threat of retaliation by incumbent firms often
deters entry. Should entry still occur, however, incumbents are able to retaliate quickly,
through initiating a price war, for example. The industry profit potential can in this case
easily fall below the cost of capital. Incumbents with deeper pockets than new entrants are
able to withstand price competition for a longer time and wait for the new entrants to exit
the industry—then raise prices again. Other weapons of retaliation include increased prod-
uct and service innovation, advertising, sales promotions, and litigation.
Potential new entrants should expect a strong and vigorous response beyond price com-
petition by incumbent firms in several scenarios: if the current competitors have made
large-scale specific investments that are of little use in other industries; unused excess
capacity; substantial resources; reputational clout with industry suppliers and buyers; and
a history of vigorous retaliation during earlier entry attempts. Moreover, if industry growth
is slow or stagnant, incumbents are more likely to retaliate against new entrants in order
to protect their market share, often initiating a price war with the goal of driving out these
new entrants. In contrast, the threat of entry is high when new entrants expect that incum-
bents will not or cannot retaliate.
THE POWER OF SUPPLIERS
The bargaining power of suppliers captures pressures that industry suppliers can exert on
an industry’s profit potential. This force reduces a firm’s ability to obtain superior perfor-
mance for two reasons: powerful suppliers can raise the cost of production by demanding
higher prices for their inputs, or by reducing the quality of the input factor or service level
delivered. Powerful suppliers are a threat to firms because they reduce the industry’s profit
potential by capturing part of the economic value created.
To compete effectively, companies generally need a wide variety of inputs into the pro-
duction process, including raw materials and components, labor (may be individuals or
labor unions, when the industry faces collective bargaining), and services. The relative
bargaining power of suppliers is high when:
■ The suppliers’ industry is more concentrated than the industry it sells to.
■ Suppliers do not depend heavily on the industry for a large portion of their revenues.
■ Incumbent firms face significant switching costs when changing suppliers.
■ Suppliers offer products that are differentiated.
■ There are no readily available substitutes for the products or services that the suppliers
offer.
■ Suppliers can credibly threaten to forward integrate into the industry.
In Strategy Highlight 3.2, we briefly mentioned that the airline industry faces strong
supplier power. Let’s take a closer look at one important supplier group to this indus-
try: Boeing and Airbus, the makers of large commercial jets. Many of the factors that
WWW.YAZDANPRESS.COMWWW.YAZDANPRESS.COM

72 CHAPTER 3 External Analysis: Industry Structure, Competitive Forces, and Strategic Groups
determine supplier power are strong, while some are moderate. The reason why airframe
manufacturers are powerful suppliers to airlines is because their industry is much more
concentrated (only two firms) than the industry it sells to (there are hundreds of com-
mercial airlines across the world). Given the trend of large airlines merging to create even
larger mega-airlines, however, increasing buyer power may eventually balance this out
a bit. Nonetheless, the airlines face non-trivial switching costs when changing suppliers
(from Boeing to Airbus, or vice versa) because pilots and crew would need to be retrained
to fly a new type of aircraft, maintenance capabilities would need to be expanded, and
some routes may even need to be reconfigured due to differences in aircraft range and pas-
senger capacity. Moreover, while some of the aircraft can be used as substitutes, Boeing
and Airbus offer differentiated products. This fact becomes clearer when considering the
most recent models from each company. Boeing introduced the 787 Dreamliner to capture
long-distance point-to-point travel (close to 8,000-mile range, sufficient to fly non-stop
from Los Angeles to Sydney), while Airbus introduced the A-380 Superjumbo to focus
on high-volume transportation (close to 900 passengers) between major airport hubs (e.g.,
Tokyo’s Haneda Airport and Singapore’s International Airport). When considering long-
distance travel, there are no readily available substitutes for commercial airliners, a fact
that strengthens supplier power.
All in all, the vast strengths of these factors lead us to conclude that the supplier power
of commercial aircraft manufacturers is quite significant. This puts Boeing and Airbus in a
strong position to extract profits from the airline industry, thus reducing the profit potential
of the airlines themselves.
Although the supplier power of Boeing and Airbus is strong, three factors moderate
their bargaining positions somewhat. First, the suppliers of commercial airliners depend
heavily on commercial airlines for their revenues. Second, Boeing and Airbus are unlikely
to threaten forward integration and become commercial airlines themselves. Finally,
industry structures are not static, but can change over time. In the last few years, several
of the remaining large domestic U.S. airlines have merged (Delta and Northwest, United
and Continental, and American and U.S. Airways), which changed the industry structure in
their favor. There are now fewer but even larger airlines remaining. This fact increases their
buyer power, which we turn to next.
THE POWER OF BUYERS
In many ways, the bargaining power of buyers is the flip side of the bargaining power
of suppliers. Buyers are the customers of an industry. The power of buyers concerns the
pressure an industry’s customers can put on the producer’s margins in the industry by
demanding a lower price or higher product quality. When buyers successfully obtain price
discounts, it reduces a firm’s top line (revenue). When buyers demand higher quality and
more service, it generally raises production costs. Strong buyers can therefore reduce
industry profit potential and with it, a firm’s profitability. Powerful buyers are a threat to
the producing firms because they reduce the industry’s profit potential by capturing part of
the economic value created.
As with suppliers, an industry may face many different types of buyers. The buyers of
an industry’s product or service may be individual consumers—like you or me when we
decide which provider we want to use for our wireless devices. In many areas, you can
choose between several providers such as AT&T, Sprint, or Verizon. Although we might
be able to play different providers against one another when carefully comparing their
individual service plans, as individual consumers we generally do not have significant
buyer power. On the other hand, large institutions such as businesses or universities have
WWW.YAZDANPRESS.COMWWW.YAZDANPRESS.COM

CHAPTER 3 External Analysis: Industry Structure, Competitive Forces, and Strategic Groups 73
significant buyer power when deciding which provider to use for their wireless services,
because they are able to sign up or move several thousand employees at once.
The power of buyers is high when:
■ There are a few buyers and each buyer purchases large quantities relative to the size of
a single seller.
■ The industry’s products are standardized or undifferentiated commodities.
■ Buyers face low or no switching costs.
■ Buyers can credibly threaten to backwardly integrate into the industry.
In addition, companies need to be aware of situations when buyers are especially price
sensitive. This is the case when:
■ The buyer’s purchase represents a significant fraction of its cost structure or procure-
ment budget.
■ Buyers earn low profits or are strapped for cash.
■ The quality (cost) of the buyers’ products and services is not affected much by the
quality (cost) of their inputs.
For instance, Google faces strong buyer power from Samsung because Samsung prod-
ucts account for 40 percent of Google’s Android operating system use in smartphones
and roughly 30 percent in tablets (in 2012). Google benefits from Samsung’s strong per-
formance, allowing the Android operating system to capture more than 70 percent mar-
ket share in smartphones. This large installed base of mobile operating systems enables
Google to capture revenues from use of its search engine. However, leveraging its buyer
power, Samsung is now demanding a larger share of revenues from Google’s online
searches, and may also demand specialized Google apps designed for Samsung smart-
phones exclusively. 19
The retail giant Walmart provides perhaps the most potent example of tremendous buyer
power. Walmart is not only the largest retailer worldwide (with over 10,000 stores and
2.2 million employees); it is also one of the largest companies in the world (with roughly
$450 billion in revenues in 2012). Walmart is one of few large big-box global retail chains
and frequently purchases large quantities from its suppliers. Walmart
leverages its buyer power by exerting tremendous pressure on its suppliers
to lower prices and to increase quality or risk losing access to shelf space
at the largest retailer in the world. Walmart’s buyer power is so strong that
many suppliers co-locate offices directly next to Walmart’s headquarters
in Bentonville, Arkansas, because such proximity enables Walmart’s man-
agers to test the supplier’s latest products and negotiate prices.
The bargaining power of buyers also increases when their switching
costs are low. Having multiple suppliers of a product category located
close to its headquarters allows Walmart to demand further price cuts and
quality improvements because it can easily switch from one supplier to
the next. This threat is even more pronounced if the products are non-
differentiated commodities from the consumers’ perspective. For exam-
ple, Walmart can easily switch from Rubbermaid plastic containers to
Sterlite containers by offering more shelf space to the producer that offers
the greatest price cut or quality improvement.
Buyers are also powerful when they can credibly threaten backward
integration. Backward integration occurs when a buyer moves upstream in
the industry value chain, into the seller’s business. Walmart has exercised
WWW.YAZDANPRESS.COMWWW.YAZDANPRESS.COM

74 CHAPTER 3 External Analysis: Industry Structure, Competitive Forces, and Strategic Groups
the threat to backward integrate by producing a number of products as private-label brands
such as Equate health and beauty items, Ol’Roy dog food, and Parent’s Choice baby prod-
ucts. This situation is also observed in the auto-component supply industry, in which car
manufacturers such as GM, Toyota, or Volkswagen have the capability to backward-inte-
grate in order to produce their components in-house if their demands for lower prices and
higher product quality are not met by their suppliers. Taken together, powerful buyers have
the ability to extract a significant amount of the value created in the industry, leaving little
or nothing for producers.
In regard to any of the five forces that shape competition, it is important to note that
their relative strengths are context-dependent. For example, the Mexican multinational
CEMEX, one of the world’s leading cement producers, faces very different buyer power in
the U.S. versus in its domestic market. Cement is an undifferentiated commodity product.
In the U.S., cement buyers consist of a few large and powerful construction companies that
account for a significant percentage of CEMEX’s output. This results in razor-thin margins
in the U.S. In contrast, the vast majority of CEMEX’s customers in its Mexican home mar-
ket are numerous, small, individual customers facing a few large suppliers, with CEMEX
being the biggest. Not surprisingly, CEMEX earns high profit margins in its home market.
This example provides the context to show that CEMEX actually competes in two different
industry conditions (albeit offering the same product), because it faces two very different
competitive forces in the U.S. and Mexico.
THE THREAT OF SUBSTITUTES
Substitutes meet the same basic customer needs as the industry’s product but in a different
way. The threat of substitutes is the idea that products or services available from outside the given industry will come close to meeting the needs of current customers. 20 For example,
many software products are substitutes to professional services, at least at the lower end.
Tax preparation software such as Intuit’s TurboTax is a substitute for professional services
offered by H&R Block and others. Legal Zoom, an online legal documentation service, is
a threat to professional law firms. Other examples of substitutes are energy drinks versus
coffee, videoconferencing versus business travel, e-mail versus express mail, gasoline ver-
sus biofuel, and wireless telephone services versus Voice over Internet Protocol (VoIP),
offered by Skype or Vonage.
A high threat of substitutes reduces industry profit potential by limiting the price the
industry’s competitors can charge for their products and services. The threat of substitutes
is high when:
■ The substitute offers an attractive price-performance trade-off.
■ The buyer’s cost of switching to the substitute is low.
The movie rental company Redbox, which uses over 42,000 kiosks in the U.S. to make
movie rentals available for just $1, is a substitute for buying movie DVDs. For buyers,
video rental via Redbox offers an attractive price-performance trade-off with low switch-
ing costs in comparison to DVD ownership.
In addition to a lower price, substitutes may also become more attractive by offering a
higher value proposition. 21 In Spain, some six million travelers commute annually between
Madrid and Barcelona. Traditionally, the travel choices to cover these roughly 400 miles
were to fly, drive, or take a slow train. Given that a car ride or train take most of the
day, it was not surprising that roughly 90 percent of commuters chose to fly, creating
a highly profitable business for local airlines. This all changed when the Alta Velocidad
Española (AVE), an ultra-modern high-speed train, was completed in 2008. Train travel
WWW.YAZDANPRESS.COMWWW.YAZDANPRESS.COM

CHAPTER 3 External Analysis: Industry Structure, Competitive Forces, and Strategic Groups 75
offers amenities that air travel cannot. Most notably, taking into account total travel time,
high-speed trains are faster than short-haul flights. Moreover, train passengers not only
travel in greater comfort than passengers in air travel, but they also commute from one city
center to the next, with only a short walk or cab ride to their final destinations.
The AVE example highlights the two fundamental insights provided by Porter’s five
forces framework. First, competition must be defined more broadly to go beyond direct
industry competitors. In this case, rather than defining competition narrowly as the firm’s
closest competitors, airline executives in Spain must look beyond other airlines and con-
sider substitute offerings such as high-speed trains. Second, any of the five forces on its
own, if sufficiently strong, can extract industry profitability. In the AVE example, the threat
of substitutes is limiting the airline industry’s profit potential. With the arrival of the AVE,
the airlines’ monopoly on fast transportation between Madrid and Barcelona vanished as
did the airlines’ high profits. The strong threat of substitutes in this case increased the
rivalry among existing competitors (in the airline industry), to which we now turn.
RIVALRY AMONG EXISTING COMPETITORS
Rivalry among existing competitors describes the intensity with which companies within
the same industry jockey for market share and profitability. It can range from genteel to cut-
throat. The other four forces—threat of entry, the power of buyers and suppliers, and the
threat of substitutes—all exert pressure upon this rivalry (as indicated by the arrows point-
ing toward the center in Exhibit 3.2 ). The stronger the forces, the stronger the expected
competitive intensity, which in turn limits the industry’s profit potential.
Competitors can lower prices to attract customers from rivals. When intense rivalry
among existing competitors brings about price discounting, industry profitability erodes.
Alternatively, competitors can use non-price competition to create more value in terms of
product features and design, quality, promotional spending, and after-sales service and
support. When non-price competition is the primary basis of competition, costs increase,
which can also have a negative impact on industry profitability. However, when these
moves create unique products with features tailored closely to meet customer needs and
willingness to pay, then average industry profitability tends to increase because producers
are able to raise prices and thus increase revenues and profit margins.
The intensity of rivalry among existing competitors is determined largely by the follow-
ing factors:
■ Competitive industry structure
■ Industry growth
■ Strategic commitments
■ Exit barriers
COMPETITIVE INDUSTRY STRUCTURE. The competitive industry structure refers to elements and features common to all industries. The structure of an industry is
largely captured by:
■ The number and size of competitors in an industry
■ Whether the firms possess some degree of pricing power
■ The type of product or service the industry offers (commodity or differentiated product)
■ The height of entry barriers 22
Exhibit 3.3 shows different industry types along a continuum from fragmented to con-
solidated structures. At one extreme, a fragmented industry consists of many small firms
LO 3-3
Explain how competitive industry structure shapes rivalry among competitors.
competitive industry
structure Elements and features common to all industries, including the number and size of competitors in an industry, whether the firms possess some degree of pricing power, and the type of product or service the industry offers.
WWW.YAZDANPRESS.COMWWW.YAZDANPRESS.COM
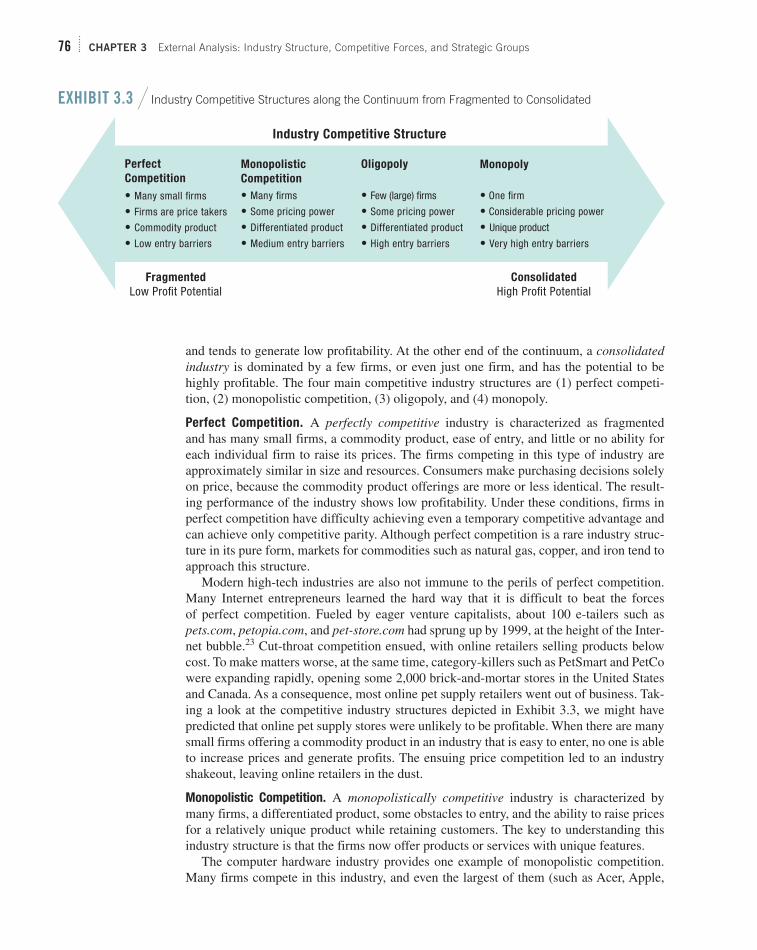
76 CHAPTER 3 External Analysis: Industry Structure, Competitive Forces, and Strategic Groups
and tends to generate low profitability. At the other end of the continuum, a consolidated industry is dominated by a few firms, or even just one firm, and has the potential to be
highly profitable. The four main competitive industry structures are (1) perfect competi-
tion, (2) monopolistic competition, (3) oligopoly, and (4) monopoly.
Perfect Competition. A perfectly competitive industry is characterized as fragmented
and has many small firms, a commodity product, ease of entry, and little or no ability for
each individual firm to raise its prices. The firms competing in this type of industry are
approximately similar in size and resources. Consumers make purchasing decisions solely
on price, because the commodity product offerings are more or less identical. The result-
ing performance of the industry shows low profitability. Under these conditions, firms in
perfect competition have difficulty achieving even a temporary competitive advantage and
can achieve only competitive parity. Although perfect competition is a rare industry struc-
ture in its pure form, markets for commodities such as natural gas, copper, and iron tend to
approach this structure.
Modern high-tech industries are also not immune to the perils of perfect competition.
Many Internet entrepreneurs learned the hard way that it is difficult to beat the forces
of perfect competition. Fueled by eager venture capitalists, about 100 e-tailers such as
pets.com , petopia.com , and pet-store.com had sprung up by 1999, at the height of the Inter-
net bubble. 23 Cut-throat competition ensued, with online retailers selling products below
cost. To make matters worse, at the same time, category-killers such as PetSmart and PetCo
were expanding rapidly, opening some 2,000 brick-and-mortar stores in the United States
and Canada. As a consequence, most online pet supply retailers went out of business. Tak-
ing a look at the competitive industry structures depicted in Exhibit 3.3 , we might have
predicted that online pet supply stores were unlikely to be profitable. When there are many
small firms offering a commodity product in an industry that is easy to enter, no one is able
to increase prices and generate profits. The ensuing price competition led to an industry
shakeout, leaving online retailers in the dust.
Monopolistic Competition. A monopolistically competitive industry is characterized by
many firms, a differentiated product, some obstacles to entry, and the ability to raise prices
for a relatively unique product while retaining customers. The key to understanding this
industry structure is that the firms now offer products or services with unique features.
The computer hardware industry provides one example of monopolistic competition.
Many firms compete in this industry, and even the largest of them (such as Acer, Apple,
EXHIBIT 3.3 / Industry Competitive Structures along the Continuum from Fragmented to Consolidated
Industry Competitive Structure
Monopolistic
Competition
• Many firms
• Some pricing power
• Differentiated product
• Medium entry barriers
Perfect
Competition
• Many small firms
• Firms are price takers
• Commodity product
• Low entry barriers
Oligopoly
• Few (large) firms
• Some pricing power
• Differentiated product
• High entry barriers
Monopoly
• One firm
• Considerable pricing power
• Unique product
• Very high entry barriers
Fragmented
Low Profit PotentialConsolidated
High Profit Potential
WWW.YAZDANPRESS.COMWWW.YAZDANPRESS.COM

CHAPTER 3 External Analysis: Industry Structure, Competitive Forces, and Strategic Groups 77
Dell, HP, or Lenovo) have less than 20 percent market share. Moreover, while products
between competitors tend to be similar, they are by no means identical. As a consequence,
managers selling a product with unique features tend to have some ability to raise prices.
When a firm is able to differentiate its product or service offerings, it carves out a niche
in the market in which it has some degree of monopoly power over pricing, thus the name
“monopolistic competition.” Firms frequently communicate the degree of product differ-
entiation through advertising.
Oligopoly. The term oligopoly comes from the Greeks and means “few sellers.” An oli-gopolistic industry is consolidated with few (large) firms, differentiated products, high
barriers to entry, and some degree of pricing power. The degree of pricing power depends,
just as in monopolistic competition, on the degree of product differentiation.
A key feature of an oligopoly is that the competing firms are interdependent. With only
a few competitors in the mix, the actions of one firm influence the behaviors of the oth-
ers. Each competitor in an oligopoly, therefore, must consider the strategic actions of the
other competitors. This type of industry structure is often analyzed using game theory, which attempts to predict strategic behaviors by assuming that the moves and reactions
of competitors can be anticipated. 24 Due to their strategic interdependence, companies in
oligopolies have an incentive to coordinate their strategic actions to maximize joint perfor-
mance. Although explicit coordination such as price fixing is illegal in the United States,
tacit coordination such as “an unspoken understanding” is not.
The express-delivery industry is an example of an oligopoly. The main competitors in
this space are FedEx and UPS. Any strategic decision made by FedEx (e.g., to expand
delivery services to ground delivery of larger-size packages) directly affects UPS; likewise,
any decision made by UPS (e.g., to guarantee next-day delivery before 8:00 a.m.) directly
affects FedEx. Other examples of oligopolies include the soft drink industry (Coca-Cola
versus Pepsi), airframe manufacturing business (Boeing versus Airbus), home-improvement
retailing (The Home Depot versus Lowe’s), toys and games (Hasbro versus Mattel), and
detergents (P&G versus Unilever). 25
Companies in an oligopoly tend to have some pricing power if they are able to dif-
ferentiate their product or service offerings from those of their competitors. However,
non-price competition is the preferred mode of competition. This means competing by
offering unique product features or services rather than competing based on price alone.
When one firm in an oligopoly cuts prices to gain market share from its competitor, the
competitor typically will respond in kind and also cut prices. This process initiates a
price war, which can be especially detrimental to firm performance if the products are
close rivals.
In the early years of the soft drink industry, for example, whenever Pepsi lowered prices,
Coca-Cola followed suit. These actions only resulted in reduced profitability for both com-
panies. In recent decades, both Coca-Cola and Pepsi have repeatedly demonstrated that
they have learned this lesson. They shifted the basis of competition from price-cutting
to new product introductions and lifestyle advertising. Any price adjustments are merely
short-term promotions. By leveraging innovation and advertising, managers from Coca-
Cola and Pepsi have moved to non-price competition, which in turn allows them to charge
higher prices and to improve industry and company profitability. 26
Monopoly. An industry is a monopoly when there is only one (large) firm supplying the
market. “Mono” means one, and thus a monopolist is the only seller in a market. The firm
may offer a unique product, and the challenges to moving into the industry tend to be high.
The monopolist has considerable pricing power. As a consequence, firm (and thus industry)
profitability tends to be high.
WWW.YAZDANPRESS.COMWWW.YAZDANPRESS.COM

78 CHAPTER 3 External Analysis: Industry Structure, Competitive Forces, and Strategic Groups
In some instances, the government will grant one firm the right to be the sole supplier of
a product or service. This is often done to incentivize a company to engage in a venture that
would not be profitable if there was more than one supplier. For example, public utilities
incur huge fixed costs to build plants and to supply a certain geographic area. Public utili-
ties supplying water, gas, and electricity to businesses and homes are frequently monopo-
lists. For example, Georgia Power is the only supplier of electricity for over 2.25 million
customers in the southeastern United States. Philadelphia Gas Works is the only supplier
of natural gas in the city of Philadelphia, Pennsylvania, serving some 500,000 customers.
These are so-called natural monopolies. Without them, the governments involved believe
the market would not supply these products or services at all. In the past few decades,
however, more and more of these natural monopolies have been deregulated in the United
States, including airlines, telecommunications, railroads, trucking, and ocean transporta-
tion. This deregulation has allowed competition to emerge, which frequently leads to lower
prices, better service, and more innovation.
While natural monopolies appear to be disappearing from the competitive landscape,
so-called near monopolies are of much greater interest to strategists. These are firms that
have accrued significant market power, for example, by owning valuable patents or pro-
prietary technology. In the process, they are changing the industry structure in their favor,
generally from monopolistic competition or oligopolies to near monopolies. These near
monopolies are firms that have accomplished product differentiation to such a degree that
they are in a class by themselves, just like a monopolist. The European Union, for exam-
ple, views Intel (with its 80 percent market share in semiconductors) as a near monopoly.
This is an enviable position in terms of the ability to extract profits, so long as Intel can
steer clear of monopolistic behavior, which may attract antitrust regulators and lead to
legal repercussions.
INDUSTRY GROWTH. Industry growth directly affects the intensity of rivalry among
competitors. In periods of high growth, consumer demand is rising, and price competi-
tion among firms frequently decreases. Because the pie is expanding, rivals are focused
on capturing part of that larger pie rather than taking market share and profitability away
from one another. The demand for knee replacements, for example, is a fast-growing seg-
ment in the medical products industry. In the United States, robust demand is driven by
the need for knee replacements for an aging population as well as for an increasingly
obese population. The leading competitors are Zimmer, DePuy, and Stryker, but signifi-
cant share is held by Smith & Nephew and Biomet. Competition is primarily based on
innovative design, improved implant materials, and differentiated products such as gender
solutions and a range of high-flex knees. With improvements to materials and procedures,
younger patients are also increasingly choosing early surgical intervention. Competitors
are able to avoid price competition and, instead, focus on differentiation that allows pre-
mium pricing.
In contrast, rivalry among competitors becomes fierce during slow or even negative
industry growth. Price discounts, frequent new product releases with minor modifica-
tions, intense promotional campaigns, and fast retaliation by rivals are all tactics indica-
tive of an industry with slow or negative growth. Competition is fierce because rivals can
only gain at the expense of others; therefore, companies are focused on taking business
away from one another. Demand for traditional fast-food providers such as McDonald’s,
Burger King, and Wendy’s has been declining in recent years. Consumers have become
more health conscious and demand has shifted to alternative restaurants such as Subway,
Chick-fil-A, and Chipotle. Attempts by McDonald’s and Wendy’s to steal customers from
WWW.YAZDANPRESS.COMWWW.YAZDANPRESS.COM

CHAPTER 3 External Analysis: Industry Structure, Competitive Forces, and Strategic Groups 79
one another include frequent discounting tactics such as dollar menus. Such competitive
tactics are indicative of cut-throat competition and a low profit potential in the traditional
hamburger fast-food industry.
Competitive rivalry based solely on cutting prices is especially destructive to profitability
because it transfers most, if not all, of the value created in the industry to the customers—
leaving little, if anything, for the firms in the industry. While this may appear attractive to
customers, firms that are not profitable are not able to make the investments necessary to
upgrade their product offerings or services to provide higher value, and eventually leave
the industry altogether. Destructive price competition can lead to limited choices, lower
product quality, and higher prices for consumers in the long run if only a few large firms
survive.
STRATEGIC COMMITMENTS. If firms make strategic commitments to compete in
an industry, rivalry among competitors is likely to be more intense. We defined strategic commitments (in Chapter 2) as firm actions that are costly, long-term oriented, and difficult
to reverse. Strategic commitments to a specific industry can stem from large fixed cost
requirements, but also from non-economic considerations.
For example, significant strategic commitments are required to compete in the airline
industry when using a hub-and-spoke system to provide not only domestic but also inter-
national coverage. The traditional U.S. airlines Delta, United, and American have large
fixed costs to maintain their network of routes that affords global coverage, frequently
in conjunction with foreign partner airlines. These fixed costs (in terms of aircrafts, gate
leases, hangars, maintenance facilities, baggage sorting facilities, and ground transporta-
tion) all accrue before the airlines sell any tickets. High fixed costs create tremendous
pressures to fill empty seats. An airline seat on a specific flight is perishable, just like hotel
rooms not filled. Empty airline seats are often filled through price-cutting. Given similar
high fixed costs, other airlines respond in kind. Eventually, a vicious cycle of price-cutting
ensues, driving average industry profitability to zero, or even negative numbers (where the
companies are losing money). To make matters worse, given their strategic commitments
airlines are unlikely to exit an industry. Excess capacity remains, further depressing indus-
try profitability.
In other cases, strategic commitments to a specific industry may be the result of more
political than economic considerations. Airbus, for example, was created by a number of
European governments through direct subsidies in order to provide a countervailing power
to Boeing. The European Union in turn claims that Boeing is subsidized by the U.S. gov-
ernment indirectly via defense contracts. Given these political considerations (and large-
scale commitments), neither Airbus nor Boeing is likely to exit the aircraft manufacturing
industry even if industry profit potential falls to zero.
Likewise, the French government owns and supports Areva, an industrial conglomerate
in the nuclear power industry, because it views nuclear power to be essential to the coun-
try’s energy independence (75 percent of the country’s electricity is from nuclear power).
Strategic and employment considerations ensure Areva’s continued survival, while making
it difficult, if not impossible, for non-subsidized companies to compete.
EXIT BARRIERS. The rivalry among existing competitors is also a function of an indus-
try’s exit barriers , the obstacles that determine how easily a firm can leave that industry.
Exit barriers are comprised of both economic and social factors. They include fixed costs
that must be paid regardless of whether the company is operating in the industry or not.
A company exiting an industry may still have contractual obligations to suppliers, such
exit barriers
Obstacles that determine how easily a firm can leave an industry.
WWW.YAZDANPRESS.COMWWW.YAZDANPRESS.COM

80 CHAPTER 3 External Analysis: Industry Structure, Competitive Forces, and Strategic Groups
as employee health care and retirement benefits, as well as severance pay. Social factors
include elements such as emotional attachments to certain geographic locations. In Michi-
gan, entire communities depend on GM, Ford, and Chrysler. If any of those carmakers
were to exit the industry altogether, communities would suffer. Other social and economic
factors include ripple effects through the supply chain. When one major player in an indus-
try shuts down, its suppliers are adversely impacted as well.
An industry with low exit barriers is more attractive because it allows underperforming
firms to exit more easily. This in turn reduces competitive pressure on the remaining firms
because excess capacity is removed. In contrast, an industry with high exit barriers reduces
its profit potential because excess capacity still remains. All of the large airlines featured
in Strategy Highlight 3.2 (American, Delta, and United) have filed for bankruptcy at one
point or another. Due to a unique feature of U.S. Chapter 11 bankruptcy law, however,
companies may continue to operate and reorganize while being temporarily shielded from
their creditors and other obligations until renegotiated. This implies that excess capacity is
not removed from the industry, and by putting pressure on prices further reduces industry
profit potential.
To summarize our discussion of the five forces model, Exhibit 3.4 provides a check-
list that you can apply to any industry when assessing the underlying competitive forces
that shape strategy. The key take-away from the five forces model is that the stronger
(weaker) the forces, the lower (greater) the industry’s ability to earn above-average
profits, and correspondingly, the lower (greater) the firm’s ability to gain and sustain a
competitive advantage. Therefore, managers need to craft a strategic position for their
company that leverages weak forces into opportunities, and mitigates strong forces
because they are potential threats to the firm’s ability to gain and sustain a competitive
advantage.
ADDING A SIXTH FORCE: THE STRATEGIC ROLE OF COMPLEMENTS
As valuable as the five forces model is for explaining the profit potential and attractiveness
of industries, some have suggested extensions of it. Intel’s former chairman and CEO, Andy
Grove, as well as strategy scholars, have suggested that the value of Porter’s five forces
model can be further enhanced if one also considers the availability of complements. 27
A complement is a product, service, or competency that adds value to the original
product offering when the two are used in tandem. 28 Complements increase demand for
the primary product, thereby enhancing the profit potential for the industry and the firm.
A company is a complementor to your company if customers value your product or ser-
vice offering more when they are able to combine it with the other company’s product or
service. 29 Firms may choose to provide the complements themselves or work with another
company to accomplish this. Several examples illustrate this point:
■ In the smartphone industry, Google is a complementor to Samsung. The Korean
high-tech company’s smartphones are more valuable when they come with Google’s
Android system pre-installed. Customers buying a Samsung smartphone have access
to roughly the same number of apps in Google’s Play store as users of Apple’s iPhone.
We noted earlier that Google is facing strong buyer power from Samsung because
it accounts for a large quantity of Google’s overall sales of its Android operating
system. Samsung is attempting to leverage its increased buyer power to request a
larger share of online search revenues from Google and to obtain other preferential
treatment, such as the development of Google apps tailored exclusively for Samsung
smartphones and tablets.
LO 3-4
Describe the strategic role of complements in creating positive-sum co-opetition.
complement
A product, service, or competency that adds value to the original product offering when the two are used in tandem.
complementor
A company that provides a good or service that leads customers to value your firm’s offering more when the two are combined.
WWW.YAZDANPRESS.COMWWW.YAZDANPRESS.COM

CHAPTER 3 External Analysis: Industry Structure, Competitive Forces, and Strategic Groups 81
EXHIBIT 3.4 / The Five Forces Competitive Analysis Checklist SOURCE: Adapted from Porter, M. E. (2008), “The five competitive forces that shape strategy,” Harvard Business Review, January.
The threat of entry is high when:
√ The minimum efficient scale to compete in an industry is low.
√ Network effects are not present.
√ Customer switching costs are low.
√ Capital requirements are low.
√ Incumbents do not possess:
° Brand loyalty.
° Proprietary technology.
° Preferential access to raw materials.
° Preferential access to distribution channels.
° Favorable geographic locations.
° Cumulative learning and experience effects.
√ Restrictive government regulations do not exist.
√ New entrants expect that incumbents will not or cannot retaliate.
The power of suppliers is high when:
√ Suppliers’ industry is more concentrated than the industry it sells to.
√ Suppliers do not depend heavily on the industry for their revenues.
√ Incumbent firms face significant switching costs when changing suppliers.
√ Suppliers offer products that are differentiated.
√ There are no readily available substitutes for the products or services that the suppliers offer.
√ Suppliers can credibly threaten to forward integrate into the industry.
The power of buyers is high when:
√ There are a few buyers and each buyer purchases large quantities relative to the size of a single seller.
√ The industry’s products are standardized or undifferentiated commodities.
√ Buyers face low or no switching costs.
√ Buyers can credibly threaten to backwardly integrate into the industry.
The threat of substitutes is high when:
√ The substitute offers an attractive price-performance trade-off.
√ The buyers’ cost of switching to the substitute is low.
The rivalry among existing competitors is high when:
√ There are many competitors in the industry.
√ The competitors are roughly of equal size.
√ Industry growth is slow, zero, or even negative.
√ Exit barriers are high.
√ Incumbent firms are highly committed to the business.
√ Incumbent firms cannot read or understand each other’s strategies well.
√ Products and services are direct substitutes.
√ Fixed costs are high and marginal costs are low.
√ Excess capacity exists in the industry.
√ The product or service is perishable.
WWW.YAZDANPRESS.COMWWW.YAZDANPRESS.COM

82 CHAPTER 3 External Analysis: Industry Structure, Competitive Forces, and Strategic Groups
At the same time, Google and Samsung are increasingly becoming competitors
as well. With Google’s acquisition of Motorola Mobility, the online search company
is planning to launch its own line of smartphones under the Google brand. This
development illustrates the process of co-opetition , which is cooperation by com-
petitors to achieve a strategic objective. Samsung and Google cooperate as comple-
mentors to compete against Apple’s strong position in the mobile device industry,
while at the same time Samsung and Google are increasingly becoming competitive
with one another.
■ Illegal music downloads created a powerful substitute for CD record sales, which plum-
meted with the availability of file-sharing software such as Napster. Seeing a strategic
opportunity, Apple established the iTunes music store to complement its iPod music
player. Apple makes money by selling the hardware (iPod or iPhone), while providing
the complement (iTunes software) for free. That combination allows you to load your
device with thousands of songs that can be selected from more than 28 million offered
from the iTunes music store at a reasonable price (beginning at $0.69 each). Similarly,
when Apple launched the iPad, it had already established relationships with several
major publishing houses as complementors to fill its iBook online store with millions
of e-books. Moreover, since the iPad runs on the same operating system as the iPhone
(iOS), the over 800,000 apps for the iPhone are also available for the iPad through
Apple’s App store.
3.3 Changes over Time: Industry Dynamics
Although the five-forces-plus-complements model is useful in understanding an indus-
try’s profit potential, it provides only a point-in-time snapshot of a moving target. With
this model (as with other static models), one cannot determine the changing speed of an
industry or the rate of innovation. This drawback implies that managers must repeat their
analysis over time in order to create a more accurate picture of their industry. It is therefore
important that managers consider industry dynamics.
Industry structures are not stable over time. Rather, they are dynamic. Since a consoli-
dated industry tends to be more profitable than a fragmented one (see Exhibit 3.3 ), firms
have a tendency to change the industry structure in their favor, making it more consolidated
through (horizontal) mergers and acquisitions. Having fewer competitors generally equates
to higher industry profitability. Industry incumbents, therefore, have an incentive to reduce
the number of competitors in the industry. With fewer but larger competitors, incumbent
firms can mitigate the threat of strong competitive forces such as supplier or buyer power
more effectively. The U.S. domestic airline industry (featured in Strategy Highlight 3.2)
has witnessed several large, horizontal mergers between competitors, including Delta and
Northwest, United and Continental, Southwest and AirTran, as well as American and U.S.
Airways. These moves in turn allow the remaining carriers to enjoy a more benign industry
structure. It also allows them to retire some of the excess capacity in the industry as the
merged airlines consolidate their networks of routes. The merger activity in the airline
industry provides one example of how firms can proactively reshape industry structure in
their favor. A more consolidated airline industry is likely to lead to higher ticket prices and
fewer choices for customers, but also more profitable airlines.
In contrast, consolidated industry structures may also break up and become more frag-
mented. This generally happens when there are external shocks to an industry such as
deregulation, new legislation, technological innovation, or globalization. For example, the
emergence of the Internet moved the stock brokerage business from an oligopoly controlled
LO 3-5
Appraise the role of industry dynamics and industry convergence in shaping the firm’s external environment.
WWW.YAZDANPRESS.COMWWW.YAZDANPRESS.COM

CHAPTER 3 External Analysis: Industry Structure, Competitive Forces, and Strategic Groups 83
by full-service firms such as Merrill Lynch and Morgan Stanley to monopolistic competi-
tion with many generic online brokers such as Ameritrade, E*TRADE, and Scottrade.
Another dynamic to be considered is industry convergence , a process whereby for-
merly unrelated industries begin to satisfy the same customer need. Industry convergence
is often brought on by technological advances. For years, many players in the media
industries have been converging due to technological progress in IT, telecommunications,
and digital media. Media convergence unites computing, communications, and content,
thereby causing significant upheaval across previously distinct industries. Content pro-
viders in industries such as newspapers, magazines, TV, movies, radio, and music are all
scrambling to adapt. Many standalone print newspapers are closing up shop, while oth-
ers are trying to figure out how to offer online news content for which consumers are
willing to pay. 30 As a consequence of media convergence, annual online ad spending is
predicted to reach $130 billion in 2015, overtaking print advertising and closing in fast on
TV advertising. 31 Internet companies such as Google, Facebook, Twitter, and Pinterest are
changing the industry structure by constantly morphing their capabilities and forcing old-
line media companies such as News Corp., Time Warner, and Disney to adapt. Amazon’s
Kindle e-reader, Apple’s iPad, or Samsung’s Galaxy Tab provide a new form of content
delivery that has the potential to make print media obsolete.
3.4 Explaining Performance Differences Within
the Same Industry: Strategic Groups
In further analyzing the firm’s external environment in order to explain performance
differences, we now move to firms within the same industry. As noted earlier in the
chapter, a firm occupies a place within a strategic group , a set of companies that pur-
sue a similar strategy within a specific industry in their quest for competitive advantage
(see Exhibit 3.1 ). 32 Strategic groups differ from one another along important dimensions
such as expenditures on research and development, technology, product differentiation,
product and service offerings, pricing, market segments, distribution channels, and cus-
tomer service.
To explain differences in firm performance within the same industry , scholars offer the
strategic group model , which clusters different firms into groups based on a few key stra-
tegic dimensions. 33 They find that even within the same industry, firm performances differ
depending on strategic group membership. Some strategic groups tend to be more profit-
able than others. This difference implies that firm performance is determined not only by
the industry to which the firm belongs, but also by its strategic group membership.
The distinct differences across strategic groups reflect the business strategies that firms
pursue. Firms in the same strategic group tend to follow a similar strategy. Companies in
the same strategic group, therefore, are direct competitors. The rivalry among firms of the
same strategic group is generally more intense than the rivalry between strategic groups:
intra-group rivalry exceeds inter-group rivalry. The number of different business strategies
LO 3-6
Generate a strategic group model to reveal performance differences between clusters of firms in the same industry.
co-opetition
Cooperation by competitors to achieve a strategic objective.
industry convergence
A process whereby formerly unrelated industries begin to satisfy the same customer need.
strategic group The set of companies that pursue a similar strategy within a specific industry.
strategic group model
A framework that explains differences in firm performance within the same industry by clustering different firms into groups based on a few key strategic dimensions.
WWW.YAZDANPRESS.COMWWW.YAZDANPRESS.COM

84 CHAPTER 3 External Analysis: Industry Structure, Competitive Forces, and Strategic Groups
pursued within an industry determines the number of strategic groups in that industry. In
most industries, strategic groups can be identified along a fairly small number of dimen-
sions. In many instances, two strategic groups are in an industry based on two different
business strategies: one that pursues a low-cost strategy (e.g., in the car industry: the South
Korean carmaker Kia, the Chinese manufacturers BYD and Geely, the Indian Tata Motors
with its Nano car line, and others, that make up one group), and a second that pursues a
differentiation strategy (e.g., BMW, Mercedes, Audi, Porsche, and others). We’ll discuss
each of these generic business strategies in detail in Chapter 6.
MAPPING STRATEGIC GROUPS
To understand competitive behavior and performance within an industry, we can map the
industry competitors into strategic groups. When mapping strategic groups, it is important
to focus on several factors:
■ Identify the most important strategic dimensions (such as expenditures on research and
development, technology, product differentiation, product and service offerings, pric-
ing, market segments, distribution channels, and customer service).
■ Choose two key dimensions for the horizontal and vertical axes, which expose impor-
tant differences among the competitors. The dimensions chosen for the axes should not be highly correlated.
■ Graph the firms in the strategic group, indicating each firm’s market share by the size
of the bubble with which it is represented. 34
Again, the U.S. domestic airline industry provides an illustrative example. Exhibit 3.5
maps the companies active within this industry. The two strategic dimensions on the axes
are prices charged and routes serviced. As a result of this mapping, two strategic groups
become apparent, as indicated by the dashed lines: low-cost, point-to-point airlines (Virgin
Atlantic, Alaska Airlines, JetBlue, and Southwest Airlines) versus differentiated airlines
using a hub-and-spoke system (American, Delta, and United). As we can see, the low-
cost, point-to-point airlines are clustered in the lower-left corner because they tend to offer
lower ticket prices but generally service a smaller number of routes due to their point-to-
point operating system.
The differentiated airlines offering full services using a hub-and-spoke route system
are the so-called legacy carriers. This second strategic group clusters in the upper-right
corner because their ticket prices tend to be somewhat higher due to frequently higher cost
structures. They usually offer many more routes than the point-to-point low-cost carriers,
made possible by use of the hub-and-spoke system. This functional-level strategy allows
the legacy airlines to offer many different destinations. For example, Delta’s main hub is
in Atlanta, Georgia. 35 If you were to fly from Seattle, Washington, to Miami, Florida, you
would stop to change planes in Delta’s Atlanta hub on your way.
The strategic group mapping in Exhibit 3.5 provides some additional insights:
■ Competitive rivalry is strongest between firms that are within the same strategic group. The closer firms are on the strategic group map, the more directly and intensely they
are in competition with one another. After a wave of mergers, the remaining mega-
airlines—American, Delta, and United—are competing head to head, not only in the
U.S. domestic market but also globally. They tend to monitor one another’s strate-
gic actions closely. While Delta does face competition from low-cost carriers such as
Southwest Airlines (SWA) on some domestic routes, its primary competitive rivals are
the other legacy carriers. This is because they compete more on providing seamless
WWW.YAZDANPRESS.COMWWW.YAZDANPRESS.COM
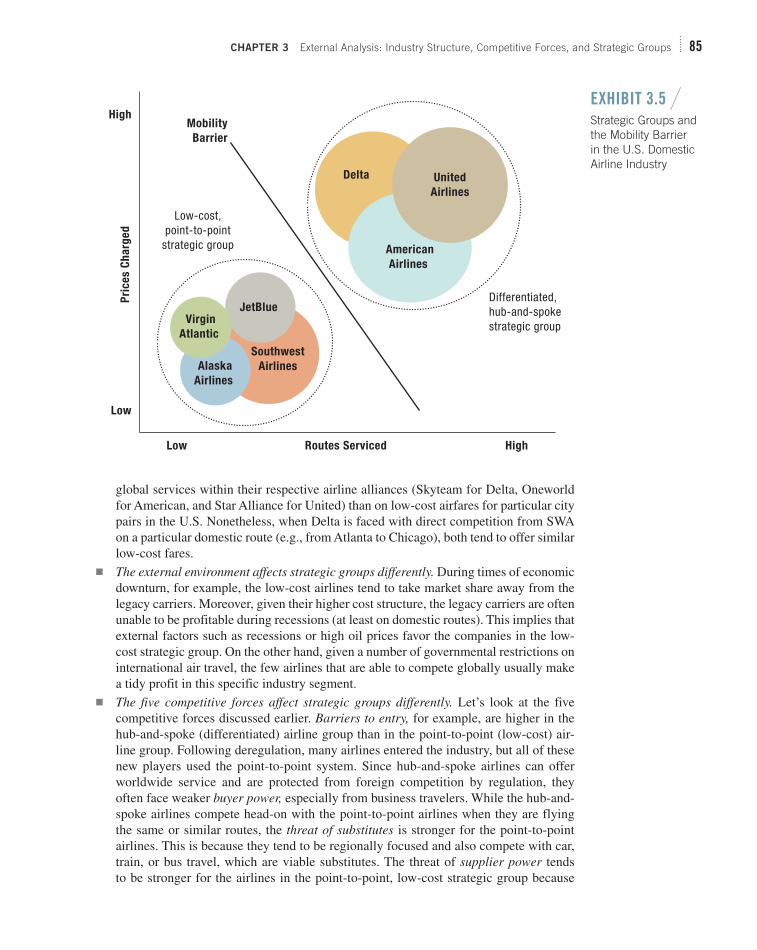
CHAPTER 3 External Analysis: Industry Structure, Competitive Forces, and Strategic Groups 85
global services within their respective airline alliances (Skyteam for Delta, Oneworld
for American, and Star Alliance for United) than on low-cost airfares for particular city
pairs in the U.S. Nonetheless, when Delta is faced with direct competition from SWA
on a particular domestic route (e.g., from Atlanta to Chicago), both tend to offer similar
low-cost fares.
■ The external environment affects strategic groups differently. During times of economic
downturn, for example, the low-cost airlines tend to take market share away from the
legacy carriers. Moreover, given their higher cost structure, the legacy carriers are often
unable to be profitable during recessions (at least on domestic routes). This implies that
external factors such as recessions or high oil prices favor the companies in the low-
cost strategic group. On the other hand, given a number of governmental restrictions on
international air travel, the few airlines that are able to compete globally usually make
a tidy profit in this specific industry segment.
■ The five competitive forces affect strategic groups differently. Let’s look at the five
competitive forces discussed earlier. Barriers to entry, for example, are higher in the
hub-and-spoke (differentiated) airline group than in the point-to-point (low-cost) air-
line group. Following deregulation, many airlines entered the industry, but all of these
new players used the point-to-point system. Since hub-and-spoke airlines can offer
worldwide service and are protected from foreign competition by regulation, they
often face weaker buyer power, especially from business travelers. While the hub-and-
spoke airlines compete head-on with the point-to-point airlines when they are flying
the same or similar routes, the threat of substitutes is stronger for the point-to-point
airlines. This is because they tend to be regionally focused and also compete with car,
train, or bus travel, which are viable substitutes. The threat of supplier power tends
to be stronger for the airlines in the point-to-point, low-cost strategic group because
Pri
ce
s C
ha
rge
d
High
Low
Low HighRoutes Serviced
Mobility
Barrier
Low-cost,point-to-point
strategic group
Differentiated,hub-and-spokestrategic group
Delta United
Airlines
American
Airlines
Southwest
Airlines
JetBlue Virgin
Atlantic
Alaska
Airlines
EXHIBIT 3.5 / Strategic Groups and the Mobility Barrier in the U.S. Domestic Airline Industry
WWW.YAZDANPRESS.COMWWW.YAZDANPRESS.COM
86 CHAPTER 3 External Analysis: Industry Structure, Competitive Forces, and Strategic Groups
they are much smaller and thus have weaker negotiation power when acquiring new
aircraft, for example. To get around this, these airlines frequently purchase used air-
craft from legacy carriers. This brief application of the five forces model leads us to
conclude that rivalry among existing competitors in the low-cost, point-to-point stra-
tegic group is likely to be more intense than within the differentiated, hub-and-spoke
strategic group.
■ Some strategic groups are more profitable than others. Historically, airlines clustered
in the lower-left corner tend to be more profitable (when considering the U.S. domestic
market only). Why? Because they create similar, or even higher, value for their custom-
ers in terms of on-time departure and arrival, safety, and fewer bags lost, while keeping
ticket costs below those of the legacy carriers. The point-to-point airlines are able to
offer their services at a lower cost and a higher perceived value, thus creating the basis
for a competitive advantage.
MOBILITY BARRIERS
Although some strategic groups tend to be more profitable and therefore more attractive
than others, mobility barriers restrict movement between groups . These are industry-spe-
cific factors that separate one strategic group from another. 36
The two groups identified in the U.S. airline industry map in Exhibit 3.5 are separated
by the fact that the group using a hub-and-spoke operational model offers international
routes, while the point-to-point airlines generally do not. Offering international routes
necessitates the hub-and-spoke model. Frequently, the international routes tend to be the
only remaining profitable routes left for the legacy carriers. This economic reality implies
that if carriers in the lower-left cluster, such as SWA or JetBlue, would like to compete
globally, they would likely need to change their point-to-point operating model to a hub-
and-spoke model. Or, they could select a few profitable international routes and service
them with long-range aircrafts such as Boeing 787s or Airbus A-380s. However, adding
international service to the low-cost model would require significant capital investments,
and a likely departure from a well-functioning business model. Additional regulatory hur-
dles reinforce these mobility barriers, such as the difficulty of securing landing slots at
international airports around the world. From the perspective of the legacy carriers whose
profits tend to be generated primarily from international routes, mobility barriers protect
this profit sanctuary for the time being.
3.5 Implications for the Strategist
At the start of the strategic management process, it is critical for managers to conduct a
thorough analysis of the firm’s external environment to identify threats and opportunities.
The initial step is to apply a PESTEL analysis to scan, monitor, and evaluate changes and
trends in the firm’s macroenvironment. This versatile framework allows managers to track
important trends and developments based on the source of the external factors: political,
economic, sociocultural, technological, ecological, and legal. When applying a PESTEL
analysis, the guiding consideration for managers should be the question of how the exter-
nal factors identified affect the firm’s industry environment.
Exhibit 3.1 further delineates external factors based on the proximity of these exter-
nal factors by gradually moving from the general to the task environment. The next layer
for managers to understand is the industry. Applying Porter’s five forces model allows
mobility barriers
Industry-specific factors that separate one strategic group from another.
WWW.YAZDANPRESS.COMWWW.YAZDANPRESS.COM

CHAPTER 3 External Analysis: Industry Structure, Competitive Forces, and Strategic Groups 87
managers to understand the profit potential of an industry and to obtain clues on how to
carve out a strategic position that makes gaining and sustaining a competitive advantage
more likely. Follow these steps to apply the five forces model: 37
1. Define the relevant industry. In the five forces model, industry boundaries are drawn by
identifying a group of incumbent companies that face more or less the same suppliers
and buyers. This group of competitors is likely to be an industry if it also has the same
entry barriers and a similar threat from substitutes. In this model, therefore, an indus-
try is defined by commonality and overlap in the five competitive forces that shape
competition.
2. Identify the key players in each of the five forces and attempt to group them into dif-ferent categories. This step aids in assessing the relative strength of each force. For
example, while makers of jet engines (GE, Rolls Royce, Pratt & Whitney) and local
catering services are all suppliers to airlines, their strengths vary widely. Segmenting
different players within each force allows you to assess each force in a more fine-
grained manner.
3. Identify the underlying drivers of each force. Which forces are strong, and which are
weak? Why? Keeping with the airline example, why is the supplier power of jet engine
manufacturers strong? Because they are supplying a mission-critical, highly differenti-
ated product for airlines. Moreover, there are only a few suppliers of jet engines world-
wide, and no viable substitutes.
4. Assess the overall industry structure. What is the industry’s profit potential? Here you
need to identify forces that directly influence industry profit potential, because not all
forces are likely to have an equal effect. Focus on the most important forces that drive
industry profitability.
The final step in industry analysis is to draw a strategic group map. This exercise allows
the strategist to unearth and explain performance differences within the same industry. When analyzing a firm’s external environment, it is critical to apply the three frameworks
introduced in this chapter (PESTEL, Porter’s five forces, and strategic group mapping).
Taken together, the external environment can determine up to one half of the performance
differences across firms (see Exhibit 1.2).
Although the different models discussed in this chapter are an important step in the
strategic management process, they are not without shortcomings. First, all of the models
presented are static. They provide a snapshot of what is actually a moving target and do
not allow for consideration of industry dynamics. However, changes in the external envi-
ronment can appear suddenly, for example, through the appearance of black swan events.
Industries can be revolutionized by innovation. Strategic groups can be made obsolete
through deregulation or technological progress. To overcome this important shortcoming,
managers must conduct external analyses at different points in time to gain a sense of the
underlying dynamics. The frequency with which these tools need to be applied is a func-
tion of the rate of change in the industry. The mobile app industry is changing extremely
fast, while the railroad industry experiences a less volatile environment.
Second, the models presented in this chapter do not allow managers to fully understand
why there are performance differences among firms in the same industry or strategic group.
To better understand differences in firm performance, we must look inside the firm to study
its resources, capabilities, and core competencies. We do this in the next chapter by mov-
ing from external to internal analysis.
WWW.YAZDANPRESS.COMWWW.YAZDANPRESS.COM

A
88 CHAPTER 3 External Analysis: Industry Structure, Competitive Forces, and Strategic Groups
ALTHOUGH TESLA MOTORS has been successful in entering the U.S. automotive market using innovative new technology, its continued success will depend on other firm and industry factors. While industry forces have been favorable for a long time in the U.S. auto-motive industry, recent dynamics have lowered the profit potential of competing in this industry and thus reduced its attractiveness. Now that Tesla Motors has demonstrated how new technology can be used to cir-cumvent entry barriers, other new ventures may soon follow. Moreover, the incumbent firms are also adopting the new technology by introducing hybrid or all-electric cars, further increasing rivalry in the industry.
Another external industry force that Tesla Motors must address is the bargaining power of suppliers. Lithium-ion battery packs are key components for Tesla’s electric engines. They are supplied by only a few technology firms such as Panasonic in Japan. Given that these sources are few, the bargaining power of sup-pliers in the electric car segment is quite high, further limiting the industry’s profit potential. As a consequence of the strong bargaining power of suppliers, combined with the weak demand for its $100K sports car, Fisker Automotive, another American automaker of plug-in hybrid sports cars based in Anaheim, California, filed for bankruptcy.
In this segment, the bargaining power of buyers is also strong. Individual buyers have many choices, and electric cars tend to be priced at a steep pre-mium due to low production runs. Large-scale buy-ers such as rental car companies Avis and Hertz or the New York City taxi fleet all have significant pur-chasing power, further driving down profit potential.
In addition, when demand is slowing, excess capacity tends to develop in the auto-motive industry, and the incumbent car companies begin to initiate a cut-throat price competition to move inventory. Although both GM and Chrysler went into Chapter 11 bankruptcy, neither exited the industry but rather restructured, causing excess capacity to remain in the industry. Finally, complementary products and services such as battery charging and service stations, which are not yet ubiquitous, are needed to help con-sumers overcome anxieties concerning electric vehicle ownership.
Questions
Thinking about Chapter Case 3, answer the following questions.
1. Which PESTEL factors are the most salient for the electric vehicle segment of the car industry? Do you see a future for electric vehicles in the U.S.? Why or why not?
2. Looking at Porter’s five forces of competition, how would you assess the profit potential of the U.S. car industry?
3. Using the five forces model, what implications can we derive for how Tesla Motors should compete in the U.S. car industry? What would be your top three recommendations for Elon Musk? Support your arguments.
4. Draw a strategic group map for the U.S. automo-tive industry. What are your conclusions?
CHAPTER CASE 3 Consider This . . .
This chapter demonstrated various approaches to ana-
lyzing the firm’s external environment, as summarized
by the following learning objectives and related take-
away concepts.
LO 3-1 / Generate a PESTEL analysis to eval-
uate the impact of external forces on the firm.
■ A firm’s macroenvironment consists of a wide
range of political, economic, sociocultural,
TAKE-AWAY CONCEPTS
WWW.YAZDANPRESS.COMWWW.YAZDANPRESS.COM

CHAPTER 3 External Analysis: Industry Structure, Competitive Forces, and Strategic Groups 89
technological, ecological, and legal (PESTEL)
factors that can affect industry and firm perfor-
mance. These external forces have both domestic
and global aspects.
■ The political environment describes the influence
government bodies can have on firms.
■ The economic environment is mainly affected by
five factors: growth rates, interest rates, levels of
employment, price stability (inflation and defla-
tion), and currency exchange rates.
■ Sociocultural factors capture a society’s cultures,
norms, and values.
■ Technological factors capture the application of
knowledge to create new processes and products.
■ Ecological factors concern a firm’s regard for
environmental issues such as the natural environ-
ment, global warming, and sustainable economic
growth.
■ Legal environment factors capture the official
outcomes of the political processes that manifest
themselves in laws, mandates, regulations, and
court decisions.
LO 3-2 / Apply Porter’s five competitive
forces to explain the profit potential of
different industries.
■ Competition must be viewed more broadly to
encompass not only direct rivals but also a set of
other forces in an industry: buyers, suppliers, the
potential new entry of other firms, and the threat
of substitutes.
■ The profit potential of an industry is a function of
the five forces that shape competition: (1) threat
of entry, (2) power of suppliers, (3) power of buy-
ers, (4) threat of substitutes, and (5) rivalry among
existing competitors.
■ The stronger a competitive force, the greater the
threat it represents. The weaker the competitive
force, the greater the opportunity it presents.
■ A firm can shape an industry’s structure in its
favor through its strategy.
LO 3-3 / Explain how competitive industry
structure shapes rivalry among competitors.
■ The competitive structure of an industry is largely
captured by the number and size of competitors
in an industry, whether the firms possess some
degree of pricing power, the type of product or
service the industry offers (commodity or differ-
entiated product), and the height of entry barriers.
■ A perfectly competitive industry is characterized
by many small firms, a commodity product, low
entry barriers, and no pricing power for individual
firms.
■ A monopolistic industry is characterized by many
firms, a differentiated product, medium entry bar-
riers, and some pricing power.
■ An oligopolistic industry is characterized by few
(large) firms, a differentiated product, high entry
barriers, and some degree of pricing power.
■ A monopoly exists when there is only one (large)
firm supplying the market. In such instances, the
firm may offer a unique product, the barriers to
entry may be high, and the monopolist usually
has considerable pricing power.
LO 3-4 / Describe the strategic role of com-
plements in creating positive-sum co-opetition.
■ Co-opetition (co-operation among competitors)
can create a positive-sum game, resulting in a
larger pie for everyone involved.
■ Complements increase demand for the primary
product, enhancing the profit potential for the
industry and the firm.
■ Attractive industries for co-opetition are charac-
terized by high entry barriers, low exit barriers,
low buyer and supplier power, a low threat of sub-
stitutes, and the availability of complements.
LO 3-5 / Appraise the role of industry
dynamics and industry convergence in shaping
the firm’s external environment.
■ Industries are dynamic—they change over time.
■ Different conditions prevail in different industries,
directly affecting the firms competing in these
industries and their profitability.
■ In industry convergence, formerly unrelated indus-
tries begin to satisfy the same customer need. It is
often brought on by technological advances.
LO 3-6 / Generate a strategic group model
to reveal performance differences between
clusters of firms in the same industry.
■ A strategic group is a set of firms within a spe-
cific industry that pursue a similar strategy in
their quest for competitive advantage.
WWW.YAZDANPRESS.COMWWW.YAZDANPRESS.COM

90 CHAPTER 3 External Analysis: Industry Structure, Competitive Forces, and Strategic Groups
■ Strategic groups are affected differently by the
external environment and the five competitive
forces.
■ Some strategic groups are more profitable than
others.
■ Movement between strategic groups is restricted
by mobility barriers—industry-specific factors
that separate one strategic group from another.
■ Generally, there are two strategic groups in an
industry based on two different business strate-
gies: one that pursues a low-cost strategy and a
second that pursues a differentiation strategy.
■ Rivalry among firms of the same strategic group
is more intense than the rivalry between strategic
groups: intra-group rivalry exceeds inter-group
rivalry.
Competitive industry structure
Complement
Complementor
Co-opetition
Entry barriers
Exit barriers
KEY TERMS
Five forces model
Industry
Industry analysis
Industry convergence
Mobility barriers
PESTEL model
Strategic group
Strategic group model
Strategic position
Threat of entry
1. Why is it important for an organization to study
and understand its external environment?
2. How do the five competitive forces in Porter’s
model affect the average profitability of the indus-
try? For example, in what way might weak forces
increase industry profits, and in what way do
strong forces reduce industry profits? Identify an
industry in which many of the competitors seem
to be having financial performance problems.
Which of the five forces seems to be strongest?
3. What is a strategic group? How can studying such
groups be useful in industry analysis?
4. How do mobility barriers affect the structure of
an industry? How do they help us explain firm
differences in performance?
DISCUSSION QUESTIONS
1. UBS, a venerable Swiss banking institution
with global business activities, experienced the
significant implications that political factors
can have on the bottom line. The U.S. govern-
ment alleged that by advertising its “tax savings”
advantages to U.S. clients, UBS aided wealthy
Americans in siphoning off billions of dollars
to a safe haven that the IRS cannot touch. The
government requested from UBS the names of
52,000 U.S. citizens who it suspected were tax
evaders. Initially, UBS declined to release names,
citing Swiss banking laws and regulations that
guarantee the privacy of customers. However,
UBS was in a lose–lose situation: If it resisted
the IRS, it risked losing its U.S. banking license.
If it disclosed names of its customers, it would
break the traditional Swiss banking secrecy and
potentially violate Swiss law, which makes it a
felony to improperly disclose client information.
In 2009, after multiple rounds of intense negotia-
tions, UBS finally relented to significant pressure
by the U.S. government and released the names
of 4,450 U.S. citizens who are suspected to have
evaded taxes.
ETHICAL/SOCIAL ISSUES
WWW.YAZDANPRESS.COMWWW.YAZDANPRESS.COM

CHAPTER 3 External Analysis: Industry Structure, Competitive Forces, and Strategic Groups 91
//// Small-Group Exercise 1
(Ethical/Social Issues)
Your group is a team of Kraft ( www.kraftfoodsgroup
.com ) marketing interns. The company has asked you
to propose new guidelines for helping it promote food
to children in a socially responsible way. As the fourth-
largest consumer packaged food and beverage com-
pany in the U.S., its 2012 sales were over $18 billion.
The company projects steady growth but would like
your help in boosting growth. One of Kraft’s largest
brands is Oscar Mayer Lunchables, described as mak-
ing lunch fun and targeted to busy parents who want
a quick lunch to send with their children to school
or keep on hand as an after-school snack. One of the
options is Lunchables with Juice, Nachos Cheese
Dip, and Salsa. However, there is a growing contro-
versy about the social responsibility of directly mar-
keting to children when the food is unhealthy—high
in fat, sugar, and salt, but low in nutrition. There is a
societal concern with the growing rate of obesity in
children and the increased incidence in diabetes that
results from childhood obesity. In response, most food
and beverage companies have agreed to follow volun-
tary guidelines created by the Better Business Bureau,
termed the Children’s Food and Beverage Advertising
Initiative (CFBAI). The guidelines ask for participating
companies to pledge to advertise only healthy choices
during children’s programs, defined as those with an
audience of 35 percent or more children under 12.
Kraft would like to have a reputation as a socially
responsible company. Accordingly, Kraft would like
to create internal guidelines that will help it market
Lunchables (as well as other packaged food items)
responsibly and gain the approval of medical profes-
sionals, parents, and watchdog groups. 39
1. Visit the Kraft website ( www.kraftfoodcompanies
.com ) and review the Lunchables products, as
well as other packaged food products that Kraft
offers. Discuss among group members the extent
to which product options are healthy choices.
2. What changes would you recommend to the
CFBAI pledge in order to ensure that the primary
audience watching advertisements for Kraft pack-
aged foods will not be children? Describe alterna-
tive guidelines that Kraft might adopt.
3. Identify other actions that Kraft might take in
order to demonstrate that it is a food company
that genuinely cares about children’s health and a
company that would like to help reverse the trend
of increasing childhood obesity.
4. If your group believes that the company is not
responsible for personal choices that consumers
make to eat unhealthy food, then describe how the
company should respond to activist groups and
public health officials that are urging companies
to stop producing and marketing unhealthy foods.
//// Small-Group Exercise 2
One industry with an impact on both undergraduate
and MBA students is textbook publishing. Traditional
printed textbooks are being challenged by the grow-
ing demand for electronic versions of these materials.
E-readers such as the Amazon Kindle and Apple iPad
SMALL-GROUP EXERCISES
The U.S. government’s case against UBS
was helped immensely by a former employee at
UBS who cooperated with prosecutors on details
of how such transactions occur. The “whistle-
blower,” a U.S. citizen, has been lauded for his
help in the investigation. Yet, in January 2010 he
also began serving a 40-month prison sentence
for his own guilty plea for helping his clients at
UBS evade taxes. 38 Some in the industry believe
such a surprisingly long prison term, despite his
cooperation with investigators, will dramatically
reduce motivation for other potential whistleblow-
ers to come forward.
a. What is the proper role for a multinational
firm in cases where government regulations
across countries are in conflict? For example,
UBS executives claimed that releasing any
names of U.S. customers would violate
Swiss banking laws. A compromise was later
reached that only the names of customers
suspected of illegal activity were released.
b. What is the responsibility of individual
employees to their employers and to their
governments when there seems to be a
conflict?
WWW.YAZDANPRESS.COMWWW.YAZDANPRESS.COM
92 CHAPTER 3 External Analysis: Industry Structure, Competitive Forces, and Strategic Groups
are examples of devices that are likely to drive industry
convergence. Millions of e-readers are sold each year. 40
Use the five forces model to think through the vari-
ous impacts such technology shifts may have on the
textbook industry. Include in your response answers to
the following questions.
1. How should managers of a textbook publishing
company respond to such changes?
2. Will the shifts in technology be likely to raise
or lower the textbook industry–level profits?
Explain.
STRATEGY TERM PROJECT
//// Module 3: External Analysis
In this section, you will study the external environ-
ment of the firm you have previously selected for this
project.
1. Are any changes taking place in the macroenvi-
ronment that might have a positive or negative
impact on the industry in which your company
is based? Apply the PESTEL framework to iden-
tify which factors may be the most important in
your industry. What will be the effect on your
industry?
2. Apply the five forces model to your industry.
What does this model tell you about the nature of
competition in the industry?
3. Identify any strategic groups that might exist in
the industry. How does the intensity of competi-
tion differ across the strategic groups you have
identified?
4. How dynamic is the industry in which your com-
pany is based? Is there evidence that industry
structure is reshaping competition, or has done so
in the recent past?
Is My Job the Next One Being
Outsourced?
The outsourcing of IT programming jobs to India is now commonly understood after years of this trend. How-ever, more recently some accounting functions have
also begun to flow into India’s large technically trained and English-speaking work force. For example, the number of U.S. tax returns completed in India rose dramatically from 2003 to 2011 (25,000 in 2003 to 1.6 million in 2011). Some esti-mate that over 20 million U.S. tax returns will be prepared in India within the next few years. Outsourcing in the account-ing functions may affect the job and career prospects for accounting-oriented business school graduates. Tax accoun-tants in Bangalore, India, are much cheaper than those in Boston or Baltimore. Moreover, tax accountants in India often work longer hours and can therefore process many more tax returns than only U.S.-based CPAs and tax accountants dur-ing the crunch period of the U.S. tax filing system. 41
1. Which aspects of accounting do you think are more likely to resist the outsourcing trends just discussed? Think about what aspects of accounting are the high-value activities versus the routine standardized ones. (If it’s been a while since you took your accounting courses, reach out for information to someone in your strategy class who is an accounting major.)
2. What industries do you think may offer the best U.S. (or domestic) job opportunities in the future? Which indus-tries do you think may offer the greatest job opportuni-ties in the global market in the future? Use the PESTEL framework and the five forces model to think through a logical set of reasons that some fields will have higher job growth trends than others.
3. Do these types of macroenvironmental and industry trends affect your thinking about selecting a career field after college? Why or why not? Explain.
my STRATEGY
WWW.YAZDANPRESS.COMWWW.YAZDANPRESS.COM

CHAPTER 3 External Analysis: Industry Structure, Competitive Forces, and Strategic Groups 93
1. For an in-depth discussion of Tesla
Motors and the car industry, see Case MHE-
FTR-017-0077645065, “Tesla Motors: Will
sparks fly in the U.S. automobile industry?”
in F. T. Rothaermel (2015), Strategic Manage-ment, 2nd ed. Burr Ridge, IL: McGraw-Hill.
2. For a detailed treatise on how institutions
shape the economic climate and with it firm
performance, see: North, D. C. (1990), Institu-tions, Institutional Change, and Economic Performance (New York: Random House).
3. “BP and Rosneft,” The Economist, October
20, 2012; and “Rosneft completes $55 billion
takeover of TNK-BP,” The Wall Street Journal, March 21, 2013.
4. Hillman, A. J., Keim, G. D., and D. Schuler
(2004), “Corporate political activity: A review
and research agenda,” Journal of Management 30: 837–857; and De Figueireo, R.J.P., and
G. Edwards (2007), “Does private money buy
public policy? Campaign contributions and
regulatory outcomes in telecommunications,”
Journal of Economics & Management Strategy 16: 547–576.
5. This phrase was used in a speech to the
American Enterprise Institute on December 5,
1996, by the former Chairman of the Federal
Reserve Bank, Alan Greenspan, to describe
the mood in the equity markets.
6. Lowenstein, R. (2010), The End of Wall Street (New York: Penguin Press).
7. “Toyota keeps idled workers busy honing
their skills,” The Wall Street Journal, October
13, 2008.
8. “Professor Emeritus Milton Friedman dies
at 94,” University of Chicago press release , November 16, 2006.
9. Lucas, R. (1972), “Expectations and the
neutrality of money,” Journal of Economic Theory 4: 103–124.
10. “Media companies are piling into the
Hispanic market. But will it pay off?” The Economist, December 15, 2012.
11. “Crisis in Europe tightens credit across
the globe,” The New York Times, November
28, 2011; “The European debt crisis: A begin-
ner’s guide,” The Huffington Post, December 21, 2011; “European debt crisis,”
The New York Times, January 10, 2013.
12. Rothaermel, F. T., and M. Thursby
(2007), “The nanotech vs. the biotech revolu-
tion: Sources of incumbent productivity in
research,” Research Policy 36: 832–849; and
Woolley, J. L., and R. M. Rottner (2008),
“Innovation policy and nanotech entrepreneur-
ship,” Entrepreneurship Theory and Practice
32: 791–811.
13. Bettis, R., and M. A. Hitt (1995), “The
new competitive landscape,” Strategic Man-agement Journal 16 (Special Issue): 7–19;
Hill, C.W.L., and F. T. Rothaermel (2003),
“The performance of incumbent firms in the
face of radical technological innovation,”
Academy of Management Review 28: 257–274;
and Afuah, A. (2009), Strategic Innovation: New Game Strategies for Competitive Advan-tage (New York: Routledge).
14. Academy of Management, ONE Division,
2013 domain statement; Anderson, R. C.
(2009), Confessions of a Radical Industrial-ist: Profits, People, Purpose—Doing Busi-ness by Respecting the Earth (New York:
St. Martin’s Press); and Esty, D. C., and
A. S. Winston (2009), Green to Gold: How Smart Companies Use Environmental Strategy to Innovate, Create Value, and Build Competi-tive Advantage, revised and updated
(Hoboken, NJ: John Wiley).
15. The discussion in this section is based on:
Porter, M. E. (1979), “How competitive forces
shape strategy,” Harvard Business Review, March–April: 137–145; Porter, M. E. (1980),
Competitive Strategy: Techniques for Analyz-ing Industries and Competitors (New York:
Free Press); Porter, M. E. (2008), “The five
competitive forces that shape strategy,”
Harvard Business Review, January; and
Magretta, J. (2012), Understanding Michael Porter: The Essential Guide to Competition and Strategy (Boston, MA: Harvard Business
Review Press).
16. Porter, M. E. (2008), “The five competi-
tive forces that shape strategy”; An Interview with Michael E. Porter: The Five Competitive Forces that Shape Strategy, Harvard Business
Publishing video; author’s interviews with
Delta executives.
17. “Everyone else in the travel business
makes money off airlines. The carriers are try-
ing to fight back,” The Economist, August 25,
2012; “How airline ticket prices fell 50% in
30 years (and nobody noticed),” The Atlantic, February 28, 2013.
18. “Fiat nears stake in Chrysler that could
lead to takeover,” The Wall Street Journal, January 20, 2009.
19. “Samsung Sparks Anxiety at Google,”
The Wall Street Journal, February 25, 2013.
20. Whether a product is a substitute (comple-
ment) can be estimated by the cross-elasticity
of demand. The cross-elasticity estimates the
percentage change in the quantity demanded
of good X resulting from a 1 percent change
in the price of good Y. If the cross-elasticity
of demand is greater (less) than zero, the prod-
ucts are substitutes (complements). For
a detailed discussion, see: Allen, W. B.,
K. Weigelt, N. Doherty, and E. Mansfield
(2009), Managerial Economics.
21. This example, as with some others in
the section on the five forces, is drawn from
Magretta, J. (2012), Understanding Michael Porter: The Essential Guide to Competition and Strategy (Boston, MA: Harvard Business
Review Press).
22. Because the threat of entry is one of the
five forces explicitly recognized in Porter’s
model, we discuss barriers to entry when
introducing the threat of entry above. The
competitive industry structure framework is
frequently referred to as the Structure-
Conduct-Performance (SCP) model. For a
detailed discussion, see: Bain, J. S. (1968),
Industrial Organization (New York: John
Wiley); Scherer, F. M., and D. Ross (1990),
Industrial Market Structure and Economic Performance, 3rd ed. (Boston, MA: Houghton-
Mifflin); Carlton, D. W., and J. M. Perloff
(2000), Modern Industrial Organization, 3rd
ed. (Reading, MA: Addison-Wesley); and
Allen, W. B., K. Weigelt, N. Doherty, and
E. Mansfield (2009), Managerial Economics: Theory, Application, and Cases, 7th ed.
(New York: Norton).
23. Besanko, D., E. Dranove, M. Hanley, and
S. Schaefer (2010), The Economics of Strat-egy, 5th ed. (Hoboken, NJ: Wiley).
24. Dixit, A., S. Skeath, and D. H. Reiley
(2009), Games of Strategy, 3rd ed. (New York:
Norton).
25. When there are only two main competi-
tors, it’s called a duopoly, and is a special case
of oligopoly.
26. Yoffie, D. B., and Y. Wang (2009), Cola Wars Continue.
27. Brandenburger, A. M., and B. Nalebuff
(1996), Co-opetition (New York: Currency
Doubleday); and Grove, A. S. (1999), Only the Paranoid Survive (New York: Time
Warner).
28. Milgrom, P., and J. Roberts (1995),
“Complementarities and fit strategy, structure,
and organizational change in manufacturing,”
Journal of Accounting and Economics
19(2-3): 179–208; and Brandenburger, A. M.,
and B. Nalebuff (1996), Co-opetition.
29. In this recent treatise, Porter also high-
lights positive-sum competition. See Porter,
M. E. (2008), “The five competitive forces
that shape strategy,” Harvard Business Review, January.
ENDNOTES
WWW.YAZDANPRESS.COMWWW.YAZDANPRESS.COM

94 CHAPTER 3 External Analysis: Industry Structure, Competitive Forces, and Strategic Groups
30. “Reading between the lines,” The Econo-mist, March 26, 2009; and “New York Times
is near web charges,” The Wall Street Journal, January 19, 2010.
31. “Global online ad spending forecast to
exceed print in 2015,” MarketingCharts, December 3, 2012.
32. Hunt, M. S. (1972), Competition in the Major Home Appliance Industry, 1960–1970, unpublished doctoral dissertation, Harvard
University; Hatten, K. J., and D. E. Schendel
(1977), “Heterogeneity within an industry:
Firm conduct in the U.S. brewing industry,”
Journal of Industrial Economics 26: 97–113;
and Porter, M. E. (1980), Competitive Strat-egy: Techniques for Analyzing Industries and Competitors (New York: Free Press).
33. This discussion is based on: Hunt, M. S.
(1972), Competition in the Major Home Appliance Industry, 1960–1970; Hatten, K. J.,
and D. E. Schendel (1977), “Heterogeneity
within an industry: Firm conduct in the U.S.
brewing industry”; Porter, M. E. (1980),
Competitive Strategy; Cool, K., and
D. Schendel (1988), “Performance differences
among strategic group members,” Strategic Management Journal 9: 207–223; Nair, A.,
and S. Kotha (2001), “Does group member-
ship matter? Evidence from the Japanese steel
industry,” Strategic Management Journal 22:
221–235; and McNamara, G., D. L. Deep-
house, and R. Luce (2003), “Competitive
positioning within and across a strategic group
structure: The performance of core, secondary,
and solitary firms,” Strategic Management Journal 24: 161–181.
34. In Exhibit 3.5 , United Airlines is the big-
gest bubble, because it merged with Continen-
tal in 2010, creating the largest airline in the
United States. Delta is the second-biggest air-
line in the U.S. after merging with Northwest
Airlines in 2008.
35. American’s hub is at Dallas–Fort Worth;
Continental’s is at Newark, New Jersey; Unit-
ed’s is at Chicago, Illinois; and U.S. Airways’
is at Charlotte, North Carolina.
36. Caves, R. E., and M. E. Porter (1977),
“From entry barriers to mobility barriers,”
Quarterly Journal of Economics 91:
241–262.
37. Porter, M. E. (2008), “The five com-
petitive forces that shape strategy,” Harvard Business Review, January; and Magretta, J.
(2012), Understanding Michael Porter: The Essential Guide to Competition and Strategy, pp. 56–57.
38. “Crying foul, ex-UBS banker starts prison
term,” The Wall Street Journal, January 9,
2010.
39. Sources: Corporate website; Orciari, M.
(2013), “Industry self-regulation permits junk
food ads in programming popular with chil-
dren,” Yale News, March 12. Accessed online;
Moss, M. (2013), “How the fast food industry
creates and keeps selling the crave,” New York Times Magazine, February 24.
40. “E-Readers everywhere: The inevitable
shakeout,” Bloomberg BusinessWeek, January 11, 2010.
41. The my Strategy module is based on:
Friedman, T. (2005), The World Is Flat: A Brief History of the Twenty-first Century (New
York: Farrar, Strauss & Giroux); and Value-
Notes, http://www.sourcingnotes.com/content/
view/197/54/ .
WWW.YAZDANPRESS.COMWWW.YAZDANPRESS.COM

WWW.YAZDANPRESS.COMWWW.YAZDANPRESS.COM

96
Chapter 4
Chapter Outline
4.1 Looking Inside the Firm for Core
Competencies
4.2 The Resource-Based View Two Critical Assumptions The VRIO Framework How to Sustain a Competitive Advantage
4.3 The Dynamic Capabilities Perspective
4.4 The Value Chain Analysis
4.5 Implications for the Strategist Using SWOT Analysis to Combine External and Internal Analysis
Learning Objectives
After studying this chapter, you should be able to:
LO 4-1 Differentiate among a firm’s resources, capabilities, core competencies, and activities.
LO 4-2 Compare and contrast tangible and intan-gible resources.
LO 4-3 Evaluate the two critical assumptions behind the resource-based view.
LO 4-4 Apply the VRIO framework to assess the competitive implications of a firm’s resources.
LO 4-5 Evaluate different conditions that allow firms to sustain their competitive advantage.
LO 4-6 Outline how dynamic capabilities can help a firm sustain competitive advantage.
LO 4-7 Apply a value chain analysis to understand which of the firm’s activities in the process of transforming inputs into outputs generate differentiation and which drive costs.
LO 4-8 Conduct a SWOT analysis to combine exter-nal and internal analysis and derive strategic implications.
Internal Analysis: Resources, Capabilities, and Core Competencies
WWW.YAZDANPRESS.COMWWW.YAZDANPRESS.COM

97
W
Nike’s Core Competency:
The Risky Business
of Fairy Tales
WITH ANNUAL REVENUES doubling during the last decade to over $25 billion and having a globally rec-ognized brand, Nike is the undisputed leader in the athletic shoe and apparel industry. The number two adidas has some $15 billion in sales, while recent entrant Under Armour reports revenues of less than $1 billion. Nike is tremendously successful, holding close to a 60 percent market share in running and nearly a 90 percent market share in basketball.
The Beaverton, Oregon, company has come a long way from its humble beginnings. It was founded by University of Oregon track and field coach Bill Bowerman and middle-distance runner Phil Knight in 1964 originally as Blue Ribbon Sports. In 1971, the company was renamed Nike (the “goddess of victory” in Greek mythology) and the now iconic “swoosh” was designed by a Portland State University student.
Coach Bowerman was a true innovator because he constantly sought ways to give his athletes a com-petitive edge. He experimented with many factors affecting running performance, from different track surfaces to rehydration drinks. Coach Bowerman’s biggest focus, however, was on providing a better run-ning shoe for his athletes. While sitting at the break-fast table one Sunday morning and absentmindedly looking at his waffle iron, Coach Bowerman had an epiphany. He began pouring hot, liquid urethane into the waffle iron—ruining it in the process—but com-ing up with the now famous waffle-type sole that not only provided better traction but was also lighter than traditional running shoes.
After completing his undergraduate degree at the University of Oregon and serving in the U.S. Army, Phil Knight entered the MBA program at Stanford. One entrepreneurship class required him to come up with a business idea. So, he wrote a term paper on how to disrupt the leading athletic shoe maker adidas. The research question he came up with was “Can Japanese sports shoes do to German sports shoes what Japanese cameras have done to German cameras?” 1 At that time,
adidas athletic shoes were the gold standard. They were also expensive and hard to find in the U.S. After several failed attempts to interest Japanese sneaker makers, Phil Knight was able to strike a distribution agreement with Tiger Shoes. After his first shipment arrived in the U.S., Phil Knight sent some of the running shoes to his former coach Bill Bowerman, hoping to make a sale. To his surprise, Bill Bowerman replied that he was inter-ested in becoming a business partner and contributing his innovative ideas on how to improve running shoes, including the waffle design. With an investment of $500 each and a handshake, the venture commenced.
Based on a highly successful string of innovations including Nike Air, by 1979 the company had cap-tured more than a 50 percent market share for run-ning shoes in the United States. A year later, Nike went public. In 1984, Nike signed Michael Jordan—whom many consider the greatest basketball player of all time—with an unprecedented multimillion-dollar endorsement deal. Rather than spreading its market-ing budget more widely as was common in the sports industry at that time, Nike made the unorthodox move to spend basically its entire budget for a specific sport on a single star athlete. Nike sought to sponsor future superstars that embodied an unlikely success story. Michael Jordan’s story is that he had been cut from his high school basketball team only to become the greatest basketball player ever.
In the 1990s and 2000s, Nike continued to spon-sor track and field sports stars such as Marion Jones, as well as Kobe Bryant in basketball. With the help of major celebrity endorsements, Nike was also able to move on to different sports and their superstars,
CHAPTER CASE 4
Kobe Bryant
WWW.YAZDANPRESS.COMWWW.YAZDANPRESS.COM

98
ONE OF THE KEY messages of this chapter is that a firm’s ability to gain and sus-
tain competitive advantage is partly driven by core competencies —unique strengths
that are embedded deep within a firm. Core competencies allow a firm to differentiate its
products and services from those of its rivals, creating higher value for the customer or
offering products and services of comparable value at lower cost. Nike is less about run-
ning shoes or sports apparel than about unlocking human potential. This is captured in
Nike’s mission “ to bring inspiration and innovation to every athlete in the world” (and “ if you have a body, you are an athlete ”). 3 Nike uses its heroes to tell a story whose moral is
that through sheer will, tenacity, and hard work, anyone can unlock the hero within and
achieve amazing things. Nike will help everyone become a hero. Just Do It! This type of
mythical brand image has allowed Nike to not only enter but often dominate one sport after
another, from running to ice hockey.
Nike’s unique strength, built over many decades and embedded deep within the firm,
allows it to differentiate its products from its rivals and create more perceived value for
its customers. To hone and refine this core competency, Nike spent some $4 billion, or
16 percent of annual revenues, in 2012 alone on sponsoring athletes. Its iconic brand alone
is worth some $16 billion, making it one of the most valuable in the world. 4
In this chapter, we study analytical tools to explain why differences in firm perfor-
mance exist even within the same industry. For example, why does Nike outperform adi-
das, ASICS, Li Ning, New Balance, Mizuno, Puma, Skechers, and Under Armour in the
athletic shoe and apparel industry? Since these companies compete in the same industry
and face the same external opportunities and threats, the source for some of the observable
performance difference must be found inside the firm. When discussing industry, firm,
and other effects in explaining superior performance, we noted that up to 55 percent of
the overall performance differences is explained by firm-specific effects (see Exhibit 1.1).
including golf with Tiger Woods, cycling with Lance Armstrong, soccer with Wayne Rooney, and football with Michael Vick.
Over time, Nike developed a deep expertise in cre-ating heroes. It picked athletes that succeeded against the odds—cancer survivor Lance Armstrong, double amputee “blade runner” Oscar Pistorius, and other ath-letes hailing from disadvantaged backgrounds. Although this core competency made Nike highly successful, it has not been without considerable risks. Time and time again, Nike’s heroes have become unmasked as cheat-ers, frauds, and criminals, some of whom have com-mitted serious felonies, such as (alleged) homicide. As Nike veers from one public relations disaster to the next, disappointment with the brand and its promise may eventually set in causing customers to go elsewhere. 2
After reading the chapter, you will find more about this
case, with related questions, on page 120.
EXHIBIT 4.1 / Some of Nike’s (Past and Current) Celebrity Endorsements
Oscar Pistorious Lance Armstrong
WWW.YAZDANPRESS.COMWWW.YAZDANPRESS.COM

CHAPTER 4 Internal Analysis: Resources, Capabilities, and Core Competencies 99
Looking inside the firm to analyze its resources, capabilities, and core competencies
allows us to understand the firm’s strengths and weaknesses. Linking these insights from a
firm’s internal analysis to the ones derived in the prior chapter on external analysis allows
managers to determine their strategic options. Ideally, firms want to leverage their internal
strengths to exploit external opportunities, and to mitigate internal weaknesses and exter-
nal threats.
Exhibit 4.2 depicts how we move from the firm’s external environment to its internal
environment. To formulate and implement a strategy that enhances the firm’s chances of
gaining and sustaining competitive advantage, the firm must have certain types of resources
and capabilities that combine to form core competencies. The goal should be to develop
resources, capabilities, and competencies that create a strategic fit with the firm’s environ-
ment. Rather than creating a static fit, the firm’s internal strengths should change with its
external environment in a dynamic fashion. The chapter will provide a deeper understand-
ing of the sources of competitive advantage that reside within a firm.
To gain a better understanding of why and how firm differences explain competitive
advantage, we begin this chapter by taking a closer look at core competencies. Next, we
introduce the resource-based view of the firm to provide an analytical model that allows
us to assess resources, capabilities, and competencies and their potential for creating a
sustainable competitive advantage. We then discuss the dynamic capabilities perspective, a more recent model that emphasizes a firm’s ability to modify and leverage its resource
base to gain and sustain a competitive advantage in a constantly changing environment. We
finally turn our attention to the value chain analysis to gain a deeper understanding of the
internal activities a firm engages in when transforming inputs into outputs. We conclude
with Implications for the Strategist, with a particular focus on how to use the SWOT analy-sis to combine external and internal analysis.
core competencies
Unique strengths, embedded deep within a firm, that allow a firm to differentiate its products and services from those of its rivals, creating higher value for the customer or offering products and services of comparable value at lower cost.
Political Economic
Sociocultural
TechnologicalEcological
LegalLooking Inside the Firm:
Resources, Capabilities,
Core Competencies,
and Activities
Strategic Group
Industry
PESTEL
Environment
PESTEL
Environment
EXHIBIT 4.2 / Looking Inside the Firm for Competitive Advantage: Resources, Capabilities, Core Competencies, and Activities
WWW.YAZDANPRESS.COMWWW.YAZDANPRESS.COM

100 CHAPTER 4 Internal Analysis: Resources, Capabilities, and Core Competencies
4.1 Looking Inside the Firm for Core Competencies
Let’s begin by taking a closer look at core competencies . These are unique strengths,
embedded deep within a firm. Core competencies allow a firm to differentiate its products
and services from those of its rivals, creating higher value for the customer or offering
products and services of comparable value at lower cost. The important point here is that
competitive advantage can be driven by core competencies. 5
Company examples of core competencies abound: Honda’s life began with a small two-
cycle motorbike engine. Through continuous learning over several decades, and often from
lessons learned from failure, Honda built the core competency to design and manufacture
small but powerful and highly reliable engines for which it now is famous. This core compe-
tency results from superior engineering know-how and skills carefully nurtured and honed
over several decades. Today, Honda engines can be found everywhere: in cars, SUVs, vans,
trucks, motorcycles, ATVs, boats, airplanes, generators, snow blowers, lawn mowers and
other yard equipment, and so on. Due to their superior performance, Honda engines have
been the only ones used in the Indy Racing League (IRL) since 2006. Not coincidentally, this
was also the first year in its long history that the Indy 500 was run without a single engine
problem. One way to look at Honda is to view it as a company with a distinct competency
in engines and a business model of finding places to put its engines. That is, underneath
the products and services that make up the visible side of competition lies a diverse set of
invisible competencies that make this happen. These invisible core competencies reside deep
within the firm. Companies, therefore, compete as much in the product and service markets
as they do in developing and leveraging core competencies. Although invisible by them-
selves, core competencies find their expression in superior products and services . Exhibit 4.3
identifies the core competencies of a number of companies, with application examples.
LO 4-1
Differentiate among a firm’s resources, capabilities, core competencies, and activities.
EXHIBIT 4.3 / Company Examples of Core Competencies and Applications
Company Core Competencies Application Examples
Amazon.com Providing the largest selection of items online, combined with superior IT systems and customer service.
Expansion to cover most electronic media, digital downloads, tablet computers (Kindle series), as well as apparel, toys, electronics, tools, etc. Offering cloud computing services.
Apple Leveraging industrial design to integrate hardware and software in innovative and category-defining mobile devices that take the user’s experience to a new level.
iMac, iPhone, iPod, iPad, iTunes, Apple TV.
Coca-Cola Leveraging one of the world’s most recognized brand names (based on its original “secret formula”) into a diverse lineup of soft drinks and other beverages.
Coke, Coke Zero, Diet Coke, Fanta, Fresca, Sprite, Dasani, Powerade, etc.
ExxonMobil Discovering and exploring fossil-fuel–based energy sources globally.
Oil and gas.
Facebook Connecting over one billion social media users worldwide.
News feed, timeline, and graph search.
General Electric
Designing and implementing efficient management processes, developing and training leaders, leveraging deep industrial engineering expertise.
Energy, health care, airplane jet engines, finance.
WWW.YAZDANPRESS.COMWWW.YAZDANPRESS.COM

CHAPTER 4 Internal Analysis: Resources, Capabilities, and Core Competencies 101
Company Core Competencies Application Examples
Google Creating proprietary algorithms to develop software products and services for the Internet and mobile computing.
Online search, Android mobile operating system, Chrome OS, Chrome web browser, Google Play, AdWords, AdSense, Google docs, Gmail, Goog411, Google Maps/Earth, Google Books, Google Scholar, etc.
Honda Designing and manufacturing of small but powerful and highly reliable internal combustion engines.
Motorcycles, cars, ATVs, sporting boats, snow mobiles, lawn mowers, small aircraft, etc.
IKEA Designing modern functional home furnishings at low prices offered in a unique retail experience.
Fully furnished room setups, practical tools for all rooms, do-it-yourself.
McKinsey Developing practice-relevant knowledge, insights, and frameworks.
Management; in particular, strategy consulting targeted toward company and government leaders.
Netflix Proprietary algorithms to track individual customer preferences.
DVD-by-mail rentals, streaming media (including proprietary) content, connection to game consoles.
Starbucks Providing high-quality beverages and selected food items, combined with superior customer service in a friendly and welcoming environment.
Customized handcrafted (coffee) beverages; warm/cold, seasonal, and fruit drinks; comfortable and convenient ambience in retail outlets; free Wi-Fi Internet connections.
Tesla Motors Designing high-performance battery-powered motors and power trains.
Tesla Roadster, Tesla Model S, Tesla Model X.
UPS Providing superior supply chain management services and solutions at low cost.
Package tracking and delivery, transportation, ecommerce, consulting services.
Since core competencies are critical to gaining and sustaining competitive advan-
tage, it is important to understand how they are created. Core competencies are built
through the interplay of resources and capabilities. Exhibit 4.4 shows this relationship.
Resources are any assets such as cash, buildings, machinery, or intellectual property that
a company can draw on when crafting and executing a strategy. Resources can be either
tangible or intangible. Capabilities are the organizational and managerial skills neces-
sary to orchestrate a diverse set of resources and to deploy them strategically. Capa-
bilities are by nature intangible. They find their expression in a company’s structure,
routines, and culture. Activities are distinct and fine-grained business processes such
as order taking, the physical delivery of products, or invoicing customers. Each distinct
activity enables firms to add incremental value by transforming inputs into goods and
services. In the interplay of resources and capabilities, resources reinforce core compe-
tencies, while capabilities allow managers to orchestrate their core competencies. Strate-
gic choices find their expression in a set of specific firm activities, which leverage core
competencies for competitive advantage. The arrows leading back from performance to
resources and capabilities indicate that superior performance in the marketplace gener-
ates profits that can be reinvested into the firm (retained earnings) to further hone and
upgrade a firm’s resources and capabilities in its pursuit of achieving and maintaining a
strategic fit within a dynamic environment.
Core competencies that are not continuously nourished will eventually lose their
ability to yield a competitive advantage. In the consumer electronics industry, Best Buy
resources Any assets that a firm can draw on when formulating and implementing a strategy.
capabilities
Organizational and managerial skills necessary to orchestrate a diverse set of resources and deploy them strategically.
activities Distinct and fine-grained business processes that enable firms to add incremental value by transforming input into goods and services.
WWW.YAZDANPRESS.COMWWW.YAZDANPRESS.COM

102 CHAPTER 4 Internal Analysis: Resources, Capabilities, and Core Competencies
outperformed Circuit City based on its strengths in customer-centricity (segmenting
customers based on demographic, attitudinal, and value tiers, and configuring stores
to serve the needs of the customer segments in that region), employee development,
and exclusive branding. Although Best Buy outperformed Circuit City (which filed for
bankruptcy in 2009), more recently Best Buy did not hone and upgrade its core com-
petencies sufficiently to compete effectively against Amazon.com , the world’s largest
online retailer. As such, Amazon does not have the overhead expenses associated with
maintaining buildings or human sales forces, and can therefore undercut in-store retail-
ers on price. When a firm does not invest in continual upgrading or improving core
competencies, its competitors are more likely to develop equivalent or superior skills, as
did Amazon. This insight will allow us to explain differences between firms in the same
industry, as well as competitive dynamics, over time. It also will help us identify strate-
gies with which firms gain and sustain a competitive advantage and weather an adverse
external environment.
4.2 The Resource-Based View
To gain a deeper understanding of how resources, capabilities, and competencies can be a
source of competitive advantage, we turn to the resource-based view of the firm to provide
a model that systematically aids in identifying core competencies. 6 As the name suggests,
this model sees resources as key to superior firm performance. As Exhibit 4.5 illustrates,
resources fall broadly into two categories: tangible and intangible. Tangible resources have physical attributes and are visible. Examples of tangible resources are labor, capital,
land, buildings, plant, equipment, and supplies. Intangible resources have no physical
attributes and thus are invisible. Examples of intangible resources are a firm’s culture, its
knowledge, brand equity, reputation, and intellectual property.
Let’s take Apple as an example. Its tangible resources (“fixed assets”), valued at $15 billion,
include its headquarters (a campus with multiple buildings) on Infinite Loop in Cupertino,
LO 4-2
Compare and contrast tangible and intangible resources.
Superior Firm
Performance
CompetitiveAdvantage
ActivitiesCore
Competencies
Resources
Capabilities
Reinvest, Hone, & Upgrade
Reinforce
Leverage
Orchestrate
Reinvest, Hone, & Upgrade EXHIBIT 4.4 / Linking Resources, Capabilities, Core Competencies, and Activities to Competitive Advantage and Superior Firm Performance
WWW.YAZDANPRESS.COMWWW.YAZDANPRESS.COM

CHAPTER 4 Internal Analysis: Resources, Capabilities, and Core Competencies 103
California, and some cutting-edge machinery and
equipment, including product tooling and manu-
facturing process equipment. 7 The Apple brand, an
intangible resource, is valued at over $180 billion
(#1 worldwide)—which is 12 times higher than
the value of its tangible assets. 8 This relationship
is even more skewed if we look at Google. Its tan-
gible resources (“fixed assets”), valued at $8 bil-
lion, include its headquarters (“The Googleplex”)
in Mountain View, California, and numerous server
farms (clusters of computer servers) across the
globe. 9 The Google brand, an intangible resource,
is valued at over $110 billion (No. 3 worldwide)—
which is 14 times higher than the value of its tan-
gible assets. 10
Google’s headquarters provides examples
of both tangible and intangible resources. The
Googleplex is a piece of land with a futuristic
building, and thus a tangible asset. The location
of the company in the heart of Silicon Valley is an
intangible resource that provides access to a valu-
able network of contacts and gives the company
several benefits. It allows Google to tap into a large and computer-savvy work force and
access graduates and knowledge spillovers from a large number of universities, including
San Francisco State University, San Jose State University, Santa Clara University, Stanford,
and the University of California, Berkeley, among others, which adds to Google’s technical
and managerial capabilities. 11 Another benefit stems from Silicon Valley’s designation as
having the largest concentration of venture capital in the United States, which is beneficial
because venture capitalists tend to prefer local investments to ensure closer monitoring. 12
Google received initial funding from the famous venture capital firms Kleiner Perkins Cau-
field & Byers and Sequoia Capital, both located in Silicon Valley.
Competitive advantage is more likely to spring from intangible rather than tangible
resources. Tangible assets, such as buildings or computer servers, can be bought on the
open market by any comers who have the necessary cash. However, a brand name must
be built, often over long periods of time. Google (founded in 1998) accomplished its enor-
mous brand valuation fairly quickly due to its ubiquitous Internet presence, while most
of the other companies in the global top-10 most valuable brands—Apple, IBM, McDon-
ald’s, Microsoft, Coca-Cola, Marlboro, AT&T, and Verizon—took much longer. 13 The
telecom provider China Mobile rounds out the top-10 brands with a valuation at roughly
$50 billion. This state-owned telecommunications company also rose fairly quickly to
prominence (it was founded in 1997), because it is the world’s largest mobile phone opera-
tor with over 710 million subscribers. 14 In comparison, AT&T Mobility, the largest mobile
operator in the United States, has about 110 million subscribers. 15
It is important to note that the resource-based view of the firm uses the term resource
much more broadly than previously defined. In the resource-based view of the firm, a
resource includes any assets as well as any capabilities and competencies that a firm can
draw upon when formulating and implementing strategy. In addition, the usefulness of the
resource-based view to explain and predict competitive advantage rests upon two critical
assumptions about the nature of resources, to which we turn next.
resource-based view
A model that sees certain types of resources as key to superior firm performance. If a resource exhibits VRIO attributes (see the section “The VRIO Framework” below), the resource enables the firm to gain and sustain a competitive advantage.
tangible resources
Resources that have physical attributes and thus are visible.
intangible resources
Resources that do not have physical attributes and thus are invisible.
Intangible
• Culture
• Knowledge
• Brand Equity
• Reputation
• Intellectual Property
Invisible,
No Physical Attributes
• Patents
• Copyrights
• Trademarks
• Trade Secrets
Tangible
Visible,
Physical Attributes
• Labor
• Capital
• Land
• Buildings
• Plant
• Equipment
• Supplies
Resources
EXHIBIT 4.5 / Tangible and Intangible Resources
WWW.YAZDANPRESS.COMWWW.YAZDANPRESS.COM
104 CHAPTER 4 Internal Analysis: Resources, Capabilities, and Core Competencies
TWO CRITICAL ASSUMPTIONS
Two assumptions are critical in the resource-based model: (1) resource heterogeneity
and (2) resource immobility. 16 What does this mean? In the resource-based view, a firm
is assumed to be a bundle of resources, capabilities, and competencies. The first criti-
cal assumption— resource heterogeneity —is that bundles of resources, capabilities, and
competencies differ across firms. The insight that the resource-based view brings to strat-
egy is that the resource bundles of firms competing in the same industry (or even the same
strategic group) are unique to some extent and thus differ from one another. For exam-
ple, although Southwest Airlines (SWA) and Alaska Airlines both compete in the same
strategic group (low-cost, point-to-point airlines, see Exhibit 3.5), they draw on different
resource bundles. SWA’s employee productivity tends to be higher than that of Alaska
Airlines, because the two companies differ along human and organizational resources. At
SWA, job descriptions are informal and employees pitch in to “get the job done.” Pilots
may help load luggage to ensure an on-time departure; flight attendants clean airplanes to
help turn them around at the gate within 15 minutes from arrival to departure. This allows
SWA to keep its planes flying for longer and lowers its cost structure, savings which SWA
passes on to passengers in lower ticket prices.
The second critical assumption— resource immobility —is that resources tend to be
“sticky” and don’t move easily from firm to firm. Because of that stickiness, the resource
differences that exist between firms are difficult to replicate and, therefore, can last for a
long time. For example, SWA has enjoyed a sustained competitive advantage, allowing
it to outperform its competitors over several decades. That resource difference is not due
to a lack of imitation attempts, though. Continental and Delta both attempted to copy
SWA, with Continental Lite and Song airline offerings, respectively. Neither Continen-
tal nor Delta, however, was able to successfully imitate the resource bundles and firm
capabilities that make SWA unique. The important point is that resource bundles are dif-
ferent across firms, and these differences can persist for long periods of time. These two
assumptions about resources that firms may control are critical to explaining superior
firm performance in the resource-based model.
Note, by the way, that the critical assumptions of the resource-based model are fun-
damentally different from the way in which a firm is viewed in the perfectly competitive
industry structure introduced in Chapter 3. In perfect competition, all firms have access
to the same resources and capabilities, ensuring that any advantage that one firm has will
be short-lived. That is, when resources are freely available and mobile, competitors can
move quickly to acquire resources that are utilized by the current market leader. Although
some commodity markets approach this situation, most other markets include firms whose
resource endowments differ from one another. The resource-based view, therefore, pro-
vides useful insights to managers in a firm’s quest for competitive advantage.
THE VRIO FRAMEWORK
We are now in a position to evaluate a firm’s resource endowments and answer the ques-
tion of what resource attributes underpin competitive advantage. In the resource-based
model, certain types of resources are seen as key to superior firm performance. 17 For a
resource to be the basis of a competitive advantage, it must be valuable (V), rare (R), and
costly to imitate (I), and the firm must organize (O) to capture the value of the resource.
Following the lead of Jay Barney, one of the pioneers of the resource-based view of the
firm, we call this model the VRIO framework . 18 According to this model, a firm can gain
LO 4-3
Evaluate the two critical assumptions behind the resource-based view.
LO 4-4
Apply the VRIO framework to assess the competitive implications of a firm’s resources.
WWW.YAZDANPRESS.COMWWW.YAZDANPRESS.COM

CHAPTER 4 Internal Analysis: Resources, Capabilities, and Core Competencies 105
and sustain a competitive advantage only when it has resources that satisfy all of the VRIO
criteria. Keep in mind that resources in the VRIO framework are broadly defined to include
any assets as well as any capabilities and competencies that a firm can draw upon when
formulating and implementing strategy.
Exhibit 4.6 captures the VRIO framework. You can use this decision tree to decide if the
resource, capability, or competency under consideration fulfills the VRIO requirements.
As you study the following discussion of each of the VRIO attributes, you will see that
the attributes accumulate. Only if a firm’s managers are able to answer “yes” four times to
the attributes listed in the decision tree is the resource in question a core competency that
underpins a firm’s sustainable competitive advantage.
VALUABLE (V). A resource is valuable if it helps a firm increase the perceived value of
its product or service in the eyes of consumers, either by adding attractive features or by
lowering price because the resource helps the firm lower its costs. By raising the perceived
value of the product, the resource increases the firm’s revenues, in turn increasing the
firm’s profitability (assuming costs are not increasing). If the resource allows the firm to
lower its cost, it also increases profitability (assuming perceived value is not decreasing).
Honda’s competency in designing and producing efficient engines increases the per-
ceived value of its products for consumers. That competency, supported by its lean manu-
facturing system, enables quality to be designed and built directly into the product and also
helps Honda lower its costs. Thus, Honda’s competency in designing and building engines
is considered a valuable resource in the VRIO framework.
In our quest for competitive advantage, we next need to find out if the resource is
also rare.
SustainedCompetitiveAdvantage
Is the Resource, Capability, or Competency… and Is the Firm…
Valuable RareCostly toImitate
Organizedto Capture
Value?
TemporaryCompetitive Advantage
TemporaryCompetitive Advantage
Competitive Parity
Competitive Disadvantage
YES YES YES YES
NO NO NO NO
EXHIBIT 4.6 / Applying the Resource-Based View: A Decision Tree Revealing Competitive Implications
resource heterogeneity
Assumption in the resource-based view that a firm is a bundle of resources and capabilities that differ across firms.
resource immobility
Assumption in the resource-based view that a firm has resources that tend to be “sticky” and that do not move easily from firm to firm.
VRIO framework A theoretical framework that explains and predicts firm-level competitive advantage. A firm can gain a competitive advantage if it has resources that are valuable (V), rare (R), and costly to imitate (I). The firm also must organize (O) to capture the value of the resources.
valuable resource One of the four key criteria in the VRIO framework. A resource is valuable if it helps a firm increase the perceived value of its product or service, either by adding attractive features or lowering costs.
WWW.YAZDANPRESS.COMWWW.YAZDANPRESS.COM
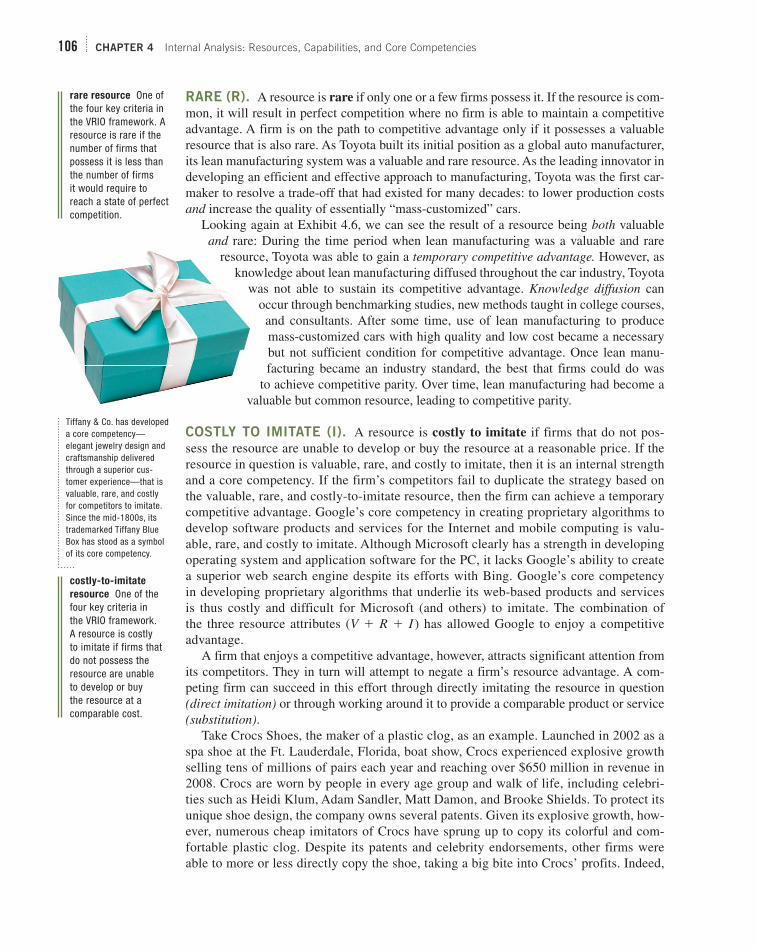
106 CHAPTER 4 Internal Analysis: Resources, Capabilities, and Core Competencies
RARE (R). A resource is rare if only one or a few firms possess it. If the resource is com-
mon, it will result in perfect competition where no firm is able to maintain a competitive
advantage. A firm is on the path to competitive advantage only if it possesses a valuable
resource that is also rare. As Toyota built its initial position as a global auto manufacturer,
its lean manufacturing system was a valuable and rare resource. As the leading innovator in
developing an efficient and effective approach to manufacturing, Toyota was the first car-
maker to resolve a trade-off that had existed for many decades: to lower production costs
and increase the quality of essentially “mass-customized” cars.
Looking again at Exhibit 4.6 , we can see the result of a resource being both valuable
and rare: During the time period when lean manufacturing was a valuable and rare
resource, Toyota was able to gain a temporary competitive advantage. However, as
knowledge about lean manufacturing diffused throughout the car industry, Toyota
was not able to sustain its competitive advantage. Knowledge diffusion can
occur through benchmarking studies, new methods taught in college courses,
and consultants. After some time, use of lean manufacturing to produce
mass-customized cars with high quality and low cost became a necessary
but not sufficient condition for competitive advantage. Once lean manu-
facturing became an industry standard, the best that firms could do was
to achieve competitive parity. Over time, lean manufacturing had become a
valuable but common resource, leading to competitive parity.
COSTLY TO IMITATE (I). A resource is costly to imitate if firms that do not pos-
sess the resource are unable to develop or buy the resource at a reasonable price. If the
resource in question is valuable, rare, and costly to imitate, then it is an internal strength
and a core competency. If the firm’s competitors fail to duplicate the strategy based on
the valuable, rare, and costly-to-imitate resource, then the firm can achieve a temporary
competitive advantage. Google’s core competency in creating proprietary algorithms to
develop software products and services for the Internet and mobile computing is valu-
able, rare, and costly to imitate. Although Microsoft clearly has a strength in developing
operating system and application software for the PC, it lacks Google’s ability to create
a superior web search engine despite its efforts with Bing. Google’s core competency
in developing proprietary algorithms that underlie its web-based products and services
is thus costly and difficult for Microsoft (and others) to imitate. The combination of
the three resource attributes ( V 1 R 1 I ) has allowed Google to enjoy a competitive
advantage.
A firm that enjoys a competitive advantage, however, attracts significant attention from
its competitors. They in turn will attempt to negate a firm’s resource advantage. A com-
peting firm can succeed in this effort through directly imitating the resource in question
( direct imitation ) or through working around it to provide a comparable product or service
( substitution ). Take Crocs Shoes, the maker of a plastic clog, as an example. Launched in 2002 as a
spa shoe at the Ft. Lauderdale, Florida, boat show, Crocs experienced explosive growth
selling tens of millions of pairs each year and reaching over $650 million in revenue in
2008. Crocs are worn by people in every age group and walk of life, including celebri-
ties such as Heidi Klum, Adam Sandler, Matt Damon, and Brooke Shields. To protect its
unique shoe design, the company owns several patents. Given its explosive growth, how-
ever, numerous cheap imitators of Crocs have sprung up to copy its colorful and com-
fortable plastic clog. Despite its patents and celebrity endorsements, other firms were
able to more or less directly copy the shoe, taking a big bite into Crocs’ profits. Indeed,
rare resource One of the four key criteria in the VRIO framework. A resource is rare if the number of firms that possess it is less than the number of firms it would require to reach a state of perfect competition.
costly-to-imitate
resource One of the four key criteria in the VRIO framework. A resource is costly to imitate if firms that do not possess the resource are unable to develop or buy the resource at a comparable cost.
Tiffany & Co. has developed a core competency—elegant jewelry design and craftsmanship delivered through a superior cus-tomer experience—that is valuable, rare, and costly for competitors to imitate. Since the mid-1800s, its trademarked Tiffany Blue Box has stood as a symbol of its core competency.
WWW.YAZDANPRESS.COMWWW.YAZDANPRESS.COM

CHAPTER 4 Internal Analysis: Resources, Capabilities, and Core Competencies 107
Crocs’ share price plunged from a high of $74.75 to $0.94 in little over one year. 19
This example illustrates that competitive advantage cannot be sustained if the underlying
capability (i.e., creating molds to imitate the shape, look, and feel of the original Crocs
shoe) can easily be replicated and can thus be directly imitated. Any competitive advan-
tage in a fashion-driven industry, moreover, is notoriously short-lived if the company
fails to continuously innovate or build such brand recognition that imitators won’t gain
a foothold in the market. Crocs Shoes was more or less a “one-trick pony.” Nike, on the
other hand, was able to do both—continuously innovate and build tremendous brand
recognition—and thus provides a counter-example of how to avoid losing a competitive
advantage through direct imitation. As Nike continues to innovate and moves into dif-
ferent sports, it is a moving target. This makes it much harder for competitors to imitate
Nike directly.
The second avenue of imitation for a firm’s valuable and rare resource is through
substitution. This is often accomplished through strategic equivalence. Take the exam-
ple of Jeff Bezos launching and developing Amazon.com . Prior to inception, the retail
book industry was dominated by a few large chains and many independent mom-
and-pop bookstores. Bezos realized that he could not compete with the big-box book
retailers directly and needed a different business model. The emergence of the Internet
allowed him to come up with a new distribution system that negated the need for retail
stores (and thus high real-estate costs). Bezos’ new business model of ecommerce not
only substituted for the traditional (fragmented) supply chain in book retailing, but also
allowed Amazon to offer lower prices due to its lower operating costs. Amazon uses a
strategic equivalent substitute to satisfy a customer need previously met by brick-and-
mortar retail stores.
In some instances, firms are able to combine direct imitation and substitution when
attempting to mitigate the competitive advantage of a rival. With its smartphones in the
Galaxy line of models, Samsung has been able to imitate successfully the look and feel of
Apple’s iPhones. Samsung’s Galaxy smartphones use Google’s Android operating system
and apps from Google Play as an alternative to Apple’s iOS and iTunes store. Although
a U.S. court has found that Samsung infringed on some of Apple’s patents in its older
models, apparently Samsung has found a way to successfully imitate the look and feel of
Apple’s iPhones in its newer models. Samsung achieved this through a combination of
direct imitation (look and feel) and substitution (using Google’s mobile operating system
and app store). 20
ORGANIZED TO CAPTURE VALUE (O). The final criterion of whether a rare, valu-
able, and costly-to-imitate resource can form the basis of a sustained competitive advan-
tage depends on the firm’s ability to capture the resource’s value-creating potential. To
fully exploit the competitive potential of its resources, capabilities, and competencies,
a firm must be organized to capture value —that is, it must have in place an effective
organizational structure and coordinating systems. (We will study organizational design in
detail in Chapter 11.)
Before Apple, HP, Lenovo, or Microsoft had any significant share of the personal com-
puter market, Xerox PARC invented and developed an early word-processing application,
the graphical user interface (GUI), the Ethernet, the mouse as a pointing device, and even
the first personal computer. These technology breakthroughs laid the foundation of the
desktop-computing industry. 21 Xerox’s invention competency built through a unique com-
bination of resources and capabilities was clearly valuable, rare, and costly to imitate with
the potential to create a competitive advantage.
organized to capture
value One of the four key criteria in the VRIO framework. The characteristic of having in place an effective organizational structure, processes, and systems to fully exploit the competitive potential of the firm’s resources, capabilities, and competencies.
WWW.YAZDANPRESS.COMWWW.YAZDANPRESS.COM

108 CHAPTER 4 Internal Analysis: Resources, Capabilities, and Core Competencies
Due to a lack of appropriate organization, however, Xerox failed to appreciate and
exploit the many breakthroughs made by its Palo Alto Research Center (PARC) in com-
puting software and hardware. Xerox failed to exploit the value of these innovative prod-
ucts originating from PARC’s underlying core competency in research and engineering,
because the innovations did not fit within the Xerox business focus on photocopiers. Under
pressure in its core photocopier business from Japanese low-cost competitors, Xerox’s top
management was busy looking for innovations in the photocopier business. The organiza-
tion of the company’s innovation system did not allow it to appreciate the competitive
potential of the valuable, rare, and inimitable resources generated at PARC. The organiza-
tional problems were accentuated by the fact that Xerox headquarters is on the East Coast
in Norwalk, Connecticut, while PARC is on the West Coast in Palo Alto, California. 22 Nor
did it help that development engineers at Xerox headquarters had a disdain for the scien-
tists engaging in basic research at PARC.
If a firm is not effectively organized to exploit the competitive potential of a valuable,
rare, and costly-to-imitate ( VRI ) resource, the best-case scenario is a temporary com-
petitive advantage. In the case of Xerox, where management was not supportive of the
resource, even a temporary competitive advantage would not be realized even though the
resource obeys the VRI attributes.
In summary, for a firm to gain and sustain a competitive advantage, its resources and
capabilities need to interact in such a way as to create unique core competencies (again, see
Exhibit 4.4 ). Ultimately, though, only a few competencies may turn out to be core compe-
tencies that fulfill the VRIO requirements. 23 A company cannot do everything equally well
and must carve out a unique strategic position for itself, making necessary trade-offs. 24
Strategy Highlight 4.1 demonstrates application of the VRIO framework.
HOW TO SUSTAIN A COMPETITIVE ADVANTAGE
Do specific conditions exist—above and beyond core competencies obeying the VRIO
attributes—that might help a firm protect and sustain its competitive advantage? Although
no competitive advantage can be sustained indefinitely, several conditions can offer some
protection to a successful firm by making it more difficult for competitors to imitate the
resources, capabilities, or competencies that underlie its competitive advantage: (1) better
expectations of future resource value (or simply luck), (2) path dependence, (3) causal
ambiguity, and (4) social complexity. 25 These barriers to imitation are important examples
of isolating mechanisms because they prevent rivals from competing away the advantage
a firm may enjoy. 26 If one, or any combination, of these isolating mechanisms is present,
a firm may strengthen its basis for competitive advantage, increasing its chance to be sus-
tainable over a longer period of time.
BETTER EXPECTATIONS OF FUTURE RESOURCE VALUE. Sometimes firms
can acquire resources at a low cost, which lays the foundation for a competitive advan-
tage later when expectations about the future of the resource turn out to be more accu-
rate. To create heroes, Nike needs to not only consistently identify and sign athletes that
have succeeded against the odds, but do so before these athletes have become world-
renowned superstars. Right after ending his college career with the University of North
Carolina Tar Heels, Nike signed Michael Jordan. Nike’s Air Jordan basketball shoes are
all-time classics that remain popular to this day. Having consistently better expectations
of the future value of resources allows Nike not only to shape the desired image of the
athlete, but to capture some of the value these athletes create as resources that obey the
VRI criteria.
LO 4-5
Evaluate different conditions that allow firms to sustain their competitive advantage.
isolating mechanisms
Barriers to imitation that prevent rivals from competing away the advantage a firm may enjoy.
WWW.YAZDANPRESS.COMWWW.YAZDANPRESS.COM

CHAPTER 4 Internal Analysis: Resources, Capabilities, and Core Competencies 109
Applying VRIO: The Rise and Fall
of Groupon
After graduating with a degree in music from Northwestern University, Andrew Mason spent a couple of years as a web designer. In 2008, the then 27-year-old founded Groupon, a daily-deal website that connects local retailers and other merchants to consumers by offering goods and services at a discount. Groupon creates marketplaces by bringing the brick-and-mortar world of local commerce onto the Internet. The company basically offers a “group-coupon.” If more than a pre-determined number of Groupon users sign up for the offer, the deal is extended to all Groupon users. For example, a local spa may offer a massage for $40 instead of the regular $80. If more than say 10 people sign up, the deal becomes reality. The users pre-pay $40 for the coupon, which Groupon splits 50-50 with the local merchant. Inspired by how Amazon.com has become the global leader in ecommerce, Mason’s strategic vision for Groupon was to be the global leader in local commerce.
Measured by its explosive growth, Groupon is one of the most successful recent Internet startups. It has over 200 million subscribers and works with over 500,000 merchants in the United States and some 50 international countries. Indeed, Groupon’s success attracted a $6 billion buyout offer by Google in early 2011, which Andrew Mason declined. In November 2011, just three years after its founding, Groupon held a successful initial public offer-ing (IPO) and was valued at more than $16 billion with a share price of over $26. Just a year later, Groupon’s share price had fallen 90 percent to just $2.63. In early 2013, Mason posted a letter for Groupon employees on the web, arguing that it would leak anyway, stating “After four and a half intense and wonderful years as CEO of Groupon, I’ve decided that I’d like to spend more time with my family. Just kidding – I was fired today.”
What went wrong? The implosion of Groupon’s mar-ket value can be explained by an application of the VRIO framework. Its competency to drum up more business for local retailers by offering lower prices for its users was certainly valuable. Before Groupon, local merchants used online and classified ads, direct mail, yellow pages, and other venues to reach customers. Rather than using one-way communication, Groupon facilitates the meeting of supply and demand in local markets. When Groupon was
first launched, this type of local market-making com-petency was also rare. Groupon enjoyed a first-mover advantage. Its ability to use technology to spur local com-merce was considered so valuable and rare that Google offered $6 billion to buy the company—just a little over two years after Groupon’s founding! Things started to go wrong soon after that.
The multibillion-dollar Google offer drew the atten-tion of many potential competitors to Groupon’s business model. As it turned out, Groupon was more of a sales com-pany than a tech venture, even though it was perceived as such in the wake of the Web 2.0 boom. To target and fine-tune its local deals, Groupon relies heavily on human labor to do the selling. Barriers to entry in this type of business are nonexistent because Groupon’s competency is built more on a tangible resource (labor) than on an intangible one (proprietary technology). Given that Groupon’s valuable and rare competency was not hard to imitate, hundreds of new ventures (so-called “Groupon clones”) rushed in to take advantage of this opportunity. Existing online giants such as Google, Amazon (via LivingSocial), and Facebook also moved in. Spurned, Google almost immediately cre-ated its own daily-deal version with Google Offers. Also, note that the ability to imitate a rare and valuable resource is directly linked to barriers of entry, which is one of the key elements in Porter’s five forces model ( threat of new entrants ). This allows linking internal analysis using the resource-based view to external analysis with the five forces model (which also would have predicted low indus-try profit potential given low or no barriers to entry).
To make matters worse, these Groupon clones are often able to better serve the needs of local markets and specific population groups. Some daily-deal sites focus only on a specific geographic area. As an example, Conejo Deals meets the needs of customers and retailers in Southern California’s Conejo Valley, a cluster of sub-urban communities. These hyper-local sites tend to have much deeper relationships and expertise with merchants in their specific areas. Since they are mostly matching local customers with local businesses, moreover, they tend to foster more repeat business than the one-off bar-gain hunters that use Groupon (based in Chicago). In addi-tion, some daily-deal sites often target specific groups. They have greater expertise in matching their users with
4.1
WWW.YAZDANPRESS.COMWWW.YAZDANPRESS.COM
110 CHAPTER 4 Internal Analysis: Resources, Capabilities, and Core Competencies
A real estate developer also provides an illustrative example of the role that better
expectations of a future resource value can play. One important decision she must make is
to decide when and where to buy land for future development. Her firm may gain a com-
petitive advantage if she buys a parcel of land for a low cost in an undeveloped rural area
40 miles north of San Antonio, Texas. Several years later, an interstate highway is built right
near her firm’s land. With the highway, suburban growth explodes as many new neighbor-
hoods and shopping malls are built. Her firm is now able to develop this particular piece
of property to build high-end office or apartment buildings. The value creation far exceeds
the cost, and her firm gains a competitive advantage. The resource has suddenly become
valuable, rare, and costly to imitate, allowing the developer’s firm a competitive advan-
tage. Other developers could have bought the land, but once the highway was announced,
the cost of the developer’s land and that of adjacent land would have risen drastically,
reflecting the new reality and thus negating any potential for competitive advantage. In this
case, the developer had better expectations than her competitors of the future value of the
resource (the land she purchased). If this developer can repeat such “better expectations”
over time, she will have a sustained competitive advantage. If she cannot, she was simply
lucky. The role of luck in gaining an initial advantage is illustrated in the story in Strategy
Highlight 4.2 about Bill Gates and Microsoft.
PATH DEPENDENCE. Path dependence describes a process in which the options
one faces in a current situation are limited by decisions made in the past. 28 Often, early
events—sometimes even random ones—have a significant effect on final outcomes. The
U.S. carpet industry provides an example of path dependence. 29 It is quite striking how
geographically concentrated the economic activity of carpet making is in the U.S. Carpet
mills located within a 65-mile radius of Dalton, Georgia, produce roughly 85 percent of
all carpets in the U.S. and almost one half of all carpets sold worldwide. While the U.S.
manufacturing sector has suffered in recent decades, the carpet industry has flourished.
Companies not located in this regional cluster around Dalton are at a disadvantage because
they cannot access the required know-how, skilled labor, suppliers, low-cost infrastructure,
and so on needed to be competitive.
Two more or less random events combined to result in the geographic concentration
of carpet making in the U.S. These events contributed to path dependence in this specific
industry. First, with the boom after World War II, many manufacturers moved south to
path dependence
A situation in which the options one faces in the current situation are limited by decisions made in the past.
local retailers (e.g., Daily Pride serving LGBT communi-ties; Black Biz Hookup serving African-American business owners and operators; Jdeal, a Jewish group-buying site in New York City, and so on).
“Finding your specific group” or “going hyper local” allows these startups to increase the perceived value added for their users over and above what Groupon can offer. The problem is that although Groupon aspires to be the global leader, there is really no advantage to global scale in serving local markets. This is because daily-deal sites are best suited to market experience goods, such as
haircuts at a local barber shop or a meal in a specific Thai restaurant. The quality of these goods and services cannot be judged unless they are consumed. Since the creation of experience goods and their consumption happens in the same geographic space, there is really no advantage to having global scale.
Once imitated, Groupon’s competency to facilitate local commerce using an Internet platform was neither valuable nor rare. As an application of the VRIO model would have predicted, Groupon’s competitive advantage as a first mover would only be temporary at best (see Exhibit 4.6 ). 27
WWW.YAZDANPRESS.COMWWW.YAZDANPRESS.COM

CHAPTER 4 Internal Analysis: Resources, Capabilities, and Core Competencies 111
Bill “Lucky” Gates
Taking a closer look at one of the richest people in the world shows that the co-founder of Microsoft, Bill Gates, was lucky on more than one occasion (as he himself freely admits). He was lucky to be born as William H. Gates III, into a well-to-do Seattle family. His father was a promi-nent attorney and co-founder of what is today the law firm K&L Gates LLC (one of the largest law firms in the world). His mother hailed from a banker’s family in Nebraska. As a graduate from the University of Washington, Mrs. Mary Gates worked as a teacher and was active in civic affairs.
Young Bill was lucky to be enrolled in Lakeside School, an exclusive preparatory school in Seattle. In 1968, when Bill was in eighth grade, the Mothers Club at Lakeside School used proceeds of a rummage sale to buy a computer terminal along with time-share programming from GE. Suddenly, Lakeside School had more computer power than many premier research universities at that time. Bill fell in love with programming and spent every free minute he had on the computer, writing soft-ware programs. In 1973, he enrolled at Harvard, where he met Steve Ballmer, who later became Microsoft’s CEO. The first mini-computer, the MITS Altair 8800, appeared on the cover of Popular Electronics magazine in January 1975. Paul Allen and Bill Gates wrote the Altair BASIC program and sold it to MITS of Albuquerque, New Mexico. In the same year, 19-year-old Bill Gates dropped out of Harvard and founded Microsoft with 22-year-old Paul Allen, a Washington State University college dropout.
Microsoft’s biggest break came in 1980 when IBM asked Microsoft to write the operating system for its
PC. How did IBM, the world leader in computing, know about a fledgling startup? Here Bill Gates was lucky again. Mary Gates was the first woman to chair the United Way’s national executive committee, and IBM’s CEO, John Akers, also served on the charity’s prestigious board. At one of the board meetings, Mr. Akers shared with Mrs. Gates the fact that IBM was looking for an operating system for its soon-to-be-released PC that would set the standard in the industry. Mrs. Gates in turn suggested that her son’s com-pany would be the right partner.
The only catch was that Bill Gates didn’t have an oper-ating system that would meet IBM’s needs, but he knew that a small computer outfit in Seattle had developed an operating system called Q-DOS, short for “quick and dirty operating system.” On short notice, Bill Gates borrowed $50,000 (approximately $140,000 in today’s value) from his father to buy Q-DOS from Seattle Computer Products, which did not know that IBM was looking for an operat-ing system. Gates then turned around and sold a license of what is now MS-DOS to IBM, but he did not transfer the copyright to the operating system as part of the sale because he correctly believed that other hardware ven-dors would want to adopt IBM’s open standard. It is impor-tant to note that while Bill Gates got some lucky breaks during Microsoft’s early days, luck cannot be sustained over time. Microsoft leveraged these initial breaks into a dominant position in the personal computer industry for several decades through an effective strategy. As techno-logical change continued at an unrelenting pace, however, Microsoft is no longer the dominant player in the mobile computing industry. 30
4.2
escape restrictions placed upon them in the North such as through unionized labor and
higher taxation. Second, and perhaps more important, was technological progress that
allowed industrial-scale production of tufted textiles to be used as substitutes for the more
expensive wool. This technology emerged in the northwest region of Georgia, in and near
Dalton. This historical accident explains why today almost all the carpet mills in the U.S.
are located in a relatively small region, including world leaders such as Shaw Industries
and Mohawk Industries.
Path dependence also rests on the notion that time cannot be compressed at will. When
attempting to compress lots of effort and resources such as R&D into a short time period, it
will not be as effective as when a firm spreads out its effort and investments over a longer
WWW.YAZDANPRESS.COMWWW.YAZDANPRESS.COM

112 CHAPTER 4 Internal Analysis: Resources, Capabilities, and Core Competencies
period of time. Trying to achieve the same outcome in a short time period, even with higher
investments, tends to lead to inferior results. The disappointing results are due to time com-pression diseconomies. 31
GM’s problems in providing a competitive alternative to the highly successful Toyota
Prius, a hybrid electric vehicle, highlight path dependence and time compression issues.
The California Air Resource Board (CARB) in 1990 passed a mandate for introducing
zero-emissions cars, which stipulated that 10 percent of new vehicles sold by carmak-
ers must have zero emissions by 2003. This mandate not only accelerated research in
alternative energy sources for cars, but also led to the development of the first fully elec-
tric production car, GM’s EV1. GM launched the car in California and Arizona in 1996.
Competitive models followed, with the Toyota RAV EV and the Honda EV. In this case,
regulations in the legal environment fostered innovation in the automobile industry (see
discussion of PESTEL forces in Chapter 3).
Companies not only are influenced by forces in their environment but can also influence
the development of those forces. The California mandate on zero emissions, for example,
did not stand. Several stakeholders, including the car and oil companies, fought it through
lawsuits and other actions. CARB ultimately gave in to the pressure and abandoned its
zero-emissions mandate. When the mandate was revoked, GM recalled and destroyed its
EV1 electric vehicles and terminated its electric-vehicle program. This decision turned
out to be a strategic error that would haunt GM a decade or so later. Although GM was the
leader among car companies in electric vehicles in the mid-1990s, it did not have a com-
petitive model to counter the Toyota Prius when its sales took off in the early 2000s. The
Chevy Volt (a plug-in hybrid), GM’s first major competition to the Prius, was delayed by
over a decade because GM had to start its electric-vehicle program basically from scratch.
Not having an adequate product lineup during the early 2000s, GM’s U.S. market share
dropped below 20 percent in 2009 (from over 50 percent a few decades earlier), the year it
filed for bankruptcy. (GM reorganized under Chapter 11 of the U.S. bankruptcy code, and
relisted on the New York Stock Exchange in 2010.) While GM sold about 40,000 Chevy
Volts worldwide, Toyota sold over 3.5 million Prius cars. This example shows that firms
cannot compress time at will; indeed, learning and improvements must take place over
time.
Strategic decisions have long-term consequences due to path dependence and time-
compression diseconomies; they are not easily reversible. A competitor cannot imitate
or create core competencies quickly, nor can one go out and buy a reputation for qual-
ity or innovation on the open market. These types of valuable, rare, and costly-to-imitate
resources, capabilities, and competencies must be built and organized effectively over
time, often through a painstaking process that frequently includes learning from failure.
CAUSAL AMBIGUITY. Causal ambiguity describes a situation in which the cause and
effect of a phenomenon are not readily apparent. To formulate and implement a strategy
that enhances a firm’s chances of gaining and sustaining a competitive advantage, manag-
ers need to have a hypothesis or theory of how to compete. This implies that managers need
to have some kind of understanding about causes for superior and inferior performance.
Understanding the underlying reasons of observed phenomena is far from trivial, however.
Everyone can see that Apple has had several hugely successful innovative products such
as the iMac, iPod, iPhone, and the iPad, combined with its hugely popular iTunes services.
These successes stem from Apple’s set of V, R, I, and O core competencies that supports its
ability to continue to offer a variety of innovative products.
A deep understanding, however, of exactly why Apple has been so successful is very dif-
ficult. Even Apple’s managers themselves may not be able to clearly pinpoint the sources
causal ambiguity
A situation in which the cause and effect of a phenomenon are not readily apparent.
WWW.YAZDANPRESS.COMWWW.YAZDANPRESS.COM

CHAPTER 4 Internal Analysis: Resources, Capabilities, and Core Competencies 113
of their success. Is it the visionary role that the late Steve Jobs played? Is it the rare skills
of Apple’s uniquely talented design team within Apple? Is it the timing of the company’s
product introductions? Or is it Apple’s former Chief Operating Officer Tim Cook (now
its CEO) who adds superior organizational skills and puts all the pieces together when
running the day-to-day operations? If the link between cause and effect is ambiguous for
Apple’s managers, it is that much more difficult for others seeking to copy a valuable
resource, capability, or competency.
SOCIAL COMPLEXITY. Social complexity describes situations in which different
social and business systems interact with one another. There is frequently no causal ambi-
guity as to how the individual systems such as supply chain management or new product
development work in isolation. They are often managed through standardized business
processes such as Six Sigma or ISO 9000. Social complexity, however, emerges when two
or more such systems are combined. Copying the emerging complex social systems is dif-
ficult for competitors because neither direct imitation nor substitution is a valid approach.
The interactions between different systems create too many possible permutations for a
system to be understood with any accuracy. The resulting social complexity makes copy-
ing these systems difficult, if not impossible, resulting in a valuable, rare, and costly-to-
imitate resource that the firm is organized to exploit.
A simple thought experiment can illustrate this point. A group with three people has
three relationships, connecting every person directly with one another. Adding a fourth
person to this group doubles the number of direct relationships to six. Just introducing one
more person increases the number of relationships to 10. 32 This gives you some idea of how
complexity might increase when we combine different systems with many different parts.
In reality, firms are often made up of thousands of employees from all walks of life.
Their interactions within the firm’s processes, procedures, and norms make up its cul-
ture. Although an observer may conclude that Zappos’ culture, with its focus on providing
superior customer service, might be the basis for its competitive advantage, engaging in
reverse social engineering to crack Zappos’ code of success might be much more difficult.
Moreover, an organizational culture that works for Zappos, an online retailer for shoes and
clothing, might cause havoc for Lockheed Martin, an aerospace and defense company.
This implies that one must understand competitive advantage within its organizational and
industry context. Looking at individual elements of success without taking social complex-
ity into account is a recipe for inferior performance, if not worse.
Taken together, a firm may be able to protect its competitive advantage (even for long
periods of time) when its managers have consistently better expectations about the future
value of resources, it has accumulated a resource advantage that can be imitated only over
long periods of time, or when the source of its competitive advantage is causally ambigu-
ous or socially complex.
4.3 The Dynamic Capabilities Perspective
A firm’s external environment is rarely stable (as discussed in Chapter 3). Rather, in many
industries, change is fast and ferocious. Firms that fail to adapt their core competencies to
a changing external environment not only lose a competitive advantage but may go out of
business altogether. This is the reason why reinvesting, honing, and upgrading resources
and capabilities is so crucial (see Exhibit 4.4 ). Dynamic capabilities describe a firm’s
ability to create, deploy, modify, reconfigure, upgrade, or leverage its resources over time
in its quest for competitive advantage. Dynamic capabilities are essential to move beyond
a short-lived advantage and create a sustained competitive advantage. For a firm to sustain
social complexity
A situation in which different social and business systems interact with one another.
LO 4-6
Outline how dynamic capabilities can help a firm sustain competitive advantage.
dynamic capabilities
A firm’s ability to create, deploy, modify, reconfigure, upgrade, or leverage its resources in its quest for competitive advantage.
WWW.YAZDANPRESS.COMWWW.YAZDANPRESS.COM

114 CHAPTER 4 Internal Analysis: Resources, Capabilities, and Core Competencies
its advantage, any fit between its internal strengths and the external environment must be
dynamic. That is, the firm must be able to change its resource base as the external environ-
ment changes. The goal should be to develop resources, capabilities, and competencies
that create a strategic fit with the firm’s environment. Rather than creating a static fit, the
firm’s internal strengths should change with its external environment in a dynamic fashion.
Not only do dynamic capabilities allow firms to adapt to changing market conditions;
they also enable firms to create market changes that can strengthen their strategic position.
These market changes implemented by proactive firms introduce altered circumstances,
to which more reactive rivals might be forced to respond. Apple’s dynamic capabili-
ties allowed it to redefine the markets for mobile devices and computing, in particular
in music, smartphones, and media content. For the portable music market through its
iPod (and iTunes store), Apple generated environmental change to which Sony and oth-
ers had to respond. With its iPhone, Apple redefined the market for smartphones, again
creating environmental change to which competitors such as Samsung, BlackBerry, Nokia,
or Google (with its Motorola unit) must respond. Apple’s introduction of the iPad is rede-
fining the media and tablet computing market, forcing competitors such as Amazon and
Microsoft to respond. Dynamic capabilities are especially relevant for surviving and com-
peting in markets that shift quickly and constantly, such as the high-tech space in which
firms such as Apple, Google, and Amazon compete.
In the dynamic capabilities perspective , competitive advantage is the outflow of a
firm’s capacity to modify and leverage its resource base in a way that enables it to gain and
sustain competitive advantage in a constantly changing environment. Given the accelerated
pace of technological change, in combination with deregulation, globalization, and demo-
graphic shifts, dynamic markets today are the rule rather than the exception. As a response,
a firm may create, deploy, modify, reconfigure, or upgrade resources so as to provide value
to customers and/or lower costs in a dynamic environment. The essence of this perspective
is that competitive advantage is not derived from static resource or market advantages, but
from a dynamic reconfiguration of a firm’s resource base. Today, consumers value reli-
able, gas-powered engines made by Honda. If consumers start to value electric motors
more (because they produce zero emissions), the value of Honda’s engine competency will
decrease. If this happens, the Chinese automaker BYD, which morphed from a battery
maker to a car company, might gain an advantage over Honda. While Honda views itself
as an engineering-driven automotive company, startup BYD views its core competency as
batteries. This in turn can be leveraged into a strong strategic position in electric-power
systems for cars, cell phones, laptops, cameras, medical devices, and so on. Imitation by
competitors is especially difficult in such a case because it requires hitting a moving target.
One way to think about developing dynamic capabilities and other intangible resources
is to distinguish between resource stocks and resource flows. 33 Resource stocks are the
firm’s current level of intangible resources. Resource flows are the firm’s level of invest-
ments to maintain or build a resource. A helpful metaphor to explain the differences
between resource stocks and resource flows is a bathtub that is being filled with water (see
Exhibit 4.7 ). 34 The amount of water in the bathtub indicates a company’s level of a specific
intangible resource stock —such as its dynamic capabilities, new product development,
engineering expertise, innovation capability, reputation for quality, and so on.
Intangible-resource stocks are built through investments over time. These resource
flows are represented in the drawing by the different faucets, from which water flows into
the tub. These different faucets indicate investments the firm can make in different intan-
gible resources. Investments in building an innovation capability, for example, differ from
investments made in marketing expertise. Each investment flow would be represented by
a different faucet.
dynamic capabilities
perspective A model that emphasizes a firm’s ability to modify and leverage its resource base in a way that enables it to gain and sustain competitive advantage in a constantly changing environment.
resource stocks The firm’s current level of intangible resources.
resource flows The firm’s level of investments to maintain or build a resource.
WWW.YAZDANPRESS.COMWWW.YAZDANPRESS.COM
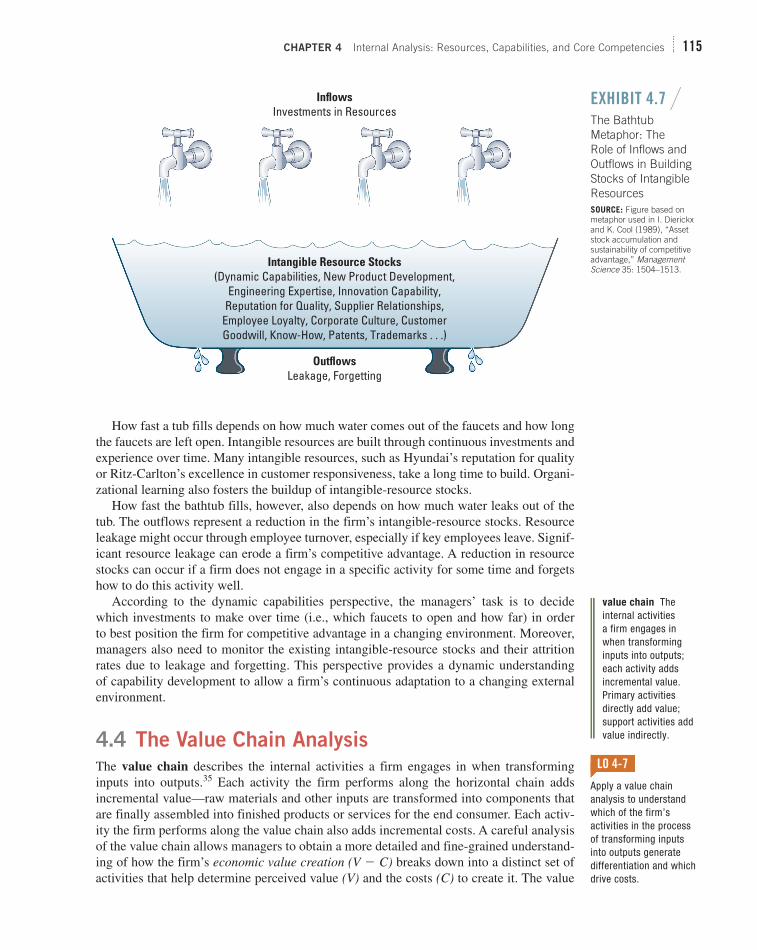
CHAPTER 4 Internal Analysis: Resources, Capabilities, and Core Competencies 115
How fast a tub fills depends on how much water comes out of the faucets and how long
the faucets are left open. Intangible resources are built through continuous investments and
experience over time. Many intangible resources, such as Hyundai’s reputation for quality
or Ritz-Carlton’s excellence in customer responsiveness, take a long time to build. Organi-
zational learning also fosters the buildup of intangible-resource stocks.
How fast the bathtub fills, however, also depends on how much water leaks out of the
tub. The outflows represent a reduction in the firm’s intangible-resource stocks. Resource
leakage might occur through employee turnover, especially if key employees leave. Signif-
icant resource leakage can erode a firm’s competitive advantage. A reduction in resource
stocks can occur if a firm does not engage in a specific activity for some time and forgets
how to do this activity well.
According to the dynamic capabilities perspective, the managers’ task is to decide
which investments to make over time (i.e., which faucets to open and how far) in order
to best position the firm for competitive advantage in a changing environment. Moreover,
managers also need to monitor the existing intangible-resource stocks and their attrition
rates due to leakage and forgetting. This perspective provides a dynamic understanding
of capability development to allow a firm’s continuous adaptation to a changing external
environment.
4.4 The Value Chain Analysis
The value chain describes the internal activities a firm engages in when transforming
inputs into outputs. 35 Each activity the firm performs along the horizontal chain adds
incremental value—raw materials and other inputs are transformed into components that
are finally assembled into finished products or services for the end consumer. Each activ-
ity the firm performs along the value chain also adds incremental costs. A careful analysis
of the value chain allows managers to obtain a more detailed and fine-grained understand-
ing of how the firm’s economic value creation ( V 2 C ) breaks down into a distinct set of
activities that help determine perceived value (V) and the costs (C) to create it. The value
LO 4-7
Apply a value chain analysis to understand which of the firm’s activities in the process of transforming inputs into outputs generate differentiation and which drive costs.
value chain The internal activities a firm engages in when transforming inputs into outputs; each activity adds incremental value. Primary activities directly add value; support activities add value indirectly.
OutflowsLeakage, Forgetting
InflowsInvestments in Resources
Intangible Resource Stocks(Dynamic Capabilities, New Product Development,
Engineering Expertise, Innovation Capability,Reputation for Quality, Supplier Relationships,
Employee Loyalty, Corporate Culture, CustomerGoodwill, Know-How, Patents, Trademarks . . .)
EXHIBIT 4.7 / The Bathtub Metaphor: The Role of Inflows and Outflows in Building Stocks of Intangible Resources SOURCE: Figure based on metaphor used in I. Dierickx and K. Cool (1989), “Asset stock accumulation and sustainability of competitive advantage,” Management Science 35: 1504–1513.
WWW.YAZDANPRESS.COMWWW.YAZDANPRESS.COM
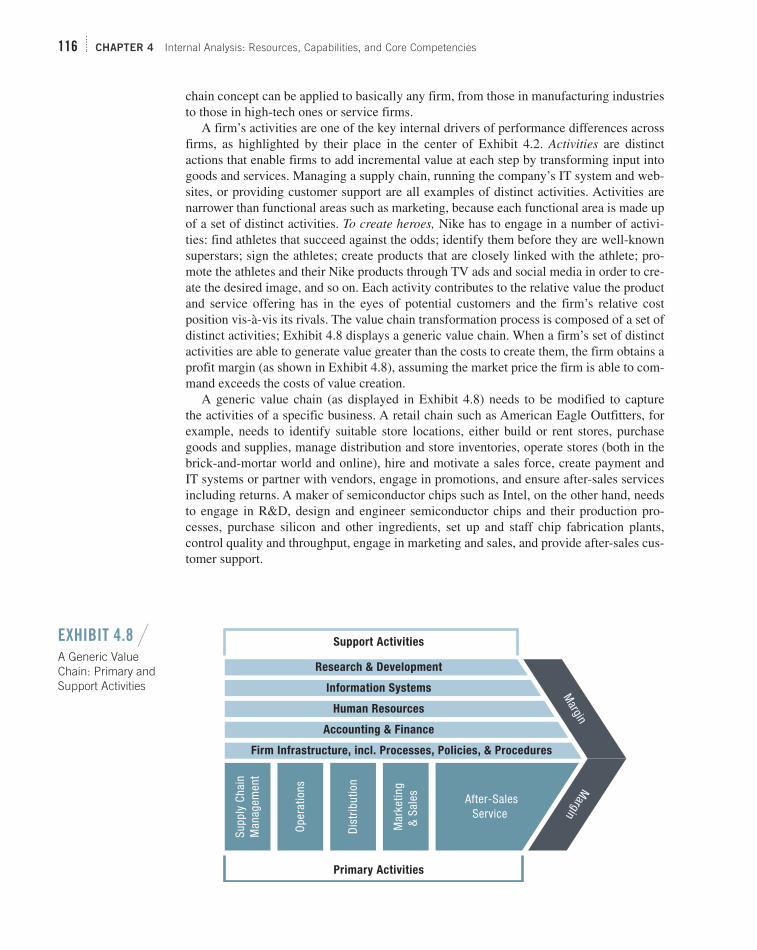
116 CHAPTER 4 Internal Analysis: Resources, Capabilities, and Core Competencies
chain concept can be applied to basically any firm, from those in manufacturing industries
to those in high-tech ones or service firms.
A firm’s activities are one of the key internal drivers of performance differences across
firms, as highlighted by their place in the center of Exhibit 4.2 . Activities are distinct
actions that enable firms to add incremental value at each step by transforming input into
goods and services. Managing a supply chain, running the company’s IT system and web-
sites, or providing customer support are all examples of distinct activities. Activities are
narrower than functional areas such as marketing, because each functional area is made up
of a set of distinct activities. To create heroes, Nike has to engage in a number of activi-
ties: find athletes that succeed against the odds; identify them before they are well-known
superstars; sign the athletes; create products that are closely linked with the athlete; pro-
mote the athletes and their Nike products through TV ads and social media in order to cre-
ate the desired image, and so on. Each activity contributes to the relative value the product
and service offering has in the eyes of potential customers and the firm’s relative cost
position vis-à-vis its rivals. The value chain transformation process is composed of a set of
distinct activities; Exhibit 4.8 displays a generic value chain. When a firm’s set of distinct
activities are able to generate value greater than the costs to create them, the firm obtains a
profit margin (as shown in Exhibit 4.8 ), assuming the market price the firm is able to com-
mand exceeds the costs of value creation.
A generic value chain (as displayed in Exhibit 4.8 ) needs to be modified to capture
the activities of a specific business. A retail chain such as American Eagle Outfitters, for
example, needs to identify suitable store locations, either build or rent stores, purchase
goods and supplies, manage distribution and store inventories, operate stores (both in the
brick-and-mortar world and online), hire and motivate a sales force, create payment and
IT systems or partner with vendors, engage in promotions, and ensure after-sales services
including returns. A maker of semiconductor chips such as Intel, on the other hand, needs
to engage in R&D, design and engineer semiconductor chips and their production pro-
cesses, purchase silicon and other ingredients, set up and staff chip fabrication plants,
control quality and throughput, engage in marketing and sales, and provide after-sales cus-
tomer support.
Supp
ly C
hain
Man
agem
ent
After-SalesService
Mar
ketin
g&
Sal
es
Dis
trib
utio
n
Ope
ratio
ns
Primary Activities
Research & Development
Information Systems
Human Resources
Accounting & Finance
Firm Infrastructure, incl. Processes, Policies, & Procedures
Support Activities
Margin
Margin
EXHIBIT 4.8 / A Generic Value Chain: Primary and Support Activities
WWW.YAZDANPRESS.COMWWW.YAZDANPRESS.COM

CHAPTER 4 Internal Analysis: Resources, Capabilities, and Core Competencies 117
As shown in Exhibit 4.8 , the value chain is divided into primary and support activities.
The primary activities add value directly as the firm transforms inputs into outputs—
from raw materials through production phases to sales and marketing and finally customer
service. Primary activities are supply chain management, operations, distribution, mar-
keting and sales, and after-sales service. Other activities, called support activities , add
value indirectly. These activities—such as research and development (R&D), information
systems, human resources, accounting and finance, and firm infrastructure including pro-
cesses, policies, and procedures— support each of the primary activities.
To help a firm achieve a competitive advantage, each distinct activity performed needs
to either add incremental value to the product or service offering or lower its relative cost.
Discrete and specific firm activities are the basic units with which to understand competi-
tive advantage because they are the drivers of the firm’s relative costs and level of differen-
tiation the firm can provide to its customers. Although the resource-based view of the firm
helps identify the integrated set of resources and capabilities that are the building blocks
of core competencies, the value chain perspective enables managers to see how competi-
tive advantage flows from the firm’s distinct set of activities. This is because a firm’s core
competency is generally found in a network linking different but distinct activities, each
contributing to the firm’s strategic position as either low-cost leader or differentiator.
Let’s consider The Vanguard Group, one of the world’s largest investment companies,
with $2 trillion of assets under management. 36 It serves individual investors, financial
professionals, and institutional investors such as state retirement funds. Vanguard’s mis-
sion is to help clients reach their financial goals by being their highest-value provider of investment products and services. 37 It therefore emphasizes low-cost investing and quality
service for its clients. Vanguard’s average expense ratio (fees as a percentage of total net
assets paid by investors) is generally the lowest in the industry. 38 Vanguard’s core com-
petency of low-cost investing while providing acceptable quality service for its clients is
accomplished through a unique set of interconnected primary and support activities includ-
ing strict cost control, direct distribution, low expenses with savings passed on to clients,
offering a broad array of mutual funds, an efficient investment management approach, and
straightforward client communication and education.
4.5 Implications for the Strategist
We’ve now reached a significant point: Combining tools for external analysis from
Chapter 3 with the frameworks for internal analysis introduced in this chapter allows you,
as the strategist, to begin formulating a strategy that matches the firm’s internal resources
and capabilities to the demands of the external industry environment. Ideally, managers
want to leverage a firm’s internal strengths to exploit external opportunities, while miti-
gating internal weaknesses and external threats. This approach allows the formulation of
a strategy that is tailored to their company, creating a unique fit between the company’s
internal resources and the external environment. A strategic fit increases the likelihood that
a firm is able to gain a competitive advantage. If a firm achieves a dynamic strategic fit, it
is likely to be able to sustain its advantage over time.
USING SWOT ANALYSIS TO COMBINE EXTERNAL AND INTERNAL ANALYSIS
We synthesize insights from an internal analysis of the company’s strengths and weak-nesses with those from an analysis of external opportunities and threats using the SWOT analysis . Internal strengths (S) and weaknesses (W) concern resources, capabilities, and
primary activities
Firm activities that add value directly by transforming inputs into outputs as the firm moves a product or service horizontally along the internal value chain.
support activities
Firm activities that add value indirectly, but are necessary to sustain primary activities.
LO 4-8
Conduct a SWOT analysis to combine external and internal analysis and derive strategic implications.
SWOT analysis
A framework that allows managers to synthesize insights obtained from an internal analysis of the company’s strengths and weaknesses (S and W) with those from an analysis of external opportunities and threats (O and T).
WWW.YAZDANPRESS.COMWWW.YAZDANPRESS.COM

118 CHAPTER 4 Internal Analysis: Resources, Capabilities, and Core Competencies
competencies. Whether they are strengths or weaknesses can be determined by applying
the VRIO framework (discussed in this chapter). External opportunities (O) and threats (T)
are in the firm’s general environment and can be captured by PESTEL and Porter’s five
forces analyses (discussed in the previous chapter).
A SWOT analysis allows managers to evaluate a firm’s current situation and future
prospects by simultaneously considering internal and external factors. The SWOT analysis
encourages managers to scan the internal and external environments, looking for any rel-
evant factors that might affect the firm’s current or future competitive advantage. The focus
is on internal and external factors that can affect—in a positive or negative way—the firm’s
ability to gain and sustain a competitive advantage. To facilitate a SWOT analysis, manag-
ers use a set of strategic questions that link the firm’s internal environment to its external
environment, as shown in Exhibit 4.9 . In this SWOT matrix, the horizontal axis is divided
into factors that are external to the organization (the focus of Chapter 3) and the vertical
axis into factors that are internal to the organization (the focus of this chapter).
In a first step, managers gather information for a SWOT analysis in order to link inter-
nal factors ( Strengths and Weaknesses ) to external factors ( Opportunities and Threats ). Next, managers use the SWOT matrix shown in Exhibit 4.9 to develop strategic alterna-tives for the firm using a four-step process:
1. Focus on the Strengths–Opportunities quadrant (top left) to derive “offensive” alterna-
tives by using an internal strength in order to exploit an external opportunity.
2. Focus on the Weaknesses–Threats quadrant (bottom right) to derive “defensive” alter-
natives by eliminating or minimizing an internal weakness in order to mitigate an
external threat.
3. Focus on the Strengths–Threats quadrant (top right) to use an internal strength to mini-
mize the effect of an external threat.
4. Focus on the Weaknesses–Opportunities quadrant (bottom left) to shore up an internal
weakness to improve its ability to take advantage of an external opportunity.
In a final step, managers need to carefully evaluate the pros and cons of each strategic
alternative to select one or more alternatives to implement. Managers need to carefully
explain their decision rationale, including why other strategic alternatives were rejected.
To further facilitate application of the SWOT framework, Exhibit 4.10 shows a hypotheti-
cal example for McDonald’s, the world’s largest chain of hamburger fast-food restaurants,
operating more than 34,000 restaurants in some 120 countries. 39
EXHIBIT 4.9 / Strategic Questions Within the SWOT Matrix
Strategic Questions Opportunities Threats
Strengths How can managers use strengths to take advantage of opportunities?
How can managers use strengths to reduce the likelihood and impact of threats?
Weaknesses How can managers overcome weaknesses that prevent the firm from taking advantage of opportunities?
How can managers overcome weaknesses that will make threats a reality?
WWW.YAZDANPRESS.COMWWW.YAZDANPRESS.COM

CHAPTER 4 Internal Analysis: Resources, Capabilities, and Core Competencies 119
Based on the SWOT analysis shown in Exhibit 4.10 , McDonald’s developed four stra-
tegic alternatives:
1. By combining its internal strengths in financial resources (S1) and brand name (S2)
with external opportunities due to growth in emerging economies (O1), it developed an
offensive strategic option to launch new restaurants in China and Mexico.
2. By combining an internal weakness due to market share decline and thus a loss of mar-
ket power (W1) with the external threat of the increasing popularity of easy-to-prepare
grocery items (T2), it developed the defensive strategic option to develop and air new
ads showing the ease and speed of McDonald’s drive-thru for take-home orders.
3. The third strategic option is to leverage internal strengths in brand name (S2) and
consistency (S3) to minimize the external threat of easy-to-prepare grocery items (T2)
by launching a McDonald’s line of frozen foods in grocery stores.
4. The final strategic alternative is to overcome internal weaknesses due to market share
decline (W1) and dependence on fried foods on its menu (W2) in order to develop and
market more healthy food items. Shoring up these internal weaknesses would improve
McDonald’s chances to take advantage of the external opportunity provided by the
increased health consciousness of the U.S. population (O2).
Although the SWOT analysis is a widely used management framework, however, a
word of caution is in order. A problem with this framework is that a strength can also be a
weakness, and that an opportunity can also simultaneously be a threat. Earlier in this chap-
ter, we discussed the location of Google’s headquarters in Silicon Valley and near several
universities as a key resource for the firm. Most people would consider this a strength for
the firm. However, California has a high cost of living and is routinely ranked among the
worst of the states in the U.S. in terms of “ease of doing business.” In addition, this area
of California is along major earthquake fault lines and is more prone to natural disasters
than many other parts of the country. So is the location a strength or a weakness? The
answer is “it depends.” In a similar fashion, is global warming an opportunity or threat
EXHIBIT 4.10 / Applying SWOT: Hypothetical Example for McDonald’s
Opportunities Threats1. Growth in emerging
economies
2. Health consciousness of U.S. population
1. Possible increase in minimum wage
2. Popularity of easy-to-prepare grocery items
Strengths Strategic Alternatives:
1. Financial resources
2. Brand name
3. Consistency
1. Launch new locations in China & Mexico (S1, S2, O1)
2. New ads showing ease and speed of drive-thru for take-home orders (W1, T2)
3. Launch McDonald’s frozen foods in grocery outlets (S2, S3, T2)
4. Develop and emphasize more healthy food menu items (W1, W2, O2)
Weaknesses
1. Market share decline
2. Dependence on fried foods on menu
WWW.YAZDANPRESS.COMWWW.YAZDANPRESS.COM

120 CHAPTER 4 Internal Analysis: Resources, Capabilities, and Core Competencies
for car manufacturers? If governments enact higher gasoline taxes and make driving more
expensive, it can be a threat. If, however, carmakers respond to government regulations by
developing more fuel-efficient cars as well as low- or zero-emission engines such as hybrid
or electric vehicles, it may create more demand for new cars and lead to higher sales.
To make the SWOT analysis an effective management tool, the strategist must first con-
duct a thorough external and internal analysis, as laid out in Chapters 3 and 4. This sequen-
tial process enables the strategist to ground the analysis in rigorous theoretical frameworks
before using SWOT to synthesize the results from the external and internal analyses in
order to derive a set of strategic options.
You have now acquired the toolkit with which to conduct a complete strategic analysis
of a firm’s internal and external environments. In the next chapter, we consider various
ways to assess and measure competitive advantage. That chapter will complete Part 1, on
strategy analysis, in the AFI framework (see Exhibit 1.5).
A ALTHOUGH NIKE’S CO-FOUNDER and chairman Phil Knight declared that scandals surrounding its superstar endorsement athletes are “part of the game,” its mar-keting strategy is not without risks. 40 In some instances, Nike continued to sponsor its athletes involved in vari-ous scandals, while in others it terminated its lucrative endorsement contracts. Nike continued to sponsor LA Lakers’ Kobe Bryant who was cleared of alleged rape charges. After Tiger Woods was engulfed in an infidel-ity scandal, Nike continued to sponsor the golf super-star. In 2007, Nike ended its endorsement deal contract with NFL quarterback Michael Vick after a public out-cry and his subsequent felony conviction of running a dog-fighting ring and engaging in animal cruelty. In 2011, after serving a prison sentence and restarting his career at the Philadelphia Eagles, Nike signed a new endorsement deal with Michael Vick. In 2012, Nike ter-minated its long-term relationship with disgraced cyclist Lance Armstrong. Just before Armstrong’s public admis-sion to doping in an interview with Oprah Winfrey, Phil Knight answered “never say never” when asked if Nike would sponsor Lance Armstrong again in the future. In 2013, Nike removed its ads with Oscar Pistorius and the unfortunate tag line “I am the bullet in the chamber,” after the alleged homicide charges against the South African track-and-field athlete.
Time and time again Nike’s heroes have fallen from grace. Clearly, Nike’s approach in building its core
competency of creating heroes is not without risks. Too many of these public relations disas-ters combined with too severe shortcomings of some of Nike’s most celebrated heroes could damage the company’s reputation and lead to a loss of competitive advantage.
Questions
Thinking about ChapterCase 4, answer the following questions.
1. The case indicates that Nike’s core competency is to create heroes. What does this mean? How did Nike build its core competency? Does it obey the VRIO attributes?
2. What would it take for Nike’s approach to turn from a strength into a weakness? Did this tipping point already occur? Why or why not?
3. What recommendations would you have for Phil Knight and Nike? Can you identify a way to “reframe” the competency of creating heroes? Or a new way to think of heroes that would continue to build the brand?
4. If you are a competitor of Nike (such as adidas, Under Armour, New Balance, or Li Ning), how could you exploit Nike’s apparent vulnerability? Provide a set of concrete recommendations.
CHAPTERCASE 4 Consider This . . .
WWW.YAZDANPRESS.COMWWW.YAZDANPRESS.COM

CHAPTER 4 Internal Analysis: Resources, Capabilities, and Core Competencies 121
This chapter demonstrated various approaches to ana-
lyzing the firm’s internal environment, as summarized
by the following learning objectives and related take-
away concepts.
LO 4-1 / Differentiate among a firm’s
resources, capabilities, core competencies,
and activities.
■ Core competencies are unique, deeply embedded,
firm-specific strengths that allow companies to
differentiate their products and services and thus
create more value for customers than their rivals,
or offer products and services of acceptable value
at lower cost.
■ Resources are any assets that a company can draw
on when crafting and executing strategy.
■ Capabilities are the organizational and manage-
rial skills necessary to orchestrate a diverse set of
resources to deploy them strategically.
■ Activities are distinct and fine-grained business
processes that enable firms to add incremen-
tal value by transforming input into goods and
services.
LO 4-2 / Compare and contrast tangible and
intangible resources.
■ Tangible resources have physical attributes and
are visible.
■ Intangible resources have no physical attributes
and are invisible.
■ Competitive advantage is more likely to be based
on intangible resources.
LO 4-3 / Evaluate the two critical assump-
tions behind the resource-based view.
■ The first critical assumption— resource heterogeneity —is that bundles of resources,
capabilities, and competencies differ across
firms. The resource bundles of firms competing
in the same industry (or even the same strategic
group) are unique to some extent and thus differ
from one another.
■ The second critical assumption— resource immobility —is that resources tend to be “sticky”
and don’t move easily from firm to firm. Because
of that stickiness, the resource differences that
exist between firms are difficult to replicate and,
therefore, can last for a long time.
LO 4-4 / Apply the VRIO framework to
assess the competitive implications of a firm’s
resources.
■ For a firm’s resource to be the basis of a com-
petitive advantage, it must have VRIO attributes:
valuable (V), rare (R), and costly to imitate (I). The firm must also be able to organize (O) in order to capture the value of the resource.
■ A resource is valuable (V) if it allows the firm to
take advantage of an external opportunity and/or
neutralize an external threat.
■ A resource is rare (R) if the number of firms
that possess it is less than the number of firms
it would require to reach a state of perfect
competition.
■ A resource is costly to imitate (I) if firms that do
not possess the resource are unable to develop or
buy the resource at a comparable cost.
■ The firm is organized (O) to capture the value of
the resource if it has an effective organizational
structure, processes, and systems in place to fully
exploit the competitive potential.
LO 4-5 / Evaluate different conditions
that allow firms to sustain their competitive
advantage.
■ Several conditions make it costly for competitors
to imitate the resources, capabilities, or compe-
tencies that underlie a firm’s competitive advan-
tage: (1) better expectations of future resource value (or simply luck), (2) path dependence, (3)
causal ambiguity, and (4) social complexity. ■ These barriers to imitation are isolating mecha-
nisms because they prevent rivals from competing
away the advantage a firm may enjoy.
LO 4-6 / Outline how dynamic capabilities
can help a firm sustain competitive advantage.
■ To sustain a competitive advantage, any fit
between a firm’s internal strengths and the exter-
nal environment must be dynamic.
TAKE-AWAY CONCEPTS
WWW.YAZDANPRESS.COMWWW.YAZDANPRESS.COM

122 CHAPTER 4 Internal Analysis: Resources, Capabilities, and Core Competencies
■ Dynamic capabilities allow a firm to create,
deploy, modify, reconfigure, or upgrade its
resource base to gain and sustain competitive
advantage in a constantly changing environment.
LO 4-7 / Apply a value chain analysis to
understand which of the firm’s activities in the
process of transforming inputs into outputs
generate differentiation and which drive costs.
■ The value chain describes the internal activities
a firm engages in when transforming inputs into
outputs.
■ Each activity the firm performs along the horizon-
tal chain adds incremental value and incremental
costs.
■ A careful analysis of the value chain allows man-
agers to obtain a more detailed and fine-grained
understanding of how the firm’s economic value
created breaks down into a distinct set of activi-
ties that help determine perceived value and the
costs to create it.
■ When a firm’s set of distinct activities is able to
generate value greater than the costs to create it,
the firm obtains a profit margin (assuming the
market price the firm is able to command exceeds
the costs of value creation).
LO 4-8 / Conduct a SWOT analysis to com-
bine external and internal analysis and derive
strategic implications.
■ Formulating a strategy that increases the chances
of gaining and sustaining a competitive advantage
is based on synthesizing insights obtained from
an internal analysis of the company’s strengths
(S) and weaknesses (W) with those from an anal-
ysis of external opportunities (O) and threats (T).
■ The strategic implications of a SWOT analy-
sis should help the firm to leverage its internal
strengths to exploit external opportunities, while
mitigating internal weaknesses and external
threats.
Activities
Capabilities
Causal ambiguity
Core competencies
Costly-to-imitate resource
Dynamic capabilities
Dynamic capabilities
perspective
Intangible resources
KEY TERMS
Isolating mechanisms
Organized to capture value
Path dependence
Primary activities
Rare resource
Resource-based view
Resource flows
Resource heterogeneity
Resource immobility
Resource stocks
Resources
Social complexity
Support activities
SWOT analysis
Tangible resources
Valuable resource
Value chain
VRIO framework
1. Why is it important to study the internal
resources, capabilities, and activities of firms?
What insights can be gained?
2. a. Conduct a value chain analysis for
McDonald’s. What are its primary activi-
ties? What are its support activities? Identify
the activities that add the most value for
the customer. Why? Which activities help
McDonald’s to contain cost? Why?
b. In the last few years, McDonald’s has made
a lot of changes to its menu, adding more
healthy choices and more higher-priced
items, such as those offered in McCafé
(e.g., premium roast coffee, frappé, and
DISCUSSION QUESTIONS
WWW.YAZDANPRESS.COMWWW.YAZDANPRESS.COM

CHAPTER 4 Internal Analysis: Resources, Capabilities, and Core Competencies 123
fruit smoothies), and has also enhanced its
in-restaurant services (e.g., free, unlimited
Wi-Fi, newer interiors). Did McDonald’s new
priorities—in terms of a broader, healthier
menu and an improved in-restaurant
experience—require changes to its traditional
value chain activities? If so, how? Try to be as
specific as possible in comparing the
McDonald’s from the recent past (focusing on
low-cost burgers) to the McDonald’s today.
3. The resource-based view of the firm identifies
four criteria that managers can use to evaluate
whether particular resources and capabilities are
core competencies and can, therefore, provide a
basis for sustainable competitive advantage. Are
these measures independent or interdependent?
Explain. If (some of) the measures are interde-
pendent, what implications does that fact have for
managers wanting to create and sustain a com-
petitive advantage?
1. As discussed in this chapter, resources that are
valuable, rare, and costly to imitate can help cre-
ate a competitive advantage. In many cases, firms
try to “reverse-engineer” a particular feature from
a competitor’s product for their own uses. It is
commonplace, for example, for cell phone manu-
facturers to buy the newest phones of their com-
petitors on the market and take them apart to see
what new components/features the new models
have implemented.
As the competition between Google ( www.
google.com ) and Baidu ( www.ir.baidu.com ) over
Internet searches in China makes clear, however,
this sort of corporate behavior does not stop with
hardware products. With hundreds of millions
of users and growing fast, China is considered
to be one of the most lucrative online markets
worldwide. Baidu, a Chinese web services com-
pany, has allegedly adapted many of the search
tools that Google uses. Baidu, however, modifies
its searches inside China (its major market) to
accommodate government guidelines. In protest
over these same guidelines, in 2010 Google left
the Chinese market and is running its Chinese
search operations from Hong Kong. Google no
longer censors its online searches as requested
by the Chinese government. Baidu has some
75 percent market share in online search in China,
and Google less than 20 percent. 41
It is legal to take apart publicly available
products and services and try to replicate them
and even develop work-arounds for relevant
patents. But is it ethical? If a key capability
protected by patents or trademarks in your firm
is being reverse-engineered by the competition,
what are your options for a response? Also, how
do you evaluate Google’s decision to move its
servers to Hong Kong? For Google’s values,
see http://www.google.com/about/company/
philosophy/ .
2. The chapter mentions that one type of resource
flow is the loss of key personnel who move to
another firm. Assume that the human resources
department of your firm has started running ads
and billboards for open positions near the office
of your top competitor. Your firm is also running
Google ads on a keyword search for this same
competitor. Is there anything unethical about
this activity? Would your view change if this key
competitor had just announced a major layoff?
ETHICAL/SOCIAL ISSUES
//// Small-Group Exercise 1
Brand valuations were mentioned in the chapter as a
potential key intangible resource for firms. Some prod-
uct brands are so well-established the entire category
of products (including those made by competitors) may
be called by the brand name rather than the product
type. In your small group, develop two or three exam-
ples of this happening in the marketplace. In any of the
cases noted, does such brand valuation give the lead-
ing brand a competitive advantage? Or does it produce
SMALL-GROUP EXERCISES
WWW.YAZDANPRESS.COMWWW.YAZDANPRESS.COM

124 CHAPTER 4 Internal Analysis: Resources, Capabilities, and Core Competencies
confusion in the market for all products or services in
that category? Provide advice to the leading brand as
to how the firm can strengthen the brand name.
//// Small-Group Exercise 2
Strategy Highlight 4.1 explains the rise and fall of
Groupon. The company’s strategic vision was to be a global leader in local commerce, based on a core
competency that could be described as “local market-
making.” Numerous competitors took advantage of
low barriers to entry and the easy imitation of Grou-
pon’s combined competency of some technology
skills with sales skills, so that Groupon found that its
competitive advantage was only temporary. Groupon
continues to compete but needs your advice on how
to build dynamic capabilities that might help it pursue
the vision of becoming a global leader in local com-
merce. How might Groupon reinvest or upgrade its
technology and sales skills so it builds a global cus-
tomer base? For example, are there new products or
services that would meet the needs of global clients
in each of the local markets where the client does
business? Brainstorm ways that Groupon might add
value for its customers. How might Groupon build
relationships with clients that are more socially com-
plex, making Groupon’s competencies more difficult
to imitate?
STRATEGY TERM PROJECT
//// Module 4: Internal Analysis
In this section, you will study the internal resources,
capabilities, core competencies, and value chain of
your selected firm.
1. A good place to start with an internal firm analy-
sis is to catalog the assets a firm has. Make a list
of the firm’s tangible assets. Then, make a sepa-
rate list of its intangible assets.
2. Now extend beyond the asset base and use the
VRIO framework to identify the competitive posi-
tion held by your firm. Which, if any, of these
resources are helpful in sustaining the firm’s com-
petitive advantage?
3. Identify the core competencies that are at the
heart of the firm’s competitive advantage.
(Remember, a firm will have only one, or at most
a few, core competencies, by definition.)
4. Perform a SWOT analysis for your firm. Remem-
ber that strengths and weaknesses (S, W) are
internal to the firm, and opportunities and threats
(O, T) are external. Prioritize the strategic actions
that you would recommend to your firm. Refer
to the Implications for the Strategist section on
how to conduct a SWOT analysis and provide
recommendations.
Looking Inside Yourself: What Is
My Competitive Advantage?
H ere, we encourage you to take what you have learned about competitive advantage and apply it to your personal career. Spend a few minutes looking at
yourself to discover your own competitive advantage.
1. Write down your own personal strengths and weak-nesses. What sort of organization will permit you to really leverage your strengths and keep you highly
engaged in your work (person–organization fit)? Do some of your weaknesses need to be mitigated through additional training or mentoring from a more seasoned professional?
2. Personal capabilities also need to be evaluated over time. Are your strengths and weaknesses different today from what they were five years ago? What are you doing to make sure your capabilities are dynamic? Are you upgrading skills, modifying behaviors, or otherwise seeking to change your future strengths and weaknesses?
my STRATEGY
WWW.YAZDANPRESS.COMWWW.YAZDANPRESS.COM
CHAPTER 4 Internal Analysis: Resources, Capabilities, and Core Competencies 125
3. Are some of your strengths valuable, rare, and costly to imitate? How can you organize your work to help capture the value of your key strengths (or mitigate your weaknesses)? Are your strengths specific to one or a few employers, or are they more generally valu-able in the marketplace? In general, should you be making investments in your human capital in terms of company-specific or market-general skills? Why should that distinction matter?
4. As an employee, how could you persuade your boss that you could be a vital source of sustainable competi-tive advantage? What evidence could you provide to make such an argument? If you are currently or previ-ously employed, consider how your professional activi-ties can help reinforce the key value added activities in your department or organization.
1. As quoted in: “Knight the king: The found-
ing of Nike,” Harvard Business School Case Study, 9-810-077, p. 2.
2. This ChapterCase is based on: Nike, Inc.,
History and Heritage, http://nikeinc.com/
pages/history-heritage ; “Knight the king: The
founding of Nike,” “Social strategy at Nike;”
Harvard Business School Case Study, 9-712-
484; “The big business of fairy tales,” The Wall Street Journal, February 14, 2013; and
Sachs, J. (2012), Winning the story wars. Why those who tell—and live—the best stories will rule the future (Boston, MA: Harvard Busi-
ness School Press).
3. http://help-en-us.nike.com/app/answers/
detail/a_id/113/p/3897 .
4. “Top 100 most valuable global brands
2012,” report by Millward Brown, WPP.
5. Prahalad, C. K., and G. Hamel
(1990), “The core competence of the
corporation,” Harvard Business Review, May–June.
6. This discussion is based on: Amit, R., and
P.J.H. Schoemaker (1993), “Strategic assets
and organizational rent,” Strategic Manage-ment Journal 14: 33–46; Barney, J. (1991),
“Firm resources and sustained competitive
advantage,” Journal of Management 17:
99–120; Peteraf, M. (1993), “The corner-
stones of competitive advantage,” Strategic Management Journal 14: 179–191; and
Wernerfelt, B. (1984), “A resource-based view
of the firm,” Strategic Management Journal 5: 171–180.
7. Apple Annual Report, 2012.
8. “Top 100 most valuable global brands
2012,” report by Millward Brown, WPP.
9. Google Annual Report, 2012
10. “Top 100 most valuable global brands
2012.”
11. For a discussion on the benefits of being
located in a technology cluster, see: Saxenian,
A. L. (1994), Regional Advantage: Culture and Competition in Silicon Valley and Route 128 (Cambridge, MA: Harvard University
Press); and Rothaermel, F. T., and D. Ku
(2008), “Intercluster innovation differentials:
The role of research universities,” IEEE Transactions on Engineering Management 55: 9–22.
12. Stuart, T., and O. Sorenson (2003), “The
geography of opportunity: Spatial heterogene-
ity in founding rates and the performance of
biotechnology firms,” Research Policy 32:
229–253.
13. Ibid.
14. http://www.chinamobileltd.com .
15. http://www.att.com .
16. This discussion is based on: Amit, R.,
and P.J.H. Schoemaker (1993), “Strategic
assets and organizational rent”; Barney, J.
(1991), “Firm resources and sustained com-
petitive advantage”; Peteraf, M. (1993), “The
cornerstones of competitive advantage”; and
Wernerfelt, B. (1984), “A resource-based view
of the firm.”
17. This discussion is based on: Amit, R.,
and P.J.H. Schoemaker (1993), “Strategic
assets and organizational rent”; Barney, J.
(1991), “Firm resources and sustained
competitive advantage”; Barney, J., and
W. Hesterly (2009), Strategic Management and Competitive Advantage, 3rd ed. (Upper
Saddle River, NJ: Pearson Prentice Hall);
Peteraf, M. (1993), “The cornerstones of
competitive advantage”; and Wernerfelt, B.
(1984), “A resource-based view of the firm.”
18. Barney, J. (1991), “Firm resources and
sustained competitive advantage”; and
Barney, J., and W. Hesterly (2009), Strategic
Management and Competitive Advantage, 3rd ed.
19. Crocs’ share price hit an all-time high of
$74.75 on October 31, 2007. By November 20,
2008, the Crocs share price had fallen to $0.94.
20. “Apple wins big in patent case,” The Wall Street Journal, August 24, 2012; and “U.S.
judge reduces Apple’s patent award in Sam-
sung case,” The Wall Street Journal, March
1, 2013.
21. Chesbrough, H. (2006), Open Innovation: The New Imperative for Creating and Profit-ing from Technology (Boston, MA: Harvard
Business School Press).
22. In 1968, Xerox moved its headquarters
from Rochester, New York, to Norwalk,
Connecticut.
23. Prahalad, C. K., and G. Hamel (1990),
“The core competence of the corporation.”
24. Porter, M. E. (1996), “What is strategy?”
Harvard Business Review, November–
December: 61–78.
25. This discussion is based on: Barney, J.
(1986), “Strategic factor markets: Expecta-
tions, luck, and business strategy,” Manage-ment Science 32: 1231–1241; Barney, J.
(1991), “Firm resources and sustained com-
petitive advantage,” Journal of Management 17: 99–120; Dierickx, I., and K. Cool (1989),
“Asset stock accumulation and sustainability
of competitive advantage,” Management Sci-ence 35: 1504–1513; and Mahoney, J. T., and
J. R. Pandian (1992), “The resource-based
view within the conversation of strategic
management,” Strategic Management Journal 13: 363–380.
26. Lippman, S. A., and R. P. Rumelt (1982),
“Uncertain imitability: An analysis of interfirm
differences in efficiency under competition,”
The Bell Journal of Economics 13: 418–438.
ENDNOTES
WWW.YAZDANPRESS.COMWWW.YAZDANPRESS.COM

126 CHAPTER 4 Internal Analysis: Resources, Capabilities, and Core Competencies
27. Groupon Annual Report, 2012; Groupon
investor deck, March 2013; “In Groupon’s
$6 billion wake, a fleet of start-ups,” The New York Times, March 9, 2011; “The economics of
Groupon,” The Economist, October 22, 2011;
“Groupon: Deep discount,” The Economist, August 14, 2012; “Why Groupon is over and
Facebook and Twitter should follow,” Forbes, August 20, 2012; “Groupon CEO fired as
daily-deals biz bottoms out,” WIRED, February
28, 2013; “Struggling Groupon ousts its quirky
CEO,” The Wall Street Journal, February 28,
2013; “Don’t weep for Groupon ex-CEO
Andrew Mason,” The Wall Street Journal, March 1, 2013; and Godin, S. (2008), Tribes: We Need You to Lead Us (New York: Portfolio).
28 . Arthur, W. B. (1989), “Competing tech-
nologies, increasing returns, and lock-in
by historical events,” Economics Journal 99: 116–131; and Dierickx, I., and K. Cool
(1989), “Asset stock accumulation and sus-
tainability of competitive advantage,”
Management Science 35: 1504–1513.
29 . Krugman, P. (1993), Geography and Trade (Cambridge, MA: MIT Press); and
Patton, R. L. (2010), “A history of the U.S.
carpet industry,” Economic History Associa-tion Encyclopedia, http://eh.net/encyclopedia/
article/patton.carpet .
30. Manes, S., and P. Andrews (1994), Gates: How Microsoft’s Mogul Reinvented an Industry and Made Himself the Richest Man in America
(New York: Doubleday); and Gladwell, M.
(2008), Outliers: The Story of Success (New
York: Little, Brown, and Company).
31. Dierickx, I., and K. Cool (1989), “Asset
stock accumulation and sustainability of com-
petitive advantage,” Management Science 35:
1504–1513.
32. More formally, the number of relation-
ships ( r ) in a group is a function of its group
members ( n ), with r 5 n ( n 2 1)/2. The
assumption is that two people, A and B, have
only one relationship (A ← → B), rather than
two relationships (A → B and A ← l B). In
the latter case, the number of relationships ( r )
in a group with n members doubles, where
r 5 n ( n 2 1).
33. Dierickx, I., and K. Cool (1989), “Asset
stock accumulation and sustainability of com-
petitive advantage,” Management Science 35:
1504–1513.
34. Ibid.
35. This discussion is based on: Porter, M. E.
(1985), Competitive Advantage: Creating and Sustaining Superior Performance (New York:
Free Press); Porter, M. E. (1996), “What is
strategy?”; Siggelkow, N. (2001), “Change
in the presence of fit: The rise, the fall, and
the renaissance of Liz Claiborne,” Academy of Management Journal 44: 838–857; and
Magretta, J. (2012), Understanding Michael Porter. The Essential Guide to Competition and Strategy.
36. This discussion draws on: Porter, M. E.
(1996), “What is strategy?”; and Siggelkow, N.
(2002), “Evolution toward fit,” Administrative Science Quarterly 47: 125–159.
37. https://careers.vanguard.com/vgcareers/
why_vgi/story/mission.shtml .
38. “Funds: How much you’re really pay-
ing,” Money (November 2005); and https://
personal.vanguard.com/us/content/Home/
WhyVanguard/AboutVanguardWhoWe
AreContent.jsp .
39. http://www.aboutmcdonalds.com .
40. According to Reuters, cited in: http://
www.sportbusiness.com December 15,
2009.
41. “How Baidu won China,” Bloomberg Businessweek, November 11, 2010; “Special
report: China and the Internet,” The Econo-mist, April 6, 2013.
WWW.YAZDANPRESS.COMWWW.YAZDANPRESS.COM

WWW.YAZDANPRESS.COMWWW.YAZDANPRESS.COM

128
Chapter 5
Competitive Advantage, Firm Performance, and Business Models
Chapter Outline
5.1 Competitive Advantage and Firm Performance Accounting Profitability Shareholder Value Creation Economic Value Creation The Balanced Scorecard The Triple Bottom Line
5.2 Business Models: Putting Strategy into Action Different Business Models
5.3 Implications for the Strategist
Learning Objectives
After studying this chapter, you should be able to:
LO 5-1 Conduct a firm profitability analysis using accounting data.
LO 5-2 Apply shareholder value creation to assess and evaluate competitive advantage.
LO 5-3 Explain economic value creation and differ-ent sources of competitive advantage.
LO 5-4 Apply a balanced scorecard to assess and evaluate competitive advantage.
LO 5-5 Apply a triple bottom line to assess and evaluate competitive advantage.
LO 5-6 Outline how business models put strategy into action.
WWW.YAZDANPRESS.COMWWW.YAZDANPRESS.COM

129
W
Assessing Competitive
Advantage: Apple vs.
BlackBerry
WE BEGAN OUR JOURNEY into strategic manage-ment (in Chapter 1) by looking at how Apple achieved a sustainable competitive advantage (until the end of 2012), while its various competitors struggled to keep up. Prior to the introduction of the iPhone in 2007, however, the Canadian high-tech company BlackBerry was a global leader in wireless commu-nication. As an early innovator, BlackBerry defined the smartphone category and changed the way mil-lions of people around the world live and work. At one point, the BlackBerry smartphone was a corporate status symbol.
As we discussed in Chapter 1, strategy is a set of goal-directed actions a firm takes to gain and sustain competitive advantage. Since competitive advantage is defined as superior performance relative to other competitors in the same industry or the industry aver-age, a firm’s managers must be able to accomplish two critical tasks:
1. Accurately assess the performance of their firm.
2. Compare and benchmark their firm’s perfor-mance to other competitors in the same industry or against the industry average.
One of the most commonly used metrics in assess-ing firm financial performance is return on invested capital (ROIC), where ROIC 5 (Net profits/Invested capital). 1 ROIC is a popular metric because it is a good proxy for firm profitability. In particular, the ratio mea-sures how effectively a company uses its total invested capital, which consists of two components: (1) share-holders’ equity through the selling of shares to the public, and (2) interest-bearing debt through borrow-ing from financial institutions and bond holders.
As a rule of thumb, if a firm’s ROIC is greater than its cost of capital, it generates value; if it is less than the cost of capital, the firm destroys value. To be more precise and to be able to derive strategic implications, however, managers must compare their ROIC to other competitors.
Let’s compare the financial performance of Apple and BlackBerry, direct competitors in the smart-phone and mobile device industry. Exhibit 5.1 shows the ROIC for Apple and BlackBerry (as of fiscal year 2012). It further breaks down ROIC into its constitu-ent components. This provides important clues for managers concerning what areas to focus on when attempting to improve firm performance.
Apple’s ROIC was 35.0 percent, which was more than 21 percentage points higher than BlackBerry’s (14.1 percent). This means that for every $1.00 invested into Apple, the company returned almost $1.35, while for every $1.00 invested in the com-pany, BlackBerry returned $1.14. Since Apple was 2.5 times more efficient than BlackBerrry at generat-ing a return on invested capital, Apple had a clear competitive advantage over BlackBerry. 2
After reading the chapter, you will find more about this
case, with related questions, on page 152.
CHAPTER CASE 5
WWW.YAZDANPRESS.COMWWW.YAZDANPRESS.COM
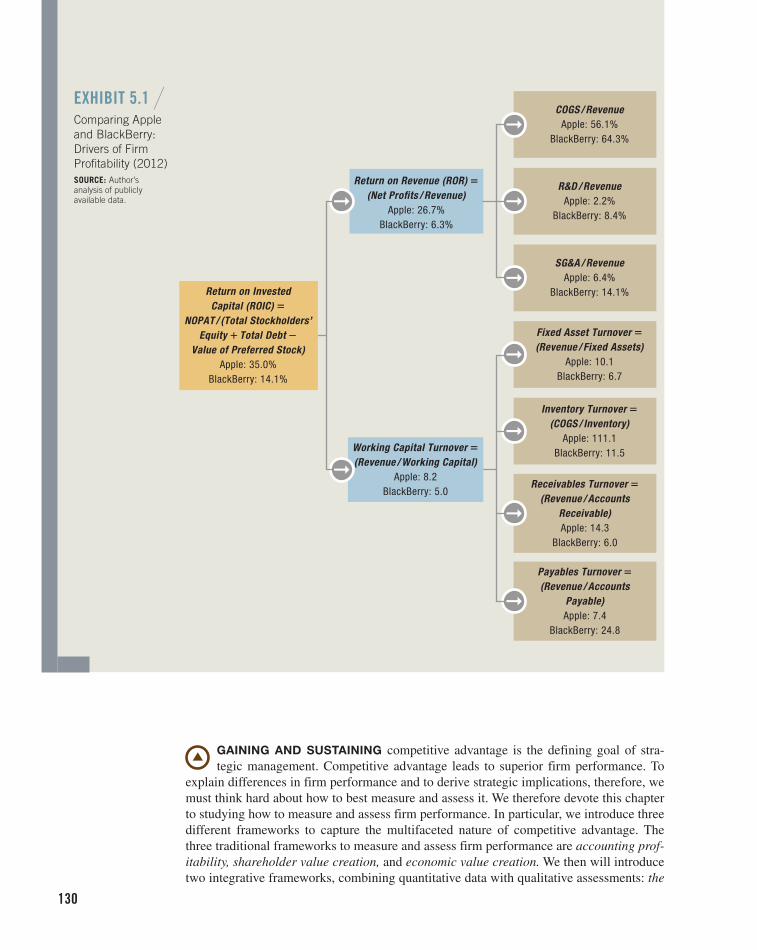
130
COGS / RevenueApple: 56.1%
BlackBerry: 64.3%
R&D / RevenueApple: 2.2%
BlackBerry: 8.4%
SG&A / RevenueApple: 6.4%
BlackBerry: 14.1%
Fixed Asset Turnover 5
(Revenue / Fixed Assets)Apple: 10.1
BlackBerry: 6.7
Inventory Turnover 5
(COGS / Inventory)Apple: 111.1
BlackBerry: 11.5
Receivables Turnover 5
(Revenue / AccountsReceivable)Apple: 14.3
BlackBerry: 6.0
Payables Turnover 5
(Revenue / AccountsPayable)Apple: 7.4
BlackBerry: 24.8
Return on InvestedCapital (ROIC) 5
NOPAT / (Total Stockholders’Equity 1 Total Debt 2
Value of Preferred Stock)Apple: 35.0%
BlackBerry: 14.1%
Working Capital Turnover 5
(Revenue / Working Capital)Apple: 8.2
BlackBerry: 5.0
Return on Revenue (ROR) 5
(Net Profits / Revenue)Apple: 26.7%
BlackBerry: 6.3%
EXHIBIT 5.1 / Comparing Apple and BlackBerry: Drivers of Firm Profitability (2012) SOURCE: Author’s analysis of publicly available data.
GAINING AND SUSTAINING competitive advantage is the defining goal of stra-
tegic management. Competitive advantage leads to superior firm performance. To
explain differences in firm performance and to derive strategic implications, therefore, we
must think hard about how to best measure and assess it. We therefore devote this chapter
to studying how to measure and assess firm performance. In particular, we introduce three
different frameworks to capture the multifaceted nature of competitive advantage. The
three traditional frameworks to measure and assess firm performance are accounting prof-itability, shareholder value creation, and economic value creation. We then will introduce
two integrative frameworks, combining quantitative data with qualitative assessments: the
WWW.YAZDANPRESS.COMWWW.YAZDANPRESS.COM

CHAPTER 5 Competitive Advantage, Firm Performance, and Business Models 131
balanced scorecard and the triple bottom line. Next, we take a closer look at business mod-els, to understand more deeply how firms put their strategy into action in order to make
money. We conclude the chapter with a practical Implications for the Strategist section.
5.1 Competitive Advantage and Firm Performance
Since competitive advantage is always relative —measured in relation to other firms—how
do we know when a firm has a competitive advantage? How do we measure and assess com-
petitive advantage? What strategic implications for managerial actions do we derive from our
assessments? Surprisingly, these apparently simple questions do not have simple answers.
Strategic management researchers have debated them intensely for at least 30 years. 3
We, too, will consider these key questions. We will develop a multidimensional per-spective to assessing competitive advantage. Let’s begin by focusing on the three standard
performance dimensions, asking: 4
1. What is the firm’s accounting profitability?
2. How much shareholder value does the firm create?
3. How much economic value does the firm generate?
These three performance dimensions tend to be correlated, particularly when consid-
ered over longer time periods. That is, accounting profitability and economic value cre-
ation tend to be reflected in the firm’s stock price.
ACCOUNTING PROFITABILITY
Using accounting data to assess competitive advantage and firm performance is standard
managerial practice. When assessing competitive advantage by measuring accounting
profitability, we use financial data and ratios derived from publicly available accounting
data such as income statements and balance sheets. 5 In Chapter Case 5, we noted that to
measure competitive advantage, we must be able to (1) accurately assess firm performance
and (2) compare and benchmark the focal firm’s performance to other competitors in the
same industry or against the industry average.
Standardized financial metrics derived from publicly available accounting data such
as income statements and balance sheets fulfill both these conditions. Public companies
are required by law to release these data, which must be in compliance with the generally
accepted accounting principles (GAAP) set by the Financial Accounting Standards Board
(FASB) and be audited by certified public accountants. Publicly traded firms are required
to file the Form 10-K (or 10-K report) annually with the U.S. Securities and Exchange
Commission (SEC), a federal regulatory agency. The 10-K reports are the primary source
of companies’ accounting data available to the public. In the wake of the Sarbanes–Oxley
Act of 2002, accounting data released to the public must now comply with more stringent
requirements. This in turn enhances the data’s usefulness for comparative analysis.
Accounting data enable us to conduct direct performance comparisons between different
companies. Some of the profitability ratios most commonly used in strategic management
are return on invested capital ( ROIC ), return on equity ( ROE ), return on assets ( ROA ), and
return on revenue ( ROR ). In five tables in the “How to Conduct a Case Analysis” module
(following the MiniCases at the back of the text), you will find a complete presentation of
accounting measures and financial ratios, how they are calculated, and a brief description
of their strategic characteristics.
To demonstrate the usefulness of accounting data in assessing competitive advan-
tage and to derive strategic implications, let’s revisit the comparison between Apple and
LO 5-1
Conduct a firm profitability analysis using accounting data.
WWW.YAZDANPRESS.COMWWW.YAZDANPRESS.COM

132 CHAPTER 5 Competitive Advantage, Firm Performance, and Business Models
BlackBerry that we began in Chapter Case 5. As shown in Exhibit 5.1 , Apple had a distinct
competitive advantage over BlackBerry (in 2012) because Apple’s ROIC was much higher
than BlackBerry’s. Although this is an important piece of information, managers need to
know the underlying factors driving differences in firm profitability. Why is the ROIC for
these two companies so different?
Much like detectives, managers look for clues to solve that mystery: They break down
ROIC into its constituent parts (as shown in Exhibit 5.1 )— return on revenue and work-ing capital turnover —to discover the underlying drivers of the marked difference in firm
profitability. Return on revenue (ROR) indicates how much of the firm’s sales is converted
into profits. Apple’s ROR was more than 20 percentage points higher than that of Black-
Berry. For every $100 in revenues, Apple earns $26.70 in profit, while BlackBerry earns
only $6.30 in profit. To explore further drivers of this difference, return on revenue is then
broken down into three additional financial ratios: Cost of goods sold (COGS)/Revenue; Research & development (R&D) expense/Revenue; and Selling, general, & administrative (SG&A) expense/Revenue.
The first of these three ratios, COGS/Revenue, indicates how efficiently a company
can produce a good. Apple is more efficient than BlackBerry (by more than 8 percentage
points). This implies that Apple’s profit margin is higher than that of BlackBerry because
Apple is able to command a greater price premium (higher markup) for its products. In
the eyes of the consumer, Apple’s products are seen as creating a higher value. Apple is
more successful than BlackBerry in differentiating its products through user-friendliness
and offering complementary services such as iTunes.
The next ratio, R&D/Revenue, indicates how much of each dollar that the firm earns in
sales is invested to conduct research and development. A higher percentage is generally an
indicator of a stronger focus on innovation to improve current products and services, and
to come up with new ones. The third ratio, SG&A/Revenue, indicates how much of each
dollar that the firm earns in sales is invested in sales, general, and administrative (SG&A)
expenses. Generally, this ratio is an indicator of the firm’s focus on marketing to promote
its products and services. Interestingly, Apple’s R&D intensity and marketing intensity are
much less than BlackBerry’s. Apple spent 2.2 percent on R&D for every dollar of revenue,
while BlackBerry spent almost four times as much (8.4 percent R&D intensity). Although
BlackBerry’s R&D and marketing intensities were multiples of Apple’s (in 2012), keep in
mind that Apple was spending much more in absolute dollar terms because it had a much
larger revenue. Adjusting financial metrics by size (e.g., revenue), however, allows a direct
comparison between different competitors.
Historically, Apple has spent much less on research and development than other firms
in the industry, in both absolute and relative terms. Apple’s co-founder and CEO, the late
Steve Jobs, defined Apple’s R&D philosophy as follows: “Innovation has nothing to do
with how many R&D dollars you have. When Apple came up with the Mac, IBM was
spending at least 100 times more on R&D. It’s not about money. It’s about the people you
have, how you’re led, and how much you get it.” 6
In contrast, BlackBerry’s R&D and marketing spending has been elevated in 2012
(thus reducing its profitability) in order to complete the development and subsequent
launch (in early 2013) of its new mobile operating system (BlackBerry 10) and its new-
est touchscreen-based smartphone, the BlackBerry Z10. In terms of marketing intensity,
BlackBerry spent more than twice as much as Apple (14.1 percent vs. 6.4 percent). The
marketing-intensity ratio (SG&A/Revenue) indicates how much of each dollar the com-
pany takes in as revenue is spent on advertising and sales support.
In January 2012, Thorsten Heins was named the new CEO of BlackBerry. To reinvigo-
rate the company’s lackluster reputation for innovation in the smartphone arena, Mr. Heins
WWW.YAZDANPRESS.COMWWW.YAZDANPRESS.COM
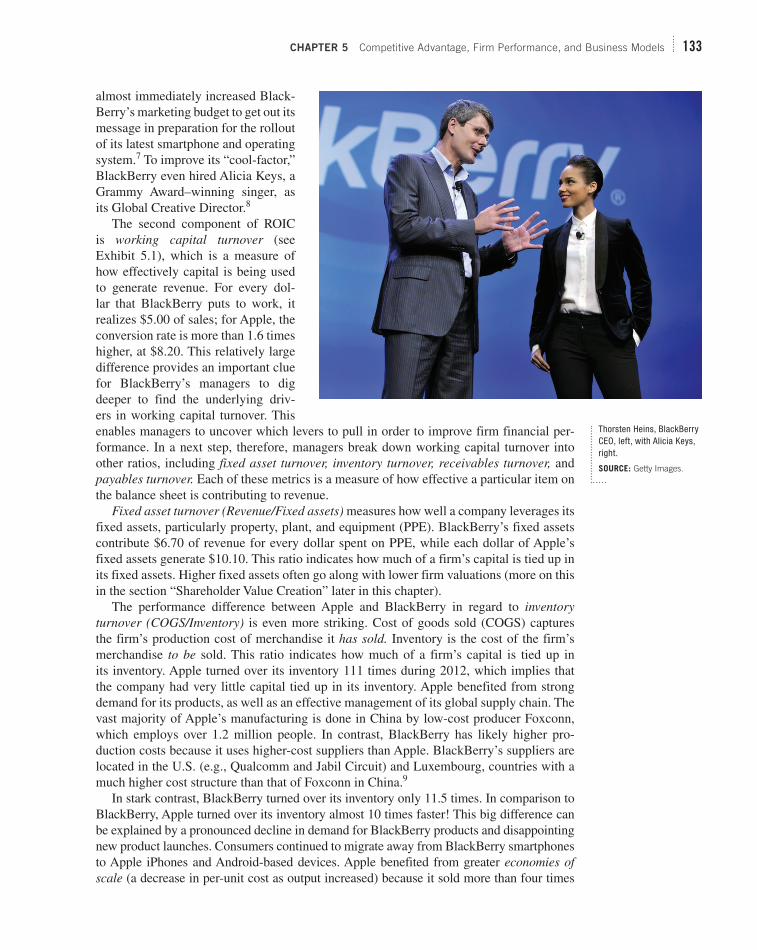
CHAPTER 5 Competitive Advantage, Firm Performance, and Business Models 133
almost immediately increased Black-
Berry’s marketing budget to get out its
message in preparation for the rollout
of its latest smartphone and operating
system. 7 To improve its “cool-factor,”
BlackBerry even hired Alicia Keys, a
Grammy Award– winning singer, as
its Global Creative Director. 8
The second component of ROIC
is working capital turnover (see
Exhibit 5.1 ), which is a measure of
how effectively capital is being used
to generate revenue. For every dol-
lar that BlackBerry puts to work, it
realizes $5.00 of sales; for Apple, the
conversion rate is more than 1.6 times
higher, at $8.20. This relatively large
difference provides an important clue
for BlackBerry’s managers to dig
deeper to find the underlying driv-
ers in working capital turnover. This
enables managers to uncover which levers to pull in order to improve firm financial per-
formance. In a next step, therefore, managers break down working capital turnover into
other ratios, including fixed asset turnover, inventory turnover, receivables turnover, and
payables turnover. Each of these metrics is a measure of how effective a particular item on
the balance sheet is contributing to revenue.
Fixed asset turnover (Revenue/Fixed assets) measures how well a company leverages its
fixed assets, particularly property, plant, and equipment (PPE). BlackBerry’s fixed assets
contribute $6.70 of revenue for every dollar spent on PPE, while each dollar of Apple’s
fixed assets generate $10.10. This ratio indicates how much of a firm’s capital is tied up in
its fixed assets. Higher fixed assets often go along with lower firm valuations (more on this
in the section “Shareholder Value Creation” later in this chapter).
The performance difference between Apple and BlackBerry in regard to inventory turnover (COGS/Inventory) is even more striking. Cost of goods sold (COGS) captures
the firm’s production cost of merchandise it has sold. Inventory is the cost of the firm’s
merchandise to be sold. This ratio indicates how much of a firm’s capital is tied up in
its inventory. Apple turned over its inventory 111 times during 2012, which implies that
the company had very little capital tied up in its inventory. Apple benefited from strong
demand for its products, as well as an effective management of its global supply chain. The
vast majority of Apple’s manufacturing is done in China by low-cost producer Foxconn,
which employs over 1.2 million people. In contrast, BlackBerry has likely higher pro-
duction costs because it uses higher-cost suppliers than Apple. BlackBerry’s suppliers are
located in the U.S. (e.g., Qualcomm and Jabil Circuit) and Luxembourg, countries with a
much higher cost structure than that of Foxconn in China. 9
In stark contrast, BlackBerry turned over its inventory only 11.5 times. In comparison to
BlackBerry, Apple turned over its inventory almost 10 times faster! This big difference can
be explained by a pronounced decline in demand for BlackBerry products and disappointing
new product launches. Consumers continued to migrate away from BlackBerry smartphones
to Apple iPhones and Android-based devices. Apple benefited from greater economies of scale (a decrease in per-unit cost as output increased) because it sold more than four times
Thorsten Heins, BlackBerry CEO, left, with Alicia Keys, right.
SOURCE: Getty Images.
WWW.YAZDANPRESS.COMWWW.YAZDANPRESS.COM

134 CHAPTER 5 Competitive Advantage, Firm Performance, and Business Models
as many iPhones as BlackBerry sold smartphones in 2012 (136 million iPhones vs. 33 mil-
lion BlackBerrys). 10 Moreover, BlackBerry’s new product launches such as the Playbook (a
tablet computer) flopped. At the same time, demand for the Apple iPad soared.
The final set of financial ratios displayed in Exhibit 5.1 concerns the effectiveness of a
company’s receivables and payables. These are part of a company’s cash flow management;
they indicate the company’s efficiency in extending credit, as well as collecting debts.
Higher ratios of receivables turnover (Revenue/Accounts receivable) imply more efficient
management in collecting accounts receivable and shorter durations of interest-free loans
to customers (i.e., time until payments are due). In contrast, payables turnover (Revenue/Accounts payable) indicates how fast the firm is paying its creditors and how much it
benefits from interest-free loans extended by its suppliers. A lower ratio indicates more
efficient management in paying creditors and generating interest-free loans from suppliers.
In the two dimensions of cash flow management, Apple displays a clear advantage over
BlackBerry. Apple is paid much faster than BlackBerry. This might be explained by the
fact that Apple’s customers are mainly individual consumers (who tend to pay with cash
or credit cards at the time of purchase), while BlackBerry’s most important customers
are corporate IT departments and governments (who request to be invoiced, and thus pay
later). On the other hand, Apple is taking quite a bit longer to pay its creditors. Due to its
stronger negotiating power, Apple might also be able to extend its payment periods, while
BlackBerry is required to pay its creditors more quickly.
A deeper understanding of the underlying drivers for differences in firm profitability
allows managers to derive strategic implications. Given its higher COGS/Revenue ratio,
BlackBerry needs to think hard about how to drive down costs, while increasing revenues.
With increased marketing spending, BlackBerry is clearly hoping that each dollar spent on
marketing and advertising will generate more than one dollar in profits. Since BlackBerry
has just completed a major refresh of its mobile phone hardware and operating system, it
might reduce R&D intensity going forward. This in turn should improve firm profitability.
One of the key pivot points for BlackBerry will be to turn over its inventory much faster.
This is, of course, closely tied to consumer demand for its products. Having more attractive
products in its lineup and improving its supply chain and logistics should help BlackBerry
improve its inventory turnover, and with it, its profitability.
Although accounting data tend to be readily available and we can easily transform them
into financial ratios to assess and evaluate competitive performance, they also exhibit some
important limitations:
■ All accounting data are historical data and thus backward-looking. Accounting prof-
itability ratios show us only the outcomes from past decisions, and the past is no
guarantee of future performance. Dell Computer, for example, clearly outperformed
its competition based on accounting data in the first few years in the last decade,
but more recently it has fallen on hard times, exhibiting a distinct competitive disad-
vantage. Also, there is a significant time delay before accounting data become pub-
licly available. Some strategy scholars have even gone so far as to suggest that using
accounting data to make strategic decisions is like driving a car by looking in the
rearview mirror. 11
■ Accounting data do not consider off–balance sheet items. Off–balance sheet items,
such as pension obligations (quite large in some U.S. companies) or operating leases
in the retail industry, can be significant factors. For example, one retailer may own all
its stores, which would properly be included in the firm’s assets; a second retailer may
lease all its stores, which would not be listed as assets. All else being equal, the second
retailer’s return on assets (ROA) would be higher. We address this shortcoming by
WWW.YAZDANPRESS.COMWWW.YAZDANPRESS.COM

CHAPTER 5 Competitive Advantage, Firm Performance, and Business Models 135
adjusting accounting data to obtain an equivalent economic capital base, so that we can
compare companies with different capital structures.
■ Accounting data focus mainly on tangible assets, which are no longer the most important. 12 This limitation of accounting data is nicely captured in the adage: Not everything that can be counted counts. Not everything that counts can be counted. 13
Although accounting data capture some intangible assets, such as the value of intel-
lectual property (patents, trademarks, and so on) and customer goodwill, many key
intangible assets are not captured. Today, the most competitively important assets tend
to be intangibles such as innovation, quality, and customer experience, which are not
included in a firm’s balance sheets. For example, Hyundai’s reputation for quality,
Honda’s core competency in designing highly reliable engines, and Zappos’ superior
customer experience are not balance sheet items.
Indeed, intangibles that are not captured in accounting data have become much more
important in firms’ stock market valuations over the last few decades. Look at Exhibit 5.2 ,
which shows the firm’s book value (accounting data capturing the firm’s actual costs of
assets minus depreciation) as part of a firm’s total stock market valuation (number of out-
standing shares times share price). The firm’s book value captures the historical cost of a
firm’s assets, whereas market valuation is based on future expectations for a firm’s growth
potential and performance. For the firms in the S&P 500 (the 500 largest publicly traded
companies by market capitalization in the U.S. stock market, as determined by Standard
& Poor’s, a rating agency), the importance of a firm’s book value has declined dramati-
cally over time. At the same time, the importance of intangibles that contribute to growth
potential and yet are not captured in a firm’s accounting data has increased commensu-
rately (see Exhibit 5.2 ). In 1980, about 80 percent of a firm’s stock market valuation was
based on its book value with 20 percent based on the market’s expectations concerning
the firm’s future performance. This almost reversed by 2002 (in the aftermath of the
Internet bubble), when firm valuations
were based only 25 percent on assets
captured by accounting data. The impor-
tant take-away is that intangibles not
captured in firms’ accounting data have
become much more important to a firm’s
competitive advantage (about 70 percent
in 2010, for example). The importance of
intangibles becomes clearer if you think,
for example, about market valuations of
Internet-based firms such as Facebook or
Google.
Key financial ratios based on account-
ing data give us an important tool with
which to assess competitive advantage.
In particular, they help us measure rela-tive profitability, which is useful when
comparing firms of different sizes over
time. While not perfect, these ratios are an
important starting point when analyzing
the competitive performance of firms (and
thus are critical tool for case analysis).
Again, see the “How to Conduct a Case
90%
80%
70%
100%
20%
80%
55%
45%
85%
15%
30%
70%60%
50%
40%
30%
20%
10%
0%1980 1990 2000 2010
Not Captured in Book Value Book Value
EXHIBIT 5.2 / The Declining Importance of Book Value in a Firm’s Stock Market Valuation, 1980–2010
SOURCE: Author’s depiction of data from Compustat, 1980–2010.
WWW.YAZDANPRESS.COMWWW.YAZDANPRESS.COM

136 CHAPTER 5 Competitive Advantage, Firm Performance, and Business Models
Analysis” module. We next turn to shareholder value creation, as a second traditional way
to measure and assess competitive advantage.
SHAREHOLDER VALUE CREATION
Shareholders —individuals or organizations that own one or more shares of stock in a
public company—are the legal owners of public companies. From the shareholders’ per-
spective, the measure of competitive advantage that matters most is the return on their risk capital , 14 which is the money they provide in return for an equity share, money that they
cannot recover if the firm goes bankrupt. In September 2008, the shareholders of Lehman
Brothers, a global financial services firm, lost their entire investment of about $40 billion
when the firm declared bankruptcy.
Investors are primarily interested in a company’s total return to shareholders , which
is the return on risk capital, including stock price appreciation plus dividends received
over a specific period. Unlike accounting data, total return to shareholders is an external performance metric. It essentially indicates how the stock market views all available pub-
lic information about a firm’s past, current state, and expected future performance (with
most of the weight on future growth expectations). The idea that all available information
about a firm’s past, current state, and expected future performance is embedded in the
market price of the firm’s stock is called the efficient-market hypothesis. 15 In this perspec-
tive, a firm’s share price provides an objective performance indicator. When assessing and
evaluating competitive advantage, a comparison of rival firms’ share price development or
market capitalization provides a helpful yardstick when used over the long term. Market capitalization (or market cap) captures the total dollar market value of a company’s out-
standing shares at any given point in time (Market cap 5 Number of outstanding shares 3
Share price). If a company has 50 million shares outstanding, and each share is traded at
$200, the market capitalization is $10 billion (50,000,000 3 $200 5 $10,000,000,000, or
$10 billion). 16
All public companies in the United States are required to report total return to share-
holders annually in the statements they file with the Securities and Exchange Commission
(SEC). In addition, companies must also provide benchmarks, usually one comparison
to the industry average and another to a broader market index (which is relevant for more
diversified firms). 17 Since competi-
tive advantage is defined in relative
terms, these benchmarks allow us to
assess whether a firm has a competi-
tive advantage. In its annual reports,
Microsoft, for example, compares its
performance to two stock indices:
the NASDAQ computer index and
the S&P 500. The computer index
includes over 400 high-tech compa-
nies traded on the NASDAQ, such
as Apple, Dell, Google, Intel, and
Oracle. It provides a comparison of
Microsoft to the computer industry—
broadly defined. The S&P 500 offers a
comparison to the wider stock market
beyond the computer industry. In its
LO 5-2
Apply shareholder value creation to assess and evaluate competitive advantage.
shareholders
Individuals or organizations that own one or more shares of stock in a public company. They are the legal owners of public companies.
risk capital The money provided by shareholders in exchange for an equity share in a company; it cannot be recovered if the firm goes bankrupt.
WWW.YAZDANPRESS.COMWWW.YAZDANPRESS.COM

CHAPTER 5 Competitive Advantage, Firm Performance, and Business Models 137
2012 annual report, Microsoft shows that it out performed the S&P 500 over the last five
years but under performed in comparison to the NASDAQ computer index. 18
Effective strategies to grow the business can increase a firm’s profitability and thus its
stock price. 19 Indeed, investors and Wall Street analysts expect continuous growth. A firm’s
stock price generally increases only if the firm’s rate of growth exceeds investors’ expec-
tations. This is because investors discount into the present value of the firm’s stock price
whatever growth rate they foresee in the future. If a low-growth business like Comcast (in
cable TV) is expected to grow 2 percent each year but realizes 4 percent growth, its stock
price will appreciate. In contrast, if a fast-growing business like Apple in mobile comput-
ing is expected to grow by 10 percent annually but delivers “only” 8 percent growth, its
stock price will fall.
Investors also adjust their expectations over time. Since the business in the slow-growth
industry surprised them by delivering higher than expected growth, they adjust their expec-
tations upward. The next year, they expect this firm to again deliver 4 percent growth. On
the other hand, if the industry average is 10 percent a year in the high-tech business, the
firm that delivered 8 percent growth will again be expected to deliver at least the industry
average growth rate; otherwise, its stock will be further discounted.
In Chapter Case 1, we noted that Apple was once the most valuable company on the
planet. Considering stock market valuations (Share price 3 Number of outstanding shares) over the long term provides a useful metric to assess competitive advantage.
Exhibit 5.3 shows the stock market valuations for Apple and a set of its closest competitors
from 1990 until the end of 2012. Microsoft was once the most valuable company world-
wide (in December 1999), but since then its market valuation has dropped by more than
50 percent. This is because investors now have lower expectations concerning Microsoft’s
ability to deliver profitable growth in the future. In particular, Microsoft is struggling with
the transition away from desktop to mobile computing. Competitive advantage is clearly transitory!
total return to
shareholders Return on risk capital that includes stock price appreciation plus dividends received over a specific period.
market capitalization
A firm performance metric that captures the total dollar market value of all of a company’s outstanding shares at any given point in time (Market cap 5 Number of outstanding shares 3 Share price).
700
600
500
Mar
ket C
apita
lizat
ion,
$ b
illio
ns
400
300
200
100
0
MICROSOFT
SAMSUNG
AMAZON
APPLE
19901991
19921993
19941995
19961997
19981999
20002001
20022003
20042005
20062007
20082009
20102011
2012
EXHIBIT 5.3 / Stock Market Valuations of Amazon, Apple, Google, Microsoft, and Samsung SOURCE: Author’s depiction of data from Bloomberg.
WWW.YAZDANPRESS.COMWWW.YAZDANPRESS.COM

138 CHAPTER 5 Competitive Advantage, Firm Performance, and Business Models
$370
$658
Mar
ket C
apita
lizat
ion,
$ b
illio
ns
700
650
600
550
500
450
400
370
300
20-Dec
-11
20-Jan
-12
20-Feb
-12
20-Mar-
12
20-Apr
-12
20-May
-12
20-Jun
-12
20-Jul-
12
20-Aug
-12
20-Sep
-12
20-Oct-
12
20-Nov
-12
20-Dec
-12
20-Jan
-13
20-Feb
-13
20-Mar-
13
20-Apr
-13
EXHIBIT 5.4 / Apple’s Market Cap (December 2011– April 2013) SOURCE: Author’s depiction of data from Bloomberg.
Exhibit 5.3 also shows the resurgence of Samsung and the strong performance of up-
and-coming newer competitors such as Google and Amazon. Samsung’s rise is driven by
a set of successful smartphones, while Google and Amazon continue to have tremendous
growth opportunities as they find new areas to apply their core competencies. As demon-
strated by Exhibit 5.3 , market capitalization over the long run is a valuable tool to assess
competitive advantage and firm performance.
In contested industries, it is difficult to gain a competitive advantage, and even more dif-
ficult to sustain it over time. As Exhibit 5.4 shows, only a few short months after reaching
its all-time high market cap of $658 billion in the fall of 2012, Apple’s market capitaliza-
tion fell by about 45 percent, wiping out close to $290 billion in shareholder value. Within
a short 16-months’ time, Apple’s market cap rose from $370 billion in December 2011 to
its all-time high of $658 billion in September 2012, only to fall back to $370 billion by
April 2013.
Although measuring firm performance through total return to shareholders and firm
market capitalization has many advantages, it is not without problems:
■ Stock prices can be highly volatile, making it difficult to assess firm performance, par-ticularly in the short term. This volatility implies that total return to shareholders is a
better measure over the long term due to the “noise” introduced by market volatility,
external factors, and investor sentiment.
■ Overall macroeconomic factors such as the unemployment rate, economic growth or contraction, and interest and exchange rates all have a direct bearing on stock
WWW.YAZDANPRESS.COMWWW.YAZDANPRESS.COM

CHAPTER 5 Competitive Advantage, Firm Performance, and Business Models 139
prices. It can be difficult to ascertain the extent to which a stock price is influenced
more by external macroeconomic factors (as discussed in Chapter 3) than by the
firm’s strategy.
■ Stock prices frequently reflect the psychological mood of investors, which can at times be irrational. Stock prices can overshoot expectations based on economic fundamentals
amidst periods like the Internet boom, during which former Federal Reserve Chairman
Alan Greenspan described investors’ buoyant sentiments as “irrational exuberance.” 20 Sim-
ilarly, stock prices can undershoot expectations during busts like the 2008–2009 worldwide
financial crisis, during which investors’ sentiment was described as “irrational gloom.” 21
ECONOMIC VALUE CREATION
The relationship between economic value creation and competitive advantage is funda-
mental in strategic management. It provides the foundation upon which to formulate a
firm’s competitive strategy of cost leadership or differentiation (discussed in detail in the
next chapter). For now, it is important to note that a firm has a competitive advantage when
it creates more economic value than rival firms. What does that mean?
Economic value created is the difference between a buyer’s willingness to pay for a
product or service and the firm’s total cost to produce it . Let’s assume you consider buying
a laptop computer and you have a budget of $1,200. You have narrowed your search down
to two models, one offered by Firm A, the other by Firm B. Your subjective assessment of
the benefits derived from owning Firm A’s laptop is $1,000—this is the absolute maximum
you’d be willing to pay for it, or the reservation price. In contrast, you value Firm B’s lap-
top model at $1,200 because it has somewhat higher performance, is more user-friendly,
and definitely has a higher “coolness-factor.” Given that you value Firm B’s laptop by $200
more than Firm A’s model, you will purchase a laptop from Firm B.
Let’s move now from your individual considerations to the overall market for laptop
computers in order to derive implications for firm-level competitive advantage. To sim-
plify this illustration, only Firm A and Firm B are competing in the market for laptops.
Assuming that both Firm A and Firm B have the same total unit cost of producing the
particular laptop model under consideration ($400) and the market at large has similar
preferences as you do, then Firm B will have a competitive advantage. This is because
Firm B creates more economic value than Firm A (by $200), but has the same total cost.
This situation is depicted in Exhibit 5.5 . The amount of total perceived consumer benefits
LO 5-3
Explain economic value creation and different sources of competitive advantage.
economic value
created Difference between value ( V ) and cost ( C ), or ( V 2 C ); sometimes also called economic contribution.
$1,000$900
Economic Value Created
$600
$800$700$600
TotalPerceivedConsumerBenefits
5
MaximumWillingness
to Pay$1,000
$500$400$300 Firm’s Cost
$400$200$100
Firm A
$1,200Total
PerceivedConsumerBenefits
$1,100$1,000
Economic Value Created
$800
$900$800
5 $700
MaximumWillingness
to Pay$1,200
$600$500$400$300 Firm’s Cost
$400$200$100
Firm B
EXHIBIT 5.5 / Firm B’s Competitive Advantage: Same Cost as Firm A but Firm B Creates More Economic Value
WWW.YAZDANPRESS.COMWWW.YAZDANPRESS.COM

140 CHAPTER 5 Competitive Advantage, Firm Performance, and Business Models
$1,200Total
PerceivedConsumerBenefits
$1,100$1,000
Economic Value Created
$600$900$800
5 $700
MaximumWillingness
to Pay$1,200
$600$500$400$300
Firm’s Cost$600
$200$100
Firm B
$1,200Total
PerceivedConsumerBenefits
$1,100$1,000
Economic Value Created
$800
$900$800
5 $700
MaximumWillingness
to Pay$1,200
$600$500$400$300 Firm’s Cost
$400$200$100
Firm A
EXHIBIT 5.6 / Firm A’s Competitive Advantage: Same Total Perceived Consumer Benefits as Firm B but Firm A Creates More Economic Value
equals the maximum willingness to pay. This amount is then split into economic value
creation and the firm’s total unit cost. Firm A and Firm B have identical total unit cost
($400 per laptop). However, Firm B’s laptop is perceived to provide more utility than Firm
A’s laptop, which implies that Firm B creates more economic value ($800) than Firm A
($600). Taken together, Firm B has a competitive advantage over Firm A because Firm B
creates more economic value. This is because Firm B’s offering has greater total perceived
consumer benefits than Firm A’s, while the firms have the same total cost. In short, Firm
B’s advantage is based on superior differentiation leading to higher perceived value. Fur-
ther, the competitive advantage can be quantified: It is $200 per laptop sold for Firm B
over Firm A.
Exhibit 5.5 shows that Firm B’s competitive advantage is based on greater economic
value creation due to superior product differentiation. Competitive advantage, however,
can also result from a relative cost advantage over rivals, assuming both firms can create
the same total perceived consumer benefits. As shown in Exhibit 5.6 , both laptop makers
now offer a model that has the same perceived consumer benefits ($1,200). Firm A, how-
ever, creates economic value greater ($800) than that of Firm B ($600). This is because
Firm A’s total unit cost ($400) is lower than Firm B’s ($600) due to Firm A’s relative
cost advantage. As Exhibit 5.6 shows, Firm A has a competitive advantage over Firm B
(in the amount of $200 each time Firm A sells a laptop). Here, the source of the competi-
tive advantage is a relative cost advantage over rivals.
Three components are needed to further explain total perceived consumer benefits and
economic value created in more detail: (1) value ( V ), (2) price ( P ), and (3) cost ( C ). Value denotes the dollar amount ( V ) a consumer would attach to a good or service. Value captures
a consumer’s willingness to pay and is determined by the perceived benefits a good or
service provides to the buyer. The cost ( C ) to produce the good or service matters little to
the consumer, but it matters a great deal to the producer (supplier) of the good or service
since it has a direct bearing on the profit margin. Continuing with the laptop example, total
perceived value ($1,200) splits into economic value created ( V 2 C 5 $800) plus total unit cost ( C 5 $400), or: V 5 ( V 2 C ) 1 C.
The difference between the price charged ( P ) and the cost to produce ( C ) is the profit , or producer surplus . In the laptop example, if the price charged is $900, the profit is
P 2 C 5 $900 2 $400 5 $500. The firm captures this amount as profit per unit sold. As
value The dollar amount ( V ) a consumer would attach to a good or service; the consumer’s maximum willingness to pay; sometimes also called reservation price.
profit (producer
surplus) Difference between price charged ( P ) and the cost to produce ( C ), or ( P 2 C ).
WWW.YAZDANPRESS.COMWWW.YAZDANPRESS.COM

CHAPTER 5 Competitive Advantage, Firm Performance, and Business Models 141
the consumer, you capture the difference between what you would have been willing to
pay ( V ) and what you paid ( P ), called consumer surplus . In our example, the consumer
surplus is V 2 P 5 $1,200 2 $900, or $300. Economic value creation therefore equals
consumer surplus plus firm profit, or ( V 2 C ) 5 ( V 2 P ) 1 ( P 2 C ). In the laptop exam-
ple, economic value created ($1,200 2 $400) 5 Consumer surplus ($1,200 2 $900) 1
Producer surplus ($900 2 $400) 5 $300 1 $500 5 $800.
The relationship between consumer and producer surplus is the reason trade happens:
Both transacting parties capture some of the overall value created. Note, though, that the
distribution of the value created between parties need not be equal to make trade worth-
while. By applying this framework, strategy is about (1) creating economic value and (2)
capturing as much of it as possible. Exhibit 5.7 graphically illustrates how these concepts fit together. On the left side of the
graph, V represents the total perceived consumer benefits, as captured in the consumer’s
maximum willingness to pay . In the lower part of the center bar, C is the cost to produce
the product or service (the unit cost). It follows that the difference between the consumers’
maximum willingness to pay and the firm’s cost ( V 2 C ) is the economic value created.
The price of the product or service ( P ) is indicated in the dashed line. The economic value
created ( V 2 C ), as shown in Exhibit 5.7 , is split between producer and consumer: ( V 2 P )
is the value the consumer captures ( consumer surplus ), and ( P 2 C ) is the value the pro-
ducer captures ( producer surplus, or profit ). Competitive advantage goes to the firm that achieves the largest economic value cre-
ated, which is the difference between V, the consumer’s willingness to pay, and C, the cost
to produce the good or service. The reason is that a large difference between V and C gives
the firm two distinct pricing options: (1) It can charge higher prices to reflect the higher
value and thus increase its profitability, or (2) it can charge the same price as competitors
and thus gain market share. Given this, the strategic objective is to maximize ( V 2 C ), or
the economic value created.
consumer surplus
Difference between the value a consumer attaches to a good or service ( V ) and what he or she paid for it ( P ), or ( V 2 P ).
(V 2 P ) 5
Consumer
Surplus
(P – C ) 5
Firm’s
Profit
(V 2 C ) 5
Economic
Value
Created
5
V 5
Total
Perceived
Consumer
Benefits
Consumer’s
Maximum
Willingness
to Pay
C 5
Firm’s
Cost
C 5
Firm’s
Cost
P 5 Price
EXHIBIT 5.7 / Competitive Advantage and Economic Value Created: The Role of Value, Cost, and Price
WWW.YAZDANPRESS.COMWWW.YAZDANPRESS.COM

142 CHAPTER 5 Competitive Advantage, Firm Performance, and Business Models
Applying the notion of economic value creation also has direct implications for firm
financial performance. Revenues are a function of the value created for consumers and the
price of the good or service, which together drive the volume of goods sold. In this per-
spective, profit ( P ) is defined as total revenues ( TR ) minus total costs ( TC ):
P 5 TR 2 TC, where TR 5 P 3 Q, or price times quantity sold
Total costs include both fixed and variable costs. Fixed costs are independent of con-
sumer demand—for example, the cost of capital to build computer manufacturing plants
or an online retail presence to take direct orders. Variable costs change with the level of
consumer demand—for instance, components such as LCD screens, microprocessors, hard
drives, display screens, and keyboards.
Rather than merely relying on historical costs, as done when taking the perspective of
accounting profitability (introduced earlier), in the economic value creation perspective,
all costs, including opportunity costs, must be considered. Opportunity costs capture the
value of the best forgone alternative use of the resources employed.
An entrepreneur, for example, faces two types of opportunity costs: (1) forgone wages
she could be earning if she was employed elsewhere and (2) the cost of capital she invested
in her business, which could instead be invested in, say, the stock market or U.S. Treasury
bonds. At the end of the year, the entrepreneur considers her business over the last 12
months. She made an accounting profit of $70,000, calculated as total revenues minus
expenses (which include all historical costs but not opportunity costs). But she also real-
izes she has forgone $60,000 in salary she could have earned at another firm. In addition,
she knows she could have earned $20,000 in interest if she had bought U.S. Treasury bills
with a 4 percent return instead of investing $500,000 in her business. The opportunity cost
of being an entrepreneur was $80,000 ($60,000 1 $20,000). Therefore, when consider-
ing all costs, including opportunity costs, she actually experienced an economic loss of
$10,000 ($80,000 2 $70,000). When considering her future options, she should stay in
business only if she values her independence as an entrepreneur more than $10,000 or
thinks business will be better next year.
As with any tool to assess competitive advantage, the economic value creation frame-
work also has some limitations:
■ Determining the value of a good in the eyes of consumers is not a simple task. One
way to tackle this problem is to look at consumers’ purchasing habits for their revealed
preferences, which indicate how much each consumer is willing to pay for a product
or service. In the earlier example, the value ( V ) you placed on the laptop—the highest
price you were willing to pay, or your reservation price—was $1,200. If the firm is able
to charge the reservation price ( P 5 $1,200), it captures all the economic value created
( V 2 C 5 $800) as producer surplus or profit ( P 2 C 5 $800).
■ The value of a good in the eyes of consumers changes based on income, preferences, time, and other factors. If your income is high, you are likely to place a higher value
on some goods (e.g., business-class air travel) and a lower value on other goods (e.g.,
Greyhound bus travel). In regard to preferences, you may place a higher value on a
ticket for a Lady Gaga concert than on one for the New York Philharmonic orchestra
(or vice versa). As an example of time value, you place a higher value on an airline
ticket that will get you to a business meeting tomorrow than on one for a planned trip
to take place eight weeks from now.
■ To measure firm-level competitive advantage, we must estimate the economic value created for all products and services offered by the firm. This estimation may be a rela-
tively easy task if the firm offers only a few products or services. However, it becomes
opportunity costs
The value of the best forgone alternative use of the resources employed.
WWW.YAZDANPRESS.COMWWW.YAZDANPRESS.COM

CHAPTER 5 Competitive Advantage, Firm Performance, and Business Models 143
much more complicated for diversified firms such as General Electric, Unilever, or
the Tata Group that may offer hundreds or even thousands of different products and
services across many different industries and geographies. Although the performance
of individual strategic business units (SBUs) can be assessed along the dimensions
described here, it becomes more difficult to make this assessment at the corporate
level. Yet, assessing corporate-level performance is critical in order to justify the exis-
tence of diversified conglomerates (more on this in our discussion on diversification
strategy in Chapter 8).
In summary, the economic value creation perspective gives us one useful way to assess
competitive advantage. This approach is conceptually quite powerful, and it lies at the
center of many strategic management frameworks (such as the generic business strategies
we discuss in the next chapter). However, it falls short when managers are called upon to
operationalize competitive advantage. When the need for “hard numbers” arises, managers
and analysts frequently rely on firm financials such as accounting profitability or share-holder value creation to measure firm performance.
We’ve now completed our consideration of the three standard dimensions for measuring
competitive advantage—economic value, accounting profitability, and shareholder value.
Although each provides unique insights for our assessment of a firm’s performance, one
drawback is that they are more or less one-dimensional metrics. Focusing on just one per-
formance metric when assessing competitive advantage, however, can lead to significant
problems, because each metric has its shortcomings, as listed earlier. We now turn to two
conceptual frameworks—the balanced scorecard and the triple bottom line—that attempt
to provide a more holistic perspective on firm performance.
THE BALANCED SCORECARD
Just as airplane pilots rely on a number of instruments to provide constant informa-
tion about key variables such as altitude, airspeed, fuel, position of other aircraft in the
vicinity, and destination in order to ensure a safe flight, so should managers rely on
multiple yardsticks to more accurately assess company performance in an integrative
way. Kaplan and Norton proposed a framework to help managers achieve their strategic
objectives more effectively. 22 Called the balanced scorecard , this approach harnesses
multiple internal and external performance metrics in order to balance both financial
and strategic goals.
Exhibit 5.8 depicts the balanced-scorecard framework. Managers using the balanced
scorecard develop strategic objectives and appropriate metrics by answering four key ques-
tions that Kaplan and Norton, during a yearlong research project with a number of differ-
ent companies, identified as the most salient. 23 Brainstorming answers to these questions
(ideally) results in a set of measures that give manag-
ers a quick but also comprehensive view of the firm’s
current state. The four key questions are:
1. How do customers view us? The customer’s per-
spective concerning the company’s products and
services is linked directly to its revenues and prof-
its. The perceived value of a product or service
determines how much the customer is willing to
pay for it. The question, “How do customers view
us?” is therefore directly linked to how much
LO 5-4
Apply a balanced scorecard to assess and evaluate competitive advantage.
balanced scorecard
Strategy implementation tool that harnesses multiple internal and external performance metrics in order to balance financial and strategic goals.
WWW.YAZDANPRESS.COMWWW.YAZDANPRESS.COM

144 CHAPTER 5 Competitive Advantage, Firm Performance, and Business Models
economic value a firm can create. If the cus-
tomer views the company’s offering favor-
ably, she is willing to pay more for a certain
product or service, enhancing its competitive
advantage (assuming production costs are
well below the asking price).
To learn how customers view a company’s
products or services, managers collect data
to identify areas to improve, with a focus
on speed, quality, service, and cost. In the
air-express industry, for example, managers
learned from their customers that many don’t
really need next-day delivery for most of their
documents and packages; rather what they
really cared about was the ability to track the
shipments. This discovery led to the devel-
opment of steeply discounted second-day
delivery by UPS and FedEx, combined with
sophisticated online tracking tools.
2. How do we create value? Answering this question challenges managers to come up with
strategic objectives that ensure future competitiveness, innovation, and organizational
learning. It focuses on the business processes and structures that allow a firm to cre-
ate economic value. One useful metric, for example, is the percentage of revenues
obtained from new product introductions. 3M, for example, requires that 30 percent of
revenues must come from products introduced within the last four years. 24 A second
metric, aimed at assessing a firm’s external learning and collaboration capability, is
to stipulate that a certain percentage of new products must originate from outside the
firm’s boundaries. 25 Through its Connect + Develop program, the consumer products
company Procter & Gamble has raised the percentage of new products that originated
(at least partly) from outside P&G, from 15 to 35 percent. 26
3. What core competencies do we need? This question focuses managers internally, to
identify the core competencies needed to achieve their objectives, and the accom-
panying business processes that support, hone, and leverage those competencies.
Robert Clarke, former president of performance development at Honda, argues that
Honda is at its heart an engine company (not a car company). 27 Beginning with
motorcycles in 1948, Honda nurtured this core competency over many decades, and
today is leveraging it to reach stretch goals in the design, development, and manu-
facture of small airplanes.
4. How do shareholders view us? The final perspective in the balanced scorecard is the
shareholders’ view of financial performance. Some of the measures in this area rely on
accounting data such as cash flow, operating income, ROIC, ROE, and, of course, total
returns to shareholders. Understanding the shareholders’ view of value creation leads
managers to a more future-oriented evaluation.
By relying on both an internal and an external view of the firm, the balanced scorecard
combines the strengths provided by the individual approaches to assessing competitive
advantage discussed earlier: accounting profitability, shareholder value creation, and eco-
nomic value creation.
How do shareholders view us?
How
do
cu
sto
me
rs v
iew
us?
How do we create value?
COMPETITIVE
ADVANTAGE
Wha
t co
re c
om
pe
ten
cie
s d
o w
e ne
ed?
EXHIBIT 5.8 / A Balanced-Scorecard Approach to Creating and Sustaining Competitive Advantage
WWW.YAZDANPRESS.COMWWW.YAZDANPRESS.COM

CHAPTER 5 Competitive Advantage, Firm Performance, and Business Models 145
ADVANTAGES OF THE BALANCED SCORECARD. The balanced-scorecard approach
is popular in managerial practice because it has several advantages. In particular, the balanced
scorecard allows managers to:
■ Communicate and link the strategic vision to responsible parties within the organization.
■ Translate the vision into measureable operational goals.
■ Design and plan business processes.
■ Implement feedback and organizational learning in order to modify and adapt strategic
goals when indicated.
The balanced scorecard can accommodate both short- and long-term performance met-
rics. It provides a concise report that tracks chosen metrics and measures and compares them
to target values. This approach allows managers to assess past performance, identify areas
for improvement, and position the company for future growth. Including a broader perspec-
tive than financials allows managers and executives a more balanced view of organizational
performance—hence its name. In a sense, the balanced scorecard is a broad diagnostic tool.
It complements the common financial metrics with operational measures on customer satis-
faction, internal processes, and the company’s innovation and improvement activities.
Let’s look at FMC Corporation, a chemical manufacturer employing some 5,000 people
in different SBUs and earning over $3 billion in annual revenues, as an example of how
to implement the balanced-scorecard approach. 28 To achieve its vision of becoming “the
customer’s most valued supplier,” FMC’s managers initially had focused solely on finan-
cial metrics such as return on invested capital (ROIC) as performance measures. FMC is a
multibusiness corporation with several standalone profit-and-loss strategic business units;
its overall performance was the result of both over- and underperforming units. FMC’s
managers had tried several approaches to enhance performance, but they turned out to be
more or less ineffective. Perhaps even more significant, short-term thinking by general
managers was a major obstacle in the attempt to implement a business strategy.
Searching for improved performance, FMC’s CEO decided to adopt a balanced-
scorecard approach. It enabled the managers to view FMC’s challenges and shortcom-
ings from a holistic, company perspective, which was especially helpful to the general
managers of different business units. In particular, the balanced scorecard allowed general
managers to focus on market position, customer service, and new product introductions
that could generate long-term value. Using the framework depicted in Exhibit 5.8 , general
managers had to answer tough follow-up questions such as: How do we become the cus-
tomer’s most valued supplier, and how can my division create this value for the customer?
How do we become more externally focused? What are my division’s core competencies
and contributions to the company goals? What are my division’s weaknesses?
Implementing a balanced scorecard allowed FMC’s managers to align their different
perspectives to create a more focused corporation overall. General managers now review
progress along the chosen metrics every month, and corporate executives do so on a quar-
terly basis. Although successful for FMC, implementing a balanced-scorecard approach is
not a one-time effort, but requires continuous tracking of metrics and updating of strategic
objectives, if needed. It is a continuous process, feeding performance back into the strategy
process to assess its effectiveness (see Chapter 2).
DISADVANTAGES OF THE BALANCED SCORECARD. Though widely implemented
by many businesses, the balanced scorecard is not without its critics. 29 It is important to
note that the balanced scorecard is a tool for strategy implementation, not for strategy
WWW.YAZDANPRESS.COMWWW.YAZDANPRESS.COM

146 CHAPTER 5 Competitive Advantage, Firm Performance, and Business Models
formulation. It is up to a firm’s managers to formulate a strategy that will enhance the
chances of gaining and sustaining a competitive advantage. In addition, the balanced-
scorecard approach provides only limited guidance about which metrics to choose. Differ-
ent situations call for different metrics. All of the three approaches to measuring competitive
advantage—accounting profitability, shareholder value creation, and economic value cre-
ation—in addition to other quantitative and qualitative measures, can be helpful when using
a balanced-scorecard approach.
When implementing a balanced scorecard, managers need to be aware that a failure to
achieve competitive advantage is not so much a reflection of a poor framework but of a
strategic failure. The balanced scorecard is only as good as the skills of the managers who
use it: They first must devise a strategy that enhances the odds of achieving competitive
advantage. Second, they must accurately translate the strategy into objectives that they can
measure and manage within the balanced-scorecard approach. 30
Once the metrics have been selected, the balanced scorecard tracks chosen metrics and
measures and compares them to target values. It does not, however, provide much insight
into how metrics that deviate from the set goals can be put back on track. 31
THE TRIPLE BOTTOM LINE
Today, managers are frequently asked to maintain and improve not only the firm’s economic
performance but also its social and ecological performance. As we saw in Chapter Case 2,
CEO Indra Nooyi responded by declaring PepsiCo’s vision to be Performance with a Pur-pose defined by goals in the social dimension ( human sustainability to combat obesity by
making its products healthier, and the whole person at work to achieve work-life balance)
and ecological dimension ( environmental sustainability in regard to clean water, energy,
recycling, and so on), in addition to firm financial performance.
Noneconomic factors can have a significant impact on a firm’s financial performance,
not to mention its reputation and customer goodwill. We saw in Strategy Highlight 1.2 how
BP’s infamous oil spill in the Gulf of Mexico put the company on the brink of financial
collapse. It also threatened to destroy fauna and flora along the U.S. shoreline from Texas
to Florida, as well as the livelihood of hundreds of thousands of people in the tourism and
fishing industries. BP’s estimated legal damages could be over $40 billion; the loss of its
reputation and customer goodwill is likely to be much higher.
In contrast, being proactive along noneconomic dimensions can make good business
sense. In anticipation of industry regulation in terms of “extended producer responsibil-
ity,” which requires the seller of a product to take it back for recycling at the end of its life,
the German carmaker BMW was proactive. It not only lined up the leading car-recycling
companies but also started to redesign its cars using a modular approach. The modular
parts allow for quick car disassembly and reuse of components in the after-sales market
(so-called “refurbished or rebuilt auto parts”). 32
Three dimensions— economic, social, and ecological —make up the triple bottom line . As the intersection of the three ovals in Exhibit 5.9 suggests, achieving positive results in all
three areas can lead to a sustainable strategy—a strategy that can endure over time. A sus-tainable strategy produces not only positive financial results, but also positive results along
the social and ecological dimensions. Like the balanced scorecard, the triple bottom line
takes a more integrative and holistic view in assessing a company’s performance. 33 Using
a triple-bottom-line approach, managers audit their company’s fulfillment of its social and
ecological obligations to stakeholders such as employees, customers, suppliers, and com-
munities as conscientiously as they track its financial performance. 34 In this sense, the tri-
ple-bottom-line framework is related to stakeholder theory, an approach to understanding a
LO 5-5
Apply a triple bottom line to assess and evaluate competitive advantage.
triple bottom line
Combination of economic, social, and ecological concerns that can lead to a sustainable strategy.
WWW.YAZDANPRESS.COMWWW.YAZDANPRESS.COM

CHAPTER 5 Competitive Advantage, Firm Performance, and Business Models 147
Ecological Economic
Social
SUSTAINABLE
STRATEGY
EXHIBIT 5.9 / The Triple Bottom Line
The simultaneous pursuit of performance along social, economic, and ecologi-cal dimensions provides a basis for a sustainable strategy.
Interface: The World’s First Sustainable
Company
Interface Inc. is a leader in modular carpeting, with annual sales of roughly $1 billion. What makes the company unique is its strategic intent to become the world’s first fully sustainable company. In 1994, founder Ray Anderson set a goal for the company to be “off oil” entirely by 2020. That included not using any petroleum-based raw materi-als or oil-related energy to fuel the manufacturing plants.
According to Collins and Porras in Built to Last, their classic study of high-performing companies over long periods of time, this is a “BHAG —a big hairy audacious goal.” BHAGs are bold missions declared by visionary companies and are a “powerful mechanism to stimulate progress.” 35 Weaning Interface off oil by 2020 is indeed a BHAG. Many see the carpet industry as an extension of the petrochemical industry, given its heavy reliance on fossil fuels and chemicals in the manufacturing, shipping, and installation of its products.
Today, Interface is a leader in both modular carpet and sustainability. The company estimates that between 1996 and 2008, it saved over $400 million due to its energy effi-ciency and use of recycled materials. Its business model is changing the carpet industry. Speaking of sustainability as a business model, Mr. Anderson stated in 2009:
Sustainability has given my company a competitive edge in more ways than one. It has proven to be the most pow-erful marketplace differentiator I have known in my long career. Our costs are down, our profits are up, and our products are the best they have ever been. Sustainable design has provided an unexpected wellspring of inno-vation, people are galvanized around a shared higher purpose, better people are applying, the best people are staying and working with a purpose, the goodwill in the marketplace generated by our focus on sustainability far exceeds that which any amount of advertising or mar-keting expenditure could have generated—this company believes it has found a better way to a bigger and more legitimate profit—a better business model. 36
5.1
firm as embedded in a network of internal and
external constituencies that each make contri-
butions and expect consideration in return (see
the discussion in Chapter 1). For an example
of how carpet manufacturer Interface uses a
triple-bottom-line approach to gain and sustain
a competitive advantage, read Strategy High-
light 5.1.
Since the emergence of strategic manage-
ment as a field of research and practice, the
focus has been on firm economic performance.
More recently, however, society and inves-
tors require companies to also address social
and ecological concerns. This discussion is
captured under the notion of corporate social responsibility, to which we turn next.
CORPORATE SOCIAL RESPONSIBILITY.
Corporate social responsibility (introduced in
Chapter 1) helps firms recognize and address
society’s expectations of the business enter-
prise at a given point in time. The notion of corporate social responsibility is rapidly
gaining ground. Millennials, defined as those born between 1980 and 1991, tend to expect
WWW.YAZDANPRESS.COMWWW.YAZDANPRESS.COM

148 CHAPTER 5 Competitive Advantage, Firm Performance, and Business Models
Baby Boomers (born between 1947 and 1963) now make up the oldest cohort of the work force. This group was parented by prosperity, and shares a presumption of entitlement to their world view. Shaping political experiences were the civil rights movement, Vietnam, and Watergate, not to mention rock music, drugs, and the sexual revolution. The Boomer cohort has always been big enough to force the culture to adapt to them. For years they have dictated politics, culture, and policy by their sheer number in a market-driven economy.
Generation X, or Xers (born between 1964 and 1979). This group’s formative experiences were framed by familial and financial insecurity. They grew up amidst rising rates of divorce and recession. Where the sexual revolution of the Boomers brought free expression and experimentation, the threat of AIDS brought Xers fear and caution. During adolescence and early adulthood, their political world view was shaped by, well, pretty much nothing. Described as “slackers,” and scorned for a world view that begins and ends with themselves, even their moniker is about something that never happened.
Millennials (born between 1980 and 1991) are much more like Boomers than Xers. They grew up as an affirmed generation, with a re-focus on the family, and are generally thought of as having high self-esteem and self-confidence. They are racially and ethnically diverse and tolerant of a variety of lifestyles. They are occasionally called Generation Y, or Millennials, because one of their defining characteristics is having come of age along with the Internet. Information has always been virtually costless and universally available to them; technology cheap and easily mastered; community as much a digital place of common interest as a shared physical space. They may also be self-centered as a generation, defined a bit by the technology of iPods and iPhones, Facebook and YouTube.
EXHIBIT 5.10 /Defining Three Generations: Baby Boomers, Generation Xers, and MillennialsSOURCE: Based on “Talent Report: What Workers Want in 2012,” published by The MacArthur Foundation (p. 2), www.netimpact.org/whatworkerswant.
companies to be socially responsible and have expressed a strong interest to work for
companies that match their values. 37 Exhibit 5.10 provides a brief description of Baby
Boomers, Generation Xers, and Millennials. According to a recent U.S. survey, over half
of the student population (58 percent) would accept a 15 percent lower pay to “work
for an organization whose values are like my own.” 38 Among the many research studies
looking at the relationship between CSR and firm performance, some find CSR improves
financial performance, while others conclude superior financial performance makes CSR
possible. 39
5.2 Business Models: Putting Strategy into Action
Strategy is a set of goal-directed actions a firm takes to gain and sustain superior per-
formance relative to competitors or the industry average. The translation of strategy into
action takes place in the firm’s business model , which details the firm’s competitive tac-
tics and initiatives. Simply put, the firm’s business model explains how the firm intends
to make money. The business model stipulates how the firm conducts its business with its
buyers, suppliers, and partners. 40
How companies do business can sometimes be as important to gaining and sustaining
competitive advantage as what they do. This also implies that business model innovation
might be as important achieving superior performance as product or process innovation. A
company might come up with a better MP3 player than Apple’s iPod (or the one embed-
ded in the iPhone and iPad), but few of the 500 million iTunes users are likely to switch
brands. As discussed in Chapter Case 1, for most of its history Apple was a personal com-
puter company. The introduction of the iPod and the iTunes Store were aspects of Apple’s
business model innovation. Apple’s innovation not only offered hardware and software but
also enabled digital music distribution, linking music content owners with end consumers
in a legal, scalable, and profitable fashion. Strategy Highlight 5.2 shows another example
of business model innovation: how the online startup Threadless has used the Internet to
craft a new business model.
LO 5-6
Outline how business models put strategy into action.
business model
Organizational plan that details the firm’s competitive tactics and initiatives; in short, how the firm intends to make money.
WWW.YAZDANPRESS.COMWWW.YAZDANPRESS.COM

CHAPTER 5 Competitive Advantage, Firm Performance, and Business Models 149
Threadless: Leveraging Crowdsourcing
to Design Cool T-Shirts
Threadless, a community-centered online apparel store (www.threadless.com), was founded in 2000 by Jake Nickell, then a student at the Illinois Institute of Art, and Jacob DeHart, then a student at Purdue University, with $1,000 as startup capital. After Jake had won an online T-shirt design contest, the two entrepreneurs came up with a business model to leverage user-generated con-tent. The idea is to let consumers “work for you” and turn consumers into prosumers, a hybrid between producers and consumers.
Members of the Threadless community do most of the work, which they consider fun: They submit T-shirt designs online, and community members vote on which designs they like best. The designs receiving the most votes are put in production, printed, and sold online. Threadless leverages crowdsourcing, a process in which a group of people voluntarily perform tasks that were tra-ditionally being completed by a firm’s employees. Rather than outsourcing its work to other companies, Threadless
outsources its T-shirt design to its website community. The concept of leveraging a firm’s own customers via Internet-enabled technology to help produce better prod-ucts is explicitly included in Threadless’ business model.
Threadless’ business model translates real-time mar-ket research and design contests into quick sales. Thread-less produces only T-shirts that were approved by its community. Moreover, it has a very good understanding of market demand because it knows the number of peo-ple who participated in each design contest. In addition, when scoring each T-shirt design in a contest, Threadless users have the option to check “I’d buy it.” These features give the Threadless community a voice in T-shirt design and also coax community members into making a pre-purchasing commitment. Threadless does not make any significant investments until the design and market size are determined, minimizing its downside. Not surpris-ingly, Threadless has sold every T-shirt that it has printed. Moreover, it has a cult-like following and is outperforming established companies such as Old Navy and Urban Out-fitters with their more formulaic T-shirt designs.
To come up with an effective business model, the firm’s managers first transform their
strategy of how to compete into a blueprint of actions and initiatives that support the over-
arching goals. In a second step, managers implement this blueprint through structures, pro-
cesses, culture, and procedures. If the company fails to translate a strategy into a profitable
business model, the firm will run into trouble.
Take Zipcar, a member-based car-sharing company, as an example. 41 Zipcar came up
with a new business model: It allows its members to rent a vehicle online that is already
in their vicinity for a few hours or a day. Users are charged for the duration of use of the
car, and gas and insurance are included in the rental fees. Zipcar appeals to urban dwellers
and Millennials who prefer not to own a vehicle, but have a need for a car on occasion.
The Zipcar member just pays for the service of access to a car as needed. The downside of
Zipcar’s business model is that it requires a large amount of up-front investment to build
the rental car fleet. Although Zipcar has excelled in customer experience and technology,
it was unable to obtain the capital necessary to scale its operation in order to be profitable.
Given low barriers to imitation, numerous competitors (some with prior capital investment
in the rental car industry) have sprung up. The new competitors include traditional car
rental companies and others that created Zipcar clones such as Hertz on Demand, Enter-
prise’s WeCar, U-Haul’s U Car Share, Avis On Location, and Daimler’s Car2Go. Since
the member-based car-sharing business model works best in highly populated areas, sev-
eral regional competitors have also entered the industry, including City CarShare in the
San Francisco Bay Area, I-GO in Chicago, and Mint in New York and Boston. Additional
5.2
crowdsourcing
A process in which a group of people voluntarily performs tasks that were traditionally completed by a firm’s employees.
WWW.YAZDANPRESS.COMWWW.YAZDANPRESS.COM
150 CHAPTER 5 Competitive Advantage, Firm Performance, and Business Models
imitators with a slightly different business model include peer-to-peer car-sharing startups
such as Getaround and RelayRides. As a consequence, Zipcar’s stock price fell rapidly.
Zipcar was eventually acquired by rental car company Avis, which plans to combine its
vast rental fleet with Zipcar’s mobile technology and customer experience.
DIFFERENT BUSINESS MODELS
Given their critical importance to achieving competitive advantage, business models are
constantly evolving. It is helpful, however, to introduce some of the more popular business
models today in order to increase the strategy toolkit at your disposal:
■ Razor–Razor-Blade . The initial product is often sold at a loss or given away for free
in order to drive demand for complementary goods. The company makes its money on
the replacement part needed. As the name indicates, it was invented by Gillette, which
gave away its razors and sold the replacement cartridges for relatively high prices. The
razor–razor-blade model is found in many business applications today. For example,
HP charges little for its laser printers but imposes high prices for its replacement car-
tridges. Another example is current-generation video game consoles that are sold at a
loss to drive demand for games which are sold at a premium to recoup the loss on the
consoles.
■ Subscription-Based. The subscription-based model has been traditionally used for
(print) magazines and newspapers. Users pay for access to a product or service whether
they use the product or service during the payment term or not. Industries that use this
model presently are cable television, cellular service providers, satellite radio, Internet
service providers, and health clubs. With the help of a hilarious promotional video that went viral with over 10 million
views, 42 the entrepreneur Michael Dubin launched Dollar Shave Club, an ecommerce
startup that delivers razors by mail. It uses a subscription-based business model. 43 As
the company’s name suggests, its entry-level membership plan delivers a razor and five
cartridges a month for just $1 (plus $2 shipping). The member selects an appropriate
plan, pays a monthly fee, and will receive razors every month in the mail. The entrepre-
neur identified the need in the market for serving people who don’t like to go shopping
for razors and certainly don’t like to pay the high prices commanded by market leaders
in razors. The company seems to be off to a great start. After the promotional video
was uploaded on YouTube in March 2012, some 12,000 people signed up for Dollar
Shave membership within the first 48 hours. It also raised over $10 million in venture
capital funding from prominent firms such as Kleiner Perkins Caufield & Byers and
Andreessen Horowitz. It remains to be seen, however, if Dollar Shave Club can dis-
rupt the $13 billion razor-blade industry where Procter & Gamble’s subsidiary Gillette
holds two-thirds of the world market. Some companies combine different business models. Telecommunications compa-
nies such as AT&T or Verizon, for example, combine the razor–razor-blade model with
the subscription-based business model. They provide a basic cell phone at no charge or
significantly subsidize high-end smartphones when you sign up for a two-year wireless
service plan. Telecom providers recoup the subsidy provided for the smartphone by
requiring customers to sign up for lengthy service plans. This is why it is so critical for
telecom providers to keep their churn rate— the proportion of subscribers that leave,
especially prior to the end of the contractual term—as low as possible.
■ Pay-as-You-Go. In the pay-as-you-go business model, the user pays for only the services
he or she consumes. The pay-as-you-go model is most widely used by utilities providing
WWW.YAZDANPRESS.COMWWW.YAZDANPRESS.COM

CHAPTER 5 Competitive Advantage, Firm Performance, and Business Models 151
power and water and cell phone service plans, but is gaining momentum in other areas such
as rental cars (i.e., Zipcar) and cloud computing. News providers such as The New York Times and The Wall Street Journal have created “pay walls” as a pay-as-you-go option.
■ Freemium. The freemium ( 5 free 1 premium) business model is a model in which the
basic features of a product or service are provided free of charge, but the user must pay
for premium services such as advanced features or add-ons. 44 For example, companies
provide a minimally supported version of their software as a trial (e.g., business appli-
cation or video game) to give users the chance to try the product. Users later have the
option of purchasing a supported version of software, which includes a full set of prod-
uct features and product support. The freemium business model is used extensively by
open-source software companies such as Red Hat, mobile app companies, and other
Internet businesses. Many of the free versions of applications include advertisements
to make up for the cost of supporting non-paying users. In addition, the paying pre-
mium users subsidize the free users. The freemium model is often used to build a con-
sumer base when the marginal cost of adding another user is low or even zero (such as
in software sales). Some examples are Adobe Acrobat, Dropbox, Evernote, LinkedIn,
Microsoft Office 365, and Spotify.
5.3 Implications for the Strategist
In this chapter, we discussed how to measure and assess competitive advantage using three
traditional approaches: accounting profitability, shareholder value, and economic value
creation. We then introduced two conceptual frameworks to help us understand competi-
tive advantage in a more holistic fashion: the balanced scorecard and the triple bottom line.
Exhibit 5.11 summarizes the concepts discussed.
Several managerial implications emerged from our discussion of competitive advantage
and firm performance:
■ No best strategy exists—only better ones (better in comparison with others). We must
interpret any performance metric relative to those of competitors and the industry aver-
age. True performance can be judged only in comparison to other contenders in the
field or the industry average, not on an absolute basis.
■ The goal of strategic management is to integrate and align each business function and
activity to obtain superior performance at the business unit and corporate levels. There-
fore, competitive advantage is best measured by criteria that reflect overall business unit performance rather than the performance of specific departments. For example,
although the functional managers in the marketing department may (and should) care
EXHIBIT 5.11 /How Do We Measure and Assess Competitive Advantage?
Competitive advantage is reflected in superior firm performance.
>> We always assess competitive advantage relative to a benchmark, either using competitors or the industry average.
>> Competitive advantage is a multifaceted concept.
>> We can assess competitive advantage by measuring accounting profit, shareholder value, or economic value.
>> The balanced-scorecard approach harnesses multiple internal and external performance dimensions to balance a firm’s financial and strategic goals.
>> More recently, competitive advantage has been linked to a firm’s triple bottom line, the ability to maintain performance in the economic, social, and ecological contexts to achieve a sustainable strategy.
WWW.YAZDANPRESS.COMWWW.YAZDANPRESS.COM
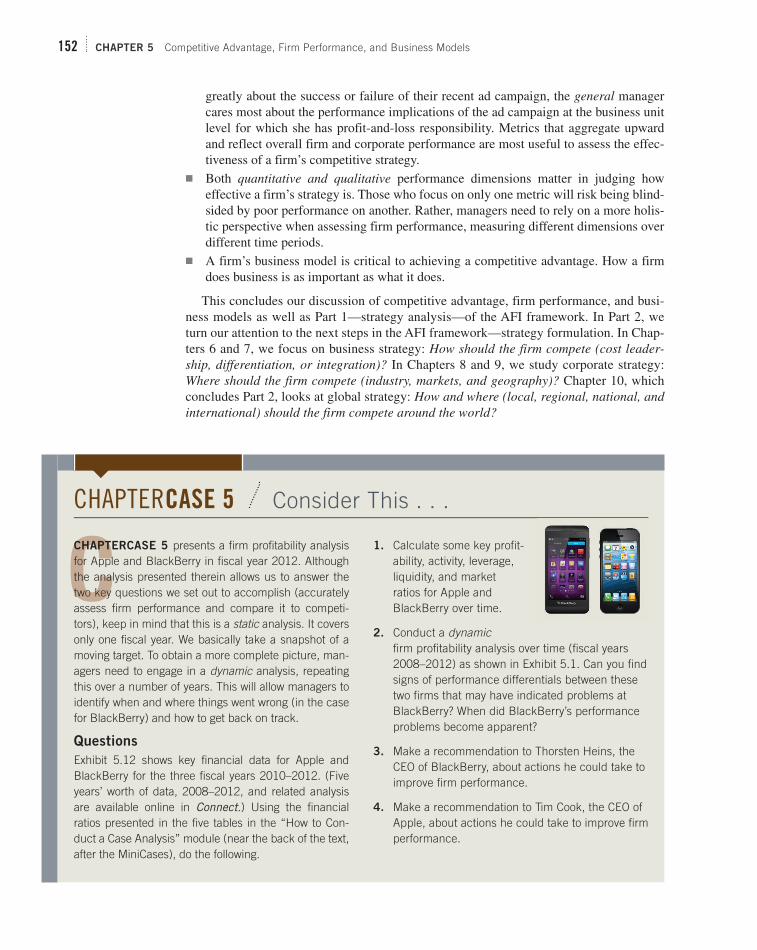
152 CHAPTER 5 Competitive Advantage, Firm Performance, and Business Models
greatly about the success or failure of their recent ad campaign, the general manager
cares most about the performance implications of the ad campaign at the business unit
level for which she has profit-and-loss responsibility. Metrics that aggregate upward
and reflect overall firm and corporate performance are most useful to assess the effec-
tiveness of a firm’s competitive strategy.
■ Both quantitative and qualitative performance dimensions matter in judging how
effective a firm’s strategy is. Those who focus on only one metric will risk being blind-
sided by poor performance on another. Rather, managers need to rely on a more holis-
tic perspective when assessing firm performance, measuring different dimensions over
different time periods.
■ A firm’s business model is critical to achieving a competitive advantage. How a firm
does business is as important as what it does.
This concludes our discussion of competitive advantage, firm performance, and busi-
ness models as well as Part 1—strategy analysis—of the AFI framework. In Part 2, we
turn our attention to the next steps in the AFI framework—strategy formulation. In Chap-
ters 6 and 7, we focus on business strategy: How should the firm compete (cost leader-ship, differentiation, or integration)? In Chapters 8 and 9, we study corporate strategy:
Where should the firm compete (industry, markets, and geography)? Chapter 10, which
concludes Part 2, looks at global strategy: How and where (local, regional, national, and international) should the firm compete around the world?
CCHAPTERCASE 5 presents a firm profitability analysis for Apple and BlackBerry in fiscal year 2012. Although the analysis presented therein allows us to answer the two key questions we set out to accomplish (accurately assess firm performance and compare it to competi-tors), keep in mind that this is a static analysis. It covers only one fiscal year. We basically take a snapshot of a moving target. To obtain a more complete picture, man-agers need to engage in a dynamic analysis, repeating this over a number of years. This will allow managers to identify when and where things went wrong (in the case for BlackBerry) and how to get back on track.
Questions
Exhibit 5.12 shows key financial data for Apple and BlackBerry for the three fiscal years 2010–2012. (Five years’ worth of data, 2008–2012, and related analysis are available online in Connect.) Using the financial ratios presented in the five tables in the “How to Con-duct a Case Analysis” module (near the back of the text, after the MiniCases), do the following.
1. Calculate some key profit-ability, activity, leverage, liquidity, and market ratios for Apple and BlackBerry over time.
2. Conduct a dynamic firm profitability analysis over time (fiscal years 2008–2012) as shown in Exhibit 5.1. Can you find signs of performance differentials between these two firms that may have indicated problems at BlackBerry? When did BlackBerry’s performance problems become apparent?
3. Make a recommendation to Thorsten Heins, the CEO of BlackBerry, about actions he could take to improve firm performance.
4. Make a recommendation to Tim Cook, the CEO of Apple, about actions he could take to improve firm performance.
CHAPTERCASE 5 Consider This . . .
WWW.YAZDANPRESS.COMWWW.YAZDANPRESS.COM

CHAPTER 5 Competitive Advantage, Firm Performance, and Business Models 153
EXHIBIT 5.12 / Key Financial Data for Apple and BlackBerry (fiscal years 2010–2012)
In millions of US$ (except for per share items)
Apple Y/E Sept.
2012
Apple Y/E Sept.
2011
Apple Y/E Sept.
2010
BlackBerry Y/E Mar.
2013
Blackberry Y/E Mar.
2012
Blackberry Y/E Mar.
2011
Total revenue 156,508 108,249 65,225 11,073 18,423 19,907
Cost of revenue, total 87,846 64,431 39,541 7,639 11,848 11,082
Gross profit 68,662 43,818 25,684 3,434 6,575 8,825
Selling/general/admin. expenses, total
10,040 7,599 5,517 2,111 2,600 2,400
Total operating expense 13,421 10,028 7,299 4,669 5,078 4,189
Operating income 55,241 33,790 18,385 21,235 1,497 4,636
Income before tax 55,763 34,205 18,540 21,220 1,518 4,644
Income after tax 41,342 25,607 13,896 0 1,429 3,405
Net income 41,733 25,922 14,013 2646 1,164 3,411
Diluted weighted average shares 945 937 925 524 524 538
Dividends per share—common stock
3 0 0 0 0 0
Diluted normalized EPS 44 28 15 21 2 6
Cash and equivalents 10,746 9,815 11,261 1,549 1,527 1,791
Short-term investments 18,383 16,137 14,359 1,105 247 330
Cash and short-term investments
29,129 25,952 25,620 2,654 1,774 2,121
Accounts receivable—trade, net 10,930 5,369 5,510 2,353 3,062 3,955
Total receivables, net 18,692 11,717 9,924 2,625 3,558 4,279
Total inventory 791 776 1,051 603 1,027 618
Total current assets 57,653 44,988 41,678 7,101 7,071 7,488
Property/plant/equipment, total—net
15,452 7,777 4,768 2,395 2,733 2,504
Accumulated depreciation, total
Goodwill, net 1,135 896 741 0 304 508
Intangibles, net 4,224 3,536 342 3,448 3,286 1,798
Long-term investments 92,122 55,618 25,391 221 337 577
Other long-term assets, total 5,478 3,556 2,263
Total assets 176,064 116,371 75,183 13,165 13,731 12,875
Accounts payable 21,175 14,632 12,015 1,064 744 832
Accrued expenses 11,414 9,247 5,723 1,842 2,382 2,511
Other current liabilities, total 5,953 4,091 2,984 542 263 108
Total current liabilities 38,542 27,970 20,722 3,448 3,389 3,630
Total long-term debt 0 0 0 0 0 0
WWW.YAZDANPRESS.COMWWW.YAZDANPRESS.COM

154 CHAPTER 5 Competitive Advantage, Firm Performance, and Business Models
In millions of US$ (except for per share items)
Apple Y/E Sept.
2012
Apple Y/E Sept.
2011
Apple Y/E Sept.
2010
BlackBerry Y/E Mar.
2013
Blackberry Y/E Mar.
2012
Blackberry Y/E Mar.
2011
Total debt 0 0 0 0 0 0
Other liabilities, total 22,617 14,191 8,515 542 263 108
Total liabilities 57,854 39,756 27,392 3,705 3,631 3,937
Common stock, total 667 381 283 13 14 66
Additional paid-in capital 0 0 0 0 0 0
Retained earnings (accumulated deficit)
101,289 62,841 37,169 7,267 7,913 6,749
Total equity 118,210 76,615 47,791 9,460 10,100 8,938
Total liabilities and shareholders’ equity
176,064 116,371 75,183 13,165 13,731 12,875
Total common shares outstanding
939 929 916 2,431 2,446 2,359
This chapter demonstrated three traditional approaches
for assessing and measuring firm performance and
competitive advantage, as well as two conceptual
frameworks designed to provide a more holistic, albeit
more qualitative, perspective on firm performance. We
also discussed the role of business models in translat-
ing a firm’s strategy into actions.
LO 5-1 / Conduct a firm profitability analysis
using accounting data.
■ To measure competitive advantage, we must be
able to (1) accurately assess firm performance,
and (2) compare and benchmark the focal firm’s
performance to other competitors in the same
industry or the industry average.
■ To measure accounting profitability, we use
standard metrics derived from publicly available
accounting data.
■ Commonly used profitability metrics in strategic
management are return on assets (ROA), return on equity (ROE), return on invested capital (ROIC), and return on revenue (ROR). See the
key financial ratios in five tables in the “How to
Conduct a Case Analysis” module.
■ All accounting data are historical and thus
backward-looking. They focus mainly on tangible
assets, and do not consider intangibles that are
hard or impossible to measure and quantify, such
as an innovation competency.
LO 5-2 / Apply shareholder value creation to
assess and evaluate competitive advantage.
■ Investors are primarily interested in total return to
shareholders, which includes stock price apprecia-
tion plus dividends received over a specific period.
■ Total return to shareholders is an external per-
formance metric; it indicates how the market
views all publicly available information about
a firm’s past, current state, and expected future
performance.
■ Applying a shareholders’ perspective, key met-
rics to measure and assess competitive advan-
tage are the return on (risk) capital and market
capitalization.
TAKE-AWAY CONCEPTS
WWW.YAZDANPRESS.COMWWW.YAZDANPRESS.COM

CHAPTER 5 Competitive Advantage, Firm Performance, and Business Models 155
LO 5-5 / Apply a triple bottom line to assess
and evaluate competitive advantage.
■ Noneconomic factors can have a significant
impact on a firm’s financial performance,
not to mention its reputation and customer
goodwill.
■ Managers are frequently asked to maintain
and improve not only the firm’s economic
performance but also its social and ecological
performance.
■ Three dimensions—economic, social, and
ecological—make up the triple bottom line.
Achieving positive results in all three areas can
lead to a sustainable strategy—a strategy that can
endure over time.
■ A sustainable strategy produces not only positive
financial results, but also positive results along
the social and ecological dimensions.
■ Using a triple-bottom-line approach, managers
audit their company’s fulfillment of its social and
ecological obligations to stakeholders such as
employees, customers, suppliers, and communi-
ties in as serious a way as they track its financial
performance.
■ The triple-bottom-line framework is related
to stakeholder theory, an approach to under-
standing a firm as embedded in a network of
internal and external constituencies that each
make contributions and expect consideration in
return.
LO 5-6 / Outline how business models put
strategy into action.
■ The translation of a firm’s strategy (where and how to compete for competitive advantage) into
action takes place in the firm’s business model
(how to make money). ■ A business model details how the firm conducts
its business with its buyers, suppliers, and
partners.
■ How companies do business is as important to
gaining and sustaining competitive advantage as
what they do.
■ Some important business models include razor–razor-blade, subscription-based, pay-as-you-go, and freemium.
■ Stock prices can be highly volatile, which makes
it difficult to assess firm performance. Overall
macroeconomic factors have a direct bearing on
stock prices. Also, stock prices frequently reflect
the psychological mood of the investors, which
can at times be irrational.
■ Shareholder value creation is a better measure of
competitive advantage over the long term due to
the “noise” introduced by market volatility, exter-
nal factors, and investor sentiment.
LO 5-3 / Explain economic value creation
and different sources of competitive advantage.
■ The relationship between economic value cre-
ation and competitive advantage is fundamen-
tal in strategic management. It provides the
foundation upon which to formulate a firm’s
competitive strategy of cost leadership or
differentiation.
■ Three components are critical to evaluating any
good or service: value (V), price (P), and cost
(C). In this perspective, cost includes opportunity
costs.
■ Economic value created is the difference between
a buyer’s willingness to pay for a good or service
and the firm’s cost to produce it (V 2 C).
■ A firm has a competitive advantage when it is
able to create more economic value than its rivals.
The source of competitive advantage can stem
from higher perceived value creation (assuming
equal cost) or lower cost (assuming equal value
creation).
LO 5-4 / Apply a balanced scorecard to
assess and evaluate competitive advantage.
■ The balanced-scorecard approach attempts to
provide a more integrative view of competitive
advantage.
■ Its goal is to harness multiple internal and exter-
nal performance dimensions to balance financial
and strategic goals.
■ Managers develop strategic objectives for the bal-
anced scorecard by answering four key questions:
(1) How do customers view us? (2) How do we
create value? (3) What core competencies do we
need? (4) How do shareholders view us?
WWW.YAZDANPRESS.COMWWW.YAZDANPRESS.COM

156 CHAPTER 5 Competitive Advantage, Firm Performance, and Business Models
Balanced scorecard
Business model
Consumer surplus
Crowdsourcing
Economic value created
KEY TERMS
Market capitalization
Opportunity costs
Profit (or producer surplus)
Risk capital
Shareholders
Total return to shareholders
Triple bottom line
Value
1. Domino’s Pizza has been in business over 50 years
and claimed to be “#1 Worldwide in Pizza Deliv-
ery” in 2013. Visit the company’s business-related
website (www.dominosbiz.com) and read the
company profile under the “Investors” tab. Does
the firm focus on the accounting, shareholder, or
economic perspective in describing its competi-
tive advantage in the profile?
2. For many people, the shareholder perspective is per-
haps the most familiar measure of competitive advan-
tage for publicly traded firms. What are some of the
disadvantages of using shareholder value as the sole
point of view for defining competitive advantage?
3. Interface Inc. is discussed in Strategy High-
light 5.1. It may seem unusual for a business-
to- business (B2B) carpet company to be using a
triple-bottom-line approach for its strategy. What
other industries do you think could productively
use this approach? How would it change custom-
ers’ perceptions if it did?
4. Threadless (in Strategy Highlight 5.2) is an exam-
ple of a firm building on its customer base to use
new products and also to participate in the design
and vetting of popular designs. In the spring of
2013, Disney and Pixar Animation announced
an expansion of its partnership with Threadless.
Previous successes have been shirts for Disney
villains, Toy Story, and the Muppets, made from
designs based on winning submissions of an art
contest. The current launch is for T-shirts designed
to coincide with the summer 2013 sequel of Mon-sters University by Disney and Pixar Animation.
The designs were chosen from 487 submissions
by artists around the world. With Disney’s long
history of expertise in designing clothing to coin-
cide with movie launches, why do you think the
company has decided to partner with Threadless?
How does this help Disney build competitive
advantage? What other firms use this crowdsourc-
ing technique? Where else might this type of busi-
ness model show up in the future?
DISCUSSION QUESTIONS
1. You work as a supervisor in a manufacturing firm.
The company has implemented a balanced-score-
card performance-appraisal system and a financial
bonus for exceeding goals. A major customer order
for 1,000 units needs to ship to a destination across
the country by the end of the quarter, which is two
days away from its close. This shipment, if it goes
well, will have a major impact on both your cus-
tomer-satisfaction goals and your financial goals.
With 990 units built, a machine breaks down.
It will take two days to get the parts and repair the
machine. You realize there is an opportunity to load
the finished units on a truck tomorrow with paper-
work for the completed order of 1,000 units. You
can have an employee fly out with the 10 remaining
parts and meet the truck at the destination city once
the machinery has been repaired. The 10 units can be
added to the pallet and delivered as a complete ship-
ment of 1,000 pieces, matching the customer’s order
and your paperwork. What do you do?
2. The chapter mentions that accounting data do not
consider off–balance sheet items. A retailer that
owns its stores will list the value of that property
as an asset, for example, while a firm that leases
ETHICAL/SOCIAL ISSUES
WWW.YAZDANPRESS.COMWWW.YAZDANPRESS.COM

CHAPTER 5 Competitive Advantage, Firm Performance, and Business Models 157
//// Small-Group Exercise 1
As discussed in the chapter, a balanced scorecard
views the performance of an organization through
four lenses: customer, innovation and learning, inter-
nal business, and financial. According to surveys from
Bain & Company (a consulting firm), in recent years
about 60 percent of firms in both public and private
sectors have used a balanced scorecard for perfor-
mance measures.45
With your group, create a balanced scorecard for
the business school at your university. You might start
by looking at your school’s web page for a mission
or vision statement. Then divide up the four perspec-
tives among the team members to develop some key
elements for each one. It may be helpful to remember
the four key balanced-scorecard questions from the
chapter:
1. How do customers view us? (Hint: First discuss
the following: Who are the customers? The
students? The companies that hire students?
Others?)
2. How do we create value?
3. What core competencies do we need?
4. How do shareholders view us? (For public uni-
versities, the shareholders are the taxpayers who
invest their taxes into the university. For private
universities, the shareholders are the people or
organizations that endow the university.)
//// Small-Group Exercise 2
At the next big family gathering, you want to impress
your grandparents with the innovative ideas you have
learned in business school. They have decades of expe-
rience in investing in the stock market and, from their
college days, believe that economic profitability is the
primary responsibility of business. You would like to
convince them that a triple-bottom-line approach is the
modern path to stronger economic performance. With
your group members, prepare a casual yet informative
speech that you can use to persuade them. They prob-
ably will not listen for more than two minutes, so you
know you have to be clear and concise with interesting
examples. You may want to reinforce your argument
by consulting “The Bottom Line of Corporate Good,”
published in Forbes.46 Present your speech in what-
ever way your instructor requests—to your group, the
entire class, or post a video on YouTube.
SMALL-GROUP EXERCISES
its stores will not. What are some of the account-
ing and shareholder advantages of leasing com-
pared to owning retail locations?
3. How does this issue play out when comparing
brick-and-mortar stores to online businesses (e.g.,
Best Buy versus Amazon; Barnes & Noble versus
Amazon; Home Depot versus Amazon; The Gap
versus Threadless; Nordstrom versus Zappos; and
so on)? Make recommendations to brick-and-
mortar stores as to how they can build competi-
tive advantage over the online competitors. What
conclusions do you draw?
STRATEGY TERM PROJECT
//// Module 5: Competitive Advantage
Perspectives
1. Based on information in the annual reports or
published on the firm’s website, summarize what
the firm views as the reasons for its successes
(either past or expected in the future). Search for
both quantitative and qualitative success factors
provided in the report.
2. Does the firm seem most focused on account-
ing profitability, shareholder value creation,
or economic value creation? Give quotes or
information from these sources to support
your view.
3. Many firms are now including annual corporate
social responsibility (CSR) reports on their web-
sites. See whether your firm does so. If it does
not, are there other indications of a triple-bottom-
line approach, including social and ecological ele-
ments, in the firm’s strategies?
WWW.YAZDANPRESS.COMWWW.YAZDANPRESS.COM

158 CHAPTER 5 Competitive Advantage, Firm Performance, and Business Models
How Much Is an MBA Worth
to You?
The myStrategy box at the end of Chapter 2 asked how much you would be willing to pay for the job you want—for a job that reflects your values. Here, we
look at a different issue relating to worth: How much is an MBA worth over the course of your career?
Alongside the traditional two-year full-time MBA pro-gram, many business schools also offer evening MBAs and executive MBAs. Let’s assume you know you want to pursue
an advanced degree, and you need to decide which program format is better for you (or you want to evaluate the choice you already made). You’ve narrowed your options to either (1) a two-year full-time MBA program, or (2) an executive MBA program at the same institution that is 18 months long with classes every other weekend. Let’s also assume the price for tuition, books, and fees is $30,000 for the full-time program and $90,000 for the executive MBA program.
Which MBA program should you choose? Consider in your analysis the value, price, and cost concepts discussed in this chapter. Pay special attention to opportunity costs attached to different MBA program options.
my STRATEGY
1. (Net profits / Invested capital) is shorthand
for (Net operating profit after taxes [NOPAT]/Total stockholders’ equity 1 Total debt 2
Value of preferred stock). See discussion of
profitability ratios in Table 1, “When and How
to Use Financial Measures to Assess Firm
Performance,” of the “How to Conduct a Case
Analysis” module at the back of the text.
2. This ChapterCase is based on: 2012 SEC
10-K reports for Apple and BlackBerry.
3. This debate takes place in the following
discourses, among others: Schmalensee, R.
(1985), “Do markets differ much?” American Economic Review 75: 341–351; Rumelt, R. P.
(1991), “How much does industry matter?”
Strategic Management Journal 12: 167–185;
Rumelt, R. P. (2003), “What in the world
is competitive advantage?” Policy Working Paper 2003-105, UCLA; Porter, M. E. (1985),
Competitive Advantage: Creating and Sustain-ing Superior Performance (New York: Free
Press); McGahan, A. M., and M. E. Porter
(1997), “How much does industry matter,
really?” Strategic Management Journal 18:
15–30; McGahan A. M., and M. E. Porter
(2002), “What do we know about variance
in accounting profitability?” Management Science 48: 834–851; Hawawini, G.,
V. Subramanian, and P. Verdin (2003), “Is per-
formance driven by industry- or firm-specific
factors? A new look at the evidence,” Strategic Management Journal 24: 1–16; McNamara,
G., F. Aime, and P. Vaaler (2005), “Is perfor-
mance driven by industry- or firm-specific fac-
tors? A reply to Hawawini, Subramanian, and
Verdin,” Strategic Management Journal 26: 1075–1081; Hawawini, G., V. Subramanian,
and P. Verdin (2005), “Is performance driven
by industry- or firm-specific factors? A new
look at the evidence: A response to
McNamara, Aime, and Vaaler,” Strategic Management Journal 26: 1083–1086; and
Misangyi, V. F., H. Elms, T. Greckhamer,
and J. A. Lepine (2006), “A new perspec-
tive on a fundamental debate: A multilevel
approach to industry, corporate, and business
unit effects,” Strategic Management Journal 27: 571–590.
4. Rumelt, R. P. (2003), “What in the world is
competitive advantage?”
5. For a discussion see: McGahan, A. M.,
and M. E. Porter (2002), “What do we know
about variance in accounting profitability?”
Management Science, 48: 834–851.
6. “The second coming of Apple through a
magical fusion of man—Steve Jobs—and
company, Apple is becoming itself again:
The little anticompany that could,” Fortune, November 9, 1998.
7. “RIM’s new CEO sticks with strategy,” The Wall Street Journal, January 24, 2012.
8. “Meet your new BlackBerry global cre-
ative director: Alicia Keys,” The Wall Street Journal, January 30, 2013.
9. “RIM squeezes BlackBerry suppliers as
economy stalls,” BusinessWeek, April 13,
2009; and “Do you know who manufactured
your BlackBerry?” Forbes, January 13, 2011.
10. http://aaplinvestors.net/stats/iphone/
bbvsiphone/ .
11. Hamel, G., and C. K. Prahalad (1994),
Competing for the Future (Boston, MA:
Harvard Business School Press).
12. Baruch, L. (2001), Intangibles: Manage-ment, Measurement, and Reporting
(Washington, DC: Brookings Institution
Press).
13. Cameron, W. B. (1967), Informal Sociol-ogy: A Casual Introduction to Sociological Thinking (New York: Random House).
14. Friedman, M. (2002), Capitalism and Freedom, 40th anniversary edition (Chicago,
IL: University of Chicago Press).
15. Fama, E. (1970), “Efficient capital mar-
kets: A review of theory and empirical work,”
Journal of Finance 25: 383–417; Beechy, M.,
D. Gruen, and J. Vickrey (2000), “The effi-
cient market hypothesis,” a survey Research
Discussion Paper, Federal Reserve Bank of
Australia.
16. The three broad categories of companies
by market cap are large cap (over $10 billion),
mid cap ($2 billion to $10 billion), and small
cap (less than $2 billion).
17. Alexander, J. (2007), Performance Dashboards and Analysis for Value Creation
(Hoboken, NJ: Wiley-Interscience).
18. Microsoft 2012 Annual Report.
19. This section draws on: Christensen, C. M,
and M. E. Raynor (2003), The Innovator’s Solution: Creating and Sustaining Successful
ENDNOTES
WWW.YAZDANPRESS.COMWWW.YAZDANPRESS.COM

CHAPTER 5 Competitive Advantage, Firm Performance, and Business Models 159
Growth (Boston, MA: Harvard Business
School Press).
20. Speech given by Alan Greenspan on
December 5, 1996, at the American Enterprise
Institute.
21. “Irrational gloom,” The Economist, October 11, 2002.
22. Kaplan, R. S., and D. P. Norton (1992),
“The balanced scorecard: Measures that drive
performance,” Harvard Business Review, January–February: 71–79.
23. Ibid.
24. Govindarajan, V., and J. B. Lang (2002),
3M Corporation, case study, Tuck School of
Business at Dartmouth.
25. Rothaermel, F. T., and A. M. Hess (2010),
“Innovation strategies combined,” MIT Sloan Management Review, Spring: 12–15.
26. Huston, L., and N. Sakkab (2006), “Con-
nect & Develop: Inside Procter & Gamble’s
new model for innovation,” Harvard Business Review, March: 58–66.
27. Clarke, R. (2009), “Failure: The secret to
success,” at http://dreams.honda.com/#/video_
fa ; and see also: Prahalad, C. K., and G. Hamel
(1990), “The core competence of the corpora-
tion,” Harvard Business Review, May–June.
28. Kaplan, R. S. (1993), “Implementing the
balanced scorecard at FMC Corporation: An
interview with Larry D. Brady,” Harvard Business Review, September–October:
143–147.
29. Norreklit, H. (2000), “The balance on
the balanced scorecard—A critical analysis
of some of its assumptions,” Management Accounting Research 11: 65–88; Jensen, M. C.
(2002), “Value Maximization, Stakeholder
Theory, and the Corporate Objective Func-
tion,” in Unfolding Stakeholder Thinking, Andriof, J., et al. (eds.) (Sheffield, UK:
Greenleaf Publishing).
30. Kaplan, R. S., and D. P. Norton (1992),
“The balanced scorecard: Measures that drive
performance”; Kaplan, R. S., and D. P. Norton
(2007), “Using the balanced scorecard as a
strategic management system,” Harvard Busi-ness Review, July–August.
31. Lawrie, G., and I. Cobbold (2002),
“Development of the 3rd generation
balanced scorecard: Evolution of the bal-
anced scorecard into an effective strategic
performance management tool,” 2GC Work-
ing Paper, 2GC Limited, Albany House,
Market Street, Maidenhead, Berkshire, SL6
8BE UK.
32. Senge, P. M., B. Bryan Smith,
N. Kruschwitz, J. Laur, and S. Schley, (2010),
The Necessary Revolution: How Individu-als and Organizations Are Working Together to Create a Sustainable World (New York:
Crown).
33. Anderson, R. C. (2009), Confessions of a Radical Industrialist: Profits, People, Purpose—Doing Business by Respecting the Earth (New York: St. Martin’s
Press).
34. Norman, W., and C. MacDonald (2004),
“Getting to the bottom of ‘triple bottom line,’”
Business Ethics Quarterly 14: 243–262.
35. Collins, J. C., and J. I. Porras (1994),
Built to Last: Successful Habits of Visionary Companies (New York:
HarperBusiness), p. 93.
36. Anderson, R. C. (2009), Confessions of a Radical Industrialist, p. 5; TED talk,
“Ray Anderson on the business logic of
sustainability,” www.ted.com ; and Perkins,
J. (2009), Hoodwinked: An Economic Hit Man Reveals Why the World Financial Markets Imploded—and What We Need to Do to Remake Them (New York: Crown
Business), p. 107.
37. “Talent Report: What Workers Want
in 2012,” published by The MacArthur
Foundation, www.netimpact.org/
whatworkerswant, defines three different
generations and describes their attributes
(on page 2) as shown in this chapter’s
Exhibit 5.10 .
38. Ibid.
39. Orlitzky, M., F. L. Schmidt, and
S. L. Rynes (2003), “Corporate social and
financial performance: A meta-analysis,”
Organization Studies 24: 403–441;
Margolis, J. D., and J. P. Walsh (2001), People and Profits? The Search for a Link between a Company’s Social and Financial Perfor-mance (Mahwah, NJ: Erlbaum). However,
this relationship may not be linear, but rather
U-shaped, as shown in Barnett, M., and
R. M. Salomon (2012), “Does it pay to be
really good? Addressing the shape of the
relationship between social and financial per-
formance,” Strategic Management Journal 33:
1304–1320.
40. This discussion is based on: Adner,
R. (2012), The Wide Lens. A New Strategy for Innovation (New York: Portfolio/Penguin);
and Amit, R., and C. Zott (2012), “Creating
value through business model innovation,”
MIT Sloan Management Review, Spring:
41–49.
41. “Zipcar: Entrepreneurial genius, public-
company failure,” The Wall Street Journal, January 2, 2013.
42. Dollar Shave Video: http://www.youtube
.com/dollarshaveclub .
43. “A David and Gillette story,” The Wall Street Journal, April 12, 2012; and
“Riding the momentum created by a
cheeky video,” The New York Times, April
10, 2013.
44. Anderson, C. (2009), Free: The Future of a Radical Price (New York: Hyperion).
45. See www.thepalladiumgroup.com for
examples.
46. http://www.forbes.com/sites/
causeintegration/2012/09/14/
the-bottom-line-of-corporate-good/ .
WWW.YAZDANPRESS.COMWWW.YAZDANPRESS.COM

WWW.YAZDANPRESS.COMWWW.YAZDANPRESS.COM
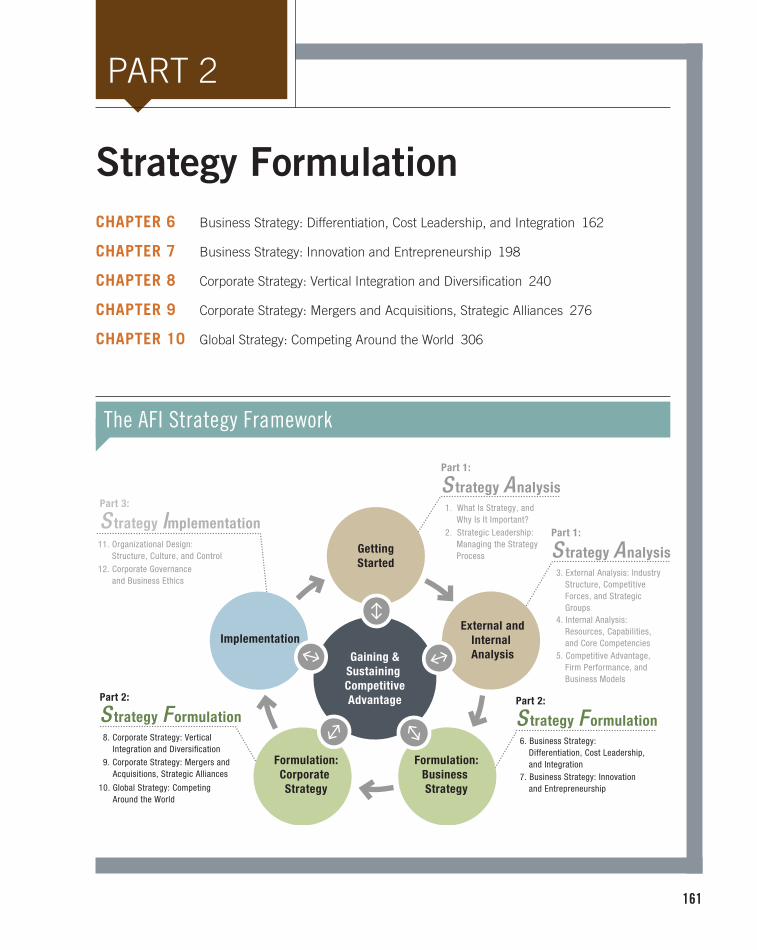
161
PART 2
Strategy Formulation
CHAPTER 6 Business Strategy: Differentiation, Cost Leadership, and Integration 162
CHAPTER 7 Business Strategy: Innovation and Entrepreneurship 198
CHAPTER 8 Corporate Strategy: Vertical Integration and Diversification 240
CHAPTER 9 Corporate Strategy: Mergers and Acquisitions, Strategic Alliances 276
CHAPTER 10 Global Strategy: Competing Around the World 306
The AFI Strategy Framework
1. What Is Strategy, and Why Is It Important?
3. External Analysis: Industry Structure, Competitive Forces, and Strategic Groups4. Internal Analysis: Resources, Capabilities, and Core Competencies5. Competitive Advantage, Firm Performance, and Business Models
6. Business Strategy: Differentiation, Cost Leadership, and Integration7. Business Strategy: Innovation and Entrepreneurship
8. Corporate Strategy: Vertical Integration and Diversification
9. Corporate Strategy: Mergers and Acquisitions, Strategic Alliances
10. Global Strategy: Competing Around the World
11. Organizational Design: Structure, Culture, and Control
Getting
Started
External and
Internal
Analysis
Formulation:
Business
Strategy
Formulation:
Corporate
Strategy
Implementation
Gaining &
Sustaining
Competitive
Advantage
12. Corporate Governance and Business Ethics
2. Strategic Leadership: Managing the Strategy Process
Part 1:
S trategy Analysis
Part 1:
S trategy Analysis
Part 2:
S trategy Formulation
Part 2:
S trategy Formulation
Part 3:
S trategy Implementation
WWW.YAZDANPRESS.COMWWW.YAZDANPRESS.COM

162
Chapter 6
Business Strategy: Differentiation, Cost Leadership, and Integration
Chapter Outline
6.1 Business-Level Strategy: How to Compete
for Advantage Strategic Position Generic Business Strategies
6.2 Differentiation Strategy: Understanding
Value Drivers Product Features Customer Service Complements
6.3 Cost-Leadership Strategy: Understanding
Cost Drivers Cost of Input Factors Economies of Scale Learning Curve Experience Curve
6.4 Business-Level Strategy and the Five Forces:
Benefits and Risks Cost-Leadership Strategy: Benefits and Risks Differentiation Strategy: Benefits and Risks
6.5 Integration Strategy: Combining Cost
Leadership and Differentiation Value and Cost Drivers of Integration Strategy Integration Strategy Gone Bad: “Stuck in the Middle”
6.6 The Dynamics of Competitive Positioning
6.7 Implications for the Strategist
Learning Objectives
After studying this chapter, you should be able to:
LO 6-1 Define business-level strategy and describe how it determines a firm’s strategic position.
LO 6-2 Examine the relationship between value drivers and differentiation strategy.
LO 6-3 Examine the relationship between cost drivers and the cost-leadership strategy.
LO 6-4 Assess the benefits and risks of cost-leadership and differentiation business strategies vis-à-vis the five forces that shape competition.
LO 6-5 Evaluate value and cost drivers that may allow a firm to pursue an integration strategy.
LO 6-6 Explain why it is difficult to succeed at an integration strategy.
LO 6-7 Describe and evaluate the dynamics of com-petitive positioning.
WWW.YAZDANPRESS.COMWWW.YAZDANPRESS.COM
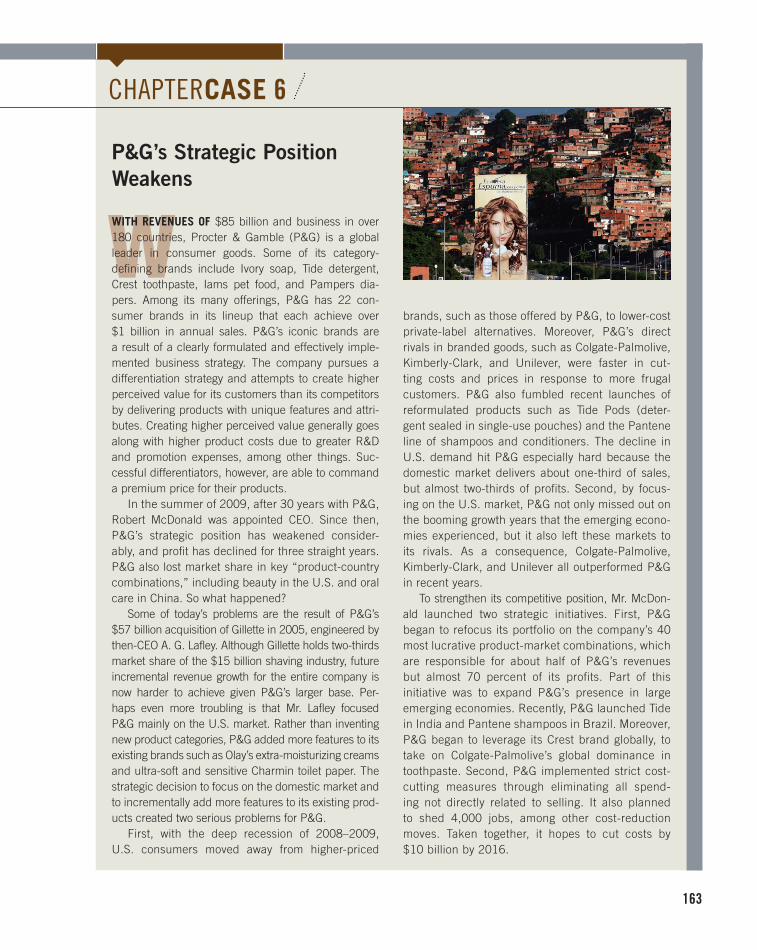
163
W
CHAPTER CASE 6
P&G’s Strategic Position
Weakens
WITH REVENUES OF $85 billion and business in over 180 countries, Procter & Gamble (P&G) is a global leader in consumer goods. Some of its category- defining brands include Ivory soap, Tide detergent, Crest toothpaste, Iams pet food, and Pampers dia-pers. Among its many offerings, P&G has 22 con-sumer brands in its lineup that each achieve over $1 billion in annual sales. P&G’s iconic brands are a result of a clearly formulated and effectively imple-mented business strategy. The company pursues a differentiation strategy and attempts to create higher perceived value for its customers than its competitors by delivering products with unique features and attri-butes. Creating higher perceived value generally goes along with higher product costs due to greater R&D and promotion expenses, among other things. Suc-cessful differentiators, however, are able to command a premium price for their products.
In the summer of 2009, after 30 years with P&G, Robert McDonald was appointed CEO. Since then, P&G’s strategic position has weakened consider-ably, and profit has declined for three straight years. P&G also lost market share in key “product-country combinations,” including beauty in the U.S. and oral care in China. So what happened?
Some of today’s problems are the result of P&G’s $57 billion acquisition of Gillette in 2005, engineered by then-CEO A. G. Lafley. Although Gillette holds two-thirds market share of the $15 billion shaving industry, future incremental revenue growth for the entire company is now harder to achieve given P&G’s larger base. Per-haps even more troubling is that Mr. Lafley focused P&G mainly on the U.S. market. Rather than inventing new product categories, P&G added more features to its existing brands such as Olay’s extra-moisturizing creams and ultra-soft and sensitive Charmin toilet paper. The strategic decision to focus on the domestic market and to incrementally add more features to its existing prod-ucts created two serious problems for P&G.
First, with the deep recession of 2008–2009, U.S. consumers moved away from higher-priced
brands, such as those offered by P&G, to lower-cost private-label alternatives. Moreover, P&G’s direct rivals in branded goods, such as Colgate-Palmolive, Kimberly-Clark, and Unilever, were faster in cut-ting costs and prices in response to more frugal customers. P&G also fumbled recent launches of reformulated products such as Tide Pods (deter-gent sealed in single-use pouches) and the Pantene line of shampoos and conditioners. The decline in U.S. demand hit P&G especially hard because the domestic market delivers about one-third of sales, but almost two-thirds of profits. Second, by focus-ing on the U.S. market, P&G not only missed out on the booming growth years that the emerging econo-mies experienced, but it also left these markets to its rivals. As a consequence, Colgate-Palmolive, Kimberly-Clark, and Unilever all outperformed P&G in recent years.
To strengthen its competitive position, Mr. McDon-ald launched two strategic initiatives. First, P&G began to refocus its portfolio on the company’s 40 most lucrative product-market combinations, which are responsible for about half of P&G’s revenues but almost 70 percent of its profits. Part of this initiative was to expand P&G’s presence in large emerging economies. Recently, P&G launched Tide in India and Pantene shampoos in Brazil. Moreover, P&G began to leverage its Crest brand globally, to take on Colgate-Palmolive’s global dominance in toothpaste. Second, P&G implemented strict cost- cutting measures through eliminating all spend-ing not directly related to selling. It also planned to shed 4,000 jobs, among other cost-reduction moves. Taken together, it hopes to cut costs by $10 billion by 2016.
WWW.YAZDANPRESS.COMWWW.YAZDANPRESS.COM
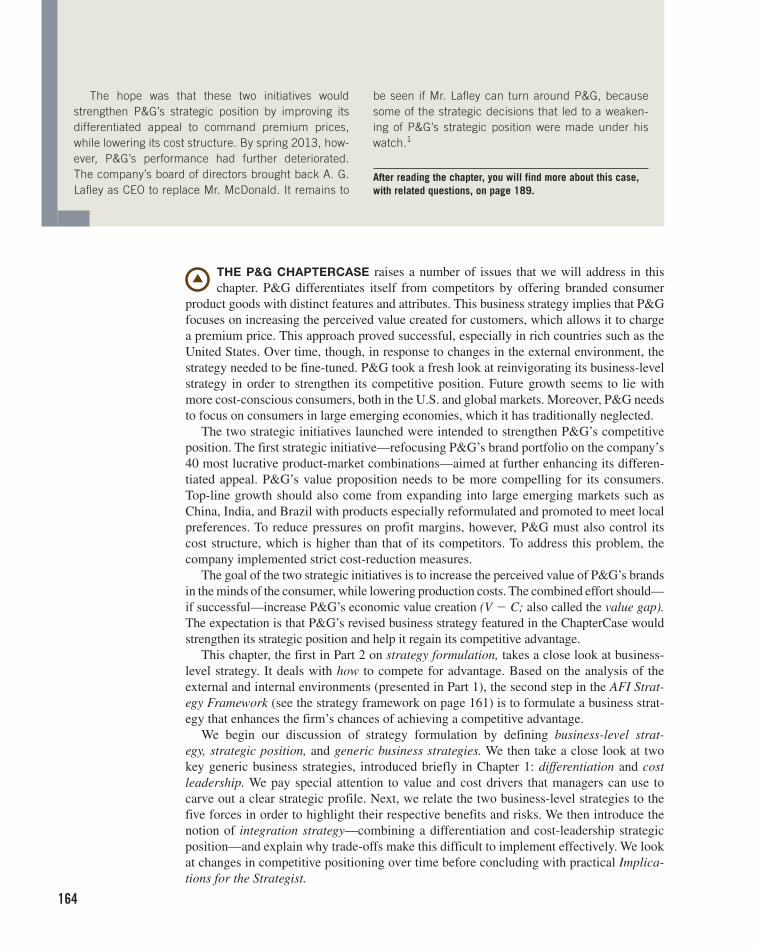
164
THE P&G CHAPTERCASE raises a number of issues that we will address in this
chapter. P&G differentiates itself from competitors by offering branded consumer
product goods with distinct features and attributes. This business strategy implies that P&G
focuses on increasing the perceived value created for customers, which allows it to charge
a premium price. This approach proved successful, especially in rich countries such as the
United States. Over time, though, in response to changes in the external environment, the
strategy needed to be fine-tuned. P&G took a fresh look at reinvigorating its business-level
strategy in order to strengthen its competitive position. Future growth seems to lie with
more cost-conscious consumers, both in the U.S. and global markets. Moreover, P&G needs
to focus on consumers in large emerging economies, which it has traditionally neglected.
The two strategic initiatives launched were intended to strengthen P&G’s competitive
position. The first strategic initiative—refocusing P&G’s brand portfolio on the company’s
40 most lucrative product-market combinations—aimed at further enhancing its differen-
tiated appeal. P&G’s value proposition needs to be more compelling for its consumers.
Top-line growth should also come from expanding into large emerging markets such as
China, India, and Brazil with products especially reformulated and promoted to meet local
preferences. To reduce pressures on profit margins, however, P&G must also control its
cost structure, which is higher than that of its competitors. To address this problem, the
company implemented strict cost-reduction measures.
The goal of the two strategic initiatives is to increase the perceived value of P&G’s brands
in the minds of the consumer, while lowering production costs. The combined effort should—
if successful—increase P&G’s economic value creation ( V 2 C; also called the value gap). The expectation is that P&G’s revised business strategy featured in the Chapter Case would
strengthen its strategic position and help it regain its competitive advantage.
This chapter, the first in Part 2 on strategy formulation, takes a close look at business-
level strategy. It deals with how to compete for advantage. Based on the analysis of the
external and internal environments (presented in Part 1), the second step in the AFI Strat-egy Framework (see the strategy framework on page 161) is to formulate a business strat-
egy that enhances the firm’s chances of achieving a competitive advantage.
We begin our discussion of strategy formulation by defining business-level strat-egy, strategic position, and generic business strategies. We then take a close look at two
key generic business strategies, introduced briefly in Chapter 1: differentiation and cost leadership. We pay special attention to value and cost drivers that managers can use to
carve out a clear strategic profile. Next, we relate the two business-level strategies to the
five forces in order to highlight their respective benefits and risks. We then introduce the
notion of integration strategy —combining a differentiation and cost-leadership strategic
position—and explain why trade-offs make this difficult to implement effectively. We look
at changes in competitive positioning over time before concluding with practical Implica-tions for the Strategist.
The hope was that these two initiatives would strengthen P&G’s strategic position by improving its differentiated appeal to command premium prices, while lowering its cost structure. By spring 2013, how-ever, P&G’s performance had further deteriorated. The company’s board of directors brought back A. G. Lafley as CEO to replace Mr. McDonald. It remains to
be seen if Mr. Lafley can turn around P&G, because some of the strategic decisions that led to a weaken-ing of P&G’s strategic position were made under his watch. 1
After reading the chapter, you will find more about this case, with related questions, on page 189.
WWW.YAZDANPRESS.COMWWW.YAZDANPRESS.COM

CHAPTER 6 Business Strategy: Differentiation, Cost Leadership, and Integration 165
6.1 Business-Level Strategy: How
to Compete for Advantage
Business-level strategy details the goal-directed actions managers take in their quest for
competitive advantage when competing in a single product market. 2 It may involve a single
product or a group of similar products that use the same distribution channel. It concerns
the broad question, “How should we compete?” To formulate an appropriate business-level
strategy, managers must answer the “who-what-why-and-how” questions of competition:
■ Who— which customer segments—will we serve?
■ What customer needs, wishes, and desires will we satisfy?
■ Why do we want to satisfy them?
■ How will we satisfy our customers’ needs? 3
To formulate an effective business strategy, managers need to keep in mind that compet-
itive advantage is determined jointly by industry and firm effects. As shown in Exhibit 6.1 ,
one route to competitive advantage is shaped by industry effects, while a second route is
determined by firm effects. As discussed in Chapter 3, an industry’s profit potential can be
assessed using the five forces framework plus the availability of complements. Managers
need to be certain that the business strategy is aligned with the five forces that shape com-
petition. They can evaluate performance differences among clusters of firms in the same
industry by conducting a strategic-group analysis. The concepts introduced in Chapter 4
are key in understanding firm effects because they allow us to look inside firms and explain
why they differ based on their resources, capabilities, and competencies. It is also impor-
tant to note that industry and firm effects are not independent, but rather they are interde-pendent, as shown by the two-pointed arrow connecting industry effects and firm effects.
At the firm level, performance is determined by value and cost positions relative to
competitors. This is the firm’s strategic position. Although P&G was once the global leader
in branded consumer products, recently its value position relative to competitors declined
because consumers did not value additional incremental features and reformulations as
LO 6-1
Define business-level strategy and describe how it determines a firm’s strategic position.
business-level
strategy The goal-directed actions managers take in their quest for competitive advantage when competing in a single product market.
EXHIBIT 6.1 / Industry and Firm Effects Jointly Determine Competitive Advantage
COMPETITIVE
ADVANTAGE
BUSINESS
STRATEGY
• Cost Leadership• Differentiation• IntegrationCOST POSITION
Relative to Competitors
VALUE POSITION
Relative to Competitors
WITHIN INDUSTRY
• Strategic Groups
INDUSTRY
ATTRACTIVENESS
• 5 Forces Model• Complements
INDUSTRY
EFFECTS
FIRM
EFFECTS
WWW.YAZDANPRESS.COMWWW.YAZDANPRESS.COM

166 CHAPTER 6 Business Strategy: Differentiation, Cost Leadership, and Integration
much as they valued lower prices. Moreover, P&G’s relative cost position is weaker due
to its higher cost structure, thereby reducing its ability to compete on price. As a conse-
quence, P&G’s strategic position weakened and it experienced a competitive disadvantage.
STRATEGIC POSITION
We noted (in Chapter 5) that competitive advantage is based on the difference between
the perceived value a firm is able to create for consumers ( V ), captured by how much con-
sumers are willing to pay for a product or service, and the total cost ( C ) the firm incurs to
create that value. The greater the economic value created ( V 2 C ), the greater the firm’s
competitive advantage. To answer the business-level strategy question of how to compete,
managers have two primary competitive levers at their disposal: value ( V ) and cost ( C ).
A firm’s business-level strategy determines its strategic position —its strategic profile
based on value creation and cost—in a specific product market. A firm attempts to stake
out a valuable and unique position that meets customer needs while simultaneously creat-
ing as large a gap as possible between the value the firm’s product creates and the cost
required to produce it. Higher value tends to require higher cost. To achieve a desired
strategic position, managers must make strategic trade-offs —choices between a cost or
value position. Managers must address the tension between value creation (which tends to
generate higher cost) and the pressure to keep cost in check so as not to erode the firm’s
economic value creation and profit margin. A business strategy is more likely to lead to a
competitive advantage if it allows firms to either perform similar activities differently, or
perform different activities than their rivals that result in creating more value or offering
similar products or services at lower cost. 4
GENERIC BUSINESS STRATEGIES
There are two fundamentally different generic business strategies— differentiation and cost leadership. A differentiation strategy seeks to create higher value for customers than the
value that competitors create, by delivering products or services with unique features while
keeping costs at the same or similar levels. A cost-leadership strategy , in contrast, seeks
to create the same or similar value for customers by delivering products or services at a
lower cost than competitors, enabling the firm to offer lower prices to its customers.
These two strategies are called generic strategies because they can be used by any
organization—manufacturing or service, large or small, for-profit or nonprofit, public or
private, U.S. or non-U.S.—in the quest for competitive advantage, independent of indus-
try context. Differentiation and cost leadership require distinct strategic positions in order
to increase a firm’s chances to gain and sustain a competitive advantage. 5 Because value
creation and cost tend to be positively correlated, there exist important trade-offs between
value creation and low cost.
strategic trade-offs Choices between a cost or value position. Such choices are necessary because higher value tends to require higher cost.
differentiation strategy Generic business strategy that seeks to create higher value for customers than the value that competitors create, by delivering products or services with unique features while keeping the firm’s cost structure at the same or similar levels.
cost-leadership
strategy Generic business strategy that seeks to create the same or similar value for customers by delivering products or services at a lower cost than competitors, enabling the firm to offer lower prices to its customers.
WWW.YAZDANPRESS.COMWWW.YAZDANPRESS.COM
CHAPTER 6 Business Strategy: Differentiation, Cost Leadership, and Integration 167
Different generic strategies can lead to
competitive advantage, even in the same indus-try. For example, Rolex and Timex both com-
pete in the market for wristwatches, yet they
follow different business strategies. Rolex
follows a differentiation strategy: It creates a
higher value for its watches by making higher-
quality timepieces with unique features that
last a lifetime and that bestow a perception of
prestige and status upon their owners. Cus-
tomers are willing to pay a steep premium for
these attributes. Timex, in contrast, follows a
cost- leadership strategy: It uses lower-cost
inputs and efficiently produces a wristwatch
of acceptable quality, highlights reliability and
accuracy, and prices its timepieces at the low
end of the market. The issue is not to compare
Rolex and Timex directly—they compete in
different market segments of the wristwatch
industry. Both can achieve a competitive
advantage using diametrically opposed busi-
ness strategies. This is because both have a clear strategic profile. Rather, the idea is to com-
pare Rolex’s strategic position with the next-best differentiator (e.g., Ebel), and Timex’s
strategic position with the next-best, low-cost producer (e.g., Swatch).
When considering different business strategies, managers also must define the scope of competition —whether to pursue a specific, narrow part of the market or go after the
broader market. 6 In the preceding example, Rolex focuses on a small market segment:
affluent consumers who want to present a certain image. Timex offers watches for many
different segments of the mass market.
Now we can combine the dimensions describing a firm’s strategic position ( differentia-tion vs. cost ) with the scope of competition ( narrow vs. broad ). As shown in Exhibit 6.2 , by
doing so we get the two major generic (or broad) business strategies ( cost leadership and
differentiation ), shown as the top two boxes in the matrix, and what are termed the focused
version of each (shown as the bottom two boxes in the matrix). The focused versions of the
strategies— focused cost-leadership strategy and focused differentiation strategy —are
essentially the same as the broad generic strategies except that the competitive scope is
narrower. The manufacturing company BIC pursues a focused cost-leadership strategy,
offering disposable pens and cigarette lighters at a very low price (often free promotional
giveaways by companies), while Mont Blanc pursues a focused differentiation strategy,
offering exquisite pens priced at several hundred dollars.
The automobile industry provides an example of the scope of competition. Alfred P.
Sloan, long-time president and CEO of GM, defined the carmaker’s mission as providing
a car for every purse and purpose. GM was one of the first to implement a multidivisional
Cost
LeadershipDifferentiation
Focused
Differentiation
Focused Cost
Leadership
Cost
Na
rro
wB
roa
d
Differentiation
STRATEGIC POSITIONC
OM
PE
TIT
IVE
SC
OP
E
EXHIBIT 6.2 / Strategic Position and Competitive Scope: Generic Business Strategies
SOURCE: Adapted from M. E. Porter (1980), Competitive Strategy. Techniques for Analyzing Industries and Competitors (New York: Free Press).
scope of competition The size—narrow or broad—of the market in which a firm chooses to compete.
focused cost-leadership
strategy Same as the cost-leadership strategy except with a narrow focus on a niche market.
focused differentiation
strategy Same as the differentiation strategy except with a narrow focus on a niche market.
WWW.YAZDANPRESS.COMWWW.YAZDANPRESS.COM

168 CHAPTER 6 Business Strategy: Differentiation, Cost Leadership, and Integration
structure in order to separate the brands into strategic business units, allowing each brand
to create its unique strategic position within the broad automotive market . For example, the
current GM product lineup ranges from the low-cost-positioned Chevy Spark, starting at
a price of $12,000, to the highly differentiated Cadillac Escalade SUV priced at $74,000.
Tesla Motors, the maker of electric cars (featured in Chapter Case 3), offers a highly
differentiated product and pursues only a small market segment. It uses a focused differen-tiation strategy. Tesla focuses on environmentally conscious consumers that are willing to
pay a premium price. It offered its sporty Roadster for a base price of $110,000. In 2012,
Tesla launched the Model S, a four-door sedan, starting at $62,000 (after a $7,500 federal
tax credit). The company plans to sell only 20,000 vehicles a year, 7 equal to less than 0.20
percent U.S. market share of auto sales. Although Tesla Motors continues to broaden its
product lineup with the new Model X (an SUV) and increase its scale, the company main-
tains its focused-differentiation strategy.
6.2 Differentiation Strategy:
Understanding Value Drivers
The goal of a generic differentiation strategy is to add unique features that will increase the
perceived value of goods and services in the minds of the consumers so they are willing to
pay a higher price. Ideally, a firm following a differentiation strategy aims to achieve in the
minds of consumers a level of value creation that its competitors cannot easily match. The
focus of competition in a differentiation strategy tends to be on unique product features,
service, and new product launches, or on marketing and promotion rather than price. For
example, the carpet company Interface is a leader in sustainability and offers innovative
products such as its Cool Carpet, the world’s first carbon-neutral floor covering. Inter-
face’s customers reward it with a willingness to pay a higher price for its environmentally
friendly products. 8
A company that uses a differentiation strategy can achieve a competitive advantage as
long as its economic value created ( V 2 C ) is greater than that of its competitors. Panel (a)
in Exhibit 6.3 shows that Firm B, a differentiator, achieves a competitive advantage over
Firm A. Firm B not only offers greater value than Firm A, but also achieves cost parity
(meaning it has the same costs as Firm A). However, even if Firm B fails to achieve cost
parity (which is often the case since higher value tends to go along with higher costs in
terms of higher-quality raw materials, research and development, employee training to
LO 6-2
Examine the relationship between value drivers and differentiation strategy.
Firm A:Competitive
Disadvantage
Valu
e
Valu
e
Panel (a) Panel (b)
CB
(V 2C)B
(V 2C)A
(V 2C)B
(V 2C)A
CACBCACo
st
Cost
Firm A:Competitive
Disadvantage
Firm B:Differentiator
Firm B:Differentiator
EXHIBIT 6.3 / Differentiation Strategy: Achieving Competitive Advantage
WWW.YAZDANPRESS.COMWWW.YAZDANPRESS.COM
CHAPTER 6 Business Strategy: Differentiation, Cost Leadership, and Integration 169
provide superior customer service, and so on), it can still gain a competitive advantage if
its economic value creation exceeds that of its competitors. This situation is depicted in
Panel (b) of Exhibit 6.3 . In both situations, Firm B’s economic value creation, ( V 2 C ) B , is
greater than that of Firm A ( V 2 C ) A . Firm B, therefore, achieves a competitive advantage
because it has a higher value gap [( V 2 C ) B > ( V 2 C ) A ] which allows it to charge a pre-
mium price, reflecting its higher value creation.
Although increased value creation is a defining feature of a differentiation strategy,
managers must also control costs. Rising costs reduce economic value created and erode
profit margins. Indeed, if cost rises too much as the firm attempts to create more perceived
value for customers, its value gap shrinks, negating any differentiation advantage. Strategy
Highlight 6.1 (next page) details how Whole Foods lost its competitive advantage mainly
because of a failure to control costs effectively.
Although a differentiation strategy is generally associated with premium pricing, man-
agers have an important second pricing option. When a firm is able to offer a differentiated
product or service and can control its costs at the same time, it is able to gain market share
from other firms by charging a similar price but offering more perceived value. By leverag-
ing its differentiated appeal of superior customer service and quality, for example, Marriott
offers a line of different hotels: its flagship Marriott full-service business hotel equipped to
host large conferences; Residence Inn for extended stay; Marriott Courtyard for business
travelers; and Marriott Fairfield Inn for inexpensive leisure and family travel. 9 Although
these hotels are roughly comparable to competitors in price, they generally offer a higher
perceived value. This difference between price and value allows Marriott to gain market
share and post superior performance.
Managers can adjust a number of different levers to improve a firm’s strategic posi-
tion. These levers either increase perceived value or decrease costs. Here, we will study
the most salient value drivers that managers have at their disposal (we look at cost drivers
later). 10 They are:
■ Product features
■ Customer service
■ Complements
These value drivers are related to a firm’s expertise in, and organization of, different
internal value chain activities. Although these are the most important value drivers, no such
list can be complete. Applying the concepts introduced in this chapter should allow manag-
ers to identify other important value and cost drivers unique to their business.
When attempting to increase the perceived value of the firm’s product or service offer-
ings, managers must remember that the different value drivers contribute to competitive
advantage only if their increase in value creation (ΔV) exceeds the increase in costs (ΔC).
The condition of ΔV > ΔC must be fulfilled if a differentiation strategy is to strengthen a
firm’s strategic position and thus enhance its competitive advantage.
PRODUCT FEATURES
One of the obvious but most important levers that managers can adjust are the product
features and attributes, thereby increasing the perceived value of the product or service
offering. Adding unique product features allows firms to turn commodity products into
differentiated products commanding a premium price. Strong R&D capabilities are often
needed to create superior product features. The luxury car maker BMW follows a differen-
tiation strategy. It has a strong reputation for superior engineering, built through decades
of continued R&D investments. As a result, a BMW M3, a sports coupé, comes with many
WWW.YAZDANPRESS.COMWWW.YAZDANPRESS.COM
170 CHAPTER 6 Business Strategy: Differentiation, Cost Leadership, and Integration
Trimming Fat at Whole Foods Market
When four young entrepreneurs opened a small natural-foods store in Austin, Texas, in 1980, they never imagined it would one day turn into an international supermarket chain with stores in the United States, Canada, and the United Kingdom. Some 30 years later, with the acquisi-tion of a close competitor, Wild Oats, Whole Foods now has 350 stores, employs more than 72,000 people, and earned $12 billion in revenue in 2012. Its mission is to offer the finest natural and organic foods available, maintain the highest quality standards in the grocery industry, and remain firmly committed to sustainable agriculture.
Whole Foods differentiates itself from competitors by offering top-quality foods obtained through sustainable agriculture. This business strategy implies that Whole Foods focuses on increasing the perceived value created for customers, which allows it to charge a premium price. In addition to natural and organic foods, it also offers a wide variety of prepared foods and luxury food items, such as $400 bottles of wine. The decision to sell high-ticket items incurs higher costs for the company because such products require more expensive in-store displays and more highly skilled workers, and many fresh items are perishable and require high turnover. Moreover, sourcing natural and organic food is generally done locally, limit-ing any scale advantages. Taken together, these actions reduce efficiency and drive up costs.
Given its unique strategic position as an upscale grocer offering natural, organic, and luxury food items, Whole Foods enjoyed a competitive advantage during the economic boom through early 2008. But as consumers became more budget conscious during the recession of 2008–2009, the company’s financial performance dete-riorated. Competitive intensity also increased markedly because basically every supermarket chain now offers organic food.
To revitalize Whole Foods, co-founder and co-CEO John Mackey decided to “trim fat” on two fronts: First, the supermarket chain refocused on its mission to offer wholesome and healthy food options. In Mackey’s words, Whole Foods’ offerings had included “a bunch of junk,” including candy. Mackey is passionate about helping U.S.
consumers overcome obesity in order to help reduce heart disease and diabetes. Given that, the new strate-gic intent at Whole Foods is to become the champion of healthy living not only by offering natural and organic food choices, but also by educating consumers with its new Healthy Eating initiative. Whole Foods Market now has “Take Action Centers” in every store to educate customers on many food-related topics such as genetic engineering, organic foods, pesticides, and sustainable agriculture.
Second, Whole Foods will trim fat by reducing costs. For example, it has expanded its private-label product line by 5 percent and now includes over 2,300 products at lower prices. Moreover, to attract more customers who buy groceries for an entire family or group, Whole Foods now offers volume discounts to compete with Costco and Sam’s Club, the two largest membership chains in the U.S.
To offer its private-label line and volume-discount packages, Whole Foods is beginning to rely more on low-cost suppliers and is improving its logistics system to cover larger geographic areas more efficiently. By continuing to open new stores and thus increase scale, Whole Foods is hoping to drive costs down further. Co-CEO Walter Robb emphasizes how cost-cutting allows Whole Foods to lower its prices to bring in new customers, while maintaining its profit margin: “The only impediment you hear [from people about why they don’t shop at Whole Foods] is that it’s more expensive, right? Which is less true than it used to be, and if we can get through the price thing, then we can talk about what we want to talk about, which is the quality of the food.” 11
The strategic initiatives put in place to strengthen Whole Foods’ strategic profile by clarifying its value proposition, and perhaps more importantly by reduc-ing its cost, seem to be paying off. Whole Foods is now again experiencing superior performance in comparison to old-line grocery stores such as Kroger, Safeway, and even Walmart (the largest grocery retailer in the United States). A more clearly formulated business strategy allows Whole Foods to increase the value gap by improv-ing its differentiated appeal to command premium prices, while keeping its cost structure in check at the same time. 12
6.1
WWW.YAZDANPRESS.COMWWW.YAZDANPRESS.COM

CHAPTER 6 Business Strategy: Differentiation, Cost Leadership, and Integration 171
more performance features than regular sedans. The high-performance capabilities of an
M3 also come with a premium price. In the kitchen-utensil industry, OXO also follows
a differentiation strategy, highlighting product features. By following its “philosophy of
making products that are easy to use for the widest spectrum of possible users,” 13 OXO
differentiates its kitchen utensils through its patent-protected ergonomically designed soft
black rubber grips.
CUSTOMER SERVICE
Managers can increase the perceived value of their firms’ product or ser-
vice offerings by focusing on customer service and responsiveness. For
example, the online retailer Zappos earned a reputation for superior cus-
tomer service by offering free shipping both ways: to the customer and
for returns. 14 Zappos’ managers didn’t view this as an additional expense
but rather as part of their marketing budget. Moreover, Zappos does not
outsource its customer service and its associates do not use predetermined
scripts. They are instead encouraged to build a relationship of trust with
each individual customer. There seemed to be a good return on investment as word spread
through the online shopping community. Competitors took notice, too; Amazon bought
Zappos for over $1 billion. 15
The hotel industry provides a second example of superior customer service. Follow-
ing its mission, “We are Ladies and Gentlemen serving Ladies and Gentlemen,” the
Ritz- Carlton has become one of the world’s leaders in providing a personalized customer
experience based on sophisticated analysis of data gathered about each guest, including
past choices. It offers personalized customer service that few hotel chains can match.
COMPLEMENTS
When studying industry analysis in Chapter 3, we identified the availability of comple-
ments as an important force determining the profit potential of an industry. Complements
add value to a product or service when they are consumed in tandem. Finding comple-
ments, therefore, is an important task for managers in their quest to enhance the value of
their offerings.
The introduction of AT&T U-verse is a recent example of managers leveraging comple-
ments to increase the perceived value of a service offering. 16 AT&T’s U-verse service bun-
dles high-speed Internet access, phone, and TV services. Service bundles can be further
enhanced by DVR capabilities that allow users to pause live TV, to record up to four live
TV shows at once, and to access video on demand. A DVR by itself is not very valuable,
but included as a “free” add-on to subscribers, it turns into a complement that significantly
enhances the perceived value of the service bundle. Leveraging complementary products
allowed AT&T to break into the highly competitive television services market, signifi-
cantly enhancing the value of its service offerings.
By choosing the differentiation strategy as the strategic position for a product, manag-
ers focus their attention on adding value to the product through its unique features that
respond to customer preferences, customer service during and after the sale, or an effective
marketing campaign that communicates the value of the product’s features to the target
market. Although this positioning involves increased costs (for example, higher-quality
inputs or innovative research and development activities), customers will be willing to pay
a premium price for the product or service that satisfies their needs and preferences. In the
next section, we will discuss how managers formulate a cost-leadership strategy.
L.L.Bean was founded in 1912 to sell the waterproof “Maine Hunting Shoe”—a unique product that came with a guarantee of 100 percent satisfaction. The company built its busi-ness on superior customer service and customer sat-isfaction. Today, L.L.Bean’s policy of “Shipped for Free. Guaranteed to Last.” continues to focus on these strengths.
WWW.YAZDANPRESS.COMWWW.YAZDANPRESS.COM

172 CHAPTER 6 Business Strategy: Differentiation, Cost Leadership, and Integration
6.3 Cost-Leadership Strategy:
Understanding Cost Drivers
The goal of a cost-leadership strategy is to reduce the firm’s cost below that of its competi-
tors while offering adequate value. The cost leader, as the name implies, focuses its atten-
tion and resources on reducing the cost to manufacture a product or deliver service in order
to offer lower prices to its customers. The cost leader optimizes all of its value chain activi-
ties to achieve a low-cost position. Although staking out the lowest-cost position in the
industry is the overriding strategic objective, a cost leader still needs to offer products and
services of acceptable value. As an example, GM and Korean car manufacturer Kia offer
some models that compete directly with one another, yet Kia’s cars tend to be produced at
lower cost, thus providing a similar value proposition.
A cost leader can achieve a competitive advantage as long as its economic value created
( V 2 C ) is greater than that of its competitors. Panel (a) in Exhibit 6.4 shows that Firm B, a cost
leader, achieves a competitive advantage over Firm A because Firm B not only has lower cost
than Firm A, but also achieves differentiation parity (meaning it creates the same value as Firm A).
Thus, Firm B’s economic value creation, ( V 2 C ) B , is greater than that of Firm A ( V 2 C ) A .
What if Firm B fails to create differentiation parity? Such parity is often hard to achieve
because value creation tends to go along with higher costs, and Firm B’s strategy is aimed at
lower costs. Firm B can still gain a competitive advantage as long as its economic value cre-
ation exceeds that of its competitors. This situation is depicted in Panel (b) of Exhibit 6.4 : Even
with lower value (no differentiation parity) but lower cost, Firm B’s economic value creation,
( V 2 C ) B , still is greater than that of Firm A, ( V 2 C ) A . For example, as the low-cost leader,
Walmart was able to take market share from Kmart, which filed for bankruptcy in 2002.
In both situations in Exhibit 6.4 , Firm B’s economic value creation is greater than that
of Firm A. Firm B achieves a competitive advantage in both cases. Either it can charge
prices similar to its competitors and benefit from a greater profit margin per unit, or it can
charge lower prices than its competition and gain higher profits from higher volume. Both
variations of a cost-leadership strategy can result in competitive advantage.
Although companies successful at cost leadership must excel at controlling costs, this
doesn’t mean they can neglect value creation. Kia signals the quality of its cars with a five-
year, 60,000-mile warranty, one of the more generous warranties in the industry. Walmart
offers products of acceptable quality, including many brand-name products. Within the
airline industry, Strategy Highlight 6.2 shows how Ryanair has been able to devise and
implement a cost-leadership strategy.
LO 6-3
Examine the relationship between cost drivers and the cost-leadership strategy.
Firm A:Competitive
Disadvantage
Valu
e
Valu
e
Panel (a) Panel (b)
CB
(V 2C)B
(V 2C)A(V 2C)B
(V 2C)A
CACB
CA
Cost
Cost
Firm A:Competitive
DisadvantageFirm B:
Cost Leader Firm B:Cost Leader
EXHIBIT 6.4 / Cost-Leadership Strategy: Achieving Competitive Advantage
WWW.YAZDANPRESS.COMWWW.YAZDANPRESS.COM
CHAPTER 6 Business Strategy: Differentiation, Cost Leadership, and Integration 173
The most important cost drivers that managers can manipulate to keep their costs
low are:
■ Cost of input factors
■ Economies of scale
■ Learning-curve effects
■ Experience-curve effects
However, this list is only a starting point; managers may consider other cost drivers,
depending on the unique situation.
COST OF INPUT FACTORS
One of the most basic advantages a firm can have over its rivals is access to lower-cost
input factors such as raw materials, capital, labor, and IT services. The South African com-
pany De Beers has long held a very strong position in the market for diamonds because
it tightly controls the supply of raw materials. The aluminum producer Alcoa has access
to lower-cost bauxite mines in the United States, which supply a key ingredient for
Ryanair: Lower Cost than the
Low-Cost Leader!
Southwest Airlines is a classic example of a company pur-suing a cost-leadership strategy. 17 Ryanair took a page out of Southwest Airlines’ playbook and copied much of its business strategy. Ryanair is pursuing, however, an even more refined version in Europe. Headquartered in Dublin, Ireland, Ryanair proudly calls itself “the nastiest airline in the world” because of its relentless effort to drive down costs in order to offer rock-bottom air fares. In fact, Ryanair is the lowest-cost airline in the world. It flies some 300 Boeing 737 aircraft to over 175 destinations across Europe and North Africa, dozens of them priced as low as $20.
How can this be possible? Ryanair is the epitome of a no-frills airline: The seats don’t recline, they have no seat-back pockets (safety cards are printed on the back of the seat in front of you), the older planes have no window shades, life jackets are in the overhead compartment, and thus only one very small carry-on bag is allowed. These choices lower aircraft-purchase costs and allow faster cleaning and turnaround. Ryanair has explored other ideas to further reduce costs, such as removing two toilets to add six more seats, removing rows of seats to offer standing-only areas (thus increasing capacity), charging
for the use of toilets, charging a premium for overweight passengers, having passengers carry their luggage to and from the airplane, and so on.
Although Ryanair’s tickets are cheap, “extras” such as pillows, blankets, and a bottle of water require an addi-tional fee. It costs $10 to check in online, but if you forget to do so, Ryanair will check you in at the airport for $100. The costs to check bags is above the industry standard ($80 per bag), and a whopping $125 per bag during the peak summer season (June 1 to September 30). Ryanair offers many other amenities, and its website has been described as a bazaar: You can book a hotel room, rent a car, get a credit card, buy insurance, and even gamble. In flight, attendants sell merchandise such as digital cam-eras ($137.50) and MP3 players ($165). It is estimated that more than 20 percent of Ryanair’s revenues flow from such ancillary services, unusual for an airline. If you want to contact Ryanair, you can’t via the website or e-mail; instead, you must use a premium-rate phone line.
Ryanair has pushed unbundling air travel into its many components furthest. Traditionally, air travel was sold at one price as a bundle of different services, which included “free” checking of bags as well as meals served on board. Ryanair offers the basic service (air travel only) for a low price, but charges a steep premium for all other items and upgrades. 18
6.2
WWW.YAZDANPRESS.COMWWW.YAZDANPRESS.COM

174 CHAPTER 6 Business Strategy: Differentiation, Cost Leadership, and Integration
aluminum. GE, through its GE Capital division, has a lower cost of capital than other
industrial conglomerates such as Siemens, Philips, or ABB. To lower labor costs for some
types of tasks, some companies outsource certain activities to India, known for its low-cost
IT and accounting services, call centers, and medical-image reading. 19
ECONOMIES OF SCALE
Firms with greater market share might be in a position to reap economies of scale , decreases in cost per unit as output increases. This relationship between unit cost and out-
put is depicted in the first (left-hand) part of Exhibit 6.5 : Cost per unit falls as output
increases up to point Q 1 . A firm whose output is closer to Q 1 has a cost advantage over
other firms with less output. In this sense, bigger is better.
In the airframe-manufacturing industry, for example, reaping economies of scale and
learning is critical for cost-competitiveness. The market for commercial airplanes is often
not large enough to allow more than one competitor to reach sufficient scale to drive down
unit cost. Boeing chose not to compete with Airbus in the market for superjumbo jets;
rather, it decided to focus on a smaller, fuel-efficient airplane (the 787 Dreamliner, priced
at roughly $225 million) that allows for long-distance, point-to-point connections. By
early 2013, it had built over 100 Dreamliners with more than 800 orders for the new air-
plane. 20 Boeing can expect to reap significant economies of scale and learning, which will
lower per-unit cost. At the same time, Airbus had delivered over 100 A380 superjumbos
(sticker price: $390 million) with a total of 262 orders on its books. 21 If both companies
would have chosen to compete head-on in each market segment, the resulting per-unit cost
for each airplane would have been much higher because neither could have achieved sig-
nificant economies of scale (overall their market share split is roughly 50–50).
What causes per-unit cost to drop as output increases (up to point Q 1 )? Economies of
scale allow firms to:
■ Spread their fixed costs over a larger output.
■ Employ specialized systems and equipment.
■ Take advantage of certain physical properties.
economies of scale
Decreases in cost per unit as output increases.
Per-
Unit
Cost
($)
Output (Q)
Economies of ScaleConstant Returns
to Scale Diseconomies of Scale
Q1 Q2
Minimum Efficient Scale
EXHIBIT 6.5 / Economies of Scale, Minimum Efficient Scale, and Diseconomies of Scale
WWW.YAZDANPRESS.COMWWW.YAZDANPRESS.COM

CHAPTER 6 Business Strategy: Differentiation, Cost Leadership, and Integration 175
SPREADING FIXED COSTS OVER LARGER OUTPUT. Larger output allows firms
to spread their fixed costs over more units. That is why gains in market share are often crit-
ical to drive down per-unit cost. Between 2007 and 2009, Microsoft spent approximately
$25 billion on R&D, a significant portion of it on its new Windows 7 operating system. 22
This R&D expense was a fixed cost Microsoft had to incur before a single copy of Win-
dows 7 was sold. However, once the initial version of the new software was completed,
the marginal cost of each additional copy was basically zero, especially for copies sold
in digital form online. Given that Microsoft dominates the operating system market for
personal computers (PCs) with more than 90 percent market share, it sold several hundred
million copies of Windows 7, thereby spreading its huge fixed cost of development over
a large output. Microsoft’s large installed base of Windows operating systems throughout
the world provided it with competitive advantage, because it could leverage its economies
of scale to drive down the per-unit cost for each additional copy of Windows 7.
Microsoft’s advantage due to its large installed base on personal computers, however,
is no longer as valuable. 23 Due to the shift to mobile computing, demand for PCs has been
in free-fall in recent years. Before 2010, growth in the PC industry often exceeded more
than 20 percent a year. Since then, the market for PCs has declined rapidly. The launch
of Microsoft’s newest operating system—Windows 8—was disappointing. A key feature
of Windows 8 was the ability to straddle both personal computers and mobile devices by
providing a dual interface, but the feature left consumers confused. In mobile operating
systems, Google (Android) and Apple (iOS) are the clear leaders, while Microsoft’s (Win-
dows) market share is miniscule (3 percent in smartphones and 7 percent in tablets).
EMPLOYING SPECIALIZED SYSTEMS AND EQUIPMENT. Larger output also
allows firms to invest in more specialized systems and equipment, such as enterprise resource
planning (ERP) software or manufacturing robots. GM introduced the Chevy Volt in the 2011
model year, its first plug-in hybrid vehicle. It is priced at about $40,000, almost twice as
expensive as a Toyota Prius. Yet GM is counting on selling the Chevy Volt in large numbers so
that specialized robotics equipment can be employed in a cost-effective fashion. This in turn
should drive down production costs, and allow GM to lower the price for the Chevy Volt. 24
TAKING ADVANTAGE OF CERTAIN PHYSICAL PROPERTIES. Economies of
scale also occur because of certain physical properties. One such property is known as
the cube-square rule: The volume of a body such as a pipe or a tank increases dispropor-
tionately more than its surface. This same principle makes big-box retail stores such as
Walmart, Best Buy, the Home Depot, and Toys“R”Us cheaper to build and run. They can
also stock much more merchandise and handle inventory more efficiently. Their huge size
makes it difficult for department stores or small retailers to compete on cost and selection.
Look again at Exhibit 6.5 . The output range between Q 1 and Q 2 in the figure is consid-
ered the minimum efficient scale (MES) in order to be cost-competitive. Between Q 1 and
Q 2 , the returns to scale are constant. It is the output range needed to bring the cost per unit
down as much as possible, allowing a firm to stake out the lowest-cost position achievable
through economies of scale. If the firm’s output range is less than Q 1 or more than Q 2 , the
firm is at a cost disadvantage.
With more than four million Prius cars sold since its introduction in 1997, Toyota has
been able to reach the minimum efficient scale part of the per-unit cost curve. This allows
the company to offer the car at a relatively low price and still make a profit.
The concept of minimum efficient scale applies not only to manufacturing processes
but also to managerial tasks such as how to organize work. Due to investments in special-
ized technology and equipment (e.g., electric arc furnaces), Nucor is able to reach MES
minimum efficient
scale (MES) Output range needed to bring down the cost per unit as much as possible, allowing a firm to stake out the lowest-cost position that is achievable through economies of scale.
WWW.YAZDANPRESS.COMWWW.YAZDANPRESS.COM
176 CHAPTER 6 Business Strategy: Differentiation, Cost Leadership, and Integration
with much smaller batches of steel than larger, fully vertically integrated steel companies
using older technology. Nucor’s optimal plant size is about 500 people, which is much
smaller than at larger integrated steel makers such as U.S. Steel (which often employs
thousands of workers per plant). 25 Of course, minimum efficient scale depends on the spe-
cific industry: The average per-unit cost curve, depicted conceptually in Exhibit 6.5 , is a
reflection of the underlying production function, which is determined by technology and
other input factors.
Benefits to scale cannot go on indefinitely, though. Bigger is not always bet-
ter; in fact, sometimes bigger is worse. Beyond Q 2 in Exhibit 6.5 , firms experience
diseconomies of scale —increases in cost as output increases. Why? As firms get too
big, the complexity of managing and coordinating raises the cost, negating any benefits
to scale. Large firms tend to become overly bureaucratic, with too many layers of hier-
archy. They grow inflexible and slow in decision making. To avoid problems associated
with diseconomies of scale, Gore Associates, maker of GORE-TEX fabric, Glide dental
floss, and many other innovative products, breaks up its company into smaller units.
Managers at Gore Associates found that employing about 150 people per plant allows
them to avoid diseconomies of scale. Gore’s Ben Hen uses a simple rule: “We put 150
parking spaces in the lot, and when people start parking on the grass, we know it’s time
to build a new plant.” 26
Finally, there are also physical limits to scale. Airbus is pushing the envelope with
its A380 aircraft, which can hold more than 850 passengers and fly up to 8,200 miles
(enough to travel non-stop from Boston to Hong Kong at about 600 mph). The goal, of
course, is to drive down the cost of the average seat-mile flown (CASM, a standard cost
metric in the airline industry). It remains to be seen whether the A380 superjumbo will
enable airlines to reach minimum efficient scale or will simply be too large to be effi-
cient. For example, boarding and embarking procedures must be streamlined in order to
accommodate more than 850 people in a timely and safe manner. Many airports around
the world will need to be retrofitted with longer and wider runways to allow the super-
jumbo to take off and land.
Taken together, scale economies are critical to driving down a firm’s cost and strength-
ening a cost-leadership position. Although managers need to increase output to operate at
a minimum efficient scale (between Q 1 and Q 2 in Exhibit 6.5 ), they also need to be watch-
ful not to drive scale beyond Q 2 , where they would encounter diseconomies. Monitoring
the firm’s cost structure closely over different output ranges allows managers to fine-tune
operations and benefit from economies of scale.
LEARNING CURVE
Learning by doing can also drive down cost. As individuals and teams engage repeatedly
in an activity, whether writing computer code, developing new medicines, or building sub-
marines, they learn from their cumulative experience. 27 Learning curves were first docu-
mented in aircraft manufacturing as the United States ramped up production in the 1930s,
prior to its entry into World War II. 28 Every time production was doubled, the per-unit cost
dropped by a predictable and constant rate (approximately 20 percent). 29 This important
relationship is captured in Exhibit 6.6 , where different colors denote different levels of
learning curves: 90 percent (blue), 80 percent (green), and 70 percent (brown). As learning
occurs, you move down the learning curve. The steeper the learning curve, the more learn-
ing takes place. For example, a 90 percent learning curve indicates that per-unit cost drops
10 percent every time output is doubled. A 70 percent learning curve indicates a 30 percent
drop every time output is doubled.
diseconomies of
scale Increases in cost per unit when output increases.
WWW.YAZDANPRESS.COMWWW.YAZDANPRESS.COM

CHAPTER 6 Business Strategy: Differentiation, Cost Leadership, and Integration 177
It is not surprising that a learning curve was first observed in aircraft manufacturing.
An aircraft is an extremely complex industrial product; a modern commercial aircraft can
contain more than five million different parts, compared with a few thousand for a car. The
more complex the production process, the more learning effects we can expect. As cumu-
lative output increases, managers learn how to optimize the process and workers improve
their performance through repetition. Learning curves are a robust phenomenon that have
been observed in many industries, not only in manufacturing processes such as building
airplanes, cars, ships, and semiconductors, but also in alliance management, franchising,
and health care. 30 For example, physicians who perform only a small number of cardiac
surgeries per year can have a patient mortality rate five times higher than physicians who
perform the same surgery more frequently. 31
There are some important differences between economies of scale and learning effects:
■ Learning effects occur over time as output is accumulated, while economies of scale
are captured at one point in time when output is increased. Although learning declines
at some point (as shown in Exhibit 6.6 , learning curves flatten out), there are no dis-economies to learning (unlike diseconomies to scale as shown in Exhibit 6.5 ’s past
output Q 2 ).
■ In some production processes (e.g., a simple one-step process in the manufacture of
steel rods), effects from economies of scale can be quite significant, while learning
effects are minimal. In contrast, in some professions (brain surgery or the practice of
estate law), learning effects can be substantial, while economies of scale are minimal.
Managers need to understand this subtle but important difference in order to calibrate
their business-level strategy. For example, if a firm’s cost advantage is due to econo-
mies of scale, a manager should be less concerned about employee turnover (and thus
a potential loss in learning) and more concerned with drops in production runs. In
contrast, if the firm’s low-cost position is based on complex learning, managers should
be much more concerned if a key employee (e.g., a star researcher at a pharmaceutical
company) was to leave.
500 100 150 200 300250
Per-
Unit
Cost
($)
Cumulative Output (Units)
120
100
80
60
40
20
Firm AFirm B
Firm C
Firm D
Economies of Learning
ProcessInnovation
Experience
90%
80%
70%
EXHIBIT 6.6 / Gaining Competitive Advantage Through Leveraging Learning- and Experience-Curve Effects
WWW.YAZDANPRESS.COMWWW.YAZDANPRESS.COM

178 CHAPTER 6 Business Strategy: Differentiation, Cost Leadership, and Integration
EXPERIENCE CURVE
The concept of an experience curve attempts to capture both learning effects and process
improvements. 32 In this perspective, economies of learning allow movement down a given learn-
ing curve based on current production technology. By moving further down a given learning
curve than competitors, a firm can gain a competitive advantage. For example, Exhibit 6.6 shows
that Firm B is further down the blue (90 percent) learning curve than Firm A. Firm B leverages
economies of learning due to larger cumulative output to gain an advantage over Firm A.
As we know, however, technology and production processes do not stay constant.
Process innovation —a new method or technology to produce an existing product—may
initiate a new and steeper learning curve. If Firm C is able to implement a new produc-
tion process (such as lean manufacturing), it initiates an entirely new and steeper learning
curve. In Exhibit 6.6 , Firm C is able to gain a competitive advantage over B through pro-
cess innovation. This allows Firm C to jump down to the green (80 percent) learning curve,
reflecting the new and lower-cost production process introduced.
Also as shown in Exhibit 6.6 , by capturing experience-curve effects (learning effects
plus process innovation), Firm D is breaking away from Firm C, gaining a competitive
advantage. Firm D is able to implement a cost-leadership strategy and enjoy a competitive
advantage over Firms A, B, and C. Taken together, learning by doing allows a firm to lower
its per-unit costs by moving down a given learning curve, while combining experience-
based learning and process innovation allows the firm to leapfrog to a steeper learning
curve, thereby further driving down its per-unit costs.
In summary, by choosing a cost-leadership strategy, managers must focus their attention on
lowering the overall costs of producing the product or service while maintaining an acceptable
level of quality that will serve the needs of the customer. Cost leaders appeal to the price-
conscious buyer, whose main criterion is the price of the product or service. By attending to the
reduction of costs in each value chain activity, managers aim to achieve the lowest cost position
in the industry. This provides the ability to offer the lowest price in the market and the conse-
quent ability to attract an increased volume of sales. As successful cost leaders such as Walmart
illustrate ( “Every Day Low Prices ”), this strategic position can be a very profitable business.
6.4 Business-Level Strategy and the Five Forces:
Benefits and Risks
The business-level strategies introduced in this chapter allow firms to carve out strong stra-
tegic positions that enhance the likelihood of gaining and sustaining competitive advantage.
The five forces model introduced in Chapter 3 helps managers assess the forces—threat of
entry, power of suppliers, power of buyers, threat of substitutes, and rivalry among existing
competitors—that make some industries more attractive than others. With this understanding
of industry dynamics, managers use one of the generic business-level strategies to protect
themselves against the forces that drive down profitability. 33 Exhibit 6.7 details the relation-
ship between competitive positioning and the five forces. In particular, it highlights the bene-
fits and risks of cost-leadership and differentiation business strategies, which we discuss next.
COST-LEADERSHIP STRATEGY: BENEFITS AND RISKS
A cost-leadership strategy is defined by obtaining the lowest-cost position in the industry
while offering acceptable value. The cost leader, therefore, is protected from other com-
petitors because of having the lowest cost. If a price war ensues, the low-cost leader will be
the last firm standing; all other firms will be driven out as margins evaporate. Since reaping
LO 6-4
Assess the benefits and risks of cost-leadership and differentiation business strategies vis-à-vis the five forces that shape competition.
WWW.YAZDANPRESS.COMWWW.YAZDANPRESS.COM

CHAPTER 6 Business Strategy: Differentiation, Cost Leadership, and Integration 179
economies of scale is critical to reaching a low-cost position, the cost leader is likely to
have a large market share, which in turn reduces the threat of entry.
A cost leader is also fairly well isolated from threats of powerful suppliers to increase
input prices, because it is more able to absorb price increases through accepting lower profit
margins. Likewise, a cost leader can absorb price reductions more easily when demanded
by powerful buyers. Should substitutes emerge, the low-cost leader can try to fend them
off by further lowering its prices to reinstall relative value with the substitute. For example,
Walmart tends to be fairly isolated from these threats. Walmart’s cost structure combined
with its large volume allows it to work with suppliers in keeping prices low, to the extent
that suppliers are often the party who experiences a profit margin squeeze.
SOURCE: Based on M. E. Porter, “The five competitive forces that shape strategy,” Harvard Business Review, January 2008; and M. E. Porter (1980), Competitive Strategy: Techniques for Analyzing Industries and Competitors (New York: Free Press).
EXHIBIT 6.7 / Competitive Positioning and the Five Forces: Benefits and Risks of Cost-Leadership and Differentiation Business Strategies
Competitive Force
Cost Leadership Differentiation
Benefits Risks Benefits Risks
Threat of entry
• Protection against entry due to economies of scale
• Erosion of margins
• Replacement
• Protection against entry due to intangible resources such as a reputation for innovation, quality, or customer service
• Erosion of margins
• Replacement
Power of suppliers
• Protection against increase in input prices, which can be absorbed
• Erosion of margins • Protection against increase in input prices, which can be passed on to customers
• Erosion of margins
Power of buyers
• Protection against decrease in sales prices, which can be absorbed
• Erosion of margins • Protection against decrease in sales prices, because well-differentiated products or services are not perfect imitations
• Erosion of margins
Threat of substitutes
• Protection against substitute products through further lowering of prices
• Replacement, especially when faced with innovation
• Protection against substitute products due to differential appeal
• Replacement, especially when faced with innovation
Rivalry among existing competitors
• Protection against price wars because lowest-cost firm will win
• Focus of competition shifts to non-price attributes
• Lowering costs to drive value creation below acceptable threshold
• Protection against competitors if product or service has enough differential appeal to command premium price
• Focus of competition shifts to price
• Increasing differentiation of product features that do not create value but raise costs
• Increasing differentiation to raise costs above acceptable threshold
WWW.YAZDANPRESS.COMWWW.YAZDANPRESS.COM

180 CHAPTER 6 Business Strategy: Differentiation, Cost Leadership, and Integration
Although a cost-leadership strategy provides some protection against
the five forces, it also carries some risks. If a new entrant with new and
relevant expertise enters the market, the low-cost leader’s margins may
erode due to loss in market share while it attempts to learn new capabili-
ties. For example, Walmart faces challenges to its cost leadership: Target
has had success due to its superior merchandising capabilities. The Dollar
Store has drawn customers who prefer a smaller format than the big box
of Walmart. The risk of replacement is particularly pertinent if a potent
substitute emerges due to an innovation. Leveraging e-commerce, Ama-
zon has become a potent substitute and thus a powerful threat to many
brick-and-mortar retail outlets including Barnes & Noble, Best Buy, The
Home Depot, and even Walmart. Powerful suppliers and buyers may be able to reduce
margins so much that the low-cost leader could have difficulty covering the cost of capital,
and lose the potential for a competitive advantage.
The low-cost leader also needs to stay vigilant to keep its cost the lowest in the indus-
try. Over time, competitors can beat the cost leader by implementing the same busi-
ness strategy, but more effectively. Although keeping its cost the lowest in the industry
is imperative, the cost leader must not forget that it needs to create an acceptable level
of value. If continuously lowering costs leads to a value proposition that falls below an
acceptable threshold, the low-cost leader’s market share will evaporate. Finally, the low-
cost leader faces significant difficulties when the focus of competition shifts from price to
non-price attributes.
DIFFERENTIATION STRATEGY: BENEFITS AND RISKS
A differentiation strategy is defined by establishing a strategic position that creates higher
perceived value while controlling costs. The successful differentiator is able to stake out
a unique strategic position, where it can benefit from imperfect competition (as discussed
in Chapter 3), and command a premium price. A well-executed differentiation strategy
reduces rivalry among competitors.
A successful differentiation strategy is likely to be based on unique or specialized fea-
tures of the product, on an effective marketing campaign, or on intangible resources such
as a reputation for innovation, quality, and customer service. A rival would need to improve
the product features as well as build a similar or more effective reputation in order to gain
market share. The threat of entry is reduced: Competitors will find such intangible advan-
tages time-consuming and costly, and maybe impossible, to imitate. If the source of the
differential appeal is intangible rather than tangible (e.g., reputation rather than observable
product and service features), a differentiator is even more likely to sustain its advantage.
Moreover, if the differentiator is able to create a significant difference between per-
ceived value and current market prices, the differentiator will not be so threatened by
increases in input prices due to powerful suppliers. Although an increase in input factors
could erode margins, a differentiator is likely able to pass on price increases to its custom-
ers as long as its value creation exceeds the price charged. Since a successful differentiator
creates perceived value in the minds of consumers and builds customer loyalty, powerful
buyers demanding price decreases are unlikely to emerge. A strong differentiated position
also reduces the threat of substitutes, because the unique features of the product have been
created to appeal to customer preferences, keeping them loyal to the product. By providing
superior quality beverages and other food items combined with a great customer experi-
ence and a global presence, Starbucks has built a strong differentiated appeal. It has culti-
vated a loyal following of customers who reward it with repeat business.
WWW.YAZDANPRESS.COMWWW.YAZDANPRESS.COM

CHAPTER 6 Business Strategy: Differentiation, Cost Leadership, and Integration 181
The viability of a differentiation strategy is severely undermined when the focus of
competition shifts to price rather than value-creating features. This can happen when dif-
ferentiated products become commoditized and an acceptable standard of quality has
emerged across rival firms. Although the iPhone was a highly differentiated product when
first introduced in 2007, touch-based screens and other once-innovative features are now
standard in smartphones. Indeed, Android-based smartphones held 70 percent market
share in 2012. 34 A differentiator also needs to be careful not to overshoot its differenti-
ated appeal by adding product features that raise costs but not the perceived value in the
minds of consumers. Finally, a differentiator needs to be vigilant that its costs of providing
uniqueness do not rise above the customer’s willingness to pay.
It is important to note that none of the business-level strategies depicted in Exhibit 6.2
(cost leadership, differentiation, and focused variations thereof) is inherently superior. The
success of each is context-dependent and relies on two factors:
■ How well the strategy leverages the firm’s internal strengths while mitigating its weak-
nesses; and
■ How well it helps the firm exploit external opportunities while avoiding external
threats.
There is no single correct generic strategy for a specific industry. The deciding factor
is that the chosen business strategy provides a strong position that attempts to maximize
economic value creation and is effectively implemented.
6.5 Integration Strategy: Combining
Cost Leadership and Differentiation
Competitive conditions in an industry may require firms to develop skills in lowering costs
as well as adding uniqueness—particularly in globalized industries. For example, success
may require lowering costs in order to compete with firms in countries with lower labor
costs and may require adding special features to respond to local customer preferences in
individual country markets. Since either increasing perceived value or lowering production
costs can increase a firm’s competitive advantage, it is tempting to conclude that managers
should be focusing on both efforts. To accomplish this, they would need to integrate two
different strategic positions: differentiation and low cost. 35 Managers should not pursue
this complex strategy unless they are able to reconcile the conflicting requirements of each
generic strategy.
A successful integration strategy requires that trade-offs between differentiation and
low cost are reconciled. This is often difficult because differentiation and low cost are
distinct strategic positions that require the firm to effectively manage internal value chain
activities that are fundamentally different from one another. For example, a cost leader
would focus research and development on process technologies in order to improve effi-
ciency, but a differentiator would focus research and development on product technolo-
gies in order to add uniqueness. When successful, investments in differentiation and low
cost are not substitutes but are complements, providing important spill-over effects. An
integration strategy allows a firm to offer a differentiated product or service at low cost.
Exhibit 6.8 shows how a successfully formulated integration strategy combines both a dif-
ferentiation and low-cost position. Exhibit 6.8 also shows the consequence of an integra-
tion strategy gone bad—the firm ends up being “stuck in the middle,” meaning the firm has
neither a clear differentiation nor a clear cost-leadership profile. We discuss the potential
pitfalls of an integration strategy in detail next.
integration strategy
Business-level strategy that successfully combines differentiation and cost-leadership activities.
WWW.YAZDANPRESS.COMWWW.YAZDANPRESS.COM

182 CHAPTER 6 Business Strategy: Differentiation, Cost Leadership, and Integration
Being successful at an integration strat-
egy doesn’t imply that the firm must be the
highest-value creator and the lowest-cost pro-
ducer in its respective industry. Whether an
integration strategy can lead to competitive
advantage depends on the difference between
value creation ( V ) and cost ( C ), and on the
resulting magnitude of economic value created
( V 2 C ). What matters in gaining competitive
advantage is the relative difference in economic
value creation in comparison to industry rivals.
The goal of an integration strategy is therefore
to achieve a larger economic value created
than that of rivals pursuing a differentiation or
low-cost–leadership strategy. This is what Tar-
get, a large retailer with some 2,000 stores in
North America, is attempting to accomplish.
Exhibit 6.9 compares the value and cost posi-
tions of three retail chains: Nordstrom, Target,
and Walmart. Each of these companies has succeeded in carving out a well-defined stra-
tegic position within the cosmetics world: Nordstrom is a differentiator; Walmart is a cost
leader; Target is an integrator.
Nordstrom is an upscale retailer pursuing a differentiation strategy by focusing on a
superior customer experience in a luxury department store setting. Target has been able to
effectively compete with Nordstrom mostly by achieving a much lower cost position, while
offering an acceptable shopping experience when compared with Nordstrom. On the other
hand, Target has been able to compete with Walmart by building equivalent skills in efficient
logistics expertise. Target almost achieves
cost parity with Walmart. At the same time,
Target outdoes Walmart in product selection,
merchandising, and store layout so that its
stores offer a higher-quality shopping experi-
ence for the customer. Target creates signifi-
cantly more value in the minds of customers
than does Walmart with its no-frills approach.
The key point is that if Target is success-
ful with its integration strategy, it achieves
the highest economic value [in Exhibit 6.9 ,
( V 2 C ) Nordstrom < ( V 2 C ) Target > ( V 2 C ) Walmart ].
A successfully implemented integration
strategy allows firms two pricing options:
First, the firm can charge a higher price than
the cost leader, reflecting its higher value
creation and thus generating greater profit
margins. Second, the firm can lower its price
below that of the differentiator because of its
lower-cost structure. If the firm offers lower
prices than the differentiator, it can gain mar-
ket share and make up the loss in margin
through increased sales.
Cost
LeadershipDifferentiation
Focused
Differentiation
Focused Cost
Leadership
Cost
Na
rro
wB
roa
d
Differentiation
STRATEGIC POSITION
CO
MP
ET
ITIV
E S
CO
PE
Integration Strategy
vs.
“Stuck in the Middle”
EXHIBIT 6.8 / Integration Strategy vs. “Stuck in the Middle”
, .
Value
Differentiator:Nordstrom
Cost
(V 2 C )Nordstrom
Integrator:Target
(V 2 C )Target
Value
Cost
Cost leader:Walmart
(V 2 C )Walmart
Value
Cost
EXHIBIT 6.9 / Target’s Attempt at Achieving Competitive Advantage by Pursuing an Integration Strategy
WWW.YAZDANPRESS.COMWWW.YAZDANPRESS.COM

CHAPTER 6 Business Strategy: Differentiation, Cost Leadership, and Integration 183
VALUE AND COST DRIVERS OF INTEGRATION STRATEGY
For an integration strategy to succeed, managers must resolve trade-offs between the two
generic strategic positions—low cost and differentiation. Some possible levers they can
use to overcome these challenges include quality, economies of scope, innovation, and the
firm’s structure, culture, and routines. These are critical: They allow managers to simultane-
ously increase perceived value and lower cost. Although we discuss each of these value and
cost drivers individually, they are interdependent. For example, process innovations such as
lean manufacturing contribute to better quality and customer service, which reinforce one
another and enhance the brand of a product or service. Here, we will study the most salient
value and cost drivers that managers can use to pursue an integration strategy. They are:
■ Quality
■ Economies of scope
■ Customization
■ Innovation
■ Structure, culture, and routines
QUALITY. The quality of a product denotes its durability and reliability. Quality not only
can increase a product’s perceived value, but also can lower its cost. Through techniques
such as total quality management, companies design and build products with quality in
mind, while increasing their differentiated appeal. By building in better quality, companies
lower the cost of both production and after-sale service requirements. From the customer’s
perspective, the product has increased value because it reduces the total cost of ownership.
Quality is a two-pronged activity: It raises economic value creation ( V 2 C ) by simultane-
ously increasing V and lowering C.
ECONOMIES OF SCOPE. We saw that economies of scale allow a firm to lower its
per-unit cost as its output increases. The concept economies of scope describes the sav-
ings that come from producing two (or more) outputs at less cost than producing each
output individually, even though using the same resources and technology. Starbucks, for
example, is already set up to boil purified water for its hot coffee beverages; thus, it reaps
economies of scope when it offers tea in addition to coffee. As a result, Starbucks lowers
its cost structure by sharing its production assets over multiple outputs, while increasing its
menu and thus its differentiated appeal.
CUSTOMIZATION. Customization allows firms to go beyond merely adding differentiat-
ing features to tailoring products and services for specific customers. Advances in manufactur-
ing and information technology have made feasible mass customization —the manufacture
of a large variety of customized products or services done at a relatively low unit cost. 36 Cus-
tomization and low cost were once opposing goals—you could have one or the other, but not
both. In the car industry, Toyota was the first to introduce lean manufacturing, allowing it to
mass customize vehicles and produce higher quality at a lower per-unit cost. Other companies
are able to conquer this trade-off by using the Internet. You can design your own T-shirts at
threadless.com or create customized sneakers at nike.com . BMW allows you to design your
customized vehicle online and then follow the manufacturing progress in real time.
INNOVATION. Broadly defined, innovation describes any new product and process, or
any modification of existing ones. 37 Innovation is frequently required to resolve existing
trade-offs when companies pursue an integration strategy.
LO 6-5
Evaluate value and cost drivers that may allow a firm to pursue an integration strategy.
economies of scope
Savings that come from producing two (or more) outputs at less cost than producing each output individually, despite using the same resources and technology.
mass customization
The manufacture of a large variety of customized products or services at a relatively low unit cost.
WWW.YAZDANPRESS.COMWWW.YAZDANPRESS.COM

184 CHAPTER 6 Business Strategy: Differentiation, Cost Leadership, and Integration
International furniture retailer IKEA orchestrates different internal value chain activi-
ties to reconcile the tension between differentiation and cost leadership in order to carve
out a unique strategic position. IKEA uses innovation in furniture design, engineering, and
store design to solve the trade-offs between value creation and production cost. Josephine
Rydberg-Dumont, president of IKEA Sweden, highlights how difficult resolving this trade-
off is: “Designing beautiful-but-expensive products is easy. Designing beautiful products
that are inexpensive and functional is a huge challenge.” 38 IKEA leverages its deep design
and engineering expertise to offer furniture that is stylish and functional and that can be eas-
ily assembled by the consumer. IKEA also focuses on lowering cost by displaying its prod-
ucts in a warehouse-like setting, thus reducing inventory cost. Customers serve themselves,
and then transport the furniture to their homes in IKEA’s signature flat-packs for assembly.
In this way, IKEA is able to pursue an integration strategy, leveraging innovation to increase
the perceived value of its products, while simultaneously lowering its cost.
Given its importance in a firm’s quest for competitive advantage, we’ll discuss innova-
tion as a business strategy in depth in Chapter 7.
STRUCTURE, CULTURE, AND ROUTINES. A firm’s structure, culture, and rou-
tines are critical when pursuing an integration strategy. The challenge that managers face
is to structure their organizations so that they both control cost and allow for creativity
that can lay the basis for differentiation. Doing the two together is hard to accomplish.
Achieving a low-cost position requires an organizational structure that relies on strict bud-
get controls, while differentiation requires an organizational structure that allows creativity
and customer responsiveness to thrive, which typically necessitates looser organizational
structures and controls.
The goal for managers who want to pursue an integration strategy should be to build
an ambidextrous organization , one that enables managers to balance and harness dif-
ferent activities in trade-off situations. 39 Here, the trade-offs to be addressed involve the
simultaneous pursuit of low-cost and differentiation strategies. Notable management prac-
tices that companies use to resolve this trade-off include flexible and lean manufacturing
systems, total quality management, just-in-time inventory management, and Six Sigma. 40
Other management techniques that allow firms to reconcile cost and value pressures are
the use of teams in the production process, as well as decentralized decision making at the
level of the individual customer.
Ambidexterity describes a firm’s ability to address trade-offs not only at one point
but also over time. It encourages managers to balance exploitation (applying current
knowledge to enhance firm performance in the short term) with exploration (searching
for new knowledge that may enhance a firm’s future
performance). 41 For example, while Intel focuses
on maximizing sales from its current cutting-edge
microprocessors, it also has several different teams
with different time horizons working on future
generations of microprocessors. 42 In ambidextrous
organizations, managers constantly analyze their
existing business processes and routines, looking
for ways to change them in order to resolve trade-
offs across internal value chain activities and time. 43
Given the importance of a firm’s structure, culture,
and routines to gaining and sustaining competitive
advantage, we dedicate Part 3, Strategy Implemen-
tation, to discussing this important topic in detail.
ambidextrous
organization An organization able to balance and harness different activities in trade-off situations.
WWW.YAZDANPRESS.COMWWW.YAZDANPRESS.COM
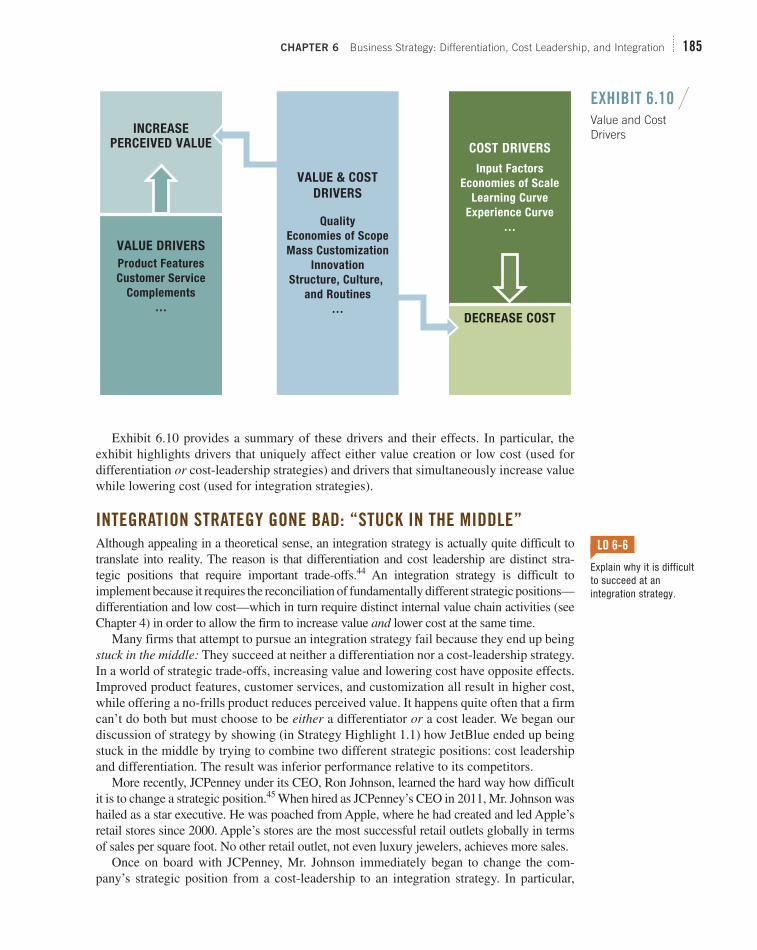
CHAPTER 6 Business Strategy: Differentiation, Cost Leadership, and Integration 185
Exhibit 6.10 provides a summary of these drivers and their effects. In particular, the
exhibit highlights drivers that uniquely affect either value creation or low cost (used for
differentiation or cost-leadership strategies) and drivers that simultaneously increase value
while lowering cost (used for integration strategies).
INTEGRATION STRATEGY GONE BAD: “STUCK IN THE MIDDLE”
Although appealing in a theoretical sense, an integration strategy is actually quite difficult to
translate into reality. The reason is that differentiation and cost leadership are distinct stra-
tegic positions that require important trade-offs. 44 An integration strategy is difficult to
implement because it requires the reconciliation of fundamentally different strategic positions—
differentiation and low cost—which in turn require distinct internal value chain activities (see
Chapter 4) in order to allow the firm to increase value and lower cost at the same time.
Many firms that attempt to pursue an integration strategy fail because they end up being
stuck in the middle: They succeed at neither a differentiation nor a cost-leadership strategy.
In a world of strategic trade-offs, increasing value and lowering cost have opposite effects.
Improved product features, customer services, and customization all result in higher cost,
while offering a no-frills product reduces perceived value. It happens quite often that a firm
can’t do both but must choose to be either a differentiator or a cost leader. We began our
discussion of strategy by showing (in Strategy Highlight 1.1) how JetBlue ended up being
stuck in the middle by trying to combine two different strategic positions: cost leadership
and differentiation. The result was inferior performance relative to its competitors.
More recently, JCPenney under its CEO, Ron Johnson, learned the hard way how difficult
it is to change a strategic position. 45 When hired as JCPenney’s CEO in 2011, Mr. Johnson was
hailed as a star executive. He was poached from Apple, where he had created and led Apple’s
retail stores since 2000. Apple’s stores are the most successful retail outlets globally in terms
of sales per square foot. No other retail outlet, not even luxury jewelers, achieves more sales.
Once on board with JCPenney, Mr. Johnson immediately began to change the com-
pany’s strategic position from a cost-leadership to an integration strategy. In particular,
LO 6-6
Explain why it is difficult to succeed at an integration strategy.
DECREASE COST
INCREASEPERCEIVED VALUE
VALUE & COST
DRIVERS
Quality
Economies of Scope
Mass Customization
Innovation
Structure, Culture,
and Routines
…
COST DRIVERS
Input Factors
Economies of Scale
Learning Curve
Experience Curve
…
VALUE DRIVERS
Product Features
Customer Service
Complements
…
EXHIBIT 6.10 / Value and Cost Drivers
WWW.YAZDANPRESS.COMWWW.YAZDANPRESS.COM

186 CHAPTER 6 Business Strategy: Differentiation, Cost Leadership, and Integration
he tried to reposition the department store more toward the high end by providing an
improved customer experience and more exclusive merchandise through in-store bou-
tiques. Mr. Johnson ordered all clearance racks with steeply discounted merchandise, com-
mon in JCPenney stores, to be removed. He also did away with JCPenney’s long-standing
practice of mailing discount coupons to its customers. Rather than following industry best
practice by testing the more drastic changes to JCPenney’s strategic positioning in a small
number of selected stores, Mr. Johnson implemented them in all 1,800 stores at once.
When one executive raised the issue of pre-testing, Mr. Johnson bristled and responded:
“We didn’t test at Apple.” Under his leadership, JCPenney also got embroiled in a legal
battle with Macy’s because of Mr. Johnson’s attempt to lure away homemaking maven
Martha Stewart and her exclusive merchandise collection.
The envisioned integration strategy failed badly, and JCPenney ended up being stuck
in the middle. Within 12 months of having Mr. Johnson at the helm, JCPenney’s sales
dropped by 25 percent. In a hypercompetitive industry such as retailing where every single
percent of market share counts, this was a landslide. Less than 18 months into his new job,
Mr. Johnson was fired and replaced by his predecessor, Myron Ullman.
This example clearly shows the perils of attempting an integration strategy due to the
inherent trade-off in the underlying generic business strategies of cost leadership and dif-
ferentiation. Moreover, it highlights the need but also the risk of changing a company’s
strategic position too abruptly. It is therefore critical for managers to understand the
dynamics of competitive positioning to which we now turn.
6.6 The Dynamics of Competitive Positioning
Companies that successfully implement one of the generic business strategies (differ-
entiation or cost leadership) are more likely to attain competitive advantage. To do so,
companies seek to reach the so-called productivity frontier , which is the value-cost
relationship that captures the result of performing best practices at any given time. 46
Firms that exhibit effectiveness and efficiency reach the productivity frontier; others are
left behind. Moreover, the productivity frontier represents a set of best-in-class strategic
positions the firm can take relating to value creation and low cost at a given point in time. A firm’s business strategy determines which strategic position it aspires to along
the productivity frontier.
Strategic positions, however, are not fixed, but can—and need to—change as the envi-
ronment changes. It is critical for managers, therefore, to understand the dynamics of competitive positioning —or how strategy shapes a firm’s position over time. Reaching
the productivity frontier at a given point in time increases the likelihood of achieving a
competitive advantage. Falling behind the productivity frontier, in contrast, results in a
competitive disadvantage. Changes in the industry environment, however, allow firms to
stake out more valuable positions and turn inferior performance into a competitive advan-
tage. By the same token, as industries change, once-leading companies that held strategic
positions along the productivity frontier may fall behind. Since competition is never static,
understanding changes as the industry evolves is critical in staking out valuable competi-
tive positions and to sustain a competitive advantage.
To illustrate this concept, let’s look at the competitive dynamics in the $350 billion PC
industry between 2010 and 2013. 47 Computer hardware has historically been a highly com-
petitive industry. Many components are commodities. Until 2010, the industry experienced
double-digit growth each year. Since 2010, however, the industry has been in decline with
a pronounced drop in sales in the most recent years. Part of the declining demand is the
result of an ongoing substitution effect: Consumers buy tablet computers or smartphones
LO 6-7
Describe and evaluate the dynamics of competitive positioning.
productivity frontier
Relationship that captures the result of performing best practices at any given time; the function is concave (bulging outward) to capture the trade-off between value creation and production cost.
WWW.YAZDANPRESS.COMWWW.YAZDANPRESS.COM

CHAPTER 6 Business Strategy: Differentiation, Cost Leadership, and Integration 187
(with larger screens) to use for mobile computing rather than personal computers such as
laptops or desktops. By 2013, declining demand combined with a shrinking market size
created an intensely competitive rivalry in the PC industry.
We demonstrate the dynamics of competitive positioning by visualizing the different
competitive positions of Apple, Dell, HP, and Lenovo over time. These are the main com-
petitors in the PC industry, jointly capturing the majority of the market share. At a given
time, the horizontal axis in Exhibit 6.11 indicates best practice in cost leadership, and the
vertical axis indicates best practice in differentiation. 48 Combining both cost leadership
and differentiation, the company that seeks an integration strategy stakes out a position in
the center part in the best-practice frontier (somewhere between the axes). The dotted line
shows the productivity frontier in 2010. It indicates a set of best possible strategic positions
a firm could occupy on the productivity frontier at that point in time.
Let’s take a look at Exhibit 6.11 . As a differentiator, Apple had carved out a strong stra-
tegic position. Its business-level strategy of differentiation was best-in-class at this time.
Using superior hardware and software integration capabilities in combination with excel-
lent marketing, Apple turned a commodity into a differentiated product. Consumers paid
a premium price for a superior user experience. By 2010, consumer preferences in the
PC industry had moved to value-added features such as seamless integration of PCs with
mobile devices (e.g., MP3 music player, digital cameras, video, and so on) that left the
other competitors (HP, Lenovo, and Dell) behind the productivity frontier. Apple’s suc-
cessful serial innovations in mobile devices (iPod, iPhone, and the iPad combined with the
iTunes Store) drove up demand for Apple’s Macs because consumers wanted one central
hub to manage all their mobile devices and content conveniently. This clearly formulated
and well-executed strategy allowed Apple to reach the productivity frontier.
2010Productivity
Frontier
2013Productivity
Frontier
Cost Leadership
Differentiation
Apple
Apple
LenovoDell
Integration
2010Productivity
Frontier
2013Productivity
Frontier
Dell
Lenovo
HP
HP
EXHIBIT 6.11 / The Dynamics of Competitive Positioning in the PC Industry: Apple, Lenovo, HP, and Dell
WWW.YAZDANPRESS.COMWWW.YAZDANPRESS.COM

188 CHAPTER 6 Business Strategy: Differentiation, Cost Leadership, and Integration
Given their stronger focus on corporate IT departments than the consumer market, HP,
Dell, and Lenovo were hit harder by the 2008–2009 recession than Apple. In particular,
both HP and Lenovo were “stuck in the middle” in 2010. When compared with Apple and
Dell, respectively, they were able to offer neither value-creating differentiation nor low
cost, ending up with strategic positions below the productivity frontier.
HP had acquired Compaq in 2002 for $25 billion. This merger, which created the
world’s largest computer PC manufacturer, was intended to stake out a strategic position
as integrator, providing “high-tech at low cost.” By 2010, however, HP was not able to
reconcile the thorny cost-differentiation trade-off. HP was unable to reach the productivity
frontier. HP’s board replaced CEO Mark Hurd (partly due to an ethics scandal) with Leo
Apotheker in 2010, who in turn was replaced by Meg Whitman in 2011.
In 2010, the Chinese technology company Lenovo was still working on integrating
IBM’s fledgling PC business, which it had acquired in 2005. At this point in time, the com-
pany did not yet have a clear strategic profile as either a differentiator or low-cost leader.
Nor did it have a strong presence outside China and other Asian markets. Lagging behind
the productivity frontier in 2010, Lenovo experienced a competitive disadvantage.
Once the leader in low-cost PCs, Dell had enjoyed a strong strategic position on the
productivity frontier for over a decade. By 2006, however, Dell’s performance began to
decline. In 2007, founder Michael Dell returned from retirement to take over as CEO. Dell
attempted to reposition the company by moving more toward IT service and by providing
more differentiation in its PCs, to go beyond “grey boxes.” In 2008, Dell hired an industrial
designer from Nike to come up with colorful futuristic designs for its product offerings. 49
In 2009, Dell purchased Perot Systems, an IT service provider, for $3.9 billion to further
enhance its differential appeal by adding services and to better compete with HP, which
acquired EDS, another IT service provider, for $13 billion in 2008. 50 By 2010, however,
Dell’s strategic position as cost leader appeared no longer as valuable as in the early 2000s,
because one of the key competitive success factors became differentiation. Dell fell behind
the productivity frontier as market demand shifted to more value-added features in the PC
industry such as the seamless integration between computers and mobile devices which
Dell could not offer. Taken together, in 2010, Apple enjoyed a clear competitive advantage
over Dell, HP, and Lenovo.
Fast-forward to 2013 . . . Now the competitive dynamics look quite different. Apple has
been struggling to continue its innovation home runs (the iPod, iTunes Store, iPhone, and
the iPad) it enjoyed for a decade beginning in 2001. In an attempt to capture more of the low
end of the market, Apple introduced lower-cost variations of its products, such as the iPad
Mini (in 2012). It changed its strategic position more toward integration, but fell behind the
productivity frontier as demand for its Macs dropped by roughly 10 percent annually.
After reversing a 2011 decision to spin out its PC business, HP continues to push for-
ward with an integration strategy. However, it continues to have severe problems. An $11
billion acquisition of software company Autonomy (which ended in a $9 billion write-
down) and the continued difficulty to transform itself into a software and service company
have contributed to HP’s sustained competitive disadvantage. 51 Partly as a consequence of
a failure to clearly formulate a business and corporate strategy, demand for HP computer
hardware has fallen by as much as 25 percent per year. HP continues to underperform and
falls short of the productivity frontier in 2013.
Likewise, Dell continues to experience difficulties in changing its strategic position,
moving from a well-executed cost-leadership strategy toward more integration, combined
with a stronger focus on IT services. As consumer preferences changed toward demanding
more value-added differentiation, Dell’s cost-leadership strategy was no longer as valu-
able. In response, Dell decided to change its strategic position. What Dell’s attempt at
WWW.YAZDANPRESS.COMWWW.YAZDANPRESS.COM

CHAPTER 6 Business Strategy: Differentiation, Cost Leadership, and Integration 189
strategic repositioning shows, however, is that reconciling the trade-offs inherent in pursu-
ing low cost and differentiation simultaneously is difficult to achieve. By 2013, Dell expe-
rienced a sustained competitive disadvantage. Demand for its PCs dropped by as much
as 15 percent per year. As a consequence, Dell’s market share in the PC industry dropped
from 25 percent a few years ago to 11 percent in 2013.
By 2013, Lenovo was able to carve out the clearest strategic profile. It executed well
on its strategic decision to focus on the higher end of the market by providing laptops and
desktops with outstanding performance. Lenovo moved to the productivity frontier, occu-
pying the position of a clear differentiator. Demand for PCs was in free-fall during this
time period, and all competitors—except Lenovo—lost significant market share. Lenovo
was the only PC maker whose demand did not fall despite the industry shrinking by double
digits. Indeed, Lenovo holds 40 percent market share in high-end PCs (over $900) that run
a Windows operating system (which are the vast majority of PCs in the high-end category).
Lenovo’s decision to carve out a clear strategic profile by following a well-crafted and
executed differentiation strategy rewarded the company with a competitive advantage.
6.7 Implications for the Strategist
Strategic positioning is critical to gaining competitive advantage. Well-formulated and
implemented generic business strategies (i.e., low cost or differentiation) enhance the
firm’s chances of obtaining superior performance. Strategic positioning requires making
important trade-offs (think Walmart versus J. Crew in clothing).
In rare instances, a few exceptional firms might be able to reconcile the significant
trade-offs between increasing value and lowering production cost by pursuing both busi-
ness strategies simultaneously. These integration strategies tend to be successful only if
a firm is able to rely on an innovation that allows it to reconcile the trade-offs mentioned
(such as Toyota in the 1980s and 1990s with its lean-manufacturing approach, before that
approach diffused widely).
Given the dynamics of competitive positioning, firms cannot stand still but must con-
stantly refine and improve their strategic position over time. The goal is to not fall behind
the productivity frontier, which is defined by the theoretically possible best practice at any
given time. Since innovation is such an essential part of business strategy and competitive
advantage, we now turn to discussing innovation in much more detail in the next chapter.
R Reflecting higher value creation based on its differen-tiation strategy, P&G generally charges a 20–40 percent premium for its products in comparison to retailers’ private-label brands. For instance, a 150-oz. container of liquid Tide detergent is $18 at Target, while the retailer’s private-label brand is priced at $15. Given recent recessionary pressures on disposable household incomes, many con-sumers switched to private-label brands that they felt
did just as fine a job. Not only has P&G lost market share because of its higher prices to consumers; its profit margins have also been squeezed by rising costs of input factors.
One underlying problem that P&G is facing is that rather than creating new product categories that it is famous for, it is tweaking existing products incrementally.
CHAPTER CASE 6 Consider This . . .
WWW.YAZDANPRESS.COMWWW.YAZDANPRESS.COM

190 CHAPTER 6 Business Strategy: Differentiation, Cost Leadership, and Integration
P&G’s recent major product breakthroughs such as Swiffer cleaning devices and supplies, Crest Whitestrips, and Febreze odor fresheners were all launched over a decade ago. In an attempt to bring in more innovation from the outside through its Connect 1 Develop initiative, P&G has slashed its R&D spending in recent years by as much as 50 percent, and is now spending less than some of its rivals. The Connect 1 Develop initiative was put in place by A. G. Lafley during his first term as P&G’s CEO.
Questions
1. The Chapter Case states that P&G is pursuing a differentiation strategy. Looking at the value and cost drivers discussed in this chapter and the table entitled “Competitive Positioning and the Five Forces: Benefits and Risks of Cost-Leadership and
Differentiation Business Strategies” in Exhibit 6.7 , identify the factors causing P&G’s business strat-egy to lose its luster. Why is P&G’s differentiation strategy no longer as potent as it once was?
2. Given the discussion in the Chapter Case about P&G slashing its R&D spending and cutting costs and jobs more generally, does the firm risk being “stuck in the middle”? Why or why not? If yes, why would being “stuck in the middle” be a bad stra-tegic position?
3. Your task is to help Mr. Lafley sharpen P&G’s stra-tegic position. Which strategic position along the productivity frontier should P&G stake out? Which value and/or cost drivers would you focus on to improve P&G’s strategic profile? How would you go about it? What results would you expect?
This chapter discussed two generic business-level strat-
egies (differentiation and cost leadership) ; some fac-
tors that companies can use to drive those strategies;
integration strategy, the attempt to find a competitive
advantage by reconciling the trade-offs between the two
generic business strategies; and the dynamics of com-
petitive positioning as summarized by the following
learning objectives and related take-away concepts.
LO 6-1 / Define business-level strategy and
describe how it determines a firm’s strategic
position.
■ Business-level strategy determines a firm’s strategic
position in its quest for competitive advantage when
competing in a single industry or product market.
■ Strategic positioning requires that managers
address strategic trade-offs that arise between
value and cost, because higher value tends to go
along with higher cost.
■ Differentiation and cost leadership are distinct
strategic positions.
■ Besides selecting an appropriate strategic posi-
tion, managers must also define the scope of
competition—whether to pursue a specific market
niche or go after the broader market.
LO 6-2 / Examine the relationship between
value drivers and differentiation strategy.
■ The goal of a differentiation strategy is to increase
the perceived value of goods and services so that
customers will pay a higher price for additional
features.
■ In a differentiation strategy, the focus of competi-
tion is on value-enhancing attributes and features,
while controlling costs.
■ Some of the unique value drivers managers can
manipulate are product features, customer ser-
vice, customization, and complements.
■ Value drivers contribute to competitive advan-
tage only if their increase in value creation (ΔV)
exceeds the increase in costs (ΔC).
LO 6-3 / Examine the relationship between
cost drivers and the cost-leadership strategy.
■ The goal of a cost-leadership strategy is to reduce
the firm’s cost below that of its competitors.
TAKE-AWAY CONCEPTS
WWW.YAZDANPRESS.COMWWW.YAZDANPRESS.COM

CHAPTER 6 Business Strategy: Differentiation, Cost Leadership, and Integration 191
■ In a cost-leadership strategy, the focus of compe-
tition is achieving the lowest possible cost posi-
tion, which allows the firm to offer the lowest
price while maintaining acceptable value.
■ Some of the unique cost drivers that managers can
manipulate are the cost of input factors, econo-
mies of scale, and learning- and experience-curve
effects.
■ No matter how low the price, if there is no accept-
able value proposition, the product or service will
not sell.
LO 6-4 / Assess the benefits and risks of
cost-leadership and differentiation business
strategies vis-à-vis the five forces that shape
competition.
■ The five forces model helps managers use
generic business strategies to protect themselves
against the industry forces that drive down
profitability.
■ Differentiation and cost-leadership strategies
allow firms to carve out strong strategic positions,
not only to protect themselves against the five
forces, but also to benefit from them in their quest
for competitive advantage.
■ Exhibit 6.7 details the benefits and risks of each
business strategy.
LO 6-5 / Evaluate value and cost drivers
that may allow a firm to pursue an integration
strategy.
■ To address the trade-offs between differentiation
and cost leadership at the business level, manag-
ers may leverage quality, economies of scope,
innovation, and the firm’s structure, culture, and
routines.
■ The trade-offs between differentiation and low
cost can be addressed either at the business level
or at the corporate level.
LO 6-6 / Explain why it is difficult to succeed
at an integration strategy.
■ A successful integration strategy requires that
trade-offs between differentiation and low cost be
reconciled.
■ Integration strategy often is difficult because the
two distinct strategic positions require internal
value chain activities that are fundamentally dif-
ferent from one another.
■ When firms fail to resolve strategic trade-offs
between differentiation and cost, they end up
being “stuck in the middle.” They then suc-
ceed at neither strategy, leading to a competitive
disadvantage.
LO 6-7 / Describe and evaluate the dynamics
of competitive positioning.
■ The productivity frontier represents a set of best-
in-class strategic positions the firm can take relat-
ing to value creation and low cost at a given point in time.
■ Reaching the productivity frontier enhances the
likelihood of obtaining a competitive advantage.
■ Not reaching the productivity frontier implies
competitive disadvantage if other firms are posi-
tioned at the productivity frontier.
■ Strategic positions need to change over time as
the environment changes.
Ambidextrous organization
Business-level strategy
Cost-leadership strategy
Differentiation strategy
Diseconomies of scale
Economies of scale
Economies of scope
Focused cost-leadership strategy
Focused differentiation strategy
Integration strategy
Mass customization
Minimum efficient scale (MES)
Productivity frontier
Scope of competition
Strategic trade-offs
KEY TERMS
WWW.YAZDANPRESS.COMWWW.YAZDANPRESS.COM
192 CHAPTER 6 Business Strategy: Differentiation, Cost Leadership, and Integration
1. What are some drawbacks and risks to a broad
generic business strategy? To a focused strategy?
2. How can a firm attempting to have an integrated
business-level strategy manage to avoid being
“stuck in the middle”?
3. In Chapter 4, we discussed the internal value
chain activities a firm can perform in its business
model (see Exhibit 4.8). The value chain priori-
ties can be quite different for firms taking differ-
ent business strategies. Create examples of value
chains for three firms: one using cost leadership,
another using differentiation, and a third using an
integration business-level strategy.
4. A company such as Intel has a complex design
and manufacturing process. This should lead Intel
management to be concerned with scale of pro-
duction and learning curves. When do you think
managers should be more concerned with large-
scale production runs, and when do you think
they should be most concerned with practices that
would foster or hinder the hiring, training, and
retention of key employees?
DISCUSSION QUESTIONS
1. Suppose Procter & Gamble (P&G) learns that a
relatively new startup company Method ( www.
methodhome.com ) is gaining market share with a
new laundry detergent in West Coast markets. In
response, P&G lowers the price of its Tide deter-
gent from $18 to $9 for a 150-oz. bottle only in
markets where Method’s product is for sale. The
goal of this “loss leader” price drop is to encour-
age Method to leave the laundry detergent mar-
ket. Is this an ethical business practice? Why or
why not?
2. Whole Foods Market continues to seek ways
to differentiate itself from the competition (see
Strategy Highlight 6.1). The firm spends 5 per-
cent of its net profits on a variety of charities, and
it also provides opportunities for patrons to con-
tribute to such causes.
In 2010, Whole Foods enhanced a “back-
to-school” project it started a year earlier. It set
a goal to put 300 salad bars in public schools
within a 50-mile radius of any Whole Foods store.
The firm solicited contributions from customers
for this cause. In February 2011, Whole Foods
announced the fund-raising had surpassed the
original $750,000 goal. With over $1.4 million in
collections, the company expanded the program
to more than 500 elementary, middle, and high
schools across the United States. Whole Foods is
also expanding its in-store educational efforts with
“wellness clubs” in some stores. These dedicated
areas of the store give customers a chance to learn
firsthand about healthy cooking and eating. 52
Co-CEO John Mackey noted that 100 years
ago Americans spent about half their dispos-
able income on food. Today that figure is about
8 percent. Additionally, Mackey said that “really
healthy eating” should cost around $200 per
month, noting that it is the processing of foods
that drives up food prices. The least-expensive
way to eat, Mackey advised, is by sticking with
whole grains, beans, seasonal plants and produce,
and proper home cooking. 53
a. What value drivers is Whole Foods using to
remain differentiated in the face of Walmart
and other competitors now selling organic
foods? (Looking back at Exhibit 6.9 may be
useful.)
b. Given the discussion in Strategy Highlight 6.1
about Whole Foods trimming its cost struc-
ture, does the firm risk being “stuck in the
middle”? Why or why not?
c. What other methods could Whole Foods use
to successfully drive its business strategy?
ETHICAL/SOCIAL ISSUES
WWW.YAZDANPRESS.COMWWW.YAZDANPRESS.COM

CHAPTER 6 Business Strategy: Differentiation, Cost Leadership, and Integration 193
//// Small-Group Exercise 1
Ryanair (see Strategy Highlight 6.2) is noted as a firm
that can make a profit on a $20 ticket by imposing
numerous fees and surcharges.
1. Generally, an ethical business practice is to dis-
close fees to potential customers to permit effec-
tive cost comparisons. Log on to www.ryanair
.com and determine if Ryanair has transparent
disclosure of these fees.
2. If you were a competitor in the European market,
such as British Airways or Lufthansa, how would
you compete against Ryanair knowing your cost
structure would not allow price parity? If you
were a low-cost leader like Easy Jet, how would
you compete against Ryanair?
//// Small-Group Exercise 2
1. In the accompanying table is a list of prominent
firms. Place each firm you know (or research online)
in one of the five categories of generic business-
level strategies—broad cost leadership, focused cost
leadership, broad differentiation, focused differentia-
tion, and integration. Explain your choices.
2. What are some common features of the firms you
have placed within each category?
SMALL-GROUP EXERCISES
Ann Taylor Martin Guitars
BIC McKinsey & Co.
Big Lots Netflix
Black & Decker Nike
Clif Bar Patek Philippe
Coca-Cola Porsche
Dollar Stores Rhapsody
Ferrari Rolls-Royce
Google Ryanair
Goya Foods Samuel Adams
Greyhound Lines Singapore Airlines
Hyundai Target
Kia Motors Toyota
JetBlue Vanguard
Lands’ End Victoria’s Secret
Liberty Mutual WellPoint
LVMH Zara
STRATEGY TERM PROJECT
//// Module 6: Business Strategy
In this module, we will look at the business model
your selected company uses and analyze its business-
level strategy to see if it is appropriate for the strategic
position. If your firm is a large multibusiness entity,
you will need to choose one of the major businesses
(strategic business unit, or SBU) of the firm for this
analysis. In prior chapters, we collected information
about this firm’s external environment and some of its
internal competitive advantages. Using this informa-
tion and any other you have gathered, address the fol-
lowing questions.
1. Does your selected business have differentiated
products or services? If so, what is the basis for
this differentiation from the competition?
2. Does your firm have a cost-leadership position in
this business? If so, can you identify which cost
drivers it uses effectively to hold this position?
3. What is your firm’s approach to the market? If it
segments the market, identify the scope of com-
petition it is using.
4. Using the answers to the preceding questions,
identify which generic business strategies your
firm is employing. Is the firm leveraging the
appropriate value and cost drivers for the business
strategy you identified? Explain why or why not.
5. As noted in the chapter, each business strategy is
context-dependent. What do you see as positives
and negatives with the selected business strategy
of your firm in its competitive situation?
WWW.YAZDANPRESS.COMWWW.YAZDANPRESS.COM

194 CHAPTER 6 Business Strategy: Differentiation, Cost Leadership, and Integration
6. In Chapter 3, we identified strategic groups in the
industry relevant to your firm. Review the firms
listed in the same strategic group as your selected
firm. See if there is a similarity with the generic
business strategy used by each. In most strategic
groups, there will be market and (some) strategy
similarities across the firms.
7. What suggestions do you have to improve the
firm’s business strategy and strategic position?
Different Value and Cost
Drivers—What Determines Your
Buying Decisions?
F irms communicate their strategy to their customers through advertising and promotions. What role does a firm’s approach to communicating with you have on
your buying decision? Do you understand how a firm’s mes-sage influences your decision? Greater awareness of how firms try to influence customers can help you understand stra-tegic positioning. On a personal level, greater understanding of your buying decisions can help you manage your disposable income more wisely. For example, to stay within your budget, conscious awareness that your choice of a high-priced bever-age has been influenced by product placement in a TV show or movie may cause you to reconsider the expenditure and choose a lower-priced alternative or even forgo the purchase.
In the following table, the columns show some optional advertising approaches used by companies to communicate
the value of their product in order to influence your buying decisions, and the rows list some familiar product catego-ries. Referring to the table, do the following:
1. For each product category, first consider how each type of advertising might influence you; then rank from 1 (not at all) to 5 (strong influence) and enter that num-ber in the cell. Most consumers use different criteria to make purchase decisions for different categories of product. Compare your rankings with those of other stu-dents in the class. What approaches not included here have a stronger influence on your buying decisions?
2. Second, for each advertising approach, decide whether you think it would be more likely to be used for products sold by a company using a differentiation (D), cost- leadership (CL), or integration (I) strategy and enter the letter abbreviation of that strategy under the column heading. Compare your responses with those of other students and discuss why differentiators and cost leaders may choose similar or different advertising approaches.
my STRATEGY
Product Placement in TV or Movies
Celebrity Endorsement
Sustainability Claims
Comments on Social
Media
Point of Purchase Displays
Print Media
AdsLow-Price
Assurances
Mobile device
Shoes for professional wear
Clothing for casual wear
Clothing for formal event
Sporting goods
Airline ticket
Car
Food and beverages
Computer
How Different Advertising Approaches Influence Consumer Buying Decisions
WWW.YAZDANPRESS.COMWWW.YAZDANPRESS.COM

CHAPTER 6 Business Strategy: Differentiation, Cost Leadership, and Integration 195
1. This ChapterCase is based on: “A David
and Gillette story,” The Wall Street Journal, April 12; “P&G’s stumbles put CEO on hot
seat for turnaround,” The Wall Street Journal, September 27, 2012; “At Procter & Gamble,
the innovation well runs dry,” BusinessWeek, September 6, 2012; “Embattled P&G chief
replaced by old boss,” The Wall Street Jour-nal, May 23, 2013; Lafley, A. G., and R. L.
Martin (2013), Playing to Win: How Strategy Really Works (Boston, MA: Harvard Business
Review Press); and “P&G’s Billion-Dollar
Brands: Trusted, Valued, Recognized,” Fact
Sheet, www.pg.com .
2. This discussion is based on: Porter, M. E.
(1980), Competitive Strategy: Techniques for Analyzing Industries and Competitors (New
York: Free Press); Porter, M. E. (1985), Com-petitive Advantage: Creating and Sustain-ing Superior Performance (New York: Free
Press); Porter, M. E. (1996), “What is strat-
egy?” Harvard Business Review, November–
December; and Porter, M. E. (2008), “The
five competitive forces that shape strategy,”
Harvard Business Review, January.
3. These questions are based on: Abell, D.
F. (1980), Defining the Business: The Start-ing Point of Strategic Planning (Englewood
Cliffs, NJ: Prentice-Hall); Porter, M. E.
(1996), “What is strategy?”; and Priem, R.
(2007), “A consumer perspective on value
creation,” Academy of Management Review
32: 219–235.
4. Porter, M. E. (1996), “What is strategy?”
5. The discussion of generic business strate-
gies is based on: Porter, M. E. (1980), Com-petitive Strategy. Techniques for Analyzing Industries and Competitors; Porter, M. E.
(1985), Competitive Advantage: Creating and Sustaining Superior Performance; Porter, M.
E. (1996), “What is strategy?”; and Porter, M.
E. (2008), “The five competitive forces that
shape strategy.”
6. To decide if and how to divide up the mar-
ket, you can apply the market segmentation
techniques you have acquired in your market-
ing and microeconomics classes.
7. Elon Musk in “Uber Entrepreneur: An
Evening with Elon Musk,” Churchill Club,
Mountain View, CA, April 7, 2009 (avail-
able at ForaTV: http://fora.tv/2009/04/07/
Uber_Entrepreneur_An_Evening_with_Elon_
Musk ).
8. Anderson, R. C., and R. White (2009),
Confessions of a Radical Industrialist: Profits, People, Purpose—Doing Business by Respect-ing the Earth (New York: St. Martin’s Press).
9. Christensen, C. M., and M. E. Raynor
(2003), The Innovator’s Solution: Creating and Sustaining Successful Growth (Boston,
MA: Harvard Business School Press).
10. The interested reader is referred to the
strategy, marketing, and economics literatures.
A good start in the strategy literature is the
classic work of M. E. Porter: Porter, M. E.
(1980), Competitive Strategy: Techniques for Analyzing Industries and Competitors; Porter,
M. E. (1985), Competitive Advantage: Creat-ing and Sustaining Superior Performance; and
Porter, M. E. (2008), “The five competitive
forces that shape strategy.”
11. “Walter Robb: Whole Foods’ other CEO
on organic growth,” Fortune, May 6, 2013.
12. “Frank talk from Whole Foods’ John
Mackey,” The Wall Street Journal, August
4, 2009; “As sales slip, Whole Foods tries to
push health,” The Wall Street Journal, August
5, 2009; “The conscience of a capitalist,” The Wall Street Journal, October 3, 2009; “Walter
Robb on Whole Foods’ recession lessons,”
BusinessWeek, August 9, 2012; “Walter Robb:
Whole Foods’ other CEO on organic growth,”
Fortune, May 6, 2013; “Whole Foods profits
by cutting ‘whole paycheck’ reputation,”
BusinessWeek, May 8, 2013; www.whole
foodsmarket.com .
13. www.oxo.com/about.jsp .
14. Hsieh, T. (2010), Delivering Happiness: A Path to Profits, Passion, and Purpose (New
York: Business Plus).
15. “Amazon opens wallet, buys Zappos,”
The Wall Street Journal, July 23, 2009.
16. www.att.com/u-verse/ .
17. See a discussion of Southwest Airlines’
cost-leadership strategy in Porter, M. E.
(1996), “What is strategy?” Harvard Business Review, November–December: 61–78.
18. Anderson, C. (2009), Free: The Future of a Radical Price (New York: Hyperion);
“Walmart with wings,” BusinessWeek, November 27, 2006; “Snarling all the way to
the bank,” The Economist, August 23, 2007;
and “Ryanair’s O’Leary: The duke of discom-
fort,” Bloomberg Businessweek, September 2,
2010, www.ryanair.com .
19. Friedman, T. (2005), The World Is Flat: A Brief History of the Twenty-First Century
(New York: Farrar, Strauss and Giroux).
20. “Boeing looks beyond Dreamliner’s first
flight,” The Wall Street Journal, December 15,
2009, www.boeing.com .
21. www.airbus.com/en/aircraftfamilies/a380/
home/ .
22. Kevin Turner, COO Microsoft. Keynote
Speech at Microsoft’s Worldwide Partner
Conference, New Orleans, July 15, 2009.
23. “Microsoft Concedes Windows 8 Misses
Expectations,” The Wall Street Journal, May 7, 2013; “Windows 8 is only the begin-
ning of Microsoft’s problems,” The Econo-mist, May 11, 2013.
24. “GM hopes Volt juices its future,” The Wall Street Journal, August 12, 2009.
25. “Nucor’s new plant project still on hold,”
Associated Press, July 23, 2009, www.nucor.
com .
26. Gladwell, M. (2002), The Tipping Point: How Little Things Can Make a Big Difference
(New York: Back Bay Books) p. 185.
27. Levitt, B., and J. G. March (1988), “Orga-
nizational learning,” in Scott, W. R. (ed.),
Annual Review of Sociology 14: 319–340
(Greenwich, CT: JAI Press).
28. For insightful reviews and syntheses on
the learning-curve literature, see: Yelle, L. E.
(1979), “The learning curve: Historical review
and comprehensive survey,” Decision Sciences
10: 302–308; and Argote, L., and G. Todorova
(2007), “Organizational learning: Review
and future directions,” in Hodgkinson, G. P.,
and J. K. Ford (eds.), International Review of Industrial and Organizational Psychology 22:
193–234 (New York: Wiley).
29. Wright, T. P. (1936), “Factors affecting
the cost of airplanes,” Journal of Aeronautical Sciences 3: 122–128.
30. This discussion is based on: Darr, E.
D., L. Argote, and D. Epple (1995), “The
acquisition, transfer and depreciation of
knowledge in service organizations: Produc-
tivity in franchises,” Management Science
42: 1750–1762; King, A. W., and A. L. Ranft
(2001), “Capturing knowledge and know-
ing through improvisation: What managers
can learn from the thoracic surgery board
certification process,” Journal of Manage-ment 27: 255–277; Zollo, M., J. J. Reuer,
and H. Singh (2002), “Interorganizational
routines and performance in strategic alli-
ances,” Organization Science 13: 701–713;
Hoang, H., and F. T. Rothaermel (2005),
“The effect of general and partner-specific
alliance experience on joint R&D project
performance,” Academy of Management Journal 48: 332–345; Rothaermel, F. T., and
D. L. Deeds (2006), “Alliance type, alliance
experience, and alliance management capa-
bility in high-technology ventures,” Journal of Business Venturing 21: 429–460; Pisano,
G. P., R. M. Bohmer, and A. C. Edmondson
ENDNOTES
WWW.YAZDANPRESS.COMWWW.YAZDANPRESS.COM

196 CHAPTER 6 Business Strategy: Differentiation, Cost Leadership, and Integration
(2001), “Organizational differences in rates
of learning: Evidence from the adoption of
minimally invasive cardiac surgery,” Man-agement Science 47: 752–768; Edmondson,
A. C., R. M. Bohmer, and G. P. Pisano
(2001), “Disrupted routines: Team learn-
ing and new technology implementation in
hospitals,” Administrative Science Quarterly
46: 685–716; Thompson, P. (2001), “How
much did the liberty shipbuilders learn? New
evidence from an old case study,” Journal of Political Economy 109: 103–137; and Gulati,
R., D. Lavie, and H. Singh (2009), “The
nature of partnering experience and the gain
from alliances,” Strategic Management Jour-nal 30: 1213–1233.
31. Ramanarayanan, S. (2008), “Does prac-
tice make perfect: An empirical analysis
of learning-by-doing in cardiac surgery.”
Available at SSRN: http://ssrn.com/
abstract 5 1129350 .
32. Boston Consulting Group (1972), Per-spectives on Experience (Boston, MA: Boston
Consulting Group).
33. This discussion is based on: Porter, M. E.
(1979), “How competitive forces shape strat-
egy,” Harvard Business Review, March–April:
137–145; Porter, M. E. (1980), Competitive Strategy. Techniques for Analyzing Industries and Competitors; and Porter, M. E. (2008),
“The five competitive forces that shape
strategy.”
34. “Samsung sparks anxiety at Google,” The Wall Street Journal, February 25, 2013.
35. This discussion is based on: Hill, C.W.L.
(1988), “Differentiation versus low cost or
differentiation and low cost: A contingency
framework,” Academy of Management Review
13: 401–412; and Miller, A., and G. G. Dess
(1993), “Assessing Porter’s model in terms of
its generalizability, accuracy, and simplicity,”
Journal of Management Studies 30: 553–585.
36. Davis, S. M. (1987), Future Perfect (Reading, MA: Addison-Wesley).
37. This discussion is based on: Afuah, A.
(2009), Strategic Innovation. New Game Strat-egies for Competitive Advantage (New York:
Routledge); Hill, C.W.L., and F. T. Rothaer-
mel (2003), “The performance of incumbent
firms in the face of radical technological
innovation,” Academy of Management Review
28: 257–274; Rothaermel, F. T., and A. Hess,
“Finding an innovation strategy that works,”
The Wall Street Journal, August 17, 2009;
and Rothaermel, F. T., and A. Hess (2010),
“Innovation strategies combined,” MIT Sloan Management Review, Spring: 12–15.
38. “IKEA: How the Swedish retailer became
a global cult brand,” BusinessWeek, November
14, 2005.
39. This discussion is based on: O’Reilly, C.
A., III, and M. L. Tushman (2007), “Ambi-
dexterity as dynamic capability: Resolving the
innovator’s dilemma,” Research in Organiza-tional Behavior 28: 1–60; Raisch, S., and J.
Birkinshaw (2008), “Organizational ambidex-
terity: Antecedents, outcomes, and modera-
tors,” Journal of Management 34: 375–409;
and Rothaermel, F. T., and M. T. Alexandre
(2009), “Ambidexterity in technology sourc-
ing: The moderating role of absorptive capac-
ity,” Organization Science 20: 759–780.
40. Hamel, G. (2006), “The why, what, and
how of management innovation,” Harvard Business Review, February.
41. March, J. G. (1991), “Exploration and
exploitation in organizational learning,” Orga-nization Science 2: 319–340; and Levinthal,
D. A., and J. G. March (1993), “The myopia
of learning,” Strategic Management Journal 14: 95–112.
42. Author’s interviews with Intel managers
and engineers.
43. Brown, S. L., and K. M. Eisenhardt
(1997), “The art of continuous change: Link-
ing complexity theory and time-paced evolu-
tion in relentlessly shifting organizations,”
Administrative Science Quarterly 42: 1–34;
and O’Reilly, C. A., B. Harreld, and M. Tush-
man (2009), “Organizational ambidexterity:
IBM and emerging business opportunities,”
California Management Review 51: 75–99.
44. This discussion is based on: Porter, M. E.
(1980), Competitive Strategy; and Porter, M. E.
(1996), “What is strategy?” Harvard Business Review, November–December: 61–78.
45. “For Penney’s heralded boss, the shine
is off the apple,” The Wall Street Journal, February 24, 2013; “Macy’s CEO: Penney,
Martha Stewart deal made me ‘sick,’” The Wall Street Journal, February 25, 2013; and
“Penney CEO out, old boss back in,” The Wall Street Journal, April 8, 2013.
46. Porter, M. E. (1996), “What is strategy?”
47. This discussion is based on: “Lenovo
aims higher in U.S.,” The Wall Street Jour-nal, January 10, 2013; “Dell: From PC king
to buyout fodder,” The Wall Street Journal, January 15, 2013; “Lenovo closes in on
HP, Dell as PC sales plummet,” Bloomberg Businessweek, April 11, 2013. Data reported
are from industry research firms Gartner
and IDC.
48. The shape of the productivity frontier is
concave to indicate the trade-offs between low
cost and differentiation.
49. “Taking the dull out of Dell,” Business-Week, November 3, 2008.
50. “Dell to buy Perot in catch-up deal,” The Wall Street Journal, September 22, 2009.
51. “HP affirms commitment to Autonomy,”
The Wall Street Journal, April 10, 2013.
52. Material for this case discussion is from:
“More than 500 schools awarded grants
for salad bars,” Whole Foods Market Press
Release, February 1, 2011, www.wholefoods
market.com/backtoschool/ ; and “ECO:nomics:
Whole Foods CEO says eating healthy costs
less,” WSJ Video, March 3, 2011.
53. “ECO:nomics: Whole Foods CEO says
eating healthy costs less.”
WWW.YAZDANPRESS.COMWWW.YAZDANPRESS.COM

WWW.YAZDANPRESS.COMWWW.YAZDANPRESS.COM

198
Chapter 7
Business Strategy: Innovation and Entrepreneurship
Chapter Outline
7.1 Competition Driven by Innovation The Innovation Process
7.2 Strategic and Social Entrepreneurship
7.3 Innovation and the Industry Life Cycle Introduction Stage Growth Stage Shakeout Stage Maturity Stage Decline Stage Crossing the Chasm
7.4 Types of Innovation Incremental vs. Radical Innovation Architectural vs. Disruptive Innovation The Internet as Disruptive Force: The Long Tail Open Innovation
7.5 Implications for the Strategist
Learning Objectives
After studying this chapter, you will be able to:
LO 7-1 Outline the four-step innovation process from idea to imitation.
LO 7-2 Apply strategic management concepts to entrepreneurship and innovation.
LO 7-3 Describe the competitive implications of dif-ferent stages in the industry life cycle.
LO 7-4 Derive strategic implications of the crossing-the-chasm framework.
LO 7-5 Categorize different types of innovations in the markets-and-technology framework.
LO 7-6 Explain the long-tail concept and derive its strategic implications.
LO 7-7 Compare and contrast closed and open innovation.
WWW.YAZDANPRESS.COMWWW.YAZDANPRESS.COM

199
W Wikipedia:
The Free Encyclopedia
W IKIPEDIA IS OFTEN the first source consulted for information about an unfamiliar topic, but this was not always the case. For almost 250 years, Encyclo-pedia Britannica was the gold standard for authori-tative reference works, delving into more than 65,000 topics with articles by some 4,000 scholarly contributors, including many by Nobel Laureates. The beautiful leather-bound, multivolume set of books made a nice decorative item in many homes. In the early 1990s, when total sales for encyclope-dias were over $1.2 billion annually, Encyclopedia Britannica was the undisputed market leader, hold-ing more than 50 percent market share and earning some $650 million in revenues. Not surprisingly, its superior differentiated appeal was highly correlated with cost, reflected in its steep sticker price of up to $2,000.
Innovation changed all that. Banking on the wide-spread diffusion of the personal computer, Microsoft launched its electronic encyclopedia Encarta in 1993 at a price of $99. Although some viewed it as merely a CD-version of the lower-cost and lower-quality Funk & Wagnall’s Encyclopedia sold in supermarkets, Encarta still took a big bite out of Britannica’s market. Within only three years, the market for printed ency-clopedias had shrunk by half, along with Britannica’s revenues, while Microsoft sold over $100 million worth of Encarta CDs.
In 2001, Internet entrepreneur Jimmy Wales launched Wikipedia, the free online multilanguage encyclopedia. In Hawaiian, wiki means quick, refer-ring to the instant do-it-yourself editing capabilities of the site. Wikipedia is a nonprofit venture sup-ported by the Wikimedia Foundation, which obtains
its funding from donations. Wikipedia now has 26 million articles in 285 languages, including over 4.2 million items in English.
Wikipedia’s slogan is “ the Free Encyclopedia that anyone can edit. ” Since it is open source, any per-son, expert or novice, can contribute content and edit pages using the handy “edit this page” button. It also draws on tens of thousands of volunteer edi-tors, who monitor and validate content by consen-sus. Although Wikipedia’s volume of English entries is almost 65 times greater than that of Britannica, the site is not as error-prone as you might think. The free online encyclopedia relies on the wisdom of the crowds, which assumes “the many” often know more than “the expert.” Moreover, user-generated content needs to be verifiable by reliable sources such as links to reputable websites. A peer-reviewed study by Nature of selected science topics found that the error rate of Wikipedia and Britannica was roughly the same. Yet, Wikipedia’s crowdsourcing approach to display user-generated content is not without criti-cism. The most serious are that the content may be unreliable and unauthoritative, that it could exhibit systematic bias, and that group dynamics might pre-vent objective and factual reporting. 1
After reading the chapter, you will find more about this case, with related questions, on page 231.
CHAPTER CASE 7
INNOVATION —the successful introduction of a new product, process, or business
model—is a powerful driver in the competitive process. The Chapter Case pro-
vides an example of how advancements in technology can render traditional business
models obsolete. With introduction of its CD-based Encarta, Microsoft destroyed about
half the value created by Britannica. In turn, Wikipedia moved away from Britannica’s
and Microsoft’s proprietary business models to an open-source model powered by
WWW.YAZDANPRESS.COMWWW.YAZDANPRESS.COM

200 CHAPTER 7 Business Strategy: Innovation and Entrepreneurship
user-generated content and available to anyone on the Internet. In doing so, it destroyed
Encarta’s business, which Microsoft shut down in 2009. At the same time, Wikipedia
created substantial benefits for users by shifting to the open-source model for content.
Because Wikipedia was able to create value for consumers by driving the price for the
end user to zero and making the information instantly accessible on the Internet, there
is no future for printed or CD-based encyclopedias. Sales of the beautiful leather-bound
Encyclopedia Britannica volumes declined from a peak of 120,000 sets in 1990 to a
mere 12,000 sets in 2010. As a consequence, Encyclopedia Britannica announced in
2012 that it no longer would print its namesake books. Its content is now accessible via
a paid subscription through its website and apps for mobile devices.
Innovation allows firms to redefine the marketplace in their favor and achieve a com-
petitive advantage. 2 As a powerful competitive weapon for business strategy formula-
tion, innovation and the related topic of entrepreneurship are the focus of this chapter.
We begin this chapter by detailing how competition is a process driven by continuous
innovation. Next we discuss strategic and social entrepreneurship. We then take a deep
dive into the industry life cycle. This helps us to formulate a more dynamic business
strategy as the industry changes over time. We also introduce the crossing-the-chasm
framework, highlighting the difficulties in transitioning different stages of the industry
life cycle. We then move into a detailed discussion of different types of innovation and
derive their strategic implications. We also present different ways to organize for inno-
vation. As with every chapter, we conclude with practice-oriented Implications for the Strategist.
7.1 Competition Driven by Innovation
Competition is a process driven by the “perennial gale of creative destruction,” in the
words of famed economist Joseph Schumpeter. 3 The continuous waves of market lead-
ership changes in the encyclopedia business, detailed in the Chapter Case, demonstrate
the potency of innovation as a competitive weapon: It can simultaneously create and
destroy value. Firms must be able to innovate while also fending off competitors’ imita-
tion attempts. A successful strategy requires both an effective offense and a hard-to-crack
defense.
Many firms have dominated an early wave of innovation only to be destroyed by the
next wave. Examples include:
■ The move from typewriters to computers: Wang Laboratories, a computer company
that led the market for word-processing machines, destroyed typewriter companies
such as Smith Corona and Underwood. It then was undone by computer makers
such as IBM and Compaq. Today, IBM has exited the personal computer market,
selling its PC division to the Chinese technology company Lenovo, and Compaq
has been acquired by HP. The computer industry, however, has not been standing
still either. Once-successful PC makers such as HP and Dell are now under threat by
companies that are innovating in the mobile device space, such as Amazon, Apple,
and Samsung.
■ The explosion of television-viewing options: The traditional television networks (ABC,
CBS, and NBC) have been struggling to maintain viewers and advertising revenues as
cable and satellite providers have offered innovative programming. Those same cable
and satellite providers are trying hard to hold on to viewers as more and more people
WWW.YAZDANPRESS.COMWWW.YAZDANPRESS.COM

CHAPTER 7 Business Strategy: Innovation and Entrepreneurship 201
gravitate toward customized content online. To exploit such opportunities, Google
acquired YouTube, while Comcast, the largest cable operator in the U.S., purchased
NBC Universal from GE. 4 Comcast’s acquisition helps it integrate delivery services
and content, with the goal of establishing itself as a new player in the media industry.
In turn, both traditional TV and cable networks are currently under threat from content
providers that stream via the Internet, such as Netflix, YouTube, Vimeo, Hulu, and
Amazon Instant Video.
As the adage goes, change is the only constant—and the rate of technological change
has accelerated dramatically over the last hundred years. Changing technologies spawn
new industries, while others die out. This makes innovation a powerful strategic weapon
in order to gain and sustain competitive advantage. Exhibit 7.1 shows how many years
it took for different technological innovations to reach 50 percent of the U.S. population
(either through ownership or usage). As an example, it took 84 years for half of the U.S.
population to own a car, but only 28 years for half the population to own a TV. The pace
of the adoption rate of recent innovations continues to accelerate. It took 19 years for the
Years
CarAirplane
TelephoneElectricityVCRMicrowave
RadioTV
8475715237353328
MP3Internet
6 10 14
CellPhone PC
19
50%
Ow
ners
hip
/ Us
e (U
.S.)
EXHIBIT 7.1 / Accelerating Speed of Technological Change
SOURCE: Author’s depiction of data from the U.S. Census Bureau, the Consumer Electronics Association, Forbes, and the National Cable and Telecommunications Association.
WWW.YAZDANPRESS.COMWWW.YAZDANPRESS.COM
202 CHAPTER 7 Business Strategy: Innovation and Entrepreneurship
PC to reach 50 percent ownership, but only 6 years for MP3 players to accomplish the
same diffusion rate.
What factors explain increasingly rapid technological diffusion and adoption? One
determinant is that initial innovations such as the car, airplane, telephone, and the use of
electricity provided the necessary infrastructure for newer innovations to diffuse more rap-
idly. Another reason is the emergence of new business models that make innovations more
accessible. For example, Dell’s direct-to-consumer distribution system improved access
to low-cost PCs, and Walmart’s low-price, high-volume model utilized its sophisticated
IT logistics system to fuel explosive growth. In addition, satellite and cable distribution
systems facilitated the ability of mass media such as radio and TV to deliver advertising
and information to a wider audience. The speed of technology diffusion has accelerated
further with the emergence of the Internet, social networking sites, and viral messaging.
The accelerating speed of technological changes has significant implications for the com-
petitive process and firm strategy. We will now take a closer look at the innovation process
unleashed by technological changes.
THE INNOVATION PROCESS
Broadly viewed, innovation describes the discovery and development of new knowledge
in a four-step process captured in the 4 - I’s: idea, invention, innovation, and imitation (see
Exhibit 7.2 ). 5
The innovation process begins with an idea. The idea is often presented in terms of
abstract concepts or as findings derived from basic research. Basic research is conducted
to discover new knowledge. This may be done to enhance the fundamental understand-
ing of nature, without any commercial application or benefit in mind. In the long run,
however, basic research is often transformed into applied research with commercial
application. For example, wireless communication technology is built upon the funda-
mental science breakthroughs Albert Einstein accomplished in his research on the nature
of light. 6
In a next step, invention describes the transformation of an idea into a new product or
process, or the modification and recombination of existing ones. The practical application
of basic knowledge in a particular area frequently results in new technology. If an inven-
tion is useful, novel, and non-obvious as assessed by the U.S. Patent and Trademark Office,
it can be patented. 7 A patent is a form of intellectual property, and gives the inventor
exclusive rights to benefit from commercializing a technology for a specified time period
in exchange for public disclosure of the underlying idea. In the U.S., the time period for
the right to exclude others from the use of the technology is 20 years from the filing date
of a patent application. Exclusive rights often translate into a temporary monopoly posi-tion until the patent expires. For instance, many pharmaceutical drugs are patent protected.
Moreover, patents can be enforced in court. In the smartphone industry, Apple won a pat-
ent infringement lawsuit against Samsung. A federal jury found that some of Samsung’s
older mobile devices had infringed on several Apple patents. 8
Innovation concerns the commercialization of an invention by entrepreneurs. 9
Entrepreneurs are the agents who introduce change into the competitive system. They do
this not only by figuring out how to use inventions, but also by introducing new products
or services, new production processes, and new forms of organization. Entrepreneurs can
introduce change by starting new ventures, such as Jimmy Wales with Wikipedia or Mark
Zuckerberg with Facebook. Or they can be found within existing firms, such as A. G.
Lafley at Procter & Gamble (P&G), who implemented an open-innovation model (which
we’ll discuss later). When innovating within existing companies, change agents are often
LO7-1
Outline the four-step innovation process from idea to imitation.
invention The transformation of an idea into a new product or process, or the modification and recombination of existing ones.
patent A form of intellectual property that gives the inventor exclusive rights to benefit from commercializing a technology for a specified time period in exchange for public disclosure of the underlying idea.
WWW.YAZDANPRESS.COMWWW.YAZDANPRESS.COM

CHAPTER 7 Business Strategy: Innovation and Entrepreneurship 203
called intrapreneurs: those pursuing corpo-rate entrepreneurship. 10
According to Schumpeter, entrepreneurs
who drive innovation need just as much
skill, commitment, and daring as inven-
tors who are responsible for the process
of invention. As an example, the engineer
Nikola Tesla invented the alternating-cur-
rent (AC) electric motor, and was granted a
patent in 1888 by the U.S. Patent and Trade-
mark Office. 11 Although this breakthrough
technology was neglected for much of the
time during the 20 th century, the entrepre-
neur Elon Musk is commercializing Tesla’s
invention with Tesla Motors, a new venture
formed to design and manufacture all-elec-
tric automobiles. Tesla Motors (a name that
Elon Musk chose to honor Nikola Tesla) launched several all-electric vehicles based on
Tesla’s original invention.
The successful commercialization of a new product or service allows a firm to extract
temporary monopoly profits. Apple’s innovation by launching the iPhone reshaped the
smartphone industry in its favor, resulting in a temporary competitive advantage. To sustain a
competitive advantage, however, a firm must continuously innovate—that is, it must produce
a string of successful new products or services over time. In this spirit, not only has Apple
introduced incrementally improved iPhones, but also the firm has launched other innovative
mobile devices such as the iPad line of products, multimedia tablet computers created with
the intent to drive convergence in computing, telecommunications, and media content.
Successful innovators can benefit from a number of first-mover advantages , 12 includ-
ing economies of scale as well as experience and learning-curve effects (as discussed in
Chapter 6). First movers may also benefit from network effect s (see Strategy Highlight 7.1
later in this chapter). Moreover, first movers may hold important intellectual property such
as critical patents. They may also be able to lock in key suppliers as well as customers
through increasing switching costs. For example, users of Microsoft Word might find the
switching costs entailed in moving to a different word-processing software prohibitive.
Not only would they need to spend many hours learning the new software, but collabora-
tors would also need to have compatible software installed and be familiar with the pro-
gram to open and revise shared documents.
Google (by offering Google Docs, a free web-based suite of application software such
as word-processing, spreadsheet, and presentation programs) is attempting to minimize
switching costs by leveraging cloud computing —a real-time network of shared comput-
ing resources via the Internet. Rather than requiring each user to have the appropriate
Idea
Invention
Innovation
Imitation
EXHIBIT 7.2 / The 4-I’s: Idea, Invention, Innovation, and Imitation
innovation The commercialization of any new product or process, or the modification and recombination of existing ones. To drive growth, innovation also needs to be useful and successfully implemented.
entrepreneurs The agents that introduce change into the competitive system. They do this not only by figuring out how to use inventions, but also by introducing new products or services, new production processes, and new forms of organization.
first-mover advantages
Competitive benefits that accrue to the successful innovator.
WWW.YAZDANPRESS.COMWWW.YAZDANPRESS.COM

204 CHAPTER 7 Business Strategy: Innovation and Entrepreneurship
software installed on his or her personal computer, the
software is maintained and updated in the cloud. Files
are also saved in the cloud, which allows collaboration
in real time globally wherever one can access an Inter-
net connection.
It is important to note that innovation need not be
high-tech in order to be a potent competitive weapon, as
P&G’s history of innovative new product launches such
as the Swiffer line of cleaning products shows. P&G
uses the razor–razor-blade business model (introduced
in Chapter 5), where the consumer purchases the handle
at a low price, but must pay a premium for replacement
refills and pads over time. As shown in Exhibit 7.3 , an
innovation needs to be novel, useful, and successfully
implemented in order to help firms gain and sustain a
competitive advantage.
The innovation process ends with imitation. If an
innovation is successful in the marketplace, competi-
tors will attempt to imitate it. As discussed in detail
when introducing the VRIO framework in Chapter 4,
Samsung’s Galaxy line of smartphones has been able
to imitate successfully the look and feel of Apple’s iPhones. As featured in the Chapter-
Case, Wikipedia has some 500 million readers monthly, making it one of the most-visited
websites. This success has not gone unnoticed. Scholarpedia, a competitor to Wikipedia,
combines features from Wikipedia such as open-source content submission with features
from Britannica such as strict quality control by leading scholarly experts.
7.2 Strategic and Social Entrepreneurship
Entrepreneurship describes the process by which change agents undertake economic
risk to innovate—to create new products, processes, and sometimes new organizations. 13
Entrepreneurs innovate by commercializing ideas and inventions. 14 They seek out or create
new business opportunities and then assemble the resources necessary to exploit them. 15 If
successful, entrepreneurship not only drives the competitive process, it also creates value
for the individual entrepreneurs and society at large.
Although many new ventures fail, some achieve spectacular success. Examples of suc-
cessful entrepreneurs are:
■ Jeff Bezos is the founder of Amazon.com , the world’s largest online retailer. The
stepson of a Cuban immigrant, Bezos graduated from Princeton and then worked
as a financial analyst on Wall Street. In 1994, after reading that the Internet was
growing by 2,000 percent a month, he set out to leverage the Internet as a new dis-
tribution channel. Listing products that could be sold online, he finally settled on
books because that retail market was fairly fragmented, with huge inefficiencies in
its distribution system. Perhaps even more important, books represent a perfect com-
modity, because they are identical regardless of where a consumer buys them. This
reduced uncertainty when introducing online shopping to consumers. In a compre-
hensive research study that evaluated the long-term performance of CEOs globally,
Jeff Bezos was ranked #2, just behind the late Steve Jobs (Apple), but ahead of Yun
Jong-Yong (Samsung). 16
entrepreneurship The process by which people undertake economic risk to innovate—to create new products, processes, and sometimes new organizations.
LO7-2
Apply strategic management concepts to entrepreneurship and innovation.
Novel
INNOVATION
Useful
Implemented
EXHIBIT 7.3 / Innovation: A Novel and Useful Idea That Is Successfully Implemented
WWW.YAZDANPRESS.COMWWW.YAZDANPRESS.COM

CHAPTER 7 Business Strategy: Innovation and Entrepreneurship 205
■ Oprah Winfrey, best-known for her self-titled TV talk show, is also founder and CEO
of Harpo Productions, a multimedia company. Some of Harpo’s well-known products
include The Oprah Winfrey Show, Dr. Phil, The Rachael Ray Show, The Dr. Oz Show, Oprah.com , O, The Oprah Magazine, and O at Home. In January 2011, she launched
a new cable-TV channel jointly with Discovery Communications: OWN, The Oprah Winfrey Network. 17 A graduate of Tennessee State University, Oprah used her entre-
preneurial talents to rise from poverty and an abusive childhood to become one of the
most successful entrepreneurs in the multimedia business, with a net worth of over
$2 billion. 18 In 2011, Oprah Winfrey ended her all-time record-setting talk show to
devote her entrepreneurial talents to OWN (which is yet to turn a profit—it has lost
more than $330 million since inception). To make OWN more successful, Oprah
Winfrey took over the position as CEO in addition to Chief Creative Officer. Her skill-
ful interview with Lance Armstrong, in which the disgraced cyclist confessed for the
first time publicly to the use of doping, drew a record 4.3 million viewers.
■ Elon Musk is an engineer and serial entrepreneur with a deep passion to “solve envi-
ronmental, social and economic challenges.” 19 Elon Musk left his native South Africa
at age 17. He went to Canada and then to the United States, where he completed a
bachelor’s degree in economics and physics at the University of Pennsylvania. After
only two days in a PhD program in applied physics and material sciences at Stanford
University, Mr. Musk left graduate school to found Zip2, an online provider of content
publishing software for news organizations. Four years later, in 1999, computer maker
Compaq acquired Zip2 for $341 million (and was in turn acquired by HP in 2002). Elon
Musk moved on to co-found PayPal, an online payment processor. When eBay acquired
PayPal for $1.5 billion in 2002, Elon Musk had the financial resources to pursue his
passion to use science and engineering to solve social and economic challenges. He is
leading three new ventures simultaneously: electric cars with Tesla Motors (featured in
ChapterCase 3), renewable energy with SolarCity, and space exploration with SpaceX.
Strategic entrepreneurship describes the pursuit of innovation using tools and concepts
from strategic management. 20 We can leverage innovation for competitive advantage by apply-
ing a strategic management lens to entrepreneurship. The fundamental question of strategic
entrepreneurship, therefore, is how to combine entrepreneurial actions, creating new opportuni-
ties or exploiting existing ones with strategic actions taken in the pursuit of competitive advan-
tage. 21 This can take place within new ventures such as Tesla Motors or within established
firms such as Samsung. Samsung’s continued innovation in mobile devices is an example of
strategic entrepreneurship: Samsung’s managers use strategic analysis, formulation, and imple-
mentation when deciding which new type of mobile device to research and develop, when to
launch it, and how to implement the necessary organizational changes to support the new prod-
uct launch. Each new release is an innovation; each is therefore an act of entrepreneurship—
planned and executed using strategic management concepts. This approach allowed Samsung
to take the lead in smartphones from Apple in terms of worldwide units sold. 22
Social entrepreneurship describes the pursuit of social goals by using entrepreneur-
ship. Social entrepreneurs evaluate the performance of their ventures not only by finan-
cial metrics but also by ecological and social contribution. They use a triple-bottom-line
approach to assess performance (as discussed in Chapter 5). Examples of social entre-
preneurship ventures include Teach For America (whose vision, mission, and values we
discussed in Chapter 2), TOMS Shoes (which gives a pair of shoes to an economically dis-
advantaged child for every pair of shoes it sells), BetterWorldBooks (an online bookstore
that “harnesses the power of capitalism to bring literacy and opportunity to people around
the world”), 23 and Wikipedia (discussed in the Chapter Case ).
strategic
entrepreneurship The pursuit of innovation using tools and concepts from strategic management.
social entrepreneurship
The pursuit of social goals by using entrepreneurship.
WWW.YAZDANPRESS.COMWWW.YAZDANPRESS.COM

206 CHAPTER 7 Business Strategy: Innovation and Entrepreneurship
The founder of Wikipedia, Jimmy Wales, is a social entrepreneur. 24 Raised in Alabama,
Wales was educated by his mother and grandmother who ran a nontraditional school. In
1994, he dropped out of a doctoral program in economics at Indiana University to take
a job at a stock brokerage firm in Chicago. In the evenings he wrote computer code for
fun and built a web browser. During the late 1990s Internet boom, Wales was one of the
first to grasp the power of an open-source method to provide knowledge on a very large
scale. What differentiates Jimmy Wales from other web entrepreneurs is his idealism:
Wikipedia is free for the end user and supports itself solely by donations (and not, for
example, by online advertising). Jimmy Wales’ idealism is a form of social entrepreneur-
ship: His vision is to make the entire repository of human knowledge available to anyone,
anywhere for free.
Since entrepreneurs and the innovations they unleash frequently create entire new
industries, we now turn to a discussion of the industry life cycle to derive implications for
competitive strategy.
7.3 Innovation and the Industry Life Cycle
Innovations frequently lead to the birth of new industries. Innovative advances in IT and
logistics facilitated the creation of the overnight express delivery industry by FedEx and
that of big-box retailing by Walmart. The Internet set online retailing in motion, with new
companies such as Amazon and eBay taking the lead, and revolutionized the advertising
industry through Google and Facebook. Advances in nanotechnology are revolutionizing
many different industries, ranging from medical diagnostics and surgery to lighter and
stronger airplane components. 25
Industries tend to follow a predictable industry life cycle : As an industry evolves over
time, we can identify five distinct stages: introduction, growth, shakeout, maturity, and
decline. 26 We illustrate how the type of innovation changes at each stage of the life cycle as
well as how innovation can initiate and drive a new life cycle.
The number and size of competitors change as the industry life cycle unfolds, and dif-
ferent types of consumers enter the market at each stage. That is, both the supply and
demand sides of the market change as the industry ages. Each stage of the industry life
cycle requires different competencies for the firm to perform well and to satisfy that stage’s
unique customer group. We first introduce the life cycle model before discussing different
customer groups in more depth when introducing the crossing-the-chasm concept later in
this chapter. 27
Exhibit 7.4 depicts a typical industry life cycle, focusing on the smartphone industry in
emerging and developed economies. In a stylized industry life cycle model, the horizontal
axis shows time (in years) and the vertical axis market size. In Exhibit 7.4 , however, we are
taking a snapshot of the global smartphone industry in the year 2014. This implies that we
are joining two different life cycles (one for emerging economies and one for developed
economies) in the same exhibit at one point in time.
The development of most industries follows an S-curve. Initial demand for a new prod-
uct or service is often slow to take off, then accelerates, before decelerating, and eventually
turning to zero, and even becoming negative as a market contracts.
As shown in Exhibit 7.4 , in emerging economies such as Argentina, Brazil, China,
India, Indonesia, Mexico, and Russia, the smartphone industry is in the growth stage (in
2014). The market for smartphones in these countries is expected to grow rapidly over the
next few years. More and more of the consumers in these countries with very large popu-
lations are expected to upgrade from a simple mobile phone to a smartphone such as the
iPhone or Galaxy.
LO7-3
Describe the competitive implications of different stages in the industry life cycle.
industry life cycle
The five different stages—introduction, growth, shakeout, maturity, and decline—that occur in the evolution of an industry over time.
WWW.YAZDANPRESS.COMWWW.YAZDANPRESS.COM

CHAPTER 7 Business Strategy: Innovation and Entrepreneurship 207
In contrast, the market for smartphones is in the maturity stage (in 2014) in developed
economies such as Australia, Canada, Germany, Japan, South Korea, the United Kingdom,
and the United States. This implies that developed economies moved through the prior
three stages of the industry life cycle (introductory, growth, and shakeout) some years
earlier. Because the smartphone industry is mature in these markets, little or no growth in
market size is expected over the next few years because most consumers own smartphones.
This implies that any market share gain by one firm comes at the expense of others. Com-
petitive intensity is expected to be high.
Each stage of the industry life cycle—introduction, growth, shakeout, maturity, and
decline—has different strategic implications for competing firms. We now discuss each
stage in detail.
INTRODUCTION STAGE
When an individual inventor or company launches a successful innovation, a new industry
may emerge. In this introductory stage, the innovator’s core competency is R&D, which is
necessary to creating a new product category that will attract customers. This is a capital-
intensive process, in which the innovator is investing in designing a unique product, trying
new ideas to attract customers, and producing small quantities—all of which contribute
to a high price when the product is launched. The initial market size is very small, and
growth is slow.
In this introductory stage, when barriers to entry tend to be high, generally only a few
firms are active in the market. In their competitive struggle for market share, they empha-
size unique product features and performance rather than price.
Although there are some benefits to being early in the market (as previously discussed),
innovators also may encounter some first-mover disadvantages. They must educate
potential customers about the product’s intended benefits, find distribution channels and
EXHIBIT 7.4 /
Industry Life Cycle: The Smartphone Industry in Emerging and Developed Economies M
arke
t Siz
e
MaturityGrowthIntroduction DeclineShakeout
Smartphones–Emerging
Economiesin 2014
Smartphones–DevelopedEconomies
in 2014
Time
WWW.YAZDANPRESS.COMWWW.YAZDANPRESS.COM

208 CHAPTER 7 Business Strategy: Innovation and Entrepreneurship
complementary assets, and continue to perfect the fledgling product. Although a core com-
petency in R&D is necessary to create or enter an industry in the introductory stage, some
competency in marketing also is helpful in achieving a successful product launch and mar-
ket acceptance. Competition can be intense, and early winners are well-positioned to stake
out a strong position for the future. As one of the main innovators in software for mobile
devices, Google’s Android operating system for smartphones is enjoying a strong market
position and substantial lead over competitors.
The strategic objective during the introductory stage is to achieve market acceptance
and seed future growth. One way to accomplish these objectives is to initiate and leverage
network effects , 28 the positive effect that one user of a product or service has on the value
of that product for other users. Network effects occur when the value of a product or ser-
vice increases, often exponentially, with the number of users. If successful, network effects
propel the industry to the next stage of the life cycle, the growth stage (which we discuss
next). Strategy Highlight 7.1 describes how Apple leveraged the network effects generated
by numerous complementary software applications (apps) to achieve a strong position in
the smartphone industry.
network effects The positive effect (externality) that one user of a product or service has on the value of that product for other users.
Apple Leverages Network Effects
to Propel Growth
Apple launched its enormously successful iPhone in the summer of 2007. A year later, it followed up with the Apple App Store, which boasts that, for almost any-thing you might need, “there’s an app for that.” Apps are small software programs developed to provide mobile users with inexpensive business and personal services wherever they may be. Popular apps allow iPhone users to access their business contacts via LinkedIn, call col-leagues overseas via Skype, check delivery of their Zappos packages shipped via UPS, get the latest news on Twitter, and engage in customer relationship management using Salesforce.com . You can stream music via Pandora, watch YouTube videos, access Facebook to check on your friends, post the latest photos using Instagram, or pin the latest fads about home décor on Pinterest.
Even more important is the effect that apps have on the value of an iPhone. Arguably, the explosive growth of the iPhone is due to the fact that the Apple App Store offers the largest selection of apps to its users. Almost 1 million apps were downloaded 50 billion times as of spring 2013. Moreover, Apple argues that users have a better experi-ence because the apps take advantage of the tight integra-tion of hardware and software provided by the iPhone. The availability of apps, in turn, leads to network effects that
increase the value of the iPhone for its users. Exhibit 7.5 shows how. Increased value creation, as we know from Chapter 6, is positively related to demand, which in turn increases the installed base, meaning the number of people using an iPhone. This in turn incentivizes soft-ware developers to write more apps. Making apps widely available strengthened Apple’s position in the smartphone industry. Based on positive feedback loops, a virtuous cycle emerges where one factor positively reinforces another. 29
7.1
Apple iPhoneInstalled Base
Value of iPhone
Demand foriPhone
iPhoneApps
(1)
(1) (1)
(1)
EXHIBIT 7.5 / Leveraging Network Effects to Drive Demand: Apple’s iPhone
WWW.YAZDANPRESS.COMWWW.YAZDANPRESS.COM

CHAPTER 7 Business Strategy: Innovation and Entrepreneurship 209
GROWTH STAGE
Market growth accelerates in the growth stage of the industry life cycle (see Exhibit 7.4 ).
After the initial innovation has gained some market acceptance, demand increases rapidly
as first-time buyers rush to enter the market, convinced by the proof-of-concept demon-
strated in the introductory stage.
As the size of the market expands, a standard signals the market’s agreement on a
common set of engineering features and design choices. 30 Standards can emerge bottom-
up through competition in the marketplace, or be imposed top-down by government or
other standard-setting agencies such as the Institute of Electrical and Electronics Engineers
(IEEE) that develops and sets industrial standards in a broad range of industries, including
energy, electric power, biomedical and health care technology, IT, telecommunications,
consumer electronics, aerospace, and nanotechnology.
An agreed-upon standard, such as the IBM PC, ensures that all components of the
system work well together, regardless of who developed them. It also helps legitimize
the new technology by reducing uncertainty and confusion. A standard tends to capture a
larger market share and can persist for a long time. The Wintel standard (a portmanteau of
Windows and Intel) marked the beginning of exponential growth in the personal computer
industry; it still holds some 90 percent of market share.
An example of a recent standards war that was fought in the marketplace is high-
definition format Blu-ray versus the HD-DVD format. Blu-ray, backed by an association
of electronics companies including Sony, Panasonic, Philips, LG, Hitachi, and Samsung,
bested the HD-DVD format backed by Toshiba. Some argue that Sony’s PlayStation 3 acted
as a catalyst for adopting the Blu-ray format. A tipping point in favor of the Blu-ray format
was reached when Warner Bros. decided to release discs only in Blu-ray format beginning
in the summer of 2008. Within weeks, leading retailers such as Walmart, Best Buy, and the
now-defunct Circuit City began carrying DVDs in Blu-ray format and did not stock as large
a selection in the HD-DVD format; Netflix and Blockbuster began renting Blu-ray DVDs
predominantly. As a consequence, thousands of titles are now available on high-definition
Blu-ray discs, while production has ceased on HD-DVDs. The competitive implications are
tremendous: Industry agreement on the format has opened a new market for both Blu-ray
disc players and titles. Barriers to entry fell as technological uncertainties were overcome,
and many new and established firms rushed to participate in the growth opportunity.
Government bodies or industry associations can also set standards by making top-down
decisions. The European Union determined in the 1980s that GSM (Global System for
Mobile Communications) should be the standard for cell phones in Europe. The United
States relied instead on a market-based approach, and CDMA (code division multiple
access), a proprietary standard developed by Qualcomm, emerged as an early leader.
While North American manufacturers and service providers such as AT&T, Verizon,
Motorola, and others were fighting a format war, Scandinavian companies such as Nokia
and Ericsson faced no such uncertainty, and they leveraged their early lead into market
dominance. Today, about 80 percent of the global mobile market uses the GSM standard.
Since demand is strong during the growth phase, both efficient and inefficient firms
thrive; the rising tide lifts all boats. Moreover, prices begin to fall, often rapidly, as standard
business processes are put in place and firms begin to reap economies of scale and learning.
Distribution channels are expanded, and complementary assets become widely available. 31
After a standard is established in an industry, the basis of competition tends to move
away from product innovations toward process innovations. 32 Product innovations , as
the name suggests, are new or recombined knowledge embodied in new products—the jet
airplane, electric vehicle, MP3 player, smartphones, and tablet computers. On the other
standard An agreed-upon solution about a common set of engineering features and design choices.
product innovations
New or recombined knowledge embodied in new products.
WWW.YAZDANPRESS.COMWWW.YAZDANPRESS.COM

210 CHAPTER 7 Business Strategy: Innovation and Entrepreneurship
hand, process innovations are new ways to produce existing products or to deliver exist-
ing services. Process innovations are made possible through advances such as the Internet,
lean manufacturing, Six Sigma, biotechnology, nanotechnology, and so on.
Process innovation must not be high-tech to be impactful, however. The invention of
the standardized shipping container, for instance, has transformed global trade. 33 By load-
ing goods into uniform containers that could easily be moved between trucks, rail, and
ships, significant savings in cost and time were accomplished. Before containerization was
invented some 60 years ago, it cost almost $6 to load a ton of (loose) cargo, and theft
was rampant. After containerization, the cost for loading a ton of cargo had plummeted to
$0.16 and theft all but disappeared (because containers are sealed at the departing factory).
Efficiency gains in terms of labor and time were even more impressive. Before contain-
erization, dock labor could move 1.7 tons per hour onto a cargo ship. After containeriza-
tion, this had jumped to 30 tons per hour. Ports are now able to accommodate much larger
ships, and travel time across the oceans has fallen in half. As a consequence, costs for
shipping goods (such as cars) across the globe have fallen rapidly. Moreover, containeriza-
tion enabled optimization of global supply chains and set the stage for subsequent process
innovations such as just-in-time (JIT) operations management. Taken together, a set of
research studies estimated that containerization alone more than tripled international trade
within five years of adopting this critical process innovation. 34
Exhibit 7.6 shows the level of product and process innovation throughout the entire life
cycle. 35 In the introductory stage, the level of product innovation is at a maximum because
new features increasing perceived consumer value are critical to gaining traction in the mar-
ket. In contrast, process innovation is at a minimum in the introductory stage because com-
panies only produce a small number of products, often just prototypes or beta versions. The
main concern is to commercialize the invention—that is, to demonstrate that the product
works and that a market exists.
The relative importance, however, reverses over time. Frequently, a standard emerges
during the growth stage of the industry life cycle (indicated by the dashed line in
Exhibit 7.6 ). At that point, most of the technological and commercial uncertainties about
the new product are gone. After the market accepts a product innovation, and a standard
for the new technology has emerged, process
innovation rapidly becomes more important
than product innovation. As market demand
increases, economies of scale kick in: Firms
establish and optimize standard business
processes through applications of lean man-
ufacturing, Six Sigma, and so on. As a con-
sequence, product improvements become
incremental, while the level of process innova-
tion rises rapidly.
The core competencies for competitive
advantage in the growth stage tend to shift
toward manufacturing and marketing capa-
bilities, with an R&D emphasis on process
innovation in order to improve efficiency.
Competitive rivalry is muted because the
market is growing fast. Since market demand
is robust in this stage and more competitors
have entered the market, there tends to be
more strategic variety: Some competitors will
process innovations
New ways to produce existing products or deliver existing services.
Leve
l of I
nnov
atio
n
Time
Industry Standard
Process Innovation
Product Innovation
Product Innovation
Process Innovation
EXHIBIT 7.6 / Product and Process Innovation and the Emergence of an Industry Standard Throughout an Industry Life Cycle
WWW.YAZDANPRESS.COMWWW.YAZDANPRESS.COM

CHAPTER 7 Business Strategy: Innovation and Entrepreneurship 211
continue to follow a differentiation strategy, emphasizing unique features, product func-
tionality, and reliability. Other firms employ a cost-leadership strategy in order to offer
an acceptable level of value but lower prices to consumers. They realize that lower cost is
likely a key success factor in the future, because this will allow the firm to lower prices
and attract more consumers into the market. When introduced in the spring of 2010, for
example, Apple’s first-generation iPad was priced at $829 for 64GB with a 3G Wi-Fi con-
nection. 36 Just three years later, in spring 2013, the same model was priced at only one-
third of the original price, or $275. 37 Access to efficient and large-scale manufacturing
operations (such as those offered by Foxconn in China, the company that assembles most
of Apple’s products) and effective supply-chain capabilities are key success factors when
market demand increases rapidly.
The key objective for firms during the growth phase is to stake out a strong strategic
position not easily imitated by rivals. In the fast-growing shapewear industry, startup com-
pany Spanx has staked out a strong position. In 1998, Florida State University graduate
Sara Blakely decided to cut the feet off her pantyhose to enhance her looks when wear-
ing pants. 38 Soon after she obtained a patent for her bodyshap-
ing undergarments, and Spanx began production and retailing of
its shapewear in 2000. Sales grew exponentially after Blakely
appeared on The Oprah Winfrey Show. By 2010, Spanx had grown
to 100 employees and sold millions of Spanx “power panties,”
with revenues exceeding $1 billion. To stake out a strong position
and to preempt competitors, Spanx now offers over 200 products
ranging from slimming apparel and swimsuits to bras and active-
wear. Moreover, it now designs and manufactures body-shaping
undergarments for men (“Spanx for Men – MANX”). Spanx
products are now available in over 50 countries globally via the
Internet. Moreover, to strengthen its strategic position and brand
image in the United States, Spanx is opening retail stores across
the country.
The shapewear industry’s explosive growth has attracted sev-
eral other players: Flexees by Maidenform, Body Wrap, and
Miraclesuit, to name a few. They are all attempting to carve out
positions in the new industry. Given Spanx’s ability to stake out a
strong position during the growth stage of the industry life cycle
and the fact that it continues to be a moving target, it might be dif-
ficult for competitors to dislodge the company.
Also, taking risk as an entrepreneur paid off for Spanx’s
founder Sara Blakely: After investing an initial $5,000 into her
startup, she became the world’s youngest self-made female bil-
lionaire. In 2012, Sara Blakely was also listed in the Time 100, the
annual list of the most influential people in the world.
SHAKEOUT STAGE
Rapid industry growth and expansion cannot go on indefinitely. As the industry moves
into the next stage of the industry life cycle, the rate of growth declines (see Exhibit 7.4 ).
Demand was largely satisfied in the prior growth stage. Given the large market size
achieved from the growth stage, any additional market demand in the next stage is lim-
ited. Demand now consists of replacement or repeat purchases only. This limited mar-
ket demand in turn increases competitive intensity within the industry. Firms begin to
WWW.YAZDANPRESS.COMWWW.YAZDANPRESS.COM

212 CHAPTER 7 Business Strategy: Innovation and Entrepreneurship
compete directly against one another for market share, rather than trying to capture a
share of an increasing pie. As rivals vie for a shrinking pie and competitive intensity is
increasing, the weaker firms are forced out of the industry. This is the reason why this
phase of the industry life cycle is called the shakeout stage: Only the strongest competi-
tors survive increasing rivalry as firms begin to cut prices and offer more services, all in
an attempt to capture more of a shrinking market. This type of cut-throat competition
erodes profitability of all but the most efficient firms in the industry. As a consequence,
the industry often consolidates, as the weakest competitors either are acquired by stron-
ger firms or exit through bankruptcy.
The winners in this increasingly competitive environment are generally firms that
stake out a strong position as cost leaders. Key success factors at this stage are the manu-
facturing and process engineering capabilities that can be used to drive costs down. As
discussed earlier, following the emergence of a standard during the growth stage, the
importance of process innovation increases rapidly and the importance of product inno-
vation diminishes quickly.
Assuming an acceptable value proposition, price is the dominant competitive weapon
in the mature stage; product features and performance requirements are now well estab-
lished. A few firms may be able to implement an integration strategy, combining differen-
tiation and low cost, but given the intensity of competition, many weaker firms are forced
to exit. Any firm that does not have a clear strategic profile is likely to not survive the
shakeout phase.
MATURITY STAGE
Generally, the larger firms enjoying economies of scale are the ones that survived the
shakeout phase as the industry consolidated and most excess capacity was removed. After
the shakeout is completed and a few firms remain, the industry enters the maturity stage.
During the fourth stage of the industry life cycle, the industry structure morphs into an oli-
gopoly with only a few large firms. The market has reached its maximum size, and indus-
try demand is likely to be zero or even negative going forward. As shown in Exhibit 7.4 ,
the smartphone industry in the U.S. and other developed economies is just entering the
maturity stage. Competitive intensity is likely to increase going forward.
The domestic airline industry has been in the maturity stage for a long time. The large
number of bankruptcies, as well as the wave of mega-mergers such as those of Delta and
Northwest, United and Continental, and American Airlines and US Airways are a con-
sequence of low or zero growth in a mature market characterized by significant excess
capacity.
DECLINE STAGE
Changes in the external environment (such as those discussed in Chapter 3 when present-
ing the PESTEL framework) often take industries from maturity to decline. In this final
stage of the industry life cycle, the size of the market contracts as demand falls.
At the end of a life cycle, the level of process innovation reaches its maximum as
firms attempt to lower cost as much as possible, while the level of incremental product
innovation reaches its minimum, as Exhibit 7.6 shows. If an innovation emerges that
opens up a new industry, then this dynamic interplay between product and process inno-
vation starts anew.
If there is any remaining excess industry capacity in the decline stage, this puts strong
pressure on prices and can further increase competitive intensity, especially if the industry
WWW.YAZDANPRESS.COMWWW.YAZDANPRESS.COM

CHAPTER 7 Business Strategy: Innovation and Entrepreneurship 213
has high exit barriers. At this stage, managers generally have four strategic options: exit, harvest, maintain, or consolidate: 39
■ Some firms are forced to exit the industry by bankruptcy or liquidation. The U.S. tex-
tile industry has experienced a large number of exits over the last few decades, mainly
due to low-cost foreign competition.
■ In pursuing a harvest strategy, the firm reduces investments in product support and
allocates only a minimum of human and other resources. While several companies
such as IBM, Brother, Olivetti, and Nakajima still offer typewriters, they don’t invest
much in future innovation. Instead, they are maximizing cash flow from their existing
typewriter product line.
■ Philip Morris, on the other hand, is following a maintain strategy with its Marlboro
brand, continuing to support marketing efforts at a given level despite the fact that U.S.
cigarette consumption has been declining.
■ Although market size shrinks in a declining industry, some firms may choose to con-solidate the industry by buying rivals (those who choose to exit). This allows the con-
solidating firm to stake out a strong position—possibly approaching monopolistic
market power, albeit in a declining industry.
Although chewing tobacco is a declining industry, the Swedish Match company has
pursued a number of acquisitions to consolidate its strategic position in the industry. It
acquired, among other firms, the Pinkerton Tobacco company of Owensboro, Kentucky,
maker of the Red Man brand. Red Man is the leading chewing tobacco brand in the United
States. Red Man has carved out a strong strategic position built on a superior reputation for
a quality product and by past endorsements of major league baseball players since 1904.
Despite a federally mandated prohibition on marketing and gory product warnings detail-
ing the health risk of chewing tobacco, the Red Man brand has remained not only popular,
but also profitable.
CROSSING THE CHASM
The industry life cycle model assumes a more or less smooth transition from one stage to
another. This holds true for most continuous innovations that require little or no change in
consumer behavior.
In the influential bestseller Crossing the Chasm 40 Geoffrey Moore documented that
many innovators, however, were unable to successfully transition from one stage of the
industry life cycle to the next. Based on empirical observations, Moore’s core argument is
that each stage of the industry life cycle is dominated by a different customer group. Differ-
ent customer groups with distinctly different preferences enter the industry at each stage of
the industry life cycle. Each customer group responds differently to a technological inno-
vation. This is due to differences in the psychological, demographic, and social attributes
observed in each unique customer segment. Moore’s main contribution is that the significant
differences between the customer groups that enter early during the introductory stage of the
industry life cycle versus customers that enter later during the growth stage make a firm’s
smooth transition between the different parts of the industry life cycle difficult. That is,
these distinct differences between customer groups lead to a big gulf or chasm into which
companies and their innovations frequently fall. Only companies that recognize these differ-
ences and are able to apply the appropriate competencies at each stage of the industry life
cycle will have a chance to transition successfully from stage to stage.
Exhibit 7.7 shows the chasm framework and the different customer segments. The indus-
try life cycle model (shown in Exhibit 7.4 ) follows an S-curve leading up to 100 percent
LO7-4
Derive strategic implications of the crossing-the-chasm framework.
WWW.YAZDANPRESS.COMWWW.YAZDANPRESS.COM

214 CHAPTER 7 Business Strategy: Innovation and Entrepreneurship
total market potential that can be reached during the maturity stage. In contrast, the chasm
framework, breaks down the 100 percent market potential into different customer seg-
ments, highlighting the incremental contribution each specific segment can bring into the
market. This results in the familiar Bell curve. Note the big gulf, or chasm, separating
the early adopters from the early and late majority that make up the mass market. Each
stage customer segment is also separated by smaller chasms. Both the large competitive
chasm and the smaller ones have strategic implications, which we’ll discuss next.
Both new technology ventures and innovations introduced by established firms have a
high failure rate. This can be explained as a failure to successfully cross the chasm from
the early users to the mass market because the firm does not recognize that the business
strategy needs to be fine-tuned for each customer segment. Formulating a business strat-
egy for each segment guided by the “ who-what-why-and-how ” questions of competition
(Who to serve? What needs to satisfy? Why and how to satisfy them?), first introduced
in Chapter 6, the firm will find that the core competencies to satisfy each of the different
customer segments are quite different. If not recognized and addressed, this will lead to the
demise of the innovation as it crashes into the chasm between life cycle stages.
We first introduce each customer group and map it to the respective stage of the indus-
try life cycle. To illustrate, we then apply the chasm framework to a historical analysis of
the smartphone industry.
TECHNOLOGY ENTHUSIASTS. The customer segment in the introductory stage of the
industry life cycle is called technology enthusiasts. 41 This is the smallest market segment,
and makes up no more than 2.5 percent of the total market potential. Technology enthusi-
asts often have an engineering mindset and pursue new technology proactively. They fre-
quently seek out new products before the products are officially introduced into the market.
Technology enthusiasts enjoy using beta versions of products, tinkering with the product’s
imperfections and providing (free) feedback and suggestions to companies. For example,
many software companies such as Google and Microsoft launch beta versions to accumu-
late customer feedback to work out bugs prior to the official launch. Moreover, technology
enthusiasts are often willing to pay a premium price to have the latest gadget. The endorse-
ment by technology enthusiasts validates the fact that the new product does in fact work.
A recent example of an innovation that appeals to technology enthusiasts is Google
Glass, a mobile computer that is worn like a pair of regular glasses. Instead of a lens,
however, one side displays a small, high-definition computer screen. Google Glass allows
EXHIBIT 7.7 /
The Crossing-the-Chasm Framework SOURCE: Adapted from G. A. Moore (1991), Crossing the Chasm: Marketing and Selling Disruptive Products to Mainstream Customers (New York: HarperCollins), p. 17.
Technology
Enthusiasts
2.5%
Late
Majority
34%
Early
Majority
34%
Early
Adopters
13.5%
Laggards
16%
THE CHASM
WWW.YAZDANPRESS.COMWWW.YAZDANPRESS.COM
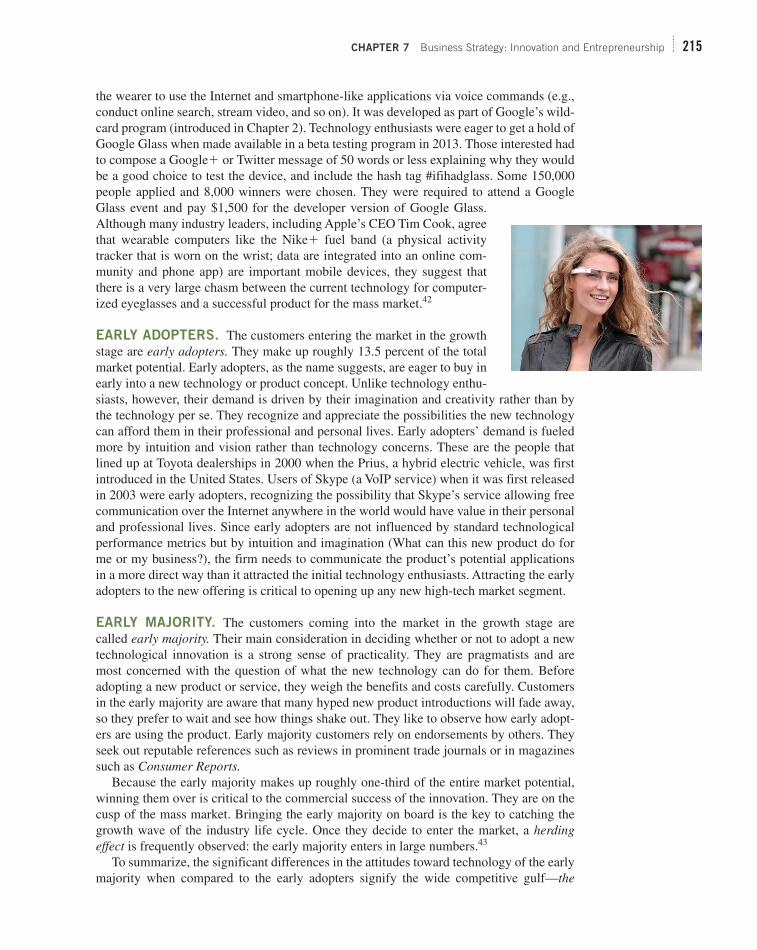
CHAPTER 7 Business Strategy: Innovation and Entrepreneurship 215
the wearer to use the Internet and smartphone-like applications via voice commands (e.g.,
conduct online search, stream video, and so on). It was developed as part of Google’s wild-
card program (introduced in Chapter 2). Technology enthusiasts were eager to get a hold of
Google Glass when made available in a beta testing program in 2013. Those interested had
to compose a Google 1 or Twitter message of 50 words or less explaining why they would
be a good choice to test the device, and include the hash tag #ifihadglass. Some 150,000
people applied and 8,000 winners were chosen. They were required to attend a Google
Glass event and pay $1,500 for the developer version of Google Glass.
Although many industry leaders, including Apple’s CEO Tim Cook, agree
that wearable computers like the Nike 1 fuel band (a physical activity
tracker that is worn on the wrist; data are integrated into an online com-
munity and phone app) are important mobile devices, they suggest that
there is a very large chasm between the current technology for computer-
ized eyeglasses and a successful product for the mass market. 42
EARLY ADOPTERS. The customers entering the market in the growth
stage are early adopters. They make up roughly 13.5 percent of the total
market potential. Early adopters, as the name suggests, are eager to buy in
early into a new technology or product concept. Unlike technology enthu-
siasts, however, their demand is driven by their imagination and creativity rather than by
the technology per se. They recognize and appreciate the possibilities the new technology
can afford them in their professional and personal lives. Early adopters’ demand is fueled
more by intuition and vision rather than technology concerns. These are the people that
lined up at Toyota dealerships in 2000 when the Prius, a hybrid electric vehicle, was first
introduced in the United States. Users of Skype (a VoIP service) when it was first released
in 2003 were early adopters, recognizing the possibility that Skype’s service allowing free
communication over the Internet anywhere in the world would have value in their personal
and professional lives. Since early adopters are not influenced by standard technological
performance metrics but by intuition and imagination (What can this new product do for
me or my business?), the firm needs to communicate the product’s potential applications
in a more direct way than it attracted the initial technology enthusiasts. Attracting the early
adopters to the new offering is critical to opening up any new high-tech market segment.
EARLY MAJORITY. The customers coming into the market in the growth stage are
called early majority. Their main consideration in deciding whether or not to adopt a new
technological innovation is a strong sense of practicality. They are pragmatists and are
most concerned with the question of what the new technology can do for them. Before
adopting a new product or service, they weigh the benefits and costs carefully. Customers
in the early majority are aware that many hyped new product introductions will fade away,
so they prefer to wait and see how things shake out. They like to observe how early adopt-
ers are using the product. Early majority customers rely on endorsements by others. They
seek out reputable references such as reviews in prominent trade journals or in magazines
such as Consumer Reports. Because the early majority makes up roughly one-third of the entire market potential,
winning them over is critical to the commercial success of the innovation. They are on the
cusp of the mass market. Bringing the early majority on board is the key to catching the
growth wave of the industry life cycle. Once they decide to enter the market, a herding effect is frequently observed: the early majority enters in large numbers. 43
To summarize, the significant differences in the attitudes toward technology of the early
majority when compared to the early adopters signify the wide competitive gulf— the
WWW.YAZDANPRESS.COMWWW.YAZDANPRESS.COM

216 CHAPTER 7 Business Strategy: Innovation and Entrepreneurship
chasm— between these two consumer segments (see Exhibit 7.7 ). Without adequate demand
from the early majority, most innovative products wither away.
Fisker Automotive, a California-based designer and manufacturer of premium plug-in
hybrid vehicles, fell into the chasm because it was unable to transition to the mass market.
Between its founding in 2007 and 2012, Fisker sold some 1,800 vehicles of its Karma model,
a $100K sports car, to early adopters. It was unable, however, to follow up with a lower-cost
model to attract the early majority into the market. In addition, technology and reliability
issues for the Karma could not be overcome. By 2013, Fisker had crashed into a chasm. 44
In contrast, Tesla Motors, the maker of all-electric vehicles introduced in Chapter Case
3, and a fierce rival of Fisker at one point in time, was able to overcome the chasm by suc-
cessfully launching a mass-market car (the Model S, a family sedan). Critical to attracting
the early majority, Tesla’s Model S received a strong endorsement as the 2013 MotorTrend
Car of the Year and the highest test scores ever awarded by Consumer Reports. This made
the early majority feel more comfortable in considering and purchasing a Tesla vehicle.
LATE MAJORITY. The next wave of growth comes from buyers in the late majority
entering the market. Like the early majority, they are a large customer segment, making up
approximately 34 percent of the total market potential. Combined, the early adopters and
early majority make up the lion’s share of the market potential. Most industry growth and
firm profitability, therefore, are driven by demand coming from just two groups—early
and late majority.
Members of the early and late majority are also quite similar in their attitudes toward
new technology. The late majority shares all the concerns of the early majority. In addition,
there is one important difference. Although the early majority is confident in their ability to
master the new technology, the late majority is not. They prefer to wait until standards have
emerged and are firmly entrenched, so that uncertainty is much reduced. The late majority
also prefers to buy from well-established firms with a strong brand image rather than from
unknown new ventures.
LAGGARDS. Finally, laggards —customers who adopt a new product only if it is abso-
lutely necessary, such as first-time cell phone adopters in the U.S. today—are the last
consumer segment to come into the market. These customers generally don’t want new
technology, either for personal or economic reasons. Given their reluctance to adopt new
technology, they are generally not considered worth pursuing. Laggards make up no more
Tesla Motors CEO Elon Musk, left, in front of a Tesla Roadster; Fisker Auto-motive CEO Henrik Fisker, right, in front of a Fisker Karma.
WWW.YAZDANPRESS.COMWWW.YAZDANPRESS.COM

CHAPTER 7 Business Strategy: Innovation and Entrepreneurship 217
than 16 percent of the total market potential. They tend to enter the market after it is com-
pletely mature and frequently during the decline stage. Their demand is far too small to
compensate for reduced demand from the early and late majority (jointly almost 70 percent
of total market demand), who are moving on to different products and services.
CROSSING THE CHASM: APPLICATION TO THE SMARTPHONE INDUSTRY.
Let’s apply the crossing-the-chasm framework to one specific industry. Keep in mind that
in this model, the transition from stage to stage in the industry life cycle is characterized
by different competitive chasms that open up because of important differences between
customer groups. Although the large chasm between early adopters and the early majority
is the main cause of demise for technological innovations, other smaller mini-chasms open
up between each stage.
Exhibit 7.8 shows the application of the chasm model to the smartphone industry.
The first victim was Motorola’s Iridium, an ill-fated satellite-based telephone system. 45
Development began in 1992 after the spouse of a Motorola engineer complained that
they couldn’t get any data or voice access to check on clients while vacationing on a
remote island. Motorola’s solution was to launch 66 satellites into low orbit to provide
global voice and data coverage. In late 1998, Motorola began offering its satellite phone
service, charging $5,000 per handset (which was almost too heavy to carry around) and
up to $14 per minute for calls. 46 Problems in consumer adoption beyond the few tech-
nology enthusiasts became rapidly apparent. The Iridium phone could not be used inside
buildings or in cars. Rather, to receive a satellite signal, the phone needed an unob-
structed line of sight to a satellite. Iridium crashed into the first chasm, never moving
beyond technology enthusiasts. For Motorola, it was a billion-dollar business blunder.
Iridium was soon displaced by cell phones that relied on earth-based networks of radio
towers. The global satellite telephone industry never moved beyond the introductory
stage of the industry life cycle.
The first Treo, a fully functioning smartphone combining voice and data capabili-
ties, was released in 2002 by Handspring. The Treo fell into the main chasm that arises
between early adopters and the early majority (see Exhibit 7.8 ). Technical problems,
combined with a lack of apps and an overly rigid contract with Sprint as its sole service
provider, prevented the Treo from gaining traction in the market beyond early adopters.
Technology
Enthusiasts
2.5%
Iridium
Treo
BlackB
erry
Galaxy
iPhone
Late
Majority
34%
Early
Majority
34%
Early
Adopters
13.5%
Laggards
16%
EXHIBIT 7.8 /
Crossing the Chasm: The Smartphone Industry
WWW.YAZDANPRESS.COMWWW.YAZDANPRESS.COM

218 CHAPTER 7 Business Strategy: Innovation and Entrepreneurship
For these reasons, the Treo was not an attractive product for the early majority, who
rejected it. This caused the Treo to plunge into the chasm. Just a year later, Handspring
was folded into Palm, which in turn was acquired by HP for $1bn in 2010. 47 HP shut
down Palm in 2011 and wrote off the acquisition. 48
Research in Motion (RIM) 49 introduced its first fully functioning BlackBerry smart-
phone in 2000. It was a huge success—especially with two key consumer segments. First,
corporate IT managers were early adopters. They became product champions for the
BlackBerry because of its encrypted security software and its reliability in always staying
connected to a company’s network. This allowed users to receive e-mail and other data
in real time, anywhere in the world where wireless service was provided. Second, corpo-
rate executives were the early majority pulling the BlackBerry over the chasm because it
allowed 24/7 access to data and voice. RIM was able to create a beachhead to cross the
chasm between the technology enthusiasts and early adopters on one side and the early
majority on the other. 50 RIM’s managers were able to identify the needs of not only early
adopters (e.g., IT managers) but also the early majority (e.g., executives), who pulled the
BlackBerry over the chasm. By 2005, the BlackBerry had become a corporate executive
status symbol. As a consequence of capturing the first three stages of the industry life
cycle, between 2002 and 2007, RIM enjoyed no less than 30 percent year-over-year rev-
enue growth as well as double-digit growth in other financial performance metrics such as
return on equity. RIM enjoyed a temporary competitive advantage.
In 2007, RIM’s dominance over the smartphone market began to erode quickly. The
main reason was Apple’s introduction of the iPhone. Although technology enthusiasts and
early adopters argue that the iPhone is an inferior product to the BlackBerry based on tech-
nological criteria, the iPhone enticed not only the early majority, but also the late major-
ity to enter the market. For the late majority, encrypted software security was much less
important than having fun with a device that allowed users to surf the web, take pictures,
play games, and send and receive e-mail. Moreover, the Apple iTunes Store soon provided
thousands of apps for basically any kind of service. While the BlackBerry couldn’t cross
the gulf between the early and the late majority, Apple’s iPhone captured the mass market
rapidly. Moreover, consumers began to bring their personal iPhone to work, which forced
corporate IT departments to open up their services beyond the BlackBerry. Apple rode the
wave of this success to capture each market segment. Likewise, Samsung with its Galaxy
line of phones is enjoying a similar success across the different market segments.
This brief application of the chasm framework to the smartphone industry shows its
usefulness. It provides insightful explanations of why some companies failed, while others
succeeded—and thus goes at the core of strategy management.
In summary, Exhibit 7.9 details the features and strategic implications of the entire
industry life cycle at each stage.
A word of caution is in order, however: Although the industry life cycle is a useful
framework to guide strategic choice, industries do not necessarily evolve through these
stages. Moreover, innovations can emerge at any stage of the industry life cycle, which in
turn can initiate a new cycle. Industries can also be rejuvenated, often in the declining stage.
Although the motorcycle industry in the United States had been declining for a long time,
Harley Davidson was able to rejuvenate the industry with new designs and an extended
lineup of bikes, greater reliability, and a more efficient and professional dealer network.
Although the industry life cycle is a useful tool, it does not explain everything about
changes in industries. Some industries may never go through the entire life cycle, while
others are continually renewed through innovation. Be aware, too, that other factors such
as fads in fashion, changes in demographics, or deregulation can affect the dynamics of
industry life cycles.
WWW.YAZDANPRESS.COMWWW.YAZDANPRESS.COM

CHAPTER 7 Business Strategy: Innovation and Entrepreneurship 219
7.4 Types of Innovation
Because of the importance of innovation to industry life cycles and as a critical component
in formulating business strategy, we now turn to a discussion of different types of innova-
tion and the strategic implications of each. We need to know, in particular, along which
dimensions we should assess innovations. This will allow us to formulate a business strat-
egy that can leverage innovation for competitive advantage.
One insightful way to categorize innovations is to measure their degree of newness in
terms of technology and markets. 51 Here, technology refers to the methods and materials
used to achieve a commercial objective. 52 For example, Amazon integrates different types
of technologies (hardware, software, microprocessors, the Internet, logistics, and so on) to
LO7-5
Categorize different types of innovations in the markets-and-technology framework.
EXHIBIT 7.9 / Features and Strategic Implications of the Industry Life Cycle
Life Cycle Stages
Introduction Growth Shakeout Maturity Decline
Core
Competency
R&D, some marketing
R&D, some manufacturing, marketing
Manufacturing, process engineering
Manufacturing, process engineering, marketing
Manufacturing, process engineering, marketing, service
Type and Level
of Innovation
Product innovation at a maximum; process innovation at a minimum
Product innovation decreasing; process innovation increasing
After emergence of standard: product innovation decreasing rapidly; process innovation increasing rapidly
Product innovation low; process innovation high
Product innovation at a minimum; process innovation at a maximum
Market Growth Slow High Moderate and slowing down
None to moderate Negative
Market Size Small Moderate Large Largest Small to moderate
Price High Falling Moderate Low Low to high
Number of
Competitors
Few, if any Many Fewer Moderate, but large
Few, if any
Mode of
Competition
Non-price competition
Non-price competition
Shifting from non-price to price competition
Price Price or non-price competition
Type of Buyers Technology enthusiasts
Early adopters Early majority Late majority Laggards
Business-Level
Strategy
Differentiation Differentiation Differentiation, or integration strategy
Cost-leadership or integration strategy
Cost-leadership, differentiation, or integration strategy
Strategic
Objective
Achieving market acceptance
Staking out a strong strategic position; generating “deep pockets”
Surviving by drawing on “deep pockets”
Maintaining strong strategic position
Exit, harvest, maintain, or consolidate
WWW.YAZDANPRESS.COMWWW.YAZDANPRESS.COM
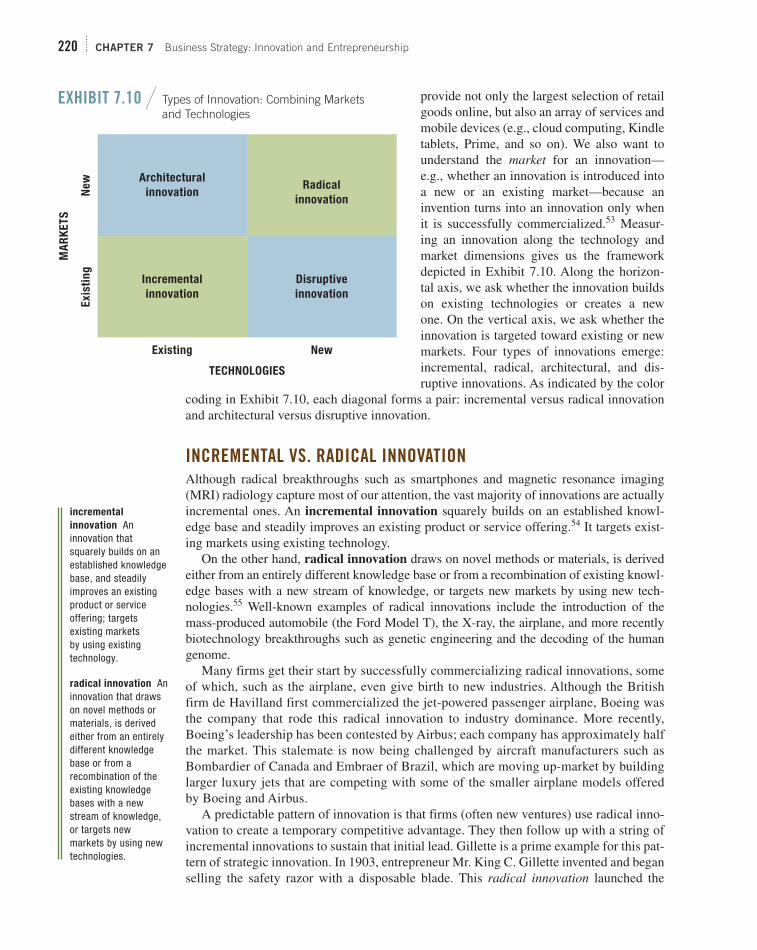
220 CHAPTER 7 Business Strategy: Innovation and Entrepreneurship
provide not only the largest selection of retail
goods online, but also an array of services and
mobile devices (e.g., cloud computing, Kindle
tablets, Prime, and so on). We also want to
understand the market for an innovation—
e.g., whether an innovation is introduced into
a new or an existing market—because an
invention turns into an innovation only when
it is successfully commercialized. 53 Measur-
ing an innovation along the technology and
market dimensions gives us the framework
depicted in Exhibit 7.10 . Along the horizon-
tal axis, we ask whether the innovation builds
on existing technologies or creates a new
one. On the vertical axis, we ask whether the
innovation is targeted toward existing or new
markets. Four types of innovations emerge:
incremental, radical, architectural, and dis-
ruptive innovations. As indicated by the color
coding in Exhibit 7.10 , each diagonal forms a pair: incremental versus radical innovation
and architectural versus disruptive innovation.
INCREMENTAL VS. RADICAL INNOVATION
Although radical breakthroughs such as smartphones and magnetic resonance imaging
(MRI) radiology capture most of our attention, the vast majority of innovations are actually
incremental ones. An incremental innovation squarely builds on an established knowl-
edge base and steadily improves an existing product or service offering. 54 It targets exist-
ing markets using existing technology.
On the other hand, radical innovation draws on novel methods or materials, is derived
either from an entirely different knowledge base or from a recombination of existing knowl-
edge bases with a new stream of knowledge, or targets new markets by using new tech-
nologies. 55 Well-known examples of radical innovations include the introduction of the
mass-produced automobile (the Ford Model T), the X-ray, the airplane, and more recently
biotechnology breakthroughs such as genetic engineering and the decoding of the human
genome.
Many firms get their start by successfully commercializing radical innovations, some
of which, such as the airplane, even give birth to new industries. Although the British
firm de Havilland first commercialized the jet-powered passenger airplane, Boeing was
the company that rode this radical innovation to industry dominance. More recently,
Boeing’s leadership has been contested by Airbus; each company has approximately half
the market. This stalemate is now being challenged by aircraft manufacturers such as
Bombardier of Canada and Embraer of Brazil, which are moving up-market by building
larger luxury jets that are competing with some of the smaller airplane models offered
by Boeing and Airbus.
A predictable pattern of innovation is that firms (often new ventures) use radical inno-
vation to create a temporary competitive advantage. They then follow up with a string of
incremental innovations to sustain that initial lead. Gillette is a prime example for this pat-
tern of strategic innovation. In 1903, entrepreneur Mr. King C. Gillette invented and began
selling the safety razor with a disposable blade. This radical innovation launched the
incremental
innovation An innovation that squarely builds on an established knowledge base, and steadily improves an existing product or service offering; targets existing markets by using existing technology.
radical innovation An innovation that draws on novel methods or materials, is derived either from an entirely different knowledge base or from a recombination of the existing knowledge bases with a new stream of knowledge, or targets new markets by using new technologies.
Architectural
innovationRadical
innovation
Disruptive
innovation
Incremental
innovation
Existing
Ex
isti
ng
Ne
w
New
TECHNOLOGIES
MA
RK
ET
S
EXHIBIT 7.10 / Types of Innovation: Combining Markets and Technologies
WWW.YAZDANPRESS.COMWWW.YAZDANPRESS.COM
CHAPTER 7 Business Strategy: Innovation and Entrepreneurship 221
Gillette company (now a brand of Procter & Gamble). To sustain its competitive advan-
tage, Gillette not only made sure that its razors were inexpensive and widely available (by
introducing the “razor and razor blade” business model), but also continually improved its
razor blades. In a classic example of a string of incremental innovations, Gillette kept add-
ing an additional blade with each new version of its razor until the number had gone from
one to six! Though this innovation strategy seems predictable, it worked. In 2013, Gillette
held 66 percent market share for razors and blades of the $13 billion industry globally.
Gillette’s newest razor, the Fusion ProGlide Power, costs around $12, plus $19.99 for a
four-pack of cartridges. With each new razor introduction, Gillette is able to push up its
per-unit cartridge price. 56
The Gillette example shows how radical innovation created a competitive advantage
that the company sustained by follow-up incremental innovation. Such an outcome is not
a foregone conclusion, though. In some instances, the innovator might be outmaneuvered
by low-cost disruption. As discussed in Chapter 5, the Dollar Shave Club is attempting to
establish a low-cost subscription business model in order to invade Gillette’s market from
the bottom up.
In other instances, the innovator is outcompeted by second movers that quickly intro-
duce a similar incremental innovation to continuously improve their own offering. For
example, although CNN was the pioneer in 24-hour cable news, today Fox News is the
most watched cable news network in the U.S. (although the entire industry is in decline as
viewers now consume much more content online).
Once firms have achieved market acceptance of a breakthrough innovation, they
tend to follow up with incremental rather than radical innovations. Over time, these
companies morph into industry incumbents. Future radical innovations are generally
introduced by new entrepreneurial ventures. Why is this so? The reasons concern eco-nomic incentives, organizational inertia, and the firm’s embeddedness in an innovation ecosystem. 57
ECONOMIC INCENTIVES. Economists highlight the role of incentives in strategic
choice. Once an innovator has become an established incumbent firm (such as Google
has today), it has strong incentives to defend its strategic position and market power.
An emphasis on incremental innovations strengthens the incumbent firm’s position
and thus maintains high entry barriers. A focus on incremental innovation is particu-
larly attractive once an industry standard has emerged and technological uncertainty
is reduced. As a result, the incumbent firm uses incremental innovation to extend the
time it can extract profits based on a favorable industry structure (see the discussion in
Chapter 3). Any potential radical innovation threatens the incumbent firm’s dominant
position.
The incentives for entrepreneurial ventures, however, are just the opposite. Successfully
commercializing a radical innovation is frequently the only option to enter an industry
protected by high entry barriers. One of the first biotech firms, Amgen, used newly discov-
ered drugs based on genetic engineering to overcome entry barriers to the pharmaceutical
industry, in which incumbents had enjoyed notoriously high profits for several decades.
Because of differential economic incentives, incumbents often push forward with incre-
mental innovations, while new entrants focus on radical innovations.
ORGANIZATIONAL INERTIA. From an organizational perspective, as firms become
established and grow, they rely more heavily on formalized business processes and struc-
tures. In some cases, the firm may experience organizational inertia —resistance to
changes in the status quo. Incumbent firms, therefore, tend to favor incremental innovations
organizational
inertia A firm’s resistance to changes in the status quo.
WWW.YAZDANPRESS.COMWWW.YAZDANPRESS.COM

222 CHAPTER 7 Business Strategy: Innovation and Entrepreneurship
that reinforce the existing organizational structure and power distribution while avoiding
radical innovation that could disturb the existing power distribution (e.g., between differ-
ent functional areas, such as R&D and marketing). New entrants, however, do not have for-
mal organizational structures and processes, giving them more freedom to launch an initial
breakthrough. (We discuss the link between organizational structure and firm strategy in
depth in Chapter 11.)
INNOVATION ECOSYSTEM. A final reason incumbent firms tend to be a source
of incremental rather than radical innovations is that they become embedded in an
innovation ecosystem : a network of suppliers, buyers, complementors, and so on. 58
They no longer make independent decisions but must consider the ramifications on
other parties in their innovation ecosystem. Continuous incremental innovations rein-
force this network and keep all its members happy, while radical innovations disrupt
it. Again, new entrants don’t have to worry about preexisting innovation ecosystems,
since they will be building theirs around the radical innovation they are bringing to a
new market.
ARCHITECTURAL VS. DISRUPTIVE INNOVATION
Firms can also innovate by leveraging existing technologies into new markets. Doing so
generally requires them to reconfigure the components of a technology, meaning they alter
the overall “architecture” of the product. 59 An architectural innovation , therefore, is a
new product in which known components, based on existing technologies, are reconfig-
ured in a novel way to create new markets.
As a radical innovator commercializing the xerography invention, Xerox was long
the most dominant copier company worldwide. 60 It produced high- volume, high-
quality, and high-priced copying machines that it leased to its customers through a
service agreement. Although these machines were ideal for the high end of the market
such as Fortune 100 companies, Xerox ignored small and medium-sized businesses. By
applying an architectural innovation, the Japanese entry Canon was able to redesign the
copier so that it didn’t need professional service— reliability was built directly into the
machine, and the user could replace parts such as the cartridge. This allowed Canon to
apply the razor–razor-blade business model (introduced in Chapter 5), charging rela-
tively low prices for its copiers but adding a steep markup to its cartridges. What Xerox
had not envisioned was the possibility that the components of the copying machine
could be put together in an altogether different way that was more user-friendly. More
importantly, Canon addressed a need in a specific consumer segment—small and
medium-sized businesses and individual departments or offices in large companies—
that Xerox neglected.
Finally, a disruptive innovation leverages new technologies to attack existing markets. It invades an existing market from the bottom up, as shown in Exhibit 7.11 . 61 The dashed
blue lines represent different market segments, from segment 1 at the low end to segment
innovation ecosystem A firm’s embeddedness in a complex network of suppliers, buyers, and complementors, which requires interdependent strategic decision making.
architectural innovation A new product in which known components, based on existing technologies, are reconfigured in a novel way to attack new markets.
disruptive innovation An innovation that leverages new technologies to attack existing markets from the bottom up.
WWW.YAZDANPRESS.COMWWW.YAZDANPRESS.COM

CHAPTER 7 Business Strategy: Innovation and Entrepreneurship 223
4 at the high end. As first demonstrated by Clayton Christensen, the dynamic process of
disruptive innovation begins when a firm, frequently a startup, introduces a new product
based on a new technology to meet existing customer needs. To be a disruptive force, how-
ever, this new product or technology has to have additional characteristics:
1. It begins as a low-cost solution to an existing problem.
2. Initially, its performance is inferior to the existing technology, but its rate of technolog-
ical improvement over time is faster than the rate of performance increases required by
different market segments. In Exhibit 7.11 , the red line captures the new technology’s
trajectory, or rate of improvement over time.
The following examples illustrate disruptive innovations:
■ Japanese carmakers successfully followed a strategy of disruptive innovation by first
introducing small fuel-efficient cars, and then leveraging their low-cost and high-
quality advantages into high-end luxury segments, captured by brands such as Lexus,
Infiniti, and Acura. More recently, the South Korean carmakers Kia and Hyundai have
followed a similar strategy.
■ Digital photography improved enough over time to provide higher-definition pictures.
As a result, it has been able to replace film photography, even in most professional
applications.
■ Laptop computers disrupted desktop computers; now tablets and larger-screen smart-
phones are disrupting laptops.
■ Educational organizations such as Coursera and Udacity are disrupting traditional uni-
versities by offering massive open online courses (MOOCs), using the web to provide
large-scale, interactive online courses with open access.
One factor favoring the success of disruptive innovation is that it relies on stealth attack:
It invades the market from the bottom up, by first capturing the low end. Many times,
incumbent firms fail to defend (and sometimes are even happy to cede) the low end of the
market, because it is frequently a low-margin business. Google, for example, is using its
mobile operating system, Android, as a beachhead to challenge Microsoft’s dominance in
EXHIBIT 7.11 /
Disruptive Innovation: Riding the Technology Trajectory to Invade Different Market Segments from the Bottom Up
Segment 1
Segment 2
Segment 3
Segment 4
Perf
orm
ance
Time
Technology trajectory (red line) –
used by disruptive innovator to
invade market segments from the
bottom up
WWW.YAZDANPRESS.COMWWW.YAZDANPRESS.COM

224 CHAPTER 7 Business Strategy: Innovation and Entrepreneurship
the personal computer industry, where 90 percent of machines run Windows. 62 Google’s
Android, in contrast, is optimized to run on mobile devices, the fastest-growing segment
in computing. To appeal to users who spend most of their time on the web accessing
e-mail and other online applications, for instance, it is designed to start up in a few sec-
onds. Moreover, Google provides Android free of charge. 63 In contrast to Microsoft’s pro-
prietary Windows operating system, Android is open-source software, freely accessible
to anyone for further development and refinement. In this sense, Google is leveraging
crowdsourcing in its new product development, just as Threadless uses crowdsourcing to
design and market T-shirts, and Wikipedia uses the wisdom of the crowds to collectively
edit encyclopedia entries.
Another factor favoring the success of disruptive innovation is that incumbent firms
often are slow to change. Incumbent firms tend to listen closely to their current custom-
ers and respond by continuing to invest in the existing technology and in incremental
changes to the existing products. When a newer technology matures and proves to be
a better solution, those same customers will switch over. At that time, however, the
incumbent firm does not yet have a competitive product ready that is based on the dis-
ruptive technology. Although customer-oriented mission statements are more likely to
guard against firm obsolescence than product-oriented ones (see Chapter 2), they are
no guarantee that a firm can hold out in the face of disruptive innovation. One of the
counterintuitive findings that Clayton Christensen unearthed in his studies is that it can
hurt incumbents to listen (too closely) only to their existing customers. Apple is famous
for not soliciting customer feedback because it believes it knows what customers need
before they even realize it.
Although these examples show that disruptive innovations are a serious threat for
incumbent firms, some have devised strategic initiatives to counter them:
1. Continue to innovate in order to stay ahead of the competition. Being a moving target
is much harder to hit than standing still and resting on existing (innovation) laurels.
Apple has done this well during the decade from 2001–2011 (as detailed in Chapter-
Case 1). Amazon is another example of a company that has continuously morphed
through innovation, 64 from a simple online book retailer to the largest e-commerce
company. It now also offers consumer electronics (Kindle tablets), cloud computing,
and content streaming, among other offerings.
2. Guard against disruptive innovation by protecting the low end of the market (segment
1 in Exhibit 7.11 ) by introducing low-cost innovations to preempt stealth competitors.
Intel introduced the Celeron chip, a stripped-down, budget version of its Pentium chip,
in 1998. More recently, Intel followed up with the Atom chip, a new processor that is
inexpensive and consumes little battery power, to power low-cost mobile devices. 65
Nonetheless, Intel also listened too closely to its existing personal computer customers
such as Dell, HP, Lenovo, and so on, and allowed ARM Holdings, a British semicon-
ductor design company (that supplies its technology to Apple, Samsung, HTC, and
others) to take the lead in providing high-performing, low-power-consuming proces-
sors for smartphones and other mobile devices.
3. Disrupt yourself, rather than wait for others to disrupt you. A firm may develop
products specifically for emerging markets such as China and India, and then intro-
duce these innovations into developed markets such as the United States, Japan, or
the European Union. 66 Strategy Highlight 7.2 describes how GE Healthcare invented
and commercialized a disruptive innovation in China that is now entering the U.S.
market (riding the steep technology trajectory of disruptive innovation shown in
Exhibit 7.11 ).
WWW.YAZDANPRESS.COMWWW.YAZDANPRESS.COM

CHAPTER 7 Business Strategy: Innovation and Entrepreneurship 225
THE INTERNET AS DISRUPTIVE FORCE: THE LONG TAIL
To harness the power of the Internet, firms digitize their offerings. This process acts as an
especially disruptive force. 68 We are all familiar with the impact that the digitization of
music, books, and movies has had on brick-and-mortar sellers. Web applications such as
TurboTax and LegalZoom are replacing professional tax accountants and attorneys. Online
gaming is the fastest-growing segment in the $55 billion video game industry. 69 One thing
is for sure: Everything that can go digital will—creating some losers and some winners.
Online digitization is thus both a threat and an opportunity.
These observations and their strategic implications have been explained by Chris
Anderson in his bestseller The Long Tail. 70 The long-tail phenomenon is that 80 percent
of offerings in a category are not big hits (see Exhibit 7.12 ). It turns out that 80 percent of
sales in a given product category (such as movies, books, and songs) come from “block-
busters” in the “short head” of the distribution curve, which represents only 20 percent of
the offerings in a category. This phenomenon is captured by the Pareto principle , also
known as the 80-20 rule, which says that roughly 80 percent of effects come from 20 per-
cent of the causes.
The short head represents the mainstream, where all the blockbusters, bestsellers, and
hits are to be found. These products tend to appeal to the largest segment of the mar-
ket with homogenous tastes. In the physical world of brick-and-mortar retail stores, these
LO7-6
Explain the long-tail concept and derive its strategic implications.
Pareto principle
Roughly 80 percent of effects come from 20 percent of the causes.
GE’s New Innovation Mantra:
Disrupt Yourself!
GE Healthcare is a leader in diagnostic devices. Realiz-ing that the likelihood of disruptive innovation increases over time, GE decided to disrupt itself. A high-end ultra-sound machine found in cutting-edge research hospitals in the United States or Europe costs $250,000. There is no market for these high-end, high-price products in developing countries. Given their large populations, however, there is a strong medical need for ultrasound devices.
In 2002, a GE team in China, through a bottom-up stra-tegic initiative, developed an inexpensive, portable ultra-sound device, combining laptop technology with a probe and sophisticated imaging software. This lightweight device (11 pounds) was first used in rural China. In the spring of 2009, GE unveiled the new medical device under the name Venue 40 in the United States, at a price of less than $30,000. There was also high demand from many American general practitioners, who could not otherwise afford the quarter of a million dollars needed to procure a high-end machine (that weighed about 400 pounds).
In the fall of 2009, GE’s chairman and CEO Jeff Immelt unveiled the Vscan, an even smaller device that looks like a cross between an early iPod and a flip phone. This wire-less ultrasound device is priced at less than $10,000. GE views the Vscan as the “stethoscope of the 21st century,” which a primary care doctor can hang around her neck when visiting patients. 67
7.2
Jeffrey Immelt, GE CEO and Chairman, unveils the Vscan.
WWW.YAZDANPRESS.COMWWW.YAZDANPRESS.COM

226 CHAPTER 7 Business Strategy: Innovation and Entrepreneurship
product selections are often the only choice on display, because there are significant costs
to carrying broader inventory to meet a wider variety of consumer needs.
The disruptive force of the Internet provides an opportunity to online retailers to benefit
from marketing the long tail, which is the remaining 80 percent of offerings. Online retail-
ers can “sell less of more” by taking advantage of low-cost virtual shelf space, which is
basically unlimited. The Internet, combined with sophisticated search engines and inven-
tory-management software, allows firms to drive down transaction costs to match indi-
vidual consumer demand with supply. As shown by the dashed line in Exhibit 7.12 , the
combined effects of these advances in technology make it possible to increase the number
of units sold—that is, to create the long tail. The long-tail business model is one in which
companies can obtain a large part of their revenues by selling a small number of units from
among almost unlimited choices.
The long tail allows online retailers to overcome the problem of thin markets , in
which transactions are likely not to take place because there are only a few buyers and
a few sellers and they have difficulty finding each other. We can look at eBay with
100 million users worldwide as an example of an online retailer with an innovative
approach to retailing, enabling buyers and sellers to meet online to exchange any good,
no matter how exotic, at no search cost to the buyer. Google also benefits from the
long tail, because it is able to match even small advertisers with their specific target
demographics.
In any distribution, the short tail captures only the tip of the iceberg. The long tail,
in contrast, captures the bottom of the iceberg, the non-obvious choices. By leveraging
sophisticated IT systems, online retailers such as Rhapsody, Netflix, and Amazon are
able to aggregate these choices. Even Walmart, the world’s largest retailer, carries only
about 55,000 music tracks. In contrast, Rhapsody’s inventory contains over 16 million
tracks. The average retail store in the now defunct Blockbuster chain carried no more
long tail Business model in which companies can obtain a large part of their revenues by selling a small number of units from among almost unlimited choices.
thin markets A situation in which transactions are likely not to take place because there are only a few buyers and sellers who have difficulty finding each other.
EXHIBIT 7.12 /
The Short Head and the Long Tail SOURCE: Adapted from C. Anderson (2006), The Long Tail: Why the Future of Business Is Selling Less of More (New York: Hyperion).
80-20 Rule or Pareto Principle:80% of sales come from 20% of selection found in Short Head
Shor
t Hea
d
Long Tail
Advances in TechnologyCreate Long Tail
Selection
Units
Sol
d
WWW.YAZDANPRESS.COMWWW.YAZDANPRESS.COM

CHAPTER 7 Business Strategy: Innovation and Entrepreneurship 227
than 1,000 DVD titles; Netflix carries more than 100,000. The typical Barnes & Noble
superstore holds some 100,000 book titles; on Amazon you can find 5 million. All in
all, the leading online retailers carry an inventory 50 to 100 times larger than those of
their largest brick-and-mortar competitors. Between 25 and 45 percent of all revenues
for Rhapsody, Netflix, and Amazon come from the long tail, or products not available
in offline retail stores.
The Internet as a disruptive innovation enables companies to solve important strategic
trade-offs. It lowers the costs of shelf space, inventory, and distribution to near zero and
enables firms to aggregate non-hits and match unique consumer preferences to supply.
Although the early experiences of media and entertainment industries illustrate the long-
tail business model, it is expected that the model can be used to build a business in any
product or service that can be digitized.
OPEN INNOVATION
During the 20th century, the closed innovation approach was the dominant research and
development (R&D) approach for most leading industrial corporations: They tended to
discover, develop, and commercialize new products internally. 71 Although this approach
was costly and time-consuming, it allowed firms to fully capture the returns to their own
innovations.
Several factors led to a shift in the knowledge landscape from closed innovation to open
innovation. They include:
■ The increasing supply and mobility of skilled workers
■ The exponential growth of venture capital
■ The increasing availability of external options (such as spinning out new ventures) to
commercialize ideas that were previously shelved or in-source promising ideas and
inventions
■ The increasing capability of external suppliers
Taken together, these factors have led more and more companies to adopt an open
innovation approach to research and development. Open innovation is a framework for
R&D that proposes permeable firm boundaries to allow a firm to benefit not only from
internal ideas and inventions, but also from ideas and innovation from external sources.
The sharing goes both ways: some external R&D is in-sourced (and further developed
in-house) while the firm may spin out internal R&D that does not fit its strategy in order
to allow others to commercialize it. Even the largest companies, such as AT&T, IBM,
and GE, are shifting their innovation strategy toward a model that blends internal with
external knowledge-sourcing via licensing agreements, strategic alliances, joint ven-
tures, and acquisitions. 72
Exhibit 7.13 depicts the closed and open innovation models. In the closed innovation
model (left panel), the firm is conducting all research and development in-house, using a
traditional funnel approach. The boundaries of the firm are impenetrable. Outside ideas and
projects cannot enter, nor does the firm allow its own research ideas and development proj-
ects to leave the firm. Firms in the closed innovation model are extremely protective of
their intellectual property. This not only allows the firm to capture all the benefits from its
own R&D, but also prevents competitors from benefitting from it. The mindset of firms
in the closed innovation model is that to profit from R&D, the firm must come up with its
own discoveries, develop them on its own, and control the distribution channels. Strength
in R&D is equated with a high likelihood of benefitting from first-mover advantages. Firms
following the closed innovation model, however, are much more likely to fall prone to the
LO7-7
Compare and contrast closed and open innovation.
open innovation A framework for R&D that proposes permeable firm boundaries to allow a firm to benefit not only from internal ideas and inventions, but also from external ones. The sharing goes both ways: some external ideas and inventions are in-sourced while others are spun-out.
WWW.YAZDANPRESS.COMWWW.YAZDANPRESS.COM
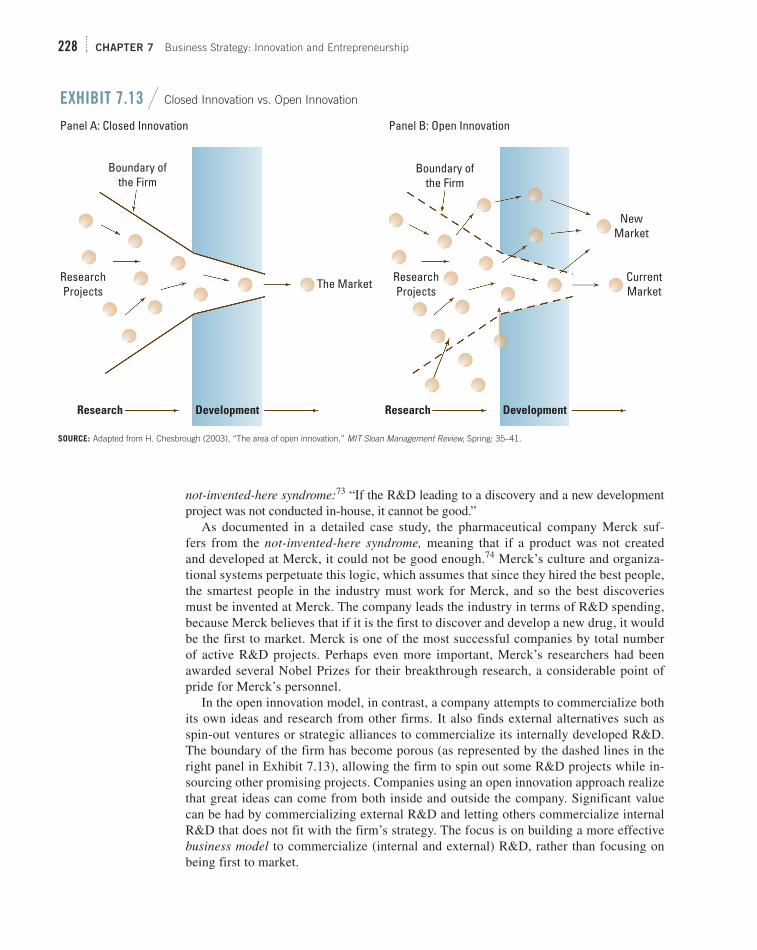
228 CHAPTER 7 Business Strategy: Innovation and Entrepreneurship
not-invented-here syndrome: 73 “If the R&D leading to a discovery and a new development
project was not conducted in-house, it cannot be good.”
As documented in a detailed case study, the pharmaceutical company Merck suf-
fers from the not-invented-here syndrome, meaning that if a product was not created
and developed at Merck, it could not be good enough. 74 Merck’s culture and organiza-
tional systems perpetuate this logic, which assumes that since they hired the best people,
the smartest people in the industry must work for Merck, and so the best discoveries
must be invented at Merck. The company leads the industry in terms of R&D spending,
because Merck believes that if it is the first to discover and develop a new drug, it would
be the first to market. Merck is one of the most successful companies by total number
of active R&D projects. Perhaps even more important, Merck’s researchers had been
awarded several Nobel Prizes for their breakthrough research, a considerable point of
pride for Merck’s personnel.
In the open innovation model, in contrast, a company attempts to commercialize both
its own ideas and research from other firms. It also finds external alternatives such as
spin-out ventures or strategic alliances to commercialize its internally developed R&D.
The boundary of the firm has become porous (as represented by the dashed lines in the
right panel in Exhibit 7.13 ), allowing the firm to spin out some R&D projects while in-
sourcing other promising projects. Companies using an open innovation approach realize
that great ideas can come from both inside and outside the company. Significant value
can be had by commercializing external R&D and letting others commercialize internal
R&D that does not fit with the firm’s strategy. The focus is on building a more effective
business model to commercialize (internal and external) R&D, rather than focusing on
being first to market.
Boundary ofthe Firm
Panel A: Closed Innovation Panel B: Open Innovation
Boundary ofthe Firm
ResearchProjects
ResearchProjects
Research Development Research
The Market
NewMarket
CurrentMarket
Development
SOURCE: Adapted from H. Chesbrough (2003), “The area of open innovation,” MIT Sloan Management Review, Spring: 35–41.
EXHIBIT 7.13 / Closed Innovation vs. Open Innovation
WWW.YAZDANPRESS.COMWWW.YAZDANPRESS.COM

CHAPTER 7 Business Strategy: Innovation and Entrepreneurship 229
One key assumption underlying the open innovation model is that combining the best of
internal and external R&D will more likely lead to a competitive advantage. This requires
that the company must continuously upgrade its internal R&D capabilities to enhance its
absorptive capacity —its ability to understand external technology developments, eval-
uate them, and integrate them into current products or create new ones. 75 Exhibit 7.14
compares and contrasts open-innovation and closed-innovation principles.
An example of open innovation is Procter & Gamble’s “Connect 1 Develop,” or C 1 D
(a play on research and development, or R&D). 76 Because of the maturing of its prod-
ucts and markets, P&G’s CEO A. G. Lafley decided it was time to look outside for new
ideas. P&G is an $85-billion company whose investors expect it to grow at least 4–6
percent a year, which implies generating between $3 and $5 billion in incremental reve-
nue annually. P&G was no longer able to generate this amount of growth through closed
innovation. By 2000, P&G’s closed innovation machine had stalled, and the company
lost half its market value. It needed a change in innovation strategy to drive organic
growth.
P&G’s Connect 1 Develop is a web-based interface that connects the company’s
internal-innovation capability with the distributed knowledge in the global community.
From that external community, researchers, entrepreneurs, and consumers can submit
ideas that might solve some of P&G’s toughest innovation challenges. The C 1 D model
is based on the realization that innovation was increasingly coming from small entrepre-
neurial ventures and even from individuals. Universities also became much more proactive
in commercializing their inventions. The Internet now enables access to widely distributed
knowledge from around the globe.
External collaborations fostered through the worldwide Connect 1 Develop network
now play a role in roughly 50 percent of P&G’s new products, up from about 15 percent
in 2000. Successful product innovations that resulted from P&G’s open innovation model
include “Pringles meets Print” (sold for $1.5 billion in 2011), Mr. Clean Magic Eraser,
Swiffer Dusters, Crest SpinBrush, and Olay Regenerist.
absorptive capacity
A firm’s ability to understand external technology developments, evaluate them, and integrate them into current products or create new ones.
Closed Innovation Principles Open Innovation Principles
The smart people in our field work for us. Not all the smart people work for us. We need to work with smart people inside and outside our company.
To profit from R&D, we must discover it, develop it, and ship it ourselves.
External R&D can create significant value; internal R&D is needed to claim (absorb) some portion of that value.
If we discover it ourselves, we will get it to market first.
We don’t have to originate the research to profit from it; we can still be first if we successfully commercialize new research.
The company that gets an innovation to market first will win.
Building a better business model is often more important than getting to market first.
If we create the most and best ideas in the industry, we will win.
If we make the best use of internal and external ideas, we will win.
We should control our intellectual property (IP), so that our competitors don’t profit from it.
We should profit from others’ use of our IP, and we should buy others’ IP whenever it advances our own business model.
SOURCE: Adapted from H. W. Chesbrough (2003), Open Innovation: The New Imperative for Creating and Profiting from Technology (Boston: Harvard Business School Press).
EXHIBIT 7.14 / Contrasting Principles of Closed and Open Innovation
WWW.YAZDANPRESS.COMWWW.YAZDANPRESS.COM

230 CHAPTER 7 Business Strategy: Innovation and Entrepreneurship
As discussed in Chapter Case 6, however, the open innovation model did not pre-
vent P&G from being “stuck in the middle” as it focused too much on incremental
innovation rather than on radical innovation by creating new product categories. This,
combined with a neglect of emerging economies, weakened P&G’s strategic position
considerably.
7.5 Implications for the Strategist
An effective innovation strategy is critical in formulating a business strategy that affords
the firm a competitive advantage. The competitive process is driven by innovation. Suc-
cessful innovation affords firms a temporary monopoly, with the corresponding pricing
power. Fast Company has named Nike, Amazon, Square, Splunk, Fab, Uber, Sproxil,
Pinterest, Safaricom, and Target as its 2013 Most Innovative Companies. 77 Continuous
innovation fuels the success of these companies.
Entrepreneurs are the agents that introduce change into the competitive system. They do
this not only by figuring out how to use inventions, but also by introducing new products
or services, new production processes, and new forms of organization. Entrepreneurs fre-
quently start new ventures, but they may also be found in existing firms.
The industry life cycle model and the crossing-the-chasm framework have critical
implications for how you as the strategist manage innovation. To overcome the chasm,
you need to formulate a business strategy guided by the “who-what-why-and-how”
questions of competition to ensure you meet the distinctly different customer needs
inherent along the industry life cycle. You also need to be mindful that to do so you need
to bring different competencies and capabilities to bear at different stages of the industry
life cycle.
Many of the more successful companies have either adopted or are moving toward an
open innovation model. As a strategist, you must actively manage a firm’s internal and
external innovation activities. Internally, you can induce innovation through a top-down
process or motivate innovation through autonomous behavior, a bottom-up process. 78 In
induced innovation, you need to put a structure and system in place to foster innovation.
3M puts structures and systems to foster induced innovation: “A core belief of 3M is that
creativity needs freedom. That’s why, since about 1948, we’ve encouraged our employees
to spend 15 percent of their working time on their own projects. To take our resources, to
build up a unique team, and to follow their own insights in pursuit of problem-solving.” 79
We discussed autonomous behavior in detail in Chapter 2. To not only motivate and sup-
port innovations through autonomous behavior, but also ensure their possible success,
internal champions need to be willing to support promising projects. In Strategy Highlight
2.2, we detailed how Howard Behar, at that time a senior executive at Starbucks, was will-
ing to support the bottom-up idea of Frappuccino.
Externally, you must manage innovation through cooperative strategies such as licens-
ing, strategic alliances, joint ventures, and acquisitions. These are the vehicles of corporate strategy discussed in the next two chapters.
In conclusion, in this and the previous chapter, we discussed how firms can use
business-level strategy —differentiation, cost leadership, integration, and innovation—
to gain and sustain competitive advantage. We now turn our attention to corporate-level strategy to help us understand how executives make decisions about where to
compete (in terms of industries, value chains, and geography) and how to execute it
through strategic alliances as well as mergers and acquisitions. A thorough understand-
ing of business and corporate strategy is necessary to formulate and sustain a winning
strategy.
WWW.YAZDANPRESS.COMWWW.YAZDANPRESS.COM

CHAPTER 7 Business Strategy: Innovation and Entrepreneurship 231
W W IKIPEDIA, AS DISCUSSED in Chapter Case 7, lever-ages technological innovation afforded by the Internet combined with a crowdsourcing approach to content development and maintenance. Beyond the technical challenges of web interfaces, servers, and bandwidth for delivery is a sometimes-overlooked capability: the Wiki-pedians themselves. Over 32 million people have reg-istered accounts to contribute edits to Wikipedia. More than 300,000 users provide edits to the website at least once a month. These volunteers build the content for the site, using a creative commons license that ensures free access to any of the 500 million unique visitors each month. 80 This crowdsourcing and its legal underpin-nings are successful only as long as individuals are will-ing to spend their own time contributing to the site for no pay or other extrinsic benefits. The ability to attract and utilize legions of interested individuals is vital to the suc-cess of Wikipedia both today and into the future.
Moreover, Wikipedia is a nonprofit, free-of- advertising social entrepreneurship venture that is exclu-sively financed by donations. Wikipedia runs regular calls for donations using slogans such as: 81 “Please help us feed the servers,” “We make the Internet not suck. Help us out,” and “We are free, our bandwidth isn’t!” Calls for donations also come in the form of personal appeals by co-founder Jimmy Wales. The question arises whether the donation model is sustainable given not only the increasing demand for Wikipedia’s services, but also the emergence of competitors.
Wikipedia might not be as error-prone in science topics as shown in the Nature study mentioned ear-lier, because most entries on Wikipedia are not about science. Wikipedia maintains that it fosters a “neutral point of view.” A recent research study tested this claim. In particular, a study of 28,000 articles about U.S.
politics revealed a significant bias. 82 On average, Wikipedia entries lean left of center. Ini-tial entries arrive with a slant, and change little over time. This bias is more pronounced in earlier Wikipedia arti-cles. The authors call this the “vintage bias.” Although the degree of slant in Wikipedia articles changes little over time, more recent political entries are more bal-anced. One reason the authors put forth to explain the vintage effect is that in the early days of Wikipedia only technology enthusiasts and early adopters participated, and this demographic tends to lean left. The shift toward a more “neutral point of view” over the years has arisen from the growth of Wikipedia, bringing in the early and late majority as contributors.
Questions
1. How can Wikipedia maintain and grow its ability to harness the crowdsourcing of its “Wikipedians” to maintain high-quality (and quickly updated) content?
2. As Wikipedia keeps growing, do you think it can continue to rely exclusively on donations (in time and money)? Why or why not? What other “business models” could be considered? Would any of those “violate the spirit of Wikipedia”? Why or why not?
3. What, if anything, should Wikipedia do to ensure that its articles indeed present a “neutral point of view”? Shouldn’t the crowdsourcing approach ensure an objectivity? Does a “neutral point of view” matter to Wikipedia’s sustainability? Why or why not?
4. How has the “long tail” affected Wikipedia?
This chapter discussed various aspects of innovation
and entrepreneurship as a business-level strategy, as
summarized by the following learning objectives and
related take-away concepts.
LO 7-1 / Outline the four-step innovation
process from idea to imitation.
■ Innovation describes the discovery and develop-
ment of new knowledge in a four-step process
TAKE-AWAY CONCEPTS
CHAPTER CASE 7 Consider This . . .
WWW.YAZDANPRESS.COMWWW.YAZDANPRESS.COM
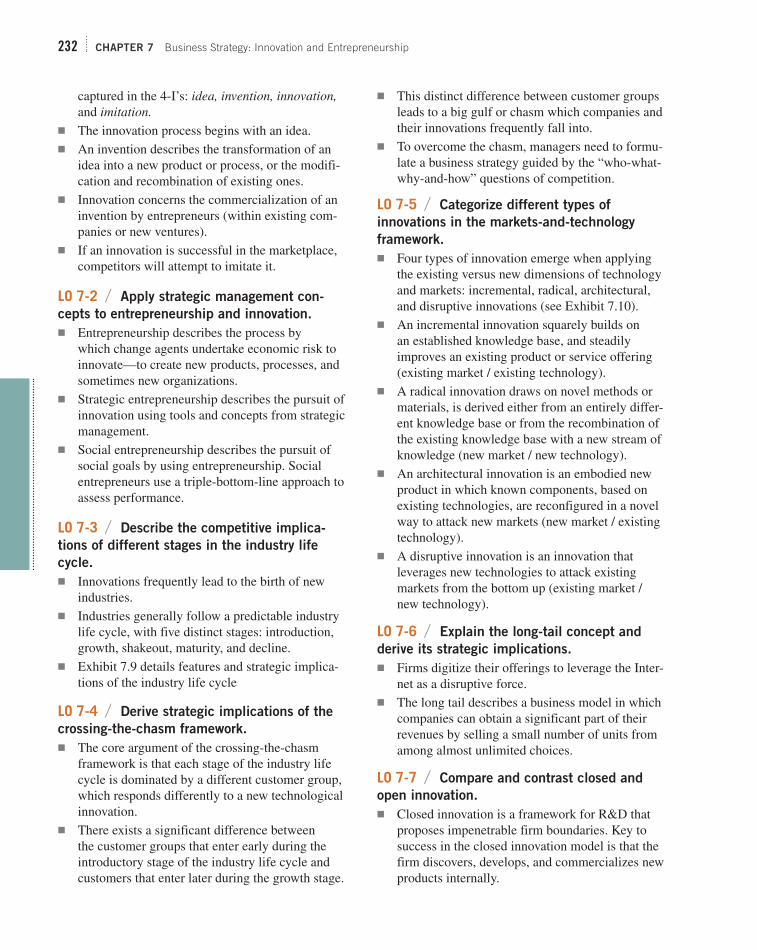
232 CHAPTER 7 Business Strategy: Innovation and Entrepreneurship
captured in the 4-I’s: idea, invention, innovation, and imitation.
■ The innovation process begins with an idea.
■ An invention describes the transformation of an
idea into a new product or process, or the modifi-
cation and recombination of existing ones.
■ Innovation concerns the commercialization of an
invention by entrepreneurs (within existing com-
panies or new ventures).
■ If an innovation is successful in the marketplace,
competitors will attempt to imitate it.
LO 7-2 / Apply strategic management con-
cepts to entrepreneurship and innovation.
■ Entrepreneurship describes the process by
which change agents undertake economic risk to
innovate—to create new products, processes, and
sometimes new organizations.
■ Strategic entrepreneurship describes the pursuit of
innovation using tools and concepts from strategic
management.
■ Social entrepreneurship describes the pursuit of
social goals by using entrepreneurship. Social
entrepreneurs use a triple-bottom-line approach to
assess performance.
LO 7-3 / Describe the competitive implica-
tions of different stages in the industry life
cycle.
■ Innovations frequently lead to the birth of new
industries.
■ Industries generally follow a predictable industry
life cycle, with five distinct stages: introduction,
growth, shakeout, maturity, and decline.
■ Exhibit 7.9 details features and strategic implica-
tions of the industry life cycle
LO 7-4 / Derive strategic implications of the
crossing-the-chasm framework.
■ The core argument of the crossing-the-chasm
framework is that each stage of the industry life
cycle is dominated by a different customer group,
which responds differently to a new technological
innovation.
■ There exists a significant difference between
the customer groups that enter early during the
introductory stage of the industry life cycle and
customers that enter later during the growth stage.
■ This distinct difference between customer groups
leads to a big gulf or chasm which companies and
their innovations frequently fall into.
■ To overcome the chasm, managers need to formu-
late a business strategy guided by the “who-what-
why-and-how” questions of competition.
LO 7-5 / Categorize different types of
innovations in the markets-and-technology
framework.
■ Four types of innovation emerge when applying
the existing versus new dimensions of technology
and markets: incremental, radical, architectural,
and disruptive innovations (see Exhibit 7.10 ).
■ An incremental innovation squarely builds on
an established knowledge base, and steadily
improves an existing product or service offering
(existing market / existing technology).
■ A radical innovation draws on novel methods or
materials, is derived either from an entirely differ-
ent knowledge base or from the recombination of
the existing knowledge base with a new stream of
knowledge (new market / new technology).
■ An architectural innovation is an embodied new
product in which known components, based on
existing technologies, are reconfigured in a novel
way to attack new markets (new market / existing
technology).
■ A disruptive innovation is an innovation that
leverages new technologies to attack existing
markets from the bottom up (existing market /
new technology).
LO 7-6 / Explain the long-tail concept and
derive its strategic implications.
■ Firms digitize their offerings to leverage the Inter-
net as a disruptive force.
■ The long tail describes a business model in which
companies can obtain a significant part of their
revenues by selling a small number of units from
among almost unlimited choices.
LO 7-7 / Compare and contrast closed and
open innovation.
■ Closed innovation is a framework for R&D that
proposes impenetrable firm boundaries. Key to
success in the closed innovation model is that the
firm discovers, develops, and commercializes new
products internally.
WWW.YAZDANPRESS.COMWWW.YAZDANPRESS.COM

CHAPTER 7 Business Strategy: Innovation and Entrepreneurship 233
■ Open innovation is a framework for R&D that
proposes permeable firm boundaries to allow a
firm to benefit not only from internal ideas and
inventions, but also from external ones. The
sharing goes both ways: some external ideas
and inventions are in-sourced while others are
spun-out.
■ Exhibit 7.14 compares and contrasts principles of
closed and open innovation.
Absorptive capacity
Architectural innovation
Disruptive innovation
Entrepreneurs
Entrepreneurship
First-mover advantages
Incremental innovation
Industry life cycle
Innovation
Innovation ecosystem
Invention
Long tail
Network effects
Open innovation
Organizational inertia
Pareto principle
Patent
Process innovations
Product innovations
Radical innovation
Social entrepreneurship
Standard
Strategic entrepreneurship
Thin markets
KEY TERMS
1. Select an industry and consider how the indus-
try life cycle has affected business strategy for
the firms in that industry over time. Detail your
answer based on each stage: introduction, growth,
shakeout, maturity, and decline.
2. Describe a firm you think has been highly innova-
tive. Which of the four types of innovation— radical,
incremental, disruptive, or architectural—did it use?
Did the firm use different types over time?
3. The chapter discussed the Internet as a disruptive
innovation that has facilitated online retailing. It
also, however, has presented challenges to brick-
and-mortar retailers. How might retailers such
as Nordstrom, Neiman Marcus, or Macy’s need
to change their in-store experience in order to
continue to attract a flow of customers into their
stores to expand sales using direct selling and
store displays of the actual merchandise? If the
Internet continues to grow and sales of brick-and-
mortar retailers decline, how might the retailers
attract, train, and retain high-quality employees if
the industry is perceived as in decline?
4. Much has been said about competitive advantage
gained from innovations such as the Internet, high-
technology gadgets, and apps. The chapter points
out, however, that low-technology innovations such
as the razor–razor-blade business model can also
create value. Think of other low-technology innova-
tions that are/were novel, useful, and successfully
implemented so that the innovating firm gained a
competitive advantage. Find information about the
entrepreneurial story behind the innovation.
DISCUSSION QUESTIONS
1. You are a co-founder of a startup firm making
electronic sensors. After a year of sales, your
business is not growing rapidly, but you have
some steady customers keeping the business
afloat. A major supplier has informed you it can
no longer supply your firm because it is moving
to serve large customers only, and your volume
does not qualify. Though you have no current
orders to support an increased commitment to
this supplier, you do have a new version of your
ETHICAL/SOCIAL ISSUES
WWW.YAZDANPRESS.COMWWW.YAZDANPRESS.COM

234 CHAPTER 7 Business Strategy: Innovation and Entrepreneurship
sensor coming out that you hope will increase the
purchase volume by over 75 percent and qualify
you for continued supply. This supplier is impor-
tant to your plans. What do you do?
2. GE’s development of the Vscan provides many
benefits as a lower-cost and portable ultrasound
device (see Strategy Highlight 7.2). Cardiolo-
gists, obstetricians, and veterinarians will be able
to use the device in rural areas and developing
countries. One of the criticisms of the device,
however, is that it also facilitates the use of the
technology for gender-selective abortion. In India,
for example, there is a cultural preference for
males, and the Vscan has been used to identify
gender in order to abort an unwanted female
fetus. Some argue that gender selection is also
used for economic reasons—specifically, to alle-
viate the financial strain of the common dowry
practice. A daughter would require the family to
pay a dowry of cash and gifts to the bridegroom’s
family in order to arrange a suitable marriage,
while a son would bring in a dowry of cash,
jewelry, gifts, and household items to help the
couple start their home. In addition, even though
there has been some progress for women in India,
others attribute the use of gender selection to
women’s lack of social, political, and economic
empowerment. 83
To what extent is GE ethically responsible
for how—and why—the Vscan is used? (To what
extent is any company ethically responsible for
how—and why—its product is used?) Note that
GE’s website states that it is an “Agent of Good.”
Consider ways that GE might become involved in
communities in India to show the company’s con-
cern for the underlying problems by improving
conditions for women. What other ways might
GE influence the way that its equipment is used?
//// Small-Group Exercise 1
Your group works for Warner Music Group ( www.
wmg.com ), a large music record label whose sales
are declining largely due to piracy. Your supervi-
sor assigns you the task of developing a strategy for
improving this situation.
1. What are the key issues you must grapple with
to improve the position of Warner Music Group
(WMG)?
2. In what phase of the life cycle is the record-label
industry?
3. How does this life cycle phase affect the types
of innovation that should be considered to help
WMG be successful?
//// Small-Group Exercise 2
The chapter compares and contrasts closed versus
open innovation. It also describes Procter & Gamble’s
Connect 1 Develop open innovation system. With your
group members, brainstorm to prepare a brief memo with
a set of talking points regarding the following questions:
1. What are some of the risks of an open innovation
approach that a company should consider before
embarking on it?
2. Do you believe P&G’s Connect 1 Develop (C 1 D)
open innovation system has the potential to create
a competitive advantage for the firm? How might
P&G’s capabilities be strengthened as a result? If
you believe that C 1 D does have the potential to
create a competitive advantage, do you believe it
is sustainable? Why or why not?
3. Larry Huston and Nabil Sakkab, (former) execu-
tives at P&G, proclaimed that “Connect 1 Develop
will become the dominant innovation model in
the 21st century.” 84 Do you agree with their state-
ment? Why or why not? If C 1 D did become
the dominant innovation model, how would this
affect its potential to create a competitive edge for
a firm?
4. Introducing the C 1 D innovation model requires
tremendous organizational change. As Huston and
Sakkab described the change effort: “We needed
to move the company’s attitude from resistance to
innovations ‘not invented here’ to enthusiasm for
those ‘proudly found elsewhere.’ And we needed
to change how we defined, and perceived, our
R&D organization—from 7,500 people inside
to 7,500 plus 1.5 million outside, with a perme-
able boundary between them.” 85 Identify some of
SMALL-GROUP EXERCISES
WWW.YAZDANPRESS.COMWWW.YAZDANPRESS.COM

CHAPTER 7 Business Strategy: Innovation and Entrepreneurship 235
the major obstacles a manager would encounter
attempting this kind of organizational change.
For example, how might P&G’s research employ-
ees react? Although you have not been formally
introduced to organizational structure, consider
some recommendations for how to accom-
plish such large-scale organizational change
successfully.
STRATEGY TERM PROJECT
//// Module 7: Innovation Strategy
In this section, you will study the environment of the
firm you have selected for the strategy term project
and the firm’s susceptibility to technological disrup-
tions from new entrants.
1. Where is your firm’s industry on the life cycle
as shown in Exhibit 7.4 ? What are the strategic
implications?
2. What is the firm’s innovation strategy? Does
it rely on incremental or radical innovations?
Disruptive or architectural? What are the com-
petitive implications of the firm’s innovation
strategies?
3. Are intellectual property rights important for your
firm? Can you find what strategies the firm is
implementing to protect its proprietary position?
Identify a recent innovation by your firm. What
is your firm’s strategy to cross the chasm(s) to
achieve mass market adoption of its innovation?
4. What attributes describe the current major cus-
tomer segment for your firm? Are these chang-
ing? If so, is your firm prepared to meet these
new customer demands?
5. How does your firm organize for innovation?
Does it use a closed or an open innovation
approach? Is its current approach working out
well, or does it need changing? If yes, how?
Do You Want to Be
an Entrepreneur?
S ome 50–75 percent of MBA students from the lead-ing programs are becoming entrepreneurs within 15 years of graduation. Moreover, economic down-
turns appear to be the best time to start a company. Many of today’s Fortune-100 and high-tech success stories were launched in economic downturns. The global depression of 1873–1895 witnessed the founding of today’s indus-try giants such as AT&T, GE, Hershey’s, Gillette, Johnson & Johnson, Abbott, Lilly, Merck, and Bristol-Myers. Similarly, Hewlett-Packard (HP), Texas Instruments, and United Tech-nologies got their starts during the Great Depression of 1929–1939 in the United States.
The success story of Silicon Valley began with the found-ing of HP in Palo Alto, California. This cluster of high-tech innovators, venture capitalists, and entrepreneurs took off during a time when the stock market had crashed by some 90 percent and almost one in three U.S. workers were
unemployed. Apple, Microsoft, LexisNexis, FedEx, and Genen-tech began their corporate lives during the oil price shocks and subsequent recession in the mid-1970s. During the early 1980s, inflation raged and mortgage rates were over 20 percent. Still, during this period entrepreneurs founded Amgen, CNN, MTV, E*Trade, AOL, Adobe, and Autodesk. 86
1. Why do you think recessions are a good time to start a business? Wouldn’t that seem counterintuitive?
2. Thinking about today’s business climate, would you say that now is a good time to start a business? Why or why not?
3. If you were to start a business, what type of business would you want to start, and why? What idea or inven-tion would you be commercializing?
4. Does it matter where (in terms of geography) you start your business? Why or why not?
5. Explain how you would apply the strategic management framework to enhance your startup’s chances to gain and sustain a competitive advantage.
my STRATEGY
WWW.YAZDANPRESS.COMWWW.YAZDANPRESS.COM

236 CHAPTER 7 Business Strategy: Innovation and Entrepreneurship
1. This Chapter Case is based on: Surowiecki, J.
(2004), The Wisdom of Crowds (New York:
Bantam Dell); “Internet encyclopedias go
head-to-head,” Nature, December 15, 2005;
Anderson, C. (2006), The Long Tail. Why the Future of Business Is Selling Less of More
(New York: Hyperion); Anderson, C. (2009),
Free. The Future of a Radical Price (New
York: Hyperion); Greenstein, S., and F. Zhu
(2012), “Is Wikipedia biased?” American Economic Review 102: 343–348; “Wikipedia’s
old-fashioned revolution,” The Wall Street Journal, April 6, 2009; “End of era for Ency-
clopaedia Britannica,” The Wall Street Jour-nal, March 14, 2012; “How Jimmy Wales’
Wikipedia harnessed the web as a force for
good,” Wired, March 19, 2013; www.
encyclopediacenter.com ; www.alexa.com/top-
sites ; and, of course, various Wikipedia sources.
2. Rothaermel, F. T., and A. Hess (2010),
“Innovation strategies combined,” MIT Sloan Management Review, Spring: 12–15.
3. Schumpeter, J. A. (1942), Capitalism, Socialism, and Democracy (New York: Harper
& Row); Foster, R., and S. Kaplan (2001),
Creative Destruction: Why Companies That Are Built to Last Underperform the Market—and How to Successfully Transform Them.
4. “Comcast, GE strike deal; Vivendi to sell
NBC stake,” The Wall Street Journal, December 4, 2009.
5. Stokes, D. E. (1997), Pasteur’s Quadrant: Basic Science and Technological Innova-tion (Washington, DC: Brookings Institute
Press); Madhavan, R., and R. Grover (1998),
“From embedded knowledge to embodied
knowledge: New product development as
knowledge management,” Journal of Market-ing 62: 1–12; and Rothaermel, F. T., and D. L.
Deeds (2004), “Exploration and exploitation
alliances in biotechnology: A system of new
product development,” Strategic Management Journal 25: 201–221.
6. Isaacson, W. (2007), Einstein: His Life and Universe (New York: Simon & Schuster).
7. A detailed description of patents can
be found at the U.S. Patent and Trademark
Office’s website at http://www.uspto.gov/ .
8. “U.S. judge reduces Apple’s patent award
in Samsung case,” The Wall Street Journal, March 1, 2013.
9. Schumpeter, J. A. (1942), Capitalism, Socialism, and Democracy. For an updated
and insightful discussion, see Foster, R., and
S. Kaplan (2001), Creative Destruction: Why Companies That Are Built to Last Underper-form the Market—and How to Successfully
Transform Them. For a very accessible dis-
cussion, see McCraw, T. (2007), Prophet of Innovation: Joseph Schumpeter and Creative Destruction (Boston: Harvard University Press).
10. Burgelman, R. A. (1983), “Corporate
entrepreneurship and strategic management:
Insights from a process study,” Management Science 29: 1349–1364; Zahra, S. A., and
J. G. Covin, “Contextual influences on the
corporate entrepreneurship-performance rela-
tionship: A longitudinal analysis ,” Journal of Business Venturing 10: 43–58.
11. U.S. Patent 381968, see http://www.
google.com/patents/US381968 .
12. Lieberman, M. B., and D. B. Montgom-
ery (1988), “First-mover advantages,” Strate-gic Management Journal 9: 41–58 (Summer
Special Issue).
13. Schramm, C. J. (2006), The Entrepre-neurial Imperative (New York: HarperCol-
lins). Dr. Carl Schramm is president of the
Kauffman Foundation, the world’s leading
foundation for entrepreneurship.
14. Schumpeter, J. A. (1942), Capitalism, Socialism, and Democracy; Foster, R., and
S. Kaplan (2001), Creative Destruction: Why Companies That Are Built to Last Underper-form the Market—and How to Successfully Transform Them.
15. Shane, S., and S. Venkataraman (2000),
“The promise of entrepreneurship as a field of
research,” Academy of Management Review
25: 217–226; Alvarez, S., and J. B. Barney
(2007), “Discovery and creation: Alternative
theories of entrepreneurial action,” Strategic Entrepreneurship Journal 1: 11–26.
16. Hansen, M. T., Ibarra, H., and U. Peyer
(2013), “The best-performing CEOs in the
world,” Harvard Business Review, January.
17. “Oprah Winfrey to end her program in 2011,”
The Wall Street Journal, November 19, 2009.
18. Forbes Special Edition: “Billionaires,”
March 29, 2010.
19. http://elonmusk.com/ .
20. Hitt, M. A., R. D. Ireland, S. M. Camp,
and D. L. Sexton (2002), “Strategic entre-
preneurship: Integrating entrepreneurial and
strategic management perspectives,” in Hitt,
M. A., R. D. Ireland, S. M. Camp, and D. L.
Sexton (eds.), Strategic Entrepreneurship: Creating a New Mindset (Oxford, UK: Black-
well Publishing); Rothaermel, F. T. (2008),
“Strategic management and strategic entre-
preneurship,” Presentation at the Strategic Management Society Annual International Conference, Cologne, Germany, October 12.
21. Ibid; Bingham, C. B., K. M. Eisen-
hardt, and N. R., Furr (2007), “What makes
a process a capability? Heuristics, strategy,
and effective capture of opportunities,”
Strategic Entrepreneurship Journal 1:
27–47.
22. “Apple iPhone5 #2 to Samsung’s 213
million shipped phones,” Forbes, January 28,
2013.
23. http://www.betterworldbooks.com/info.
aspx?f 5 corevalues .
24. This discussion is based on: “How Jimmy
Wales’ Wikipedia harnessed the web as a
force for good,” Wired, March 19, 2013.
25. Rothaermel, F. T., and M. Thursby
(2007), “The nanotech vs. the biotech revolu-
tion: Sources of incumbent productivity in
research,” Research Policy 36: 832–849; and
Woolley, J. (2010), “Technology Emergence
through Entrepreneurship across Multiple
Industries,” Strategic Entrepreneurship Jour-nal 4: 1–21.
26. This discussion is built on the seminal
work by Rogers, E. (1962), Diffusion of Innovations (New York: Free Press). For a
more recent treatise, see Baum, J.A.C., and
A. M. McGahan (2004), Business Strategy over the Industry Lifecycle, Advances in
Strategic Management, Volume 21 (Bingley,
United Kingdom: Emerald).
27. Moore, G. A. (1991), Crossing the Chasm. Marketing and Selling Disruptive Products to Mainstream Customers (New
York: HarperCollins).
28. This discussion is based on: Arthur, W.
B. (1989), “Competing technologies, increas-
ing returns, and lock-in by historical events,”
Economics Journal 99: 116–131; Hill, C.W.L.
(1997), “Establishing a standard: Competi-
tive strategy and winner-take-all industries,”
Academy of Management Executive 11: 7–25;
Shapiro, C., and H. R. Varian (1998), Informa-tion Rules. A Strategic Guide to the Network Economy (Boston, MA: Harvard Business
School Press); and Schilling, M. A. (2002),
“Technology success and failure in winner-
take-all markets: Testing a model of techno-
logical lockout,” Academy of Management Journal 45: 387–398.
29. This Strategy Highlight is based on:
“Inside the app economy,” BusinessWeek, October 22, 2009; Adner, R. (2012), The Wide Lens. A New Strategy for Innovation
(New York: Portfolio); “The 10 most popular
iPhone Apps of all time,” PCMag.com , May
3, 2013; and http://www.apple.com/iphone/
from-the-app-store/ .
ENDNOTES
WWW.YAZDANPRESS.COMWWW.YAZDANPRESS.COM

CHAPTER 7 Business Strategy: Innovation and Entrepreneurship 237
30. This discussion is based on: Utterback,
J. M. (1994), Mastering the Dynamics of Innovation (Boston, MA: Harvard Business
School Press); Anderson, P., and M. Tush-
man (1990), “Technological discontinuities
and dominant designs: A cyclical model of
technological change,” Administrative Sci-ence Quarterly 35: 604–634; and Schilling,
M. A. (1998), “Technological lockout: An
integrative model of the economic and stra-
tegic factors driving technology success and
failure,” Academy of Management Review 23:
267–284.
31. This discussion is based on: Teece, D. J.
(1986), “Profiting from technological innova-
tion: Implications for integration, collabora-
tion, licensing and public policy,” Research Policy 15: 285–305; and Ceccagnoli, M., and
F. T. Rothaermel (2008), “Appropriating the
returns to innovation,” Advances in Study of Entrepreneurship, Innovation, and Economic Growth 18: 11–34.
32. Abernathy, W. J., and J. M. Utterback
(1978), “Patterns of innovation in technology,”
Technology Review 80: 40–47; Benner, M.,
and M. A. Tushman (2003), “Exploitation,
exploration, and process management: The
productivity dilemma revisited,” Academy of Management Review 28: 238–256.
33. “Containers have been more important for
globalization than freer trade,” The Economist, May 18, 2013.
34. The article “Containers have been
more important for globalization than freer
trade,” The Economist, May 18, 2013, pres-
ents findings from the following research
studies: Hummels, D. (2007), “Transporta-
tion costs and international trade in the
second era of globalization,” Journal of Economic Perspectives 21: 131–154; Bald-
win, R. (2011), “Trade and industrializa-
tion after globalization’s 2nd unbundling:
How building and joining a supply chain
are different and why it matters,” NBER Working Paper 17716; and Bernhofen, D.,
Z. El-Sahli, and R. Keller (2013), “Estimat-
ing the Effects of the Container Revolution
on World Trade,” Working Paper, Lund
University.
35. This discussion is based on: Abernathy,
W. J., and J. M. Utterback (1978), “Patterns of
innovation in technology,” Technology Review
80: 40–47; Benner, M., and M. A. Tushman
(2003), “Exploitation, exploration, and pro-
cess management: The productivity dilemma
revisited,” Academy of Management Review
28: 238–256.
36. www.apple.com/ipad/pricing/ .
37. www.geeks.com .
38. The history of Spanx is documented at
www.spanx.com .
39. Harrigan, K. R. (1980), Strategies for Declining Businesses (Lexington, MA:
Heath).
40. Moore, G. A. (1991), Crossing the Chasm. Marketing and Selling Disruptive Products to Mainstream Customers (New
York: HarperCollins).
41. We follow the customer type category
originally introduced by E. M. Rogers (1962),
Diffusion of Innovations (New York: Free
Press) and also used by G. Moore (1991):
technology enthusiasts (~2.5%), early adopt-
ers (~13.5%), early majority (~34%), late
majority (~34%), and laggards (~16%).
Rogers’ book originally used the term innova-tors rather than technology enthusiasts for the
first segment. Given the specific definition of
innovation as commercialized invention in this
chapter, we follow Moore (1991, page 30) and
use the term technology enthusiasts.
42. “For wearable computers, future looks
blurry,” The Wall Street Journal, May 30,
2013.
43. Shiller, R. (1995), “Conversation, infor-
mation, and herd behavior,” American Eco-nomic Review 85: 181–185.
44. “A year of few dull moments,” The New York Times, December 21, 2012; “How the
wheels came off for Fisker,” The Wall Street Journal, April 24, 2013.
45. The Iridium example is drawn from:
Finkelstein, S. (2003), Why Smart Executives Fail: And What You Can Learn from Their Mistakes (New York: Portfolio).
46. In inflation-adjusted 2012 U.S. dollars.
The original price in 1998 was $3,000 and the
cost per minute up to $8.
47. “HP gambles on ailing Palm,” The Wall Street Journal, April 29, 2010.
48. “What’s gone wrong with HP?” The Wall Street Journal, November 6, 2012.
49. In 2013, RIM adopted BlackBerry as
company name.
50. Moore, G. A. (1991), Crossing the Chasm. Marketing and Selling Disruptive Products to Mainstream Customers (New
York: HarperCollins).
51. Shuen, A. (2008), Web 2.0: A Strategy Guide (Sebastopol, CA: O’Reilly Media);
Thursby, J., and M. Thursby (2006), Here or There? A Survey in Factors of Multinational R&D Location (Washington, DC: National
Academies Press).
52. Byers, T. H., R. C. Dorf, and A. J. Nel-
son (2011), Technology Entrepreneurship: From Idea to Enterprise (Burr Ridge, IL:
McGraw-Hill).
53. This discussion is based on: Schum-
peter, J. A. (1942), Capitalism, Socialism, and Democracy; Freeman, C., and L. Soete
(1997), The Economics of Industrial Innova-tion (Cambridge, MA: MIT Press); and Foster,
R., and S. Kaplan (2001), Creative Destruc-tion: Why Companies That Are Built to Last Underperform the Market—and How to Suc-cessfully Transform Them.
54. The discussion of incremental and radical
innovations is based on: Hill, C.W.L., and F.
T. Rothaermel (2003), “The performance of
incumbent firms in the face of radical techno-
logical innovation,” Academy of Management Review 28: 257–274.
55. Hill, C.W.L., and F. T. Rothaermel
(2003), “The performance of incumbent firms
in the face of radical technological innova-
tion,” Academy of Management Review 28:
257–274.
56. “A David and Gillette story,” The Wall Street Journal, April 12, 2012.
57. This discussion is based on: Hill, C.W.L.,
and F. T. Rothaermel (2003), “The perfor-
mance of incumbent firms in the face of radi-
cal technological innovation.”
58. Brandenburger, A. M., and B. J. Nale-
buff (1996), Co-opetition (New York: Cur-
rency Doubleday); and Christensen, C. M.,
and J. L. Bower (1996), “Customer power,
strategic investment, and the failure of lead-
ing firms,” Strategic Management Journal 17: 197–218; Adner, R. (2012), The Wide Lens. A New Strategy for Innovation (New
York: Portfolio)
59. Henderson, R., and K. B. Clark (1990),
“Architectural innovation: The reconfigura-
tion of existing technologies and the failure
of established firms,” Administrative Science Quarterly 35: 9–30.
60. This example is drawn from: Chesbrough,
H. (2003), Open Innovation. The New Impera-tive for Creating and Profiting from Technol-ogy (Boston, MA: Harvard Business School
Press).
61. The discussion of disruptive innovation
is based on: Christensen, C. M. (1997), The Innovator’s Dilemma: When New Technolo-gies Cause Great Firms to Fail (Boston, MA:
Harvard Business School Press); and Chris-
tensen, C. M., and M. E. Raynor (2003), The Innovator’s Solution: Creating and Sustaining Successful Growth (Boston, MA: Harvard
Business School Press).
62. Android here is used to include Chrome
OS. “Introducing the Google Chrome OS,”
The Official Google Blog, July 7, 2009, http://
googleblog.blogspot.com/2009/07/introduc-
ing-google-chrome-os.html .
63. See discussion on Business Models in
Chapter 1. See also: Anderson, C. (2009),
Free. The Future of a Radical Price.
64. Rindova, V., and S. Kotha (2001),
“ Continuous ‘morphing’: Competing through
WWW.YAZDANPRESS.COMWWW.YAZDANPRESS.COM

238 CHAPTER 7 Business Strategy: Innovation and Entrepreneurship
dynamic capabilities, form, and function,” Acad-emy of Management Journal 44: 1263–1280.
65. The new processor not only is inex-
pensive but also consumes little battery
power. Moreover, it marks a departure from
the Wintel (Windows and Intel) alliance,
because Microsoft did not have a suitable
operating system ready for the low-end
netbook market. Many of these computers
are using free software such as Google’s
Android operating system and Google Docs
for applications.
66. This approach is referred to as reverse innovation in the literature; see Govindarajan,
V. and C. Trimble (2012), Reverse Innova-tion: Create Far from Home, Win Everywhere
( Boston, MA: Harvard Business Review
Press).
67. This Strategy Highlight is based on:
Immelt, J. R., V. Govindarajan, and C.
Trimble (2009), “How GE is disrupting
itself,” Harvard Business Review, October;
author’s interviews with Michael Poteran
of GE Healthcare (10/30/09 and 11/04/09);
and “Vscan handheld ultrasound: GE unveils
‘stethoscope of the 21st century,’” The Huff-ington Post, October 20, 2009.
68. This section is based on: Anderson, C.
(2006), The Long Tail. Why the Future of Business Is Selling Less of More; and Ander-
son, C. (2009), Free. The Future of a Radical Price.
69. “A giant sucking sound,” The Economist, November 5, 2009.
70. Anderson, C. (2006), The Long Tail. Why the Future of Business Is Selling Less of More.
71. The discussion in this section draws
mainly on Chesbrough’s seminal work, but
also on the other insightful sources refer-
enced here. Chesbrough, H. W. (2003), Open Innovation: The New Imperative for Creating and Profiting from Technology (Boston, MA:
Harvard Business School Press); Chesbrough,
H. (2003), “The area of open innovation,” MIT Sloan Management Review, Spring: 35–41;
Chesbrough, H. (2007), “Why companies
should have open business models,” MIT Sloan Management Review, Winter: 22–28;
Chesbrough, H. W., and M. M. Appleyard
(2007), “Open innovation and strategy,”
California Management Review, Fall 50:
57–76; Laursen, K., and A. Salter (2006),
“Open for innovation: The role of openness
in explaining innovation performance among
U.K. manufacturing firms,” Strategic Manage-ment Journal 27: 131–150; and West, J., and
S. Gallagher (2006), “Challenges of open
innovation: The paradox of firm investment
in open-source software,” R&D Management 36: 319–331.
72. Rothaermel, F. T., and M. T. Alexan-
dre (2009), “Ambidexterity in technology
sourcing: The moderating role of absorptive
capacity,” Organization Science 20: 759–780;
Rothaermel, F. T., and A. M. Hess (2010),
“Innovation strategies combined,” MIT Sloan Management Review, Spring 51: 13–15.
73. Katz, R., and T. J. Allen (1982), “Inves-
tigating the Not Invented Here (NIH) syn-
drome: A look at the performance, tenure, and
communication patterns of 50 R&D project
groups,” R&D Management 12: 7–20.
74. Horbaczewski, A., and F. T. Rothaermel
(2013), “Merck: Open for innovation?” Case
Study MH-FTR-009-0077645065, available
at: http://create.mcgraw-hill.com .
75. Cohen, W. M., and D. A. Levinthal
(1990), “Absorptive capacity: New perspective
on learning and innovation,” Administrative Science Quarterly 35: 128–152; Zahra, S. A.,
and G. George (2002), “Absorptive capacity:
A review, reconceptualization, and extension,”
Academy of Management Review 27: 185–
203; and Rothaermel, F. T., and M. T. Alex-
andre (2009), “Ambidexterity in technology
sourcing: The moderating role of absorptive
capacity,” Organization Science 20: 759–780.
76. Huston, L., and N. Sakkab (2006), “Con-
nect & Develop: Inside Procter & Gamble’s
new model for innovation,” Harvard Business Review, March: 58–66; Lafley, A. G., and R.
L. Martin (2013), Playing to Win: How Strat-egy Really Works (Boston, MA: Harvard Busi-
ness Review Press); Rothaermel, F. T., and
M. T. Alexandre (2009), “Ambidexterity in
technology sourcing: The moderating role of
absorptive capacity,” Organization Science 20:
759–780; Rothaermel, F. T., and A. M. Hess
(2010), “Innovation strategies combined,”
MIT Sloan Management Review, Spring 51:
13–15; and “Diamond buys P&G’s Pringles,”
The Wall Street Journal, April 6, 2011.
77. http://www.fastcompany.com/section/
most-innovative-companies-2013 .
78. Burgelman, R. A. (1983), “Corporate
entrepreneurship and strategic management:
Insights from a process Study,” Manage-ment Science 29: 1349–1364; Burgelman,
R. A. (1991), “Intraorganizational ecology
of strategy making and organizational adap-
tation: Theory and field research,” Organi-zation Science 2: 239–262; and Burgelman,
R. A., and A. Grove (2007), “Let chaos
reign, then rein in chaos—repeatedly:
Managing strategic dynamics for corporate
longevity,” Strategic Management Journal 28: 965–979.
79. http://solutions.3m.com/innovation/
en_US/stories/time-to-think .
80. Data from Wikipedia, www.wikipedia.
org/wiki/wikipedia:about .
81. http://en.wikipedia.org/wiki/
Wikipedia:Donation_appeal_ideas.
82. Greenstein, S., and F. Zhu (2012), “Is
Wikipedia biased?” American Economic Review 102: 343–348.
83. “Gendercide in India,” The Economist, April 7, 2011; “Sex-selective abortion,” The Economist, June 28, 2011; “India women:
One dishonourable step backwards,” The Economist, May 11, 2012; and “India’s
skewed sex ratios,” The Economist, December
18, 2012.
84. Huston, L., and N. Sakkab (2006), “Con-
nect & Develop: Inside Procter & Gamble’s
new model for innovation,” Harvard Business Review, March: 58–66; Lafley, A. G., and
R. L. Martin (2013), Playing to Win: How Strategy Really Works (Boston, MA: Harvard
Business Review Press).
85. Huston, L., and N. Sakkab (2006), “Con-
nect & Develop: Inside Procter & Gamble’s
new model for innovation,” Harvard Business Review, March: 58–66; Lafley, A. G., and
R. L. Martin (2013), Playing to Win: How Strategy Really Works (Boston, MA: Harvard
Business Review Press).
86. This my Strategy example is based on:
“14 big businesses that started in a recession,”
www.insidecrm.com , November 11, 2008;
“Full-time MBA programs: Stanford Uni-
versity,” BusinessWeek, November 13, 2008;
“Start-ups that thrive in a recession,” The
Wall Street Journal, February 4, 2009; “Why
great companies get started in the downturns,”
www.vcconfidential.com , February 24, 2009;
and “M.B.A. students shift focus toward
entrepreneurship,” U.S. News & World Report, April 29, 2011.
WWW.YAZDANPRESS.COMWWW.YAZDANPRESS.COM

WWW.YAZDANPRESS.COMWWW.YAZDANPRESS.COM
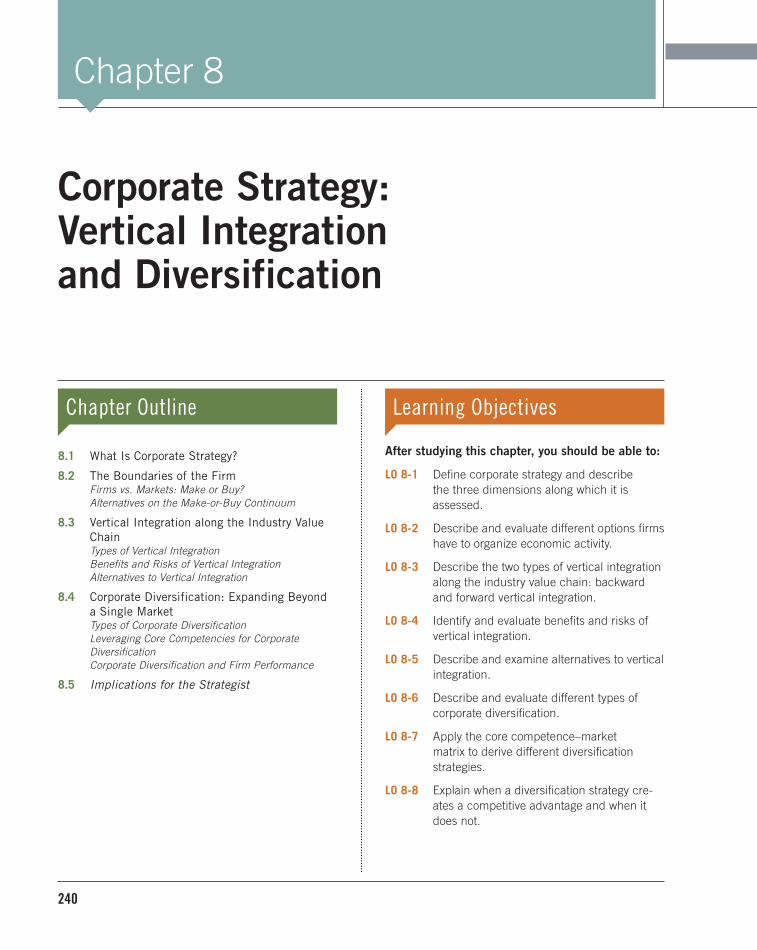
240
Corporate Strategy: Vertical Integration and Diversification
Chapter Outline
8.1 What Is Corporate Strategy?
8.2 The Boundaries of the Firm Firms vs. Markets: Make or Buy? Alternatives on the Make-or-Buy Continuum
8.3 Vertical Integration along the Industry Value
Chain Types of Vertical Integration Benefits and Risks of Vertical Integration Alternatives to Vertical Integration
8.4 Corporate Diversification: Expanding Beyond
a Single Market Types of Corporate Diversification Leveraging Core Competencies for Corporate Diversification Corporate Diversification and Firm Performance
8.5 Implications for the Strategist
Learning Objectives
After studying this chapter, you should be able to:
LO 8-1 Define corporate strategy and describe the three dimensions along which it is assessed.
LO 8-2 Describe and evaluate different options firms have to organize economic activity.
LO 8-3 Describe the two types of vertical integration along the industry value chain: backward and forward vertical integration.
LO 8-4 Identify and evaluate benefits and risks of vertical integration.
LO 8-5 Describe and examine alternatives to vertical integration.
LO 8-6 Describe and evaluate different types of corporate diversification.
LO 8-7 Apply the core competence–market matrix to derive different diversification strategies.
LO 8-8 Explain when a diversification strategy cre-ates a competitive advantage and when it does not.
Chapter 8
WWW.YAZDANPRESS.COMWWW.YAZDANPRESS.COM

241
J
CHAPTER CASE 8
Refocusing GE: A Future of
Clean-Tech and Health Care?
J EFFREY IMMELT WAS APPOINTED chairman and CEO of General Electric (GE) on September 7, 2001. Since then, the external environment has experienced con-tinuous and dramatic change: first, the social and economic effects of the 9/11 terrorist attacks, fol-lowed later by the 2008–2009 global financial crisis. Although GE is a diversified conglomerate that spans many industries and markets, the recession in 2001 and the even deeper recession of 2008–2009 hit the company especially hard. One reason was the finan-cial blow that GE Capital took, since more than half of GE’s profits came from that unit. In a critical 17 months, GE’s share price fell 84 percent, from $42.12 (on October 2, 2007) to $6.66 (on March 5, 2009), equating to a loss in shareholder value of $378 bil-lion. To compound matters, GE also lost its AAA credit rating, and the company had to ask for a $15 billion liquidity injection from famed investor Warren Buffett. Between 2008 and 2013, GE significantly underper-formed the Dow Jones Industrial Index.
The need for change was clear to Mr. Immelt. In 2009, GE’s five business units (Technology Infrastruc-ture, Energy Infrastructure, Capital Finance, Con-sumer and Industrial, and NBC Universal) brought in $157 billion in annual revenues. More than 50 per-cent of those revenues came from outside the United States, and GE employed more than 300,000 people in over 100 countries. Mr. Immelt decided to refocus GE’s portfolio of businesses to reduce its exposure to capital markets and to achieve reliable and sustain-able future growth by leveraging its core competency in industrial engineering. GE sold NBC Universal to Comcast, the largest U.S. cable operator, and also put its century-old appliance unit up for sale. GE had iden-tified the clean-technology sector and, more recently, health care as major future-growth industries. To capi-talize on these opportunities, GE launched two strate-gic initiatives: ecomagination and healthymagination.
Ecomagination is GE’s clean-tech strategic ini-tiative, launched in 2005 and renewed in 2010 by adding another $10 billion in investments. As Mr. Immelt explains, its strategic intent is “to focus our unique energy, technology, manufacturing, and infrastructure capabilities to develop tomorrow’s solutions such as solar energy, hybrid locomotives, fuel cells, lower-emission aircraft engines, lighter and stronger materials, efficient lighting, and water purification technology.” 1 The ecomagination initia-tive generates roughly $25 billion in annual reve-nues for GE.
Healthymagination, launched in 2009, is GE’s newest strategic initiative. Its goal is to increase the quality of, and access to, health care while lower-ing its cost. Investing $6 billion by 2015, GE’s stra-tegic intent is to reduce the cost of health care by 15 percent, increase access to essential health care services worldwide by 15 percent, reach a minimum of 100 million people a year, and improve health care quality by 15 percent by streamlining health care procedures, processes, and standards. 2
These two strategic initiatives are tools with which GE’s top executives are attempting to drive change within their large multinational corpora-tion. In particular, Mr. Immelt hopes that the two new strategic initiatives not only position GE to take advantage of opportunities in future industries, but also facilitate more lateral cooperation between the disparate GE strategic business units to share R&D, technology, management processes, and talent.
After reading the chapter, you will find more about this case, with related questions, on page 267.
WWW.YAZDANPRESS.COMWWW.YAZDANPRESS.COM

242 CHAPTER 8 Corporate Strategy: Vertical Integration and Diversification
AS A MULTIBUSINESS enterprise, GE has been changing its corporate strategy
in several ways. One, it has moved away from slow-growing businesses, such as
appliances and entertainment, and turned to future-growth industries, such as clean-tech
and health care. Two, Jeffrey Immelt reduced GE’s exposure to the financial markets by
trimming the GE Capital unit. Although during the first decade of the 2000s GE Capital
produced roughly half of GE’s profits based on one-third of its revenues, it made GE more
vulnerable to changes in the macro environment such as the 2008–2009 financial crisis.
Three, GE is also focusing more on faster growing international markets such as those in
Asia, Eastern Europe, and the Middle East.
These changes in GE’s portfolio of businesses and geographic focus illustrate that firms
must decide in which industries and global markets to compete. Moreover, these choices are
likely to change over time in response to opportunities and threats in the external environ-
ment. Answers to the important question of where to compete are captured in a firm’s corpo-rate strategy, which we cover in the next three chapters. In this chapter, we define corporate
strategy and then look at two fundamental corporate strategy topics: vertical integration and
diversification. We conclude the chapter with Implications for the Strategist that provide a
practical application of dynamic corporate strategy at Nike and adidas.
8.1 What Is Corporate Strategy?
Strategy formulation centers around the key questions of where and how to compete. Busi-ness strategy concerns the question of how to compete in a single product market. As dis-
cussed in Chapter 6, the two generic business strategies that firms can pursue in their quest
for competitive advantage are to increase differentiation (while containing cost) or lower
costs (while maintaining differentiation). If trade-offs can be reconciled, some firms might
be able to pursue an integration strategy by increasing differentiation and lowering costs.
As firms grow, they are frequently expanding their business activities through seeking out
new markets both by offering new products and services and by competing in different
geographies. When this happens, managers must formulate a corporate strategy. To gain
and sustain competitive advantage, therefore, any corporate strategy must align with and
strengthen a firm’s business strategy, whether it is differentiation, cost leadership, or an
integration strategy.
Corporate strategy comprises the decisions that senior management makes and the
goal-directed actions it takes in the quest for competitive advantage in several industries
and markets simultaneously. 3 It provides answers to the key question of where to compete. Corporate strategy determines the boundaries of the firm along three dimensions: industry
value chain, products and services, and geography (regional, national, or global markets).
Executives must decide:
1. In what stages of the industry value chain to participate. The industry value chain
describes the transformation of raw materials into finished goods and services along
distinct vertical stages. This decision determines the firm’s vertical integration.
2. What range of products and services to offer. This decision determines the firm’s level
of diversification.
3. Where to compete in terms of regional, national, or international markets. This decision
determines the firm’s geographic scope.
Although many managers have input to this important decision-making process,
the responsibility for corporate strategy ultimately rests with the CEO. We noted in
ChapterCase 8, for example, General Electric CEO Immelt’s attempt to refocus the con-
glomerate on future-growth industries through the ecomagination and healthymagination
LO 8-1
Define corporate strategy and describe the three dimensions along which it is assessed.
corporate strategy
The decisions that senior management makes and the goal-directed actions it takes to gain and sustain competitive advantage in several industries and markets simultaneously; addresses where to compete along three dimensions: products and services, industry value chain, and geography (regional, national, or global markets).
WWW.YAZDANPRESS.COMWWW.YAZDANPRESS.COM

CHAPTER 8 Corporate Strategy: Vertical Integration and Diversification 243
strategic initiatives. In his 2010 letter to shareholders,
Mr. Immelt confirmed GE’s back-to-its-roots corporate
strategy: “As we grew, financial services became too
big and added too much volatility. GE must be an indus-
trial company first. We have increased our investment in
industrial growth.” 4
Where to compete in terms of industry value chain,
products and services, and geography are the fundamen-
tal corporate strategic decisions. The underlying strate-
gic management concepts that will guide our discussion
of vertical integration, diversification, and geographic
competition are core competencies, economies of scale, economies of scope, and transaction costs.
■ Core competencies are unique strengths embedded deep within a firm (as discussed
in Chapter 4). Core competencies allow a firm to differentiate its products and ser-
vices from those of its rivals, creating higher value for the customer or offering prod-
ucts and services of comparable value at lower cost. According to the resource-based view of the firm, a firm’s boundaries are delineated by its knowledge bases and com-
petencies. 5 Activities that draw on what the firm knows how to do well (e.g., Honda’s
core competency in small, highly reliable engines, or Google’s core competency in
developing proprietary search algorithms) should be done in-house, while non-core
activities such as payroll and facility maintenance can be outsourced. In this per-
spective, the internally held knowledge underlying a core competency determines a
firm’s boundaries.
■ Economies of scale occur when a firm’s average cost per unit decreases as its output
increases (as discussed in Chapter 6). Anheuser-Busch InBev, the largest global brewer
(producer of brands such as Budweiser, Bud Light, Stella Artois, and Beck’s), reaps
significant economies of scale. Given its size, it is able to spread its fixed costs over
the millions of gallons of beer it brews each year, in addition to the significant buyer
power its large market share affords. Larger market share, therefore, often leads to
lower costs.
■ Economies of scope, in turn, are the savings that come from producing two (or more)
outputs or providing different services at less cost than producing each individually,
though using the same resources and technology (as discussed in Chapter 6). Lever-
aging its online retailing expertise, for example, Amazon benefits from economies of
scope: It can offer a large range of different product and service categories at a lower
cost than it would take to offer each product line individually.
■ Transaction costs are all costs associated with an economic exchange. The concept
is developed in transaction cost economics, a strategic management framework, and
enables managers to answer the question of whether it is cost-effective for their firm
to expand its boundaries through vertical integration or diversification. This implies
taking on greater ownership of the production of needed inputs or of the channels by
which it distributes its outputs, or adding business units that offer new products and
services.
We begin our study of corporate strategy by drawing on transaction cost economics to
explain vertical integration, meaning the choices a firm makes concerning its boundar-
ies. Later, we will explore managerial decisions relating to diversification, which directly
affect the firm’s range of products and services in multi-industry competition.
WWW.YAZDANPRESS.COMWWW.YAZDANPRESS.COM

244 CHAPTER 8 Corporate Strategy: Vertical Integration and Diversification
8.2 The Boundaries of the Firm
Determining the boundaries of the firm so that it is more likely to gain and sustain a com-
petitive advantage is the critical challenge in corporate strategy. 6 A theoretical framework
in strategic management called transaction cost economics explains and predicts the
boundaries of the firm. Insights gained from transaction cost economics help managers
decide what activities to do in-house versus what services and products to obtain from
the external market. This stream of research was first initiated by Nobel Laureate Ronald
Coase, who asked a fundamental question: Given the efficiencies of free markets, why do
firms even exist? The key insight of transaction cost economics is that different institu-tional arrangements —markets versus firms—have different costs attached.
To start, we need to identify transaction costs : these are all internal and external costs
associated with an economic exchange, whether it takes place within the boundaries of
a firm or in markets. 7 Exhibit 8.1 visualizes the notion of transaction costs. It shows the
respective internal transactions costs within Firm A and Firm B, as well as the external
transactions that occur when Firm A and Firm B do business with one another.
The total costs of transacting consist of external and internal transaction costs, as follows:
■ When companies transact in the open market, they incur external transaction costs : the costs of searching for a firm or an individual with whom to contract, and then nego-
tiating, monitoring, and enforcing the contract.
■ Transaction costs can occur within the firm as well. Considered internal transaction costs , these include costs pertaining to organizing an economic exchange within a
firm—for example, the costs of recruiting and retaining employees, paying salaries and
benefits, setting up a shop floor, providing office space and computers, and organizing,
monitoring, and supervising work. Internal transaction costs also include administra-
tive costs associated with coordinating economic activity between different business
units of the same corporation such as transfer pricing for input factors, and between
LO 8-2
Describe and evaluate different options firms have to organize economic activity.
InternalTransaction
Costs
Firm B
InternalTransaction
Costs
Firm A
ExternalTransaction
Costs
Market EXHIBIT 8.1 /
Internal and External Transaction Costs
transaction cost
economics A theoretical framework in strategic management to explain and predict the boundaries of the firm, which is central to formulating a corporate strategy that is more likely to lead to competitive advantage.
transaction costs All internal and external costs associated with an economic exchange, whether within a firm or in markets.
external transaction
costs Costs of searching for a firm or an individual with whom to contract, and then negotiating, monitoring, and enforcing the contract.
internal transaction costs
Costs pertaining to organizing an economic exchange within a hierarchy; also called administrative costs.
WWW.YAZDANPRESS.COMWWW.YAZDANPRESS.COM

• Command and control - Fiat - Hierarchical lines of authority
• Coordination• Transaction-specific investments• Community of knowledge
• High-powered incentives• Flexibility
• Administrative costs• Low-powered incentives• Principal–agent problem
• Search costs• Opportunism
- Hold-up• Incomplete contracting
- Specifying & measuring performance - Information asymmetries
• Enforcement of contracts
Ad
van
tag
es
Dis
ad
van
tag
es
MarketsFirm
EXHIBIT 8.2 / Organizing Economic Activity: Firms vs. Markets
CHAPTER 8 Corporate Strategy: Vertical Integration and Diversification 245
business units and corporate headquarters including important decisions pertaining to
resource allocation, among others. Internal transaction costs tend to increase with orga-
nizational size and complexity.
FIRMS VS. MARKETS: MAKE OR BUY?
Transaction cost economics allows us to explain which activities a firm should pursue in-
house (“make”) versus which goods and services to obtain externally (“buy”). These deci-
sions help determine the boundaries of the firm. In some cases, costs of using the market such
as search costs, negotiating and drafting contracts, monitoring work, and enforcing contracts
when necessary may be higher than integrating the activity within a single firm and coordi-
nating it through an organizational hierarchy. When the costs of pursuing an activity in-house
are less than the costs of transacting for that activity in the market ( C in-house < C market ), then the
firm should vertically integrate by owning production of the needed inputs or the channels
for the distribution of outputs. In other words, when firms are more efficient in organizing
economic activity than are markets, which rely on contracts among many independent actors,
firms should vertically integrate. 8
For example, rather than contracting in the open market for individual pieces of soft-
ware code, Google hires programmers to write code in-house. Owning these software-
development capabilities is valuable to the firm because its costs such as salaries and
employee benefits to in-house computer programmers are less than what they would
be in the open market. More importantly, Google gains economies of scope in soft-
ware development resources and capabilities and reduces the monitoring costs. This
is because skills acquired in writing software code for its different Internet-based ser-
vice offerings are transferable to new offerings. Programmers working on the original
proprietary software code for the Google search engine leveraged these skills in creat-
ing a highly profitable online advertising business (AdWords and AdSense). 9 Although
some of Google’s software products are open source, such as the Android operating
system, many of the company’s Internet
services are based on closely guarded
and proprietary software code. Google,
like many leading high-tech companies
such as Amazon, Apple, Facebook, and
Microsoft, relies on proprietary software
code and algorithms, because using the
open market to transact for individual
pieces of software would be prohibitively
expensive. Also, the firms would need
to disclose the underlying software code
to outside developers, thus negating the
value-creation potential.
Firms and markets, as different insti-
tutional arrangements for organizing eco-
nomic activity, have their own distinct
advantages and disadvantages, summarized
in Exhibit 8.2 .
The advantages of firms include:
■ The ability to make command-and- control decisions by fiat along clear
hierarchical lines of authority.
WWW.YAZDANPRESS.COMWWW.YAZDANPRESS.COM

246 CHAPTER 8 Corporate Strategy: Vertical Integration and Diversification
■ Coordination of highly complex tasks to allow for specialized division of labor. ■ Transaction-specific investments, such as specialized robotics equipment that is highly
valuable within the firm, but of little or no use in the external market.
■ Creation of a community of knowledge.
The disadvantages of organizing economic activity within firms include:
■ Administrative costs because of necessary bureaucracy.
■ Low-powered incentives, such as hourly wages and salaries. These often are less attrac-
tive motivators than the entrepreneurial opportunities and rewards that can be obtained
in the open market.
■ The principal–agent problem.
The principal–agent problem is a major disadvantage of organizing economic activity
within firms, as opposed to within markets. It can arise when an agent such as a manager,
performing activities on behalf of the principal (the owner of the firm), pursues his or her
own interests. 10 Indeed, the separation of ownership and control is one of the hallmarks of
a publicly traded company, and so some degree of the principal–agent problem is almost
inevitable. 11 For example, a manager may pursue his or her own interests such as job secu-
rity and managerial perks (e.g., corporate jets and golf outings) that conflict with the prin-
cipal’s goals—in particular, creating shareholder value. One potential way to overcome the
principal–agent problem is to give stock options to managers, thus making them owners.
We will revisit the principal–agent problem, with related ideas, in Chapters 11 and 12.
The advantages of markets include:
■ High-powered incentives. Rather than work as a salaried engineer for an existing firm,
for example, an individual can start a new venture offering specialized software. High-
powered incentives of the open market include the entrepreneur’s ability to capture the
venture’s profit, to take a new venture through an initial public offering (IPO), or to be
acquired by an existing firm. In these so-called liquidity events, a successful entrepre-
neur can make potentially enough money to provide financial security for life. 12
■ Increased flexibility. Transacting in markets enables those who wish to purchase goods
to compare prices and services among many different providers.
The disadvantages of markets include:
■ Search costs. On a very fundamental level, perhaps the biggest disadvantage of trans-
acting in markets, rather than owning the various production and distribution activities
within the firm itself, entails non-trivial search costs. In particular, a firm faces search
costs when it must scour the market to find reliable suppliers from among the many
firms competing to offer similar products and services. Even more difficult can be
the search to find suppliers when the specific products and services needed are not
offered at all by firms currently in the market. In this case, production of supplies
would require transaction-specific investments, an advantage of firms.
■ Opportunism by other parties. Opportunism is behavior characterized by self-interest
seeking with guile (we’ll discuss this in more detail later).
■ Incomplete contracting. Although market transactions are based on implicit and
explicit contracts, all contracts are incomplete to some extent, because not all future
contingencies can be anticipated at the time of contracting. It is also difficult to specify
expectations (e.g., What stipulates “acceptable quality” in a graphic design project?) or
to measure performance and outcomes (e.g., What does “excess wear and tear” mean
when returning a leased car?). Another serious hazard inherent in contracting is infor-mation asymmetry (which we discuss next).
principal–agent
problem Situation in which an agent performing activities on behalf of a principal pursues his or her own interests.
WWW.YAZDANPRESS.COMWWW.YAZDANPRESS.COM

CHAPTER 8 Corporate Strategy: Vertical Integration and Diversification 247
■ Enforcement of contracts. It often is difficult, costly, and time-consuming to enforce
legal contracts. Not only does litigation absorb a significant amount of managerial
resources and attention, but it can easily amount to several million dollars in legal fees.
Legal exposure is one of the major hazards in using markets rather than integrating an
activity within a firm’s hierarchy.
Frequently, sellers have better information about products and services than buyers, which
in turn creates information asymmetries , situations in which one party is more informed
than another, because of the possession of private information. When firms transact in the
market, such unequal information can lead to a lemons problem. Nobel Laureate George
Akerlof first described this situation using the market for used cars as an example. 13 Assume
only two types of cars are sold: good cars and bad cars (lemons). Good cars are worth $8,000
and bad ones are worth $4,000. Moreover, only the seller knows whether a car is good or is
a lemon. Assuming the market supply is split equally between good and bad cars, the prob-
ability of buying a lemon is 50 percent. Buyers are aware of the general possibility of buying
a lemon and thus would like to hedge against it. Therefore, they split the difference and offer
$6,000 for a used car. This discounting strategy has the perverse effect of crowding out all
the good cars because the sellers perceive their value to be above $6,000. Assuming that to
be the case, all used cars offered for sale will be lemons.
The important take-away here is caveat emptor —buyer beware. Information
asymmetries can result in the crowding out of desirable goods and services by infe-
rior ones. This has been shown to be true in many markets, not just for used cars,
but also in e-commerce (e.g., eBay), mortgage-backed securities, and even col-
laborative R&D projects. 14
ALTERNATIVES ON THE MAKE-OR-BUY CONTINUUM
The “make” and “buy” choices anchor each end of a continuum from markets to
firms, as depicted in Exhibit 8.3 . Several alternative hybrid arrangements are in fact available
between these two extremes. 15 Moving from transacting in the market (“buy”) to full integration
(“make”), alternatives include short-term contracts as well as various forms of strategic alliances
(long-term contracts, equity alliances, and joint ventures) and parent–subsidiary relationships.
SHORT-TERM CONTRACTS. When engaging in short-term contracting, a firm sends
out requests for proposals ( RFPs ) to several companies, which initiates competitive bid-
ding for contracts to be awarded with a short duration, generally less than one year. 16
information
asymmetries
Situations in which one party is more informed than another, because of the possession of private information.
EXHIBIT 8.3 / Alternatives on the Make-or-Buy Continuum
Buy
Arm’s-lengthmarket transactions
Strategic Alliances
Short-termcontracts
Long-term contracts• Licensing• Franchising
Equityalliances
Jointventures
Make
Parent–subsidiary
relationship
Activitiesperformedin-house
Less integrated More integrated
WWW.YAZDANPRESS.COMWWW.YAZDANPRESS.COM

248 CHAPTER 8 Corporate Strategy: Vertical Integration and Diversification
The benefit to this approach lies in the fact that it allows a somewhat longer planning
period than individual market transactions. Moreover, the buying firm can often demand
lower prices due to the competitive bidding process. The drawback, however, is that firms
responding to the RFP have no incentive to make any transaction-specific investments
(e.g., buy new machinery to improve product quality) due to the short duration of the
contract. This is exactly what happened in the U.S. automotive industry when GM used
short-term contracts for standard car components to reduce costs. When faced with signifi-
cant cost pressures, suppliers reduced component quality in order to protect their eroding
margins. This resulted in lower-quality GM cars, contributing to a competitive advantage
vis-à-vis competitors, most notably Toyota but also Ford, which used a more cooperative,
longer-term partnering approach with their suppliers. 17
STRATEGIC ALLIANCES. As we move toward greater integration on the make-or-buy
continuum, the next organizational forms are strategic alliances . Strategic alliances are
voluntary arrangements between firms that involve the sharing of knowledge, resources,
and capabilities with the intent of developing processes, products, or services to lead to
competitive advantage. 18 Alliances have become a ubiquitous phenomenon, especially in
high-tech industries. Moreover, strategic alliances can facilitate investments in transaction-
specific assets without encountering the internal transaction costs involved in owning firms
in various stages of the industry value chain.
Strategic alliances is an umbrella term that denotes different hybrid organizational forms—
among them, long-term contracts, equity alliances, and joint ventures. Given their prevalence
in today’s competitive landscape, as a key vehicle to execute a firm’s corporate strategy, we
take a quick look at strategic alliances here and then study them in more depth in Chapter 9.
Long-Term Contracts. We noted that firms in short-term contracts have no incentive to
make transaction-specific investments. Long-term contracts, which work much like short-
term contracts but with a duration generally greater than one year, help overcome this
drawback. Long-term contracts help facilitate transaction-specific investments. Licensing , for example, is a form of long-term contracting in the manufacturing sector that enables
firms to commercialize intellectual property such as a patent. The first biotechnology drug
to reach the market, Humulin (human insulin), was developed by Genentech and commer-
cialized by Eli Lilly based on a licensing agreement.
In service industries, franchising is an example of long-term contracting. In these
arrangements, a franchisor such as McDonald’s, Burger King, 7-Eleven, H&R Block, or
Subway grants a franchisee (usually an entrepreneur owning no more than a few outlets)
the right to use the franchisor’s trademark and business processes to offer goods and ser-
vices that carry the franchisor’s brand name. Besides providing the capital to finance the
expansion of the chain, the franchisee generally pays an up-front (buy-in) lump sum to the
franchisor plus a percentage of revenues.
Equity Alliances. Yet another form of strategic alliance is an equity alliance —a partner-
ship in which at least one partner takes partial ownership in the other partner. A partner
purchases an ownership share by buying stock, and thus making an equity investment. The
taking of equity tends to signal greater commitment to the partnership.
Strategy Highlight 8.1 describes an equity alliance between Toyota and Orocobre Ltd.,
an Australian mineral-resource company, to facilitate specialized investments for the
exploration and mining of lithium, a critical input for lithium-ion batteries used in hybrid
and electric vehicles.
In a contract arrangement, one transaction partner could attempt to hold up the other, by
demanding lower prices or threatening to walk away from the agreement altogether (with
whatever financial penalties might be included in the contract). To assuage Orocobre’s
strategic alliances
Voluntary arrangements between firms that involve the sharing of knowledge, resources, and capabilities with the intent of developing processes, products, or services to lead to competitive advantage.
licensing A form of long-term contracting in the manufacturing sector that enables firms to commercialize intellectual property.
franchising A long-term contract in which a franchisor grants a franchisee the right to use the franchisor’s trademark and business processes to offer goods and services that carry the franchisor’s brand name; the franchisee in turn pays an up-front buy-in lump sum and a percentage of revenues.
WWW.YAZDANPRESS.COMWWW.YAZDANPRESS.COM

CHAPTER 8 Corporate Strategy: Vertical Integration and Diversification 249
Toyota Locks Up Lithium
for Car Batteries
In 2012, 40 percent of all Toyota cars sold in Japan and 14 percent sold globally were hybrid electric vehicles. Since the introduction of the first Prius model in 1997, Toyota has sold more than 5 million hybrid cars. It should come as no surprise then that global demand for lithium-ion batteries to propel hybrid electric cars has grown almost a hundred-fold, to $25 billion in 2014, up from a mere $278 million in 2009. Moreover, this type of battery requires large amounts of high-quality lith-ium, which is difficult and costly to extract. Given the specific geological conditions, the company mining the lithium must deploy highly specialized equipment, which is of little use in alternative applications.
Given the strong demand for its hybrid vehicles, Toyota Motor Corporation was interested in securing a long-term supply of lithium. It approached Orocobre, which holds the exploration rights to a large salt-lake area in northwestern
Argentina. Although lithium is found in several rock formations across the globe, large quantities can be extracted in a cost-effective manner only below the surfaces of salt flats. Initial investments in specialized equipment worth several hundred million dollars, however, are required even to understand the quality of the deposits. If the findings are positive, more invest-ments would be needed to exploit them commercially.
Should Orocobre make the investment in the special-ized equipment? What if the lithium is not of the quality expected, or a new technology emerges that is superior to lithium-ion batteries? If Toyota were merely to trans-act for the lithium in the market—by simply signing a contract with Orocobre that it would purchase any lithium it mined—Toyota could walk away from the exploratory proj-ect undertaken by Orocobre if the results were not what it had expected, or if the forecasted demand for lithium-ion batteries did not materialize. To mitigate Orocobre’s con-cerns, Toyota took an equity stake worth an estimated $120 million in this project. 19
8.1
concerns, Toyota made a credible commitment —a long-term strategic decision that is
both difficult and costly to reverse. Alternatively, Toyota could have acquired Orocobre
outright, thus engaging in backward vertical integration as well as in unrelated diversifica-
tion. This would have been, however, a much more costly and riskier strategic move.
Joint Ventures. In a joint venture , which is another special form of strategic alliance,
two or more partners create and jointly own a new organization. Since the partners con-
tribute equity to a joint venture, they make a long-term commitment, which in turn facili-
tates transaction-specific investments. Dow Corning, owned jointly by Dow Chemical and
Corning, is an example of a joint venture. Dow Corning, which focuses on silicone-based
technology, employs roughly 10,000 people and has $5 billion in annual revenues, which
shows that some joint ventures can be quite large. 20 Hulu, which offers web-based stream-
ing video of TV shows and movies, is also a joint venture, owned by NBC, Fox, and Dis-
ney. With three million users in 2013, Hulu is a smaller competitor to Netflix with some 30
million users. We will further discuss joint ventures in Chapter 9.
PARENT–SUBSIDIARY RELATIONSHIP. The parent–subsidiary relationship des-
cribes the most-integrated alternative to performing an activity within one’s own corpo-
rate family. The corporate parent owns the subsidiary and can direct it via command and
control. Transaction costs that arise are frequently due to political turf battles, which may
include the capital budgeting process and transfer prices, among other areas. For example,
although GM owns its European carmakers (Opel in Germany and Vauxhall in the United
Kingdom), it had problems bringing some of their know-how and design of small fuel-
efficient cars back into the U.S. This failure put GM at a competitive disadvantage vis-
à-vis the Japanese competitors when they were first entering the U.S. market with more
credible commitment
A long-term strategic decision that is both difficult and costly to reverse.
joint venture
Organizational form in which two or more partners create and jointly own a new organization.
WWW.YAZDANPRESS.COMWWW.YAZDANPRESS.COM
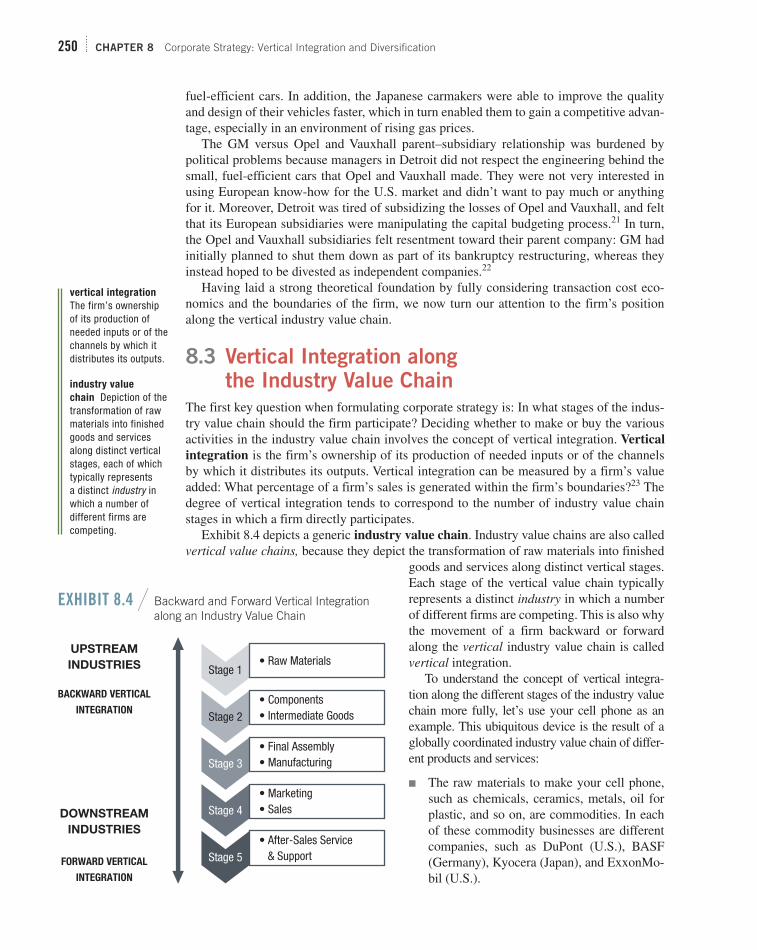
250 CHAPTER 8 Corporate Strategy: Vertical Integration and Diversification
fuel-efficient cars. In addition, the Japanese carmakers were able to improve the quality
and design of their vehicles faster, which in turn enabled them to gain a competitive advan-
tage, especially in an environment of rising gas prices.
The GM versus Opel and Vauxhall parent–subsidiary relationship was burdened by
political problems because managers in Detroit did not respect the engineering behind the
small, fuel-efficient cars that Opel and Vauxhall made. They were not very interested in
using European know-how for the U.S. market and didn’t want to pay much or anything
for it. Moreover, Detroit was tired of subsidizing the losses of Opel and Vauxhall, and felt
that its European subsidiaries were manipulating the capital budgeting process. 21 In turn,
the Opel and Vauxhall subsidiaries felt resentment toward their parent company: GM had
initially planned to shut them down as part of its bankruptcy restructuring, whereas they
instead hoped to be divested as independent companies. 22
Having laid a strong theoretical foundation by fully considering transaction cost eco-
nomics and the boundaries of the firm, we now turn our attention to the firm’s position
along the vertical industry value chain.
8.3 Vertical Integration along
the Industry Value Chain
The first key question when formulating corporate strategy is: In what stages of the indus-
try value chain should the firm participate? Deciding whether to make or buy the various
activities in the industry value chain involves the concept of vertical integration. Vertical integration is the firm’s ownership of its production of needed inputs or of the channels
by which it distributes its outputs. Vertical integration can be measured by a firm’s value
added: What percentage of a firm’s sales is generated within the firm’s boundaries? 23 The
degree of vertical integration tends to correspond to the number of industry value chain
stages in which a firm directly participates.
Exhibit 8.4 depicts a generic industry value chain . Industry value chains are also called
vertical value chains, because they depict the transformation of raw materials into finished
goods and services along distinct vertical stages.
Each stage of the vertical value chain typically
represents a distinct industry in which a number
of different firms are competing. This is also why
the movement of a firm backward or forward
along the vertical industry value chain is called
vertical integration.
To understand the concept of vertical integra-
tion along the different stages of the industry value
chain more fully, let’s use your cell phone as an
example. This ubiquitous device is the result of a
globally coordinated industry value chain of differ-
ent products and services:
■ The raw materials to make your cell phone,
such as chemicals, ceramics, metals, oil for
plastic, and so on, are commodities. In each
of these commodity businesses are different
companies, such as DuPont (U.S.), BASF
(Germany), Kyocera (Japan), and ExxonMo-
bil (U.S.).
vertical integration
The firm’s ownership of its production of needed inputs or of the channels by which it distributes its outputs.
industry value
chain Depiction of the transformation of raw materials into finished goods and services along distinct vertical stages, each of which typically represents a distinct industry in which a number of different firms are competing.
EXHIBIT 8.4 / Backward and Forward Vertical Integration along an Industry Value Chain
Stage 1• Raw Materials
Stage 2• Components• Intermediate Goods
Stage 3• Final Assembly• Manufacturing
Stage 4• Marketing• Sales
Stage 5• After-Sales Service & Support
UPSTREAMINDUSTRIES
BACKWARD VERTICAL
INTEGRATION
DOWNSTREAMINDUSTRIES
FORWARD VERTICAL
INTEGRATION
WWW.YAZDANPRESS.COMWWW.YAZDANPRESS.COM
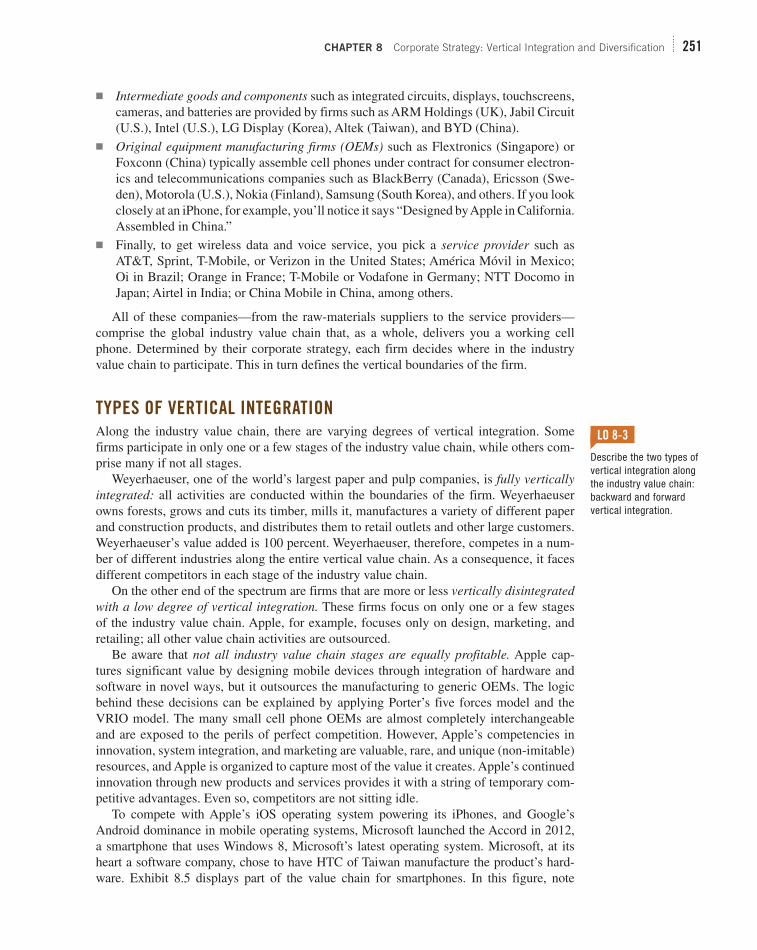
CHAPTER 8 Corporate Strategy: Vertical Integration and Diversification 251
■ Intermediate goods and components such as integrated circuits, displays, touchscreens,
cameras, and batteries are provided by firms such as ARM Holdings (UK), Jabil Circuit
(U.S.), Intel (U.S.), LG Display (Korea), Altek (Taiwan), and BYD (China).
■ Original equipment manufacturing firms (OEMs) such as Flextronics (Singapore) or
Foxconn (China) typically assemble cell phones under contract for consumer electron-
ics and telecommunications companies such as BlackBerry (Canada), Ericsson (Swe-
den), Motorola (U.S.), Nokia (Finland), Samsung (South Korea), and others. If you look
closely at an iPhone, for example, you’ll notice it says “Designed by Apple in California.
Assembled in China.”
■ Finally, to get wireless data and voice service, you pick a service provider such as
AT&T, Sprint, T-Mobile, or Verizon in the United States; América Móvil in Mexico;
Oi in Brazil; Orange in France; T-Mobile or Vodafone in Germany; NTT Docomo in
Japan; Airtel in India; or China Mobile in China, among others.
All of these companies—from the raw-materials suppliers to the service providers—
comprise the global industry value chain that, as a whole, delivers you a working cell
phone. Determined by their corporate strategy, each firm decides where in the industry
value chain to participate. This in turn defines the vertical boundaries of the firm.
TYPES OF VERTICAL INTEGRATION
Along the industry value chain, there are varying degrees of vertical integration. Some
firms participate in only one or a few stages of the industry value chain, while others com-
prise many if not all stages.
Weyerhaeuser, one of the world’s largest paper and pulp companies, is fully vertically integrated: all activities are conducted within the boundaries of the firm. Weyerhaeuser
owns forests, grows and cuts its timber, mills it, manufactures a variety of different paper
and construction products, and distributes them to retail outlets and other large customers.
Weyerhaeuser’s value added is 100 percent. Weyerhaeuser, therefore, competes in a num-
ber of different industries along the entire vertical value chain. As a consequence, it faces
different competitors in each stage of the industry value chain.
On the other end of the spectrum are firms that are more or less vertically disintegrated with a low degree of vertical integration. These firms focus on only one or a few stages
of the industry value chain. Apple, for example, focuses only on design, marketing, and
retailing; all other value chain activities are outsourced.
Be aware that not all industry value chain stages are equally profitable. Apple cap-
tures significant value by designing mobile devices through integration of hardware and
software in novel ways, but it outsources the manufacturing to generic OEMs. The logic
behind these decisions can be explained by applying Porter’s five forces model and the
VRIO model. The many small cell phone OEMs are almost completely interchangeable
and are exposed to the perils of perfect competition. However, Apple’s competencies in
innovation, system integration, and marketing are valuable, rare, and unique (non- imitable)
resources, and Apple is organized to capture most of the value it creates. Apple’s continued
innovation through new products and services provides it with a string of temporary com-
petitive advantages. Even so, competitors are not sitting idle.
To compete with Apple’s iOS operating system powering its iPhones, and Google’s
Android dominance in mobile operating systems, Microsoft launched the Accord in 2012,
a smartphone that uses Windows 8, Microsoft’s latest operating system. Microsoft, at its
heart a software company, chose to have HTC of Taiwan manufacture the product’s hard-
ware. Exhibit 8.5 displays part of the value chain for smartphones. In this figure, note
LO 8-3
Describe the two types of vertical integration along the industry value chain: backward and forward vertical integration.
WWW.YAZDANPRESS.COMWWW.YAZDANPRESS.COM
EXHIBIT 8.5 / HTC’s Backward and Forward Integration along the Industry Value Chain in the Smartphone Industry
Stage 1
• Design
Stage 2
• Manufacturing
Stage 3
• Marketing & Sales
Stage 4
• After-Sales Service & Support
BACKWARD
VERTICAL
INTEGRATION
FORWARD
VERTICAL
INTEGRATION
s Apple, BlackBerry, Google, Ericsson, Microsoft, Motorola, LG, Nokia, Samsung, HTC
s Apple, BlackBerry, Google, Ericsson, Microsoft, Motorola, LG, Nokia, Samsung, HTC
s Foxconn, Flextronics, LG, Samsung, OEMs
s AT&T, Sprint, T-Mobile, Verizon
HTC
252 CHAPTER 8 Corporate Strategy: Vertical Integration and Diversification
HTC’s transformation from a no-name
OEM manufacturer in stage 2 of the
value chain, to a significant player in
the design, manufacture, and sale of
smartphones (stages 1 and 3). It now
offers a lineup of innovative and high-
performance smartphones under the
HTC label. 24
Over time, HTC was able to
upgrade its capabilities from merely
manufacturing smartphones to also
designing products. 25 In doing so,
HTC engaged in backward vertical integration —moving ownership of
activities upstream to the originating
inputs of the value chain. Moreover,
by moving downstream into sales and
increasing its branding activities, HTC
has also engaged in forward vertical integration —moving ownership of
activities closer to the end customer.
Although HTC has long benefitted
from economies of scale as an OEM, it is now also benefitting from economies of scope
through participating in different stages of the industry value chain. For instance, it now is
able to share competencies in product design, manufacturing, and sales, while at the same
time attempting to reduce transaction costs.
BENEFITS AND RISKS OF VERTICAL INTEGRATION
To decide the degree and type of vertical integration to pursue, managers need to under-
stand the possible benefits and risks of vertical integration.
BENEFITS OF VERTICAL INTEGRATION. Vertical integration, either backward or
forward, can have a number of benefits, including: 26
■ Securing critical supplies and distribution channels
■ Lowering costs
■ Improving quality
■ Facilitating scheduling and planning
■ Facilitating investments in specialized assets
As noted earlier, HTC started as an OEM for brand-name mobile device companies
such as Motorola and Nokia, or telecom service providers such as AT&T and T-Mobile.
It backwardly integrated into smartphone design by acquiring One & Co., a San Fran-
cisco–based design firm. 27 The acquisition allowed HTC to secure scarce design talent
and capabilities that it leveraged into the design of smartphones with superior quality and
features built in, enhancing the differentiated appeal of its products. Moreover, HTC can
now design phones that leverage its low-cost manufacturing capabilities.
Likewise, forward integration into distribution and sales allows companies to more
effectively plan for and respond to changes in demand. HTC’s forward integration into
sales enables it to offer its products directly to wireless providers such as AT&T, Sprint,
backward vertical
integration Changes in an industry value chain that involve moving ownership of activities upstream to the originating (inputs) point of the value chain.
forward vertical
integration Changes in an industry value chain that involve moving ownership of activities closer to the end (customer) point of the value chain.
LO 8-4
Identify and evaluate benefits and risks of vertical integration.
WWW.YAZDANPRESS.COMWWW.YAZDANPRESS.COM

CHAPTER 8 Corporate Strategy: Vertical Integration and Diversification 253
and Verizon. HTC even offers unlocked phones directly to the end consumer via its own
website. With ownership and control of more stages of the industry value chain, HTC
is now in a much better position to respond if, for example, demand for its latest phone
should suddenly pick up.
PepsiCo’s corporate strategy highlights several benefits to vertical integration. In 2009,
PepsiCo forwardly integrated by buying its bottlers in order to obtain more control over its
quality, pricing, distribution, and in-store display. This $8 billion purchase reversed a 1999
decision in which PepsiCo sold its bottlers in order to focus on marketing. CEO Indra Nooyi
revised Pepsi’s strategic intent to broaden its menu of offerings to include noncarbonated
beverages such as flavored water enhanced with vitamins and fruit juices. With an integrated
value chain, Ms. Nooyi hoped to improve decision making and enhance flexibility to bring
these innovative products to market faster, while reducing costs by more than $400 million. 28
Because of the strategic interdependence of companies in an oligopoly (as studied in
Chapter 3), it came as no surprise that only a few months later, in early 2010, Pepsi’s archri-
val Coca-Cola responded with its own forward integration move and purchased its bottlers
for $12 billion. Coca-Cola also indicated that more control of manufacturing and distribution
was the key driver behind this deal. Moreover, Coca-Cola pegged the expected cost savings
at $350 million. Like PepsiCo, Coca-Cola’s forward integration represented a major depar-
ture from its decade-old business model with large independent bottlers and distributors. 29
Vertical integration allows firms to increase operational efficiencies through improved
coordination and the fine-tuning of adjacent value chain activities. Keeping the down-
stream value chain activities independent worked well for PepsiCo and Coca-Cola during
the 1980s and 1990s, when consumption of soda beverages was on the rise. However, inde-
pendent bottlers are cost-effective only when doing large-volume business of a few, limited
product offerings. With Pepsi’s and Coke’s more diversified portfolio of noncarbonated
and healthier drinks, the costs of outsourcing bottling and distribution to independent bot-
tlers increased significantly. Some of the independent bottlers even lacked the specialized
equipment needed to produce the niche drinks now in demand. In addition, the indepen-
dent bottlers’ direct store-delivery system adds significant costs. To overcome this prob-
lem, the soft drink giants had begun to deliver some of their niche products such as Pepsi’s
Gatorade and SoBe Lifewater and Coke’s Powerade and Glacéau directly to warehouse
retailers such as Sam’s Club and Costco. By owning the bottlers, both companies can
deliver all products through one channel, thus lowering the overall cost of distribution.
Given the increase in costs of using independent bottlers (or the market), the forward inte-
gration of Pepsi and Coca-Cola is in line with predictions derived from transaction cost eco-
nomics. Controlling the delivery part of the value chain also enhances the soft drink giants’
bargaining power when negotiating product price, placement, and promotion. Looking at
Porter’s five forces model, Pepsi and Coke are reducing the bargaining power of buyers and
thus shifting the industry structure in their favor. End consumers are likely to benefit from
Coke’s and Pepsi’s forward integration in the form of a wider variety of niche drinks. Taken
together, vertical integration can increase differentiation and reduce costs, thus strengthening
a firm’s strategic position as the gap between value creation and costs widens.
Vertical integration along the industry value chain can also facilitate investments in spe-cialized assets. What does this mean? Specialized assets have a high opportunity cost:
They have significantly more value in their intended use than in their next-best use. 30 They
can come in several forms: 31
■ Site specificity. Assets are required to be co-located, such as the equipment necessary
for mining bauxite and aluminum smelting.
■ Physical-asset specificity. Assets whose physical and engineering properties are
designed to satisfy a particular customer, such as bottling machinery for Coca-Cola and
specialized assets
Unique assets with high opportunity cost: They have significantly more value in their intended use than in their next-best use. They come in three types: site specificity, physical-asset specificity, and human-asset specificity.
WWW.YAZDANPRESS.COMWWW.YAZDANPRESS.COM

254 CHAPTER 8 Corporate Strategy: Vertical Integration and Diversification
PepsiCo. Since the bottles have different and often trademarked shapes, they require
unique molds. Cans, in contrast, do not require physical-asset specificity because they
are generic.
■ Human-asset specificity. Investments made in human capital to acquire unique knowl-
edge and skills, such as mastering the routines and procedures of a specific organiza-
tion, which are not transferable to a different employer.
Why do investments in specialized assets tend to incur high opportunity costs? Making
the specialized investment opens up the threat of opportunism by one of the partners. Oppor-
tunism is defined as self-interest seeking with guile. 32 Backward vertical integration is often
undertaken to overcome the threat of opportunism and in securing key raw materials.
In an effort to secure supplies and reduce the costs of jet fuel, Delta was the first airline
to acquire an oil refinery. In 2012, it purchased a Pennsylvania-based facility from Cono-
coPhillips. Delta estimates that this backward vertical integration move not only will allow
it to provide 80 percent of its fuel internally, but will also save it some $300 million in costs
annually. Fuel costs are quite significant for airlines; for Delta, they are almost 40 percent
of its total operating cost. 33
RISKS OF VERTICAL INTEGRATION. Depending on the situation, vertical integra-
tion has several risks, including: 34
■ Increasing costs
■ Reducing quality
■ Reducing flexibility
■ Increasing the potential for legal repercussions
A higher degree of vertical integration can lead to increasing costs for a number of rea-
sons. In-house suppliers tend to have higher cost structures because they are not exposed
to market competition. Knowing there will always be a buyer for their products reduces
their incentives to lower costs. In contrast, suppliers in the open market, because they serve
a much larger market, can achieve economies of scale that elude in-house suppliers. Orga-
nizational complexity increases with higher levels of vertical integration, thereby increas-
ing administrative costs such as determining the appropriate transfer prices between an
in-house supplier and buyer. Administrative costs are part of internal transaction costs and
arise from the coordination of multiple divisions, political maneuvering for resources, the
consumption of company perks, or simply from employees slacking off.
The knowledge that there will always be a buyer for their products not only reduces the
incentives of in-house suppliers to lower costs, but also can reduce the incentive to increase
quality or come up with innovative new products. Moreover, given their larger scale and
greater exposure to more customers, external suppliers often can reap higher learning and
experience effects and so develop unique capabilities or quality improvements.
A higher degree of vertical integration can also reduce a firm’s strategic flexibility, espe-
cially when faced with changes in the external environment like fluctuations in demand and
technological change. 35 For instance, when technological process innovations enabled sig-
nificant improvements in steel-making, mills such as U.S. Steel and Bethlehem Steel were
tied to their fully integrated business models and were thus unable to switch technologies,
leading to the bankruptcy of many integrated steel mills. Non-vertically integrated mini-mills
such as Nucor and Chaparral, on the other hand, invested in the new steel-making process and
grew their business by taking market share away from the less flexible integrated producers. 36
U.S. regulators such as the Federal Trade Commission (FTC) and the Justice Depart-
ment (DOJ) tend to allow vertical integration, arguing that it generally makes firms more
WWW.YAZDANPRESS.COMWWW.YAZDANPRESS.COM

CHAPTER 8 Corporate Strategy: Vertical Integration and Diversification 255
efficient and lowers costs, which in turn can benefit customers. However, due to monopoly
concerns, vertical integration has not gone entirely unchallenged. 37 The FTC, for example,
carefully reviewed PepsiCo’s plan to reintegrate its two largest bottlers, which gives the
firm full control of about 80 percent of its North American distribution. Before engaging in
vertical integration, therefore, managers need to be aware that this corporate strategy can
increase the potential for legal repercussions.
ALTERNATIVES TO VERTICAL INTEGRATION
Ideally, one would like to find alternatives to vertical integration that provide similar ben-
efits without the accompanying risks. Are there such alternatives?
TAPER INTEGRATION. One alternative to vertical integration is taper integration . It is
a way of orchestrating value activities in which a firm is backwardly integrated, but it also
relies on outside-market firms for some of its supplies, and/or is forwardly integrated but
also relies on outside-market firms for some if its distribution. 38 Exhibit 8.6 illustrates the
concept of taper integration along the vertical industry value chain. Here, the firm sources
intermediate goods and components from in-house suppliers as well as outside suppliers. In
a similar fashion, a firm sells its products through company-owned retail outlets and through
independent retailers. Both Apple and Nike, for example, use taper integration: They own
retail outlets but also use other retailers, both the brick-and-mortar type and online.
Taper integration has several benefits: 39
■ It exposes in-house suppliers and distributors to market competition so that perfor-
mance comparisons are possible. Rather than hollowing out its competencies by rely-
ing too much on outsourcing, taper integration allows a firm to retain and fine-tune its
competencies in upstream and downstream value chain activities. 40
■ Taper integration also enhances a firm’s flexibil-
ity. For example, when adjusting to fluctuations in
demand, a firm could cut back on the finished goods
it delivers to external retailers while continuing to
stock its own stores.
■ Using taper integration, firms can combine internal
and external knowledge, possibly paving the path
for innovation.
Based on a study of 3,500 product introductions in
the computer industry, researchers have provided empir-
ical evidence that taper integration can be beneficial. 41
Firms that pursued taper integration achieved superior
performance in both innovation and financial perfor-
mance when compared with firms that relied more on
vertical integration or strategic outsourcing.
STRATEGIC OUTSOURCING. Another alternative
to vertical integration is strategic outsourcing , which
involves moving one or more internal value chain
activities outside the firm’s boundaries to other firms in
the industry value chain. A firm that engages in stra-
tegic outsourcing reduces its level of vertical integra-
tion. Rather than developing their own human resource
LO 8-5
Describe and examine alternatives to vertical integration.
taper integration
A way of orchestrating value activities in which a firm is backwardly integrated but also relies on outside-market firms for some of its supplies, and/or is forwardly integrated but also relies on outside-market firms for some of its distribution.
strategic outsourcing
Moving one or more internal value chain activities outside the firm’s boundaries to other firms in the industry value chain.
EXHIBIT 8.6 / Taper Integration along the Industry Value Chain
IN-HOUSE SUPPLIERSIntermediate Goods
& Components
IN-HOUSE SUPPLIERSAssembly
& Manufacturing
IN-HOUSEDISTRIBUTORSRetail & Service
OUTSIDESUPPLIERS
Intermediate Goods& Components
OUTSIDEDISTRIBUTORSRetail & Sales
WWW.YAZDANPRESS.COMWWW.YAZDANPRESS.COM
256 CHAPTER 8 Corporate Strategy: Vertical Integration and Diversification
management systems, for instance, some firms outsource these non-core activities to com-
panies such as PeopleSoft (owned by Oracle), EDS (owned by HP), or Perot Systems
(owned by Dell), which can leverage their deep competencies and produce scale effects.
In the popular media and in everyday conversation, you may hear the term “outsourc-
ing” used to mean sending jobs out of the country. Actually, when outsourced activities
take place outside the home country, the correct term is off-shoring (or off-shore outsourc-ing ). By whatever name, it is a huge phenomenon. For example, Infosys, one of the world’s
largest technology companies and providers of IT services to many Fortune 100 com-
panies, is located in Bangalore, India. The global off-shoring market is estimated to be
$1.4 trillion, and is expected to grow at a compound annual growth rate of 15 percent.
Banking and financial services, IT, and health care are the most active sectors in such off-
shore outsourcing. 42 More recently, U.S. law firms began to off-shore low-end legal work,
such as drafting standard contracts and background research, to India. 43 We discuss global strategy in detail in Chapter 10.
8.4 Corporate Diversification:
Expanding Beyond a Single Market
Early in the chapter, we listed three questions related to corporate strategy and, in particu-
lar, the boundaries of the firm. We discussed the first question defining corporate strategy
(In what stages of the industry value chain should the firm participate?) in detail earlier
when discussing vertical integration. We now turn to the second and third questions that
determine corporate strategy and the boundaries of the firm.
The second of those questions relates to the firm’s degree of diversification: What range of
products and services should the firm offer? In particular, why do some companies compete
in a single product market, while others compete in several different product markets? Coca-
Cola, for example, focuses on soft drinks and thus on a single product market. Its archrival
PepsiCo competes directly with Coca-Cola by selling a wide variety of soft drinks and other
beverages, and also offering different types of chips such as Lay’s, Doritos, and Cheetos, as
well as Quaker Oats products such as oatmeal and granola bars. Although PepsiCo is more
diversified than Coca-Cola, it has reduced its level of diversification in recent years.
The third and final of the key questions defining corporate strategy concerns the ques-
tion of where to compete in terms of regional, national, or international markets. This deci-
sion determines the firm’s geographic focus. For example, why do some firms compete
beyond state boundaries, while others are content to focus on the local market? Why do
some firms compete beyond their national borders, while others prefer to focus on the
domestic market?
Kentucky Fried Chicken (KFC), the world’s largest quick-service chicken restaurant
chain, operates more than 5,200 outlets in the U.S., and more than 15,000 outlets inter-
nationally in 109 countries. 44 It is particularly popular in China, where it has over 4,000
restaurants and about the same revenues as in the U.S. We noted in Chapter Case 2 that
Indra Nooyi, PepsiCo’s CEO, was instrumental in spinning out KFC, as well as Pizza
Hut and Taco Bell, to reduce PepsiCo’s level of diversification. In 1997, the three fast-
food chains were established as an independent company under the name Yum Brands. In
2012, Yum Brands had annual revenues of $13 billion. The world’s second-largest quick-
service chicken restaurant is Chick-fil-A. 45 KFC and Chick-fil-A are direct competitors in
the United States. Not only do they both compete in the fast-food industry; they also both
specialize in chicken. In 2012, Chick-fil-A operated over 1,700 locations in 39 U.S. states
with sales of $4.6 billion.
WWW.YAZDANPRESS.COMWWW.YAZDANPRESS.COM
CHAPTER 8 Corporate Strategy: Vertical Integration and Diversification 257
Why are KFC and Chick-fil-A pursuing different corporate strategies? Although both
companies were founded roughly in the same time period (KFC in 1930 and Chick-fil-A
in 1946), one big difference between KFC and Chick-fil-A is the ownership structure.
KFC is a publicly traded stock company, as part of Yum Brands; Chick-fil-A is privately
owned. Public companies are often expected by shareholders to achieve profitable growth
as fast as possible to result in an appreciation of the stock price and thus an increase in
shareholder value (see the discussion in Chapter 5). In contrast, private companies gener-
ally grow slower than public companies because their growth is mostly financed through
retained earnings and debt rather than equity. Prior to an initial public offering, private
companies do not have the option to sell shares (equity) to the public to fuel growth. This
is one explanation why KFC focuses on international markets, especially China, where
future expected growth continues to be high, while Chick-fil-A focuses on the domestic
U.S. market.
Answers to questions about the number of markets to compete in and where to compete
geographically relate to the broad topic of diversification . A firm that engages in diversifi-
cation increases the variety of products and services it offers or markets and the geographic
regions in which it competes. A non-diversified company focuses on a single market,
whereas a diversified company competes in several different markets simultaneously. 46
There are various general diversification strategies:
■ A firm that is active in several different product markets is pursuing a product diversification strategy .
■ A firm that is active in several different countries is pursuing a geographic diversifica-tion strategy .
■ A company that pursues both a product and a geographic diversification strategy
simultaneously follows a product–market diversification strategy .
Because shareholders expect continuous growth from public companies, managers fre-
quently turn to product and geographic diversification to achieve it. It is therefore not
surprising that the vast majority of the Fortune 500 companies are diversified to some
degree. Achieving performance gains through diversification, however, is not guaranteed.
Some forms of diversification are more likely to lead to performance improvements than
others. We now discuss which diversification types are more likely to lead to a competitive
advantage, and why.
TYPES OF CORPORATE DIVERSIFICATION
To understand the different types and degrees of corporate diversification, Richard Rumelt
developed a helpful classification scheme, depicted in Exhibit 8.7 :
■ A single-business firm derives 95 percent or more of its revenues from one business.
Although Google is active in many different businesses, it obtains more than 95 percent
of its revenues ($50 billion in 2012) from online advertising. 47
LO 8-6
Describe and evaluate different types of corporate diversification.
diversification An increase in the variety of products and services a firm offers or markets and the geographic regions in which it competes.
product diversification
strategy Corporate strategy in which a firm is active in several different product markets.
geographic diversification
strategy Corporate strategy in which a firm is active in several different countries.
product–market
diversification strategy
Corporate strategy in which a firm is active in several different product markets and several different countries.
WWW.YAZDANPRESS.COMWWW.YAZDANPRESS.COM
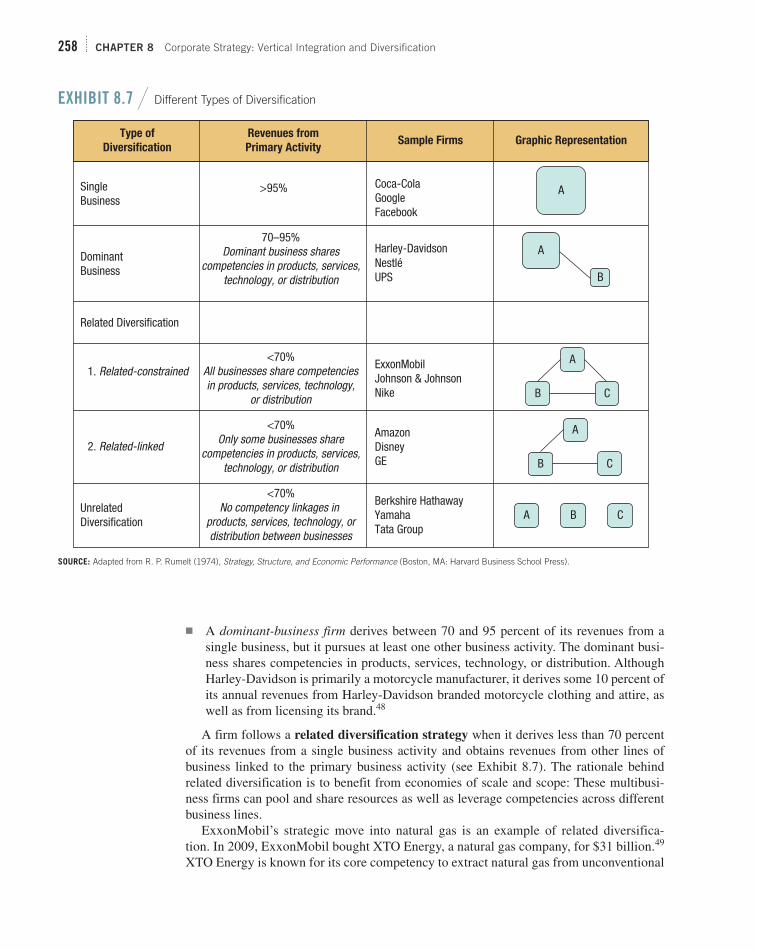
258 CHAPTER 8 Corporate Strategy: Vertical Integration and Diversification
■ A dominant-business firm derives between 70 and 95 percent of its revenues from a
single business, but it pursues at least one other business activity. The dominant busi-
ness shares competencies in products, services, technology, or distribution. Although
Harley-Davidson is primarily a motorcycle manufacturer, it derives some 10 percent of
its annual revenues from Harley-Davidson branded motorcycle clothing and attire, as
well as from licensing its brand. 48
A firm follows a related diversification strategy when it derives less than 70 percent
of its revenues from a single business activity and obtains revenues from other lines of
business linked to the primary business activity (see Exhibit 8.7 ). The rationale behind
related diversification is to benefit from economies of scale and scope: These multibusi-
ness firms can pool and share resources as well as leverage competencies across different
business lines.
ExxonMobil’s strategic move into natural gas is an example of related diversifica-
tion. In 2009, ExxonMobil bought XTO Energy, a natural gas company, for $31 billion. 49
XTO Energy is known for its core competency to extract natural gas from unconventional
EXHIBIT 8.7 / Different Types of Diversification
Type of
Diversification
Revenues from
Primary ActivitySample Firms Graphic Representation
SingleBusiness
>95% Coca-ColaGoogleFacebook
DominantBusiness
70–95%Dominant business shares
competencies in products, services,technology, or distribution
Harley-DavidsonNestléUPS
Related Diversification
1. Related-constrained<70%
All businesses share competenciesin products, services, technology,
or distribution
ExxonMobilJohnson & JohnsonNike
2. Related-linked
<70%Only some businesses share
competencies in products, services,technology, or distribution
AmazonDisneyGE
UnrelatedDiversification
<70%No competency linkages in
products, services, technology, ordistribution between businesses
Berkshire HathawayYamahaTata Group
A
A
B
A B C
A
B C
A
B C
SOURCE: Adapted from R. P. Rumelt (1974), Strategy, Structure, and Economic Performance (Boston, MA: Harvard Business School Press).
WWW.YAZDANPRESS.COMWWW.YAZDANPRESS.COM

CHAPTER 8 Corporate Strategy: Vertical Integration and Diversification 259
places such as shale rock—the type of deposits currently being exploited in the United
States. ExxonMobil hopes to leverage its core competency in the exploration and com-
mercialization of oil into natural gas extraction. The company is producing nearly equal
amounts of crude oil and natural gas, making it the world’s largest producer of natural
gas. The company believes that roughly 50 percent of the world’s energy for the next
50 years will continue to come from fossil fuels, but that its diversification into natural
gas, the cleanest of the fossil fuels in terms of greenhouse gas emissions, will pay off.
ExxonMobil’s strategic scenario may be right on the mark. Because of major techno-
logical advances in hydraulic fracking to extract oil and natural gas from shale rock by
companies such as XTO Energy, the United States has emerged as the world’s richest
country in natural gas resources and the third-largest producer of crude oil, just behind
Saudi Arabia and Russia. 50
We can further identify two types of related diversification strategy: related-constrained
and related-linked (see Exhibit 8.7 ). When executives consider business opportuni-
ties only where they can leverage their existing competencies and resources, the firm is
using related-constrained diversification. The choices of alternative business activities are
limited—constrained—by the fact that they need to be related through common resources,
capabilities, and competencies. ExxonMobil’s diversification move into natural gas is an
example of related-constrained diversification.
If executives consider new business activities that share only a limited number of link-
ages, the firm is using related-linked diversification. For example, Amazon began business
by selling only one product: books. Over time, it expanded into CDs and later gradually
leveraged its online retailing capabilities into a wide array of product offerings. As the
world’s largest online retailer, and given the need to build huge data centers to service its
peak holiday demand, Amazon decided to leverage spare capacity into cloud computing,
again benefitting from economies of scope and scale. Amazon now also offers its Kindle
line of tablet computers and proprietary content, as well as instant video streaming via its
Prime service. Amazon follows a related-linked diversification strategy.
A firm follows an unrelated diversification strategy when less than 70 percent of
its revenues comes from a single business and there are few, if any, linkages among its
businesses (see Exhibit 8.7 ). A company that combines two or more strategic business
units under one overarching corporation and follows an unrelated diversification strategy is
called a conglomerate . Some research evidence suggests that an unrelated diversification
strategy can be advantageous. 51 This arrangement helps firms gain and sustain competi-
tive advantage because it allows the conglomerate to overcome institutional weaknesses in
emerging economies, such as a lack of capital markets and well-defined legal systems and
property rights. Companies such as Berkshire Hathaway, the South Korean LG chaebol,
and the Yamaha group are all considered conglomerates due to their unrelated diversifica-
tion strategy. Strategy Highlight 8.2 features the Tata Group of India, a conglomerate that
follows an unrelated diversification strategy.
related diversification
strategy Corporate strategy in which a firm derives less than 70 percent of its revenues from a single business activity and obtains revenues from other lines of business that are linked to the primary business activity.
unrelated diversification
strategy Corporate strategy in which a firm derives less than 70 percent of its revenues from a single business activity and there are few, if any, linkages among its businesses.
conglomerate A company that combines two or more strategic business units under one overarching corporation; follows an unrelated diversification strategy.
WWW.YAZDANPRESS.COMWWW.YAZDANPRESS.COM

260 CHAPTER 8 Corporate Strategy: Vertical Integration and Diversification
LEVERAGING CORE COMPETENCIES FOR CORPORATE DIVERSIFICATION
In Chapter 4, when looking inside the firm, we introduced the idea that competitive advantage
can be based on core competencies. Core competencies are unique strengths embedded deep
within a firm. They allow companies to increase the perceived value of their product and ser-
vice offerings and/or lower the cost to produce them. 53 Examples of core competencies are:
■ Walmart’s ability to effectively orchestrate a globally distributed supply chain at low cost.
■ Infosys’s ability to provide high-quality information technology services at a low cost
by leveraging its global delivery model. This implies taking work to the location where
LO 8-7
Apply the core competence–market matrix to derive different diversification strategies.
The Tata Group: Integration at
the Corporate Level
Founded in 1868 as a trading company by then 29-year-old entrepreneur Jamsetji Nusserwanji Tata, the Tata Group today has roughly 500,000 employees and $100 billion in annual revenues. A widely diversified multinational conglomerate, headquartered in Mumbai, India, it is active in industries rang-ing from tea, to hospitality, steel, IT, communications, power, and automobiles. Some of its strategic business units are giants in their own right. The Tata Group includes Asia’s largest software company (TCS) and India’s largest steelmaker. It also owns the renowned Taj Hotels Resorts & Palaces.
In 2008, Tata Motors attracted attention in the automo-tive world when it bought Jaguar and Land Rover from Ford for $2.3 billion. In 2009, the Indian Tata Motors attracted even more attention when it unveiled its Tata Nano car. The Nano is the lowest-priced car in the world. It accommodates passengers just over six feet tall, goes from zero to 60 mph in 30 seconds, and gets 67 mpg, beating the Toyota Prius for fuel consumption. The Tata Nano, clearly a no-frills car, exemplifies a focused low-cost strategy. The rear hatch can’t be opened, it doesn’t have a radio or glove compartment, and its top speed is a little over 60 mph. Nonetheless, being about 50 percent cheaper than the
next-lowest-cost car, Tata Motors hopes to find tens of millions of customers in the Indian and Chinese markets. Initial sales were disappointing, however. Apparently low cost alone was not sufficient to lure new buyers into the market. The first Nano models might have provided too little along the value dimension. Tata Motors is now attempting to revive Nano sales by adding features to newer models such side-view mirrors, a music sys-tem with Bluetooth connectivity, chrome trim, and wheel covers.
The Tata Group is attempting to carve out different strategic positions in its different segments of the automotive industry. Moreover, the Tata Group hopes to integrate distinctly differ-ent business strategies at the corporate level. In particular, the luxury division of Tata Motors, with the Jaguar and Land Rover brands, is pursuing a focused differentiation strategy; the Nano car division is pursuing a focused cost-leadership strategy. Although their respective strategic profiles are basically the opposite of one another (differentiation versus low-cost), both business-level strategies are aimed at a specific segment of the market. Jaguar and Land Rover are luxury brands in their respective categories and appeal to buyers in the developed world; the Nano is clearly a low(est)-cost offering, focused on a very specific market niche. Indeed, the Nano focuses on non-consumption: Buyers of the Nano will not be replacing other vehicles. They will be first-time car buyers moving up from
bicycles and mopeds. By offering the Nano, Tata Motors is still hoping to bring millions of new car buyers from emerging countries into the market and thus increase the size of the automobile market. Taken together, Tata’s corporate strategy is attempt-ing to integrate different strategic positions, pursued by different stra-tegic business units, each with its own profit and loss responsibility. 52
8.2
WWW.YAZDANPRESS.COMWWW.YAZDANPRESS.COM
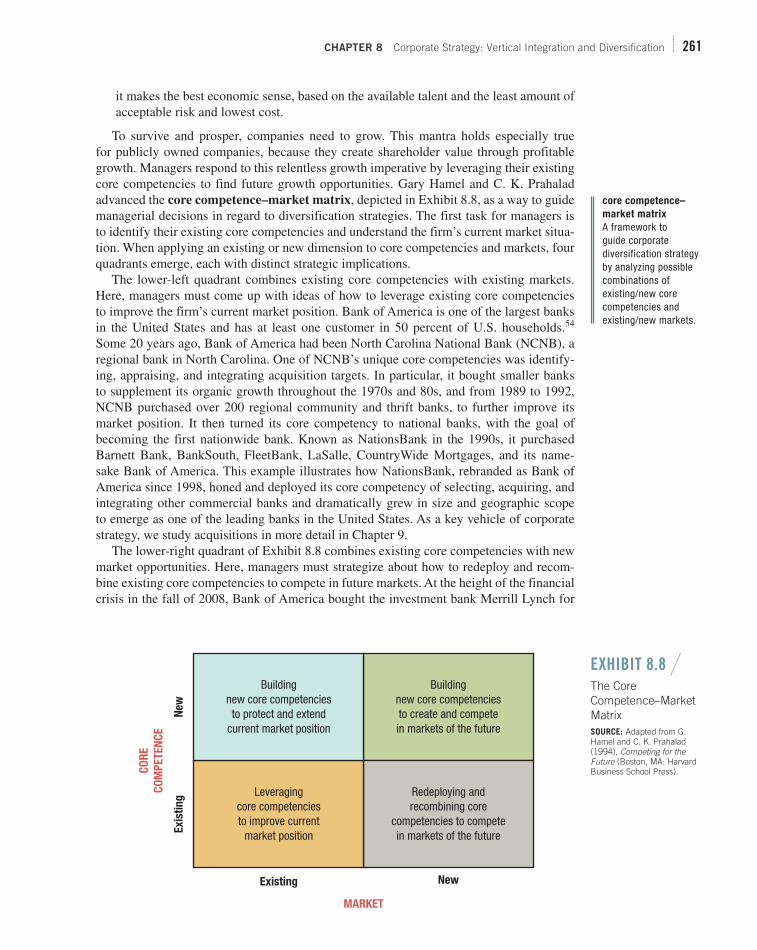
CHAPTER 8 Corporate Strategy: Vertical Integration and Diversification 261
it makes the best economic sense, based on the available talent and the least amount of
acceptable risk and lowest cost.
To survive and prosper, companies need to grow. This mantra holds especially true
for publicly owned companies, because they create shareholder value through profitable
growth. Managers respond to this relentless growth imperative by leveraging their existing
core competencies to find future growth opportunities. Gary Hamel and C. K. Prahalad
advanced the core competence–market matrix , depicted in Exhibit 8.8 , as a way to guide
managerial decisions in regard to diversification strategies. The first task for managers is
to identify their existing core competencies and understand the firm’s current market situa-
tion. When applying an existing or new dimension to core competencies and markets, four
quadrants emerge, each with distinct strategic implications.
The lower-left quadrant combines existing core competencies with existing markets.
Here, managers must come up with ideas of how to leverage existing core competencies
to improve the firm’s current market position. Bank of America is one of the largest banks
in the United States and has at least one customer in 50 percent of U.S. households. 54
Some 20 years ago, Bank of America had been North Carolina National Bank (NCNB), a
regional bank in North Carolina. One of NCNB’s unique core competencies was identify-
ing, appraising, and integrating acquisition targets. In particular, it bought smaller banks
to supplement its organic growth throughout the 1970s and 80s, and from 1989 to 1992,
NCNB purchased over 200 regional community and thrift banks, to further improve its
market position. It then turned its core competency to national banks, with the goal of
becoming the first nationwide bank. Known as NationsBank in the 1990s, it purchased
Barnett Bank, BankSouth, FleetBank, LaSalle, CountryWide Mortgages, and its name-
sake Bank of America. This example illustrates how NationsBank, rebranded as Bank of
America since 1998, honed and deployed its core competency of selecting, acquiring, and
integrating other commercial banks and dramatically grew in size and geographic scope
to emerge as one of the leading banks in the United States. As a key vehicle of corporate
strategy, we study acquisitions in more detail in Chapter 9.
The lower-right quadrant of Exhibit 8.8 combines existing core competencies with new
market opportunities. Here, managers must strategize about how to redeploy and recom-
bine existing core competencies to compete in future markets. At the height of the financial
crisis in the fall of 2008, Bank of America bought the investment bank Merrill Lynch for
core competence–
market matrix
A framework to guide corporate diversification strategy by analyzing possible combinations of existing/new core competencies and existing/new markets.
EXHIBIT 8.8 /
The Core Competence–Market Matrix SOURCE: Adapted from G. Hamel and C. K. Prahalad (1994), Competing for the Future (Boston, MA: Harvard Business School Press).
Buildingnew core competenciesto protect and extend
current market position
Buildingnew core competenciesto create and competein markets of the future
Leveragingcore competenciesto improve current
market position
Redeploying andrecombining core
competencies to competein markets of the future
New
NewExisting
Exi
stin
g
CO
RE
CO
MP
ET
EN
CE
MARKET
WWW.YAZDANPRESS.COMWWW.YAZDANPRESS.COM

262 CHAPTER 8 Corporate Strategy: Vertical Integration and Diversification
$50 billion. 55 Although many problems ensued for Bank of America following the Merrill
Lynch acquisition, it is now the bank’s investment and wealth management division. Bank
of America’s corporate managers applied an existing competency (acquiring and integrat-
ing) into a new market (investment and wealth management). The combined entity is now
leveraging economies of scope through cross-selling when, for example, consumer bank-
ing makes customer referrals for investment bankers to follow up. 56
The upper-left quadrant combines new core competencies with existing market oppor-
tunities. Here, managers must come up with strategic initiatives to build new core compe-
tencies to protect and extend the company’s current market position. For example, in the
early 1990s, Gatorade dominated the market for sports drinks, a segment in which it had
been the original innovator. Some 25 years earlier, medical researchers at the University
of Florida had created the drink to enhance the performance of the Gators, the university’s
football team, thus the name Gatorade. Stokely-Van Camp commercialized and marketed
the drink, and eventually sold it to Quaker Oats. PepsiCo brought Gatorade into its lineup
of soft drinks when it acquired Quaker Oats in 2001.
By comparison, Coca-Cola had existing core competencies in marketing, bottling, and
distributing soft drinks, but had never attempted to compete in the sports-drink market.
Over a 10-year R&D effort, Coca-Cola developed competencies in the development and
marketing of its own sports drink, Powerade, which launched in 1990. In 2012, Powerade
held about 25 percent of the sports drink-market, making it a viable competitor to Gato-
rade, which still holds about 70 percent of the market. 57
Finally, the upper-right quadrant combines new core competencies with new market
opportunities. Hamel and Prahalad call this combination “mega opportunities”—those that
hold significant future-growth opportunities. At the same time, it is likely the most chal-
lenging diversification strategy because it requires building new core competencies to cre-
ate and compete in future markets.
Salesforce.com , for example, is a company that employs this diversification strategy
well. 58 In recent years, Salesforce experienced tremendous growth, the bulk of it coming
from the firm’s existing core competency in delivering customer relationship manage-
ment (CRM) software to its clients. Salesforce’s product distinguished itself from the
competition by providing software as a service via cloud computing: Clients did not need
to install software or manage any servers, but could easily access the CRM through a web
browser (a business model called software as a service, or SaaS ). In 2007, Salesforce
recognized an emerging market for platform as a service ( PaaS ) offerings, which would
enable clients to build their own software solutions that are accessed the same way as
the Salesforce CRM. Seizing the opportunity, Salesforce developed a new competency
in delivering software development and deployment tools that allowed its customers to
either extend their existing CRM offering or build completely new types of software.
Today, Salesforce’s Force.com offering is one of the leading providers of PaaS tools and
services.
Taken together, the core competence–market matrix provides guidance to executives
on how to diversify in order to achieve continued growth. Once managers have a clear
understanding of their firm’s core competencies (see Chapter 4), they have four options to
formulate corporate strategy:
1. Leverage existing core competencies to improve current market position.
2. Build new core competencies to protect and extend current market position.
3. Redeploy and recombine existing core competencies to compete in markets of the
future.
4. Build new core competencies to create and compete in markets of the future.
WWW.YAZDANPRESS.COMWWW.YAZDANPRESS.COM

CHAPTER 8 Corporate Strategy: Vertical Integration and Diversification 263
CORPORATE DIVERSIFICATION AND FIRM PERFORMANCE
Corporate managers pursue diversification to gain and sustain competitive advantage. But
does corporate diversification indeed lead to superior performance? To answer this ques-
tion, we can evaluate the performance of diversified companies. The critical question to
ask when doing so is whether the individual businesses are worth more under the com-
pany’s management than if each were managed individually.
The diversification-performance relationship is a function of the underlying type
of diversification. A cumulative body of research indicates an inverted U-shaped rela-
tionship between the type of diversification and overall firm performance, as depicted
in Exhibit 8.9 . 59 High and low levels of diversification are generally associated with
lower overall performance, while moderate levels of diversification are associated with
higher firm performance. This implies that companies that focus on a single business,
as well as companies that pursue unrelated diversification, often fail to achieve addi-
tional value creation. Firms that compete in single markets could potentially benefit
from economies of scope by leveraging their core competencies into adjacent markets.
Firms that pursue unrelated diversification are often unable to create additional value.
They experience a diversification discount in the stock market: The stock price of
such highly diversified firms is valued at less than the sum of their individual business
units. 60 This finding, however, depends on the institutional context. Although it holds in
developed economies with developed capital markets, some research evidence suggests
that an unrelated diversification strategy can be advantageous in emerging economies
(as mentioned when discussing the Tata Group). 61 Here, unrelated diversification may
help firms gain and sustain competitive advantage because it allows the conglomerate to
overcome institutional weaknesses in emerging economies such as a lack of a function-
ing capital market.
In contrast, companies that pursue related diversification are more likely to improve
their performance. They create a diversification premium : the stock price of related-
diversification firms is valued at greater than the sum of their individual business units. 62
Why is this so? At the most basic
level, a corporate diversification
strategy enhances firm performance
when its value creation is greater
than the costs it incurs. Exhibit 8.10
lists the sources of value creation
and costs for different corporate
strategies, for vertical integration as
well as related and unrelated diver-
sification. For diversification to
enhance firm performance, it must
do at least one of the following:
■ Provide economies of scale, which reduces costs.
■ Exploit economies of scope, which increases value.
■ Reduce costs and increase value.
We discussed these drivers of
competitive advantage—economies
of scale, economies of scope, and
LO 8-8
Explain when a diversification strategy creates a competitive advantage and when it does not.
diversification
discount Situation in which the stock price of highly diversified firms is valued at less than the sum of their individual business units.
diversification
premium Situation in which the stock price of related-diversification firms is valued at greater than the sum of their individual business units.
EXHIBIT 8.9 / The Diversification-Performance Relationship
Perf
orm
an
ce
SingleBusiness
UnrelatedDiversification
RelatedDiversification
Related-constrainedRelated-linked
DominantBusiness
Level of Diversification
SOURCE: Adapted from L. E. Palich, L. B. Cardinal, and C. C. Miller (2000), “Curvilinearity in the diversification-performance linkage: An examination of over three decades of research,” Strategic Management Journal 21: 155–174.
WWW.YAZDANPRESS.COMWWW.YAZDANPRESS.COM

264 CHAPTER 8 Corporate Strategy: Vertical Integration and Diversification
increase in value and reduction of costs—in depth in Chapter 6 in relation to business strat-
egy. In addition to these criteria, firms may enhance their performance when following a
diversification strategy by benefitting from:
■ Financial economies, including:
◆ Restructuring
◆ Using internal capital markets
RESTRUCTURING. Restructuring describes the process of reorganizing and divest-
ing business units and activities to refocus a company in order to leverage its core
competencies more fully. Chapter Case 8 highlighted the restructuring that has taken
place at GE to leverage its core competency in management processes and industrial
engineering. The Belgium-based Anheuser-Busch InBev recently sold Busch Entertain-
ment, its theme park unit that owns SeaWorld and Busch Gardens, to a group of private
investors for roughly $3 billion. This strategic move allows InBev to focus more fully
on its core business and to pay for its 2008 acquisition of Anheuser-Busch, which cost
$52 billion. 63
Corporate executives can restructure the portfolio of their firm’s businesses, much like
an investor can change a portfolio of stocks. One helpful tool to guide corporate portfo-
lio planning is the Boston Consulting Group (BCG) growth-share matrix , shown in
Exhibit 8.11 . 64 This matrix locates the firm’s individual SBUs in two dimensions: relative
market share (horizontal axis) and speed of market growth (vertical axis). The firm plots
its SBUs into one of four categories in the matrix: dog, cash cow, star, and question mark.
Each category warrants a different investment strategy. All four categories shape the firm’s
corporate strategy.
SBUs identified as dogs are relatively easy to identify: They are the underperform-
ing businesses. Dogs hold a small market share in a low-growth market; they have low
and unstable earnings, combined with neutral or negative cash flows. The strategic
Boston Consulting
Group (BCG) growth-
share matrix
A corporate planning tool in which the corporation is viewed as a portfolio of business units, which are represented graphically along relative market share (horizontal axis) and speed of market growth (vertical axis). SBUs are plotted into four categories (dog, cash cow, star, and question mark), each of which warrants a different investment strategy.
EXHIBIT 8.10 / Vertical Integration and Diversification: Sources of Value Creation and Costs
Corporate Strategy Sources of Value Creation (V ) Sources of Costs (C )
Vertical Integration • Securing critical supplies and distribution channels
• Lowering costs
• Improving quality
• Facilitating scheduling and planning
• Facilitating investments in specialized assets
• Increasing costs
• Reducing quality
• Reducing flexibility
• Increasing potential for legal repercussions
Related Diversification
• Economies of scope
• Economies of scale
• Financial economies
■ Restructuring
■ Internal capital markets
• Coordination costs
• Influence costs
Unrelated Diversification
• Financial economies
■ Restructuring
■ Internal capital markets
• Influence costs
WWW.YAZDANPRESS.COMWWW.YAZDANPRESS.COM

CHAPTER 8 Corporate Strategy: Vertical Integration and Diversification 265
recommendations are either to divest the business or to harvest it. This implies stopping
investment in the business and squeezing out as much cash flow as possible before shutting
it down or selling it.
Cash cows, in contrast, are SBUs that compete in a low-growth market but hold con-
siderable market share. Their earnings and cash flows are high and stable. The strategic
recommendation is to invest enough into cash cows to hold their current position, and to
avoid having them turn into dogs (as indicated by the arrow).
A corporation’s star SBUs hold a high market share in a fast-growing market. Their
earnings are high and either stable or growing. The recommendation for the corporate
strategist is to invest sufficient resources to hold the star’s position or even increase invest-
ments for future growth. As indicated by the arrow, stars may turn into cash cows as the
market in which the SBU is situated slows down due to reaching the maturity stage of the
industry life cycle.
Finally, some SBUs are question marks: It is not clear whether they will turn into dogs or
stars. Their earnings are low and unstable, but they might be growing. The cash flow, how-
ever, is negative. Ideally, corporate executives want to invest in question marks to increase
their relative market share so they turn into stars. If market conditions change, however, or
the overall market growth slows down, then a question-mark SBU is likely to turn into a
dog. In this case, executives would want to harvest the cash flow or divest the SBU.
USING INTERNAL CAPITAL MARKETS. Internal capital markets can be a source
of value creation in a diversification strategy if the conglomerate’s headquarters does a
more efficient job of allocating capital through its budgeting process than what could be
achieved in external capital markets. Based on private information, corporate managers
are in a position to discover which of their strategic business units will provide the highest
return on invested capital. In addition, internal capital markets may allow the company to
access capital at a lower cost.
Until recently, for example, GE Capital brought in close to $70 billion in annual rev-
enues, and generated more than half of GE’s profits. 65 In combination with GE’s triple-A
debt rating, having access to such a large finance arm allowed GE to benefit from a lower
cost of capital, which in turn was a source of value creation in itself. In 2009, GE lost its
AAA debt rating and is now in the process of downsizing its finance unit. The lower debt
EXHIBIT 8.11 / Restructuring the Corporate Portfolio: The Boston Consulting Group Growth-Share Matrix
Question Mark
Earnings: Low, unstable,or growingCash flow: NegativeStrategy: Increase marketshare or harvest/divest
Earnings: Low, unstableCash flow: Neutral ornegativeStrategy: Harvest/divest
Earnings: High, stableCash flow: High, stableStrategy: Hold
Earnings: High, stable,or growingCash flow: NeutralStrategy: Hold orinvest for growth
Dog Cash Cow
High
Low
MA
RK
ET
GR
OW
TH
Low
RELATIVE MARKET SHARE
High
Star
WWW.YAZDANPRESS.COMWWW.YAZDANPRESS.COM

266 CHAPTER 8 Corporate Strategy: Vertical Integration and Diversification
rating and the smaller finance unit are likely to result in a higher cost of capital, and thus a
potential loss in value creation through internal capital markets.
A strategy of related-constrained or related-linked diversification is more likely to
enhance corporate performance than either a single or dominant level of diversification
or an unrelated level of diversification. The reason is that the sources of value creation
include not only restructuring, but more fundamentally, the potential benefits of economies
of scope and scale. To create additional value, however, the benefits from these sources
of incremental value creation must outweigh their costs. A related-diversification strategy
entails two additional types of costs: coordination and influence costs. Coordination costs
are a function of the number, size, and types of businesses that are linked to one another.
Influence costs occur due to political maneuvering by managers to influence capital and
resource allocation and the resulting inefficiencies stemming from suboptimal allocation
of scarce resources. 66
8.5 Implications for the Strategist
An effective corporate strategy increases a firm’s chances to gain and sustain a competitive
advantage. By formulating corporate strategy, executives make important choices along
three dimensions that determine the boundaries of the firm:
■ The degree of vertical integration—in what stages of the industry value chain to
participate.
■ The type of diversification—what range of products and services to offer.
■ The geographic scope—where to compete.
As an executive, you will have the opportunity to proactively shape the company’s cor-
porate strategy in order to take advantage of external opportunities and mitigate threats.
As discussed in Chapter Case 8, Jeffrey
Immelt formulated a new corporate
strategy to take advantage of future
business opportunities in clean-tech and
health care, while reducing the exposure
to global financial markets.
Corporate strategy needs to be
dynamic over time. As firms grow, they
tend to diversify and globalize to cap-
ture additional growth opportunities.
Exhibit 8.12 shows the dynamic nature
of corporate strategy through decisions
made by two top competitors in the
sports footwear and apparel industry:
Nike and adidas.
Adidas was founded in 1924 in
Germany. It began its life in the laundry
room of a small apartment. Two brothers
focused on one product: athletic shoes.
Initially, adidas was a fairly integrated
manufacturer of athletic shoes. The big
breakthrough for the company came in
1954 when the underdog West Germany
EXHIBIT 8.12 / Dynamic Corporate Strategy: Nike versus adidas
Diversification
in products and services
Vert
ica
l In
teg
rati
on
alon
g st
ages
of i
ndus
try v
alue
cha
in
Nike2013Nike
1978
1924
2013Nike2013Nike
1978
adidas1924
adidas2013
WWW.YAZDANPRESS.COMWWW.YAZDANPRESS.COM

CHAPTER 8 Corporate Strategy: Vertical Integration and Diversification 267
won the soccer World Cup in adidas cleats. As the world markets globalized and became
more competitive in the decades after World War II, adidas not only vertically disintegrated
to focus mainly on the design of athletic shoes but also diversified into sports apparel. By
2013, adidas was a diversified company active across the globe in sports shoes (40 percent
of revenues), sports apparel (50 percent of revenues), and sports equipment (10 percent of
revenues). The change in adidas’ corporate strategy from a small, highly integrated single
business to a disintegrated and diversified global company is shown in Exhibit 8.12 .
Nike, the world’s leader in sports shoes and apparel, was featured in Chapter Case 4.
Founded in 1978, and thus much younger than adidas, Nike was vertically disintegrated
from the very beginning. After moving beyond importing Japanese shoes to the U.S., Nike
focused almost exclusively on R&D, design, and marketing of running shoes. Although
Nike diversified into different lines of business, it stayed true to its vertical disintegration
by focusing on only a few activities (see Exhibit 8.12 ). In 2013, Nike was a global com-
pany and its revenues came from sports shoes (50 percent) and apparel (25 percent), as well
as sports equipment and other businesses, such as affiliate brands Cole Haan, Converse,
Hurley, and Umbro. The changes in the strategic positions shown in Exhibit 8.12 highlight
the dynamic nature of corporate strategy. Also, keep in mind that the relationship between
diversification strategy and competitive advantage depends on the type of diversification. There exists an inverted U-shaped relationship between the level of diversification and
performance improvements. On average, related diversification (either related-constrained
or related-linked such as in the Nike and adidas example) is most likely to lead to superior
performance because it taps into multiple sources of value creation (economies of scale
and scope; financial economies). To achieve a net positive effect on firm performance,
however, related diversification must overcome additional sources of costs such as coordi-
nation and influence costs.
A A S DISCUSSED IN the Chapter Case, General Electric has been refocusing its businesses through aggressive cor-porate divestitures and restructuring. It divested NBC Universal, chemicals, and insurance. It also restruc-tured GE Capital.
GE’s focus on clean-tech seems to be bearing some fruit, with the industrial sector experiencing double-digit earnings growth in the last few years. The GE Energy divi-sion grew to almost $50 billion in annual revenues, partly through acquisitions, making up roughly one-third of GE’s total revenues. Because GE management believes the energy business has become too big to be managed effectively, it continued its corporate restructuring and split the energy business into three standalone strategic business units in 2012: Power and Water; Oil and Gas; and Energy Management. This move comes in response
to external trends as well as internal needs.
Externally, it is GE’s response to the shale gas revolution that is reshap-ing America’s energy industry. For example, lower gas prices drive up demand for GE’s gas turbines as more and more power providers retire coal-fired plants and replace them with gas-fired power plants. Internally, this restructuring was motivated to create three more CEO positions for the new SBUs for training a potential suc-cessor for Jeffrey Immelt. After running GE for more than a decade, Mr. Immelt needs to begin grooming a number of potential successors since the company tends to recruit its CEOs internally.
GE has also been increasing its global footprint. International sales have soared from 19 percent of
CHAPTER CASE 8 Consider This . . .
WWW.YAZDANPRESS.COMWWW.YAZDANPRESS.COM

268 CHAPTER 8 Corporate Strategy: Vertical Integration and Diversification
sales in 1980, to 34 percent in 2000, to over 52 per-cent in 2012. Immelt believes that tackling big problems on a global scale is a strength of conglomerates such as GE. An example of a large-scale problem is the fact that according to the United Nations, nearly one-fourth of the world’s population lives without access to reliable power. In India, one of the fastest-growing economies in the world, the electrical coverage rate is about 65 percent. India has set a goal to provide electricity to all its citizens using a combination of national-scale power systems for the major cities and smaller “micro grids” for rural areas. India and other rapidly developing nations are seeking to replicate a “leap frog” approach in energy similar to that used in telecommunications. Instead of investing in vast quantities of landline communications wires, India built extensive mobile capabilities for communication needs. In energy, this means using software-enabled “smart grid” electrical systems and smaller-scale but numerous renewable generation (such as wind, solar, and biomass) locations across the country. The Indian government is
also encouraging smaller investments in order to improve the efficiency of existing fossil-fuel–based generators. When completed, this energy infrastructure is likely to be more economical and robust than most systems in the “more developed” Western economies. 67
Questions
1. Where do ecomagination and healthymagination fit on the core competence–market matrix for GE? (See Exhibit 8.8 .)
2. Take either the energy or health care industry and draw the industry value chain. What areas of potential vertical integration should GE consider?
3. What related diversification would you suggest for GE in reference to its focus for the future?
4. How do GE’s corporate strategic initiatives of clean-tech, health care, and globalization rein-force each other? How might they generate con-flicts in the company?
This chapter defined corporate strategy and then
looked at two fundamental corporate strategy topics—
vertical integration and diversification—as summa-
rized by the following learning objectives and related
take-away concepts.
LO 8-1 / Define corporate strategy and
describe the three dimensions along which
it is assessed.
■ Corporate strategy addresses “where to
compete.” Business strategy addresses “how
to compete.”
■ Corporate strategy concerns the boundaries of the
firm along three dimensions: (1) industry value
chain, (2) products and services, and (3) geogra-
phy (regional, national, or global markets).
■ To gain and sustain competitive advantage, any
corporate strategy must support and strengthen a
firm’s strategic position, regardless of whether it
is a differentiation, cost-leadership, or integration
strategy.
LO 8-2 / Describe and evaluate different
options firms have to organize economic
activity.
■ Transaction cost economics help managers decide
what activities to do in-house (“make”) versus
what services and products to obtain from the
external market (“buy”).
■ When the costs to pursue an activity in-house are
less than the costs of transacting in the market
( C in-house < C market ), then the firm should vertically
integrate.
■ Principal–agent problems and information asym-
metries can lead to market failures, and thus situa-
tions where internalizing the activity is preferred.
■ A principal–agent problem arises when an agent
performing activities on behalf of a principal pur-
sues his or her own interests.
■ Information asymmetries arise when one party is
more informed than another because of the pos-
session of private information.
TAKE-AWAY CONCEPTS
WWW.YAZDANPRESS.COMWWW.YAZDANPRESS.COM

CHAPTER 8 Corporate Strategy: Vertical Integration and Diversification 269
■ Moving from less integrated to more fully
integrated forms of transacting, alternatives
include short-term contracts, strategic alliances
(including long-term contracts, equity alli-
ances, and joint ventures), and parent–subsidiary
relationships.
LO 8-3 / Describe the two types of vertical
integration along the industry value chain:
backward and forward vertical integration.
■ Vertical integration denotes a firm’s value
added—what percentage of a firm’s sales is gen-
erated by the firm within its boundaries.
■ Industry value chains (vertical value chains)
depict the transformation of raw materials into
finished goods and services. Each stage typically
represents a distinct industry in which a number
of different firms are competing.
■ Backward vertical integration involves moving
ownership of activities upstream nearer to the orig-
inating (inputs) point of the industry value chain.
■ Forward vertical integration involves moving
ownership of activities closer to the end (cus-
tomer) point of the value chain.
LO 8-4 / Identify and evaluate benefits and
risks of vertical integration.
■ Benefits of vertical integration include securing
critical supplies and distribution channels, lower-
ing costs, improving quality, facilitating schedul-
ing and planning, and facilitating investments in
specialized assets.
■ Risks of vertical integration include increasing
costs, reducing quality, reducing flexibility, and
increasing the potential for legal repercussions.
LO 8-5 / Describe and examine alternatives
to vertical integration.
■ Taper integration is a strategy in which a firm is
backwardly integrated but also relies on outside-
market firms for some of its supplies, and/or is
forwardly integrated but also relies on outside-
market firms for some if its distribution.
■ Strategic outsourcing involves moving one or
more value chain activities outside the firm’s
boundaries to other firms in the industry value
chain. Off-shoring is the outsourcing of activities
outside the home country.
LO 8-6 / Describe and evaluate different
types of corporate diversification.
■ A single-business firm derives 95 percent or more
of its revenues from one business.
■ A dominant-business firm derives between
70 and 95 percent of its revenues from a single
business, but pursues at least one other business
activity.
■ A firm follows a related diversification strategy
when it derives less than 70 percent of its rev-
enues from a single business activity, but obtains
revenues from other lines of business that are
linked to the primary business activity. Choices
within a related diversification strategy can be
related-constrained or related-linked.
■ A firm follows an unrelated diversification strat-
egy when less than 70 percent of its revenues
come from a single business, and there are few, if
any, linkages among its businesses.
LO 8-7 / Apply the core competence– market
matrix to derive different diversification
strategies.
■ When applying an existing/new dimension to
core competencies and markets, four quadrants
emerge, as depicted in Exhibit 8.8 .
■ The lower-left quadrant combines existing core
competencies with existing markets. Here, man-
agers need to come up with ideas of how to lever-
age existing core competencies to improve their
current market position.
■ The lower-right quadrant combines existing core
competencies with new market opportunities.
Here, managers need to think about how to rede-
ploy and recombine existing core competencies to
compete in future markets.
■ The upper-left quadrant combines new core
competencies with existing market opportuni-
ties. Here, managers must come up with strategic
initiatives of how to build new core competencies
to protect and extend the firm’s current market
position.
■ The upper-right quadrant combines new core
competencies with new market opportunities.
This is likely the most challenging diversification
strategy because it requires building new core
competencies to create and compete in future
markets.
WWW.YAZDANPRESS.COMWWW.YAZDANPRESS.COM
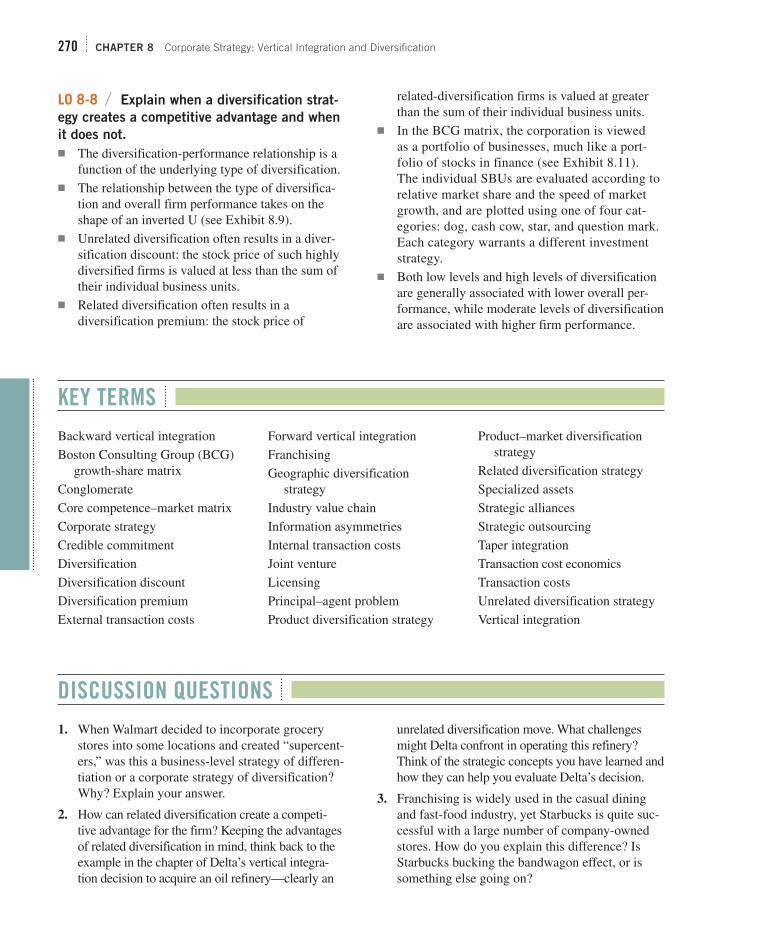
270 CHAPTER 8 Corporate Strategy: Vertical Integration and Diversification
LO 8-8 / Explain when a diversification strat-
egy creates a competitive advantage and when
it does not.
■ The diversification-performance relationship is a
function of the underlying type of diversification.
■ The relationship between the type of diversifica-
tion and overall firm performance takes on the
shape of an inverted U (see Exhibit 8.9 ).
■ Unrelated diversification often results in a diver-
sification discount: the stock price of such highly
diversified firms is valued at less than the sum of
their individual business units.
■ Related diversification often results in a
diversification premium: the stock price of
related-diversification firms is valued at greater
than the sum of their individual business units.
■ In the BCG matrix, the corporation is viewed
as a portfolio of businesses, much like a port-
folio of stocks in finance (see Exhibit 8.11 ).
The individual SBUs are evaluated according to
relative market share and the speed of market
growth, and are plotted using one of four cat-
egories: dog, cash cow, star, and question mark.
Each category warrants a different investment
strategy.
■ Both low levels and high levels of diversification
are generally associated with lower overall per-
formance, while moderate levels of diversification
are associated with higher firm performance.
Backward vertical integration
Boston Consulting Group (BCG)
growth-share matrix
Conglomerate
Core competence–market matrix
Corporate strategy
Credible commitment
Diversification
Diversification discount
Diversification premium
External transaction costs
KEY TERMS
Forward vertical integration
Franchising
Geographic diversification
strategy
Industry value chain
Information asymmetries
Internal transaction costs
Joint venture
Licensing
Principal–agent problem
Product diversification strategy
Product–market diversification
strategy
Related diversification strategy
Specialized assets
Strategic alliances
Strategic outsourcing
Taper integration
Transaction cost economics
Transaction costs
Unrelated diversification strategy
Vertical integration
1. When Walmart decided to incorporate grocery
stores into some locations and created “supercent-
ers,” was this a business-level strategy of differen-
tiation or a corporate strategy of diversification?
Why? Explain your answer.
2. How can related diversification create a competi-
tive advantage for the firm? Keeping the advantages
of related diversification in mind, think back to the
example in the chapter of Delta’s vertical integra-
tion decision to acquire an oil refinery—clearly an
unrelated diversification move. What challenges
might Delta confront in operating this refinery?
Think of the strategic concepts you have learned and
how they can help you evaluate Delta’s decision.
3. Franchising is widely used in the casual dining
and fast-food industry, yet Starbucks is quite suc-
cessful with a large number of company-owned
stores. How do you explain this difference? Is
Starbucks bucking the bandwagon effect, or is
something else going on?
DISCUSSION QUESTIONS
WWW.YAZDANPRESS.COMWWW.YAZDANPRESS.COM
CHAPTER 8 Corporate Strategy: Vertical Integration and Diversification 271
1. The chapter notes that some firms choose to
outsource their human resource management sys-
tems. If a firm has a core value of respecting its
employees and rewarding top performance with
training, raises, and promotions, does outsourc-
ing HR management show a lack of commitment
by the firm? HR management systems are soft-
ware applications that typically manage payroll,
benefits, hiring and training, and performance
appraisal. What are the advantages and disadvan-
tages of this decision? Think of ways that a firm
can continue to show its commitment to treat
employees with respect.
2. Nike is a large and successful firm in the design
of athletic shoes. It could easily decide to
forward-integrate to manufacture the shoes it
designs. Therefore, the firm has a credible threat
over its current manufacturers. If Nike has no
intention of actually entering the manufacturing
arena, is its supply chain management team being
ethical with the current manufacturers if the team
mentions this credible threat numerous times in
annual pricing negotiations? Why or why not?
What aspects of Nike’s agreement with its manu-
facturing partners do you believe they emphasize
in negotiations?
ETHICAL/SOCIAL ISSUES
//// Small-Group Exercise 1
Agriculture is one of the largest and oldest industries
in the world. In the U.S. and many other countries,
farmers often struggle to turn a profit given the vari-
ances of weather and commodity prices. Some work-
ing farms are turning to tourism as an additional and
complementary revenue source. A study from the U.S.
Census of Agriculture in 2007 found nearly 25,000
farms providing some level of agri-tourism and rec-
reation services. There were 2.2 million farms in the
census, almost triple the number from 2002. In 2010,
the Department of Agriculture announced a new grant
program aimed at providing public access to private
farms for such purposes. Small farms worldwide are
participating in this trend by offering “pick your own”
crops in season, as well as small bed-and-breakfast
experiences.
Perhaps one of the most successful large companies
leading this marriage of industries is a dairy farm in
Indiana: Fair Oaks Farms ( http://www.fofarms.com/
en/home ). Fair Oaks Farms is home to 30,000 cows and
produces enough milk to feed 8 million people. Fair
Oaks is also participating in the education market as a
popular destination for school field trips. Other attrac-
tions include the “Birthing Barn,” where calf births can
be viewed live; the Cheese Factory; and Mooville—a
themed outdoor play area. Fair Oaks Farms hosts
some 500,000 tourists each year, who come to see
the hands-on adventure center and the working
milking operations. A video of the operation is avail-
able at www.youtube.com/watch?v 5 JJRy82i8e5Q .
Such ingenious business diversification can offer
many benefits to the agriculture industry. 68
1. What other industrial or commercial industries
could benefit from such potential tourist or recre-
ational revenues? Discuss what new and comple-
mentary capabilities would need to be developed
in order to succeed.
2. In your group, list other industry combinations
you have seen be successful. Consider why you
think the combination has been a success.
//// Small-Group Exercise 2
Target and Walmart are significant rivals in the retail-
ing industry. Though Walmart is the world’s largest
company (2012 sales of $466 billion), Target had been
growing faster than Walmart until the 2008 recession.
From 2003 to 2007, same-store sales at Target grew an
average of 4.6 percent, while Walmart’s comparable
growth was 2.9 percent.
However, in 2008 Target’s same-store sales fell 2.6
percent, while Walmart’s rose 3.3 percent. What drove
this difference? Product mix seems to be a large factor.
Target devotes less than 20 percent of its space to con-
sumables such as health and beauty products and food.
Walmart, by contrast, has 45 percent of its shelf space for
consumables, with groceries being a major component.
SMALL-GROUP EXERCISES
WWW.YAZDANPRESS.COMWWW.YAZDANPRESS.COM

272 CHAPTER 8 Corporate Strategy: Vertical Integration and Diversification
Though an obvious answer for Target is to continue fol-
lowing Walmart into groceries, consider that the average
net profit of the grocery industry was less than 1.4 per-
cent from 2002 to 2008. As a team, assume you’ve been
called in to consult with Target on the problem. 69
1. What should Target do to get back on a growth
track?
2. Is Target’s problem strategy or execution?
3. What action plan would you recommend?
STRATEGY TERM PROJECT
//// Module 8: Vertical Integration
In this section, you will study the boundaries of the
firm you have selected for your strategy project in
reference to the vertical value chain activities of its
industry.
1. Draw out the vertical value chain for your firm’s
industry. List the major firms in each important
activity along the chain (see Exhibits 8.4 and 8.5
as examples). Note that a firm’s name may appear
multiple times in the value chain. This indicates
some level of vertical integration by the firm. If
your firm is in many different industries (e.g.,
GE), then choose the dominant industry or the
one that intrigues you the most and use only that
one for this analysis.
2. Is your firm highly vertically integrated? If yes,
does it also employ taper integration?
3. Are any of the vertical value chain operations
off-shored? If so, list some of the pros and cons
of having this part of the value chain outside the
home country.
4. Use the preceding vertical value chain to identify
the corporate strategy of the firm. In other words,
where within the industry has the firm chosen to
compete? Based on where it competes, describe
what you now see as its corporate strategy.
5. In Module 2, you were asked to identify the mis-
sion and major goals for your selected company.
Go back to that information now and compare the
mission and goals to what you have found as the
corporate strategy. Are the mission, goals, and
corporate strategy in alignment? Do you see any
holes or conflicts among these three elements?
Can you relate the performance of the firm to this
finding in any way? (If all three are consistent, is
this a well-performing unit?) If there is a conflict
between the corporate strategy and the mission,
does this lack of alignment contribute to perfor-
mance problems? Why or why not?
How Diversified Are You?
When someone asks a manager about diversifica-tion, the questioner may be referring to the man-ager’s overall portfolio of savings and retirement
investments. While that is an important personal financial consideration, here we are asking you to think about diversi-fication a bit differently.
Corporations diversify by investing time and resources into new areas of business. As individuals, each of us makes choices about how to spend our time and energies. Typically, we could
divide our time between school, work, family, sleep, and play. During high-stress work projects, we likely devote more of our time to work; when studying for final exams or a professional board exam (such as the CPA exam), we probably spend more time and effort in the “student learning” mode. This manner of dividing our time can be thought of as “personal diversifi-cation.” Just as companies can invest in related or unrelated activities, we make similar choices. While we attend college, we may choose to engage in social and leisure activities with cam-pus colleagues, or we may focus on classwork at school and spend our “play time” with an entirely separate set of people.
my STRATEGY
WWW.YAZDANPRESS.COMWWW.YAZDANPRESS.COM

CHAPTER 8 Corporate Strategy: Vertical Integration and Diversification 273
Using Exhibit 8.7 as a guide, list each of your major activity areas. Think of each of these as a business. (If you are literally “all work and no play,” you are a single-business type of per-sonal diversification.) Instead of revenues, estimate the percent-age of time you spend per week in each activity. (Most people will be diversified, though some may be dominant perhaps in school or work.) To assess your degree of relatedness and unre-latedness, consider the subject matter and community involved
with each activity. For example, if you are studying ballet and working as an accountant, those would be largely unrelated activities (unless you are an accountant for a ballet company!).
1. What conclusions do you derive based on your personal diversification strategy?
2. Do you need to make adjustments to your portfolio of activities? Explain the reasons for your answer.
1. Jeffrey Immelt, quoted in “Ecomagina-
tion: Inside GE’s power play,” by J. Makower,
May 8, 2005, www.worldchanging.com/
archives/002669.html .
2. This ChapterCase is based on: “A slip-
ping crown,” The Economist, March 13,
2009; “Comcast, GE strike deal; Vivendi to
sell NBC stake,” The Wall Street Journal, December 4, 2009; “Ecomagination: Inside
GE’s power play,” Worldchanging, May 8,
2005; “GE: How clean (and not-so-clean)
tech drives ecomagination,” The Wall Street Journal, May 27, 2009; “GE launches
‘healthymagination’; will commit $6 billion to
enable better health focusing on cost, access
and quality,” GE press release, May 7, 2009;
“GE may shed storied appliance unit,” The Wall Street Journal, May 15, 2008; “GE’s
chief declines $12 million bonus amid crisis,”
The Wall Street Journal, February 19, 2009;
“Comcast buys rest of NBC’s parent,” The Wall Street Journal, February 13, 2013; www.
ge.com ; and www.wolframalpha.com .
3. Collis, D. J. (1995), “The scope of the
corporation,” Harvard Business School Note, 9-795-139.
4. 2010 Letter to Shareholders in 2009 GE
Annual Report.
5. Kogut, B., and U. Zander (1992), “Knowl-
edge of the firm, combinative capabilities, and
the replication of technology,” Organization Science 3: 383–397; O’Connor, G. C., and
M. Rice (2001), “Opportunity recognition
and breakthrough innovation in large firms,”
California Management Review 43: 95–116;
O’Connor, G. C., and R. W. Veryzer (2001),
“The nature of market visioning for technol-
ogy-based radical innovation,” Journal of Product Innovation Management 18: 231–224.
6. The literature on transaction cost econom-
ics is rich and expanding. For important
theoretical and empirical contributions, see:
Folta, T. B. (1998), “Governance and uncer-
tainty: The trade-off between administrative
control and commitment,” Strategic Manage-ment Journal 19: 1007–1028; Klein, B., R.
Crawford, and A. Alchian (1978), “Vertical
integration, appropriable rents, and the com-
petitive contracting process,” Journal of Law and Economics 21: 297–326; Leiblein, M. J.,
and D. J. Miller (2003), “An empirical exami-
nation of transformation- and firm-level influ-
ences on the vertical boundaries of the firm,”
Strategic Management Journal 24: 839–859;
Leiblein, M. J., J. J. Reuer, and F. Dalsace
(2002), “Do make or buy decisions matter?
The influence of organizational governance
on technological performance,” Strategic Management Journal 23: 817–833; Mahoney,
J. (1992), “The choice of organizational form:
Vertical financial ownership versus other
methods of vertical integration,” Strategic Management Journal 13: 559–584; Mahoney,
J. T. (2005), Economic Foundations of Strat-egy (Thousand Oaks, CA: Sage); Williamson,
O. E. (1975), Markets and Hierarchies, (New
York: Free Press); Williamson, O. E. (1981),
“The economics of organization: The trans-
action cost approach,” American Journal of Sociology 87: 548–577; and Williamson, O. E.
(1985), The Economic Institutions of Capital-ism (New York: Free Press).
7. This draws on: Mahoney, J. T. (2005),
Economic Foundations of Strategy (Thousand
Oaks, CA: Sage); Williamson, O. E. (1975),
Markets and Hierarchies (New York: Free
Press); Williamson, O. E. (1981), “The eco-
nomics of organization: The transaction cost
approach,” American Journal of Sociology
87: 548–577; Williamson, O. E. (1985), The Economic Institutions of Capitalism (New
York: Free Press); and Hart, O., and O. Moore
(1990), “Property rights and the nature of
the firm,” Journal of Political Economy 98:
1119–1158.
8. Highlighting the relevance of research
on transaction costs, both Ronald Coase
(1991) and Oliver Williamson (2009), who
further developed and refined Coase’s initial
insight, were each awarded a Nobel Prize in
economics.
9. Levy, S. (2011), In the Plex: How Google Thinks, Works, and Shapes Our Lives (New
York: Simon & Schuster).
10. This is based on: Berle, A., and G. Means
(1932), The Modern Corporation and Private Property (New York: Macmillan); Jensen, M.,
and W. Meckling (1976), “Theory of the firm:
Managerial behavior, agency costs and owner-
ship structure,” Journal of Financial Econom-ics 3: 305–360; and Fama, E. (1980), “Agency
problems and the theory of the firm,” Journal of Political Economy 88: 375–390.
11. Berle, A., and G. Means (1932), The Modern Corporation and Private Property.
12. This discussion draws on: Zenger, T. R.,
and W. S. Hesterly (1997), “The disaggrega-
tion of corporations: Selective intervention,
high-powered incentives, and molecular
units,” Organization Science 8: 209–222; and
Zenger, T. R., and S. G. Lazzarini (2004),
“Compensating for innovation: Do small firms
offer high-powered incentives that lure talent
and motivate effort,” Managerial and Deci-sion Economics 25: 329–345.
13. This discussion draws on: Akerlof, G.
A. (1970), “The market for lemons: Qual-
ity uncertainty and the market mechanism,”
Quarterly Journal of Economics 94: 488–500.
14. Pisano, G. P. (1997), “R&D performance,
collaborative arrangements, and the market-for-
know-how: A test of the ‘lemons’ hypothesis
in biotechnology,” Working Paper No. 97-105, Harvard Business School; Lerner, J., and
ENDNOTES
WWW.YAZDANPRESS.COMWWW.YAZDANPRESS.COM

274 CHAPTER 8 Corporate Strategy: Vertical Integration and Diversification
R. P. Merges (1998), “The control of technol-
ogy alliances: An empirical analysis of the
biotechnology industry,” Journal of Industrial Economics 46: 125–156; Huston, J. H., and
R. W. Spencer (2002), “Quality, uncertainty
and the Internet: The market for cyber lem-
ons,” The American Economist 46: 50–60;
Rothaermel, F. T., and D. L. Deeds (2004),
“Exploration and exploitation alliances in
biotechnology: A system of new product devel-
opment,” Strategic Management Journal 25:
201–221; Downing, C., D. Jaffee, and N. Walla
(2009), “Is the market for mortgage-backed
securities a market for lemons?” Review of Financial Studies 22: 2457–2494.
15. This discussion draws on: Williamson, O. E.
(1991), “Comparative economic organization:
The analysis of discrete structural alterna-
tives,” Administrative Science Quarterly 36:
269–296.
16. Since short-term contracts are unlikely to
be of strategic significance, they are not sub-
sumed under the term strategic alliances, but
rather are considered to be mere contractual
arrangements.
17. Dyer, J. H. (1997), “Effective interfirm
collaboration: How firms minimize transac-
tion costs and maximize transaction value,”
Strategic Management Journal 18: 535–556.
18. This is based on: Gulati, R. (1998), “Alli-
ances and networks,” Strategic Management Journal 19: 293–317; Ireland, R. D., M. A.
Hitt, and D. Vaidyanath (2002), “Alliance
management as a source of competitive
advantage,” Journal of Management 28: 413–
446; Hoang, H., and F. T. Rothaermel (2005),
“The effect of general and partner-specific
alliance experience on joint R&D project
performance,” Academy of Management Journal 48: 332–345; and Lavie, D. (2006),
“The competitive advantage of interconnected
firms: An extension of the resource-based
view,” Academy of Management Review 31:
638–658.
19. This Strategy Highlight is based on
“Toyota sets pact on lithium,” The Wall Street Journal, January 20, 2010; and “Toyota pre-
dicts hybrid majority,” The Wall Street Journal Japan Edition, April 18, 2013.
20. www.dowcorning.com .
21. “Rising from the ashes in Detroit,” The Economist, August 19, 2010.
22. “Small cars, big question,” The Econo-mist, January 21, 2010.
23. Tucker, I., and R. P. Wilder (1977),
“Trends in vertical integration in the U.S.
manufacturing sector,” Journal of Industrial Economics 26: 81–97; Harrigan, K. R. (1984),
“Formulating vertical integration strate-
gies,” Academy of Management Review 9:
638–652; Harrigan, K. R. (1986), “Matching
vertical integration strategies to competitive
conditions,” Strategic Management Journal 7: 535–555; Rothaermel, F. T., M. A. Hitt,
and L. A. Jobe (2006), “Balancing vertical
integration and strategic outsourcing: Effects
on product portfolios, new product success,
and firm performance,” Strategic Management Journal 27: 1033–1056.
24. “HTC clones Nexus One, launches 3 new
phones,” Wired.com , February 16, 2010.
25. www.htc.com .
26. Harrigan, K. R. (1984), “Formulating ver-
tical integration strategies,” Academy of Man-agement Review 9: 638–652; Harrigan, K. R.
(1986), “Matching vertical integration strate-
gies to competitive conditions,” Strategic Management Journal 7: 535–555.
27. “HTC clones Nexus One, launches 3 new
phones,” Wired.com , February 16, 2010.
28. “Companies more prone to go vertical,”
The Wall Street Journal, December 1, 2009.
29. This is based on: “Pepsi bids $6 billion
for largest bottlers, posts flat profit,” The Wall Street Journal, April 20, 2009; “PepsiCo
buys bottlers for $7.8 billion,” The Wall Street Journal, August 5, 2009; “Companies more
prone to go vertical,” The Wall Street Journal, December 1, 2009; and “Coca-Cola strikes
deal with bottler,” The Wall Street Journal, February 25, 2010.
30. Williamson, O. E. (1975), Markets and Hierarchies (New York: Free Press);
Williamson, O. E. (1981), “The econom-
ics of organization: The transaction cost
approach,” American Journal of Sociology
87: 548–577; Williamson, O. E. (1985), The Economic Institutions of Capitalism (New
York: Free Press); Poppo, L., and T. Zenger
(1998), “Testing alternative theories of the
firm: Transaction cost, knowledge based, and
measurement explanations for make or buy
decisions in information services,” Strategic Management Journal 19: 853–878.
31. Williamson, O. E. (1975), Markets and Hierarchies (New York: Free Press); Wil-
liamson, O. E. (1981), “The economics of
organization: The transaction cost approach,”
American Journal of Sociology 87: 548–577;
Williamson, O. E. (1985), The Economic Institutions of Capitalism (New York: Free
Press).
32. Williamson, O. E. (1975), Markets and Hierarchies (New York: Free Press).
33. “Delta to buy refinery in effort to lower
jet-fuel costs,” The Wall Street Journal, April
30, 2012.
34. Harrigan, K. R. (1984), “Formulating
vertical integration strategies,” Academy of Management Review 9: 638–652; Harrigan,
K. R. (1986), “Matching vertical integration
strategies to competitive conditions,” Strategic Management Journal 7: 535–555; Afuah, A.
(2001), “Dynamic boundaries of the firm: Are
firms better off being vertically integrated in
the face of a technological change?” Acad-emy of Management Journal 44: 1211–1228;
Rothaermel, F. T., M. A. Hitt, and L. A. Jobe
(2006), “Balancing vertical integration and
strategic outsourcing: Effects on product
portfolios, new product success, and firm
performance,” Strategic Management Journal 27: 1033–1056.
35. Afuah, A. (2001), “Dynamic boundaries
of the firm: Are firms better off being verti-
cally integrated in the face of a technological
change?”
36. Ghemawat, P. (1993), “Commitment to a
process innovation: Nucor, USX, and thin slab
casting,” Journal of Economics and Manage-ment Strategy 2: 133–161; Christensen, C. M.,
and M. E. Raynor (2003), The Innovator’s Solution: Creating and Sustaining Success-ful Growth (Boston, MA: Harvard Business
School Press).
37. “Companies more prone to go
vertical,” The Wall Street Journal, December
1, 2009.
38. Harrigan, K. R. (1984), “Formulating
vertical integration strategies,” Academy of Management Review 9: 638–652.
39. This is based on: Harrigan, K. R. (1984),
“Formulating vertical integration strate-
gies”; and Harrigan, K. R. (1986), “Matching
vertical integration strategies to competitive
conditions,” Strategic Management Journal 7: 535–555.
40. This is based on the following: Prahalad
and Hamel argued that a firm that outsources
too many activities risks hollowing out
(“unlearning”) its core competencies because
the firm no longer participates in key adjacent
value chain activities. A similar argument
has been made by Teece (1986); Prahalad, C.
K., and G. Hamel (1990), “The core compe-
tence of the corporation,” Harvard Business Review, May–June; and Teece, D. J. (1986),
“Profiting from technological innovation:
Implications for integration, collaboration,
licensing and public policy,” Research Policy
15: 285–305.
41. Rothaermel, F. T., M. A. Hitt, and L. A.
Jobe (2006), “Balancing vertical integration
and strategic outsourcing: Effects on product
portfolios, new product success, and firm
performance,” Strategic Management Journal 27: 1033–1056.
42. “Global outsourcing market to be worth
$1,430bn by 2009,” Computer Business Review, August 2007.
43. “Passage to India,” The Economist, June
26, 2010.
WWW.YAZDANPRESS.COMWWW.YAZDANPRESS.COM

CHAPTER 8 Corporate Strategy: Vertical Integration and Diversification 275
44. KFC and Yum Brands data drawn from
2012 Yum Brands Annual Report ( http://yum.
com/annualreport/ ) and www.kfc.com/about/ .
45. Chick-fil-A data drawn from
http://www.chick-fil-a.com/Company/
Highlights-Fact-Sheets .
46. This section is based on: Rumelt, R. P.
(1974), Strategy, Structure, and Economic Performance (Boston, MA: Harvard Business
School Press); Montgomery, C. A. (1985),
“Product-market diversification and market
power,” Academy of Management Review 28:
789–798.
47. Google Annual Reports.
48. Harley-Davidson Annual Reports.
49. This is based on: ExxonMobil Annual
Reports; “Oil’s decline slows Exxon, Chevron
profit growth,” The Wall Street Journal, Janu-
ary 30, 2009; “The greening of ExxonMobil,”
Forbes, August 24, 2009; Friedman, T. L.
(2008), Hot, Flat, and Crowded. Why We Need a Green Revolution—And How It Can Renew America (New York: Farrar, Straus and Gir-
oux); “Exxon to acquire XTO Energy in $31
billion stock deal,” The Wall Street Journal, December 14, 2009; and “ExxonMobil buys
XTO Energy,” The Economist, December 17,
2009.
50. “The shale revolution: What could go
wrong?” The Wall Street Journal, September
6, 2012; and “U.S. oil notches record growth,”
The Wall Street Journal, June 12, 2013.
51. This is based on: Peng, M. W., and P.
S. Heath (1996), “The growth of the firm in
planned economies in transitions: Institutions,
organizations, and strategic choice,” Academy of Management Review 21: 492–528; Peng,
M. W. (2000), Business Strategies in Transi-tion Economies (Thousand Oaks, CA: Sage);
and Peng, M. W. (2005), “What determines
the scope of the firm over time? A focus on
institutional relatedness,” Academy of Man-agement Review 30: 622–633.
52. The history of the Tata Group is docu-
mented at: http://www.tata.com/htm/heritage/
HeritageOption1.html ; “The Tata group,” The Economist, March 3, 2011; “Ratan Tata’s
legacy,” The Economist, December 1, 2012;
and “A new boss at Tata,” The Economist, December 1, 2012. See also, Sean McLaing,
“Why the world’s cheapest car flopped,” The Wall Street Journal, October 14, 2013.
53. Prahalad, C. K., and G. Hamel (1990),
“The core competence of the corporation.”
54. This discussion is based on: Burt, C.,
and F. T. Rothaermel (2013), “Bank of
America and the new financial landscape,”
case study, in Rothaermel, F. T., Strategic
Management (Burr Ridge IL: McGraw-Hill),
http://mcgrawhillcreate.com/rothaermel, ID#
MHE-FTR-07-0077645065.
55. Bank of America had long coveted
Merrill Lynch, a premier investment bank.
Severely weakened by the global financial
crisis, Merrill Lynch became a takeover tar-
get, and Bank of America made a bid. In the
process, Bank of America learned that Merrill
Lynch’s exposure to subprime mortgages and
other exotic financial instruments was much
larger than previously disclosed. Other prob-
lems included Merrill Lynch’s payments of
multimillion-dollar bonuses to many employ-
ees, despite the investment bank’s having lost
billions of dollars (in 2008). After learning
this new information, Bank of America (under
its then-CEO Ken Lewis) attempted to with-
draw from the Merrill Lynch takeover. The
Federal Reserve Bank, under the leadership
of its chairman, Ben Bernanke, insisted that
Bank of America fulfill the agreement, noting
that the takeover was part of a grand strategy
to save the financial system from collapse.
Once Bank of America shareholders learned
that CEO Ken Lewis had not disclosed the
problems at Merrill Lynch, they first stripped
him of his chairmanship of the board of
directors, and later fired him as CEO. For a
detailed and insightful discussion on the Mer-
rill Lynch takeover by Bank of America, see
Lowenstein, R. (2010), The End of Wall Street (New York: Penguin Press).
56. “Bank of America and Merrill Lynch,”
The Economist, April 14, 2010.
57. “In Gatorade war, Pepsi seems to have
deliberately given up market share to Coke,”
Business Insider, February 1, 2012.
58. “Oracle vs. salesforce.com ,” Harvard
Business School Case Study, 9-705-440;
“How to innovate in a downturn,” The Wall Street Journal, March 18, 2009; and Dyer, J.,
H. Gregersen, and C. M. Christensen (2011),
The Innovator’s DNA: Mastering the Five Skills of Disruptive Innovators (Boston, MA:
Harvard Business Review Press).
59. Palich, L. E., L. B. Cardinal, and C. C.
Miller (2000), “Curvilinearity in the diversifi-
cation-performance linkage: An examination
of over three decades of research,” Strategic Management Journal 21: 155–174.
60. This is based on: Lang, L.H.P., and R.
M. Stulz (1994), “Tobin’s q, corporate diver-
sification, and firm performance,” Journal of Political Economy 102: 1248–1280; Martin,
J. D., and A. Sayrak (2003), “Corporate
diversification and shareholder value: A
survey of recent literature,” Journal of Cor-porate Finance 9: 37–57; and Rajan, R., H.
Servaes, and L. Zingales (2000), “The cost
of diversity: The diversification discount and
inefficient investment,” Journal of Finance
55: 35–80.
61. This is based on: Peng, M. W., and P.
S. Heath (1996), “The growth of the firm in
planned economies in transitions: Institutions,
organizations, and strategic choice,” Academy of Management Review 21: 492–528; Peng, M. W.
(2000), Business Strategies in Transition Economies (Thousand Oaks, CA: Sage); and
Peng, M. W. (2005), “What determines the
scope of the firm over time? A focus on insti-
tutional relatedness,” Academy of Manage-ment Review 30: 622–633.
62. Villalonga, B. (2004), “Diversification
discount or premium? New evidence from the
business information tracking series,” Journal of Finance 59: 479–506.
63. This section is based on: “U.S. clears
InBev to buy Anheuser,” The Wall Street Journal, November 15, 2008; and “Blackstone
nears deal,” The Wall Street Journal, October
5, 2009.
64. Boston Consulting Group (1970), The Product Portfolio (Boston, MA); and Shay,
J. P., and F. T. Rothaermel (1999), “Dynamic
competitive strategy: Towards a multi-
perspective conceptual framework,” Long Range Planning 32: 559–572; and Kiechel, W.
(2010), The Lords of Strategy: The Secret Intel-lectual History of the New Corporate World
(Boston, MA: Harvard Business School Press).
65. GE Annual Reports.
66. Milgrom, P., and J. Roberts (1990),
“ Bargaining costs, influence costs, and the
organization of economic activity,” in Alt, J.,
and K. Shepsle (eds.), Perspectives on Positive Political Economy (Cambridge, UK: Cam-
bridge University Press).
67. GE Annual Reports; Heintzelman, D.
(2010), “India’s path to renewable power,”
Bloomberg Businessweek, Viewpoint Column,
May 27 (Mr. Heintzelman is president and
CEO of GE Oil & Gas); and “GE shake-up
will audition new leaders,” The Wall Street Journal, July 20, 2012.
68. This Small-Group Exercise is based on:
The Rural Community Building website
produced by the American Farm Bureau
Federation; America’s Heartland “Episode
311”; and Fair Oaks Farms Dairy
( www.fofarms.com ).
69. This Small-Group Exercise is based on:
Gregory, S. (2009), “Walmart vs. Target: No
contest in the recession,” Time, March 14; and
Food Marketing Institute Annual Financial
Report, December 2008.
WWW.YAZDANPRESS.COMWWW.YAZDANPRESS.COM
276
Chapter 9
Corporate Strategy: Mergers and Acquisitions, Strategic Alliances
Chapter Outline
9.1 Mergers and Acquisitions Merging with Competitors Why Do Firms Make Acquisitions? M&A and Competitive Advantage
9.2 Strategic Alliances Why Do Firms Enter Strategic Alliances? Governing Strategic Alliances Alliance Management Capability
9.3 Implications for the Strategist
Learning Objectives
After studying this chapter, you should be able to:
LO 9-1 Differentiate between mergers and acquisitions, and explain why firms would use either as a vehicle for corporate strategy.
LO 9-2 Define horizontal integration and evaluate the advantages and disadvantages of this corporate-level strategy.
LO 9-3 Explain why firms engage in acquisitions.
LO 9-4 Evaluate whether mergers and acquisitions lead to competitive advantage.
LO 9-5 Define strategic alliances, and explain why they are important corporate strategy vehicles and why firms enter into them.
LO 9-6 Describe three alliance governance mecha-nisms and evaluate their pros and cons.
LO 9-7 Describe the three phases of alliance management and explain how an alliance management capability can lead to a competitive advantage.
LO 9-8 Apply the build-borrow-or-buy framework to guide corporate strategy.
WWW.YAZDANPRESS.COMWWW.YAZDANPRESS.COM
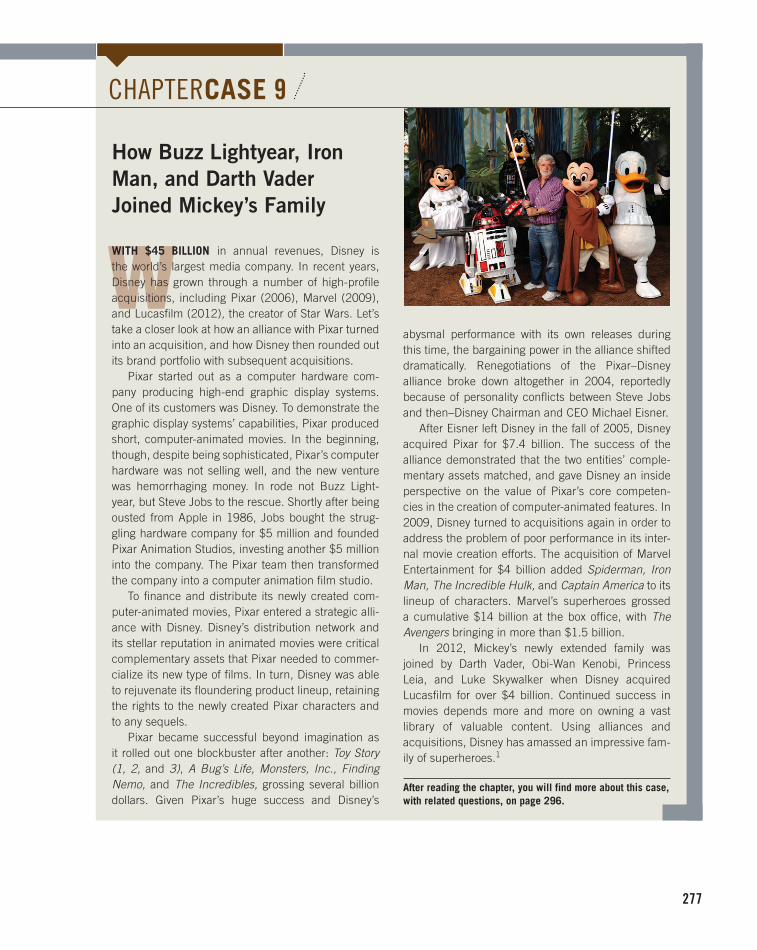
277
W
How Buzz Lightyear, Iron
Man, and Darth Vader
Joined Mickey’s Family
W ITH $45 BILLION in annual revenues, Disney is the world’s largest media company. In recent years, Disney has grown through a number of high-profile acquisitions, including Pixar (2006), Marvel (2009), and Lucasfilm (2012), the creator of Star Wars. Let’s take a closer look at how an alliance with Pixar turned into an acquisition, and how Disney then rounded out its brand portfolio with subsequent acquisitions.
Pixar started out as a computer hardware com-pany producing high-end graphic display systems. One of its customers was Disney. To demonstrate the graphic display systems’ capabilities, Pixar produced short, computer-animated movies. In the beginning, though, despite being sophisticated, Pixar’s computer hardware was not selling well, and the new venture was hemorrhaging money. In rode not Buzz Light-year, but Steve Jobs to the rescue. Shortly after being ousted from Apple in 1986, Jobs bought the strug-gling hardware company for $5 million and founded Pixar Animation Studios, investing another $5 million into the company. The Pixar team then transformed the company into a computer animation film studio.
To finance and distribute its newly created com-puter-animated movies, Pixar entered a strategic alli-ance with Disney. Disney’s distribution network and its stellar reputation in animated movies were critical complementary assets that Pixar needed to commer-cialize its new type of films. In turn, Disney was able to rejuvenate its floundering product lineup, retaining the rights to the newly created Pixar characters and to any sequels.
Pixar became successful beyond imagination as it rolled out one blockbuster after another: Toy Story (1, 2, and 3) , A Bug’s Life, Monsters, Inc., Finding Nemo, and The Incredibles, grossing several billion dollars. Given Pixar’s huge success and Disney’s
abysmal performance with its own releases during this time, the bargaining power in the alliance shifted dramatically. Renegotiations of the Pixar–Disney alliance broke down altogether in 2004, reportedly because of personality conflicts between Steve Jobs and then–Disney Chairman and CEO Michael Eisner.
After Eisner left Disney in the fall of 2005, Disney acquired Pixar for $7.4 billion. The success of the alliance demonstrated that the two entities’ comple-mentary assets matched, and gave Disney an inside perspective on the value of Pixar’s core competen-cies in the creation of computer-animated features. In 2009, Disney turned to acquisitions again in order to address the problem of poor performance in its inter-nal movie creation efforts. The acquisition of Marvel Entertainment for $4 billion added Spiderman, Iron Man, The Incredible Hulk, and Captain America to its lineup of characters. Marvel’s superheroes grossed a cumulative $14 billion at the box office, with The Avengers bringing in more than $1.5 billion.
In 2012, Mickey’s newly extended family was joined by Darth Vader, Obi-Wan Kenobi, Princess Leia, and Luke Skywalker when Disney acquired Lucasfilm for over $4 billion. Continued success in movies depends more and more on owning a vast library of valuable content. Using alliances and acquisitions, Disney has amassed an impressive fam-ily of superheroes. 1
After reading the chapter, you will find more about this case, with related questions, on page 296.
CHAPTER CASE 9
WWW.YAZDANPRESS.COMWWW.YAZDANPRESS.COM

278 CHAPTER 9 Corporate Strategy: Mergers and Acquisitions, Strategic Alliances
DISNEY IS ACTIVE in a wide array of business activities, from cable and network
television stations (ABC, ESPN, and others) and movies to amusement parks, cruises,
and retailing. It became the world’s leading media company to a large extent by pursuing
a corporate strategy of related-linked diversification (see discussion in Chapter 8). This is
because some, but not all, of Disney’s business activities share some common resources,
capabilities, and competencies. As detailed in the Chapter Case, Disney’s executives imple-
mented its corporate strategy through the use of strategic alliances and acquisitions.
In addition to internal organic growth, firms have two critical strategic options to pursue
common interests, enhance competitiveness, and increase revenues: acquisitions and alli-
ances. We devote this chapter to the study of these fundamental pathways through which
to implement corporate strategy. We begin by taking a closer look at mergers and acquisi-
tions before studying strategic alliances. We conclude with Implications for the Strate-gist, in which we discuss practical applications. Here, we apply the “build-borrow-buy”
framework to guiding corporate strategy in deciding whether and when to grow internally
(build), use alliances (borrow), or make acquisitions (buy).
9.1 Mergers and Acquisitions
A popular vehicle for executing corporate strategy is mergers and acquisitions (M&A).
Thousands of mergers and acquisitions occur each year, with a cumulative value in the
trillions of dollars. 2 Although people sometimes use the terms interchangeably, and usually
in tandem, mergers and acquisitions are, by definition, distinct from each other. A merger describes the joining of two independent companies to form a combined entity. Mergers
tend to be friendly; in mergers, the target firm would like to be acquired. Disney’s acquisi-
tion of Pixar, for example, was a friendly one, in which both management teams believed
that joining the two companies was a good idea.
An acquisition describes the purchase or takeover of one company by another. Acquisi-
tions can be friendly or unfriendly. When a target firm does not want to be acquired, the
acquisition is considered a hostile takeover . British telecom company Vodafone’s acqui-
sition of Germany-based Mannesmann, a diversified conglomerate with holdings in tele-
phony and Internet services, at an estimated value of $150 billion, was a hostile one.
In defining mergers and acquisitions, size can matter as well. The combining of two
firms of comparable size is often described as a merger even though it might in fact be an
acquisition. For example, the integration of Daimler and Chrysler was pitched as a merger,
though in reality Daimler acquired Chrysler and later sold it. After emerging from bank-
ruptcy restructuring, Chrysler is now majority-owned by Fiat, an Italian auto manufacturer.
In contrast, when large, incumbent firms such as the Tata Group, GE, or Microsoft buy
startup companies, the transaction is generally described as an acquisition. Although there
is a distinction between mergers and acquisitions, many observers simply use the umbrella
term “mergers and acquisitions” or M&A.
MERGING WITH COMPETITORS
In contrast to vertical integration, which concerns the number of activities a firm participates
in up and down the industry value chain (as discussed in Chapter 8), horizontal integration
LO 9-1
Differentiate between mergers and acquisitions, and explain why firms would use either as a vehicle for corporate strategy.
LO 9-2
Define horizontal integration and evaluate the advantages and disadvantages of this corporate-level strategy.
merger The joining of two independent companies to form a combined entity.
acquisition The purchase or takeover of one company by another; can be friendly or unfriendly.
hostile takeover
Acquisition in which the target company does not wish to be acquired.
horizontal integration
The process of merging with competitors, leading to industry consolidation.
WWW.YAZDANPRESS.COMWWW.YAZDANPRESS.COM

CHAPTER 9 Corporate Strategy: Mergers and Acquisitions, Strategic Alliances 279
is the process of merging with a competitor at the same stage
of the industry value chain. Horizontal integration is a type of
corporate strategy that can improve a firm’s strategic position
in a single industry. An industry-wide trend toward horizontal
integration leads to industry consolidation. The pharmaceutical
industry has seen considerable consolidation, with Pfizer merg-
ing with Wyeth, and Merck and Schering-Plough merging in
2009. In the event-promotion business, the only remaining seg-
ment in the music industry in which revenues are increasing,
Live Nation acquired Ticketmaster in 2010.
There are three main benefits to a horizontal integration
strategy:
■ Reduction in competitive intensity
■ Lower costs
■ Increased differentiation
Exhibit 9.1 previews the sources of value creation and costs
in horizontal integration, which we discuss next.
REDUCTION IN COMPETITIVE INTENSITY. Looking
through the lens of Porter’s five forces model with a focus on
rivalry among competitors (introduced in Chapter 3), hori-
zontal integration changes the underlying industry structure in favor of the surviving
firms. Excess capacity is taken out of the market, and competition tends to decrease
as a consequence of horizontal integration, assuming no new entrants. As a whole, the
industry structure becomes more consolidated and potentially more profitable. If the
surviving firms find themselves in an oligopolistic industry structure and maintain a
focus on non-price competition (e.g., R&D spending, customer service, or advertising),
the industry can indeed be quite profitable, and rivalry would likely decrease among
existing firms. Recent horizontal integration in the U.S. airline industry, for example,
provided several benefits to the surviving carriers. By reducing excess capacity, the
mergers between Delta and Northwest Airlines (in 2008), United Airlines and Conti-
nental (in 2010), Southwest and AirTran (in 2010), and American and US Airways (pro-
posed in 2013 but put on hold by the U.S. Department of Justice) lowered competitive
intensity in the industry overall.
Horizontal integration can favorably affect several of Porter’s five forces for the
surviving firms: strengthening bargaining power vis-à-vis suppliers and buyers, reduc-
ing the threat of entry, and reducing rivalry among existing firms. Because of the
potential to reduce competitive intensity in an industry, government authorities such
EXHIBIT 9.1 /
Sources of Value Creation and Costs in Horizontal Integration
Corporate Strategy Sources of Value Creation (V ) Sources of Costs (C )
Horizontal integration through M&A
• Reduction in competitive intensity
• Lower costs
• Increased differentiation
• Integration failure
• Reduced flexibility
• Increased potential for legal repercussions
WWW.YAZDANPRESS.COMWWW.YAZDANPRESS.COM

280 CHAPTER 9 Corporate Strategy: Mergers and Acquisitions, Strategic Alliances
as the FTC and/or the European Commission usually must approve any large horizon-
tal integration activity. For example, the FTC did not approve the proposed merger
between Staples and Office Depot, arguing that the remaining industry would have
only two competitors (the other being Office Max). Staples and Office Depot argued
that the market for office supplies needed to be defined more broadly to include large
retailers such as Walmart and Target. The U.S. courts sided with the FTC, which
argued that the prices for end consumers would be significantly higher if the market
had only two category killers. 3
LOWER COSTS. Research provides empirical evidence that firms use horizontal inte-
gration to lower costs through economies of scale, enhance their economic value creation,
and in turn their performance. 4 In industries that have high fixed costs, achieving econo-
mies of scale through large output is critical in lowering costs. The dominant pharmaceu-
tical companies such as Pfizer, Roche, and Novartis, for example, maintain large sales
forces (“detail people”) who call on doctors and hospitals to promote their products. These
specialized sales forces often number 10,000 or more, and thus are a significant fixed cost
to the firms, even though part of their compensation is based on commissions. Maintain-
ing such a large and sophisticated sales force (many with MBAs) is costly if the firm has
only a few drugs it can show the doctor. As a rule of thumb, if a pharma company does not
possess a blockbuster drug that brings in more than $1 billion in annual revenues, it cannot
maintain its own sales force. 5 When existing firms such as Pfizer and Wyeth merge, they
join their drug pipelines and portfolios of existing drugs. They are likely to have one sales
force for the combined portfolio, consequently reducing the size of the sales force and
lowering the overall cost of distribution.
INCREASED DIFFERENTIATION. Horizontal integration through M&A can help
firms strengthen their competitive positions by increasing the differentiation of their prod-
uct and service offerings. In particular, horizontal integration can do this by filling gaps
in a firm’s product offering, allowing the combined entity to offer a complete suite of
products and services. To enhance its differentiated appeal, Oracle acquired PeopleSoft for
$10 billion in 2005. This horizontal integration joined Oracle, the world’s leading enter-
prise software company, whose core competency is in database management systems, with
PeopleSoft, a market leader in human resource management systems. This move allowed
Oracle to offer its customers a complete suite of enterprise software systems to optimize
their entire internal value chains.
WHY DO FIRMS MAKE ACQUISITIONS?
When first defining the terminology at the beginning of the chapter, we noted that an
acquisition describes the purchase or takeover of one company by another. Why do firms
make acquisitions? Three main reasons stand out:
■ To gain access to new markets and distribution channels.
■ To gain access to a new capability or competency.
■ To preempt rivals.
Firms sometimes make acquisitions to overcome entry barriers. Merging with com-
petitors can allow firms to gain access to new markets and distribution channels. Strategy
Highlight 9.1 discusses Kraft’s acquisition of Cadbury to tap into new distribution chan-
nels in both the U.S. and fast-growing international markets.
Larger firms—such as GE, Cisco, Siemens, and Microsoft—often engage in serial
acquisitions to maintain a window on the latest technology developments. These companies
LO 9-3
Explain why firms engage in acquisitions.
WWW.YAZDANPRESS.COMWWW.YAZDANPRESS.COM

CHAPTER 9 Corporate Strategy: Mergers and Acquisitions, Strategic Alliances 281
Food Fight: Kraft’s Hostile
Takeover of Cadbury
In 2010, Kraft Foods bought its UK-based competitor Cadbury PLC for close to $20 billion in a hostile takeover. Unlike the more diversified food-products company Kraft, Cadbury was focused solely on candy and gum. Hail-ing back to 1824, Cadbury established itself in markets across the globe, in concert with the British Empire.
Kraft was attracted to Cadbury due to its strong posi-tion in countries such as India, Egypt, and Thailand and in fast-growing markets in Latin America. Cadbury held 70 percent of the market share for chocolate in India, with more than one billion people. Children there specifically ask for “Cadbury chocolate” instead of just plain “choco-late.” It is difficult for outsiders like Kraft to break into emerging economies because earlier entrants have devel-oped and perfected their distribution systems to meet the needs of millions of small, independent vendors. To secure a strong strategic position in these fast-growing emerg-ing markets, therefore, Kraft felt that horizontal integra-tion with Cadbury was critical. Kraft continues to face formidable competitors in global markets, including Nestlé and Mars (which is especially strong in China where its
famous Snickers bar was the official chocolate of the 2008 Olympic Games in Beijing).
In the U.S. market, the Cadbury acquisition allows Kraft greater access to convenience stores, gives it a new distribution channel, and opens a market for it that is growing fast and tends to have high profit margins. To achieve a stronger strategic position in the domestic market, Kraft has to compete with The Hershey Com-pany, the largest U.S. chocolate manufacturer. This bat-tle is intense because Hershey’s main strategic focus is on the domestic market. With the U.S. population grow-ing slowly and becoming more health conscious, how-ever, Hershey decided to enter the Chinese market in 2013, the world’s fastest-growing candy market. Since its founding in 1894, Hershey’s entry into China is the company’s first new product launch outside the United States. With Hershey’s attention on China, Kraft could have a window of opportunity for gaining market share in the U.S. market.
In 2012, Kraft Foods announced a restructuring. It separated its North American grocery-food business from its fast-growing global snack-food and candy business (including Oreos and Cadbury chocolate), which is now Mondeléz International. 6
9.1
acquire small startups not only to gain access to a new capability or competency, but also
to preempt rivals from doing so.
Let’s look at the acquisitions made by some of the leading Internet companies: Google,
Facebook, and Yahoo. 7 Google, the leader in online search and advertisement, engaged in
a number of smaller acquisitions of tech ventures to fill gaps in its competency lineup. In
2006, Google bought YouTube, the video-sharing website, for $1.65 billion. Also moti-
vated by the desire to gain a new capability, Facebook acquired Instagram, a photo and
video-sharing social media site, for $1 billion in 2012. Likewise, Yahoo is attempting to
fill a gap in its social networking capabilities by acquiring Tumblr for $1.1 billion in 2013.
In 2013, Google purchased the Israeli startup company Waze for $1 billion. Google
acquired Waze to gain access to a new capability and to prevent rivals from gaining access.
Waze’s claim to fame is its interactive mobile map app. Google is already the leader in
online maps and wanted to extend this capability to mobile devices. Perhaps even more
importantly, Google’s intent was to preempt its competitors Apple and Facebook from
buying Waze. Apple and Facebook are each comparatively weaker than Google in the
increasingly important interactive mobile map and information services segment.
Google engaged in a somewhat larger acquisition when it bought Motorola’s cell phone
unit for $12.5 billion (in 2011). This was done to gain access to Motorola’s valuable patent
holdings in mobile technology. The Motorola acquisition also enables Google to integrate
hardware and software (Android OS) more seamlessly. In turn, this positions Google better
to compete with Apple and Samsung in mobile devices.
WWW.YAZDANPRESS.COMWWW.YAZDANPRESS.COM

282 CHAPTER 9 Corporate Strategy: Mergers and Acquisitions, Strategic Alliances
M&A AND COMPETITIVE ADVANTAGE
Do mergers and acquisitions create competitive advantage? Despite their popularity, the
answer, surprisingly, is that in most cases they do not. In fact, the M&A performance
track record is rather mixed. Most mergers destroy shareholder value because the antici-
pated synergies never materialize. 8 If there is any value creation, it generally accrues to the
shareholders of the firm that was taken over (the acquiree), because acquirers often pay a
premium when buying the target company. 9 Indeed, sometimes companies get involved in
a bidding war for an acquisition; the winner may end up with the prize but may have over-
paid for the acquisition—thus falling victim to the winner’s curse. Given that mergers and acquisitions, on average, destroy rather than create shareholder
value, why do we see so many mergers? Reasons include:
■ Principal–agent problems
■ The desire to overcome competitive disadvantage
■ Superior acquisition and integration capability
PRINCIPAL–AGENT PROBLEMS. When discussing diversification in the previous
chapter, we noted that some firms diversify through acquisitions due to principal–agent
problems. 10 Managers, as agents, are supposed to act in the best interest of the principals,
the shareholders. However, managers may have incentives to grow their firms through
acquisitions—not for anticipated shareholder value appreciation, but to build a larger
empire, which is positively correlated with prestige, power, and pay. Besides providing
higher compensation and more corporate perks, a larger organization may also provide
more job security, especially if the company pursues unrelated diversification.
A related problem is managerial hubris , a form of self-delusion in which managers
convince themselves of their superior skills in the face of clear evidence to the contrary. 11
Managerial hubris comes in two forms:
1. Managers of the acquiring company convince themselves that they are able to manage the
business of the target company more effectively and, therefore, create additional share-
holder value. This justification is often used for an unrelated diversification strategy.
2. Although most top-level managers are aware that the majority of acquisitions destroy
rather than create shareholder value, they see themselves as the exceptions to the
rule.
Managerial hubris has led to many ill-fated deals, destroying billions of dol-
lars. For example, Quaker Oats Company acquired Snapple because its manag-
ers thought Snapple was another Gatorade, which was a successful previous
acquisition.12 The difference was that Gatorade had been a standalone company
and was easily integrated, but Snapple relied on a decentralized network of
independent distributors and retailers who did not want Snapple to be taken
over and who made it difficult and costly for Quaker Oats Company to inte-
grate Snapple. The acquisition failed—and Quaker Oats itself was taken over
by PepsiCo. Snapple was spun out and eventually ended up being part of the
Dr Pepper Snapple Group.
THE DESIRE TO OVERCOME COMPETITIVE DISADVANTAGE. In
some instances, mergers are not motivated by gaining competitive advantage,
but by overcoming a competitive disadvantage. For example, to compete more
successfully with Nike, the worldwide leader in sports shoes and apparel,
adidas (#2) acquired Reebok (#3) for $3.8 billion in 2006. This acquisition
LO 9-4
Evaluate whether mergers and acquisitions lead to competitive advantage.
managerial hubris
A form of self-delusion in which managers convince themselves of their superior skills in the face of clear evidence to the contrary.
WWW.YAZDANPRESS.COMWWW.YAZDANPRESS.COM

CHAPTER 9 Corporate Strategy: Mergers and Acquisitions, Strategic Alliances 283
allowed the now-larger adidas group to benefit from economies of scale and scope that
were unachievable when adidas and Reebok operated independently. Overcoming its
competitive disadvantage against Nike in turn strengthened adidas’ competitive position.
Indeed, overcoming a competitive disadvantage may put an organization on the road to
gaining a competitive advantage.
SUPERIOR ACQUISITION AND INTEGRATION CAPABILITY. Acquisition and
integration capabilities are not equally distributed across firms. Although there is strong
evidence that mergers and acquisitions, on average, destroy rather than create shareholder
value, it does not exclude the possibility that some firms are consistently able to identify,
acquire, and integrate target companies to strengthen their competitive positions. Since it
is valuable, rare, and difficult to imitate, a superior acquisition and integration capability,
together with past experience, can lead to competitive advantage.
Cisco Systems, a networking and telecommunications company, is one such firm with
an exemplary acquisitions record. 13 To position itself more strongly after the 2001 burst-
ing of the Internet and tech stock bubble, Cisco embarked on an acquisitions-led growth
strategy in which it acquired more than 150 technology companies. 14 Through this process,
it diversified from computer networking routers to local area networking switching, Voice
over IP (Internet telephony), and home networks. While Cisco acquired mainly smaller
technology companies, it also acquired several larger firms including Linksys, Scientific
Atlanta, and WebEx, now each multibillion-dollar business units in their own right. Cisco
buys successful companies, provides them with important complementary assets, and then
lets them continue to be successful more or less on their own. Cisco has developed a tem-
plate to monitor, evaluate, select, buy, and integrate technology ventures. It benefits from
learning- and experience-curve effects accumulated through its large number of acquisi-
tions. Because of this superior integration template, Cisco kept the management of the
larger firms it acquired and managed the relationships more like strategic alliances than
acquisitions. 15
In stark contrast to Cisco, HP did not have as much expertise in selecting, pricing, and
integrating technology acquisitions. HP wrote off completely some of its recent technol-
ogy acquisitions, taking billions of dollars in losses. In 2011, HP acquired Palm, a pioneer
in personal digital assistants (PDAs). 16 HP’s strategic intent was to leverage the Palm’s
webOS mobile operating system into a stronger position in the fast-growing smartphone
and tablet-computer markets in order to compete more effectively with Apple’s lead. Not
even a year later, HP wrote off almost $2 billion and declared the Palm OS acquisition a
failure. HP capitulated to Apple, and decided to exit the mobile device industry. Even more
disastrous was HP’s acquisition of the UK-based enterprise-software company Autonomy.
In 2011, HP spent a whopping $11 billion for the company, only to write down $9 billion
some two years later. 17
We now turn to discussing strategic alliances as the second key vehicle for corporate
strategy.
9.2 Strategic Alliances
Strategic alliances are voluntary arrangements between firms that involve the sharing of
knowledge, resources, and capabilities with the intent of developing processes, products,
or services. 18 Firms enter many types of alliances, from small contracts that have no bear-
ing on a firm’s competitiveness to multibillion-dollar joint ventures that can make or break
the company. An alliance, therefore, qualifies as strategic only if it has the potential to
affect a firm’s competitive advantage.
strategic alliance A voluntary arrangement between firms that involves the sharing of knowledge, resources, and capabilities with the intent of developing processes, products, or services.
LO 9-5
Define strategic alliances, and explain why they are important corporate strategy vehicles and why firms enter into them.
WWW.YAZDANPRESS.COMWWW.YAZDANPRESS.COM

284 CHAPTER 9 Corporate Strategy: Mergers and Acquisitions, Strategic Alliances
The use of strategic alliances to implement corporate strategy has exploded since the
1980s, with thousands forming each year. 19 Strategic alliances may join complementary
parts of a firm’s value chain, such as R&D and marketing, or they may focus on joining the
same value chain activities. Strategic alliances are attractive because they enable firms to
achieve goals faster and at lower costs than going it alone. Globalization has also contrib-
uted to an increase in cross-border strategic alliances.
A strategic alliance has the potential to help a firm gain and sustain a competitive
advantage when it joins together resources and knowledge in a combination that obeys the
VRIO principles (introduced in Chapter 4). 20 The locus of competitive advantage is often
not found within the individual firm but within a strategic partnership. According to this
relational view of competitive advantage , critical resources and capabilities frequently
are embedded in strategic alliances that span firm boundaries. Applying the VRIO frame-
work introduced in Chapter 4, we know that the basis for competitive advantage is formed
when a strategic alliance creates resource combinations that are valuable, rare, and difficult
to imitate, and the alliance is organized appropriately to allow for value capture. In support
of this perspective, over 80 percent of Fortune 1000 CEOs indicated in a recent survey that
more than one-quarter of their firm’s revenues were derived from strategic alliances. 21
Using a strategic alliance, HP and DreamWorks Animation SKG created the Halo
Collaboration Studio, which makes virtual communication possible around the globe. 22
Halo’s conferencing technology gives participants the vivid sense that they are in the same
room. The conference rooms of clients match, down to the last detail, giving participants
the impression that they are sitting together at the same table. DreamWorks produced the
computer-animated movie Shrek 2 using this new technology for its meetings. People with
different creative skills—script writers, computer animators, directors—though dispersed
geographically, were able to participate as if in the same room, even seeing the work on
each other’s laptops. Use of the technology enabled faster decision making, enhanced pro-
ductivity, reduced (or even eliminated) travel time and expense, and increased job satis-
faction. Neither HP nor DreamWorks would have been able to produce this technology
breakthrough alone, but moving into the videoconferencing arena together via a strategic
alliance allowed both partners to pursue related diversification. Moreover, HP’s alliance
with DreamWorks Animation SKG enabled HP to compete head on with Cisco’s high-end
videoconferencing solution, TelePresence. 23
WHY DO FIRMS ENTER STRATEGIC ALLIANCES?
To affect a firm’s competitive advantage, an alliance must promise a positive effect on
the firm’s economic value creation through increasing value and/or lowering costs (see
discussion in Chapter 5). This logic is reflected in the common reasons why firms enter
alliances. 24 They do so to:
■ Strengthen competitive position.
■ Enter new markets.
■ Hedge against uncertainty.
■ Access critical complementary assets.
■ Learn new capabilities.
STRENGTHEN COMPETITIVE POSITION. Firms can use strategic alliances to
change the industry structure in their favor. 25 Firms frequently use strategic alliances
when competing in so-called battles for industry standards (see discussion in Chapter 7).
relational view
of competitive
advantage
Strategic management framework that proposes that critical resources and capabilities frequently are embedded in strategic alliances that span firm boundaries.
WWW.YAZDANPRESS.COMWWW.YAZDANPRESS.COM
CHAPTER 9 Corporate Strategy: Mergers and Acquisitions, Strategic Alliances 285
Or they may also initiate these alliances by themselves to challenge market leaders and
thus change the underlying market structure. Strategy Highlight 9.2 shows how Apple
orchestrated a web of strategic alliances with publishing houses to challenge Amazon’s
early lead in the delivery of e-content.
ENTER NEW MARKETS. Firms may use strategic alliances to enter new markets,
either in terms of geography or products and services. 27 In some instances, governments
such as Saudi Arabia or China may require that foreign firms have a local joint venture
partner before doing business in their countries. These cross-border strategic alliances have
both benefits and risks. While the foreign firm can benefit from local expertise and con-
tacts, it is exposed to the risk that some of its proprietary know-how may be appropriated
by the foreign partner. We will address such issues in the next chapter when studying
global strategy.
Microsoft, though the leader in PC-based software, has been struggling for years to gain
a foothold in the online search and advertising market. As personal computing moves more
Strategic Alliances to
Challenge Amazon
In 2007, Amazon established its Kindle device as the dominant e-reader by offering content (e-books, news-papers, and magazines) for instant download at heavily discounted prices. Kindle users paid $9.99 for e-books, including new releases and The New York Times’ best sell-ers. Amazon lost money on each e-book sold, because it had to pay publishers between $12.99 and $14.99 per e-book. Still, it was able to leverage this pricing strategy to establish Kindle as the dominant e-reader with 90 per-cent market share.
Selling below cost is the same pricing strategy Amazon had used successfully when it first established itself as the leading e-tailer in sales of printed books. Amazon’s e-book pricing strategy, however, did not sit well with content providers. They did not want to set an expectation in consumers’ minds that all e-books should be priced at $9.99. Also, anchoring the e-book prices clearly would have negative repercussions for the sale of printed books, which are priced higher.
Apple crafted a different e-book business model. To attack Amazon’s stronghold, Apple orchestrated a web of strategic alliances with major publishing houses such as HarperCollins, Macmillan, McGraw-Hill, and Simon & Schuster prior to launching its iPad product. To incentivize
the publishers, Apple offered to let the content providers set the sales prices directly for the end consumers. These alliances aided Apple in populating its iBookstore with much needed content for iPad when it launched in 2010.
The publishers liked this deal. They retained pricing power over e-books, which allowed them to break the cus-tomer expectation that e-books should be priced at $9.99. In this agency model, publishers set the retail prices and Apple would take a 30 percent cut. Their alliances with Apple also gave the publishers much needed leverage in negotiations with Amazon. Applying industry structural analysis, the bargaining power of suppliers—in this case, the content providers—increased from Amazon’s perspec-tive. In fact, book publishers even threatened to withhold or delay book titles if Amazon would not change its pric-ing structure. As a result, Amazon reluctantly changed its e-book pricing strategy and now charges between $12.99 and $14.99 for some new releases.
The U.S. Department of Justice suspected collusion between Apple and the book publishers. It alleged that they conspired to fix prices, which is illegal. Although the book publishers settled with the Department of Justice, Apple and the publishers maintained their innocence. Amazon’s market share in the e-book readers has dropped from 90 to 60 percent. In July 2013, a federal judge ruled that Apple colluded with five major publishers to drive up prices of e-books. 26
9.2
WWW.YAZDANPRESS.COMWWW.YAZDANPRESS.COM

286 CHAPTER 9 Corporate Strategy: Mergers and Acquisitions, Strategic Alliances
and more into the cloud, and PC-based software can be replaced by free online offerings
such as Google Docs, it is critical for Microsoft to establish future revenue streams. The
new cloud computing market, in which money is made, for example, from the accompany-
ing online advertising, reached $30 billion in 2013. 28
Although Yahoo’s co-founder and then-CEO Jerry Yang rebuffed Microsoft’s $48 bil-
lion acquisition bid for Yahoo in 2008, Microsoft was able to get a much better deal through
a subsequent strategic alliance. In early 2009, Yahoo appointed Carol Bartz as its new
CEO, and she almost immediately rekindled negotiations with Microsoft’s CEO Steve
Ballmer, who suggested a strategic alliance between the two companies. Yahoo and Micro-
soft formed a partnership through which Yahoo’s searches are powered by Microsoft’s
search engine, Bing. In return, Yahoo gets a portion of the revenues from the search ads
sold on its sites. With its technology now powering some 30 percent of all online searches,
Microsoft is able to fine-tune Bing. Microsoft can strengthen its competitive position
against Google’s dominance in online search and advertisement. 29 In the end, this strategic
alliance was a low-cost alternative to an acquisition for Microsoft. But why did Yahoo agree to the deal? It entered this alliance
because it had not generated the cash flow necessary to continuously
update its own search technology. As a consequence of the lack of
adequate cash flow, Yahoo suffered years of a competitive disad-
vantage, especially in comparison to online search leader Google.
Yahoo also churned through a number of CEOs. Carol Bartz was let
go in 2011 and replaced by a number of short-term (interim) CEOs.
In 2012, Yahoo appointed Marissa Mayer as CEO. Ms. Mayer was
hired away from Google, which she had joined in 1999 as employee
number 20. When departing for Yahoo, Marissa Mayer was a vice
president at Google.
HEDGE AGAINST UNCERTAINTY. In dynamic markets, strategic alliances allow
firms to limit their exposure to uncertainty in the market. 30 For instance, in the wake of the
biotechnology revolution, incumbent pharmaceutical firms such as Pfizer, Novartis, and
Roche entered into hundreds of strategic alliances with biotech startups. 31 These alliances
allowed the big pharma firms to make small-scale investments in many of the new biotech-
nology ventures that were poised to disrupt existing market economics. In some sense, the
pharma companies were taking real options in these biotechnology experiments, providing
them with the right but not the obligation to make further investments when new drugs
were introduced from the biotech companies.
A real-options perspective to strategic decision making breaks down a larger invest-
ment decision (such as whether to enter biotechnology or not) into a set of smaller decisions
that are staged sequentially over time. This approach allows the firm to obtain additional
information at predetermined stages. At each stage, after new information is revealed, the
firm evaluates whether or not to make further investments. In a sense, a real option, which
is the right, but not the obligation, to continue making investments allows the firm to buy
time until sufficient information for a go versus no-go decision is revealed. Once the new
biotech drugs were a known quantity, the uncertainty was removed, and the incumbent
firms could react accordingly.
For example, in 1990 the Swiss pharma company Roche initially invested $2.1 bil-
lion in an equity alliance to purchase a controlling interest ( > 50 percent) in the biotech
startup Genentech. In 2009, after witnessing the success of Genentech’s drug discovery
and development projects in subsequent years, Roche spent $47 billion to purchase the
remaining minority interest in Genentech, making it a wholly owned subsidiary. 32 Taking
Marissa Mayer, CEO of Yahoo.
WWW.YAZDANPRESS.COMWWW.YAZDANPRESS.COM

CHAPTER 9 Corporate Strategy: Mergers and Acquisitions, Strategic Alliances 287
a wait-and-see approach by entering strategic alliances allows incumbent firms to buy time
and wait for the uncertainty surrounding the market and technology to fade. Many firms
in fast-moving markets subscribe to this rationale. Besides biotechnology, it has also been
documented in nanotechnology, semiconductors, and other dynamic markets. 33
ACCESS CRITICAL COMPLEMENTARY ASSETS. The successful commercializa-
tion of a new product or service often requires complementary assets such as marketing,
manufacturing, and after-sale service. 34 In particular, new firms are in need of comple-
mentary assets to complete the value chain from upstream innovation to downstream com-
mercialization. This implies that a new venture that has a core competency in R&D, for
example, will need to access distribution channels and marketing expertise to complete the
value chain. Building downstream complementary assets such as marketing and regulatory
expertise or a sales force is often prohibitively expensive and time-consuming, and thus
frequently not an option for new ventures. Strategic alliances allow firms to match comple-
mentary skills and resources to complete the value chain. Moreover, licensing agreements
of this sort allow the partners to benefit from a division of labor, allowing each to effi-
ciently focus on its core competency.
LEARN NEW CAPABILITIES. Firms enter strategic alliances because they are moti-
vated by the desire to learn new capabilities from their partners. 35 When the collaborating
firms are also competitors, co-opetition ensues. 36 Co-opetition is a portmanteau describ-
ing cooperation by competitors. They may cooperate to create a larger pie but then might
compete about how the pie should be divided. Such co-opetition can lead to learning races in strategic alliances, 37 a situation in which both partners are motivated to form an alliance
for learning, but the rate at which the firms learn may vary. The firm that learns faster and
accomplishes its goal more quickly has an incentive to exit the alliance or, at a minimum,
to reduce its knowledge sharing. Since the cooperating firms are also competitors, learn-
ing races can have a positive effect on the winning firm’s competitive position vis-à-vis its
alliance partner.
NUMMI (New United Motor Manufacturing, Inc.) was the first joint venture in the U.S.
automobile industry, formed between GM and Toyota in 1984. Recall from Chapter 8 that
joint ventures are a special type of a strategic alliance in which two partner firms create
a third, jointly owned entity. In the NUMMI joint venture, each partner was motivated to
learn new capabilities: GM entered the strategic alliance to learn the lean manufacturing
system pioneered by Toyota in order to produce high-quality, fuel-efficient cars at a profit.
Toyota entered the alliance to learn how to implement its lean manufacturing program with
an American work force. NUMMI was a test-run for Toyota before building fully owned
greenfield plants (new manufacturing facilities) in Alabama, Indiana, Kentucky, Texas,
and West Virginia. In this 25-year history, GM and Toyota built some seven million high-
quality cars at the NUMMI plant. In fact, NUMMI was transformed from worst performer
real-options perspective
Approach to strategic decision making that breaks down a larger investment decision into a set of smaller decisions that are staged sequentially over time. This approach allows the firm to obtain additional information in pre-determined stages.
co-opetition Cooperation by competitors to achieve a strategic objective.
learning races Situations in which both partners in a strategic alliance are motivated to form an alliance for learning, but the rate at which the firms learn may vary; the firm that accomplishes its goal more quickly has an incentive to exit the alliance or reduce its knowledge sharing.
WWW.YAZDANPRESS.COMWWW.YAZDANPRESS.COM

288 CHAPTER 9 Corporate Strategy: Mergers and Acquisitions, Strategic Alliances
(under GM ownership prior to the joint venture) to GM’s highest-quality plant in the U.S.
In the end, as part of GM’s bankruptcy reorganization during 2009–2010, it pulled out of
the NUMMI joint venture.
The joint venture between GM and Toyota can be seen as a learning race. Who won?
Strategy scholars argue that Toyota was faster in accomplishing its alliance goal—learning
how to manage U.S. labor—because of its limited scope. 38 Toyota had already perfected
lean manufacturing; all it needed to do was learn how to train U.S. workers in the method
and transfer this knowledge to its subsidiary plants in the U.S. On the other hand, GM
had to learn a completely new production system. GM was successful in transferring lean
manufacturing to its newly created Saturn brand (which was discontinued in 2010 as part
of GM’s reorganization), but it had a hard time implementing lean manufacturing in its
existing plants. These factors suggest that Toyota won the learning race with GM, which in
turn helped Toyota gain and sustain a competitive advantage over GM in the U.S. market.
Also, note that different motivations for forming alliances are not necessarily indepen-
dent and can be intertwined. For example, firms that collaborate to access critical comple-
mentary assets may also want to learn from one another to subsequently pursue vertical
integration. In sum, alliance formation is frequently motivated by leveraging economies of
scale, scope, specialization, and learning.
GOVERNING STRATEGIC ALLIANCES
In Chapter 8, we showed that strategic alliances lie in the middle of the make-or-buy
continuum (see Exhibit 8.3). Alliances can be governed by the following mechanisms—
contractual agreements for:
■ Non-equity alliances
■ Equity alliances
■ Joint ventures 39
Exhibit 9.2 provides an overview of the key characteristics of the three alliance types,
including their advantages and disadvantages.
NON-EQUITY ALLIANCES. The most common type of alliance is a non-equity alliance , which is based on contracts between firms. The most frequent forms of non-equity alliances
are supply agreements, distribution agreements, and licensing agreements. As suggested by
their names, these contractual agreements are vertical strategic alliances, connecting differ-
ent parts of the industry value chain. In a non-equity alliance, firms tend to share explicit knowledge —knowledge that can be codified. Patents, user manuals, fact sheets, and scientific
publications are all ways to capture explicit knowledge, which concerns the notion of knowing about a certain process or product.
Licensing agreements are contractual alliances in which the participants regularly
exchange codified knowledge. The biotech firm Genentech licensed its newly developed
drug Humulin (human insulin) to the pharmaceutical firm Eli Lilly for manufacturing,
facilitating approval by the Food and Drug Administration (FDA), and distribution. This
partnership was an example of a vertical strategic alliance: one partner (Genentech) was
positioned upstream in the industry value chain focusing on R&D, while the other partner
(Eli Lilly) was positioned downstream focusing on manufacturing and distribution. This
type of vertical arrangement is often described as a “hand-off” from the upstream partner
to the downstream partner, and is possible because the underlying knowledge is largely
explicit and can be easily codified. When Humulin reached the market in 1982, it was
the first approved genetically engineered human therapeutic worldwide. 40 Subsequently,
Humulin became a billion-dollar blockbuster drug.
LO 9-6
Describe three alliance governance mechanisms and evaluate their pros and cons.
non-equity alliance
Partnership based on contracts between firms. The most frequent forms are supply agreements, distribution agreements, and licensing agreements.
explicit knowledge
Knowledge that can be codified (e.g., information, facts, instructions, recipes); concerns knowing about a process or product.
WWW.YAZDANPRESS.COMWWW.YAZDANPRESS.COM

CHAPTER 9 Corporate Strategy: Mergers and Acquisitions, Strategic Alliances 289
Because of their contractual nature, non-equity alliances are flexible and easy to initi-
ate and terminate. However, because they can be temporary in nature, they also sometimes
produce weak ties between the alliance partners, which can result in a lack of trust and
commitment.
EQUITY ALLIANCES. In an equity alliance , at least one partner takes partial owner-
ship in the other partner. Equity alliances are less common than contractual, non-equity
alliances because they often require larger investments. Because they are based on partial
equity alliance
Partnership in which at least one partner takes partial ownership in the other.
EXHIBIT 9.2 / Key Characteristics of Different Alliance Types
Alliance TypeGovernance Mechanism Frequency
Type of Knowledge Exchanged Pros Cons Examples
Non-equity (supply, licensing, and distribution agreements)
Contract Most common Explicit • Flexible
• Fast
• Easy to initiate and terminate
• Weak tie
• Lack of trust and commitment
• Genentech–Lilly (exclusive) licensing agreement for Humulin
• Microsoft–IBM (non-exclusive) licensing agreement for MS-DOS
Equity (purchase of an equity stake or corporate venture capital, CVC investment)
Equity investment
Less common than non-equity alliances, but more common than joint ventures
Explicit; exchange of tacit knowledge possible
• Stronger tie
• Trust and commitment can emerge
• Window into new technology (option value)
• Less flexible
• Slower
• Can entail significant investments
• Renault–Nissan alliance based on cross equity holdings, with Renault owning 44.4% in Nissan; and Nissan owning 15% in Renault
• Roche’s equity investment in Genentech (prior to full integration)
Joint venture (JV)
Creation of new entity by two or more parent firms
Least common Both tacit and explicit knowledge exchanged
• Strongest tie
• Trust and commitment likely to emerge
• May be required by institutional setting
• Can entail long negotiations and significant investments
• Long-term solution
• JV managers have double reporting lines (2 bosses)
• Hulu, JV owned by NBC, Fox, and ABC
• Dow Corning, JV owned by Dow Chemical and Corning
WWW.YAZDANPRESS.COMWWW.YAZDANPRESS.COM

290 CHAPTER 9 Corporate Strategy: Mergers and Acquisitions, Strategic Alliances
ownership rather than contracts, equity alliances are used to signal stronger commitments.
Moreover, equity alliances allow for the sharing of tacit knowledge —knowledge that can-
not be codified. 41 Tacit knowledge concerns knowing how to do a certain task. It can be
acquired only through actively participating in the process. In an equity alliance, therefore,
the partners frequently exchange personnel to make the acquisition of tacit knowledge
possible.
Toyota is using an equity alliance with Tesla Motors,
a designer and developer of electric cars, to learn new
knowledge and gain a window into new technology. In
2010, Toyota made a $50 million equity investment in
the California startup company. In the same year, Tesla
Motors purchased the NUMMI plant in Fremont, Cali-
fornia, where it now manufactures its Model S sedan.
Tesla’s CEO Elon Musk stated, “The Tesla factory
effectively leverages an ideal combination of hardcore
Silicon Valley engineering talent, traditional automotive
engineering talent and the proven Toyota production
system.” 42 Toyota in turn hopes to infuse its company
with Tesla’s entrepreneurial spirit. Toyota President
Akio Toyoda commented that “by partnering with
Tesla, my hope is that all Toyota employees will recall
that ‘venture business spirit’ and take on the challenges of the future.” 43 Mr. Toyoda hopes
that a transfer of tacit knowledge will take place, in which Tesla’s entrepreneurial spirit
reinvigorates Toyota. 44
Another governance mechanism that falls under the broad rubric of equity alliances is
corporate venture capital (CVC) investments, which are equity investments by estab-
lished firms in entrepreneurial ventures. 45 The value of CVC investments is estimated to be
in the double-digit billion-dollar range each year. Larger firms frequently have dedicated
CVC units, such as Dow Venture Capital, Siemens Venture Capital, Kaiser Permanente
Ventures, and Johnson & Johnson Development Corporation. Rather than hoping primar-
ily for financial gains, as venture capitalists traditionally do, CVC investments create real
options in terms of gaining access to new, and potentially disruptive, technologies. 46 Strat-
egy scholars find that CVC investments have a positive impact on value creation for the
investing firm, especially in high-tech industries such as semiconductors, computing, and
the medical-device sector. 47
Taken together, equity alliances tend to produce stronger ties and greater trust between
partners than non-equity alliances do. They also offer a window into new technology that,
like a real option, can be exercised if successful or abandoned if not promising. Equity alli-
ances are frequently stepping stones toward full integration of the partner firms either through
tacit knowledge
Knowledge that cannot be codified; concerns knowing how to do a certain task and can be acquired only through active participation in that task.
corporate venture capital
(CVC) Equity investments by established firms in entrepreneurial ventures; CVC falls under the broader rubric of equity alliances.
joint venture A standalone organization created and jointly owned by two or more parent companies.
alliance management
capability A firm’s ability to effectively manage three alliance-related tasks concurrently: (1) partner selection and alliance formation, (2) alliance design and governance, and (3) post-formation alliance management.
WWW.YAZDANPRESS.COMWWW.YAZDANPRESS.COM
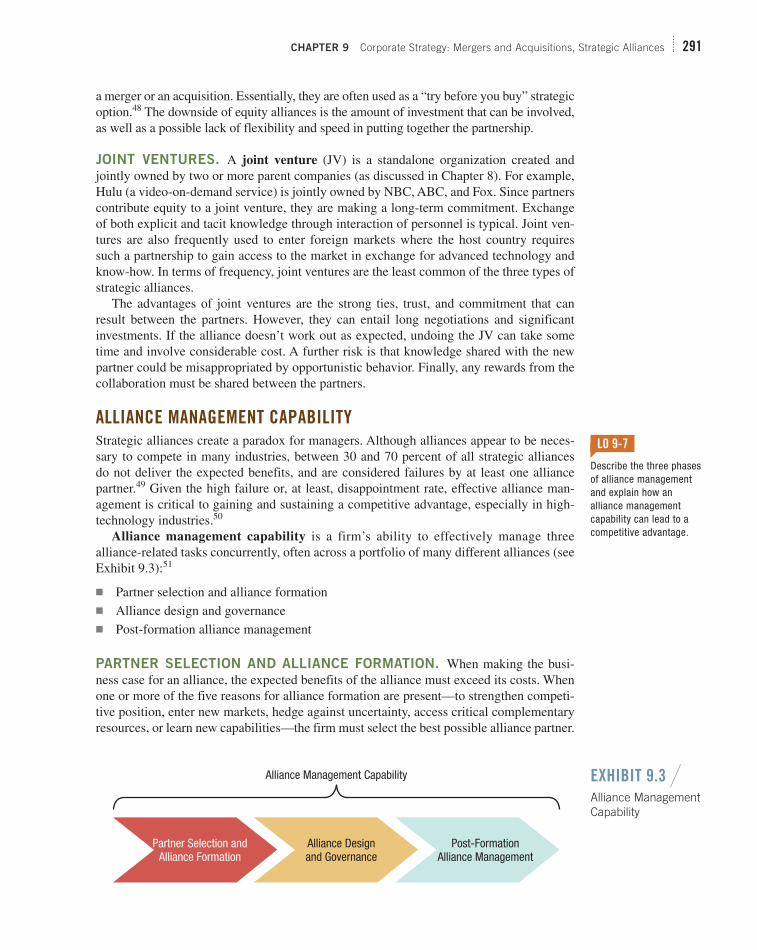
CHAPTER 9 Corporate Strategy: Mergers and Acquisitions, Strategic Alliances 291
a merger or an acquisition. Essentially, they are often used as a “try before you buy” strategic
option. 48 The downside of equity alliances is the amount of investment that can be involved,
as well as a possible lack of flexibility and speed in putting together the partnership.
JOINT VENTURES. A joint venture (JV) is a standalone organization created and
jointly owned by two or more parent companies (as discussed in Chapter 8). For example,
Hulu (a video-on-demand service) is jointly owned by NBC, ABC, and Fox. Since partners
contribute equity to a joint venture, they are making a long-term commitment. Exchange
of both explicit and tacit knowledge through interaction of personnel is typical. Joint ven-
tures are also frequently used to enter foreign markets where the host country requires
such a partnership to gain access to the market in exchange for advanced technology and
know-how. In terms of frequency, joint ventures are the least common of the three types of
strategic alliances.
The advantages of joint ventures are the strong ties, trust, and commitment that can
result between the partners. However, they can entail long negotiations and significant
investments. If the alliance doesn’t work out as expected, undoing the JV can take some
time and involve considerable cost. A further risk is that knowledge shared with the new
partner could be misappropriated by opportunistic behavior. Finally, any rewards from the
collaboration must be shared between the partners.
ALLIANCE MANAGEMENT CAPABILITY
Strategic alliances create a paradox for managers. Although alliances appear to be neces-
sary to compete in many industries, between 30 and 70 percent of all strategic alliances
do not deliver the expected benefits, and are considered failures by at least one alliance
partner. 49 Given the high failure or, at least, disappointment rate, effective alliance man-
agement is critical to gaining and sustaining a competitive advantage, especially in high-
technology industries. 50
Alliance management capability is a firm’s ability to effectively manage three
alliance-related tasks concurrently, often across a portfolio of many different alliances (see
Exhibit 9.3 ): 51
■ Partner selection and alliance formation
■ Alliance design and governance
■ Post-formation alliance management
PARTNER SELECTION AND ALLIANCE FORMATION. When making the busi-
ness case for an alliance, the expected benefits of the alliance must exceed its costs. When
one or more of the five reasons for alliance formation are present—to strengthen competi-
tive position, enter new markets, hedge against uncertainty, access critical complementary
resources, or learn new capabilities—the firm must select the best possible alliance partner.
LO 9-7
Describe the three phases of alliance management and explain how an alliance management capability can lead to a competitive advantage.
EXHIBIT 9.3 /Alliance Management Capability
Alliance Management Capability
Partner Selection andAlliance Formation
Alliance Designand Governance
Post-FormationAlliance Management
WWW.YAZDANPRESS.COMWWW.YAZDANPRESS.COM

292 CHAPTER 9 Corporate Strategy: Mergers and Acquisitions, Strategic Alliances
Partner compatibility and partner commitment are necessary conditions for successful alli-
ance formation. 52 Partner compatibility captures aspects of cultural fit between different
firms. Partner commitment concerns the willingness to make available necessary resources
and to accept short-term sacrifices to ensure long-term rewards.
ALLIANCE DESIGN AND GOVERNANCE. Once two or more firms agree to pursue
an alliance, managers must then design the alliance and choose an appropriate governance
mechanism from among the three options: non-equity contractual agreement, equity alli-
ances, or joint venture. For example, in a study of over 640 alliances, researchers found
that the joining of specialized complementary assets increases the likelihood that the alli-
ance is governed hierarchically. This effect is stronger in the presence of uncertainties
concerning the alliance partner as well as the envisioned tasks. 53
In addition to the formal governance mechanisms, inter-organizational trust is a criti-
cal dimension of alliance success. 54 Because all contracts are necessarily incomplete, trust
between the alliance partners plays an important role for effective post-formation alliance
management. Effective governance, therefore, can be accomplished only by skillfully
combining formal and informal mechanisms.
POST-FORMATION ALLIANCE MANAGEMENT. The third phase in a firm’s alli-
ance management capability concerns the ongoing management of the alliance. To be a
source of competitive advantage, the partnership needs to create resource combinations
that obey the VRIO criteria. As shown in Exhibit 9.4 , this can be most likely accomplished
if the alliance partners make relation-specific investments, establish knowledge-sharing routines, and build interfirm trust. 55
Trust is a critical aspect of any alliance. Interfirm trust entails the expectation that each
alliance partner will behave in good faith and develop norms of reciprocity and fairness. 56
Such trust helps ensure that the relationship survives and thereby increases the possibility
of meeting the intended goals of the alliance. Interfirm trust is also important for fast deci-
sion making. 57 Several firms such as Eli Lilly, HP, Procter & Gamble, and IBM compete to
obtain trustworthy reputations in order
to become the alliance “partner of
choice” for small technology ventures,
universities, and individual inventors.
Indeed, the systematic differences
in firms’ alliance management capa-
bility can be a source of competitive
advantage. 58 But how do firms go
about building alliance management
capability? The answer is to build
capability through repeated experi-
ences over time. In support of this
idea, several empirical studies have
shown that firms move down the learn-
ing curve and become better at manag-
ing alliances through repeated alliance
exposure. 59
The “learning-by-doing” approach
has value for small ventures in which
a few key people coordinate most of
the firms’ activities. 60 However, there
Relation-SpecificInvestments
InterfirmTrust
Knowledge-SharingRoutines
Effective AllianceGovernance
Effec
tive A
llianc
e
Govern
ance
Effective Alliance
Governance
EXHIBIT 9.4 / How to Make Alliances Work
SOURCE: Adapted from J. H. Dyer and H. Singh (1998), “The relational view: Cooperative strategy and the sources of intraorganizational advantage,” Academy of Management Review 23: 660–679.
WWW.YAZDANPRESS.COMWWW.YAZDANPRESS.COM

CHAPTER 9 Corporate Strategy: Mergers and Acquisitions, Strategic Alliances 293
are clearly limitations for larger companies. Firms such as ABB, GE, Philips, or Siemens
are engaged in hundreds of alliances simultaneously. In fact, if alliances are not man-
aged from a portfolio perspective at the corporate level, serious negative repercussions
can emerge. 61 Groupe Danone, a large French food conglomerate, lost its leading position
in the highly lucrative and fast-growing Chinese market because its local alliance partner,
Hangzhou Wahaha Group, terminated their long-standing alliance. 62 Wahaha accused dif-
ferent Danone business units of subsequently setting up partnerships with other Chinese
firms that were a direct competitive threat to Wahaha. This example makes it clear that
although alliances are important pathways by which to pursue business-level strategy, they
are best managed at the corporate level.
To accomplish effective alliance management, strategy scholars suggest that firms
create a dedicated alliance function, 63 led by a vice president or director of alliance
management and endowed with its own resources and support staff. The dedicated alli-
ance function should be given the tasks of coordinating all alliance-related activity in
the entire organization, taking a corporate-level perspective. It should serve as a reposi-
tory of prior experience and be responsible for creating processes and structures to teach
and leverage that experience and related knowledge throughout the rest of the organiza-
tion across all levels. Research shows that firms with a dedicated alliance function are
able to create value from their alliances above and beyond what could be expected based
on experience alone. 64
Pharmaceutical company Eli Lilly is an acknowledged leader in alliance management. 65
Lilly’s Office of Alliance Management, led by a director and endowed with several man-
agers, manages its far-flung alliance activity across all hierarchical levels and around the
globe. Lilly’s process prescribes that each alliance is managed by a three-person team: an
alliance champion, alliance leader, and alliance manager.
■ The alliance champion is a senior, corporate-level executive responsible for high-level
support and oversight. This senior manager is also responsible for making sure that the
alliance fits within the firm’s existing alliance portfolio and corporate-level strategy.
■ The alliance leader has the technical expertise and knowledge needed for the specific
technical area and is responsible for the day-to-day management of the alliance.
■ The alliance manager, positioned within the Office of Alliance Management, serves as
an alliance process resource and business integrator between the two alliance partners,
and provides alliance training and development, as well as diagnostic tools.
Some companies are also able to leverage the relational capabilities obtained through
managing alliance portfolios into a successful acquisition strategy. 66 As detailed earlier,
Eli Lilly has an entire department at the corporate level devoted to managing its alliance
portfolio. Following up on an earlier 50/50 joint venture formed with Icos, maker of the $1
billion-plus erectile-dysfunction drug Cialis, Lilly acquired Icos in 2007. Just a year later,
Eli Lilly outmaneuvered Bristol-Myers Squibb to acquire biotech venture ImClone for
$6.5 billion. ImClone discovered and developed the cancer-fighting drug Erbitux, also a $1
billion blockbuster in terms of annual sales. The acquisition of these two smaller biotech
ventures allowed Lilly to address its problem of an empty drug pipeline. 67
Strategy researchers, therefore, have suggested that corporate-level managers should
not only coordinate the firm’s portfolio of alliances, but also leverage their relationships to
successfully engage in mergers and acquisitions. 68 That is, rather than focusing on devel-
oping an alliance management capability in isolation, firms should develop a relational capability that allows for the successful management of both strategic alliances and merg-
ers and acquisitions.
WWW.YAZDANPRESS.COMWWW.YAZDANPRESS.COM

294 CHAPTER 9 Corporate Strategy: Mergers and Acquisitions, Strategic Alliances
9.3 Implications for the Strategist
The business environment is constantly changing. 69 New opportunities come and go
quickly. Firms often need to develop new resources, capabilities, or competencies to take
advantage of opportunities. Examples abound. Traditional book publishers must transform
themselves into digital content companies. Old-line banking institutions with expensive
networks of branches must now offer seamless online banking services. They must make
them work between a set of traditional and non-traditional payment services on a mobile
platform. Energy providers are in the process of changing their coal-fired power plants to
gas-fired ones in the wake of the shale gas boom. Pharmaceutical companies need to take
advantage of advances in biotechnology to drive future growth. Food companies are now
expected to offer organic, all natural, gluten-free products.
The strategist also knows that firms need to grow to survive and prosper, especially if
they are publicly traded stock companies. A firm’s corporate strategy is critical in pursuing
growth. To be able to grow as well as gain and sustain a competitive advantage, a firm must
not only possess VRIO resources but also be able to leverage existing resources and build
new ones. The question of how to build new resources, capabilities, and competencies to
grow your enterprise lies at the center of corporate strategy.
As a strategist, you have three options at your disposal to drive firm growth: organic
growth through internal development, external growth through alliances, or external growth
through acquisitions. Laurence Capron and Will Mitchell have developed an insightful
step-by-step decision model to guide strategists in selecting the most appropriate corporate
strategy vehicle. 70 Selecting the most appropriate vehicle for corporate strategy in response
to a specific strategic challenge also makes implementation success more likely.
The build-borrow-or-buy framework provides a conceptual model that aids strategists
in deciding whether to pursue internal development ( build ), enter a contract arrangement
or strategic alliance ( borrow ), or acquire new resources, capabilities, and competencies
( buy ). Firms that are able to learn how to select the right pathways to obtain new resources
are more likely to gain and sustain a competitive advantage. Note that in the borrow-build-
or-buy model, the term resources is defined broadly to also include capabilities and com-
petencies. Exhibit 9.5 shows the build-borrow-or-buy decision framework.
The starting point is management’s identification of a strategic resource gap that will
impede future growth. The resource gap is strategic because closing this gap is likely to
lead to a competitive advantage. Also, as we learned in Chapter 4, the required resources
with the potential to lead to competitive advantage cannot be simply bought on the open
market. This is because any firm could buy this simple resource, negating any potential for
competitive advantage. The options to close the strategic resource gap are, therefore, to
build, borrow, or buy (through an acquisition).
After a strategic resource gap has been identified, the first decision question the strate-
gist needs to pose is: Are the firm’s internal resources relevant? The strategist first needs
to consider the firm’s existing resources. As shown in Exhibit 9.5 , if the firm’s inter-
nal resources are highly relevant, the firm should itself build the new resources needed,
through internal development. How does the strategist know whether the firm’s resources
are relevant in addressing the new challenge or opportunity? A firm’s internal resources
are relevant if they are (1) similar to those you need to develop and (2) superior to those of competitors in the targeted area. 71 If both conditions are met, then the firm’s internal
resources are relevant and the strategist should pursue internal development.
Let’s look at both conditions. Often strategists are misled by the first test because things
that might appear similar at the surface are actually quite different deep down. 72 More-
over, managers have a tendency to focus on the similarities they know rather than on the
LO 9-8
Apply the build-borrow-or-buy framework to guide corporate strategy.
build-borrow-or-buy
framework
Conceptual model that aids strategists in deciding whether to pursue internal development (build), enter a contract arrangement or strategic alliance (borrow), or acquire new resources, capabilities, and competencies (buy).
WWW.YAZDANPRESS.COMWWW.YAZDANPRESS.COM
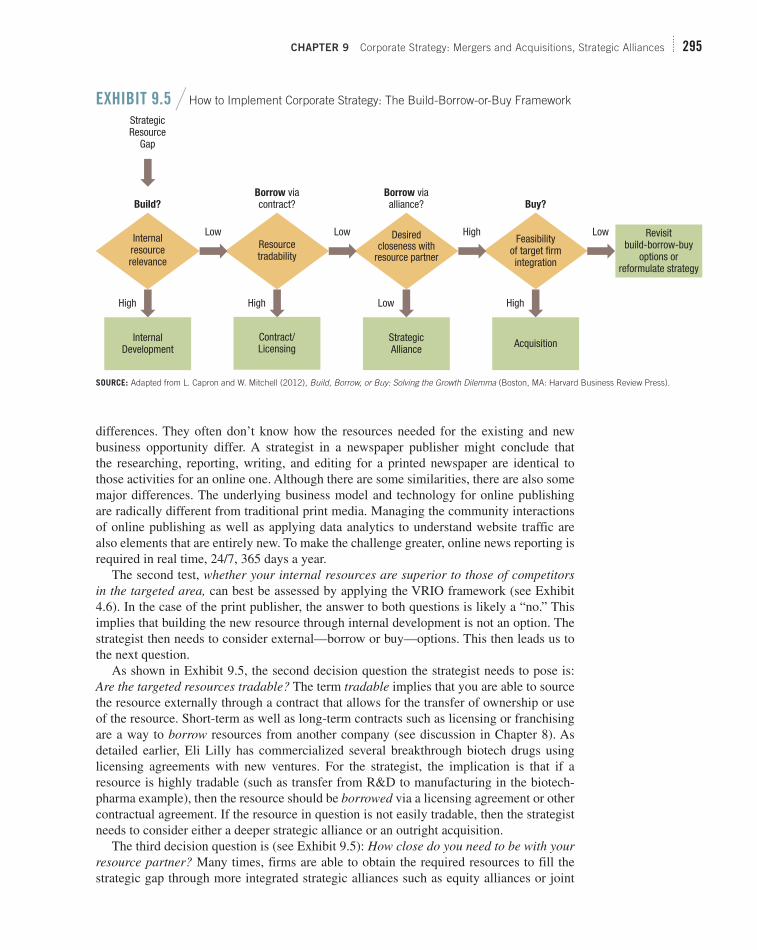
CHAPTER 9 Corporate Strategy: Mergers and Acquisitions, Strategic Alliances 295
differences. They often don’t know how the resources needed for the existing and new
business opportunity differ. A strategist in a newspaper publisher might conclude that
the researching, reporting, writing, and editing for a printed newspaper are identical to
those activities for an online one. Although there are some similarities, there are also some
major differences. The underlying business model and technology for online publishing
are radically different from traditional print media. Managing the community interactions
of online publishing as well as applying data analytics to understand website traffic are
also elements that are entirely new. To make the challenge greater, online news reporting is
required in real time, 24/7, 365 days a year.
The second test, whether your internal resources are superior to those of competitors in the targeted area, can best be assessed by applying the VRIO framework (see Exhibit
4.6). In the case of the print publisher, the answer to both questions is likely a “no.” This
implies that building the new resource through internal development is not an option. The
strategist then needs to consider external—borrow or buy—options. This then leads us to
the next question.
As shown in Exhibit 9.5 , the second decision question the strategist needs to pose is:
Are the targeted resources tradable? The term tradable implies that you are able to source
the resource externally through a contract that allows for the transfer of ownership or use
of the resource. Short-term as well as long-term contracts such as licensing or franchising
are a way to borrow resources from another company (see discussion in Chapter 8). As
detailed earlier, Eli Lilly has commercialized several breakthrough biotech drugs using
licensing agreements with new ventures. For the strategist, the implication is that if a
resource is highly tradable (such as transfer from R&D to manufacturing in the biotech-
pharma example), then the resource should be borrowed via a licensing agreement or other
contractual agreement. If the resource in question is not easily tradable, then the strategist
needs to consider either a deeper strategic alliance or an outright acquisition.
The third decision question is (see Exhibit 9.5 ): How close do you need to be with your resource partner? Many times, firms are able to obtain the required resources to fill the
strategic gap through more integrated strategic alliances such as equity alliances or joint
Revisitbuild-borrow-buy
options orreformulate strategy
Internalresourcerelevance
Resourcetradability
Desiredcloseness with
resource partner
Feasibilityof target firmintegration
AcquisitionStrategicAlliance
Contract/Licensing
InternalDevelopment
Low
StrategicResource
Gap
Build?Borrow viacontract?
Borrow viaalliance? Buy?
Low High Low
High High Low High
EXHIBIT 9.5 / How to Implement Corporate Strategy: The Build-Borrow-or-Buy Framework
SOURCE: Adapted from L. Capron and W. Mitchell (2012), Build, Borrow, or Buy: Solving the Growth Dilemma (Boston, MA: Harvard Business Review Press).
WWW.YAZDANPRESS.COMWWW.YAZDANPRESS.COM

296 CHAPTER 9 Corporate Strategy: Mergers and Acquisitions, Strategic Alliances
ventures (see Exhibit 8.3) rather than through outright acquisition. As discussed earlier,
mergers and acquisitions are the most costly, complex, and difficult to reverse strategic
option. This implies that only if extreme closeness to the resource partner is necessary in
order to understand and obtain its underlying knowledge should M&A be considered the
buy option. Regardless, the strategist should always first consider borrowing the necessary
resources through integrated strategic alliances before looking at M&A.
The final decision question is (see Exhibit 9.5 ): Can you integrate the target firm?
Many firms fail with post-merger integration. The list of post-integration failure, often due
to cultural differences, is long. We briefly highlighted the Daimler-Chrysler integration
failure; other costly integration failures include AOL and TimeWarner, HP and Autonomy,
and Bank of America and Merrill Lynch.
Only if the three prior conditions shown in the decision tree in Exhibit 9.5 are met
should the strategist consider M&A: If the firm’s internal resources are insufficient to
build, and the resource needed to fill the strategic gap cannot be borrowed through a strate-
gic alliance, and closeness to the resource partner is needed, then the final question for the
strategist to consider is whether the integration of the two firms in M&A will be success-
ful. In all other cases, the firms should consider finding a less costly borrow arrangement
when building is not an option.
We now have concluded our discussion of corporate strategy. Acquisitions and alliances
are the key vehicles to execute corporate strategy, each with its distinct advantages and
disadvantages. It is also clear from this chapter that mergers and acquisitions, as well as
strategic alliances, are a global phenomenon. In the next chapter, we discuss strategy in a
global world.
U U NDER CEO ROBERT IGER, Disney has followed an acquisition-led growth strategy. This corporate strategy turned Disney into a more diversified company. Reve-nue streams from its various activities (box office, home entertainment, theme parks, cable TV, toys, licensing, and so on) have become more stable and predictable. Being more diversified also allowed Disney to compen-sate more easily for losses from flops such as the sci-fi movie John Carter.
Disney has also shown superior post-merger integra-tion capabilities after acquiring Pixar, Marvel, and Lucas-film. Disney managed its new subsidiaries more like alliances rather than attempting full integration (which could have destroyed the unique value of the acquisi-tions). In Pixar’s case, Disney kept the entire creative team in place and allowed them to continue to work in Pixar’s headquarters near San Francisco with minimum inter-ference. The hands-off approach paid huge dividends: Although Disney paid a steep $7.4 billion for Pixar, it made
some $10 billion on Pixar’s Toy Story 3 franchise revenues alone. As a consequence, Dis-ney has gained a competitive advantage over its rivals such as Sony, and has also outperformed the Dow Jones Indus-trial Average over the last few years by a wide margin.
There are clouds on the horizon, however. The media industry is being disrupted: People spend much less time and money watching movies on the large screen, and spend more time consuming content online via You-Tube, Netflix, Hulu, and other streaming services. The only large-screen movies that have done well recently are sequels in existing franchises such as Sony’s Skyfall, the 23 rd installment in the James Bond saga, Warner Bros.’ Batman sequel The Dark Knight Rises, and Dis-ney’s own sequels in the Pixar and Marvel brands. Soon Disney will be adding the next installment in the Star Wars trilogy.
CHAPTERCASE 9 Consider This . . .
WWW.YAZDANPRESS.COMWWW.YAZDANPRESS.COM

CHAPTER 9 Corporate Strategy: Mergers and Acquisitions, Strategic Alliances 297
TAKE-AWAY CONCEPTS
Questions
1. Why do you think Disney was so successful with the Pixar and Marvel acquisitions, while other media interactions such as Sony’s acquisition of Columbia Pictures or News Corp.’s acquisition of MySpace were much less successful?
2. Given the “build-borrow-or-buy” framework discussed in the Implications for the Strategist
section, do you think Disney should pursue alternatives to acquisitions? Why or why not?
3. Do you think Disney’s acquisition-led growth strategy is sustainable? Are there sufficient “Mini-Disneys” that Disney can acquire?
4. What effects do you expect from the continued disruption of the media industry on Disney? How should Disney respond?
This chapter discussed two mechanisms of corporate-
level strategy (acquisitions and alliances), as summa-
rized by the following learning objectives and related
take-away concepts.
LO 9-1 / Differentiate between mergers and
acquisitions, and explain why firms would use
either as a vehicle for corporate strategy.
■ A merger describes the joining of two indepen-
dent companies to form a combined entity.
■ An acquisition describes the purchase or takeover
of one company by another. It can be friendly or
hostile.
■ Although there is a distinction between merg-
ers and acquisitions, many observers simply use
the umbrella term “mergers and acquisitions,” or
M&A.
■ Firms can use M&A activity for competitive
advantage when they possess a superior relational
capability, which is often built on superior alli-
ance management capability.
LO 9-2 / Define horizontal integration and
evaluate the advantages and disadvantages of
this corporate-level strategy.
■ Horizontal integration is the process of
merging with competitors, leading to industry
consolidation.
■ As a corporate strategy, firms use horizontal
integration to (1) reduce competitive intensity,
(2) lower costs, and (3) increase differentiation.
LO 9-3 / Explain why firms engage in
acquisitions.
■ Firms engage in acquisitions to (1) access new
markets and distributions channels, (2) gain
access to a new capability or competency, and (3)
preempt rivals.
LO 9-4 / Evaluate whether mergers and
acquisitions lead to competitive advantage.
■ Most mergers and acquisitions destroy shareholder
value because anticipated synergies never materialize.
■ If there is any value creation in M&A, it gener-
ally accrues to the shareholders of the firm that is
taken over (the acquiree), because acquirers often
pay a premium when buying the target company.
■ Mergers and acquisitions are a popular vehicle for
corporate-level strategy implementation for three
reasons: (1) because of principal–agent problems,
(2) the desire to overcome competitive disadvan-
tage, and (3) the quest for superior acquisition
and integration capability.
LO 9-5 / Define strategic alliances, and
explain why they are important corporate strat-
egy vehicles and why firms enter into them.
■ Strategic alliances have the goal of sharing
knowledge, resources, and capabilities in order to
develop processes, products, or services.
■ An alliance qualifies as strategic if it has the
potential to affect a firm’s competitive advantage
by increasing value and/or lowering costs.
WWW.YAZDANPRESS.COMWWW.YAZDANPRESS.COM

298 CHAPTER 9 Corporate Strategy: Mergers and Acquisitions, Strategic Alliances
■ An alliance management capability consists of a
firm’s ability to effectively manage three alliance-
related tasks concurrently: (1) partner selection
and alliance formation, (2) alliance design and
governance, and (3) post-formation alliance
management.
■ Firms build a superior alliance management capa-
bility through “learning-by-doing” and by estab-
lishing a dedicated alliance function.
LO 9-8 / Apply the build-borrow-or-buy frame-
work to guide corporate strategy.
■ The build-borrow-or-buy framework provides a
conceptual model that aids strategists in deciding
whether to pursue internal development (build),
enter a contract arrangement or strategic alliance
(borrow), or acquire new resources, capabilities,
and competencies (buy).
■ Firms that are able to learn how to select the right
pathways to obtain new resources are more likely
to gain and sustain a competitive advantage.
■ The most common reasons why firms enter
alliances are to (1) strengthen competitive posi-
tion, (2) enter new markets, (3) hedge against
uncertainty, (4) access critical complementary
resources, and (5) learn new capabilities.
LO 9-6 / Describe three alliance governance
mechanisms and evaluate their pros and cons.
■ Alliances can be governed by the following mech-
anisms: contractual agreements for non-equity
alliances, equity alliances, and joint ventures.
■ Exhibit 9.2 presents the pros and cons of each
alliance governance mechanism .
LO 9-7 / Describe the three phases of alli-
ance management and explain how an alliance
management capability can lead to a competi-
tive advantage.
■ An alliance management capability can be a
source of competitive advantage.
KEY TERMS
Acquisition
Alliance management capability
Build-borrow-or-buy framework
Co-opetition
Corporate venture capital
(CVC)
Equity alliance
Explicit knowledge
Horizontal integration
Hostile takeover
Joint venture
Learning races
Managerial hubris
Merger
Non-equity alliance
Real-options perspective
Relational view of competitive
advantage
Strategic alliance
Tacit knowledge
DISCUSSION QUESTIONS
1. Horizontal integration has benefits to the firms
involved. Consider the consolidation in the event-
promotion business when Live Nation bought
Ticketmaster. List some specific advantages of
this acquisition for Live Nation. Do you see any
downside to the merger?
2. The chapter distinguishes between “merging with
competitors” (or horizontal integration) and the
acquisitions of smaller companies, often tech ven-
tures. Do you expect there to be a difference in
the failure rate? Why or why not? Which concepts
introduced in Chapter 6 (when discussing cost
drivers) could help in lowering the failure rate of
serial acquisitions?
3. The chapter identifies three governing mecha-
nisms for strategic alliances: non-equity, equity,
and joint venture. Provide the benefits and down-
sides for each of these mechanisms.
4. An alliance’s purpose can affect which
governance structure is optimal. Compare a
WWW.YAZDANPRESS.COMWWW.YAZDANPRESS.COM

CHAPTER 9 Corporate Strategy: Mergers and Acquisitions, Strategic Alliances 299
pharmaceutical R&D alliance with a prescription-
drug marketing agreement, and recommend a
governing mechanism for each. Provide reasons
for your selections.
5. Alliances are often used to pursue business-level
goals, but they may be managed at the corporate
level. Explain why this portfolio approach to alli-
ance management would make sense.
ETHICAL/SOCIAL ISSUES
1. If mergers and acquisitions quite often end up
providing a competitive disadvantage, why do so
many of them take place? Given the poor track
record, is the continuing M&A activity a result of
principal–agent problems and managerial hubris?
What can be done to overcome principal–agent
problems? Are there other reasons for poor
performance?
2. Alliances and acquisitions can sometimes lead to
less access or higher prices for consumers. Com-
cast bought NBC Universal (from GE). When one
content provider and the Internet access provider
are the same, will this lead to some content being
favored over others on the Internet? For example,
will Comcast want to send Universal movies
(which it owns) with faster download capabilities
than it sends, say, a Harry Potter movie from War-
ner Brothers (which it doesn’t own)? If you were
a Comcast executive, would you want to favor the
speed of your own content delivery versus other
content providers, including Netflix? 73
3. IKEA is the world’s largest furniture retailer. It
has many non-equity alliances with suppliers
and manufacturers around the world. IKEA also
makes strategic use of non-equity alliances and
stakeholder partnerships to participate in find-
ing solutions to social and environmental chal-
lenges. For example, IKEA has had long-standing
relationships with Save the Children, UNICEF
(United Nations Children’s Fund), and the WWF
(World Wildlife Fund, the global conservation
organization). Go to IKEA’s website and use your
Internet search expertise to find more information
about these and other active partnerships. In what
ways does IKEA participate? What projects have
shown success? How do these partnerships relate
to maintaining IKEA’s competitive advantage as
the world’s largest furniture retailer?
company’s purchase of another. To take advantage of
the increase in M&A activity in the furniture man-
ufacturing industry, The Charter Group launched a
dedicated furniture practice in 2013. Western Michi-
gan is home to the top three office furniture manu-
facturers, which is a key segment of the industry. The
sales of the top three make up half of the industry’s
$10 billion market.
The Charter Group has hired your small consulting
team to do the basic research regarding a client that
has recently approached them. The client is a small
manufacturer of office furniture in a medium-sized
town in Michigan. The managers are seeking advice
as they decide whether to upgrade capabilities in order
to expand sales, to find a partner with complementary
skills, or to sell to a larger company. The owner has
SMALL-GROUP EXERCISES
//// Small-Group Exercise 1
In this chapter, we studied horizontal integration and
the build-borrow-or-buy framework. One industry
currently anticipating a wave of consolidation is the
furniture manufacturing industry, with thousands of
manufacturers and suppliers. Manufacturers range
from large recognizable brands such as Baker, Steel-
case, and La-Z-Boy, to small family-owned compa-
nies. Demand for both office furniture and residential
furniture is beginning to experience post-recession
growth. Analysts have observed that companies are
shopping for acquisitions just as consumers are shop-
ping for furniture.
The Charter Group in Grand Rapids, Michigan,
is a mergers and acquisitions adviser helping com-
panies initiate, negotiate, and close deals on one
WWW.YAZDANPRESS.COMWWW.YAZDANPRESS.COM

300 CHAPTER 9 Corporate Strategy: Mergers and Acquisitions, Strategic Alliances
company usage—79 percent of companies create
original content to use on YouTube (up from 50 per-
cent) and average 2 million viewers. Companies are
also reacting faster to new social media platforms;
Google Plus was launched in November 2011, and
48 percent of the largest companies had accounts
by March 2012. Another new platform, Pinterest, is
joined by invitation, and 48 percent of the Global
100 have accounts.
The study found that companies now have more
accounts on each platform. For example, they may
have many Twitter accounts or Facebook pages estab-
lished in order to communicate more effectively to
different stakeholder interests and to highlight dif-
ferent products or services. The companies can pro-
vide general news or more specific information about
career opportunities or customer service.
The research firm also observed changes in its
findings by region (North America, Europe, Asia-
Pacific, and Latin America) and network. Twitter is
now the most popular platform for Latin American
companies, used by 53 percent of them (up from
32 percent in 2010), and 65 percent use at least one
social media platform (up from 49 percent in 2010).
Europe has more challenges in efficiently using
social media because of multiple languages; how-
ever, Vodafone has separate Facebook accounts for
each country, while others engage in more common
languages, such as English and French. Asia-Pacific
companies are catching up, but tend to use different
social media, such as micro blogs, social networks,
corporate blogs, and video sharing. Video sharing
allows visual storytelling and can be used across
countries. 74
In your group, select three firms and research their
social media web presence. If you select firms from
the same industry, you can more directly compare and
contrast their social media expertise.
1. Do the firms seem to do a good job of managing
their web identity? If you chose firms from the
same industry, is it evident how each firm’s web
content relates to its competitive position?
2 . What differences do you find among the three
firms? For example, do some tailor their message
for different stakeholders? Are some firms more
creative in generating YouTube content?
3. Pinterest is newer than the other platforms and
requires an invite to join. Do any of the three
firms you selected have a Pinterest account?
stated that the firm is like a family, and he feels a sense
of loyalty to the workers and the community. The firm
has had steady sales over its history, although it expe-
rienced a slight dip in sales during the recession. The
company is aware that other office furniture manufac-
turers are beginning to integrate technology into the
furniture. For example, one competitor is building
wireless technology into desk surfaces to power sev-
eral devices at one time and avoid the need to plug
them in. The owner sees the integration of technology
as a game changer.
Using the build-borrow-or-buy framework and
other strategic concepts, develop a set of questions
to ask the managers of this small business in order
to gather information to inform the decision as to
whether to hire new employees with more sophisti-
cated technology expertise in order to build capabili-
ties in-house or whether to partner with another firm
that already has these capabilities. Alternatively, con-
sider information that could help the owner decide
whether this is the time to sell to a larger company.
Your consulting team will need adequate information
to help put a value on the firm in order to advise The
Charter Group if/when it initiates a search for a part-
ner or buyer.
//// Small-Group Exercise 2
The global public relations and communications firm
Burson-Marsteller conducted its first study of how
the Fortune Global 100 used social media in 2010. It
found that 79 percent of the 100 largest companies
used Twitter, Facebook, YouTube, or corporate blogs
to communicate corporate messages to customers
and other stakeholders. Burson-Marsteller wanted to
learn how the largest global companies had changed
their usage of social media after two years of expe-
rience and conducted The Global Social Media Check-Up 2012.
The 2012 study focused on the Fortune Global
100 companies’ social media activity on Twitter,
Facebook, YouTube, Google Plus, and Pinterest. The
findings show that companies have gained experi-
ence and adapted quickly. Twitter is the most popular
platform, as tweets have exploded from 50 million
tweets per day in 2010 to 340 million per day in
2012 (over 1 billion every three days). Because of
this popularity, 82 percent of the companies have
Twitter accounts (up from 65 percent in 2010), and
79 percent are actively engaged in retweeting or
@mentions. YouTube has seen the most growth in
WWW.YAZDANPRESS.COMWWW.YAZDANPRESS.COM

CHAPTER 9 Corporate Strategy: Mergers and Acquisitions, Strategic Alliances 301
What Is Your Network Strategy?
Most of us participate in one or more popular social networks online such as Facebook, LinkedIn, Pin-terest, Tumblr, or Twitter. While many of us spend
countless hours in these social networks, you may not have given a lot of thought to your network strategy.
Social networks describe the relationships or ties between individuals linked to one another. An important element of social networks is the different strengths of ties between individuals. Some ties between two people in a network may be very strong (e.g., “soul mates” or “best friends”), while others are weak (mere acquaintances—“I talk to her briefly in my yoga class”). As a member of a social network, you have access to social capital, which is derived from the connections within and between social networks. It is a function of whom you know, and what advantages you can create through those connections. Social capital is an important concept in business. Remember the old adage: What matters is not what you know, but whom you know.
Some Facebook users claim to have 2,000 or more “friends.” With larger networks, one expects to have greater social capital, right? Though this seems obvious, academic research suggests that humans have the brain capacity to
my STRATEGY
maintain a functional network of only about 150 people. This so-called Dunbar number was derived by extrapolating from the brain sizes and social networks of primates.
Far-fetched? Not necessarily. You may have a lot more than 150 friends on Facebook, but researchers call that number the social core of any network. Why is this the case? Even though it takes only a split second to accept a new friend request on Facebook, friendships still need to be “groomed.” To develop a meaningful relationship, you need to spend some time with this new friend, even in cyberspace. Recent data from Facebook provide support for the concept of a social core, that the average number of friends a user has is 120, with women having more friends than men. However, the number of friends a Facebook user frequently interacts with is a lot smaller, and tends to be stable over time. The more frequent the exchanges among friends, the smaller the inner core. For example, on average, men leave comments for 17 friends and communicate with 10, while women leave comments for 26 friends and communicate with 16.
Social networking sites allow users to broadcast their lives and to passively keep track of more people. They enlarge their social networks, even though many of those ties tend to be weak. It may come as a surprise, however,
STRATEGY TERM PROJECT
//// Module 9: Strategic Alliance
and M&A Strategy
In this section, you will study your selected firm’s
use of acquisitions and alliances to grow or change its
business.
1. Has your firm participated in any mergers or
acquisitions in the past three years? What was the
nature of these actions? Did they result in a con-
solidation of competitors?
2. Research what strategic alliances your firm has
entered in the past three years. If there are several
of these, choose the three you identify as the most
important for further analysis. Based on company
press releases and business journal reports for
each alliance, what do you find to be the main
reason the firm entered these alliances?
3. Do you think each of the three alliances achieves
the original intent, and therefore is successful?
Why or why not?
4. Does your firm have an identifiable alliance man-
agement organization? Can you find any evidence
that this organization improves the likelihood of
success for these alliances? What responsibilities
does this alliance management organization have
in your firm?
5. Go to LinkedIn ( www.linkedin.com ) and see what
executive officers or groups your firm may have
set up on the professional networking site. Next,
look to see if the firm has a “fan page” on Face-
book. Is there also a “detractors page” for your
firm? How would you assess your firm’s use of
web networks and social media for its business?
WWW.YAZDANPRESS.COMWWW.YAZDANPRESS.COM

302 CHAPTER 9 Corporate Strategy: Mergers and Acquisitions, Strategic Alliances
calculated by the following formula: [N 3 (N 2 1)] / 2. If your network size is 12, then your maximum network density is [12 3 (12 2 1)] / 2 5 66. This is the maxi-mum number of ties in your network when everybody knows everybody. Step 3: To calculate your actual network density, divide X by N: Network density 5 (X/N). In the example with 8 ties in a network of 12 people, the network den-sity is 0.67. The closer this number is to 1, the denser the network.
3. Network density is bound by 0 and 1. Is a network den-sity that approaches 1 the most beneficial? Why or why not? Think about weak ties, which can also be indirect connections.
4. Compare your network to that of your group members (two to four people in your class). Do you find any com-monalities in your networks? Who has the greatest social capital, and why? What can you do to “optimize” your network structure?
5. Can you draw the joint network of your study group?
6. In this joint (study group) network, can you identify dif-ferent network positions such as those discussed in the chapter, centrally located person(s) and broker(s), or a person who connects different clusters? Can you iden-tify people with high and low social capital? Are there any dense clusters in this network? Would that indicate the existence of cliques? Is it a small-world network? What other implications can you draw?
to learn that research shows new opportunities such as job offers tend to come from weak ties, because it is these weak ties that allow you to access non-redundant and novel infor-mation. This phenomenon is called strength of weak ties. So, in thinking about how to leverage your social capital more fully as part of your network strategy, rather than always communicating with the same people, it may pay off for you to invest a bit more time in grooming your weak ties. 75
1. Create a list of up to 12 people at your university with whom you regularly communicate (in person, electroni-cally, or both). Draw your network (place names or ini-tials next to each node), and connect every node where people you communicate with also talk to one another (i.e., indicate friends of friends). Can you identify strong and weak ties in your network?
2. What is the degree of closure in your network? The density of your network reflects the degree of closure. Network density can be calculated in three simple steps. Step 1: Create a simple matrix in which you list the names of the people in your network on both the hori-zontal and vertical axis. (This can be easily done in an Excel spreadsheet.) Then put an X in each box, indicat-ing who knows whom in your network. Each X corre-sponds to a social tie in your network. Count the total number of Xs in your matrix. Let’s assume X 5 8. Step 2: If your network contains 12 people (includ-ing yourself), N 5 12. The maximum network density is
1. This ChapterCase is based on: Disney
Annual Reports; Paik, K. (2007), To Infinity and Beyond!: The Story of Pixar Animation Studies (New York: Chronicle Books); “Mar-
vel superheroes join the Disney family,” The Wall Street Journal, August 31, 2009; Isaac-
son, W. (2011), Steve Jobs (New York: Simon
& Schuster); “Disney buys out George Lucas,
the creator of ‘Star Wars,’ The Economist, November 3, 2012; and “Superman v Spider-
Man,” The Economist, January 15, 2013.
2. Hitt, M. A., R. D. Ireland, and J. S. Harrison
(2001), “Mergers and acquisitions: A value
creating or value destroying strategy?” in
Hitt, M. A., R. E. Freeman, and J. S. Harrison,
Handbook of Strategic Management (Oxford,
UK: Blackwell-Wiley): 384–408.
3. Allen, W. B., N. A. Doherty,
K. Weigelt, and E. Mansfield (2005),
Managerial Economics, 6th ed. (New York:
Norton); and Breshnahan, T., and P. Reiss
(1991), “Entry and competition in
concentrated markets,” Journal of Political Economy 99: 997–1009.
4. Brush, T. H. (1996), “Predicted change in
operational synergy and post-acquisition per-
formance of acquired businesses,” Strategic Management Journal 17: 1–24.
5. Tebbutt, T. (2010), “An insider’s perspec-
tive of the pharmaceutical industry,” presenta-
tion in “Competing in the Health Sciences,”
Georgia Institute of Technology, January
29. Mr. Tebbutt is former president of UCB
Pharma.
6. This Strategy Highlight is based on:
Kraft Foods Annual Reports; The Hershey
Company Annual Reports; “Cadbury rejects
Kraft’s $16.73 billion bid,” The Wall Street Journal, September 7, 2009; “Food fight,”
The Economist, November 5, 2009; “Cadbury
accepts fresh Kraft offer,” The Wall Street Journal, January 19, 2010; “Kraft wins a
reluctant Cadbury with help of clock, hedge
funds,” The Wall Street Journal, January 20,
2010; “Analysts bullish on Mondeléz ahead of
Kraft split,” The Wall Street Journal, October
1, 2012; “Mondeléz can slim way to success,”
The Wall Street Journal, May 28, 2013; and
the author’s personal communication with
Dr. Narayanan Jayaraman, Georgia Institute
of Technology.
ENDNOTES
WWW.YAZDANPRESS.COMWWW.YAZDANPRESS.COM

CHAPTER 9 Corporate Strategy: Mergers and Acquisitions, Strategic Alliances 303
7. Examples are drawn from: “Google in talks
to buy YouTube for $1.6 billion,” The Wall Street Journal, October 7, 2006; “Google’s
$12.5 billion gamble,” The Wall Street Jour-nal, August 16, 2011; Insta-rich: $1 billion for
Instagram,” The Wall Street Journal, April 10,
2012; and “Google buys Waze,” The Econo-mist, June 15, 2013.
8. Capron, L. (1999), “The long-term perfor-
mance of horizontal acquisitions,” Strategic Management Journal 20: 987–1018; Capron,
L., and J. C. Shen (2007), “Acquisitions of
private vs. public firms: Private information,
target selection, and acquirer returns,” Strate-gic Management Journal 28: 891–911.
9. Jensen, M. C., and R. S. Ruback (1983),
“The market for corporate control: The scien-
tific evidence,” Journal of Financial Econom-ics 11: 5–50.
10. This discussion is based on: Finkelstein,
S., and D. C. Hambrick (1989), “Chief execu-
tive compensation: A study of the intersection
of markets and political processes, Strategic Management Journal 10: 121–134; Lambert,
R. A., D. F. Larcker, and K. Weigelt (1991),
“How sensitive is executive compensation to
organizational size?” Strategic Management Journal 12: 395–402; and Finkelstein, S.
(2003), Why Smart Executives Fail, and What You Can Learn from Their Mistakes (New
York: Portfolio).
11. This discussion is based on: Finkelstein,
S. (2003), Why Smart Executives Fail, and What You Can Learn from Their Mistakes; and
Finkelstein, S., J. Whitehead, and A. Campbell
(2009), Think Again: Why Good Leaders Make Bad Decisions and How to Keep It from Happening to You (Boston, MA: Harvard
Business School Press).
12. The examples are drawn from:
Finkelstein, S. (2003), Why Smart Executives Fail, and What You Can Learn from Their Mistakes; and Finkelstein, S., J. Whitehead,
and A. Campbell (2009), Think Again: Why Good Leaders Make Bad Decisions and How to Keep It from Happening to You.
13. Dyer, J. H., P. Kale, and H. Singh (2004),
“When to ally and when to acquire,” Harvard Business Review, July–August; Mayer, D.,
and M. Kenney (2004), “Ecosystems and
acquisition management: Understanding
Cisco’s strategy,” Industry and Innovation 11:
299–326.
14. “Silicon Valley survivor,” The Wall Street Journal, July 28, 2009.
15. Kale, P., H. Singh, and A. P. Raman
(2009), “Don’t integrate your acquisitions,
partner with them,” Harvard Business Review, December.
16. “HP gambles on ailing Palm,” The Wall Street Journal, April 29, 2010.
17. “HP affirms commitment to Autonomy,”
The Wall Street Journal, April 10, 2013.
18. Gulati, R. (1998), “Alliances and net-
works,” Strategic Management Journal 19:
293–317.
19. J. Hagedoorn (2002), “Inter-firm R&D
partnerships: An overview of major trends
and patterns since 1960,” Research Policy
31: 477–492; and Schilling, M. A. (2009),
“Understanding the alliance data,” Strategic Management Journal 30: 233–260.
20. This discussion draws on: Dyer, J. H., and
H. Singh (1998), “The relational view: Coop-
erative strategy and the sources of interorgani-
zational advantage,” Academy of Management Review 23: 660–679.
21. Kale, P., and H. Singh (2009), “Managing
strategic alliances: What do we know now,
and where do we go from here?” Academy of Management Perspectives 23: 45–62.
22. The author participated in the HP demo;
and “HP unveils Halo collaboration stu-
dio: Life-like communication leaps across
geographic boundaries,” HP Press Release,
December 12, 2005.
23. “Bank of America taps Cisco for Tele
Presence,” InformationWeek, March 30, 2010.
24. For a review of the alliance literature,
see: Gulati, R. (1998), “Alliances and net-
works,” Strategic Management Journal 19:
293–317; Dyer, J. H., and H. Singh (1998),
“The relational view: Cooperative strategy
and the sources of interorganizational advan-
tage,” Academy of Management Review 23:
660–679; Inkpen, A. (2001), “Strategic alli-
ances,” in Hitt, M. A., R. E. Freeman, and
J. S. Harrison, Handbook of Strategic Man-agement; Ireland, R. D., M. A. Hitt, and D.
Vaidyanath (2002), “Alliance management as
a source of competitive advantage,” Journal of Management 28: 413–446; Lavie, D. (2006),
“The competitive advantage of interconnected
firms: An extension of the resource-based
view,” Academy of Management Review 31:
638–658; Kale, P., and H. Singh (2009),
“Managing strategic alliances: What do we
know now, and where do we go from here?”
Academy of Management Perspectives 23:
45–62.
25. Kogut, B. (1991), “Joint ventures and the
option to expand and acquire,” Management Science 37: 19–34.
26. “U.S. alleges e-book scheme,” The Wall Street Journal, April 11, 2012; “Apple’s 30%
e-book commission is 100% legal,” The Wall Street Journal, June 9, 2013; “Throwing the
book at Apple,” The Wall Street Journal, June 12, 2013; and “U.S. judge rules Apple
colluded on e-books,” The Wall Street Journal, July 10, 2013, http://online.wsj.com/article/
SB1000142412788732442520457859745305
3469898.html .
27. Markides, C. C., and P. J. Williamsen
(1994), “Related diversification, core compe-
tences, and performance,” Strategic Manage-ment Journal 15: 149–165 (Summer Special
Issue); Kale, P., and H. Singh (2009), “Man-
aging strategic alliances: What do we know
now, and where do we go from here?” Acad-emy of Management Perspectives 23: 45–62.
28. “The real market size of public cloud ser-
vices,” Wired, March 4, 2013.
29. “Microsoft, Yahoo tout ad alliance,” The Wall Street Journal, July 30, 2009.
30. Tripsas, M. (1997), “Unraveling the process
of creative destruction: Complementary assets
and incumbent survival in the typesetter indus-
try,” Strategic Management Journal 18: 119–142.
31. Rothaermel, F. T. (2001), “Incumbent’s
advantage through exploiting complementary
assets via interfirm cooperation,” Strategic Management Journal 22: 687–699; Rothaermel,
F. T. (2001), “Complementary assets, strategic
alliances, and the incumbent’s advantage: An
empirical study of industry and firm effects
in the biopharmaceutical industry,” Research Policy 30: 1235–1251; Hill, C.W.L., and
F. T. Rothaermel (2003), “The performance of
incumbent firms in the face of radical techno-
logical innovation,” Academy of Management Review 28: 257–274; Rothaermel, F. T., and
C.W.L. Hill (2005), “Technological disconti-
nuities and complementary assets: A longitu-
dinal study of industry and firm performance,”
Organization Science 16: 52–70.
32. Arthaud-Day, M. L., F. T. Rothaermel,
and W. Zhang (2013), “Genentech: After
the Acquisition by Roche,” case study, in
Rothaermel, F. T. Strategic Management (Burr Ridge, IL: McGraw-Hill). http://
mcgrawhillcreate.com/rothaermel, ID#
MHE-FTR-014-0077645065.
33. Jiang, L., J. Tan, and M. Thursby (2011),
“Incumbent firm invention in emerging fields:
Evidence from the semiconductor industry,”
Strategic Management Journal; Rothaermel,
F. T., and M. Thursby (2007), “The nano-
tech vs. the biotech revolution: Sources of
incumbent productivity in research,” Research Policy 36: 832–849.
34. This discussion is based on: Teece, D. J.
(1986), “Profiting from technological
innovation: Implications for integration,
collaboration, licensing and public policy,”
Research Policy 15: 285–305; Tripsas, M.
(1997), “Unraveling the process of creative
destruction: Complementary assets and
incumbent survival in the typesetter indus-
try”; Rothaermel, F. T. (2001), “Incumbent’s
advantage through exploiting complementary
assets via interfirm cooperation,” Strategic
WWW.YAZDANPRESS.COMWWW.YAZDANPRESS.COM

304 CHAPTER 9 Corporate Strategy: Mergers and Acquisitions, Strategic Alliances
Management Journal 22 (6–7): 687–699;
Ceccagnoli, M., and F. T. Rothaermel (2008),
“Appropriating the returns to innovation,”
Advances in Study of Entrepreneurship, Inno-vation, and Economic Growth 18: 11–34;
Rothaermel, F. T., and W. Boeker (2008), “Old
technology meets new technology: Comple-
mentarities, similarities, and alliance forma-
tion,” Strategic Management Journal 29 (1):
47–77; and Hess, A. M., and F. T. Rothaermel
(2011), “When are assets complementary?
Star scientists, strategic alliances and innova-
tion in the pharmaceutical industry,” Strategic Management Journal 32: 895–909.
35. Mowery, D. C., J. E. Oxley, and B. S.
Silverman (1996), “Strategic alliances and
interfirm knowledge transfer,” Strategic Man-agement Journal 17: 77–91 (Winter Special
Issue).
36. Brandenburger, A. M., and B. J. Nalebuff
(1996), Co-opetition (New York: Currency
Doubleday); Gnyawali, D., and B. Park
(2011), “Co-opetition between Giants: Col-
laboration with competitors for technological
innovation,” Research Policy; Gnyawali, D., J.
He, and R. Madhaven (2008), “Co-opetition:
Promises and challenges,” in Wankel, C.
(ed.), 21st Century Management: A Refer-ence Handbook (Thousand Oaks, CA: Sage):
386–398.
37. This discussion is based on: Hamel, G.,
Y. Doz, and C. K. Prahalad (1989), “Col-
laborate with your competitors—and win,”
Harvard Business Review (January–February):
190–196; Hamel, G. (1991), “Competition for
competence and interpartner learning within
international alliances,” Strategic Manage-ment Journal 12: 83–103 (Summer Special
Issue); Khanna, T., R. Gulati, and N. Nohria
(1998), “The dynamics of learning alliances:
Competition, cooperation, and relative scope,”
Strategic Management Journal 19: 193–210;
Larsson, R., L. Bengtsson, K. Henriksson,
and J. Sparks (1998), “The interorganizational
learning dilemma: Collective knowledge
development in strategic alliances,” Organiza-tion Science 9: 285–305; and Kale, P., and H.
Perlmutter (2000), “Learning and protection
of proprietary assets in strategic alliances:
Building relational capital,” Strategic Man-agement Journal 21: 217–237.
38. Nti, K. O., and R. Kumar (2000), “Differ-
ential learning in alliances,” in Faulkner, D.,
and M. de Rond (eds.), Cooperative Strategy. Economic, Business, and Organizational Issues (Oxford, UK: University Press): 119–
134. For an opposing viewpoint, see: Inkpen,
A. C. (2008), “Knowledge transfer and inter-
national joint ventures: The case of NUMMI
and General Motors,” Strategic Management Journal 29: 447–453.
39. This discussion is based on: Gulati, R.
(1998), “Alliances and networks,” Strategic Management Journal 19: 293–317; Ireland,
R. D., Hitt, M. A., and Vaidyanath D. (2002),
“Alliance management as a source of competi-
tive advantage,” Journal of Management 28:
413–446; Hoang, H., and F. T. Rothaermel
(2005), “The effect of general and partner-
specific alliance experience on joint R&D
project performance,” Academy of Manage-ment Journal 48: 332–345; and Lavie, D.
(2006), “The competitive advantage of inter-
connected firms: An extension of the resource-
based view,” Academy of Management Review
31: 638–658.
40. This is based on: Pisano, G. P., and Mang
P. (1993), “Collaborative product development
and the market for know-how: Strategies and
structures in the biotechnology industry,” in
Rosenbloom, R., and R. Burgelman (eds.),
Research on Technological Innovation, Man-agement, and Policy (Greenwich, CT: J.A.I.
Press) 109–136; and Hoang, H., and F. T.
Rothaermel (2010), “Leveraging internal and
external experience: Exploration, exploitation,
and R&D project performance,” Strategic Management Journal 31 (7): 734–758.
41. The distinction of explicit and tacit
knowledge goes back to the seminal work
by Polanyi, M. (1966), The Tacit Dimension
(Chicago, IL: University of Chicago Press).
For more recent treatments, see: Spender,
J.-C. (1996), “Managing knowledge as
the basis of a dynamic theory of the firm,”
Strategic Management Journal 17: 45–62
(Winter Special Issue); Spender, J.-C., and R.
M. Grant (1996), “Knowledge and the firm,”
Strategic Management Journal 17: 5–9 (Win-
ter Special Issue); and Crossan, M. M., H. W.
Lane, R. E. White (1999), “An organizational
learning framework: From intuition to institu-
tion,” Academy of Management Review 24:
522–537.
42. “Toyota and Tesla partnering to make
electric cars,” The Wall Street Journal, May
21, 2010.
43. Ibid.
44. Ibid.
45. For an insightful treatment of CVC
investments, see: Dushnitsky, G., and M. J.
Lenox (2005a), “When do incumbent firms
learn from entrepreneurial ventures? Corpo-
rate venture capital and investing firm inno-
vation rates,” Research Policy 34: 615–639;
Dushnitsky, G., and M. J. Lenox (2005b),
“When do firms undertake R&D by invest-
ing in new ventures?” Strategic Management Journal 26: 947–965; Dushnitsky, G., and
M. J. Lenox (2006), “When does corporate
venture capital investment create value?”
Journal of Business Venturing 21: 753–772;
and Wadhwa, A., and S. Kotha (2006),
“Knowledge creation through external ventur-
ing: Evidence from the telecommunications
equipment manufacturing industry,” Academy of Management Journal 49: 1–17.
46. Benson, D., and R. H. Ziedonis (2009),
“Corporate venture capital as a window on
new technology for the performance of cor-
porate investors when acquiring startups,”
Organization Science 20: 329–351.
47. Dushnitsky, G., and M. J. Lenox (2006),
“When does corporate venture capital invest-
ment create value?” Journal of Business Ven-turing 21: 753–772.
48. Higgins, M. J., and D. Rodriguez (2006),
“The outsourcing of R&D through acquisition
in the pharmaceutical industry,” Journal of Financial Economics 80: 351–383; Benson,
D., and R. H. Ziedonis (2009), “Corporate
venture capital as a window on new technol-
ogy for the performance of corporate investors
when acquiring startups,” Organization Sci-ence 20: 329–351.
49. Reuer, J. J., M. Zollo, and H. Singh
(2002), “Post-formation dynamics in strategic
alliances,” Strategic Management Journal 23:
135–151.
50. This discussion is based on: Dyer, J. H.,
and H. Singh (1998), “The relational view:
Cooperative strategy and the sources of
interorganizational advantage,” Academy of Management Review 23: 660–679; Ireland,
R. D., M. A. Hitt, and D. Vaidyanath (2002),
“Alliance management as a source of competi-
tive advantage,” Journal of Management 28:
413–446; and Lavie, D. (2006), “The competi-
tive advantage of interconnected firms: An
extension of the resource-based view,” Acad-emy of Management Review 31: 638–658.
51. For an insightful discussion of alli-
ance management capability and alliance
portfolios, see: Rothaermel, F. T., and D. L.
Deeds (2006), “Alliance type, alliance experi-
ence, and alliance management capability in
high-technology ventures,” Journal of Busi-ness Venturing 21: 429–460; Hoffmann, W.
(2007), “Strategies for managing a portfolio
of alliances,” Strategic Management Journal 28: 827–856; Schreiner, M., P. Kale, and D.
Corsten (2009), “What really is alliance man-
agement capability and how does it impact
alliance outcomes and success?” Strategic Management Journal 30: 1395–1419; Ozcan,
P., and K. M. Eisenhardt (2009), “Origin of
alliance portfolios: Entrepreneurs, network
strategies, and firm performance,” Academy of Management Journal 52: 246–279; and
Schilke, O., and A. Goerzten (2010), “Alliance
management capability: An investigation of
the construct and its measurement,” Journal of Management 36: 1192–1219.
WWW.YAZDANPRESS.COMWWW.YAZDANPRESS.COM

CHAPTER 9 Corporate Strategy: Mergers and Acquisitions, Strategic Alliances 305
52. Kale, P., and H. Singh (2009), “Managing
strategic alliances: What do we know now,
and where do we go from here?” Academy of Management Perspectives 23: 45–62.
53. Santoro, M. D., and J. P. McGill (2005),
“The effect of uncertainty and asset co-
specialization on governance in biotechnology
alliances,” Strategic Management Journal 26:
1261–1269.
54. This is based on: Gulati, R. (1995), “Does
familiarity breed trust? The implications of
repeated ties for contractual choice in alli-
ances,” Academy of Management Journal 38:
85–112; and Poppo, L., and T. Zenger (2002),
“Do formal contracts and relational governance
function as substitutes or complements?” Stra-tegic Management Journal 23: 707–725.
55. Dyer, J. H., and H. Singh (1998), “The
relational view: Cooperative strategy and
the sources of interorganizational advan-
tage,” Academy of Management Review 23:
660–679.
56. Zaheer, A., B. McEvily, and V. Perrone
(1998), “Does trust matter? Exploring the
effects of interorganizational and interpersonal
trust on performance,” Organization Science
8: 141–159.
57. Covey, S.M.R. (2008), The Speed of Trust: The One Thing That Changes Every-thing (New York: Free Press).
58. Dyer, J. H., and H. Singh (1998), “The
relational view: Cooperative strategy and
the sources of interorganizational advan-
tage,” Academy of Management Review 23:
660–679; Ireland, R. D., M. A. Hitt, and D.
Vaidyanath (2002), “Alliance management as
a source of competitive advantage,” Journal of Management 28: 413–446; Lavie, D. (2006),
“The competitive advantage of interconnected
firms: An extension of the resource-based
view,” Academy of Management Review 31:
638–658.
59. This is based on: Anand, B., and T.
Khanna (2000), “Do firms learn to create
value?” Strategic Management Journal 21:
295–315; Sampson, R. (2005), “Experience
effects and collaborative returns in R&D alli-
ances,” Strategic Management Journal 26:
1009–1031; Hoang, H., and F. T. Rothaermel
(2005), “The effect of general and partner-
specific alliance experience on joint R&D
project performance,” Academy of Manage-ment Journal 48: 332–345; and Rothaermel,
F. T., and D. L. Deeds (2006), “Alliance
type, alliance experience, and alliance
management capability in high-technology
ventures,” Journal of Business Venturing 21:
429–460.
60. Rothaermel, F. T., and D. L. Deeds
(2006), “Alliance type, alliance experience,
and alliance management capability in high-
technology ventures,” Journal of Business Venturing 21: 429–460.
61. Hoffmann, W. (2007), “Strategies for
managing a portfolio of alliances,” Strategic Management Journal 28: 827–856.
62. Wassmer, U., P. Dussage, and M. Planel-
las (2010), “How to manage alliances better
than one at a time,” MIT Sloan Management Review, Spring: 77–84.
63. Dyer, J. H., P. Kale, and H. Singh (2001),
“How to make strategic alliances work,” MIT Sloan Management Review, Summer: 37–43.
64. Kale, P., J. H. Dyer, and H. Singh (2002),
“Alliance capability, stock market response,
and long-term alliance success: The role of
the alliance function,” Strategic Management Journal 23: 747–767.
65. Gueth A., N. Sims, and R. Harrison
(2001), “Managing alliances at Lilly,” In Vivo: The Business & Medicine Report (June): 1–9; Rothaermel, F. T., and D. L.
Deeds (2006), “Alliance type, alliance experi-
ence, and alliance management capability in
high-technology ventures,” Journal of Busi-ness Venturing 21: 429–46.
66. Dyer, J. H., Kale, P., Singh, H. (2004),
“When to ally and when to acquire,” Harvard Business Review, July–August.
67. Rothaermel, F. T., and A. Hess (2010),
“Innovation strategies combined,” MIT Sloan Management Review, Spring: 12–15.
68. Dyer, J. H., Kale, P., Singh, H. (2004),
“When to ally and when to acquire,” Harvard Business Review, July–August.
69. This section is based on: Capron, L., and
W. Mitchell (2012), Build, Borrow, or Buy: Solving the Growth Dilemma (Boston, MA:
Harvard Business Review Press).
70. Ibid.
71. Ibid., p. 16.
72. Hoang, H., and Rothaermel, F. T.
(2010), “Leveraging internal and external
experience: Exploration, exploitation, and
R&D project performance,” Strategic Man-agement Journal 31: 734–758; and Gick,
M. L., and K. J. Holyoak (1987), “The
cognitive basis of knowledge transfer,” in
Cormier, S. M., and J. D. Hagman (eds.),
Transfer of Learning (New York: Academic
Press): 9–46.
73. If so, this would violate a “net-neutrality”
policy that has generally been honored—that
all information on the Internet is treated
equally as far as speed and cost per size of
content. Data sourced from “The FCC’s cru-
sade to keep the Internet free,” Bloomberg Businessweek, August 16, 2010.
74. Data from “Global social media check
up” by Burson-Marsteller PR firm, 2010.
75. This my Strategy section is based on:
Granovetter, M. (1973), “The strength of
weak ties,” American Journal of Sociology 78:
1360–1380; and “Primates on Facebook,” The Economist, February 26, 2009.
WWW.YAZDANPRESS.COMWWW.YAZDANPRESS.COM
306
Chapter 10
Global Strategy: Competing Around the World
Chapter Outline
10.1 What Is Globalization? Stages of Globalization
10.2 Going Global: Why? Advantages of Expanding Internationally Disadvantages of Expanding Internationally
10.3 Going Global: Where and How? Where in the World to Compete? The CAGE
Distance Framework How Do MNEs Enter Foreign Markets?
10.4 Cost Reductions vs. Local Responsiveness:
The Integration-Responsiveness Framework International Strategy Multidomestic Strategy Global-Standardization Strategy Transnational Strategy
10.5 National Competitive Advantage: World
Leadership in Specific Industries Porter’s Diamond Framework
10.6 Implications for the Strategist
Learning Objectives
After studying this chapter, you should be able to:
LO 10-1 Define globalization, multinational enterprise (MNE), foreign direct investment (FDI), and global strategy.
LO 10-2 Explain why companies compete abroad, and evaluate the advantages and disadvantages of a global strategy.
LO 10-3 Apply the CAGE distance framework to explain which countries MNEs enter.
LO 10-4 Compare and contrast the different options MNEs have to enter foreign markets.
LO 10-5 Apply the integration-responsiveness framework to evaluate the four different strategies MNEs can pursue when competing globally.
LO 10-6 Apply Porter’s diamond framework to explain why certain industries are more competitive in specific nations than in others.
WWW.YAZDANPRESS.COMWWW.YAZDANPRESS.COM

307
H Hollywood Goes Global
H OLLYWOOD MOVIES HAVE always been a quintes-sentially American product. Globalization, however, has changed the economics of the movie industry. Foreign ticket sales for Hollywood blockbusters made up 50 percent of worldwide totals in 2000. By 2012, they had jumped to over 70 percent. Of the total $35 billion that Hollywood movies grossed in 2012, over $24 billion came from outside the United States! Today, largely due to the collapse of DVD/Blu-ray sales, Hollywood would be unable to continue pro-ducing big-budget movies without foreign revenues. Foreign sales can make or break the success of newly released big-budget movies.
Look at Exhibit 10.1 , which depicts the lifetime reve-nues (domestic and foreign) of recent Hollywood block-buster movies. Avatar is the highest-grossing movie to date, earning over $2.7 billion since its release in 2009. It may surprise you to learn that non-U.S. box office
sales account for almost 75 percent of that number. Avatar was hugely popular in Asia, especially in China, where the government gave permission to increase the number of movie theaters showing the film from 5,000 to 35,000. Another of James Cameron’s popular films, Titanic, grossed almost 70 percent of its $1.8 billion in overseas markets. The only billion-dollar blockbuster to receive a majority of ticket receipts from domestic audiences was the second installment in the Batman trilogy, The Dark Knight (2008).
CHAPTER CASE 10
Avatar (2009)Titanic (1997)
Marvel’s The Avengers (2012)Harry Potter and the Deathly Hallows Part 2 (2011)
The Lord of the Rings: The Return of the King (2003)Skyfall (2012)
Pirates of the Caribbean: Dead Man’s Chest (2006)Toy Story 3 (2010)Iron Man 3 (2013)*
The Dark Knight (2008)Harry Potter and the Sorcerer’s Stone (2001)
Star Wars: Episode 1 - The Phantom Menace (1999)Shrek 2 (2004)
Jurassic Park (1993)
Star Wars: Episode III - Revenge of the Sith (2005)Spider-Man (2002)
Independence Day (1996)
Lifetime Box Office Total, in millions
$0 $500 $1,000 $1,500 $2,500$2,000 $3,000
Spider-Man 3 (2007)
U.S. sales, $ millions
* through May 2013
Non-U.S. sales, $ millions
EXHIBIT 10.1 / Lifetime Revenues of Hollywood Blockbuster Movies, > $800 million (release year in parentheses)
SOURCE: Adapted from “Plot change: Foreign forces transform Hollywood films,” The Wall Street Journal, August 2, 2010, and updated with data from http://boxofficemojo.com for years 2010–2013.
WWW.YAZDANPRESS.COMWWW.YAZDANPRESS.COM

308
HOLLY WOOD HAS ALWAYS obtained some of its revenues from international
sales, but it is now a truly global enterprise, with the vast majority of revenues com-
ing from outside the United States. Moreover, the huge opportunities in the global movie
market have also attracted new entrants. Besides wanting to cater to international audi-
ences, Hollywood film studios are also feeling squeezed by low-cost foreign competition.
For example, Bollywood, the Indian movie industry, creates its own productions and brings
in low-cost but high-impact actors such as Freida Pinto and Dev Patel, who played the
lead roles in the mega-success Slumdog Millionaire. Slumdog ’s budget was merely
$14 million, but the movie grossed almost $400 million and won eight Oscars. By com-
parison, Hollywood’s budget for Home Alone, a similar success in terms of revenues, was
nearly five times as large.
The shift in revenue sources away from the U.S. market, as well as the opportunities for
future growth in emerging economies, is changing the global strategy of many U.S. firms,
not just Hollywood moviemakers. Firms from a wide variety of industries—such as Apple,
Caterpillar, GE, Intel, and IBM—are global enterprises. They not only manage global sup-
ply chains, but also obtain the majority of their revenues from outside their home mar-
ket. Once-unassailable U.S. firms now encounter formidable foreign competitors such as
Brazil’s Embraer (aerospace), China’s Haier (home appliances) and Lenovo (PCs), India’s
ArcelorMittal (steel), Infosys (IT services) and Reliance Group (conglomerate), Mexico’s
Cemex (cement), Russia’s Gazprom (energy), South Korea’s LG and Samsung (both in
electronics and appliances), and Sweden’s IKEA (home furnishings), to name just a few.
This chapter is about how firms gain and sustain competitive advantage when competing
around the world.
Given the increasing importance of non-U.S. box-office sales, Hollywood studios are changing their business models. Rob Moore, vice chairman of Para-mount Pictures, explains: “We need to make mov-ies that have the ability to break out internationally. That’s the only way to make the economic puzzle of film production work today.” 1 As a result, studios are adapting scripts to appeal to global audiences, casting foreign actors in leading roles, and pulling the plug on projects that seem too U.S.-centric. For example, the film G.I. Joe: The Rise of Cobra prominently featured South Korean movie star Byung-hun Lee and South African actor Arnold Vosloo. On the other hand, Dis-ney’s Wedding Banned, a romantic comedy about a divorced couple trying to prevent their daughter from getting married, was axed in the advanced production stage despite several marquee stars (Robin Williams, Anna Faris, and Diane Keaton) because of perceptions that it would not succeed outside the American mar-ket. Some mega releases such as Disney’s Monsters University (the prequel to Monsters, Inc. ) premier first in foreign markets before being shown in the U.S. Sim-ilarly, many scripts are altered or movie studios pro-duce multiple versions of the same movie.
Disney’s Marvel studio produced two versions of the 2013 box office hit Iron Man 3. One version of the film was produced for general release, and another version specifically targeted the 1.3 billion Chinese that make up the second-largest film market in the world. This version included bonus footage in Beijing and guest appearances by Chinese movie stars. Iron Man 3 grossed roughly 70 percent of its box office sales over-seas, or almost $700 million. Other studios are also realizing the significance of the Chinese market. Mov-ies such as the latest James Bond film Skyfall, Men in Black 3, Pirates of the Caribbean: At World’s End, and Mission Impossible 3 have all been edited so they would be permitted to screen in China.
Globalization also puts pressure on the pay of Holly-wood stars. Given the importance of international audi-ences and the availability of foreign stars and movies, the days are over when stars like Tom Hanks, Eddie Murphy, and Julia Roberts could demand 20 percent royalties on total ticket sales. 2
After reading the chapter, you will find more about this case, with related questions, on page 332.
WWW.YAZDANPRESS.COMWWW.YAZDANPRESS.COM

CHAPTER 10 Global Strategy: Competing Around the World 309
The competitive playing field is becoming increasingly global, as the ChapterCase
about the movie industry indicates. This globalization provides significant opportunities
for individuals, companies, and countries. Indeed, you can probably see the increase in
globalization on your own campus. The number of students enrolled at universities outside
their native countries tripled between 1980 (about one million students) to 2010 (three mil-
lion students). 3 The country of choice for foreign students remains the United States, with
some 600,000 enrolled per year, followed by the UK with some 360,000 foreign university
students.
In Chapter 8, we looked at the first two dimensions of corporate strategy: managing
the degree of vertical integration, and deciding which products and services to offer (the
degree of diversification). The question of how to compete effectively around the world is
the third dimension of corporate strategy. The world’s marketplace—made up of some 200
countries—is a staggering $70 trillion in gross domestic product (GDP), of which the U.S.
market is roughly $15 trillion, or about 21 percent. 4
We begin this chapter by defining globalization and presenting stages of globalization.
We then tackle a number of questions that the strategist must answer: Why should the com-
pany go global? Where and how should it compete? We present the CAGE 5 distance model
to answer the question of where the firm should compete globally. In a next step, we pres-
ent the integration-responsiveness framework to link a firm’s options of how to compete
globally with the different business strategies introduced in Chapter 6 (cost leadership,
differentiation, and integration). We then debate the question of why world leadership in
specific industries is often concentrated in certain geographic areas. We conclude with
practical Implications for the Strategist.
10.1 What Is Globalization?
Globalization is a process of closer integration and exchange between different countries
and peoples worldwide, made possible by falling trade and investment barriers, advances
in telecommunications, and reductions in transportation costs. 6 Combined, these factors
reduce the costs of doing business around the world, opening the doors to a much larger
market than any one home country. Globalization also allows companies to source sup-
plies at lower costs and to further differentiate products. Consequently, the world’s market
economies are becoming more integrated and interdependent.
Globalization has led to significant increases in living standards in many economies
around the world. Germany and Japan, countries that were basically destroyed after
World War II, turned into industrial powerhouses, fueled by export-led growth. The Asian
Tigers—Hong Kong, Singapore, South Korea, and Taiwan—turned themselves from
underdeveloped countries into advanced economies, enjoying some of the world’s highest
standards of living. The BRIC countries (Brazil, Russia, India, and China), with more than
40 percent of the world’s population and producing roughly half of the world’s economic
growth over the last decade, continue to offer significant business opportunities. 7 Indeed,
China with $7.5 trillion in GDP has become the second-largest economy worldwide after
the United States (with $15 trillion in GDP), in absolute terms. 8
The engine behind globalization is the multinational enterprise (MNE) —a company
that deploys resources and capabilities in the procurement, production, and distribution
of goods and services in at least two countries. By making investments in value chain
activities abroad, MNEs engage in foreign direct investment (FDI) . 9 For example, the
European aircraft maker Airbus is investing $600 million in Mobile, Alabama, to build
jetliners. 10 It’s doing so in order to avoid voluntary import restrictions, to take advantage of
business-friendly conditions such as lower taxes, labor cost, and cost of living, as well as
LO 10-1
Define globalization, multinational enterprise (MNE), foreign direct investment (FDI), and global strategy.
globalization The process of closer integration and exchange between different countries and peoples worldwide, made possible by falling trade and investment barriers, advances in telecommunications, and reductions in transportation costs.
multinational
enterprise (MNE)
A company that deploys resources and capabilities in the procurement, production, and distribution of goods and services in at least two countries.
foreign direct
investment (FDI)
A firm’s investments in value chain activities abroad.
WWW.YAZDANPRESS.COMWWW.YAZDANPRESS.COM

310 CHAPTER 10 Global Strategy: Competing Around the World
other incentives provided by host states in the southern United States, and to be closer to
customers in North America. For similar reasons, German carmaker Volkswagen invested
$1 billion in its Chattanooga, Tennessee, plant. 11 MNEs need an effective global strategy that enables them to gain and sustain a competitive advantage when competing against
other foreign and domestic companies around the world. 12
In the digital age, some companies are even born global— their founders start them with
the intent of running global operations. Internet-based companies such as Amazon, eBay,
Google, and LinkedIn by nature have a global presence. Indeed, Facebook, with over one
billion users around the globe, would—if it were a country—be the third-most populous
country worldwide after China (1.4 billion) and India (1.2 billion). To better customize
their websites to suit local preferences and cultures, these companies still tend to establish
offices and maintain computer servers in different countries. 13 Amazon.com , for example,
customizes its offerings for different markets (see country-specific sites at: www.amazon.
cn for China, www.amazon.de for Germany, and www.amazon.com.br for Brazil).
U.S. MNEs have a disproportionately positive impact on the U.S. economy. 14 Well-
known U.S. multinational enterprises include Boeing, Caterpillar, Coca-Cola, GE, John
Deere, Exxon Mobil, IBM, P&G, and Walmart. They make up less than 1 percent of the
number of total U.S. companies, but they:
■ Account for 11 percent of private-sector employment growth since 1990.
■ Employ 19 percent of the work force.
■ Pay 25 percent of the wages.
■ Account for 31 percent of the U.S. gross domestic product (GDP).
■ Make up 74 percent of private-sector R&D spending.
STAGES OF GLOBALIZATION
Since the beginning of the 20th century, globalization has proceeded through three notable
stages. 15 Each stage presents a different global strategy pursued by MNEs headquartered
in the United States.
GLOBALIZATION 1.0: 1900–1941. Globalization 1.0 took place from about 1900
through the early years of World War II. In that period, basically all the important business
functions were located in the home country. Typically, only sales and distribution opera-
tions took place overseas—essentially exporting goods to other markets. In some instances,
firms procured raw materials from overseas. Strategy formulation and implementation, as
well as knowledge flows, followed a one-way path—from domestic headquarters to inter-
national outposts. This time period saw the blossoming of the idea of MNEs. It ended with
the U.S. entry into World War II.
GLOBALIZATION 2.0: 1945–2000. With the end of World War II came a new
focus on growing business—not only to meet the needs that went unfulfilled during the
war years but also to reconstruct the damage from the war. From 1945 to the end of the
20th century, in the Globalization 2.0 stage, MNEs began to create smaller, self-contained
copies of themselves, with all business functions intact, in a few key countries (notably,
Western European countries, Japan, and Australia).
This strategy required significant amounts of foreign direct investment. Although it was
costly to duplicate business functions in overseas outposts, doing so allowed for greater
local responsiveness to country-specific circumstances. While the corporate headquarters
back in the U.S. set overarching strategic goals and allocated resources through the capital
global strategy Part of a firm’s corporate strategy to gain and sustain a competitive advantage when competing against other foreign and domestic companies around the world.
WWW.YAZDANPRESS.COMWWW.YAZDANPRESS.COM

CHAPTER 10 Global Strategy: Competing Around the World 311
budgeting process, local mini-MNE replicas had considerable leeway in day-to-day oper-
ations. Knowledge flow back to U.S. headquarters, however, remained limited in most
instances.
GLOBALIZATION 3.0: 21ST CENTURY. We are now in the Globalization 3.0 stage.
MNEs that had been the vanguard of globalization have since become global-collaboration
networks (see Exhibit 10.2 ). Such companies now freely locate business functions any-
where in the world based on an optimal mix of costs, capabilities, and PESTEL factors.
Huge investments in fiber-optic cable networks around the world have effectively reduced
communication distances, enabling companies to operate 24/7, 365 days a year. When
an engineer in Minneapolis, Minnesota, leaves for the evening, an engineer in Mumbai,
India, begins her workday. In the Globalization 3.0 stage, the MNE’s strategic objective
changes. The MNE reorganizes from a multinational company with self-contained opera-
tions in a few selected countries to a more seamless global enterprise with centers of
expertise. Each of these centers of expertise is a hub within a global network for delivering
products and services. Consulting companies, for example, can now tap into a worldwide
network of experts in real time, rather than relying on the limited number of employees in
their local offices.
Creating a global network of local expertise is beneficial not only in service industries,
but also in the industrial sector. To increase the rate of low-cost innovation that can then
be used to disrupt existing markets, GE organizes local growth teams in China, India,
Kenya, and many other emerging countries. 16 GE uses the slogan “in country, for country”
to describe the local growth teams’ autonomy in deciding which products and services to
develop, how to make them, and how to shape the business model. Many of these low-cost
innovations that were developed to serve local market needs such as the Vcan (a hand-
held ultrasound device, developed in China), the Mac 400 (an ECG device, developed in
India—more details later in the chapter), and the 9100c (an anesthesia system developed in
Kenya) were developed in emerging economies, and then introduced as disruptive innova-
tions in Western markets. 17
Some new ventures organize as global-collaboration networks (shown in Exhibit 10.2 )
from the start. Logitech, the maker of wireless peripherals such as computer mice, pre-
sentation “clickers,” and video game controllers, started in Switzerland but quickly estab-
lished offices in Silicon Valley, California. 18 Pursuing a global strategy right from the
EXHIBIT 10.2 /Globalization 3.0: 21st Century
Based on an optimal mix of costs, skills, and PESTEL factors, MNEs are organized as global-collaboration networks that perform business functions throughout the world.
SOURCE: Adapted from IBM (2009), A Decade of Generating Higher Value at IBM, IBM report, www.ibm.com.
WWW.YAZDANPRESS.COMWWW.YAZDANPRESS.COM

312 CHAPTER 10 Global Strategy: Competing Around the World
start allowed Logitech to tap into the innovation expertise contained in Silicon Valley. 19
In 2012, Logitech had sales of over $2 billion, with offices throughout the Americas, Asia,
and Europe. Underlying Logitech’s innovation competence is a network of best-in-class
skills around the globe. Moreover, Logitech can organize work continuously because its
teams in different locations around the globe can work 24/7.
The trend toward global-collaboration networks during the Globalization 3.0 stage
indeed raises the interesting question, “What defines a U.S. company?” If it’s the address
of the headquarters, then IBM, GE, and others are U.S. companies—despite the fact that a
majority of their employees work outside the United States. On the other hand, non-U.S.
companies such as carmakers from Japan (Toyota, Honda, and Nissan) and South Korea
(Hyundai and Kia) and several engineering companies (Siemens from Germany, and ABB,
a Swiss-Swedish MNE) all have made significant investments in the United States and cre-
ated a large number of well-paying jobs.
As a business student, you have several reasons to be interested in MNEs. Not only can
these companies provide interesting work assignments in different locations throughout
the world, but they also frequently offer the highest-paying jobs for college graduates.
Even if you don’t want to work for an MNE, chances are that the organization you will be
working for will do business with one, so it’s important to understand how they compete
around the globe.
Before we delve deeper into the question of why and how firms compete for advantage
globally, a cautionary note concerning globalization is in order. Although many large firms
are more than 50 percent globalized—meaning that more than half of their revenues are
from outside the home country—the world itself is far from being globalized. 20 If we look at
a number of different indicators, the level of globalization is no more than 10 to 25 percent.
For example, only:
■ 2 percent of all voice-calling minutes are cross-border. 21
■ 3 percent of the world’s population are first-generation immigrants.
■ 9 percent of all investments in the economy are foreign direct investments.
■ 15 percent of patents list at least one foreign inventor.
■ 18 percent of Internet traffic crosses national borders.
These data indicate that the world is not quite flat yet, 22 but at best semi-globalized. 23
Pankaj Ghemawat reasons that many more gains in social welfare and living standards can
be had through further globalization if future integration is managed effectively through
coordinated efforts by governments. 24 The European Union is an example of coordinated
economic and political integration by 28 countries, of which 17 use the euro as a common
currency. This coordinated integration took place over several decades following World
War II, precisely to prevent future wars in Europe. The EU now encompasses more than
500 million people. This makes it one of the largest economic zones in the world. Further
coordinated integration appears to be one solution to the current Eurozone crisis. Although
the EU has monetary authority (administered through the European Central Bank), it
does not have fiscal (i.e., budgetary) authority. This important responsibility remains with
national governments, leading to the sovereign debt crisis (discussed in detail in Chapter 2).
Further coordinated integration may not only solve this problem, but also create more busi-
ness opportunities for companies to gain and sustain competitive advantage.
Continued economic development across the globe has two consequences for MNEs.
First, rising wages and other costs are likely to negate any benefits of access to low-cost
input factors. Second, as the standard of living rises in emerging economies, MNEs are
hoping that increased purchasing power will enable workers to purchase the products they
used to make for export only. 25 China’s labor costs, for example, are steadily rising in
WWW.YAZDANPRESS.COMWWW.YAZDANPRESS.COM

CHAPTER 10 Global Strategy: Competing Around the World 313
tandem with an improved standard of living, especially in the coastal regions, where wages
have risen 50 percent since 2005. 26 Some MNEs have boosted wages an extra 30 percent
following the recent labor unrest. Many now offer bonuses to blue-collar workers and are
taking other measures to avoid sweatshop allegations that have plagued companies such as
Nike, Apple, and Levi Strauss. Rising wages, fewer workers due to the effects of China’s
one-child-per-family policy, and appreciation of the Chinese currency now combine to
lessen the country’s advantage in low-cost manufacturing. 27 This shift is in alignment with
the Chinese government’s economic policy, which wants to see a move from “Made in
China” to “Designed in China,” to capture more of the value added. 28 The value added of
manufacturing an iPad (by Foxconn in China) is only about 5 percent. 29 We next discuss in
more detail the reasons why firms “go global.”
10.2 Going Global: Why?
Clearly, the decision to pursue a global strategy comes from the firm’s assessment that
doing so will enhance its competitive advantage and that the benefits of globalization
will exceed the costs. Simply put, firms expand beyond their domestic borders if they
can increase their economic value creation ( V – C) and enhance competitive advantage.
As detailed in Chapter 5, firms enlarge their competitive advantage by increasing a con-
sumer’s willingness to pay through higher perceived value based on differentiation and/
or lower production and service delivery costs. Here we consider both the advantages and
disadvantages of expanding beyond the home market.
ADVANTAGES OF EXPANDING INTERNATIONALLY
Why do firms expand internationally? The main reasons firms expand abroad are to:
■ Gain access to a larger market.
■ Gain access to low-cost input factors.
■ Develop new competencies.
GAIN ACCESS TO A LARGER MARKET. Becoming an MNE provides significant
opportunities for U.S. companies, given economies of scale and scope that can be reaped
by participating in a much larger and more diverse market. At the same time, some coun-
tries with relatively weak domestic demand, such as China, Germany, South Korea, and
Japan, focus on export-led economic growth, which in turn drives many of their domestic
businesses to become MNEs.
For companies based in smaller economies, becoming an MNE may be necessary to
achieve growth or to gain and sustain competitive advantage. Examples include Acer
(Taiwan), Casella Wines (Australia), Nestlé (Switzerland), Novo Nordisk (Denmark),
Philips (Netherlands), Samsung (South Korea), and Zara (Spain). Unless companies in
smaller economies expand internationally, their domestic markets are often too small for
them to reach significant economies of scale to compete effectively against other MNEs.
In contrast, given the sheer size of the U.S. automotive market, GM needed to focus
mainly on its domestic market only to do well. GM once held more than 50 percent market
share and was the leader in global car sales between 1931 and 2008. In its heyday, GM
employed 350,000 U.S. workers and was an American icon. More and more, however,
GM’s future depends on its performance outside the U.S. In particular, the Chinese market
is becoming more and more important to GM’s performance, as Strategy Highlight 10.1
discusses.
LO 10-2
Explain why companies compete abroad, and evaluate the advantages and disadvantages of a global strategy.
WWW.YAZDANPRESS.COMWWW.YAZDANPRESS.COM

314 CHAPTER 10 Global Strategy: Competing Around the World
Does GM’s Future Lie in China?
With a population of 1.4 billion and currently only one vehicle per 100 people—compared with a vehicle den-sity of 94 per 100 in the U.S.—China offers tremendous growth opportunities for the automotive industry. Since China joined the World Trade Organization (WTO) in 2001, its domestic auto market has been growing at double dig-its annually and has now overtaken the U.S. as the largest in the world.
GM entered China in 1997 through a joint venture with Shanghai Automotive Industrial Corp (SAIC). Today, the Chinese market already accounts for 25 percent of GM’s total revenues. Moreover, GM’s China operation has been cost-competitive from day one. The company operates about the same number of assembly plants in China as in the U.S., but sells more vehicles while employing about half the number of employees. Chinese workers cost only a fraction of what U.S. workers do, and GM is not weighed down by additional health care and pension obligations.
GM’s Buick brand is considered a luxury vehicle in China. GM’s best-selling model in China, however, is the Wuling Sunshine, a small, boxy, purely functional vehicle (a so-called “micro van”) priced between $5,000 and $10,000 depending on what options the customer chooses. The SAIC-GM joint venture sold more than 1.4 million
Wuling vehicles in China in 2012. In the same year, GM held almost 15 percent market share in China. The Wuling Sunshine may help GM further penetrate the Chinese mar-ket; it also may be an introductory car for other emerging markets, such as India. GM’s low-cost strategy with this vehicle has been so successful that the firm is planning to expand the Wuling product line and offer the vehicle glob-ally. GM already sells the Wuling Sunshine in Brazil under the Buick nameplate. In total, GM earns over 70 percent of its revenues annually from outside the United States! This is quite a high level of globalization for a company that once was focused more or less domestically on the U.S. market.
Indeed, GM is betting its future on China and other emerging economies in Asia, Latin America, and the Mid-dle East as it strives to become a lean and low-cost manu-facturer of profitable small cars. To back up its strategic intent, GM has quadrupled its engineering and design personnel in China and is investing a quarter-billion dol-lars to build a cutting-edge R&D center on its Shanghai campus, home of its international headquarters. With GM’s growth in the double digits in China and rebound-ing in the U.S., the company confidently declared: “GM’s greatest strengths today are our market-leading positions in the United States and China, the world’s two largest markets.” 30
10.1
GAIN ACCESS TO LOW-COST INPUT FACTORS. Access to low-cost raw materi-
als such as lumber, iron ore, oil, and coal was a key driver behind Globalization 1.0 and
2.0. During Globalization 3.0, firms have expanded globally to benefit from lower labor
costs in manufacturing and services. India carved out a competitive advantage in busi-
ness process outsourcing (BPO), not only because of low-cost labor but because of an
abundance of well-educated, English-speaking young people. Infosys, TCS, and Wipro are
some of the more well-known Indian IT service companies. Taken together, these compa-
nies employ close to 250,000 people and provide services to many of the Global Fortune
500. Many MNEs have close business ties with Indian IT firms. Some, such as IBM, are
engaged in foreign direct investment through equity alliances or building their own IT and
customer service centers in India. More than a quarter of Accenture’s work force, a consul-
tancy specializing in technology and outsourcing, is now in Bangalore, India. 31
Likewise, China has emerged as a manufacturing powerhouse because of low labor
costs and an efficient infrastructure. An American manufacturing worker costs about 20
times more in wages alone than a similarly skilled worker in China. 32 A significant cost dif-
ferential exists not only for low-skilled labor, but for high-skilled labor as well. A Chinese
engineer trained at Purdue University, for example, works for only a quarter of the salary in
WWW.YAZDANPRESS.COMWWW.YAZDANPRESS.COM

CHAPTER 10 Global Strategy: Competing Around the World 315
his native country compared with an engineer working in the U.S. 33 Of course, this abso-
lute wage disparity also reflects the relative difference in the two countries’ cost of living.
DEVELOP NEW COMPETENCIES. Some MNEs pursue a global strategy in order
to develop new competencies. 34 These companies are making foreign direct investments
to be part of communities of learning, which are often contained in specific geographic
regions. 35 AstraZeneca, a Swiss-based pharmaceutical company, relocated its research
facility to Cambridge, Massachusetts, to be part of the Boston biotech cluster, in hopes
of developing new R&D competencies in biotechnology. 36 Cisco is investing more than
$1 billion to create an Asian headquarters in Bangalore, in order to be right in the middle of
India’s top IT location. 37 Unilever’s new-concept center is located in downtown Shanghai,
China, attracting hundreds of eager volunteers to test the firm’s latest product innovations
onsite, while Unilever researchers monitor consumer
reactions. In these examples, AstraZeneca, Cisco, and
Unilever all reap location economies —benefits from
locating value chain activities in optimal geographies
for a specific activity, wherever that may be. 38
Many MNEs now are replacing the one-way inno-
vation flow from Western economies to developing
markets with a polycentric innovation strategy —a strat-
egy in which MNEs now draw on multiple, equally
important innovation hubs throughout the world (char-
acteristic of Globalization 3.0; see Exhibit 10.2 ). GE
Global Research, for example, orchestrates a “net-
work of excellence” with facilities in Niskayuna, New
York (USA), Bangalore (India), Shanghai (China), and
Munich (Germany). Indeed, emerging economies are
becoming hotbeds for low-cost innovations that find their way back to developed mar-
kets. In Bangalore, GE researchers developed the Mac 400, a handheld electrocardiogram
(ECG). 39 The device is small, portable, and runs on batteries. Although a conventional
ECG costs $2,000, this handheld version costs $800 and enables doctors to do an ECG
test at a cost of only $1 per patient. The Mac 400 is now making its entry as a disruptive
innovation into the U.S. and other Western markets, with anticipated widespread use in the
offices of general practitioners and emergency ambulances.
DISADVANTAGES OF EXPANDING INTERNATIONALLY
Companies expanding internationally must carefully weigh the benefits and costs of doing
so. Disadvantages to “going global” include:
■ The liability of foreignness
■ Loss of reputation
■ Loss of intellectual property
THE LIABILITY OF FOREIGNESS. In international expansion, firms also face some
risks. In particular, MNEs doing business abroad also must overcome the liability of foreignness . This liability consists of the additional costs of doing business in an unfamil-
iar cultural and economic environment, and of coordinating across geographic distances. 40
Strategy Highlight 10.2 illustrates how Walmart underestimated its liability of foreignness
when entering and competing in Germany.
location economies
Benefits from locating value chain activities in the world’s optimal geographies for a specific activity, wherever that may be.
The GE Mac 400 device is small, portable, and enables doctors to do an ECG test in non-hospital settings and at low cost. It is now making its entry as a disruptive innovation in Western markets.
liability of
foreignness
Additional costs of doing business in an unfamiliar cultural and economic environment, and of coordinating across geographic distances.
WWW.YAZDANPRESS.COMWWW.YAZDANPRESS.COM
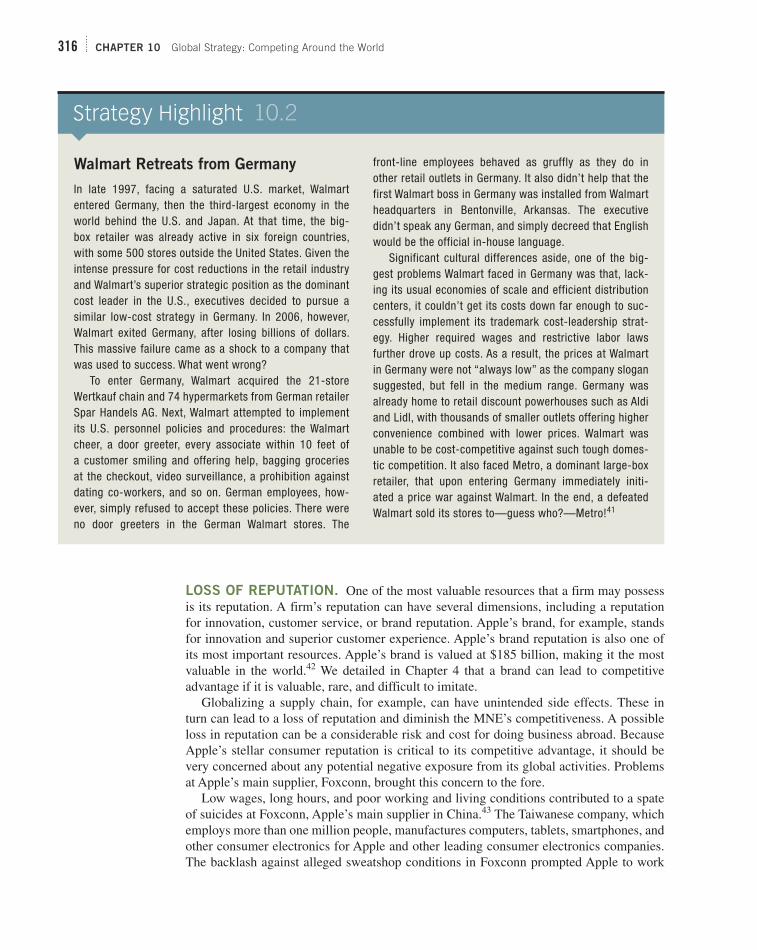
316 CHAPTER 10 Global Strategy: Competing Around the World
Walmart Retreats from Germany
In late 1997, facing a saturated U.S. market, Walmart entered Germany, then the third-largest economy in the world behind the U.S. and Japan. At that time, the big-box retailer was already active in six foreign countries, with some 500 stores outside the United States. Given the intense pressure for cost reductions in the retail industry and Walmart’s superior strategic position as the dominant cost leader in the U.S., executives decided to pursue a similar low-cost strategy in Germany. In 2006, however, Walmart exited Germany, after losing billions of dollars. This massive failure came as a shock to a company that was used to success. What went wrong?
To enter Germany, Walmart acquired the 21-store Wertkauf chain and 74 hypermarkets from German retailer Spar Handels AG. Next, Walmart attempted to implement its U.S. personnel policies and procedures: the Walmart cheer, a door greeter, every associate within 10 feet of a customer smiling and offering help, bagging groceries at the checkout, video surveillance, a prohibition against dating co-workers, and so on. German employees, how-ever, simply refused to accept these policies. There were no door greeters in the German Walmart stores. The
front-line employees behaved as gruffly as they do in other retail outlets in Germany. It also didn’t help that the first Walmart boss in Germany was installed from Walmart headquarters in Bentonville, Arkansas. The executive didn’t speak any German, and simply decreed that English would be the official in-house language.
Significant cultural differences aside, one of the big-gest problems Walmart faced in Germany was that, lack-ing its usual economies of scale and efficient distribution centers, it couldn’t get its costs down far enough to suc-cessfully implement its trademark cost-leadership strat-egy. Higher required wages and restrictive labor laws further drove up costs. As a result, the prices at Walmart in Germany were not “always low” as the company slogan suggested, but fell in the medium range. Germany was already home to retail discount powerhouses such as Aldi and Lidl, with thousands of smaller outlets offering higher convenience combined with lower prices. Walmart was unable to be cost-competitive against such tough domes-tic competition. It also faced Metro, a dominant large-box retailer, that upon entering Germany immediately initi-ated a price war against Walmart. In the end, a defeated Walmart sold its stores to—guess who?—Metro! 41
10.2
LOSS OF REPUTATION. One of the most valuable resources that a firm may possess
is its reputation. A firm’s reputation can have several dimensions, including a reputation
for innovation, customer service, or brand reputation. Apple’s brand, for example, stands
for innovation and superior customer experience. Apple’s brand reputation is also one of
its most important resources. Apple’s brand is valued at $185 billion, making it the most
valuable in the world. 42 We detailed in Chapter 4 that a brand can lead to competitive
advantage if it is valuable, rare, and difficult to imitate.
Globalizing a supply chain, for example, can have unintended side effects. These in
turn can lead to a loss of reputation and diminish the MNE’s competitiveness. A possible
loss in reputation can be a considerable risk and cost for doing business abroad. Because
Apple’s stellar consumer reputation is critical to its competitive advantage, it should be
very concerned about any potential negative exposure from its global activities. Problems
at Apple’s main supplier, Foxconn, brought this concern to the fore.
Low wages, long hours, and poor working and living conditions contributed to a spate
of suicides at Foxconn, Apple’s main supplier in China. 43 The Taiwanese company, which
employs more than one million people, manufactures computers, tablets, smartphones, and
other consumer electronics for Apple and other leading consumer electronics companies.
The backlash against alleged sweatshop conditions in Foxconn prompted Apple to work
WWW.YAZDANPRESS.COMWWW.YAZDANPRESS.COM

CHAPTER 10 Global Strategy: Competing Around the World 317
with its main supplier to improve working conditions and wages. Tim Cook, Apple’s CEO,
visited Foxconn in China to personally inspect its manufacturing facility and workers’
living conditions. Although conditions at Foxconn have been improving, 44 Apple started
to diversify its supplier base by adding Pegatron, another Taiwanese original equipment
manufacturer (OEM). 45
There have also been some tragic effects of the MNEs’ search for low-cost labor, often
in a context where local governments are corrupt and unwilling or unable to enforce a
minimum of safety standards. The textile industry is notorious for sweatshop conditions,
and many Western companies such as the Gap (U.S.), H&M (UK), and Carrefour (France)
have taken a big hit to their reputation in recent factory accidents in Bangladesh and else-
where in Southeast Asia. Hundreds of factory workers were killed when a textile factory
collapsed on the outskirts of Dhaka, Bangladesh. 46 Although much of the blame lies with
the often corrupt host governments not enforcing laws, regulations, and building codes,
the MNEs that source their textiles in these factories also receive some of the blame with
negative consequences for their reputation. The MNEs are accused of exploiting workers
and being indifferent to their working conditions and safety, all in an unending quest to
drive down costs.
This challenge directly concerns the MNEs’ corporate social responsibility (CSR), dis-
cussed in Chapter 2. Since some host governments are either unwilling or unable to enforce
regulation and safety codes, MNEs need to rise to the challenge. 47 Walmart responded by
posting a public list of “banned suppliers” on its website. These are suppliers that do not
meet adequate safety standards and working conditions. Prior to the Rana Plaza accident,
Walmart had already launched a working and fire-safety academy in Bangladesh to train
textile workers.
Given the regulatory and legal void that local governments often leave, several Western
MNEs have proposed a concerted action to finance safety efforts and worker training as
well as structural upgrades to factory buildings. After earlier revelations about the fre-
quent practice of child labor in many developing countries, Western MNEs in the textile
industry worked together to ban their suppliers from using child labor. Ensuring “ethical
sourcing” of raw materials and supplies is becoming ever more important. Besides a moral
responsibility, MNEs have a market incentive to protect their reputations given the public
backlash in the wake of factory accidents, child labor, worker suicides, and other horrific
externalities.
LOSS OF INTELLECTUAL PROPERTY. Finally, the issue of protecting intellectual
property in foreign markets also looms large. The software, movie, and music industries
have long lamented large-scale copyright infringements in many foreign markets. In addi-
tion, when required to partner with a foreign host firm, companies may find their intellec-
tual property being siphoned off and reverse-engineered.
Japanese and European engineering companies entered China, for example, to partici-
pate in building the world’s largest network of high-speed trains worth billions of dollars. 48
Companies such as Kawasaki Heavy Industries (Japan), Siemens (Germany), and Alstom
(France) were joint venture partners with domestic Chinese companies. These firms now
allege that the Chinese partners built on the Japanese and European partners’ advanced
technology to create their own, next-generation high-speed trains. To make matters worse,
they also claim that the Chinese companies now compete against them in other lucrative
foreign markets, such as Saudi Arabia, Brazil, and even California, with trains of equal or
better capabilities but at much lower prices. This example highlights the intellectual prop-erty exposure that firms can face when expanding overseas.
WWW.YAZDANPRESS.COMWWW.YAZDANPRESS.COM

318 CHAPTER 10 Global Strategy: Competing Around the World
10.3 Going Global: Where and How?
After discussing why companies expand internationally, we now turn our attention to the
question of which countries MNEs choose to enter, and how they do so.
WHERE IN THE WORLD TO COMPETE? THE CAGE DISTANCE FRAMEWORK
The question of where to compete geographically is, besides vertical integration and diver-
sification, the third dimension of determining a firm’s corporate strategy. The primary
drivers behind firms expanding beyond their domestic market are to gain access to larger
markets and low-cost input factors and to develop new competencies. Often, however, sev-
eral countries and locations score similarly on absolute metrics. Ireland and Portugal, for
example, have similar cost structures, and both provide access to the 500 million custom-
ers in the European Union. In such cases, how does an MNE decide? Rather than looking
at absolute measures such as the combination of market size (e.g., per capita fast-food
consumption) and consumer purchasing power (e.g., proxied by per capita income) when
conducting a country portfolio analysis, MNEs need to consider relative distance. To aid MNEs in deciding where in the world to compete, Pankaj Ghemawat introduced
the CAGE distance framework . CAGE is an acronym for C ultural, A dministrative and
political, G eographic, and E conomic distance. 49 Most of the costs and risks involved in
expanding beyond the domestic market are created by distance. Distance not only denotes
geographic distance (in miles or kilometers), but also includes, as the CAGE acronym
points out, cultural distance, administrative and political distance, and economic distance.
The CAGE distance framework breaks distance into different relative components between
any two country pairs that affect the success of FDI.
Although absolute metrics such as country wealth or market size matter to some extent
(for example, a 1 percent increase in country wealth leads to a 0.8 percent increase in inter-
national trade), the relative factors captured by the CAGE distance model matter more. For
instance, countries that are 5,000 miles apart trade only 20 percent of the amount traded
among countries that are 1,000 miles apart. Cultural distance matters even more. A com-
mon language increases trade between two countries by 200 percent over country pairs
that do not share a common language. In the earlier example regarding which EU country
to select for FDI, a U.S. MNE would pick Ireland, while a Brazilian MNE would select
Portugal. In the latter case, Brazil and Portugal also share a historic colony–colonizer rela-
tionship. This tie increases the expected trade intensity between these two countries by yet
another 900 percent in comparison to country pairs where this link is absent. Other CAGE
distance factors that are significant in predicting the amount of trade between two coun-
tries include whether they belong to the same regional trading bloc ( 1 330 percent; e.g., the
U.S. and Mexico in NAFTA, or the 28 member states of the European Union) and whether
the two countries use the same currency ( 1 340 percent; e.g., the euro is used in 17 of 28
EU countries as the common currency).
Exhibit 10.3 presents the CAGE distance model. In particular, it details factors that
increase the distance between two countries and how distance affects different industries
or products along the CAGE dimensions. 50 Next, we briefly discuss each of the CAGE
distance dimensions. 51
CULTURAL DISTANCE. In his research, Geert Hofstede defined and measured
national culture , the collective mental and emotional “programming of the mind” that dif-
ferentiates human groups. 52 Culture is made up of a collection of social norms and mores,
LO 10-3
Apply the CAGE distance framework to explain which countries MNEs enter.
CAGE distance
framework A decision framework based on the relative distance between home and a foreign target country along four dimensions: cultural distance, administrative and political distance, geographic distance, and economic distance.
national culture The collective mental and emotional “programming of the mind” that differentiates human groups.
WWW.YAZDANPRESS.COMWWW.YAZDANPRESS.COM

CHAPTER 10 Global Strategy: Competing Around the World 319
beliefs, and values. Culture captures the often unwritten and implic-
itly understood rules of the game.
Although there is no one-size-fits-all culture that accurately
describes any nation, Hofstede’s work provides a useful tool to proxy
cultural distance. Based on data analysis from more than 100,000
individuals from many different countries, four dimensions of culture
emerged: power distance, individualism, masculinity–femininity, and
uncertainty avoidance. 53 Hofstede’s data analysis yielded scores for
the different countries, for each dimension, on a range of zero to 100,
with 100 as the high end. More recently, Hofstede added a fifth cul-
tural dimension: long-term orientation. 54
Cultural differences find their expression in language, ethnicity,
religion, and social norms. They directly affect customer preferences (see Exhibit 10.3 ).
Because of their religious beliefs, for example, Hindus do not eat beef, while Muslims
do not eat pork. In terms of content-intensive service, cultural and language differences
are also the reason why global Internet companies such as Amazon or Google offer
country-specific variations of their sites. Despite these best efforts, they are often out-
flanked by native providers because of their deeper cultural understanding. For example,
in China the leading websites are domestic ones: Alibaba in e-commerce, and Baidu in
online search. In Russia, the leading e-commerce site is Ozon, while the leading search
engine is Yandex. Hofstede’s national-culture research becomes even more useful for managers by com-
bining the four distinct dimensions of culture into an aggregate measure for each country.
MNEs then can compare the national-culture measures for any two country pairings to
When Starbucks entered the Chinese market in 2000, it sought to reduce cultural distance by hand-ing out keychains to help new customers learn how to order. Layered cylinders on the mini coffee cup represent drink options—caffeinated or not, number of espresso shots, type of syrup, and so on. The customer spins the choices into the desired position and hands the keychain to the barista.
EXHIBIT 10.3 / The CAGE Distance Framework
SOURCE: Adapted from P. Ghemawat (2001), “Distance still matters: The hard reality of global expansion,” Harvard Business Review, September: 137–147.
CCultural Distance
A Administrative and Political Distance
GGeographic Distance
EEconomic Distance
Distance between two countries increases with . . .
• Different languages, ethnicities, religions, social norms, and dispositions
• Lack of connec-tive ethnic or social networks
• Lack of trust and mutual respect
• Absence of trading bloc
• Absence of shared currency, monetary or political association
• Absence of colonial ties
• Political hostilities
• Weak legal and finan-cial institutions
• Lack of common border, waterway access, adequate transportation, or communication links
• Physical remoteness
• Different climates and time zones
• Different consumer incomes
• Different costs and quality of natural, financial, and human resources
• Different information or knowledge
Distance most affects industries or products . . .
• With high linguistic content (TV)
• Related to national and/or religious iden-tity (foods)
• Carrying country-specific quality asso-ciations (wines)
• That a foreign gov-ernment views as staples (electricity), as building national reputations (aero-space), or as vital to national security (telecommunications)
• With low value-to-weight ratio (cement)
• That are fragile or perishable (glass, meats)
• In which communica-tions are vital (finan-cial services)
• For which demand varies by income (cars)
• In which labor and other cost differences matter (textiles)
WWW.YAZDANPRESS.COMWWW.YAZDANPRESS.COM

320 CHAPTER 10 Global Strategy: Competing Around the World
inform their entry decisions. 55 The difference between scores indicates cultural distance , the cultural disparity between the internationally expanding firm’s home country and its
targeted host country. A firm’s decision to enter certain international markets is influenced
by cultural differences. A greater cultural distance can increase the cost and uncertainty
of conducting business abroad. In short, greater cultural distance increases the liability of
foreignness.
If we calculate the cultural distance from the U.S. to various countries, for example, we
find that some countries are culturally very close to the U.S. (e.g., Australia has an overall
cultural distance score of 0.02), while others are culturally quite distant (e.g., Russia has
an overall cultural distance score of 4.42). As can be expected, English-speaking countries
such as Canada (0.12), Ireland (0.35), New Zealand (0.26), and the UK (0.09) all exhibit a
low cultural distance to the United States. Since culture is embedded in language, it comes
as no surprise that cultural and linguistic differences are highly correlated.
Culture even matters in the age of Facebook with its global reach of over one billion
users. Turns out that most Facebook friends are local rather than across borders. This
makes sense when one considers that the online social graph that Facebook users develop
in their network of friends is actually a virtual network laid above a (pre)existing social
network, rather than forming one anew. 56
ADMINISTRATIVE AND POLITICAL DISTANCE. Administrative and political
distances are captured in factors such as the absence or presence of shared monetary or
political associations, political hostilities, and weak legal and financial institutions. 57 The
17 European countries in the Eurozone, for example, not only share the same currency
but are also integrated politically to some extent. It should come as no surprise then that
most cross-border trade between European countries takes place within the EU. Germany,
one of the world’s largest exporters, conducts roughly 75 percent of its cross-border busi-
ness within the EU. 58 Similarly, Canada and Mexico partner with the United States in the
North American Free Trade Agreement (NAFTA), increasing trade in goods and services
between the three countries. Colony–colonizer relationships also have a strong positive
effect on bilateral trade between countries. British companies continue to trade heavily
with businesses from its former colonies in the Commonwealth; Spanish companies trade
heavily with Latin American countries; and French businesses trade with the franc zone of
West Africa.
Many foreign (target) countries also erect other political and administrative barriers,
such as tariffs, trade quotas, FDI restrictions, and so forth, to protect domestic competitors.
In many instances, China, for example, requests the sharing of technology in a joint venture
when entering the country. This was the case in the high-speed train developments dis-
cussed earlier. Other countries, such as the U.S. or those in the EU, protect national cham-
pions like Boeing or Airbus from foreign competition. Industries that are considered critical
to national security such as domestic airlines or telecommunications are often protected.
Finally, strong legal and ethical pillars as well as well-functioning economic institutions
like capital markets and an independent central bank reduce distance. Strong institutions,
both formal and informal, reduce uncertainty, and thus reduce transaction costs. 59
GEOGRAPHIC DISTANCE. The costs to cross-border trade rise with geographic dis-
tance. It is important to note, however, that geographic distance does not simply capture
how far two countries are from each other but also includes additional attributes such as
the country’s physical size (Canada versus Singapore), whether the countries are contigu-
ous to one another, have access to waterways to the ocean, the within-country distances
cultural distance
Cultural disparity between an internationally expanding firm’s home country and its targeted host country.
WWW.YAZDANPRESS.COMWWW.YAZDANPRESS.COM

CHAPTER 10 Global Strategy: Competing Around the World 321
to its borders, the country’s topography, and its time zones. The country’s infrastructure
such as road, power, and telecommunications networks also plays a role in determining
geographic distance. Geographic distance is particularly relevant when trading products
with low value-to-weight ratios such as steel, cement, or other bulk products and fragile
and perishable products such as glass or fresh meats and fruits.
ECONOMIC DISTANCE. The wealth and per capita income of consumers is the most
important determinant of economic distance. Wealthy countries engage in relatively more
cross-border trade than poorer ones. Rich countries tend to trade with other rich countries;
in addition, poor countries also trade more frequently with rich countries than with other
poor countries. Companies from wealthy countries benefit in cross-border trade with other
wealthy countries when their competitive advantage is based on economies of experience, scale, scope, and standardization. This is because replication of an existing business model
is much easier in a country where the incomes are relatively similar and resources, comple-
ments, and infrastructure are of roughly equal quality. Although Walmart in Canada is
a virtual carbon copy of the Walmart in the United States, Walmart in India is very dif-
ferent. 60 The Wall Street Journal captured Walmart’s difficulties in replicating its finely
tuned supply chain with the overarching aim to minimize cost in the headline “Bad Roads,
Red Tape, Burly Thugs Slow Walmart’s Passage in India.” 61 These are all key reasons
why India would score as very distant from the U.S. using the CAGE model. In contrast,
Walmart’s successful expansion into Canada was a simple replication. Companies from wealthy countries also trade with companies from poor countries to
benefit from economic arbitrage. The textile industry (discussed earlier) is a prime exam-
ple. We also highlighted economic arbitrage as one of the main benefits of “going global”:
access to low-cost input factors.
In conclusion, although the CAGE distance framework helps determine the attractive-
ness of foreign target markets in a more fine-grained manner based on relative differ-
ences, it is necessarily only a first step. A deeper analysis requires looking inside the firm
(as done in Chapter 4) to see how a firm’s strengths and weaknesses work to increase or
reduce distance from specific foreign markets. A company with a large cadre of cosmo-
politan managers and a diverse work force will be much less affected by cultural differ-
ences, for example, than a company with a more insular and less diverse culture with all
managers from the home country. Although technology may make the world seem smaller,
the costs of distance along all its dimensions are real. The costs of distance in expanding
internationally are often very high. Ignoring these costs can be very costly (see Walmart’s
adventure in Germany, discussed in Strategy Highlight 10.2) and lead to a competitive
disadvantage.
HOW DO MNEs ENTER FOREIGN MARKETS?
Assuming an MNE has decided why and where to enter a foreign market, the remaining
decision is how to do so. Exhibit 10.4 displays the different options managers have when
entering foreign markets, along with the required investments necessary and the control they
can exert. On the end of the continuum (left in Exhibit 10.4 ) are vehicles of foreign expan-
sion that require low investments but also allow for a low level of control. On the right are
foreign entry modes that require a high level of investments in terms of capital and other
resources, but also allow for a high level of control. Foreign entry modes with a high level
of control such as foreign acquisitions or greenfield plants reduce the firm’s exposure to two
particular downsides of global business: loss of reputation and loss of intellectual property.
LO 10-4
Compare and contrast the different options MNEs have to enter foreign markets.
WWW.YAZDANPRESS.COMWWW.YAZDANPRESS.COM

322 CHAPTER 10 Global Strategy: Competing Around the World
Exporting —producing goods in one country to sell in another—is one of the oldest
forms of internationalization (part of Globalization 1.0). It is often used to test whether
a foreign market is ready for a firm’s products. When studying vertical integration and
diversification (in Chapter 8), we discussed in detail different forms along the make-or-
buy continuum. As discussed in Chapter 9, acquisitions and strategic alliances (including
licensing, franchising, and joint ventures) are popular vehicles for entry into foreign mar-
kets. Since we discussed these organizational arrangements in detail in previous chapters,
we therefore keep this section on foreign entry modes brief.
The framework illustrated in Exhibit 10.4 , moving from left to right, has been suggested
as a stage model of sequential commitment to a foreign market over time. 62 Though it
does not apply to globally born companies, it is relevant for manufacturing companies that
are just now expanding into global operations. In some instances, companies are required
by the host country to form joint ventures in order to conduct business there, while some
MNEs prefer greenfield operations (building new plants and facilities from scratch), as
Motorola did when it entered China in the 1990s. 63
10.4 Cost Reductions vs. Local Responsiveness:
The Integration-Responsiveness Framework
When discussing business strategy (in Chapter 6), we noted that an effective integration
strategy must resolve the inherent trade-offs between cost and differentiation. In much
the same fashion, MNEs face two opposing forces when competing around the globe:
cost reductions versus local responsiveness. Indeed, cost reductions achieved through a
global-standardization strategy often reinforce a cost-leadership strategy at the business
level. Similarly, local responsiveness increases the differentiation of products and services,
reinforcing a differentiation strategy at the business level.
One of the core drivers for globalization is to expand the total market of firms in order
to achieve economies of scale and drive down costs. For many business executives, the
move toward globalization was based on the globalization hypothesis , which states that
consumer needs and preferences throughout the world are converging and thus becoming
increasingly homogenous. 64 Theodore Levitt stated: “Nothing confirms [the globalization
hypothesis] as much as the success of McDonald’s from [the] Champs-Élysées to Ginza,
of Coca-Cola in Bahrain and Pepsi-Cola in Moscow, and of rock music, Greek salad,
Hollywood movies, Revlon cosmetics, Sony televisions, and Levi jeans everywhere.” 65
LO 10-5
Apply the integration-responsiveness framework to evaluate the four different strategies MNEs can pursue when competing globally.
Exporting
Strategic Alliances
• Licensing• Franchising
• Joint Venture • Acquisition• Greenfield
Subsidiary
Investment & Control
LOWInvestment & Control
HIGH
EXHIBIT 10.4 / Modes of Foreign-Market Entry along the Investment and Control Continuum
WWW.YAZDANPRESS.COMWWW.YAZDANPRESS.COM

CHAPTER 10 Global Strategy: Competing Around the World 323
In support of the globalization hypothesis, Toyota is selling its hybrid Prius vehicle suc-
cessfully in 80 countries. Most vehicles today are built on global platforms and modified
(sometimes only cosmetically) to meet local tastes and standards.
The strategic foundations of the globalization hypothesis are based primarily on cost
reduction. One key competitive weapon is lower price, and MNEs attempt to reap sig-
nificant cost reductions by leveraging economies of scale and by managing global supply
chains to access the lowest-cost input factors.
Although there seems to be some convergence of consumer preferences across the
globe, national differences remain, due to distinct institutions and cultures. For example, in
the 1990s, Ford Motor Company followed this one-size-fits-all strategy by offering a more
or less identical car throughout the world: the Ford Mondeo, sold as the Ford Contour and
the Mercury Mystique in North America. Ford learned the hard way (lack of sales) that
consumer preferences were not converging sufficiently to allow it to ignore regional differ-
ences. 66 In some instances, MNEs therefore experience pressure for local responsiveness —the need to tailor product and service offerings to fit local consumer preferences and host-
country requirements. McDonald’s, for example, uses mutton instead of beef in India and
offers a teriyaki burger in Japan, even though its basic business model of offering fast food
remains the same the world over. Local responsiveness generally entails higher cost, and
sometimes even outweighs cost advantages from economies of scale and lower-cost input
factors.
Given the two opposing pressures of cost reductions versus local responsiveness, schol-
ars have advanced the integration-responsiveness framework , shown in Exhibit 10.5 . 67
This framework juxtaposes the opposing pressures for cost reductions and local respon-
siveness to derive four different strategies to gain and sustain competitive advantage
when competing globally. The four strategies, which we will discuss in the following
sections, are:
■ International strategy
■ Multidomestic strategy
■ Global-standardization strategy
■ Transnational strategy 68
At the end of that discussion, Exhibit 10.7 summarizes each global strategy.
INTERNATIONAL STRATEGY
An international strategy is essentially a strategy in which a company sells the same
products or services in both domestic and foreign markets. It enables MNEs to leverage
their home-based core competencies in foreign markets. An international strategy is one
globalization hypothesis
Assumption that consumer needs and preferences throughout the world are converging and thus becoming increasingly homogenous.
local responsiveness
The need to tailor product and service offerings to fit local consumer preferences and host-country requirements; generally entails higher costs.
integration-responsiveness
framework Strategy framework that juxtaposes the pressures an MNE faces for cost reductions and local responsiveness to derive four different strategies to gain and sustain competitive advantage when competing globally: international strategy, multidomestic strategy, global-standardization strategy, and transnational strategy.
international strategy
Strategy that involves leveraging home-based core competencies by selling the same products or services in both domestic and foreign markets; advantageous when the MNE faces low pressures for both local responsiveness and cost reductions.
WWW.YAZDANPRESS.COMWWW.YAZDANPRESS.COM
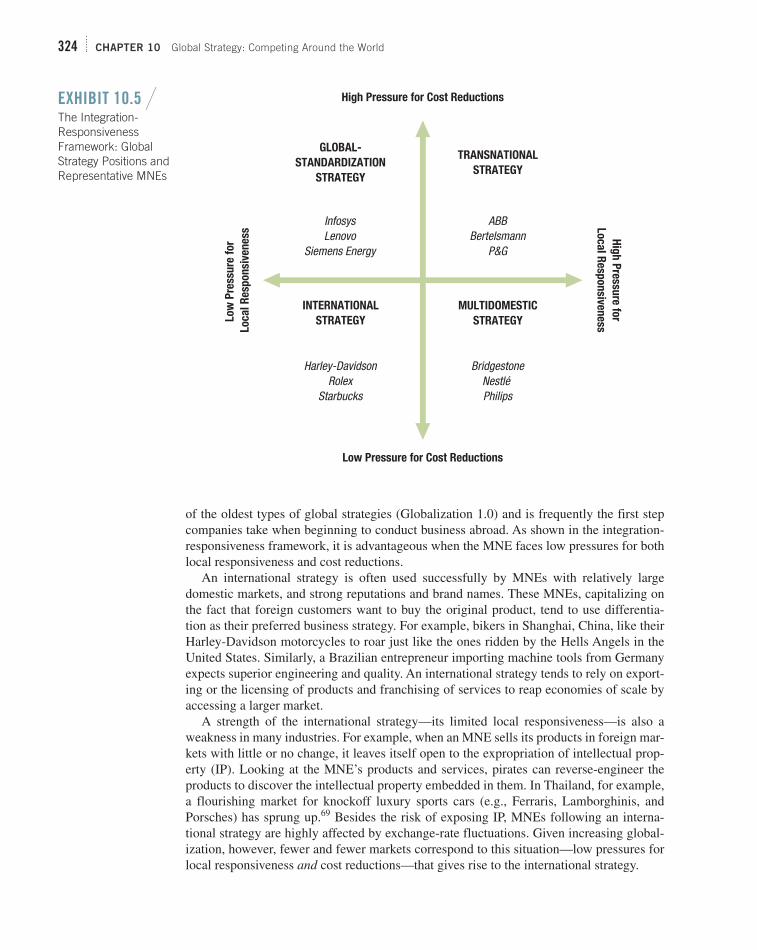
324 CHAPTER 10 Global Strategy: Competing Around the World
of the oldest types of global strategies (Globalization 1.0) and is frequently the first step
companies take when beginning to conduct business abroad. As shown in the integration-
responsiveness framework, it is advantageous when the MNE faces low pressures for both
local responsiveness and cost reductions.
An international strategy is often used successfully by MNEs with relatively large
domestic markets, and strong reputations and brand names. These MNEs, capitalizing on
the fact that foreign customers want to buy the original product, tend to use differentia-
tion as their preferred business strategy. For example, bikers in Shanghai, China, like their
Harley-Davidson motorcycles to roar just like the ones ridden by the Hells Angels in the
United States. Similarly, a Brazilian entrepreneur importing machine tools from Germany
expects superior engineering and quality. An international strategy tends to rely on export-
ing or the licensing of products and franchising of services to reap economies of scale by
accessing a larger market.
A strength of the international strategy—its limited local responsiveness—is also a
weakness in many industries. For example, when an MNE sells its products in foreign mar-
kets with little or no change, it leaves itself open to the expropriation of intellectual prop-
erty (IP). Looking at the MNE’s products and services, pirates can reverse-engineer the
products to discover the intellectual property embedded in them. In Thailand, for example,
a flourishing market for knockoff luxury sports cars (e.g., Ferraris, Lamborghinis, and
Porsches) has sprung up. 69 Besides the risk of exposing IP, MNEs following an interna-
tional strategy are highly affected by exchange-rate fluctuations. Given increasing global-
ization, however, fewer and fewer markets correspond to this situation—low pressures for
local responsiveness and cost reductions—that gives rise to the international strategy.
InfosysLenovo
Siemens Energy
Harley-DavidsonRolex
Starbucks
BridgestoneNestlé Philips
ABBBertelsmann
P&G
GLOBAL-
STANDARDIZATION
STRATEGY
TRANSNATIONAL
STRATEGY
INTERNATIONAL
STRATEGYLo
w P
ress
ure
fo
r
Lo
ca
l R
esp
on
sive
ness H
igh
Pre
ssure
for
Lo
ca
l Resp
on
siven
ess
High Pressure for Cost Reductions
Low Pressure for Cost Reductions
MULTIDOMESTIC
STRATEGY
EXHIBIT 10.5 / The Integration-Responsiveness Framework: Global Strategy Positions and Representative MNEs
WWW.YAZDANPRESS.COMWWW.YAZDANPRESS.COM
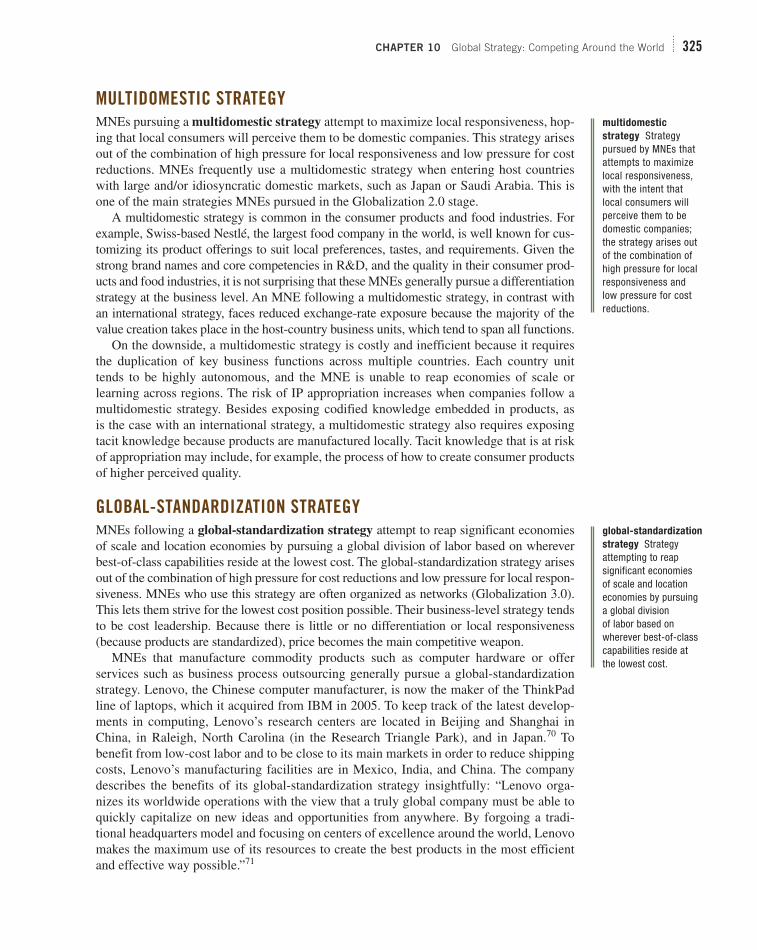
CHAPTER 10 Global Strategy: Competing Around the World 325
MULTIDOMESTIC STRATEGY
MNEs pursuing a multidomestic strategy attempt to maximize local responsiveness, hop-
ing that local consumers will perceive them to be domestic companies. This strategy arises
out of the combination of high pressure for local responsiveness and low pressure for cost
reductions. MNEs frequently use a multidomestic strategy when entering host countries
with large and/or idiosyncratic domestic markets, such as Japan or Saudi Arabia. This is
one of the main strategies MNEs pursued in the Globalization 2.0 stage.
A multidomestic strategy is common in the consumer products and food industries. For
example, Swiss-based Nestlé, the largest food company in the world, is well known for cus-
tomizing its product offerings to suit local preferences, tastes, and requirements. Given the
strong brand names and core competencies in R&D, and the quality in their consumer prod-
ucts and food industries, it is not surprising that these MNEs generally pursue a differentiation
strategy at the business level. An MNE following a multidomestic strategy, in contrast with
an international strategy, faces reduced exchange-rate exposure because the majority of the
value creation takes place in the host-country business units, which tend to span all functions.
On the downside, a multidomestic strategy is costly and inefficient because it requires
the duplication of key business functions across multiple countries. Each country unit
tends to be highly autonomous, and the MNE is unable to reap economies of scale or
learning across regions. The risk of IP appropriation increases when companies follow a
multidomestic strategy. Besides exposing codified knowledge embedded in products, as
is the case with an international strategy, a multidomestic strategy also requires exposing
tacit knowledge because products are manufactured locally. Tacit knowledge that is at risk
of appropriation may include, for example, the process of how to create consumer products
of higher perceived quality.
GLOBAL-STANDARDIZATION STRATEGY
MNEs following a global-standardization strategy attempt to reap significant economies
of scale and location economies by pursuing a global division of labor based on wherever
best-of-class capabilities reside at the lowest cost. The global-standardization strategy arises
out of the combination of high pressure for cost reductions and low pressure for local respon-
siveness. MNEs who use this strategy are often organized as networks (Globalization 3.0).
This lets them strive for the lowest cost position possible. Their business-level strategy tends
to be cost leadership. Because there is little or no differentiation or local responsiveness
(because products are standardized), price becomes the main competitive weapon.
MNEs that manufacture commodity products such as computer hardware or offer
services such as business process outsourcing generally pursue a global-standardization
strategy. Lenovo, the Chinese computer manufacturer, is now the maker of the ThinkPad
line of laptops, which it acquired from IBM in 2005. To keep track of the latest develop-
ments in computing, Lenovo’s research centers are located in Beijing and Shanghai in
China, in Raleigh, North Carolina (in the Research Triangle Park), and in Japan. 70 To
benefit from low-cost labor and to be close to its main markets in order to reduce shipping
costs, Lenovo’s manufacturing facilities are in Mexico, India, and China. The company
describes the benefits of its global-standardization strategy insightfully: “Lenovo orga-
nizes its worldwide operations with the view that a truly global company must be able to
quickly capitalize on new ideas and opportunities from anywhere. By forgoing a tradi-
tional headquarters model and focusing on centers of excellence around the world, Lenovo
makes the maximum use of its resources to create the best products in the most efficient
and effective way possible.” 71
multidomestic
strategy Strategy pursued by MNEs that attempts to maximize local responsiveness, with the intent that local consumers will perceive them to be domestic companies; the strategy arises out of the combination of high pressure for local responsiveness and low pressure for cost reductions.
global-standardization
strategy Strategy attempting to reap significant economies of scale and location economies by pursuing a global division of labor based on wherever best-of-class capabilities reside at the lowest cost.
WWW.YAZDANPRESS.COMWWW.YAZDANPRESS.COM

326 CHAPTER 10 Global Strategy: Competing Around the World
One of the advantages of the global-standardization strategy—obtaining the lowest cost
point possible by minimizing local adaptations—is also one of its key weaknesses. The
American MTV network cable channel started out with a global-standardization strategy. 72
The main inputs—music videos by vocal artists—were sourced more or less globally based
on the prevailing music hits. MTV reasoned that music videos were a commodity product that
would attract worldwide audiences. MTV was wrong! As indicated by the CAGE distance
model, cultural distance most affects products with high linguistic content such as TV. Even
in a music video channel, audiences have a distinct preference for at least some local content.
Keep in mind that strategic positions are not constant; they can change over time.
Exhibit 10.6 shows how MTV changed its strategic positions over time. To be more
responsive to local audiences, MTV then implemented a multidomestic strategy to meet
the need for local responsiveness. This turn led to a loss of all possible scale effects, espe-
cially rolling out expensive content over a large installed base of viewers. In a next move,
MTV shifted its strategic position away from a multidomestic strategy and is now pursuing
a transnational strategy.
TRANSNATIONAL STRATEGY
MNEs pursuing a transnational strategy attempt to combine the benefits of a localization
strategy (high local responsiveness) with those of a global-standardization strategy (lowest
cost position attainable). This strategy arises out of the combination of high pressure for
local responsiveness and high pressure for cost reductions. A transnational strategy is gen-
erally used by MNEs that pursue an integration strategy at the business level by attempting
to reconcile product and/or service differentiations at low cost.
transnational strategy
Strategy that attempts to combine the benefits of a localization strategy (high local responsiveness) with those of a global-standardization strategy (lowest cost position attainable).
(1)MTV starts out by pursuing a
GLOBAL-STANDARDIZATION
STRATEGY
(3)Today, MTV pursues a
TRANSNATIONALSTRATEGY
(2)MTV then
implements a
MULTIDOMESTICSTRATEGY
High Pressure for Cost Reductions
Low Pressure for Cost Reductions
Low
Pre
ssu
re f
or
Loca
l R
esp
on
sive
ness H
igh
Pre
ssure
for
Loca
l Resp
on
siven
ess
EXHIBIT 10.6 /
Dynamic Strategic Positioning: The MTV Music Chanel
WWW.YAZDANPRESS.COMWWW.YAZDANPRESS.COM

CHAPTER 10 Global Strategy: Competing Around the World 327
Besides harnessing economies of scale and location, a transnational strategy also
aims to benefit from global learning. MNEs typically implement a transnational strat-
egy through a global matrix structure. That structure combines economies of scale along
specific product divisions with economies of learning attainable in specific geographic
regions. The idea is that best practices, ideas, and innovations will be diffused throughout
the world, regardless of their origination. The managers’ mantra is to think globally, but act locally.
Although a transnational strategy is quite appealing, the required matrix structure is
rather difficult to implement because of the organizational complexities involved. High
local responsiveness typically requires that key business functions are frequently dupli-
cated in each host country, leading to higher costs. Further compounding the organiza-
tional complexities is the challenge of finding managers who can dexterously work across
cultures in the ways required by a transnational strategy. We’ll discuss organizational
structure in more depth in the next chapter.
The German multimedia conglomerate Bertelsmann attempts to follow a transnational
strategy. Bertelsmann employs over 100,000 people, with two-thirds of that work force
outside its home country. In particular, Bertelsmann operates in more than 60 countries
throughout the world, and owns many regional leaders in their specific product catego-
ries, including Random House Publishing in the U.S. and RTL Group, Europe’s second-
largest TV, radio, and production company (after the BBC). Bertelsmann operates its
over 500 regional media divisions as more or less autonomous profit-and-loss centers;
global learning and human resource strategies for executives are coordinated at the net-
work level. 73
As a summary, Exhibit 10.7 (next page) provides a detailed description of each of the
four global strategies in the integration-responsiveness framework.
10.5 National Competitive Advantage:
World Leadership in Specific Industries
Globalization, the prevalence of the Internet and other advances in communications tech-
nology, and transportation logistics can lead us to believe that firm location is becom-
ing increasingly less important. 74 Because firms can now, more than ever, source inputs
globally, many believe that location must be diminishing in importance as an expla-
nation of firm-level competitive advantage. This idea is called the death-of-distance hypothesis . 75
Despite an increasingly globalized world, however, it turns out that high-performing
firms in certain industries are concentrated in specific countries. 76 For example, the lead-
ing biotechnology, software, and Internet companies are headquartered in the United
States. Some of the world’s best computer manufacturers are in China and Taiwan. Many
of the leading consumer electronics companies are in South Korea and Japan. The top
mining companies are in Australia. The leading business process outsourcing (BPO) com-
panies are in India. Some of the best engineering and car companies are in Germany. The
world’s top fashion designers are in Italy. The best wineries are in France. The list goes on.
Although globalization lowers the barriers to trade and investments and increases human
capital mobility, one key question remains: Why are certain industries more competitive in some countries than in others? This question goes to the heart of the issue of national competitive advantage , a consideration of world leadership in specific industries. That
death-of-distance
hypothesis
Assumption that geographic location alone should not lead to firm-level competitive advantage because firms are now, more than ever, able to source inputs globally.
national competitive
advantage World leadership in specific industries.
WWW.YAZDANPRESS.COMWWW.YAZDANPRESS.COM
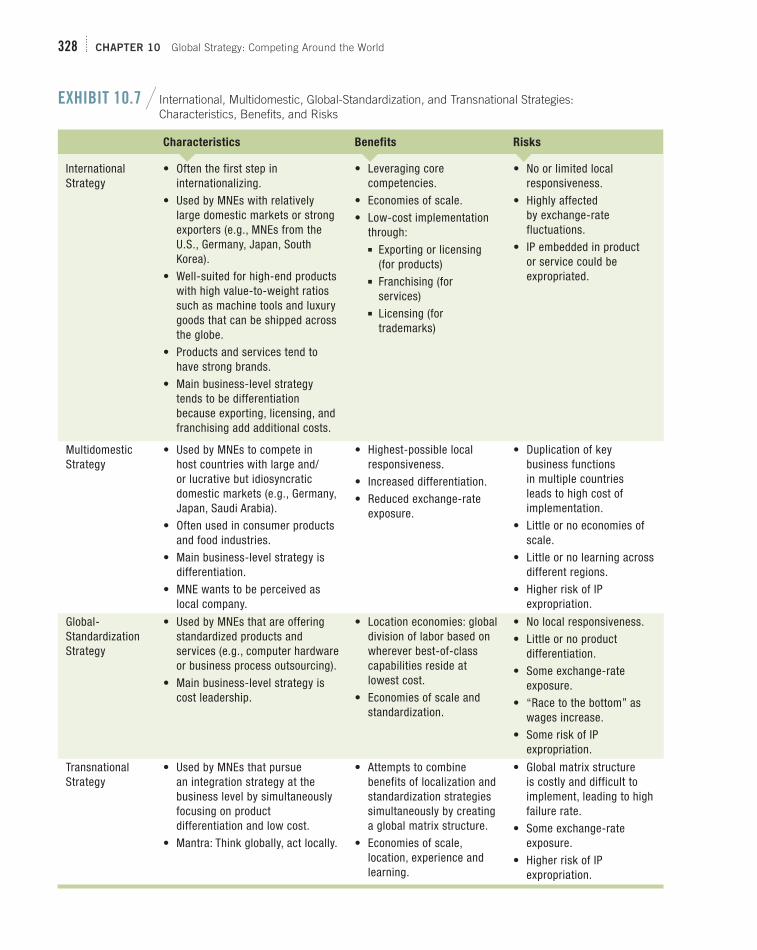
328 CHAPTER 10 Global Strategy: Competing Around the World
EXHIBIT 10.7 / International, Multidomestic, Global-Standardization, and Transnational Strategies: Characteristics, Benefits, and Risks
Characteristics Benefits Risks
International Strategy
• Often the first step in internationalizing.
• Used by MNEs with relatively large domestic markets or strong exporters (e.g., MNEs from the U.S., Germany, Japan, South Korea).
• Well-suited for high-end products with high value-to-weight ratios such as machine tools and luxury goods that can be shipped across the globe.
• Products and services tend to have strong brands.
• Main business-level strategy tends to be differentiation because exporting, licensing, and franchising add additional costs.
• Leveraging core competencies.
• Economies of scale.
• Low-cost implementation through:
■ Exporting or licensing (for products)
■ Franchising (for services)
■ Licensing (for trademarks)
• No or limited local responsiveness.
• Highly affected by exchange-rate fluctuations.
• IP embedded in product or service could be expropriated.
Multidomestic Strategy
• Used by MNEs to compete in host countries with large and/or lucrative but idiosyncratic domestic markets (e.g., Germany, Japan, Saudi Arabia).
• Often used in consumer products and food industries.
• Main business-level strategy is differentiation.
• MNE wants to be perceived as local company.
• Highest-possible local responsiveness.
• Increased differentiation.
• Reduced exchange-rate exposure.
• Duplication of key business functions in multiple countries leads to high cost of implementation.
• Little or no economies of scale.
• Little or no learning across different regions.
• Higher risk of IP expropriation.
Global-Standardization Strategy
• Used by MNEs that are offering standardized products and services (e.g., computer hardware or business process outsourcing).
• Main business-level strategy is cost leadership.
• Location economies: global division of labor based on wherever best-of-class capabilities reside at lowest cost.
• Economies of scale and standardization.
• No local responsiveness.
• Little or no product differentiation.
• Some exchange-rate exposure.
• “Race to the bottom” as wages increase.
• Some risk of IP expropriation.
Transnational Strategy
• Used by MNEs that pursue an integration strategy at the business level by simultaneously focusing on product differentiation and low cost.
• Mantra: Think globally, act locally.
• Attempts to combine benefits of localization and standardization strategies simultaneously by creating a global matrix structure.
• Economies of scale, location, experience and learning.
• Global matrix structure is costly and difficult to implement, leading to high failure rate.
• Some exchange-rate exposure.
• Higher risk of IP expropriation.
WWW.YAZDANPRESS.COMWWW.YAZDANPRESS.COM

CHAPTER 10 Global Strategy: Competing Around the World 329
issue, in turn, has a direct effect on firm-level competitive advantage. Companies from
home countries that are world leaders in specific industries tend to be the strongest com-
petitors globally.
PORTER’S DIAMOND FRAMEWORK
Michael Porter advanced a framework to explain national competitive advantage—why are
some nations outperforming others in specific industries. This framework is called Porter’s
diamond of national competitive advantage, and is shown in Exhibit 10.8 . It consists of
four interrelated factors:
■ Factor conditions
■ Demand conditions
■ Competitive intensity in focal industry
■ Related and supporting industries/complementors
FACTOR CONDITIONS. Factor conditions describe a country’s endowments in terms
of natural, human, and other resources. Interestingly, natural resources are often not needed
to generate world-leading companies, because competitive advantage is often based on
human capital and know-how. Several of the world’s most resource-rich countries (such
as Afghanistan, 77 Iran, Iraq, Russia, Saudi Arabia, and Venezuela) are not home to any
LO 10-6
Apply Porter’s diamond framework to explain why certain industries are more competitive in specific nations than in others.
FactorConditions
Related andSupportingIndustries/
Complementors
DemandConditions
CompetitiveIntensity in
Focal Industry
NATIONAL
COMPETITIVE
ADVANTAGE
EXHIBIT 10.8 /
Porter’s Diamond of National Competitive AdvantageSOURCE: Adapted from M. E. Porter (1990), “The competitive advantage of nations,” Harvard Business Review, March–April: 78.
WWW.YAZDANPRESS.COMWWW.YAZDANPRESS.COM

330 CHAPTER 10 Global Strategy: Competing Around the World
of the world’s leading companies, even though some (though not all) do have in place
institutional frameworks allowing them to be a productive member of world commerce.
In contrast, countries that lack natural resources (e.g., Denmark, Finland, Israel, Japan,
Singapore, South Korea, Switzerland, Taiwan, and the Netherlands) often develop world-
class human capital to compensate. 78 Other important factors include capital markets,
a supportive institutional framework, research universities, and public infrastructure
(airports, roads, schools, health care system), among others.
DEMAND CONDITIONS. Demand conditions are the specific characteristics of
demand in a firm’s domestic market. A home market made up of sophisticated customers
who hold companies to a high standard of value creation and cost containment contributes
to national competitive advantage. Moreover, demanding customers may also clue firms
in to the latest developments in specific fields and may push firms to move research from
basic findings to commercial applications for the marketplace.
For example, due to dense urban living conditions, hot and humid summers, and high
energy costs, it is not surprising that Japanese customers demand small, quiet, and energy-
efficient air conditioners. In contrast to the Japanese, Finns have a sparse population living
in a more remote countryside. A lack of land lines for telephone service has resulted in the
Finnish demand for high-quality wireless services, combined with reliable handsets (and
long-life batteries) that can be operated in remote, often hostile, environments. Cell phones
have long been a necessity for survival in rural areas of Finland. This situation enabled
Nokia to become an early leader in cell phones. 79
COMPETITIVE INTENSITY IN A FOCAL INDUSTRY. Companies that face a
highly competitive environment at home tend to outperform global competitors that lack
such intense domestic competition. Fierce domestic competition in Germany, for exam-
ple, combined with demanding customers and the no-speed-limit Autobahn make a tough
environment for any car company. Success requires top-notch engineering of chassis
and engines, as well as keeping costs and fuel consumption ($9-per-gallon gas prices) in
check. This extremely tough home environment amply prepared German car companies
such as Volkswagen (which also owns Audi and Porsche), BMW, and Daimler for global
competition.
RELATED AND SUPPORTING INDUSTRIES/COMPLEMENTORS. Leader-
ship in related and supporting industries can also foster world-class competitors in down-
stream industries. The availability of top-notch complementors —firms that provide a good
or service that leads customers to value the focal firm’s offering more when the two are
combined—further strengthens national competitive advantage. Switzerland, for example,
leveraged its early lead in industrial chemicals into pharmaceuticals. A sophisticated health
care service industry sprang up alongside as an important complementor, to provide fur-
ther stimulus for growth and continuous improvement and innovation.
The effects of sophisticated customers and highly competitive industries ripple through
the industry value chain to create top-notch suppliers and complementors. Toyota’s global
success in the 1990s and early 2000s was based to a large extent on a network of world-
class suppliers in Japan. 80 This tightly knit network allowed for fast two-way knowledge
sharing—this in turn improved Toyota’s quality and lowered its cost, which it leveraged
into a successful integration strategy at the business level.
It is also interesting to note that by 2010, Toyota’s supplier advantage had disappeared. 81
It was unable to solve the trade-off between drastically increasing its volume and main-
taining superior quality. Toyota’s rapid growth to becoming the world’s leader in volume
WWW.YAZDANPRESS.COMWWW.YAZDANPRESS.COM
CHAPTER 10 Global Strategy: Competing Around the World 331
required quickly bringing on new suppliers outside Japan, and quality standards couldn’t be
maintained. Part of the problem lies in path dependence (discussed in Chapter 4), because
Chinese and other suppliers could not be found quickly enough, nor could most foreign
suppliers build at the required quality levels fast enough. The cultural distance between
Japan and China exacerbated these problems. Combined, these factors explain the quality
problems Toyota experienced recently, and serve to highlight the importance of related and
supporting industries to national competitive advantage.
10.6 Implications for the Strategist
In addition to determining the degree of vertical integration and level of diversification,
the strategist needs to decide if and how the firm should compete beyond its home market.
Decisions along all three dimensions formulate the firm’s corporate strategy. Because of
increasing global integration in products and services as well as capital markets, the ben-
efits of competing globally outweigh the costs for more and more enterprises. This is not
just true for large MNEs, but also for small and medium ones (SMEs). Even small startups
are now able to leverage technology such as the Internet to compete beyond their home
market.
The strategist has a number of frameworks at his or her disposal to make global strat-
egy decisions. The CAGE framework allows for a detailed analysis of any country pair-
ing. Rather than looking at simple absolute measures such as market size, the strategist
can determine the relative distance or closeness of a target market to the home market
along cultural, administrative/political, geographic, and economic dimensions. Once the
strategist has decided which countries to enter, the mode of foreign entry needs to be
determined. Considerations of the degree of investment and level of control help in this
decision. Higher levels of control, and thus greater protection of IP and a lower likelihood
of any loss in reputation, go along with more investment-intensive foreign entry modes
such as acquisitions or greenfield plants.
A firm’s business-level strategy (discussed in Chapter 6) provides an important clue to
possible strategies pursued globally. A cost leader, for example, is more likely to have the
capabilities to be successful with a global-standardization strategy. In contrast, a differen-
tiator is more likely to be successful in pursuing an international or multidomestic strategy.
The same caveats raised concerning an integration strategy at the business level apply at
the corporate level: Although attractive on paper, a transnational strategy combining high
pressures for cost reductions with high pressures for local responsiveness is difficult to
implement because of inherent trade-offs.
Finally, the strategist must be aware of the fact that despite globalization and the emer-
gence of the Internet, firm geographic location has actually maintained its importance.
Critical masses of world-class firms are clearly apparent in regional geographic clusters. Think of computer technology firms in Silicon Valley, medical device firms in the Chicago
area, and biotechnology firms in and around Boston. This is not only a U.S. phenomenon,
it holds worldwide. Known for their engineering prowess, car companies such as Daimler,
BMW, Audi, and Porsche are clustered in southern Germany. Many fashion-related com-
panies (clothing, shoes, and accessories) are located in northern Italy. Singapore is a well-
known cluster for semiconductor materials, and India’s leading IT firms are in Bangalore.
Porter captures this phenomenon succinctly: “Paradoxically, the enduring competitive
advantages in a global economy lie increasingly in local things—knowledge, relationships,
and motivation that distant rivals cannot match.” 82
This concludes our discussion of global strategy. Moreover, we have now completed
our study of the first two pillars of the AFI framework— Strategy Analysis (Chapters 1–5)
WWW.YAZDANPRESS.COMWWW.YAZDANPRESS.COM

332 CHAPTER 10 Global Strategy: Competing Around the World
and Strategy Formulation (Chapters 6–10). Next, we turn to the third and final pillar of the
AFI framework— Strategy Implementation. In Chapter 11, we’ll study what managers can
do to implement their carefully crafted strategies successfully and how to avoid failure. In
Chapter 12, we study corporate governance and business ethics.
T T HE HOLLYWOOD FILM INDUSTRY garners a surprisingly large percentage of its revenues (nearly 75 percent) from foreign sales, as discussed in the Chapter Case. This number is surprisingly large given several con-straints that U.S. films have when selling internationally. First, there are numerous piracy concerns. Even in the European Union (EU), where countries like Britain and France impose fines on producers and buyers of pirated content, other countries such as Spain have long been havens for the distribution of illegal movies and music. In February 2011, Spain passed a new law to provide bet-ter protection of copyrighted material, but enforcement may be difficult in a country where nearly 50 percent of all Internet users admit to illegally downloading copy-righted content (twice the EU average rate). 83
China is infamous for its rampant business in illegal materials. In 2010, a Chinese government report found that the market for pirated DVDs was $6 billion. As a comparison, the total box-office revenues in China in 2010 were $1.5 billion. 84 One reason is that ticket prices for movies in China are steep and movies are considered luxury entertainment that few can afford. Another reason that “black-market” sales in China are so high is that legitimate sales often are not allowed. China allows only about 20 new non-Chinese movies into its theaters each year. Additionally, it has strict licensing rules on the sale of home-entertainment goods. Chinese censors are not likely to approve the sale of official DVDs for movies such as Lara Croft Tomb Raider: The Cradle of Life, Black Swan, and The Social Network. As a result there is often no legitimate product competing with the bootlegged offerings available via DVD and the Internet in China. 85
Movie studios are moving to simultaneous worldwide releases of expected block-busters in part to try to cut down on the revenues lost to piracy. International growth is expected to continue and take increasing shares of Hollywood film revenues, especially in the face of falling U.S. DVD sales. China is reportedly building new cinema screens at a rate of three per day in 2011. Yet growth in China (and elsewhere) is not as profitable as traditional releases in the United States. For example, film distributors typically earn 50 to 55 percent of box-office revenues in America. The aver-age in many other countries is closer to 40 percent (the rest goes to the cinema owner). But in China, a typical Hollywood film distributor gets only 15 percent of the box-office ticket revenue. 86
Questions
1. Given the forces on the Hollywood movie industry, is it likely we will see a decrease in the produc-tion of regional- and U.S.-centered movies, or will small independent movie producers pick up a higher share of the domestic U.S. market? Please explain.
2. What alternatives could movie producers develop to help combat the piracy of first-run movies and follow-on DVD and Internet releases?
3. How would you prioritize which nations to expand distribution into if you were working for a major Hollywood movie studio?
CHAPTERCASE 10 Consider This . . .
WWW.YAZDANPRESS.COMWWW.YAZDANPRESS.COM

CHAPTER 10 Global Strategy: Competing Around the World 333
LO 10-3 / Apply the CAGE distance frame-
work to explain which countries MNEs enter.
■ Most of the costs and risks involved in expanding
beyond the domestic market are created by distance. ■ The CAGE distance framework determines the
relative distance between home and foreign target
country along four dimensions: cultural distance,
administrative and political distance, geographic
distance, and economic distance.
LO 10-4 / Compare and contrast the different
options MNEs have to enter foreign markets.
■ The strategist has the following foreign entry modes
available: exporting, strategic alliances (licensing
for products, franchising for services), joint venture,
and subsidiary (acquisition or greenfield).
■ Higher levels of control, and thus a greater pro-
tection of IP and a lower likelihood of any loss
in reputation, go along with more investment-
intensive foreign entry modes such as acquisitions
or greenfield plants.
LO 10-5 / Apply the integration-responsiveness
framework to evaluate the four different strate-
gies MNEs can pursue when competing globally.
■ To navigate between the competing pressures of
cost reductions and local responsiveness, MNEs
have four strategy options: international, multido-
mestic, global-standardization, and transnational.
■ An international strategy leverages home-based
core competencies into foreign markets, primarily
through exports. It is useful when the MNE faces
low pressures for both local responsiveness and
cost reductions.
■ A multidomestic strategy attempts to maximize
local responsiveness in the face of low pressure
for cost reductions. It is costly and inefficient
because it requires the duplication of key business
functions in multiple countries.
■ A global-standardization strategy seeks to reap
economies of scale and location by pursuing a
global division of labor based on wherever best-
of-class capabilities reside at the lowest cost. It
involves little or no local responsiveness.
This chapter discussed the roles of MNEs for eco-
nomic growth; the stages of globalization; why,
where, and how companies go global; four strategies
MNEs use to navigate between cost reductions and
local responsiveness; and national competitive advan-
tage, as summarized by the following learning objec-
tives and related take-away concepts.
LO 10-1 / Define globalization, multinational
enterprise (MNE), foreign direct investment
(FDI), and global strategy.
■ Globalization involves closer integration and
exchange between different countries and peoples
worldwide, made possible by factors such as fall-
ing trade and investment barriers, advances in
telecommunications, and reductions in transporta-
tion costs.
■ A multinational enterprise (MNE) deploys
resources and capabilities to procure, produce,
and distribute goods and services in at least two
countries.
■ Many MNEs are more than 50 percent globalized;
they receive the majority of their revenues from
countries other than their home country.
■ Product, service, and capital markets are more
globalized than labor markets. The level of every-
day activities is roughly 10 to 25 percent inte-
grated, and thus semi-globalized. ■ Foreign direct investment (FDI) denotes a firm’s
investments in value chain activities abroad.
LO 10-2 / Explain why companies compete
abroad, and evaluate the advantages and
disadvantages of a global strategy.
■ Companies expand beyond their home market if
the benefits outweigh the risks.
■ Advantages to competing internationally include
gaining access to a larger market, gaining access
to low-cost input factors, and developing new
competencies.
■ Disadvantages to competing internationally
include the liability of foreignness, the possible
loss of reputation, and the possible loss of intel-
lectual capital.
TAKE-AWAY CONCEPTS
WWW.YAZDANPRESS.COMWWW.YAZDANPRESS.COM

334 CHAPTER 10 Global Strategy: Competing Around the World
■ Four interrelated factors explain national
competitive advantage: (1) factor conditions,
(2) demand conditions, (3) competitive intensity
in a focal industry, and (4) related and supporting
industries/complementors.
■ Even in a more globalized world, the basis for
competitive advantage is often local.
■ A transnational strategy attempts to combine the
high local responsiveness of a localization strat-
egy with the lowest cost position attainable from
a global-standardization strategy. It also aims to
benefit from global learning. Although appealing,
it is difficult to implement due to the organiza-
tional complexities involved.
LO 10-6 / Apply Porter’s diamond framework
to explain why certain industries are more
competitive in specific nations than in others.
■ National competitive advantage, or world leader-
ship in specific industries, is created rather than
inherited.
CAGE distance framework
Cultural distance
Death-of-distance hypothesis
Foreign direct investment (FDI)
Global-standardization strategy
Global strategy
Globalization
Globalization hypothesis
Integration-responsiveness
framework
International strategy
Liability of foreignness
Local responsiveness
Location economies
Multidomestic strategy
Multinational
enterprise (MNE)
National competitive advantage
National culture
Transnational strategy
KEY TERMS
DISCUSSION QUESTIONS
1. Think about the last movie you saw in a movie
theater. What aspects of the movie had inter-
national components in it (e.g., the plot line,
locations, cast, and so on)? Are there more inter-
national elements included than compared to your
favorite movie from a decade ago?
2. Multinational enterprises (MNEs) have an impact
far beyond their firm boundaries. Assume you are
working for a small firm that supplies a product
or service to an MNE. How might your relation-
ship change as the MNE moves from Globaliza-
tion 2.0 to Globalization 3.0 operations?
3. Professor Pankaj Ghemawat delivered a TED
talk entitled “Actually, the World Isn’t Flat.” Do
you agree with his assessment that the world is
at most semi-globalized, and that we need to be
careful not to fall victim to “globalony”? View
the talk at: http://www.ted.com/talks/pankaj_
ghemawat_actually_the_world_isn_t_flat.html
[17.04 min].
4. “Licensing patented technology to a foreign
competitor is likely to reduce or eliminate the
firm’s competitive advantage.” True or false?
Write a paragraph discussing this statement.
WWW.YAZDANPRESS.COMWWW.YAZDANPRESS.COM

CHAPTER 10 Global Strategy: Competing Around the World 335
ignored the hidden costs of time and money try-
ing to communicate quality and design concerns
to workers across countries as well as unexpected
costs to the supply chain from natural disasters or
political threats. These factors combined with the
new economics of energy (e.g., growing supply
of natural gas) and new technologies (robotics,
artificial intelligence, 3D printing, and nanotech-
nology) are rapidly changing manufacturing and
management decisions.
Discuss the factors that managers of Apple or
GE may consider as they focus on continuous
innovation rather than the cost of manufacturing.
How might governments with an interest in gen-
erating employment opportunities try to influence
the decisions of firms? What other stakehold-
ers may have an interest in bringing jobs back
onshore and thus try to influence the decisions
of firms? Consider the persuasive arguments and
deals that might be struck. With changes to the
location of production, what might Globalization
4.0 look like?
1. A “race-to-the-bottom” process may set in as
MNEs search for ever-lower-cost locations. Dis-
cuss the trade-offs between the positive effects
of raising the standard of living in some of the
world’s poorest countries with the drawbacks
of moving jobs established in one country to
another. Does your perspective change in light of
the recent accidents in textile factories in Ban-
gladesh, Cambodia, and elsewhere, where the
cumulative death was over 1,000 workers? What
responsibilities do MNEs have?
2. Will the Globalization 3.0 strategy persist through
the 21 st century? If not, what will Globaliza-
tion 4.0 look like? Several American companies
such as Apple and GE have realized that they
miscalculated the full cost of managing far-flung
production operations and are bringing produc-
tion back to the United States. Forbes magazine
put the blame on managers who were focused on
maximizing shareholder value rather than empha-
sizing the long-term future of the firm. 87 That is,
some managers looked only at labor costs and
ETHICAL/SOCIAL ISSUES
//// Small-Group Exercise 1
(Ethical/Social Issues)
Many U.S. companies have become global players.
The technology giant IBM employs over 465,000
people and has revenues of roughly $100 billion.
Although IBM’s headquarters is in Armonk, New
York, the vast majority of its employees (more than
70 percent) actually work outside the United States.
IBM, like many other U.S.-based multinationals, now
earns the majority of its revenues (roughly two-thirds)
outside the United States (as shown in Exhibit 1.6). 88
IBM’s revenues in the BRIC countries have been
growing at between 20 and 40 percent per year, while
they have grown by only about 1 to 3 percent in devel-
oped markets such as the United States. IBM’s goal
is to obtain 35 percent of its total revenue from fast-
growing emerging economies such as the BRIC coun-
tries by 2015. To capture these opportunities, IBM
(along with many other multinational companies) has
been reducing the U.S. headcount while increasing
employment in emerging economies such as India. 89
1. Given that traditional U.S. firms such as IBM
have over 70 percent of their employees outside
the U.S. and earn almost two-thirds of their reve-
nues from outside the U.S., what is an appropriate
definition of a “U.S. firm”?
2. Is there any special consideration a firm should
have for its “home country”? Is it ethical to lay off
workers in the U.S. while hiring overseas? What
about keeping profits outside the U.S. in offshore
accounts to avoid paying corporate taxes?
//// Small-Group Exercise 2
In this exercise, we want to apply the four types of
global strategy. Imagine your group works for Clif Bar
( www.clifbar.com ). Founded in 1992, the firm makes
nutritious, all natural food and drinks for sport and
SMALL-GROUP EXERCISES
WWW.YAZDANPRESS.COMWWW.YAZDANPRESS.COM

336 CHAPTER 10 Global Strategy: Competing Around the World
operating. What is the relative distance of each to
the United States? Rank the order of the six coun-
tries in terms of relative distance.
2. Given the results from the CAGE model, do the
six chosen countries make sense? Why or why
not?
3. Can you recommend three or four other coun-
tries Clif Bar should enter? Support your
recommendations.
4. What entrance strategy should the firm employ in
expanding the business to new countries? Why?
healthy snacking. Clif Bar is a privately held com-
pany with some 200 employees. About 20 percent of
the company is owned by the employees through an
employee-stock-ownership program (ESOP). The vast
majority of Clif Bar’s sales are in the United States.
The firm has some distribution set up in Canada (since
1996) and the United Kingdom (since 2007). As of
2013, Clif Bar sells its products via the website in
six countries: Austria, Canada, Germany, Japan, New
Zealand, and Switzerland.
Review the company’s website for more informa-
tion about the firm and its products.
1. Apply the CAGE distance framework to the
six international countries where Clif Bar is
How Do You Develop
a Global Mind-Set?
H ow can you develop the skills needed to succeed as an international leader? Researchers have devel-oped a personal strategy for building a global mind-
set that will facilitate success as an effective manager in a different cultural setting. A global mind-set has three
components: intellectual capital, the understanding of how business works on a global level; psychological capital, openness to new ideas and experiences; and social capital, the ability to build connections with people and to influence stakeholders from a different cultural background. 90
Intellectual capital is considered the easiest to gain if one puts forth the effort. You can gain global business acumen by taking courses, but you can learn a great deal on your own by reading publications with an international scope such as
//// Module 10: Global Strategy
In this section, you will study your firm’s global strat-
egy, or a strategy it should pursue globally.
If your firm is already engaged in international activities, answer the following questions:
1. Is your company varying its product or service to
adapt to differences in countries? Is the marketing
approach different among the nations involved?
Should it be?
2. Is your firm working internationally to access
larger markets? To gain low-cost input factors? To
develop new competencies? Is its approach in all
three areas appropriate?
3. Which of the four global strategies is the firm
using? Is this the best strategy for it to use? Why
or why not? ( Exhibit 10.7 provides a summary of
the four global strategies.)
If your firm is not now engaged internationally, answer the following questions:
1. Would your firm’s product or service need to be
modified or marketed differently if it expanded
beyond the home country?
2. Does your firm have the potential to access larger
markets by expanding internationally? Does it
have the possibility of lowering input factors with
such expansion? Please explain why or why not.
3. If your firm decided to expand internationally,
where does the firm reside on the integration-
responsiveness framework? (Refer to Exhibit 10.5
if needed.) What does this result say about the
“best” global strategy for your firm to use for
international expansion?
STRATEGY TERM PROJECT
my STRATEGY
WWW.YAZDANPRESS.COMWWW.YAZDANPRESS.COM

CHAPTER 10 Global Strategy: Competing Around the World 337
2. Identify your weakest area, and make a list of activi-ties that will help you improve your capital in that area. After generating your own list, check out http://hbr.org/globalize-yourself-list . You will be amazed at the possibilities.
3. Identify courses you could take in international busi-ness, economics, politics, history, or art history. While you may be required to be proficient in at least one foreign language, learn a few words in other languages that can help you navigate any new countries you visit.
4. Make a list of at least six activities you could do this week in order to get started. For example, you could choose to work with international students on group projects in class. Or, move on to having lunch with them. What questions could you ask that would help you learn about their culture and about doing business in their country? You could go to a museum with an exhibit from another culture, an international movie, or a restaurant with cuisine that is new to you.
If you are interested in more information, go to http://globalmindset.thunderbird.edu/ , where you can also take a sample survey to get an idea of the degree to which you have the attributes needed for global success.
The Economist, visiting websites that provide information on different cultures or business operations in foreign countries, or simply watching television programs with an international news or culture focus. Working in global industries with people from diverse cultures is also a complex assignment, requiring the ability to manage complexity and uncertainty.
Psychological capital is gained by being receptive to new ideas and experiences and appreciating diversity. It may be the most difficult to develop, because your ability to change your personality has limits. If you are enthusiastic about adventure and are willing to take risks in new environments, then you have the attitudes needed to be energized by a foreign assignment. It takes self-confidence and a sense of humor to adapt successfully to new environments.
Social capital is based on relationships and is gained through experience. You can gain experience with diversity simply by widening your social circle, volunteering to work with international students, or by traveling on vacation or through a study abroad experience.
Now that you have a description of the three components of a global mind-set and a few ideas about how to develop the attributes necessary for global success, consider some ways you can develop a personal strategy that can be imple-mented during your college career.
1. So that you have a better idea of where you stand now, draw up a list of your strengths and weaknesses for each component.
1. “Plot change: Foreign forces transform
Hollywood films,” The Wall Street Journal, August 2, 2010.
2. This ChapterCase is based on: “Plot
change: Foreign forces transform Hollywood
films,” The Wall Street Journal; “Hollywood
squeezes stars’ pay in slump,” The Wall Street Journal, April 2, 2009; “News Corporation,”
The Economist, February 26, 2009; and
“Slumdog Millionaire wins eight Oscars,”
The Wall Street Journal, February 23, 2009;
“China gets its OWN VERSION of Iron Man
3 after Disney allows the country’s film cen-
sors onto the set,” MailOnline, April 14, 2012;
“‘Hobbit’ to break $1 billion,” Daily Variety, January 22, 2013.
3. “Foreign university students,” The Econo-mist, August 7, 2010.
4. World Bank (2013), World Develop-ment Indicators, http://data.worldbank.org/
data-catalog/world-development-indicators.
5. CAGE is an acronym for C ultural, A dmin-
istrative and political, G eographic, and E co-
nomic distance. The model was introduced by
Ghemawat, P. (2001), “Distance still matters:
The hard reality of global expansion,” Har-vard Business Review, September.
6. Stiglitz, J. (2002), Globalization and Its Discontents (New York: Norton).
7. “BRICs, emerging markets and the world
economy,” The Economist, June 18, 2009.
8. World Bank (2013), World Develop-ment Indicators, http://data.worldbank.org/
data-catalog/world-development-indicators .
9. Caves, R. (1996), Multinational Enterprise and Economic Analysis (New York: Cambridge
University Press); and Dunning, J. (1993), Mul-tinational Enterprises and the Global Economy
(Reading, MA: Addison-Wesley).
10. “Airbus’s new push: Made in the U.S.A.,”
The Wall Street Journal, July 2, 2012.
11. “GM’s latest nemesis: VW,” The Wall Street Journal, August 4, 2010.
12. Following Peng (2010: 18), we define
global strategy as a “strategy of firms around
the globe—essentially various firms’ theories
about how to compete successfully.” This
stands in contrast to a narrower alternative use
of the term “global strategy,” which implies a
global cost leadership strategy in standardized
products. We follow Peng to denote this type
of strategy as global-standardization strategy
(Peng, 2010: 20); Peng, M. W. (2010), Global Strategy, 2nd ed. (Mason, OH: Cengage).
13. Kotha, S., V. Rindova, and F. T. Rothaer-
mel (2001), “Assets and actions: Firm-specific
factors in the internationalization of U.S.
Internet firms,” Journal of International Busi-ness Studies 32: 769–791.
14. McKinsey Global Institute (2010), Growth and Competitiveness in the United States: The Role of Its Multinational Companies (London).
ENDNOTES
WWW.YAZDANPRESS.COMWWW.YAZDANPRESS.COM

338 CHAPTER 10 Global Strategy: Competing Around the World
15. IBM (2009), A Decade of Generating Higher Value at IBM, IBM report, www.ibm.
com .
16. Immelt, J. R., V. Govindarajan, and
C. Trimble (2009), “How GE is disrupting
itself,” Harvard Business Review, October;
Author’s interviews with Michael Poteran
of GE Healthcare (10/30/09 and 11/04/09);
and “Vscan handheld ultrasound: GE unveils
‘stethoscope of the 21st century,’” Huffington Post, October 20, 2009; and Govindarajan, V.,
and C. Trimble (2012), Reverse Innovation: Create Far from Home, Win Everywhere
(Boston, MA: Harvard Business Review Press).
17. This process is also referred to as reverse
innovation. Govindarajan, V., and C. Trimble
(2012), Reverse Innovation: Create Far from Home, Win Everywhere.
18. www.logitech.com . Its two founders, one
Swiss and the other Italian, each held master’s
degrees from Stanford University.
19. Saxenian, A. (1994), Regional Advantage
(Cambridge, MA: Harvard University Press);
and Rothaermel, F. T., and D. Ku (2008),
“Intercluster innovation differentials: The role
of research universities,” IEEE Transactions on Engineering Management 55: 9–22.
20. Ghemawat, P. (2011), World 3.0: Global Prosperity and How to Achieve It (Boston,
MA: Harvard Business Review Press). The
data presented are drawn from Ghemawat
(2011) and his TED talk “Actually, the world
isn’t flat,” June 2012. It is an excellent talk.
You can view it at: http://www.ted.com/talks/
pankaj_ghemawat_actually_the_world_isn_t_
flat.html .
21. The number rises to 6–7 percent if VoIP
(such as Skype) is included; Ghemawat, P.
(2012), “Actually, the world isn’t flat,” TED
talk.
22. Friedman, T. L. (2005), The World Is Flat: A Brief History of the Twenty-First Cen-tury (New York: Farrar, Strauss, and Giroux).
23. Ghemawat, P. (2011), World 3.0: Global Prosperity and How to Achieve It.
24. Ibid.
25. “The rising power of the Chinese worker,”
The Economist, July 29, 2010.
26. “Supply chain for iPhone highlights costs
in China,” The New York Times, July 5, 2010.
27. Ibid.
28. This is based on: Friedman, T. L. (2005),
The World Is Flat: A Brief History of the Twenty-First Century; “Supply chain for
iPhone highlights costs in China,” The New York Times; and “The rising power of the
Chinese worker,” The Economist.
29. Ghemawat, P. (2011), World 3.0: Global Prosperity and How to Achieve It (Boston:
Harvard Business Review Press).
30. This Strategy Highlight is based on:
quote from “2012 GM Annual Report,”
p. 6 ( www.gm.com ); “Can China save GM?”
Forbes, May 10, 2010; and Tao, Q. (2009),
“Competition in the Chinese automobile
industry,” in Peng, M. W. (2010), Global Strategy, pp. 419–425; “GM 2012 global sales
rise 2.9 percent on strong Chevy demand,”
Reuters, January 14, 2013.
31. “A special report on innovation in emerg-
ing markets,” The Economist, April 15, 2010.
32. “The rising power of the Chinese worker,”
The Economist, July 29, 2010.
33. Friedman, T. L. (2005), The World Is Flat: A Brief History of the Twenty-First Century.
34. Chang, S. J. (1995), “International expan-
sion strategy of Japanese firms: Capability
building through sequential entry,” Acad-emy of Management Journal 38: 383–407;
Vermeulen, F., and H. G. Barkema (1998),
“International expansion through start-up or
acquisition: A learning perspective,” Academy of Management Journal 41: 7–26; Vermeulen,
F., and H. G. Barkema (2002), “Pace, rhythm,
and scope: Process dependence in building a
profitable multinational corporation,” Strate-gic Management Journal 23: 637–653; and
Ghemawat, P. (2011), World 3.0: Global Pros-perity and How to Achieve It.
35. Brown, J. S., and P. Duguid (1991),
“Organizational learning and communities-of-
practice: Toward a unified view of working,
learning, and innovation,” Organization Sci-ence 2: 40–57.
36. Owen-Smith, J., and W. W. Powell
(2004), “Knowledge networks as channels
and conduits: The effects of spillovers in the
Boston biotech community,” Organization Science 15: 5–21.
37. Examples drawn from: “A special report
on innovation in emerging markets,” The Economist, April 15, 2010.
38. Dunning, J. H., and S. M. Lundan (2008),
Multinational Enterprises and the Global Economy, 2nd ed. (Northampton, MA:
Edward Elgar).
39. “A special report on innovation in emerg-
ing markets,” The Economist, April 15, 2010.
40. Zaheer, S. (1995), “Overcoming the
liability of foreignness,” Academy of Manage-ment Journal 38: 341–363.
41. This Strategy Highlight is based on: Knorr,
A., and A. Arndt (2003), “Why did Wal-Mart
fail in Germany?” in Knorr, A., A. Lemper, A.
Sell, and K. Wohlmuth (eds.), Materialien des Wissenschaftsschwerpunktes “Globalisierung der Weltwirtschaft, ” vol. 24 (IWIM—Institute
for World Economics and International Man-
agement, Universität Bremen, Germany); the
author’s onsite observations at Walmart stores
in Germany; and “Hair-shirt economics: Get-
ting Germans to open their wallets is hard,”
The Economist, July 8, 2010. For a recent
discussion of Walmart’s global efforts, see:
“After early errors, Wal-Mart thinks locally to
act globally,” The Wall Street Journal, August
14, 2009.
42. Top 100 Most Valuable Global Brands
2013,” report by Millward Brown, WPP.
43. “The Foxconn suicides,” The Wall Street Journal, May 27, 2010.
44. “When workers dream of a life beyond
the factory gates,” The Economist, December
15, 2012.
45. “Apple shifts supply chain away from
Foxconn to Pegatron,” The Wall Street Jour-nal, May 29, 2013.
46. “Disaster at Rana Plaza,” The Economist, May 4, 2013; “The Bangladesh disaster and
corporate social responsibility,” Forbes, May
2, 2013.
47. Ibid.
48. This example is drawn from: “Train mak-
ers rail against China’s high-speed designs,”
The Wall Street Journal, November 17, 2010.
49. This section is based on: Ghemawat, P.
(2001), “Distance still matters: The hard real-
ity of global expansion,” Harvard Business Review, September; see also Ghemawat, P.
(2011), World 3.0: Global Prosperity and How to Achieve It.
50. To obtain scores for any two country pair-
ings and to view interactive CAGE distance
maps, go to www.ghemawat.com .
51. The discussion of the CAGE distance
frameworks and the attributes thereof is based
on: Ghemawat, P. (2001), “Distance still mat-
ters: The hard reality of global expansion”;
see also Ghemawat, P. (2011), World 3.0: Global Prosperity and How to Achieve It.
52. Hofstede, G. H. (1984), Culture’s Conse-quences: International Differences in Work-Related Values (Beverly Hills, CA: Sage), p.
21. The description of Hofstede’s four cultural
dimensions is drawn from: Rothaermel, F. T.,
S. Kotha, and H. K. Steensma (2006), “Inter-
national market entry by U.S. Internet firms:
An empirical analysis of country risk, national
culture, and market size,” Journal of Manage-ment 32: 56–82.
53. The power-distance dimension of national
culture focuses on how a society deals with
inequality among people in terms of physical
and intellectual capabilities and how those
methods translate into power distributions
within organizations. High power-distance
cultures, like the Philippines (94/100, with
100 5 high), tend to allow inequalities among
people to translate into inequalities in oppor-
tunity, power, status, and wealth. Low power-
distance cultures, like Austria (11/100), on the
WWW.YAZDANPRESS.COMWWW.YAZDANPRESS.COM

CHAPTER 10 Global Strategy: Competing Around the World 339
other hand, tend to intervene to create a more
equal distribution among people within orga-
nizations and society at large.
The individualism dimension of national
culture focuses on the relationship between
individuals in a society, particularly in regard
to the relationship between individual and
collective pursuits. In highly individualistic
cultures, like the U.S. (91/100), individual
freedom and achievements are highly valued.
As a result, individuals are only tied loosely
to one another within society. In less-individ-
ualistic cultures, like Venezuela (12/100), the
collective good is emphasized over the indi-
vidual, and members of society are strongly
tied to one another throughout their lifetimes
by virtue of birth into groups like extended
families.
The masculinity–femininity dimension of
national culture focuses on the relationship
between genders and its relation to an indi-
vidual’s role at work and in society. In more
“masculine” cultures, like Japan (95/100),
gender roles tend to be clearly defined and
sharply differentiated. In “masculine” cul-
tures, values like competitiveness, assertive-
ness, and exercise of power are considered
cultural ideals, and men are expected to
behave accordingly. In more “feminine”
cultures, like Sweden (5/100), values like
cooperation, humility, and harmony are guid-
ing cultural principles. The masculinity–femi-
ninity dimension uncovered in Hofstede’s
research is undoubtedly evolving over time,
and values and behaviors are converging to
some extent.
The uncertainty-avoidance dimension
of national culture focuses on societal dif-
ferences in tolerance toward ambiguity and
uncertainty. In particular, it highlights the
extent to which members of a certain cul-
ture feel anxious when faced with uncertain
or unknown situations. Members of high
uncertainty-avoidance cultures, like Russia
(95/100), value clear rules and regulations as
well as clearly structured career patterns,
lifetime employment, and retirement
benefits. Members of low uncertainty-
avoidance cultures, like Singapore (8/100),
have greater tolerance toward ambiguity
and thus exhibit less emotional resistance
to change and a greater willingness to
take risks.
54. The available data on that fifth dimension
is not, at this point, as comprehensive as for
the four original dimensions.
55. This is based on: Kogut, B., and H.
Singh (1988), “The effect of national culture
on the choice of entry mode,” Journal of International Business Studies 19: 411–432;
Rothaermel, F. T., S. Kotha, and H. K.
Steensma (2006), “International market entry
by U.S. Internet firms: An empirical analysis
of country risk, national culture, and market
size”; cultural distance from the United States,
for example, is calculated as follows: where
I ij stands for the index for the i th cultural
dimension and j th country, V i is the variance
of the index of i th dimension, u indicates the
United States, and CD j is the cultural distance
difference of the j th country from the United
States.
56. Ghemawat, P. (2012), “Actually, the
world isn’t flat,” TED talk, http://www.ted.
com/talks/pankaj_ghemawat_actually_the_
world_isn_t_flat.html ; and Ghemawat, P.
(2011), World 3.0: Global Prosperity and How to Achieve It.
57. Ghemawat, P. (2001), “Distance still mat-
ters: The hard reality of global expansion.”
58. See statistics provided by Eurostat at:
http://epp.eurostat.ec.europa.eu .
59. Williamson, O. E. (1975), Markets and Hierarchies (New York: Free Press); Wil-
liamson, O. E. (1981), “The economics of
organization: The transaction cost approach,”
American Journal of Sociology 87: 548–577;
and Williamson, O. E. (1985), The Economic Institutions of Capitalism (New York: Free
Press).
60. Ghemawat, P. (2001), “Distance still mat-
ters: The hard reality of global expansion.”
61. “Bad roads, red tape, burly thugs slow
Walmart’s passage in India,” The Wall Street Journal, January 11, 2013.
62. Johanson, J., and J. Vahlne (1977), “The
internationalization process of the firm,”
Journal of International Business Studies 4:
20–29.
63. Fuller, A. W., and F. T. Rothaermel
(2008), “The interplay between capability
development and strategy formation: Motor-
ola’s entry into China,” Georgia Institute of
Technology Working Paper.
64. Levitt, T. (1983), “The globalization of
markets,” Harvard Business Review, May–
June: 92–102.
65. Ibid., p. 93.
66. Mol, M. (2002), “Ford Mondeo: A Model
T world car?” in Tan, F. B. (ed.), Cases on Global IT Applications and Management: Successes and Pitfalls, pp. 69–89.
67. Prahalad, C. K., and Y. L. Doz (1987),
The Multinational Mission (New York: Free
Press); and Roth, K., and A. J. Morrison
(1990), “An empirical analysis of the inte-
gration-responsiveness framework in global
industries,” Journal of International Business Studies 21: 541–564.
68. Bartlett, C. A., S. Ghoshal, and P. W.
Beamish (2007), Transnational Manage-ment: Text, Cases and Readings in Cross-Border Management, 5th ed. (Burr Ridge, IL:
McGraw-Hill).
69. “Ditch the knock-off watch, get the
knock-off car,” The Wall Street Journal Video, August 8, 2010.
70. www.lenovo.com/lenovo/US/en/locations.
html .
71. Ibid.
72. Ghemawat, P. (2011), World 3.0: Global Prosperity and How to Achieve It.
73. Mueller, H.-E. (2001), “Developing
global human resource strategies,” paper pre-
sented at the European International Business
Academy, Paris, December 13–15; Mueller,
H.-E. (2001), “Wie Global Player den Kampf
um Talente führen,” Harvard Business Man-ager 6: 16–25.
74. This section draws on: Rothaermel, F. T.,
and D. Ku (2008), “Intercluster innovation
differentials: The role of research universi-
ties,” IEEE Transactions on Engineering Man-agement 55: 9–22.
75. This is based on: Buckley, P. J., and
P. N. Ghauri (2004), “Globalisation, economic
geography and the strategy of multinational
enterprises,” Journal of International Business Studies 35: 81–98; Cairncross, F. (1997), The Death of Distance: How the Communications Revolution Will Change Our Lives (Boston,
MA: Harvard Business School Press); and
Friedman, T. L. (2005), The World Is Flat: A Brief History of the Twenty-First Century. For a counterpoint, see: Ghemawat, P. (2001),
“Distance still matters: The hard reality of
global expansion”; Ghemawat, P. (2007),
Redefining Global Strategy: Crossing Borders in a World Where Differences Still Matter
(Boston, MA: Harvard Business School
Press); and Ghemawat, P. (2011), World 3.0: Global Prosperity and How to Achieve It.
76. This section is based on: Porter, M.
E. (1990), “The competitive advantage of
nations,” Harvard Business Review, March–
April: 73–91; and Porter, M. E. (1990), The Competitive Advantage of Nations (New York:
Free Press).
77. “U.S. identifies vast mineral riches in
Afghanistan,” The New York Times, June 13,
2010.
78. For an insightful recent discussion, see:
Breznitz, D. (2007), Innovation and the State: Political Choice and Strategies for Growth in Israel, Taiwan, and Ireland (New Haven, CT:
Yale University Press).
79. More recently, however, Nokia has ceded
leadership to RIM (Canada). Currently, Apple
and Samsung (South Korea) are the leaders in
the smartphone industry.
80. Dyer, J. H., and K. Nobeoka (2000),
“Creating and managing a high-performance
knowledge-sharing network: The Toyota
case,” Strategic Management Journal 21:
345–367.
WWW.YAZDANPRESS.COMWWW.YAZDANPRESS.COM

340 CHAPTER 10 Global Strategy: Competing Around the World
81. This discussion is based on: “Toyota slips
up,” The Economist, December 10, 2009;
“Toyota: Losing its shine,” The Economist, December 10, 2009; “Toyota heir faces crises
at the wheel,” The Wall Street Journal, Janu-
ary 27, 2010; “Toyota’s troubles deepen,” The Economist, February 4, 2010; “The humbling
of Toyota,” Bloomberg Businessweek, March
11, 2010; and “Inside Toyota, executives trade
blame over debacle,” The Wall Street Journal, April 13, 2010.
82. Porter, M. E. (1990), The Competitive Advan-tage of Nations (New York: Free Press), p. 77.
83. “Ending the open season on artists,” The Economist, February 17, 2011.
84. Levin, D., and J. Horn (2011), “DVD
pirates running rampant in China,”
Los Angeles Times, March, 22.
85. Ibid.
86. “Bigger abroad,” The Economist, February 17, 2011.
87. “Why Apple and GE are bringing back
manufacturing,” Forbes, December 7, 2012.
88. IBM Annual Reports, various years.
89. “IBM to cut U.S. jobs, expand in India,”
The Wall Street Journal, March 26, 2009.
90. This my Strategy item is based on an
article by Javidan, M., M. Teagarden, and
D. Bowen, (2010), “Making it overseas,”
Harvard Business Review, April, vol. 88 (4):
109–113.
WWW.YAZDANPRESS.COMWWW.YAZDANPRESS.COM
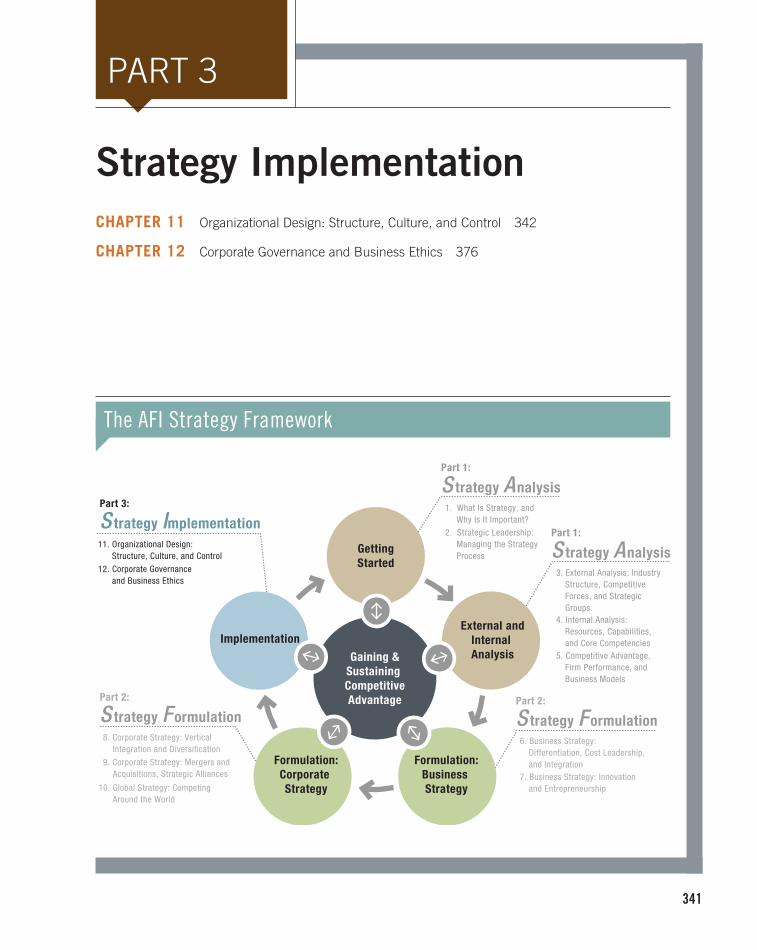
341
PART 3
Strategy Implementation
CHAPTER 11 Organizational Design: Structure, Culture, and Control 342
CHAPTER 12 Corporate Governance and Business Ethics 376
The AFI Strategy Framework
1. What Is Strategy, and Why Is It Important?
3. External Analysis: Industry Structure, Competitive Forces, and Strategic Groups4. Internal Analysis: Resources, Capabilities, and Core Competencies5. Competitive Advantage, Firm Performance, and Business Models
6. Business Strategy: Differentiation, Cost Leadership, and Integration7. Business Strategy: Innovation and Entrepreneurship
8. Corporate Strategy: Vertical Integration and Diversification
9. Corporate Strategy: Mergers and Acquisitions, Strategic Alliances
10. Global Strategy: Competing Around the World
11. Organizational Design: Structure, Culture, and Control
Getting
Started
External and
Internal
Analysis
Formulation:
Business
Strategy
Formulation:
Corporate
Strategy
Implementation
Gaining &
Sustaining
Competitive
Advantage
12. Corporate Governance and Business Ethics
2. Strategic Leadership: Managing the Strategy Process
Part 1:
S trategy Analysis
Part 1:
S trategy Analysis
Part 2:
S trategy Formulation
Part 2:
S trategy Formulation
Part 3:
S trategy Implementation
WWW.YAZDANPRESS.COMWWW.YAZDANPRESS.COM

342
Chapter Outline
11.1 How to Organize for Competitive Advantage Organizational Inertia and the Failure of Established Firms The Key Elements of Organizational Structure Assembling the Pieces: Mechanistic vs. Organic Organizations
11.2 Matching Strategy and Structure Simple Structure Functional Structure Multidivisional Structure Matrix Structure
11.3 Organizational Culture: Values, Norms, and
Artifacts Where Do Organizational Cultures Come From? How Does Organizational Culture Change? Organizational Culture and Competitive Advantage
11.4 Strategic Control-and-Reward Systems Input Controls Output Controls
11.5 Implications for the Strategist
Learning Objectives
After studying this chapter, you should be able to:
LO 11-1 Define organizational design and list its three components.
LO 11-2 Explain how organizational inertia can lead established firms to failure.
LO 11-3 Define organizational structure and describe its four elements.
LO 11-4 Compare and contrast mechanistic versus organic organizations.
LO 11-5 Describe different organizational structures and match them with appropriate strategies.
LO 11-6 Describe the elements of organizational culture, and explain where organizational cultures can come from and how they can be changed.
LO 11-7 Compare and contrast different strategic control-and-reward systems.
Chapter 11
Organizational Design: Structure, Culture, and Control
WWW.YAZDANPRESS.COMWWW.YAZDANPRESS.COM
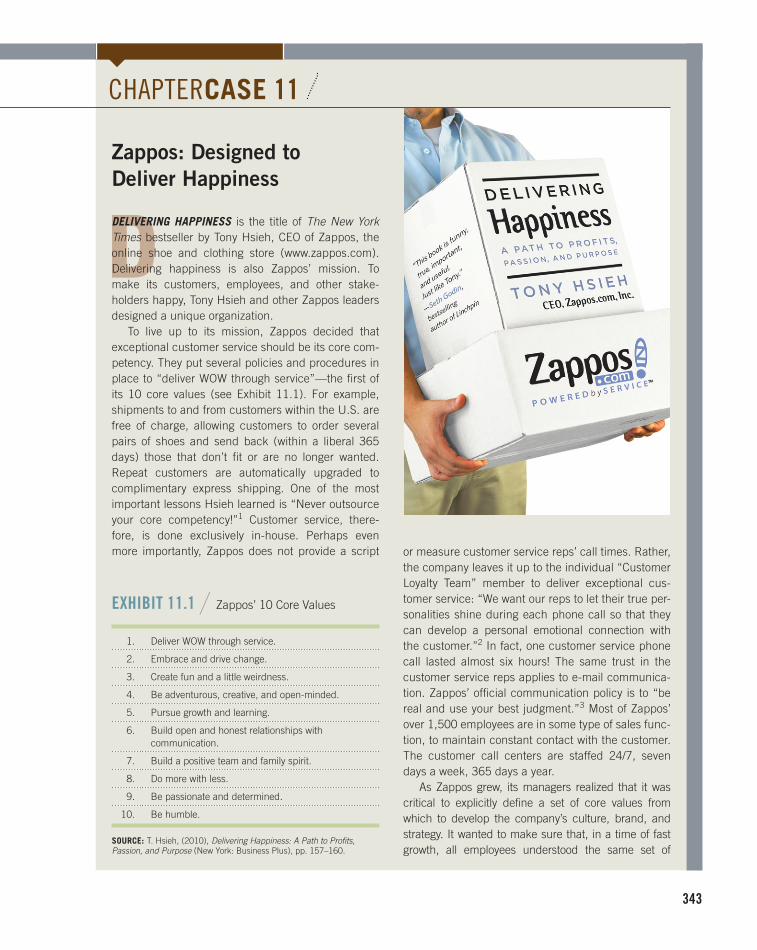
343
D Zappos: Designed to
Deliver Happiness
D ELIVERING HAPPINESS is the title of The New York Times bestseller by Tony Hsieh, CEO of Zappos, the online shoe and clothing store ( www.zappos.com ). Delivering happiness is also Zappos’ mission. To make its customers, employees, and other stake-holders happy, Tony Hsieh and other Zappos leaders designed a unique organization.
To live up to its mission, Zappos decided that exceptional customer service should be its core com-petency. They put several policies and procedures in place to “deliver WOW through service”—the first of its 10 core values (see Exhibit 11.1 ). For example, shipments to and from customers within the U.S. are free of charge, allowing customers to order several pairs of shoes and send back (within a liberal 365 days) those that don’t fit or are no longer wanted. Repeat customers are automatically upgraded to complimentary express shipping. One of the most important lessons Hsieh learned is “Never outsource your core competency!” 1 Customer service, there-fore, is done exclusively in-house. Perhaps even more importantly, Zappos does not provide a script or measure customer service reps’ call times. Rather,
the company leaves it up to the individual “Customer Loyalty Team” member to deliver exceptional cus-tomer service: “We want our reps to let their true per-sonalities shine during each phone call so that they can develop a personal emotional connection with the customer.” 2 In fact, one customer service phone call lasted almost six hours! The same trust in the customer service reps applies to e-mail communica-tion. Zappos’ official communication policy is to “be real and use your best judgment.” 3 Most of Zappos’ over 1,500 employees are in some type of sales func-tion, to maintain constant contact with the customer. The customer call centers are staffed 24/7, seven days a week, 365 days a year.
As Zappos grew, its managers realized that it was critical to explicitly define a set of core values from which to develop the company’s culture, brand, and strategy. It wanted to make sure that, in a time of fast growth, all employees understood the same set of
CHAPTER CASE 11
1. Deliver WOW through service.
2. Embrace and drive change.
3. Create fun and a little weirdness.
4. Be adventurous, creative, and open-minded.
5. Pursue growth and learning.
6. Build open and honest relationships with communication.
7. Build a positive team and family spirit.
8. Do more with less.
9. Be passionate and determined.
10. Be humble.
EXHIBIT 11.1 / Zappos’ 10 Core Values
SOURCE: T. Hsieh, (2010), Delivering Happiness: A Path to Profits, Passion, and Purpose (New York: Business Plus), pp. 157–160.
WWW.YAZDANPRESS.COMWWW.YAZDANPRESS.COM

344
Z APPOS’ CEO, TONY Hsieh, believes that soon 30 percent of all retail transactions
in the U.S. will be online, and that people will buy from the company with the best
customer service and best selection. The strategic intent for Zappos is to be that online
store. Tony Hsieh and other Zappos employees thought long and hard about what type
of structure, culture, and processes to put in place that would support the firm’s strategic
goals. They proactively designed a flat organization that enabled them to implement its
differentiation strategy effectively. Zappos’ managers further refined their organizational
design through trial-and-error, being transparent, and soliciting bottom-up feedback, while
making the tough strategic decisions of what not to do.
Chapter Case 11 brings us to the final piece of the AFI framework: strategy implementa-
tion. Strategy implementation concerns the organization, coordination, and integration of
strategy
implementation The part of the strategic management process that concerns the organization, coordination, and integration of how work gets done. It is key to gaining and sustaining competitive advantage.
values and expected behaviors. Zappos’ list of 10 core values was crafted through a bottom-up initiative, in which all employees were invited to participate. Zappos also restructured its performance-evaluation system to give these values “teeth”: The firm rewards employees who apply the values well in their day-to-day decision making. In this way, Zappos’ managers directly con-nected the informal cultural control system to the for-mal reward system. CEO Tony Hsieh states, “Ideally, we want all 10 core values to be reflected in everything we do, including how we interact with each other, how we interact with our customers, and how we interact with our vendors and business partners. . . . Our core values should always be the framework from which we make all of our decisions.” 4
When establishing customer service as a core com-petency, one of the hardest decisions Tony Hsieh made was to pull the plug on drop-shipment orders. These are orders for which Zappos would be the intermediary, relaying them to particular shoe vendors who then ship directly to the customer. Such orders were very profit-able because Zappos would not have to stock all the shoes. They were also appealing because the fledgling startup was still losing money. The problem was two-fold. The vendors were slower than Zappos in filling orders. In addition, they did not accomplish the reli-ability metric that Zappos wanted for exceptional ser-vice: 95 percent accuracy was simply not good enough! Instead, Zappos decided to forgo drop shipments and instead built a larger warehouse in Kentucky to stock a full inventory. This move enabled the firm to achieve close to 100 percent accuracy in its shipments, many of which were overnight. Unlike other online retailers, Zap-pos stocks everything it sells in its own warehouses—this is the only way to get the merchandise as quickly as possible with 100 percent accuracy to the customer.
In addition to making customers happy, Zappos also works to keep its own employees happy. Although it employs more than 1,500 people, Zappos’ organiza-tional structure is extremely flat. Once an employee has mastered a job, he or she is rotated to a different job, often horizontally. This system allows Zappos to cre-ate a large pool of trained talent, and makes it easier to promote from within. In keeping with another of its core values, “Create fun and a little weirdness,” the Las Vegas–based startup offers employees “free” lunches, employer-paid health care benefits, a designated nap room, concierge service, an onsite life coach who is also a chiropractor, a library of books on happiness (along with other bestsellers), onsite seminars on per-sonal growth, and fun events such as pajama parties at work. In 2011, Zappos was ranked #6 in Fortune ’s “100 Best Companies to Work For” list (the highest ranking for a relatively young firm).
Finally, Zappos has also made its investors happy. In 2008, just 10 years after its founding, Zappos achieved over $1 billion in annual sales. In 2009, Amazon acquired the startup in a deal valued at $1.2 billion. Although now a subsidiary of Amazon, Zappos contin-ues to operate as an independent brand. Indeed, Zap-pos has grown so much—receiving 10 million website hits a day—that it reorganized to continue to offer the best customer service possible. To keep the organiza-tion flat and responsive to customers, Zappos restruc-tured into 10 separate units such as Zappos.com, Zappos Gift Cards, Zappos IP, and 6pm.com, among others. Today, Zappos.com stocks over three million shoes, handbags, and clothing items from some 1,200 brands. 5
After reading the chapter, you will find more about this case, with related questions, on page 367.
WWW.YAZDANPRESS.COMWWW.YAZDANPRESS.COM
CHAPTER 11 Organizational Design: Structure, Culture, and Control 345
how work gets done. It is key to gaining and sustaining competitive advantage. Although
the discussion of strategy formulation (what to do) is distinct from strategy implementa-
tion (how to do it), formulation and implementation must be part of an interdependent,
reciprocal process in order to ensure continued success. That need for interdependence is
why the AFI framework is illustrated as a circle, rather than a linear diagram. The design
of an organization, the matching of strategy and structure, and its control-and-reward sys-
tems determine whether an organization that has chosen an effective strategy will thrive or
wither away.
In this chapter, we study the three key levers that managers have at their disposal when
designing their organizations for competitive advantage: structure, culture, and control. We
begin our discussion with organizational structure. We discuss different types of organiza-
tional structures as well as why and how they need to change over time as successful firms
grow in size and complexity. We highlight the critical need to match strategy and structure,
and then dive into corporate culture. An organization’s culture can either support or hinder
its quest for competitive advantage. 6 We next study strategic control systems, which allow
managers to receive feedback on how well a firm’s strategy is being implemented. We
conclude our discussion of how to design an organization for competitive advantage with
practical implications for the strategist.
Managers employ these three levers—structure, culture, and control—to coordinate
work and motivate employees across different levels, functions, and geographies. How
successful they are in this endeavor determines whether they are able to translate their cho-
sen business, corporate, and global strategies into strategic actions and business models,
and ultimately whether the firm is able to gain and sustain a competitive advantage.
11.1 How to Organize for Competitive Advantage
Organizational design is the process of creating, implementing, monitoring, and modify-
ing the structure, processes, and procedures of an organization. The key components of
organizational design are structure, culture, and control. The goal is to design an organiza-
tion that allows managers to effectively translate their chosen strategy into a realized one.
Simply formulating an effective strategy is a necessary but not sufficient condition for
gaining and sustaining competitive advantage. Some argue that strategy execution is more
important. 7 Often, managers do a good job of analyzing the firm’s internal and external
environments to formulate a promising business, corporate, and global strategy, but then
fail to implement the chosen strategy successfully. That is why some scholars refer to
implementation as the “graveyard of strategy.” 8
Not surprisingly, the inability to implement strategy effectively is the number-one rea-
son boards of directors fire CEOs. 9 Yahoo’s co-founder and CEO Jerry Yang was ousted in
2008 precisely because he failed to implement necessary strategic changes after Yahoo lost
its competitive advantage. 10 In the two years leading up to his exit, Yahoo lost more than
75 percent of its market value. Mr. Yang was described as someone who preferred consen-
sus among his managers to making tough strategic decisions needed to change Yahoo’s
structure. That preference, though, led to bickering and infighting. Jerry Yang’s failure to
make the necessary changes to the Internet firm’s organizational structure not only led to
a destruction of billions in shareholder value and thousands of layoffs, but also cost him
his job. Once a leader in online search, Yahoo is struggling to make a comeback. A num-
ber of short-term and interim CEOs followed Jerry Yang without much success. In 2012,
former Google executive Marissa Mayer was appointed president and CEO of Yahoo.
Ms. Mayer’s turnaround efforts at Yahoo are focused on improving the user experience,
thus driving online advertising revenues. 11
LO 11-1
Define organizational design and list its three components.
organizational design
The process of creating, implementing, monitoring, and modifying the structure, processes, and procedures of an organization.
WWW.YAZDANPRESS.COMWWW.YAZDANPRESS.COM

346 CHAPTER 11 Organizational Design: Structure, Culture, and Control
Because strategy implementation transforms strategy into actions and business models,
it often requires changes within the organization. However, strategy implementation often
fails because managers are unable to make the necessary changes due to its effects on
resource allocation and power distribution within an organization. 12
As demonstrated by business historian Alfred Chandler in his seminal book Strategy and Structure, organizational structure must follow strategy in order for firms to achieve
superior performance: “Structure can be defined as the design of organization through
which the enterprise is administered . . . the thesis deduced [from studying the adminis-
trative history of DuPont, GM, Sears Roebuck, and Standard Oil from the early to mid-
1900s] is that structure follows strategy. ” 13 This tenet implies that to implement a strategy
successfully, organizational design must be flexible enough to accommodate the formu-
lated strategy and future growth and expansion. Featured in the Chapter Case, Zappos pro-
vides an example of a company with flexible organizational structure. To maintain its core
competency of providing a superior customer experience in the face of explosive growth,
Zappos split the organization into 10 standalone units.
ORGANIZATIONAL INERTIA AND THE FAILURE OF ESTABLISHED FIRMS
In reality, however, a firm’s strategy often follows its structure. 14 This reversal implies
that some managers consider only strategies that do not change existing organizational
structures; they do not want to confront the inertia that often exists in established organiza-
tions. 15 Inertia, a firm’s resistance to change the status quo, can set the stage for the firm’s
subsequent failure. Successful firms often plant the seed of subsequent failure: They opti-
mize their organizational structure to the current situation. That tightly coupled system can
break apart when internal or external pressures occur.
Exhibit 11.2 shows how success in the current environment can lead to a firm’s downfall
in the future, when the tightly coupled system of strategy and structure experiences inter-
nal or external shifts. 16 First, the managers achieve a mastery of, and fit with, the firm’s
current environment. Second, the firm often defines and measures success by financial
metrics, with a focus on short-term performance. (See the discussion of firm performance
in Chapter 5.) Third, the firm puts in place metrics and systems to accommodate and man-
age increasing firm size due to continued success. Finally, as a result of a tightly coupled
(albeit successful) system, organizational inertia sets in—and with it, resistance to change.
Such a tightly coupled system is prone to break apart when external and internal shifts
put pressure on the system. 17 In Exhibit 11.2 , the blue arrows show the firm’s tightly coupled
organizational design. The light gray arrows indicate pressures emanating from internal shifts
such as accelerated growth, a change in the business model, entry into new markets, a change
in the top management team (TMT), or mergers and acquisitions. The dark gray arrows indi-
cate external pressures, which can stem from any of the PESTEL forces (political, economic,
sociocultural, technological, ecological, and legal, as discussed in Chapter 3). Strong external
or internal pressure can break apart the current system, which may lead to firm failure.
THE KEY ELEMENTS OF ORGANIZATIONAL STRUCTURE
Some of the key decisions managers must make when designing effective organizations per-
tain to the firm’s organizational structure . That structure determines how the work efforts of
individuals and teams are orchestrated and how resources are distributed. In particular, an orga-
nizational structure defines how jobs and tasks are divided and integrated, delineates the report-
ing relationships up and down the hierarchy, defines formal communication channels, and
LO 11-3
Define organizational structure and describe its four elements.
organizational
structure A key building block of organizational design that determines how the work efforts of individuals and teams are orchestrated and how resources are distributed.
LO 11-2
Explain how organizational inertia can lead established firms to failure.
WWW.YAZDANPRESS.COMWWW.YAZDANPRESS.COM

CHAPTER 11 Organizational Design: Structure, Culture, and Control 347
prescribes how individuals and teams coordinate their work efforts. The key building blocks
of an organizational structure are specialization, formalization, centralization, and hierarchy. Specialization describes the degree to which a task is divided into separate jobs—that
is, the division of labor. Larger firms, such as Fortune 100 companies, tend to have a high
degree of specialization; smaller entrepreneurial ventures tend to have a
low degree of specialization. For example, an accountant for a large firm
may specialize in only one area (e.g., internal audit), whereas an accountant
in a small firm needs to be more of a generalist and take on many different
things (e.g., not only internal auditing, but also payroll, accounts receivable,
financial planning, and taxes). Specialization requires a trade-off between
breadth and depth of knowledge. While a high degree of the division of
labor increases productivity, it can also have unintended side-effects such as
reduced employee job satisfaction due to repetition of tasks.
Formalization captures the extent to which employee behavior is steered
by explicit and codified rules and procedures. Formalized structures are char-
acterized by detailed written rules and policies of what to do in specific sit-
uations. These are often codified in employee handbooks. McDonald’s, for
example, uses detailed standard operating procedures throughout the world to
ensure consistent quality and service. Don Thompson, McDonald’s Corpora-
tion President and CEO, formalized the company’s strategy by focusing on
three key priorities in the company’s Plan to Win: to optimize the menu, mod-
ernize the customer experience, and broaden restaurant accessibility. 18
(1)Mastery of, andFit with, Current
Environment
(3)Measures to
Accommodate and Manage Size
(4)Organizational
Inertia
(2)Success, Usually
Measured by Financial Metrics
Internal Shifts:
- Accelerated growth - Change in business model - Entry into new markets - Change in TMT - Mergers and acquisitions
External Shifts:
- PESTEL factorsExternal Shifts:
- PESTEL factors
External Shifts:
- PESTEL factors
EXHIBIT 11.2 /
Organizational Inertia and the Failure of Established Firms When External or Internal Environments Shift
specialization An element of organizational structure that describes the degree to which a task is divided into separate jobs (i.e., the division of labor).
formalization An element of organizational structure that captures the extent to which employee behavior is steered by explicit and codified rules and procedures.
Don Thompson, McDonald’s Corporation President and CEO
WWW.YAZDANPRESS.COMWWW.YAZDANPRESS.COM

348 CHAPTER 11 Organizational Design: Structure, Culture, and Control
Formalization, therefore, is not necessarily negative; often it is necessary to achieve
consistent and predictable results. Airlines, for instance, must rely on a high degree of
formalization to instruct pilots on how to fly their airplanes in order to ensure safety and
reliability. Yet a high degree of formalization can slow decision making, reduce creativity
and innovation, and hinder customer service. 19 Most customer service reps in call cen-
ters, for example, follow a detailed script. This is especially true when call centers are
outsourced to overseas locations. As highlighted in the Chapter Case, Zappos deliberately
avoided this approach when it made customer service its core competency. W. L. Gore uses
an extremely informal organizational structure to foster employee satisfaction, retention,
and creativity, as discussed in Strategy Highlight 11.1.
Centralization refers to the degree to which decision making is concentrated at the
top of the organization. Centralized decision making often correlates with slow response
time and reduced customer satisfaction. In decentralized organizations such as W. L. Gore
or Zappos, decisions are made and problems solved by empowered lower-level employ-
ees who are closer to the sources of issues. Different strategic management processes
(discussed in Chapter 2) match with different degrees of centralization. Top-down strategic
centralization An element of organizational structure that refers to the degree to which decision making is concentrated at the top of the organization.
W. L. Gore & Associates:
Informality and Innovation
W. L. Gore & Associates is the inventor of path-breaking new products such as breathable GORE-TEX fabrics, Glide dental floss, and Elixir guitar strings. Bill Gore, a former long-time employee of chemical giant DuPont, founded the company with the vision to create an organization “devoted to innovation, a company where imagination and initiative would flourish, where chronically curious engineers would be free to invent, invest, and succeed.” 20 When founding the company in 1958, Bill Gore articulated four core values that still guide the company and its asso-ciates to this day:
1. Fairness to each other and everyone with whom the firm does business
2. Freedom to encourage, help, and allow other associates to grow in knowledge, skill, and scope of responsibility
3. The ability to make one’s own commitments and keep them
4. Consultation with other associates before undertak-ing actions that could cause serious damage to the reputation of the company (“blowing a hole below the waterline”)
W. L. Gore & Associates is organized in an informal and decentralized manner: It has no formal job titles, job descriptions, chains of command, formal communication
channels, written rules or standard operating procedures. Face-to-face communication is preferred over e-mail. There is no organizational chart. In what is called a lattice or boundaryless organizational form, everyone is empow-ered and encouraged to speak to anyone else in the orga-nization. People who work at Gore are called “associates” rather than employees, indicating professional expertise and status. Gore associates organize themselves in project-based teams that are led by sponsors, not bosses. Associ-ates invite other team members based on their expertise and interests in a more or less ad hoc fashion. Peer control in these multidisciplinary teams further enhances associ-ate productivity. Group members evaluate each other’s per-formance annually, and these evaluations determine each associate’s level of compensation. Moreover, all associates at W. L. Gore are also shareholders of the company, and thus are part owners sharing in profits and losses.
Gore’s freewheeling and informal culture has been linked to greater employee satisfaction and retention, higher personal initiative and creativity, and innovation at the firm level. Although W. L. Gore’s organizational structure may look like something you might find in a small, high-tech startup company, the company has 10,000 employees and over $2.5 billion in revenues, making Gore one of the largest privately held companies in the United States. W. L. Gore is consistently ranked in the top 25 of Fortune ’s “100 Best Companies to Work For” list (#21 in 2013), and has been included in every edition of that prestigious ranking. 21
11.1
WWW.YAZDANPRESS.COMWWW.YAZDANPRESS.COM
CHAPTER 11 Organizational Design: Structure, Culture, and Control 349
planning takes place in highly centralized organizations, whereas planned emergence is
found in more decentralized organizations.
Whether centralization or decentralization is more effective depends on the specific sit-
uation. During the Gulf oil spill in 2010, BP’s response was slow and cumbersome because
key decisions were initially made in its UK headquarters and not onsite. In this case, cen-
tralization reduced response time and led to a prolonged crisis. In contrast, the FBI and the
CIA were faulted in the 9/11 Commission Report for not being centralized enough. 22 The
report concluded that although each agency had different types of evidence that a terrorist
strike in the U.S. was imminent, their decentralization made them unable to put together
the pieces to prevent the 9/11 attacks.
Hierarchy determines the formal, position-based reporting lines and thus stipulates who reports to whom. Let’s assume two firms of roughly equal size: Firm A and Firm B. If many
levels of hierarchy exist between the front-line employee and the CEO in Firm A, it has a
tall structure. In contrast, if there are few levels of hierarchy in Firm B, it has a flat structure. The number of levels of hierarchy, in turn, determines the managers’ span of control —
how many employees directly report to a manager. In tall organizational structures (Firm
A), the span of control is narrow. In flat structures (Firm B), the span of control is wide,
meaning one manager supervises many employees. In recent years, firms have de-layered
by reducing the headcount (often middle managers), making themselves flatter and more
nimble. This, however, puts more pressure on the remaining managers who have to super-
vise and monitor more direct reports due to an increased span of control. 23 Recent research
suggests that managers are most effective at an intermediate point where the span of con-
trol is not too narrow or too wide. 24
ASSEMBLING THE PIECES: MECHANISTIC VS. ORGANIC ORGANIZATIONS
Several of the building blocks of organizational structure frequently show up together, cre-
ating distinct organizational forms—organic and mechanistic organizations. 25
Zappos and W. L. Gore are both examples of organic organizations . Such organiza-
tions have a low degree of specialization and formalization, a flat organizational struc-
ture, and decentralized decision making. 26 Organic structures tend to be correlated with
the following: a fluid and flexible information flow among employees in both horizontal
and vertical directions; faster decision making; and higher employee motivation, retention,
satisfaction, and creativity. Organic organizations also typically exhibit a higher rate of
entrepreneurial behaviors and innovation. Organic structures allow firms to foster R&D
and/or marketing, for example, as a core competency. Thus, firms that pursue a differen-
tiation strategy at the business level frequently employ an organic structure. Exhibit 11.3
highlights the key features of organic organizations.
Due to significant advances in information technology, organic organizations frequently
use virtual teams. In these teams, geographically dispersed team members are able to col-
laborate through electronic communications such as e-mail, instant messaging, intranets,
and teleconferencing. 27 Given time differences, virtual teams often organize work flow so
that projects can be pushed forward 24 hours a day, seven days a week. Use of virtual work
LO 11-4
Compare and contrast mechanistic versus organic organizations.
hierarchy An element of organizational structure that determines the formal, position-based reporting lines and thus stipulates who reports to whom.
span of control The number of employees who directly report to a manager.
organic organization
Organizational form characterized by a low degree of specialization and formalization, a flat organizational structure, and decentralized decision making.
WWW.YAZDANPRESS.COMWWW.YAZDANPRESS.COM

350 CHAPTER 11 Organizational Design: Structure, Culture, and Control
and collaboration technologies has enabled companies to be more nimble and to employ
flatter and more decentralized organizational structures. Research data show that the larg-
est 30 companies by market capitalization used networked digital technologies to double
productivity per employee, despite more than doubling the number of employees. In the
decades prior to the widespread use of computer-mediated work, employee productivity
remained more or less flat. 28
Mechanistic organizations are characterized by a high degree of specialization and
formalization, and a tall hierarchy that relies on centralized decision making. The fast-
food chain McDonald’s fits this description quite well. Each step of every job (such as
deep-frying fries) is documented in minute detail (e.g., what kind of vat, the quantity of
oil, how many fries, what temperature, how long, and so on). Decision power is central-
ized at the top of the organization: McDonald’s headquarters provides detailed instructions
to each of its franchisees so that they provide comparable quality and service across the
board (although with some local menu variations). Communication and authority lines
are top-down and well defined. To ensure standardized operating procedures and consis-
tent food quality throughout the world, McDonald’s operates Hamburger University, a
state-of-the-art teaching facility in a Chicago suburb, where 50 full-time instructors teach
courses in chemistry, food preparation, and marketing. In 2010, McDonald’s opened a
second Hamburger University campus in Shanghai, China. Mechanistic structures allow
for standardization and economies of scale, and often are used when the firm pursues a
cost-leadership strategy at the business level (again, see Exhibit 11.3 ).
Although at first glance organic organizations may appear to be more attractive than
mechanistic ones, their relative effectiveness depends on context. McDonald’s, with its
mechanistic
organization
Organizational form characterized by a high degree of specialization and formalization, and a tall hierarchy that relies on centralized decision making.
EXHIBIT 11.3 / Mechanistic vs. Organic Organizations: The Building Blocks of Organizational Structure
Mechanistic Organizations Organic Organizations
Specialization • High degree of specialization
• Rigid division of labor
• Employees focus on narrowly defined tasks
• Low degree of specialization
• Flexible division of labor
• Employees focus on “bigger picture”
Formalization • Intimate familiarity with rules, policies, and processes necessary
• Deep expertise in narrowly defined domain required
• Task-specific knowledge valued
• Clear understanding of organization’s core competencies and strategic intent
• Domain expertise in different areas
• Generalized knowledge of how to accomplish strategic goals valued
Centralization • Decision power centralized at top
• Vertical (top-down) communication
• Distributed decision making
• Vertical (top-down and bottom-up) as well as horizontal communication
Hierarchy • Tall structures
• Low span of control
• Clear lines of authority
• Command and control
• Flat structures
• High span of control
• Horizontal as well as two-way vertical communication
• Mutual adjustment
Business Strategy • Cost-leadership strategy
• Examples: McDonald’s; Walmart
• Differentiation strategy
• Examples: W. L. Gore, Zappos
WWW.YAZDANPRESS.COMWWW.YAZDANPRESS.COM

CHAPTER 11 Organizational Design: Structure, Culture, and Control 351
over 34,000 restaurants across the globe, would not be successful with an organic struc-
ture. Similarly, a mechanistic structure would not allow Zappos or W. L. Gore to develop
and hone their respective core competencies in customer service and product innovation.
The key point is this: To gain and sustain competitive advantage, structure must follow
strategy. Moreover, the chosen organizational form must match the firm’s business strategy.
We will expand further on the required strategy-structure relationship in the next section.
11.2 Matching Strategy and Structure
The important and interdependent relationship between strategy and structure directly
impacts a firm’s performance. Moreover, the relationship is dynamic—changing over
time in a predictable pattern as firms grow in size and complexity. Successful new ven-
tures generally grow first by increasing sales, then by obtaining larger geographic reach,
and finally by diversifying through vertical integration and entering into related and unre-
lated businesses. 29 Different stages in a firm’s growth require different organizational
structures. This important evolutionary pattern is depicted in Exhibit 11.4 . As we will
discuss next, organizational structures range from simple to functional to multidivisional
to matrix.
SIMPLE STRUCTURE
A simple structure generally is used by small firms with low organizational complex-
ity. In such firms, the founders tend to make all the important strategic decisions and run
the day-to-day operations. Examples include entrepreneurial ventures such as Facebook in
2004, when the startup operated out of Mark Zuckerberg’s dorm room, and professional
service firms such as smaller advertising, consulting, accounting, and law firms, as well as
family-owned businesses. Simple structures are flat hierarchies operated in a decentralized
fashion. They exhibit a low degree of formalization and specialization. Typically, neither
professional managers nor sophisticated systems are in place, which often leads to an over-
load for the founder and/or CEO when the firms experience growth.
FUNCTIONAL STRUCTURE
As sales increase, firms generally adopt
a functional structure , which groups
employees into distinct functional areas
based on domain expertise. These func-
tional areas often correspond to distinct
stages in the company value chain such
as R&D, engineering and manufacturing,
and marketing and sales, as well as sup-
porting areas such as human resources,
finance, and accounting. Exhibit 11.5
shows a functional structure, with the
lines indicating reporting and authority
relationships. The department head of
each functional area reports to the CEO,
who coordinates and integrates the work
of each function. A business school stu-
dent generally majors in one of these
simple structure
Organizational structure in which the founders tend to make all the important strategic decisions as well as run the day-to-day operations.
functional structure
Organizational structure that groups employees into distinct functional areas based on domain expertise.
Organizational Complexity
Firm
Siz
e
SimpleStructure
FunctionalStructure
MultidivisionalStructure
MatrixStructure
EXHIBIT 11.4 / Changing Organizational Structures and Increasing Complexity as Firms Grow
LO 11-5
Describe different organizational structures and match them with appropriate strategies.
WWW.YAZDANPRESS.COMWWW.YAZDANPRESS.COM

352 CHAPTER 11 Organizational Design: Structure, Culture, and Control
functional areas such as finance, accounting, IT, marketing, operations, or human resources,
and is then recruited into a corresponding functional group.
W. L. Gore began as a company by operating out of Bill Gore’s basement and using a
simple structure. Two years after its founding, the company received a large manufacturing
order for high-tech cable that it could not meet with its ad hoc basement operation. At that
point, W. L. Gore reorganized itself into a functional structure. A simple structure could
not provide the effective division, coordination, and integration of work required to accom-
modate future growth.
A functional structure allows for a higher degree of specialization and deeper domain
expertise than a simple structure. Higher specialization also allows for a greater division of
labor, which is linked to higher productivity. 30 While work in a functional structure tends
to be specialized, it is centrally coordinated by the CEO (see Exhibit 11.5 ). A functional
structure allows for an efficient top-down and bottom-up communication chain between
the CEO and the functional departments, and thus relies on a relatively flat structure.
USE WITH VARIOUS BUSINESS STRATEGIES. A functional structure is recom-
mended when a firm has a fairly narrow focus in terms of product/service offerings (i.e.,
low level of diversification) combined with a small geographic footprint. It matches well,
therefore, with the different business strategies discussed in Chapter 6: cost leadership,
differentiation, and integration. Although a functional structure is the preferred method for
implementing business strategy, different variations and contexts require careful modifica-
tions in each case:
■ The goal of a cost-leadership strategy is to create a competitive advantage by reducing
the firm’s cost below that of competitors while offering acceptable value. The cost leader
sells a no-frills, standardized product or service to the mainstream customer. To effec-
tively implement a cost-leadership strategy, therefore, managers must create a functional
structure that contains the organizational elements of a mechanistic structure —one that
is centralized, with well-defined lines of authority up and down the hierarchy. Using a
functional structure allows the cost leader to nurture and constantly upgrade necessary
core competencies in manufacturing and logistics. Moreover, the cost leader needs to cre-
ate incentives to foster process innovation in order to drive down cost. Finally, because the
firm services the average customer, and thus targets the largest market segment possible, it
should focus on leveraging economies of scale to further drive down costs.
■ The goal of a differentiation strategy is to create a competitive advantage by offering
products or services at a higher perceived value, while controlling costs. The differentia-
tor, therefore, sells a non-standardized product or service to specific market segments in
which customers are willing to pay a higher price. To effectively implement a differenti-
ation strategy, managers rely on a functional structure that resembles an organic organi-zation. In particular, decision making tends to be decentralized to foster and incentivize
continuous innovation and creativity as well as flexibility and mutual adjustment across
areas. Using a functional structure with an organic organization allows the differentia-
tor to nurture and constantly upgrade necessary core competencies in R&D, innovation,
EXHIBIT 11.5 / Typical Functional Structure
CEO
Research &Development
Engineering &Manufacturing
Marketing,Sales, & Service
HumanResources
Finance &Accounting
WWW.YAZDANPRESS.COMWWW.YAZDANPRESS.COM

CHAPTER 11 Organizational Design: Structure, Culture, and Control 353
and marketing. Finally, the functional structure should be set up to allow the firm to reap
economies of scope from its core competencies, such as by leveraging its brand name
across different products or its technology across different devices.
■ A successful integration strategy requires reconciliation of the trade-offs between dif-
ferentiation and low cost. To effectively implement an integration strategy, the firm must
be both efficient and flexible. For example, the integrator must balance centralization (to
control costs) with decentralization (to foster creativity and innovation). Managers must,
therefore, attempt to combine the advantages of the functional-structure variations used
for cost leadership and differentiation while mitigating their disadvantages. Moreover,
the integrator needs to develop several distinct core competencies to both drive up per-
ceived value and lower cost. It must further pursue both product and process innovations
in an attempt to reap economies of scale and scope. All of these challenges make it clear
that although an integration strategy is attractive at first glance, it is quite difficult to
implement given the range of important trade-offs that must be addressed.
Exhibit 11.6 presents a detailed match between different business strategies and their
corresponding functional structures.
Business Strategy Structure
Cost leadership Functional
• Mechanistic organization
• Centralized
• Command and control
• Core competencies in efficient manufacturing and logistics
• Process innovation to drive down cost
• Focus on economies of scale
Differentiation Functional
• Organic organization
• Decentralized
• Flexibility and mutual adjustment
• Core competencies in R&D, innovation, and marketing
• Product innovation
• Focus on economies of scope
Integration Functional
• Ambidextrous organization
• Balancing centralization with decentralization
• Multiple core competencies along the value chain required: R&D, manufacturing, logistics, marketing, etc.
• Process and product innovations
• Focus on economies of scale and scope
EXHIBIT 11.6 / Matching Business Strategy and Structure
WWW.YAZDANPRESS.COMWWW.YAZDANPRESS.COM

354 CHAPTER 11 Organizational Design: Structure, Culture, and Control
As mentioned in Chapter 6, managers can implement an integration strategy by build-
ing an ambidextrous organization, which attempts to balance and harness different activi-
ties in trade-off situations. 31 One example is the attempt to balance exploitation — applying
current knowledge to enhance firm performance in the short term—with exploration —searching for new knowledge that may enhance future performance. 32 To transform a func-
tional structure into an ambidextrous organization, the CEO or a team of top executives
must personally take responsibility for the integration and coordination across different
functional areas. Strategy scholars found that ambidextrous organizations were most effec-
tive in executing continuous innovation. 33 Strategy Highlight 11.2 shows how USA Today
used an ambidextrous organizational design to successfully reintegrate its independent
online unit.
DRAWBACKS. While certainly attractive, the functional strategy is not without signifi-
cant drawbacks. One is that, although the functional strategy facilitates rich and extensive
communication between members of the same department, it frequently lacks effective
communication channels across departments. (Notice in Exhibit 11.5 the lack of links
between different functions.) The lack of linkage between functions is the reason, for
exploitation Applying current knowledge to enhance firm performance in the short term.
exploration Searching for new knowledge that may enhance future performance.
USA Today: Leveraging
Ambidextrous Organizational Design
The newspaper USA Today, published by Gannett Com-pany, has one of the widest print circulations in the United States (close to 2 million). Though highly profit-able, in the mid-1990s the newspaper faced the emerg-ing threat of online news media, which is mostly free for the end user. Gannett decided to create a competing online offering— USA Today.com, making it independent from the namesake newspaper. The online news unit hired staff from the outside, and its first general manager put in place an organizational structure with fundamen-tally different roles and incentives and a different culture. USA Today.com ’s culture was that of a new high-tech venture, whereas the print media USA Today had a more conservative corporate culture. Physically and structur-ally separated from the print newspaper, USA Today.com resembled an online startup company in the media busi-ness more than a traditional newspaper outlet. Roughly 80 percent of the online news originated from sources other than the print version.
Although USA Today.com successfully attracted read-ers and advertising dollars, Gannett starved the fledgling startup by draining resources. As a result, USA Today.com lost some key editorial talent because it could not provide
competitive compensation packages. To solve this prob-lem, USA Today.com ’s general manager pushed for even greater independence and for profit-and-loss responsi-bility. That decision further isolated the startup from the print-news unit.
By 2000, Gannett decided it was time to integrate USA Today.com with the newspaper in order to create syner-gies between the two news outfits. Duplication of all edi-torial functions and separate creation of content no longer made sense. Given the strained relationship and large cultural differences between the print newspaper and the online business , however, this seemed a daunting task.
The newly appointed general manager of USA Today.com put in place an ambidextrous organizational struc-ture, keeping the online unit somewhat independent but integrating important functions at the top through joint editorial meetings and senior management teams. To sup-port this integration, the president of USA Today shifted compensation incentives for both senior teams to accom-plish joint goals rather than to focus solely on each busi-ness unit’s performance. General managers of each unit implemented further integration through weekly meet-ings of lower-level editorial staff. The general managers of each unit, therefore, were the key integrating linchpins between formerly independent business units, allowing for synergies to emerge. 34
11.2
WWW.YAZDANPRESS.COMWWW.YAZDANPRESS.COM

CHAPTER 11 Organizational Design: Structure, Culture, and Control 355
example, why R&D managers often do not communicate directly with marketing manag-
ers. In an ambidextrous organization, a top-level manager such as the CEO must take on
the necessary coordination and integration work.
To overcome the lack of cross-departmental collaboration in a functional structure, a
firm can set up cross-functional teams. In these temporary teams, members come from
different functional areas to work together on a specific project or product, usually from
start to completion. Each team member reports to two supervisors: the team leader and the
respective functional department head. As we saw in Strategy Highlight 11.1, W. L. Gore
employs cross-functional teams successfully.
A second critical drawback of the functional structure is that it cannot effectively
address a higher level of diversification, which often stems from further growth. 35 This is
the stage at which firms find it effective to evolve and adopt a multidivisional or matrix
structure, both of which we will discuss next.
MULTIDIVISIONAL STRUCTURE
Over time, as a firm diversifies into different product lines and geographies, it implements
a multidivisional or a matrix structure (as shown in Exhibit 11.4 ). The multidivisional structure (or M-form) consists of several distinct strategic business units (SBUs), each
with its own profit-and-loss (P&L) responsibility. Each SBU is operated more or less
independently from one another, and each is led by a CEO (or equivalent general man-
ager) who is responsible for the unit’s business strategy and its day-to-day operations. The
CEOs of each division in turn report to the corporate office, which is led by the company’s
highest-ranking executive (titles vary and include president or CEO for the entire corpora-
tion). Because most large firms are diversified to some extent across different product lines
and geographies, the M-form is a widely adopted organizational structure.
For example, Zappos is an SBU under Amazon, which employs a multidivisional struc-
ture. Also, W. L. Gore uses a multidivisional structure to administer its differentiation and
related diversification strategies. It has four product divisions (electronic products, indus-
trial products, medical products, and fabrics division) with manufacturing facilities in the
U.S., China, Germany, Japan, and Scotland, and business activities in 30 countries across
the globe. 36
A typical M-form is shown in Exhibit 11.7 . In this example, the company has four SBUs,
each led by a CEO. Corporations may use SBUs to organize around different businesses
and product lines or around different geographic regions. Each SBU represents a self-
contained business with its own hierarchy and organizational structure. In Exhibit 11.7 ,
SBU 2 is organized using a functional structure, while SBU 4 is organized using a matrix
structure. The CEO of each SBU must determine which organizational structure is most
appropriate to implement the SBU’s business strategy.
A firm’s corporate office is supported by company-wide staff functions such as human
resources, finance, and corporate R&D. These staff functions support all of the company’s
SBUs, but are centralized at corporate headquarters to benefit from economies of scale and
to avoid duplication within each SBU. Since most of the larger enterprises are publicly
held stock companies, the president reports to a board of directors who represents the inter-
ests of the shareholders (indicated by the dashed line in Exhibit 11.7 ).
The president, with help from corporate headquarters staff, monitors the performance
of each SBU and determines how to allocate resources across units. 37 Corporate head-
quarters add value by functioning as an internal capital market. The goal is to be more
efficient at allocating capital through its budgeting process than what could be achieved
in external capital markets. This can be especially effective if the corporation overall
multidivisional
structure (M-form)
Organizational structure that consists of several distinct strategic business units (SBUs), each with its own profit-and-loss (P&L) responsibility.
WWW.YAZDANPRESS.COMWWW.YAZDANPRESS.COM

356 CHAPTER 11 Organizational Design: Structure, Culture, and Control
can access capital at a lower cost than competitors due to a favorable (AAA) debt rating.
Corporate headquarters can also add value through restructuring the company’s portfolio
of SBUs by selling low-performing businesses and adding promising businesses through
acquisitions.
USE WITH VARIOUS CORPORATE STRATEGIES. To achieve an optimal match
between strategy and structure, different corporate strategies require different organiza-
tional structures. In Chapter 8, we identified four types of corporate diversification (see
Exhibit 8.7): single business, dominant business, related diversification, and unrelated diversification. Each is defined by the percentage of revenues obtained from the firm’s
primary activity. Firms that follow a single-business or dominant-business strategy at the
corporate level gain at least 70 percent of their revenues from their primary activity; they
generally employ a functional structure. For firms that pursue either related or unrelated
diversification, the M-form is the preferred organizational structure. Exhibit 11.8 matches
different corporate strategies and their corresponding organizational structures.
Managers using the M-form organizational structure to support a related- diversification
strategy should ideally concentrate decision making at the top of the organization. Doing
so allows a high level of integration. It also helps corporate headquarters leverage and
transfer across different SBUs the core competencies that form the basis for a related diver-
sification. Co-opetition among the SBUs is both inevitable and necessary. They compete
with one another for resources such as capital and managerial talent, but they also need to
cooperate to share competencies.
In contrast, corporate executives using the M-form structures to support an unrelated- diversification strategy should decentralize decision making. Doing so allows general
managers to respond to specific circumstances, and leads to a low level of integration at
corporate headquarters. Since each SBU is evaluated as a standalone profit-and-loss center,
SBUs end up in competition with each other. A high-performing SBU might be rewarded
with greater capital budgets and strategic freedoms; low-performing businesses might be
spun off. As explained in Chapter 8, the BCG growth-share matrix helps corporate execu-
tives when making these types of decisions.
BOARD OFDIRECTORS
CORPORATER&D
CEOSBU 1
CEOSBU 2
CEOSBU 3
CEOSBU 4
PRESIDENTCORPORATEHQ STAFF
EXHIBIT 11.7 / Typical Multidivisional (M-Form) Structure
(Note that SBU 2 uses a functional structure, and SBU 4 uses a matrix structure.)
WWW.YAZDANPRESS.COMWWW.YAZDANPRESS.COM
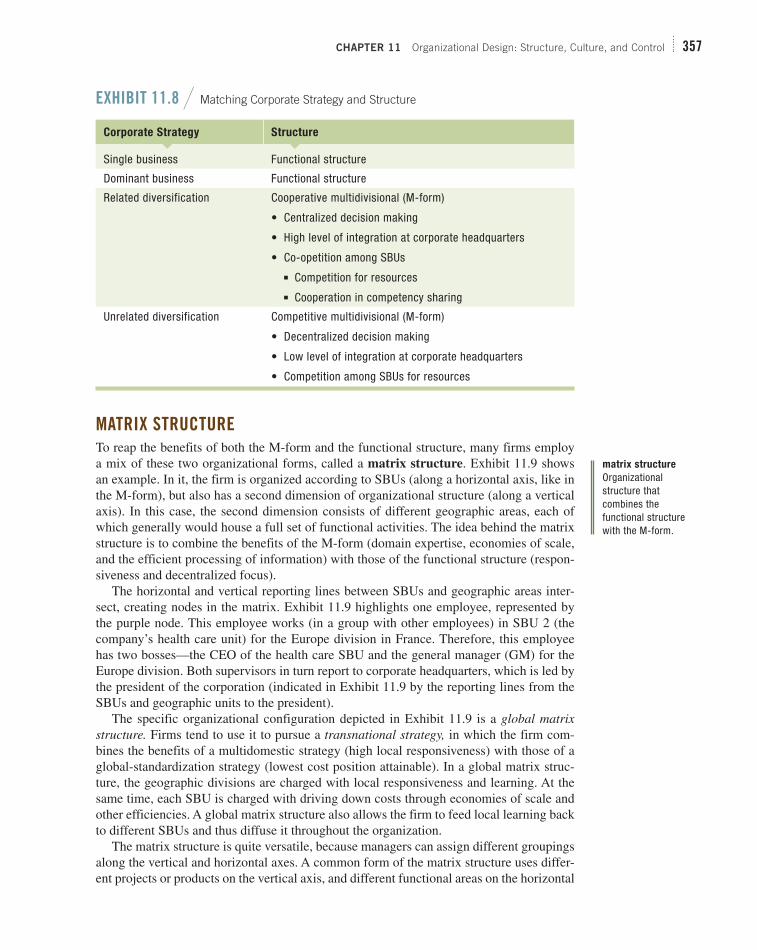
CHAPTER 11 Organizational Design: Structure, Culture, and Control 357
MATRIX STRUCTURE
To reap the benefits of both the M-form and the functional structure, many firms employ
a mix of these two organizational forms, called a matrix structure . Exhibit 11.9 shows
an example. In it, the firm is organized according to SBUs (along a horizontal axis, like in
the M-form), but also has a second dimension of organizational structure (along a vertical
axis). In this case, the second dimension consists of different geographic areas, each of
which generally would house a full set of functional activities. The idea behind the matrix
structure is to combine the benefits of the M-form (domain expertise, economies of scale,
and the efficient processing of information) with those of the functional structure (respon-
siveness and decentralized focus).
The horizontal and vertical reporting lines between SBUs and geographic areas inter-
sect, creating nodes in the matrix. Exhibit 11.9 highlights one employee, represented by
the purple node. This employee works (in a group with other employees) in SBU 2 (the
company’s health care unit) for the Europe division in France. Therefore, this employee
has two bosses—the CEO of the health care SBU and the general manager (GM) for the
Europe division. Both supervisors in turn report to corporate headquarters, which is led by
the president of the corporation (indicated in Exhibit 11.9 by the reporting lines from the
SBUs and geographic units to the president).
The specific organizational configuration depicted in Exhibit 11.9 is a global matrix structure. Firms tend to use it to pursue a transnational strategy, in which the firm com-
bines the benefits of a multidomestic strategy (high local responsiveness) with those of a
global-standardization strategy (lowest cost position attainable). In a global matrix struc-
ture, the geographic divisions are charged with local responsiveness and learning. At the
same time, each SBU is charged with driving down costs through economies of scale and
other efficiencies. A global matrix structure also allows the firm to feed local learning back
to different SBUs and thus diffuse it throughout the organization.
The matrix structure is quite versatile, because managers can assign different groupings
along the vertical and horizontal axes. A common form of the matrix structure uses differ-
ent projects or products on the vertical axis, and different functional areas on the horizontal
matrix structure
Organizational structure that combines the functional structure with the M-form.
Corporate Strategy Structure
Single business Functional structure
Dominant business Functional structure
Related diversification Cooperative multidivisional (M-form)
• Centralized decision making
• High level of integration at corporate headquarters
• Co-opetition among SBUs
■ Competition for resources
■ Cooperation in competency sharing
Unrelated diversification Competitive multidivisional (M-form)
• Decentralized decision making
• Low level of integration at corporate headquarters
• Competition among SBUs for resources
EXHIBIT 11.8 / Matching Corporate Strategy and Structure
WWW.YAZDANPRESS.COMWWW.YAZDANPRESS.COM

358 CHAPTER 11 Organizational Design: Structure, Culture, and Control
axis. In that traditional matrix structure, cross-functional teams work together on different
projects. In contrast to the cross-functional teams discussed earlier in the W. L. Gore exam-
ple, the teams in a matrix structure tend to be more permanent rather than project-based.
Though it is appealing in theory, the matrix structure does have shortcomings. It is usu-
ally difficult to implement: Implementing two layers of organizational structure creates
significant organizational complexity and increases administrative costs. Also, reporting
structures in a matrix are often not clear. In particular, employees can have trouble recon-
ciling goals presented by their two (or more) supervisors. Less-clear reporting structures
can undermine accountability by creating multiple principal–agent relationships. This can
make performance appraisals more difficult. Adding a layer of hierarchy can also slow
decision making and increase bureaucratic costs.
Given the advances in computer-mediated collaboration tools, some firms have replaced
the more rigid matrix structure with a network structure. A network structure allows the
firm to connect centers of excellence, whatever their global location (see Exhibit 10.2). 38
The firm benefits from communities of practice, which store important organizational
learning and expertise. To avoid undue complexity, however, these network structures need
to be supported by corporate-wide procedures and policies to streamline communication,
collaboration, and the allocation of resources. 39
USE WITH VARIOUS GLOBAL STRATEGIES. We already noted that a global
matrix structure fits well with a transnational strategy. To complete the strategy-structure
relationships in the global context, we also need to consider the international, multido-
mestic, and standardization strategies discussed in Chapter 10. Exhibit 11.10 shows how
different global strategies best match with different organizational structures.
In an international strategy, the company leverages its home-based core competency by
moving into foreign markets. An international strategy is advantageous when the company
faces low pressure for both local responsiveness and cost reductions. Companies pursue an
CEOSBU 1
CEOSBU 2
CEOSBU 3
CEOSBU 4
PRESIDENTCORPORATE HQ
NORTHAMERICA
SOUTHAMERICA
EUROPE
MIDDLE EAST& AFRICA
ASIA
Employee in FranceReports to Europe GM ANDCEO SBU 2 (e.g., Health Care)
EXHIBIT 11.9 / Typical Matrix Structure with Geographic and SBU Divisions
WWW.YAZDANPRESS.COMWWW.YAZDANPRESS.COM

CHAPTER 11 Organizational Design: Structure, Culture, and Control 359
international strategy through a differentiation strategy at the business level. The best match
for an international strategy is a functional organizational structure, which allows the com-
pany to leverage its core competency most effectively. This approach is similar to matching a
business-level differentiation strategy with a functional structure (discussed in detail earlier).
When a multinational enterprise (MNE) pursues a multidomestic strategy, it attempts to
maximize local responsiveness in the face of low pressures for cost reductions. An appro-
priate match for this type of global strategy is the multidivisional organizational structure.
That structure would enable the MNE to set up different divisions based on geographic
regions (e.g., by continent). The different geographic divisions operate more or less as
standalone SBUs to maximize local responsiveness. Decision making is decentralized.
When following a global-standardization strategy, the MNE attempts to reap signifi-
cant economies of scale as well as location economies by pursuing a global division of
labor based on wherever best-of-class capabilities reside at the lowest cost. Since the
product offered is more or less an undifferentiated commodity, the MNE pursues a cost-
leadership strategy. The optimal organizational structure match is, again, a multidivisional structure. Rather than focusing on geographic differences as in the multidomestic strategy,
the focus is on driving down costs due to consolidation of activities across different geo-
graphic areas.
11.3 Organizational Culture:
Values, Norms, and Artifacts
Organizational culture is the second key building block when designing organizations for
competitive advantage. Just as people have distinctive personalities, so too do organiza-
tions have unique cultures that capture “how things get done around here.” Organizational culture describes the collectively shared values and norms of an organization’s mem-
bers. 40 Values define what is considered important. Zappos’ 10 core values (shown in
Exhibit 11.1 ) are important to its employees; they define their identity of what it means
to be working at Zappos. 41 Norms define appropriate employee attitudes and behaviors. 42
LO 11-6
Describe the elements of organizational culture, and explain where organizational cultures can come from and how they can be changed.
organizational
culture The collectively shared values and norms of an organization’s members; a key building block of organizational design.
EXHIBIT 11.10 / Matching Global Strategy and Structure
Global Strategy Structure
International Functional
Multidomestic Multidivisional
• Geographic areas
• Decentralized decision making
Global Standardization Multidivisional
• Product divisions
• Centralized decision making
Transnational Global matrix
• Balance of centralized and decentralized decision making
• Additional layer of hierarchy to coordinate both:
■ Geographic areas
■ Product divisions
WWW.YAZDANPRESS.COMWWW.YAZDANPRESS.COM

360 CHAPTER 11 Organizational Design: Structure, Culture, and Control
Employees learn about an organization’s culture through
socialization, a process whereby employees internalize an
organization’s values and norms through immersion in its day-
to-day operations. 43 Successful socialization, in turn, allows
employees to function productively and to take on specific
roles within the organization. Strong cultures emerge when
the company’s core values are widely shared among the firm’s
employees and when the norms have been internalized.
Corporate culture finds its expression in artifacts. Artifacts
include elements such as the design and layout of physical
space (e.g., cubicles or private offices); symbols (e.g., the type
of clothing worn by employees); vocabulary; what stories are
told (see the Zappos example that follows); what events are cel-
ebrated and highlighted; and how they are celebrated (e.g., a
formal dinner versus a company BBQ when the firm reaches
its sales target).
Exhibit 11.11 depicts the elements of organizational
culture—values, norms, and artifacts—in concentric circles.
The most important yet least visible element—values—is in
the center. As we move outward in the figure, from values to
norms to artifacts, culture becomes more observable. Under-
standing what organizational culture is, and how it is created,
maintained, and changed, can help you be a more effective manager. A unique culture that
is strategically relevant can also be the basis of a firm’s competitive advantage.
WHERE DO ORGANIZATIONAL CULTURES COME FROM?
Often, company founders define and shape an organization’s culture, which can persist
for many decades after their departure. This phenomenon is called founder imprinting . 44
Firm founders set the initial strategy, structure, and culture of an organization by transform-
ing their vision into reality. Famous founders who have left strong imprints on their orga-
nizations include Steve Jobs (Apple), Walt Disney (Disney), Michael Dell (Dell), Sergei
Brin and Larry Page (Google), Oprah Winfrey (Harpo Productions and OWN, the Oprah
Winfrey Network), Bill Gates (Microsoft), Larry Ellison (Oracle), Ralph Lauren (Polo
Ralph Lauren), Martha Stewart (Martha Stewart Living Omnimedia), and Herb Kelleher
(Southwest Airlines).
Walmart’s founder Sam Walton personified the retailer’s cost-leadership strategy. At
one time the richest man in America, Sam Walton drove a beat-up Ford pickup truck, got
$5 haircuts, went camping for vacations, and lived in a modest ranch home in Benton-
ville, Arkansas. 45 Everything Sam Walton did was consistent with the low-cost strategy.
Walmart stays true to its founder’s tradition. Home to one of the largest companies on
the planet, the company’s Arkansas headquarters in Bentonville was described by Thomas
Friedman in his book The World Is Flat as follows: “[Walmart’s corporate headquarters]
are crammed into a reconfigured warehouse . . . a large building made of corrugated metal,
I figured it was the maintenance shed.” 46
The culture that founders initially imprint is reinforced by their strong preference to
recruit, retain, and promote employees who subscribe to the same values. In turn, more
people with similar values are attracted to that organization. 47 As the values and norms
held by the employees become more similar, the firm’s corporate culture becomes stron-
ger and more distinct. This in turn can have a serious negative side-effect: groupthink , a
founder imprinting A process by which the founder defines and shapes an organization’s culture, which can persist for decades after his or her departure.
groupthink A situation in which opinions coalesce around a leader without individuals critically evaluating and challenging that leader’s opinions and assumptions.
Values
Norms
Artifacts
EXHIBIT 11.11 / The Elements of Organizational Culture: Values, Norms, and Artifacts
WWW.YAZDANPRESS.COMWWW.YAZDANPRESS.COM

CHAPTER 11 Organizational Design: Structure, Culture, and Control 361
situation in which opinions coalesce around a leader without individuals critically evaluat-
ing and challenging that leader’s opinions and assumptions. Cohesive, non-diverse groups
are highly susceptible to groupthink, which in turn can lead to flawed decision making
with potentially disastrous consequences.
In addition to founder imprinting, a firm’s culture also flows from its values, espe-
cially when they are linked to the company’s reward system. For example, Zappos
established its unique organizational culture through explicitly stated values that are
connected to its reward system (see Exhibit 11.1 ). To recruit people that fit with the com-
pany’s values, Tony Hsieh has all new-hires go through a four-week training program.
It covers such topics as company history, culture, and vision, as well as customer ser-
vice. 48 New-hires also spend two weeks on the phone as customer service reps. What’s
novel about Zappos’ approach is that at the end of the first week, the company offers any
new hire $2,000 to quit (plus pay for the time already worked). This offer stands until
the end of the fourth week, when the training program is completed. Individuals who
choose to stay on despite the enticing offer tend to fit well with and strengthen Zappos’
distinct culture. 49
HOW DOES ORGANIZATIONAL CULTURE CHANGE?
An organization’s culture can be one of its strongest assets, but also its greatest liability. An
organization’s culture can turn from a core competency into a core rigidity if a firm relies
too long on the competency without honing, refining, and upgrading as the firm and the
environment change. 50 Over time, the original core competency is no longer a good fit and
turns from an asset into a liability, and thus a core rigidity. For example, GM’s bureaucratic culture, combined with its innovative M-form struc-
ture, was once hailed as the key to superior efficiency and management. 51 However, that
culture became a liability when the external environment changed following the oil-price
shocks in the 1970s and the entry of Japanese carmakers into the U.S. 52 As a consequence,
GM’s strong culture led to organizational inertia. This resulted in a failure to adapt to
changing customer preferences for more fuel-efficient cars, and prevented higher quality
and more innovative designs. GM lost customers to foreign competitors that offered these
features. In such times, corporate culture may need to be changed to address a breakdown
in the culture-environment fit.
The primary avenues of culture change (often combined with changes in strategy and
structure) include bringing in new leadership and mergers and acquisitions (M&As). Lead-
ers and top executives shape corporate culture in the way they communicate and make
decisions regarding an organization’s structure, resource-allocation process, and reward
system.
ORGANIZATIONAL CULTURE AND COMPETITIVE ADVANTAGE
Can organizational culture be the basis of a firm’s (sustainable) competitive advantage?
For this to occur, according to the resource-based view of the firm, the resource—in this
case, organizational culture—must be valuable, rare, difficult to imitate, and the firm must
be organized to capture the value created. That is, the VRIO principles must hold (see
Chapter 4). 53
Let’s look at two examples of how culture affects employee behavior and ultimately
firm performance:
■ If you have flown with Southwest Airlines (SWA), you may have noticed that things are
done a little differently there. Flight attendants might sing a song about the city you’re
core rigidity A former core competency that turned into a liability because the firm has failed to hone, refine, and upgrade the competency as the environment changed.
WWW.YAZDANPRESS.COMWWW.YAZDANPRESS.COM

362 CHAPTER 11 Organizational Design: Structure, Culture, and Control
landing in, or they might slide bags of peanuts down the aisle at
takeoff. Employees celebrate Halloween in a big way by wear-
ing costumes to work. Some argue that SWA’s business strategy—
being a cost leader in point-to-point air travel—is fairly simple,
and that SWA’s competitive advantage actually comes from its
unique culture. 54 It’s not all fun and games, though: Friendly and
highly energized employees work across functional and hierarchi-
cal levels. Even Southwest’s pilots pitch in to help load baggage
quickly when needed. As a result, SWA’s turn time between flights
is only 15 minutes, whereas competitors frequently take two to
three times as long.
■ Zappos’ number-one core value is to “deliver WOW through service.” CEO Tony Hsieh
shares the following story to illustrate this core value in action: “I was in Santa Monica,
California, a few years ago at a Skechers sales conference. . . . [In the early hours of the
morning], a small group of us headed up to someone’s hotel room to order some food.
My friend from Skechers tried to order a pepperoni pizza from the room-service menu
but was disappointed to learn that the hotel did not deliver hot food after 11:00 p.m.
We had missed the deadline by several hours. . . . A few of us cajoled her into calling
Zappos to try to order a pizza. She took us up on our dare, turned on the speakerphone,
and explained to the (very) patient Zappos rep that she was staying in a Santa Monica
hotel and really craving a pepperoni pizza, that room service was no longer delivering
hot food, and that she wanted to know if there was anything Zappos could do to help.
The Zappos rep was initially a bit confused by the request, but she quickly recovered
and put us on hold. She returned two minutes later, listing the five closest places in the
Santa Monica area that were still open and delivering pizzas at that time.” 55
In the SWA example, the company’s unique culture helps it keep costs low by turn-
ing around its planes faster, thus keeping them flying longer hours (among many other
activities that lower SWA’s cost structure). 56 In the Zappos example, providing a “wow”
customer experience by “going the extra mile” didn’t save Zappos money, but in the long
run superior experience does increase the company’s perceived value and thereby its eco-
nomic value creation. Indeed, Tony Hsieh makes it a point to conclude the story with the
following statement: “As for my friend from Skechers? After that phone call, she’s now a
customer for life.” 57
Let’s consider how an organization’s culture can have a strong influence on employee
behavior. 58 A positive culture motivates and energizes employees by appealing to their
higher ideals. Internalizing the firm’s values and norms, employees feel that they are part
of a larger, meaningful community attempting to accomplish important things. When
employees are intrinsically motivated this way, the firm can rely on fewer levels of hierar-
chy; thus close monitoring and supervision are not needed as much. Moreover, motivating
through inspiring values allows the firms to tap employees’ emotions so they use both their
heads and their hearts when making business decisions. Strong organizational cultures that
are strategically relevant, therefore, align employees’ behaviors more fully with the orga-
nization’s strategic goals. In doing so, they better coordinate work efforts, and they make
cooperation more effective. They also strengthen employee commitment, engagement, and
effort. Effective alignment in turn allows the organization to develop and refine its core
competencies, which can form the basis for competitive advantage.
Applying the VRIO principles to the SWA and Zappos examples, we see that both cultures
are valuable (lowering costs for SWA and increasing perceived value created for Zappos),
rare (none of their competitors has an identical culture), non-imitable (despite attempts by
WWW.YAZDANPRESS.COMWWW.YAZDANPRESS.COM

CHAPTER 11 Organizational Design: Structure, Culture, and Control 363
competitors), and organized to capture some part of the incremental economic value created
due to their unique cultures. It appears that at both SWA and Zappos, a unique organizational
culture can in fact provide the basis for a (sustained) competitive advantage. These cultures,
of course, need to be in sync with and in support of the respective business strategies pursued
(cost leadership for SWA and differentiation for Zappos). Moreover, as the firms grow and
external economic environments change, these cultures must be flexible enough to adapt.
Once it becomes clear that a firm’s culture is a source of competitive advantage, some
competitors will attempt to imitate that culture. Therefore, only a culture that cannot be easily
copied can provide a competitive advantage. However, it can be difficult, at best, to imitate
the cultures of successful firms, for two reasons: causal ambiguity and social complexity. While one can observe that a firm has a unique culture, the causal relationships among values,
norms, artifacts, and the firm’s performance may be hard to establish, even for people who
work within the organization. For example, employees may become aware of the effect cul-
ture has on performance only after significant organizational changes occur. Moreover, orga-
nizational culture is socially complex. It encompasses not only interactions among employees
across layers of hierarchy, but also the firm’s outside relationships with its customers and sup-
pliers. 59 Such a wide range of factors is difficult for any competing firm to imitate.
It is best to develop a strong and strategically relevant culture in the first few years of a
firm’s existence. Strategy scholars have documented that the initial structure, culture, and
control mechanisms established in a new firm can be a significant predictor of later suc-
cess. 60 In other empirical research, founder CEOs had a stronger positive imprinting effect
than non-founder CEOs. 61 This stronger imprinting effect, in turn, resulted in higher per-
formance of firms led by founder CEOs. In addition, consider that the vehicles of cultural
change—changing leadership and growing through M&As—do not have a stellar record of
success. 62 Indeed, researchers estimate that only about 20 percent of organizational change
attempts are successful. 63 Thus, it is even more important to get the culture right from the
beginning and then adapt it as the business evolves.
By combining theory and empirical evidence, we can see that organizational culture can
help a firm gain and sustain competitive advantage if the culture makes a positive contribu-
tion to the firm’s economic value creation and obeys the VRIO principles. Organizational
culture is an especially effective lever for new ventures due to its malleability. Firm found-
ers, early-stage CEOs, and venture capitalists, therefore, should be proactive in attempting
to create a culture that leads to or at least supports a firm’s competitive advantage.
11.4 Strategic Control-and-Reward Systems
Strategic control-and-reward systems are the third and final key building block when
designing organizations for competitive advantage. Strategic control-and-reward systems are internal-governance mechanisms put in place to align the incentives of prin-
cipals (shareholders) and agents (employees). These systems allow managers to specify
goals, measure progress, and provide performance feedback. In Chapter 5, we discussed
how firms can use the balanced-scorecard framework as a strategic control system. Here,
we discuss additional control-and-reward systems: organizational culture, input controls,
and output controls.
As just demonstrated, organizational culture can be a powerful motivator. It also can
be an effective control system. Norms, informal and tacit in nature, act as a social con-
trol mechanism. Zappos, for example, achieves organizational control partly through
an employee’s peer group: Each group member’s compensation, including the supervi-
sor’s, depends in part on the group’s overall productivity. Peer control, therefore, exerts a
LO 11-7
Compare and contrast different strategic control-and-reward systems.
strategic control-and-
reward systems A key building block of organizational design; internal-governance mechanisms put in place to align the incentives of principals (shareholders) and agents (employees).
WWW.YAZDANPRESS.COMWWW.YAZDANPRESS.COM

364 CHAPTER 11 Organizational Design: Structure, Culture, and Control
powerful force on employee conformity and performance. 64 Values and norms also provide
control by helping employees address unpredictable and irregular situations and problems
(common in service businesses). In contrast, rules and procedures (e.g., codified in an
employee handbook) can address only circumstances that can be predicted.
INPUT CONTROLS
Input controls seek to define and direct employee behavior through a set of explicit, codi-
fied rules and standard operating procedures. Firms use input controls when the goal is to
define the ways and means to reach a strategic goal and to ensure a predictable outcome.
They are called input controls because management designs these mechanisms so they are
considered before employees make any business decisions; thus, they are an input into the
value-creation activities.
The use of budgets is key to input controls. Managers set budgets before employees
define and undertake the actual business activities. For example, managers decide how
much money to allocate to a certain R&D project before the project begins. In diversi-
fied companies using the M-form, corporate headquarters determines the budgets for each
division. Public institutions, like some universities, also operate on budgets that must be
balanced each year. Their funding often depends to a large extent on state appropriations
and thus fluctuates depending on the economic cycle. During recessions, budgets tend to
be cut, and they expand during boom periods.
Standard operating procedures, or policies and rules, are also a frequently used mecha-
nism when relying on input controls. In our discussion on formalization, we described
how McDonald’s relies on detailed operating procedures to ensure consistent quality and
service worldwide. The goal is to specify the conversion process from beginning to end in
great detail to guarantee standardization and minimize deviation. This is important when a
company operates in different geographies and with different human capital throughout the
globe but needs to deliver a standardized product or service.
OUTPUT CONTROLS
Output controls seek to guide employee behavior by defining expected results (outputs),
but leave the means to those results open to individual employees, groups, or SBUs. Firms
frequently tie employee compensation and rewards to predetermined goals, such as a spe-
cific sales target or return on invested capital. When factors internal to the firm determine
the relationship between effort and expected performance, outcome controls are especially
effective. At the corporate level, outcome controls discourage collaboration among differ-
ent strategic business units. They are therefore best applied when a firm focuses on a single
line of business or pursues unrelated diversification.
These days, more and more work requires creativity and innovation, especially in highly
developed economies. 65 As a consequence, so-called results-only-work-environments
( ROWEs ) have attracted significant attention. ROWEs are output controls that attempt to
tap intrinsic (rather than extrinsic) employee motivation, which is driven by the employee’s
interest in and the meaning of the work itself. In contrast, extrinsic motivation is driven by
external factors such as awards and higher compensation, or punishments like demotions
and layoffs (the carrot-and-stick approach ). According to a recent synthesis of the strate-
gic human resources literature, intrinsic motivation in a task is highest when an employee
has autonomy (about what to do), mastery (how to do it), and purpose (why to do it). 66
Today, 3M is best known for its adhesives and other consumer and industrial products. 67
But its full name reflects its origins: 3M stands for Minnesota Mining and Manufacturing
input controls
Mechanisms in a strategic control-and-reward system that seek to define and direct employee behavior through a set of explicit, codified rules and standard operating procedures that are considered prior to the value-creating activities.
output controls
Mechanisms in a strategic control-and-reward system that seek to guide employee behavior by defining expected results (outputs), but leave the means to those results open to individual employees, groups, or SBUs.
WWW.YAZDANPRESS.COMWWW.YAZDANPRESS.COM

CHAPTER 11 Organizational Design: Structure, Culture, and Control 365
Company. Over time, 3M has relied on the ROWE
framework and has morphed into a highly science-
driven innovation company. At 3M, employees are
encouraged to spend 15 percent of their time on proj-
ects of their own choosing. If any of these projects
look promising, 3M provides financing through an
internal venture capital fund and other resources to
further develop their commercial potential. In fact,
several of 3M’s flagship products, including Post-It
Notes and Scotch Tape, were the results of serendip-
ity (see Chapter 2). To foster continued innovation,
moreover, 3M requires each of its divisions to derive
at least 30 percent of their revenues from products
introduced in the past four years.
11.5 Implications for the Strategist
This chapter has a clear practical implication for the strategist: Formulating an effective
strategy is a necessary but not sufficient condition for gaining and sustaining competi-
tive advantage; strategy execution is at least as important for success. Successful strat-
egy implementation requires managers to design and shape structure, culture, and control
mechanisms. In doing so, they execute a firm’s strategy as they put its accompanying busi-
ness model into action. Strategy formulation and strategy implementation, therefore, are
iterative and interdependent activities.
Organizing for competitive advantage, moreover, is a dynamic and not a static pro-
cess. As seen in the Zappos example, to maintain competitive advantage, companies need
to restructure as they grow and the competitive environment changes. In Chapter 4, we
introduced the SWOT analysis as a helpful tool for the strategist to combine the results
of a thorough external and internal analysis. We applied a SWOT analysis based on four
strategic questions to McDonald’s, the results of which were shown Exhibit 4.10.
We are now in a position to provide more guidance in terms of how to implement the rec-
ommendations over time and apply the resources necessary. Exhibit 11.12 shows this frame-
work. The left panel is a repeat of the results from the SWOT analysis conducted in Chapter
4. The right panel shows resource requirements (low $, medium $$, and high $$$) on the hori-
zontal axis, and time horizon (short term, medium term, and long term) on the vertical axis.
Translating the findings from the left panel into the right panel, the strategist concludes that the
first recommendation—to launch new locations in China and Mexico (S1, S2, O1)—requires
a high level of investment and is a long-term proposition. The second recommendation—to
show new ads highlighting the ease and speed of the McDonald’s drive-thru for take-home
orders (W1, T2)—requires a low amount of funding and can be achieved in the short term.
The third recommendation—to launch a line of McDonald’s frozen food in grocery chains
(S2, S3, T2)—requires a medium investment and likely needs a longer time horizon to be
accomplished. Finally, the fourth recommendation—to develop and emphasize more healthy
food menu items (W1, W2, O2)—needs a medium level of resources and can be accomplished
in the medium term. This exercise helps make the results of strategy analysis and formulation
more concrete, and allows for a detailed list of action items outlining required investment
levels and time horizons. In sum, the implementation matrix shown in Exhibit 11.12 provides
helpful guidance for the strategist to operationalize strategy implementation.
This concludes our discussion of organizational design. We now move on to our conclud-
ing chapter, where we study corporate governance and business ethics.
Daniel Pink’s book on motivation ( Drive: The Surprising Truth About What Motivates Us ) discusses the limits of the carrot-and-stick approach versus the motivational impact of autonomy.
WWW.YAZDANPRESS.COMWWW.YAZDANPRESS.COM
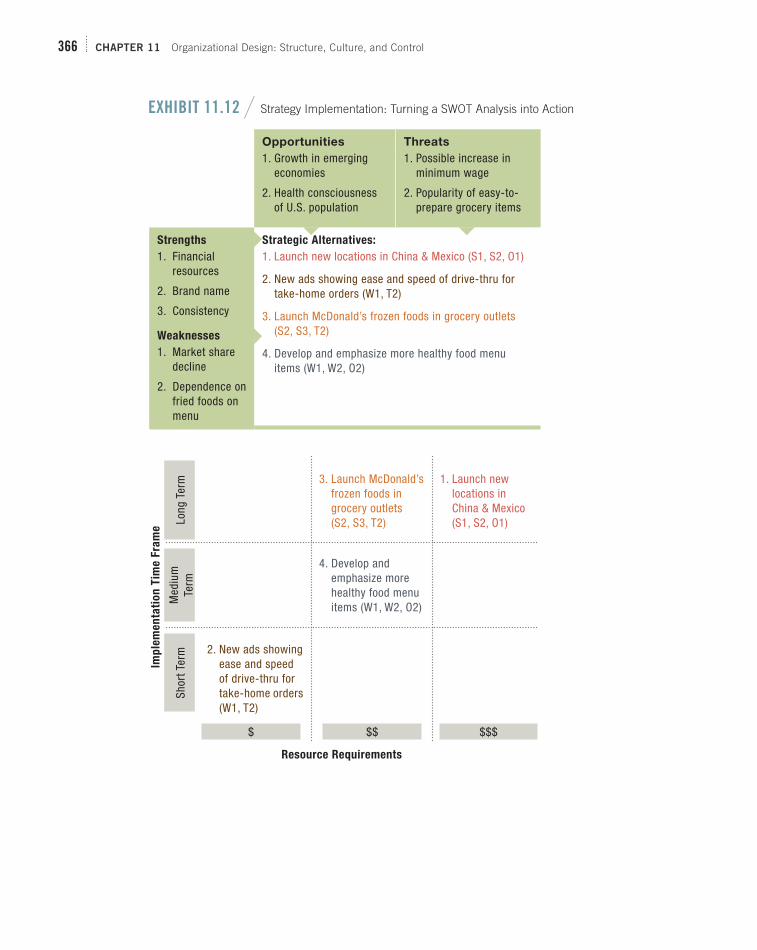
366 CHAPTER 11 Organizational Design: Structure, Culture, and Control
3. Launch McDonald’s frozen foods in grocery outlets (S2, S3, T2)
1. Launch new locations in China & Mexico (S1, S2, O1)
4. Develop and emphasize more healthy food menu items (W1, W2, O2)
2. New ads showing ease and speed of drive-thru for take-home orders (W1, T2)
Resource Requirements
$$ $$$$
Long
Ter
m
Imp
lem
en
tati
on
Tim
e F
ram
e
Med
ium
Te
rmSh
ort T
erm
EXHIBIT 11.12 / Strategy Implementation: Turning a SWOT Analysis into Action
Opportunities Threats1. Growth in emerging
economies
2. Health consciousness of U.S. population
1. Possible increase in minimum wage
2. Popularity of easy-to-prepare grocery items
Strengths Strategic Alternatives:
1. Financial resources
2. Brand name
3. Consistency
1. Launch new locations in China & Mexico (S1, S2, O1)
2. New ads showing ease and speed of drive-thru for take-home orders (W1, T2)
3. Launch McDonald’s frozen foods in grocery outlets (S2, S3, T2)
4. Develop and emphasize more healthy food menu items (W1, W2, O2)
Weaknesses
1. Market share decline
2. Dependence on fried foods on menu
WWW.YAZDANPRESS.COMWWW.YAZDANPRESS.COM

CHAPTER 11 Organizational Design: Structure, Culture, and Control 367
In this chapter, we studied the three key levers that
managers have at their disposal when designing their
firms for competitive advantage—structure, culture,
and control — as summarized by the following learning
objectives and related take-away concepts.
LO 11-1 / Define organizational design and
list its three components.
■ Organizational design is the process of creat-
ing, implementing, monitoring, and modifying
the structure, processes, and procedures of an
organization.
■ The key components of organizational design are
structure, culture, and control.
■ The goal is to design an organization that allows
managers to effectively translate their chosen
strategy into a realized one.
LO 11-2 / Explain how organizational inertia
can lead established firms to failure.
■ Organizational inertia can lead to the failure of
established firms when a tightly coupled system
of strategy and structure experiences internal or
external shifts.
■ Firm failure happens through a dynamic, four-
step process (see Exhibit 11.2 ).
TAKE-AWAY CONCEPTS
Z ZAPPOS WANTS TO “deliver WOW through service.” We saw an example of this culture in the story of the Zap-pos customer service rep who provided contacts for local pizza delivery to an out-of-town guest. Though it is a memorable story, providing the pizza 411-service did not involve significant cost to the employee or the firm for delivering “WOW through service.” However, at midnight on Friday, May 21, 2010, Zappos created a problem that required a significant financial cost to deliver that “WOW.” Due to a programming error in its pricing engine, Zappos accidentally capped the sales price at $49.95 for all products sold on its subsidiary site ( www.6pm.com ). The mistake was not discovered until 6 a.m., and Zappos pulled down the site to correct the pricing problem. Once fixed, there remained a question of what to do about the products sold with the erroneous prices.
Zappos’ terms and conditions clearly state that the firm is under no obligation to fulfill orders placed due to pricing mistakes. However, Zappos decided to honor every sale made in the time frame between midnight and 6 a.m.—resulting in a loss of over $1.6 million. That’s putting your money where your “WOW” is! 68
Amazon, which owns Zappos, had its own pric-ing mistake just two months prior to the Zappos incident. Best Buy and Dell have also both had online pric-ing errors. 69 None of these firms handled the situation as smoothly as Zappos.
Questions
1. What elements of an organic organization are apparent from the chapter material on Zappos? (Refer to Exhibit 11.3 .)
2. How does the Zappos business strategy match its organizational structure?
3. Which strategic control-and-reward system discussed in the chapter would be most appropriate for Zappos?
4. Do you think Zappos’ decision to honor every sale, despite its explicit business terms and conditions that would allow it not to do so, was a sound one? Why or why not?
CHAPTER CASE 11 Consider This . . .
WWW.YAZDANPRESS.COMWWW.YAZDANPRESS.COM
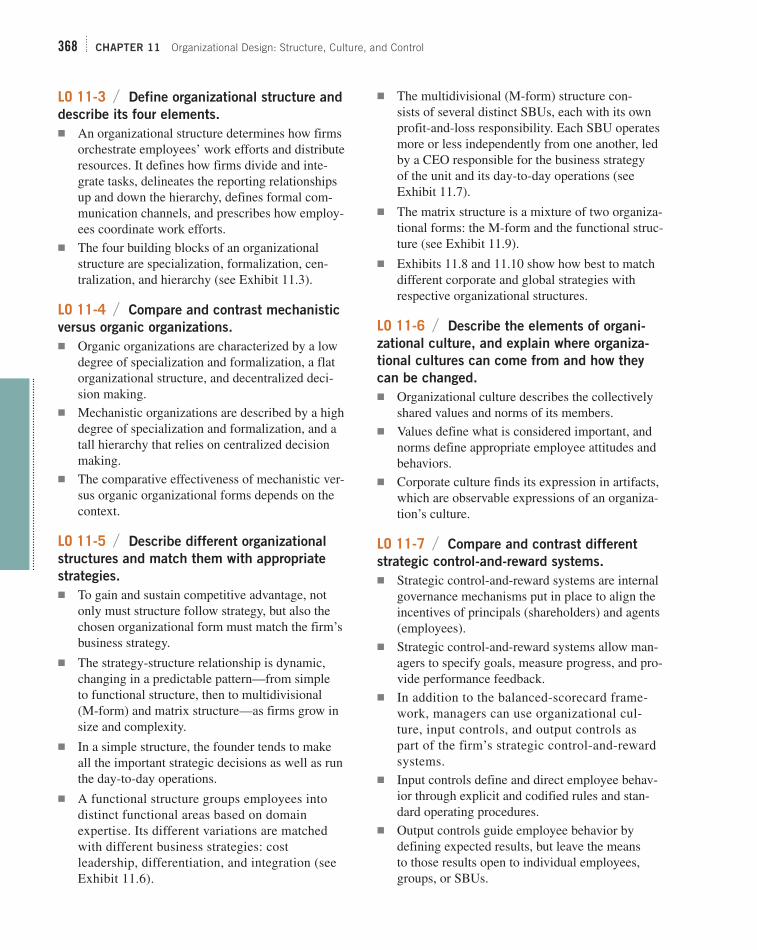
368 CHAPTER 11 Organizational Design: Structure, Culture, and Control
LO 11-3 / Define organizational structure and
describe its four elements.
■ An organizational structure determines how firms
orchestrate employees’ work efforts and distribute
resources. It defines how firms divide and inte-
grate tasks, delineates the reporting relationships
up and down the hierarchy, defines formal com-
munication channels, and prescribes how employ-
ees coordinate work efforts.
■ The four building blocks of an organizational
structure are specialization, formalization, cen-
tralization, and hierarchy (see Exhibit 11.3 ).
LO 11-4 / Compare and contrast mechanistic
versus organic organizations.
■ Organic organizations are characterized by a low
degree of specialization and formalization, a flat
organizational structure, and decentralized deci-
sion making.
■ Mechanistic organizations are described by a high
degree of specialization and formalization, and a
tall hierarchy that relies on centralized decision
making.
■ The comparative effectiveness of mechanistic ver-
sus organic organizational forms depends on the
context.
LO 11-5 / Describe different organizational
structures and match them with appropriate
strategies.
■ To gain and sustain competitive advantage, not
only must structure follow strategy, but also the
chosen organizational form must match the firm’s
business strategy.
■ The strategy-structure relationship is dynamic,
changing in a predictable pattern—from simple
to functional structure, then to multidivisional
(M-form) and matrix structure—as firms grow in
size and complexity.
■ In a simple structure, the founder tends to make
all the important strategic decisions as well as run
the day-to-day operations.
■ A functional structure groups employees into
distinct functional areas based on domain
expertise. Its different variations are matched
with different business strategies: cost
leadership, differentiation, and integration (see
Exhibit 11.6 ).
■ The multidivisional (M-form) structure con-
sists of several distinct SBUs, each with its own
profit-and-loss responsibility. Each SBU operates
more or less independently from one another, led
by a CEO responsible for the business strategy
of the unit and its day-to-day operations (see
Exhibit 11.7 ).
■ The matrix structure is a mixture of two organiza-
tional forms: the M-form and the functional struc-
ture (see Exhibit 11.9 ).
■ Exhibits 11.8 and 11.10 show how best to match
different corporate and global strategies with
respective organizational structures.
LO 11-6 / Describe the elements of organi-
zational culture, and explain where organiza-
tional cultures can come from and how they
can be changed.
■ Organizational culture describes the collectively
shared values and norms of its members.
■ Values define what is considered important, and
norms define appropriate employee attitudes and
behaviors.
■ Corporate culture finds its expression in artifacts,
which are observable expressions of an organiza-
tion’s culture.
LO 11-7 / Compare and contrast different
strategic control-and-reward systems.
■ Strategic control-and-reward systems are internal
governance mechanisms put in place to align the
incentives of principals (shareholders) and agents
(employees).
■ Strategic control-and-reward systems allow man-
agers to specify goals, measure progress, and pro-
vide performance feedback.
■ In addition to the balanced-scorecard frame-
work, managers can use organizational cul-
ture, input controls, and output controls as
part of the firm’s strategic control-and-reward
systems.
■ Input controls define and direct employee behav-
ior through explicit and codified rules and stan-
dard operating procedures.
■ Output controls guide employee behavior by
defining expected results, but leave the means
to those results open to individual employees,
groups, or SBUs.
WWW.YAZDANPRESS.COMWWW.YAZDANPRESS.COM

CHAPTER 11 Organizational Design: Structure, Culture, and Control 369
1. Why is it important for an organization
to have alignment between its strategy and
structure?
2. The chapter describes the role of culture in the
successful implementation of strategy. Con-
sider an employment experience of your own
or of someone you have observed closely (e.g.,
a family member). Describe to the best of your
ability the values, norms, and artifacts of the
organization. What was the socialization pro-
cess of embedding the culture? Do you consider
this to be an example of an effective culture for
contributing to the organization’s competitive
advantage? Why or why not?
3. Strategy Highlight 11.1 discusses the informal
organizational structure of W. L. Gore & Associ-
ates. Go to the firm’s website ( www.gore.com )
and review the company’s product scope.
a. What commonalities across the products
would likely be enhanced by flexible cross-
functional teams?
b. What would be your expectations of the type
of norms found at W. L. Gore?
DISCUSSION QUESTIONS
Centralization
Core rigidity
Exploitation
Exploration
Formalization
Founder imprinting
Functional structure
Groupthink
Hierarchy
Input controls
Matrix structure
Mechanistic organization
Multidivisional structure (M-form)
Organic organization
Organizational culture
Organizational design
Organizational structure
Output controls
Simple structure
Span of control
Specialization
Strategic control-and-reward
systems
Strategy implementation
KEY TERMS
1. As noted in Chapter 5, many public firms are
under intense pressure for short-term (such as
quarterly) financial improvements. How might
such pressure, in combination with output con-
trols, lead to unethical behaviors?
2. Cultural norms and values play a significant role
in all organizations, from businesses in the eco-
nomic sector to religious, political, and sports
organizations. Strong organizational cultures can
have many benefits, such as those described in the
Zappos example. However, sometimes a strong
organizational culture is less positive. Vince Lom-
bardi, renowned coach of the Green Bay Packers,
is often quoted as saying, “Winning isn’t every-
thing; it’s the only thing.” Many sports teams
from junior sports to professional sports have
either explicitly or implicitly touted this attitude
as exemplary. Others, however, argue that this
attitude is what’s wrong with sports and leads to
injury, minor misbehavior, and criminal behavior.
It encourages players to do whatever it takes to
win—from tripping a player or other unsports-
manlike conduct during middle-school sports to
throwing a game as part of gambling.
When a player hears the message as “any
action will be tolerated as long as you are win-
ning,” there can be serious consequences on
and off the field. Recent examples include high-
school football players convicted of rape, yet Jen
Floyd Engel of Fox Sports noticed “a shocking
lack of outrage” within the community as they
continued to support their football heroes. 70
ETHICAL/SOCIAL ISSUES
WWW.YAZDANPRESS.COMWWW.YAZDANPRESS.COM
370 CHAPTER 11 Organizational Design: Structure, Culture, and Control
How could leaders of sports organizations com-
municate the will to win and develop the neces-
sary skills while maintaining ethical behavior?
Think of examples of coaches who coaxed
players to play by the rules and maintain high
personal ethical standards. What other socializa-
tion experiences could a coach use? What is the
role of team leaders in encouraging high ethical
standards while building the desire to win?
Name some other examples of organizational
culture leading to business failure, criminal
behavior, or civil legal actions.
3. What makes some strong cultures helpful in gaining
and sustaining a competitive advantage, while other
strong cultures are a liability to achieving that goal?
//// Small-Group Exercise 1
Your classmates are a group of friends who have
decided to open a small retail shop. The team is torn
between two storefront ideas. The first idea is to open
a high-end antique store selling household items used
for decorations in upscale homes. Members of the
team have found a location in a heavily pedestrian
area near a local coffee shop. The store would have
many items authenticated by a team member’s uncle,
who is a certified appraiser.
In discussing the plan, however, two group mem-
bers suggest shifting to a drop-off store for online
auctions such as eBay. In this business model, cus-
tomers drop off items they want to sell, and the
retail store does all the logistics involved—listing
and selling the items on eBay, and then shipping
them to buyers—for a percentage of the sales price.
They suggest that a quick way to get started is to
become a franchisee for a group such as “I Sold It”
( www.877isoldit.com ).
1. What is the business strategy for each store
concept?
2. How would the organizational structure be differ-
ent for the concepts?
3. What would likely be the cultural differences in
the two store concepts?
4. How would the control-and-reward systems be
different?
//// Small-Group Exercise 2
(Ethical/Social Issues)
The chapter describes Daniel Pink’s ROWE theory of
motivation, in which he argued that the most powerful
motivation occurs when there is an interest in the work
and the work itself has meaning. Intrinsic motivation is
highest when an employee has autonomy (about what
to do), mastery (how to do it), and purpose (why to do
it). Assume your group has been asked by your univer-
sity to brainstorm ways that the university might apply
the ROWE theory. Discuss whether you would be more
motivated and better educated if you had more auton-
omy in designing your program of study, could deter-
mine the best way for you to learn and gain mastery,
and could develop your own statement of purpose as to
why you were pursuing a particular program of study.
1. How might this change the university’s allocation
of resources (e.g., would more trained advisers
and career counselors be required, and how would
they be evaluated)?
2. If large numbers of students decided they would
learn some of the core materials best by taking an
online course, how might this affect the univer-
sity’s revenue stream? How might this change the
way professors teach courses?
3. Have each group member explain how this
approach might change his/her program of study.
4. Consider the potential pitfalls of such an approach
and how these might be addressed.
SMALL-GROUP EXERCISES
//// Module 11: Organizational
Implementation Processes
In this module, you will study the organizational imple-
mentation processes of your selected firm. You will
again rely on annual reports, news articles, and press
releases for information to analyze and formulate your
answers. You will identify a major strategic change the
firm should seriously consider implementing, and then
STRATEGY TERM PROJECT
WWW.YAZDANPRESS.COMWWW.YAZDANPRESS.COM

CHAPTER 11 Organizational Design: Structure, Culture, and Control 371
Implementation Stage Key Questions to Ask in This Stage
Stage 1
People, skills, and organizational structure
• When must the strategy/strategic initiative be implemented? (How flexible is that date?)
• Who is going to do it? What human skills are needed?
• Do affected employees understand their roles?
• Will the organization need to hire or lay off people? If so, how should we go about it?
• How should the firm be organized? What structure should be implemented? Why and how?
Stage 2
Organizational culture
• What culture in the organization is required for the implementation to be successful?
• If the current culture differs from the culture needed for the success of the strategy implementation, how should the firm go about changing its culture?
Stage 3
Reward system
• Is a reward structure in place to accomplish the task?
• If not, what type of reward structure needs to be introduced to ensure successful strategy implementation?
Stage 4
Resource requirements
• What resources (financial and otherwise) are needed?
• Are they in place?
• If not, how can the firm obtain the required resources?
Stage 5
Supporting activities
• How is the implementation to be supported?
• What policies, procedures, and IT support are needed?
• Does the firm need external help (e.g., consulting services)? If so, what kind of services would the firm need, and why?
Stage 6
Strategic leadership
• What types of strategic leaders are required to make the change happen?
• Does the firm have them in-house?
• Should the firm hire some strategic leaders from outside?
• How should the firm train its managers to create a pipeline of strategic leaders?
EXHIBIT 11.13 / Implementation Framework
follow a six-step process to study the implementation
impacts.
Implementation is a critical step in putting a
planned action into effect. It often introduces change
into the organization and can be met with strong
resistance. The six stages outlined in Exhibit 11.13
can help leaders and organizations determine how to
implement a particular plan. 71 These questions pro-
vide a framework for the strategic change. You may
be able to find a prior successful strategic change the
firm undertook and use this prior implementation as a
guide for your suggested change.
As you progress through the six stages, reflect on
what you have learned about your firm in the prior
modules. In some cases, you will need to make edu-
cated guesses for the answer since you are looking
at the implementation from outside the organiza-
tion. However, over the 10 modules you have com-
pleted, you have already learned much about the firm.
Answer the following questions for your selected
organization.
1. From your knowledge of the firm, identify a
major strategic change the firm should seriously
consider. Briefly describe what the goal of the ini-
tiative is for the organization.
2. Work your way through the six stages in Exhibit
11.13 , answering as many of the questions as you
can for the proposed strategic change. As you
develop the project plans with specifics for each
of the stages, the plan should provide flexibility,
allowing for unexpected contingencies to emerge.
WWW.YAZDANPRESS.COMWWW.YAZDANPRESS.COM

372 CHAPTER 11 Organizational Design: Structure, Culture, and Control
For What Type of Organization
Are You Best-Suited?
A s noted in the chapter, firms can have very distinc-tive cultures. Recall that Zappos has a standing offer to pay any new hire $2,000 to quit the company dur-
ing the first month. Zappos makes this offer to help ensure that those who stay with the company are comfortable in its “create fun and a little weirdness” environment.
You may have taken a personality test such as Myers-Briggs or The Big Five. These tests may be useful in gauging compat-ibility of career and personality types. They are often available for both graduate and undergraduate students at university career-placement centers. In considering the following questions, think about your next job and your longer-term career plans.
1. Review Exhibit 11.3 and circle the organizational characteristics you find appealing. Cross out those factors you think you would not like. Do you find a trend toward either the mechanistic or organic organization?
2. Have you been in school or work situations in which your values did not align with those of your peers or colleagues? How did you handle the situation? Are there certain values or norms important enough for you to consider as you look for a new job?
3. As you consider your career after graduation, which control-and-reward system discussed in the concluding section of the chapter would you find most motivating? Is this different from the controls used at some jobs you have had in the past?
my STRATEGY
1. Hsieh, T. (2010), Delivering Happiness: A Path to Profits, Passion, and Purpose (New
York: Business Plus), p. 130.
2. Ibid., p. 145.
3. Ibid., p. 177.
4. Ibid., pp. 157–160.
5. This ChapterCase is based on: Hsieh, T.
(2010), Delivering Happiness: A Path to Prof-its, Passion, and Purpose; and http://about.
zappos.com .
6. Barney, J. B. (1986), “Organizational
culture: Can it be a source of sustained com-
petitive advantage?” Academy of Management Review 11: 656–665.
7. Bossidy, L., R. Charan, and C. Burck
(2002), Execution: The Discipline of Get-ting Things Done (New York: Crown Busi-
ness); and Hrebiniak, L. G. (2005), Making Strategy Work: Leading Effective Execution and Change (Philadelphia: Wharton School
Publishing).
8. Grundy, T. (1998), “Strategy implementa-
tion and project management,” International Journal of Project Management 16: 43–50.
9. Bossidy, L., R. Charan, and C. Burck
(2002), Execution: The Discipline of Getting Things Done; and Herold, D. M., and
D. B. Fedor (2008), Change the Way You Lead Change: Leadership Strategies That Really
Work (Palo Alto, CA: Stanford University
Press).
10. “Yang’s exit doesn’t fix Yahoo,” The Wall Street Journal, November 19, 2008.
11. “Yahoo’s ad struggles persist,” The Wall Street Journal, April 16, 2013.
12. Herold, D. M., and D. B. Fedor (2008),
Change the Way You Lead Change.
13. Chandler, A. D. (1962), Strategy and Structure: Chapters in the History of Ameri-can Industrial Enterprise (Cambridge, MA:
MIT Press), p. 14 (italics added).
14. Hall, D. J., and M. A. Saias (1980),
“Strategy follows structure!” Strategic Man-agement Journal 1: 149–163.
15. Hill, C.W.L., and F. T. Rothaermel
(2003), “The performance of incumbent firms
in the face of radical technological innova-
tion,” Academy of Management Review 28:
257–274.
16. I gratefully acknowledge Professor Luis
Martins’ input on this exhibit.
17. In his insightful book, Finkelstein (2003)
identifies several key transition points that put
pressure on an organization and thus increase
the likelihood of subsequent failure. See
Finkelstein, S. (2003), Why Smart Executives Fail: And What You Can Learn from Their Mistakes (New York: Portfolio).
18. http://www.aboutmcdonalds.com/mcd/
our_company/leadership/don_thompson.html .
19. Fredrickson, J. W. (1986), “The strategic
decision process and organizational struc-
ture,” Academy of Management Review 11:
280–297; Eisenhardt, K. M. (1989), “Making
fast strategic decisions in high-velocity envi-
ronments,” Academy of Management Journal 32: 543–576; and Wally, S., and R. J. Baum
(1994), “Strategic decision speed and firm
performance,” Strategic Management Journal 24: 1107–1129.
20. Hamel, G. (2007), The Future of Manage-ment (Boston, MA: Harvard Business School
Press), p. 84.
21. This Strategy Highlight is based on:
Hamel, G. (2007), The Future of Manage-ment; Collins, J. (2009), How the Mighty Fall: And Why Some Companies Never Give In
(New York: HarperCollins); Collins, J., and
M. Hansen (2011), Great by Choice: Uncer-tainty, Chaos, and Luck—Why Some Thrive Despite Them All (New York: HarperCollins);
and www.gore.com .
22. The 9/11 Report. The National Commis-sion on Terrorist Attacks Upon the United States (2004), http://govinfo.library.unt.
edu/911/report/index.htm .
23. Child, J., and R. G. McGrath (2001),
“Organization unfettered: Organizational
ENDNOTES
WWW.YAZDANPRESS.COMWWW.YAZDANPRESS.COM

CHAPTER 11 Organizational Design: Structure, Culture, and Control 373
forms in the information-intensive economy,”
Academy of Management Journal 44:
1135–1148; and Huy, Q. N. (2002), “Emo-
tional balancing of organizational continu-
ity and radical change: The contribution of
middle managers,” Administrative Science Quarterly 47: 31–69.
24. Theobald, N. A., and S. Nicholson-
Crotty (2005), “The many faces of span of
control: Organizational structure across mul-
tiple goals,” Administration and Society 36:
648–660.
25. This section draws on: Burns, T., and
G. M. Stalker (1961), The Management of Innovation (London: Tavistock).
26. This section draws on: Burns, T., and G.
M. Stalker (1961), The Management of Inno-vation; Perry-Smith, J. E., and C. E. Shalley
(2003), “The social side of creativity: A static
and dynamic social network perspective,” Acad-emy of Management Review 28: 89–106; and
Shalley, C. E., and J. E. Perry-Smith (2008),
“The emergence of team creative cognition: The
role of diverse outside ties, sociocognitive net-
work centrality, and team evolution,” Strategic Entrepreneurship Journal 2: 23–41.
27. Hagel III, J., J. S. Brown, and L. Davison
(2010), The Power of Pull: How Small Moves, Smartly Made, Can Set Big Things in Motion
(Philadelphia: Basic Books); Majchrzak,
A., A. Malhotra, J. Stamps, and J. Lipnack
(2004), “Can absence make a team grow
stronger?” Harvard Business Review, May:
137–144; and Malhotra, A., A. Majchrzak,
and B. Rosen, (2007), “Leading far-flung
teams,” Academy of Management Perspectives
21: 60–70.
28. Bryan, L. L., and C. I. Joyce (2007),
“Better strategy through organizational
design,” The McKinsey Quarterly 2: 21–29.
29. Chandler, A. D. (1962), Strategy and Structure: Chapters in the History of Ameri-can Industrial Enterprise.
30. Ibid. Also, for a more recent treatise
across different levels of analysis, see Ridley, M.
(2010), The Rational Optimist: How Prosper-ity Evolves (New York: HarperCollins).
31. Rothaermel, F. T., and M. T. Alexandre
(2009), “Ambidexterity in technology sourc-
ing: The moderating role of absorptive capac-
ity,” Organization Science 20: 759–780.
32. Levinthal, D. A., and J. G. March (1993),
“The myopia of learning,” Strategic Management Journal 14: 95–112; and March, J. G. (1991),
“Exploration and exploitation in organizational
learning,” Organization Scien ce 2: 319–340.
33. Tushman, M., W. K. Smith, R. C. Wood,
and G. Westerman (2010), “Organizational
designs and innovation streams,” Industrial and Corporate Change 19: 1331–1366.
34. Ibid.
35. Chandler, A. D. (1962), Strategy and Structure: Chapters in the History of Ameri-can Industrial Enterprise.
36. www.gore.com .
37. Williamson, O. E. (1975), Markets and Hierarchies (Free Press: New York); and Wil-
liamson, O. E. (1985), The Economic Institu-tions of Capitalism (Free Press: New York).
38. Bryan, L. L., and C. I. Joyce (2007), “Better
strategy through organizational design”; Hagel
III, J., J. S. Brown, and L. Davison (2010),
The Power of Pull: How Small Moves, Smartly Made, Can Set Big Things in Motion; Maj-
chrzak, A., A. Malhotra, J. Stamps, and J. Lip-
nack (2004), “Can absence make a team grow
stronger?”; Malhotra, A., A. Majchrzak, and
B. Rosen (2007), “Leading far-flung teams.”
39. Brown, J. S., and P. Duguid (1991),
“Organizational learning and communities-of-
practice: Toward a unified view of working,
learning, and innovation,” Organization Sci-ence 2: 40–57.
40. This section draws on: Barney, J. B.
(1986), “Organizational culture: Can it be a
source of sustained competitive advantage?”;
Chatman, J. A., and S. Eunyoung Cha (2003),
“Leading by leveraging culture,” California Management Review 45: 19–34; Kerr, J., and
J. W. Slocum (2005), “Managing corporate
culture through reward systems,” Academy of Management Executive 19: 130–138;
O’Reilly, C. A., J. Chatman, and D. L.
Caldwell (1991), “People and organizational
culture: A profile comparison approach to
assessing person-organization fit,” Academy of Management Journal 34: 487–516; and
Schein, E. H. (1992), Organizational Culture and Leadership (San Francisco: Jossey-Bass).
41. In this video, Zappos employees speak
about what the 10 core values mean to them:
http://about.zappos.com/our-unique-culture/
zappos-core-values [3.50 min].
42. Chatman, J. A., and S. Eunyoung Cha (2003),
“Leading by leveraging culture,” pp. 19–34
43. Chao, G. T., A. M. O’Leary-Kelly, S.
Wolf, H. J. Klein, and P. D. Gardner (1994),
“Organizational socialization: Its content and
consequences,” Journal of Applied Psychology
79: 730–743.
44. Nelson, T. (2003), “The persistence of
founder influence: Management, ownership,
and performance effects at initial public
offering,” Strategic Management Journal 24:
707–724.
45. A&E Biography Video (1997), Sam Walton: Bargain Billionaire.
46. Friedman, T. L. (2005), The World Is Flat. A Brief History of the 21st Century (New York:
Farrar, Straus and Giroux), pp. 130–131.
47. Schneider, B., H. W. Goldstein, and
D. B. Smith (1995), “The ASA framework: An
update,” Personnel Psychology 48: 747–773.
48. Hsieh, T. (2010), Delivering Happiness. A Path to Profits, Passion, and Purpose, p. 145.
49. Less than 1 percent of new hires take
Zappos up on the $2,000 offer to quit during
the training program.
50. Leonard-Barton, D. (1995), Wellsprings of Knowledge: Building and Sustaining the Sources of Innovation (Boston, MA: Harvard
Business School Press).
51. Chandler, A. D. (1962), Strategy and Structure: Chapters in the History of Ameri-can Industrial Enterprise.
52. Birkinshaw, J. (2010), Reinventing Management. Smarter Choices for Getting Work Done (Chichester, West Sussex, UK:
Jossey-Bass).
53. This section is based on: Barney, J. B.
(1986), “Organizational culture: Can it be a
source of sustained competitive advantage?”;
Barney, J. (1991), “Firm resources and sus-
tained competitive advantage,” Journal of Management 17: 99–120; and Chatman, J. A.,
and S. Eunyoung Cha (2003), “Leading by
leveraging culture,” pp. 19–34.
54. Hoffer Gittel, J. (2003), The Southwest Airlines Way (Burr Ridge, IL: McGraw-
Hill); and O’Reilly, C., and J. Pfeffer
(1995), “Southwest Airlines: Using human
resources for competitive advantage,” case
study, Graduate School of Business, Stan-
ford University.
55. Hsieh, T. (2010), Delivering Happiness. A Path to Profits, Passion, and Purpose, p. 146.
56. See discussion in Chapter 4 on SWA’s
activities supporting its cost-leadership strat-
egy. Recently, SWA has experienced problems
with the fuselage of its 737 cracking prema-
turely. See: “Southwest’s solo flight in crisis,”
The Wall Street Journal, April 8, 2011.
57. Hsieh, T. (2010), Delivering Happiness. A Path to Profits, Passion, and Purpose, p. 146.
58. Chatman, J. A., and S. Eunyoung Cha
(2003), “Leading by leveraging culture,”
pp. 19–34.
59. Hoffer Gittel, J. (2003), The Southwest Airlines Way (Burr Ridge, IL: McGraw-Hill).
60. Baron, J. N., M. T. Hannan, and M. D.
Burton (2001), “Labor pains: Change in
organizational models and employee turn-
over in young, high-tech firms,” American Journal of Sociology 106: 960–1012; and
Hannan, M. T., M. D. Burton, and J. N. Baron
(1996), “Inertia and change in the early years:
Employment relationships in young, high
technology firms,” Industrial and Corporate Change 5: 503–537.
WWW.YAZDANPRESS.COMWWW.YAZDANPRESS.COM

374 CHAPTER 11 Organizational Design: Structure, Culture, and Control
61. Nelson, T. (2003), “The persistence of
founder influence: Management, ownership, and
performance effects at initial public offering,”
Strategic Management Journal 24: 707–724.
62. See the section “ Gaining & Sustaining Competitive Advantage: Mergers and Acquisi-
tions” in Chapter 9.
63. Herold, D. M., and D. B. Fedor (2008),
Change the Way You Lead Change: Leader-ship Strategies That Really Work.
64. Hsieh, T. (2010), Delivering Happiness: A Path to Profits, Passion, and Purpose (New
York: Business Plus).
65. Pink, D. H. (2009), Drive: The Surprising Truth about What Motivates Us (New York:
Riverhead Books).
66. Ibid.
67. 3M Company (2002), A Century of Inno-vation: The 3M Story (Maplewood, MN: The
3M Company).
68. The ChapterCase 11 information is based
on “Zappos screws up pricing and sells prod-
ucts at $1.6M below costs . . . Then honors
the sales!” Business Insider, May 23, 2010;
and “6pm.com pricing mistake,” The Zappos Family Blog, May 21, 2010.
69. “Zappos will honor $1.6 million pricing
mistake,” MSN MoneyCentral, May 25, 2010;
and “Amazon wields $25 gift certificates to
pacify frustrated comic book fans,” Tech-Crunch.com, March 9, 2010.
70. http://www.cleveland.com/steubenville-
rape-case/ , March 18, 2013.
71. Input for this module is used with the
permission of Blaine Lawlor, strategic
management professor, University of West
Florida.
WWW.YAZDANPRESS.COMWWW.YAZDANPRESS.COM

WWW.YAZDANPRESS.COMWWW.YAZDANPRESS.COM

376
Chapter 12
Corporate Governance and Business Ethics
Chapter Outline
12.1 The Shared Value Creation Framework Public Stock Companies and
Shareholder Capitalism Creating Shared Value
12.2 Corporate Governance Agency Theory The Board of Directors Other Governance Mechanisms
12.3 Strategy and Business Ethics
12.4 Implications for the Strategist
Learning Objectives
After studying this chapter, you should be able to:
LO 12-1 Describe the shared value creation frame-work and its relationship to competitive advantage.
LO 12-2 Explain the role of corporate governance.
LO 12-3 Apply agency theory to explain why and how companies use governance mecha-nisms to align interests of principals and agents.
LO 12-4 Evaluate the board of directors as the central governance mechanism for public stock companies.
LO 12-5 Evaluate other governance mechanisms.
LO 12-6 Explain the relationship between strategy and business ethics.
WWW.YAZDANPRESS.COMWWW.YAZDANPRESS.COM

377
W HP’s Boardroom
Soap Opera Continues
W ITH SOME $120 BILLION in annual revenues, Hewlett-Packard (HP) is still one of the largest technology companies in the world. Within a short 18-month period, however, HP’s market value dropped by almost 80 percent, from some $105 bil-lion in April 2010 to a mere $23 billion by November 2012, wiping out $82 billion in shareholder wealth. It turns out that a perfect storm of corporate- governance problems, combined with repeated ethical shortcom-ings, had been brewing at HP for a decade.
This development is even more astonishing given that, at one point, HP was much admired for its corpo-rate culture—known as “the HP Way.” The core values of the HP Way include “business conduct with uncom-promising integrity,” as well as “trust and respect for individuals,” among others (see Exhibit 12.1 ). The HP Way guided the company since its inception in 1938, when it was founded with some $500 of initial invest-ment in Dave Packard’s garage in Palo Alto, California. As one of the world’s most successful technology com-panies (think “laser printing”), HP initiated the famous technology cluster known as Silicon Valley. Over the last decade, however, HP’s board of directors—a group of individuals that is supposed to represent the interests of the firm’s shareholders and oversee the CEO—seemed to forget the HP Way as it violated its core values time and time again. In the process, HP’s board of directors acted out a sordid “soap opera,” with the season finale not yet in sight.
The first episode “aired” in 2006. The online tech-nology site CNET published an article on HP’s strategy. Quoting an anonymous source, the article disclosed sensitive details that could have only come from one of the directors or senior executives at HP. Eager to discover the identity of the leaker, Patricia Dunn, then chair of the board, launched a covert investigation. She hired an outside security firm to conduct surveillance on HP’s board members, selected employees, and even some journalists. Although it is common practice for companies to monitor phone and computer use of their employees, HP’s investigation went above and beyond. The private investigators used an illegal spying
technique called “pretexting” (impersonating the tar-gets) to obtain phone records by contacting the tele-com service providers. The security firm obtained some 300 telephone records covering mobile, home, and office phones of all directors (including Ms. Dunn), nine journalists, and several HP employees. Not to leave anything to chance, the security firm also obtained phone records of the spouses and even the children of suspected HP board members and employees. The firm also conducted physical surveillance of the sus-pected leaker—board member George Keyworth and his spouse—as well as two other directors.
In a May 2006 board meeting, Ms. Dunn presented the evidence gathered, implicating Mr. Keyworth as the source of the leak. Ms. Dunn’s disclosure of the investiga-tion infuriated HP director Thomas Perkins, a prominent venture capitalist, so much that he resigned on the spot. Mr. Perkins called the HP-initiated surveillance “illegal, unethical, and a misplaced corporate priority.” 1 Mr. Per-kins also forced HP to disclose the spying campaign to the SEC (and thus the public) as his reason for resigning. Ms. Dunn and Mr. Keyworth were dismissed from the board along with six senior HP managers. Despite the boardroom drama, HP came out unscathed financially, largely due to the superior performance of then-CEO Mark Hurd.
Mark Hurd was appointed Hewlett-Packard’s CEO in the spring of 2005. He began his business career 25 years earlier as an entry-level salesperson with NCR, a U.S. technology company best known for its bar code scanners in retail outlets and automatic teller machines (ATMs). By the time he worked his way up to the role of CEO at NCR, he had earned a reputation as a low-profile, no-nonsense manager focused on flawless strategy execution. When he was appointed HP’s CEO, industry analysts praised its
CHAPTER CASE 12
WWW.YAZDANPRESS.COMWWW.YAZDANPRESS.COM

378
board of directors. Moreover, investors hoped that Mr. Hurd would run an efficient and lean operation at HP and return the company to its former greatness and, above all, profitability.
Mr. Hurd did not disappoint. By all indications, he was highly successful at the helm of HP. The company became number one in desktop computer sales and increased its lead in inkjet and laser printers to more than 50 per-cent market share. Through significant cost-cutting and streamlining measures, Mr. Hurd turned HP into a lean operation. For example, he oversaw large-scale layoffs and a pay cut for all remaining employees as he reorga-nized the company. Wall Street rewarded HP shareholders with an almost 90 percent stock price appreciation during Mr. Hurd’s tenure (see Exhibit 12.2 ), outperforming the S&P 500 composite index by a wide margin.
Yet, in the summer of 2010, HP aired the second sea-son of its boardroom soap opera. The HP board found itself caught “between a rock and a hard place,” with no
easy options in sight. Jodie Fisher, a former adult-movie actress, filed a lawsuit against Mr. Hurd, alleging sexual harassment. As an independent contractor, she worked as a hostess at HP-sponsored events. In this function, she screened attending HP customers and personally ensured that Mr. Hurd would spend time with the most impor-tant ones. With another ethics scandal looming despite Mr. Hurd’s stellar financial results for the company, HP’s board of directors forced him to resign. He left HP in August 2010 with an exit package worth $35 million.
The third season of HP’s soap opera began in the fall of 2010 when HP announced Leo Apotheker as its new CEO. Mr. Apotheker, who came to HP after being let go from the German enterprise software company SAP, proposed a new corporate strategy for HP. He suggested that the company focus on enterprise software solutions and spin out its low-margin consumer hardware busi-ness. HP’s consumer hardware business resulted from the $25 billion legacy acquisition of Compaq during the
We have trust and respect for individuals.
• We approach each situation with the belief that people want to do a good job and will do so, given the proper tools and support. We attract highly capable, diverse, innovative people and recognize their efforts and contributions to the company. HP people contribute enthusiastically and share in the success that they make possible.
We focus on a high level of achievement and contribution.
• Our customers expect HP products and services to be of the highest quality and to provide lasting value. To achieve this, all HP people, especially managers, must be leaders who generate enthusiasm and respond with extra effort to meet customer needs. Techniques and management practices which are effective today may be outdated in the future. For us to remain at the forefront in all our activities, people should always be looking for new and better ways to do their work.
We conduct our business with uncompromising integrity.
• We expect HP people to be open and honest in their dealings to earn the trust and loyalty of others. People at every level are expected to adhere to the highest standards of business ethics and must understand that anything less is unacceptable. As a practical matter, ethical conduct cannot be assured by written HP policies and codes; it must be an integral part of the organization, a deeply ingrained tradition that is passed from one generation of employees to another.
We achieve our common objectives through teamwork.
• We recognize that it is only through effective cooperation within and among organizations that we can achieve our goals. Our commitment is to work as a worldwide team to fulfill the expectations of our customers, shareholders and others who depend upon us. The benefits and obligations of doing business are shared among all HP people.
We encourage flexibility and innovation.
• We create an inclusive work environment which supports the diversity of our people and stimulates innovation. We strive for overall objectives which are clearly stated and agreed upon, and allow people flexibility in working toward goals in ways that they help determine are best for the organization. HP people should personally accept responsibility and be encouraged to upgrade their skills and capabilities through ongoing training and development. This is especially important in a technical business where the rate of progress is rapid and where people are expected to adapt to change.
EXHIBIT 12.1 / The HP Way
SOURCE: Hewlett-Packard Alumni Association, http://www.hpalumni.org/hp_way.htm.
WWW.YAZDANPRESS.COMWWW.YAZDANPRESS.COM
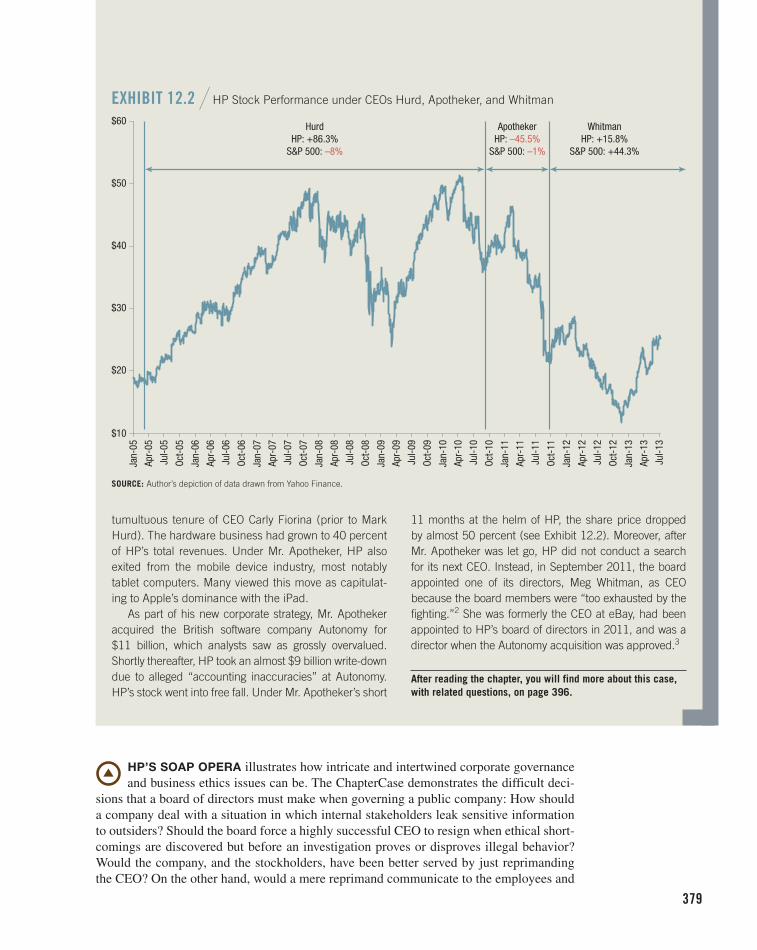
379
$10
$20
$30
$40
$50
$60Ja
n-05
Apr-
05
Jul-0
5
Oct-
05
Jan-
06
Apr-
06
Jul-0
6
Oct-
06
Jan-
07
Apr-
07
Jul-0
7
Oct-
07
Jan-
08
Apr-
08
Jul-0
8
Oct-
08
Jan-
09
Apr-
09
Jul-0
9
Oct-
09
Jan-
10
Apr-
10
Jul-1
0
Oct-
10
Jan-
11
Apr-
11
Jul-1
1
Oct-
11
Jan-
12
Apr-
12
Jul-1
2
Oct-
12
Jan-
13
Apr-
13
Jul-1
3
ApothekerHP: –45.5%
S&P 500: –1%
WhitmanHP: +15.8%
S&P 500: +44.3%
HurdHP: +86.3%
S&P 500: –8%
EXHIBIT 12.2 / HP Stock Performance under CEOs Hurd, Apotheker, and Whitman
SOURCE: Author’s depiction of data drawn from Yahoo Finance.
tumultuous tenure of CEO Carly Fiorina (prior to Mark Hurd). The hardware business had grown to 40 percent of HP’s total revenues. Under Mr. Apotheker, HP also exited from the mobile device industry, most notably tablet computers. Many viewed this move as capitulat-ing to Apple’s dominance with the iPad.
As part of his new corporate strategy, Mr. Apotheker acquired the British software company Autonomy for $11 billion, which analysts saw as grossly overvalued. Shortly thereafter, HP took an almost $9 billion write-down due to alleged “accounting inaccuracies” at Autonomy. HP’s stock went into free fall. Under Mr. Apotheker’s short
11 months at the helm of HP, the share price dropped by almost 50 percent (see Exhibit 12.2 ). Moreover, after Mr. Apotheker was let go, HP did not conduct a search for its next CEO. Instead, in September 2011, the board appointed one of its directors, Meg Whitman, as CEO because the board members were “too exhausted by the fighting.” 2 She was formerly the CEO at eBay, had been appointed to HP’s board of directors in 2011, and was a director when the Autonomy acquisition was approved. 3
After reading the chapter, you will find more about this case, with related questions, on page 396.
HP’S SOAP OPERA illustrates how intricate and intertwined corporate governance
and business ethics issues can be. The Chapter Case demonstrates the difficult deci-
sions that a board of directors must make when governing a public company: How should
a company deal with a situation in which internal stakeholders leak sensitive information
to outsiders? Should the board force a highly successful CEO to resign when ethical short-
comings are discovered but before an investigation proves or disproves illegal behavior?
Would the company, and the stockholders, have been better served by just reprimanding
the CEO? On the other hand, would a mere reprimand communicate to the employees and
WWW.YAZDANPRESS.COMWWW.YAZDANPRESS.COM

380 CHAPTER 12 Corporate Governance and Business Ethics
other stakeholders that performance trumps ethics? What due diligence should a board of
directors apply when approving a multibillion-dollar acquisition or appointing a new
CEO? The Chapter Case highlights how failure in corporate governance and ethical short-
comings by executives can dramatically affect firm performance. Many observers place the
blame for HP’s loss in competitive advantage and stellar reputation squarely on its board of
directors because of major strategic errors committed over the last decade. 4
In this chapter, we wrap up our discussion of strategy implementation and close the
circle in the AFI framework by studying two important areas: corporate governance and
business ethics. To be effective as a strategist, you must understand and appreciate the
link between business and society. This chapter first introduces the shared value creation framework to illuminate the link between strategic management, competitive advantage,
and society more fully. We then discuss effective corporate-governance mechanisms to
direct and control the enterprise, which a firm must put in place to ensure pursuit of its
intended goals. Next, we study business ethics, which enable managers to think through
complex decisions in an increasingly dynamic, interdependent, and global marketplace.
We conclude with practical implications for the strategist.
12.1 The Shared Value Creation Framework
The shared value creation framework provides guidance to managers about how to recon-
cile the economic imperative of gaining and sustaining competitive advantage with cor-
porate social responsibility (introduced in Chapter 1). 5 It helps managers create a larger
pie that benefits both shareholders and other stakeholders. To develop the shared value
creation framework, though, we first must understand the role of the public stock company.
PUBLIC STOCK COMPANIES AND SHAREHOLDER CAPITALISM
The public stock company is an important institutional arrangement in modern, free-
market economies. It provides goods and services as well as employment, pays taxes, and
increases the standard of living. There exists an implicit contract based on trust between
society and the public stock company. Society grants the right to incorporation, but in turn
expects companies to be good citizens by adding value to society.
Exhibit 12.3 depicts the levels of hierarchy within a public stock company. The state (or
society) grants a charter of incorporation to the company’s shareholders—its owners, who
legally own stock in the company. The shareholders appoint a board of directors to govern
and oversee the firm’s management. The managers in turn hire, supervise, and coordi-
nate employees to manufacture products and provide services. The public stock company
enjoys four characteristics that make it an attractive corporate form: 6
1. Limited liability for investors. This characteristic means that the shareholders who pro-
vide the risk capital are liable only to the capital specifically invested, and not for other
investments they may have made or for their personal wealth. Limited liability encour-
ages investments by the wider public and entrepreneurial risk-taking.
2. Transferability of investor ownership through the trading of shares of stock on exchanges
such as the New York Stock Exchange (NYSE) and NASDAQ, 7 or exchanges in other
countries. Each share represents only a minute fraction of ownership in a company,
thus easing transferability.
3. Legal personality —that is, the law regards a non-living entity such as a for-profit firm
as similar to a person, with legal rights and obligations. Legal personality allows a
firm’s continuation beyond the founder or the founder’s family.
LO 12-1
Describe the shared value creation framework and its relationship to competitive advantage.
WWW.YAZDANPRESS.COMWWW.YAZDANPRESS.COM

CHAPTER 12 Corporate Governance and Business Ethics 381
4. Separation of legal ownership and management control. 8 In publicly traded com-
panies, the stockholders (the principals, represented by the board of directors) are
the legal owners of the company, and they delegate decision-making authority to
professional managers (the agents).
The public stock company has been a major contributor to value creation since its
inception as a new organizational form over one hundred years ago. Michael Porter and
others, however, argue that many public companies have defined value creation too nar-
rowly in terms of financial performance. 9 This in turn has contributed to some of the black swan events discussed in Chapter 1, such as large-scale accounting scandals and the global
financial crisis. Managers’ pursuit of strategies that define value creation too narrowly may
have negative consequences for society at large, as evidenced during the global financial
crisis. This narrow focus has contributed to the loss of trust in the corporation as a vehicle
for value creation, not only for shareholders but also other stakeholders and society.
Nobel laureate Milton Friedman stated his view of the firm’s social obligations:
“There is one and only one social responsibility of business—to use its resources and
engage in activities designed to increase its profits so long as it stays within the rules of
the game, which is to say, engages in open and free competition without deception or
fraud.” 10 This notion is often captured by the term shareholder capitalism. According
to this perspective, shareholders—the providers of the necessary risk capital and the
legal owners of public companies—have the most legitimate claim on profits. When
introducing the notion of corporate social responsibility (CSR) in Chapter 1, though,
we noted that a firm’s obligations frequently go beyond the economic responsibility to
increase profits, extending to ethical and philanthropic expectations that society has of
the business enterprise. 11
A recent survey measured attitudes toward business responsibility in various countries.
The survey asked the top 25 percent of income earners holding a university degree in each
country surveyed whether they agree with Milton Friedman’s philosophy that “the social responsibility of business is to increase its profits.” 12 The results, displayed in Exhibit 12.4 ,
revealed some intriguing national differences. The United Arab Emirates (UAE), a small
and business-friendly federation of seven emirates, had the highest level of agreement, at
84 percent. The top five also included a number of Asian countries (Japan, India, South
Korea, and Singapore), where roughly two-thirds agreed.
The countries where the fewest people agreed with Friedman’s philosophy were China,
Brazil, Germany, Italy, and Spain; fewer than 40 percent of respondents in those coun-
tries supported an exclusive focus on shareholder capitalism. Although they have achieved
a high standard of living, European countries such as Germany have tempered the free-
market system with a strong social element, leading to so-called social market economies. The respondents from these countries seemed to be more supportive of a stakeholder strat-egy approach to business. Some critics, however, would argue that too strong a focus on
the social dimension contributed to the European debt crisis because sovereign govern-
ments such as Greece, Italy, and Spain took on nonsustainable debt levels to fund social
programs such as early retirement plans, government-funded health care, and so on. The
United States placed roughly in the middle of the continuum. In particular, a bit more than
half (56 percent) of U.S. respondents subscribed to Friedman’s philosophy.
CREATING SHARED VALUE
In contrast to Milton Friedman, Porter argues that executives should not concentrate exclu-
sively on increasing firm profits. Rather, the strategist should focus on creating shared value, a concept that involves creating economic value for shareholders while also creating
EMPLOYEES
MANAGEMENT
BOARD OFDIRECTORS
SHAREHOLDERS
STATE CHARTER
D
D
D
D
EXHIBIT 12.3 /The Public Stock Company: Hierarchy of Authority
WWW.YAZDANPRESS.COMWWW.YAZDANPRESS.COM

382 CHAPTER 12 Corporate Governance and Business Ethics
0%
10%
20%
30%
40%
50%
60%
70%
80%
90%
UnitedArab
Emirates
Japan India SouthKorea
Singapore U.S.A. China Brazil Germany Italy Spain
EXHIBIT 12.4 / Global Survey of Attitudes Toward Business Responsibility
The bar chart indicates the percentage of mem-bers of the “informed public” who “strongly agree/somewhat agree” with Milton Friedman’s philosophy, “the social responsibility of business is to increase its profits.”
SOURCE: Author’s depiction of data from Edelman’s (2011) Trust Barometer as included in “Milton Friedman goes on tour,” The Economist, January 27, 2011.
social value by addressing society’s needs and challenges. He argues that managers need
to reestablish the important relationship between superior firm performance and societal
progress. This dual point of view, Porter argues, will not only allow companies to gain and
sustain a competitive advantage but also reshape capitalism and its relationship to society.
The shared value creation framework proposes that managers maintain a dual focus
on shareholder value creation and value creation for society. It recognizes that markets are
defined not only by economic needs but also by societal needs. It also advances the per-
spective that externalities such as pollution, wasted energy, and costly accidents actually
create internal costs, at least in lost reputation if not directly on the bottom line. Rather
than pitting economic and societal needs in a trade-off, Porter suggests that the two can
be reconciled to create a larger pie. The shared value creation framework seeks to enhance
a firm’s competitiveness by identifying connections between economic and social needs,
and then creating a competitive advantage by addressing these business opportunities.
GE, for example, has strengthened its competitiveness by creating a profitable busi-
ness with its “green” ecomagination initiative. Ecomagination is GE’s strategic initiative
to provide cleaner and more efficient sources of energy, provide abundant sources of clean
water anywhere in the world, and reduce emissions. 13 Jeffrey Immelt, GE’s CEO, is fond
of saying: “Green is green,” 14 meaning that addressing ecological needs offers the poten-
tial of gaining and sustaining a competitive advantage for GE. Through applying strate-
gic innovation, GE is providing solutions for some tough environmental challenges, while
driving company growth at the same time. Ecomagination solutions and products allow
GE to increase the perceived value it creates for its customers while lowering costs to pro-
duce and deliver the “green” products and services. Ecomagination allows GE to solve the
trade-off between increasing value creation and lower costs at the same time. This in turn
enhances GE’s economic value creation and its competitive advantage. Moreover, ecomag-ination products and services also create value for society in terms of reducing emissions
and lowering energy consumption, among other benefits. In 2012, GE’s ecomagination
strategic initiative alone generated $25 billion in revenues. Just to put this in perspective,
shared value
creation framework
A model proposing that managers have a dual focus on shareholder value creation and value creation for society.
WWW.YAZDANPRESS.COMWWW.YAZDANPRESS.COM

CHAPTER 12 Corporate Governance and Business Ethics 383
if GE’s ecomagination were a standalone company, it would rank at roughly #110 in the
Fortune 500 of largest public companies in the U.S., approximately equal in size to Rite
Aid and Staples. 15
To ensure that managers can reconnect economic and societal needs, Michael Porter
recommends that managers focus on three things within the shared value creation
framework: 16
1. Expand the customer base to bring in nonconsumers such as those at the bottom of the pyramid —the largest but poorest socioeconomic group of the world’s population. The
bottom of the pyramid in the global economy can yield significant business opportuni-
ties, which—if satisfied—could improve the living standard of the world’s poorest.
Muhammad Yunus, Nobel Peace Prize winner, founded Grameen Bank in Bangladesh
to provide small loans (termed microcredit) to impoverished villagers, who used the
funding for entrepreneurial ventures that would help them climb out of poverty. Other
businesses have also found profitable opportunities at the bottom of the pyramid. In
India, Arvind Mills offers jeans in a ready-to-make kit that costs only a fraction of the
high-end Levi’s. The Tata Group sells its Nano car for around 150,000 rupees (less than
$2,500), enabling more Indian families to move from mopeds to cars and adding up to
a substantial business.
2. Expand traditional internal firm value chains to include more nontraditional partners
such as nongovernmental organizations (NGOs). NGOs are nonprofit organizations
that pursue a particular cause in the public interest, and are independent of any govern-
ments. Habitat for Humanity and Greenpeace are examples of NGOs.
3. Focus on creating new regional clusters , such as Silicon Valley in the U.S., Electronic
City in Bangalore, India, and Chilecon Valley in Santiago, Chile.
In line with stakeholder theory (discussed in Chapter 1), Porter argues that these stra-
tegic actions will in turn lead to a larger pie of revenues and profits that can be distributed
among a company’s stakeholders. General Electric, for example, recognizes a convergence
between shareholders and stakeholders to create shared value. It states in its Governance
Principles: “Both the board of directors and management recognize that the long-term
interests of shareowners are advanced by responsibly addressing the concerns of other
stakeholders and interested parties, including employees, recruits, customers, suppliers,
GE communities, government officials and the public at large.” 17 To ensure that conver-
gence indeed takes place, companies need effective governance mechanisms, which we
discuss next.
12.2 Corporate Governance
Corporate governance concerns the mechanisms to direct and control an enterprise in
order to ensure that it pursues its strategic goals successfully and legally. 18 Corporate gov-
ernance is about checks and balances and about asking the tough questions at the right
time. The accounting scandals of the early 2000s and the global financial crisis of 2008
and beyond got so out of hand because the enterprises involved did not practice effective
corporate governance.
Corporate governance attempts to address the principal–agent problem (introduced in
Chapter 8), which can occur any time an agent performs activities on behalf of a princi-
pal. 19 This problem can arise whenever a principal delegates decision making and control
over resources to agents, with the expectation that they will act in the principal’s best inter-
est. We mentioned earlier that the separation of ownership and control is one of the major
advantages of the public stock companies. This benefit, however, is also the source of the
LO 12-2
Explain the role of corporate governance.
corporate governance
A system of mechanisms to direct and control an enterprise in order to ensure that it pursues its strategic goals successfully and legally.
WWW.YAZDANPRESS.COMWWW.YAZDANPRESS.COM

384 CHAPTER 12 Corporate Governance and Business Ethics
principal–agent problem. In publicly traded companies, the stockholders are the legal own-
ers of the company, but they delegate decision-making authority to professional manag-
ers. The conflict arises if the agents pursue their own personal interests, which can be at
odds with the principals’ goals. For their part, agents may be more interested in maximiz-
ing their total compensation, including benefits, job security, status, and power. Principals
desire maximization of total returns to shareholders.
The risk of opportunism on behalf of agents is exacerbated by information asymmetry: the agents are generally better informed than the principals. Exhibit 12.5 depicts the prin-
cipal–agent relationship.
Managers, executives, and board members tend to have access to private information
concerning important company developments that outsiders, especially investors, are not
privy to. Often this informational advantage is based on timing—insiders are the first
to learn about important developments before the information is released to the public.
Although possessing insider information is not illegal and indeed is part of an executive’s
job, what is illegal is acting upon it through trading stocks or passing on the information to
others who might do so. Insider-trading cases, therefore, provide an example of egregious
exploitation of information asymmetry. The hedge fund Galleon Group (holding assets
worth $7 billion under management at its peak) was engulfed in an insider-trading scandal
involving private information about important developments at companies such as Gold-
man Sachs, Google, IBM, Intel, and P&G. 20 Galleon Group’s founder, Raj Rajaratnam, the
mastermind behind a complex network of informants, was sentenced to 11 years in prison
and fined over $150 million. In one instance, an Intel manager had provided Rajaratnam
with internal Intel data such as orders for processors and production runs. These data
indicated that demand for Intel processors was much higher than analysts had expected.
Galleon bought Intel stock well before this information was public to benefit from the
anticipated share appreciation.
In another instance, Rajaratnam benefitted from insider tips provided by Rajat Gupta,
a former McKinsey chief executive who served on Goldman Sachs’ board. Often within
seconds after a Goldman Sachs board meeting ended, Gupta called Rajaratnam. In one of
these phone calls, Gupta revealed the impending multibillion-dollar liquidity injection by
Warren Buffett into Goldman Sachs during the midst of the global financial crisis. This
information allowed the Galleon Group to buy Goldman Sachs shares before the official
announcement about Buffett’s investment
was made, profiting from the subsequent
stock appreciation. In another call, Gupta
informed Rajaratnam that the investment
bank would miss earnings estimates. Based
on this insider information, the Galleon
Group was able to sell its holdings in Gold-
man Sachs’ stock prior to the announce-
ment, avoiding a multimillion-dollar loss. 21
Information asymmetry also can breed
on-the-job consumption, perquisites, and
excessive compensation. Although use
of company funds for golf outings, resort
retreats, attending professional sporting
events, or having elegant dinners and other
entertainment is an everyday manifestation
of on-the-job consumption, other forms are
more extreme. Dennis Kozlowski, former
EXHIBIT 12.5 / The Principal–Agent Problem
AgentPrincipal
hires, monitors,and compensates
InformationAsymmetry
performs work, providestime and talents
WWW.YAZDANPRESS.COMWWW.YAZDANPRESS.COM

CHAPTER 12 Corporate Governance and Business Ethics 385
CEO of Tyco, a diversified conglomerate, used company funds for his $30 million New York
City apartment (the shower curtain alone was $6,000) and for a $2 million birthday party for
his second wife. 22 John Thain, former CEO of Merrill Lynch, spent $1.2 million of company
funds on redecorating his office, while he demanded cost cutting and frugality from his
employees. 23 Such uses of company funds, in effect, mean that shareholders pay for those
items and activities. Mr. Thain also allegedly requested a bonus in the range of $10 to $30
million in 2009 despite Merrill Lynch having lost billions of dollars and being unable to con-
tinue as an independent company. (Merrill Lynch was later acquired by Bank of America.)
AGENCY THEORY
The principal–agent problem is a core part of agency theory, which views the firm as a
nexus of legal contracts. 24 In this perspective, corporations are viewed merely as a set of legal
contracts between different parties. Conflicts that may arise are to be addressed in the legal
realm. Agency theory finds its everyday application in employment contracts, for example.
Besides dealing with the relationship between shareholders and managers, principal–
agent problems also cascade down the organizational hierarchy (shown in Exhibit 12.3 ).
Senior executives, such as the CEO, face agency problems when they delegate authority
of strategic business units to general managers. Employees who perform the actual opera-
tional labor are agents who work on behalf of the managers. Such front-line employees
often enjoy an informational advantage over management. They may tell their supervi-
sor that it took longer to complete a project or serve a customer than it actually did, for
example. Some employees may be tempted to use such informational advantage for their
own self-interest (e.g., spending time on Facebook during work hours, watching YouTube
videos, or using the company’s computer and Internet connection for personal business).
The managerial implication of agency theory relates to the management functions of
organization and control: The firm needs to design work tasks, incentives, and employment
contracts and other control mechanisms in ways that minimize opportunism by agents.
Such governance mechanisms are used to align incentives between principals and agents.
These mechanisms need to be designed in such a fashion as to overcome two specific
agency problems: adverse selection and moral hazard.
ADVERSE SELECTION. In general, adverse selection occurs when information asym-
metry increases the likelihood of selecting inferior alternatives. In principal–agent relation-
ships, for example, adverse selection describes a situation in which an agent misrepresents
his or her ability to do the job. Such misrepresentation is common during the recruiting
process. Once hired, the principal may not be able to accurately assess whether the agent
can do the work for which he or she is being paid. The problem is especially pronounced in
team production, when the principal often cannot ascertain the contributions of individual
team members. This in turn creates an incentive for opportunistic employees to free-ride
on the efforts of others.
MORAL HAZARD. In general, moral hazard describes a situation in which information
asymmetry increases the incentive of one party to take undue risks or shirk other respon-
sibilities because the costs incur to the other party. For example, bailing out homeowners
from their mortgage obligations or bailing out banks from the consequences of undue risk-
taking in lending are examples of moral hazard. The costs of default are rolled over to soci-
ety. Knowing that there is a high probability of being bailed out (“too big to fail”) increases
moral hazard. In this scenario, any profits occurring due to a competitive advantage remain
private, while losses become public.
LO 12-3
Apply agency theory to explain why and how companies use governance mechanisms to align interests of principals and agents.
adverse selection
A situation that occurs when information asymmetry increases the likelihood of selecting inferior alternatives.
agency theory A theory that views the firm as a nexus of legal contracts.
moral hazard
A situation in which information asymmetry increases the incentive of one party to take undue risks or shirk other responsibilities because the costs incur to the other party.
WWW.YAZDANPRESS.COMWWW.YAZDANPRESS.COM

386 CHAPTER 12 Corporate Governance and Business Ethics
In the principal–agent relationship, moral hazard describes the difficulty of the prin-
cipal to ascertain whether the agent has really put forth a best effort. In this situation,
the agent is able to do the work but may decide not to do so. For example, a company
scientist at a biotechnology company may decide to work on his own research project,
hoping to eventually start his own firm, rather than on the project he was assigned. 25
While working on his own research on company time, he might also use the company’s
laboratory and technicians. Given the complexities of basic research, it is often chal-
lenging, especially for nonscientist principals, to ascertain which problem a scientist is
working on. 26 To overcome these principal–agent problems, firms put several governance
mechanisms in place. We shall discuss several of them next, beginning with the board of
directors.
THE BOARD OF DIRECTORS
The shareholders of public stock companies appoint a board of directors to represent
their interests. The board of directors is the centerpiece of corporate governance in such
companies. The shareholders’ interests, however, are not uniform. The goals of some
shareholders, such as institutional investors (e.g., retirement funds, governmental bodies,
and so on), are generally the long-term viability of the enterprise combined with profitable
growth. Long-term viability and profitable growth should allow consistent dividend pay-
ments and result in stock appreciation over time. The goals of other shareholders, such as
hedge funds, are often to profit from short-term movements of stock prices. These more
proactive investors often demand changes in a firm’s strategy, such as spinning out cer-
tain divisions or splitting up companies into parts to enhance overall performance. Votes
at shareholder meetings, generally in proportion to the amount of ownership, determine
whose representatives are appointed to the board of directors.
The Chapter Case illustrated that a board of directors may not always act in the best
interests of shareholders. In the case of HP, one can argue that poor strategic deci-
sions taken by the board led to billions of dollars of shareholder value destruction.
Indeed, shareholders have filed lawsuits against HP’s board of directors in conjunction
with Mark Hurd’s forced resignation and for allegedly misleading statements by Leo
Apotheker about HP’s commitment to mobile devices (a segment which HP later exited
under Apotheker).
The day-to-day business operations of a publicly traded stock company are conducted
by its managers and employees, under the direction of the chief executive officer (CEO)
and the oversight of the board of directors. The board of directors is composed of inside
and outside directors who are elected by the shareholders: 27
■ Inside directors are generally part of the company’s senior management team, such
as the chief financial officer (CFO) and the chief operating officer (COO). They are
appointed by shareholders to provide the board with necessary information pertain-
ing to the company’s internal workings and performance. Without this valuable inside
information, the board would not be able to effectively monitor the firm. As senior
executives, however, inside board members’ interests tend to align with management
and the CEO rather than the shareholders.
■ Outside directors, on the other hand, are not employees of the firm. They frequently
are senior executives from other firms or full-time professionals, who are appointed to
a board and who serve on several boards simultaneously. Given their independence,
they are more likely to watch out for the interests of shareholders.
LO 12-4
Evaluate the board of directors as the central governance mechanism for public stock companies.
WWW.YAZDANPRESS.COMWWW.YAZDANPRESS.COM

CHAPTER 12 Corporate Governance and Business Ethics 387
The board is elected by the shareholders to represent their interests. Each director has
a fiduciary responsibility toward the shareholders because of the trust placed in him or
her. Prior to the annual shareholders’ meeting, the board proposes a slate of nominees,
although shareholders can also directly nominate director candidates. In general, large
institutional investors support their favored candidates through their accumulated proxy
votes. The board members meet several times a year to review and evaluate the company’s
performance and to assess its future strategic plans as well as opportunities and threats. In
addition to general strategic oversight and guidance, the board of directors has other, more
specific functions, including:
■ Selecting, evaluating, and compensating the CEO. The CEO reports to the board.
Should the CEO lose the board’s confidence, the board may fire him or her.
■ Overseeing the company’s CEO succession plan. Both HP and Apple have been crit-
icized for poor succession planning. HP’s board was apparently unprepared to deal
with the unexpected departure of Mark Hurd. 28 Likewise, institutional shareholders
criticized Apple’s board for not (publicly) addressing CEO succession in light of Steve
Jobs’ repeated medical leaves. 29
■ Providing guidance to the CEO in the selection, evaluation, and compensation of other
senior executives.
■ Reviewing, monitoring, evaluating, and approving any significant strategic initiatives
and corporate actions such as large acquisitions.
■ Conducting a thorough risk assessment and proposing options to mitigate risk. The
boards of directors of the financial firms at the center of the global financial crisis were
faulted for not noticing or not appreciating the risks the firms were exposed to.
■ Ensuring that the firm’s audited financial statements represent a true and accurate pic-
ture of the firm.
■ Ensuring the firm’s compliance with laws and regulations. The boards of directors of
firms caught up in the large accounting scandals were faulted for being negligent in
their company oversight and not adequately performing several of the functions listed
here.
Board independence is critical to effectively fulfilling a board’s governance responsi-
bilities. Given that board members are directly responsible to shareholders, they have an
incentive to ensure that the shareholders’ interests are pursued. If not, they can experience
a loss in reputation or can be removed outright. More and more directors are also exposed
to legal repercussions should they fail in their fiduciary responsibility. To perform their
strategic oversight tasks, board members apply the strategic management theories and con-
cepts presented herein, among other more specialized tools such as those originating in
finance and accounting. Strategy Highlight 12.1 takes a closer look at the composition and
workings of General Electric’s board of directors.
board of directors
The centerpiece of corporate governance, composed of inside and outside directors who are elected by the shareholders.
inside directors
Board members who are generally part of the company’s senior management team; appointed by shareholders to provide the board with necessary information pertaining to the company’s internal workings and performance.
outside directors
Board members who are not employees of the firm, but who are frequently senior executives from other firms or full-time professionals. Given their independence, they are more likely to watch out for shareholder interests.
WWW.YAZDANPRESS.COMWWW.YAZDANPRESS.COM

388 CHAPTER 12 Corporate Governance and Business Ethics
GE’s Board of Directors
The GE board is composed of individuals from the busi-ness world (chairpersons and CEOs of Fortune 500 compa-nies spanning a range of industries), academia (business school and science professors, deans, and provosts), and government (SEC).30 Including the board’s chairperson, there are 17 members on GE’s board. Experts in corporate governance consider an appropriate number of directors for a company of GE’s size (roughly $250 billion in mar-ket capitalization as of summer 2013). In contrast, Apple’s board of directors has only eight members, while its mar-ket capitalization is about $425 billion. Indeed, Apple’s board of directors has been criticized for having become too insular in recent years.31
At GE (as of 2013), 16 of the 17 board members (94 percent) are independent outside directors. To achieve board independence, experts in corporate governance recommend that two-thirds of its directors be outsiders. GE’s board has only one inside director, Jeffrey Immelt, GE’s CEO, who also acts as chairman of the board. In roughly one half of U.S. public firms, the CEO of the com-pany also serves as chair of the board of directors.
This practice of duality—holding both the role of CEO and chairperson of the board—has been declining some-what in recent years. Arguments can be made both for and against splitting the roles of CEO and chairman of the board. On the one hand, the CEO has invaluable inside information that can help in chairing the board effec-tively. On the other hand, the chairperson may influence
the board unduly through setting the meeting agendas or suggesting board appointees who are friendly toward the CEO. The recent trend toward separation of CEO/chair duality is likely to continue. Because one of the key roles of the board is to monitor and evaluate the CEO’s perfor-mance, there can be a conflict of interest when the CEO actually chairs the board.
GE’s board of directors meets a dozen or more times annually. With increasing board accountability in recent years, boards now tend to meet more often. Moreover, many firms limit the number and type of directorships a board member may hold concurrently.32 To accomplish their responsibilities, boards of directors are usually orga-nized into different committees. GE’s board has five com-mittees, each with its own chair: the audit committee; the management development and compensation committee; the nominating, corporate governance and public respon-sibilities committee; the risk committee; and the science and technology committee.
In general, women and minorities remain underrepre-sented on boards of directors across the U.S. and through-out most of the world. GE’s board is actually fairly diverse when compared with other Fortune 500 companies, which averaged less than 16 percent women on their boards (versus 28 percent for GE). Diversity in backgrounds and expertise in the boardroom is considered an asset: More diverse boards are less likely to fall victim to groupthink, a situation in which opinions coalesce around a leader with-out individuals critically challenging and evaluating that leader’s opinions and assumptions.
12.1
OTHER GOVERNANCE MECHANISMS
While the board of directors is the central governance piece for a public stock company,
several other corporate mechanisms are also used to align incentives between principals
and agents, including:
■ Executive compensation
■ The market for corporate control
■ Financial statement auditors, government regulators, and industry analysts
EXECUTIVE COMPENSATION. The board of directors determines executive com-
pensation packages. To align incentives between shareholders and management, the board
may grant stock options as part of the compensation package. This incentive mechanism
gives the recipient the right to buy a company’s stock at a predetermined price sometime
LO 12-5
Evaluate other governance mechanisms.
stock options An incentive mechanism to align the interests of shareholders and managers, by giving the recipient the right to buy a company’s stock at a predetermined price sometime in the future.
WWW.YAZDANPRESS.COMWWW.YAZDANPRESS.COM
CHAPTER 12 Corporate Governance and Business Ethics 389
in the future. If the company’s share price rises above the negotiated strike
price, which is often the price on the day when compensation is negotiated,
the executive stands to reap significant gains.
Executive compensation—CEO pay, in particular—has attracted sig-
nificant attention in recent years. Two issues are at the forefront: (1) the
absolute size of the CEO pay package compared with the pay of the average
employee, and (2) the relationship between firm performance and CEO pay.
The ratio of CEO to average employee pay in the U.S. is about 300 to 1,
up from roughly 40 to 1 in 1980. 33 In 2012, the average compensation for a
CEO of a Fortune 500 company was $11 million. 34 The top three earners in
terms of annual compensation were Larry Ellison of Oracle ($96 million),
Robert Kotick of Activision Blizzard ($64 million), and Leslie Moonves of
CBS ($60 million). 35 In 2013, McKesson’s CEO John Hammergren made
headlines by setting the all-time record with $159 million pension pack-
age. 36 Mr. Hammergren is also one of the highest-paid CEOs, averaging
$50 million in annual compensation. 37
In some instances, the relationship between executive pay and firm per-
formance is strong; in others it is nonexistent or even negative. 38 Mr. Hammergren’s com-
pensation and pension package, for example, was closely tied to performance. Since he
was appointed CEO in 2001, McKesson’s stock price more than tripled, outperforming the
overall market by a wide margin. Specifically, McKesson’s stock appreciated by roughly
325 percent under Mr. Hammergren’s leadership, while the S&P 500 index rose merely 40
percent. 39 On the other hand, as CEO of The Home Depot, Robert Nardelli earned annual
compensation packages of over $200 million, while the company’s stock remained flat
under his tenure (2000–2007). In comparison, the share price of The Home Depot’s main
competitor, Lowe’s, nearly doubled during that time. In another example in which executive
pay did not reflect performance, after only 11 months on the job and almost losing one half
of the company’s total market value, HP’s former CEO Leo Apotheker left with a $25 mil-
lion compensation package. 40
Responding to shareholder criticism, the GE board recently revised the compensation
package for Jeffrey Immelt, GE’s CEO and chairman of the board. 41 His compensation
package was changed to include a stronger performance-related equity component. In par-
ticular, GE’s board attached strings on stock options already granted to Mr. Immelt. The
revised compensation package now stipulates more stringent performance conditions: The
stock options will vest only if GE’s stock and dividend performance in its industrial busi-
nesses (energy, health care, and technology infrastructure) is equal to or better than the per-
formance of the Standard & Poor 500 stock index. In addition, half of the options will vest
only if GE achieves at least $55 billion in cash flow from operating activities between 2011
and 2014. This unusual move by GE’s board of directors underscores the increasing clout of
vocal shareholders who have expressed dissatisfaction with GE’s stock performance over the
last decade. They expect that linking compensation to specific performance measures tied to
GE’s core competency in industrial engineering will result in improved stock performance.
Some recent experiments in behavioral economics caution that incentives that are too
high-powered (e.g., outsized bonuses) may have a negative effect on job performance. 42 That
is, when the incentive level is very high, an individual may get distracted from strategic activ-
ities because too much attention is devoted to the outsized bonus to be enjoyed in the near
future. This in turn can further increase job stress and negatively impact job performance.
THE MARKET FOR CORPORATE CONTROL. Whereas the board of directors and
executive compensation are internal corporate-governance mechanisms, the market for corporate control is an important external corporate-governance mechanism. It consists of
WWW.YAZDANPRESS.COMWWW.YAZDANPRESS.COM

390 CHAPTER 12 Corporate Governance and Business Ethics
activist investors who seek to gain control of an underperforming corporation by buying
shares of its stock in the open market. To avoid such attempts, corporate managers strive to
protect shareholder value by delivering strong share-price performance or putting in place
poison pills (discussed later).
Here’s how the market for corporate control works: If a company is poorly managed, its
performance suffers and its stock price falls as more and more investors sell their shares.
Once shares fall to a low enough level, the firm may become the target of a hostile takeover
(as discussed in Chapter 9) when new bidders believe they can fix the internal problems
that are causing the performance decline. Besides competitors, so-called corporate raiders
(e.g., Carl Icahn and T. Boone Pickens) or private equity firms and hedge funds (e.g., The
Blackstone Group and Soros Fund Management) may buy enough shares to exert control
over a company.
In a leveraged buyout (LBO), a single investor or group of investors buys, with the
help of borrowed money (leveraged against the company’s assets), the outstanding shares
of a publicly traded company in order to take it private. In short, an LBO changes the
ownership structure of a company from public to private. The expectation is often that the
private owners will restructure the company and eventually take it public again through an
initial public offering (IPO).
Private companies enjoy certain benefits that public companies do not. Private compa-
nies are not required to disclose financial statements. They experience less scrutiny from
analysts and can often focus more on long-term viability. In a classic example, Harley-
Davidson underwent an LBO in 1981 as the company was struggling against Japanese
competitors. By implementing a “back to its roots retro style” and improving product qual-
ity and labor relations, Harley-Davidson is considered one of the most successful corporate
turnarounds: The company went public again in 1987 and remains so today. 43
In 2013, computer maker Dell Inc. became a takeover target of famed corporate raider
Carl Icahn. 44 He jumped into action after Dell’s founder and its largest shareholder,
Michael Dell, announced in January of that year that he intended a leveraged buyout with
the help of Silverlake Partners, a private equity firm, to take the company private. In the
Dell buyout battle, many observers, including Mr. Icahn who is the second-largest share-
holder of Dell, saw the attempt by Mr. Dell to take the company private as the “ultimate
insider trade.”
This view implied that Mr. Dell, who is also CEO and chairman, had private informa-
tion about the future value of the company, and that his offer was too low. Dell Inc., which
had $57 billion in revenues in its fiscal year 2013, has been struggling in the ongoing
transition from personal computers such as desktops and laptops to mobile devices and
services. Between December 2004 and February 2009, Dell (which until just a few years
ago was the number-one computer maker) lost more than 80 percent of its market capi-
talization, dropping from some $76 billion to a mere $14 billion. In the the fall of 2013,
Dell’s shareholders approved Mr. Dell’s $25 billion offer to take the company private, thus
avoiding a hostile takeover.
If a hostile takeover attempt is successful, however, the new owner frequently replaces
the old management and board of directors in order to manage the company in a way that
creates more value for shareholders. In some instances, the new owner will break up the
company and sell off its pieces. In either case, since a firm’s existing management faces
the threat of losing their jobs and their reputations as effective executives if the firm sus-
tains a competitive disadvantage, the market for corporate control is a credible governance
mechanism.
leveraged buyout
(LBO) A single investor or group of investors buys, with the help of borrowed money (leveraged against the company’s assets), the outstanding shares of a publicly traded company in order to take it private; the private owners often will restructure the company and eventually take it public again.
WWW.YAZDANPRESS.COMWWW.YAZDANPRESS.COM

CHAPTER 12 Corporate Governance and Business Ethics 391
To avoid being taken over against their consent, some firms put in place poison pills. These are defensive provisions that kick in should a buyer reach a certain level of share
ownership without top management approval. For example, a poison pill could allow
existing shareholders to buy additional shares at a steep discount. Those additional shares
would in turn make any takeover attempt much more expensive and function as a deterrent.
With the rise of actively involved institutional investors, poison pills have become rare
because they retard an effective function of equity markets.
Although poison pills are becoming rarer, the market for corporate control is alive and
well, as shown in the battle over control of Dell Inc. or the hostile takeover of Cadbury by
Kraft (featured in Strategy Highlight 9.1). However, the market for corporate control is
a last resort because it comes with significant transaction costs. To succeed in its hostile
takeover bid, buyers generally pay a significant premium over given share price. This often
leads to overpaying for the acquisition and subsequent shareholder value destruction—the
so-called winner’s curse. The market for corporate control is useful, however, when inter-
nal corporate-governance mechanisms have not functioned effectively and the company is
underperforming.
AUDITORS, GOVERNMENT REGULATORS, AND INDUSTRY ANALYSTS.
Auditors, government regulators, and industry analysts serve as additional external-governance
mechanisms. All public companies listed on the U.S. stock exchanges must file a number of
financial statements with the Securities and Exchange Commission (SEC), a federal regulatory
agency whose task it is to oversee stock trading and enforce federal securities laws. To avoid
the misrepresentation of financial results, all public financial statements must follow generally accepted accounting principles (GAAP) 45 and be audited by certified public accountants.
As part of its disclosure policy, the SEC makes all financial reports filed by public com-
panies available electronically via the EDGAR database. 46 This database contains more
than 7 million financial statements, going back several years. Industry analysts scrutinize
these reports in great detail, trying to identify any financial irregularities and assess firm
performance. Given recent high-profile oversights in accounting scandals and fraud cases,
the SEC has come under pressure to step up its monitoring and enforcement.
Industry analysts often base their buy, hold, or sell recommendations on financial
statements filed with the SEC and business news published in The Wall Street Journal, Bloomberg Businessweek, Fortune, Forbes, and other business media such as CNBC.
Researchers have questioned the independence of industry analysts and credit-rating agen-
cies that evaluate companies (such as Fitch, Moody’s, and Standard & Poor’s), 47 because
the investment banks and rating agencies frequently have lucrative business relationships
with the companies they are supposed to evaluate, creating conflicts of interest. A study
of over 8,000 analysts’ ratings of corporate equity securities, for example, revealed that
investment bankers rated their own clients more favorably. 48
In addition, an industry has sprung up around assessing the effectiveness of corporate
governance in individual firms. Research outfits such as GovernanceMetrics International
(now GMI Ratings) 49 provide independent corporate governance ratings. The ratings from
these external watchdog organizations inform a wide range of stakeholders, including
investors, insurers, auditors, regulators, and others.
Corporate-governance mechanisms play an important part in aligning the interests of
principals and agents. They enable closer monitoring and controlling, as well as provide
incentives to align interests of principals and agents. Perhaps even more important are the
“most internal of control mechanisms”: business ethics —a topic we discuss next.
WWW.YAZDANPRESS.COMWWW.YAZDANPRESS.COM

392 CHAPTER 12 Corporate Governance and Business Ethics
12.3 Strategy and Business Ethics
Multiple, high-profile accounting scandals and the global financial crisis have placed
business ethics center stage in the public eye. Business ethics is an agreed-upon code of
conduct in business, based on societal norms. Business ethics lay the foundation and pro-
vide training for “behavior that is consistent with the principles, norms, and standards of
business practice that have been agreed upon by society.” 50 These principles, norms, and
standards of business practice differ to some degree in different cultures around the globe.
But a large number of research studies have found that some notions—such as fairness,
honesty, and reciprocity—are universal norms. 51 As such, many of these values have been
codified into law.
Law and ethics, however, are not synonymous. This distinction is important. Stay-
ing within the law is a minimum acceptable standard. A note of caution is therefore in
order, though: A manager’s actions can be completely legal, but ethically questionable.
For example, consider the actions of mortgage-loan officers who—being incentivized by
commissions—persuaded unsuspecting consumers to sign up for exotic mortgages, such as
“option ARMs.” These mortgages offer borrowers the choice to pay less than the required
interest, which is then added to the principal while the interest rate can adjust upward.
Such actions may be legal, but they are unethical, especially if there are indications that the
borrower might be unable to repay the mortgage once the interest rate moves up. 52
To go beyond the minimum acceptable standard codified in law, many organizations
have explicit codes of conduct. These codes go above and beyond the law in detailing how
the organization expects an employee to behave and to represent the company in business
dealings. Codes of conduct allow an organization to overcome moral hazards and adverse
selections as they attempt to resonate with employees’ deeper values of justice, fairness,
honesty, integrity, and reciprocity. Since business decisions are not made in a vacuum
but are embedded within a societal context that expects ethical behavior, managers can
improve their decision making by also considering:
■ When facing an ethical dilemma, a manager can ask whether the intended course of
action falls within the acceptable norms of professional behavior as outlined in the
organization’s code of conduct and defined by the profession at large.
■ The manager should imagine whether he or she would feel comfortable explaining and defending the decision in public. How would the media report the business decision if
it were to become public? How would the company’s stakeholders feel about it?
Strategy Highlight 12.2 features Goldman Sachs, which has come under close scrutiny
and faced some tough questions pertaining to its business dealings in the wake of the finan-
cial crisis.
In the aftermath of the Abacus debacle (discussed in Strategy Highlight 12.2), Goldman
Sachs revised its code of conduct. A former Goldman Sachs employee, Greg Smith, pub-
lished a book in 2012 chronicling his career at the investment bank, from a lowly sum-
mer intern to head of Goldman Sachs’ U.S. equity derivatives business in Europe, the
Middle East, and Africa. 53 Mr. Smith’s thesis was that the entire ethical climate within
Goldman Sachs changed over that period of time. For its first 130 years, Goldman Sachs
was organized as a professional partnership, like most law firms. In this organizational
form, a selected group of partners are joint owners and directors of the professional service
firm. After years of superior performance, associates in the professional service firms may
“make partner”—being promoted to joint owner. During the time when organized as a
LO 12-6
Explain the relationship between strategy and business ethics.
business ethics An agreed-upon code of conduct in business, based on societal norms.
WWW.YAZDANPRESS.COMWWW.YAZDANPRESS.COM

CHAPTER 12 Corporate Governance and Business Ethics 393
Did Goldman Sachs and the “Fabulous
Fab” Commit Securities Fraud?
In April 2010, the SEC sued Goldman Sachs and one of its employees, Mr. Fabrice Tourre, for securities fraud. The SEC’s case focused on one specific, mortgage-related deal during the financial crisis. The deal began in 2006 during the height of the real estate bubble in the United States. The assumption at this time was that house prices could only go up, after years of consistent real estate appreciation. Indeed, real estate prices in the United States had surged, and a speculative bubble had emerged. The real estate bubble was fueled by cheap mortgages, many of them extended to home buyers who really couldn’t afford them. John Paulson, founder of the hedge fund Paulson & Co., approached Goldman Sachs with a trading idea to place a billion-dollar bet that the real estate bubble was about to burst. This would occur when borrowers began to default on their mortgages in large numbers. House prices would collapse as dis-tressed borrowers attempted to unload their properties at fire sale prices, and banks foreclosed in large numbers. That is exactly what happened.
To benefit from his timely insight, Mr. Paulson asked Goldman Sachs to create an investment instrument, later named “Abacus.” Goldman Sachs agreed and assigned Mr. Tourre to put Abacus together. This investment vehi-cle was a collateralized debt obligation (CDO). CDOs are made up of thousands of mortgages bundled together into bonds. These bonds provide stable and regular interest payments as long as the borrowers make mortgage pay-ments. CDOs were considered to be much safer invest-ment choices than regular, standalone mortgages because defaults by a few borrowers would not matter much. To make matters worse, rating agencies such as Standard & Poor’s, Fitch, and Moody’s frequently rated such CDOs as “triple A,” which is the highest-quality rating. A triple A rating indicates an “extremely strong capacity” for the borrower to meet its financial obligation. Only a few com-panies, such as Exxon, Johnson & Johnson, and Microsoft, hold a triple A rating. Given that the Abacus investment vehicle received a triple A rating, many institutional
investors such as pension funds bought into it. Everything looked great: Abacus was offered by Goldman Sachs, the number-one investment bank in the world with a stellar reputation, and it had a triple A rating.
But, according to internal e-mails, Mr. Paulson and several Goldman Sachs employees, including Mr. Tourre, knew other-wise. For example, Mr. Tourre earned his nickname “fabulous Fab” based on an e-mail he sent describing the anticipated burst of the real estate bubble: “The entire building is at risk of collapse at any moment. Only potential survivor, the fabu-lous Fab (. . . even though there is nothing fabulous about me . . .) standing in the middle of all these complex, highly leveraged, exotic trades he created without necessarily understanding all the implications of these monstrosities.”54
Messrs. Paulson and Tourre worked together in select-ing highly risky CDOs to roll them into Abacus. Goldman Sachs then turned around and sold the Abacus CDOs to unsuspecting clients—without, of course, revealing the motivation behind Abacus. Nor did Goldman Sachs reveal that Mr. Paulson helped in selecting the riskiest CDOs to be bundled into Abacus. Mr. Paulson then took a “short posi-tion” in Abacus—meaning he bought into it at a low price when first issued but sold his holdings when the price was bid up by institutional investors, often long-term Goldman clients, who believed that Abacus was a great investment opportunity. When the real estate bubble burst, Mr. Paulson made more than $1 billion from his position in Abacus.
The question that immediately arose was whether Goldman Sachs defrauded investors—as the SEC believed. The SEC argued that the investment bank know-ingly misled investors by not revealing their motives in putting Abacus together and not informing them about John Paulson’s role in this transaction. Basically, the SEC alleged that Goldman violated its fiduciary respon-sibility and defrauded its clients. Mounting a strong legal defense, Goldman Sachs argued that it is up to the clients to assess the risks involved in any investments. As pub-lic pressure mounted, however, Goldman Sachs settled the lawsuit with the SEC by paying a $550 million fine without admitting any wrongdoing. Mr. Tourre declined a settlement, and his case went to court. In August 2013, Mr. Tourre was convicted of securities fraud.55
12.2
WWW.YAZDANPRESS.COMWWW.YAZDANPRESS.COM

394 CHAPTER 12 Corporate Governance and Business Ethics
professional partnership, Goldman Sachs earned a reputation as the best investment bank
in the world. It had the best people and put its clients’ interests first. Mr. Smith describes
how Goldman’s culture—and with it, employee attitudes—changed after the firm went
public (in 1999), from “we are here to serve our clients as honorable business partners, and
we have our clients best interest in mind,” to “we [Goldman Sachs and our clients] are all
grown-ups and just counter parties to any transaction.” 56 In the latter perspective, unsus-
pecting clients in the Abacus deal were seen just as “counter parties to a transaction,” who
should have known better.
Some people believe that unethical behavior is limited to a few “bad apples” in orga-
nizations. 57 The assumption is that the vast majority of the population—and by extension,
organizations—are good, and that we need only safeguard against abuses by a few bad
actors. According to agency theory, it’s the “bad agents” who act opportunistically, and
principals need to be on guard against bad actors.
However, research indicates that it is not just the few “bad apples” but entire organi-
zations that can create a climate in which unethical, even illegal behavior is tolerated. 58
While there clearly are some people with unethical or even criminal inclinations, in gen-
eral one’s ethical decision-making capacity depends very much on the organizational con-
text. Research shows that if people work in organizations that expect and value ethical
behavior, they are more likely to act ethically. 59 The opposite is also true. Enron’s stated
key values included respect and integrity, and its mission statement proclaimed that all
business dealings should be open and fair. 60 Yet, the ethos at Enron was all about creating
an inflated share price at any cost, and its employees observed and followed the behavior
set by their leaders.
Sometimes, it’s the bad barrel that can spoil the apples! This is precisely what Mr.
Smith argues in regard to Goldman Sachs: The ethical climate had changed for the worse,
so that seeing clients as mere “counter parties” to transactions made deals like Abacus pos-
sible. One could argue that Mr. Tourre simply followed the values held within Goldman
Sachs (“profit is king” and “clients are grown-ups”). As a mid-level employee, many view
Mr. Tourre as the scapegoat in the Abacus case. 61
Employees take cues from their environment on how to act. Therefore, ethical leader-
ship is critical, and strategic leaders set the tone for the ethical climate within an organi-
zation. This is one of the reasons the HP board removed Mark Hurd, even without proof
of illegal behavior or violation of the company’s sexual-harassment policy. The Chapter-
Case illustrates that strategic leaders, such as CEOs of Fortune 500 companies, are under
constant public scrutiny and ought to adhere to the highest ethical standards. If they do
not, they cannot rationally expect their employees to behave ethically. Unethical behavior
can quickly destroy the reputation of a CEO, one of the most important assets he or she
possesses.
To foster ethical behavior in employees, top management must create an organiza-
tional structure, culture, and control system that values and encourages desired behavior.
Furthermore, a company’s formal and informal cultures must be aligned, and executive
behavior must be in sync with the formally stated vision and values. Employees will
quickly see through any duplicity. Actions by executives speak louder than words in
vision statements.
Other leading professions have accepted codes of conduct (e.g., the bar association in the
practice of law and the Hippocratic oath in medicine); management has not. 62 Some argue
that management needs an accepted code of conduct, 63 holding members to a high profes-
sional standard and imposing consequences for misconduct. Misconduct by an attorney,
for example, can result in being disbarred and losing the right to practice law. Likewise,
medical doctors can lose their professional accreditations if they engage in misconduct.
WWW.YAZDANPRESS.COMWWW.YAZDANPRESS.COM

CHAPTER 12 Corporate Governance and Business Ethics 395
To anchor future managers in professional values and to move management closer to
a truly professional status, a group of Harvard Business School students developed an
MBA oath (see Exhibit 12.6 ). 64 Since 2009, over 6,000 MBA students from over 300
institutions around the world have taken this voluntary pledge. The oath explicitly recog-
nizes the role of business in society and its responsibilities beyond shareholders. It also
holds managers to a high ethical standard based on more or less universally accepted
principles in order to “create value responsibly and ethically.” 65 Having the highest per-
sonal integrity is of utmost importance to one’s career. It takes decades to build a career,
but sometimes just a few moments to destroy one. The voluntary MBA oath sets pro-
fessional standards, but its effect on behavior is unknown, and it does not impose any
consequences for misconduct.
12.4 Implications for the Strategist
An important implication for the strategist is the recognition that effective corporate
governance and solid business ethics are critical to gaining and sustaining competitive
advantage.
A variety of corporate governance mechanisms can be effective in addressing the principal–
agent problem. These mechanisms tend to focus on monitoring, controlling, and providing
incentives, and they must be complemented by a strong code of conduct and strategic leaders
who act with integrity. The strategist must help employees to “walk the talk”; leading by ethi-
cal example often has a stronger effect on employee behavior than words alone.
As a business leader I recognize my role in society.
>> My purpose is to lead people and manage resources to create value that no single individual can create alone.
>> My decisions affect the well-being of individuals inside and outside my enterprise, today and tomorrow.
Therefore, I promise that:
>> I will manage my enterprise with loyalty and care, and will not advance my personal interests at the expense of my enterprise or society.
>> I will understand and uphold, in letter and spirit, the laws and contracts governing my conduct and that of my enterprise.
>> I will refrain from corruption, unfair competition, or business practices harmful to society.
>> I will protect the human rights and dignity of all people affected by my enterprise, and I will oppose discrimination and exploitation.
>> I will protect the right of future generations to advance their standard of living and enjoy a healthy planet.
>> I will report the performance and risks of my enterprise accurately and honestly.
>> I will invest in developing myself and others, helping the management profession continue to advance and create sustainable and inclusive prosperity.
In exercising my professional duties according to these principles, I recognize that my behavior must set an example of integrity, eliciting trust and esteem from those I serve. I will remain accountable to my peers and to society for my actions and for upholding these standards.
This oath I make freely, and upon my honor.
EXHIBIT 12.6 /The MBA OathSOURCE: www.mbaoath.org.
WWW.YAZDANPRESS.COMWWW.YAZDANPRESS.COM

396 CHAPTER 12 Corporate Governance and Business Ethics
IBM is a company that emphasizes its values—“the dignity of the individual, excel-
lence, and service”—to its employees worldwide. Stephen Covey, author of the best- selling
leadership and business ethics book The 7 Habits of Highly Effective People describes how
IBM acted upon this belief system:
Once I was training a group of people for IBM in New York. It was a small group, about 20
people, and one of them became ill. He called his wife in California, who expressed concern
because his illness required special treatment. The IBM people responsible for the train-
ing session arranged to have him taken to an excellent hospital with medical specialists in
the disease. But they could sense that his wife was uncertain and really wanted him home
where their personal physician could handle the problem. So they decided to get him home.
Concerned about the time in driving him to the airport and waiting for a commercial plane,
they brought in a helicopter, flew him to the airport, and hired a special plane just to take this
man to California. 66
It is interesting to note that this expensive evacuation (“walking the talk”) did not come
as a surprise for any of the IBMers present—they knew that the company would act upon
its belief system and do the same for any of them, regardless of circumstance or geography.
The strategist needs to look beyond shareholders and apply a stakeholder perspective to
ensure long-term survival and success of the firm. A firm that does not respond to stake-
holders beyond stockholders in a way that keeps them committed to its vision will not be
successful. Stakeholders want fair treatment even if not all of their demands can be met. A
minimum of fairness and transparency is critical to maintaining good relationships within
the network of stakeholders the firm is embedded in.
Finally, the large number of glaring ethical lapses over the last decade or so makes it
clear that ethical values and a code of conduct are key to the continued professionalization
of management.
H H P WAS ONCE so successful that it was featured as one of a handful of visionary companies in the business bestseller Built to Last, published in 1994. 67 These select companies outperformed the stock market by a wide margin over several decades. Built to Last opens with a quote by HP’s co-founder Bill Hewlett:
As I look back on my life’s work, I’m probably most proud of having helped to create a company that by virtue of its values, practices, and success has had a tremendous impact on the way companies are managed around the world. And I’m partic-ularly proud that I’m leaving behind an ongoing organization that can live on as a role model long after I’m gone. 68
Bill Hewlett passed away in 2001. Much has changed since then. Although gener-ally CEOs are blamed for a company’s poor performance, it appears that in the case of HP much of the blame is to be laid on the board of directors. The board is a key corporate governance mechanism that is supposed to act in the best interests of shareholders, but many of the HP board’s decisions contributed to the destruction of $82 billion in shareholder value. For the last decade, it appears that HP’s board of directors was dysfunctional. It started with the pretexting affair, followed by the han-dling of the Mark Hurd ethics scandal, the appointment
CHAPTERCASE 12 Consider This . . .
WWW.YAZDANPRESS.COMWWW.YAZDANPRESS.COM

CHAPTER 12 Corporate Governance and Business Ethics 397
of Leo Apotheker, and the botched Autonomy acqui-sition. In order to appoint a successor to Apotheker quickly, the board made the controversial decision not to engage in an open search for the next CEO but rather appoint Meg Whitman, who was serving as an HP board member at the time.
A closer look, for example, at the Autonomy acquisi-tion in which HP lost some $9 billion shows that the due diligence process by the board was flawed. The process itself was truncated. Moreover, the HP board did not heed the red flags thrown up by Deloitte, Autonomy’s auditor. Indeed, a few days before the Autonomy acqui-sition was finalized, Deloitte auditors asked to meet with the board to inform them about a former Autonomy executive who accused the company of accounting irregularities. Deloitte also added that it investigated the claim and did not find any irregularities.
Perhaps most problematic, the board fell victim to groupthink, rallying around Mr. Apotheker as CEO and Ray Lane, the board chair, who strongly supported him. Mr. Apotheker was eager to make a high-impact acquisition to put his strategic vision of HP as a soft-ware and service company into action. In the wake of the Mark Hurd ethics scandal, an outside recruiting firm
had identified Mr. Apotheker as CEO and Ray Lane as the new chair of HP’s board of directors. The full board never met either of the men before hiring them into key strategic positions!
The HP board of directors experienced a major shakeup after the Mark Hurd ethics scandal and then again after the departure of Leo Apotheker. Mr. Lane stepped down as chairman of HP’s board in spring 2013, but remains a director. 69
Questions
1. Who is to blame for HP’s shareholder value destruction—the CEO, the board of directors, or both? What recourse, if any, do shareholders have?
2. You are brought in as (a) a corporate governance consultant or (b) a business ethics consultant by HP’s CEO. What recommendations would you give the new CEO, Meg Whitman? How would you go about implementing them? Be specific.
3. Discuss the general lessons in terms of corpo-rate governance and business ethics that can be drawn from Chapter Case 12.
TAKE-AWAY CONCEPTS
In this final chapter, we looked at stakeholder strategy,
corporate governance, business ethics, and strategic
leadership, as summarized by the following learning
objectives and related take-away concepts.
LO 12-1 / Describe the shared value creation
framework and its relationship to competitive
advantage.
■ By focusing on financial performance, many
companies have defined value creation too
narrowly.
■ Companies should instead focus on creating
shared value, a concept that includes value
creation for both shareholders and society.
■ The shared value creation framework seeks to
identify connections between economic and
social needs, and then leverage them into com-
petitive advantage.
LO 12-2 / Explain the role of corporate
governance.
■ Corporate governance involves mechanisms used
to direct and control an enterprise in order to
ensure that it pursues its strategic goals success-
fully and legally.
■ Corporate governance attempts to address the
principal–agent problem, which describes any situa-
tion in which an agent performs activities
on behalf of a principal.
WWW.YAZDANPRESS.COMWWW.YAZDANPRESS.COM

398 CHAPTER 12 Corporate Governance and Business Ethics
LO 12-3 / Apply agency theory to explain
why and how companies use governance
mechanisms to align interests of principals
and agents.
■ Agency theory views the firm as a nexus of legal
contracts.
■ The principal–agent problem concerns the rela-
tionship between owners (shareholders) and man-
agers and also cascades down the organizational
hierarchy.
■ The risk of opportunism on behalf of agents is
exacerbated by information asymmetry: Agents
are generally better informed than the principals.
■ Governance mechanisms are used to align incen-
tives between principals and agents.
■ Governance mechanisms need to be designed
in such a fashion as to overcome two specific
agency problems: adverse selection and moral
hazard.
LO 12-4 / Evaluate the board of directors as
the central governance mechanism for public
stock companies.
■ The shareholders are the legal owners of a pub-
licly traded company and appoint a board of
directors to represent their interests.
■ The day-to-day business operations of a publicly
traded stock company are conducted by its man-
agers and employees, under the direction of the
chief executive officer (CEO) and the oversight
of the board of directors. The board of directors is
composed of inside and outside directors, who are
elected by the shareholders.
■ Inside directors are generally part of the com-
pany’s senior management team, such as the chief
financial officer (CFO) and the chief operating
officer (COO).
■ Outside directors are not employees of the firm.
They frequently are senior executives from other
firms or full-time professionals who are appointed
to a board and who serve on several boards
simultaneously.
LO 12-5 / Evaluate other governance
mechanisms.
■ Other important corporate mechanisms are execu-
tive compensation, the market for corporate con-
trol, and financial statement auditors, government
regulators, and industry analysts.
■ Executive compensation has attracted significant
attention in recent years. Two issues are at the
forefront: (1) the absolute size of the CEO pay
package compared with the pay of the average
employee and (2) the relationship between firm
performance and CEO pay.
■ The board of directors and executive compensa-
tion are internal corporate-governance mecha-
nisms. The market for corporate control is an
important external corporate-governance mecha-
nism. It consists of activist investors who seek to
gain control of an underperforming corporation
by buying shares of its stock in the open market.
■ All public companies listed on the U.S. stock
exchanges must file a number of financial state-
ments with the Securities and Exchange Commis-
sion (SEC), a federal regulatory agency whose
task it is to oversee stock trading and enforce
federal securities laws. Auditors and industry
analysts study these public financial statements
carefully for clues of a firm’s future valuations,
financial irregularities, and strategy.
LO 12-6 / Explain the relationship between
strategy and business ethics.
■ The ethical pursuit of competitive advantage
lays the foundation for long-term superior
performance.
■ Law and ethics are not synonymous; obeying the
law is the minimum that society expects of a cor-
poration and its managers.
■ A manager’s actions can be completely legal, but
ethically questionable.
■ Some argue that management needs an accepted
code of conduct that holds members to a high
professional standard and imposes consequences
for misconduct.
WWW.YAZDANPRESS.COMWWW.YAZDANPRESS.COM

CHAPTER 12 Corporate Governance and Business Ethics 399
KEY TERMS
Adverse selection
Agency theory
Board of directors
Business ethics
Corporate governance
Inside directors
Leveraged buyout (LBO)
Moral hazard
Outside directors
Shared value creation
framework
Stock options
DISCUSSION QUESTIONS
1. How can a top management team lower the
chances that key managers will pursue their own
self-interests at the expense of stockholders? At
the expense of the employees? At the expense of
other key stakeholders?
2. The Business Roundtable has recommended that
the CEO should not also serve as the chairman of
the board. Discuss the disadvantages for building
a sustainable competitive advantage if the two
positions are held by one person. What are the
disadvantages for stakeholder management? Are
there situations where it would be advantageous
to have one person in both positions?
3. The shared value creation framework provides
help in making connections between economic
needs and social needs in a way that transforms
into a business opportunity. Taking the role of
consultant to Nike Inc., discuss how Nike might
move beyond selling high-quality footwear and
apparel and utilize its expertise to serve a social
need. Give Nike some advice on actions the com-
pany could take in different geographic markets
that would connect economic and social needs.
ETHICAL/SOCIAL ISSUES
1. Assume you work in the accounting department
of a large software company. Toward the end of
December, your supervisor tells you to change
the dates on several executive stock option grants
from March 15 to July 30. Why would she ask for
this change? What should you do?
2. As noted in the chapter, the average compensa-
tion for a CEO of a Fortune 500 company was
$11 million, and CEO pay was 300 times the aver-
age worker pay. This contrasts with historic values
of between 25 and 40 times the average pay.
a. What are the potentially negative effects of
this increasing disparity in CEO pay?
b. Do you believe that current executive pay
packages are justified? Why or why not?
3. The MBA oath (shown in Exhibit 12.6 ) says
in part, “My decisions affect the well-being of
individuals inside and outside my enterprise,
today and tomorrow.” This echoes what John
Mackey of Whole Foods has in recent years
called conscious capitalism. 70
One example of a large firm reorienting toward
this approach is PepsiCo. In the last few years,
PepsiCo has been contracting directly with small
farmers in impoverished areas (for example,
in Mexico). What started as a pilot project in
PepsiCo’s Sabritas snack food division has now
spread to over 1,000 farmers providing potatoes,
corn, and sunflower oil to the firm. Pepsi pro-
vides a price guarantee for farmers’ crops that is
higher and much more consistent than the previ-
ous system of using intermediaries. The farmers
report that since they have a firm market, they
are planting more crops. Output is up about 160
percent, and farm incomes have tripled in the last
WWW.YAZDANPRESS.COMWWW.YAZDANPRESS.COM

400 CHAPTER 12 Corporate Governance and Business Ethics
three years. 71 The program has benefits for Pepsi
as well. A shift to sunflower oil for its Mexican
products will replace the 80,000 tons of palm
oil it currently imports to Mexico from Asia and
Africa, thus slashing transportation and storage
costs.
a. What are the benefits of this program for
PepsiCo? What are its drawbacks?
b. What other societal benefits could such a pro-
gram have in Mexico?
c. If you were a PepsiCo shareholder, would you
support this program? Why or why not?
d. Can you find other examples of firms employ-
ing “conscious capitalism”?
//// Small-Group Exercise 1
1. Discuss in your group the contrasting perspectives
of “shareholder versus stakeholder” governance.
What benefits and drawbacks can you find in each
view?
2. Next, go online to find two sets of examples: (a)
firms in the U.S. or Britain saving jobs by offer-
ing reduced hours to workers rather than having
layoffs, and (b) large firms in Germany or Japan
laying off employees or closing plants. What do
the results of your search say about the impact of
governance structure on corporate decisions?
3. Developments after the global financial crisis
moved the U.S. away from being one of the most
free-market economies in the world toward an
economy with much more active and stronger
government involvement (e.g., the “Patient Pro-
tection and Affordable Care Act,” commonly
known as “Obama-care,” requires employers to
spend more on health care, including smaller
firms). What implications does this shift in the
political and economic environment in the United
States have for large firms (such as GE or IBM)
versus small firms (mom-and-pop entrepreneurs
and technology startups)? How does this change
the competitive landscape and affect a firm’s
strategy formulation and implementation?
//// Small-Group Exercise 2
(Ethical/Social Issues) It is not unusual for even large corporate boards to
have no women or minorities on them. In the U.S.,
women held 16 percent of board seats at Fortune
500 companies in 2012. 72 In her 2013 book, Lean In, Sheryl Sandberg points out that this number has been
flat for 10 years—or, as she puts it, there has been no
progress in the past 10 years. 73 In Europe, of the total
number of board members in Britain, only 12 percent
were women; Spain, France, and Germany all had
less than 10 percent. 74 In Norway, by contrast, female
members comprised 40 percent of the boards.
So how did Norway do it? In 2005, the government
of Norway gave public firms two years to change their
boards’ composition from 9 percent female to 40 per-
cent female. Is this a good idea? Spain, Italy, France,
and the Netherlands must think so: Each country is
considering implementing a similar quota (though
generally with more than two years to implement it).
1. Discuss in your group to what extent it is a prob-
lem that women are proportionally underrepre-
sented on corporate boards. Provide the rationale
for your responses.
2. Why has representation by women on U.S.
boards not increased over the past 10 years? What
actions could be taken by companies to increase
participation? What actions could be taken by
women who seek to be directors?
3. Would a regulatory quota be a good solution?
Why or why not?
4. What other methods could be used to increase
female and minority participation on corporate
boards? Should it be perceived as a problem when
a company seeks minority women as directors
so that both statistics rise? What data would you
gather in order to verify that such appointments
are sincere?
SMALL-GROUP EXERCISES
WWW.YAZDANPRESS.COMWWW.YAZDANPRESS.COM

CHAPTER 12 Corporate Governance and Business Ethics 401
//// Module 12: Corporate Governance
In this section, you will study the governance struc-
ture of your selected firm. This is also our conclud-
ing module, so we will have final questions for you to
consider about your firm overall.
1. Find a list of the members of the board of direc-
tors for your firm. How large is the board? How
many independent (non-employee) members are
on the board? Are any women or minorities on the
board? Is the CEO also the chair of the board?
2. Who are the largest stockholders of your firm? Is
there a high degree of employee ownership of the
stock?
3. In reviewing press releases and news articles
about your firm over the past year, can you find
examples of any actions the firm has taken that,
though legal, may be ethically questionable?
4. You have now completed 12 modular assignments
about your selected firm. You know a lot about its
mission, strategies, competitive advantage, and
organization. Is this a company you would like to
work for? If you had $1,000 to invest in a firm,
would you invest it in the stock of this firm? Why
or why not?
my STRATEGY
Are You Part of Gen Y, or Will
You Manage Gen-Y Workers?
G eneration Y (born between 1980 and 2001) is enter-ing the work force and advancing their careers now, as the Baby Boomers of their parents’ generation
begin to retire in large numbers. Given the smaller size of Gen Y compared to the Baby Boomers, this generation received much more individual attention from their imme-diate and extended families. Classes in school were much smaller than in previous generations. The parents of Gen-Y members placed a premium on achievement, both academi-cally and socially. Gen Y grew up during a time of unprec-edented economic growth and prosperity, combined with an explosion in technology (including laptop computers, cell phones, the Internet, e-mail, instant messaging, and online social networks). Gen Yers are connected 24/7 and are able to work anywhere, frequently multitasking. Due to the unique circumstances of their upbringing, they are said to be tech-savvy, family- and friends-centric, team players, achievement-oriented, but also attention-craving. 75
Some have called Generation Y the “trophy kids,” due in part to the practice of giving all Gen-Y children trophies in competitive activities, not wanting to single out winners and losers. When coaching a group of Gen-Y students for
job interviews, a consultant asked them how they believe future employers view them. She gave them a clue to the answer: the letter E. Quickly, the students answered con-fidently: excellent, enthusiastic, and energetic. The answer the consultant was looking for was “entitled.” Baby Boomers believe that Gen Y has an overblown sense of entitlement.
When they bring so many positive characteristics to the workplace, why do Baby Boomers view Gen-Y employees as entitled? Many managers are concerned that these young workers have outlandish expectations when compared with other employees: They often expect higher pay, flexible work schedules, promotions and significant raises every year, and generous vacation and personal time. 76 Managers also often find that for Gen-Y employees, the traditional annual or semiannual performance evaluations are not considered sufficient. Instead, Gen-Y employees seek more immediate feedback, ideally daily or at least weekly. For many, feedback needs to come in the form of positive reinforcement rather than as a critique.
The generational tension seems a bit ironic, since the dissatisfied Baby Boomer managers are the same indulgent parents who raised Gen Yers. Some companies, such as Google, Intel, and Sun Microsystems (Sun), have leveraged this tension into an opportunity. Google, for example, allows its engineers to spend one day a week on any project of their own choosing, thus meeting the Gen-Y need for creativity
STRATEGY TERM PROJECT
WWW.YAZDANPRESS.COMWWW.YAZDANPRESS.COM

402 CHAPTER 12 Corporate Governance and Business Ethics
1 . “Suspicions and spies in Silicon Valley,”
Newsweek, September 17, 2006.
2 . “How Hewlett-Packard lost its way,” CNN Money, May 8, 2012.
3 . This Chapter Case, developed by Frank
T. Rothaermel and Carrie Yang (GT MBA,
MSc.), is based on: Packard, D. (1995),
HP Way: How Bill Hewlett and I Built Our Company (New York: Collins); “Corporate
governance: Spying and leaking are wrong,”
The Economist, September 14, 2006; “Cor-
porate governance: Pretext in context,” The Economist, September 14, 2006; “HP CEO
Mark Hurd resigns after sexual-harassment
probe,” The Huffington Post, August 6, 2010;
“The curse of HP,” The Economist, August
12, 2010; “HP shakes up board in scandal’s
wake,” The Wall Street Journal, January 21,
2011; “How Hewlett-Packard lost its way,”
CNN Money, May 8, 2012; “Inside HP’s
missed chance to avoid a disastrous deal,”
The Wall Street Journal, January 21, 2013;
and “The HP Way out,” The Economist, April
5, 2013.
4 . “Inside HP’s missed chance to avoid a
disastrous deal,” The Wall Street Journal, January 21, 2013; and “The HP Way out,” The Economist, April 5, 2013.
5 . Porter, M. E., and M. R. Kramer (2006),
“Strategy and society: The link between
competitive advantage and corporate social
responsibility,” Harvard Business Review, December: 80–92; Porter, M. E., and M. R.
Kramer (2011), “Creating shared value: How
to reinvent capitalism—and unleash innova-
tion and growth,” Harvard Business Review, January–February.
6 . “The endangered public company,” The Economist, March 19, 2012; and the classic
work by Berle, A., and G. Means (1932), The Modern Corporation & Private Property
(New York: Macmillan); and Monks, R.A.G.,
and N. Minow (2008), Corporate Gover-nance, 4th ed. (West Sussex, UK: Wiley).
7 . NASDAQ was originally an acronym for
National Association of Securities Dealers
Automated Quotations, but it is now a stand-
alone term.
8 . Berle, A., and G. Means (1932), The Mod-ern Corporation & Private Property (New
York: Macmillan); and Monks, R.A.G., and
N. Minow (2008), Corporate Governance, 4th
ed. (West Sussex, UK: Wiley).
9 . This section is based on: Porter, M. E., and
M. R. Kramer (2006), “Strategy and society:
The link between competitive advantage and
corporate social responsibility,” Harvard Business Review, December: 80–92; Porter,
M. E., and M. R. Kramer (2011), “Creating
shared value: How to reinvent capitalism—
and unleash innovation and growth,” Harvard Business Review, January–February.
10 . Friedman, M. (1962), Capitalism and Freedom (Chicago, IL: University of Chicago
Press), quoted in Friedman, M. (1970), “The
social responsibility of business is to increase
its profits,” The New York Times Magazine, September 13.
11 . Carroll, A. B., and A. K. Buchholtz
(2012), Business & Society. Ethics, Sustain-ability, and Stakeholder Management (Mason,
OH: South-Western Cengage).
12 . “Milton Friedman goes on tour,” The Economist, January 27, 2011.
13 . For detailed data and descriptions on the
GE ecomagination initiative, see http://www.
ge.com/about-us/ecomagination .
14 . “GE to invest more in ‘green’ technol-
ogy,” The New York Times, May 10, 2005.
15 . 2012 Fortune 500 ranking, see http://
money.cnn.com/magazines/fortune/
fortune500/index.html .
16 . Porter, M. E., and M. R. Kramer (2011),
“Creating shared value: How to reinvent
capitalism—and unleash innovation and growth,”
Harvard Business Review, January–February.
17 . GE Governance Principles, p. 1, www.
ge.com .
18 . Monks, R.A.G., and N. Minow (2008),
Corporate Governance, 4th ed. (West Sussex,
UK: Wiley).
19 . Berle, A., and G. Means (1932), The Modern Corporation & Private Property
(New York, Macmillan); Jensen, M., and W.
Meckling (1976), “Theory of the firm: Mana-
gerial behavior, agency costs and ownership
structure,” Journal of Financial Economics
3: 305–360; and Fama, E. (1980), “Agency
problems and the theory of the firm,” Journal of Political Economy 88: 375–390.
20 . “Fund titan found guilty,” The Wall Street Journal, May 12, 2011.
21 . Ibid.
22 . “Top 10 crooked CEOs,” Time, June 9,
2009.
23 . “Thain ousted in clash at Bank of
America,” The Wall Street Journal, January
23, 2009.
24 . Agency theory originated in finance; see
Jensen, M., and W. Meckling (1976), “Theory
of the firm: Managerial behavior, agency costs
and ownership structure,” Journal of Financial Economics 3: 305–360; and Fama, E. (1980),
“Agency problems and the theory of the firm,”
Journal of Political Economy 88: 375–390.
For an application to strategic management,
see Eisenhardt, K. M. (1989), “Agency theory:
An assessment and review,” Academy of Man-agement Review 14: 57–74; and Mahoney, J.
T. (2005), Economic Foundations of Strategy
(Thousand Oaks, CA: Sage).
25 . Fuller, A.W., and F. T. Rothaermel (2012),
“When stars shine: The effects of faculty
founders on new technology ventures,” Strate-gic Entrepreneurship Journal, 6: 220–235.
26 . Eisenhardt, K. M. (1989), “Agency
theory: An assessment and review,” Academy of Management Review 14: 57–74.
and self-determination. Executives at Intel have learned to motivate Gen-Y employees by sincerely respecting their con-tributions as colleagues rather than relying on hierarchical or position power. The network-computing company Sun accommodates Gen Yers’ need for flexibility through dras-tically increasing work-from-home and telecommunicating arrangements, so that basically all employees now have a “floating office.”
1. As you and your cohort enter the work force, do you expect to see a different set of business ethics take hold?
2. Are efforts such as the MBA oath (discussed in this chapter) reflections of a different approach that Gen Y will take to the business environment, compared with prior generations?
ENDNOTES
WWW.YAZDANPRESS.COMWWW.YAZDANPRESS.COM

CHAPTER 12 Corporate Governance and Business Ethics 403
27 . This section draws on: Monks, R.A.G.,
and N. Minow (2008), Corporate Gover-nance, 4th ed. (West Sussex, UK: Wiley);
Williamson, O. E. (1984), “Corporate gov-
ernance,” Yale Law Journal 93: 1197–1230;
and Williamson, O. E. (1985), The Economic Institutions of Capitalism (New York: Free
Press).
28 . “HP looks beyond its ranks,” The Wall Street Journal, August 9, 2010.
29 . “Apple chief to take leave,” The Wall Street Journal, January 18, 2010.
30 . For the latest listing, see www.ge.com/
company/leadership/directors.html .
31 . “On Apple’s board, fewer independent
voices,” The Wall Street Journal, March 24,
2010.
32 . This Strategy Highlight is based on:
“2010 Catalyst census: Fortune 500 women
board directors,” www.catalyst.org ; Baliga,
B. R., R. C. Moyer, and R. S. Rao (1996),
“CEO duality and firm performance: What’s
the fuss,” Strategic Management Journal 17:
41–53; Brickley, J. A., J. L. Coles, and
G. Jarrell (1997), “Leadership structure: Sepa-
rating the CEO and chairman of the board,”
Journal of Corporate Finance 3: 189–220;
Daily, C. M., and D. R. Dalton (1997), “CEO
and board chair roles held jointly or sepa-
rately,” Academy of Management Executive
3: 11–20; “GE governance principles,” www.
ge.com ; Irving, J. (1972), Victims of Group-think. A Psychological Study of Foreign-Policy Decisions and Fiascoes (Boston, MA:
Houghton Mifflin); Jensen, M. C. (1993),
“The modern industrial revolution, exit, and
the failure of internal control systems,” Jour-nal of Corporate Finance 48: 831–880; “On
Apple’s board, fewer independent voices,”
The Wall Street Journal, March 24, 2010;
“Strings attached to options grant for GE’s
Immelt,” The Wall Street Journal, April 20,
2011; Westphal, J. D., and E. J. Zajac (1995),
“Who shall govern? CEO board power, demo-
graphic similarity and new director selection,”
Administrative Science Quarterly 40: 60–83;
and Westphal, J. D., and I. Stern (2007), “Flat-
tery will get you everywhere (especially if
you are male Caucasian): How ingratiation,
boardroom behavior, and demographic minor-
ity status affect additional board appointments
at U.S. companies,” Academy of Management Journals 50: 267–288.
33. www.faireconomy.org .
34 . http://www.forbes.com/pictures/
eggh45jef/highest-paid-bosses/ .
35 . “Executive pay by the numbers,” The New York Times, June 23, 2013.
36 . “For McKesson’s CEO, a pension of
$159 million,” The Wall Street Journal, June
24, 2013.
37 . Ibid.
38 . Heineman, B. W. (2008), “The fatal flaw
in pay for performance,” Harvard Business Review, June; and Kaplan, S. N. (2008), “Are
U.S. CEOs overpaid?” Academy of Manage-ment Perspectives 22: 5–20.
39 . “Executive pay: Because he’s worth it,”
The Economist, July 6, 2013.
40 . “HP’s ousted CEO will take home
$25 million,” CNNMoneyTech, September
22, 2011.
41 . “Strings attached to options grant for
GE’s Immelt,” The Wall Street Journal, April
20, 2011.
42 . Ariely, D. (2010), The Upside of Irra-tionality: The Unexpected Benefits of Defy-ing Logic at Work and at Home (New York:
HarperCollins).
43 . “Have investors learned their LBO les-
sons?” BusinessWeek, December 3, 2007.
44 . The Dell LBO battle is described in:
“Dell buyout pushed to brink,” The Wall Street Journal, July 18, 2013; and “Monarchs ver-
sus managers. The battle over Dell raises the
question of whether tech firms’ founders make
the best long-term leaders of their creations,”
The Economist, July 27, 2013.
45 . www.fasb.org : “The term ‘generally
accepted accounting principles’ has a specific
meaning for accountants and auditors. The
AICPA Code of Professional Conduct prohib-
its members from expressing an opinion or
stating affirmatively that financial statements
or other financial data ‘present fairly . . . in
conformity with generally accepted account-
ing principles,’ if such information contains
any departures from accounting principles
promulgated by a body designated by the
AICPA Council to establish such principles.
The AICPA Council designated FASAB as
the body that establishes generally accepted
accounting principles (GAAP) for federal
reporting entities.”
46 . www.secfilings.com .
47 . Lowenstein, R. (2010), The End of Wall Street (New York: Penguin Press).
48 . Hayward, M.L.A., and W. Boeker (1998),
“Power and conflicts of interest in profes-
sional firms: Evidence from investment bank-
ing,” Administrative Science Quarterly 43:
1–22.
49 . http://www2.gmiratings.com/ .
50 . This section draws on and the definition
is from: Treviño, L. K., and K. A. Nelson
(2011), Managing Business Ethics: Straight Talk About How to Do It Right, 5th ed.
(Hoboken, NJ: Wiley).
51 . Several such studies, such as the
“ultimatum game,” are described in: Ariely, D.
(2008), Predictably Irrational: The Hidden
Forces That Shape Our Decisions (New York:
HarperCollins); and Ariely, D. (2010), The Upside of Irrationality: The Unexpected Ben-efits of Defying Logic at Work and at Home
(New York: HarperCollins).
52 . Lowenstein, R. (2010), The End of Wall Street (New York: Penguin Press).
53 . Smith, G. (2012), Why I Left Goldman Sachs. A Wall Street Story (New York: Grand
Central Publishing).
54 . Quoted in “‘Fab’ trader liable in fraud,”
The Wall Street Journal, August 2, 2013.
55. This Strategy Highlight is based on:
Smith, G. (2012), Why I Left Goldman Sachs. A Wall Street Story (New York: Grand Central
Publishing); “The trial of Fabrice Tourre. Not
so fabulous,” The Economist, July 20, 2013;
“‘Fab’ trader liable in fraud,” The Wall Street Journal, August 2, 2013; and “The Abacus
trial. No longer fabulous,” The Economist, August 2, 2013.
56 . Smith, G. (2012), Why I Left Goldman Sachs. A Wall Street Story.
57 . This section draws on: Treviño, L. K., and
K. A. Nelson (2011), Managing Business Ethics.
58 . Treviño, L., and A. Youngblood (1990),
“Bad apples in bad barrels: A causal analysis
of ethical-decision behavior,” Journal of Applied Psychology 75: 378–385.
59 . Ibid. Also, for a superb review and discus-
sion of this issue, see Treviño, L. K., and K.
A. Nelson (2011), Managing Business Ethics.
60 . McLean, B., and P. Elkind (2004), The Smartest Guys in the Room: The Amazing Rise and Scandalous Fall of Enron (New York:
Portfolio).
61 . “The trial of Fabrice Tourre. Not so fabu-
lous,” The Economist, July 20, 2013; “‘Fab’
trader liable in fraud,” The Wall Street Journal, August 2, 2013; and “The Abacus trial. No lon-
ger fabulous,” The Economist, August 2, 2013.
62 . Khurana, R. (2007), From Higher Aims to Hired Hands: The Social Transformation of American Business Schools and the Unful-filled Promise of Management as a Profession
(Princeton, NJ: Princeton University Press).
63 . Khurana, R., and N. Nohria (2008), “It’s
time to make management a true profession,”
Harvard Business Review, October: 70–77.
64 . For a history of the MBA oath and other
information, see www.mbaoath.org .
65 . www.mbaoath.org .
66 . Covey, S. R. (1989), The 7 Habits of Highly Effective People. Powerful Lessons in Personal Change (New York: Fire Side), pp.
139–140.
67 . Collins, J. C., and J. I. Porras (1994),
Built to Last: Successful Habits of Visionary Companies (New York: HarperCollins).
WWW.YAZDANPRESS.COMWWW.YAZDANPRESS.COM

404 CHAPTER 12 Corporate Governance and Business Ethics
68 . Bill Hewlett, HP co-founder, as quoted in
Collins, J. C., and J. I. Porras (1994), Built to Last: Successful Habits of Visionary Compa-nies, p. 1.
69 . “HP shakes up board in scandal’s wake,”
The Wall Street Journal, January 21, 2011;
and “Inside HP’s missed chance to avoid a
disastrous deal,” The Wall Street Journal, January 21, 2013.
70 . “The conscience of a capitalist,” The Wall Street Journal, October 3, 2009.
71 . “For Pepsi, a business decision with
social benefit,” The New York Times, February
21, 2011.
72 . “Catalyst 2012 census of Fortune 500:
No change for women in top leadership,”
http://www.catalyst.org/media/catalyst-
2012-census-fortune-500-no-change-women-
top-leadership .
73 . Sandberg, S. (2013), Lean In: Women, Work, and the Will to Lead (New York: Knopf).
74 . “Skirting the issue,” The Economist, March 11, 2010.
75 . This my Strategy module is based on:
“The ‘trophy kids’ go to work,” The Wall Street Journal, October 21, 2008; and Alsop,
R. (2008), The Trophy Kids Grow Up: How the Millennial Generation Is Shaking Up the Workplace (Hoboken, NJ: Jossey-Bass).
76 . Survey by CareerBuilder.com .
WWW.YAZDANPRESS.COMWWW.YAZDANPRESS.COM

405
PART 4
MiniCases
1 / Does Facebook Have a Strategy? 406
2 / Michael Phelps: The Greatest Olympian 408
3 / Teach For America: Inspiring Future Leaders 410
4 / Strategy and Serendipity: A Billion-Dollar Bonanza 412
5 / The Wonder from Sweden: Is IKEA’s Success Sustainable? 413
6 / Starbucks: Re-creating Its Uniqueness 416
7 / LVMH in China: Building Its Empire of Desire 418
8 / GE under Jack Welch vs. Jeffrey Immelt 421
9 / Competing on Business Models: Google vs. Microsoft 424
10 / From Good to Great to Gone: The Rise and Fall of Circuit City 427
11 / China’s Li Ning Challenges Nike and adidas 429
12 / Which Automotive Technology Will Win? 432
13 / Is Porsche Killing the Golden Goose? 434
14 / The Rise of Samsung Electronics 437
15 / Yummy Yum!’s Competitive Advantage in China 440
16 / BYD—“Build Your Dreams” in America 444
17 / Alibaba and China’s E-Commerce: “Open Sesame” Comes True 446
18 / The Premature Death of a Google Forerunner at Microsoft 449
19 / Sony’s Structure and Competitive Disadvantage 451
20 / UBS’s Billion-Dollar Ethics Scandals 454
WWW.YAZDANPRESS.COMWWW.YAZDANPRESS.COM
406
MiniCase 1
Does Facebook Have a Strategy?
FACEBOOK WAS FOUNDED in a dorm room at Harvard
in 2004 by 19-year-old Mark Zuckerberg and three
college pals. What began as a hobby to let college
students socialize online is now the world’s largest
social networking site, with more than 1.1 billion
users and over $5 billion in revenues (in 2012). As of
summer 2013, Facebook is the most popular website
globally, even more popular than Google. Zuckerberg
sees online social networking as the “most powerful
and transformative social change” in recent history,
and the biggest invention since Gutenberg’s printing
press. 1 Indeed, it’s made him the world’s youngest
billionaire.
Before Facebook became a global phenomenon,
it had to overcome the first-mover advantage held by
Myspace. Launched in 2003, Myspace was an early
leader in social networking. Its success attracted the
attention of News Corp. and other media outlets.
News Corp. acquired Myspace for $580 million in
2005. As a subsidiary of a publicly owned company,
Myspace’s revenues and profitability became more
pressing issues after the acquisition. Myspace’s busi-
ness model shifted from accumulating more users to
growing revenues and profits by focusing on a few
ad-heavy markets such as the U.S., UK, Germany,
France, and Japan. Myspace was hit hard by the global
economic downturn that began in 2008. A year later, it
laid off 45 percent of its staff.
Facebook, on the other hand, remained a private
company until May 2012. Among other investors,
Microsoft purchased a $240 million equity stake in
2007, and a Russian investment group added $200
million in 2009. Facebook’s managers had less pres-
sure to produce bottom-line results than did Myspace.
This allowed the company to pursue a different busi-
ness model: more users first, profits later. While
Myspace concentrated on a few developed markets,
Facebook pursued a truly global strategy. More than
70 percent of its users are outside the United States.
In 2008, Facebook displaced Myspace as the most
popular social networking site. Facebook’s new chal-
lengers in the social media space include Google 1 ,
LinkedIn, Pinterest, and Twitter.
Facebook’s business model is based on three
pillars:
1. News Feed. Launched in September 2006, this
quickly became a core feature of Facebook. It
is at the heart of a user’s homepage and pro-
vides regular updates of friends’ posts, photos,
events, group memberships, and other subjects.
The priority of items displayed in the News
Feed is based on a complex algorithm.
2. Timeline. This is an updated version of the
profi le pages and was launched in September
2011. It allows each user to paint a complete
life story on his or her profi le. Users can select
what information is shared and with whom
they share it.
3. Graph Search. Zuckerberg calls the network of
connections between people the “social graph.”
Graph Search is an attempt to map the global
social graph in the form of a massive database.
Introduced in January 2013, it is a search bar
that hovers at the top of Facebook’s web page,
acting as a title for the content of that page
and allowing a user to query the portion of the
social graph that is connected to and fi lled in by
the user.
As Exhibit MC1.1 shows, in May 2012 Facebook
went public with an initial share price of $38, making
the company worth more than $100 billion. Just a year
later, in the summer of 2013, Facebook was valued at
around $60 billion. In an interview, Mark Zuckerberg
conceded, “The performance of the stock has obvi-
ously been disappointing.” 2
Frank T. Rothaermel prepared this MiniCase from public sources. It is devel-
oped for the purpose of class discussion. It is not intended to be used for
any kind of endorsement, source of data, or depiction of efficient or inef-
ficient management. All opinions expressed, and all errors and omissions, are
entirely the author’s. © Rothaermel, 2014.
WWW.YAZDANPRESS.COMWWW.YAZDANPRESS.COM

MINICASE 1 Does Facebook Have a Strategy? 407
Endnotes
1. “Facebook CEO in no rush to ‘friend’ Wall Street,” The Wall Street Journal, March 3, 2010.
2. Quote from: “Zuckerberg admits to missteps,” The Wall Street Journal, September 11, 2012.
DISCUSSION QUESTIONS
Review Chapter 1: What Is Strategy, and Why Is It Important?
1. Why is Facebook the number-one social media
company, and not Myspace which enjoyed a first-
mover advantage?
2. Given the hallmarks of good and bad strategy
(discussed in Chapter 1), do you think Facebook
has a good strategy? Why or why not?
3. The first step in creating a good strategy is to diag-
nose the competitive challenge. What do you believe
is Facebook’s number-one competitive challenge?
4. What top-three recommendations would you give
Mr. Zuckerberg? Why? Support your arguments.
May Jul Oct 2013 Apr
38.00
36.00
34.00
32.00
30.00
28.00
26.00
24.00
22.00
20.00
18.00
May 18, 2012 - Jul 04, 2013 Facebook
$24.52
$38.00
EXHIBIT MC1.1 / Facebook’s Share Price May 18, 2012, at IPO ($38.00) to July 4, 2013 ($24.52)SOURCE: MSN Money, http://money.msn.com/.
Sources: This MiniCase is based on “Facebook’s land grab in the face of a
downturn,” Bloomberg Businessweek, November 20, 2008; “A special report
on social networking,” The Economist, January 30, 2010; “Facebook CEO
in no rush to ‘friend’ Wall Street,” The Wall Street Journal; “The world’s
billionaires,” Forbes, March 10, 2010; “Facebook wants to know more than
just who your friends are,” The Wall Street Journal; “Facebook’s Washing-
ton problem,” Bloomberg Businessweek, May 13, 2010; “Lives of others,”
The Economist, May 20, 2010; www.comscore.com; www.facebook.com;
and www.myspace.com. For an in-depth discussion of Facebook, see: Case
Study MHHE-FTR-0021 “Facebook: Will Wall Street hit the ‘Like’ button?”
by Frank T. Rothaermel and Seth Taylor (2014).
WWW.YAZDANPRESS.COMWWW.YAZDANPRESS.COM
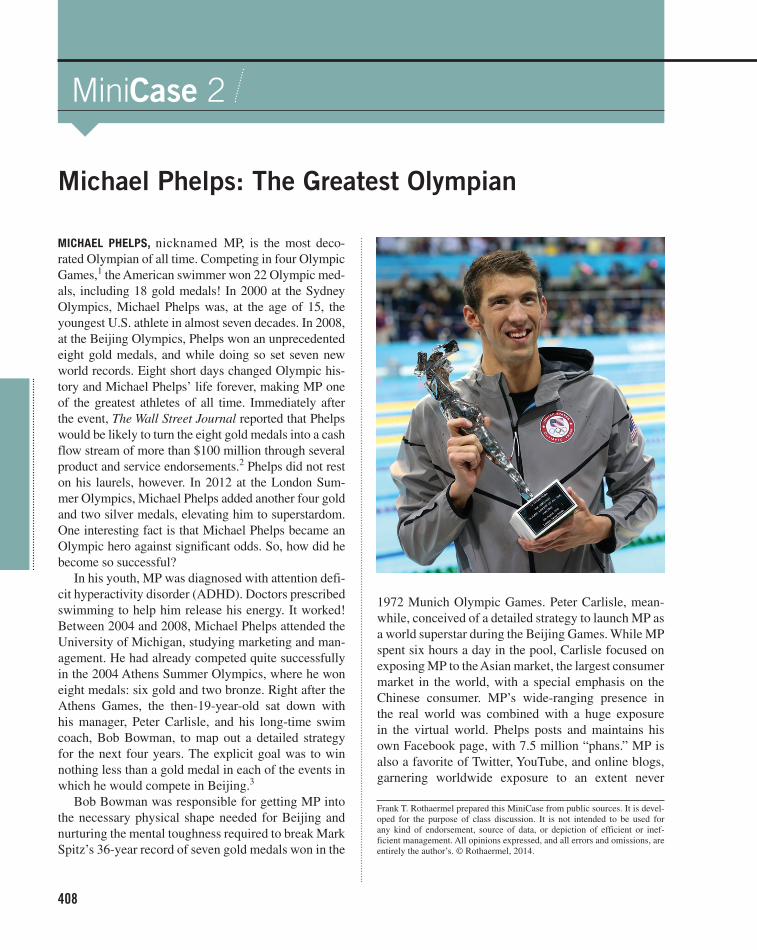
408
MiniCase 2
MICHAEL PHELPS, nicknamed MP, is the most deco-
rated Olympian of all time. Competing in four Olympic
Games, 1 the American swimmer won 22 Olympic med-
als, including 18 gold medals! In 2000 at the Sydney
Olympics, Michael Phelps was, at the age of 15, the
youngest U.S. athlete in almost seven decades. In 2008,
at the Beijing Olympics, Phelps won an unprecedented
eight gold medals, and while doing so set seven new
world records. Eight short days changed Olympic his-
tory and Michael Phelps’ life forever, making MP one
of the greatest athletes of all time. Immediately after
the event, The Wall Street Journal reported that Phelps
would be likely to turn the eight gold medals into a cash
flow stream of more than $100 million through several
product and service endorsements. 2 Phelps did not rest
on his laurels, however. In 2012 at the London Sum-
mer Olympics, Michael Phelps added another four gold
and two silver medals, elevating him to superstardom.
One interesting fact is that Michael Phelps became an
Olympic hero against significant odds. So, how did he
become so successful?
In his youth, MP was diagnosed with attention defi-
cit hyperactivity disorder (ADHD). Doctors prescribed
swimming to help him release his energy. It worked!
Between 2004 and 2008, Michael Phelps attended the
University of Michigan, studying marketing and man-
agement. He had already competed quite successfully
in the 2004 Athens Summer Olympics, where he won
eight medals: six gold and two bronze. Right after the
Athens Games, the then-19-year-old sat down with
his manager, Peter Carlisle, and his long-time swim
coach, Bob Bowman, to map out a detailed strategy
for the next four years. The explicit goal was to win
nothing less than a gold medal in each of the events in
which he would compete in Beijing. 3
Bob Bowman was responsible for getting MP into
the necessary physical shape needed for Beijing and
nurturing the mental toughness required to break Mark
Spitz’s 36-year record of seven gold medals won in the
1972 Munich Olympic Games. Peter Carlisle, mean-
while, conceived of a detailed strategy to launch MP as
a world superstar during the Beijing Games. While MP
spent six hours a day in the pool, Carlisle focused on
exposing MP to the Asian market, the largest consumer
market in the world, with a special emphasis on the
Chinese consumer. MP’s wide-ranging presence in
the real world was combined with a huge exposure
in the virtual world. Phelps posts and maintains his
own Facebook page, with 7.5 million “phans.” MP is
also a favorite of Twitter, YouTube, and online blogs,
garnering worldwide exposure to an extent never
Michael Phelps: The Greatest Olympian
Frank T. Rothaermel prepared this MiniCase from public sources. It is devel-
oped for the purpose of class discussion. It is not intended to be used for
any kind of endorsement, source of data, or depiction of efficient or inef-
ficient management. All opinions expressed, and all errors and omissions, are
entirely the author’s. © Rothaermel, 2014.
WWW.YAZDANPRESS.COMWWW.YAZDANPRESS.COM
MINICASE 2 Michael Phelps: The Greatest Olympian 409
2. Following the Beijing Olympics, a photo pub-
lished by a British tabloid showed Michael Phelps
using a “bong,” a device for smoking marijuana,
at a party in South Carolina. Kellogg’s withdrew
Phelps’ endorsement contract. What does this
incident tell you about maintaining and increasing
brand value over time?
3. According to a study by two economics pro-
fessors at the University of California, Davis, 6
another example of an athlete who lost significant
“brand value” is Tiger Woods, who destroyed an
estimated $12 billion in stock market value of the
firms sponsoring him—Accenture, Gillette, Nike,
PepsiCo (Gatorade), and Electronic Arts (EA). As
a manager, what lessons about celebrity endorse-
ments can you draw from the examples of Phelps
and Woods? What are some general take-aways
that a strategist should keep in mind?
Endnotes
1. Sydney in 2000; Athens in 2004; Beijing in 2008; and London in
2012.
2 . “Now, Phelps chases gold on land,” The Wall Street Journal, August
18, 2008.
3 . Ibid.
4. “Michael Phelps’ agent has been crafting the swimmer’s image for
years,” Associated Press, September 14, 2008.
5. “Profile: Michael Phelps—A normal guy from another planet,”
Telegraph, August 15, 2008.
6 . Knittel, C. R., and V. Stango (2008), “Celebrity endorsements, firm
value and reputation risk: Evidence from the Tiger Woods scandal,”
working paper, University of California, Davis, http://faculty.gsm.
ucdavis.edu/~vstango/tiger007.pdf .
before achieved by an Olympian. 4 The gradual buildup
of Phelps over a number of years enabled manager
Peter Carlisle to launch MP as a superstar right after
he won his eighth gold medal at the Beijing Games.
By then, MP had become a worldwide brand.
A successful strategy can be based on leverag-
ing unique resources and capabilities. Accordingly,
some suggest that MP’s success can be explained by
his unique physical endowments: his long thin torso,
which reduces drag; his arm span of 6 feet 7 inches
(204 cm), which is disproportionate to his 6-foot-4-
inch (193 cm) height; his relatively short legs for a
person of his height; and his size-14 feet which work
like flippers due to hypermobile ankles. 5 While MP’s
physical attributes are a necessary condition for win-
ning, they are not sufficient. Many other swimmers,
like the Australian Ian Thorpe (who has size-17 feet)
or the German “albatross” Michael Gross (with an arm
span of 7 feet, or 213 cm), also brought extraordinary
resource endowments to the swim meet. Yet neither of
them won eight gold medals in a single Olympics.
DISCUSSION QUESTIONS
Review Chapter 1: What Is Strategy, and Why Is It Important?
1. Olympians generally do not turn into global phe-
nomena. One reason is that they are highlighted
only every four years (e.g., not too many people
follow competitive swimming or downhill skiing
[think Lindsey Vonn] outside the Olympics). How
did Michael Phelps transform his competitive
advantage as an athlete into a “global brand”?
WWW.YAZDANPRESS.COMWWW.YAZDANPRESS.COM

410
MiniCase 3
TEACH FOR AMERICA (TFA) is a nonprofit organization
that recruits college graduates and professionals to
teach for two years in economically disadvantaged
communities in the United States. The idea behind
Teach For America was developed in 1989 by then-21-
year-old Wendy Kopp as her senior thesis at Princeton.
Kopp was convinced young people today are search-
ing for meaning in their lives by making a positive
contribution to society. In the first four months after
creating TFA, Kopp received more than 2,500 appli-
cants. Her “marketing” tool was flyers under dorm
rooms at this time. Corporate America donated $2.5
million in seed grants during TFA’s first year. In 2012,
TFA’s operating budget was $250 million. Teach For
America describes itself as “the growing movement of
leaders who work to ensure that kids growing up in
poverty get an excellent education.” 1
The genius of Kopp’s idea was to turn on its head the
social perception of teaching—to make what appeared
to be an unattractive, low-status job into a high- prestige
professional opportunity. Kopp established a mission
for the organization she had in mind: to eliminate
educational inequality by enlisting our nation’s most
promising future leaders in the effort. Her underlying
assumption was that significant numbers of young peo-
ple have a desire to take on meaningful responsibility
in order to have a positive impact on the lives of others.
To be chosen for TFA is a badge of honor. In 2012,
TFA received some 48,000 applications for only about
5,000 positions across the country (paying the same as
all other first-year teachers, ranging from $30,000 to
$51,500 a year). This translates to a mere 10 percent
acceptance rate. Since each TFA cohort teaches for two
years, in the 2012–2013 school year, more than 10,000
corps members taught 750,000 students.
Persuading highly qualified teachers to take up
jobs in some inner cities and rural areas has been an
elusive goal for many decades. Making TFA highly
selective changed the social perception of teaching in
underprivileged areas. Suddenly, it was an honor (and
great résumé builder) to be chosen for TFA. More than
60 percent of TFA’s more than 20,000 alumni are still
working in the field of education today.
TFA is not without critics, however. Some tradi-
tional teachers have charged that hiring college students
who are given only seven weeks of teacher training and
who are committed to a community for only two years
takes jobs away from traditionally trained teachers and
thus is detrimental to a community.
DISCUSSION QUESTIONS
Review Chapter 2: Strategic Leadership: Managing the Strategy Process.
1. How did an undergraduate student accomplish
what the Department of Education, state and local
school boards, and the national Parent-Teacher
Association were unable to achieve despite trying
for decades and spending billions of dollars in the
process?
2. Respond to the charge that TFA teachers take jobs
away from teachers with degrees in education. Is
Teach For America: Inspiring Future Leaders
Frank T. Rothaermel prepared this MiniCase from public sources. It is devel-
oped for the purpose of class discussion. It is not intended to be used for
any kind of endorsement, source of data, or depiction of efficient or inef-
ficient management. All opinions expressed, and all errors and omissions, are
entirely the author’s. © Rothaermel, 2014.
WWW.YAZDANPRESS.COMWWW.YAZDANPRESS.COM

MINICASE 3 Teach For America: Inspiring Future Leaders 411
4. What are your personal leadership take-aways
from Wendy Kopp and the TFA Mini Case?
Endnote
1. http://www.teachforamerica.org.
using TFA teachers a way for school corporations
to lower costs by hiring younger teachers at entry-
level salaries?
3. Applying the Level-5 leadership pyramid, in what
ways is Wendy Kopp an effective leader?
WWW.YAZDANPRESS.COMWWW.YAZDANPRESS.COM
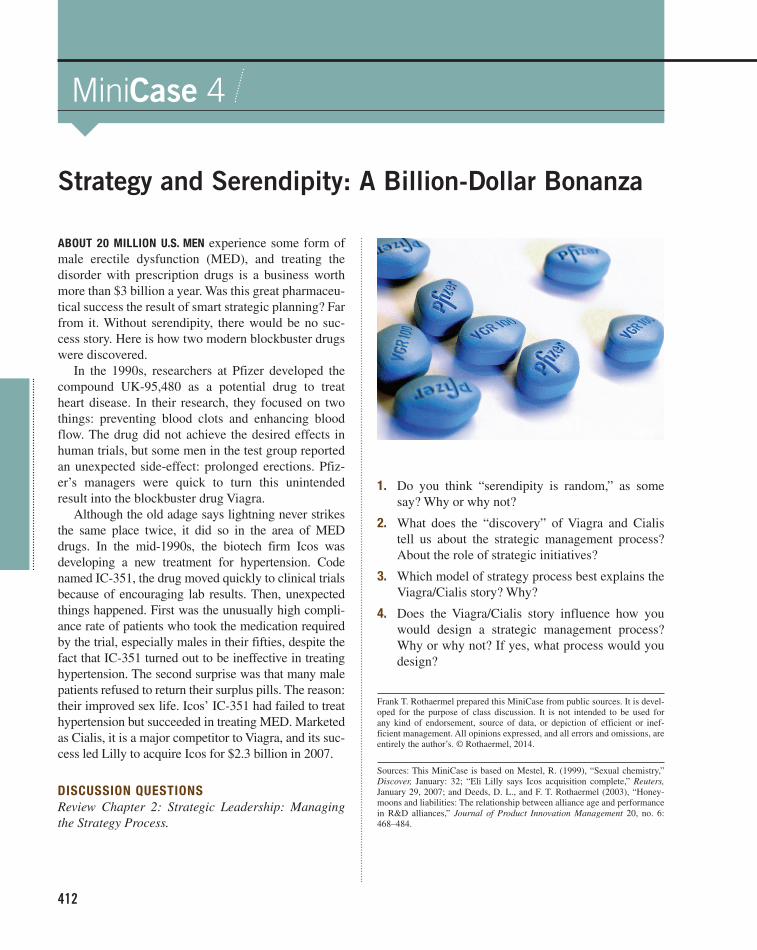
412
MiniCase 4
ABOUT 20 MILLION U.S. MEN experience some form of
male erectile dysfunction (MED), and treating the
disorder with prescription drugs is a business worth
more than $3 billion a year. Was this great pharmaceu-
tical success the result of smart strategic planning? Far
from it. Without serendipity, there would be no suc-
cess story. Here is how two modern blockbuster drugs
were discovered.
In the 1990s, researchers at Pfizer developed the
compound UK-95,480 as a potential drug to treat
heart disease. In their research, they focused on two
things: preventing blood clots and enhancing blood
flow. The drug did not achieve the desired effects in
human trials, but some men in the test group reported
an unexpected side-effect: prolonged erections. Pfiz-
er’s managers were quick to turn this unintended
result into the blockbuster drug Viagra.
Although the old adage says lightning never strikes
the same place twice, it did so in the area of MED
drugs. In the mid-1990s, the biotech firm Icos was
developing a new treatment for hypertension. Code
named IC-351, the drug moved quickly to clinical trials
because of encouraging lab results. Then, unexpected
things happened. First was the unusually high compli-
ance rate of patients who took the medication required
by the trial, especially males in their fifties, despite the
fact that IC-351 turned out to be ineffective in treating
hypertension. The second surprise was that many male
patients refused to return their surplus pills. The reason:
their improved sex life. Icos’ IC-351 had failed to treat
hypertension but succeeded in treating MED. Marketed
as Cialis, it is a major competitor to Viagra, and its suc-
cess led Lilly to acquire Icos for $2.3 billion in 2007.
DISCUSSION QUESTIONS
Review Chapter 2: Strategic Leadership: Managing the Strategy Process.
1. Do you think “serendipity is random,” as some
say? Why or why not?
2. What does the “discovery” of Viagra and Cialis
tell us about the strategic management process?
About the role of strategic initiatives?
3. Which model of strategy process best explains the
Viagra/Cialis story? Why?
4. Does the Viagra/Cialis story influence how you
would design a strategic management process?
Why or why not? If yes, what process would you
design?
Frank T. Rothaermel prepared this Mini Case from public sources. It is devel-
oped for the purpose of class discussion. It is not intended to be used for
any kind of endorsement, source of data, or depiction of efficient or inef-
ficient management. All opinions expressed, and all errors and omissions, are
entirely the author’s. © Rothaermel, 2014.
Sources: This MiniCase is based on Mestel, R. (1999), “Sexual chemistry,”
Discover, January: 32; “Eli Lilly says Icos acquisition complete,” Reuters, January 29, 2007; and Deeds, D. L., and F. T. Rothaermel (2003), “Honey-
moons and liabilities: The relationship between alliance age and performance
in R&D alliances,” Journal of Product Innovation Management 20, no. 6:
468–484.
Strategy and Serendipity: A Billion-Dollar Bonanza
WWW.YAZDANPRESS.COMWWW.YAZDANPRESS.COM

413
MiniCase 5
THE WORLD’S MOST SUCCESSFUL GLOBAL RETAILER, in
terms of profitability, is not Walmart or the French
grocery chain Carrefour, but IKEA—a privately
owned home-furnishings company with origins in
Sweden. In 2012, IKEA had more than 330 stores
worldwide in 38 countries, employed some 140,000
people, and earned revenues of 33 billion euros.
IKEA’s revenues by geographic region are 70 percent
from Europe, with the rest from North America (16
percent), Asia and Australia (8 percent), and Russia
(6 percent) (Exhibit MC5.1). Although IKEA’s largest
market is in Germany (14 percent of total sales), its
fastest-growing markets are the United States, China,
and Russia. Exhibit MC5.2 shows IKEA’s growth in
the number of stores and revenues worldwide since
1974. Known today for its iconic blue-and-yellow big-
box retail stores, focusing on flat-pack furniture boxes
combined with a large DIY component, IKEA started
as a small retail outlet in 1943 by then-17-year-old
Ingvar Kamprad.
Though IKEA has become a global phenomenon, it
was initially slow to internationalize. It took 20 years
before the company expanded beyond Sweden to its
neighboring country of Norway. After honing and
refining its core competencies of designing modern
functional home furnishings at low prices and offer-
ing a unique retail experience in its home market,
IKEA followed an international strategy, expanding
first to Europe, and then beyond. Using an interna-
tional strategy allowed IKEA to sell the same types
of home furnishings across the globe with little adap-
tation (although it does make some allowances for
country preferences). Because IKEA focuses on low
cost, it shifted more recently from an international
strategy to a global-standardization strategy, in which
it attempts to achieve economies of scale through
effectively managing a global supply chain. Although
Asia accounts currently for only 8 percent of its sales,
IKEA sources 32 percent of its inputs (mostly timber)
from this region. To drive costs down further, IKEA
has begun to implement production techniques from
auto and electronics industries, in which cutting-edge
technologies are employed to address complexity
while achieving flexibility and low cost.
Despite its success, IKEA faces significant chal-
lenges going forward. Opening new stores is critical
The Wonder from Sweden:
Is IKEA’s Success Sustainable?
EXHIBIT MC5.1 / IKEA’s Sales by Geographic Region (2012)
SOURCE: Author’s depiction of data from “IKEA’s Yearly Summary FY 2012” (www.ikea.com).
Frank T. Rothaermel prepared this MiniCase from public sources. It is devel-
oped for the purpose of class discussion. It is not intended to be used for
any kind of endorsement, source of data, or depiction of efficient or inef-
ficient management. All opinions expressed, and all errors and omissions, are
entirely the author’s. © Rothaermel, 2014.
Europe70%
North America16%
Asia &Australia
8%
Russia6%
WWW.YAZDANPRESS.COMWWW.YAZDANPRESS.COM

414 MINICASE 5 The Wonder from Sweden: Is IKEA’s Success Sustainable?
Besides these external challenges, IKEA also
faces significant internal ones. Since the compa-
ny’s founding in 1943, no strategic decisions have
been made without Mr. Kamprad’s involvement and
explicit approval. In 2013, Mr. Kamprad (now in
his late 80s) announced he is stepping down from
chairing Inter IKEA, the foundation that owns the
company. Many observers compare Mr. Kamprad’s
influence on IKEA’s culture and organization to
that of the legendary Sam Walton at Walmart.
Mr. Kamprad’s three sons will take on stronger lead-
ership roles at IKEA, with one of them now chairing
Inter IKEA.
Moreover, IKEA is privately held (through a
complicated network of foundations and holding
companies in the Netherlands, Lichtenstein, and
Luxembourg). This arrangement provides benefits in
terms of reducing tax exposure, but also creates con-
straints in accessing large sums of capital needed for
rapid global expansion. IKEA will need to address
these challenges in order to live up to its strategic
intent of doubling its number of yearly openings in an
attempt to capture a larger slice of fast-growing mar-
kets such as the U.S., China, and Russia.
to drive future growth (see Exhibit MC5.2). Finding
new sources of supply to support more store openings,
however, is a challenge. Although demand for IKEA’s
low-cost home furnishings increased during the global
financial crisis as more customers became price con-
scious, IKEA’s annual store growth has slowed to less
than five new stores a year. This is because its sup-
ply chain has become a bottleneck. IKEA has diffi-
culty finding suppliers that are a strategic fit with its
highly efficient operations. Related to this issue is the
fact that wood remains one of IKEA’s main input fac-
tors, and the world’s consumers are becoming more
sensitive to the issue of deforestation and its possible
link to global warming. In the near future, IKEA must
find low-cost replacement materials for wood. In
addition, powerful competitors have taken notice of
IKEA’s success. Although IKEA is growing in North
America, it holds less than 5 percent of the home-
furnishings market. In some European markets, IKEA
holds 30 percent market share. To keep IKEA at bay
in the U.S., Target has recently recruited top designers
and launched a wide range of low-priced furnishings.
Kmart, likewise, has enrolled Martha Stewart to help
with the design of its offerings of home furnishings.
EXHIBIT MC5.2 / IKEA Stores and Revenues, 1974–2012SOURCES: Author’s depiction of data from “The secret of IKEA’s success,” The Economist, February 24, 2011, and various IKEA “Yearly Summaries” (www.ikea.com).
0
50
100
150
200
250
300
350
400
1974 1984 1994 2004 2005 2006 2007 2008 2009 2010 2011 2012
Nu
mb
er
of
Sto
res
0
5
10
15
20
25
30
35
Re
ven
ue
s (b
illi
on
eu
ro)
RevenuesStores
WWW.YAZDANPRESS.COMWWW.YAZDANPRESS.COM

MINICASE 5 The Wonder from Sweden: Is IKEA’s Success Sustainable? 415
4. What can IKEA do to continue to drive growth
globally, especially given its strategic intent to
double annual store openings?
5. Assume you are hired to consult IKEA on the
topic of corporate social responsibility (see the
discussion in Chapter 2). Which areas would you
recommend the company be most sensitive to, and
how should these be addressed?
DISCUSSION QUESTIONS
Review Chapter 3: External Analysis: Industry Struc-ture, Competitive Forces, and Strategic Groups.
1. List IKEA’s external and internal challenges.
Looking at IKEA’s challenges, which ones do you
think pose the greatest threat? Why? How would
you address the challenges?
2. Walmart entered a period of difficulties after Sam
Walton stepped down. Do you anticipate IKEA
having the same leadership transition challenges?
Why or why not?
3. Did it surprise you to learn that both a developed
country (the United States) and also emerging
economies (i.e., China and Russia) are the fastest-
growing international markets for IKEA? Does this
fact pose any challenges in the way IKEA ought to
compete across the globe? Why or why not?
Sources: This MiniCase is based on “IKEA: How the Swedish retailer
became a global cult brand,” BusinessWeek, November 14, 2005; “Flat-pack
accounting,” The Economist, May 11, 2006; “Shocking tell-all book takes aim
at Ikea,” Bloomberg Businessweek, November 12, 2009; Peng, M. (2009),
Global Strategy, 2nd ed. (Mason, OH: South-Western Cengage); “The secret
of IKEA’s success,” The Economist, February 24, 2011; “IKEA to accelerate
expansion,” The Wall Street Journal, September 18, 2012; “Ingvar Kamprad
steps back,” The Economist, June 5, 2013; and various IKEA Yearly Sum-
maries (www.ikea.com).
WWW.YAZDANPRESS.COMWWW.YAZDANPRESS.COM
416
MiniCase 6
INSPIRED BY ITALIAN COFFEE BARS, Starbucks’ CEO
Howard Schultz set out to provide a completely new
consumer experience. The trademark of any Star-
bucks coffeehouse is its ambience—where music and
comfortable chairs and sofas encourage customers
to sit and enjoy their beverages. While hanging out
at Starbucks (Ticker: SBUX), they can use the com-
plimentary wireless hotspot or just visit with friends.
The barista seems to speak a foreign language as she
rattles off the offerings: Caffé Misto, Caramel Mac-
chiato, Cinnamon Dolce Latte, Espresso Con Panna,
and Starbucks’ Mint Mocha Chip Frappuccino are
among some 30 different coffee blends. Dazzled and
enchanted, customers pay $4 or more for a Venti-sized
drink. Starbucks has been so successful in creating its
ambience that customers keep coming back for more.
Starbucks’ core competency is to create a unique
consumer experience the world over. That is what
customers are paying for, not the cup of coffee or
tea. The consumer experience Starbucks created
was a valuable, rare, and costly-to-imitate intangible
resource. This allowed the company to gain a com-
petitive advantage.
While core competencies are often built through
learning from experience, these competencies can
atrophy through forgetting. This is what happened
to Starbucks. Between 2004 and 2008, Starbucks
expanded operations rapidly by doubling the num-
ber of stores from 8,500 to almost 17,000 stores (see
Exhibit MC6.1). It also branched out into ice cream,
desserts, sandwiches, books, music, and other retail
merchandise, straying from its core business. Trying
to keep up with its explosive growth in both the num-
ber of stores and product offerings, Starbucks began
to forget what made it unique. It lost the appeal that
made it special, and its unique culture became diluted.
For example, baristas used to grind beans throughout
the day whenever a new pot of coffee had to be brewed
(which was at least every eight minutes). The grind-
ing sounds and fresh coffee aroma were trademarks
of Starbucks stores. Instead, to accommodate its fast
growth, many baristas began to grind all of the day’s
coffee beans in the morning and store them for the rest
of the day. To make matters worse, in 2008 the global
financial crisis hit. The first items consumers go with-
out during recession are luxury items such as a $4 cof-
fee at Starbucks (see revenue drop in Exhibit MC6.1 ).
Coming out of an eight-year retirement, Howard
Schultz again took the reins as CEO and president in
January 2008, attempting to re-create what had made
Starbucks special. In 2009, Starbucks introduced Via,
its new instant coffee, a move that some worried might
further dilute the brand. In the fall of 2010, Schultz
rolled out a new guideline: Baristas would no longer
multitask, making multiple drinks at the same time,
but would instead focus on no more than two drinks at
a time, starting a second one while finishing the first.
The goal was to bring back the customer experience
that built the Starbucks brand. By the summer of 2013,
Starbucks operated some 21,000 stores in over 60
countries, bringing in $14 billion in annual revenues.
DISCUSSION QUESTIONS
Review Chapter 4: Internal Analysis: Resources, Capabilities, and Core Competencies.
1. What resources and capabilities formed the basis
of the uniqueness of Starbucks in the first place?
Why was it so successful?
2. To be a source of competitive advantage over time,
core competencies need to be honed and upgraded
continuously (see Exhibit 4.5, in Chapter 4).
a. Why and how did Starbucks lose its uniqueness?
b. How is Starbucks re-creating its uniqueness?
Do you think it will be successful over time?
Why or why not?
Starbucks: Re-creating Its Uniqueness
Frank T. Rothaermel prepared this MiniCase from public sources. It is devel-
oped for the purpose of class discussion. It is not intended to be used for
any kind of endorsement, source of data, or depiction of efficient or inef-
ficient management. All opinions expressed, and all errors and omissions, are
entirely the author’s. © Rothaermel, 2014.
WWW.YAZDANPRESS.COMWWW.YAZDANPRESS.COM
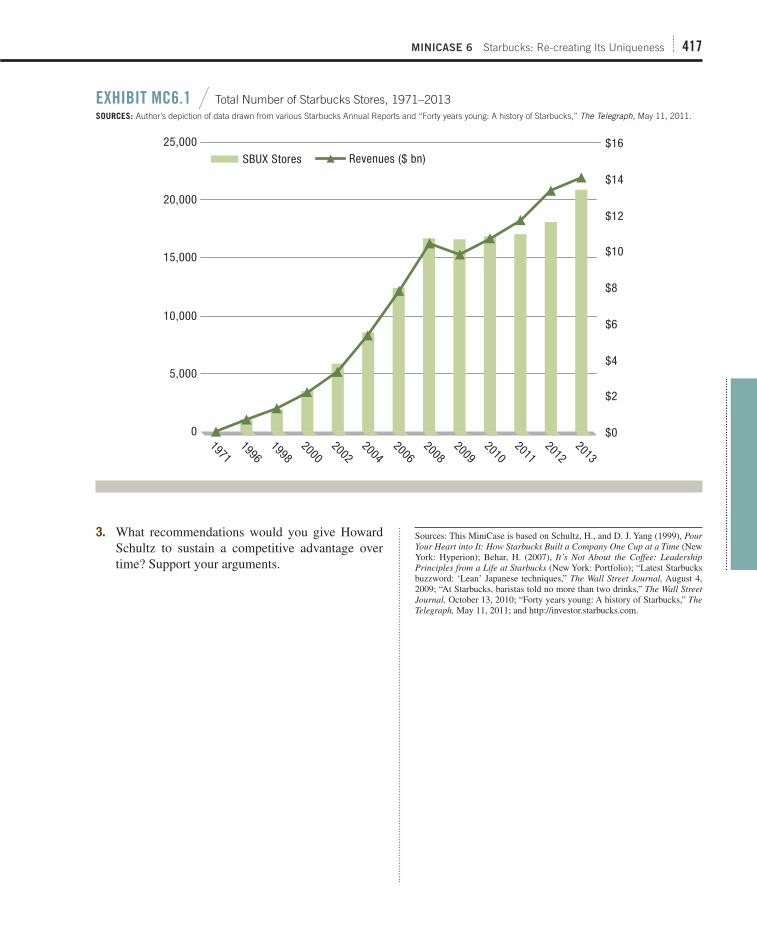
MINICASE 6 Starbucks: Re-creating Its Uniqueness 417
3. What recommendations would you give Howard
Schultz to sustain a competitive advantage over
time? Support your arguments.
0
5,000
10,000
15,000
20,000
25,000
19711996
19982000
20022004
20062008
20092010
20112012
2013
$0
$2
$4
$6
$8
$10
$12
$14
$16SBUX Stores Revenues ($ bn)
EXHIBIT MC6.1 / Total Number of Starbucks Stores, 1971–2013SOURCES: Author’s depiction of data drawn from various Starbucks Annual Reports and “Forty years young: A history of Starbucks,” The Telegraph, May 11, 2011.
Sources: This MiniCase is based on Schultz, H., and D. J. Yang (1999), Pour Your Heart into It: How Starbucks Built a Company One Cup at a Time (New
York: Hyperion); Behar, H. (2007), It’s Not About the Coffee: Leadership Principles from a Life at Starbucks (New York: Portfolio); “Latest Starbucks
buzzword: ‘Lean’ Japanese techniques,” The Wall Street Journal, August 4,
2009; “At Starbucks, baristas told no more than two drinks,” The Wall Street Journal, October 13, 2010; “Forty years young: A history of Starbucks,” The Telegraph, May 11, 2011; and http://investor.starbucks.com.
WWW.YAZDANPRESS.COMWWW.YAZDANPRESS.COM

418
MiniCase 7
IN JULY 2012, Louis Vuitton, the flagship brand of
France’s Moët Hennessy Louis Vuitton S.A., better
known as LVMH, opened its 16 th global “Maison”
at Shanghai’s Plaza 66, a mega luxury mall. The
Shanghai Maison houses the entire range of Louis
Vuitton collections, from high-fashion clothing and
leather goods, to jewelry, watches, cosmetics, and
wines and spirits. The grand opening of the Shanghai
Maison also coincided with the 20 th anniversary of the
brand’s presence in China; Louis Vuitton had opened
its first store in the country in 1992, in Beijing’s
Peninsula Hotel.
LVMH’s sales in Asia accounted for one third of its
total revenue by the end of the first quarter of 2013. 1
Those results made Asia the largest region for LVMH
in terms of revenues ( Exhibit MC7.1 ). Focusing on
countries rather than regions, China is the world’s big-
gest luxury market ( Exhibit MC7.2 ), having achieved
an average annual growth rate of 27 percent from
2008 to 2012.
Louis Vuitton loves China, and the Chinese love
Louis Vuitton. In a recent Chinese luxury consumer
survey published by the Hurun Research Institute,
Louis Vuitton topped the list as the number-one and
number-two preferred luxury brand by Chinese men
and women, respectively. Although the brand’s heri-
tage and craftsmanship are attractive characteristics to
Chinese consumers, they are not solely responsible for
opening the wallets of affluent Chinese. Louis Vuit-
ton’s steep prices and glamorous prestige are reflected
onto its customers, and Chinese luxury customers
value being recognized as wealthy elites with high
social status. To stay apart from (or atop) the crowd
is what Chinese customers crave in a densely popu-
lated and formerly egalitarian (communist) society.
The brand’s image reinforcement is so powerful that
even many in China’s middle class aspire to become
owners of Louis Vuitton goods. On average, Chinese
Louis Vuitton customers are younger than their West-
ern counterparts. Moreover, they spend a significantly
higher amount of their disposable income on LVMH’s
luxury status symbols.
With an eager consumer base and a lack of local
competitors, there is probably no stronger tailwind an
international brand could hope for in China. LVMH’s
years of heavy marketing to raise consumer brand recog-
nition have paid off: Goods fly off the shelves, and every
single store LVMH has opened in China is profitable.
LVMH managed its growth well. Since its forma-
tion in 1987, it has become the world’s largest luxury
conglomerate, owning more than 60 brands and 3,200
stores worldwide. 2 It has a remarkable track record
in Asia: 85 percent of Japanese women own a Louis
Vuitton product, for example. With an early entry into
China, LVMH was also able to take advantage of the
country’s increasing growth to become the largest
luxury market worldwide. Not only did LVMH cap-
ture the luxury lovers in Beijing and Shanghai, but it
also opened stores in second-tier provincial capitals
and wealthier third-tier cities in the west, where rapid
growth was expected.
After nearly a decade of successful expansion, LVMH
recently turned more cautious, though. LVMH’s con-
cern in China is to “avoid becoming too commonplace.” 3
Although the newly rich in second- and third-tier cities
still crave luxury goods, consumer tastes in Beijing and
Shanghai may be maturing. Chinese in the major cities
have become well-traveled global consumers and are
shying away from “logo-heavy” mega brands. Increas-
ingly, they are more sophisticated consumers, embracing
uniqueness and understatement in luxury items.
To respond to changing consumer tastes, LVMH
stopped opening new stores in China and launched the
Shanghai Maison with invitation-only floors. It also
offers custom made-to-order bags using exotic animal
LVMH in China: Building Its Empire of Desire
Frank T. Rothaermel and Carrie Yang (GT MBA, MSc.) prepared this Mini-
Case from public sources. It is developed for the purpose of class discussion.
It is not intended to be used for any kind of endorsement, source of data, or
depiction of efficient or inefficient management. All opinions expressed, and
all errors and omissions, are entirely the authors’. © Rothaermel and Yang,
2014.
WWW.YAZDANPRESS.COMWWW.YAZDANPRESS.COM

MINICASE 7 LVMH in China: Building Its Empire of Desire 419
recent holiday season, for example, Louis Vuitton had
to put in drastic measures to slow sales. In its flagship
Paris store, LVMH limited the total number of leather
products available for purchase for each customer
and reduced store hours. In addition, Louis Vuitton’s
skins, to project exclusivity for the very top-end cus-
tomers. It began to focus on leather products with high
value added rather than the entry-level-priced canvas
logo style. In addition, LVMH has promoted a set of
“logo-free” handbags targeted exclusively at high-end
Chinese customers.
But LVMH’s decision to limit
store growth may have another
reason: The Chinese are more
often choosing to buy abroad.
The main reasons Chinese con-
sumers cite for shopping over-
seas are lower prices (due to
China’s high luxury taxes), bet-
ter selection, and greater “show-
off” value. It is quite common
to find busloads of Chinese
tourists lining up outside Louis
Vuitton’s boutique on Avenue
des Champs- Elysées in Paris to
purchase merchandise.
Although such purchases
in the Paris store have created
growth for LVMH Europe, they
also pose challenges such as
managing inventory and provid-
ing adequate service. Before a
EXHIBIT MC7.1 / LVMH’s Sales by Geographic RegionSOURCE: Authors’ depiction of data from LVMH Annual Reports, 2002–Q1 2013.
0%
10%
20%
30%
40%
50%
60%
70%
80%
90%
100%
20022003
20042005
20062007
20082009
20102011
2012
Q1 2013
Other
Asia (excl. Japan)
Japan
U.S.
Europe
0% 5% 10% 15% 20% 25% 30% 35%
Other Asian
Japanese
U.S.
European
Chinese
19952012
EXHIBIT MC7.2 / Luxury Market by Consumer NationalitySOURCE: Authors’ depiction of data from “Luxury goods in China: Beyond bling,” The Economist, June 8, 2013.
WWW.YAZDANPRESS.COMWWW.YAZDANPRESS.COM

420 MINICASE 7 LVMH in China: Building Its Empire of Desire
the challenges to the value of the brand as LVMH
responds by introducing more luxury handbags
and accessories without displaying the logo.
3. LVMH is also confronting the problem of prolif-
eration of the LV logo through excessive counter-
feiting activity. How can LVMH use its strengths
to overcome threats from counterfeiters?
4. How does LVMH encourage Chinese custom-
ers to purchase LVMH products in China rather
than abroad? Do you think these strategic initia-
tives will be successful? Why or why not? What
other ideas do you think LVMH should pursue to
encourage Chinese customers to purchase LVMH
products in China?
5. Given a backlash in China against conspicuous consumption (the spending of money on luxury
goods to publicly display wealth and status), what
recommendations would you give LVMH?
6. Other luxury brands such as Chanel, Burberry, and
Gucci are building a presence in the large luxury-
goods market in China. What actions might LVMH
take to sustain its strong position in the market?
Endnotes
1. Excluding Japan; LVMH does not break down sales for China
separately.
2 . LVMH’s famous brands include Louis Vuitton (fashion and leather
goods), Bulgari and Tag Heuer (watches and jewelry), Moët et Chandon
and Dom Pérignon (wines and spirits), and Dior (fashion, perfumes,
and cosmetics).
3 . “Louis Vuitton slows expansion to protect image,” The Globe and Mail, January 31, 2013.
European stores have hired Mandarin-speaking staff
who are trained to better meet Chinese needs and bet-
ter handle the spikes of tour-bus traffic. Meanwhile,
LVMH aims to strengthen its relationship with Chi-
nese customers at home by providing premium ser-
vices and enhancing their shopping experience. As
long as the price difference exists, however, stores
abroad will continue to be Chinese customers’ pre-
ferred shopping destinations.
Like all other luxury brands, LVMH has to con-
stantly fight against the counterfeiting of its prod-
ucts, especially the Louis Vuitton brand. China’s
dominance in manufacturing and its general lack of
enforcement of intellectual property laws have made
it the location for the manufacture of more than 80
percent of the estimated $300 billion counterfeit
industry. To keep some control over its products,
LVMH manufactures its leather goods in company-
owned factories in France, Switzerland, Germany,
Italy, Spain, and the United States. Since the early
2000s, LVMH’s Chinese anti-counterfeiting team,
together with its global specialists and investiga-
tors, has raised public awareness of counterfeits and
stemmed the flow of the counterfeits from China to
the developed world. It also brought legal actions
against pirates who made fake goods, as well as
landlords who provided operation locations for the
pirates. LVMH has achieved much anti-counter-
feiting success in China, including winning several
recent cases in Chinese courts. But as long as the
popularity of its Louis Vuitton bag lasts, the anti-
counterfeiting battle goes on, further contributing to
a potential loss of exclusivity.
DISCUSSION QUESTIONS
Review Chapter 4: Internal Analysis: Resources, Capabilities, and Core Competencies.
1. Why is LVMH so successful in China?
2. Louis Vuitton is LVMH’s flagship brand. Much of
Louis Vuitton’s appeal is that it bestows exclusivity
on its owners. In the last few years, however, the
Louis Vuitton logo has been applied to handbags
and accessories at an unprecedented rate. Discuss
Sources: This MiniCase is based on LVMH’s Annual Reports, 2002–Q1
2013; “Louis Vuitton’s Steven Liew: Protecting IP in China,” Asialaw, Octo-
ber 2005; “Made in China on the sly,” The New York Times, November 23,
2007; “LVMH: The empire of desire,” The Economist, June 2, 2012; “Event
watch: Louis Vuitton Shanghai Maison grand opening,” Jing Daily, July 10,
2012; “LVMH faces dilemma of success,” Financial Times, October 19, 2012;
“Luxury without borders: China’s new class of shoppers take on the world,”
McKinsey & Company, December 2012; “Louis Vuitton slows expansion to
protect image,” The Globe and Mail, January 31, 2013; “Has luxury peaked in
mainland China,” South China Morning Post, May 22, 2013; “LVMH rushes
to keep up with China’s changing tastes,” Jing Daily, May 27, 2013; “For
luxury brands targeting China, expansion to lower-tier cities beckons,” Jing Daily, June 5, 2013; “Luxury goods in China: Beyond bling,” The Economist, June 8, 2013; and “Wealthy Chinese love French luxury goods,” South China Morning Post, June 21, 2013.
WWW.YAZDANPRESS.COMWWW.YAZDANPRESS.COM

421
MiniCase 8
AN INVESTMENT OF $100 in General Electric (GE) on
April 22, 1981, when Jack Welch took over as chair-
man and CEO would have been worth $6,320 by 2000.
Including stock price appreciation plus dividends,
GE’s total shareholder return was 6,220 percent dur-
ing this period, equating to an annual compounded
growth rate of about 23 percent.
Although the sheer magnitude of GE’s total returns
to shareholders is impressive, to assess whether GE
had a competitive advantage that produced that return,
we need a benchmark. Because GE is a widely diver-
sified conglomerate spanning financial and industrial
operations across a number of different industries, one
common metric for comparison is a broad stock mar-
ket index such as the Dow Jones Industrial Average
(DJIA). The DJIA (or Dow 30) represents an average
stock return, based on the stock prices of the 30 most
widely held public companies in the U.S. The DJIA
was established in 1896, and GE is the only company
remaining from its original members (although GE
was delisted for a number of years).
Although the DJIA had a return of slightly over
1,000 percent between 1981 and the end of 2000,
this return is dwarfed when compared with GE’s (see
Exhibit MC8.1 ). This comparison implies that GE
outperformed the DJIA by several multiples during
this 20-year time period.
When we apply total return to shareholders as a
performance metric, GE’s total return of 6,220 percent
is astonishing. GE clearly enjoyed a sustained com-petitive advantage during the Jack Welch era. This
feat is even more impressive for two reasons. First, the
calculation was set in a way that both started at 0 per-
cent in 1981. Second, GE is one of the 30 companies
included in the DJIA, and thus it is one big reason why
the DJIA performed quite well during the 1981–2000
time frame.
Jeffrey Immelt was appointed GE’s CEO and chair-
man on September 7, 2001, just four days before the
9/11 terrorist attacks. Since that tragedy, Mr. Immelt
had spent his time putting out fire after fire. Follow-
ing 9/11, the U.S. economy went into a recession, and
a global economic slowdown began. Several of GE’s
key industrial sectors such as aviation and energy
were especially hard hit. The global financial crisis
beginning in 2008 compounded the company’s trou-
bles even further. Because the conglomerate relied on
its financial services unit, GE Capital, for more than
50 percent of its profits, the company was hit espe-
cially hard during the global financial crisis. In 2009,
Standard & Poor’s downgraded GE’s AAA credit rat-
ing, further underscoring the market’s lost confidence
in GE’s financial health. GE asked famed investor
Warren Buffett for a $15 billion liquidity injection.
On March 5, 2009, GE’s share price hit an all-time
low of $6.66. The performance of GE’s stock versus
the DJIA during Mr. Immelt’s tenure is depicted in
Exhibit MC8.2 .
DISCUSSION QUESTIONS
Review Chapter 5: Competitive Advantage, Firm Per-formance, and Business Models.
1. Do you agree with the claim that “GE experienced
a sustained competitive advantage under Jack
Welch, while it experienced a sustained competi-tive disadvantage under Jeffrey Immelt”? Why or
why not?
2. How much of the performance difference in the
Welch versus Immelt time periods do you believe
can be directly attributed to the respective CEO?
What other factors might have played an impor-
tant role in determining firm performance?
(Hint: Consider especially the time period since
2001.)
GE under Jack Welch vs. Jeffrey Immelt
Frank T. Rothaermel prepared this MiniCase from public sources. It is devel-
oped for the purpose of class discussion. It is not intended to be used for
any kind of endorsement, source of data, or depiction of efficient or inef-
ficient management. All opinions expressed, and all errors and omissions, are
entirely the author’s. © Rothaermel, 2014.
WWW.YAZDANPRESS.COMWWW.YAZDANPRESS.COM

422 MINICASE 8 GE under Jack Welch vs. Jeffrey Immelt
Apr 1981 Jan 1983 Jan 1986 Jan 1989 Jan 1992 Jan 1995 Jan 1998 Sep 2001
PRICE HISTORY - GE (4/1/1981 - 9/6/2001)
5,000%
4,500%
4,000%
3,500%
3,000%
2,500%
2,000%
1,500%
1,000%
500%
0%
2500%
General Electric Co Dow Jones Industrial Average Index
EXHIBIT MC8.1 / GE under Jack Welch: GE Stock Performance vs. DJIA, April 1981–September 2001
EXHIBIT MC8.2 / GE under Jeffrey Immelt: GE Stock Performance vs. DJIA, September 2001–September 2013
General Electric Company (GE)
2002 2004 2006 2008 2010 2012
Week of Sep 30, 2013: GE 24.05 ^DJI 15072.60
280%
260%
240%
220%
0%
20%
40%
60%
WWW.YAZDANPRESS.COMWWW.YAZDANPRESS.COM

MINICASE 8 GE under Jack Welch vs. Jeffrey Immelt 423
eras? If Jack Welch had been more focused on broader
measures of firm performance, might GE have been
better able to weather the post-2001 changes?
3. Shareholder value creation is one of the metrics to
assess firm performance. Do you consider this met-
ric to be the most important one? Why or why not?
4. If you were to use a balanced-scorecard or triple-bot-
tom-line approach to assessing firm performance and
competitive advantage, how might those approaches
change your assessment of the Welch and Immelt
Sources: This MiniCase is based on “GE’s Welch will be a tough act to
follow; Math shows stock unlikely to repeat its rise,” The New York Times, November 28, 2000; Glader, P. (2009), “GE’s Immelt to cite lessons learned,”
The Wall Street Journal, December 15; and various GE Annual Reports.
WWW.YAZDANPRESS.COMWWW.YAZDANPRESS.COM

424
MiniCase 9
RIVALS OFTEN USE different business models to com-
pete with one another. Due to competitive dynamics
and industry convergence, Google and Microsoft pro-
gressively move on to the other’s turf. In many areas,
Google and Microsoft are now direct competitors.
In 2012, Microsoft had $73 billion in revenues and
Google $50 billion. Although Google started out as an
online search and advertising company, it now offers
software applications (Google Docs, word processing,
spreadsheet programs, e-mail, interactive calendars,
and presentation software) and operating systems
(Chrome OS for the Web; Android for mobile appli-
cations), among many other online products and ser-
vices. In contrast, Microsoft began its life by offering
an operating system (since 1985, called Windows),
then moved into software applications with its Office
Suite, and into online search and advertising with
Bing, as well as online gaming with Xbox One. The
stage is set for a clash of the technology titans.
In competing with each other, Google and Micro-
soft pursue very different business models, as detailed
in Exhibit MC9.1 . 1 Google offers its applications
software Google Docs for free to induce and retain as
many users as possible for its search engine. Although
Google’s flagship search engine is free for the end
user, Google makes money from sponsored links by
advertisers. The advertisers pay for the placement of
their ad on the results pages and every time a user
clicks through an ad (which Google calls a “sponsored
link”). Many billions of mini-transactions like this
add up to a substantial business. As shown in Exhibit
MC9.2 , advertising revenues account for close to 90
percent of Google’s total revenues.
As indicated in Exhibit MC9.1 , Google uses part
of the profits earned from its lucrative online advertis-
ing business to subsidize Google Docs. Giving away
products and services to induce widespread use allows
Google to benefit from network effects —the increase
in the value of a product or service as more people use
it. Google can charge advertisers for highly targeted
and effective ads, allowing it to subsidize other prod-
uct offerings that compete directly with Microsoft.
As indicated by the opposing arrows in Exhibit
MC9.1 , Microsoft’s business model is almost the
reverse of Google’s. Initially, Microsoft focused
on creating a large installed base of users for its
PC operating system (Windows). It holds some 90
percent market share in operating system software
for personal computers worldwide. As shown in
Exhibit MC9.3 , roughly 50 percent of Microsoft’s rev-
enues are based on the Windows franchise. Moreover,
the users are locked into a Microsoft operating system
(which generally comes preloaded with the computer
they purchased), and then want to buy applications
that run seamlessly with the operating system. The
obvious choice for most users is Microsoft’s Office
Suite (containing Word, Excel, PowerPoint, Outlook,
and Access), but they need to pay several hundred
dollars for the latest version. This application soft-
ware segment (called “Microsoft Business Division,”
see Exhibit MC9.3 ) contributes roughly one-third of
Microsoft’s total revenues. This implies that over 80
percent of Microsoft’s revenues are either tied directly
or indirectly to its Windows franchise.
As shown in Exhibit MC9.1 , Microsoft uses the
profits from its application software business to sub-
sidize its search engine Bing, which is—just like
Google’s—a free product offering for the end user.
Given Bing’s relatively small market share, however,
and the tremendous cost in developing the search
Competing on Business Models:
Google vs. Microsoft
Frank T. Rothaermel prepared this MiniCase from public sources. It is devel-
oped for the purpose of class discussion. It is not intended to be used for
any kind of endorsement, source of data, or depiction of efficient or inef-
ficient management. All opinions expressed, and all errors and omissions, are
entirely the author’s. The author is grateful for research assistance by Vivek
Viswanathan (GT MBA and MSc.). © Rothaermel, 2014.
WWW.YAZDANPRESS.COMWWW.YAZDANPRESS.COM
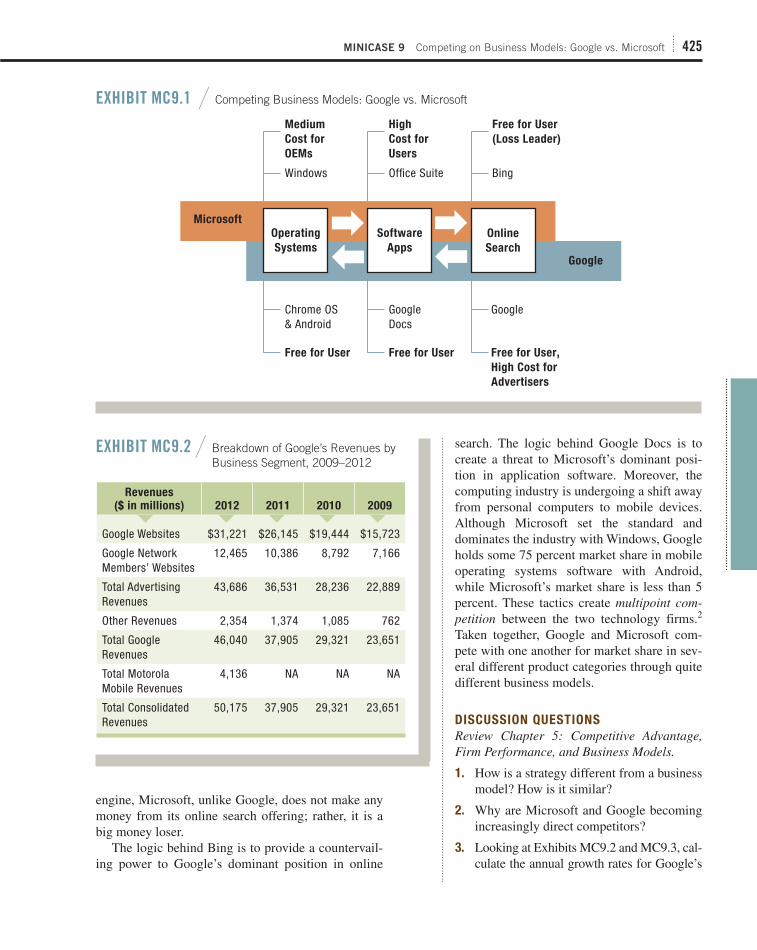
MINICASE 9 Competing on Business Models: Google vs. Microsoft 425
Microsoft
Medium
Cost for
OEMs
Windows
High
Cost for
Users
Office Suite
Free for User
(Loss Leader)
Bing
Free for User Free for User Free for User,
High Cost for
Advertisers
Chrome OS& Android
Google Docs
Operating
Systems
Software
Apps
Online
Search
EXHIBIT MC9.1 / Competing Business Models: Google vs. Microsoft
EXHIBIT MC9.2 / Breakdown of Google’s Revenues by Business Segment, 2009–2012
Revenues ($ in millions) 2012 2011 2010 2009
Google Websites $31,221 $26,145 $19,444 $15,723
Google Network Members’ Websites
12,465 10,386 8,792 7,166
Total Advertising Revenues
43,686 36,531 28,236 22,889
Other Revenues 2,354 1,374 1,085 762
Total Google Revenues
46,040 37,905 29,321 23,651
Total Motorola Mobile Revenues
4,136 NA NA NA
Total Consolidated Revenues
50,175 37,905 29,321 23,651
engine, Microsoft, unlike Google, does not make any
money from its online search offering; rather, it is a
big money loser.
The logic behind Bing is to provide a countervail-
ing power to Google’s dominant position in online
search. The logic behind Google Docs is to
create a threat to Microsoft’s dominant posi-
tion in application software. Moreover, the
computing industry is undergoing a shift away
from personal computers to mobile devices.
Although Microsoft set the standard and
dominates the industry with Windows, Google
holds some 75 percent market share in mobile
operating systems software with Android,
while Microsoft’s market share is less than 5
percent. These tactics create multipoint com-petition between the two technology firms. 2
Taken together, Google and Microsoft com-
pete with one another for market share in sev-
eral different product categories through quite
different business models.
DISCUSSION QUESTIONS
Review Chapter 5: Competitive Advantage, Firm Performance, and Business Models.
1. How is a strategy different from a business
model? How is it similar?
2. Why are Microsoft and Google becoming
increasingly direct competitors?
3. Looking at Exhibits MC9.2 and MC9.3 , cal-
culate the annual growth rates for Google’s
WWW.YAZDANPRESS.COMWWW.YAZDANPRESS.COM

426 MINICASE 9 Competing on Business Models: Google vs. Microsoft
Works, and Shapes Our Lives (New York: Simon & Schuster); Adner,
R. (2012), The Wide Lens. A New Strategy for Innovation (New York:
Portfolio); and “The quest for a third mobile platform,” The Wall Street Journal, May 6, 2013.
2. Chen, M. J. (1996), “Competitor analysis and interfirm rivalry:
Toward a theoretical integration,” Academy of Management Review
21: 100–134; Gimeno, J. (1999), “Reciprocal threats in multimar-
ket rivalry: Staking out ‘spheres of influence’ in the U.S. airline
industry,” Strategic Management Journal 20: 101–128; and Gimeno,
J., and C. Y. Woo (1999), “Multimarket competition, economies of
scale, and firm performance,” Academy of Management Journal 42:
239–259.
and Microsoft’s different business segments. What
trend emerges? What conclusions can you draw?
4. What recommendations would you give to the
CEO of Microsoft to compete more effectively
against Google?
5. What recommendations would you give to the
CEO of Google to compete more effectively
against Google?
Endnotes
1. Anderson, C. (2009), Free: The Future of a Radical Price (New
York: Hyperion); Levy, S. (2011), In the Plex: How Google Thinks,
EXHIBIT MC9.3 / Breakdown of Microsoft’s Revenues by Business Segment, 2009–2012
Revenues ($ in millions) 2012 2011 2010 2009
Windows and Windows Live Division $18,373 $19,033 $19,491 $14,712
Server and Tools (Windows) 18,686 16,680 15,109 14,126
Online Services Division 2,867 2,607 2,294 3,088
Microsoft Business Division 23,991 22,514 19,256 18,894
Entertainment and Devices Division 9,593 8,915 6,079 7,753
Unallocated and Other 213 194 255 145
Total Consolidated Revenues 73,723 69,943 62,484 58,718
WWW.YAZDANPRESS.COMWWW.YAZDANPRESS.COM
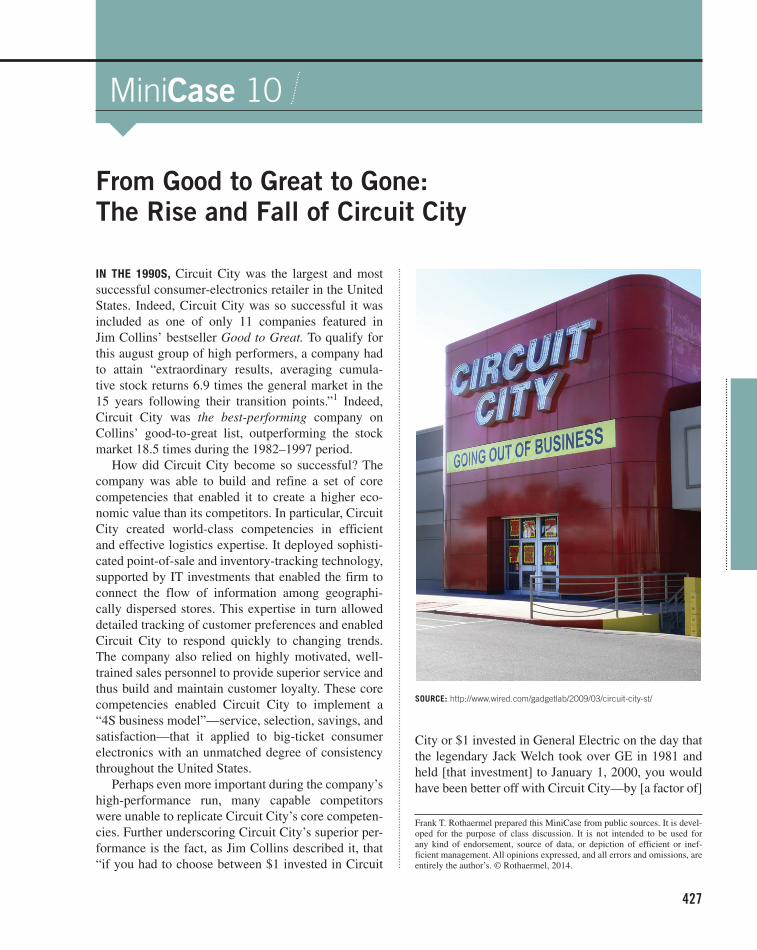
427
Mini Case 10
IN THE 1990S, Circuit City was the largest and most
successful consumer-electronics retailer in the United
States. Indeed, Circuit City was so successful it was
included as one of only 11 companies featured in
Jim Collins’ bestseller Good to Great. To qualify for
this august group of high performers, a company had
to attain “extraordinary results, averaging cumula-
tive stock returns 6.9 times the general market in the
15 years following their transition points.” 1 Indeed,
Circuit City was the best-performing company on
Collins’ good-to-great list, outperforming the stock
market 18.5 times during the 1982–1997 period.
How did Circuit City become so successful? The
company was able to build and refine a set of core
competencies that enabled it to create a higher eco-
nomic value than its competitors. In particular, Circuit
City created world-class competencies in efficient
and effective logistics expertise. It deployed sophisti-
cated point-of-sale and inventory-tracking technology,
supported by IT investments that enabled the firm to
connect the flow of information among geographi-
cally dispersed stores. This expertise in turn allowed
detailed tracking of customer preferences and enabled
Circuit City to respond quickly to changing trends.
The company also relied on highly motivated, well-
trained sales personnel to provide superior service and
thus build and maintain customer loyalty. These core
competencies enabled Circuit City to implement a
“4S business model”—service, selection, savings, and
satisfaction—that it applied to big-ticket consumer
electronics with an unmatched degree of consistency
throughout the United States.
Perhaps even more important during the company’s
high-performance run, many capable competitors
were unable to replicate Circuit City’s core competen-
cies. Further underscoring Circuit City’s superior per-
formance is the fact, as Jim Collins described it, that
“if you had to choose between $1 invested in Circuit
City or $1 invested in General Electric on the day that
the legendary Jack Welch took over GE in 1981 and
held [that investment] to January 1, 2000, you would
have been better off with Circuit City—by [a factor of]
From Good to Great to Gone:
The Rise and Fall of Circuit City
Frank T. Rothaermel prepared this MiniCase from public sources. It is devel-
oped for the purpose of class discussion. It is not intended to be used for
any kind of endorsement, source of data, or depiction of efficient or inef-
ficient management. All opinions expressed, and all errors and omissions, are
entirely the author’s. © Rothaermel, 2014.
SOURCE: http://www.wired.com/gadgetlab/2009/03/circuit-city-st/
WWW.YAZDANPRESS.COMWWW.YAZDANPRESS.COM

428 MINICASE 10 From Good to Great to Gone: The Rise and Fall of Circuit City
Employees at Circuit City stores and even at the
headquarters in Richmond, Virginia, were shocked
and devastated when the firm actually ceased opera-
tions in March 2009. More than a year after the clos-
ing, former headquarters workers noted that the firm
had a good, hard-working, and family-friendly atmo-
sphere. They believed to the end that, in the worst
case, another firm would buy Circuit City and per-
haps reduce its size but not permanently close the
business. 3
DISCUSSION QUESTIONS
Review Chapter 6: Business Strategy: Differentiation, Cost Leadership, and Integration.
1. Why was Circuit City so successful as to be fea-
tured in Good to Great? What was its strategic
position during its successful period? How did it
contribute to competitive advantage?
2. Why did Circuit City lose its competitive advan-
tage? What was Circuit City’s strategic position
during the time of its competitive disadvantage?
3. What could Circuit City’s management have done
differently?
4. What is the future of Best Buy as the leader in big-
box electronics retailing as it faces tough competi-
tion with Amazon and other online retailers? What
core competencies in big-box retailing are critical
not only to survive but also to gain and sustain a
competitive advantage?
Endnotes
1 . Collins, J. (2001), Good to Great: Why Some Companies Make the Leap . . . and Others Don’t (New York: HarperCollins), p. 3.
2 . Ibid., p. 33.
3 . Collins, J. (2001), Good to Great; and Collins, J. (2009), How the Mighty Fall: And Why Some Companies Never Give In (New York:
HarperCollins); and A Tale of Two Cities: The Circuit City Story, film
documentary by Tom Wulf, released November 2010.
six times.” 2 In the fall of 2008, however, Circuit City
filed for bankruptcy. So what happened?
Circuit City’s core competencies lost value
because the firm neglected to upgrade and protect
them. As a consequence, it was outflanked by Best
Buy and online retailers such as Amazon. Moreover,
Circuit City’s top management team was also dis-
tracted by pursuing noncore activities such as the cre-
ation of CarMax, a retail chain for used cars, a foray
into providing an alternative to video rentals through
its proprietary DivX DVD player, and an attempted
merger with Blockbuster (which filed for bankruptcy
in 2010).
Perhaps the biggest blunder that Circuit City’s top-
management team committed was to lay off 3,000 of
the firm’s highest-paid sales personnel. The layoff was
done to become more cost-competitive with Best Buy
and, in particular, the burgeoning online retailers. The
problem was that the highest-paid salespeople were
also the most experienced and loyal ones, better able
to provide superior customer service. It appears that
laying off key human capital—given their valuable,
rare, and difficult-to-imitate nature—was a supreme
strategic mistake! Not only did Circuit City destroy
part of its core competency, it also allowed its main
competitor—Best Buy—to recruit Circuit City’s top
salespeople. With that transfer of personnel to Best
Buy went the transfer of important tacit knowledge
underlying some of Circuit City’s core competencies,
which in turn not only eroded Circuit City’s advantage
but also allowed Best Buy to upgrade its core com-
petencies. In particular, Best Buy went on to develop
its innovative “customer-centricity” model, based
on a set of skills that allowed its store employees to
identify and more effectively serve specific customer
segments. Highlighting the dynamic nature of the
competitive process, however, Best Buy now faces its
own challenges competing with online retailers such
as Amazon.
WWW.YAZDANPRESS.COMWWW.YAZDANPRESS.COM

429
Mini Case 11
ALMOST EVERYONE IN CHINA knows Li Ning Com-
pany Ltd. The eponymous sportswear company was
founded in 1990 by former star gymnast Li Ning,
who won six medals (including three golds) at the
1984 Los Angeles Olympics. Riding on the fame of
its founder, Li Ning quickly became the largest and
best-known Chinese sportswear company. In parallel
with China’s incredible economic rise, Li Ning did
exceptionally well.
The company decided that the 2008 Olympics in
Beijing would mark the beginning of overtaking the
world leaders in sports shoes and apparel, Nike and
adidas. This would happen first in the Chinese market
and then globally. To symbolize the company rise, its
founder Li Ning, still a popular folk hero, was chosen
to light the Olympic flame during the Beijing open-
ing ceremonies. With its home turf advantage, every-
thing seemed to be going in Li Ning’s favor. In March
2013, however, Li Ning shocked the business world
by announcing a worse-than-expected annual loss of
$315 million. This was Li Ning’s first ever loss since
going public in 2004. Just two years earlier in 2010, Li
Ning reported an all-time-high revenue of $1.5 billion,
with $182.3 million in net income. What happened?
Li Ning’s strategic intent had been from the very
beginning to overtake Nike and adidas. The Beijing
Olympics were to be the turning point in this “epic
battle” for market dominance. In anticipation of the
enormous business opportunities that would come
with the 2008 Beijing Olympics, Li Ning pushed its
penetration into China’s second- and third-tier cit-
ies via aggressive channel expansion through its dis-
tributors, adding almost 1,000 stores a year ( Exhibit
MC11.1 ). In 2008 and 2009 alone, more than 80 per-
cent of the new stores were opened in China’s second-
and third-tier cities.
China’s rapid urbanization and the post-Olympics
effects echoed Li Ning’s vision: from 2005 to 2010, Li
Ning tripled its revenue and seemed to be overtaking
adidas to become number two in the Chinese market,
just behind Nike ( Exhibit MC11.2 ). Fueled by seem-
ingly unstoppable success, Li Ning began to expand
in Southeast Asia. In a brazen move, Li Ning even
opened a specialty store across the Pacific in Portland,
Oregon, the hometown of Nike.
Li Ning soon found that its local Chinese competi-
tors were pursuing a similar expansion strategy. To
make matters worse, even Nike and adidas joined the
fray to compete aggressively in second- and third-tier
cities. This was a departure from the usual business
model where the two world leaders would focus on
high-end markets such as Shanghai and Beijing. As
the post-Olympic shopping enthusiasm gradually
faded, competition further intensified. Realizing that
the expansion-fueled growth was not sustainable, Li
Ning began fine-tuning its business model: consoli-
dating distributors, upgrading product offerings, and
focusing on serving higher-end markets and younger
consumers. Li Ning even changed its logo and slo-
gan to promote the new image. Almost overnight, Li
Ning’s brand marketing campaign swept China’s air-
waves, towns, and cities.
Despite its best marketing efforts, Li Ning’s inven-
tory kept piling up. Against the backdrop of declin-
ing sales, Li Ning’s cash flow soon drained. Given its
financial squeeze, Li Ning had to raise funds from a
private equity group and the Government of Singapore
Investment Corporation. This led to a shake-up of Li
Ning’s board of directors, which subsequently put a
new top management team in place. The top priority
of the new management was to tackle Li Ning’s inven-
tory problems. Its management took several drastic
steps to revive the sales channel by freeing up distrib-
utors’ cash flows for introducing new products. Dis-
tributors were further consolidated and Li Ning added
China’s Li Ning Challenges Nike and adidas
Frank T. Rothaermel and Carrie Yang (GT MBA, MSc.) prepared this Mini-
Case from public sources. It is developed for the purpose of class discussion.
It is not intended to be used for any kind of endorsement, source of data, or
depiction of efficient or inefficient management. All opinions expressed, and
all errors and omissions, are entirely the authors’. © Rothaermel and Yang,
2014.
WWW.YAZDANPRESS.COMWWW.YAZDANPRESS.COM
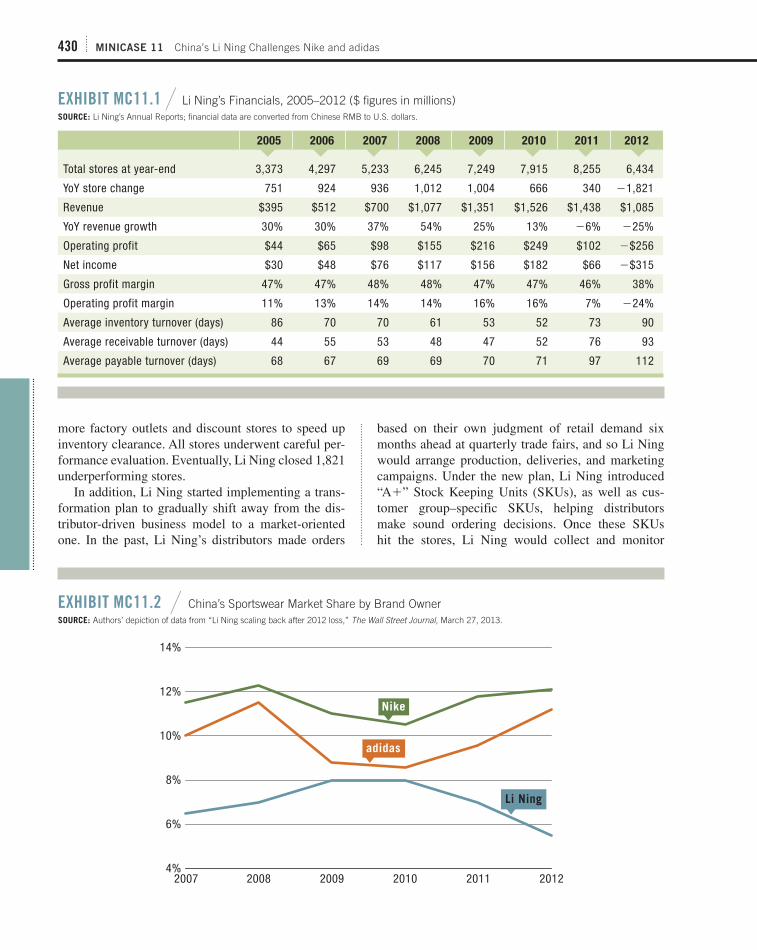
430 MINICASE 11 China’s Li Ning Challenges Nike and adidas
more factory outlets and discount stores to speed up
inventory clearance. All stores underwent careful per-
formance evaluation. Eventually, Li Ning closed 1,821
underperforming stores.
In addition, Li Ning started implementing a trans-
formation plan to gradually shift away from the dis-
tributor-driven business model to a market-oriented
one. In the past, Li Ning’s distributors made orders
based on their own judgment of retail demand six
months ahead at quarterly trade fairs, and so Li Ning
would arrange production, deliveries, and marketing
campaigns. Under the new plan, Li Ning introduced
“A 1 ” Stock Keeping Units (SKUs), as well as cus-
tomer group–specific SKUs, helping distributors
make sound ordering decisions. Once these SKUs
hit the stores, Li Ning would collect and monitor
EXHIBIT MC11.1 / Li Ning’s Financials, 2005–2012 ($ figures in millions)SOURCE: Li Ning’s Annual Reports; financial data are converted from Chinese RMB to U.S. dollars.
2005 2006 2007 2008 2009 2010 2011 2012
Total stores at year-end 3,373 4,297 5,233 6,245 7,249 7,915 8,255 6,434
YoY store change 751 924 936 1,012 1,004 666 340 21,821
Revenue $395 $512 $700 $1,077 $1,351 $1,526 $1,438 $1,085
YoY revenue growth 30% 30% 37% 54% 25% 13% 26% 225%
Operating profit $44 $65 $98 $155 $216 $249 $102 2$256
Net income $30 $48 $76 $117 $156 $182 $66 2$315
Gross profit margin 47% 47% 48% 48% 47% 47% 46% 38%
Operating profit margin 11% 13% 14% 14% 16% 16% 7% 224%
Average inventory turnover (days) 86 70 70 61 53 52 73 90
Average receivable turnover (days) 44 55 53 48 47 52 76 93
Average payable turnover (days) 68 67 69 69 70 71 97 112
EXHIBIT MC11.2 / China’s Sportswear Market Share by Brand OwnerSOURCE: Authors’ depiction of data from “Li Ning scaling back after 2012 loss,” The Wall Street Journal, March 27, 2013.
4%
6%
8%
10%
12%
14%
2007 2008 2009 2010 2011 2012
Nike
adidas
Li Ning
WWW.YAZDANPRESS.COMWWW.YAZDANPRESS.COM

MINICASE 11 China’s Li Ning Challenges Nike and adidas 431
real-time sales data and make inventory adjustments
accordingly. Li Ning launched fast-response products
that could easily be ordered in between trade fairs in
response to changes in market trends. It also rede-
signed product lines and changed pricing based on
the needs of its target customers, which had not been
clearly defined before.
The new management team at Li Ning believed that
there was a big market between the higher-end Nike
and adidas, on the one hand, and most of the low-end
local brands, on the other. New products with a wider
price range would be launched to capture the consumer
in the “middle.” Li Ning’s transformation is nonethe-
less costly: revenue in 2012 declined by a whopping
25 percent to $1 billion (versus $26 billion for Nike
and $20 billion for adidas). Li Ning’s market share
ranking in China has dropped to number four from
number three (now held by a local competitor, Anta).
To avoid bankruptcy, Li Ning had to ask for another
round of liquidity injection by its recent backers.
Li Ning’s problem of overexpansion is not unique.
Slowing sales and high inventories have burdened
other sportswear brands in China, including Nike and
adidas. The two global brands have gained back their
market shares, presumably at Li Ning’s expense. Nike
and adidas were faster in responding to changes in the
market environment. They also further differentiated
themselves from the pack through continued innova-
tion and sophisticated marketing. For example, adidas
introduced fashionable sportswear such as high-heeled
sports shoes in China.
The only sportswear brand in China to post posi-
tive growth in 2012 was adidas, and it seems best
positioned to gain from the country’s $24 billion
sportswear business, which is estimated to grow at 15
to 20 percent for the next three years. In contrast, Li
Ning is in deep downsizing mode: stores, distributors,
and business segments are all up to be cut in 2013. Its
proud Portland venture and other overseas stores are
long gone, and the company is now refocusing on the
Chinese market only.
DISCUSSION QUESTIONS
Review Chapter 6: Business Strategy: Differentiation, Cost Leadership, and Integration.
1. At the close of the case, why was Li Ning experi-
encing a competitive disadvantage?
2. What are the strategic positions of Nike, adidas,
and Li Ning (see Chapter 6)? Do you see a link
between strategic position and firm performance?
If so, what explains that link?
3. Why is it so difficult for Li Ning to challenge Nike
and adidas even in China? Would you expect that
the Chinese consumer would be more loyal to a
Chinese brand? What moves could the company
make that would build customer loyalty? What
recommendations would you give Li Ning to
achieve a successful turnaround? Explain.
Sources: This MiniCase is based on Li Ning’s Annual Reports, 2004–2012;
“Nike, adidas readjust marketing strategy,” China Daily, August 30, 2010;
“A year of rebuilding for China’s Li Ning,” The Wall Street Journal, Decem-
ber 2, 2012; “China’s sportswear brands nurse Olympics hangover,” China Daily, July 2, 2012; “Nike notes: Weak China results part of broader strat-
egy,” Portland Business Journal, December 20, 2012; “Li Ning stumbles over
costly makeover plan,” South China Morning Post, January 26, 2013; “Nike
soars but China is its Achilles heel,” Financial Times, March 21, 2013; “Li
Ning scaling back after 2012 loss,” The Wall Street Journal, March 27, 2013;
“adidas sportswear is hot on Nike’s heels in China,” The Wall Street Journal, March 7, 2013.
WWW.YAZDANPRESS.COMWWW.YAZDANPRESS.COM

432
Mini Case 12
IN THE ENVISIONED TRANSITION away from gasoline-
powered cars, Nissan’s CEO Carlos Ghosn firmly
believes the next technological paradigm will be
electric motors. Mr. Ghosn calls hybrids a “halfway
technology” and suggests they will be a temporary
phenomenon at best. A number of startup companies,
including Tesla Motors in the United States and BYD
in China, share Ghosn’s belief in this future scenario.
One of the biggest remaining impediments to large-
scale adoption of electric vehicles, however, is the lack
of appropriate infrastructure: There are few stations
on the roads where drivers can recharge their car’s
battery when necessary. With the mileage range of
electric vehicles currently limited to some 200 miles,
many consider a lack of recharging stations a serious
problem (so called “range anxiety”). Tesla Motors and
others, however, are working hard to develop a net-
work of superfast charging stations.
Nissan’s Mr. Ghosn believes electric cars will
account for 10 percent of global auto sales over the
next decade. In contrast, Toyota is convinced gasoline-
electric hybrids will become the next dominant tech-
nology. These different predictions have significant
influence on what technology they decide to back and
how much money Nissan and Toyota invest in that
technology. Nissan’s fully electric vehicle, the Leaf
(an acronym for Leading, Environmentally friendly, Affordable, Family car ), built at a plant in Smyrna,
Tennessee, was introduced in 2010 in Japan and in
2011 in Europe, the U.S., and Canada. As of 2013,
the Nissan Leaf is the best-selling all-electric car, with
global sales of some 100,000 units.
Toyota is expanding its R&D investments in hybrid
technology. Toyota has already sold some 4 million of
its popular Prius cars since they were first introduced
in 1997. By 2020, Toyota plans to offer hybrid tech-
nology in all its vehicles. Eventually, the investments
made by Nissan and Toyota will yield different returns,
depending on which predictions prove more accurate.
An alternative outcome is that neither hybrids nor
electric cars will become the next paradigm. To add
even more uncertainty to the mix, Honda and BMW
are betting on cars powered by hydrogen fuel cells.
In sum, many alternative technologies are compet-
ing to become the winner in setting a new standard
for propelling cars. This situation is depicted in
Exhibit MC12.1 , where the new technologies rep-
resent a swarm of new entries vying for dominance.
Only time will tell which technology will win this
standard battle.
DISCUSSION QUESTIONS
Review Chapter 7: Business Strategy: Innovation and Entrepreneurship.
1. Do you believe that the internal combustion engine
will lose its dominant position in the future? Why
or why not? What time horizon are you looking at?
2. Which factors do you think will be most critical in
setting the next industry standard for technology
in car propulsion? Do you believe it is possible
that the new technologies can coexist, or do you
think there will be only one industry standard?
3. Which companies do you think are currently best
positioned to influence the next industry standard
in car-propulsion technology?
4. What would you recommend different competitors
(e.g., GM, Toyota, Nissan, and Tesla Motors) do to
influence the emerging industry standard?
Which Automotive Technology Will Win?
Frank T. Rothaermel prepared this MiniCase from public sources. It is devel-
oped for the purpose of class discussion. It is not intended to be used for
any kind of endorsement, source of data, or depiction of efficient or inef-
ficient management. All opinions expressed, and all errors and omissions, are
entirely the author’s. © Rothaermel, 2014.
WWW.YAZDANPRESS.COMWWW.YAZDANPRESS.COM

MINICASE 12 Which Automotive Technology Will Win? 433
OldTechnology
Gasoline-PoweredCombustion Engine
Ra
te o
f T
ec
hn
olo
gic
al
Pro
gre
ss Next Dominant
Technology
• Electric• Hybrid• Hydrogen• Solar• Others …
Swarm ofNew Entries:
Time
EXHIBIT MC12.1 / Several Technologies Competing for Dominance
Sources: This MiniCase is based on “Bright sparks,” The Economist, Janu-
ary 15, 2009; “The electric-fuel-trade acid test,” The Economist, September
3, 2009; “At Tokyo auto show, hybrids and electrics dominate,” The New York Times, October 21, 2009; “Risky business at Nissan,” BusinessWeek,
November 2, 2009; “Propulsion systems: The great powertrain race,” The Economist, April 20, 2013; and “Tesla recharges the battery-car market,”
The Economist, May 10, 2013.
WWW.YAZDANPRESS.COMWWW.YAZDANPRESS.COM

434
Mini Case 13
Is Porsche Killing the Golden Goose?
Frank T. Rothaermel and Carrie Yang (GT MBA, MSc.) prepared this Mini-
Case from public sources. It is developed for the purpose of class discussion.
It is not intended to be used for any kind of endorsement, source of data,
or depiction of efficient or inefficient management. All opinions expressed,
and all errors and omissions, are entirely the authors’. © Rothaermel and
Yang, 2014.
One day a farmer going to the nest of his goose found there an egg all yellow and glittering. He took it and found that the egg was pure gold. The farmer could hardly believe his luck! Every morning the same thing occurred, and the farmer grew richer, day by day. Thinking he could get all the gold at once, he killed the goose. After he opened it, he found nothing.
Aesop’s Fable
WHEN PORSCHE REVEALED its 911 sports car design in
1962, 1 it caused a worldwide sensation. Ever since,
Porsche has been one of the world’s finest performance
car manufacturers. The Porsche 911 is a legendary
sports car icon. Although focusing on a niche market
with a small output every year, Porsche was extremely
profitable. Even today, it still enjoys the largest profit
margins among all major auto manufacturers, thanks to
the hefty premium it can command for its cars.
More than 50 years after its birth, the 911 remains
the heart and soul of Porsche. However, it is no longer
the company’s best-selling model. The number-one
spot has been taken by the Cayenne, a five-seat sports
utility vehicle (SUV) launched by Porsche in 2002.
Porsche views the Cayenne as a way to reduce the
company’s dependence on the traditional sports mod-
els and to provide for future growth in sales and prof-
its. The Cayenne may be the most successful model
launch of Porsche since the 911: Porsche sold the
200,000 th Cayenne unit only six years after its debut at
the Paris Motor Show. In 2012, the Cayenne’s world-
wide sales reached a record 77,822 units, accounting
for more than half of the company’s overall sales vol-
ume (see Exhibit MC13.1 ). The popularity of Cay-
enne is seen across regions, especially in the U.S. and
China, the two largest markets of Porsche overall (see
Exhibit MC13.2 ). In fact, China has become the larg-
est market for Cayenne, and the model will continue to
be the strategic sales focus of Porsche in that country.
The Cayenne has made Porsche more appealing to
people who are not sports-car drivers but are happy to
own the sportiest SUV on the market. While the model
expansion may upset the purists, Porsche did not stop
there. In 2005, Porsche announced its plan to build a
new model line Panamera, a premium-category four-
seat sports sedan, to extend its customer base. The line
was launched on time in 2009 and like Cayenne, it
outsold the 911 in the subsequent years. As of 2012,
Cayenne and Panamera together accounted for 73 per-
cent of Porsche’s total sales volumes.
In the years leading up to the global financial cri-
sis in 2008–2009, Porsche was attempting a hostile
takeover of the much larger Volkswagen (VW). Part
of the competition was motivated by a bitter family
feud resulting from estranged members of the Porsche
family holding leading executive positions in both
companies. As the global financial crisis took hold,
Porsche collapsed under a heavy debt burden caused
by the hostile VW takeover attempt. VW turned the
tables and took over Porsche in 2012. Now Porsche is
clearly gunning for economies of scale as it ramps up
unit sales, and VW overall is aiming to overtake GM
and Toyota as the word leader in unit sales.
Porsche developed its own growth blueprint, termed
“Strategy 2018,” as part of Volkswagen group’s grand
vision: Porsche plans to increase unit sales to 200,000
per year by 2018, up from 30,000 units in 2002. To
achieve this goal, Porsche needs to inspire more buy-
ers. It continues to push overseas sales of the Cayenne
and the Panamera models, setting up more dealerships
where growth is the strongest. To address potential
customers’ concern over the 911’s drivability as an
everyday vehicle, Porsche launched an advertising
WWW.YAZDANPRESS.COMWWW.YAZDANPRESS.COM

MINICASE 13 Is Porsche Killing the Golden Goose? 435
0
20,000
40,000
60,000
80,000
2002 2003 2004 2005 2006 2007 2008 2009 2010 2011 2012
911 ($84,300]$181,100)
Cayenne ($49,600]$146,000)
Panamera ($78,100]$161,100)
EXHIBIT MC13.1 / Porsche Annual Sales by Model (units)SOURCE: Porsche Annual Reports, 2009–2012; pricing is manufacturer’s suggested retail price (MSRP) for U.S. 2014 models.
EXHIBIT MC13.2 / Porsche Sales and Deliveries by Region, 2012SOURCE: Porsche 2012 Annual Report.
U.S. China Germany Rest of Europe Rest of World
Total Sales (% of World Total):
36,170
(25.3%)
33,590
(23.5%)
16,090
(11.2%)
31,094
(21.7%)
26,152
(18.3%)
Deliveries by Model (% of Country Total):
911 8,528
(24.3%)
949
(3.0%)
5,238
(30.0%)
6.654
(20.7%)
4,088
(16.2%)
Cayenne 15,545
(44.4%)
19,959
(64.0%)
7,758
(44.4%)
16,966
(52.8%)
14,535
(57.7%)
Panamera 7,614
(21.7%)
9,148
(29.3%)
2,682
(15.3%)
5,262
(16.4%)
4,324
(17.2%)
campaign titled “Engineered for Magic. Everyday,”
in the U.S., featuring actual Porsche owners using
their sports cars for daily activities, from commuting
to work, to picking up their kids and running errands.
In 2012, Porsche revealed the name of its fifth model
line, Macan—a compact SUV to be launched in 2014.
The company is also considering the development of a
smaller version of the Panamera.
The essence of a Porsche—a high-performance
sports car—seems now to take a back seat. Although
WWW.YAZDANPRESS.COMWWW.YAZDANPRESS.COM

436 MINICASE 13 Is Porsche Killing the Golden Goose?
3. In the recent past, both GM and Toyota ran into
problems as they chased the goal of becoming the
world’s leader in terms of unit sales. GM achieved
this goal but lost billions in the process and ended
up in bankruptcy (in 2008). Toyota then pushed
output and briefly held the number-one spot in
terms of unit sales, but found that the emphasis
on increasing output meant that quality issues
arose—which then negatively affected its reputa-
tion. If you were asked to advise VW, what pitfalls
would you point to that may need to be considered
when attempting to be the world leader in unit out-
put? How might VW avoid those pitfalls?
4. Porsche is expanding rapidly through both related
and geographic diversification. Do you consider
this business strategy to be successful? Why, or why
not? If you consider Porsche’s diversification to be
successful, what is the source of Porsche’s success?
5. The Mini Case began with Aesop’s fable of “The
Goose That Laid the Golden Eggs.” What is the
take-away of this fable? Is Porsche killing its
golden goose?
Endnote
1. Originally, the car’s name was the Porsche 901, but Porsche had to
change this designation because Peugeot claimed trademark infringe-
ment using the numbers “901.” Porsche settled on 911—and has used
that number ever since. See “1964 Porsche 901 prototype classic drive,”
Motor Trend, December 25, 2012.
the company has built “experience centers” in China
and the U.S. to cultivate sports-car enthusiasts,
Porsche only sold 26,203 units of the 911 in 2012, or
18 percent of Porsche’s total sales volumes. Porsche’s
expansion success so far largely relies on its reputation
as an iconic sports-car maker. At the same time, many
of today’s Cayenne buyers, such as soccer parents in
the U.S. or Chinese businesspeople that like a chauf-
feur, have no idea about Porsche’s true identity as a
high-performance sports and race car manufacturer.
DISCUSSION QUESTIONS
Review Chapter 8: Corporate Strategy: Vertical Inte-gration and Diversification.
1. For many decades, Porsche pursued a focused dif-
ferentiation strategy (see Exhibit 6.2 in Chapter
6). Using a clear strategic profile as a focused dif-
ferentiator, Porsche was very successful and very
profitable. More recently, the Porsche brand is
repositioning itself from focused differentiation to
broad differentiation by changing its competitive
scope. What are the risks inherent in such strategic
positioning? What are the benefits? Do you think
Porsche will be successful in carving out a new
strategic position as a broad differentiator? Why or
why not?
2. Volkswagen ranks with GM and Toyota as one
of the top-three carmakers in the world today in
terms of sales volume (in units). It uses its Volk-
swagen brand, as well as its entire portfolio of
other brands, including the luxury marques of
Porsche, Audi, Bentley, Bugatti, and Lamborghini,
and at the lower end, the Seat, Skoda, and Scania.
What type of diversification is Volkswagen pursu-
ing? What are the advantages and disadvantages in
VW’s corporate strategy?
Sources: This MiniCase is based on Porsche Annual Reports, 2003–2012;
“Porsche to develop and produce sports utility vehicle,” Porsche Press Release, June 4, 1998; “Porsche will build fourth model line: Porsche Pana-
mera,” Porsche Press Release, July 27, 2005; “The Porsche story: A fierce
family feud,” Der Spiegel, July 21, 2009; “Porsche puts dollars behind sports
cars again after pushing SUV, Sedan,” Advertising Age, April 18, 2011;
“Name for new Porsche SUV is Macan,” Porsche Press Release, February
16, 2012; and “Is Porsche still a sports car maker?” The Wall Street Journal, May 29, 2013.
WWW.YAZDANPRESS.COMWWW.YAZDANPRESS.COM

437
Mini Case 14
IN 2012, SAMSUNG, with $248 billion in revenues, was
one of the largest conglomerates globally and the
largest chaebol 1 in South Korea. A rough compari-
son would be the U.S. conglomerate General Elec-
tric, which had $147 billion in revenues in the same
year. Established in 1938 by Lee Byung-chul as a
trading company selling noodles and dried seafood,
Samsung has since diversified into various industries,
such as electronics, chemicals, shipbuilding, financial
services, and construction. In particular, Samsung is
widely diversified with 83 standalone subsidiaries.
The conglomerate accounts for a fifth of all South
Korean exports. In 1987, Lee Kun-hee, the youngest
son of the founder, took over as chairman of the con-
glomerate after the death of Lee Byung-chul. By that
time, Samsung had become an industry leader in many
of its markets.
Samsung Electronics, the flagship subsidiary of
Samsung (and best known in the U.S. for its Galaxy
line of smartphones and tablets), was initially set up
in 1969 to produce home appliances. In 1988, Lee
Kun-hee merged Samsung Electronics with Samsung
Semiconductors to integrate manufacturing. By 1992,
it had become the worldwide market leader in DRAM
(dynamic random access memory). Samsung Elec-
tronics, however, aspired to be more than a leading
supplier and OEM (original equipment manufacturer).
Its strategic intent was to be the leader in branded con-
sumer electronics.
Samsung’s image, however, was overshadowed by
Sony and Motorola, the undisputed world leaders in
consumer electronics and mobile phones during this
time. In 1988, Samsung Electronics launched its first
mobile phone in the South Korean market. It flopped
because of the phone’s poor quality. In the early 1990s,
Samsung Electronics’ market share in mobile phones
in South Korea was a mere 10 percent compared to
Motorola’s 60 percent.
The pivotal moment in redefining Samsung Elec-
tronics’ strategic focus came in early 1995. Samsung’s
chairman, Mr. Lee, sent out mobile phones as New
Year’s gifts to hundreds of key business partners. A
public embarrassment occurred when Mr. Lee later
learned that the phones he had send out as personal
gifts didn’t work properly. Mr. Lee ordered drastic
changes. In front of Samsung’s Gami factory with
2,000 employees watching, Mr. Lee set fire to a pile
of 150,000 mobile phones to show his disappointment
and determination alike. Many Samsung employ-
ees credit this day as the beginning of a successful
turnaround.
Samsung Electronics increased spending signifi-
cantly on R&D as well as on marketing and design.
Meanwhile, Mr. Lee was undertaking a complete
overhaul of the conglomerate’s structure in order to
change Samsung’s culture. To a culture that deeply
values seniority, Mr. Lee introduced merit-based pay
and promotion. Mr. Lee (who holds an MBA degree
from George Washington University) hired Western
managers and designers into leading positions and
sent home-grown talent to learn the best business
practices of other firms around the globe. Mr. Lee also
set up the Global Strategic Group to assist non-Korean
MBAs and PhDs with a smooth transition into their
positions in a largely homogenous cadre of employees.
Mr. Lee appointed a new CEO for Samsung Elec-
tronics in 1996, Yun Jong-Yong. Mr. Yun aggressively
trimmed costs and sold off unproductive assets during
the Asian Financial Crisis in 1997, making the com-
pany leaner and more agile. Subsequently, through
improved operational efficiency and an integrated
manufacturing process, Samsung Electronics short-
ened the time needed to respond quickly to changes in
market trends. It chose to be a fast follower, investing
only after a new product category had proven market
The Rise of Samsung Electronics
Frank T. Rothaermel and Carrie Yang (GT MBA, MSc.) prepared this
MiniCase from public sources. It is developed for the purpose of class discus-
sion. It is not intended to be used for any kind of endorsement, source of data,
or depiction of efficient or inefficient management. All opinions expressed,
and all errors and omissions, are entirely the authors’. © Rothaermel and
Yang, 2014.
WWW.YAZDANPRESS.COMWWW.YAZDANPRESS.COM

438 MINICASE 14 The Rise of Samsung Electronics
HTC
0
10
20
30
40
50
60
70
1Q’092Q’09
3Q’094Q’09
1Q’102Q’10
3Q’104Q’10
1Q’112Q’11
3Q’114Q’11
1Q’122Q’12
3Q’124Q’12
Samsung
Apple
Motorola
BlackBerry
EXHIBIT MC14.1 / Global Smartphone Shipment by Vendor (2009–2012, in millions)SOURCE: Authors’ depiction of data from “How Samsung’s rise is reshaping the mobile ecosystem,” Business Insider, March 14, 2013.
traction. Once such categories were identified, how-
ever, Samsung vastly outspent competitors in order to
develop leading electronics products. For example, the
company started making batteries for digital gadgets
in 2000. Ten years later, it became the world’s largest
producer of this critical component. In 2001, Samsung
started to invest in flat-panel televisions. Just four
years later, Samsung was the world’s leader in flat-
panel TVs. In 2002, Samsung Electronics bet on flash
memory, the technology that runs Apple’s iPads and
iPhones. Providing not only batteries but also flash
memory, Samsung is Apple’s largest supplier today.
Samsung Electronics applied the same “follow first,
innovate second” rule to smartphones. Being a key com-
ponent vendor to other leading technology companies
including Apple, Samsung was able to see easily what
directions other companies were taking. It made a range
of smartphones tailored to customers in different price
categories. Within two short years, it had overtaken
Motorola, HTC, BlackBerry, and eventually even Apple
to become the number-one vendor of smartphones in
the world and the largest technology company by rev-
enues globally (see Exhibits MC14.1 and MC14.2 ).
Although Samsung has gained a temporary com-
petitive advantage, sustaining it will be even more
difficult for a number of reasons. First, Samsung’s
competitive advantage was built in large part by fol-
lowing its “follow first, innovate second” rule. To keep
its number-one spot in the world’s technology indus-
try may be a challenge for a company that intends to
be a follower rather than a leader. Second, Chinese
technology companies such as Lenovo and Huawei
are also looking to join the battlefield in smartphones.
Third, Apple and Samsung have been locked in ongo-
ing court battles about who infringed the copyrights of
whom and in what type of smartphone models. Sam-
sung has already lost a high-profile case against Apple
in a California court, where damages were reduced
later to some $500 million.
To provide new avenues for future revenue growth,
chairman Lee laid out five new business areas in
which Samsung plans to invest some $20 billion by
2020. The five areas include (in order of size of invest-
ment): LED lighting, solar panels, e-vehicle batteries,
biotech drugs, and medical devices.
Succession planning is another challenge Sam-
sung is facing. The family of the late founder, Lee
Byung-Chul, still controls a majority of the shares.
At 71, Lee Kun-hee has long-groomed his eldest son
Jay Y. Lee (43) to be his successor as chairman of
WWW.YAZDANPRESS.COMWWW.YAZDANPRESS.COM
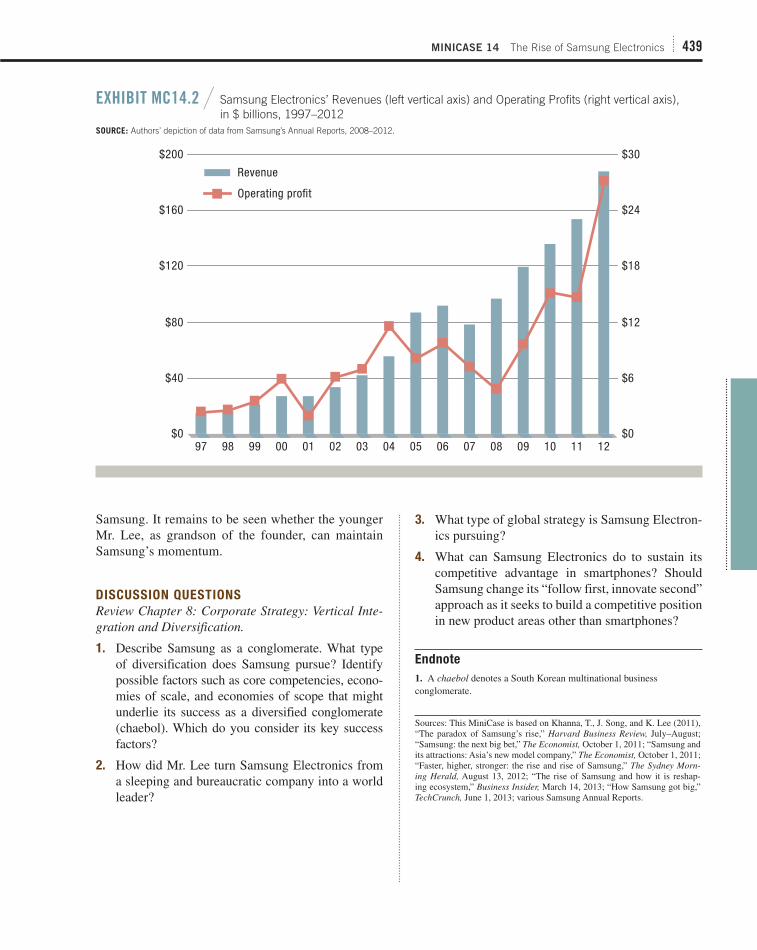
MINICASE 14 The Rise of Samsung Electronics 439
3. What type of global strategy is Samsung Electron-
ics pursuing?
4. What can Samsung Electronics do to sustain its
competitive advantage in smartphones? Should
Samsung change its “follow first, innovate second”
approach as it seeks to build a competitive position
in new product areas other than smartphones?
Endnote
1. A chaebol denotes a South Korean multinational business
conglomerate.
Samsung. It remains to be seen whether the younger
Mr. Lee, as grandson of the founder, can maintain
Samsung’s momentum.
DISCUSSION QUESTIONS
Review Chapter 8: Corporate Strategy: Vertical Inte-gration and Diversification.
1. Describe Samsung as a conglomerate. What type
of diversification does Samsung pursue? Identify
possible factors such as core competencies, econo-
mies of scale, and economies of scope that might
underlie its success as a diversified conglomerate
(chaebol). Which do you consider its key success
factors?
2. How did Mr. Lee turn Samsung Electronics from
a sleeping and bureaucratic company into a world
leader?
$0
$40
$80
$120
$160
$200
97 98 99 00 01 02 03 04 05 06 07 08 09 10 11 12$0
$6
$12
$18
$24
$30
Revenue
Operating profit
EXHIBIT MC14.2 / Samsung Electronics’ Revenues (left vertical axis) and Operating Profits (right vertical axis), in $ billions, 1997–2012
SOURCE: Authors’ depiction of data from Samsung’s Annual Reports, 2008–2012.
Sources: This MiniCase is based on Khanna, T., J. Song, and K. Lee (2011),
“The paradox of Samsung’s rise,” Harvard Business Review, July–August;
“Samsung: the next big bet,” The Economist, October 1, 2011; “Samsung and
its attractions: Asia’s new model company,” The Economist, October 1, 2011;
“Faster, higher, stronger: the rise and rise of Samsung,” The Sydney Morn-ing Herald, August 13, 2012; “The rise of Samsung and how it is reshap-
ing ecosystem,” Business Insider, March 14, 2013; “How Samsung got big,”
TechCrunch, June 1, 2013; various Samsung Annual Reports.
WWW.YAZDANPRESS.COMWWW.YAZDANPRESS.COM

440
Mini Case 15
IT MAY SOUND ASTONISHING that a fast-food chain
selling fried chicken could conquer a country with a
diverse culinary culture rooted in thousands of years
of tradition, but the Chinese division of Yum! Brands
did just that. Yum! Brands was created in 1997 as a
result of PepsiCo spinning off its fast-food operations
worldwide, a group that included KFC, Pizza Hut, and
Taco Bell. Not only did Yum! China become the big-
gest restaurant chain in the country, accounting for 4
out of 10 fast-food restaurants; it also now provides
half of Yum!’s total revenue and 42 percent of its prof-
its ( Exhibit MC15.1 ). No wonder David Novak, CEO
of Yum! Brands, considers China to be “the best res-
taurant growth opportunity of the 21st century.” 1
When Yum! Brands (then a subsidiary of PepsiCo)
opened its first KFC restaurant in Beijing in 1987,
there was no other Western-style fast-food chain in
China. Being greeted by smiling staff and then dining
in an air-conditioned, clean, and brightly lit environ-
ment was a novelty to local Chinese, as was a bite of
KFC’s crispy chicken. Compared to other American
fast foods, KFC also has a natural advantage: Chicken
is the second most common meat staple in China, just
after pork. Based on an understanding and apprecia-
tion of the Chinese taste for tradition and variety, KFC
introduced dishes that mimicked local cuisines, such
as Chinese porridge and dough fritters for breakfast.
Its menu in China included more items than on menus
in the U.S., and was updated more frequently. In addi-
tion, the level of spiciness of the food was adjusted
according to regional preferences within China. As
a result, a KFC restaurant in China has a much big-
ger kitchen and employs twice as many people as its
U.S. counterpart (although Chinese labor costs are
much lower, see Exhibit MC15.2 ). Given all its efforts
in pleasing Chinese diners, KFC no longer positions
itself in China as a cheap place for take-outs. Instead,
it is seen as a more upscale quick-service restaurant
for gatherings of family and friends.
KFC’s sister chain, Pizza Hut, also underwent a
similar makeover in China. Unlike its image in the
West as a cheap, fast-food outlet, Pizza Hut in China
has presented itself as a trendy casual dining restau-
rant since its opening in 1990. Diners at a Pizza Hut
restaurant in China are waited on while soothing back-
ground music plays, and the menu offers many other
Western-style dishes than just pizza.
Yum! China’s localization strategy was made
possible because Pepsi was busy competing with
Coca-Cola in the United States and took a hands-off
approach toward managing its overseas restaurant
business. When Yum! Brands was spun off from its
parent in 1997, Yum! China had already opened 200
restaurants in major cities. But Yum! China’s growth
strategy is about more than simply adding restaurants.
From the very beginning, the company has focused on
“building a perfect system which governs every step
of the way—from purchasing, to making, to deliver-
ing the food and to the quick service.” 2 Because a reli-
able network of distributors in China was nonexistent
at the time, Yum! China set up its own distribution arm
with company-owned warehouses and a fleet of trucks
to cover every province in China. To make sure each
new restaurant is properly staffed and offers excel-
lent customer service, Yum! China runs an extensive
training program where teams of new employees work
side by side with experienced ones in established res-
taurants. Once trained, these new employees rotate to
new restaurants.
The emphasis in the early years on building an
efficient operations network nationwide laid a solid
foundation for Yum! China’s rapid expansion. From
1997 to 2012, Yum! China opened more than 4,000
Yummy Yum!’s Competitive Advantage in China
Frank T. Rothaermel and Carrie Yang (GT MBA, MSc.) prepared this MiniCase
from public sources. It is developed for the purpose of class discussion. It is not
intended to be used for any kind of endorsement, source of data, or depiction of
efficient or inefficient management. All opinions expressed, and all errors and
omissions, are entirely the authors’. © Rothaermel and Yang, 2014.
WWW.YAZDANPRESS.COMWWW.YAZDANPRESS.COM

MINICASE 15 Yummy Yum!’s Competitive Advantage in China 441
0
500
1,000
1,500
2,000
2,500
3,000
3,500
4,000
4,500
2001 2002 2003 2004 2005 2006 2007 2008 2009 2010 2011 20120%
10%
20%
30%
40%
50%
60%KFC Pizza Hut China sales as % of total company sales
EXHIBIT MC15.1 / Yum! China’s Restaurant NumbersSOURCE: Authors’ depiction of data from Yum Brands Annual Reports, 2000–2012.
KFC and 800 Pizza Hut restaurants in 850 Chinese
cities. Most of the time, Yum! China was the first fast-
food chain (let alone international chain) to establish
EXHIBIT MC15.2 / Yum! Brands Selected FinancialsSOURCE: Yum! Brands Annual Reports, 2006–2012.
2007 2008 2009 2010 2011 2012
Sales growth
China 36% 47% 22% 21% 35% 24%
U.S. 27% 21% 213% 28% 221% 2%
Rest of world 30% 1% 212% 4% 23% 211%
Restaurant margin
China 20.1% 18.4% 20.2% 22.1% 19.7% 18.1%
U.S. 13.3% 12.5% 13.9% 14.2% 12.1% 16.3%
Rest of world 12.3% 11.1% 11.1% 11.7% 12.3% 12.9%
Cost of labor as % of sales
China 13.2% 13.8% 13.3% 14.4% 16.2% 18.5%
U.S. 30.5% 30.1% 30.0% 29.6% 30.4% 29.5%
Rest of world 26.1% 26.0% 26.0% 25.2% 25.6% 24.9%
a presence in a city. This enabled Yum! to gain a
first-mover advantage by selecting the best locations
with strong customer traffic, high visibility, and an
WWW.YAZDANPRESS.COMWWW.YAZDANPRESS.COM

442 MINICASE 15 Yummy Yum!’s Competitive Advantage in China
bond of trust with Chinese customers, another potential
outbreak of avian flu scared more eaters away. Yum!
China’s same-store sales dropped by 20 percent for the
first quarter of 2013, its first quarterly decline in three
years ( Exhibit MC15.3 ). But with only two Yum! res-
taurants per million people in China currently (com-
pared to 58 in the U.S.), Yum! China has no intention of
modifying its growth strategy or losing its number-one
spot in China’s fast-food industry any time soon.
DISCUSSION QUESTIONS
Review Chapter 9: Corporate Strategy: Mergers and Acquisitions, Strategic Alliances.
1. Yum! Brands is the result of a spin-off by PepsiCo,
where it sold its fast-food chains KFC, Taco Bell,
and Pizza Hut. Do you consider this spin-off suc-
cessful? Why or why not? Explain.
2. Why is Yum! Brands so much more successful in
China than in the U.S., its home country?
3. Why was Yum! Brands KFC so successful in China,
while other U.S. fast-food companies—such as
attractive rental rate. Sometimes, being the first also
generated free publicity from local officials since the
opening of a world-famous fast-food restaurant meant
that their city was becoming more cosmopolitan. Also,
benefiting from China’s lower labor costs, Yum! China
has become the only division within Yum! Brands to
consistently deliver double-digit sales growth and the
highest restaurant margin (see Exhibit MC15.2 ).
With thousands of stores and a vast distribution net-
work in densely populated areas, Yum! China is vul-
nerable to many external and internal threats, such as
outbreaks of bird flu (a repeat occurrence in China) and
food safety scandals. In 2003, the avian flu outbreak
caused a 40 percent decline in Yum! China’s sales. Two
years later, the discovery of a questionable ingredient
used in the chicken feeds by one of Yum! China’s sup-
pliers brought sales growth down to “only” 11 percent.
Although Yum! China recovered quickly from these set-
backs, last December Yum! China was again attacked
by China’s national news service for sourcing from
suppliers that use excessive antibiotics in their chicken
feeds. Worse yet, just as Yum! China was rebuilding its
China
USRest of world
225%
220%
215%
210%
–5%
0%
5%
10%
15%
20%
25%
1Q’102Q’10
3Q’104Q’10
1Q’112Q
’113Q
’114Q
’111Q’12
2Q’123Q’12
4Q’12
1Q’13
EXHIBIT MC15.3 / Yum! Brands Quarterly Same-Store Sales Growth by RegionSOURCE: Authors’ depiction of data from Yum! Brands quarterly earnings releases, Q1 2010–Q1 2013.
WWW.YAZDANPRESS.COMWWW.YAZDANPRESS.COM

MINICASE 15 Yummy Yum!’s Competitive Advantage in China 443
Endnotes
1. Yum! Brands 2012 Annual Report.
2 . “Competition gearing up in China’s fast food industry,” China Daily, June 30, 2008.
Pizza Hut (also owned by Yum!), McDonald’s, and
Burger King—were much less successful?
4. Given Yum! Brands recent challenges in China, do
you consider this to be a temporary problem or a
harbinger of losing its competitive advantage?
5. What recommendations would you give David
Novak, Yum! Brands’ CEO, to overcome the com-
pany’s current challenges in China?
Sources: This MiniCase is based on Yum! Brands Annual Reports, 2000–
2012; “Competition gearing up in China’s fast food industry,” China Daily, June 30, 2008; “Fast food in China: Yucky Kentucky,” The Economist, Feb-
ruary 9, 2013; and Bell, D. E., and Shelman, M. L. (2011), “KFC’s radical
approach to China,” Harvard Business Review, November.
WWW.YAZDANPRESS.COMWWW.YAZDANPRESS.COM
444
Mini Case 16
THE CHINESE COMPANY BYD, an acronym for “Build
Your Dreams,” began life as a manufacturer of
rechargeable batteries in 1995. It is now leveraging
this expertise into electric vehicles. But why would
a battery manufacturer diversify into car manufactur-
ing? Unlike complex gasoline engines, electric cars
are powered by simple motors and gearboxes that have
very few parts. Electric vehicles are therefore much
cheaper and more straightforward to build. BYD’s
claim to fame is a lithium iron phosphate battery on
which cars can run 250 miles on a single three-hour
charge. BYD sells plug-in hybrids and all-electric
vehicles in China, Africa, the Middle East, and South
America. In 2013, it entered the U.S. market.
Given the problems carmakers faced in the after-
math of the global financial crisis, which witnessed
the bankruptcies of GM and Chrysler, for a new firm
to expand into the auto manufacturing industry doesn’t
seem advisable. Yet BYD is joining the fray. How can
it sidestep such insurmountable entry barriers? The
answer: Technology is leveling the playing field. Mr.
Wang, founder and chairman of BYD, explains his stra-
tegic intent: “It’s almost hopeless for a latecomer like us
to compete with GM and other established automakers
with a century of experience in gasoline engines. With
electric vehicles, we’re all at the same starting line.” 1
Actually, BYD may even have a head start because of
its deep experience in batteries, selling them to technol-
ogy companies such as Motorola, Nokia, and Samsung,
and supplying more than 50 percent of the world’s
global handset batteries. Now it is leveraging its core
competencies in batteries, the most critical component
of electric vehicles, into car manufacturing.
In 2003, Mr. Wang, who was trained as a chemist,
decided to make cars. BYD acquired a state-owned,
near-defunct car manufacturer and launched its first
self-developed sedan model two years later. The model
soon became a national bestseller, and BYD a top-ten
auto manufacturer in China. By 2009, BYD’s auto divi-
sion made up more than 50 percent of the company’s
total revenue ( Exhibit MC16.1 ). Even legendary inves-
tor Warren Buffett was so impressed with the company
and Wang’s entrepreneurial spirit that a subsidiary of
Mr. Buffett’s Berkshire Hathaway bought a 10 percent
equity stake in BYD for $232 million.
Leveraging the company’s know-how in mak-
ing rechargeable batteries, BYD developed an all-
electric model, the e6. In 2009, BYD introduced this
new model at the North American International Auto
Show. The debut generated buzz in the car industry
and fueled the company’s ambition to promote its
brand in America. BYD indicated its plan to start sell-
ing the five-seat sedan to fleet customers in the Los
Angeles area by 2010. After almost a year of delay,
BYD opened its North American headquarters in
Los Angeles in 2011. However, the commercializa-
tion of the e6 never occurred in the U.S. for a number
of reasons: The e6 needed further development; Los
Angeles lacked the adequate infrastructure of charg-
ing stations required for electric vehicles; and the city
did not provide an incentive scheme for green car buy-
ers at the time. In addition, already well-established
auto manufacturers launched electric models, such
as Nissan’s Leaf and General Motor’s Volt (a plug-in
hybrid), not to mention the popular Toyota Prius (also
a plug-in hybrid launched in 2000 in the U.S.). All this
has made it much more difficult for BYD to enter the
U.S. market successfully.
Given these challenges, BYD is now focusing on
making all-electric buses. The primary target market
is metropolitan transport authorities, and BYD seems
to be gaining momentum. Its all-electric buses are
built on the production platform of a Chinese coach
manufacturer acquired in 2009. The first all-electric
bus model, the K9, rolled off BYD’s production line
BYD—“Build Your Dreams” in America
Frank T. Rothaermel and Carrie Yang (GT MBA, MSc.) prepared this Mini-
Case from public sources. It is developed for the purpose of class discussion.
It is not intended to be used for any kind of endorsement, source of data,
or depiction of efficient or inefficient management. All opinions expressed,
and all errors and omissions, are entirely the authors’. © Rothaermel and
Yang, 2014.
WWW.YAZDANPRESS.COMWWW.YAZDANPRESS.COM

MINICASE 16 BYD—“Build Your Dreams” in America 445
1. What type of company is BYD? Is it a battery
manufacturer or a car and bus manufacturer?
Or is it something else entirely? What is BYD’s
core competency? How does it leverage its core
competency to diversify? (You may want to refer
to Exhibit 8.8, “The Core Competence–Market
Matrix.”)
2. Thinking about the concept of liability of for-eignness, what would you consider to be BYD’s
greatest challenge when attempting to compete
successfully in the U.S. market? How would you
address these challenges?
3. What type of global strategy would you recom-
mend BYD pursue based on the integration-
response framework? (See Exhibit 10.5.)
4. Do you think BYD will be successful in America?
Why or why not?
Endnote
1 . “Technology levels playing field in race to market electric car,”
The Wall Street Journal, January 12, 2009.
in 2010. K9’s debut generated immediate commercial
interest. In 2012, BYD sold more than 1,200 buses
priced at $300,000 each to countries such as Israel,
Uruguay, Columbia, Canada, and the Netherlands.
Mr. Wang hasn’t given up on his dream of making
it big in America, though. To meet the requirements
of the “Buy America Act” (which specifies that U.S.
government agencies must procure products where
U.S.-made parts account for more than 60 percent of
total component costs), BYD announced in 2012 its
plan to open an electric-bus assembly plant in Lan-
caster, California. This announcement came right after
BYD received a 10-bus order worth $12.1 million
from Long Beach Transit, a transport agency serving
the communities south of Los Angeles. BYD is now
building its buses in the California plant using local
labor, and has benefitted from the ability of transport
agencies and other public entities in the U.S. to tap
federal subsidies that cover up to 80 percent of the
cost of buying electric buses. BYD is eyeing other
lucrative California markets, also, such as the Los
Angeles County Metropolitan Transportation Author-
ity and BART (Bay Area Rapid Transit). BYD plans to
deliver between 200 and 300 electric buses to custom-
ers in the U.S. by the end of 2014. So, the question
remains . . . Will BYD be able to continue building its
dream in America?
DISCUSSION QUESTIONS
Review Chapter 10: Global Strategy: Competing Around the World.
EXHIBIT MC16.1 / BYD Auto Financial Results (2005–2012, $ figures in millions)SOURCE: BYD Annual Reports, 2004–2012.
2005 2006 2007 2008 2009 2010 2011 2012
Sales – Auto $1,046 $2,084 $3,416 $4,314 $6,356 $7,518 $7,458 $7,147
Growth (YoY)* 61.5% 414.2% 50.7% 77.5% 142.8% 2.7% 2.7% 1.9%
Percentage of total sales 9.7% 25.0% 23.0% 32.3% 53.2% 46.2% 47.8% 50.8%
Operating profit – Auto 2$15 $19 $41 $81 $566 $281 $306 $170
Percentage of total operating profit - 8.3% 12.3% 27.5% 72.9% 48.4% 67.5% 79.2%
Operating margin – Auto - 3.7% 5.3% 5.8% 16.7% 8.1% 8.6% 4.7%
Number of total vehicles sold 15,993 55,038 85,942 170,000 450,000 500,000 437,000 420,000
YoY growth 7.9% 244.1% 56.2% 97.8% 164.7% 11.1% 212.6% 23.9%
*YoY 5 year over year
Sources: This MiniCase is based on BYD Annual Reports 2003–2012;
Fishman, T. C. (2005), China Inc.: How the Rise of the Next Superpower Challenges America and the World (New York: Simon & Schuster), p. 215;
“Warren Buffett takes charge,” CNN Money, April 13, 2009; “Hollywood
beckons China’s BYD,” The Wall Street Journal, December 10, 2009; “A
crowded car industry. From Big Three to magnificent seven,” The Economist, January 13, 2011; “BYD opens U.S. headquarters in Los Angeles,” Edmunds AutoObserver, October 25, 2011; “BYD signs South American electric bus
deal,” CleanBiz.Asia, July 23, 2012; “Tel Aviv to get 700 BYD electric
buses,” CleanBiz.Asia, August 28, 2012; “Chasing the dragon: An old rela-
tionship presents fresh opportunities,” The Economist, April 13, 2013.
WWW.YAZDANPRESS.COMWWW.YAZDANPRESS.COM

446
Mini Case 17
IN THE ARABIC TALE of “Ali Baba and the Forty
Thieves,” Ali Baba, the poor woodcutter, opened the
cave with hidden treasure by saying the magic words
“Open sesame!” In modern-day China, Alibaba is
a family of e-commerce businesses, which The Wall Street Journal described as “comparable to eBay,
Amazon, and PayPal all rolled into one, with a stake in
Twitter-like Weibo thrown in to boot.” 1 Alibaba’s main
trading platforms are Taobao and Tmall; together they
processed $170 billion in transactions last year. This
is more than Amazon and eBay combined! So, what is
Alibaba’s magic?
Alibaba had a humble beginning. In 1999, a former
English teacher named Jack Ma started the company
with a team of 18 in his apartment in Hangzhou, a city
some 100 miles southwest of Shanghai. The year 1999
also marked the start of China’s explosive growth of
Internet users (See Exhibit MC17.1 ). By 2012, China’s
Internet users grew to 564 million, a compound annual
growth rate (CAGR) of a whopping 37.6 percent.
Initially, Alibaba’s website was a business-to-
business (B2B) platform where China’s small and
medium-sized businesses could showcase their prod-
ucts to buyers around the world. Alibaba was not the
first company to explore opportunities in introducing
China’s manufacturing to global demand, but it was
the first to do so online. In its first year of operation,
Alibaba signed up new members at a rate of 1,200 per
day. By 2002, the young startup was already profit-
able. By 2012, Alibaba facilitated transactions in basi-
cally every country in the world.
In 1999, EachNet, another Chinese Internet ven-
ture, was founded in Shanghai by two Harvard MBAs
who wanted to create a “Chinese eBay,” an auction site
for locals to sell and bid for goods. By 2003, Each-
Net had 2 million users and 85 percent market share
in China’s consumer-to-consumer (C2C) transactions.
At the time, eBay was actively looking to expand in
China and eventually acquired EachNet as its China
operation for $180 million in 2003.
Fearing eBay would lure away small businesses,
Alibaba launched a competing C2C platform, Taobao
(meaning “digging treasure” in Chinese), as a defen-
sive strategy. Unlike EachNet which charged listing
and transaction fees from sellers, Taobao was free
for the user. But Taobao’s free services did not erode
EachNet’s loyal customer base. EachNet’s dominant
market position meant more products and more oppor-
tunities for both buyers and sellers to trade. Although
EachNet was competing head to head with Taobao on
advertising campaigns, eBay made a decision to ter-
minate EachNet’s homegrown technology platform
and move all EachNet users to eBay’s U.S. platform in
2004. Internally, this was called a “migration” at eBay.
The intent was to create one global trading platform
that would allow eBay users to trade with each other,
no matter where they were located.
The problem was that eBay’s U.S. platform did not
have the set of features that EachNet needed to com-
pete in China. The online data that once freely flowed
within China now became cross-border traffic and had
to pass the Chinese government’s “firewall.” The speed
to load EachNet’s web page slowed significantly.
Frustrated users left EachNet in droves and turned to
Taobao for a better alternative. While most decisions
at EachNet had to go to eBay’s U.S. headquarters for
approval, Alibaba swiftly launched a number of inno-
vative services to assist transactions on Taobao. One
was Aliwangwang, an instant messaging service help-
ing buyers and sellers interact. Another was Alipay, an
escrow payment system to reduce online transaction
Alibaba and China’s E-Commerce:
“Open Sesame” Comes True
Frank T. Rothaermel and Carrie Yang (GT MBA, MSc.) prepared this Mini-
Case from public sources. It is developed for the purpose of class discussion.
It is not intended to be used for any kind of endorsement, source of data,
or depiction of efficient or inefficient management. All opinions expressed,
and all errors and omissions, are entirely the authors’. © Rothaermel and
Yang, 2014.
WWW.YAZDANPRESS.COMWWW.YAZDANPRESS.COM

MINICASE 17 Alibaba and China’s E-Commerce: “Open Sesame” Comes True 447
1. How was Alibaba able to become the leading
online trading platform in China? Think about
standards, network effects, and crossing the chasm
(from Chapter 7).
2. Apply the CAGE distance framework (see
Exhibit 10.3) to help explain why eBay was not
successful in the Chinese market. Why do you
think Amazon has only 1.9 percent market share
in China (see Exhibit MC17.3 ), while it holds
some 26 percent market share of the $226 billion
U.S. e-commerce market. What general conclu-
sions do you draw?
3. Review the integration-responsiveness framework
shown in Exhibit 10.5. Which global strategy posi-
tions would you recommend U.S. e-commerce
companies such as eBay, Amazon, and others pur-
sue, and why?
4. Does your recommendation in question 3 support
the notion that the “world is flat,” or would “semi-
globalization” be a more accurate description?
Support your arguments.
Endnote
1. “China changes won’t faze Alibaba,” The Wall Street Journal, July 5, 2013.
risks. Just three months after eBay’s migration, Taobao
had captured 60 percent of the C2C market share, leav-
ing EachNet at 30 percent. In 2006, eBay shut down
EachNet and folded its China operation altogether.
Alibaba, meanwhile, continued to build its e-com-
merce venture around Taobao. In 2007, it set up Ali-
soft, where Taobao sellers could buy customized
third-party software to help with their day-to-day oper-
ations, and Alimama, where Taobao sellers could post
ads on a network of specialized websites. Anticipating
a growing share of business-to-consumer (B2C) trans-
actions of online retailing, Taobao launched TMall,
a dedicated B2C platform to complement Taobao in
2008. (See Exhibit MC17.2 .)
By 2012, Alibaba employed 24,000 people and had
over $4 billion in revenues, becoming the clear market
share leader in all three e-commerce areas (B2B, C2C,
B2C) in China (see Exhibit MC17.3 ). Alibaba’s initial
public offering is highly anticipated because the company
is valued at somewhere between $55 billion and $120
billion. China’s Internet e-commerce market is expected
to grow to $600 billion by 2020. The U.S. online search
firm Yahoo owns a 24 percent stake in Alibaba.
DISCUSSION QUESTIONS
Review Chapter 10: Global Strategy: Competing Around the World.
564
0
100
200
300
400
CAGR 5 37.6%
500
600
1999 2000 2001 2002 2003 2004 2005 2006 2007 2008 2009 2010 2011 2012
EXHIBIT MC17.1 / China’s Internet Users (in millions)SOURCE: Authors’ depiction of data from China Internet Network Information Center, http://www1.cnnic.cn/.
WWW.YAZDANPRESS.COMWWW.YAZDANPRESS.COM

448 MINICASE 17 Alibaba and China’s E-Commerce: “Open Sesame” Comes True
0%
10%
20%
30%
40%
50%
60%
70%
80%
90%
100%
2008 2009 2010 2011 2012 2013E 2014E
B2C C2C
EXHIBIT MC17.2 / China’s Online Retailing Market (2008–2014E*)SOURCE: Authors’ depiction of data from iResearch Global, http://www.iresearchchina.com.
* E indicates an estimation.
EXHIBIT MC17.3 / China’s E-Commerce Ranking by Market Share (2012)SOURCE: iResearch Global, http://www.iresearchchina.com/.
B2B C2C B2C*
Alibaba 39.7% Taobao (Alibaba) 94.5% Tmall (Alibaba) 51.3%
Mysteel 5.7% Tencent Paipai 5.5% Jd 17.5%
Global Sources 5.4% Tencent E-Comm. 6.8%
HC360 3.2% Suning E-Comm. 4.5%
Dhgate 3.0% Dangdang 2.6%
Made-in-China 2.5% Gome E-Comm. 2.1%
Global Market 1.2% Vipshop 1.9%
Toocle 1.1% Amazon 1.9%
Other 38.0% Other 11.4%
* Data as of first quarter of 2013.
Sources: This MiniCase is based on company overview, news on Alibaba.
com; “The Jack who would be king,” The Economist, August 24, 2000;
“E-commerce with Chinese characteristics,” The Economist, November 15,
2007; “How eBay lost the China market,” Global Times, August 10, 2009;
“How eBay failed in China,” Forbes, September 12, 2010; “How Tao-
bao bested eBay in China,” Financial Times, March 12, 2012; “Yahoo’s ad
struggles persist,” The Wall Street Journal, April 16, 2013; “Alibaba: The
world’s greatest bazaar,” The Economist, March 23, 2013; “E-commerce in
China: The Alibaba phenomenon,” The Economist, March 23, 2013; “Micro-
soft considered building e-commerce market,” Fox Business, June 2013; and
“Yahoo’s Marissa Mayer hits one-year mark,” The Wall Street Journal, July
15, 2013.
WWW.YAZDANPRESS.COMWWW.YAZDANPRESS.COM

449
Mini Case 18
IN 1998, 24-YEAR-OLD Sergey Brin and 25-year-old
Larry Page founded Google. They met as graduate
students in computer science at Stanford Univer-
sity, where they began working together on a web
crawler, with the goal of improving online searches.
What they developed was the PageRank algorithm,
which returns the most relevant web pages more or
less instantaneously and ranks them by how often
they are referenced on other important web pages. A
clear improvement over early search engines such as
AltaVista, Overture, and Yahoo, all of which indexed
by keywords, the PageRank algorithm is able to con-
sider 500 million variables and 3 billion terms. What
started as a homework assignment launched the two
into an entrepreneurial venture when they set up shop
in a garage in Menlo Park, California.
Today, Google is the world’s leading online search
and advertising company, with some 70 percent mar-
ket share of an industry estimated to be worth more
than $50 billion a year, and growing quickly. Though
Yahoo is a distant second with less than 20 per-
cent share, in 2008 Microsoft’s CEO Steve Ballmer
offered to buy the runner-up for close to $50 billion
to help his company gain a foothold in the paid-
search business where Google rules. Yahoo turned
down the offer.
What haunts Ballmer is that Microsoft actually
had its own working prototype of a Google forerun-
ner, called Keywords, more than a decade earlier.
Scott Banister, then a student at the University of
Illinois, had come up with the idea of adding paid
advertisements to Internet searches. He quit college
and drove his Geo hatchback to the San Francisco
Bay Area to start Keywords, later joining an online
ad company called LinkExchange. In 1998, Micro-
soft bought LinkExchange for some $265 million
(about one two-hundredth the price it would later
offer for Yahoo). LinkExchange’s managers urged
Microsoft to invest in Keywords. Instead, Microsoft
executives shut down LinkExchange in 2000 because
they did not see a viable business model in it. One
LinkExchange manager actually approached Ballmer
himself and explained that he thought Microsoft was
making a mistake. But Ballmer said he wanted to
manage through delegation and would not reverse
a decision made by managers three levels below
him, thus bringing an end to Microsoft’s first online
advertising venture.
In 2003, Microsoft got a second chance to enter
the online advertising business when some mid-level
managers proposed buying Overture Services, an
innovator in combining Internet searches with adver-
tisements. This time, Ballmer, joined by Microsoft’s
co-founder Bill Gates, decided not to pursue the idea
because they thought Overture was overpriced. Shortly
thereafter, Yahoo bought Overture for $1.6 billion.
Having missed two huge opportunities to pursue
promising strategic initiatives that emerged from
The Premature Death of a
Google Forerunner at Microsoft
Frank T. Rothaermel prepared this MiniCase from public sources. It is devel-
oped for the purpose of class discussion. It is not intended to be used for
any kind of endorsement, source of data, or depiction of efficient or inef-
ficient management. All opinions expressed, and all errors and omissions, are
entirely the author’s. © Rothaermel, 2014.
WWW.YAZDANPRESS.COMWWW.YAZDANPRESS.COM

450 MINICASE 18 The Premature Death of a Google Forerunner at Microsoft
1. Describe the strategic management process at
Microsoft. How are strategic decisions made? What
are the strengths and weaknesses of this approach?
2. Explain the role of organizational inertia in Micro-
soft’s difficulty in establishing a presence in the online
paid-search business. What could Microsoft have
done differently? What recommendations pertaining
to the strategic management process would you give?
3. How did two college students successfully launch a
business in online search and advertising that out-
performs Microsoft, one of the world’s leading tech-
nology companies? Among other issues, consider
the role of differences in organizational culture.
4. Why is Google successful in the online search busi-
ness while Yahoo and Microsoft are struggling?
Endnote
1 . Microsoft CEO Steve Ballmer’s quote drawn from “Microsoft bid
to beat Google builds on a history of misses,” The Wall Street Journal, January 16, 2009.
lower levels within the firm, Microsoft has been
playing catch-up in the paid-search business ever
since. In the summer of 2009, it launched its own
search engine, Bing (an acronym for “Because It’s
Not Google”). Microsoft and Yahoo subsequently
formed a strategic alliance, and Microsoft’s new
search engine will also power Yahoo searches. These
two strategic moves helped Microsoft increase
its share in the lucrative online search business to
roughly 25 percent, up from just over 8 percent. It
remains an open question whether this is sufficient,
however, to challenge Google’s dominance. In par-
ticular, Bing’s increase in market share of online
searches is obtained at the expense of Yahoo’s,
and not Google’s, market share. Microsoft’s CEO
Ballmer admits problems in Microsoft’s strategic
management process: “The biggest mistakes I claim
I’ve been involved with are where I was impatient—
because we didn’t have a business yet in something,
we should have stayed patient. If we’d kept consis-
tent with some of the ideas, we might have been in
paid search. We are letting more flowers bloom.” 1 In
the summer of 2013, Steve Ballmer announced he
would retire as Microsoft’s CEO by mid-2014.
DISCUSSION QUESTIONS
Review Chapter 11: Organizational Design: Struc-ture, Culture, and Control.
Sources: This MiniCase is based on “Yahoo to buy Overture for $1.63 bil-
lion,” CNET News, July 14, 2003; “Microsoft bid to beat Google builds on a
history of misses,” The Wall Street Journal, January 16, 2009; “Yahoo tie-up
is latest sign tide turning for Microsoft’s Ballmer,” The Wall Street Journal, July 30, 2009; “Bingoo! A deal between Microsoft and Yahoo!” The Econo-mist, July 30, 2009; “Google, Microsoft spar on antitrust,” The Wall Street Journal, March 1, 2010; Levy, S. (2011), In the Plex: How Google Thinks, Works, and Shapes Our Lives (New York: Simon & Schuster); and “Microsoft
CEO Steve Ballmer to retire in 12 months,” The Wall Street Journal, August
23, 2013.
WWW.YAZDANPRESS.COMWWW.YAZDANPRESS.COM
451
Mini Case 19
APPLE’S MARKET CAPITALIZATION in 2001 was $7 bil-
lion, while Sony’s was $55 billion. Apple introduced
the iPod, a portable digital music player, in October
2001 and the iTunes music store 18 months later.
Through these two strategic moves Apple redefined
the music industry, reinventing itself as not only a
mobile-device but also a content-delivery company.
Signaling its renaissance, Apple changed its name
from Apple Computer, Inc., to simply Apple, Inc. But
what happened to Sony—the company that created the
portable-music industry by introducing the Walkman
in 1979?
Sony’s strategy was to differentiate itself through
the vertical integration of content and hardware,
driven by its 1988 acquisition of CBS Records (later
part of Sony Entertainment). This vertical integra-
tion strategy contrasted with Sony Music division’s
desire to protect its lucrative revenue-generating,
copyrighted compact discs (CDs). Sony Music’s engi-
neers were aggressively combating rampant music
piracy by inhibiting the Microsoft Windows Media
Player’s ability to rip CDs and by serializing discs
(assigning unique ID numbers to discs). Meanwhile,
Apple’s engineers were developing a Digital Rights
Management (DRM) system to control and restrict the
transfer of copyrighted digital music. Apple’s DRM
succeeded, protecting the music studio’s interests
while creating value that enabled consumers to enjoy
portable digital music.
Sony had a long history of creating electronics
devices of superior quality and design. It had all the
right competencies to launch a successful counterat-
tack to compete with Apple: electronics, software,
music, and computer divisions. Sony even supplied
the batteries for Apple’s iPod. Cooperation among
strategic business units had served Sony well in the
past, leading to breakthrough innovations such as
the Walkman, PlayStation, the CD, and the VAIO
computer line. In this case, however, the hardware and
content divisions each seemed to have their own idea
of what needed to be done. Cooperation among the
Sony divisions was also hindered by the fact that their
centers of operations were spread across the globe:
Music operations were located in New York City and
electronics design was in Japan, inhibiting face-to-
face communications and making real-time interac-
tions more difficult.
Sony’s then-CEO Nobuyuki Idei learned the hard
way that the Music division managers were focused
on the immediate needs of their recordings compet-
ing against consumer-driven market forces. In 2002,
Mr. Idei shared his frustrations about the cultural dif-
ferences between the hardware and content divisions:
The opposite of soft alliances is hard alliances, which
include mergers and acquisitions. Since purchas-
ing the Music and Pictures businesses, more than 10
years have passed, and we have experienced many
cultural differences between hardware manufactur-
ing and content businesses. . . . This experience has
taught us that in certain areas where hard alliances
would have taken 10 years to succeed, soft alliances
can be created more easily. Another advantage of soft
alliances is the ability to form partnerships with many
different companies. We aim to provide an open and
easy-to-access environment where anybody can par-
ticipate and we are willing to cooperate with compa-
nies that share our vision. Soft alliances offer many
possibilities. 1
In contrast, Apple organized a small, empow-
ered, cross-functional team to produce the iPod in
just a few months. Apple successfully outsourced
Sony’s Structure and Competitive Disadvantage
Frank T. Rothaermel prepared this MiniCase from public sources. A prior
version of this MiniCase was prepared in collaboration with Robert Redrow
(formerly of Sony Corp.). It is developed for the purpose of class discussion.
It is not intended to be used for any kind of endorsement, source of data, or
depiction of efficient or inefficient management. All opinions expressed, and
all errors and omissions, are entirely the author’s. © Rothaermel, 2014.
WWW.YAZDANPRESS.COMWWW.YAZDANPRESS.COM
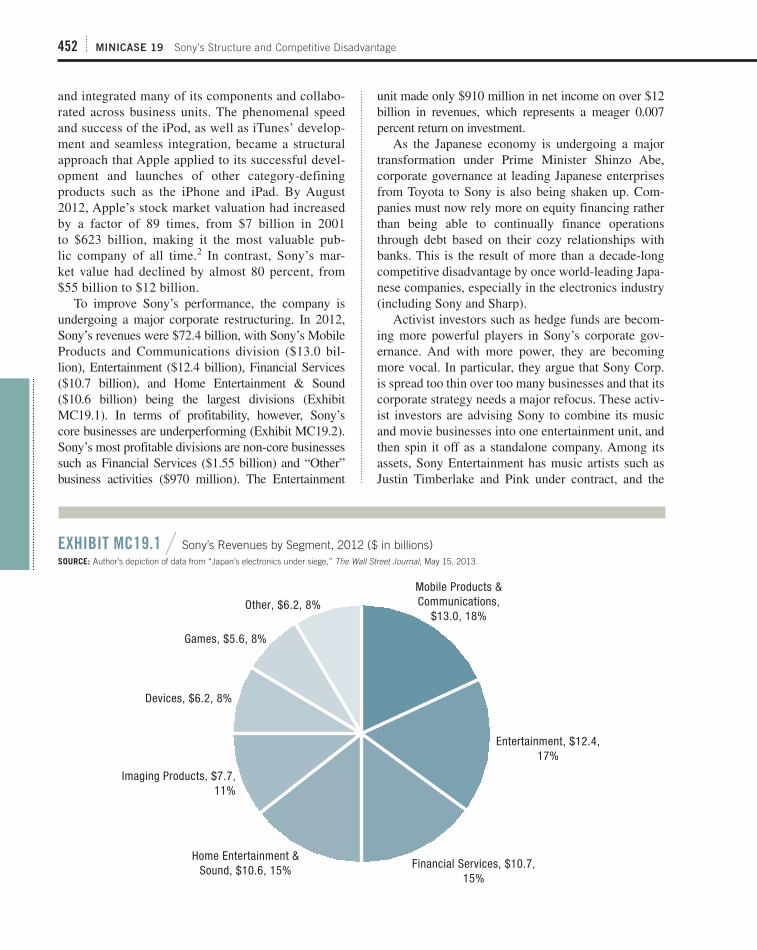
452 MINICASE 19 Sony’s Structure and Competitive Disadvantage
unit made only $910 million in net income on over $12
billion in revenues, which represents a meager 0.007
percent return on investment.
As the Japanese economy is undergoing a major
transformation under Prime Minister Shinzo Abe,
corporate governance at leading Japanese enterprises
from Toyota to Sony is also being shaken up. Com-
panies must now rely more on equity financing rather
than being able to continually finance operations
through debt based on their cozy relationships with
banks. This is the result of more than a decade-long
competitive disadvantage by once world-leading Japa-
nese companies, especially in the electronics industry
(including Sony and Sharp).
Activist investors such as hedge funds are becom-
ing more powerful players in Sony’s corporate gov-
ernance. And with more power, they are becoming
more vocal. In particular, they argue that Sony Corp.
is spread too thin over too many businesses and that its
corporate strategy needs a major refocus. These activ-
ist investors are advising Sony to combine its music
and movie businesses into one entertainment unit, and
then spin it off as a standalone company. Among its
assets, Sony Entertainment has music artists such as
Justin Timberlake and Pink under contract, and the
and integrated many of its components and collabo-
rated across business units. The phenomenal speed
and success of the iPod, as well as iTunes’ develop-
ment and seamless integration, became a structural
approach that Apple applied to its successful devel-
opment and launches of other category-defining
products such as the iPhone and iPad. By August
2012, Apple’s stock market valuation had increased
by a factor of 89 times, from $7 billion in 2001
to $623 billion, making it the most valuable pub-
lic company of all time. 2 In contrast, Sony’s mar-
ket value had declined by almost 80 percent, from
$55 billion to $12 billion.
To improve Sony’s performance, the company is
undergoing a major corporate restructuring. In 2012,
Sony’s revenues were $72.4 billion, with Sony’s Mobile
Products and Communications division ($13.0 bil-
lion), Entertainment ($12.4 billion), Financial Services
($10.7 billion), and Home Entertainment & Sound
($10.6 billion) being the largest divisions ( Exhibit
MC19.1 ). In terms of profitability, however, Sony’s
core businesses are underperforming ( Exhibit MC19.2 ).
Sony’s most profitable divisions are non-core businesses
such as Financial Services ($1.55 billion) and “Other”
business activities ($970 million). The Entertainment
Mobile Products &Communications,
$13.0, 18%
Entertainment, $12.4,17%
Financial Services, $10.7,15%
Home Entertainment &Sound, $10.6, 15%
Imaging Products, $7.7,11%
Devices, $6.2, 8%
Games, $5.6, 8%
Other, $6.2, 8%
EXHIBIT MC19.1 / Sony’s Revenues by Segment, 2012 ($ in billions)SOURCE: Author’s depiction of data from “Japan’s electronics under siege,” The Wall Street Journal, May 15, 2013.
WWW.YAZDANPRESS.COMWWW.YAZDANPRESS.COM

MINICASE 19 Sony’s Structure and Competitive Disadvantage 453
4. What could Sony have done differently to avoid
failure? What lessons could be learned?
5. Explain how restructuring (as activist investors are
recommending) would produce benefits for Sony.
What would be the benefits of splitting up Sony as
proposed? What would be its drawbacks?
Endnotes
1 . Sony Annual Report 2002, year ended March 31, 2002, Sony
Corporation, p. 9.
2 . By summer 2013, Apple’s stock market valuation had decreased
considerably as detailed in Chapter Cases 1 and 5.
movie Skyfall, Sony’s latest installment in the James
Bond saga, which topped the rankings and grossed
over one billion dollars since its release in 2012. This
corporate restructuring should allow Sony to focus on
its core business in electronics, while unlocking hid-
den value-creating potential in its entertainment unit.
DISCUSSION QUESTIONS
Review Chapter 11: Organizational Design: Struc-ture, Culture, and Control.
1. Why had Sony been successful in the past (e.g.,
with the introduction of the Walkman, PlaySta-
tion, the CD, and the VAIO computer line)?
2. What was Mr. Idei’s assessment of strategic alli-
ances versus M&As? Do you agree or disagree
with his conclusion? Support your assessment.
3. Explain how Sony’s organizational design (struc-
ture, culture, and control) inhibited Sony’s ability
to respond to the competitive challenge of Apple
in the digital portable music industry.
Home Entertainment& Sound2$0.90
Imaging Products$0.00
Devices$0.47
Games$0.00
Other$0.97
2$1.50 2$1.00 2$0.50 $0.00 $0.50 $1.00 $1.50 $2.00
Mobile Products &Communications
2$1.03
Entertainment$0.91
Financial Services$1.55
EXHIBIT MC19.2 / Sony’s Net Income by Segment, 2012 ($ in billions)SOURCE: Author’s depiction of data from “Japan’s electronics under siege,” The Wall Street Journal, May 15, 2013.
Sources: This MiniCase is based on Hansen, M. T. (2009), Collabora-tion: How Leaders Avoid the Traps, Create Unity, and Reap Big Results
(Cambridge, MA: Harvard Business School Press); Sony Annual Report
2002, year ended March 31, 2002, Sony Corporation, p. 9; “Japan’s electron-
ics under siege,” The Wall Street Journal, May 15, 2013; Sony Corporation
Info, www.sony.net/SonyInfo/CorporateInfo/History/sonyhistory-e.html; and
Wolfram Alpha, www.wolframalpha.com.
WWW.YAZDANPRESS.COMWWW.YAZDANPRESS.COM

454
Mini Case 20
UBS WAS FORMED in 1997 when the Swiss Bank Cor-
poration merged with the Union Bank of Switzerland.
After acquiring Paine Webber, a 120-year-old U.S.
wealth management firm in 2000, and aggressively
hiring for its investment banking business, UBS soon
became one of the top financial services companies in
the world and the biggest bank in Switzerland.
Between 2008 and 2012, however, UBS’s stand-
ing was harmed by a series of ethics scandals, detailed
next. These scandals cost the bank billions of dollars
in fines and lost profits, and severely damaged its rep-
utation ( Exhibit MC20.1 ).
Ethics Scandal #1:
U.S. Tax Evasion
Swiss banks have long enjoyed a competitive advan-
tage brought by the Swiss banking privacy laws, mak-
ing it a criminal offense to share clients’ information
with any third parties. The exceptions are cases of
criminal acts such as accounts linked to terrorists or
tax fraud. Merely not declaring assets to tax authori-
ties (tax evasion), however, is not considered tax fraud.
After the acquisition of Paine Webber, UBS entered
into a Qualified Intermediary (QI) agreement with the
Internal Revenue Service (IRS), the federal tax agency
of the U.S. government. Like other foreign financial
institutions under a QI agreement, UBS agreed to
report and withhold taxes on accounts receiving U.S.-
sourced income. Reporting on non-U.S. accounts with
U.S.-sourced income is done on an aggregate basis.
This in turn protects the identity of the non-U.S.
account holders.
In mid-2008, it came to light that since 2000, UBS
had actively participated in helping its U.S. clients
evade taxes. To avoid QI reporting requirements,
UBS’s Switzerland-based bankers had aided U.S.
clients in structuring their accounts to divest U.S.
securities and set up sham entities offshore to acquire
non-U.S. account-holder status. Aided by Swiss bank
privacy laws, UBS successfully helped its U.S. clients
conceal billions of dollars from the IRS. In addition,
UBS aggressively marketed its “tax saving” schemes
by sending its Swiss bankers to the U.S. to develop
clientele, even though those bankers never acquired
proper licenses from the U.S. Securities and Exchange
Commission (SEC) to do so.
The U.S. prosecutors pressed charges on UBS for
conspiring to defraud the United States by imped-
ing the IRS. In a separate suit, the U.S. requested
UBS to reveal the names of 52,000 U.S. clients who
were believed to be tax evaders. In February 2009,
UBS paid $780 million in fines to settle the charges.
Although it initially resisted the pressure to turn
over clients’ information, citing the Swiss bank pri-
vacy laws, UBS eventually agreed to disclose 4,450
accounts after intense negotiations involving officials
from both countries. Clients left UBS in droves: Oper-
ating profit from the bank’s wealth management divi-
sion declined by 60 percent or $4.4 billion in 2008; it
declined another 17 percent ($504 million) in 2009.
The UBS case has far-reaching implications for
the bank’s wealth management business and the
Swiss banking industry as a whole, especially for the
bank secrecy in which the industry takes such pride.
To close loopholes in the QI program and crack down
on tax evasion in countries with strict bank-secrecy
traditions, President Obama signed into law the For-
eign Account Tax Compliance Act (FATCA) in 2010.
The law requires all foreign financial institutions to
report offshore accounts and activities of their U.S.
clients with assets over $50,000, and to impose a
30 percent withholding tax on U.S. investments or
UBS’s Billion-Dollar Ethics Scandals
Frank T. Rothaermel and Carrie Yang (GT MBA, MSc.) prepared this
MiniCase from public sources. It is developed for the purpose of class discus-
sion. It is not intended to be used for any kind of endorsement, source of data,
or depiction of efficient or inefficient management. All opinions expressed,
and all errors and omissions, are entirely the authors’. © Rothaermel and
Yang, 2014.
WWW.YAZDANPRESS.COMWWW.YAZDANPRESS.COM

MINICASE 20 UBS’s Billion-Dollar Ethics Scandals 455
trading limits. UBS was fined $47.6 million in late
2012.
Ethics Scandal #3:
Libor Manipulation
Libor, or the London Interbank Offered Rate, is the
interest rate at which international banks based in
London lend to each other. Libor is set daily: A panel
of banks submits rates to the British Bankers’ Asso-
ciation based on their perceived unsecured borrowing
cost; the rate is then calculated using a “trimmed” aver-
age, which excludes the highest and lowest 25 percent
of the submissions. Libor is the most frequently used
benchmark reference rate worldwide, setting prices on
financial instruments worth about $800 trillion.
UBS, as one of the panel banks, was fined $1.5 bil-
lion in December 2012 by the U.S., the UK, and Swiss
regulators for manipulating Libor submissions from
2005 to 2010. During that period, UBS traders acted on
their own or colluded with interdealer brokers and trad-
ers at other panel banks to adjust Libor submissions to
benefit UBS’s own trading positions. In addition, during
to exit the U.S. business altogether. Switzerland has
agreed to implement the FATCA. The annual com-
pliance cost for each Swiss bank is estimated to be
$100 million.
Ethics Scandal #2: Rogue Trader
On September 15, 2011, UBS announced that a rogue
trader named Kweku Adoboli at its London branch had
racked up an unauthorized trading loss of $2.3 billion
over a period of three years. Nine days later, UBS’s
CEO Oswald Grübel resigned “to assume responsibil-
ity for the recent unauthorized trading incident.” 1
After more than a year of joint investigation by
the UK and Swiss regulators, the case was concluded
with findings that systems and controls at UBS were
“seriously defective.” 2 As a result, Mr. Adoboli, a
relatively junior trader, was able to take highly risky
positions with vast amounts of money. More alarm-
ingly, all three of Mr. Adoboli’s desk colleagues
admitted that they knew more or less of his unau-
thorized trades. Moreover, Mr. Adoboli’s two bosses
had shown a relaxed attitude toward breaching daily
$0
$10
$20
$30
$40
$50
Dec 07 Jun 08 Dec 08
U.S. Tax
Evasion Case
Libor Investigation
Rogue Trader
Sep 15, 2011:$2bn trading loss revealed.
CEO resigned 9 days later.
Jun 09 Dec 09 Jun 10 Dec 10 Jun 11 Dec 11 Jun 12 Dec 12 Jun 13
EXHIBIT MC20.1 / UBS’s Share Prices (12/31/2007–07/02/2013, in $)SOURCE: Authors’ depiction of data from Yahoo Finance, http://finance.yahoo.com.
WWW.YAZDANPRESS.COMWWW.YAZDANPRESS.COM

456 MINICASE 20 UBS’s Billion-Dollar Ethics Scandals
4. What can UBS do to (a) avoid more ethics scandals
in the future and (b) repair its damaged reputation?
Endnotes
1 . “Memo to UBS staff from interim CEO, chairman,” Reuters, September 24, 2011.
2 . “UBS fined £29.7m over rogue trader,” Financial Times, November 26, 2012.
the second half of 2008, UBS instructed its Libor sub-
mitters to keep submissions low to make the bank look
stronger. At least 40 people, including several senior
managers at UBS, were involved in the Libor manipula-
tion. In addition to the fine, UBS Japan pleaded guilty to
U.S. prosecutors for committing wire fraud. UBS ended
the year 2012 with a loss of almost $3 billion, compared
with a profit of $4.5 billion for 2011.
DISCUSSION QUESTIONS
Review Chapter 12: Corporate Governance and Busi-ness Ethics.
1. Mini Case 20 details three ethics scandals at UBS in
recent years. What does that tell you about UBS?
2. Given the UBS ethics failings, who is to blame?
The CEO? The board of directors?
3. What lessons in terms of business ethics and com-
petitive advantage can be drawn from the UBS
scandals, especially comparing the firm’s 2012
and 2011 net income? Looking at Exhibit MC20.1 ,
why do you think the stock market hasn’t reacted
more strongly to the ethics failings?
Sources: This MiniCase is based on UBS Annual Reports, various years;
“Tax haven banks and U.S. tax compliance,” United States Senate, July 17,
2008; “UBS enters into Deferred Prosecution Agreement,” The United States Department of Justice Release, February 18, 2009; “UBS to give 4,450 names
to U.S.,” The Wall Street Journal, August 20, 2009; Cantley, B. G. (2011),
“The U.B.S. case: The U.S. attack on Swiss banking sovereignty,” Brigham Young University International Law & Management Review, Vol. 7, Spring
2011; available at SSRN: http://ssrn.com/abstract51554827; “Rogue trader
causes $2 billion loss at UBS,” Associated Press, September 15, 2011; “End-
ing an era of Swiss banking secrecy: The facts behind FATCA,” American Criminal Law Review, September 18, 2011; “Swiss and U.S. move forward
on tax compliance,” Swissinfo.ch, June 21, 2012; “The LIBOR scandal: The
rotten heart of finance,” The Economist, July 7, 2012; “UBS fined £30m over
rogue trader,” The Guardian, November 26, 2012; “UBS fined £29.7m over
rogue trader,” Financial Times, November 26, 2012; “Final notice to UBS
AG,” Financial Services Authority, December 19, 2012; “Demise of Swiss
banking secrecy heralds new era,” Financial Times, May 19, 2013; and “UBS
ex-official gets 18 months in muni bond-rigging case,” The Wall Street Jour-nal, July 24, 2013.
WWW.YAZDANPRESS.COMWWW.YAZDANPRESS.COM

457
How to Conduct a Case Analysis
The case study is a fundamental learning tool in stra tegic
management. We carefully wrote and chose the cases
in this book to expose you to a wide variety of key con-
cepts, industries, protagonists, and strategic problems.
In simple terms, cases tell the story of a company
facing a strategic dilemma. The firms may be real or
fictional in nature, and the problem may be current or
one that the firm faced in the past. Although the details
of the cases vary, in general they start with a description
of the challenge(s) to be addressed, followed by the his-
tory of the firm up until the decision point, and then
additional information to help you with your analysis.
The strategic dilemma is often faced by a specific man-
ager, who wonders what they should do. To address the
strategic dilemma, you will use the AFI framework to
conduct a case analysis using the tools and concepts
provided in this textbook. After careful analysis, you
will be able to formulate a strategic response and make
recommendations about how to implement it.
Why Do We Use Cases?
Strategy is something that people learn by doing; it
cannot be learned simply by reading a book or lis-
tening carefully in class. While those activities will
help you become more familiar with the concepts and
models used in strategic management, the only way
to improve your skills in analyzing, formulating, and
implementing strategy is to practice. We encourage you to take advantage of the cases
in this text as a “laboratory” in which to experiment
with the strategic management tools you have been
given, so that you can learn more about how, when,
and where they might work in the “real world.” Cases
are valuable because they expose you to a number and
variety of situations in which you can refine your stra-
tegic management skills without worrying about mak-
ing mistakes. The companies in these cases will not
lose profits or fire you if you miscalculate a financial
ratio, misinterpret someone’s intentions, or make an
incorrect prediction about environmental trends.
Cases also invite you to “walk in” and explore many
more kinds of companies in a wider array of industries
than you will ever be able to work at in your lifetime.
In this textbook alone, you will find cases about com-
panies involved in energy infrastructure development
(Siemens), medical products and services (General Elec-
tric), electronic equipment (Apple), computer network-
ing (IBM), sustainability consulting (InterfaceRAISE),
electric cars (Tesla Motors), book retailing (BetterWorld
Books), and consumer products (Cola Wars), to name
just a few. Your personal organizational experiences are
usually much more limited, defined by the jobs held by
your family members or by your own forays into the
working world. Learning about companies involved in so
many different types of products and services may open
up new employment possibilities for you. Diversity also
forces us to think about the ways in which industries (as
well as people) are both similar and yet distinct, and to
critically examine the degree to which lessons learned in
one forum transfer to other settings (i.e., to what degree
are they “generalizable”). In short, cases are a great train-
ing tool, and they are fun to study.
You will find that many of our cases are written
from the perspective of the CEO or general man-
ager responsible for strategic decision making in the
organization. While you do not need to be a member
of a top management team to utilize the strategic-
management process, these senior leaders are usu-
ally responsible for determining strategy in most of
the organizations we study. Importantly, cases allow
us to put ourselves “in the shoes” of strategic leaders
and invite us to view the issues from their perspective.
Having responsibility for the performance of an entire
organization is quite different from managing a single
project team, department, or functional area. Cases
can help you see the b ig picture in a way that most of
us are not accustomed to in our daily, organizational
lives. We recognize that most undergraduate students
and even MBAs do not land immediately in the corpo-
rate boardroom. Yet having a basic understanding of
the types of conversations going on in the boardroom
Case analysis
WWW.YAZDANPRESS.COMWWW.YAZDANPRESS.COM

458 How to Conduct a Case Analysis
we follow the steps of the strategic- management pro-cess. You have any and all of the following models and
frameworks at your disposal:
1. Perform an external environmental analysis of
the:
■ Macrolevel environment (PESTEL analysis)
■ Industry environment (e.g., Porter’s five forces)
■ Competitive environment
2. Perform an internal analysis of the firm using the
resource-based view:
■ What are the firm’s resources, capabilities, and
competencies?
■ Does the firm possess valuable, rare, costly to
imitate resources, and is it organized to capture
value from those resources (VRIO analysis)?
■ What is the firm’s value chain?
3. Analyze the firm’s current business-level and
corporate-level strategies:
■ Business-level strategy (product market
positioning)
■ Corporate-level strategy (diversification)
■ International strategy (geographic scope and
mode of entry)
■ How are these strategies being implemented?
4. Analyze the firm’s performance: ■ Use both financial and market-based measures.
■ How does the firm compare to its competitors
as well as the industry average?
■ What trends are evident over the past three to
five years?
■ Consider the perspectives of multiple stake-
holders (internal and external).
■ Does the firm possess a competitive advan-
tage? If so, can it be sustained?
CALCULATING FINANCIAL RATIOS. Financial
ratio analysis is an important tool for assessing the
outcomes of a firm’s strategy. Although financial per-
formance is not the only relevant outcome measure,
long-term profitability is a necessary precondition for
firms to remain in business and to be able to serve the
needs of all of their stakeholders. Accordingly, at the
end of this introductory module, we have provided a
table of financial measures that can be used to assess
firm performance (see Table 1, pages 463–467).
not only increases your current value as an employee,
but improves your chances of getting there someday,
should you so desire.
Finally, cases help give us a long-term view of the
firms they depict. Corporate history is immensely help -
ful in understanding how a firm got to its present posi-
tion and why people within that organization think the
way they do. Our case authors (both the author of this
book and authors of cases from respected third-party
sources) have spent many hours poring over histori-
cal documents and news reports in order to re-create
each company’s heritage for you, a luxury that most
of us do not have when we are bombarded on a daily
basis with homework, tests, and papers or project
team meetings, deadlines, and reports. We invite you
not just to learn from, but also to savor, reading each
company’s story.
STRATEGIC CASE ANALYSIS. The first step in
analyzing a case is to skim it for the basic facts. As
you read, jot down your notes regarding the following
basic questions:
■ What company or companies is the case about?
■ Who are the principal actors?
■ What are the key events? When and where do they
happen (in other words, what is the timeline)?
Second, go back and reread the case in greater detail,
this time with a focus on defining the problem. Which
facts are relevant and why? Just as a doctor begins by
interviewing the patient (“What hurts?”), you likewise
gather information and then piece the clues together
in order to figure out what is wrong. Your goal at this
stage is to identify the “symptoms” in order to figure
out which “tests” to run in order to make a defini-
tive “diagnosis” of the main “disease.” Only then can
you prescribe a “treatment” with confidence that it
will actually help the situation. Rushing too quickly
through this stage often results in “malpractice” (that
is, giving a patient with an upset stomach an antacid
when she really has the flu), with effects that range
from unhelpful to downright dangerous. The best way
to ensure that you “do no harm” is to analyze the facts
carefully, fighting the temptation to jump right to pro-
posing a solution.
The third step, continuing the medical analogy, is to
determine which analytical tools will help you to most
accurately diagnose the problem(s). Doctors may choose
to run blood tests or take an x-ray. In doing case analysis,
WWW.YAZDANPRESS.COMWWW.YAZDANPRESS.COM

How to Conduct a Case Analysis 459
the what and the why. Using our medical analogy:
The what for a patient with the flu might be antiviral
medication, rest, and lots of fluids. The why: antivirals
attack the virus directly, shortening the duration of ill-
ness; rest enables the body to recuperate naturally; and
fluids are necessary to help the body fight fever and
dehydration. The ultimate goal is to restore the patient to wellness. Similarly, when you are doing case analy-
sis, your task is to figure out what the leaders of the
company should do and why this is an appropriate
course of action. Each part of your proposal should be
justifiable based on your analyses.
One word of caution about the formulation stage:
By nature, humans are predisposed to engage in
“local” and “simplistic” searches for solutions to the
problems they face.1 On the one hand, this can be an
efficient approach to problem solving, because rely-
ing on past experiences (what worked before) does
not “waste time reinventing the wheel.” The purpose
of doing case analysis, however, is to look past the
easy answers and to help us figure out not just “what
works” (satisficing) but what might be the best answer
(optimizing). In other words, do not just take the first
idea that comes to your mind and run with it. Instead,
write down that idea for subsequent consideration but
then think about what other solutions might achieve
the same (or even better) results. Some of the most
successful companies engage in scenario planning,
in which they develop several possible outcomes and
estimate the likelihood that each will happen. If their
first prediction turns out to be incorrect, then they
have a “Plan B” ready and waiting to be executed.
Plan for Implementation
The final step in the AFI framework is to develop a
plan for implementation. Under formulation, you came
up with a proposal, tested it against alternatives, and
used your research to support why it provides the best
solution to the problem at hand. To demonstrate its fea-
sibility, however, you must be able to explain how to put it into action. Consider the following questions:
1. What activities need to be performed? The value
chain is a very useful tool when you need to fig-
ure out how different parts of the company are
likely to be affected. What are the implications
of your plan with respect to both primary activi-
ties (e.g., operations and sales/marketing/service)
and support activities (e.g., human resources and
infrastructure)?
All of the following aspects of performance should
be considered, because each provides a different type
of information about the financial health of the firm:
■ Profit ratios—how efficiently a company utilizes
its resources.
■ Activity ratios—how effectively a firm manages
its assets.
■ Leverage ratios—the degree to which a firm relies
on debt versus equity (capital structure).
■ Liquidity ratios—a firm’s ability to pay off its
short-term obligations.
■ Market ratios—returns earned by shareholders
who hold company stock.
MAKING THE DIAGNOSIS. With all of this
information in hand, you are finally ready to make a “ diagnosis.” Describe the problem(s) or opportunity(ies)
facing the firm at this point in time and/or in the near
future. How are they interrelated? (For example, a runny
nose, fever, stomach upset, and body aches are all indic-
ative of the flu.) Support your conclusions with data
generated from your analyses.
The following general themes may be helpful to
consider as you try to pull all the pieces together into
a cohesive summary:
■ Are the firm’s value chain (primary and support)
activities mutually reinforcing?
■ Do the firm’s resources and capabilities fit with the
demands of the external environment?
■ Does the firm have a clearly defined strategy that
will create a competitive advantage?
■ Is the firm making good use of its strengths and
taking full advantage of its opportunities?
■ Does the firm have serious weaknesses or face sig-
nificant threats that need to be mitigated?
Keep in mind that “problems” can be positive (how
to manage increased demand) as well as negative
(declining stock price) in nature. Even firms that are
currently performing well need to figure out how to
maintain their success in an ever-changing and highly
competitive global business environment.
Formulation: Proposing Feasible
Solutions
When you have the problem figured out (your diag-
nosis), the next step is to propose a “treatment plan”
or solution. There are two parts to the treatment plan:
WWW.YAZDANPRESS.COMWWW.YAZDANPRESS.COM

460 How to Conduct a Case Analysis
Things to Keep in Mind While
Doing Case Analysis
While some solutions are clearly better than others,
it is important to remember that there is no single,
correct answer to any case. Unlike an optimization
equation or accounting spreadsheet, cases cannot be
reduced to a mathematical formula. Formulating and
implementing strategy involves people, and working
with people is inherently messy. Thus, the best way to
get the maximum value from the case-analysis process
is to maintain an open mind and carefully consider the
strengths and weaknesses of all of the options. Strat-
egy is an iterative process, and it is important not to
rush to a premature conclusion.
For some cases, your instructor may be able to
share with you what the company actually did, but that
does not necessarily mean it was the best course of
action. Too often students find out what happened in
the “real world” and their creative juices stop flow-
ing. Whether due to lack of information, experience,
or time, companies quite often make the most expedi-
ent decision. With your access to additional data and
time to conduct more detailed analyses, you may very
well arrive at a different (and better) conclusion. Stand
by your findings as long as you can support them
with solid research data. Even Fortune 500 companies
make mistakes.
Unfortunately, to their own detriment, students
some times discount the value of cases based on fic-
tional scenarios or set some time in the past. One
significant advantage of fictional cases is that every-
body has access to the same information. Not only
does this “level the playing field,” but it prevents
you from being unduly biased by actual events, thus
cutting short your own learning process. Similarly,
just because a case occurred in the past does not
mean it is no longer relevant. The players and tech-
nology may change over time, but many questions
that businesses face are timeless in nature: how
to adapt to a changing environment, the best way
to compete against other firms, and whether and
how to expand.
Case Limitations
As powerful a learning tool as case analysis can be,
it does come with some limitations. One of the most
important for you to be aware of is that case analysis
2. What is the timeline? What steps must be taken
first and why? Which ones are most critical?
Which activities can proceed simultaneously, and
which ones are sequential in nature? How long is
your plan going to take?
3. How are you going to finance your proposal? Does
the company have adequate cash on hand, or does
it need to consider debt and/or equity financing?
How long until your proposal breaks even and
pays for itself?
4. What outcomes is your plan likely to achieve?
Provide goals that are “SMART”: specific, mea-
surable, achievable, realistic, and timely in nature.
Make a case for how your plan will help the firm
to achieve a strategic competitive advantage.
In-Class Discussion
Discussing your ideas in class is often the most valu-
able part of a case study. Your professor will moderate
the class discussion, guiding the AFI process and ask-
ing probing questions when necessary. Case discussion
classes are most effective and interesting when every-
body comes prepared and participates in the exchange.
Actively listen to your fellow students; mutual
respect is necessary in order to create an open and
inviting environment in which people feel comfortable
sharing their thoughts with one another. This does not
mean you need to agree with what everyone else is say-
ing, however. Everyone has unique perspectives and
biases based on differences in life experiences, educa-
tion and training, values, and goals. As a result, no two
people will interpret the same information in exactly
the same way. Be prepared to be challenged, as well as
to challenge others, to consider the case from another
vantage point. Conflict is natural and even beneficial as
long as it is managed in constructive ways.
Throughout the discussion, you should be pre-
pared to support your ideas based on the analyses you
conducted. Even students who agree with you on the
general steps to be taken may disagree on the order of
importance. Alternatively, they may like your plan in
principle but argue that it is not feasible for the com-
pany to accomplish. You should not be surprised if
others come up with an altogether different diagno-
sis and prescription. For better or worse, a good idea
does not stand on its own merit—you must be able to
convince your peers of its value by backing it up with
sound logic and support.
WWW.YAZDANPRESS.COMWWW.YAZDANPRESS.COM

How to Conduct a Case Analysis 461
Finally, our business culture also places a high pre-
mium on benchmarking and best practices. Although
we present you with a sample of firms that we believe
are worthy of in-depth study, we would again caution
you against uncritical adoption of their activities in
the hope of emulating their achievements. Even when
a management practice has broad applications, strat-
egy involves far more than merely copying the indus-
try leader. The company that invents a best practice
is already far ahead of its competitors on the learning
curve, and even if other firms do catch up, the best
they can usually hope for is to match (but not exceed)
the original firm’s success. By all means, learn as
much as you can from whomever you can, but use
that information to strengthen your organization’s own
strategic identity.
Frequently Asked Questions
about Case Analysis
1. Is it okay to utilize outside materials?
Ask your professor. Some instructors utilize cases
as a springboard for analysis and will want you to look
up more recent financial and other data. Others may
want you to base your analysis on the information
from the case only, so that you are not influenced by
the actions actually taken by the company.
2. Is it okay to talk about the case with other students?
Again, you should check with your professor, but
many will strongly encourage you to meet and talk
about the case with other students as part of your prep-
aration process. The goal is not to come to a group
consensus, but to test your ideas in a small group
setting and revise them based on the feedback you
receive.
3. Is it okay to contact the company for more information?
If your professor permits you to gather outside
information, you may want to consider contacting the
company directly. If you do so, it is imperative that
you represent yourself and your school in the most
professional and ethical manner possible. Explain
to them that you are a student studying the firm and
that you are seeking additional information, with your
instructor’s permission. Our experience is that some
companies are quite receptive to student inquiries;
others are not. You cannot know how a particular com-
pany will respond unless you try.
relies on a process known as inductive reasoning, in
which you study specific business cases in order to
derive general principles of management. Intuitively,
we rely on inductive reasoning across almost every
aspect of our lives. We know that we need oxygen to
survive, so we assume that all living organisms need
oxygen. Similarly, if all the swans we have ever seen
are white, we extrapolate this to mean that all swans
are white. While such relationships are often built
upon a high degree of probability, it is important to
remember that they are not empirically proven. We
have in fact discovered life forms (microorganisms)
that rely on sulfur instead of oxygen. Likewise, just
because all the swans you have seen have been white,
black swans do exist.
What does this caution mean with respect to case
analysis? First and foremost, do not assume that just
because one company utilized a joint venture to com-
mercialize a new innovation, another company will
be successful employing the same strategy. The first
company’s success may not be due to the particular
organizational form it selected; it might instead be a
function of its competencies in managing interfirm
relationships or the particularities of the external
environment. Practically speaking, this is why the
analysis step is so fundamental to good strategic man-
agement. Careful research helps us to figure out all
of the potential contributing factors and to formulate
hypotheses about which ones are most likely critical
to success. Put another way, what happens at one firm
does not necessarily generalize to others. However,
solid analytical skills go a long way toward enabling
you to make informed, educated guesses about when
and where insights gained from one company have
broader applications.
In addition, we have a business culture that tends
to put on a pedestal high-performance firms and their
leaders. Critical analysis is absolutely essential in
order to discern the reasons for such firms’ success.
Upon closer inspection, we have sometimes found that
their image is more a mirage than a direct reflection
of sound business practices. Many business analysts
have been taken in by the likes of Enron, WorldCom,
and Bernie Madoff, only to humbly retract their praise
when the company’s shaky foundation crumbles. We
selected many of the firms in these cases because of
their unique stories and positive performance, but we
would be remiss if we let students interpret their pres-
ence in this book as a whole-hearted endorsement of
all of their business activities.
WWW.YAZDANPRESS.COMWWW.YAZDANPRESS.COM

462 How to Conduct a Case Analysis
facts from the case. You can assume that your profes-
sor has read the case carefully. What he or she is most
interested in is your analysis of the situation and your
rationale for choosing a particular solution.
Endnotes
1. Cyert, R. M., and March, J. G. (2001), A Behavioral Theory of the Firm, 2nd ed. (Malden, MA: Blackwell Publishers Inc.).
4. What should I include in my case analysis report?
Instructors generally provide their own guidelines
regarding content and format, but a general outline
for a case analysis report is as follows: (1) analysis
of the problem; (2) proposal of one or more alterna-
tive solutions; and (3) justification for which solution
you believe is best and why. The most important thing
to remember is not to waste precious space repeating
WWW.YAZDANPRESS.COMWWW.YAZDANPRESS.COM
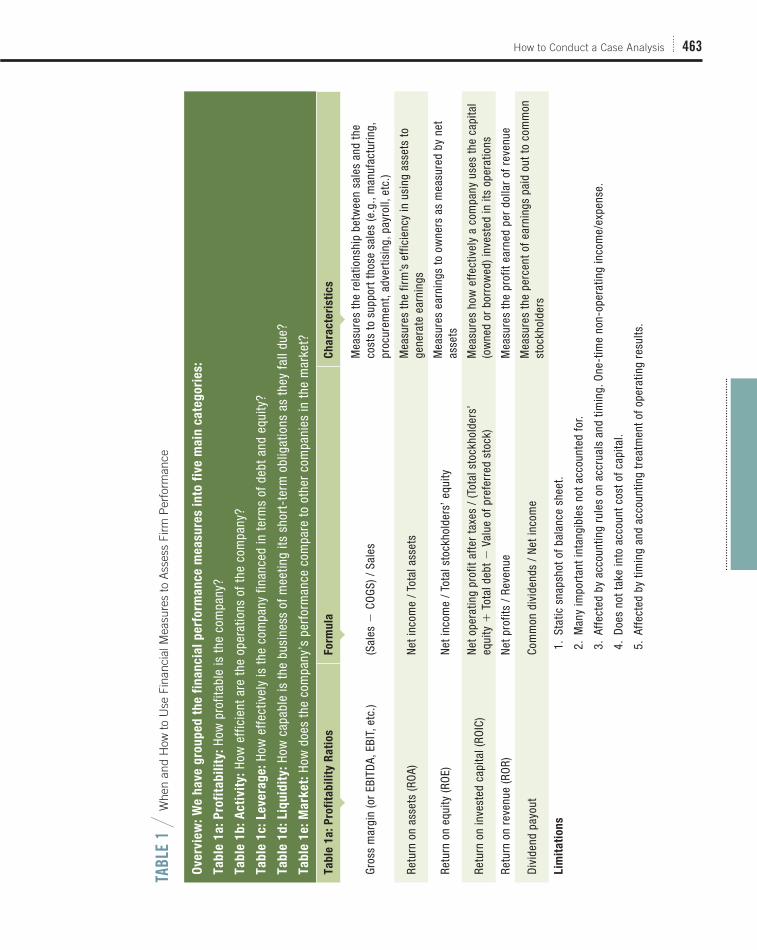
How to Conduct a Case Analysis 463
Ove
rvie
w:
We
ha
ve
gro
up
ed
th
e f
ina
nc
ial
pe
rfo
rma
nc
e m
ea
su
res i
nto
fiv
e m
ain
ca
teg
ori
es:
Ta
ble
1a
: P
rofi
tab
ilit
y:
How
pro
fitab
le is
the
com
pany
?
Ta
ble
1b
: A
cti
vit
y:
How
eff
icie
nt a
re th
e op
erat
ions
of t
he c
ompa
ny?
Ta
ble
1c
: L
eve
rag
e:
How
eff
ectiv
ely
is th
e co
mpa
ny fi
nanc
ed in
term
s of
deb
t and
equ
ity?
Ta
ble
1d
: L
iqu
idit
y:
How
cap
able
is th
e bu
sine
ss o
f mee
ting
its s
hort
-ter
m o
blig
atio
ns a
s th
ey fa
ll du
e?
Ta
ble
1e
: M
ark
et:
How
doe
s th
e co
mpa
ny’s
per
form
ance
com
pare
to o
ther
com
pani
es in
the
mar
ket?
Ta
ble
1a
: P
rofi
tab
ilit
y R
ati
os
Fo
rmu
laC
ha
rac
teri
sti
cs
Gros
s m
argi
n (o
r EB
ITD
A, E
BIT,
etc
.)(S
ales
2 C
OGS
) / S
ales
Mea
sure
s th
e re
latio
nshi
p be
twee
n sa
les
and
the
cost
s to
sup
port
thos
e sa
les
(e.g
., m
anuf
actu
ring,
pr
ocur
emen
t, ad
vert
isin
g, p
ayro
ll, e
tc.)
Retu
rn o
n as
sets
(RO
A)N
et in
com
e / T
otal
ass
ets
Mea
sure
s th
e fir
m’s
eff
icie
ncy
in u
sing
ass
ets
to
gene
rate
ear
ning
s
Retu
rn o
n eq
uity
(RO
E)N
et in
com
e / T
otal
sto
ckho
lder
s’ e
quity
Mea
sure
s ea
rnin
gs to
ow
ners
as
mea
sure
d by
net
as
sets
Retu
rn o
n in
vest
ed c
apita
l (RO
IC)
Net
ope
ratin
g pr
ofit
afte
r ta
xes
/ (T
otal
sto
ckho
lder
s’
equi
ty 1
Tot
al d
ebt 2
Val
ue o
f pre
ferr
ed s
tock
)M
easu
res
how
eff
ectiv
ely
a co
mpa
ny u
ses
the
capi
tal
(ow
ned
or b
orro
wed
) inv
este
d in
its
oper
atio
ns
Retu
rn o
n re
venu
e (R
OR)
Net
pro
fits
/ Re
venu
eM
easu
res
the
prof
it ea
rned
per
dol
lar
of r
even
ue
Div
iden
d pa
yout
Com
mon
div
iden
ds /
Net
inco
me
Mea
sure
s th
e pe
rcen
t of e
arni
ngs
paid
out
to c
omm
on
stoc
khol
ders
Lim
ita
tio
ns
1.
Sta
tic s
naps
hot o
f bal
ance
she
et.
2.
Man
y im
port
ant i
ntan
gibl
es n
ot a
ccou
nted
for.
3.
Aff
ecte
d by
acc
ount
ing
rule
s on
acc
rual
s an
d tim
ing.
One
-tim
e no
n-op
erat
ing
inco
me/
expe
nse.
4.
Doe
s no
t tak
e in
to a
ccou
nt c
ost o
f cap
ital.
5.
Aff
ecte
d by
tim
ing
and
acco
untin
g tr
eatm
ent o
f ope
ratin
g re
sults
.
TAB
LE 1
/ W
hen
and
How
to U
se F
inan
cial
Mea
sure
s to
Ass
ess
Firm
Per
form
ance
WWW.YAZDANPRESS.COMWWW.YAZDANPRESS.COM
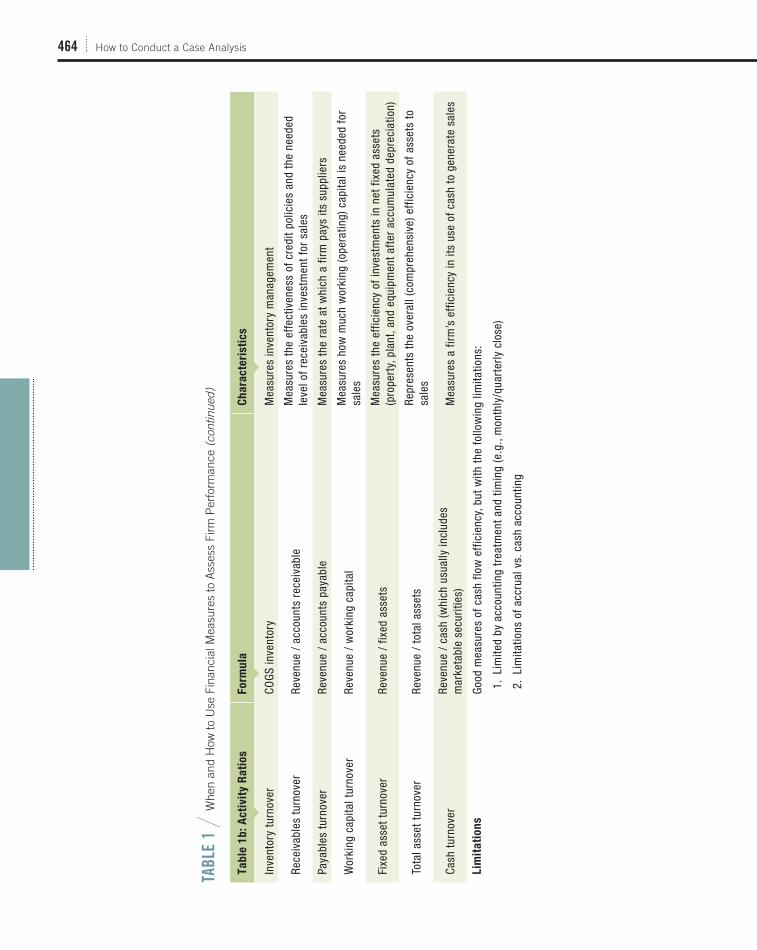
464 How to Conduct a Case Analysis
Ta
ble
1b
: A
cti
vit
y R
ati
os
Fo
rmu
laC
ha
rac
teri
sti
cs
Inve
ntor
y tu
rnov
erCO
GS in
vent
ory
Mea
sure
s in
vent
ory
man
agem
ent
Rece
ivab
les
turn
over
Reve
nue
/ ac
coun
ts r
ecei
vabl
eM
easu
res
the
effe
ctiv
enes
s of
cre
dit p
olic
ies
and
the
need
ed
leve
l of r
ecei
vabl
es in
vest
men
t for
sal
es
Paya
bles
turn
over
Reve
nue
/ ac
coun
ts p
ayab
leM
easu
res
the
rate
at w
hich
a fi
rm p
ays
its s
uppl
iers
Wor
king
cap
ital t
urno
ver
Reve
nue
/ w
orki
ng c
apita
lM
easu
res
how
muc
h w
orki
ng (o
pera
ting)
cap
ital i
s ne
eded
for
sale
s
Fixe
d as
set t
urno
ver
Reve
nue
/ fix
ed a
sset
sM
easu
res
the
effic
ienc
y of
inve
stm
ents
in n
et fi
xed
asse
ts
(pro
pert
y, p
lant
, and
equ
ipm
ent a
fter
acc
umul
ated
dep
reci
atio
n)
Tota
l ass
et tu
rnov
erRe
venu
e /
tota
l ass
ets
Repr
esen
ts th
e ov
eral
l (co
mpr
ehen
sive
) eff
icie
ncy
of a
sset
s to
sa
les
Cash
turn
over
Reve
nue
/ ca
sh (w
hich
usu
ally
incl
udes
m
arke
tabl
e se
curit
ies)
M
easu
res
a fir
m’s
eff
icie
ncy
in it
s us
e of
cas
h to
gen
erat
e sa
les
Lim
ita
tio
ns
Good
mea
sure
s of
cas
h flo
w e
ffic
ienc
y, b
ut w
ith th
e fo
llow
ing
limita
tions
:
1.
Lim
ited
by a
ccou
ntin
g tr
eatm
ent a
nd ti
min
g (e
.g.,
mon
thly
/qua
rter
ly c
lose
)
2.
Lim
itatio
ns o
f acc
rual
vs.
cas
h ac
coun
ting
TAB
LE 1
/ W
hen
and
How
to U
se F
inan
cial
Mea
sure
s to
Ass
ess
Firm
Per
form
ance
(con
tinue
d)
WWW.YAZDANPRESS.COMWWW.YAZDANPRESS.COM
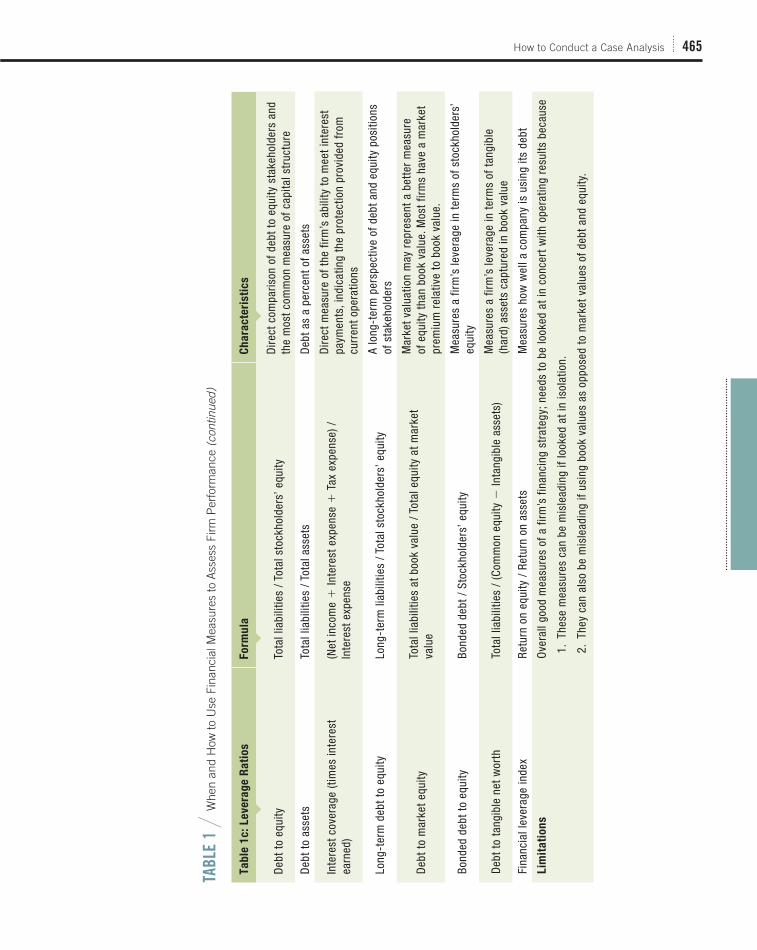
How to Conduct a Case Analysis 465
Ta
ble
1c
: L
eve
rag
e R
ati
os
Fo
rmu
laC
ha
rac
teri
sti
cs
Deb
t to
equi
tyTo
tal l
iabi
litie
s / T
otal
sto
ckho
lder
s’ e
quity
Dire
ct c
ompa
rison
of d
ebt t
o eq
uity
sta
keho
lder
s an
d th
e m
ost c
omm
on m
easu
re o
f cap
ital s
truc
ture
Deb
t to
asse
tsTo
tal l
iabi
litie
s / T
otal
ass
ets
Deb
t as
a pe
rcen
t of a
sset
s
Inte
rest
cov
erag
e (ti
mes
inte
rest
ea
rned
)(N
et in
com
e 1
Inte
rest
exp
ense
1 T
ax e
xpen
se) /
In
tere
st e
xpen
se
Dire
ct m
easu
re o
f the
firm
’s a
bilit
y to
mee
t int
eres
t pa
ymen
ts, i
ndic
atin
g th
e pr
otec
tion
prov
ided
from
cu
rren
t ope
ratio
ns
Long
-ter
m d
ebt t
o eq
uity
Long
-ter
m li
abili
ties
/ Tot
al s
tock
hold
ers’
equ
ityA
long
-ter
m p
ersp
ectiv
e of
deb
t and
equ
ity p
ositi
ons
of s
take
hold
ers
Deb
t to
mar
ket e
quity
Tota
l lia
bilit
ies
at b
ook
valu
e / T
otal
equ
ity a
t mar
ket
valu
e
Mar
ket v
alua
tion
may
rep
rese
nt a
bet
ter
mea
sure
of
equ
ity th
an b
ook
valu
e. M
ost f
irms
have
a m
arke
t pr
emiu
m r
elat
ive
to b
ook
valu
e.
Bond
ed d
ebt t
o eq
uity
Bond
ed d
ebt /
Sto
ckho
lder
s’ e
quity
Mea
sure
s a
firm
’s le
vera
ge in
term
s of
sto
ckho
lder
s’
equi
ty
Deb
t to
tang
ible
net
wor
thTo
tal l
iabi
litie
s /
(Com
mon
equ
ity 2
Inta
ngib
le a
sset
s)M
easu
res
a fir
m’s
leve
rage
in te
rms
of ta
ngib
le
(har
d) a
sset
s ca
ptur
ed in
boo
k va
lue
Fina
ncia
l lev
erag
e in
dex
Retu
rn o
n eq
uity
/ R
etur
n on
ass
ets
Mea
sure
s ho
w w
ell a
com
pany
is u
sing
its
debt
Lim
ita
tio
ns
Ove
rall
good
mea
sure
s of
a fi
rm’s
fina
ncin
g st
rate
gy; n
eeds
to b
e lo
oked
at i
n co
ncer
t with
ope
ratin
g re
sults
bec
ause
1.
The
se m
easu
res
can
be m
isle
adin
g if
look
ed a
t in
isol
atio
n.
2.
The
y ca
n al
so b
e m
isle
adin
g if
usin
g bo
ok v
alue
s as
opp
osed
to m
arke
t val
ues
of d
ebt a
nd e
quity
.
TAB
LE 1
/ W
hen
and
How
to U
se F
inan
cial
Mea
sure
s to
Ass
ess
Firm
Per
form
ance
(con
tinue
d)
WWW.YAZDANPRESS.COMWWW.YAZDANPRESS.COM
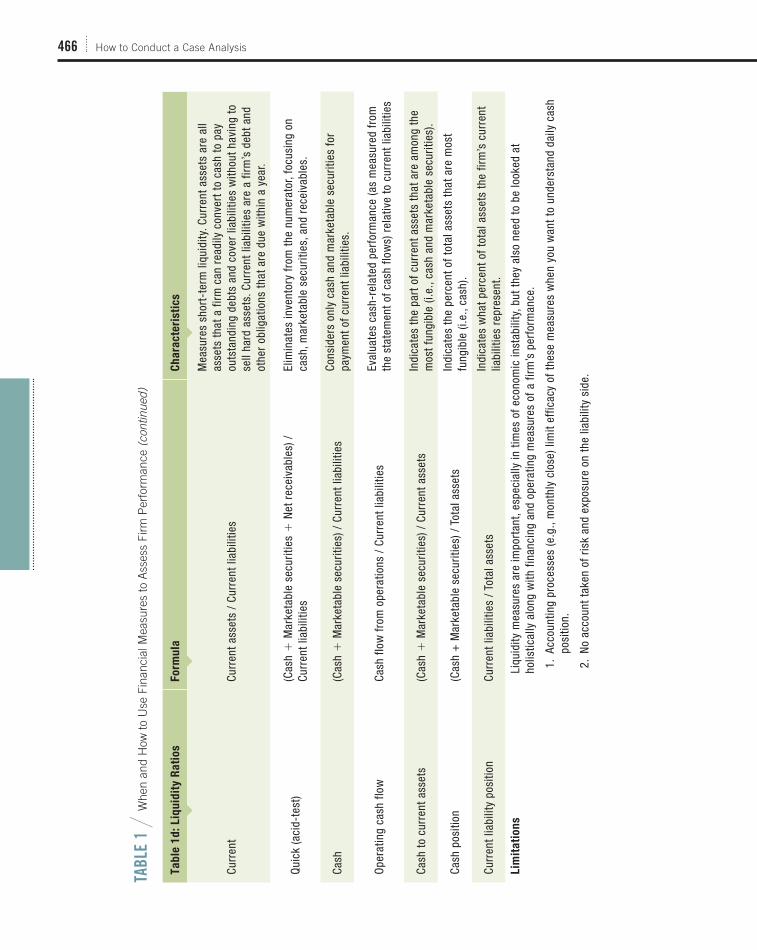
466 How to Conduct a Case Analysis
Ta
ble
1d
: L
iqu
idit
y R
ati
os
Fo
rmu
laC
ha
rac
teri
sti
cs
Curr
ent
Curr
ent a
sset
s /
Curr
ent l
iabi
litie
s
Mea
sure
s sh
ort-
term
liqu
idity
. Cur
rent
ass
ets
are
all
asse
ts th
at a
firm
can
rea
dily
con
vert
to c
ash
to p
ay
outs
tand
ing
debt
s an
d co
ver
liabi
litie
s w
ithou
t hav
ing
to
sell
hard
ass
ets.
Cur
rent
liab
ilitie
s ar
e a
firm
’s d
ebt a
nd
othe
r ob
ligat
ions
that
are
due
with
in a
yea
r.
Qui
ck (a
cid-
test
)(C
ash
1 M
arke
tabl
e se
curit
ies
1 N
et r
ecei
vabl
es) /
Cu
rren
t lia
bilit
ies
Elim
inat
es in
vent
ory
from
the
num
erat
or, f
ocus
ing
on
cash
, mar
keta
ble
secu
ritie
s, a
nd r
ecei
vabl
es.
Cash
(Cas
h 1
Mar
keta
ble
secu
ritie
s) /
Cur
rent
liab
ilitie
sCo
nsid
ers
only
cas
h an
d m
arke
tabl
e se
curit
ies
for
paym
ent o
f cur
rent
liab
ilitie
s.
Ope
ratin
g ca
sh fl
owCa
sh fl
ow fr
om o
pera
tions
/ C
urre
nt li
abili
ties
Eval
uate
s ca
sh-r
elat
ed p
erfo
rman
ce (a
s m
easu
red
from
th
e st
atem
ent o
f cas
h flo
ws)
rel
ativ
e to
cur
rent
liab
ilitie
s
Cash
to c
urre
nt a
sset
s(C
ash
1 M
arke
tabl
e se
curit
ies)
/ C
urre
nt a
sset
sIn
dica
tes
the
part
of c
urre
nt a
sset
s th
at a
re a
mon
g th
e m
ost f
ungi
ble
(i.e.
, cas
h an
d m
arke
tabl
e se
curit
ies)
.
Cash
pos
ition
(Cas
h +
Mar
keta
ble
secu
ritie
s) /
Tot
al a
sset
sIn
dica
tes
the
perc
ent o
f tot
al a
sset
s th
at a
re m
ost
fung
ible
(i.e
., ca
sh).
Curr
ent l
iabi
lity
posi
tion
Curr
ent l
iabi
litie
s / T
otal
ass
ets
Indi
cate
s w
hat p
erce
nt o
f tot
al a
sset
s th
e fir
m’s
cur
rent
lia
bilit
ies
repr
esen
t.
Lim
ita
tio
ns
Liqu
idity
mea
sure
s ar
e im
port
ant,
espe
cial
ly in
tim
es o
f eco
nom
ic in
stab
ility
, but
they
als
o ne
ed to
be
look
ed a
t ho
listic
ally
alo
ng w
ith fi
nanc
ing
and
oper
atin
g m
easu
res
of a
firm
’s p
erfo
rman
ce.
1.
Acc
ount
ing
proc
esse
s (e
.g.,
mon
thly
clo
se) l
imit
effic
acy
of th
ese
mea
sure
s w
hen
you
wan
t to
unde
rsta
nd d
aily
cas
h po
sitio
n.
2.
No
acco
unt t
aken
of r
isk
and
expo
sure
on
the
liabi
lity
side
.
TAB
LE 1
/ W
hen
and
How
to U
se F
inan
cial
Mea
sure
s to
Ass
ess
Firm
Per
form
ance
(con
tinue
d)
WWW.YAZDANPRESS.COMWWW.YAZDANPRESS.COM

How to Conduct a Case Analysis 467
Ta
ble
1e
: M
ark
et
Ra
tio
sF
orm
ula
Ch
ara
cte
risti
cs
Book
val
ue p
er s
hare
To
tal s
tock
hold
ers’
equ
ity /
Num
ber
of s
hare
s ou
tsta
ndin
gEq
uity
or
net a
sset
s, a
s m
easu
red
on th
e ba
lanc
e sh
eet
Earn
ings
-bas
ed g
row
th m
odel
s P
5 k
E /
(r 2
g),
whe
re E
5 e
arni
ngs,
k 5
div
iden
d pa
yout
rat
e, r
5 d
isco
unt r
ate,
and
g 5
ear
ning
s gr
owth
rat
e
Valu
atio
n m
odel
s th
at d
isco
unt e
arni
ngs
and
divi
dend
s by
a d
isco
unt r
ate
adju
sted
for
futu
re
earn
ings
gro
wth
Mar
ket-
to-b
ook
(Sto
ck p
rice
3 N
umbe
r of
sha
res
outs
tand
ing)
/ T
otal
st
ockh
olde
rs’ e
quity
M
easu
res
acco
untin
g-ba
sed
equi
ty
Pric
e-ea
rnin
gs (P
E) r
atio
Stoc
k pr
ice
/ EP
SM
easu
res
mar
ket p
rem
ium
pai
d fo
r ea
rnin
gs a
nd
futu
re e
xpec
tatio
ns
Pric
e-ea
rnin
gs g
row
th (P
EG) r
atio
PE /
Ear
ning
s gr
owth
rat
ePE
com
pare
d to
ear
ning
s gr
owth
rat
es, a
mea
sure
of
PE
“rea
sona
blen
ess”
Sale
s-to
-mar
ket v
alue
Sale
s /
(Sto
ck p
rice
3 N
umbe
r of
sha
res
outs
tand
ing)
A sa
les
activ
ity r
atio
bas
ed o
n m
arke
t pric
e
Div
iden
d yi
eld
Div
iden
ds p
er s
hare
/ S
tock
pric
eD
irect
cas
h re
turn
on
stoc
k in
vest
men
t
Tota
l ret
urn
to s
hare
hold
ers
Stoc
k pr
ice
appr
ecia
tion
plus
div
iden
ds
Lim
ita
tio
ns
Mar
ket m
easu
res
tend
to b
e m
ore
vola
tile
than
acc
ount
ing
mea
sure
s bu
t als
o pr
ovid
e a
good
per
spec
tive
on th
e ov
eral
l hea
lth o
f a c
ompa
ny w
hen
used
hol
istic
ally
with
the
othe
r m
easu
res
of fi
nanc
ial p
erfo
rman
ce.
1.
Mar
ket v
olat
ility
/noi
se is
the
bigg
est c
halle
nge
with
thes
e m
easu
res.
2.
Und
erst
andi
ng w
hat i
s a
resu
lt of
a fi
rm s
trat
egy/
deci
sion
vs.
the
broa
der
mar
ket i
s ch
alle
ngin
g.
TAB
LE 1
/ W
hen
and
How
to U
se F
inan
cial
Mea
sure
s to
Ass
ess
Firm
Per
form
ance
(con
tinue
d)
WWW.YAZDANPRESS.COMWWW.YAZDANPRESS.COM

468
CHAPTER 1
p. 3, 19: ©KIM HONG-JI/Reuters/
Corbis
p. 4: ©Laughing Stock/Corbis
p. 7: ©Jeff Carlick/Bloomberg via
Getty Images
p. 10: ©Krys Bailey/Alamy
CHAPTER 2
p. 29, 48: ©Neville Elder/Corbis
p. 31: ©Najlah Feanny/Corbis
p. 36: Photo by The Star-Ledger
p. 46: ©David Lee/Alamy
CHAPTER 3
p. 57, 88: Courtesy of Tesla Motors
p. 61: ©VStock LLC/Getty Images RF
p. 69: Photo by Robert Scoble/
Licensed under CC BY 3.0/
http://www.flickr.com/photos/
scobleizer/4541965949/sizes/l/in/
photostream
p. 73: Photo by Walmart Corporate/
Licensed under CC BY 3.0/ http://
www.flickr.com/photos/
walmartcorporate/4615944359/
sizes/z/in/photostream
CHAPTER 4
p. 97, 120 ©LUCY NICHOLSON/
Reuters /Landov
p. 98: (l)©Ian Walton/Getty Images,
(r)©epa european pressphoto
agency b.v./Alamy
p. 106: ©Amy Cicconi/Alamy
CHAPTER 5
p. 129, 152: ©STANCA SANDA/
Alamy
p. 133: ©TIMOTHY A. CLARY/
AFP/Getty Images
p. 136: ©Mark Lennihan/AP Images
p. 143: ©Cultura Creative/Alamy RF
CHAPTER 6
p. 163, 189: ©Diego Giudice/Corbis
p. 171: ©Andre Jenny/Alamy
p. 180: ©Fanatic Studio/Getty
Images RF
p. 184: ©ImageZoo/Alamy RF
CHAPTER 7
p. 199, 231: The Wikipedia logo
is a registered trademark of the
Wikimedia Foundation. Photo
of Jimmy Wales by Lane Hart-
well/Licensed under CC BY-SA
3.0/ http://commons.wikimedia.
org/wiki/File:Jimmy_Wales_
July_2010.jpg
p. 211: Photo courtesy of Spanx, Inc.
p. 215: ©Google/AP Images
p. 216: ©Misha Gravenor
Photography
p. 225: Courtesy of GE Healthcare
CHAPTER 8
p. 241, 267: Courtesy of GE
Healthcare
p. 243: ©David Aubrey/Corbis
p. 247: ©Big Pants productions/
Alamy RF
p. 260: (l)Photo by David Villarreal
Fernández/Licensed under CC
BY-SA 2.0/ http://www.flickr.
com/photos/davidvillarreal/
4181282929, (r)Photo by Land
Rover MENA/Licensed by CC BY
2.0/ http://www.flickr.com/photos/
landrovermena/8039141660
CHAPTER 9
p. 277, 296: ©Disney, Todd Anderson/
AP Images
p. 279: ©Steve Kropp/Steve Illustra-
tion Source/Getty Images
p. 282: ©Spark Studio/Imagezoo/
Getty Images RF
p. 286: ©EMMANUEL DUNAND/
AFP/Getty Images
p. 290: ©Images.com/Corbis
CHAPTER 10
p. 307, 332: ©STR/AFP/Getty
Images/Newscom
p. 315: Courtesy of GE Healthcare
p. 319: ©McGraw-Hill Education/
Allison Rocks! Photography RF
CHAPTER 11
p. 343, 367: Photo courtesy of
Zappos and the Delivering
Happiness Team
p. 347: Photo courtesy of
McDonald’s Corporation.
Reprinted with permission
p. 362: ©Joe Raedle/Getty Images
p. 365: Courtesy of RSAnimate
CHAPTER 12
p. 377, 396: ©ChinaFotoPress via
Getty Images
p. 389: Greg Hargreaves/Getty
Images RF
MINICASES
p. 408: Copyright OMEGA SA. All
rights reserved
p. 410: ©Najlah Feanny/Corbis
p. 412: Photo by Syifa Pasutri/
Licensed under CC BY-SA
3.0/ https://picasaweb.google.
com/112795968878031693000/
OBATKUAT#556264502618
5821266
p. 427: Photo by Terry Ross/
Licensed under CC BY 2.0/
http://www.flickr.com/photos/
qnr/3248186753/sizes/l/in/
photostream
p. 449: ©PAUL J. RICHARDS/AFP/
Getty Images
PHOTO CREDITS
WWW.YAZDANPRESS.COMWWW.YAZDANPRESS.COM

I-1
AABB, 29, 174, 293, 312, 324
Abbott Laboratories, 38, 235
ABC, 62, 200, 278, 289, 290
Accenture, 409
Acer, 77, 313
Activision Blizzard, 389
Adelphia Cable, 10
adidas, 99, 266–267, 282–283, 429, 431
Adobe, 151, 235
Advance Auto Parts, 51
Aflac, 51
Airbus, 32, 63, 66, 70, 71–72, 77, 79, 86, 174,
176, 220, 309, 320
Air France, 63
Airtel, 251
AirTran, 82, 279
Alaska Airlines, 84, 85, 104
Albertsons, 62
Alcoa, 173
Aldi, 316
Alibaba Group, The, 35, 48, 51, 319, 446–448
Alisoft, 447
Aliwangwang, 447
Alstom, 317
Alta Velocidad Española (AVE), 74–75
AltaVista, 449
Altek, 251
Amazon.com, 3, 5, 34, 35, 44–45, 51, 60, 65, 83,
101, 102, 107, 109, 137, 138,
157, 171, 180, 200, 204, 206, 219–220, 224,
226, 227, 230, 243, 245, 258,
259, 285, 310, 319, 344, 355, 367, 446,
447, 448
Amazon Instant Video, 201
Amazon Prime, 8
América Móvil, 251
American Airlines, 7, 66, 72, 79, 80, 82, 84–85,
94n, 212, 279
American Eagle Outfitters, 116
American Red Cross, 31
Ameritrade, 83
Amgen, 235
Andreessen Horowitz, 150
Anheuser-Busch InBev, 243, 264
AOL, 235, 296
Apple Inc., 3, 4, 5–6, 10, 12, 19–20, 25n, 40, 41,
64, 69, 70, 77, 80, 82, 83, 101, 102, 103,
107, 112–113, 114, 129–134, 137, 138, 148,
152–154, 175, 185, 187–188, 200, 202, 203,
204, 205, 208, 211, 215, 218, 224, 235, 245,
251, 252, 255, 277, 281, 285, 308, 316, 335,
360, 379, 387, 388, 451–452
ArcelorMittal, 308
Areva, 48, 79
ARM Holdings, 224, 251
Arthur Andersen, 10
Arvind Mills, 383
ASICS, 99
AstraZeneca, 315
AT&T, 70, 72, 103, 150, 171, 209, 227, 235,
251, 252
Audi, 84, 330, 331, 436
Autodesk, 235
AutoNation, 51
Autonomy, 188, 283, 296, 379
AVE (Alta Velocidad Española), 74–75
Avis, 88, 149
Avon, 51
Azul, 7
BBaidu, 35, 123, 319
Bank of America, 261–262, 275n, 296, 385
Bank South, 261
Barnes & Noble, 51, 157, 180, 227
Barnett Bank, 261
BASF, 250
BBC, 327
BCG (Boston Consulting Group), 29, 264
Bentley, 436
Berkshire Hathaway, 9, 258, 259, 444
Bertelsmann, 324, 327
Best Buy, 35, 45, 102, 157, 175, 180, 209, 367
Bethlehem Steel, 254
BetterWorldBooks, 205
Biomet, 78
BlackBerry, 3, 5, 64, 114, 129–134, 152–154,
237n, 251, 252. See also Research in Motion
(RIM)
Black Biz Hookups, 110
Blackstone Group, The, 390
Blockbuster, 8, 209, 226–227
Blue Ribbon Sports, 97
BMW, 57, 62, 84, 146, 169, 171, 183, 330, 331
Body Wrap, 211
Boeing, 11–12, 42, 62, 63, 66, 70, 71–72, 77, 79,
86, 174, 220, 310, 320
Bombardier, 220
Boston Consulting Group (BCG), 29, 264
BP (British Petroleum), 16, 17, 42, 59, 64, 146,
349
Bridgestone, 324
Bristol-Myers, 235
Bristol-Myers Squibb, 293
British Petroleum (BP), 16, 17, 42, 59, 64, 146,
349
Brother, 213
Bugatti, 436
Burberry, 420
Burger King, 62, 78, 248, 443
Busch Entertainment, 264
BYD, 84, 114, 251, 444–445
CCadbury PLC, 280, 281, 391
CalPERS (California Public Employees’ Retire-
ment System), 14, 26nCanon, 222
Caribou Coffee, 68
Carrefour, 317, 413
Casella Wines, 313
Caterpillar, 308, 310
CBS, 62, 200, 389
CBS Records, 451
CEMEX, 74, 308
Chanel, 420
Chaparral, 254
Chevrolet, 112
Chick-fil-A, 78, 256, 257
China Mobile, 103, 251
Chipotle, 78
Chrysler, 35, 57, 68, 80, 278, 444
Circuit City, 102, 209
Cisco Systems, 280, 283, 284, 315
Citi, 51
CitiGroup, 35
City CarShare, 149
CNBC, 391
CNET, 378
CNN, 221, 235
Coca-Cola Company, 14, 40, 48, 77, 101, 103,
253–254, 256, 258, 262, 310, 322, 440
Cole Haan, 267
Colgate-Palmolive, 163
Columbia Pictures, 297
Comcast, 70, 201, 241, 299
Compaq, 34, 188, 205, 378
Compustat, 135nConejo Deals, 109
ConocoPhillips, 51, 254
Continental Airlines, 72, 82, 94n, 104, 212, 279
Converse, 267
Corning, 249, 289
Costco, 170, 253
CountryWide Mortgages, 261
Coursers, 223
Crocs Shoes, 106–107
CSX Railroad, 33
DDaily Pride, 110
Daimler, 57, 149, 278, 330, 331
Dangdang, 448
Darden, 51
De Beers, 70, 173
de Havilland, 220
Dell Inc., 3, 5, 34, 69, 77, 137, 187–189, 200,
202, 224, 256, 360, 367, 390, 391
Delta Air Lines, 7, 66, 72, 79, 80, 82, 84–85, 94n, 104, 212, 254, 279
DePuy, 78
Dhgate, 448
Discovery Communications, 205
Disney, 33–34, 83, 249, 258, 277, 278, 296, 297,
308, 360
Dollar Shave Club, 150, 221
Dollar Store, 180
Dow Chemical, 249, 289
Dow Corning, 249, 289
Dow Venture Capital, 290
DreamWorks Animation SKG, 284
Dropbox, 48, 151
Dr Pepper Snapple Group, 282
DuPont, 250, 346, 348
EEA (Electronic Arts), 409
EachNet, 446–447
EADS, 32
COMPANY NAME INDEXNote: Page numbers followed by n indicate material in chapter endnotes and source notes
WWW.YAZDANPRESS.COMWWW.YAZDANPRESS.COM

I-2 COMPANY NAME INDEX
eBay, 34, 44–45, 48, 51, 60, 69, 205, 206, 226,
247, 310, 379, 446, 447
Ebel, 167
ECB (European Central Bank), 63, 312
Edelman, 382nEDS, 188, 256
Electronic Arts (EA), 409
Eli Lilly, 235, 248, 288, 289, 292, 293, 295, 412
Embraer, 7, 63, 220, 308
Encyclopedia Britannica, 199–200, 204
Enron, 10, 45–46, 51, 394
Enron Wind, 45–46
Enterprise, 149
Ericsson, 209, 251, 252
ESPN, 278
ESPN Deportes, 62
Estee Lauder, 51
E*TRADE, 83, 235
European Central Bank (ECB), 63, 312
Evernote, 151
ExxonMobil, 3, 101, 250, 258–259, 310, 393
FFab, 230
Facebook, 6, 35, 47, 48, 51, 69, 83, 101, 109,
135, 203, 206, 208, 245, 258, 281, 301, 310,
320, 351, 406–407
Family Dollar, 51
FedEx, 33, 51, 60, 77, 144, 206, 235
Fiat, 68, 278
Fisker Automotive, 88, 216
Fitch, 391, 393
FleetBank, 261
Flexees by Maidenform, 211
Flextronics, 251, 252
FMC Corporation, 145
Ford Motor Company, 33, 35, 57, 58, 80, 220,
248, 260, 323
Fortune, 12
Fox, 249, 289, 290
Foxconn, 133, 211, 251, 252, 313, 316–317
Fox Network, 62
Fox News, 221
Fox Sports, 369
Funk & Wagnalls, 199
GGalleon Group, 384
Gannett Company, 354
Gap, The, 157, 317
Gatorade, 262, 282
Gazprom, 308
GE. See General Electric
GE Capital, 241, 242, 265–266, 267
Geely, 84
GE Global Research, 315
GE Healthcare, 224, 225
GEMs, 252
Genentech, 235, 248, 286, 288, 289
General Electric (GE), 3, 9, 15, 31, 34, 40, 45–46,
60, 66, 70, 87, 101, 111, 143, 174, 201, 227,
234, 235, 241, 242, 243, 258, 264, 265–268,
278, 280, 293, 299, 308, 310, 311, 312, 335,
382–383, 387, 388, 389, 421–423
General Motors (GM), 35, 57, 58, 69, 74, 80,
112, 167, 168, 175, 248, 249, 250, 273, 287–
288, 313, 314, 346, 361, 434, 436, 444
Georgia Power, 78
Getaround, 150
Gillette, 38, 150, 163, 220–221, 235, 409
Global Market, 448
Global Sources, 448
GM. See General Motors
GMI Ratings, 391
Goldman Sachs, 384, 392, 393, 394
Gome E-Comm., 448
Goodrich, 66
Google, 3, 5, 6, 14, 19, 34, 35, 45, 46–47, 48,
51, 60, 73, 80, 82, 83, 101, 102–103, 106,
107, 109, 114, 119, 123, 135, 137, 138, 175,
201, 203, 206, 208, 214, 215, 221, 223–224,
226, 238n, 243, 245, 251, 252, 257, 258,
281, 286, 310, 319, 360, 384, 401–402, 406,
424–426, 449–450
Google Plus, 69
Governance Metrics International, 391
Grameen Bank, 383
Green Bay Packers, 369
Greenpeace, 383
Groupe Danone, 293
Groupon, 109
Gucci, 420
HHabitat for Humanity, 383
Haier, 308
Halo Collaboration Studio, 284
H&M, 317
H&R Block, 74, 248
Handspring, 217–218
Hangzhou Wahaha Group, 293
Harley-Davidson, 42, 218, 258, 324, 390
HarperCollins, 285
Harpo Productions, 205, 360
Hasbro, 77
HC360, 448
Hershey Company, The, 51, 235, 281
Hertz, 88, 149
Hewlett-Packard (HP), 3, 5, 10, 34, 69, 77, 107,
150, 187–188, 200, 205, 218, 224, 235, 256,
283, 284, 292, 296, 377–379, 386, 387, 389,
394, 396–397
Hitachi, 209
Home Depot, The 35, 77, 157, 175, 180, 389
Honda, 57, 99–100, 101, 105, 112, 114, 144,
243, 312
Hostess Brands, 13–14
HP. See Hewlett-Packard
HTC, 19, 224, 251–252, 253
Hulu, 8, 201, 249, 289, 290
Hurley, 267
Hyatt Hotels, 60
Hyundai, 35, 57, 115, 223, 312
IIBM, 34, 40, 66, 103, 111, 188, 200, 209, 213,
227, 289, 292, 308, 310, 312, 325, 384
Icos, 293, 412
I-GO, 149
IKEA, 70, 101, 184, 299, 308, 413–415
ImClone, 293
Indy Racing League (IRL), 100
Infosys, 256, 260, 308, 314, 324
Instagram, 281
Intel Corporation, 5, 34, 47, 78, 80, 116, 137,
184, 224, 251, 308, 384, 401
Interface Inc., 147, 168
Inter IKEA, 414
International Monetary Fund (IMF), 63
Intuit, 74
JJabil Circuit, 133, 251
Jaguar, 260
JCPenney, 35, 45, 185–186
Jd, 448
Jdeal, 110
JetBlue Airways, 7, 8, 84, 85, 86, 185
John Deere, 42, 62, 310
Johnson & Johnson, 29, 235, 258, 393
Johnson & Johnson Development Corporation, 290
KKaiser Permanente Ventures, 290
K&L Gates LLC, 111
Kawasaki Heavy Industries, 317
Kayak, 66
Kellogg’s, 409
Kentucky Fried Chicken (KFC), 29, 256, 257,
440–443
Kia, 57, 84, 172, 223, 312
Kimberly-Clark, 38, 163
Kleiner Perkins Caufield & Byers, 103, 150
Kmart, 172, 414
Kraft Foods, 35, 280, 281, 391
Kroger, 38, 62, 170
Kyocera, 250
LLamborghini, 436
Land Rover, 260
LaSalle, 261
LegalZoom, 74, 225
Lehman Brothers, 35, 135
Lenovo, 77, 187–189, 200, 224, 308, 324, 325
Levi Strauss, 313, 322
LexisNexis, 235
LG, 209, 252, 259, 308
LG Display, 251
Lidl, 316
Li Ning Company Ltd., 99, 429–431
LinkedIn, 151, 208, 301, 310, 406
LinkExchange, 449
Linksys, 283
Live Nation, 279
L.L. Bean, 171
Lockheed Martin, 113
Logitech, 311–312
Louis Vuitton, 418–420
Lowe’s, 77, 389
Lucasfilm, 277, 296
LVMH (Moët Hennessy Louis Vuitton S.A.), 3,
62, 418–420
MMacmillan, 285
Macy’s, 186
Made-in-China, 448
Mannesmann, 278
Marlboro, 103
Marriott Corporation, 66, 169
WWW.YAZDANPRESS.COMWWW.YAZDANPRESS.COM
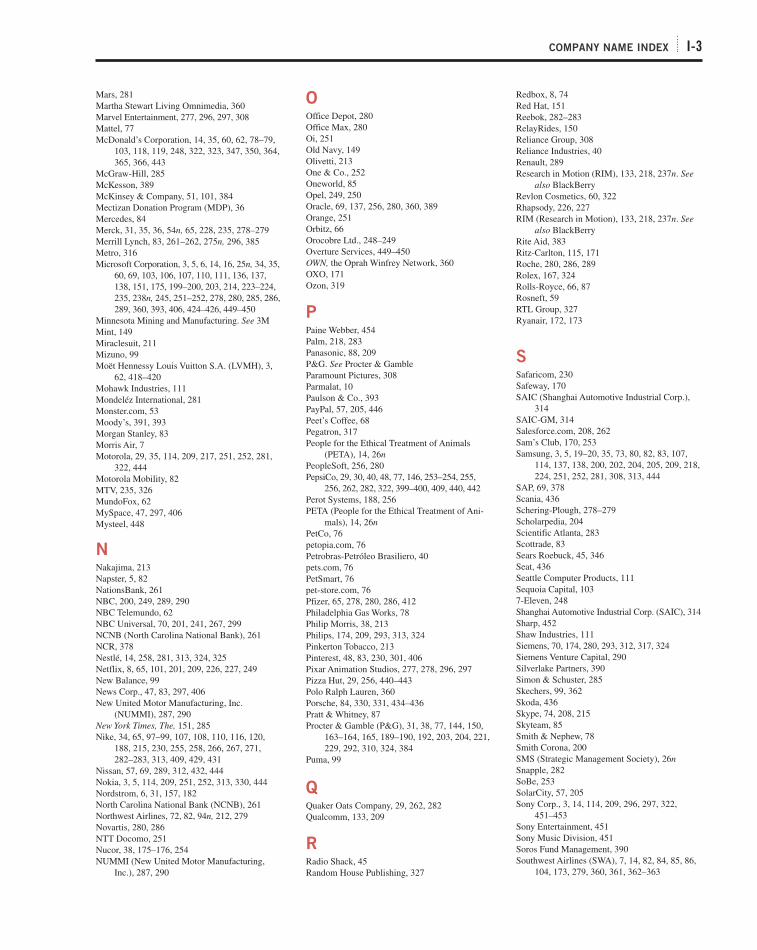
COMPANY NAME INDEX I-3
Mars, 281
Martha Stewart Living Omnimedia, 360
Marvel Entertainment, 277, 296, 297, 308
Mattel, 77
McDonald’s Corporation, 14, 35, 60, 62, 78–79,
103, 118, 119, 248, 322, 323, 347, 350, 364,
365, 366, 443
McGraw-Hill, 285
McKesson, 389
McKinsey & Company, 51, 101, 384
Mectizan Donation Program (MDP), 36
Mercedes, 84
Merck, 31, 35, 36, 54n, 65, 228, 235, 278–279
Merrill Lynch, 83, 261–262, 275n, 296, 385
Metro, 316
Microsoft Corporation, 3, 5, 6, 14, 16, 25n, 34, 35,
60, 69, 103, 106, 107, 110, 111, 136, 137,
138, 151, 175, 199–200, 203, 214, 223–224,
235, 238n, 245, 251–252, 278, 280, 285, 286,
289, 360, 393, 406, 424–426, 449–450
Minnesota Mining and Manufacturing. See 3M
Mint, 149
Miraclesuit, 211
Mizuno, 99
Moët Hennessy Louis Vuitton S.A. (LVMH), 3,
62, 418–420
Mohawk Industries, 111
Mondeléz International, 281
Monster.com, 53
Moody’s, 391, 393
Morgan Stanley, 83
Morris Air, 7
Motorola, 29, 35, 114, 209, 217, 251, 252, 281,
322, 444
Motorola Mobility, 82
MTV, 235, 326
MundoFox, 62
MySpace, 47, 297, 406
Mysteel, 448
NNakajima, 213
Napster, 5, 82
NationsBank, 261
NBC, 200, 249, 289, 290
NBC Telemundo, 62
NBC Universal, 70, 201, 241, 267, 299
NCNB (North Carolina National Bank), 261
NCR, 378
Nestlé, 14, 258, 281, 313, 324, 325
Netflix, 8, 65, 101, 201, 209, 226, 227, 249
New Balance, 99
News Corp., 47, 83, 297, 406
New United Motor Manufacturing, Inc.
(NUMMI), 287, 290
New York Times, The, 151, 285
Nike, 34, 65, 97–99, 107, 108, 110, 116, 120,
188, 215, 230, 255, 258, 266, 267, 271,
282–283, 313, 409, 429, 431
Nissan, 57, 69, 289, 312, 432, 444
Nokia, 3, 5, 114, 209, 251, 252, 313, 330, 444
Nordstrom, 6, 31, 157, 182
North Carolina National Bank (NCNB), 261
Northwest Airlines, 72, 82, 94n, 212, 279
Novartis, 280, 286
NTT Docomo, 251
Nucor, 38, 175–176, 254
NUMMI (New United Motor Manufacturing,
Inc.), 287, 290
OOffice Depot, 280
Office Max, 280
Oi, 251
Old Navy, 149
Olivetti, 213
One & Co., 252
Oneworld, 85
Opel, 249, 250
Oracle, 69, 137, 256, 280, 360, 389
Orange, 251
Orbitz, 66
Orocobre Ltd., 248–249
Overture Services, 449–450
OWN, the Oprah Winfrey Network, 360
OXO, 171
Ozon, 319
PPaine Webber, 454
Palm, 218, 283
Panasonic, 88, 209
P&G. See Procter & Gamble
Paramount Pictures, 308
Parmalat, 10
Paulson & Co., 393
PayPal, 57, 205, 446
Peet’s Coffee, 68
Pegatron, 317
People for the Ethical Treatment of Animals
(PETA), 14, 26nPeopleSoft, 256, 280
PepsiCo, 29, 30, 40, 48, 77, 146, 253–254, 255,
256, 262, 282, 322, 399–400, 409, 440, 442
Perot Systems, 188, 256
PETA (People for the Ethical Treatment of Ani-
mals), 14, 26nPetCo, 76
petopia.com, 76
Petrobras-Petróleo Brasiliero, 40
pets.com, 76
PetSmart, 76
pet-store.com, 76
Pfizer, 65, 278, 280, 286, 412
Philadelphia Gas Works, 78
Philip Morris, 38, 213
Philips, 174, 209, 293, 313, 324
Pinkerton Tobacco, 213
Pinterest, 48, 83, 230, 301, 406
Pixar Animation Studios, 277, 278, 296, 297
Pizza Hut, 29, 256, 440–443
Polo Ralph Lauren, 360
Porsche, 84, 330, 331, 434–436
Pratt & Whitney, 87
Procter & Gamble (P&G), 31, 38, 77, 144, 150,
163–164, 165, 189–190, 192, 203, 204, 221,
229, 292, 310, 324, 384
Puma, 99
QQuaker Oats Company, 29, 262, 282
Qualcomm, 133, 209
RRadio Shack, 45
Random House Publishing, 327
Redbox, 8, 74
Red Hat, 151
Reebok, 282–283
RelayRides, 150
Reliance Group, 308
Reliance Industries, 40
Renault, 289
Research in Motion (RIM), 133, 218, 237n. See also BlackBerry
Revlon Cosmetics, 60, 322
Rhapsody, 226, 227
RIM (Research in Motion), 133, 218, 237n. See also BlackBerry
Rite Aid, 383
Ritz-Carlton, 115, 171
Roche, 280, 286, 289
Rolex, 167, 324
Rolls-Royce, 66, 87
Rosneft, 59
RTL Group, 327
Ryanair, 172, 173
SSafaricom, 230
Safeway, 170
SAIC (Shanghai Automotive Industrial Corp.),
314
SAIC-GM, 314
Salesforce.com, 208, 262
Sam’s Club, 170, 253
Samsung, 3, 5, 19–20, 35, 73, 80, 82, 83, 107,
114, 137, 138, 200, 202, 204, 205, 209, 218,
224, 251, 252, 281, 308, 313, 444
SAP, 69, 378
Scania, 436
Schering-Plough, 278–279
Scholarpedia, 204
Scientific Atlanta, 283
Scottrade, 83
Sears Roebuck, 45, 346
Seat, 436
Seattle Computer Products, 111
Sequoia Capital, 103
7-Eleven, 248
Shanghai Automotive Industrial Corp. (SAIC), 314
Sharp, 452
Shaw Industries, 111
Siemens, 70, 174, 280, 293, 312, 317, 324
Siemens Venture Capital, 290
Silverlake Partners, 390
Simon & Schuster, 285
Skechers, 99, 362
Skoda, 436
Skype, 74, 208, 215
Skyteam, 85
Smith & Nephew, 78
Smith Corona, 200
SMS (Strategic Management Society), 26nSnapple, 282
SoBe, 253
SolarCity, 57, 205
Sony Corp., 3, 14, 114, 209, 296, 297, 322,
451–453
Sony Entertainment, 451
Sony Music Division, 451
Soros Fund Management, 390
Southwest Airlines (SWA), 7, 14, 82, 84, 85, 86,
104, 173, 279, 360, 361, 362–363
WWW.YAZDANPRESS.COMWWW.YAZDANPRESS.COM

I-4 COMPANY NAME INDEX
SpaceX, 57, 205
Spanx, 211
Spar Handels AT, 316
Splunk, 230
Spotify, 151
Sprint, 72, 251, 252
Sproxil, 230
Square, 230
Standard & Poor’s, 135, 137, 391, 393
Staples, 280, 383
Star Alliance, 85
Starbucks, 14, 15, 35, 45, 60, 68, 101, 180, 183,
230, 319, 324, 416–417
Stokely Van Camp, 262
Strategic Management Society (SMS), 26nStryker, 78
Subway, 62, 78, 248
Suning E-Comm., 448
Sun Microsystems, 401
SWA. See Southwest Airlines
Swatch, 167
Swedish Match, 213
Swiss Bank Corporation, 454
TTaco Bell, 29, 256, 440, 442
Taj Hotels Resorts & Palaces, 260
Taobao, 446–448
Target Corporation, 12, 180, 182, 189, 230, 280,
414
Tata Group, 9, 35, 143, 258, 259, 260, 263, 278,
383
Tata Motors, 84
TCS, 260, 314
Teachers Insurance and Annuity Association–
College Retirement Equities Fund (TIAA-
CREF), 14, 26nTeach For America (TFA), 31, 32, 205, 410–411
Tencent E-Comm., 448
Tencent Paipai, 448
Tesla Motors, 57, 58, 60, 64, 68, 69, 88, 101, 168,
203, 205, 216, 290, 432
Texas Instruments, 235
TFA (Teach For America), 31, 32, 205, 410–411
Threadless, 149, 157, 183
3M, 31, 51, 144, 230, 364–365
TIAA-CREF (Teachers Insurance and Annuity
Association–College Retirement Equities
Fund), 14, 26nTicketmaster, 279
Tiffany & Co., 3, 106
Tiger Shoes, 97
Times, 167
Time Warner, 35, 83, 296
Tmall, 446, 447, 448
T-Mobile, 251, 252
TNK, 59
TNK-BP, 59
TOMS Shoes, 205
Toocle, 448
Toshiba, 209
Toyota Motor Corporation, 57, 60, 74, 106,
112, 175, 183, 189, 215, 248–249, 287–
288, 290, 312, 323, 330, 432, 434, 436,
444, 452
Toys “R” Us, 175
Travelocity, 66
Tropicana, 29
Tumblr, 281, 301
Twitter, 48, 83, 208, 301, 406, 408
Tyco International, 10, 385
UUber, 230
UBS, 90–91, 454–456
Udacity, 223
U-Haul, 149
Umbro, 267
Under Armour, 65, 97, 99
Underwood, 200
Unilever, 77, 143, 163, 315
Union Bank of Switzerland, 454
United Airlines, 7, 66, 72, 79, 80, 82, 84–85, 94n, 212, 279
United Technologies, 235
United Way, 111
Univision, 62
UPS, 33, 42, 77, 101, 144, 208, 258
Urban Outfitters, 149
US Airways, 72, 82, 94n, 212, 279
U.S. Steel, 176, 254
USA Today, 354
VVanguard Group, The, 14, 117
Vauxhall, 249, 250
Verizon, 72, 103, 150, 209, 251, 252, 253
Vimeo, 201
Vipshop, 448
Virgin America, 66
Virgin Atlantic, 66, 84, 85
Virgin Group, 35, 66
Vodafone, 251, 278
Volkswagen (VW), 57, 74, 310, 330,
434–435, 436
Vonage, 74
VW. See Volkswagen
WWalgreens, 38
Wall Street Journal, The, 151
Walmart, 6, 8, 14, 31, 34, 51, 57, 70, 73–74, 170,
172, 175, 178, 179, 180, 182, 202, 206, 209,
226, 260, 280, 310, 316, 317, 321, 350, 360,
413, 414, 415
Wang Laboratories, 200
Warner Bros., 209, 296, 299
Waze, 281
WebEx, 283
Weibo, 446
Wendy’s, 78–79
Wertkauf, 316
Weyerhaeuser, 251
Whole Foods Market, 14, 35, 62, 169, 170, 192,
399
Wikipedia, 199–200, 203, 204, 205, 206, 231
Wikipedia Foundation, 199
Wild Oats, 170
W. L. Gore & Associates, 176, 348, 349, 350,
351, 352, 355, 358
Wipro, 314
WorldCom, 10
Wyeth, 278, 280
XXerox, 40, 107–108, 125n, 222
XTO Energy, 258–259
YYahoo!, 35, 281, 286, 345, 447, 449
Yamaha, 258, 259
Yandex, 319
YouTube, 150, 201, 208, 281, 408
Yum! Brands, 256, 257, 440–443
Yum! China, 440–443
ZZappos, 113, 157, 171, 208, 343–344, 346, 348,
349, 350, 351, 355, 359, 360, 362–363, 365,
367, 369, 372
Zara, 313
Zimmer, 78
Zipcar, 149, 150, 151
Zip2, 205
WWW.YAZDANPRESS.COMWWW.YAZDANPRESS.COM
I-5
NAME INDEX
AAbe, Shinzo, 452
Abell, D., 195nAbernathy, W. J., 237nAbrahamson, E., 54nAdner, R., 159n, 236n, 237n, 426nAdoboli, Kweku, 455
Aesop, 434, 436
Afuah, A., 93n, 196n, 274nAgle, B. R., 26nAime, F., 158nAkerlof, George A., 247, 273nAkers, John, 111
Alchian, A., 273nAlexander, J., 158nAlexandre, M. T., 196n, 238n, 373nAllen, Paul, 111
Allen, T. J., 238nAllen, W. B., 93n, 302nAlsop, R., 404nAlt, J., 275nAlvarez, S., 236nAmbani, Mukesh, 40
Amit, R., 125n, 159nAnand, B., 305nAnderson, Chris, 159n, 195n, 225, 226n, 236n,
237n, 238n, 426nAnderson, P., 237nAnderson, R. C., 26n, 93n, 159n, 195nAnderson, Ray, 147
Andrews, P., 126nApotheker, Leo, 378–379, 386, 389, 397
Appleyard, M. M., 238nArgote, L., 195nAriely, D., 403nArmstrong, Lance, 98, 120, 205
Arndt, A., 338nArthaud-Day, M. L., 303nArthur, W. B., 54n, 126n, 236n
BBaetz, M. C., 54nBain, J. S., 93nBaldwin, R., 237nBaliga, B. R., 403nBallmer, Steve, 111, 286, 426, 449, 450, 450nBandiera, O., 37n, 54nBanister, Scott, 449
Barkema, H. G., 338nBarnett, M., 159nBarney, J. B., 125n, 126n, 236n, 372n, 373nBaron, J. N., 373nBart, C. K., 54nBartlett, C. A., 339nBartz, Carol, 286
Baruch, L., 158nBaum, J. A. C., 236nBaum, R. J., 372nBeamish, P. W., 339nBeechy, M., 158nBehar, Howard, 45, 46, 55n, 230, 416nBengtsson, L., 304nBenner, M., 237n
Benson, D., 304nBerle, A., 273n, 402nBernanke, Ben, 275nBernhofen, D., 237nBesanko, D., 93nBettis, R., 93nBezos, Jeff, 35, 107, 204
Bingham, C. B., 236nBirkinshaw, J., 196n, 373nBlakely, Sara, 211
Boeker, W., 304n, 403nBohmer, R. M., 195n–196nBossidy, L., 372nBowen, D., 340nBower, J. L., 54n, 55n, 237nBowerman, Bill, 97
Bowman, Bob, 408
Brandenburger, A. M., 54n, 93n, 237n, 304nBranson, Sir Richard, 35, 66
Breshnahan, T., 302nBreznitz, D., 339nBrickley, J. A., 403nBrin, Sergey, 6, 35, 47, 360, 449
Brown, J. L., 373nBrown, J. S., 338nBrown, S. L., 54n, 55n, 196nBrush, T. H., 302nBryan, L. L., 373nBryan Smith, B., 159nBryant, Kobe, 97, 120
Bryce, D. J., 26nBuchholtz, A. K., 26n, 402nBuckley, P. J., 339nBuffett, Warren, 241, 384, 421, 444
Burck, C., 372nBurgelman, R. A., 54n–55n, 236n, 238nBurns, T., 373nBurns, Ursula, 40
Burt, C., 275nBurton, M. D., 373nBuyukkokten, Orkut, 46
Byers, T. H., 237n
CCairncross, F., 339nCaldwell, D. L., 373nCameron, James, 306
Cameron, W. B., 158nCamp, S. M., 236nCampbell, A., 303nCannella, A. A., 54nCantley, B. G., 454nCapron, Laurence, 294, 295n, 303n,
305nCardinal, L. B., 263n, 275nCarlisle, Peter, 408, 409
Carlton, D. W., 93nCarroll, A. B., 16n, 26n, 402nCaves, R. E., 94n, 337nCeccagnoli, M., 237n, 304nCha, S. Eunyoung, 373nChandler, Alfred D., 346, 372n, 373nChang, S. J., 338n
Chao, G. T., 373nCharan, R., 372nChatman, J. A., 373nChen, M. J., 426nChesbrough, H. W., 125n, 228n, 229n, 237n,
238nChild, J., 372n–373nChristensen, Clayton M., 159n, 195n, 223, 224,
237n, 274n, 275nChung Mong-Koo, 35
Clark, K. B., 237nClarke, Robert, 144, 159nCoase, Ronald, 244, 273nCobbold, I., 159nCohen, W. M., 238nColes, J. L., 403nCollins, J. C., 38, 38n, 39, 54n, 147, 159n, 372n,
403n, 404nCollis, D. J., 273nCook, Tim, 20, 41–42, 113, 152, 215,
317
Cool, K., 94n, 115n, 126nCooper, M. B., 54nCorsten, D., 304nCovey, Stephen, 305n, 396, 403nCovin, J. G., 236nCrawford, R., 273nCrossan, M. M., 304n
DDaily, C. M., 403nDalsace, F., 273nDalton, D. R., 403nDamodaran, A., 26nDarr, E. D., 195ndas Graças Silva Foster, Maria, 40
Davis, S. M., 196nDavison, L., 373nDe Colle, S., 26nDeeds, D. L., 195n, 236n, 274n, 304n, 305n,
412nDeephouse, D. L., 94nDe Figueireo, R. J. P., 93nDeHart, Jacob, 149
Dell, Michael, 360, 390
Dess, G. G., 196nDierickx, I., 115n, 126nDisney, Walt, 360
Dixit, A., 54n, 93nDoherty, N. A., 93n, 302nDorf, R. C., 237nDowning, C., 274nDoz, Y. L., 304n, 339nDranove, E., 93nDubin, Michael, 150
Duguid, P., 338n, 373nDunn, Brian, 35
Dunn, Patricia, 378
Dunning, J. H., 337n, 338nDushnitsky, G., 304nDussage, P., 305nDyer, J. H., 26n, 274n, 275n, 292n, 303n, 304n,
305n, 339n
Note: Page numbers followed by n indicate material in chapter endnotes and source notes.
WWW.YAZDANPRESS.COMWWW.YAZDANPRESS.COM
I-6 NAME INDEX
EEdmondson, A. C., 195n–196nEdwards, G., 93nEesley, C., 26nEinstein, Albert, 202
Eisenhardt, K. M., 25n, 54n, 55n, 196n, 236n, 304n, 372n, 402n
Eisner, Michael, 277
Elkind, P., 403nEllison, Larry, 360, 389
Elms, H., 26n, 158nEl-Sahli, Z., 237nEngel, Jen Floyd, 369
Epple, D., 195nEsty, D. C., 26n, 55n, 93n
FFama, E., 158n, 273n, 402nFaris, Anna, 307
Farjourn, M., 55nFastow, Andrew, 51
Fedor, D. B., 372n, 374nFinkelstein, S., 54n, 237n, 303n, 372nFiorina, Carly, 379
Fisher, Jodie, 378
Fishman, T. C., 444nFolta, T. B., 273nForstall, Scott, 20
Foster, R., 236n, 237nFrankl, V. E., 54nFrazier, Kenneth, 36, 54nFredrickson, J. W., 372nFreeman, C., 237nFreeman, R. E., 26nFriedman, Milton, 158n, 381, 402nFriedman, Thomas L., 25–26n, 94n, 195n, 275n,
338n, 339n, 360, 373nFuld, Richard, 35
Fuller, A. W., 339n, 402nFurr, N. R., 236n
GGallagher, S., 238nGamel, G., 55nGardner, P. D., 373nGates, Bill, 26n, 35, 110, 111, 360, 450
Gates, Mary, 111
George, G., 238nGermain, R., 54nGhauri, P. N., 339nGhemawat, Pankaj, 274n, 312, 318, 319n, 337n,
338n, 339nGhoshal, S., 339nGhosn, Carlos, 432
Gick, M. L., 305nGilbert, C. G., 54n, 55nGillette, King C., 220
Gilmartin, Raymond V., 35, 36, 54nGimeno, J., 426nGlader, P., 421nGladwell, M., 126n, 195nGnyawali, D., 304nGodlin, S., 125nGoerzten, A., 304nGoldstein, H. W., 373nGore, Bill, 348, 352
Govindarajan, V., 159n, 238n, 338nGranovetter, M., 305nGrant, R. M., 55n, 304nGreckhamer, T., 26n, 158nGreenspan, Alan, 93n, 139, 159nGreenstein, S., 236n, 238nGregersen, H., 275nGregory, S., 275nGross, Michael, 409
Grove, Andrew S., 54n, 55n, 80, 93n, 238nGrover, R., 236nGrübel, Oswald, 455
Gruen, D., 158nGrundy, T., 372nGueth, A., 305nGulati, R., 196n, 274n, 303n, 304n, 305nGupta, Rajat, 384
Gutenberg, Johannes, 406
HHagedoorn, J., 303nHagel, J., III, 373nHall, D. J., 372nHambrick, D. C., 54n, 303nHamel, Gary, 54n, 125n, 158n, 159n, 196n, 261,
261n, 262, 274n, 275n, 304n, 372nHammergren, John, 389
Hanks, Tom, 307
Hanley, M., 93nHannan, M. T., 373nHansen, G. S., 26nHansen, M. T., 236n, 372n, 451nHarreld, B., 196nHarrigan, K. R., 237n, 274nHarrison, J. S., 26n, 302nHarrison, R., 305nHart, O., 273nHatten, K. J., 94nHawawini, G., 26n, 158nHayward, M. L. A., 403nHe, J., 304nHeal, G., 54nHeath, C., 54nHeath, D., 54nHeath, P. S., 275nHeineman, B. W., 403nHeins, Thorsten, 132–133, 152
Heintzelman, D., 275nHen, Ben, 176
Henderson, R., 237nHenriksson, K., 304nHerold, D. M., 372n, 374nHess, A. M., 159n, 196n, 236n, 238n, 304n,
305nHesterly, W. S., 125n, 273nHewlett, Bill, 396, 404nHiggins, M. J., 304nHill, C. W. L., 93n, 196n, 236n, 237n, 303n,
372nHillman, A. J., 93nHitt, M. A., 26n, 93n, 236n, 274n, 302n, 303n,
304n, 305nHoang, H., 195n, 274n, 304n, 305nHoffer Gittel, J., 373nHoffmann, W., 304n, 305nHofstede, Geert H., 318, 319, 338nHolyoak, K. J., 305nHorbaczewski, A., 238nHorn, J., 340n
Hrebiniak, L. G., 372nHsieh, Tony, 195n, 343, 343n, 344, 360, 362,
372n, 373n, 374nHummels, D., 237nHunt, M. S., 94nHurd, Mark, 378, 379, 386, 387, 394, 396,
397
Huston, J. H., 274nHuston, L., 159n, 238nHuy, Q. N., 373n
IIbarra, H., 236nIcahn, Carl, 390
Idei, Nobuyuki, 451, 453
Iger, Robert, 296
Immelt, Jeffrey R., 40, 46, 225, 238n, 241, 242,
243, 266, 267–268, 273n, 338n, 382, 388,
389, 421–423
Inkpen, A. C., 303n, 304nIreland, R. D., 236n, 274n, 302n, 303n, 304n, 305nIrving, J., 403nIsaacson, W., 25n, 54n, 236n, 302n
JJaffee, D., 274nJarrell, G., 403nJavidan, M., 340nJayaraman, Narayanan, 302nJensen, M. C., 159n, 273n, 303n, 402n, 403nJiang, L., 303nJobe, L. A., 274nJobs, Steve, 3, 4, 5, 6, 19, 20, 41, 54n, 113, 132,
204, 277, 360, 387
Johanson, J., 339nJohnson, Ron, 35, 185
Jones, Marion, 97
Jordan, Michael, 97, 108
Joyce, C. I., 373n
KKale, P., 303n, 304n, 305nKamprad, Ingvar, 413, 414
Kaplan, R. S., 143, 159nKaplan, S., 236n, 237nKaplan, S. N., 403nKatz, R., 238nKeaton, Diane, 307
Keim, G. D., 93nKelleher, Herb, 360
Keller, R., 237nKenney, M., 303nKerr, J., 373nKeys, Alicia, 133
Keyworth, George, 378
Khanna, T., 304n, 305n, 437nKhurana, R., 403nKiechel, W., 275nKing, A. W., 195nKlein, B., 273nKlein, H. J., 373nKnight, Phil, 97, 120
Knittel, C. R., 409nKnorr, A., 338nKogut, B., 273n, 303n, 339nKopp, Wendy, 410, 411
WWW.YAZDANPRESS.COMWWW.YAZDANPRESS.COM

NAME INDEX I-7
Kotha, S., 94n, 237n–238n, 304n, 337n, 338n, 339nKotick, Robert, 389
Kozlowski, Dennis, 384–385
Kramer, M. R., 26n, 402nKrugman, P., 126nKruschwitz, N., 159nKu, D., 125n, 338n, 339nKumar, R., 304n
KLafley, A. G., 163, 164, 190, 195n, 203, 229, 238nLambert, R. A., 303nLane, H. W., 304nLane, Ray, 397
Lang, J. B., 159nLang, L. H. P., 275nLarcker, D. F., 303nLarsson, R., 304nLaur, J., 159nLauren, Ralph, 360
Laursen, K., 238nLavie, D., 196n, 274n, 303n, 304n, 305nLawlor, Blaine, 374nLawrie, G., 159nLazzarini, S. G., 273nLee, Jay Y., 439
Lee, K., 437nLee Byung-chul, 437, 439
Lee Byung-hun, 307
Lee Kun-hee, 437, 438–439
Leiblein, M. J., 273nLenox, M. J., 26n, 304nLeonard-Barton, D., 373nLepine, J. A., 26n, 158nLerner, J., 273n–274nLevin, D., 340nLevin, Gerald, 35
Levinthal, D. A., 196n, 238n, 373nLevitt, B., 195nLevitt, Theodore, 322, 339nLevy, S., 55n, 273n, 426n, 449nLewis, Ken, 275nLi, Robin, 35
Lieberman, M. B., 236nLi Ning, 429
Lipnack, J., 373nLippman, S. A., 126nLombardi, Vince, 369
Lowenstein, R., 26n, 93n, 275n, 403nLucas, R., 93nLuce, R., 94nLundan, S. M., 338n
MMa, Jack, 35
MacDonald, C., 159nMackey, John, 35, 170, 192, 399
Madhavan, R., 236n, 304nMagretta, J., 93n, 94n, 126nMahoney, J., 55nMahoney, J. T., 126n, 273n, 402nMajchrzak, A., 373nMakower, J., 273nMalhotra, A., 373nManes, S., 126nMang, P., 304nMansfield, E., 93n, 302n
March, J. G., 195n, 196n, 373nMargolis, J. D., 159nMarkides, C. C., 303nMartin, J. D., 275nMartin, R. L., 195n, 238nMason, Andrew, 109
Mason, P. A., 54nMayer, D., 303nMayer, Marissa, 35, 46, 55n, 286, 345
McCraw, T., 236nMcDonald, Robert, 163, 164
McEvily, B., 305nMcGahan, A. M., 26n, 158n, 236nMcGill, J. P., 305nMcGrath, R. G., 372n–373nMcHugh, A., 44nMcLean, B., 403nMcNamara, G., 94n, 158nMcVea, J., 26nMeans, G., 273n, 402nMeckling, W., 273n, 402nMerck, George W., 36
Merges, R. P., 273n–274nMestel, R., 412nMilgrom, P., 93n, 275nMiller, A., 196nMiller, C. C., 263n, 275nMiller, D. J., 273nMinow, N., 402n, 403nMintzberg, Henry, 44, 44n, 54nMisangyi, V. F., 26n, 158nMitchell, R. K., 26nMitchell, Will, 294, 295n, 305nMol, M., 339nMonks, R. A. G., 402n, 403nMontgomery, C. A., 275nMontgomery, D. B., 236nMoonves, Leslie, 389
Moore, Geoffrey A., 213, 214n, 236n, 237n
Moore, O., 273nMoore, Rob, 307
Morrison, A. J., 339nMoss, M., 94nMowery, D. C., 304nMoyer, R. C., 403nMueller, H.-E., 339nMulally, Allan, 35
Murphy, Eddie, 307
Musk, Elon, 57, 195n, 203, 205, 290
NNair, A., 94nNalebuff, B. J., 54n, 93n, 237n, 304nNardelli, Robert, 35, 389
Neeleman, David, 7, 25nNelson, A. J., 237nNelson, K. A., 403nNelson, T., 373n, 374nNicholson-Crotty, S., 373nNickell, Jake, 149
Nobeoka, K., 339nNohria, N., 304n, 403nNooyi, Indra, 29, 30, 40, 48, 146, 253, 256
Norman, W., 159nNorreklit, H., 159nNorth, D. C., 93nNorton, D. P., 143, 159n
Novak, David, 440, 443
Nti, K. O., 304n
OO’Connor, G. C., 273nO’Leary-Kelly, A. M., 373nOrciari, M., 94nO’Reilly, C. A. III, 196n, 373nOrlitzky, M., 159nOwen-Smith, J., 338nOxley, J. E., 304nOzcan, P., 304n
PPackard, Dave, 378, 402nPage, Larry, 6, 35, 47, 360, 426, 449
Palich, L. E., 263n, 275nPandian, J. R., 126nPannar, B. L., 26nPark, B., 304nPatel, Dev, 307
Patton, R. L., 126nPaulson, H. M., 26nPaulson, John, 393
Peng, M. W., 275n, 337n, 413nPerkins, J., 159nPerkins, Thomas, 378
Perlmutter, H., 304nPerloff, J. M., 93nPerrone, V., 305nPerry-Smith, J. E., 373nPeteraf, M., 125nPeyer, U., 236nPfeffer, J., 373nPhelps, Michael, 408–409
Phillips, R., 26nPickens, T. Boone, 390
Pink, 452
Pink, Daniel H., 54n, 365n, 374nPinto, Freida, 307
Pisano, G. P., 195n–196n, 273n, 304nPistorius, Oscar, 98, 120
Planellas, M., 305nPolanyi, M., 304nPoppo, L., 274n, 305nPorras, J. I., 54n, 147, 159n, 403n, 404nPorter, Michael E., 25n, 26n, 58, 65, 67, 67n,
81n, 86–87, 93n, 94n, 125n, 126n, 158n, 167n, 179n, 195n, 196n, 251, 253, 279,
329, 329n, 331, 334, 339n, 340n, 381–382,
383, 402nPoteran, Michael, 238n, 338nPowell, W. W., 338nPrahalad, C. K., 54n, 125n, 158n, 159n, 261,
261n, 262, 274n, 275n, 304n, 339nPrat, A., 37n, 54nPriem, R., 195nPrince, Charles, 35
Purnell, L., 26n
RRaisch, S., 196nRajan, R., 275nRajaratnam, Raj, 384
Raman, A. P., 303nRamanarayanan, S., 196n
WWW.YAZDANPRESS.COMWWW.YAZDANPRESS.COM

I-8 NAME INDEX
Ranft, A. L., 195nRao, R. S., 403nRaynor, M. E., 159n, 195n, 237n, 274nRedrow, Robert, 451nReiley, D. H., 93nReiss, P., 302nReuer, J. J., 195n, 273n, 304nRice, John, 55nRice, M., 273nRidley, M., 373nRindova, V., 237n–238n, 337nRobb, Walter, 170, 195nRoberts, J., 93n, 275nRoberts, Julia, 307
Rodriguez, D., 304nRogers, E. M., 236n, 237nRometty, Virginia, 40
Rooney, Wayne, 98
Roquebert, J. A., 26nRosen, B., 373nRosenfelt, Irene, 35
Ross, D., 93nRoth, K., 339nRothaermel, Frank T., 93n, 125n, 159n, 195n,
196n, 236n, 237n, 238n, 274n, 275n, 303n–304n, 305n, 337n, 338n, 339n, 372n, 373n, 402n, 406n, 408n, 410n, 412n, 413n, 416n, 418n, 421n, 424n, 429n, 432n, 434n, 437n, 440n, 444n, 446n, 449n, 451n, 454n
Rottner, R. M., 93nRuback, R. S., 303nRumelt, Richard P., 25n, 26n, 126n, 158n, 257,
258n, 275nRydberg-Dumont, Josephine, 184
Rynes, S. L., 159n
SSachs, J., 125nSadun, R., 37n, 54nSaias, M. A., 372nSakkab, N., 159n, 238nSalomon, R. M., 159nSalter, A., 238nSampson, R., 305nSandberg, S., 404nSandberg, Sheryl, 35
Santoro, M. D., 305nSaxenian, A. L., 125n, 338nSayrak, A., 275nSchaefer, S., 93nSchein, E. H., 373nSchendel, D. E., 94nScherer, F. J., 93nSchilke, O., 304nSchilling, M. A., 236n, 237n, 303nSchley, S., 159nSchmalensee, R., 158nSchmidt, F. L., 159nSchneider, B., 373nSchoemaker, P. J. H., 125nSchramm, Carl J., 236nSchreiner, M., 304nSchuler, D., 93nSchultz, Howard, 35, 46, 416, 416n, 417
Schumpeter, Joseph A., 200, 203, 236n, 237nSenge, P. M., 159nServaes, H., 275n
Sexton, D. L., 236nShalley, C. E., 373nShane, S., 236nShapiro, C., 236nShay, J. P., 275nShen, J. C., 303nShepsle, K., 275nSheth, J. N., 26nShiller, R., 237nShuen, A., 237nSiggelkow, N., 126nSilverman, B. S., 304nSims, N., 305nSingh, H., 195n, 196n, 292n, 303n, 304n, 305n,
339nSisodia, R. S., 26nSkeath, S., 93nSkilling, Jeffrey, 51
Sloan, Alfred P., 167–168
Slocum, J. W., 373nSmith, A., 26nSmith, D. B., 373nSmith, Greg, 392, 394, 403nSmith, W. K., 373nSoete, L., 237nSong, J., 437nSorenson, D., 125nSparks, J., 304nSpencer, R. W., 274nSpender, J.-C., 304nStalker, G. M., 373nStamps, J., 373nStango, V., 409nSteensma, H. K., 338n, 339nStern, I., 403nStern, S., 55nStewart, Martha, 186, 360, 414
Stiglitz, J., 337nStokes, D. E., 236nStuart, T., 125nStulz, R. M., 275nSubramanian, V., 26n, 158nSull, D., 25nSurowiecki, J., 236nSvendsen, A., 26n
TTalib, N. N., 26nTan, J., 303nTao, Q., 338nTata, Jamsetji Nusserwanji, 260
Tata, Ratan, 35
Taylor, Seth, 406nTeagarden, M., 340nTebbutt, T., 302nTeece, D. J., 237n, 274n, 303nTesla, Nikola, 203
Thain, John, 385
Theobald, N. A., 373nThompson, Don, 35, 347
Thompson, P., 196nThorpe, Ian, 409
Thursby, J., 237nThursby, M., 93n, 236n, 237n, 303nTimberlake, Justin, 452
Todorova, G., 195nTourre, Fabrice, 393, 394
Toyoda, Akio, 290
Treviño, L. K., 403nTrimble, C., 238n, 338nTripsas, M., 303nTucker, I., 274nTurner, Kevin, 195nTushman, M. L., 196n, 237n, 373n
UUllman, Myron, 186
Utterback, J. M., 237n
VVaaler, P., 158nVagelos, Ray, 36
Vahlne, J., 339nVaidyanath, D., 274n, 303n, 304n, 305nVarian, H. R., 236nVenkataraman, S., 236nVerdin, P., 26n, 158nVermeulen, F., 338nVeryzer, R. W., 273nVick, Michael, 98, 120
Vickrey, J., 158nVillalonga, B., 275nViswanathan, Vivek, 424nVonn, Lindsey, 409
Vosloo, Arnold, 307
WWadhwa, A., 304nWagoner, Richard, 35
Wales, Jimmy, 199, 203, 206, 231
Walla, N., 274nWally, S., 372nWalsh, J. P., 159nWalton, Sam, 360, 414, 415
Wang, Y., 93nWang Chuan-Fu, 444, 445
Wassmer, U., 305nWeigelt, K., 93n, 302n, 303nWelch, Jack, 45, 46, 421–423
Wernerfelt, B., 26n, 125nWessel, D., 26nWest, J., 238nWesterman, G., 373nWestfall, P. A., 26nWestphal, J. D., 403nWhite, R., 195nWhite, R. E., 304nWhitehead, J., 303nWhitman, Meg, 379, 397
Wicks, A. C., 26nWilder, R. P., 274nWilliams, Robin, 307
Williamsen, P. J., 303nWilliamson, Oliver E., 273n, 274n, 339n, 373n,
403nWinfrey, Oprah, 120, 205, 360
Winston, A. S., 26n, 55n, 93nWolf, S., 373nWolfe, D. B., 26nWoo, C. Y., 426nWood, D. J., 26nWood, R. C., 373nWoods, Tiger, 98, 120, 409
Woolley, J. L., 93n, 236nWright, T. P., 195n
WWW.YAZDANPRESS.COMWWW.YAZDANPRESS.COM

NAME INDEX I-9
YYang, Carrie, 402n, 418n, 429n, 434n, 437n,
440n, 444n, 446n, 454nYang, D. J., 416nYang, Jerry, 286, 345
Yelle, L. E., 195nYoffie, D. B., 93nYoungblood, A., 403nYulk, G., 54n
Yun Jong-Yong, 35, 204, 437–438
Yunus, Muhammad, 383
ZZaheer, A., 305nZaheer, S., 338nZahra, S. A., 236n, 238nZajac, E. J., 403nZander, Ed, 35
Zander, U., 273nZenger, T. R., 273n, 274n, 305nZhang, W., 303nZhu, F., 236n, 238nZiedonis, R. H., 304nZingales, L., 275nZollo, M., 195n, 304nZott, C., 159nZuckerberg, Mark, 6, 35, 203, 351, 406, 407
WWW.YAZDANPRESS.COMWWW.YAZDANPRESS.COM
I-10
SUBJECT INDEX
AAbsorptive capacity, 229
Accounting data, 131–132, 134–135, 154
Accounting profitability, 130, 131–135, 142, 143,
151, 154
Accounting Reform and Investor Protection Act
(SOX) of 2002, 15, 131
Accounting scandals, 10, 392
Acquisition capabilities, 283
Acquisitions. See Mergers and acquisitions
(M&A)
Activities
in developing core competencies, 100, 102
primary and support activities, 117
value added by, 116
Administrative costs, 244–245, 246
Administrative distance, 319, 320
Adverse selection, 385
Advertising industry, 83
AFI strategy framework, 1, 4, 16–19
analysis of challenge, 4–5
implementation of strategy, 4, 5
scenario planning with, 42–44
strategy formulation, 4, 5, 164
in top-down strategic planning, 41
Agency theory, 381, 385–386, 398
AICPA Code of Professional Conduct, 403nAircraft manufacturing industry, 70, 77, 176,
177, 220
Airline industry, 79, 82
cost-leadership strategy in, 173
five forces model in, 65–66
horizontal integration in, 279
industry life cycle and, 212
mapping strategic groups in, 84–86
power of suppliers in, 71–72
threat of substitutes, 74–75
Alliance champion, 293
Alliance leader, 293
Alliance management capability, 291–293, 298
alliance design, 292
alliance management, 292–293
partner selection, 291–292
Alliance manager, 293
Alternative-energy industry, 45–46
Ambidextrous organizations, 184, 354
Analysis
competitive analysis checklist, 81
dynamic analysis, 152
external. See External analysis
firm profitability analysis, 130, 131–135,
154
internal. See Internal analysis
stakeholder impact analysis, 12–16, 21
strategy analysis. See Strategy analysis (A)SWOT analysis, 99, 117–120, 122, 365
value chain analysis, 99, 100, 115–117,
122
Apparel industry, 328, 331
Architectural innovation, 222
Artifacts, 360
Automotive industry, 33
competing technologies (minicase),
432–433
competitive forces in, 57–58, 88
competitive intensity in, 330
disruptive innovation in, 223
economies of scale in, 68–69
globalization of, 323
international expansion of, 313, 314
learning races in, 287–288
national competitive advantage in, 328
scope of competition in, 167–168
short-term contracting in, 248
Autonomous behavior, innovation from, 230
BBaby boomers, 148, 401–402
Backward integration, 73–74
Backward vertical integration, 252, 254
Balanced scorecard, 143–146, 151, 155
advantages of, 145
disadvantages of, 145–146
elements of, 143–144
Banking business, scandals in (minicase),
454–456
Barriers to imitation, 110
Bathtub metaphor, 114–115
Beachheads, 218, 223–224
Behavioral economics, 389
Benchmarks, 5, 151
Best in Class for Corporate Governance award,
12
Best Places to Work award, 12
BHAG (big hairy audacious goal), 147
Big-box retailers, buyer bargaining power,
73–74
Big hairy audacious goal (BHAG), 147
Biotechnology industry, 248, 288, 315, 328
Black swan events, 10–11, 42, 381
Bloomberg Businessweek, 391
Board of directors, 386–387, 388, 398
ethical violations by, 377–378
fiduciary responsibility of, 387, 393
independence of, 387, 388
Book value of firm, 135
Boom and bust cycles, 60–61
Boston Consulting Group growth-share matrix,
264–265, 269
Bottom-up processes, 44–47, 225, 230
Boundaryless organizational form, 348
BPO (business process outsourcing), 314, 328
Brand loyalty, 70, 416–417
Brand value (minicases)
celebrity branding, 408–409
in differentiation strategy, 418–420
Budgets, 364
Build-borrow-or-buy framework, 294–296, 298
Built to Last (Collins & Porras), 147, 396
Business cycle, 60
Business ethics, 12, 15, 18
business-level strategies, 192
case study, 377–379, 396–397
corporate governance and. See Corporate
governance
ethical/social issues
acquisitions and alliances, 299
business-level strategies, 192
corporate governance, 399–400
corporate-level strategies, 271
cultural norms and values, 369–370
global strategy, 335
innovation, 233–234
measuring firm performance, 156–157
political influence, 90–91
resources, 123
strategy analysis, 22
vision/mission statements, 51
ethical sourcing of raw materials, 317
implications for strategist, 395–396
organizational values and, 35
principal-agent problem, 246, 282,
383–385
scandals. See Scandals
shared value creation network, 380–383
creating shared value, 381–383
public stock companies, 380–381
strategy and, 392–395, 398
Business functions, 40
Business-level strategies, 18, 39, 40, 162–191,
198–233
case study, 163–164, 189–190
competing for advantage, 165–168
generic strategies, 166–168
strategic position, 166
cost-leadership strategy. See Cost-leadership
strategy
differentiation strategy. See Differentiation
strategy
dynamics of competitive positioning,
186–189, 191
entrepreneurship, 204–206
ethical/social issues, 192
five forces and, 178–181, 191
functional structure used with, 352–354
implications for strategist, 189
industry life cycle and, 219
innovation, 200–204
integration strategy. See Integration
strategy
mechanistic vs. organic organizations, 350
scenario planning, 42
Business models, 5, 18
competing on (minicase), 424–426
for competitive advantage, 148–151, 152,
155
in e-book industry, 285
emergence of, 202
freemium, 151
innovation in, 148–150
pay-as-you-go, 150–151
razor–razor-blade, 150, 204, 220–221, 222
in software industry, 262
subscription-based, 150
sustainability as, 147
Business process outsourcing (BPO), 314, 328
Buyer power
in airline industry, 66
business-level strategies and, 179
effects on strategic groups, 85
in five forces model, 72–74, 81
as industry force, 88
market share and, 243
Note: Page numbers followed by n indicate material in chapter endnotes and source notes.
WWW.YAZDANPRESS.COMWWW.YAZDANPRESS.COM
SUBJECT INDEX I-11
CCAGE distance framework, 318–321, 331, 333
administrative and political distance, 320
cultural distance, 318–320
economic distance, 321
geographic distance, 320–321
Candy industry, 281
Capabilities, 100, 121
for acquisition and integration, 283
alliance management capability, 291–293,
298
dynamic, 113–114
learning, 287–288
relational, 293
unique, leveraging (minicase), 408–409
Capital, 129, 135
corporate venture capital, 290
as entry barrier, 69–70
internal capital markets, 265–266, 355–356
risk and return ratios, 129–133
total invested capital metric, 129
Carpet industry, 110–111
Car rental industry, 149–150
Carrot-and-stick approach, 364–365
Cash cows, 265
Causal ambiguity, 112–113, 363
Caveat emptor, 247
CDOs (collateralized debt obligations), 393
Centralization, 348–349, 350, 355
CEO. See Chief executive officer
Chaebol, 259, 437, 439nChasm-crossing framework, 207, 213–218, 230,
232
early adopters, 215, 217
early majority, 215–216, 217
example of, 217–218, 219
laggards, 216
late majority, 216, 218
technology enthusiasts, 214–215, 217
Chief executive officer (CEO)
compensation of, 388–389
as inside director, 386
role in firm performance (minicase),
421–423
succession plan for, 387
Chief operating officer (COO), 386
Child labor, 317
China, 314–315
Clean-technology industries, 241
Closed innovation model, 227–228, 229,
232–233
Cloud computing, 203–204, 286
Codes of conduct, 392, 394–395
Coffee industry, 44, 45
COGS (cost of goods sold), 132
Collateralized debt obligations (CDOs), 393
Colony-colonizer relationships, 320
Command-and-control decisions, 245–246, 249
Commercialization of new products, 203–204
Communication channels, 346–347, 352,
354–355
Communities of learning, 315
Communities of practice, 358
Community of knowledge, 246
Competition. See also Competitive rivalry
competitive forces, 57–58, 88
in five forces model, 65–67
global, 320, 332
innovation and, 199, 231
for market share, 212
monopolistic, 76–77
multipoint (minicase), 424–426
non-price, 75, 77
perfect, 76, 104, 251
among SBUs, 356, 357
scope of, 167–168
Competitive advantage, 3, 5–9, 18, 128–155
business models for, 148–151, 152, 155
case study, 129, 130, 152–154
core competencies and, 97–99, 120
implications for strategist, 151–152
intangible resources and, 102–103, 109
learning-curve effects and, 176–177
measuring, 131–148
accounting profitability, 130, 131–135,
143, 151, 154
balanced scorecard, 143–146, 151
economic value creation, 131, 139–143,
151, 155
shareholder value creation, 131, 135–139,
143, 151, 154–155
triple bottom line, 146–148, 151, 155,
205
mergers and acquisitions and, 282–283,
297
national, 328–331
availability of complementors in,
330–331
factor conditions in, 329–330
industry leadership, 328–329
nature of strategy and, 3, 5–9, 20–21
organizational culture and, 361–363
organizational design for, 346–351
key structural elements, 346–349
mechanistic vs. organic organizations,
349–351, 368
organizational inertia and, 346, 347, 367
relational view of, 284
role of CEO in, 421–423
role of innovation in, 200–204, 220–221
role of suppliers in, 330–331
strategic alliances for, 283–284
sustainable. See Sustainable competitive
advantage
temporary, 106, 137
Competitive analysis checklist, 81
Competitive challenge(s)
analysis of, 4–5
CSR as (minicase), 413–415
external environment as (minicase),
440–443
failure to face, 8
Competitive disadvantage, 6
organizational design and (minicase),
451–453
overcoming, 282–283
role of CEO in, 421–423
Competitive industry structure, 75–78
Competitive intensity
in diamond framework, 330
industry life cycle and, 212–213, 219
reducing through acquisitions, 279–280
Competitive parity, 6
Competitive positioning
dynamics of, 186–189, 191
strategic alliances and, 284–285
Competitive rivalry, 67, 75–80, 81, 89. See also
Competition
business-level strategies and, 179
competitive industry structure, 75–78
exit barriers, 79–80, 81
industry growth, 78–79
during industry life cycle, 207, 208, 210, 219
in local markets, 109–110
strategic commitments, 79
in strategic groups, 83, 84–85, 86
Competitors
merging with, 278–280, 281
rivalry among, 67, 75–80, 81, 89
Complementors, 330–331
Complements, 93nin differentiation strategy, 171
need for complementary assets, 287
strategic role of, 80, 82, 88, 89
Conglomerates, 259
Consolidate strategy, 213
Consumer(s), 142, 164
Consumer behavior, 60
Consumer boycotts, 14
Consumer electronics industry, 328
Consumer experience, unique (minicase), 416–417
Consumer Reports, 215
Consumer surplus, 141
Containerization, 210
Context dependency, 74
Continuous innovation, 230
Contracts
incomplete contracting, 246
information asymmetry in, 246, 247
long-term contracting, 248
short-term contracting, 247–248, 274nContractual obligations, 79–80
Control-and-reward systems, 345, 363–365
input controls, 364
output controls, 364–365
COO (chief operating officer), 386
Co-opetition, 287
positive-sum, 82, 89
among SBUs, 356, 357
Coordination costs, 266
Copier industry, 222
Copyrighted material, piracy of, 332
Core competence–market matrix, 264–265, 269
Core competencies, 121
application of, 101
competitive advantage and, 97–99, 120
for corporate diversification, 260–262
corporate-level strategy and, 243
“creating heroes,” 97–98, 120
customer service as, 343–344, 362, 367
diversification strategy and (minicase),
444–445
industry life cycle and, 207–208, 210, 219
internal analysis of, 99–102
mission and, 98–99
needed for value creation, 144
new, development of, 311, 315
visible and invisible, 100
Core rigidity of culture, 361
Corporate effects, 9
Corporate entrepreneurship, 203
Corporate executives, 50
daily activities of, 37
decisions made by, 40
leadership by. See Strategic leadership
Level-5 leadership pyramid, 38–39
role in emergent strategy, 46–47
upper-echelons theory, 37
values of, 35
WWW.YAZDANPRESS.COMWWW.YAZDANPRESS.COM

I-12 SUBJECT INDEX
Corporate governance, 18, 383–391, 397
agency theory and, 381, 385–386
board of directors. See Board of directors
case study, 377–379, 396–397
ethics in. See Business ethics
implications for strategist, 395–396
mechanisms for, 388–391
auditors, regulators, and analysts, 391
executive compensation, 388–389
market for corporate control, 389–391,
398
Corporate governance mechanisms
in strategic alliances, 288–291, 298
equity alliances, 289–290
joint ventures, 289, 290–291
non-equity alliances, 288–289
strategic control-and-reward systems,
363–365
Corporate-level strategy, 39–40, 240–270,
276–298
boundaries of firm and, 244–250, 266
alternatives to make-or-buy decision,
247–250
make-or-buy decision, 245–247
defined, 242–243, 268
dimensions of, 331
diversification. See Diversification strategy
implications for strategist, 266–267
integration strategy, 260
mergers and acquisitions. See Mergers and
acquisitions (M&A)
scenario planning, 39–40
strategic alliances. See Strategic alliances
vertical integration. See Vertical integration
Corporate raiders, 390
Corporate social responsibility (CSR), 15–16,
147–148
citizenship, 12, 16
as external challenge (minicase), 413–415
in firm vision, 29
international expansion and, 317
lack of business integrity, 17
obligations of firms, 380
survey of attitudes toward, 381, 382
Corporate strategy, 18
Corporate venture capital (CVC), 290
Cost(s)
increased due to vertical integration, 254
reducing, 170, 280, 323, 325
Cost advantage, 139–140
Cost drivers
cost-leadership strategy and, 190–191
cost of input factors, 173–174
economies of scale, 174–176
Cost-leadership strategy, 84, 164, 166, 172–178,
190–191
benefits and risks of, 178–180
cost of input factors, 173–174
economies of scale. See Economies of scale
example of, 173
experience curve in, 177
founder imprinting to, 360
functional organizational structure and,
352, 353
industry life cycle and, 211, 212
in integration strategy, 7
international expansion and, 316, 322,
413–415
learning curve in, 176–177
Costly-to-imitate resources, 106–107
Cost of capital, 129
Cost of goods sold (COGS), 132
Cost of goods sold / revenue ratio, 132, 134
Cost parity, 168
Credible commitment, 249
Credit, 61, 63
CRM (customer relationship management) soft-
ware, 262
Crossing the Chasm (Moore), 213
Crowdsourcing, 149, 224, 231
CSR. See Corporate social responsibility
Cube-square rule, 175
Cultural differences, 316
Cultural distance, 318–320, 326
Culture
dimensions of, 338n–339nnational, 318–319
organizational. See Organizational culture
Currency exchange rates, 62, 324, 325
Customer(s). See also Buyer power
cultural differences in preferences, 319
demands of, 330
perspective of firm, 143–144
role in industry life cycle, 213–214, 219
early adopters, 215, 217
early majority, 215–216, 217
laggards, 216
late majority, 216, 218
technology enthusiasts, 214–215, 217
“Customer Bill of Rights,” 7
Customer experience (minicase), 416–417
Customer-oriented vision statements, 33–35, 49
Customer relationship management (CRM) soft-
ware, 262
Customer service
as core competency, 343–344, 362, 367
premium service (minicase), 418–420
strategic positioning for, 6
as value driver, 171
Customization, 183, 310
CVC (corporate venture capital), 290
Cyclical trends
boom and bust cycles, 60–61
business cycle, 60
industry life cycle, 206–218, 219, 230, 232
virtuous cycle, 208
DDeath-of-distance hypothesis, 328
Decision making, 40
build-borrow-or-buy framework, 294–296, 298
command-and-control decisions, 245–246, 249
driven by values, 35, 36
long-term consequences of, 112
make-or-buy decision, 245–250
real-options perspective, 286–287
Decision tree, 105
Decline stage of industry life cycle, 212–213, 219
Dedicated alliance function, 293
Deflation, 61–62
Demand conditions, 330
Demographic trends, 62
Deregulation, 71
Desktop-computing industry, 77
competitive positioning in, 187–189
disruptive innovation in, 223–224
national competitive advantage in, 328
organization to capture value in, 107–108
value chain in, 116
Diamond framework, 329–331, 334
availability of complementors, 330–331
competitive intensity, 330
demand conditions, 330
factor conditions, 329–330
Differentiation parity, 172
Differentiation strategy, 72, 84, 164, 166, 190
benefits and risks of, 167, 180–181
brand image and (minicase), 418–420
changing (minicase), 434–436
as core competency, 99
customer service, 171
focused, 167–168, 434–436
functional structure and, 352–353
behind horizontal integration, 280
in industry life cycle, 211
in integration strategy, 7–8
local responsiveness and, 322
in medical products industry, 78
product features, 169, 171
role of complements in, 171
value drivers in, 168–171, 191
Digitization, 225
Direct imitation, 106–107
Diseconomies of scale, 176
Disruptive innovation, 222–224
characteristics of, 223
in globalization, 311
self-disruption, 224, 225
Distribution agreements, 288, 289
Distribution channels (minicase), 429–431
Diversification, 256–266, 269
competitive advantage of, 142–143
core competencies for, 260–262,
444–445
degree of diversification, 256
economies of scale or scope, 259, 263
firm performance and, 263–266
internal capital markets, 265–266
restructuring, 264–265
perils of (minicase), 434–436
types of strategies, 257–259, 267
product-market or geographic, 257
related, 258–259
related-constrained, 258, 259, 266
related-linked, 258, 259, 266
unrelated, 258, 259, 263, 282
Diversification discount, 263
Diversification premium, 263
Diversified firms, 142–143
Division of labor, 347
DJIA (Dow Jones Industrial Average),
10–11
Dodd-Frank Wall Street Reform and Consumer
Protection Act of 2010, 59–60
“Dogs,” 264, 265
Domain expertise, 351–352
Domestic markets, 330
Dominant-business firms, 258, 263, 356, 357
Dominant strategic plan, 43
Donation model, 231
Dow Jones Industrial Average (DJIA), 10–11
Dow Jones Industrial Index, 241
Drive: The Surprising Truth About What Moti-vates Us (D. Pink), 365
Dynamic analysis, 152
Dynamic capabilities, 113–114
Dynamic capabilities perspective, 99, 101,
113–115, 121–122
Dynamic strategy, 266–267
WWW.YAZDANPRESS.COMWWW.YAZDANPRESS.COM
SUBJECT INDEX I-13
EEarly adopters, 215, 217
Early majority customers, 215–216, 217
Ecology. See Environment
Ecomagination initiative (GE), 241, 243, 382–383
E-commerce. See Internet businesses; Online
retailers
Economic activity, organization of, 245–246,
268–269
Economic arbitrage, 321
Economic distance, 319, 321
Economic factors in PESTEL framework,
60–62, 63
Economic incentives, 221
Economic responsibility, 15
Economics
behavioral, 389
transaction cost economics, 244–250, 253
Economic value creation, 115–116, 131, 139–
143, 151, 155
as cost driver, 166, 168, 169
in cost-leadership strategy, 172
through organizational culture, 363
as reason for globalization, 313
Economies of experience, 321, 325
Economies of scale, 133, 174–176, 321
corporate-level strategy and, 243
diversification strategy and, 259, 263
as entry barrier, 68–69
as first-mover advantage, 203
fixed costs, 175
in global matrix structure, 357
horizontal integration and, 280
in international expansion, 313
learning curves and, 176–177
in mechanistic organizations, 350
minimum efficient scale, 174, 175–176
multidomestic strategy and, 325
physical properties and, 174, 175–176
process innovation and, 210
specialized systems or equipment, 175
spreading fixed costs, 175
Economies of scope, 321
corporate-level strategy and, 243
as cost and value driver, 183
diversification strategy and, 259, 263
international expansion and, 313
vertical integration and, 245
Economies of standardization, 321, 350
Economy, growth rates for, 60–61
EDGAR database (SEC), 391
Education industry, 31, 32, 223
Efficiency
of matrix structure, 357
minimum efficient scale, 174, 175–176
vertical integration and, 253
Efficient-market hypothesis, 136
80-20 rule, 225–227
Emergent strategy, 44, 45, 50
Emerging markets, 206, 281
expanding customer base in, 383
products developed for, 223, 224
standard of living in, 312–313
Employees
autonomous actions of, 44, 45–46, 48
behavior of, 361–362, 394
effects of vision statements on, 33–34
generation Y, 401–402
interests of, 14
Employee stock ownership plans (ESOPs), 14
Employment levels, 61
Enterprise resource planning (ERP) software,
69, 175
Entrepreneurs, 203–204
economic incentives for, 221
online retailers, 76
simple organizational structure, 351, 352
Entrepreneurship, 61, 232
corporate, 203
examples of, 204–205
innovation and, 204–206
Internet entrepreneurs, 76
opportunity costs and, 142
in organic organizations, 349
personal strategy, 235
social, 205–206, 231
strategic, 205
Entry barriers, 68, 207
capital requirements, 69–70
customer switching costs, 66, 69
economies of scale, 68–69
effects on strategic groups, 85
government policy, 70–71
network effects, 69
non-size advantages, 70
threat of retaliation, 71
Environment (ecology)
competing technologies (minicase), 432–433
ecomagination initiative (GE), 241, 243,
382–383
environmental disasters, 17
in PESTEL framework, 64
Environmental Protection Agency (EPA), 17
EPA (Environmental Protection Agency), 17
Equity alliances, 248–249, 289–290
ERP (enterprise resource planning) software, 69, 175
ESOPs (employee stock ownership plans), 14
Ethical responsibility, 15
Ethics. See Business ethics
EU. See European Union
European Commission, 279–280
European Union (EU), 63, 209
competitive rivalry in, 78, 79
global strategy and, 312, 320
Eurozone crisis, 63
Event-promotion industry, 279
Executive compensation, 388–389, 398
Exit barriers, 79–80, 81
Exit strategy, 213
Experience curve(s), 177, 178
Experience-curve effects, 70, 203
Expertise, leveraging (minicase), 444–445
Explicit knowledge, 288, 289
Exploitation, 354
Exploration, 354
Exporting, 62, 322, 324
Express-delivery industry, 77
External analysis, 17, 56–90
case study, 57–58, 88
five forces model. See Five forces model
implications for strategist, 59, 86–87
industry dynamics, 76, 82–83, 89
PESTEL framework, 58–64, 88–89, 119
strategic groups, 59, 83–86, 89–90
mapping, 84–86
mobility barriers in, 85, 86
External environment of firm, 58
analysis of. See External analysis
as challenge (minicase), 440–443
decline of industries and, 212–213
effects on strategic groups, 85
growth of firm and, 294
internal costs created by, 382
reciprocal influence of, 112
as threat or opportunity, 119–120, 242
External governance mechanisms, 389–391, 398
External stakeholders, 11
External transaction costs, 244
FFace-to-face meetings, 37
Factor conditions, 329–330
FASB (Financial Accounting Standards Board),
131
Fast Company magazine, 230
Fast-food industry, 78–79
FATCA (Foreign Account Tax Compliance Act)
of 2010, 455
FDI. See Foreign direct investment
Federal Trade Commission (FTC), 254–255,
279–280
Fiduciary responsibility, 387, 393
Financial Accounting Standards Board (FASB),
131
Financial crisis of 2008, 10–11
Financial economies, 264–266
internal capital markets, 265–266
from restructuring, 264–265
Financial ratios, 131–135
Firm(s), 6, 11–12, 38, 129, 135. See also
Resource-based view of firm
analyzing profitability of, 130,
131–135, 154
boundaries of, 244–250, 266
customer perspective of, 143–144
disruptive innovation and, 223–224
diversified, 142–143
dominant-business firms, 258, 263,
356, 357
ethical climate of, 392–394
external environment of. See External
environment of firm
growth of, 278, 351
investment in R&D, 132
legal environment of, 59–60
organizational inertia in, 346, 347, 367
organization of economic activity by, 245–
246, 268–269
political environment of, 59, 60, 79, 250
private equity firms, 390
relationship to society, 10
shareholder views of, 144
single-business firms, 257, 258, 263, 356,
357, 364
social obligations of, 380
vision statements of, 31
Firm effects, 9, 21, 165
Firm-level competitive advantage, 142–143, 329
Firm performance, 18
competitive advantage and. See Competitive
advantage
diversification and, 263–266, 270
internal capital markets, 265–266
restructuring, 264–265
on ethical/social issues, 156–157
evaluation of, 344
executive pay tied to, 389
industry vs. firm effects and, 9
WWW.YAZDANPRESS.COMWWW.YAZDANPRESS.COM
I-14 SUBJECT INDEX
Firm performance—Cont.overall business unit performance, 151–152
performance metrics, 129, 130–131
external, 136
financial ratios, 131–135
role of CEO in (minicase), 421–423
stakeholder management and, 12
vision statements and, 34–35
First-mover advantages, 203–204, 441–442
First-mover disadvantages, 207–208
Five forces model, 59, 64–82, 89, 118, 178–181,
191
application of, 86–87
competition in, 65–67
competitive analysis checklist, 81
cost-leadership strategy and, 178–180
differentiation strategy and, 167, 180–181
effects on strategic groups, 85–86
horizontal integration and, 279
power of buyers in, 72–74, 81
power of suppliers, 66, 71–72, 81
rivalry among existing competitors, 67,
75–80, 81, 89
strategic role of complements, 80, 82, 88, 89
threat of entry, 67–71, 81, 93n, 109
threat of substitutes, 74–75, 81
Fixed assets, 133
Fixed asset turnover ratio, 133
Fixed costs, 79–80, 175
Flat structure, 344, 349
Flexibility, 246, 254, 255
Focused cost-leadership strategy, 167
Focused differentiation strategy, 167–168,
434–436
Food and Drug Administration (FDA), 288
Forbes, 391
Foreign Account Tax Compliance Act (FATCA)
of 2010, 455
Foreign direct investment (FDI)
growth of globalization and, 310–311
by MNEs, 309–310, 333
Foreign governments, 317
Foreign markets, 321–322, 333
Formalization, 347–348, 350
Form 10-K, 131
Formulation. See Strategy formulation (F)Fortune, 391
Forward vertical integration, 252–253
Founder imprinting, 360, 363
4-I’s, 202–204, 231–232
Franchising, 248, 324
Freemium business model, 151
FTC (Federal Trade Commission), 254–255,
279–280
Functional-level strategy, 39, 40, 84
Functional managers, 40, 45, 50
Functional structure, 351–355, 368
drawbacks of, 352, 354–355
for single- or dominant-business firms,
356, 357
used with international strategy, 358–359
use with various strategies, 352–354
Future resource value, 108, 110
GGAAP (generally accepted accounting prin-
ciples), 131, 391, 403nGame theory, 77
General environment model. See PESTEL
framework
Generally accepted accounting principles
(GAAP), 131, 391, 403nGeneral managers, 40, 50
Generational tension
baby boomers, 148, 401–402
generation X, 148
millennials (generation Y), 147–148,
401–402
Generation X, 148
Generation Y (millennials), 147–148, 401–402
Generic business strategies, 166–168
Geographic concentration, 110–111
Geographic distance, 319, 320–321
Geographic diversification strategy, 257
Geographic locations, 119, 242, 256–257
Geographic organization, 40
Glass-Steagall Act, repeal of, 59–60
Global-collaboration networks, 311–313
Global financial crisis (2008–2012), 63, 392
Globalization, 309–313, 323, 333. See also
Global strategy
current level of, 312
history of, 310–313
global-collaboration networks, 311–313
post-World War II, 310–311
pre-World War II, 310
Globalization hypothesis, 322–323
Global markets, 256, 311
Global matrix structure, 327, 357, 358
Global-standardization strategy, 322, 324,
325–326, 333
characteristics, benefits, and risks, 328
multidivisional structure used with, 359
Global strategy, 18, 306–334
advantages of, 313–317, 333
competency development, 311, 315
low-cost input factors, 314–315
market access, 313
business strategy as clue to, 331
case study of, 306–307, 332
disadvantages of, 315–317, 333
liability of foreignness, 315, 445
loss of intellectual property, 317, 321
loss of reputation, 316–317, 321
ethical/social issues, 335
globalization, 309–313, 323, 333
how to enter foreign markets, 321–322
implications for strategist, 331–332
industry leadership
diamond framework for, 329–331
national competitive advantage,
328–329
integration-responsiveness framework,
322–328
global-standardization strategy, 322, 324,
325–326, 328, 333, 359
international strategy, 323–324
multidomestic strategy, 324, 325
transnational strategy, 324, 326–327
in social networking (minicase), 406–407
where to compete, 242, 318–321, 331, 333
administrative and political distance, 320
cultural distance, 318–320
economic distance, 319, 321
geographic distance, 320–321
Good to Great (Collins), 38
Government policy as entry barrier, 70–71
Government regulation, 71, 80, 320
as external governance mechanism, 391,
398
of mergers and acquisitions, 279–280
regulatory changes, 59–60
top-down standard setting, 209
of vertical integration, 254–255
Grandiose statements, 8
Grassroots Innovation award, 12
Greenfield operations, 322
Groupthink, 360–361, 388, 397
Growth of firm, 278, 351
Growth rates, 60–61, 211–212
Growth stage of industry life cycle, 209–211,
219
Guiding policy, 4, 5
HHarvest strategy, 213
Health care industry, 241
Healthymagination initiative (GE), 241
Hedge funds, 386, 390
Herding effect, 216
Hierarchy
in organizational structure, 349, 385,
350381
in strategic alliance design, 292
High-powered incentives, 246
Historical data, 134
“Home sourcing,” 7
Horizontal integration, 278–280, 292
Hostile takeovers, 278, 281, 390
Housing bubble, 60–61
Human-asset specificity, 254
Human resource management, 255–256
“Hyper-local” markets, 109–110
IIdeas, 202
Illusion of control, 44
IMF (International Monetary Fund), 63
Imitation, 109, 110
causal ambiguity and, 112–113
costly-to-imitate resources, 106–107
in innovation process, 204
resource immobility and, 104
Implementation. See Strategy implementa-
tion (I)Importing, 62
Incomplete contracting, 246
Incremental innovation, 220–222
economic incentives and, 221
innovation ecosystems and, 222
organizational inertia and, 221–222
Individualism dimension of culture, 319, 339nInduced innovation, 230
Industry(ies), 64–65, 87, 167, 211. See also spe-cific industriesanalysis of industry dynamics, 76, 82–
83, 89
competitive industry structure, 75–78
consolidated, 76
fragmented, 75–76
industry leadership
diamond framework for, 329–331
national competitive advantage, 328–329
monopolistic competition in, 76–77
monopoly, 76, 77–78
national competitive advantage in, 328–329
oligopoly, 76, 77
perfect competition, 76, 104, 251
profit potential of, 65, 66–67, 68
related or supporting, 330–331
WWW.YAZDANPRESS.COMWWW.YAZDANPRESS.COM

SUBJECT INDEX I-15
Industry convergence, 83
Industry effects, 9, 21, 165
Industry life cycle, 206–218, 219, 230, 232
chasm crossing, 207, 213–218
decline stage, 212–213
growth stage, 209–211
introduction stage, 207–208
maturity stage, 207, 212
role of customers in. See Customer(s)
shakeout stage, 207, 211–212
Industry standards, 209, 284–285
Industry value chain, 242
related or supporting industries, 330–331
variable profitability in, 251
vertical integration along, 250–256
Inflation, 61
Influence costs, 266
Information asymmetry
adverse selection and, 385
in contracting, 246, 247
moral hazard and, 385–386
principal-agent problem and, 384
Initial public offering (IPO), 246, 390
Innovation, 200–204
case study of, 199, 231
commercialization of new products,
203–204
as cost and value driver, 183–184
disruptive. See Disruptive innovation
entrepreneurship and, 204–206
ethical issues, 233–234
fostering in organizational culture, 365
implications for strategist, 230
industry life cycle and, 206–218, 219
low-cost, 223, 224, 311
in organic organizations, 349
polycentric strategy, 315
as process, 202–204, 231–232
process innovation, 177, 178, 209–210
product innovation, 209, 210, 229
reverse innovation, 238nserendipity in (minicase), 412
serial innovation, 187
technological. See Technological innovation
types of, 219–230, 232
architectural vs. disruptive, 222–224
incremental vs. radical, 220–222
long-tail phenomenon, 225–227
open innovation, 227–230
technology and, 219–220
Innovation ecosystems, 222
Input controls, 364
Input factors, cost of, 173–174, 314–315
Inside directors, 386
Insider trading scandals, 384
Institutional investors, 14, 386
Intangible assets, 134–135
Intangible resources, 102–103, 109, 114–115
Integration
horizontal, 278–280, 292
vertical. See Vertical integration
Integration capabilities, 283
Integration-responsiveness framework, 322–328,
333–334
global-standardization strategy, 322, 324,
325–326, 328, 333, 359
international strategy, 323–324
multidomestic strategy, 324, 325
transnational strategy, 324, 326–327
Integration strategy, 164, 181–186, 191
attempts at, 7–8
competitive positioning and, 187–189
at corporate level, 260
failure of, 181, 182, 185–186
trade-offs in, 184, 188–189, 353
transnational strategy and, 326
value and cost drivers of, 183–185
Intellectual property (IP), 202, 317, 321, 324, 325
Intended strategy, 44–45
Interest rates, 61
Intermediate goods, 251
Internal analysis, 18, 96–122
case study, 97–98, 120
of core competencies, 99–102, 121
dynamic capabilities perspective, 101,
113–115, 121–122
implications for strategist, 117–120
resource-based view, 102–113, 121
core competencies in, 243
critical assumptions, 104
sustainable competitive advantage, 5, 21,
108, 110–113, 121
value chain perspective compared, 117
VRIO framework. See VRIO framework
SWOT analysis, 117–120, 122
value chain analysis, 100, 115–117, 122
Internal capital markets, 265–266, 355–356
Internal champions of innovation, 230
Internal resources, 294–295
Internal Revenue Service (IRS), 454
Internal stakeholders, 11
Internal transaction costs, 244–245
International expansion
advantages of, 313–315
access to larger markets, 313
access to low-cost inputs, 314–315
development of new competencies, 311,
315
cost-leadership strategy and, 315, 322,
413–415
disadvantages of, 315–317, 445
loss of reputation in, 316–317, 321
overexpansion (minicase), 429–431
International Monetary Fund (IMF), 63
International strategy, 333
characteristics, benefits, and risks, 327
example of (minicase), 413–415
functional structure used with, 358–359
integration-responsiveness framework,
323–324
Internet
as disruptive force, 225–227
effects on education industry, 223
effects on stock brokerage industry, 82–83
Internet businesses. See also Online retailers
acquisitions by, 281
“born global,” 310
entrepreneurship, 76
freemium business model, 151
national competitive advantage in, 328
search and advertising business, 285–286
startups, 109–110
Inter-organizational trust, 292
Intrapreneurs, 203
Introduction stage of industry life cycle, 207–
208, 219
Invention, 202
Inventory turnover ratio, 133
Investment and control continuum, 321–322
Investors
activist, 389–390
expectations of, 137
institutional, 14, 386
irrationality of, 139
limited liability of, 380
IP (intellectual property), 202, 317, 321,
324, 325
IPO (initial public offering), 246, 390
IRS (Internal Revenue Service), 454
Isolating mechanisms, 110
ISO 9000, 113
JJoint ventures (JVs), 249
as governing mechanism, 289, 290–291
learning races in, 287–288
Justice Department (DOJ), 254–255, 285
JVs. See Joint ventures
KKnowledge diffusion, 106, 227–230
LLabor
effect of globalization on wages, 312, 313
low-cost, access to, 314–315, 325
specialized division of, 246
Laggard customers, 216
Late majority customers, 216, 218
Lattice organizational form, 348
LBO (leveraged buyout), 390
Lean manufacturing, 183, 210
“Learning-by-doing” approach to alliances,
292–293
Learning-curve effects, 203
Learning curves, 176–177
Learning new capabilities, 287–288
Learning races, 287–288
Legal environment of firm, 59–60
Legal ownership of public stock companies, 381
Legal personality of public stock companies,
380
Legal responsibility, in CSR, 15
Lemons problem, 247
Level-5 leadership pyramid, 38–39
Leveraged buyout (LBO), 390
Liability of foreignness, 315, 445
Libor (London Interbank Offered Rate),
455–456
Licensing agreements, 248, 288, 324
Limited liability of public stock companies, 380
Liquidity events, 246
Local expertise in global markets, 311
Localization strategy (minicase), 440–443
Local markets, 109–110
Local responsiveness, 322, 323
example of (minicase), 440–443
minimizing, 325, 326
Location as barrier to entry, 70
Location economies, 315
London Interbank Offered Rate (Libor),
455–456
Long Tail The, (Anderson), 225
Long-tail phenomenon, 225–227, 232
Long-term contracts, 248
Long-term orientation, 319
Low-cost innovation, 223, 224, 311
Low-cost leader, 172, 180
Low-powered incentives, 246
Luck, 111
WWW.YAZDANPRESS.COMWWW.YAZDANPRESS.COM

I-16 SUBJECT INDEX
MMaintain strategy, 213
Make-or-buy continuum
alternatives to, 247–250
parent-subsidiary relationships,
249–250
short-term contracts, 247–248, 274nstrategic alliances, 248–249
firms vs. markets, 245–247
Management control of public stock companies,
381
Manager(s)
alliance manager, 293
functional managers, 40, 45, 50
general managers, 40, 50
Managerial hubris, 282
M&A. See Mergers and acquisitions
Market(s)
access to, 280, 285–286, 313
advantages and disadvantages of, 246, 313
core competence–market matrix, 264–265,
269
creating changes in, 114
disruptive innovation and, 223–224
efficient-market hypothesis, 136
emerging markets, 223, 224
entry into foreign markets, 321–322, 333
industry life cycle and, 212, 219
information asymmetry in, 246, 247
internal capital markets, 265–266,
355–356
local markets, 109–110
organization of economic activity by, 245,
246–247, 268–269
social market economies, 380
thin market problem, 226–227
Market capitalization, 136
Market for corporate control, 389–391, 398
Markets-and-technology framework, 219–230,
232
architectural vs. disruptive innovation,
222–224
incremental vs. radical innovation,
220–222
long-tail phenomenon, 225–227
open innovation, 227–230
Market share, 212, 243
Masculinity-femininity dimension of culture,
319, 339nMass customization, 183
Massive open online courses (MOOCs), 223
Mass market, transition to, 215–216
Matrix structure, 357–359, 368
Maturity stage of industry life cycle, 207, 212,
219
MBA oath, 395
Mechanistic organizations, 349–351, 352,
368
Media industries
business media, 391
convergence in, 83
cultural distance and, 326
intellectual property exposure, 317
mergers and acquisitions in, 277, 278,
296–297
motion pictures, 306–307, 317, 332
role of complements in, 82
television, 200–201
Medical products industry, 78
Mergers and acquisitions (M&A), 278–283,
297
ability to integrate and, 296
case study, 277, 296–297
competitive advantage and, 282–283, 297
as corporate strategy, 261, 293
implications for strategist, 294–296
merging with competitors, 278–280, 281
reasons for, 280–281
MES (minimum efficient scale), 174, 175–176
Metaphors, 33–34
M-form (multidivisional structure), 351, 355–
356, 368
Microcredit, 383
Millennials (generation Y), 147–148, 401–402
Minimum acceptable standards, 392
Minimum efficient scale (MES), 174, 175–176
Mission, 31, 32, 98–99
MNEs. See Multinational enterprises
Mobility barriers, 84–85, 86
Monopolistic competition, 76–77
Monopoly, 76, 77–78, 202, 255
MOOCs (massive open online courses), 223
Moral hazard, 385–386
Most Admired Companies list, 12
Most Ethical Companies award, 12
Motor Trend, 216
Multidivisional structure (M-form), 351, 355–
356, 368
Multidomestic strategy, 324, 325, 328, 333,
359
Multinational enterprises (MNEs)
expansion of, 313–315
foreign direct investment by, 309–310,
333
international strategy used by, 324
Multipoint competition (minicase), 424–426
NNAFTA (North American Free Trade Agree-
ment), 320
NASDAQ computer index, 136–137
NASDAQ index, 60
National competitive advantage, 328–331
availability of complementors in, 330–331
factor conditions in, 329–330
industry leadership, 328–329
National culture, 318–319
Natural monopolies, 78
Near monopolies, 78
Network effects
as entry barrier, 69
as first-mover advantage, 203
leveraging to drive demand, 208
Networking, 301–302
Network structure, 358
New-product introduction, 144
NGOs (nongovernmental organizations), 383
Nonconsumers, 383
Non-diversified companies, 257
Noneconomic factors, 146–148
Non-equity alliances, 288–289
Nongovernmental organizations (NGOs), 383
Non-market strategies, 60
Non-price competition, 75, 77
Nonprofit organizations, 31
Non-size advantages, 70
Norms, 359, 360, 363–364, 392
North American Free Trade Agreement
(NAFTA), 320
Not-invented-here syndrome, 227–228
Nuclear power industry, 79
OOccupy Wall Street movement, 11
OEMs (original equipment manufacturers), 251,
252, 317
Off-balance sheet items, 134
Off-shoring, 256
Oligopoly, 76, 77, 93n, 253
Online retailers. See also Internet businesses
auctions, 69, 226
crowdsourcing by, 149
entrepreneurs, 76
thin market problem, 226–227
trading platforms for (minicase), 446–448
On-the-job consumption, 384–385
Open innovation model, 203, 227–230,
232–233
Open-source software industry, 151, 245
Opportunism, 246, 254
Opportunities
loss of (minicase), 449–450
in SWOT analysis, 117–119
Opportunity costs, 142
Organic organizations, 349–350, 352–353, 368
Organizational complexity of matrix structure,
358
Organizational culture, 343, 359–363, 367,
368
adaptation in, 361
changing (minicase), 437–439
competitive advantage and, 361–363
ethical climate of firm, 392–394
fostering innovation in, 365
informal, 348
in integration strategy, 184
norms in, 359, 360, 363–364
in organizational design, 345
origins of, 360–361
as powerful motivator, 363–364
social complexity of, 113, 126, 363
strong cultures, 360, 361, 362
values in, 359, 360, 361
VRIO framework and, 361, 362–363
Organizational design, 18, 342–368
case study of, 343–344, 367
for competitive advantage, 346–351
key structural elements, 346–349
mechanistic vs. organic organizations,
349–351, 368
organizational inertia and, 346, 347,
367
competitive disadvantage and (minicase),
451–453
control-and-reward systems, 345, 363–365,
368
implications for strategist, 365, 366
organizational culture and. See Organiza-
tional culture
organizational structure. See Organizational
structure
Organizational hierarchy, 349, 350, 381, 385
Organizational inertia
failure of firms due to, 346, 347, 367
incremental innovation and, 221–222
WWW.YAZDANPRESS.COMWWW.YAZDANPRESS.COM

SUBJECT INDEX I-17
loss of opportunity due to (minicase),
449–450
Organizational structure, 351–359, 367, 368
alignment with vision statement, 34–35
flat structure, 344, 349
following strategy, 346
functional, 351–355, 368
drawbacks of, 352, 354–355
for single- or dominant-business firms,
356, 357
used with international strategy, 358–359
use with various strategies, 352–354
hybrid structures, 248–249
key elements of, 346–349
lack of, 107–108
matrix structure, 357–359
mechanistic vs. organic, 349–351, 368
multidivisional, 351, 355–356
in organizational design, 345
simple, 351, 352
tall structure, 349
Organizational values, 35, 36, 49
case study of, 377–379, 396–397
core values, 343–344, 367
Organization to capture value, 101, 107–108
Original equipment manufacturers (OEMs), 251,
252, 317
Output controls, 364–365
Outside directors, 386
Ownership of corporation, 380
PPaaS (platform as a service), 262
Parent-subsidiary relationships, 249–250
Pareto principle, 225–227
Partner(s)
in alliance formation, 291–292
closeness with, 295–296
Partner commitment, 292
Partner compatibility, 292
Patent(s), 70, 106–107, 202
Patent and Trademark Office, U.S., 202, 203
Path dependence, 110–112
Payables turnover ratio, 133–134
Pay-as-you-go business model, 150–151
Peer control, 363–364
Perceived value
changing (minicase), 410–411
customer experience and, 362
in differentiation strategy, 169, 170, 181
Perfect competition, 76, 104, 251
Performance metrics, 129, 130–131. See also
Firm performance
external, 136
financial ratios, 131–135
Personal branding (minicase), 408–409
Personal strategy
career advantage, 24–25
career prospects, 92
cultural “fit,” 372
diversification, 272–273
entrepreneurship, 235
generational tension, 401–402
global mind-set, 336–337
networking, 301–302
personal capabilities, 124–125
value and cost drivers, 194
value of MBA, 158
values, 53
Per-unit costs, 174–176
PESTEL framework, 58–64, 88–89, 118
ecological factors, 64
economic factors, 60–62, 63
implications for strategist, 86, 87
legal environment, 59–60
political environment, 59, 60
sociocultural factors, 62
technological factors, 64
Pharmaceutical industry
alliance management in, 293
horizontal integration in, 278–279
not-invented-here syndrome in, 228
sales forces in, 280
strategic alliances in, 286–287
Philanthropic responsibility, 16
Photography industry, 223
Physical-asset specificity, 253–254
Piracy of copyrighted material, 332
Planned emergence, 44–47, 348
Platform as a service (PaaS), 262
Poison pills, 391
Political distance, 319, 320
Political environment of firm, 59, 60, 79, 250
Polycentric innovation strategy, 315
Positive-sum co-opetition, 82, 89
Power distance, 319
Power-distance dimension of culture,
338n–339nPrice
as competitive weapon, 212
industry life cycle and, 219
premium pricing, 169, 214
Price sensitivity, 73
Price stability, 61–62
Price wars, 71
Pricing options, 141, 182–183
Pricing strategy, 288
Primary activities, 117
Principal-agent problem, 246
ethical issues, 383–385
in mergers and acquisitions, 282
Private equity firms, 390
Privately held companies, 257
Process innovation, 177, 178, 209–210
Producer surplus (profit), 140–141
Product(s)
features of, 169, 171, 180
new, commercialization of, 203–204
new-product introduction, 144
Product diversification strategy, 257
Product innovation, 209, 210, 229
Productivity frontier, 186–189
Product-market diversification strategy, 257
Product organization, 40
Product-oriented vision statements, 32–33, 34,
49
Profit (producer surplus), 140–141
Profitability, 151, 154
measuring, 130, 131–135, 143
relative, 135
variable, 251
Profit potential, 65, 66–67, 68, 88
power of suppliers and, 71–72
of strategic groups, 86
Profit sanctuaries, 86
Proprietary software, 245
Prosumers, 149
Publicly traded companies, 380–381, 398
corporate strategies of, 257
need for growth in, 294
separation of ownership and control in, 246
Public utilities, 78
QQualitative performance dimension, 152
Quality, 183, 254
Quantitative performance dimension, 152
“Question marks,” 265
RRadical innovation, 220–221
Railroad industry, 32–33
R&D. See Research and development
R&D expense / revenue ratio, 132
RAP (resource allocation process), 44, 45, 47
Rare resources, 105, 106
Raw materials
access to, 70, 314
controlling supply of, 173
“ethical sourcing” of, 317
vertical integration and, 250
Razor–razor-blade business model, 150, 204,
220–221, 222
Real estate, 10, 60–61, 110, 393
Realized strategy, 44–47
Real-options perspective, 286–287
Receivables turnover ratio, 133
Regional clusters, 383
Regional geographic clusters, 328, 331
Related-constrained diversification, 258, 259,
266
Related diversification strategy, 258–259, 263,
356, 357
Related-linked diversification, 258, 259, 266,
277, 278, 296–297
Relational capability, 293
Relational view of competitive advantage, 284
Relationships, 126nCRM software, 262
face-to-face meetings and, 37
of firm to society, 10
parent-subsidiary, 249–250
Relative distance, 318
Reputation of firm, 12, 316–317, 321
Requests for proposals (RFPs), 247–248
Research and development (R&D)
closed innovation model, 227–228,
232–233
as core competency, 207, 208
firm investment in, 132
open innovation model, 228–229, 232–233
spreading costs of, 175
time compression diseconomies in, 112
Reservation price, 139
Resource(s)
broadly defined, 103–104
costly to imitate, 106–107
dynamic reconfiguration of, 114
ethical/social issues, 123
future value of, 108, 110
intangible, 102–103, 109, 114–115
internal, 294–295
rare, 105, 106
tangible, 100, 102–103, 109, 121
unique, leveraging (minicase), 408–409
valuable, 105–106, 108, 110
Resource allocation process (RAP), 44, 45, 47
WWW.YAZDANPRESS.COMWWW.YAZDANPRESS.COM
I-18 SUBJECT INDEX
Resource-based view of firm, 99, 102–113, 121
core competencies in, 243
critical assumptions, 104
sustainable competitive advantage, 5, 21,
108, 110–113, 121
value chain perspective compared, 117
VRIO framework. See VRIO framework
Resource flows, 114–115
Resource heterogeneity, 104
Resource immobility, 104
Resource leakage, 115
Resource stocks, 114, 115
Restrictive policies, 71
Restructuring, 264–265
in candy industry, 281
case study, 241, 267–268
Results-only-work-environments (ROWEs),
364–365
Retail industry
big-box retailers, 73–74
failure of integration strategy, 185–186
international strategy in (minicase),
413–415
Internet businesses. See Online retailers
value chain in, 116
Return on assets (ROA), 131
Return on equity (ROE), 131
Return on invested capital (ROIC), 129, 131, 132
Return on revenue (ROR), 131, 132
Revenue sources, 308
Reverse innovation, 238nReverse social engineering, 113
RFPs (requests for proposals), 247–248
Risk capital, 135
ROA (return on assets), 131
ROE (return on equity), 131
ROIC (return on invested capital), 129, 131, 132
ROR (return on revenue), 131, 132
ROWEs (results-only-work-environments),
364–365
SSaaS (software as a service), 262
S&P 500 firms, 135
Sarbanes-Oxley Act (SOX) of 2002, 15, 131
SBUs. See Strategic business units
Scandals
accounting scandals, 10, 392
banking business (minicase), 454–456
ethics violations (case study), 377–379,
396–397
insider trading, 384
securities fraud, 393
superstar endorsements, 97–98, 120
Scenario planning, 42–44, 50
Scope of competition, 167–168
SCP (Structure-Conduct-Performance) model, 93nSearch costs, 246
Second movers, 221
Securities and Exchange Commission (SEC),
131, 136, 391, 398, 454
Securities fraud, 393
Selling, general, & administrative expense
(SG&A), 132
Serendipity, 44, 45
Serial innovation, 187
Service bundles, 171
Service industries, 248, 251, 325
7 Habits of Highly Effective People The, (Covey),
396
SG&A (selling, general, & administrative
expense), 132
SG&A expense / revenue ratio, 132
Shakeout stage of industry life cycle, 207,
211–212, 219
Shapewear industry, 211
Shared value, 381–383
Shared value creation framework, 380–383, 397
Shareholder(s)
interests of, 14, 15
lawsuits against board of directors, 386
total return to, 136
views of firm, 144
Shareholder capitalism, 380
Shareholder value creation, 131, 135–139, 143,
151, 154–155
Short head of distribution curve, 225–226
Short-term contracting, 247–248, 274nShort-term performance, 346, 367
Simple structure, 351, 352, 368
Single-business firms, 257, 258, 263
functional structure for, 356, 357
output controls in, 364
Site specificity, 253
Six Sigma, 113, 210
Smartphone industry
chasm-crossing in, 217–218, 219
conglomerates in (minicase), 437–439
industry life cycle of, 206–207
innovation in, 203
intellectual property and, 202
role of complements, 80, 82
vertical integration in, 250–252
Social complexity
in organizational culture, 113, 126, 363
in sustainable competitive advantage, 113, 126nSocial entrepreneurship, 205–206, 231
Social factors as exit barrier, 80
Socialization to firm culture, 360
Social market economies, 380
Social networking, 46–47, 320, 406–407
Social obligations of firms, 380
Society, relationship of firms to, 10
Soft drink industry, 77
Software as a service (SaaS), 262
Software industry
diversification strategy in, 262
domination of, 175
intellectual property losses in, 317
national competitive advantage in, 328
SOX (Sarbanes-Oxley Act of 2002), 15, 131
Span of control, 349
Specialization, 347, 350
Specialized assets, 253–254
Specialized division of labor, 246
Stakeholder(s), 10–16, 21
attributes of, 13
internal vs. external, 11
stakeholder impact analysis, 12–16, 21
stakeholder strategy, 11–12
Stakeholder impact analysis, 12–16, 21
addressing concerns, 16
identifying stakeholders, 13–14
interests and claims, 14
opportunities and threats, 14
social responsibilities, 15–16
Stakeholder management, 12
Stakeholder strategy, 380
Stakeholder theory, 147, 383, 396
Standard(s)
establishment of, 209, 210
late majority customers and, 216
minimum acceptable standards, 392
Wintel standard, 209, 238fStandardization
economies of, 321, 350
global-standardization strategy, 322, 324,
325–326, 328, 333, 359
Standard of living, 312–313
Standard operating procedures, 347–348, 364
Standards wars, 209, 284–285
Star SBUs, 265
Startups, 109–110, 280–281
Steel industry, 254
Stock brokerage industry, 82–83
Stock market valuation metric, 137
Stock options, 388–389
Stock prices, volatility of, 137–139
Strategic alliances, 283–293, 297–298
entry into foreign markets and, 322
equity alliances, 248–249
governance mechanisms, 288–291, 298
equity alliances, 289–290
joint ventures, 289, 290–291
non-equity alliances, 288–289
hierarchical design of, 292
implications for strategist, 294–296
joint ventures, 249
long-term contracts, 248
management capability, 291–293, 298
alliance design, 292
alliance management, 292–293
partner selection, 291–292
reasons for, 284–288
entering new markets, 285–286
hedging against uncertainty, 286–287
learning new capabilities, 287–288
need for complementary assets, 287
strengthening competitive position,
284–285
Strategic alternatives, developing, 118–119
Strategic business units (SBUs), 40
co-opetition or competition among, 356, 357
in growth-share matrix, 264–265, 269
measuring competitive advantage for, 143
in multidivisional structure, 351, 355–356
Strategic commitments, 32, 79
Strategic control-and-reward systems, 345,
363–365, 368
input controls, 364
output controls, 364–365
Strategic entrepreneurship, 205
Strategic equivalence, 107
Strategic fit, 114, 117
Strategic group(s), 59, 83–86, 89–90
implications for strategist, 87
mapping, 84–86
mobility barriers in, 85, 86
Strategic group model, 83, 89–90
Strategic initiatives, 45, 223, 224, 241
Strategic leadership, 17, 30, 35–40, 49
integrity of, 395–396
strategy formulation, 39–40
tasks of strategic leaders, 37
top-down strategic planning, 41–42, 50
upper-echelons theory of, 37–39
WWW.YAZDANPRESS.COMWWW.YAZDANPRESS.COM

SUBJECT INDEX I-19
Strategic management, 4
Strategic management process, 28–50
case study, 29, 48–49
implications for strategist, 48
innovation and (minicase), 412
leadership. See Strategic leadership
loss of opportunity and (minicase), 449–450
making strategy, 41–47, 50
emergent strategy, 44–47
scenario planning in, 42–44
top-down strategic planning in, 41–42,
50, 348
vision, mission, and values, 30–35, 48, 49
organizational values, 35, 36
vision and mission, 29, 30–35
vision statements. See Vision statements
Strategic mistakes, 10
Strategic objectives, 219
Strategic outsourcing, 255–256
Strategic planning
dominant plan, 43
as top-down process, 41–42, 50, 348
Strategic positioning, 6, 65, 165–166
changing position, 163–164, 189–190
competing for advantage, 166
differentiation strategies (minicase),
434–436
staking out unique position, 8
trade-offs in, 6–7
Strategic thinking, 44
Strategic trade-offs, 166
Strategy, 2–21. See also specific strategiesAFI strategy framework. See AFI strategy
framework
business ethics and, 392–395, 398
at business level. See Business-level strategy
case study, 3, 19–20
implications for strategist, 19
nature of, 4–9, 19
competitive advantage and, 3, 5–9, 20–21
competitive challenge and, 4–5
industry vs. firm effects, 9, 21
stakeholders and. See Stakeholder(s)
sustainable, 146–147, 151
Strategy analysis (A), 4–5, 17–18
external. See External analysis
internal. See Internal analysis
in scenario planning, 42, 43
stakeholder impact analysis, 12–16, 21
Strategy and Structure (Chandler), 346
Strategy formulation (F), 18, 39–40, 43
Strategy implementation (I), 4, 5, 18, 344–345
balanced scorecard as tool for, 145–146
corporate governance and ethics, 376–398
failure of, 345
organizational design, 342–368
in scenario planning, 43
Strategy process, 17
Strengths, in SWOT analysis, 117–119
Strong cultures, 360, 361, 362
Structure-Conduct-Performance (SCP) model,
93n“Stuck in the middle,” 181, 182, 185–186, 188
Subscription-based business model, 150
Substitutes
availability of, 66
threat of, 74–75, 81, 93nSubstitution, 106, 107
Supplier(s)
in competitive advantage, 330–331
equity alliances with, 249
search for, 246
Supplier power, 66, 71–72, 81
bargaining power, 285
business-level strategies and, 179
effects on strategic groups, 85–86
as industry force, 88
Supply agreements, 288, 289
Supply chain management, 133
Support activities, 117
Sustainability, 111, 147
Sustainable competitive advantage, 5, 21, 108,
110–113, 121
causal ambiguity in, 112–113
future resource value, 108, 110
path dependence in, 110–112
social complexity in, 113, 126nSustainable strategy, 146–147, 151
Switching costs, 66, 69
SWOT analysis, 99, 117–120, 122, 365
TTacit knowledge, 289, 290, 325
Tactical tools, 8–9
Tall structure, 349
Tangible resources, 102–103, 109, 121
Taper integration, 255
Task environment, 58
Technological innovation, 58
accessing, 290
as core competency, 97
as driver in competition, 199
industry life cycle and. See Industry life
cycle
as intangible resource, 103
organization to capture value and,
107–108
in PESTEL framework, 64
rate of change, 201–202
Technology, 219–220
Technology enthusiasts, 214–215, 217
Telecommunications industry, 150, 283
Temporary competitive advantage, 106, 137
Textile industry, 321
Thin markets, 226
Threat(s), in SWOT analysis, 117–119
Threat of entry, 67–71, 81, 93n, 109, 179, 180
Threat of retaliation, 71
Threat of substitutes, 74–75, 81
business-level strategies and, 179, 180
effects on strategic groups, 85
Tightly coupled systems, 346
Time compression diseconomies, 112
Top-down processes
innovation as, 230
standard setting, 209
strategic planning, 41–42, 50, 348
Total invested capital metric, 129
Total perceived consumer benefits, 140–141
Total return to shareholders, 136
Trade-offs
in integration strategies, 184, 188–189,
353
in strategic positioning, 6–7
Trade secrets, 70
Trading platforms (minicase), 446–448
Training programs, 361, 440
Transaction cost(s), 243, 244–245
Transaction cost economics, 244–250
forward integration and, 253
make-or-buy decision, 245–247
Transaction-specific investments, 246
Transferability of ownership, 380
Transnational strategy, 324, 326–327, 334
characteristics, benefits, and risks, 328
global matrix structure used with, 357, 358
Triple bottom line, 146–148, 151, 155, 205
Trust, in strategic alliances, 292
Typewriter industry, 200
UUncertainty, hedging against, 286–287
Uncertainty-avoidance dimension of culture,
319, 339nUnrelated diversification strategy, 258, 259, 263
managerial hubris and, 282
multidivisional structure for, 356, 357
Upper-echelons theory
of strategic leadership, 37–39
strategy formulation, 39–40
VValue, 140
consumer view of, 142, 164
perception of (minicase), 410–411
Value chain, 115, 116
direct and indirect addition to, 116
industry value chain, 242
related or supporting industries,
330–331
variable profitability in, 251
vertical integration along, 250–256, 269
integrated, 253
need for complementary assets, 287
Value chain analysis, 99, 100, 115–117, 122
Value creation, 6
as differentiation strategy, 170
diversification strategy and, 263
economic. See Economic value creation
narrowly defined, 381
by new-product introduction, 144
shareholder value, 131, 135–139, 143, 151,
154–155
vertical integration and, 245
Value drivers
in differentiation strategy, 168–171, 191
complements, 171
customer service, 171
product features, 169, 171
in integration strategy, 183–185
Values
of corporate executives, 35
cultural norms and values, 369–370
decision making driven by, 35, 36
organizational, 35, 36, 49
case study of, 377–379, 396–397
core values, 35, 343–344, 367,
377–378
in organizational culture, 359, 360, 361
personal, 53
Vertical disintegration, 251, 267
Vertical integration, 250–256, 269
WWW.YAZDANPRESS.COMWWW.YAZDANPRESS.COM

I-20 SUBJECT INDEX
alternatives to, 255–256
benefits of, 252–254
firms vs. markets, 245–247
risks of, 254–255
types of, 251–252
Virtual shelf-space, 226, 227
Virtual teams, 349
Virtuous cycle, 208
Vision, 29, 30–35
Vision statements, 31
customer-oriented, 33–35, 49
product-oriented, 32–33, 34, 49
VRIO framework, 104–108, 121
application of, 105,
109–110, 118
cost to imitate, 106–107
decision tree in, 105
organizational culture and, 361,
362–363
organization to capture value, 101,
107–108
rarity, 105, 106
strategic alliances and, 284, 292
value, 105–106
WWages, 312, 313
Wall Street Journal, The, 391
Weaknesses, in SWOT analysis, 117–119
Wineries, 328
Winner’s curse, 282, 391
Wintel standard, 209, 238fWisdom of crowds, 199
Working capital turnover ratio, 130, 132, 133
World Is Flat, The (T. Friedman), 360
World Trade Organization (WTO), 314
WWW.YAZDANPRESS.COMWWW.YAZDANPRESS.COM
Copyright © 2022 FDOKUMEN

