


Bahasa
Halaman
Hukum

2019 2019

2019
World health statistics 2019: monitoring health for the SDGs, sustainable development goals
ISBN 978-92-4-156570-7
© World Health Organization 2019
Some rights reserved. This work is available under the Creative Commons Attribution-NonCommercial-ShareAlike 3.0 IGO licence (CC BY-NC-SA 3.0 IGO; https://creativecommons.org/licenses/by-nc-sa/3.0/igo).
Under the terms of this licence, you may copy, redistribute and adapt the work for non-commercial purposes, provided the work is appropriately cited, as indicated below. In any use of this work, there should be no suggestion that WHO endorses any specific organization, products or services. The use of the WHO logo is not permitted. If you adapt the work, then you must license your work under the same or equivalent Creative Commons licence. If you create a translation of this work, you should add the following disclaimer along with the suggested citation: “This translation was not created by the World Health Organization (WHO). WHO is not responsible for the content or accuracy of this translation. The original English edition shall be the binding and authentic edition”.
Any mediation relating to disputes arising under the licence shall be conducted in accordance with the mediation rules of the World Intellectual Property Organization.
Suggested citation. World health statistics 2019: monitoring health for the SDGs, sustainable development goals. Geneva: World Health Organization; 2019. Licence: CC BY-NC-SA 3.0 IGO.
Cataloguing-in-Publication (CIP) data. CIP data are available at http://apps.who.int/iris.
Sales, rights and licensing. To purchase WHO publications, see http://apps.who.int/bookorders. To submit requests for commercial use and queries on rights and licensing, see http://www.who.int/about/licensing.
Third-party materials. If you wish to reuse material from this work that is attributed to a third party, such as tables, figures or images, it is your responsibility to determine whether permission is needed for that reuse and to obtain permission from the copyright holder. The risk of claims resulting from infringement of any third-party-owned component in the work rests solely with the user.
General disclaimers. The designations employed and the presentation of the material in this publication do not imply the expression of any opinion whatsoever on the part of WHO concerning the legal status of any country, territory, city or area or of its authorities, or concerning the delimitation of its frontiers or boundaries. Dotted and dashed lines on maps represent approximate border lines for which there may not yet be full agreement.
The mention of specific companies or of certain manufacturers’ products does not imply that they are endorsed or recommended by WHO in preference to others of a similar nature that are not mentioned. Errors and omissions excepted, the names of proprietary products are distinguished by initial capital letters.
All reasonable precautions have been taken by WHO to verify the information contained in this publication. However, the published material is being distributed without warranty of any kind, either expressed or implied. The responsibility for the interpretation and use of the material lies with the reader. In no event shall WHO be liable for damages arising from its use.
Photo credits: WHO
Design and layout by L’IV Com Sàrl, Switzerland
Printed in Switzerland
iiiMONITORING HEALTH FOR THE SDGs
CONTENTS
Foreword . . . . . . . . . . . . . . . . . . . . . . . . . . . . . . . . . . . . . . . . . . . . . . . . . . . . . . . . . . . . . . . . . . . . . . . . . . . . . . . v
Abbreviations . . . . . . . . . . . . . . . . . . . . . . . . . . . . . . . . . . . . . . . . . . . . . . . . . . . . . . . . . . . . . . . . . . . . . . . . . . . vi
Introduction . . . . . . . . . . . . . . . . . . . . . . . . . . . . . . . . . . . . . . . . . . . . . . . . . . . . . . . . . . . . . . . . . . . . . . . . . . . . . 1
1. Life expectancy and causes of death . . . . . . . . . . . . . . . . . . . . . . . . . . . . . . . . . . . . . . . . . . . . . . . . . . . . . . 3
2. Reproductive and maternal health . . . . . . . . . . . . . . . . . . . . . . . . . . . . . . . . . . . . . . . . . . . . . . . . . . . . . . . 10
3. Newborn and child health . . . . . . . . . . . . . . . . . . . . . . . . . . . . . . . . . . . . . . . . . . . . . . . . . . . . . . . . . . . . . . 16
4. Infectious diseases . . . . . . . . . . . . . . . . . . . . . . . . . . . . . . . . . . . . . . . . . . . . . . . . . . . . . . . . . . . . . . . . . . . 23
5. Noncommunicable diseases . . . . . . . . . . . . . . . . . . . . . . . . . . . . . . . . . . . . . . . . . . . . . . . . . . . . . . . . . . . . 31
6. Injuries and violence . . . . . . . . . . . . . . . . . . . . . . . . . . . . . . . . . . . . . . . . . . . . . . . . . . . . . . . . . . . . . . . . . . 36
7. Environmental risks . . . . . . . . . . . . . . . . . . . . . . . . . . . . . . . . . . . . . . . . . . . . . . . . . . . . . . . . . . . . . . . . . . 40
8. Universal health coverage and health systems . . . . . . . . . . . . . . . . . . . . . . . . . . . . . . . . . . . . . . . . . . . . . 46
9. Summary of findings . . . . . . . . . . . . . . . . . . . . . . . . . . . . . . . . . . . . . . . . . . . . . . . . . . . . . . . . . . . . . . . . . 53
10. Highlights and ways forward . . . . . . . . . . . . . . . . . . . . . . . . . . . . . . . . . . . . . . . . . . . . . . . . . . . . . . . . . . . 61
References . . . . . . . . . . . . . . . . . . . . . . . . . . . . . . . . . . . . . . . . . . . . . . . . . . . . . . . . . . . . . . . . . . . . . . . . . . . . . 63
Annex 1. Regional highlights of health-related SDG indicators . . . . . . . . . . . . . . . . . . . . . . . . . . . . . . . . . . . . 67
Annex 2. Tables of health statistics by country, WHO region and globally . . . . . . . . . . . . . . . . . . . . . . . . . . . . 81
Annex 3. WHO regional groupings . . . . . . . . . . . . . . . . . . . . . . . . . . . . . . . . . . . . . . . . . . . . . . . . . . . . . . . . . . 120

vMONITORING HEALTH FOR THE SDGs
Dr Tedros Adhanom Ghebreyesus Director-GeneralWorld Health Organization
FOREWORD
For 71 years, the World Health Organization (WHO) has had one vision: the highest attainable standard of health for all people in all countries. Reliable data are vital for assessing whether we are making progress towards that vision, for highlighting areas of progress and for exposing where we need to change course.
Health trends are constantly evolving, and so are health systems. No health system is perfect, and all countries have people who are left behind. It is therefore important to accurately document the state of global health and how it is changing.
The World health statistics, published annually since 2005, is WHO’s annual snapshot of the state of the world’s health. Since 2016, the World Health Statistics series has focused on monitoring progress toward the Sustainable Development Goals (SDGs), and the 2019 edition contains the latest available data for the health-related SDG indicators.
The SDGs address inequality wherever it exists. The 2019 edition reports on trends over time and disaggregates data by WHO region, World Bank income group, and sex to identify key inequalities. The report reveals that in low-income countries, health is frequently compromised by diseases and conditions that are preventable or treatable. Many premature deaths are associated with environmental factors or the leading underlying causes of death, such as tobacco use, unhealthy diet, physical inactivity and unhealthy consumption of alcohol.
Although the World health statistics 2019 tells its story with numbers, the consequences are human. In low-income countries, one woman in 41 dies from maternal causes, and each maternal death greatly affects the health of surviving family members and the resilience of the community. Not only are the risks of maternal deaths elevated by poverty, but their occurrence perpetuates the cycle of poverty in poor communities from one generation to the next.
We must be relentless in our pursuit of solutions to such human tragedies, and our responses must be informed by robust, reliable data on health risks, access to services and health outcomes. At present, many countries lack the health information systems they need to accurately monitor health trends and inform decision-making. That is why WHO is creating an entirely new process for strategic policy dialogue with countries, using evidence and information strategically to drive change.
We will continue to work with countries to strengthen their information systems for health and generate better data. We will also build a modern data backbone that allows sharing and analysis of data among the three levels of WHO and countries. And we will make investments to strengthen analytical capacity at all levels, to identify trends, make projections and support acceleration of progress toward achieving health targets.
Behind every number in these pages is a person, a family, a community and a nation. My hope is that governments, health providers, academics, civil society organizations, the media and others use these numbers to promote health, keep the world safe and serve the vulnerable.
vi WORLD HEALTH STATISTICS 2019
AFR WHO African Region AIDS acquired immunodeficiency syndrome AMR WHO Region of the Americas COPD chronic obstructive pulmonary disease COSI Childhood Obesity Surveillance InitiativeCRD chronic respiratory disease CRVS civil registration and vital statisticsCVD cardiovascular disease DHS demographic and health surveysDTP3 diphtheria-tetanus-pertussis third dose EMR WHO Eastern Mediterranean Region EUR WHO European Region FGM female genital mutilationGGE general government expenditure GHO Global Health ObservatoryHALE healthy life expectancy HBV hepatitis B virusHES health examination surveyHI high income HIV human immunodeficiency virus IHR International Health Regulations ITN insecticide-treated mosquito netLAC Latin America and the CaribbeanLI low income LMI lower-middle income LMIC low- and middle-income countriesM/F male to female (ratio) MCV2 measles-containing vaccine second dose MIS malaria indicator surveysMMR maternal mortality ratiosNCD noncommunicable disease NTD neglected tropical disease ODA official development assistance PAHO Pan American Health Organization PCV3 pneumococcal conjugate vaccine third dose PPP purchasing power parityPrEP pre-exposure prophylaxisSCI service coverage indexSDG Sustainable Development GoalSEAR WHO South-East Asia Region TB tuberculosis UHC universal health coverage UMI upper-middle income UN United NationsUNICEF United Nations Children’s FundWASH water, sanitation and hygiene for all WB World Bank WHO World Health Organization WPR WHO Western Pacific Region
ABBREVIATIONS
1MONITORING HEALTH FOR THE SDGs
INTRODUCTION
The World Health Statistics series is the World Health Organization’s (WHO’s) annual compilation of health statistics for its 194 Member States. The series is produced by WHO’s Division for Data, Analytics and Delivery, in collaboration with WHO technical departments and regional offices.
World health statistics 2019 summarizes recent trends and levels in life expectancy and causes of death (Section 1) and reports on the health and health-related Sustainable Development Goals (SDGs) and associated targets (Sections 2–8). It then summarizes the major findings, including the availability of underlying data for monitoring progress towards the health-related SDGs (Section 9), and concludes by briefly discussing the implications for health policy and the planning of programmes (Section 10). Annex 1 provides regional level statistics, Annex 2 presents country-level statistics for selected health-related SDG indicators and Annex 3 summarizes WHO regional groupings.
The 2019 report disaggregates data by WHO region, World Bank income group1 and sex where possible, and it discusses differences in health status and access to preventive and curative services, particularly in relation to differences between men and women. Where possible, it indicates the roles of sex, as a biological determinant, and gender, as a social construct, in accounting for the observed differences as shown in the table below. Because the focus of World health statistics is on life expectancy, causes of death and SDG indicators, it does not capture some important health differences between men and women such as anaemia or other morbidities. In addition, the report summarizes national data and differences between countries, but does not undertake subnational analysis of the interaction between sex differences in health-related indicators and other factors such as household wealth, ethnicity and geographical location. Finally, there have been gaps in the datasets available for analysis, meaning that the analyses presented are not exhaustive. Nonetheless, it is hoped that the report will raise awareness of some critical sex and gender differences in health outcomes, highlight the importance of those differences in the attainment of the SDGs, and encourage the roles of sex and gender to be systematically taken into account when collecting data, analysing health situations, formulating policies and designing health programmes.
The statistics presented in World health statistics 2019 are official WHO statistics based on data available for global monitoring in March 2019. They have been compiled primarily using publications and databases produced and maintained by WHO or by United Nations (UN) groups of which WHO is a member, such as the UN Interagency Group for Child Mortality Estimation. Additionally, a number of statistics have been derived from data produced and maintained by other international organizations, such as the UN Department of Economic and Social Affairs and its Population Division.
The statistics presented are of two types:
• primary data – data compiled by international agencies from routine reporting by countries or publicly available sources such as demographic and health surveys (DHS); statistics are presented as they were reported or with modest adjustment; and
• comparable estimates – country data adjusted or modelled to allow comparisons between countries or over time. Comparable estimates are produced for countries with underlying primary data and, in some cases, also for those without.
In constructing estimates, Member States were asked to review the methodology, data input and the resulting estimates before the estimates were finalized. Comparable estimates are subject to considerable uncertainty, especially for countries where the availability and quality of the underlying primary data are limited. However, to ensure readability, the printed and online versions of the World Health Statistics series do not include the margins of uncertainty, which are instead made available through online WHO databases such as the Global Health Observatory (GHO).
1 Unless otherwise noted, the World Bank Income groupings used in this report refers to the World Bank’s classification of economies based on the gross national income (GNI) per capita corresponding to the year of the data or estimates.
2 WORLD HEALTH STATISTICS 2019
This report also considers the extent to which underlying data are available for use by WHO or other UN agencies or interagency groups. In World health statistics 2019, attention has been given to the availability of data by sex. More details on the indicators and statistics presented here are available from the GHO.
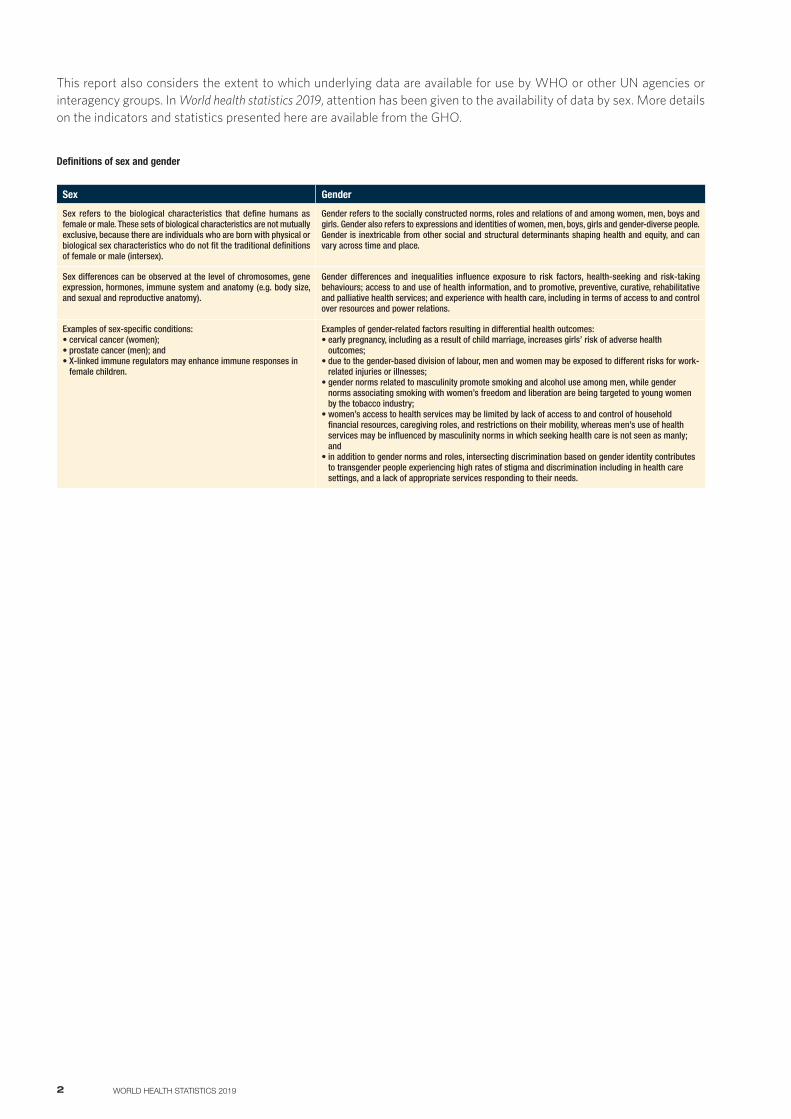
Sex Gender
Sex refers to the biological characteristics that define humans as female or male. These sets of biological characteristics are not mutually exclusive, because there are individuals who are born with physical or biological sex characteristics who do not fit the traditional definitions of female or male (intersex).
Gender refers to the socially constructed norms, roles and relations of and among women, men, boys and girls. Gender also refers to expressions and identities of women, men, boys, girls and gender-diverse people. Gender is inextricable from other social and structural determinants shaping health and equity, and can vary across time and place.
Sex differences can be observed at the level of chromosomes, gene expression, hormones, immune system and anatomy (e.g. body size, and sexual and reproductive anatomy).
Gender differences and inequalities influence exposure to risk factors, health-seeking and risk-taking behaviours; access to and use of health information, and to promotive, preventive, curative, rehabilitative and palliative health services; and experience with health care, including in terms of access to and control over resources and power relations.
Examples of sex-specific conditions: • cervical cancer (women);• prostate cancer (men); and• X-linked immune regulators may enhance immune responses in
female children.
Examples of gender-related factors resulting in differential health outcomes:• early pregnancy, including as a result of child marriage, increases girls’ risk of adverse health
outcomes; • due to the gender-based division of labour, men and women may be exposed to different risks for work-
related injuries or illnesses;• gender norms related to masculinity promote smoking and alcohol use among men, while gender
norms associating smoking with women’s freedom and liberation are being targeted to young women by the tobacco industry;
• women’s access to health services may be limited by lack of access to and control of household financial resources, caregiving roles, and restrictions on their mobility, whereas men’s use of health services may be influenced by masculinity norms in which seeking health care is not seen as manly; and
• in addition to gender norms and roles, intersecting discrimination based on gender identity contributes to transgender people experiencing high rates of stigma and discrimination including in health care settings, and a lack of appropriate services responding to their needs.
Definitions of sex and gender
3MONITORING HEALTH FOR THE SDGs
LIFE EXPECTANCY AND CAUSES OF DEATH 1
Women live longer than men, but the additional years are not always healthy
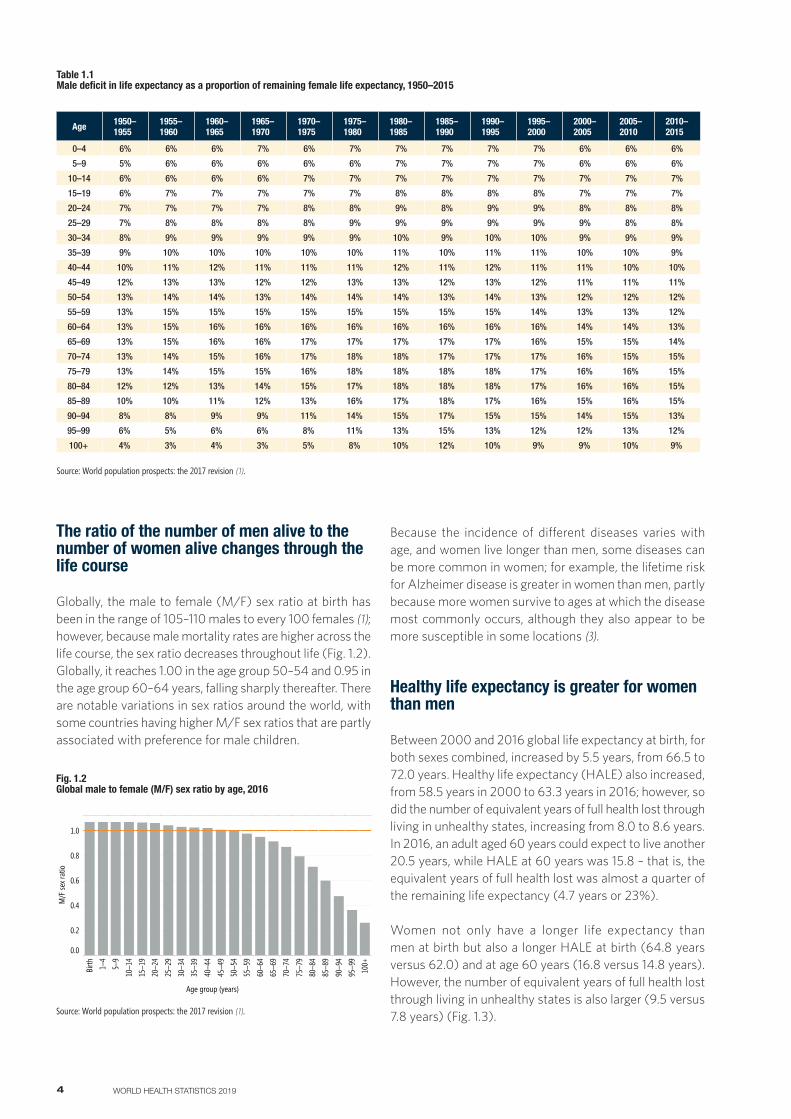
In 2019, more than 141 million children will be born: 73 million boys and 68 million girls (1). Based on recent mortality risks the boys will live, on average, 69.8 years and the girls 74.2 years – a difference of 4.4 years. Life expectancy at age 60 years is also greater for women than men: 21.9 versus 19.0 years. Women have a longer life expectancy than men at all ages (Fig. 1.1). Although the absolute difference in life expectancy decreases with age, the proportional difference increases from age 1 year up to age 80 years before it declines. Thus, women can expect to live 7.6% longer than men at age 20 years, and 14% longer at age 80 years. Differences in global life expectancy between men and women increased between 1950 and 1990 but have subsequently decreased (Table 1.1).
Fig. 1.1 Global life expectancy at different ages for men and women, 2016
0 10 20 30 40 50 60 70 80 90
Age
0
20
40
60
Life
expe
ctanc
y (ye
ars)
0
5
10
15
Diffe
renc
e as
a p
ropo
rtion
of r
emain
ing
fem
ale lif
eex
pecta
ncy (
%)
Males Females Difference
Source: WHO (2018) (2).
4 WORLD HEALTH STATISTICS 2019
The ratio of the number of men alive to the number of women alive changes through the life course
Globally, the male to female (M/F) sex ratio at birth has been in the range of 105–110 males to every 100 females (1); however, because male mortality rates are higher across the life course, the sex ratio decreases throughout life (Fig. 1.2). Globally, it reaches 1.00 in the age group 50–54 and 0.95 in the age group 60–64 years, falling sharply thereafter. There are notable variations in sex ratios around the world, with some countries having higher M/F sex ratios that are partly associated with preference for male children.
Age 1950–1955
1955–1960
1960–1965
1965–1970
1970–1975
1975–1980
1980–1985
1985–1990
1990–1995
1995–2000
2000–2005
2005–2010
2010–2015
0–4 6% 6% 6% 7% 6% 7% 7% 7% 7% 7% 6% 6% 6%
5–9 5% 6% 6% 6% 6% 6% 7% 7% 7% 7% 6% 6% 6%
10–14 6% 6% 6% 6% 7% 7% 7% 7% 7% 7% 7% 7% 7%
15–19 6% 7% 7% 7% 7% 7% 8% 8% 8% 8% 7% 7% 7%
20–24 7% 7% 7% 7% 8% 8% 9% 8% 9% 9% 8% 8% 8%
25–29 7% 8% 8% 8% 8% 9% 9% 9% 9% 9% 9% 8% 8%
30–34 8% 9% 9% 9% 9% 9% 10% 9% 10% 10% 9% 9% 9%
35–39 9% 10% 10% 10% 10% 10% 11% 10% 11% 11% 10% 10% 9%
40–44 10% 11% 12% 11% 11% 11% 12% 11% 12% 11% 11% 10% 10%
45–49 12% 13% 13% 12% 12% 13% 13% 12% 13% 12% 11% 11% 11%
50–54 13% 14% 14% 13% 14% 14% 14% 13% 14% 13% 12% 12% 12%
55–59 13% 15% 15% 15% 15% 15% 15% 15% 15% 14% 13% 13% 12%
60–64 13% 15% 16% 16% 16% 16% 16% 16% 16% 16% 14% 14% 13%
65–69 13% 15% 16% 16% 17% 17% 17% 17% 17% 16% 15% 15% 14%
70–74 13% 14% 15% 16% 17% 18% 18% 17% 17% 17% 16% 15% 15%
75–79 13% 14% 15% 15% 16% 18% 18% 18% 18% 17% 16% 16% 15%
80–84 12% 12% 13% 14% 15% 17% 18% 18% 18% 17% 16% 16% 15%
85–89 10% 10% 11% 12% 13% 16% 17% 18% 17% 16% 15% 16% 15%
90–94 8% 8% 9% 9% 11% 14% 15% 17% 15% 15% 14% 15% 13%
95–99 6% 5% 6% 6% 8% 11% 13% 15% 13% 12% 12% 13% 12%
100+ 4% 3% 4% 3% 5% 8% 10% 12% 10% 9% 9% 10% 9%
Table 1.1 Male deficit in life expectancy as a proportion of remaining female life expectancy, 1950–2015
Source: World population prospects: the 2017 revision (1).
Fig. 1.2 Global male to female (M/F) sex ratio by age, 2016
Birth 1–
4
5–9
10–1
4
15–1
9
20–2
4
25–2
9
30–3
4
35–3
9
40–4
4
45–4
9
50–5
4
55–5
9
60–6
4
65–6
9
70–7
4
75–7
9
80–8
4
85–8
9
90–9
4
95–9
9
100+
0.0
0.2
0.4
0.6
0.8
1.0
M/F
sex r
atio
Age group (years)
Source: World population prospects: the 2017 revision (1).
Because the incidence of different diseases varies with age, and women live longer than men, some diseases can be more common in women; for example, the lifetime risk for Alzheimer disease is greater in women than men, partly because more women survive to ages at which the disease most commonly occurs, although they also appear to be more susceptible in some locations (3).
Healthy life expectancy is greater for women than men
Between 2000 and 2016 global life expectancy at birth, for both sexes combined, increased by 5.5 years, from 66.5 to 72.0 years. Healthy life expectancy (HALE) also increased, from 58.5 years in 2000 to 63.3 years in 2016; however, so did the number of equivalent years of full health lost through living in unhealthy states, increasing from 8.0 to 8.6 years. In 2016, an adult aged 60 years could expect to live another 20.5 years, while HALE at 60 years was 15.8 – that is, the equivalent years of full health lost was almost a quarter of the remaining life expectancy (4.7 years or 23%).
Women not only have a longer life expectancy than men at birth but also a longer HALE at birth (64.8 years versus 62.0) and at age 60 years (16.8 versus 14.8 years). However, the number of equivalent years of full health lost through living in unhealthy states is also larger (9.5 versus 7.8 years) (Fig. 1.3).
5MONITORING HEALTH FOR THE SDGs
At birthMales Females
2000
2005
2010
2015
2016
2000
2005
2010
2015
2016
0
20
40
60
Year
s
At age 60 yearsMales Females
2000
2005
2010
2015
2016
2000
2005
2010
2015
2016
0
5
10
15
20
Lost HALE HALE
Source: WHO (2018) (2).
Fig. 1.3 Global life expectancy and HALE, 2000–2016
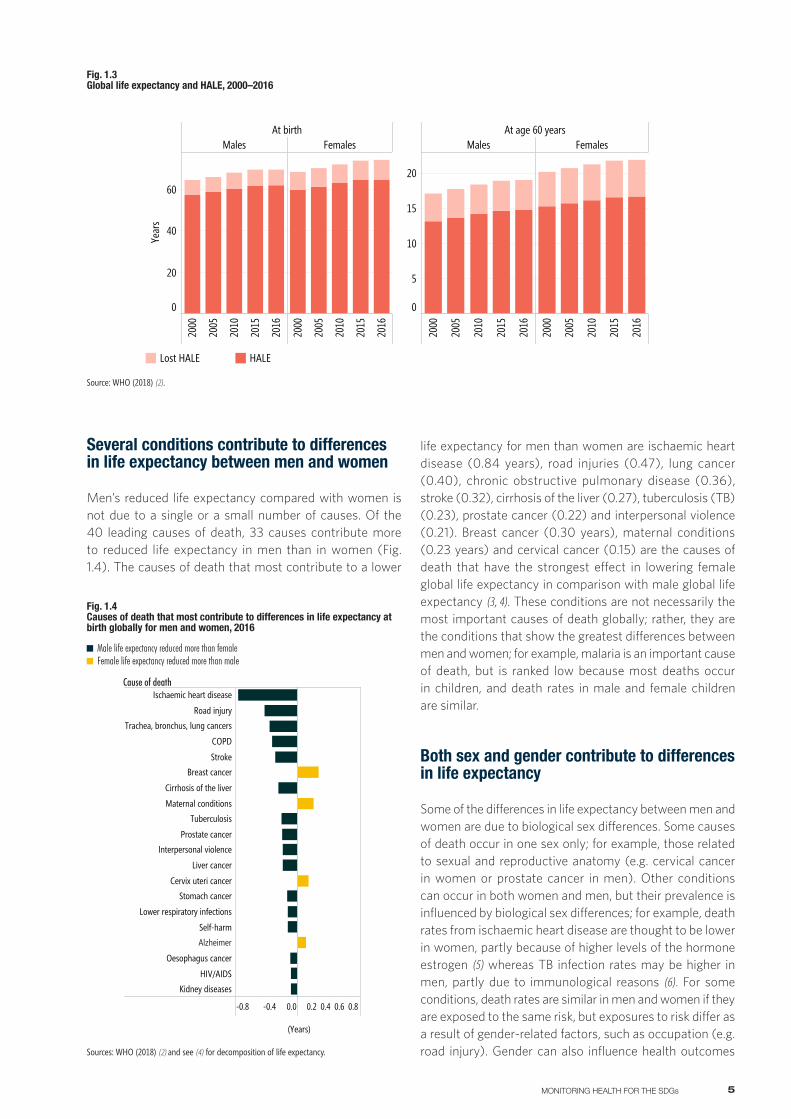
Several conditions contribute to differences in life expectancy between men and women
Men’s reduced life expectancy compared with women is not due to a single or a small number of causes. Of the 40 leading causes of death, 33 causes contribute more to reduced life expectancy in men than in women (Fig. 1.4). The causes of death that most contribute to a lower
life expectancy for men than women are ischaemic heart disease (0.84 years), road injuries (0.47), lung cancer (0.40), chronic obstructive pulmonary disease (0.36), stroke (0.32), cirrhosis of the liver (0.27), tuberculosis (TB) (0.23), prostate cancer (0.22) and interpersonal violence (0.21). Breast cancer (0.30 years), maternal conditions (0.23 years) and cervical cancer (0.15) are the causes of death that have the strongest effect in lowering female global life expectancy in comparison with male global life expectancy (3, 4). These conditions are not necessarily the most important causes of death globally; rather, they are the conditions that show the greatest differences between men and women; for example, malaria is an important cause of death, but is ranked low because most deaths occur in children, and death rates in male and female children are similar.
Both sex and gender contribute to differences in life expectancy
Some of the differences in life expectancy between men and women are due to biological sex differences. Some causes of death occur in one sex only; for example, those related to sexual and reproductive anatomy (e.g. cervical cancer in women or prostate cancer in men). Other conditions can occur in both women and men, but their prevalence is influenced by biological sex differences; for example, death rates from ischaemic heart disease are thought to be lower in women, partly because of higher levels of the hormone estrogen (5) whereas TB infection rates may be higher in men, partly due to immunological reasons (6). For some conditions, death rates are similar in men and women if they are exposed to the same risk, but exposures to risk differ as a result of gender-related factors, such as occupation (e.g. road injury). Gender can also influence health outcomes
Fig. 1.4 Causes of death that most contribute to differences in life expectancy at birth globally for men and women, 2016
Cause of death
-0.8 -0.4 0.0 0.2 0.4 0.6 0.8
Ischaemic heart disease
Road injury
Trachea, bronchus, lung cancers
COPD
Stroke
Breast cancer
Cirrhosis of the liver
Maternal conditions
Tuberculosis
Prostate cancer
Interpersonal violence
Liver cancer
Cervix uteri cancer
Stomach cancer
Lower respiratory infections
Self-harm
Alzheimer's
Oesophagus cancer
HIV/AIDS
Kidney diseases
(Years)
Cause of death
Male life expectancy reduced more than female Female life expectancy reduced more than male
Sources: WHO (2018) (2) and see (4) for decomposition of life expectancy.
Alzheimer
6 WORLD HEALTH STATISTICS 2019
Age group(years) Low income Lower-middle income Upper-middle income High income
04080
Males
0 40 80
Females
04080
Males
0 40 80
Females
04080
Males
0 40 80
Females
04080
Males
0 40 80
Females
70+60–6950–5930–4915–295–14
<5
(%)
Fig. 1.5 Proportion of deaths by age and World Bank income group, 2016 (%)
Source: WHO (2018) (2).
0
1–4
5–9
10–1
4
15–1
9
20–2
4
25–2
9
30–3
4
35–3
9
40–4
4
45–4
9
50–5
4
55–5
9
60–6
4
65–6
9
70–7
4
75–7
9
80–8
4
85+
0
5
10
15
Defic
it in
male
life
expe
ctanc
y as p
ropo
rtion
of re
main
ing
fem
ale lif
e ex
pecta
ncy (
%)
Low incomeLower-middle income
Upper-middle incomeHigh income
Age group (years)
Fig. 1.6 Male deficit in life expectancy as a proportion of remaining female life expectancy by World Bank income group, 2016
Source: WHO (2018) (2).
through differences in health literacy, availability of and access to health information and services, and provider knowledge and attitude. The exact contributions of sex and gender to health disparities are often hard to separate because they do not operate independently (7).
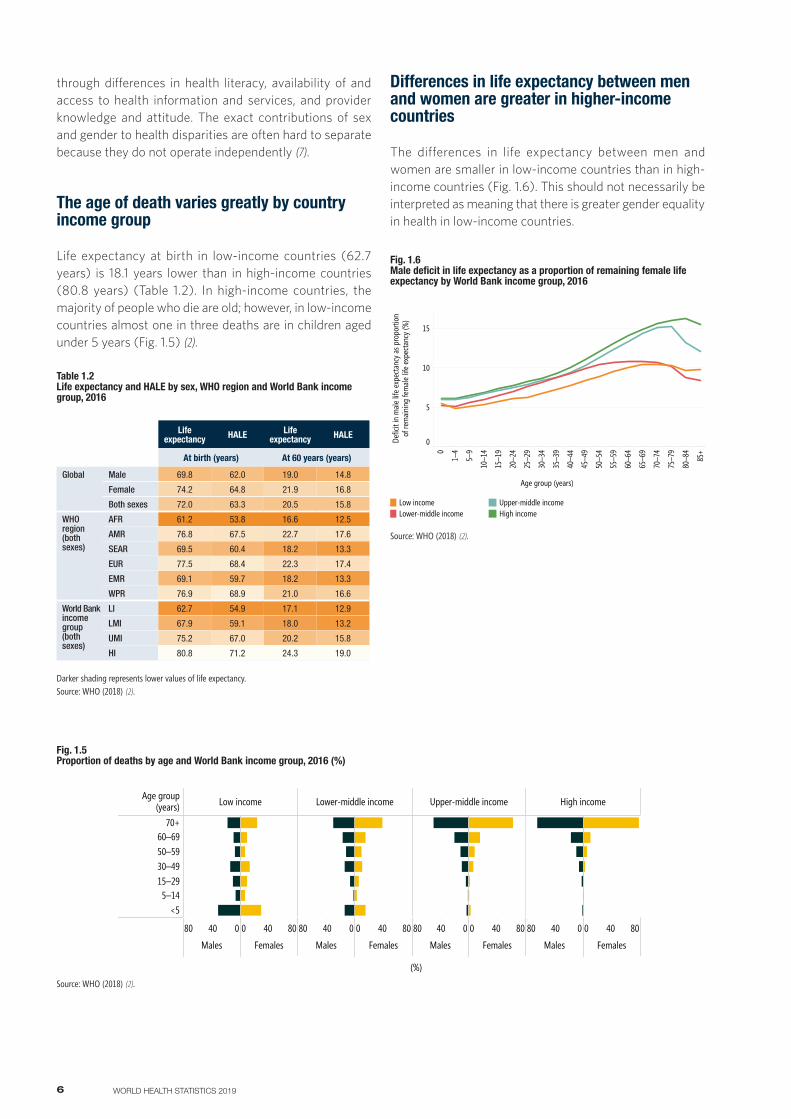
The age of death varies greatly by country income group
Life expectancy at birth in low-income countries (62.7 years) is 18.1 years lower than in high-income countries (80.8 years) (Table 1.2). In high-income countries, the majority of people who die are old; however, in low-income countries almost one in three deaths are in children aged under 5 years (Fig. 1.5) (2).
Life expectancy HALE Life
expectancy HALE
At birth (years) At 60 years (years)
Global Male 69.8 62.0 19.0 14.8
Female 74.2 64.8 21.9 16.8
Both sexes 72.0 63.3 20.5 15.8
WHO region(both sexes)
AFR 61.2 53.8 16.6 12.5
AMR 76.8 67.5 22.7 17.6
SEAR 69.5 60.4 18.2 13.3
EUR 77.5 68.4 22.3 17.4
EMR 69.1 59.7 18.2 13.3
WPR 76.9 68.9 21.0 16.6
World Bank income group (both sexes)
LI 62.7 54.9 17.1 12.9
LMI 67.9 59.1 18.0 13.2
UMI 75.2 67.0 20.2 15.8
HI 80.8 71.2 24.3 19.0
Table 1.2 Life expectancy and HALE by sex, WHO region and World Bank income group, 2016
Darker shading represents lower values of life expectancy.Source: WHO (2018) (2).
Differences in life expectancy between men and women are greater in higher-income countries
The differences in life expectancy between men and women are smaller in low-income countries than in high-income countries (Fig. 1.6). This should not necessarily be interpreted as meaning that there is greater gender equality in health in low-income countries.
7MONITORING HEALTH FOR THE SDGs
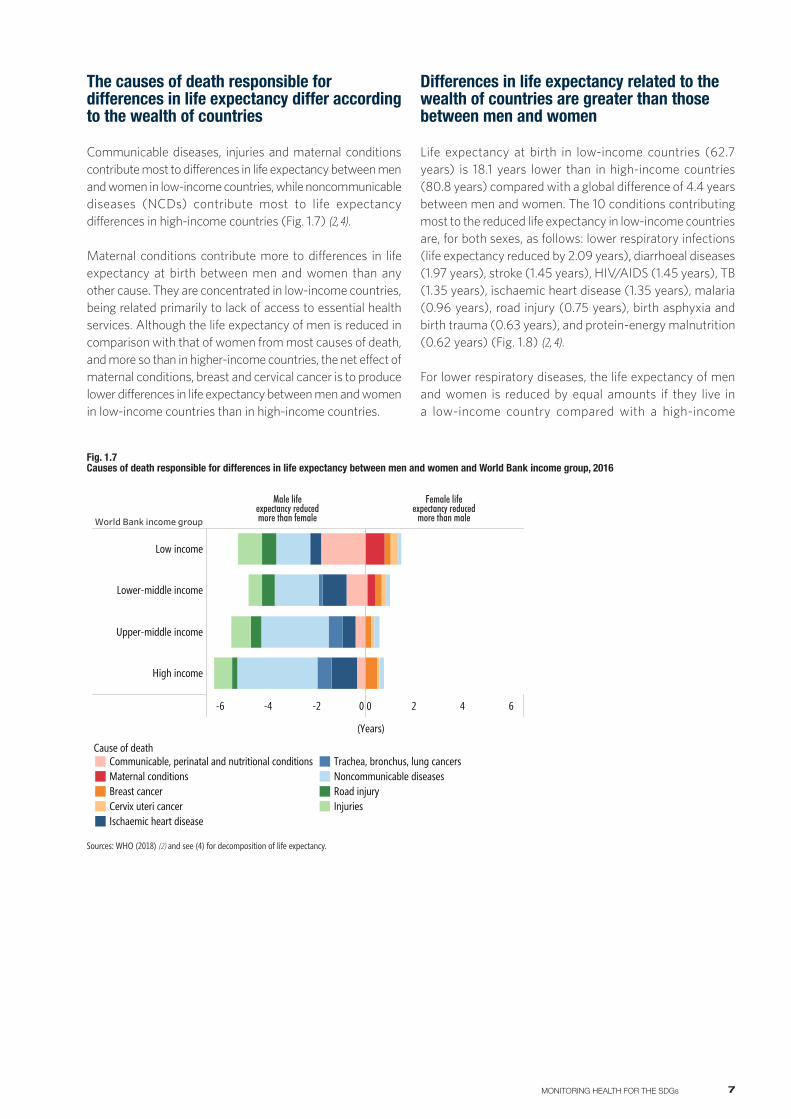
The causes of death responsible for differences in life expectancy differ according to the wealth of countries
Communicable diseases, injuries and maternal conditions contribute most to differences in life expectancy between men and women in low-income countries, while noncommunicable diseases (NCDs) contribute most to life expectancy differences in high-income countries (Fig. 1.7) (2, 4).
Maternal conditions contribute more to differences in life expectancy at birth between men and women than any other cause. They are concentrated in low-income countries, being related primarily to lack of access to essential health services. Although the life expectancy of men is reduced in comparison with that of women from most causes of death, and more so than in higher-income countries, the net effect of maternal conditions, breast and cervical cancer is to produce lower differences in life expectancy between men and women in low-income countries than in high-income countries.
Sources: WHO (2018) (2) and see (4) for decomposition of life expectancy.
World Bank income group
-6 -4 -2 0 0 2 4 6
Low income
Lower-middle income
Upper-middle income
High income
(Years)
Cause of deathCommunicable, perinatal and nutritional conditionsMaternal conditionsBreast cancerCervix uteri cancerIschaemic heart disease
Trachea, bronchus, lung cancersNoncommunicable diseasesRoad injuryInjuries
Male life expectancy reduced more than female
Female life expectancy reduced
more than male
Fig. 1.7 Causes of death responsible for differences in life expectancy between men and women and World Bank income group, 2016
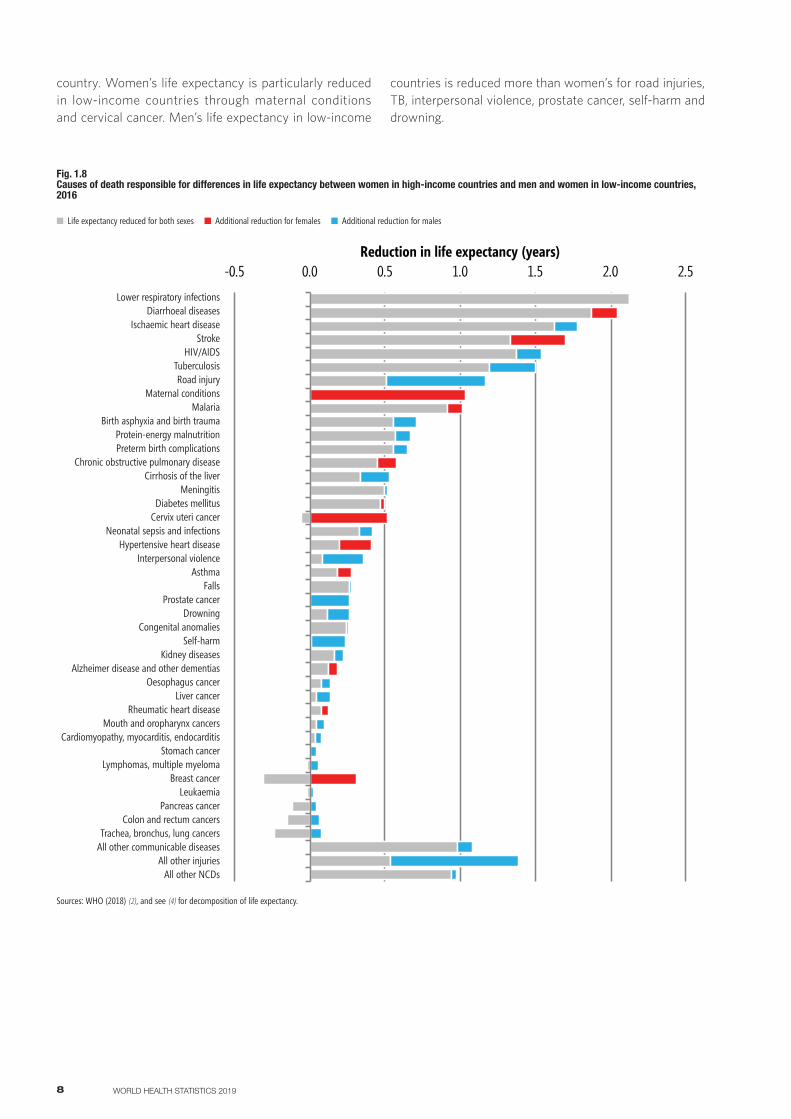
Differences in life expectancy related to the wealth of countries are greater than those between men and women
Life expectancy at birth in low-income countries (62.7 years) is 18.1 years lower than in high-income countries (80.8 years) compared with a global difference of 4.4 years between men and women. The 10 conditions contributing most to the reduced life expectancy in low-income countries are, for both sexes, as follows: lower respiratory infections (life expectancy reduced by 2.09 years), diarrhoeal diseases (1.97 years), stroke (1.45 years), HIV/AIDS (1.45 years), TB (1.35 years), ischaemic heart disease (1.35 years), malaria (0.96 years), road injury (0.75 years), birth asphyxia and birth trauma (0.63 years), and protein-energy malnutrition (0.62 years) (Fig. 1.8) (2, 4).
For lower respiratory diseases, the life expectancy of men and women is reduced by equal amounts if they live in a low-income country compared with a high-income
8 WORLD HEALTH STATISTICS 2019
country. Women’s life expectancy is particularly reduced in low-income countries through maternal conditions and cervical cancer. Men’s life expectancy in low-income
-0.5 0.0 0.5 1.0 1.5 2.0 2.5
Lower respirato ry infectionsDiarrhoeal diseases
Ischaemic heart d iseaseStroke
HIV/AIDSTuberculo sisRo ad inju ry
Maternal conditionsMalaria
Birth asphyxia and b irth traumaProtein-energy malnutritionPreterm b irth comp lications
Ch ronic obstru ctive pulmonary diseaseCirrhosis of the l iver
MeningitisDiabetes mell itus
Cervix uteri cancerNeonatal sepsis and infectio ns
Hypertensive heart d iseaseInterpersonal violence
AsthmaFalls
Prostate cancerDrown ing
Co ngenital ano mal iesSelf-harm
Kidney d iseasesAlzheimer d isease and other dementias
Oeso phagus cancerLiver cancer
Rheumatic heart d iseaseMouth and oropharynx cancers
Card iomyopathy, myocardi tis, endocardi tisStomach cancer
Lymphomas, multiple myelomaBreast cancer
LeukaemiaPancreas cancer
Co lon and rectum cancersTrachea, b ronchus, lung cancersAll other communicab le d iseases
All other In juriesAll other NCDs
Reduction in life expectancy (years)
Lower respiratory infectionsDiarrhoeal diseases
Ischaemic heart diseaseStroke
HIV/AIDSTuberculosisRoad injury
Maternal conditionsMalaria
Birth asphyxia and birth traumaProtein-energy malnutritionPreterm birth complications
Chronic obstructive pulmonary diseaseCirrhosis of the liver
MeningitisDiabetes mellitus
Cervix uteri cancerNeonatal sepsis and infections
Hypertensive heart diseaseInterpersonal violence
AsthmaFalls
Prostate cancerDrowning
Congenital anomaliesSelf-harm
Kidney diseasesAlzheimer disease and other dementias
Oesophagus cancerLiver cancer
Rheumatic heart diseaseMouth and oropharynx cancers
Cardiomyopathy, myocarditis, endocarditisStomach cancer
Lymphomas, multiple myelomaBreast cancer
LeukaemiaPancreas cancer
Colon and rectum cancersTrachea, bronchus, lung cancers
All other communicable diseasesAll other injuries
All other NCDs
Fig. 1.8 Causes of death responsible for differences in life expectancy between women in high-income countries and men and women in low-income countries, 2016
Life expectancy reduced for both sexes Additional reduction for females Additional reduction for males
Sources: WHO (2018) (2), and see (4) for decomposition of life expectancy.
countries is reduced more than women’s for road injuries, TB, interpersonal violence, prostate cancer, self-harm and drowning.
9MONITORING HEALTH FOR THE SDGs
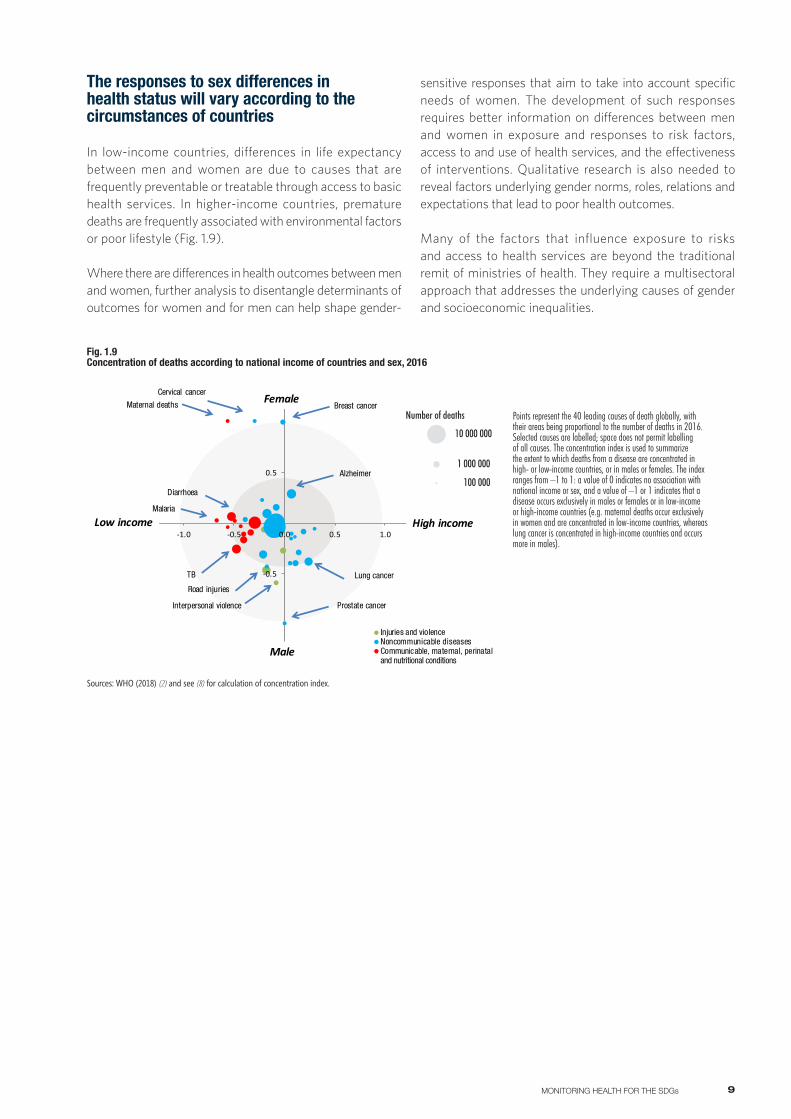
The responses to sex differences in health status will vary according to the circumstances of countries
In low-income countries, differences in life expectancy between men and women are due to causes that are frequently preventable or treatable through access to basic health services. In higher-income countries, premature deaths are frequently associated with environmental factors or poor lifestyle (Fig. 1.9).
Where there are differences in health outcomes between men and women, further analysis to disentangle determinants of outcomes for women and for men can help shape gender-
sensitive responses that aim to take into account specific needs of women. The development of such responses requires better information on differences between men and women in exposure and responses to risk factors, access to and use of health services, and the effectiveness of interventions. Qualitative research is also needed to reveal factors underlying gender norms, roles, relations and expectations that lead to poor health outcomes.
Many of the factors that influence exposure to risks and access to health services are beyond the traditional remit of ministries of health. They require a multisectoral approach that addresses the underlying causes of gender and socioeconomic inequalities.
Points represent the 40 leading causes of death globally, with their areas being proportional to the number of deaths in 2016. Selected causes are labelled; space does not permit labelling of all causes. The concentration index is used to summarize the extent to which deaths from a disease are concentrated in high- or low-income countries, or in males or females. The index ranges from –1 to 1: a value of 0 indicates no association with national income or sex, and a value of –1 or 1 indicates that a disease occurs exclusively in males or females or in low-income or high-income countries (e.g. maternal deaths occur exclusively in women and are concentrated in low-income countries, whereas lung cancer is concentrated in high-income countries and occurs more in males).
-1.5
-0.5
0.5
1.5
-1.0 -0.5 0.0 0.5 1.0
Injuries and violenceNoncommunicable diseasesCommunicable, maternal, perinatal and nutritional conditions
nd nutritional conditionsMale
Female
High incomeLow income
Breast cancerMaternal deaths
Cervical cancer
Road injuries
Interpersonal violence
TB Lung cancer
Prostate cancer
Malaria
Diarrhoea
Alzheimer
Number of deaths
10 000 000
1 000 000
100 000
Fig. 1.9 Concentration of deaths according to national income of countries and sex, 2016
Sources: WHO (2018) (2) and see (8) for calculation of concentration index.
10 WORLD HEALTH STATISTICS 2019
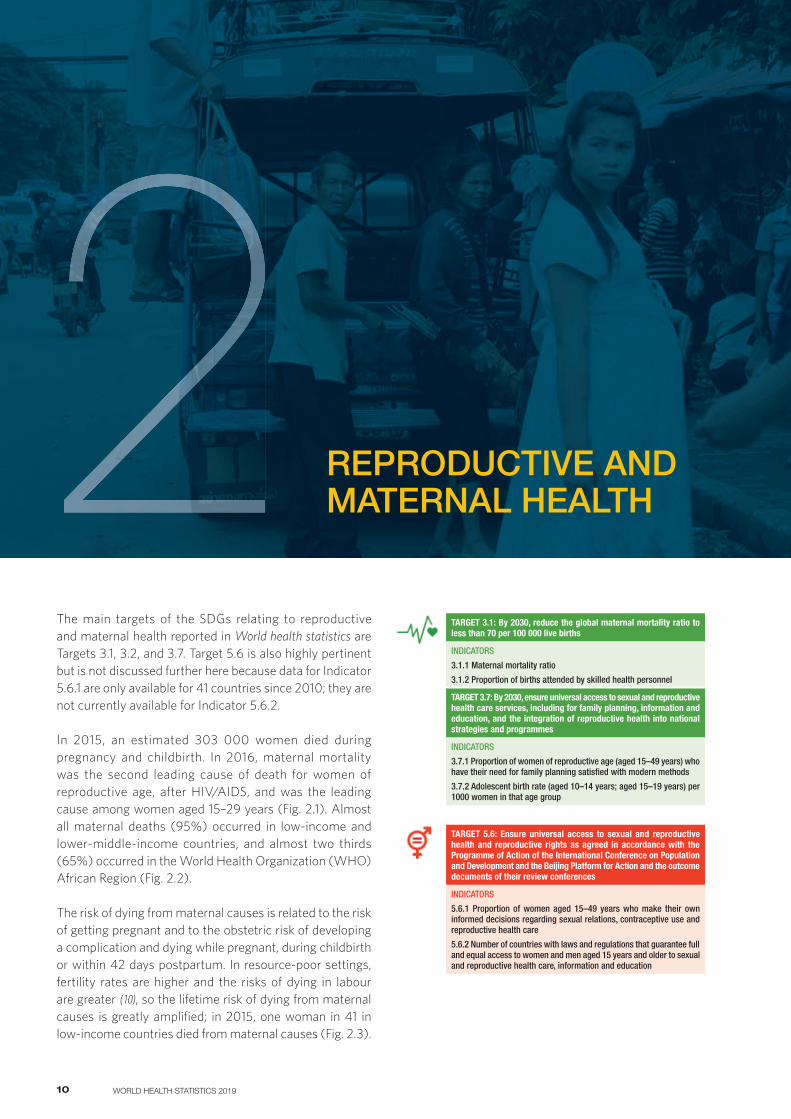
REPRODUCTIVE AND MATERNAL HEALTH2
The main targets of the SDGs relating to reproductive and maternal health reported in World health statistics are Targets 3.1, 3.2, and 3.7. Target 5.6 is also highly pertinent but is not discussed further here because data for Indicator 5.6.1 are only available for 41 countries since 2010; they are not currently available for Indicator 5.6.2.
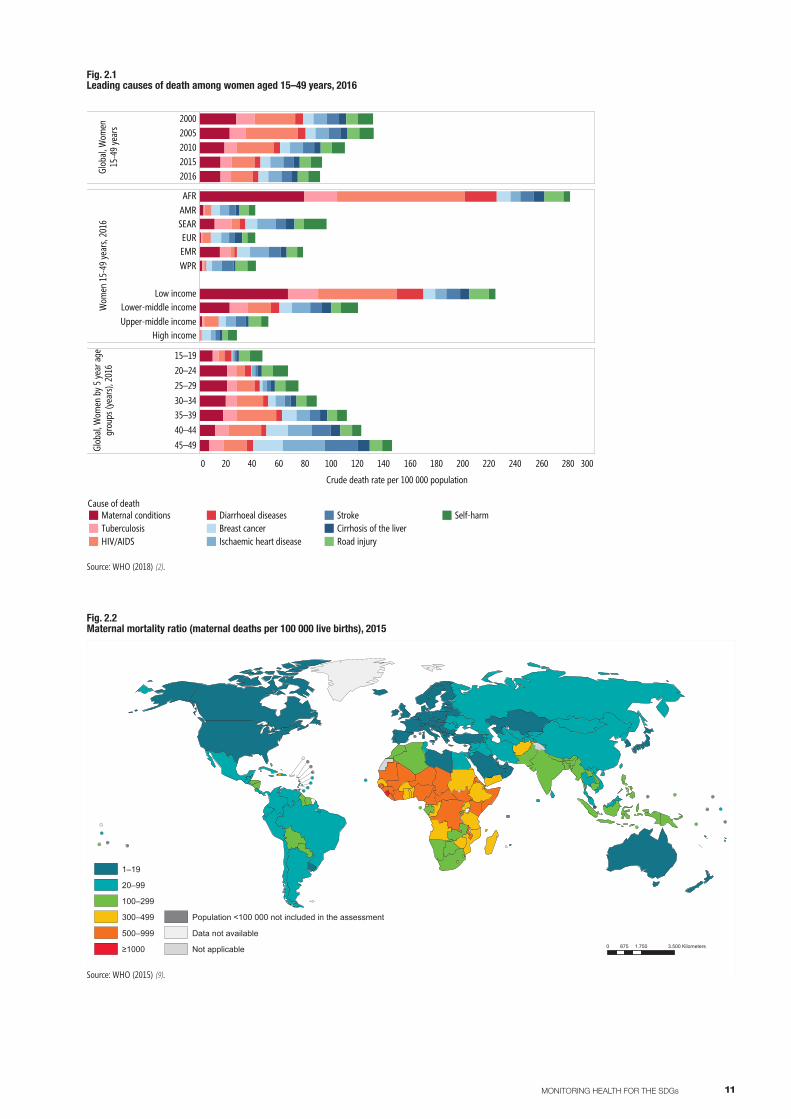
In 2015, an estimated 303 000 women died during pregnancy and childbirth. In 2016, maternal mortality was the second leading cause of death for women of reproductive age, after HIV/AIDS, and was the leading cause among women aged 15–29 years (Fig. 2.1). Almost all maternal deaths (95%) occurred in low-income and lower-middle-income countries, and almost two thirds (65%) occurred in the World Health Organization (WHO) African Region (Fig. 2.2).
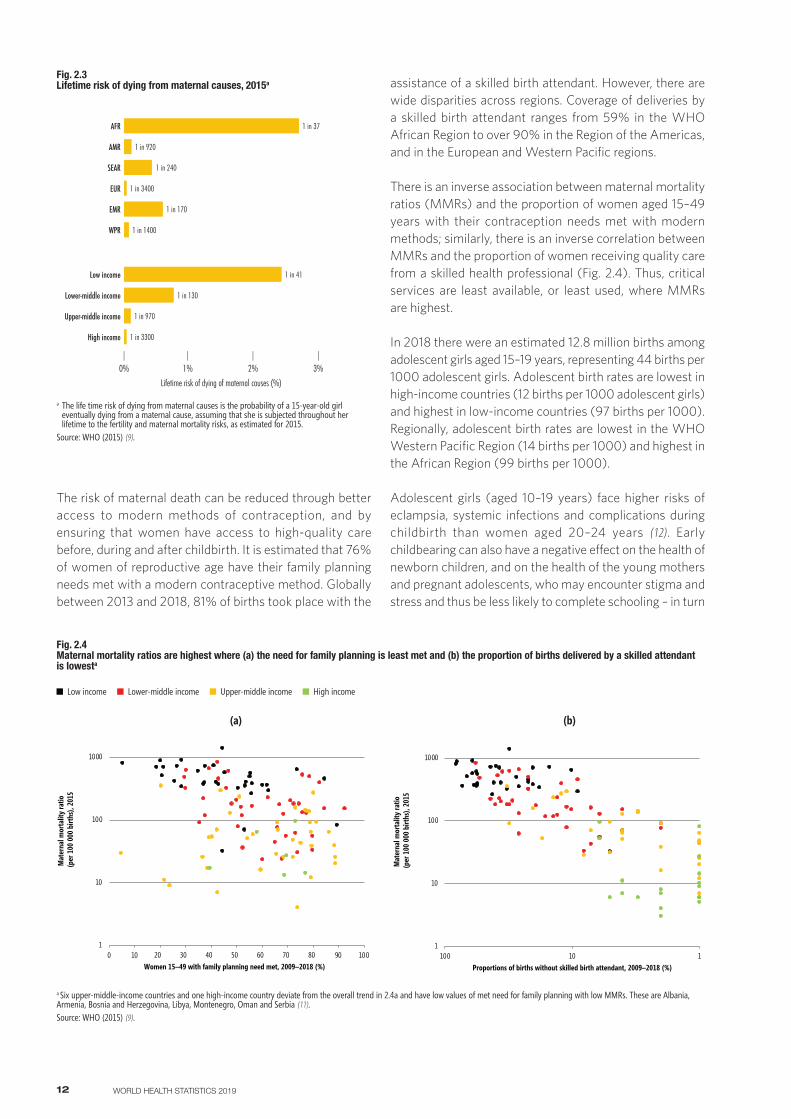
The risk of dying from maternal causes is related to the risk of getting pregnant and to the obstetric risk of developing a complication and dying while pregnant, during childbirth or within 42 days postpartum. In resource-poor settings, fertility rates are higher and the risks of dying in labour are greater (10), so the lifetime risk of dying from maternal causes is greatly amplified; in 2015, one woman in 41 in low-income countries died from maternal causes (Fig. 2.3).
TARGET 3.1: By 2030, reduce the global maternal mortality ratio to less than 70 per 100 000 live births
INDICATORS
3.1.1 Maternal mortality ratio
3.1.2 Proportion of births attended by skilled health personnel
TARGET 3.7: By 2030, ensure universal access to sexual and reproductive health care services, including for family planning, information and education, and the integration of reproductive health into national strategies and programmes
INDICATORS
3.7.1 Proportion of women of reproductive age (aged 15–49 years) who have their need for family planning satisfied with modern methods
3.7.2 Adolescent birth rate (aged 10–14 years; aged 15–19 years) per 1000 women in that age group
TARGET 5.6: Ensure universal access to sexual and reproductive health and reproductive rights as agreed in accordance with the Programme of Action of the International Conference on Population and Development and the Beijing Platform for Action and the outcome documents of their review conferences
INDICATORS
5.6.1 Proportion of women aged 15–49 years who make their own informed decisions regarding sexual relations, contraceptive use and reproductive health care
5.6.2 Number of countries with laws and regulations that guarantee full and equal access to women and men aged 15 years and older to sexual and reproductive health care, information and education
11MONITORING HEALTH FOR THE SDGs
Fig. 2.1 Leading causes of death among women aged 15–49 years, 2016
Glob
al, W
omen
15-4
9 ye
ars
20002005201020152016
Cause of deathMaternal conditionsTuberculosisHIV/AIDS
Diarrhoeal diseasesBreast cancerIschaemic heart disease
StrokeCirrhosis of the liverRoad injury
Self-harm
Wom
en 1
5-49
year
s, 20
16
AFRAMRSEAREUREMRWPR
Low incomeLower-middle incomeUpper-middle income
High income
0 20 40 60 80 100 120 140 160 180 200 220 240 260 280 300
Crude death rate per 100 000 population
Glob
al, W
omen
by 5
year
age
grou
ps (y
ears
), 20
16
15–1920–2425–2930–3435–3940–4445–49
Source: WHO (2018) (2).
Fig. 2.2 Maternal mortality ratio (maternal deaths per 100 000 live births), 2015
1–19
20–99
100–299
300–499
500–999
≥
Population <100 000 not included in the assessment
Data not available
Not applicable 0 1.750 3.500875 Kilometers
Source: WHO (2015) (9).
12 WORLD HEALTH STATISTICS 2019
The risk of maternal death can be reduced through better access to modern methods of contraception, and by ensuring that women have access to high-quality care before, during and after childbirth. It is estimated that 76% of women of reproductive age have their family planning needs met with a modern contraceptive method. Globally between 2013 and 2018, 81% of births took place with the
assistance of a skilled birth attendant. However, there are wide disparities across regions. Coverage of deliveries by a skilled birth attendant ranges from 59% in the WHO African Region to over 90% in the Region of the Americas, and in the European and Western Pacific regions. There is an inverse association between maternal mortality ratios (MMRs) and the proportion of women aged 15–49 years with their contraception needs met with modern methods; similarly, there is an inverse correlation between MMRs and the proportion of women receiving quality care from a skilled health professional (Fig. 2.4). Thus, critical services are least available, or least used, where MMRs are highest.
In 2018 there were an estimated 12.8 million births among adolescent girls aged 15–19 years, representing 44 births per 1000 adolescent girls. Adolescent birth rates are lowest in high-income countries (12 births per 1000 adolescent girls) and highest in low-income countries (97 births per 1000). Regionally, adolescent birth rates are lowest in the WHO Western Pacific Region (14 births per 1000) and highest in the African Region (99 births per 1000).
Adolescent girls (aged 10–19 years) face higher risks of eclampsia, systemic infections and complications during childbirth than women aged 20–24 years (12). Early childbearing can also have a negative effect on the health of newborn children, and on the health of the young mothers and pregnant adolescents, who may encounter stigma and stress and thus be less likely to complete schooling – in turn
|0%
|1%
|3%
EMR 1 in 170
AFR 1 in 37
AMR 1 in 920
|2%
EUR 1 in 3400
SEAR 1 in 240
WPR 1 in 1400
Low income 1 in 41
Lower-middle income 1 in 130
Upper-middle income 1 in 970
High income 1 in 3300
Lifetime risk of dying of maternal causes (%)
Fig. 2.3 Lifetime risk of dying from maternal causes, 2015a
a The life time risk of dying from maternal causes is the probability of a 15-year-old girl eventually dying from a maternal cause, assuming that she is subjected throughout her lifetime to the fertility and maternal mortality risks, as estimated for 2015.
Source: WHO (2015) (9).
Fig. 2.4 Maternal mortality ratios are highest where (a) the need for family planning is least met and (b) the proportion of births delivered by a skilled attendant is lowesta
Low income Lower-middle income Upper-middle income High income
a Six upper-middle-income countries and one high-income country deviate from the overall trend in 2.4a and have low values of met need for family planning with low MMRs. These are Albania, Armenia, Bosnia and Herzegovina, Libya, Montenegro, Oman and Serbia (11).Source: WHO (2015) (9).
1
10
100
1000
0 10 90 100
Mat
erna
l mor
talit
y ra
tio(p
er 1
00 0
00 b
irths
), 20
15
20 30 40 50 60 70 80 Women 15–49 with family planning need met, 2009–2018 (%)
(a)
1
10
100
1000
110100
Mat
erna
l mor
talit
y ra
tio(p
er 1
00 0
00 b
irths
), 20
15
Proportions of births without skilled birth attendant, 2009–2018 (%)
(b)
13MONITORING HEALTH FOR THE SDGs
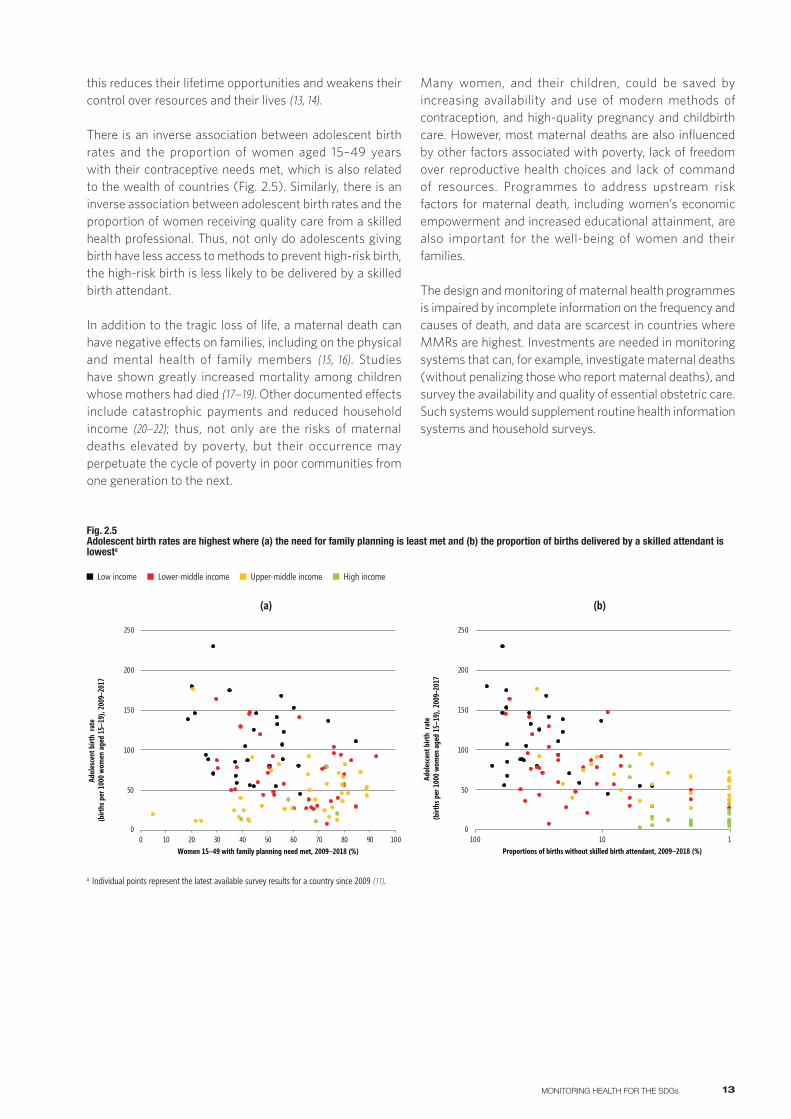
a Individual points represent the latest available survey results for a country since 2009 (11).
0
50
100
150
200
250
0 10 20 30 40 50 60 70 80 90 100
Adol
esce
nt b
irth
rate
(birt
hs p
er 1
000
wom
en a
ged
15–1
9), 2
009–
2017
Women 15–49 with family planning need met, 2009–2018 (%)
(a)
0
50
100
150
200
250
110100
Adol
esce
nt b
irth
rate
(birt
hs p
er 1
000
wom
en a
ged
15–1
9), 2
009–
2017
Proportions of births without skilled birth attendant, 2009–2018 (%)
(b)
this reduces their lifetime opportunities and weakens their control over resources and their lives (13, 14).
There is an inverse association between adolescent birth rates and the proportion of women aged 15–49 years with their contraceptive needs met, which is also related to the wealth of countries (Fig. 2.5). Similarly, there is an inverse association between adolescent birth rates and the proportion of women receiving quality care from a skilled health professional. Thus, not only do adolescents giving birth have less access to methods to prevent high-risk birth, the high-risk birth is less likely to be delivered by a skilled birth attendant.
In addition to the tragic loss of life, a maternal death can have negative effects on families, including on the physical and mental health of family members (15, 16). Studies have shown greatly increased mortality among children whose mothers had died (17–19). Other documented effects include catastrophic payments and reduced household income (20–22); thus, not only are the risks of maternal deaths elevated by poverty, but their occurrence may perpetuate the cycle of poverty in poor communities from one generation to the next.
Many women, and their children, could be saved by increasing availability and use of modern methods of contraception, and high-quality pregnancy and childbirth care. However, most maternal deaths are also influenced by other factors associated with poverty, lack of freedom over reproductive health choices and lack of command of resources. Programmes to address upstream risk factors for maternal death, including women’s economic empowerment and increased educational attainment, are also important for the well-being of women and their families.
The design and monitoring of maternal health programmes is impaired by incomplete information on the frequency and causes of death, and data are scarcest in countries where MMRs are highest. Investments are needed in monitoring systems that can, for example, investigate maternal deaths (without penalizing those who report maternal deaths), and survey the availability and quality of essential obstetric care. Such systems would supplement routine health information systems and household surveys.
Fig. 2.5 Adolescent birth rates are highest where (a) the need for family planning is least met and (b) the proportion of births delivered by a skilled attendant is lowesta
Low income Lower-middle income Upper-middle income High income
14 WORLD HEALTH STATISTICS 2019
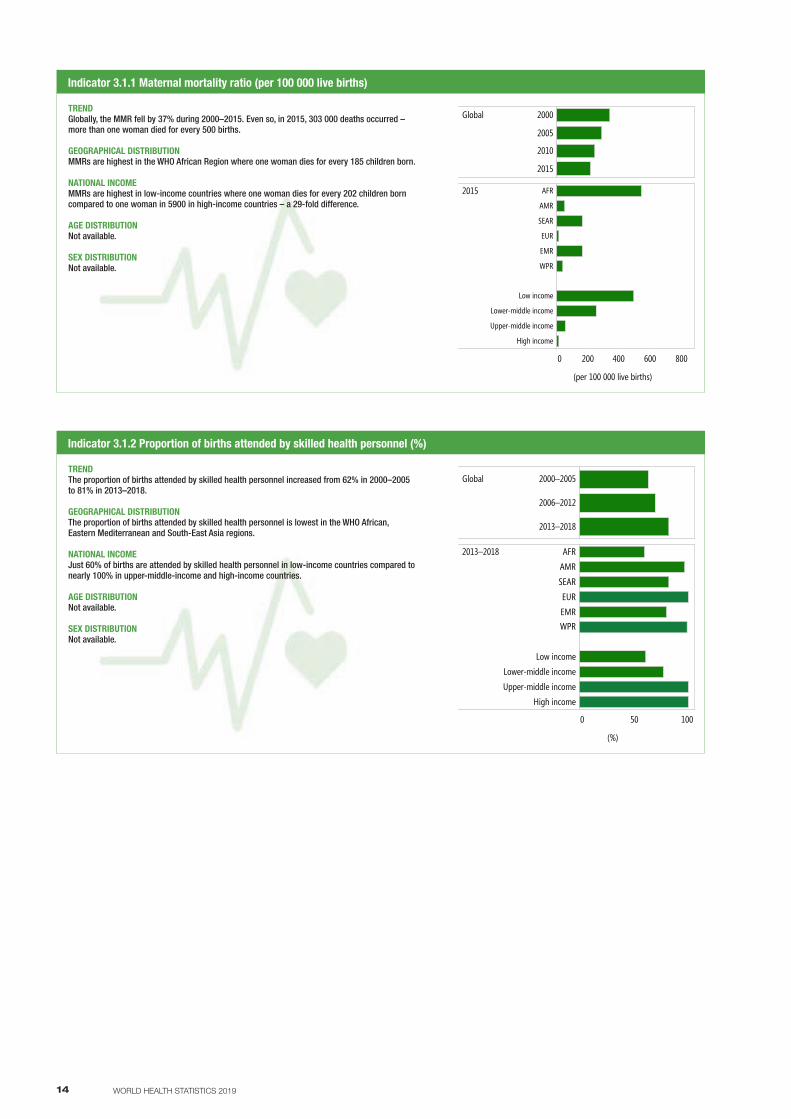
TREND Globally, the MMR fell by 37% during 2000–2015. Even so, in 2015, 303 000 deaths occurred – more than one woman died for every 500 births.
GEOGRAPHICAL DISTRIBUTIONMMRs are highest in the WHO African Region where one woman dies for every 185 children born.
NATIONAL INCOMEMMRs are highest in low-income countries where one woman dies for every 202 children born compared to one woman in 5900 in high-income countries – a 29-fold difference.
AGE DISTRIBUTIONNot available.
SEX DISTRIBUTIONNot available.
Indicator 3.1.1 Maternal mortality ratio (per 100 000 live births)
0 200 400 600 800
2015 AFR
AMR
SEAR
EUR
EMR
WPR
Low income
Lower-middle income
Upper-middle income
High income
(per 100 000 live births)
Maternal
Global 2000
2005
2010
2015
TREND The proportion of births attended by skilled health personnel increased from 62% in 2000–2005 to 81% in 2013–2018.
GEOGRAPHICAL DISTRIBUTIONThe proportion of births attended by skilled health personnel is lowest in the WHO African, Eastern Mediterranean and South-East Asia regions.
NATIONAL INCOMEJust 60% of births are attended by skilled health personnel in low-income countries compared to nearly 100% in upper-middle-income and high-income countries.
AGE DISTRIBUTIONNot available.
SEX DISTRIBUTIONNot available.
Indicator 3.1.2 Proportion of births attended by skilled health personnel (%)
0 50 100
2013–2018 AFR
AMR
SEAR
EUR
EMRWPR
Low income
Lower-middle income
Upper-middle income
High income
(%)
SBA
Global 2000–2005
2006–2012
2013–2018
15MONITORING HEALTH FOR THE SDGs
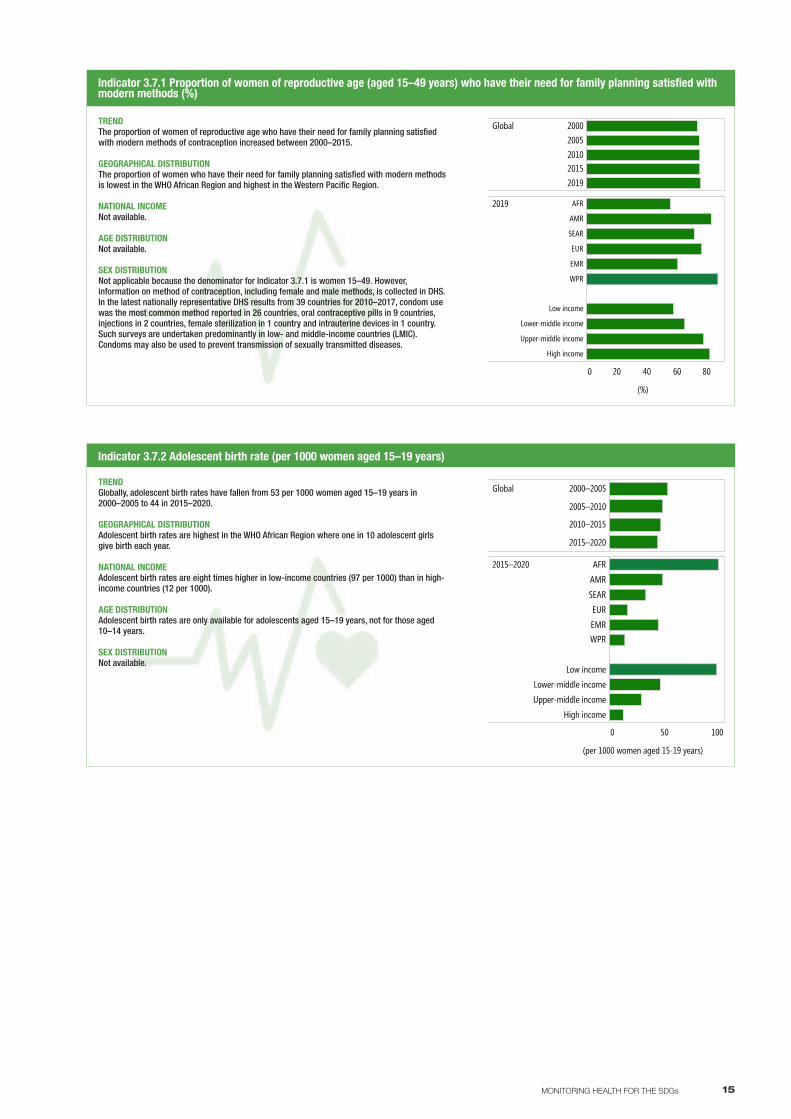
TREND Globally, adolescent birth rates have fallen from 53 per 1000 women aged 15–19 years in 2000–2005 to 44 in 2015–2020.
GEOGRAPHICAL DISTRIBUTIONAdolescent birth rates are highest in the WHO African Region where one in 10 adolescent girls give birth each year.
NATIONAL INCOMEAdolescent birth rates are eight times higher in low-income countries (97 per 1000) than in high-income countries (12 per 1000).
AGE DISTRIBUTIONAdolescent birth rates are only available for adolescents aged 15–19 years, not for those aged 10–14 years.
SEX DISTRIBUTIONNot available.
Indicator 3.7.2 Adolescent birth rate (per 1000 women aged 15–19 years)
0 50 100
2015–2020 AFR
AMR
SEAR
EUR
EMRWPR
Low income
Lower-middle income
Upper-middle income
High income
(per 1000 women aged 15-19 years)
AFR
Global 2000–2005
2005–2010
2010–2015
2015–2020
TREND The proportion of women of reproductive age who have their need for family planning satisfied with modern methods of contraception increased between 2000–2015.
GEOGRAPHICAL DISTRIBUTIONThe proportion of women who have their need for family planning satisfied with modern methods is lowest in the WHO African Region and highest in the Western Pacific Region.
NATIONAL INCOMENot available.
AGE DISTRIBUTIONNot available.
SEX DISTRIBUTIONNot applicable because the denominator for Indicator 3.7.1 is women 15–49. However, information on method of contraception, including female and male methods, is collected in DHS. In the latest nationally representative DHS results from 39 countries for 2010–2017, condom use was the most common method reported in 26 countries, oral contraceptive pills in 9 countries, injections in 2 countries, female sterilization in 1 country and intrauterine devices in 1 country. Such surveys are undertaken predominantly in low- and middle-income countries (LMIC). Condoms may also be used to prevent transmission of sexually transmitted diseases.
Indicator 3.7.1 Proportion of women of reproductive age (aged 15–49 years) who have their need for family planning satisfied with modern methods (%)
0 20 40 60 80
2019 AFR
AMR
SEAR
EUR
EMR
WPR
Low income
Lower-middle income
Upper-middle income
High income
(%)
FP
Global 20002005201020152019
16 WORLD HEALTH STATISTICS 2019
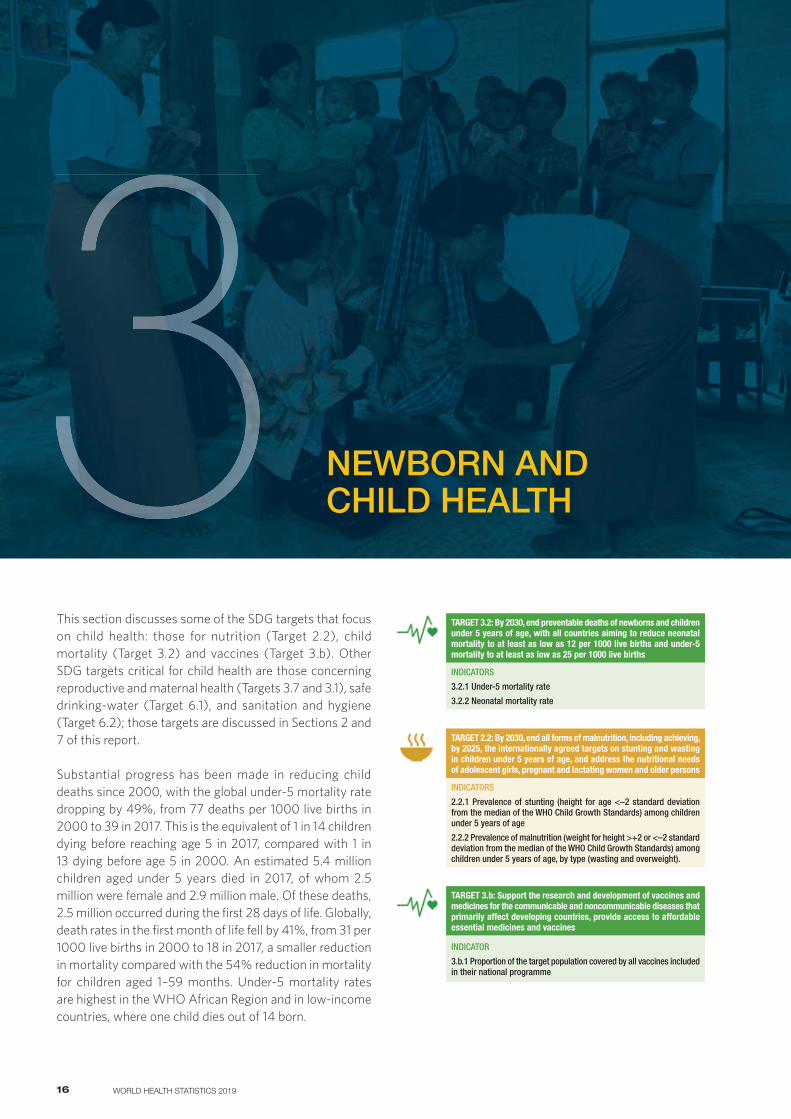
NEWBORN AND CHILD HEALTH3
This section discusses some of the SDG targets that focus on child health: those for nutrition (Target 2.2), child mortality (Target 3.2) and vaccines (Target 3.b). Other SDG targets critical for child health are those concerning reproductive and maternal health (Targets 3.7 and 3.1), safe drinking-water (Target 6.1), and sanitation and hygiene (Target 6.2); those targets are discussed in Sections 2 and 7 of this report.
Substantial progress has been made in reducing child deaths since 2000, with the global under-5 mortality rate dropping by 49%, from 77 deaths per 1000 live births in 2000 to 39 in 2017. This is the equivalent of 1 in 14 children dying before reaching age 5 in 2017, compared with 1 in 13 dying before age 5 in 2000. An estimated 5.4 million children aged under 5 years died in 2017, of whom 2.5 million were female and 2.9 million male. Of these deaths, 2.5 million occurred during the first 28 days of life. Globally, death rates in the first month of life fell by 41%, from 31 per 1000 live births in 2000 to 18 in 2017, a smaller reduction in mortality compared with the 54% reduction in mortality for children aged 1–59 months. Under-5 mortality rates are highest in the WHO African Region and in low-income countries, where one child dies out of 14 born.
TARGET 3.2: By 2030, end preventable deaths of newborns and children under 5 years of age, with all countries aiming to reduce neonatal mortality to at least as low as 12 per 1000 live births and under-5 mortality to at least as low as 25 per 1000 live births
INDICATORS
3.2.1 Under-5 mortality rate
3.2.2 Neonatal mortality rate
TARGET 2.2: By 2030, end all forms of malnutrition, including achieving, by 2025, the internationally agreed targets on stunting and wasting in children under 5 years of age, and address the nutritional needs of adolescent girls, pregnant and lactating women and older persons
INDICATORS
2.2.1 Prevalence of stunting (height for age <–2 standard deviation from the median of the WHO Child Growth Standards) among children under 5 years of age
2.2.2 Prevalence of malnutrition (weight for height >+2 or <–2 standard deviation from the median of the WHO Child Growth Standards) among children under 5 years of age, by type (wasting and overweight).
TARGET 3.b: Support the research and development of vaccines and medicines for the communicable and noncommunicable diseases that primarily affect developing countries, provide access to affordable essential medicines and vaccines
INDICATOR
3.b.1 Proportion of the target population covered by all vaccines included in their national programme
17MONITORING HEALTH FOR THE SDGs
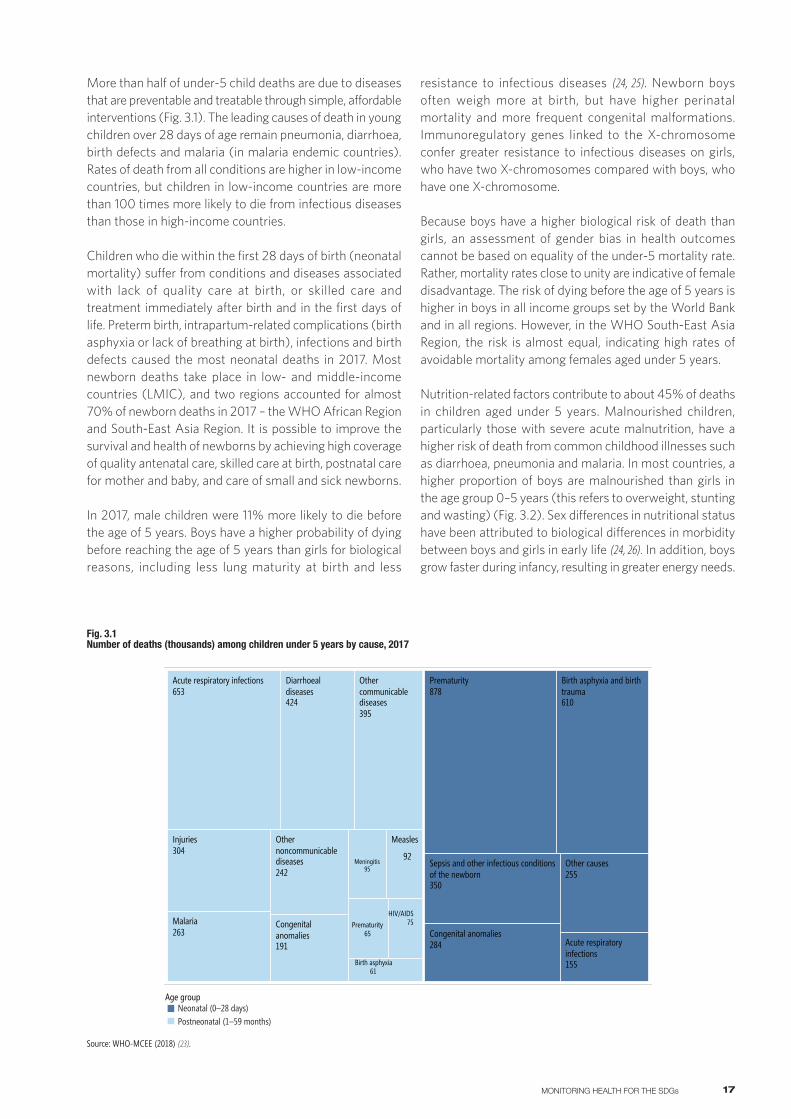
More than half of under-5 child deaths are due to diseases that are preventable and treatable through simple, affordable interventions (Fig. 3.1). The leading causes of death in young children over 28 days of age remain pneumonia, diarrhoea, birth defects and malaria (in malaria endemic countries). Rates of death from all conditions are higher in low-income countries, but children in low-income countries are more than 100 times more likely to die from infectious diseases than those in high-income countries.
Children who die within the first 28 days of birth (neonatal mortality) suffer from conditions and diseases associated with lack of quality care at birth, or skilled care and treatment immediately after birth and in the first days of life. Preterm birth, intrapartum-related complications (birth asphyxia or lack of breathing at birth), infections and birth defects caused the most neonatal deaths in 2017. Most newborn deaths take place in low- and middle-income countries (LMIC), and two regions accounted for almost 70% of newborn deaths in 2017 – the WHO African Region and South-East Asia Region. It is possible to improve the survival and health of newborns by achieving high coverage of quality antenatal care, skilled care at birth, postnatal care for mother and baby, and care of small and sick newborns.
In 2017, male children were 11% more likely to die before the age of 5 years. Boys have a higher probability of dying before reaching the age of 5 years than girls for biological reasons, including less lung maturity at birth and less
resistance to infectious diseases (24, 25). Newborn boys often weigh more at birth, but have higher perinatal mortality and more frequent congenital malformations. Immunoregulatory genes linked to the X-chromosome confer greater resistance to infectious diseases on girls, who have two X-chromosomes compared with boys, who have one X-chromosome.
Because boys have a higher biological risk of death than girls, an assessment of gender bias in health outcomes cannot be based on equality of the under-5 mortality rate. Rather, mortality rates close to unity are indicative of female disadvantage. The risk of dying before the age of 5 years is higher in boys in all income groups set by the World Bank and in all regions. However, in the WHO South-East Asia Region, the risk is almost equal, indicating high rates of avoidable mortality among females aged under 5 years.
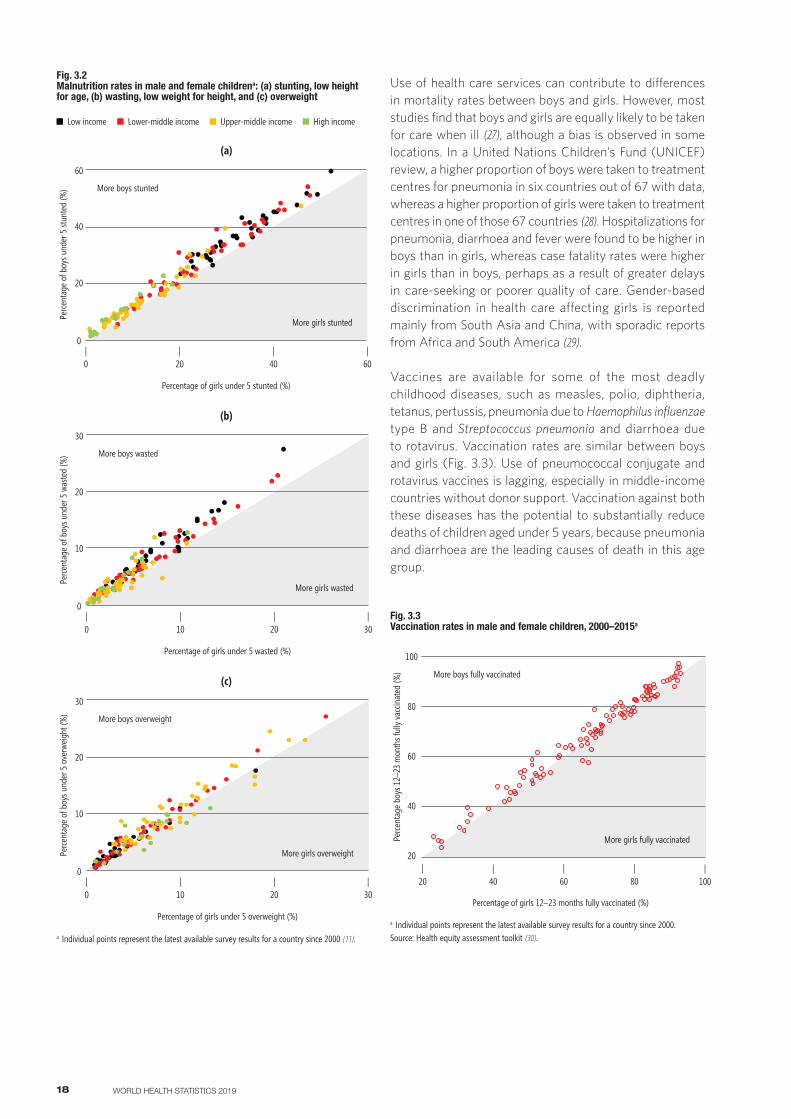
Nutrition-related factors contribute to about 45% of deaths in children aged under 5 years. Malnourished children, particularly those with severe acute malnutrition, have a higher risk of death from common childhood illnesses such as diarrhoea, pneumonia and malaria. In most countries, a higher proportion of boys are malnourished than girls in the age group 0–5 years (this refers to overweight, stunting and wasting) (Fig. 3.2). Sex differences in nutritional status have been attributed to biological differences in morbidity between boys and girls in early life (24, 26). In addition, boys grow faster during infancy, resulting in greater energy needs.
Fig. 3.1 Number of deaths (thousands) among children under 5 years by cause, 2017
Source: WHO-MCEE (2018) (23).
Age groupNeonatal (0–28 days)Postnatal (1–59 months)
Othernoncommunicablediseases242
Othercommunicablediseases395
Measles
Malaria263
Injuries304
Diarrhoealdiseases424
Congenitalanomalies191
Acute respiratory infections653
Sepsis and other infectious conditionsof the newborn350
Prematurity878
Other causes255
Congenital anomalies284
Birth asphyxia and birthtrauma610
Acute respiratoryinfections155
Meningitis95
Prematurity65
HIV/AIDS75
Birth asphyxia61
92
Neonatal (0–28 days)Postneonatal (1–59 months)
18 WORLD HEALTH STATISTICS 2019
Use of health care services can contribute to differences in mortality rates between boys and girls. However, most studies find that boys and girls are equally likely to be taken for care when ill (27), although a bias is observed in some locations. In a United Nations Children’s Fund (UNICEF) review, a higher proportion of boys were taken to treatment centres for pneumonia in six countries out of 67 with data, whereas a higher proportion of girls were taken to treatment centres in one of those 67 countries (28). Hospitalizations for pneumonia, diarrhoea and fever were found to be higher in boys than in girls, whereas case fatality rates were higher in girls than in boys, perhaps as a result of greater delays in care-seeking or poorer quality of care. Gender-based discrimination in health care affecting girls is reported mainly from South Asia and China, with sporadic reports from Africa and South America (29).
Vaccines are available for some of the most deadly childhood diseases, such as measles, polio, diphtheria, tetanus, pertussis, pneumonia due to Haemophilus influenzae type B and Streptococcus pneumonia and diarrhoea due to rotavirus. Vaccination rates are similar between boys and girls (Fig. 3.3). Use of pneumococcal conjugate and rotavirus vaccines is lagging, especially in middle-income countries without donor support. Vaccination against both these diseases has the potential to substantially reduce deaths of children aged under 5 years, because pneumonia and diarrhoea are the leading causes of death in this age group.
Fig. 3.2 Malnutrition rates in male and female childrena: (a) stunting, low height for age, (b) wasting, low weight for height, and (c) overweight
a Individual points represent the latest available survey results for a country since 2000 (11).
Low income Lower-middle income Upper-middle income High income
(a)
|60
|40
|20
|0
More girls stunted
More boys stunted
Perce
ntag
e of
boy
s und
er 5
stun
ted
(%)
0
60
40
20
Percentage of girls under 5 stunted (%)
(b)
|30
|20
|10
|0
More girls wasted
More boys wasted
Perce
ntag
e of
boy
s und
er 5
was
ted
(%)
0
30
20
10
Percentage of girls under 5 wasted (%)
(c)
|30
|20
|10
|0
More girls overweight
More boys overweight
Perce
ntag
e of
boy
s und
er 5
ove
rweig
ht (%
)
0
30
20
10
Percentage of girls under 5 overweight (%)
Fig. 3.3 Vaccination rates in male and female children, 2000–2015a
a Individual points represent the latest available survey results for a country since 2000.Source: Health equity assessment toolkit (30).
|100
|20
More girls fully vaccinated
More boys fully vaccinated
20
60
Percentage of girls 12–23 months fully vaccinated (%)
100
80
40
Perce
ntag
e bo
ys 1
2–23
mon
ths f
ully
vacc
inat
ed (%
)
|40
|60
|80
19MONITORING HEALTH FOR THE SDGs
Globally, countries with a low under-5 mortality rate have high M/F mortality ratios (31, 32), partly because congenital diseases predominate when mortality is low. Countries with a high under-5 mortality rate have low M/F mortality ratios. Both high under-5 mortality rate and low M/F mortality ratios are associated with low socioeconomic status and gender inequality (33). Progress in reducing the under-5 mortality rate since 2000 was accompanied by an increase in the M/F mortality ratio from 1.06 in 2000 to 1.11 in 2017, indicating that the decline in the female under-5 mortality rate was faster than that for males.
Reductions in the under-5 mortality rate are accompanied not only by higher M/F mortality ratios but also by reductions in fertility. Smaller families reduce the chances of a couple having a child of any given sex. In societies with a preference for male children, reductions in the under-5 mortality rate have been accompanied by another type of female disadvantage – that is, a disadvantage in natality – through selective abortion of female fetuses. Increases in the M/F sex ratio at birth have been seen in parts of East Asia, South Asia and the South Caucuses. M/F sex ratios at birth have been seen to be higher if a couple’s previous children have been female; also, multiparous women are more likely to have prenatal knowledge of the sex of their
fetus, resulting in sex selection and more male births than in primiparous women (34).
A number of actions can be envisaged to address female disadvantage in populations with an atypically high female under-5 mortality rate, including policies to discourage sex-selective abortions, financial incentives to have female children, and policies that address the marginalized status of women or the provision of social protection in old age (35). The development of policies that will improve child health requires better information on sex differentials in child morbidity and mortality, and more qualitative research that can reveal the harmful gender norms and expectations that result in discriminatory treatment of boys or girls.
Female disadvantage is of widespread concern and must be tackled. In addition, the specific needs of boys should be addressed. Boys experience higher rates of mortality than girls in most of the world, and as the under-5 mortality rate falls globally, the M/F mortality ratio is increasing. In countries that have achieved large reductions in the under-5 mortality rate, additional actions may need to be taken to improve health outcomes for boys, to ensure continued progress towards SDG Target 3.2.
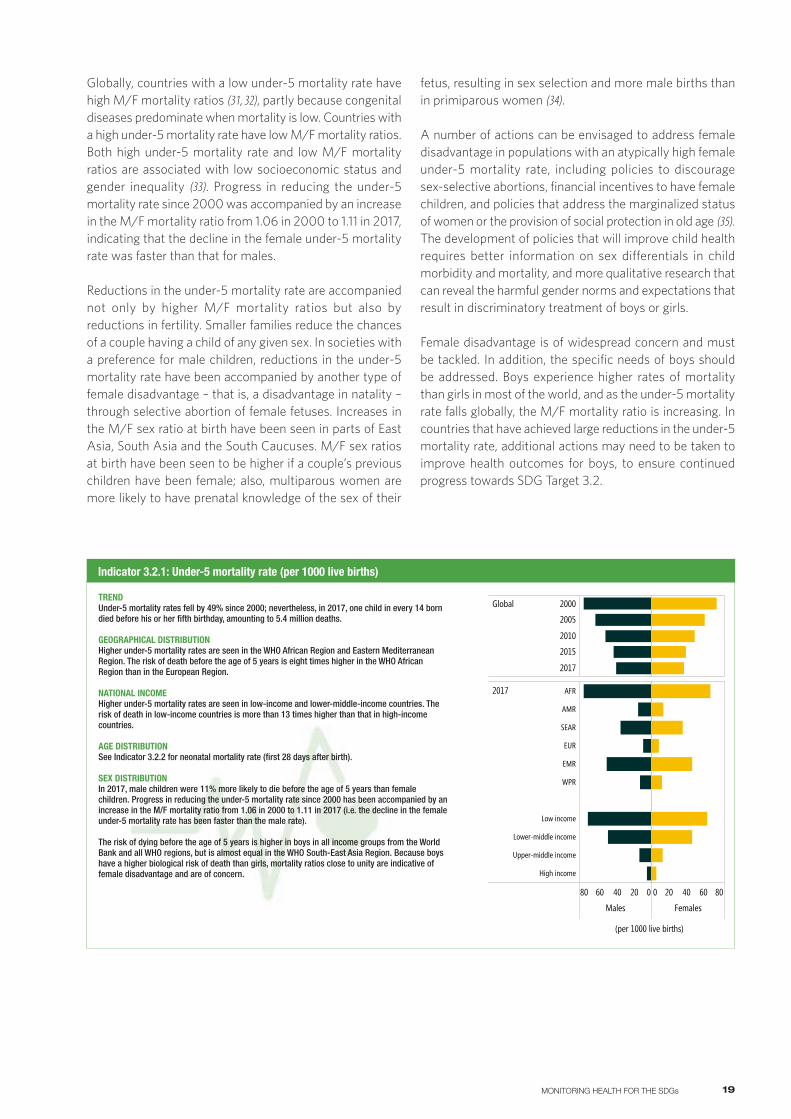
TREND Under-5 mortality rates fell by 49% since 2000; nevertheless, in 2017, one child in every 14 born died before his or her fifth birthday, amounting to 5.4 million deaths.
GEOGRAPHICAL DISTRIBUTIONHigher under-5 mortality rates are seen in the WHO African Region and Eastern Mediterranean Region. The risk of death before the age of 5 years is eight times higher in the WHO African Region than in the European Region.
NATIONAL INCOMEHigher under-5 mortality rates are seen in low-income and lower-middle-income countries. The risk of death in low-income countries is more than 13 times higher than that in high-income countries.
AGE DISTRIBUTIONSee Indicator 3.2.2 for neonatal mortality rate (first 28 days after birth).
SEX DISTRIBUTIONIn 2017, male children were 11% more likely to die before the age of 5 years than female children. Progress in reducing the under-5 mortality rate since 2000 has been accompanied by an increase in the M/F mortality ratio from 1.06 in 2000 to 1.11 in 2017 (i.e. the decline in the female under-5 mortality rate has been faster than the male rate).
The risk of dying before the age of 5 years is higher in boys in all income groups from the World Bank and all WHO regions, but is almost equal in the WHO South-East Asia Region. Because boys have a higher biological risk of death than girls, mortality ratios close to unity are indicative of female disadvantage and are of concern.
Indicator 3.2.1: Under-5 mortality rate (per 1000 live births)
020406080
Males
0 20 40 60 80
Females
2017 AFR
AMR
SEAR
EUR
EMR
WPR
Low income
Lower-middle income
Upper-middle income
High income
(per 1000 live births)
Global 2000
2005
2010
2015
2017
U5MR
20 WORLD HEALTH STATISTICS 2019
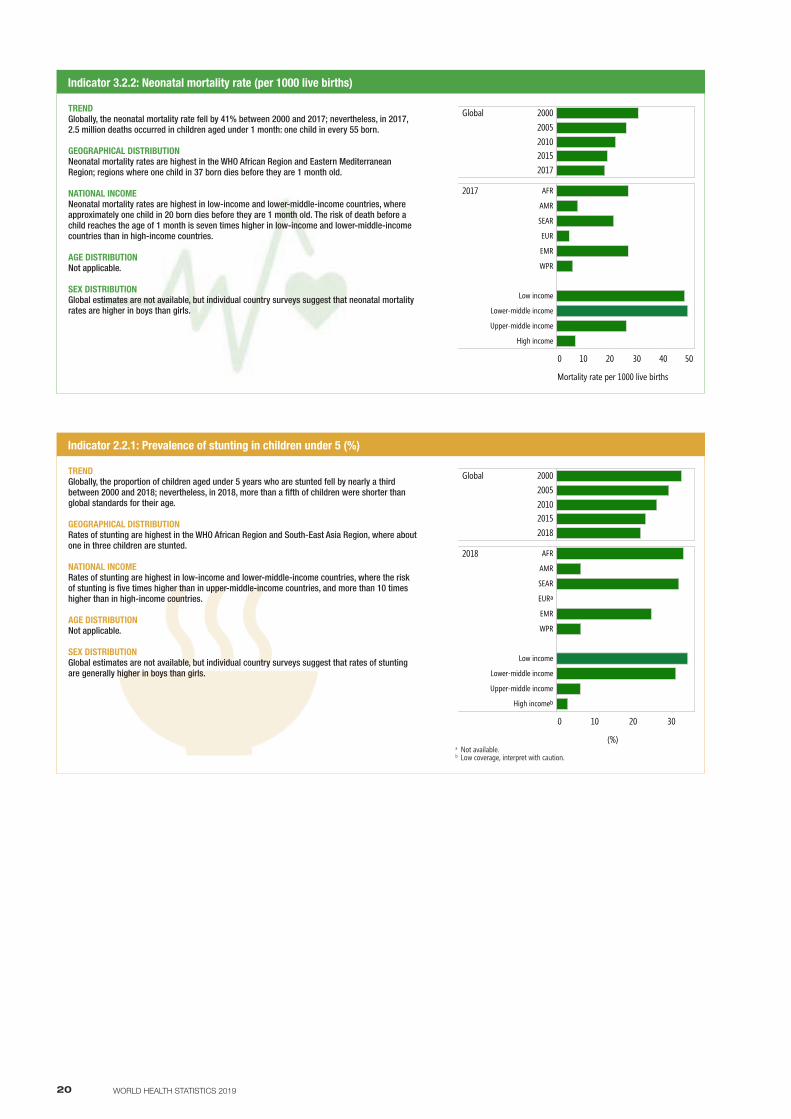
TREND Globally, the neonatal mortality rate fell by 41% between 2000 and 2017; nevertheless, in 2017, 2.5 million deaths occurred in children aged under 1 month: one child in every 55 born.
GEOGRAPHICAL DISTRIBUTIONNeonatal mortality rates are highest in the WHO African Region and Eastern Mediterranean Region; regions where one child in 37 born dies before they are 1 month old.
NATIONAL INCOMENeonatal mortality rates are highest in low-income and lower-middle-income countries, where approximately one child in 20 born dies before they are 1 month old. The risk of death before a child reaches the age of 1 month is seven times higher in low-income and lower-middle-income countries than in high-income countries.
AGE DISTRIBUTIONNot applicable.
SEX DISTRIBUTIONGlobal estimates are not available, but individual country surveys suggest that neonatal mortality rates are higher in boys than girls.
Indicator 3.2.2: Neonatal mortality rate (per 1000 live births)
0 10 20 30 40 50
2017 AFR
AMR
SEAR
EUR
EMR
WPR
Low income
Lower-middle income
Upper-middle income
High income
Mortality rate per 1000 live births
Neonatal
Global 20002005201020152017
TREND Globally, the proportion of children aged under 5 years who are stunted fell by nearly a third between 2000 and 2018; nevertheless, in 2018, more than a fifth of children were shorter than global standards for their age.
GEOGRAPHICAL DISTRIBUTIONRates of stunting are highest in the WHO African Region and South-East Asia Region, where about one in three children are stunted.
NATIONAL INCOMERates of stunting are highest in low-income and lower-middle-income countries, where the risk of stunting is five times higher than in upper-middle-income countries, and more than 10 times higher than in high-income countries.
AGE DISTRIBUTIONNot applicable.
SEX DISTRIBUTIONGlobal estimates are not available, but individual country surveys suggest that rates of stunting are generally higher in boys than girls.
Indicator 2.2.1: Prevalence of stunting in children under 5 (%)
0 10 20 30
2018 AFR
AMR
SEAR
EURᵃ
EMR
WPR
Low income
Lower-middle income
Upper-middle income
High incomeᵇ
(%)
stunting
Global 20002005201020152018
a Not available.b Low coverage, interpret with caution.
21MONITORING HEALTH FOR THE SDGs
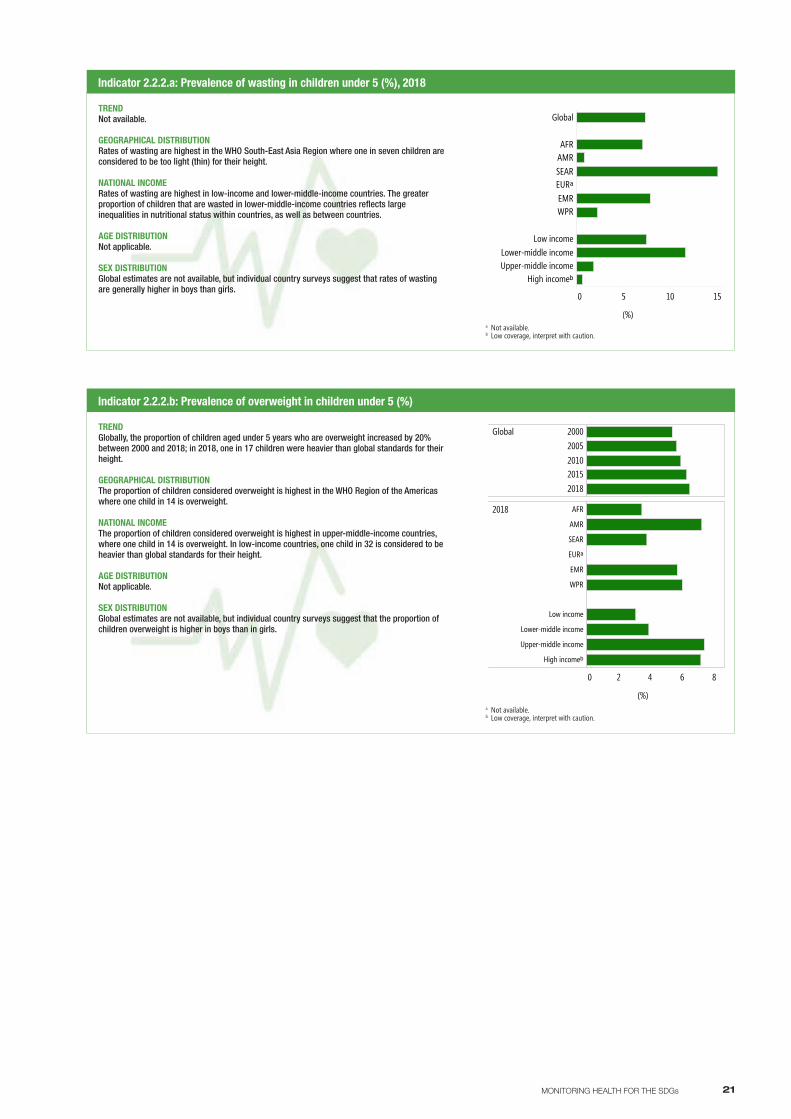
TREND Not available.
GEOGRAPHICAL DISTRIBUTIONRates of wasting are highest in the WHO South-East Asia Region where one in seven children are considered to be too light (thin) for their height.
NATIONAL INCOMERates of wasting are highest in low-income and lower-middle-income countries. The greater proportion of children that are wasted in lower-middle-income countries reflects large inequalities in nutritional status within countries, as well as between countries.
AGE DISTRIBUTIONNot applicable.
SEX DISTRIBUTIONGlobal estimates are not available, but individual country surveys suggest that rates of wasting are generally higher in boys than girls.
Indicator 2.2.2.a: Prevalence of wasting in children under 5 (%), 2018
0 5 10 15
Global
AFRAMRSEAREURᵃEMRWPR
Low incomeLower-middle incomeUpper-middle income
High incomeᵇ
(%)
wasting
a Not available.b Low coverage, interpret with caution.
TREND Globally, the proportion of children aged under 5 years who are overweight increased by 20% between 2000 and 2018; in 2018, one in 17 children were heavier than global standards for their height.
GEOGRAPHICAL DISTRIBUTIONThe proportion of children considered overweight is highest in the WHO Region of the Americas where one child in 14 is overweight.
NATIONAL INCOMEThe proportion of children considered overweight is highest in upper-middle-income countries, where one child in 14 is overweight. In low-income countries, one child in 32 is considered to be heavier than global standards for their height.
AGE DISTRIBUTIONNot applicable.
SEX DISTRIBUTIONGlobal estimates are not available, but individual country surveys suggest that the proportion of children overweight is higher in boys than in girls.
Indicator 2.2.2.b: Prevalence of overweight in children under 5 (%)
0 2 4 6 8
2018 AFR
AMR
SEAR
EURᵃ
EMR
WPR
Low income
Lower-middle income
Upper-middle income
High incomeᵇ
(%)
overweight
Global 20002005201020152018
a Not available.b Low coverage, interpret with caution.
22 WORLD HEALTH STATISTICS 2019
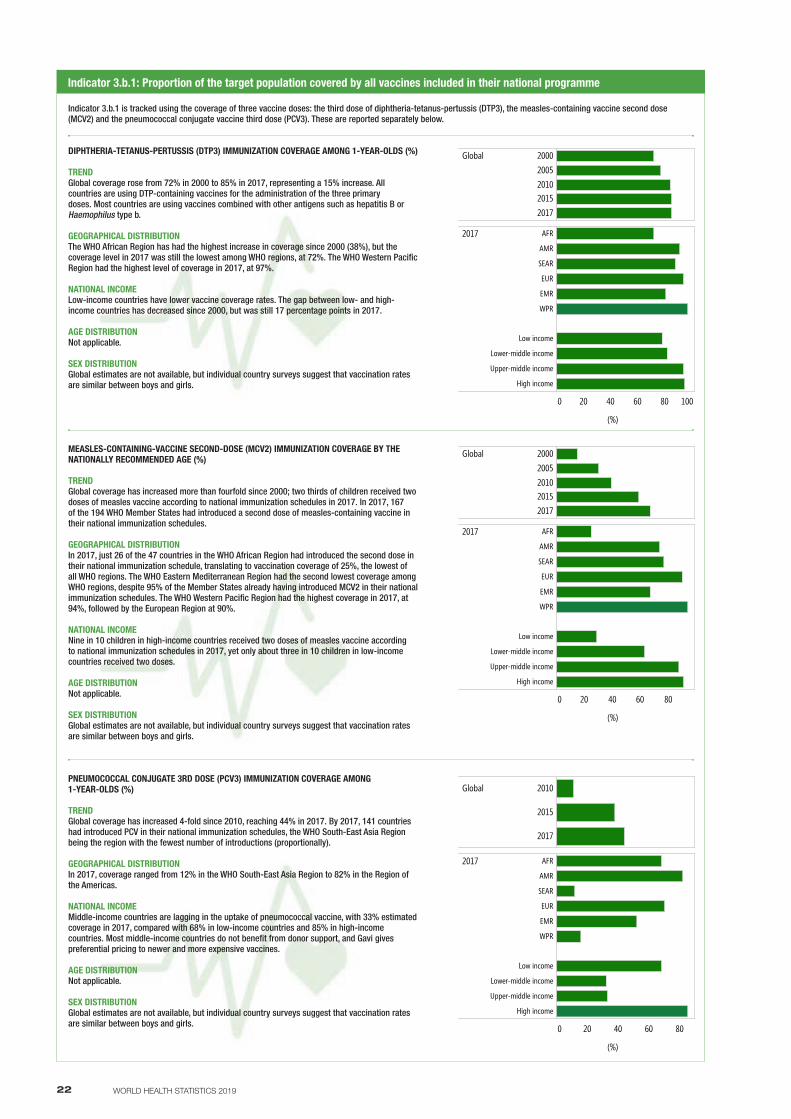
Indicator 3.b.1 is tracked using the coverage of three vaccine doses: the third dose of diphtheria-tetanus-pertussis (DTP3), the measles-containing vaccine second dose (MCV2) and the pneumococcal conjugate vaccine third dose (PCV3). These are reported separately below.
DIPHTHERIA-TETANUS-PERTUSSIS (DTP3) IMMUNIZATION COVERAGE AMONG 1-YEAR-OLDS (%)
TREND Global coverage rose from 72% in 2000 to 85% in 2017, representing a 15% increase. All countries are using DTP-containing vaccines for the administration of the three primary doses. Most countries are using vaccines combined with other antigens such as hepatitis B or Haemophilus type b.
GEOGRAPHICAL DISTRIBUTIONThe WHO African Region has had the highest increase in coverage since 2000 (38%), but the coverage level in 2017 was still the lowest among WHO regions, at 72%. The WHO Western Pacific Region had the highest level of coverage in 2017, at 97%.
NATIONAL INCOMELow-income countries have lower vaccine coverage rates. The gap between low- and high-income countries has decreased since 2000, but was still 17 percentage points in 2017.
AGE DISTRIBUTIONNot applicable.
SEX DISTRIBUTIONGlobal estimates are not available, but individual country surveys suggest that vaccination rates are similar between boys and girls.
MEASLES-CONTAINING-VACCINE SECOND-DOSE (MCV2) IMMUNIZATION COVERAGE BY THE NATIONALLY RECOMMENDED AGE (%)
TREND Global coverage has increased more than fourfold since 2000; two thirds of children received two doses of measles vaccine according to national immunization schedules in 2017. In 2017, 167 of the 194 WHO Member States had introduced a second dose of measles-containing vaccine in their national immunization schedules.
GEOGRAPHICAL DISTRIBUTIONIn 2017, just 26 of the 47 countries in the WHO African Region had introduced the second dose in their national immunization schedule, translating to vaccination coverage of 25%, the lowest of all WHO regions. The WHO Eastern Mediterranean Region had the second lowest coverage among WHO regions, despite 95% of the Member States already having introduced MCV2 in their national immunization schedules. The WHO Western Pacific Region had the highest coverage in 2017, at 94%, followed by the European Region at 90%.
NATIONAL INCOMENine in 10 children in high-income countries received two doses of measles vaccine according to national immunization schedules in 2017, yet only about three in 10 children in low-income countries received two doses.
AGE DISTRIBUTIONNot applicable.
SEX DISTRIBUTIONGlobal estimates are not available, but individual country surveys suggest that vaccination rates are similar between boys and girls.
PNEUMOCOCCAL CONJUGATE 3RD DOSE (PCV3) IMMUNIZATION COVERAGE AMONG 1-YEAR-OLDS (%)
TREND Global coverage has increased 4-fold since 2010, reaching 44% in 2017. By 2017, 141 countries had introduced PCV in their national immunization schedules, the WHO South-East Asia Region being the region with the fewest number of introductions (proportionally).
GEOGRAPHICAL DISTRIBUTIONIn 2017, coverage ranged from 12% in the WHO South-East Asia Region to 82% in the Region of the Americas.
NATIONAL INCOMEMiddle-income countries are lagging in the uptake of pneumococcal vaccine, with 33% estimated coverage in 2017, compared with 68% in low-income countries and 85% in high-income countries. Most middle-income countries do not benefit from donor support, and Gavi gives preferential pricing to newer and more expensive vaccines.
AGE DISTRIBUTIONNot applicable.
SEX DISTRIBUTIONGlobal estimates are not available, but individual country surveys suggest that vaccination rates are similar between boys and girls.
Indicator 3.b.1: Proportion of the target population covered by all vaccines included in their national programme
0 20 40 60 80 100
2017 AFR
AMR
SEAR
EUR
EMR
WPR
Low income
Lower-middle income
Upper-middle income
High income
(%)
DTP3
Global 20002005201020152017
0 20 40 60 80
2017 AFR
AMR
SEAR
EUR
EMR
WPR
Low income
Lower-middle income
Upper-middle income
High income
(%)
MCV2
Global 20002005201020152017
0 20 40 60 80
2017 AFR
AMR
SEAR
EUR
EMR
WPR
Low income
Lower-middle income
Upper-middle income
High income
(%)
PCV3
Global 2010
2015
2017
23MONITORING HEALTH FOR THE SDGs
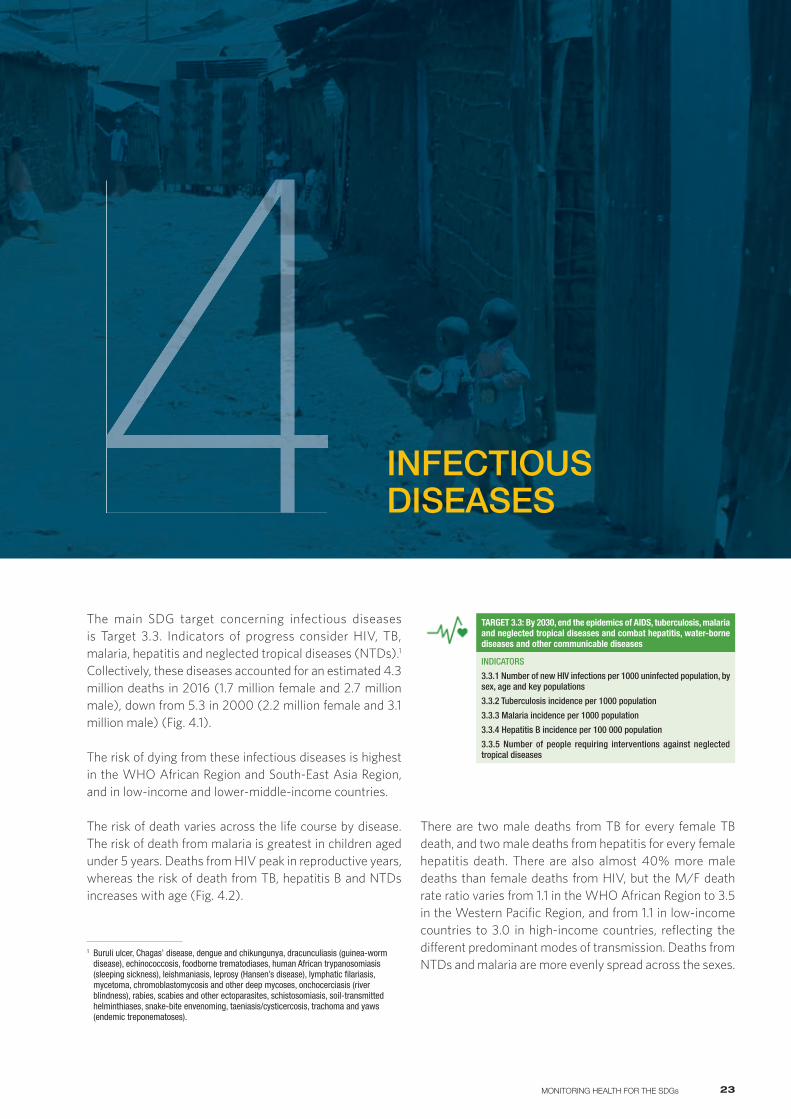
INFECTIOUS DISEASES4
The main SDG target concerning infectious diseases is Target 3.3. Indicators of progress consider HIV, TB, malaria, hepatitis and neglected tropical diseases (NTDs).1 Collectively, these diseases accounted for an estimated 4.3 million deaths in 2016 (1.7 million female and 2.7 million male), down from 5.3 in 2000 (2.2 million female and 3.1 million male) (Fig. 4.1).
The risk of dying from these infectious diseases is highest in the WHO African Region and South-East Asia Region, and in low-income and lower-middle-income countries.
The risk of death varies across the life course by disease. The risk of death from malaria is greatest in children aged under 5 years. Deaths from HIV peak in reproductive years, whereas the risk of death from TB, hepatitis B and NTDs increases with age (Fig. 4.2).
1 Buruli ulcer, Chagas’ disease, dengue and chikungunya, dracunculiasis (guinea-worm disease), echinococcosis, foodborne trematodiases, human African trypanosomiasis (sleeping sickness), leishmaniasis, leprosy (Hansen’s disease), lymphatic filariasis, mycetoma, chromoblastomycosis and other deep mycoses, onchocerciasis (river blindness), rabies, scabies and other ectoparasites, schistosomiasis, soil-transmitted helminthiases, snake-bite envenoming, taeniasis/cysticercosis, trachoma and yaws (endemic treponematoses).
TARGET 3.3: By 2030, end the epidemics of AIDS, tuberculosis, malaria and neglected tropical diseases and combat hepatitis, water-borne diseases and other communicable diseases
INDICATORS
3.3.1 Number of new HIV infections per 1000 uninfected population, by sex, age and key populations
3.3.2 Tuberculosis incidence per 1000 population
3.3.3 Malaria incidence per 1000 population
3.3.4 Hepatitis B incidence per 100 000 population
3.3.5 Number of people requiring interventions against neglected tropical diseases
There are two male deaths from TB for every female TB death, and two male deaths from hepatitis for every female hepatitis death. There are also almost 40% more male deaths than female deaths from HIV, but the M/F death rate ratio varies from 1.1 in the WHO African Region to 3.5 in the Western Pacific Region, and from 1.1 in low-income countries to 3.0 in high-income countries, reflecting the different predominant modes of transmission. Deaths from NTDs and malaria are more evenly spread across the sexes.
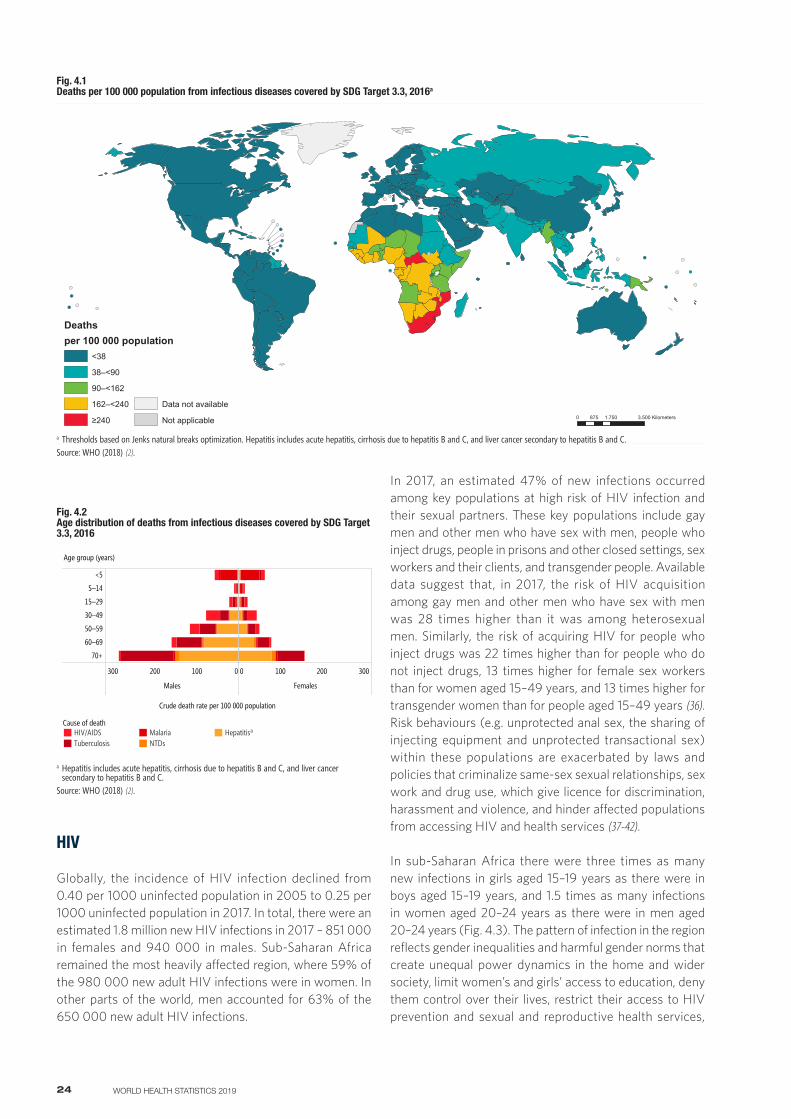
24 WORLD HEALTH STATISTICS 2019
Fig. 4.2 Age distribution of deaths from infectious diseases covered by SDG Target 3.3, 2016
0100200300
Males
0 100 200 300
Females
<5
5–14
15–29
30–49
50–59
60–69
70+
Cause of deathHIV/AIDSTuberculosis
MalariaNTDs
Hepatitisª
Crude death rate per 100 000 population
Age group (years)
a Hepatitis includes acute hepatitis, cirrhosis due to hepatitis B and C, and liver cancer secondary to hepatitis B and C.
Source: WHO (2018) (2).
HIV
Globally, the incidence of HIV infection declined from 0.40 per 1000 uninfected population in 2005 to 0.25 per 1000 uninfected population in 2017. In total, there were an estimated 1.8 million new HIV infections in 2017 – 851 000 in females and 940 000 in males. Sub-Saharan Africa remained the most heavily affected region, where 59% of the 980 000 new adult HIV infections were in women. In other parts of the world, men accounted for 63% of the 650 000 new adult HIV infections.
In 2017, an estimated 47% of new infections occurred among key populations at high risk of HIV infection and their sexual partners. These key populations include gay men and other men who have sex with men, people who inject drugs, people in prisons and other closed settings, sex workers and their clients, and transgender people. Available data suggest that, in 2017, the risk of HIV acquisition among gay men and other men who have sex with men was 28 times higher than it was among heterosexual men. Similarly, the risk of acquiring HIV for people who inject drugs was 22 times higher than for people who do not inject drugs, 13 times higher for female sex workers than for women aged 15–49 years, and 13 times higher for transgender women than for people aged 15–49 years (36). Risk behaviours (e.g. unprotected anal sex, the sharing of injecting equipment and unprotected transactional sex) within these populations are exacerbated by laws and policies that criminalize same-sex sexual relationships, sex work and drug use, which give licence for discrimination, harassment and violence, and hinder affected populations from accessing HIV and health services (37-42).
In sub-Saharan Africa there were three times as many new infections in girls aged 15–19 years as there were in boys aged 15–19 years, and 1.5 times as many infections in women aged 20–24 years as there were in men aged 20–24 years (Fig. 4.3). The pattern of infection in the region reflects gender inequalities and harmful gender norms that create unequal power dynamics in the home and wider society, limit women’s and girls’ access to education, deny them control over their lives, restrict their access to HIV prevention and sexual and reproductive health services,
Fig. 4.1 Deaths per 100 000 population from infectious diseases covered by SDG Target 3.3, 2016a
Deathsper 100 000 population
<38
38–<90
90–<162
162–<240
≥240
Data not available
Not applicable 0 1.750 3.500875 Kilometers
a Thresholds based on Jenks natural breaks optimization. Hepatitis includes acute hepatitis, cirrhosis due to hepatitis B and C, and liver cancer secondary to hepatitis B and C.Source: WHO (2018) (2).
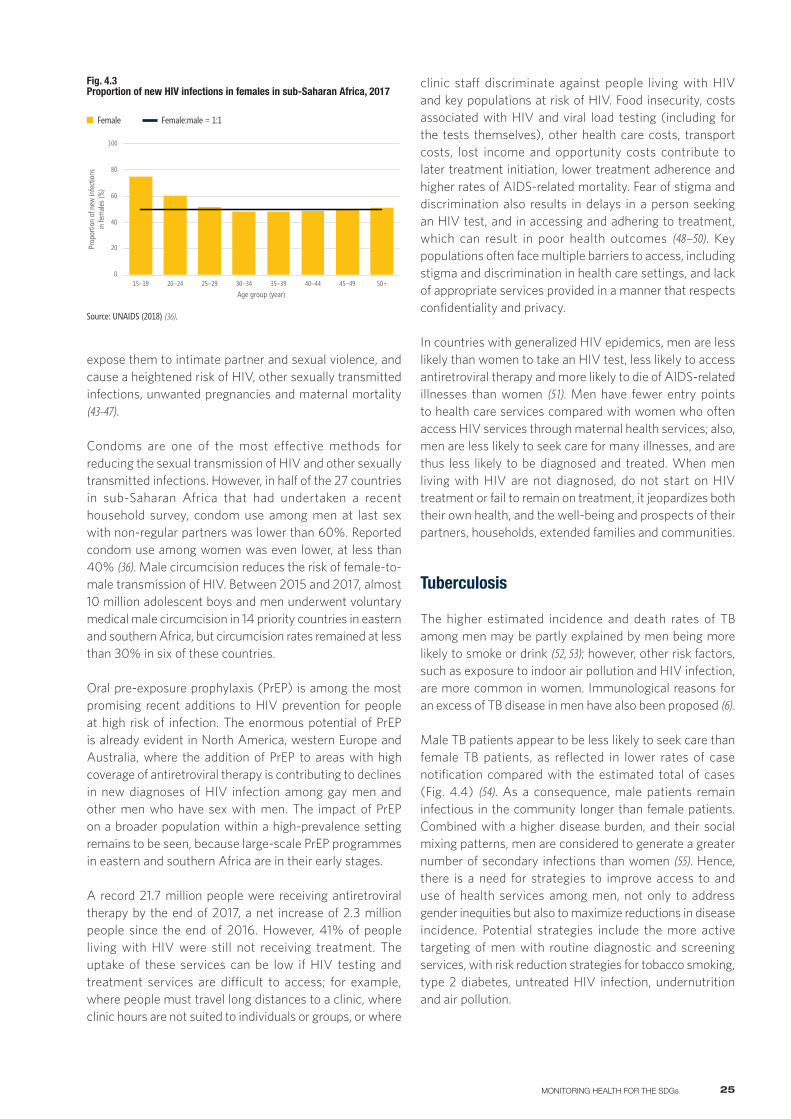
25MONITORING HEALTH FOR THE SDGs
expose them to intimate partner and sexual violence, and cause a heightened risk of HIV, other sexually transmitted infections, unwanted pregnancies and maternal mortality (43-47).
Condoms are one of the most effective methods for reducing the sexual transmission of HIV and other sexually transmitted infections. However, in half of the 27 countries in sub-Saharan Africa that had undertaken a recent household survey, condom use among men at last sex with non-regular partners was lower than 60%. Reported condom use among women was even lower, at less than 40% (36). Male circumcision reduces the risk of female-to-male transmission of HIV. Between 2015 and 2017, almost 10 million adolescent boys and men underwent voluntary medical male circumcision in 14 priority countries in eastern and southern Africa, but circumcision rates remained at less than 30% in six of these countries.
Oral pre-exposure prophylaxis (PrEP) is among the most promising recent additions to HIV prevention for people at high risk of infection. The enormous potential of PrEP is already evident in North America, western Europe and Australia, where the addition of PrEP to areas with high coverage of antiretroviral therapy is contributing to declines in new diagnoses of HIV infection among gay men and other men who have sex with men. The impact of PrEP on a broader population within a high-prevalence setting remains to be seen, because large-scale PrEP programmes in eastern and southern Africa are in their early stages.
A record 21.7 million people were receiving antiretroviral therapy by the end of 2017, a net increase of 2.3 million people since the end of 2016. However, 41% of people living with HIV were still not receiving treatment. The uptake of these services can be low if HIV testing and treatment services are difficult to access; for example, where people must travel long distances to a clinic, where clinic hours are not suited to individuals or groups, or where
clinic staff discriminate against people living with HIV and key populations at risk of HIV. Food insecurity, costs associated with HIV and viral load testing (including for the tests themselves), other health care costs, transport costs, lost income and opportunity costs contribute to later treatment initiation, lower treatment adherence and higher rates of AIDS-related mortality. Fear of stigma and discrimination also results in delays in a person seeking an HIV test, and in accessing and adhering to treatment, which can result in poor health outcomes (48–50). Key populations often face multiple barriers to access, including stigma and discrimination in health care settings, and lack of appropriate services provided in a manner that respects confidentiality and privacy.
In countries with generalized HIV epidemics, men are less likely than women to take an HIV test, less likely to access antiretroviral therapy and more likely to die of AIDS-related illnesses than women (51). Men have fewer entry points to health care services compared with women who often access HIV services through maternal health services; also, men are less likely to seek care for many illnesses, and are thus less likely to be diagnosed and treated. When men living with HIV are not diagnosed, do not start on HIV treatment or fail to remain on treatment, it jeopardizes both their own health, and the well-being and prospects of their partners, households, extended families and communities.
Tuberculosis
The higher estimated incidence and death rates of TB among men may be partly explained by men being more likely to smoke or drink (52, 53); however, other risk factors, such as exposure to indoor air pollution and HIV infection, are more common in women. Immunological reasons for an excess of TB disease in men have also been proposed (6).
Male TB patients appear to be less likely to seek care than female TB patients, as reflected in lower rates of case notification compared with the estimated total of cases (Fig. 4.4) (54). As a consequence, male patients remain infectious in the community longer than female patients. Combined with a higher disease burden, and their social mixing patterns, men are considered to generate a greater number of secondary infections than women (55). Hence, there is a need for strategies to improve access to and use of health services among men, not only to address gender inequities but also to maximize reductions in disease incidence. Potential strategies include the more active targeting of men with routine diagnostic and screening services, with risk reduction strategies for tobacco smoking, type 2 diabetes, untreated HIV infection, undernutrition and air pollution.
Fig. 4.3 Proportion of new HIV infections in females in sub-Saharan Africa, 2017
0
20
40
60
80
100
15–19 20–24 25–29 30–34 35–39 40–44 45–49 50+
Prop
ortio
n of
new
infe
ction
s in
fem
ales (
%)
Age group (year)
Source: UNAIDS (2018) (36).
Female Female:male = 1:1
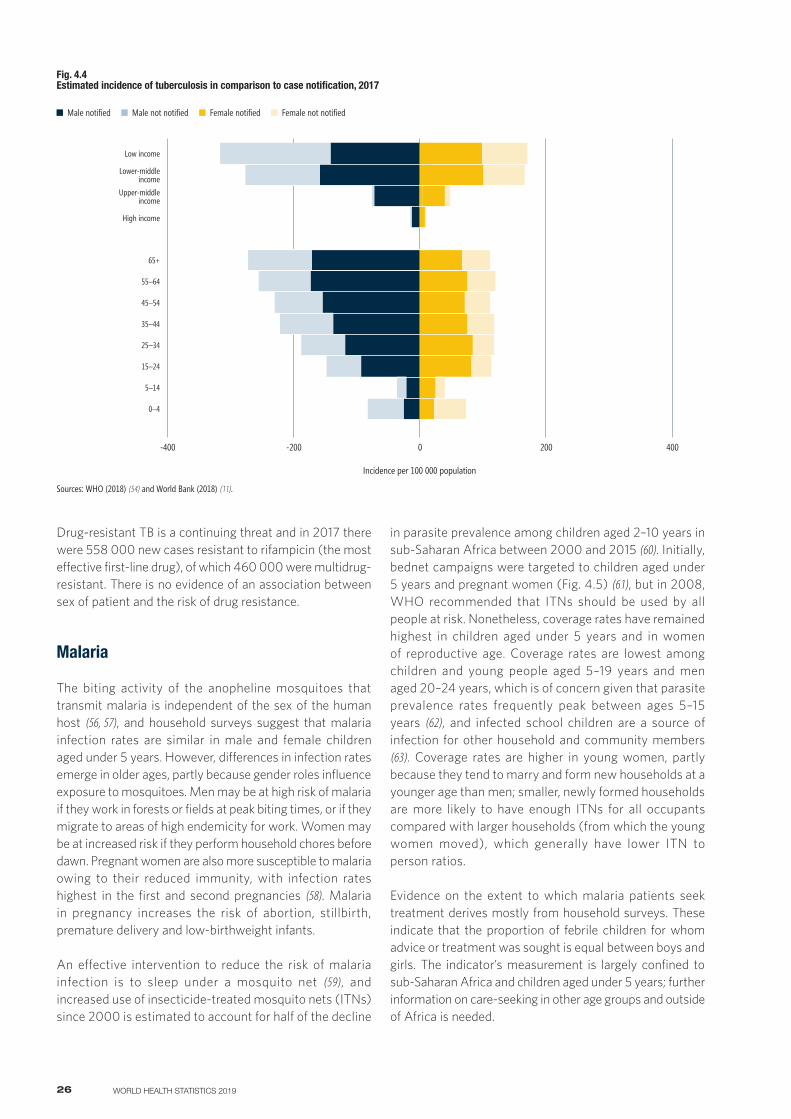
26 WORLD HEALTH STATISTICS 2019
Male notified Male not notified Female notified Female not notified
-400 -200 4000 200
Incidence per 100 000 population
65+
Low income
Lower-middle income
Upper-middle income
High income
55–64
45–54
35–44
25–34
15–24
5–14
0–4
Fig. 4.4 Estimated incidence of tuberculosis in comparison to case notification, 2017
Sources: WHO (2018) (54) and World Bank (2018) (11).
Drug-resistant TB is a continuing threat and in 2017 there were 558 000 new cases resistant to rifampicin (the most effective first-line drug), of which 460 000 were multidrug-resistant. There is no evidence of an association between sex of patient and the risk of drug resistance.
Malaria
The biting activity of the anopheline mosquitoes that transmit malaria is independent of the sex of the human host (56, 57), and household surveys suggest that malaria infection rates are similar in male and female children aged under 5 years. However, differences in infection rates emerge in older ages, partly because gender roles influence exposure to mosquitoes. Men may be at high risk of malaria if they work in forests or fields at peak biting times, or if they migrate to areas of high endemicity for work. Women may be at increased risk if they perform household chores before dawn. Pregnant women are also more susceptible to malaria owing to their reduced immunity, with infection rates highest in the first and second pregnancies (58). Malaria in pregnancy increases the risk of abortion, stillbirth, premature delivery and low-birthweight infants.
An effective intervention to reduce the risk of malaria infection is to sleep under a mosquito net (59), and increased use of insecticide-treated mosquito nets (ITNs) since 2000 is estimated to account for half of the decline
in parasite prevalence among children aged 2–10 years in sub-Saharan Africa between 2000 and 2015 (60). Initially, bednet campaigns were targeted to children aged under 5 years and pregnant women (Fig. 4.5) (61), but in 2008, WHO recommended that ITNs should be used by all people at risk. Nonetheless, coverage rates have remained highest in children aged under 5 years and in women of reproductive age. Coverage rates are lowest among children and young people aged 5–19 years and men aged 20–24 years, which is of concern given that parasite prevalence rates frequently peak between ages 5–15 years (62), and infected school children are a source of infection for other household and community members (63). Coverage rates are higher in young women, partly because they tend to marry and form new households at a younger age than men; smaller, newly formed households are more likely to have enough ITNs for all occupants compared with larger households (from which the young women moved), which generally have lower ITN to person ratios.
Evidence on the extent to which malaria patients seek treatment derives mostly from household surveys. These indicate that the proportion of febrile children for whom advice or treatment was sought is equal between boys and girls. The indicator’s measurement is largely confined to sub-Saharan Africa and children aged under 5 years; further information on care-seeking in other age groups and outside of Africa is needed.
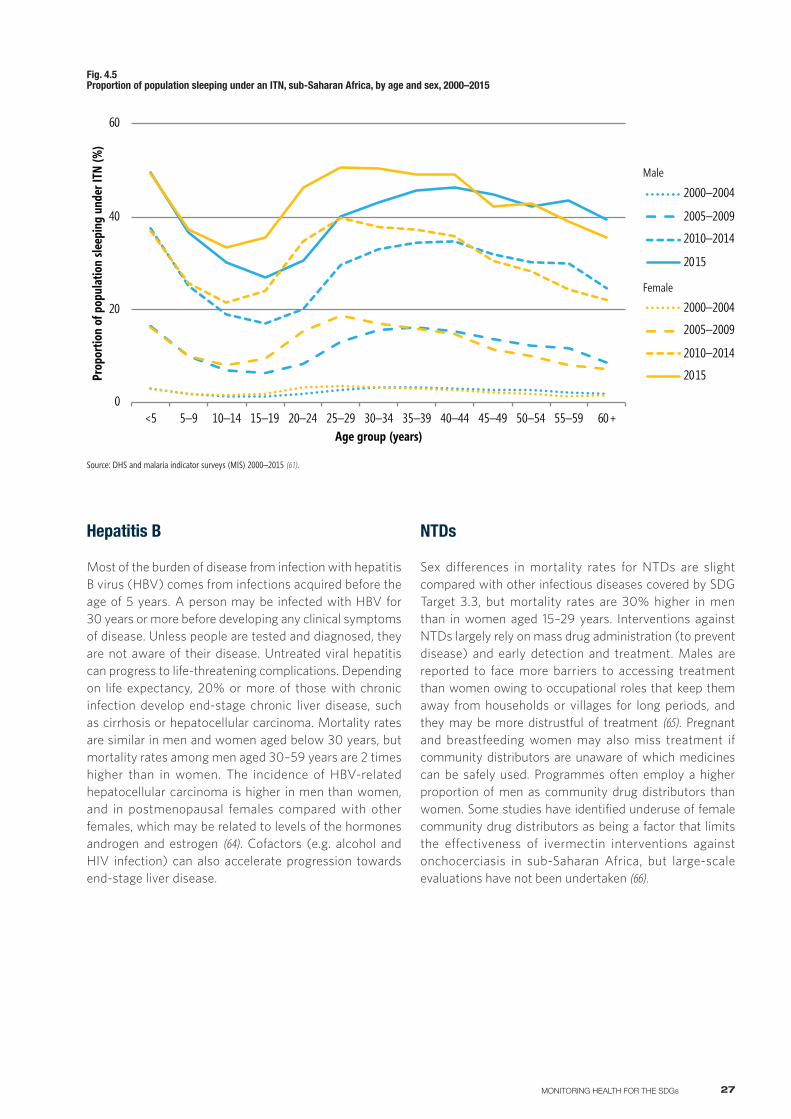
27MONITORING HEALTH FOR THE SDGs
Hepatitis B
Most of the burden of disease from infection with hepatitis B virus (HBV) comes from infections acquired before the age of 5 years. A person may be infected with HBV for 30 years or more before developing any clinical symptoms of disease. Unless people are tested and diagnosed, they are not aware of their disease. Untreated viral hepatitis can progress to life-threatening complications. Depending on life expectancy, 20% or more of those with chronic infection develop end-stage chronic liver disease, such as cirrhosis or hepatocellular carcinoma. Mortality rates are similar in men and women aged below 30 years, but mortality rates among men aged 30–59 years are 2 times higher than in women. The incidence of HBV-related hepatocellular carcinoma is higher in men than women, and in postmenopausal females compared with other females, which may be related to levels of the hormones androgen and estrogen (64). Cofactors (e.g. alcohol and HIV infection) can also accelerate progression towards end-stage liver disease.
Fig. 4.5 Proportion of population sleeping under an ITN, sub-Saharan Africa, by age and sex, 2000–2015
Source: DHS and malaria indicator surveys (MIS) 2000–2015 (61).
0
20
40
60
<5 5–9 10–14 15–19 20–24 25–29 30–34 35–39 40–44 45–49 50–54 55–59 60+
Prop
ortio
n of
pop
ulat
ion
sleep
ing
unde
r ITN
(%)
Age group (years)
2000–2004
2005–2009
2010–2014
2015
2000–2004
2005–2009
2010–2014
2015
Male
Female
NTDs
Sex differences in mortality rates for NTDs are slight compared with other infectious diseases covered by SDG Target 3.3, but mortality rates are 30% higher in men than in women aged 15–29 years. Interventions against NTDs largely rely on mass drug administration (to prevent disease) and early detection and treatment. Males are reported to face more barriers to accessing treatment than women owing to occupational roles that keep them away from households or villages for long periods, and they may be more distrustful of treatment (65). Pregnant and breastfeeding women may also miss treatment if community distributors are unaware of which medicines can be safely used. Programmes often employ a higher proportion of men as community drug distributors than women. Some studies have identified underuse of female community drug distributors as being a factor that limits the effectiveness of ivermectin interventions against onchocerciasis in sub-Saharan Africa, but large-scale evaluations have not been undertaken (66).
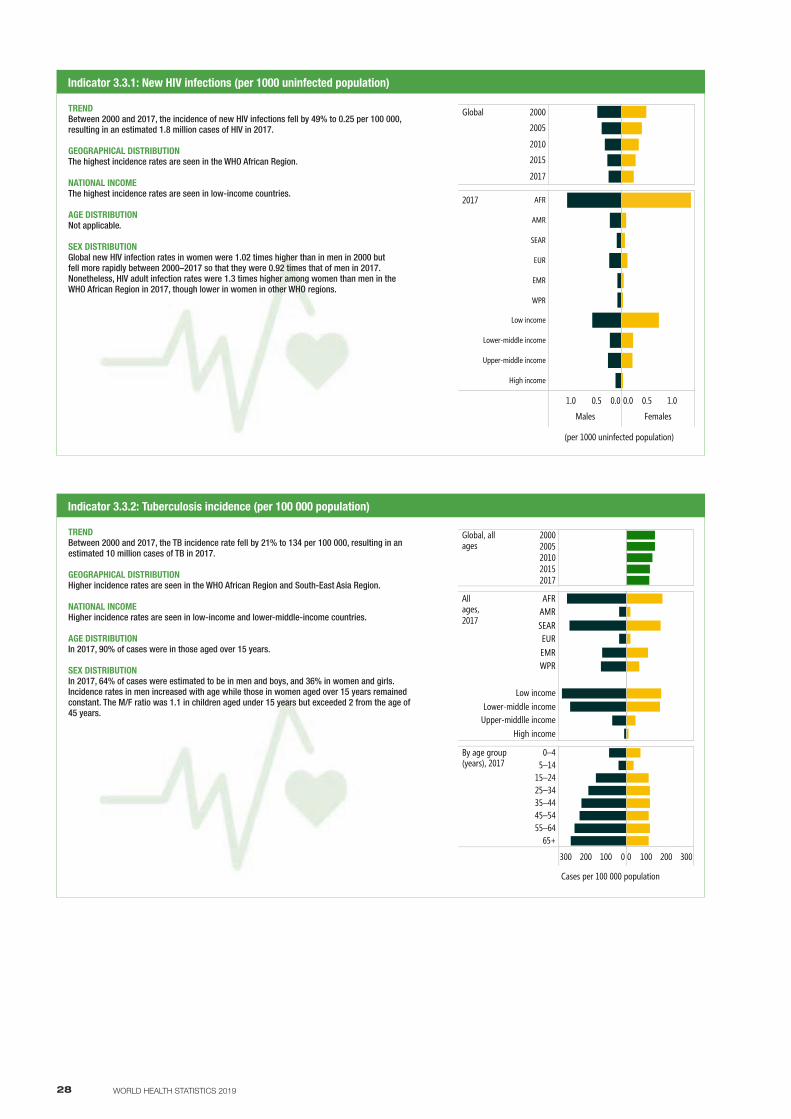
28 WORLD HEALTH STATISTICS 2019
TREND Between 2000 and 2017, the incidence of new HIV infections fell by 49% to 0.25 per 100 000, resulting in an estimated 1.8 million cases of HIV in 2017.
GEOGRAPHICAL DISTRIBUTIONThe highest incidence rates are seen in the WHO African Region.
NATIONAL INCOMEThe highest incidence rates are seen in low-income countries.
AGE DISTRIBUTIONNot applicable.
SEX DISTRIBUTIONGlobal new HIV infection rates in women were 1.02 times higher than in men in 2000 but fell more rapidly between 2000–2017 so that they were 0.92 times that of men in 2017. Nonetheless, HIV adult infection rates were 1.3 times higher among women than men in the WHO African Region in 2017, though lower in women in other WHO regions.
Indicator 3.3.1: New HIV infections (per 1000 uninfected population)
0.00.51.0
Males
0.0 0.5 1.0
Females
2017 AFR
AMR
SEAR
EUR
EMR
WPR
Low income
Lower-middle income
Upper-middle income
High income
(per 1000 uninfected population)
Global 2000
2005
2010
2015
2017
HIV
Indicator 3.3.2: Tuberculosis incidence (per 100 000 population)
0100200300 0 100 200 300
By age group(years), 2017
0–45–14
15–2425–3435–4445–5455–64
65+
Cases per 100 000 population
Allages,2017
AFRAMRSEAREUREMRWPR
Low incomeLower-middle income
Upper-middlle incomeHigh income
Global, allages
20002005201020152017
TREND Between 2000 and 2017, the TB incidence rate fell by 21% to 134 per 100 000, resulting in an estimated 10 million cases of TB in 2017.
GEOGRAPHICAL DISTRIBUTIONHigher incidence rates are seen in the WHO African Region and South-East Asia Region.
NATIONAL INCOMEHigher incidence rates are seen in low-income and lower-middle-income countries.
AGE DISTRIBUTIONIn 2017, 90% of cases were in those aged over 15 years.
SEX DISTRIBUTIONIn 2017, 64% of cases were estimated to be in men and boys, and 36% in women and girls. Incidence rates in men increased with age while those in women aged over 15 years remained constant. The M/F ratio was 1.1 in children aged under 15 years but exceeded 2 from the age of 45 years.
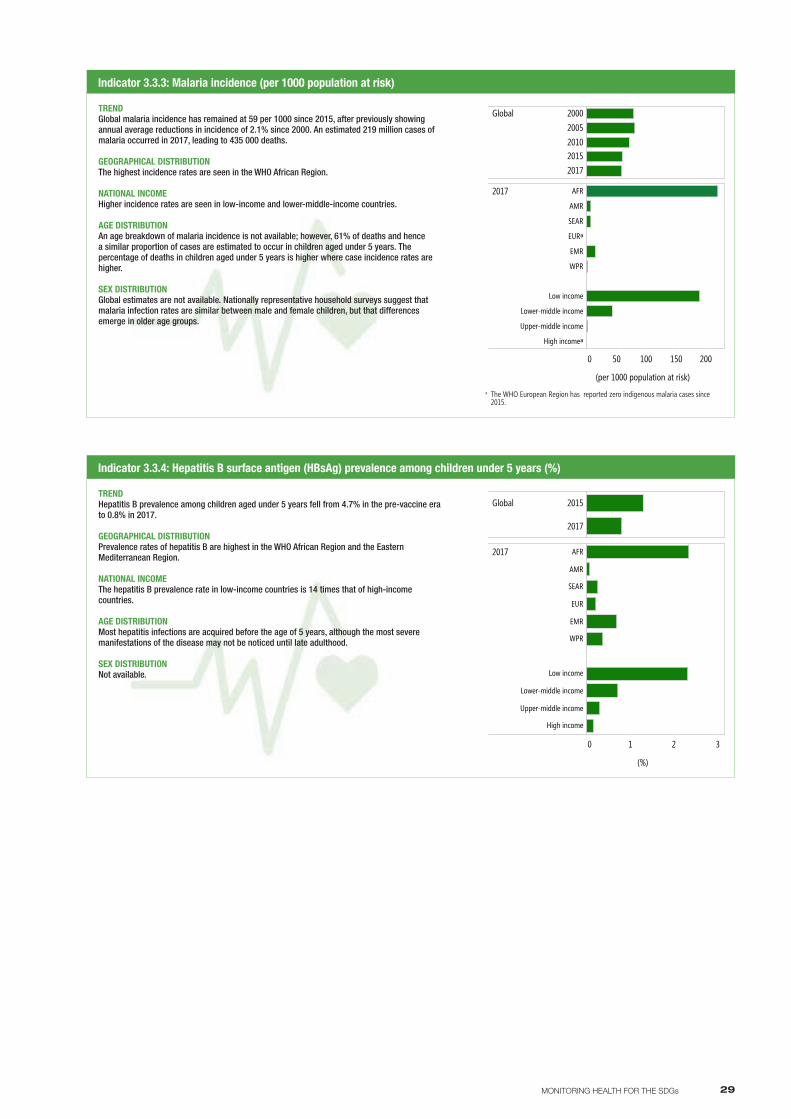
29MONITORING HEALTH FOR THE SDGs
Indicator 3.3.3: Malaria incidence (per 1000 population at risk)
0 50 100 150 200
2017 AFR
AMR
SEAR
EURᵃ
EMR
WPR
Low income
Lower-middle income
Upper-middle income
High incomeᵃ
(per 1000 population at risk)
SDGMALARIA
Global 20002005201020152017
TREND Global malaria incidence has remained at 59 per 1000 since 2015, after previously showing annual average reductions in incidence of 2.1% since 2000. An estimated 219 million cases of malaria occurred in 2017, leading to 435 000 deaths.
GEOGRAPHICAL DISTRIBUTIONThe highest incidence rates are seen in the WHO African Region.
NATIONAL INCOMEHigher incidence rates are seen in low-income and lower-middle-income countries.
AGE DISTRIBUTIONAn age breakdown of malaria incidence is not available; however, 61% of deaths and hence a similar proportion of cases are estimated to occur in children aged under 5 years. The percentage of deaths in children aged under 5 years is higher where case incidence rates are higher.
SEX DISTRIBUTIONGlobal estimates are not available. Nationally representative household surveys suggest that malaria infection rates are similar between male and female children, but that differences emerge in older age groups.
a The WHO European Region has reported zero indigenous malaria cases since 2015.
Indicator 3.3.4: Hepatitis B surface antigen (HBsAg) prevalence among children under 5 years (%)
0 1 2 3
2017 AFR
AMR
SEAR
EUR
EMR
WPR
Low income
Lower-middle income
Upper-middle income
High income
(%)
Hepb
Global 2015
2017
TREND Hepatitis B prevalence among children aged under 5 years fell from 4.7% in the pre-vaccine era to 0.8% in 2017.
GEOGRAPHICAL DISTRIBUTIONPrevalence rates of hepatitis B are highest in the WHO African Region and the Eastern Mediterranean Region.
NATIONAL INCOMEThe hepatitis B prevalence rate in low-income countries is 14 times that of high-income countries.
AGE DISTRIBUTIONMost hepatitis infections are acquired before the age of 5 years, although the most severe manifestations of the disease may not be noticed until late adulthood.
SEX DISTRIBUTIONNot available.
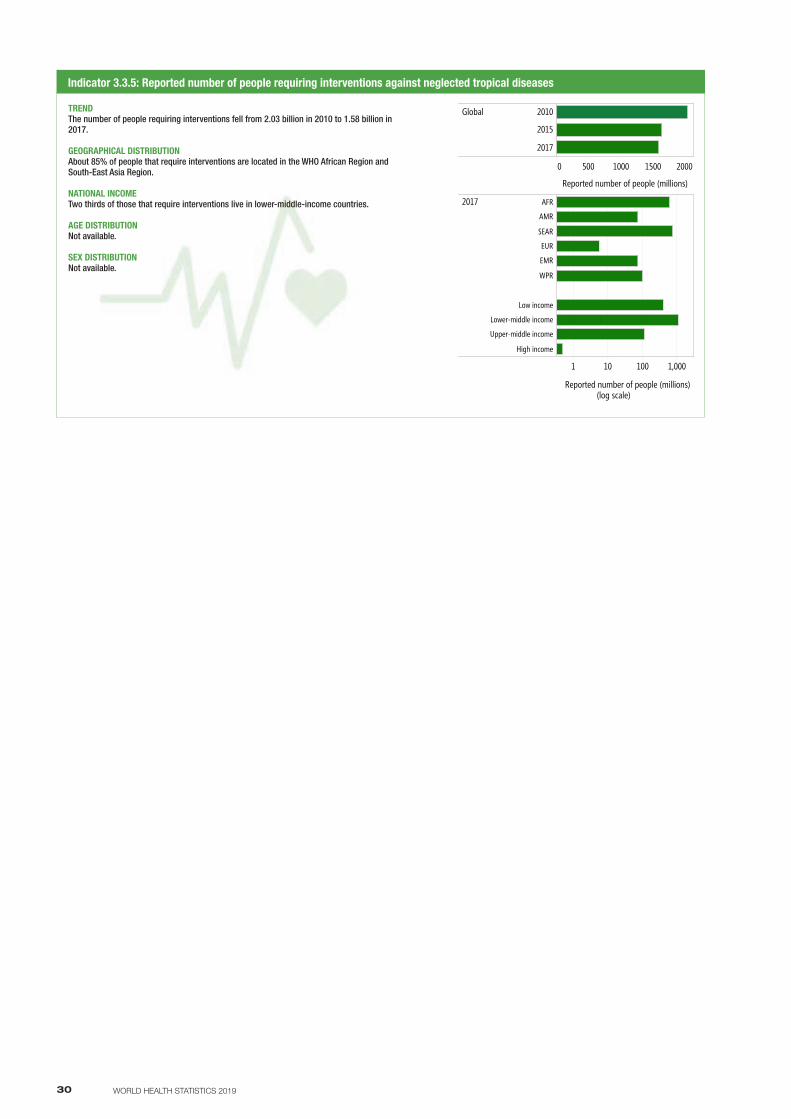
30 WORLD HEALTH STATISTICS 2019
Indicator 3.3.5: Reported number of people requiring interventions against neglected tropical diseases
0 500 1000 1500 2000
Reported number of people (millions)
Global 2010
2015
2017
1 10 100 1,000
2017 AFR
AMR
SEAR
EUR
EMR
WPR
Low income
Lower-middle income
Upper-middle income
High income
Reported number of people (millions) (log scale)
TREND The number of people requiring interventions fell from 2.03 billion in 2010 to 1.58 billion in 2017.
GEOGRAPHICAL DISTRIBUTIONAbout 85% of people that require interventions are located in the WHO African Region and South-East Asia Region.
NATIONAL INCOMETwo thirds of those that require interventions live in lower-middle-income countries.
AGE DISTRIBUTIONNot available.
SEX DISTRIBUTIONNot available.
31MONITORING HEALTH FOR THE SDGs
NONCOMMUNICABLE DISEASES5
The SDG targets concerning noncommunicable diseases (NCDs) are twofold; namely, improving health outcomes (Target 3.4) and lowering the exposure to NCD risk factors (Targets 3.5 and 3.A). Target 3.4 is assessed on the reduction in risk of premature death between the ages of 30 and 70 years from cardiovascular disease (CVD), cancer, diabetes and chronic respiratory disease (Indicator 3.4.1), and reduction in suicide mortality rates (Indicator 3.4.2).
NCDs collectively caused 41 million deaths worldwide in 2016, equivalent to 71% of all global deaths. Additionally, there were nearly 800 000 deaths from suicide.
Globally in 2016, the risk of a 30-year-old person dying from any of the four major NCDs before reaching the age of 70 years was 21.6% for men and 15.0% for women. The highest risks of premature death from NCDs by WHO region were seen in the WHO South-East Asia Region for men (26.5%) and in the WHO African Region for women (20.1%), whereas the highest risks by national income were in lower-middle-income countries for both sexes (26.6% for men and 19.9% for women). The risk of death from NCDs increased with age.
At a global level, CVD causes more premature deaths than cancer; however, for women in the WHO European Region
TARGET 3.4: By 2030, reduce by one third premature mortality from noncommunicable diseases through prevention and treatment and promote mental health and well-being
INDICATORS
3.4.1 Mortality rate attributed to cardiovascular disease, cancer, diabetes or chronic respiratory disease
3.4.2 Suicide mortality rate
TARGET 3.5: Strengthen the prevention and treatment of substance abuse, including narcotic drug abuse and harmful use of alcohol
INDICATORS
3.5.1 Coverage of treatment interventions (pharmacological, psychosocial and rehabilitation and aftercare services) for substance use disorders
3.5.2 Harmful use of alcohol, defined according to the national context as alcohol per capita consumption (aged 15 years and older) within a calendar year in litres of pure alcohol
TARGET 3.a: Strengthen the implementation of the WHO Framework Convention on Tobacco Control in all countries, as appropriate
INDICATOR
3.a.1 Age-standardized prevalence of current tobacco use among persons aged 15 years and older
and the Region of the Americas, cancer is the predominant cause of NCD premature deaths. Overall, in 2016, men were more likely than women to die from all four major NCDs, except in the WHO African Region and the Eastern Mediterranean Region, where women had higher age-standardized rates of premature death from cancer than men, and in the Western Pacific Region and the Eastern
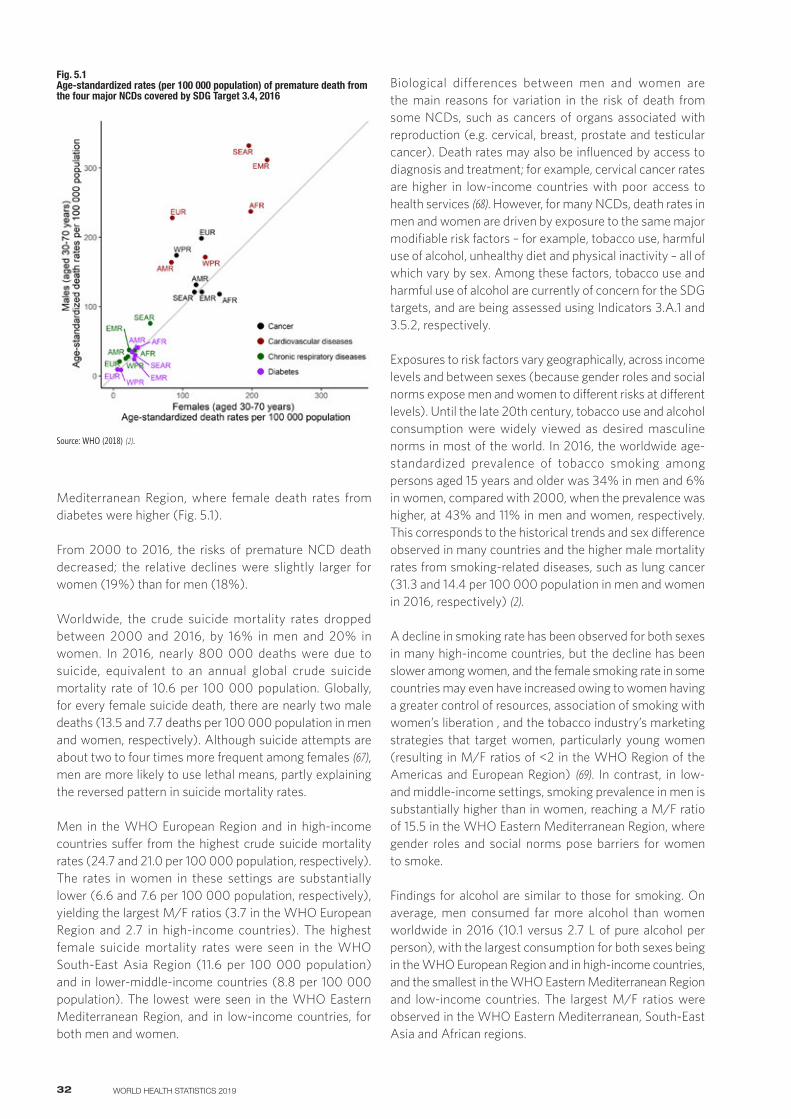
32 WORLD HEALTH STATISTICS 2019
Mediterranean Region, where female death rates from diabetes were higher (Fig. 5.1).
From 2000 to 2016, the risks of premature NCD death decreased; the relative declines were slightly larger for women (19%) than for men (18%).
Worldwide, the crude suicide mortality rates dropped between 2000 and 2016, by 16% in men and 20% in women. In 2016, nearly 800 000 deaths were due to suicide, equivalent to an annual global crude suicide mortality rate of 10.6 per 100 000 population. Globally, for every female suicide death, there are nearly two male deaths (13.5 and 7.7 deaths per 100 000 population in men and women, respectively). Although suicide attempts are about two to four times more frequent among females (67), men are more likely to use lethal means, partly explaining the reversed pattern in suicide mortality rates.
Men in the WHO European Region and in high-income countries suffer from the highest crude suicide mortality rates (24.7 and 21.0 per 100 000 population, respectively). The rates in women in these settings are substantially lower (6.6 and 7.6 per 100 000 population, respectively), yielding the largest M/F ratios (3.7 in the WHO European Region and 2.7 in high-income countries). The highest female suicide mortality rates were seen in the WHO South-East Asia Region (11.6 per 100 000 population) and in lower-middle-income countries (8.8 per 100 000 population). The lowest were seen in the WHO Eastern Mediterranean Region, and in low-income countries, for both men and women.
Biological differences between men and women are the main reasons for variation in the risk of death from some NCDs, such as cancers of organs associated with reproduction (e.g. cervical, breast, prostate and testicular cancer). Death rates may also be influenced by access to diagnosis and treatment; for example, cervical cancer rates are higher in low-income countries with poor access to health services (68). However, for many NCDs, death rates in men and women are driven by exposure to the same major modifiable risk factors – for example, tobacco use, harmful use of alcohol, unhealthy diet and physical inactivity – all of which vary by sex. Among these factors, tobacco use and harmful use of alcohol are currently of concern for the SDG targets, and are being assessed using Indicators 3.A.1 and 3.5.2, respectively.
Exposures to risk factors vary geographically, across income levels and between sexes (because gender roles and social norms expose men and women to different risks at different levels). Until the late 20th century, tobacco use and alcohol consumption were widely viewed as desired masculine norms in most of the world. In 2016, the worldwide age-standardized prevalence of tobacco smoking among persons aged 15 years and older was 34% in men and 6% in women, compared with 2000, when the prevalence was higher, at 43% and 11% in men and women, respectively. This corresponds to the historical trends and sex difference observed in many countries and the higher male mortality rates from smoking-related diseases, such as lung cancer (31.3 and 14.4 per 100 000 population in men and women in 2016, respectively) (2).
A decline in smoking rate has been observed for both sexes in many high-income countries, but the decline has been slower among women, and the female smoking rate in some countries may even have increased owing to women having a greater control of resources, association of smoking with women’s liberation , and the tobacco industry’s marketing strategies that target women, particularly young women (resulting in M/F ratios of <2 in the WHO Region of the Americas and European Region) (69). In contrast, in low- and middle-income settings, smoking prevalence in men is substantially higher than in women, reaching a M/F ratio of 15.5 in the WHO Eastern Mediterranean Region, where gender roles and social norms pose barriers for women to smoke.
Findings for alcohol are similar to those for smoking. On average, men consumed far more alcohol than women worldwide in 2016 (10.1 versus 2.7 L of pure alcohol per person), with the largest consumption for both sexes being in the WHO European Region and in high-income countries, and the smallest in the WHO Eastern Mediterranean Region and low-income countries. The largest M/F ratios were observed in the WHO Eastern Mediterranean, South-East Asia and African regions.
Fig. 5.1 Age-standardized rates (per 100 000 population) of premature death from the four major NCDs covered by SDG Target 3.4, 2016
Source: WHO (2018) (2).
33MONITORING HEALTH FOR THE SDGs
As a major type of substance abuse, the implication of harmful use of alcohol goes beyond the control of major NCDs, because it is also a modifiable risk factor for suicide, especially for young people at risk. The high average alcohol consumption in men is likely to be one of the drivers of men’s excess rates of suicide mortality relative to women (70). Yet, data for interventions for substance use disorders (Indicator 3.5.1) are currently unavailable and its methodology is still under development.
In addition to the unhealthier lifestyles and risk-taking behaviours among men compared with women, in many settings men tend to underuse health services and visit a doctor less frequently, due to norms of masculinity and other socioeconomic factors. However, some NCD risk factors are less in favour of women. For example, women are more likely to have insufficient physical activity (31.7% versus 23.4% of men) (71), because women are often subject to financial restraint, lack of decision-making power and extra household workload, making it difficult for them to allocate adequate resources and time for physical activity (72). In particular, a large proportion of the female population have to fulfil multiple roles – such as childrearing, household care-giving and professional duties – which consume women’s time and energy. Moreover, many communities lack the exercise space and facilities that are intended for and accessible to women, giving women less motivation to undertake physical activity. The lack of physical activity interacts with sex-related biological factors (e.g. women generally are more likely to store fat subcutaneously, but have lower metabolism than men); hence, the prevalence of obesity is higher in women (15.3% versus 11.1% in men) (73). The higher prevalence of obesity leads to women having greater vulnerability to some NCDs; for example, for diabetes, the M/F ratio in risks of premature death is nearly unity at global level, substantially lower than the ratios for other NCDs. Women with lower education or socioeconomic status are even more likely to suffer from these NCDs, because they
also tend to have limited access to a healthy diet. Because physical activity could potentially reduce levels of stress and depression, the lack of it would also put women at greater risk of suffering mental health issues.
Women may also manifest different symptoms of some NCDs than men, and hence be more likely to experience delayed diagnosis and treatment. This delay occurs in part because, historically, male patients have been more widely used as the reference in medical research while female patients have been understudied. For example, women’s symptoms for coronary heart disease – including back pain, nausea or fatigue – are usually considered “atypical”, leading to underdiagnosis and under-treatment (74). Moreover, women, particularly those in low-resourced settings, are likely to face increased economic burdens for the prevention and treatment of NCDs and mental health issues, while having less decision-making power for health expenditures. This situation means that women are more vulnerable than men once the diseases have developed, and it offsets their lower exposure to the risk factors relative to men. For example, the M/F ratio of premature NCD mortality in 2016 was lowest in the WHO African Region (M/F: 1.1) where women have the lowest access to quality health care, and was over 40% lower than the highest ratio, which was seen in the WHO European Region (M/F: 1.9).
To meet the SDG target for NCDs by 2030, more research is needed to better understand the differences between men and women in susceptibility, vulnerability and exposure to risk factors, presentation of symptoms, disease progression, access to diagnosis and treatment, and treatment response, in addition to other gender-related factors related to inequity in health systems. Policies and strategies must recognize the sex and gender differences, and address the different needs of men and women with better targeted measures to reduce exposure to risk factors, improve early diagnosis, and increase access to affordable and effective treatment.
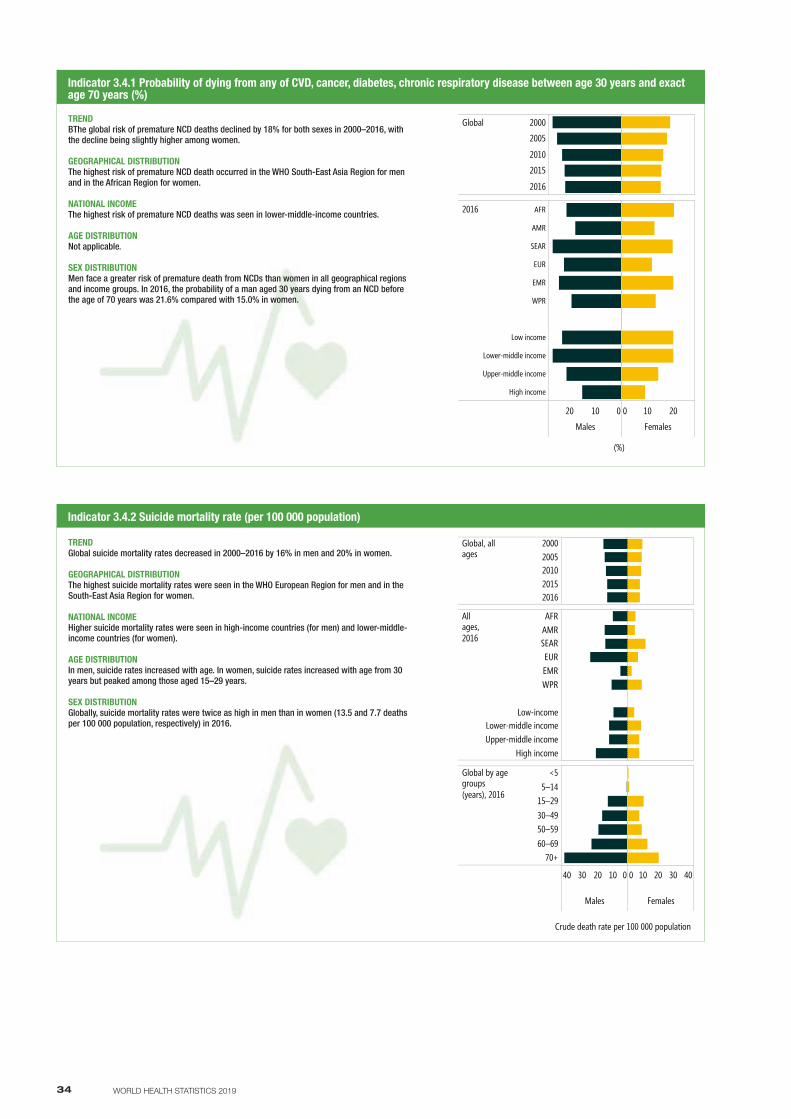
34 WORLD HEALTH STATISTICS 2019
TREND BThe global risk of premature NCD deaths declined by 18% for both sexes in 2000–2016, with the decline being slightly higher among women.
GEOGRAPHICAL DISTRIBUTIONThe highest risk of premature NCD death occurred in the WHO South-East Asia Region for men and in the African Region for women.
NATIONAL INCOMEThe highest risk of premature NCD deaths was seen in lower-middle-income countries.
AGE DISTRIBUTIONNot applicable.
SEX DISTRIBUTIONMen face a greater risk of premature death from NCDs than women in all geographical regions and income groups. In 2016, the probability of a man aged 30 years dying from an NCD before the age of 70 years was 21.6% compared with 15.0% in women.
Indicator 3.4.1 Probability of dying from any of CVD, cancer, diabetes, chronic respiratory disease between age 30 years and exact age 70 years (%)
01020
Males
0 10 20
Females
2016 AFR
AMR
SEAR
EUR
EMR
WPR
Low income
Lower-middle income
Upper-middle income
High income
(%)
Global 2000
2005
2010
2015
2016
NCD
Indicator 3.4.2 Suicide mortality rate (per 100 000 population)
Global, allages
20002005201020152016
Allages,2016
AFRAMRSEAREUREMRWPR
Low-incomeLower-middle incomeUpper-middle income
High income
010203040
Males
0 10 20 30 40
Females
Global by agegroups(years), 2016
<55–14
15–2930–4950–5960–69
70+
Crude death rate per 100 000 population
Suicide
TREND Global suicide mortality rates decreased in 2000–2016 by 16% in men and 20% in women.
GEOGRAPHICAL DISTRIBUTIONThe highest suicide mortality rates were seen in the WHO European Region for men and in the South-East Asia Region for women.
NATIONAL INCOMEHigher suicide mortality rates were seen in high-income countries (for men) and lower-middle-income countries (for women).
AGE DISTRIBUTIONIn men, suicide rates increased with age. In women, suicide rates increased with age from 30 years but peaked among those aged 15–29 years.
SEX DISTRIBUTIONGlobally, suicide mortality rates were twice as high in men than in women (13.5 and 7.7 deaths per 100 000 population, respectively) in 2016.
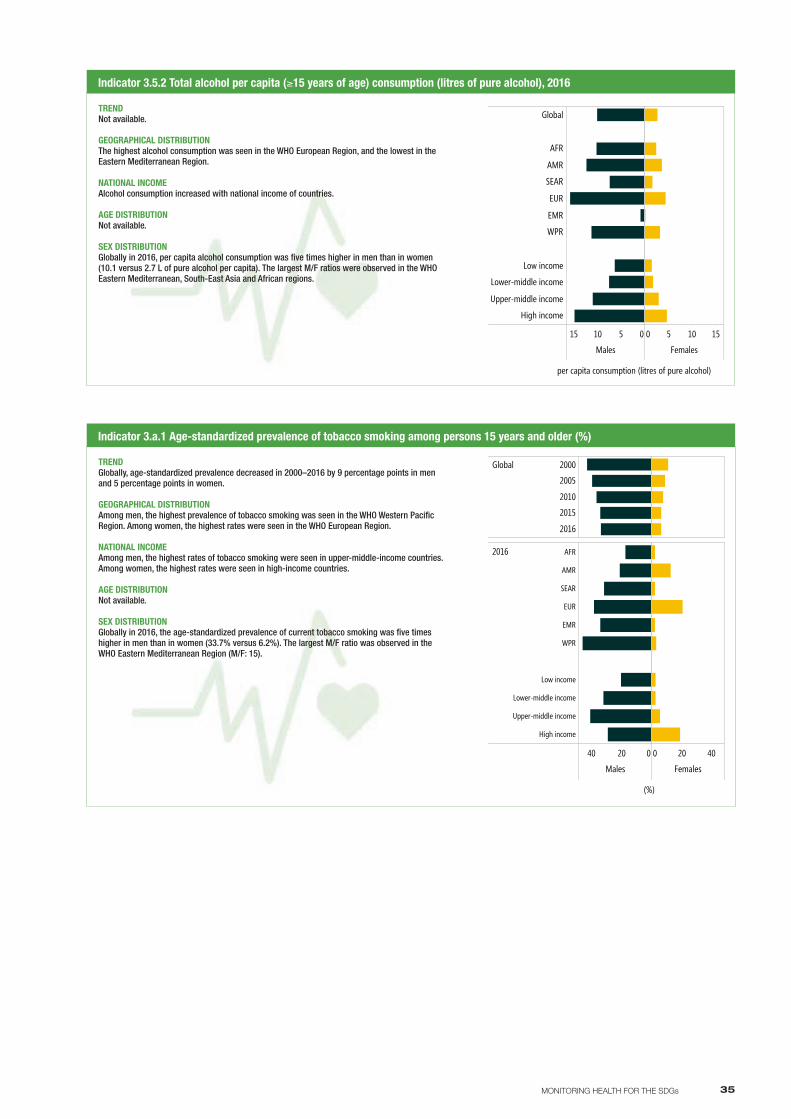
35MONITORING HEALTH FOR THE SDGs
Indicator 3.5.2 Total alcohol per capita (≥15 years of age) consumption (litres of pure alcohol), 2016
051015
Males
0 5 10 15
Females
Global
AFR
AMR
SEAR
EUR
EMR
WPR
Low income
Lower-middle income
Upper-middle income
High income
per capita consumption (litres of pure alcohol)
alcohol
TREND Not available.
GEOGRAPHICAL DISTRIBUTIONThe highest alcohol consumption was seen in the WHO European Region, and the lowest in the Eastern Mediterranean Region.
NATIONAL INCOMEAlcohol consumption increased with national income of countries.
AGE DISTRIBUTIONNot available.
SEX DISTRIBUTIONGlobally in 2016, per capita alcohol consumption was five times higher in men than in women (10.1 versus 2.7 L of pure alcohol per capita). The largest M/F ratios were observed in the WHO Eastern Mediterranean, South-East Asia and African regions.
Indicator 3.a.1 Age-standardized prevalence of tobacco smoking among persons 15 years and older (%)
02040
Males
0 20 40
Females
2016 AFR
AMR
SEAR
EUR
EMR
WPR
Low income
Lower-middle income
Upper-middle income
High income
(%)
Global 2000
2005
2010
2015
2016
tobacco
TREND Globally, age-standardized prevalence decreased in 2000–2016 by 9 percentage points in men and 5 percentage points in women.
GEOGRAPHICAL DISTRIBUTIONAmong men, the highest prevalence of tobacco smoking was seen in the WHO Western Pacific Region. Among women, the highest rates were seen in the WHO European Region.
NATIONAL INCOMEAmong men, the highest rates of tobacco smoking were seen in upper-middle-income countries. Among women, the highest rates were seen in high-income countries.
AGE DISTRIBUTIONNot available.
SEX DISTRIBUTIONGlobally in 2016, the age-standardized prevalence of current tobacco smoking was five times higher in men than in women (33.7% versus 6.2%). The largest M/F ratio was observed in the WHO Eastern Mediterranean Region (M/F: 15).
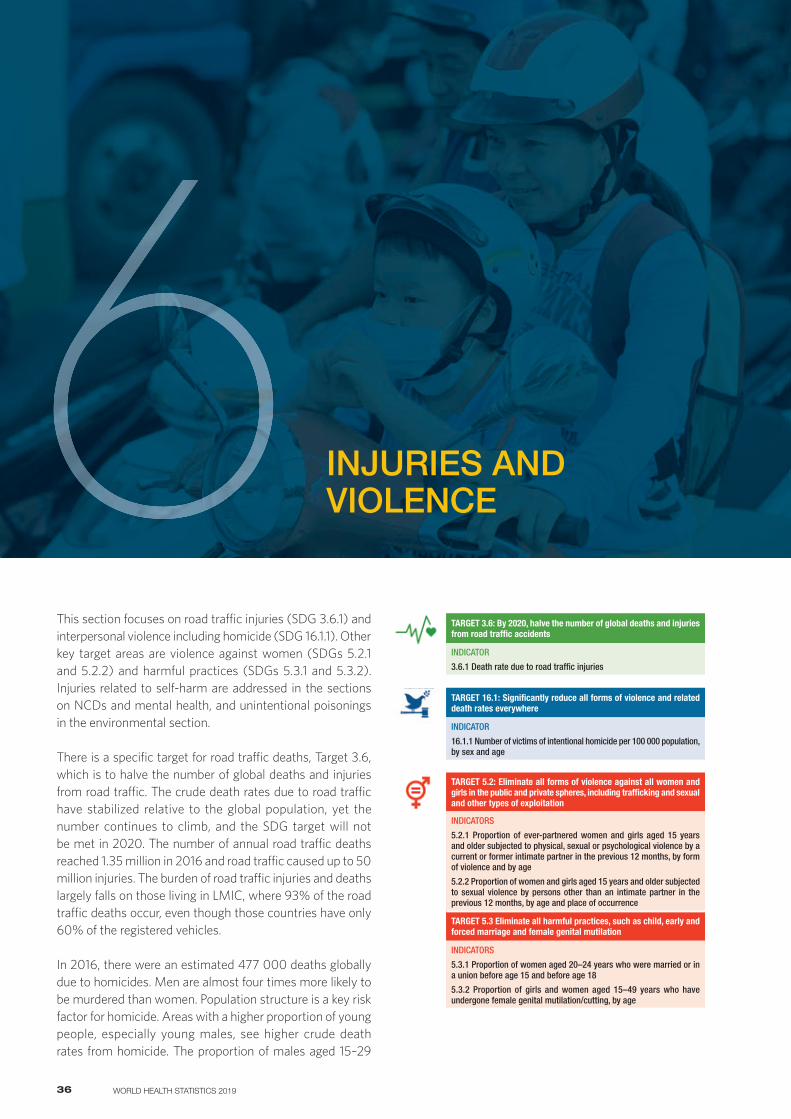
36 WORLD HEALTH STATISTICS 2019
INJURIES AND VIOLENCE6
This section focuses on road traffic injuries (SDG 3.6.1) and interpersonal violence including homicide (SDG 16.1.1). Other key target areas are violence against women (SDGs 5.2.1 and 5.2.2) and harmful practices (SDGs 5.3.1 and 5.3.2). Injuries related to self-harm are addressed in the sections on NCDs and mental health, and unintentional poisonings in the environmental section.
There is a specific target for road traffic deaths, Target 3.6, which is to halve the number of global deaths and injuries from road traffic. The crude death rates due to road traffic have stabilized relative to the global population, yet the number continues to climb, and the SDG target will not be met in 2020. The number of annual road traffic deaths reached 1.35 million in 2016 and road traffic caused up to 50 million injuries. The burden of road traffic injuries and deaths largely falls on those living in LMIC, where 93% of the road traffic deaths occur, even though those countries have only 60% of the registered vehicles.
In 2016, there were an estimated 477 000 deaths globally due to homicides. Men are almost four times more likely to be murdered than women. Population structure is a key risk factor for homicide. Areas with a higher proportion of young people, especially young males, see higher crude death rates from homicide. The proportion of males aged 15–29
TARGET 3.6: By 2020, halve the number of global deaths and injuries from road traffic accidents
INDICATOR
3.6.1 Death rate due to road traffic injuries
TARGET 16.1: Significantly reduce all forms of violence and related death rates everywhere
INDICATOR
16.1.1 Number of victims of intentional homicide per 100 000 population, by sex and age
TARGET 5.2: Eliminate all forms of violence against all women and girls in the public and private spheres, including trafficking and sexual and other types of exploitation
INDICATORS
5.2.1 Proportion of ever-partnered women and girls aged 15 years and older subjected to physical, sexual or psychological violence by a current or former intimate partner in the previous 12 months, by form of violence and by age
5.2.2 Proportion of women and girls aged 15 years and older subjected to sexual violence by persons other than an intimate partner in the previous 12 months, by age and place of occurrence
TARGET 5.3 Eliminate all harmful practices, such as child, early and forced marriage and female genital mutilation
INDICATORS
5.3.1 Proportion of women aged 20–24 years who were married or in a union before age 15 and before age 18
5.3.2 Proportion of girls and women aged 15–49 years who have undergone female genital mutilation/cutting, by age
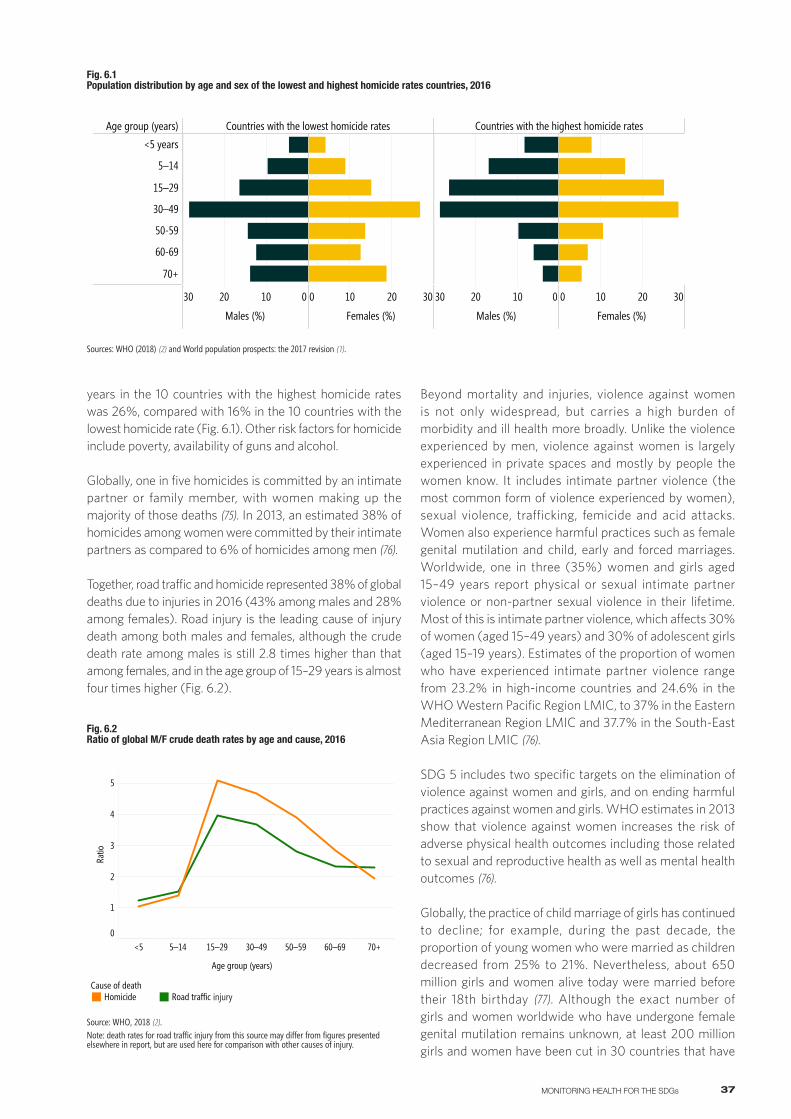
37MONITORING HEALTH FOR THE SDGs
years in the 10 countries with the highest homicide rates was 26%, compared with 16% in the 10 countries with the lowest homicide rate (Fig. 6.1). Other risk factors for homicide include poverty, availability of guns and alcohol.
Globally, one in five homicides is committed by an intimate partner or family member, with women making up the majority of those deaths (75). In 2013, an estimated 38% of homicides among women were committed by their intimate partners as compared to 6% of homicides among men (76).
Together, road traffic and homicide represented 38% of global deaths due to injuries in 2016 (43% among males and 28% among females). Road injury is the leading cause of injury death among both males and females, although the crude death rate among males is still 2.8 times higher than that among females, and in the age group of 15–29 years is almost four times higher (Fig. 6.2).
Beyond mortality and injuries, violence against women is not only widespread, but carries a high burden of morbidity and ill health more broadly. Unlike the violence experienced by men, violence against women is largely experienced in private spaces and mostly by people the women know. It includes intimate partner violence (the most common form of violence experienced by women), sexual violence, trafficking, femicide and acid attacks. Women also experience harmful practices such as female genital mutilation and child, early and forced marriages. Worldwide, one in three (35%) women and girls aged 15–49 years report physical or sexual intimate partner violence or non-partner sexual violence in their lifetime. Most of this is intimate partner violence, which affects 30% of women (aged 15–49 years) and 30% of adolescent girls (aged 15–19 years). Estimates of the proportion of women who have experienced intimate partner violence range from 23.2% in high-income countries and 24.6% in the WHO Western Pacific Region LMIC, to 37% in the Eastern Mediterranean Region LMIC and 37.7% in the South-East Asia Region LMIC (76).
SDG 5 includes two specific targets on the elimination of violence against women and girls, and on ending harmful practices against women and girls. WHO estimates in 2013 show that violence against women increases the risk of adverse physical health outcomes including those related to sexual and reproductive health as well as mental health outcomes (76).
Globally, the practice of child marriage of girls has continued to decline; for example, during the past decade, the proportion of young women who were married as children decreased from 25% to 21%. Nevertheless, about 650 million girls and women alive today were married before their 18th birthday (77). Although the exact number of girls and women worldwide who have undergone female genital mutilation remains unknown, at least 200 million girls and women have been cut in 30 countries that have
Fig. 6.1 Population distribution by age and sex of the lowest and highest homicide rates countries, 2016
Age group (years) Countries with the lowest homicide rates Countries with the highest homicide rates
0102030
Males (%)
0 10 20 30
Females (%)
0102030
Males (%)
0 10 20 30
Females (%)
<5 years
5–14
15–29
30–49
50-59
60-69
70+
Sources: WHO (2018) (2) and World population prospects: the 2017 revision (1).
<5 5–14 15–29 30–49 50–59 60–69 70+0
1
2
3
4
5
Ratio
Cause of deathHomicide Road traffic
Age group (years)
Source: WHO, 2018 (2). Note: death rates for road traffic injury from this source may differ from figures presented elsewhere in report, but are used here for comparison with other causes of injury.
injury
Fig. 6.2 Ratio of global M/F crude death rates by age and cause, 2016
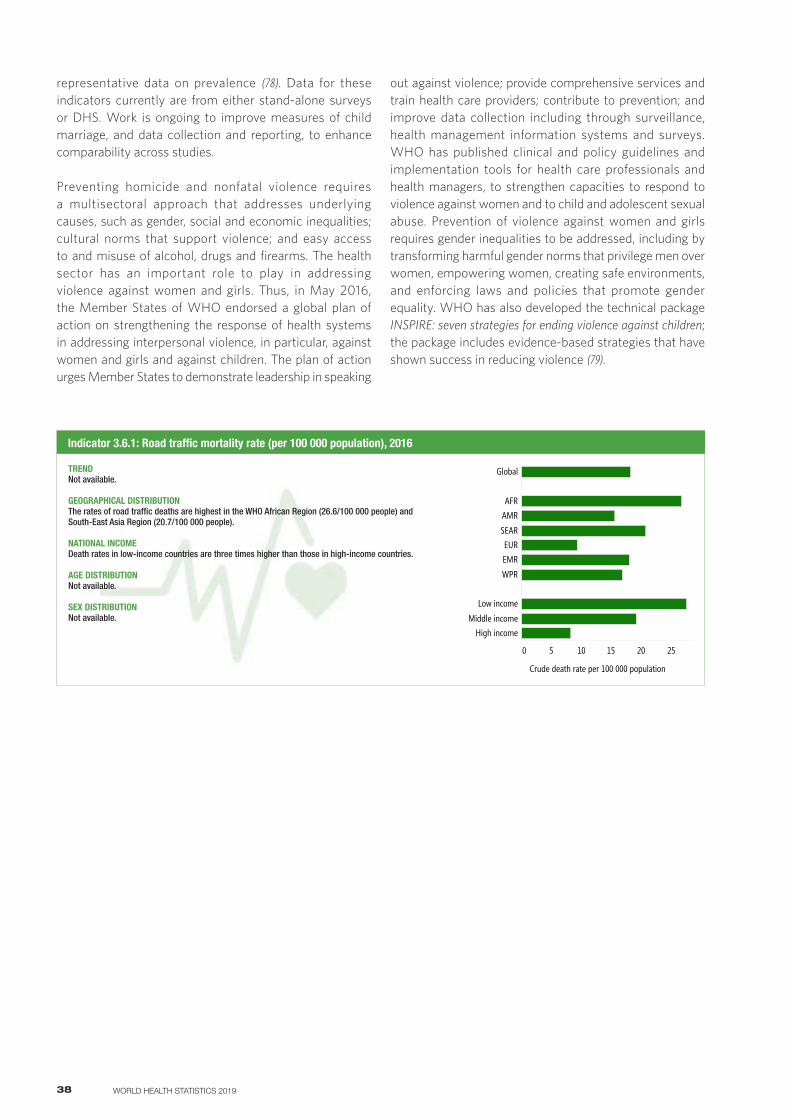
38 WORLD HEALTH STATISTICS 2019
representative data on prevalence (78). Data for these indicators currently are from either stand-alone surveys or DHS. Work is ongoing to improve measures of child marriage, and data collection and reporting, to enhance comparability across studies.
Preventing homicide and nonfatal violence requires a multisectoral approach that addresses underlying causes, such as gender, social and economic inequalities; cultural norms that support violence; and easy access to and misuse of alcohol, drugs and firearms. The health sector has an important role to play in addressing violence against women and girls. Thus, in May 2016, the Member States of WHO endorsed a global plan of action on strengthening the response of health systems in addressing interpersonal violence, in particular, against women and girls and against children. The plan of action urges Member States to demonstrate leadership in speaking
out against violence; provide comprehensive services and train health care providers; contribute to prevention; and improve data collection including through surveillance, health management information systems and surveys. WHO has published clinical and policy guidelines and implementation tools for health care professionals and health managers, to strengthen capacities to respond to violence against women and to child and adolescent sexual abuse. Prevention of violence against women and girls requires gender inequalities to be addressed, including by transforming harmful gender norms that privilege men over women, empowering women, creating safe environments, and enforcing laws and policies that promote gender equality. WHO has also developed the technical package INSPIRE: seven strategies for ending violence against children; the package includes evidence-based strategies that have shown success in reducing violence (79).
Indicator 3.6.1: Road traffic mortality rate (per 100 000 population), 2016
0 5 10 15 20 25
Global
AFRAMR
SEAREUREMR
WPR
Low income
Middle incomeHigh income
Crude death rate per 100 000 population
Road
TREND Not available.
GEOGRAPHICAL DISTRIBUTIONThe rates of road traffic deaths are highest in the WHO African Region (26.6/100 000 people) and South-East Asia Region (20.7/100 000 people).
NATIONAL INCOMEDeath rates in low-income countries are three times higher than those in high-income countries.
AGE DISTRIBUTIONNot available.
SEX DISTRIBUTIONNot available.
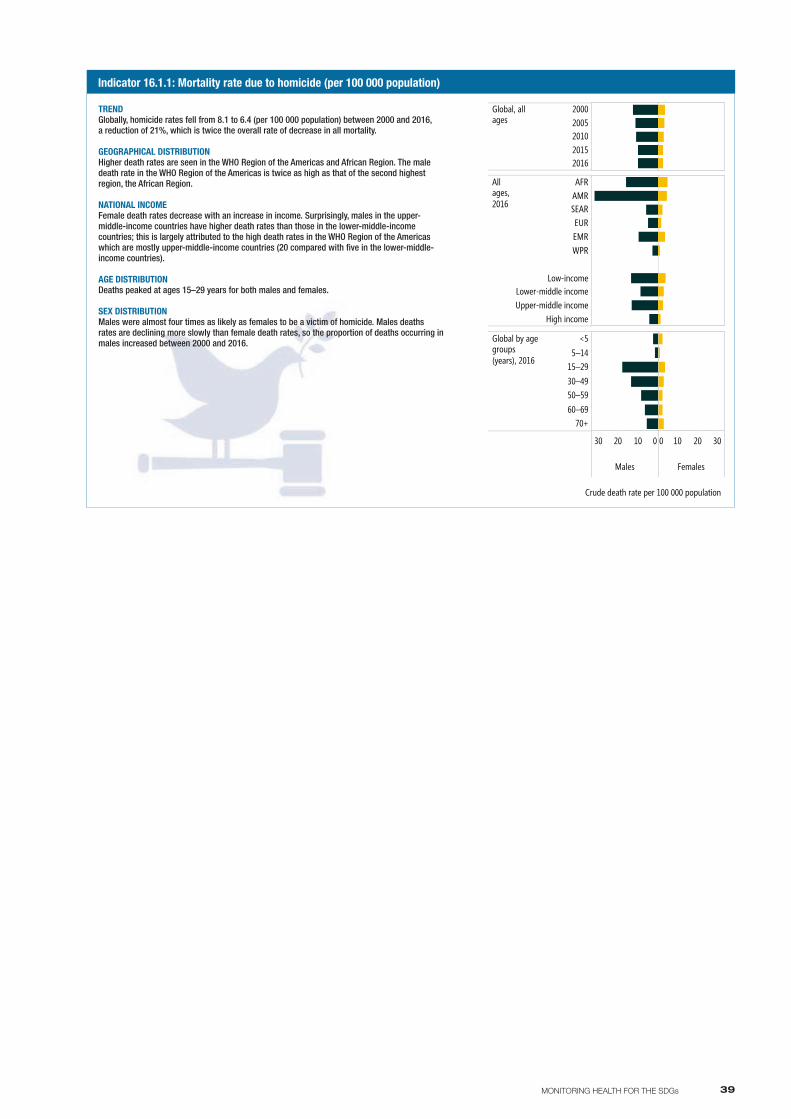
39MONITORING HEALTH FOR THE SDGs
Indicator 16.1.1: Mortality rate due to homicide (per 100 000 population)
Global, allages
20002005201020152016
Allages,2016
AFRAMRSEAREUREMRWPR
Low-incomeLower-middle incomeUpper-middle income
High income
0102030
Males
0 10 20 30
Females
Global by agegroups(years), 2016
<55–14
15–2930–4950–5960–69
70+
Crude death rate per 100 000 population
Homicide
TREND Globally, homicide rates fell from 8.1 to 6.4 (per 100 000 population) between 2000 and 2016, a reduction of 21%, which is twice the overall rate of decrease in all mortality.
GEOGRAPHICAL DISTRIBUTIONHigher death rates are seen in the WHO Region of the Americas and African Region. The male death rate in the WHO Region of the Americas is twice as high as that of the second highest region, the African Region.
NATIONAL INCOMEFemale death rates decrease with an increase in income. Surprisingly, males in the upper-middle-income countries have higher death rates than those in the lower-middle-income countries; this is largely attributed to the high death rates in the WHO Region of the Americas which are mostly upper-middle-income countries (20 compared with five in the lower-middle-income countries).
AGE DISTRIBUTIONDeaths peaked at ages 15–29 years for both males and females.
SEX DISTRIBUTIONMales were almost four times as likely as females to be a victim of homicide. Males deaths rates are declining more slowly than female death rates, so the proportion of deaths occurring in males increased between 2000 and 2016.
40 WORLD HEALTH STATISTICS 2019
ENVIRONMENTAL RISKS7
The SDG targets principally focus on three types of environmental risk: air pollution (assessed with Indicators 3.9.1, 7.1.2 and 11.6.2), water and sanitation (assessed with Indicators 3.9.2, 6.1.1 and 6.2.1) and poisoning (assessed with Indicator 3.9.3).
TARGET 3.9: By 2030, substantially reduce the number of deaths and illnesses from hazardous chemicals and air, water and soil pollution and contamination
INDICATORS
3.9.1 Mortality rate attributed to household and ambient air pollution
3.9.2 Mortality rate attributed to unsafe water, unsafe sanitation and lack of hygiene (exposure to unsafe Water, Sanitation and Hygiene for All (WASH) services)
3.9.3 Mortality rate attributed to unintentional poisoning
TARGET 6.1: By 2030, achieve universal and equitable access to safe and affordable drinking-water for all
INDICATOR
6.1.1 Proportion of population using safely managed drinking-water services
TARGET 6.2: By 2030, achieve access to adequate and equitable sanitation and hygiene for all and end open defecation, paying special attention to the needs of women and girls and those in vulnerable situations
INDICATOR
6.2.1 Proportion of population using safely managed sanitation services, including a hand-washing facility with soap and water
TARGET 6.a: By 2030, expand international cooperation and capacity-building support to developing countries in water- and sanitation-related activities and programmes, including water harvesting, desalination, water efficiency, wastewater treatment, recycling and reuse technologies
INDICATOR
6.a.1 Amount of water and sanitation related official development assistance for water and sanitation related activities and programmes that is part of a government-coordinated spending plan
TARGET 11.6: By 2030, reduce the adverse per capita environmental impact of cities, including by paying special attention to air quality and municipal and other waste management
INDICATOR
11.6.2 Annual mean levels of fine particulate matter (e.g. PM2.5 and PM10) in cities (population weighted)
TARGET 7.1: By 2030, ensure universal access to affordable, reliable and modern energy services
INDICATOR
7.1.2 Proportion of population with primary reliance on clean fuels and technology
41MONITORING HEALTH FOR THE SDGs
It is estimated that, globally, 9 out of 10 people dwelling in urban areas are exposed to air pollution from PM2.5 (i.e. particulate matter 2.5 micrometres in diameter) levels that are above the annual mean WHO air quality guideline levels of 10 μg/m3, with the highest annual mean levels of urban PM2.5 concentration being in the WHO South-East Asia Region (57.3 μg/m3) and Eastern Mediterranean Region (54.0 μg/m3). Regarding household air pollution, the proportion of the global population with primary reliance on clean fuels and technologies has been increasing progressively, and in 2017 it nearly reached full coverage in the WHO European Region (>95%) and Region of the Americas (92%). Nevertheless, 3 billion people still cook with polluting fuels and technologies, putting their health at risk, especially in the WHO African Region (where only 17% have primary reliance on clean fuels) – a situation that has changed little in 3 decades.
Poor air quality is associated with increasing risk of stroke, heart disease, lung cancer, and chronic and acute respiratory diseases. Household and ambient air pollution were jointly responsible for 7 million deaths in 2016. Globally in 2016, men had nearly 30% higher age-standardized mortality rates attributed to household and ambient air pollution than women (128.5 and 101.1 per 100 000 population, respectively). High-income countries and the WHO European Region had the highest M/F mortality ratio, at about 1.8, whereas countries in the WHO African Region had the lowest M/F ratio, at only 1.1. The highest mortality burdens fall in the WHO African Region and LMIC, and the lowest in the WHO Region of the Americas and high-income countries, for both sexes.
In 2015, 71% of the world population used safely managed drinking-water services, and 39% used safely managed sanitation services; these percentages have increased progressively since 2000, when the figures were 61% and 29%, respectively. The WHO African Region again fell far behind other parts of the world, with only 44% of the rural population having at least basic drinking-water and only 21% having basic sanitation services. Globally in 2016, unsafe drinking-water, unsafe sanitation and lack of hygiene were responsible for nearly 0.9 million deaths, including over 470 000 deaths of children aged under 5 years from diarrhoea. Crude death rates decline substantially with increasing level of national income and level of development; for example, in 2016, the rates were nearly 150 times higher in low-income countries and the WHO African Region (42.4 and 45.8 per 100 000 population, respectively) than in high-income countries and the WHO European Region (0.3 per 100 000 population for both). The rates were slightly higher for women than men (12.1 compared with 11.4 per 100 000 population globally) in most parts of the world, except in the WHO African Region and Region of the Americas, and in low-income countries, where the rates for males were higher than those for females.
Similar geographical and economic trends were observed for crude death rates due to unintentional poisoning at global level in 2016, with the WHO African Region and low-income countries having the highest rates (2.7 and 2.8 per 100 000 population, respectively), and the WHO Region of the Americas and high-income countries the lowest (0.6 and 0.5 per 100 000 population, respectively). Infants and the elderly are more likely to die from exposure to chemicals such as pesticides and carbon monoxide. Children aged under 5 years and those aged over 70 years account for 37% of the estimated 107 000 deaths caused by unintentional poisonings. The WHO Eastern Mediterranean Region and Western Pacific Region and upper-middle-income countries have M/F ratios below 1 (0.68, 0.83 and 0.96, respectively); globally, males are more likely than females to succumb to unintentional poisoning. The decrease in unintentional poisonings has been faster globally in males than in females, and the global M/F ratio fell from 1.7 in 2000 to 1.3 in 2016.
Scaling up financial resources and technical capacity with increased external aid is required for ensuring water, sanitation and hygiene for all (WASH), which has been included as SDG Target 6.a, and is measured with Indicator 6.a.1. According to OECD data, official development assistance (ODA) disbursements to the water sector declined by 3% from 2016 to 2017, perhaps reflecting the fall in ODA commitments from US$ 12 billion in 2012 to US$ 9 billion in 2016, partly owing to donor stocktaking in the transition from Millennium Development Goals (MDGs) to SDGs. However, donors have renewed their focus on the water sector, with commitments jumping by 37% in 2016–2017.
For both social and biological reasons, men and women are at different levels of risk for negative health effects from environmental exposures. The differences include the level, frequency and duration of exposures, as well as the types of pollutants and chemicals to which they are exposed. For example, men constitute a majority of the workforce in many industries (e.g. mining and manufacturing) that expose workers to toxic chemicals. In contrast, women are more likely to be responsible for household work that involves direct contact with the natural environment and some pollution sources; for example, women are more likely to cook with polluting energy systems, manage household waste and use water sources or pesticides containing pollutants and chemicals on a daily basis for an extended time. Due to their caring and domestic roles, women, particularly those in low-resource settings, are more reliant on natural resources and more vulnerable to environmental risks, because alternative opportunities and sources of livelihood are limited. For example, women and children in rural areas bear the greatest burden of death due to high levels of black carbon produced by the inefficient burning of solid fuels in unventilated homes (80).
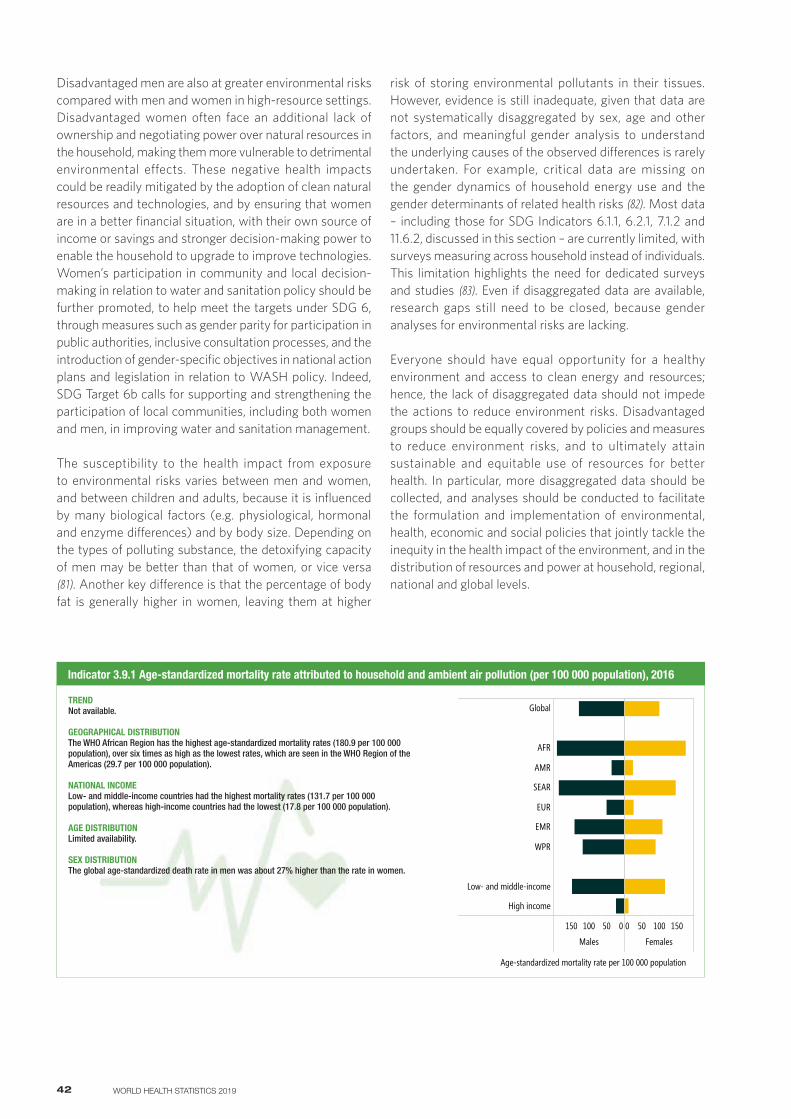
42 WORLD HEALTH STATISTICS 2019
Disadvantaged men are also at greater environmental risks compared with men and women in high-resource settings. Disadvantaged women often face an additional lack of ownership and negotiating power over natural resources in the household, making them more vulnerable to detrimental environmental effects. These negative health impacts could be readily mitigated by the adoption of clean natural resources and technologies, and by ensuring that women are in a better financial situation, with their own source of income or savings and stronger decision-making power to enable the household to upgrade to improve technologies. Women’s participation in community and local decision-making in relation to water and sanitation policy should be further promoted, to help meet the targets under SDG 6, through measures such as gender parity for participation in public authorities, inclusive consultation processes, and the introduction of gender-specific objectives in national action plans and legislation in relation to WASH policy. Indeed, SDG Target 6b calls for supporting and strengthening the participation of local communities, including both women and men, in improving water and sanitation management.
The susceptibility to the health impact from exposure to environmental risks varies between men and women, and between children and adults, because it is influenced by many biological factors (e.g. physiological, hormonal and enzyme differences) and by body size. Depending on the types of polluting substance, the detoxifying capacity of men may be better than that of women, or vice versa (81). Another key difference is that the percentage of body fat is generally higher in women, leaving them at higher
risk of storing environmental pollutants in their tissues. However, evidence is still inadequate, given that data are not systematically disaggregated by sex, age and other factors, and meaningful gender analysis to understand the underlying causes of the observed differences is rarely undertaken. For example, critical data are missing on the gender dynamics of household energy use and the gender determinants of related health risks (82). Most data – including those for SDG Indicators 6.1.1, 6.2.1, 7.1.2 and 11.6.2, discussed in this section – are currently limited, with surveys measuring across household instead of individuals. This limitation highlights the need for dedicated surveys and studies (83). Even if disaggregated data are available, research gaps still need to be closed, because gender analyses for environmental risks are lacking.
Everyone should have equal opportunity for a healthy environment and access to clean energy and resources; hence, the lack of disaggregated data should not impede the actions to reduce environment risks. Disadvantaged groups should be equally covered by policies and measures to reduce environment risks, and to ultimately attain sustainable and equitable use of resources for better health. In particular, more disaggregated data should be collected, and analyses should be conducted to facilitate the formulation and implementation of environmental, health, economic and social policies that jointly tackle the inequity in the health impact of the environment, and in the distribution of resources and power at household, regional, national and global levels.
Indicator 3.9.1 Age-standardized mortality rate attributed to household and ambient air pollution (per 100 000 population), 2016
050100150
Males
0 50 100 150
Females
Global
AFR
AMR
SEAR
EUR
EMR
WPR
Low- and middle-income
High income
Age-standardized mortality rate per 100 000 population
HAAP
TREND Not available.
GEOGRAPHICAL DISTRIBUTIONThe WHO African Region has the highest age-standardized mortality rates (180.9 per 100 000 population), over six times as high as the lowest rates, which are seen in the WHO Region of the Americas (29.7 per 100 000 population).
NATIONAL INCOMELow- and middle-income countries had the highest mortality rates (131.7 per 100 000 population), whereas high-income countries had the lowest (17.8 per 100 000 population).
AGE DISTRIBUTIONLimited availability.
SEX DISTRIBUTIONThe global age-standardized death rate in men was about 27% higher than the rate in women.
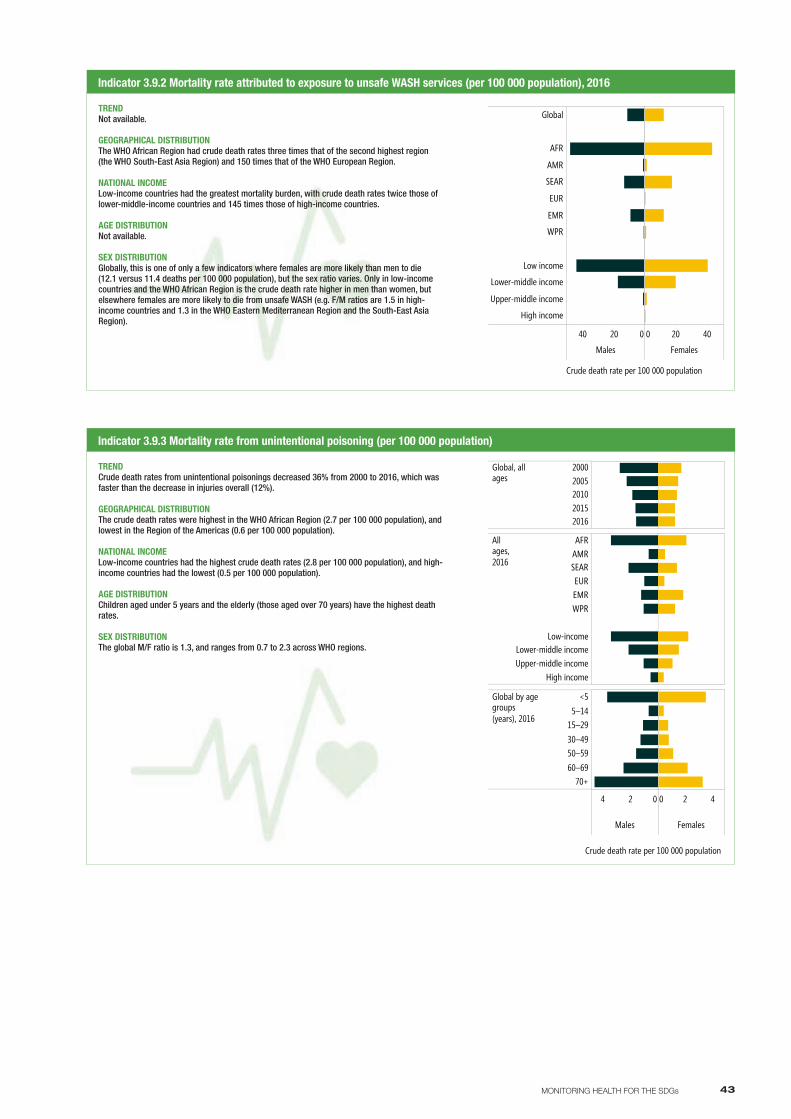
43MONITORING HEALTH FOR THE SDGs
Indicator 3.9.2 Mortality rate attributed to exposure to unsafe WASH services (per 100 000 population), 2016
02040
Males
0 20 40
Females
Global
AFR
AMR
SEAR
EUR
EMR
WPR
Low income
Lower-middle income
Upper-middle income
High income
Crude death rate per 100 000 population
WASHmort
TREND Not available.
GEOGRAPHICAL DISTRIBUTIONThe WHO African Region had crude death rates three times that of the second highest region (the WHO South-East Asia Region) and 150 times that of the WHO European Region.
NATIONAL INCOMELow-income countries had the greatest mortality burden, with crude death rates twice those of lower-middle-income countries and 145 times those of high-income countries.
AGE DISTRIBUTIONNot available.
SEX DISTRIBUTIONGlobally, this is one of only a few indicators where females are more likely than men to die (12.1 versus 11.4 deaths per 100 000 population), but the sex ratio varies. Only in low-income countries and the WHO African Region is the crude death rate higher in men than women, but elsewhere females are more likely to die from unsafe WASH (e.g. F/M ratios are 1.5 in high-income countries and 1.3 in the WHO Eastern Mediterranean Region and the South-East Asia Region).
Indicator 3.9.3 Mortality rate from unintentional poisoning (per 100 000 population)
Global, allages
20002005201020152016
Allages,2016
AFRAMRSEAREUREMRWPR
Low-incomeLower-middle incomeUpper-middle income
High income
024
Males
0 2 4
Females
Global by agegroups(years), 2016
<55–14
15–2930–4950–5960–69
70+
Crude death rate per 100 000 population
Poisoning
TREND Crude death rates from unintentional poisonings decreased 36% from 2000 to 2016, which was faster than the decrease in injuries overall (12%).
GEOGRAPHICAL DISTRIBUTIONThe crude death rates were highest in the WHO African Region (2.7 per 100 000 population), and lowest in the Region of the Americas (0.6 per 100 000 population).
NATIONAL INCOMELow-income countries had the highest crude death rates (2.8 per 100 000 population), and high-income countries had the lowest (0.5 per 100 000 population).
AGE DISTRIBUTIONChildren aged under 5 years and the elderly (those aged over 70 years) have the highest death rates.
SEX DISTRIBUTIONThe global M/F ratio is 1.3, and ranges from 0.7 to 2.3 across WHO regions.
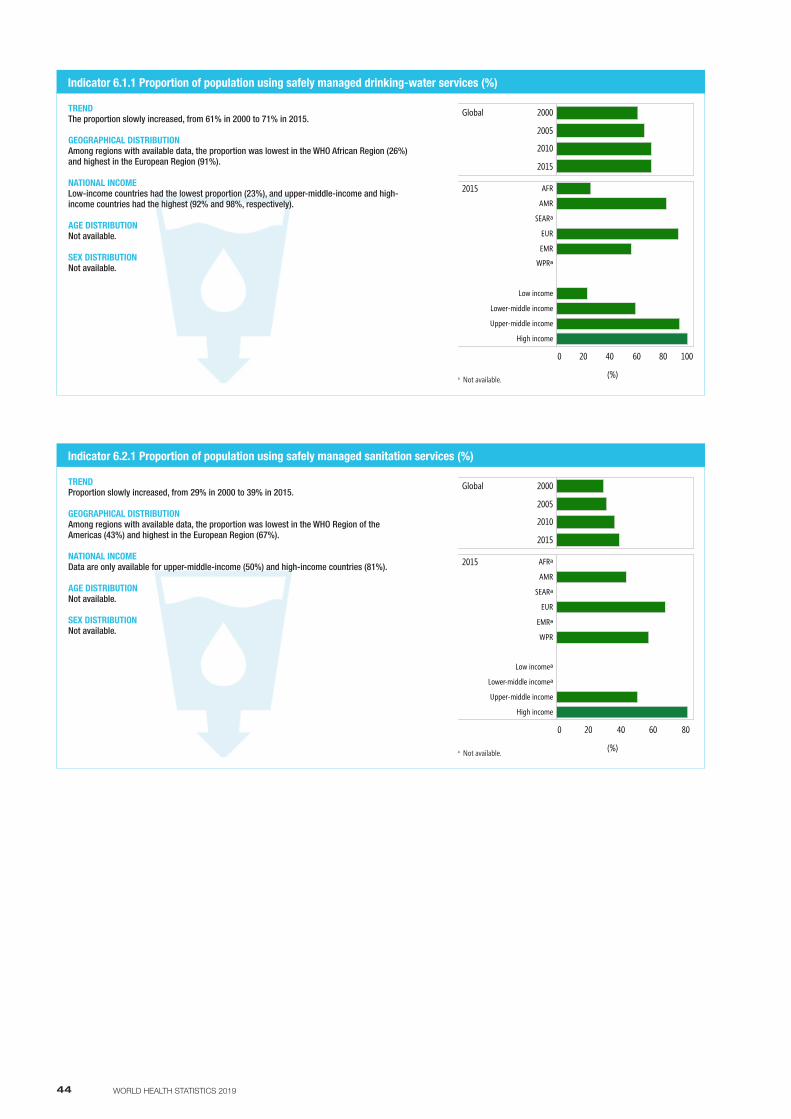
44 WORLD HEALTH STATISTICS 2019
Indicator 6.1.1 Proportion of population using safely managed drinking-water services (%)
0 20 40 60 80 100
2015 AFR
AMR
SEARᵃ
EUR
EMR
WPRᵃ
Low income
Lower-middle income
Upper-middle income
High income
(%)
water
Global 2000
2005
2010
2015
TREND The proportion slowly increased, from 61% in 2000 to 71% in 2015.
GEOGRAPHICAL DISTRIBUTIONAmong regions with available data, the proportion was lowest in the WHO African Region (26%) and highest in the European Region (91%).
NATIONAL INCOMELow-income countries had the lowest proportion (23%), and upper-middle-income and high-income countries had the highest (92% and 98%, respectively).
AGE DISTRIBUTIONNot available.
SEX DISTRIBUTIONNot available.
a Not available.
Indicator 6.2.1 Proportion of population using safely managed sanitation services (%)
TREND Proportion slowly increased, from 29% in 2000 to 39% in 2015.
GEOGRAPHICAL DISTRIBUTIONAmong regions with available data, the proportion was lowest in the WHO Region of the Americas (43%) and highest in the European Region (67%).
NATIONAL INCOMEData are only available for upper-middle-income (50%) and high-income countries (81%).
AGE DISTRIBUTIONNot available.
SEX DISTRIBUTIONNot available.
0 20 40 60 80
2015 AFRᵃ
AMR
SEARᵃ
EUR
EMRᵃ
WPR
Low incomeᵃ
Lower middle incomeᵃ
Upper-middle income
High income
(%)
san
Global 2000
2005
2010
2015
a Not available.
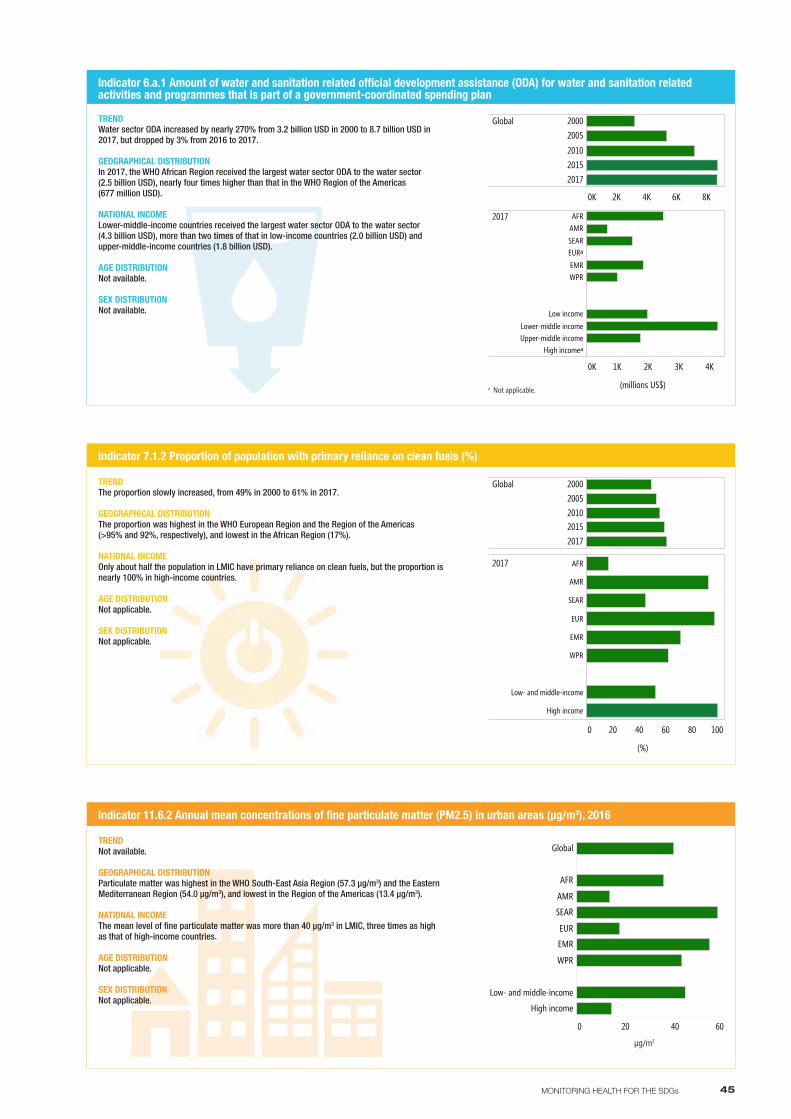
45MONITORING HEALTH FOR THE SDGs
Indicator 6.a.1 Amount of water and sanitation related official development assistance (ODA) for water and sanitation related activities and programmes that is part of a government-coordinated spending plan
0K 1K 2K 3K 4K
2017 AFRAMRSEAREURᵃEMRWPR
Low incomeLower-middle incomeUpper-middle income
High incomeᵃ
(millions US$)
ODAWASH
0K 2K 4K 6K 8K
Global 20002005
201020152017
TREND Water sector ODA increased by nearly 270% from 3.2 billion USD in 2000 to 8.7 billion USD in 2017, but dropped by 3% from 2016 to 2017.
GEOGRAPHICAL DISTRIBUTIONIn 2017, the WHO African Region received the largest water sector ODA to the water sector (2.5 billion USD), nearly four times higher than that in the WHO Region of the Americas (677 million USD).
NATIONAL INCOMELower-middle-income countries received the largest water sector ODA to the water sector (4.3 billion USD), more than two times of that in low-income countries (2.0 billion USD) and upper-middle-income countries (1.8 billion USD).
AGE DISTRIBUTIONNot available.
SEX DISTRIBUTIONNot available.
a Not applicable.
Indicator 7.1.2 Proportion of population with primary reliance on clean fuels (%)
0 20 40 60 80 100
2017 AFR
AMR
SEAR
EUR
EMR
WPR
Low- and middle-income
High income
(%)
CLEANFUELS
Global 20002005201020152017
TREND The proportion slowly increased, from 49% in 2000 to 61% in 2017.
GEOGRAPHICAL DISTRIBUTIONThe proportion was highest in the WHO European Region and the Region of the Americas (>95% and 92%, respectively), and lowest in the African Region (17%).
NATIONAL INCOMEOnly about half the population in LMIC have primary reliance on clean fuels, but the proportion is nearly 100% in high-income countries.
AGE DISTRIBUTIONNot applicable.
SEX DISTRIBUTIONNot applicable.
Indicator 11.6.2 Annual mean concentrations of fine particulate matter (PM2.5) in urban areas (µg/m3), 2016
0 20 40 60
Global
AFR
AMR
SEAR
EUR
EMR
WPR
Low- and middle-income
High income
[ug/m3]
CLEANCITIES
TREND Not available.
GEOGRAPHICAL DISTRIBUTIONParticulate matter was highest in the WHO South-East Asia Region (57.3 µg/m3) and the Eastern Mediterranean Region (54.0 µg/m3), and lowest in the Region of the Americas (13.4 µg/m3).
NATIONAL INCOMEThe mean level of fine particulate matter was more than 40 µg/m3 in LMIC, three times as high as that of high-income countries.
AGE DISTRIBUTIONNot applicable.
SEX DISTRIBUTIONNot applicable.
µg/m3
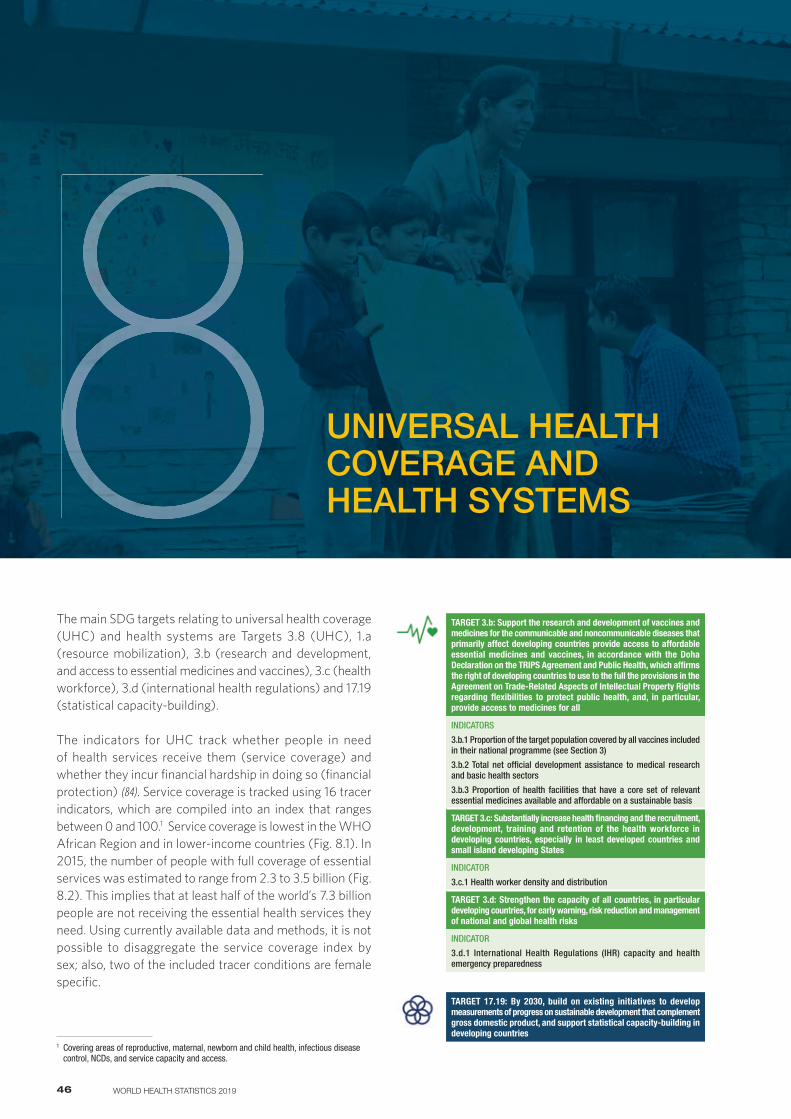
46 WORLD HEALTH STATISTICS 2019
UNIVERSAL HEALTH COVERAGE AND HEALTH SYSTEMS8
The main SDG targets relating to universal health coverage (UHC) and health systems are Targets 3.8 (UHC), 1.a (resource mobilization), 3.b (research and development, and access to essential medicines and vaccines), 3.c (health workforce), 3.d (international health regulations) and 17.19 (statistical capacity-building).
The indicators for UHC track whether people in need of health services receive them (service coverage) and whether they incur financial hardship in doing so (financial protection) (84). Service coverage is tracked using 16 tracer indicators, which are compiled into an index that ranges between 0 and 100.1 Service coverage is lowest in the WHO African Region and in lower-income countries (Fig. 8.1). In 2015, the number of people with full coverage of essential services was estimated to range from 2.3 to 3.5 billion (Fig. 8.2). This implies that at least half of the world’s 7.3 billion people are not receiving the essential health services they need. Using currently available data and methods, it is not possible to disaggregate the service coverage index by sex; also, two of the included tracer conditions are female specific.
1 Covering areas of reproductive, maternal, newborn and child health, infectious disease control, NCDs, and service capacity and access.
TARGET 3.b: Support the research and development of vaccines and medicines for the communicable and noncommunicable diseases that primarily affect developing countries provide access to affordable essential medicines and vaccines, in accordance with the Doha Declaration on the TRIPS Agreement and Public Health, which affirms the right of developing countries to use to the full the provisions in the Agreement on Trade-Related Aspects of Intellectual Property Rights regarding flexibilities to protect public health, and, in particular, provide access to medicines for all
INDICATORS
3.b.1 Proportion of the target population covered by all vaccines included in their national programme (see Section 3)
3.b.2 Total net official development assistance to medical research and basic health sectors
3.b.3 Proportion of health facilities that have a core set of relevant essential medicines available and affordable on a sustainable basis
TARGET 3.c: Substantially increase health financing and the recruitment, development, training and retention of the health workforce in developing countries, especially in least developed countries and small island developing States
INDICATOR
3.c.1 Health worker density and distribution
TARGET 3.d: Strengthen the capacity of all countries, in particular developing countries, for early warning, risk reduction and management of national and global health risks
INDICATOR
3.d.1 International Health Regulations (IHR) capacity and health emergency preparedness
TARGET 17.19: By 2030, build on existing initiatives to develop measurements of progress on sustainable development that complement gross domestic product, and support statistical capacity-building in developing countries
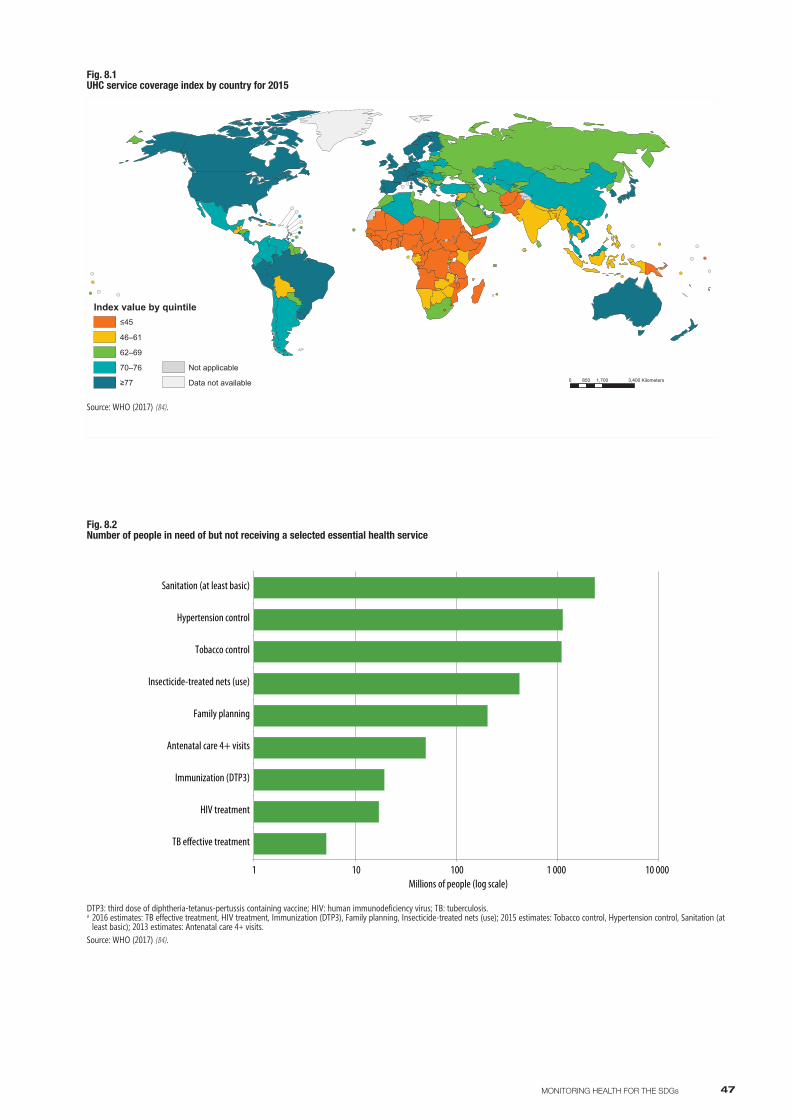
47MONITORING HEALTH FOR THE SDGs
1 10 100 1 000 10 000
TB e�ective treatment
HIV treatment
Immunization (DTP3)
Antenatal care 4+ visits
Family planning
Insecticide-treated nets (use)
Tobacco control
Hypertension control
Sanitation (at least basic)
Millions of people (log scale)
Fig. 8.2 Number of people in need of but not receiving a selected essential health service
DTP3: third dose of diphtheria-tetanus-pertussis containing vaccine; HIV: human immunodeficiency virus; TB: tuberculosis.a 2016 estimates: TB effective treatment, HIV treatment, Immunization (DTP3), Family planning, Insecticide-treated nets (use); 2015 estimates: Tobacco control, Hypertension control, Sanitation (at
least basic); 2013 estimates: Antenatal care 4+ visits.Source: WHO (2017) (84).
Fig. 8.1 UHC service coverage index by country for 2015
0 1,700 3,400850 Kilometers
Index value by quintile≤45
46–61
62–69
70–76
≥77
Not applicable
Data not available
Source: WHO (2017) (84).
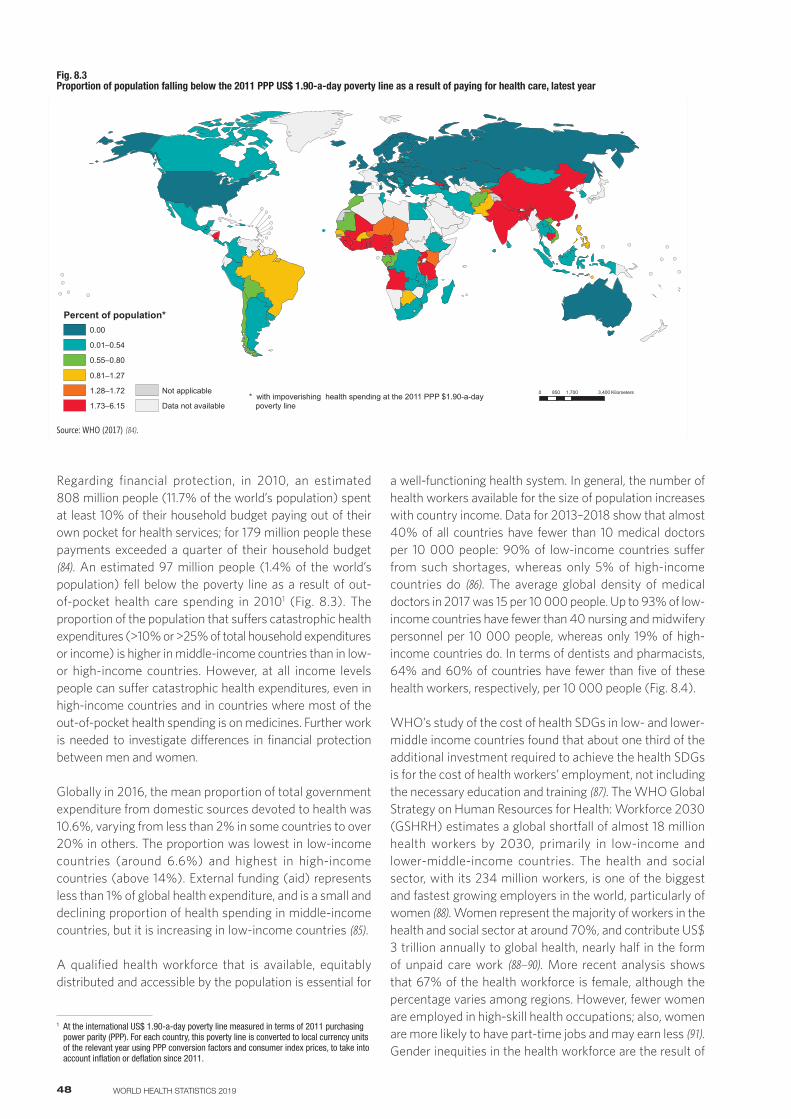
48 WORLD HEALTH STATISTICS 2019
Fig. 8.3 Proportion of population falling below the 2011 PPP US$ 1.90-a-day poverty line as a result of paying for health care, latest year
0 1,700 3,400850 Kilometers
Percent of population*0.00
0.01–0.54
0.55–0.80
0.81–1.27
1.28–1.72
1.73–6.15
Not applicable
Data not available* with impoverishing health spending at the 2011 PPP $1.90-a-day poverty line
Source: WHO (2017) (84).
Regarding financial protection, in 2010, an estimated 808 million people (11.7% of the world’s population) spent at least 10% of their household budget paying out of their own pocket for health services; for 179 million people these payments exceeded a quarter of their household budget (84). An estimated 97 million people (1.4% of the world’s population) fell below the poverty line as a result of out-of-pocket health care spending in 20101 (Fig. 8.3). The proportion of the population that suffers catastrophic health expenditures (>10% or >25% of total household expenditures or income) is higher in middle-income countries than in low- or high-income countries. However, at all income levels people can suffer catastrophic health expenditures, even in high-income countries and in countries where most of the out-of-pocket health spending is on medicines. Further work is needed to investigate differences in financial protection between men and women.
Globally in 2016, the mean proportion of total government expenditure from domestic sources devoted to health was 10.6%, varying from less than 2% in some countries to over 20% in others. The proportion was lowest in low-income countries (around 6.6%) and highest in high-income countries (above 14%). External funding (aid) represents less than 1% of global health expenditure, and is a small and declining proportion of health spending in middle-income countries, but it is increasing in low-income countries (85).
A qualified health workforce that is available, equitably distributed and accessible by the population is essential for
1 At the international US$ 1.90-a-day poverty line measured in terms of 2011 purchasing power parity (PPP). For each country, this poverty line is converted to local currency units of the relevant year using PPP conversion factors and consumer index prices, to take into account inflation or deflation since 2011.
a well-functioning health system. In general, the number of health workers available for the size of population increases with country income. Data for 2013–2018 show that almost 40% of all countries have fewer than 10 medical doctors per 10 000 people: 90% of low-income countries suffer from such shortages, whereas only 5% of high-income countries do (86). The average global density of medical doctors in 2017 was 15 per 10 000 people. Up to 93% of low-income countries have fewer than 40 nursing and midwifery personnel per 10 000 people, whereas only 19% of high-income countries do. In terms of dentists and pharmacists, 64% and 60% of countries have fewer than five of these health workers, respectively, per 10 000 people (Fig. 8.4).
WHO’s study of the cost of health SDGs in low- and lower-middle income countries found that about one third of the additional investment required to achieve the health SDGs is for the cost of health workers’ employment, not including the necessary education and training (87). The WHO Global Strategy on Human Resources for Health: Workforce 2030 (GSHRH) estimates a global shortfall of almost 18 million health workers by 2030, primarily in low-income and lower-middle-income countries. The health and social sector, with its 234 million workers, is one of the biggest and fastest growing employers in the world, particularly of women (88). Women represent the majority of workers in the health and social sector at around 70%, and contribute US$ 3 trillion annually to global health, nearly half in the form of unpaid care work (88–90). More recent analysis shows that 67% of the health workforce is female, although the percentage varies among regions. However, fewer women are employed in high-skill health occupations; also, women are more likely to have part-time jobs and may earn less (91). Gender inequities in the health workforce are the result of
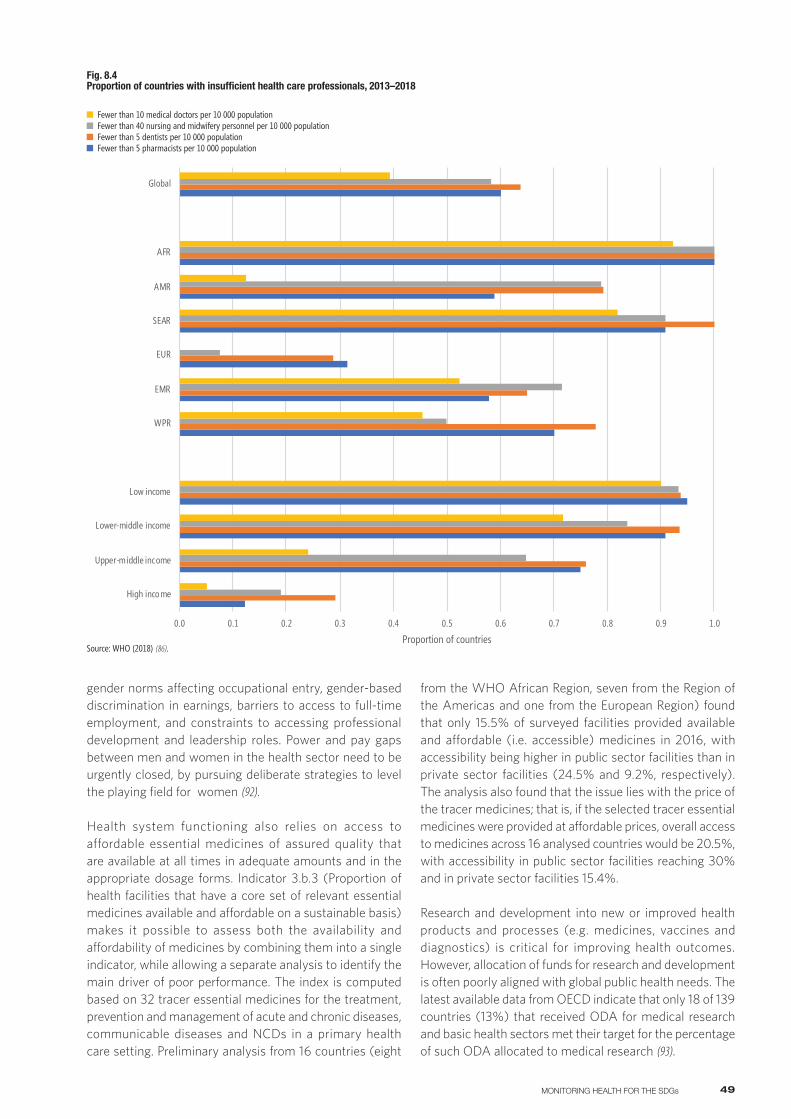
49MONITORING HEALTH FOR THE SDGs
gender norms affecting occupational entry, gender-based discrimination in earnings, barriers to access to full-time employment, and constraints to accessing professional development and leadership roles. Power and pay gaps between men and women in the health sector need to be urgently closed, by pursuing deliberate strategies to level the playing field for women (92).
Health system functioning also relies on access to affordable essential medicines of assured quality that are available at all times in adequate amounts and in the appropriate dosage forms. Indicator 3.b.3 (Proportion of health facilities that have a core set of relevant essential medicines available and affordable on a sustainable basis) makes it possible to assess both the availability and affordability of medicines by combining them into a single indicator, while allowing a separate analysis to identify the main driver of poor performance. The index is computed based on 32 tracer essential medicines for the treatment, prevention and management of acute and chronic diseases, communicable diseases and NCDs in a primary health care setting. Preliminary analysis from 16 countries (eight
from the WHO African Region, seven from the Region of the Americas and one from the European Region) found that only 15.5% of surveyed facilities provided available and affordable (i.e. accessible) medicines in 2016, with accessibility being higher in public sector facilities than in private sector facilities (24.5% and 9.2%, respectively). The analysis also found that the issue lies with the price of the tracer medicines; that is, if the selected tracer essential medicines were provided at affordable prices, overall access to medicines across 16 analysed countries would be 20.5%, with accessibility in public sector facilities reaching 30% and in private sector facilities 15.4%.
Research and development into new or improved health products and processes (e.g. medicines, vaccines and diagnostics) is critical for improving health outcomes. However, allocation of funds for research and development is often poorly aligned with global public health needs. The latest available data from OECD indicate that only 18 of 139 countries (13%) that received ODA for medical research and basic health sectors met their target for the percentage of such ODA allocated to medical research (93).
0.0 0.1 0.2 0.3 0.4 0.5 0.6 0.7 0.8 0.9 1.0
High income
Upper-middle income
Lower-middle income
Low income
WPR
EMR
EUR
SEAR
AMR
AFR
Global
Proportion of countries
Fewer than 10 medical doctors per 10 000 population Fewer than 40 nursing and midwifery personnel per 10 000 population
Fewer than 5 dentists per 10 000 population Fewer than 5 pharmacists per 10 000 population
Fig. 8.4 Proportion of countries with insufficient health care professionals, 2013–2018
Fewer than 10 medical doctors per 10 000 population Fewer than 40 nursing and midwifery personnel per 10 000 population Fewer than 5 dentists per 10 000 population Fewer than 5 pharmacists per 10 000 population
Source: WHO (2018) (86).
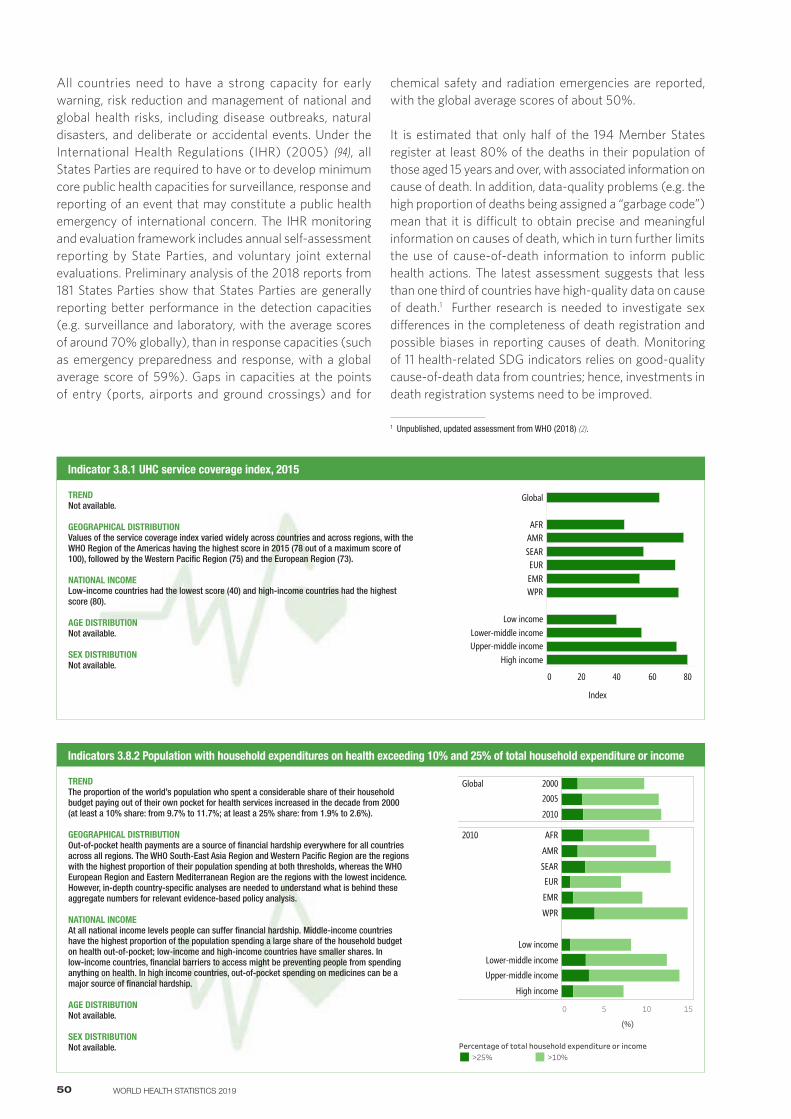
50 WORLD HEALTH STATISTICS 2019
Indicator 3.8.1 UHC service coverage index, 2015
0 20 40 60 80
Global
AFRAMRSEAREUREMRWPR
Low incomeLower-middle incomeUpper-middle income
High income
Index
UHC
TREND Not available.
GEOGRAPHICAL DISTRIBUTIONValues of the service coverage index varied widely across countries and across regions, with the WHO Region of the Americas having the highest score in 2015 (78 out of a maximum score of 100), followed by the Western Pacific Region (75) and the European Region (73).
NATIONAL INCOMELow-income countries had the lowest score (40) and high-income countries had the highest score (80).
AGE DISTRIBUTIONNot available.
SEX DISTRIBUTIONNot available.
All countries need to have a strong capacity for early warning, risk reduction and management of national and global health risks, including disease outbreaks, natural disasters, and deliberate or accidental events. Under the International Health Regulations (IHR) (2005) (94), all States Parties are required to have or to develop minimum core public health capacities for surveillance, response and reporting of an event that may constitute a public health emergency of international concern. The IHR monitoring and evaluation framework includes annual self-assessment reporting by State Parties, and voluntary joint external evaluations. Preliminary analysis of the 2018 reports from 181 States Parties show that States Parties are generally reporting better performance in the detection capacities (e.g. surveillance and laboratory, with the average scores of around 70% globally), than in response capacities (such as emergency preparedness and response, with a global average score of 59%). Gaps in capacities at the points of entry (ports, airports and ground crossings) and for
chemical safety and radiation emergencies are reported, with the global average scores of about 50%.
It is estimated that only half of the 194 Member States register at least 80% of the deaths in their population of those aged 15 years and over, with associated information on cause of death. In addition, data-quality problems (e.g. the high proportion of deaths being assigned a “garbage code”) mean that it is difficult to obtain precise and meaningful information on causes of death, which in turn further limits the use of cause-of-death information to inform public health actions. The latest assessment suggests that less than one third of countries have high-quality data on cause of death.1 Further research is needed to investigate sex differences in the completeness of death registration and possible biases in reporting causes of death. Monitoring of 11 health-related SDG indicators relies on good-quality cause-of-death data from countries; hence, investments in death registration systems need to be improved.
1 Unpublished, updated assessment from WHO (2018) (2).
Indicators 3.8.2 Population with household expenditures on health exceeding 10% and 25% of total household expenditure or income
0 5 10 15
(%)
2010 AFR
AMR
SEAR
EUR
EMR
WPR
Low income
Lower-middle income
Upper-middle income
High income
Percentage of total household expenditure or income>25% >10% and ≤25%
Global 2000
2005
2010
TREND The proportion of the world’s population who spent a considerable share of their household budget paying out of their own pocket for health services increased in the decade from 2000 (at least a 10% share: from 9.7% to 11.7%; at least a 25% share: from 1.9% to 2.6%).
GEOGRAPHICAL DISTRIBUTIONOut-of-pocket health payments are a source of financial hardship everywhere for all countries across all regions. The WHO South-East Asia Region and Western Pacific Region are the regions with the highest proportion of their population spending at both thresholds, whereas the WHO European Region and Eastern Mediterranean Region are the regions with the lowest incidence. However, in-depth country-specific analyses are needed to understand what is behind these aggregate numbers for relevant evidence-based policy analysis.
NATIONAL INCOMEAt all national income levels people can suffer financial hardship. Middle-income countries have the highest proportion of the population spending a large share of the household budget on health out-of-pocket; low-income and high-income countries have smaller shares. In low-income countries, financial barriers to access might be preventing people from spending anything on health. In high income countries, out-of-pocket spending on medicines can be a major source of financial hardship.
AGE DISTRIBUTIONNot available.
SEX DISTRIBUTIONNot available.
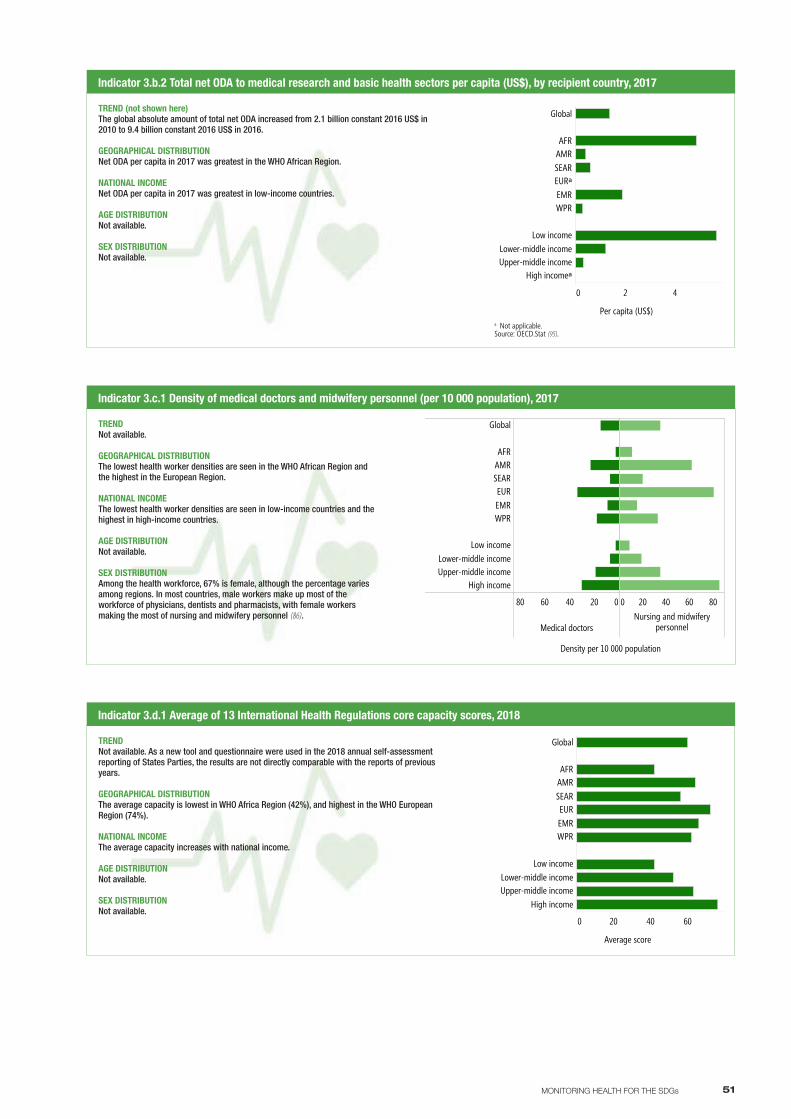
51MONITORING HEALTH FOR THE SDGs
Indicator 3.c.1 Density of medical doctors and midwifery personnel (per 10 000 population), 2017
020406080
Medical doctors
0 20 40 60 80Nursing and midwifery
personnel
Global
AFRAMRSEAREUREMRWPR
Low incomeLower-middle incomeUpper-middle income
High income
Density per 10 000 population
TREND Not available.
GEOGRAPHICAL DISTRIBUTIONThe lowest health worker densities are seen in the WHO African Region and the highest in the European Region.
NATIONAL INCOMEThe lowest health worker densities are seen in low-income countries and the highest in high-income countries.
AGE DISTRIBUTIONNot available.
SEX DISTRIBUTIONAmong the health workforce, 67% is female, although the percentage varies among regions. In most countries, male workers make up most of the workforce of physicians, dentists and pharmacists, with female workers making the most of nursing and midwifery personnel (86).
Indicator 3.d.1 Average of 13 International Health Regulations core capacity scores, 2018
TREND Not available. As a new tool and questionnaire were used in the 2018 annual self-assessment reporting of States Parties, the results are not directly comparable with the reports of previous years.
GEOGRAPHICAL DISTRIBUTIONThe average capacity is lowest in WHO Africa Region (42%), and highest in the WHO European Region (74%).
NATIONAL INCOMEThe average capacity increases with national income.
AGE DISTRIBUTIONNot available.
SEX DISTRIBUTIONNot available.
0 20 40 60
Global
AFRAMRSEAREUREMRWPR
Low incomeLower-middle incomeUpper-middle income
High income
Average score
IHR
Indicator 3.b.2 Total net ODA to medical research and basic health sectors per capita (US$), by recipient country, 2017
0 2 4
Global
AFRAMRSEAREURᵃEMRWPR
Low incomeLower-middle incomeUpper-middle income
High incomeᵃ
Per capita (US$)
ODA
TREND (not shown here) The global absolute amount of total net ODA increased from 2.1 billion constant 2016 US$ in 2010 to 9.4 billion constant 2016 US$ in 2016.
GEOGRAPHICAL DISTRIBUTIONNet ODA per capita in 2017 was greatest in the WHO African Region.
NATIONAL INCOMENet ODA per capita in 2017 was greatest in low-income countries.
AGE DISTRIBUTIONNot available.
SEX DISTRIBUTIONNot available.
a Not applicable.Source: OECD.Stat (95).
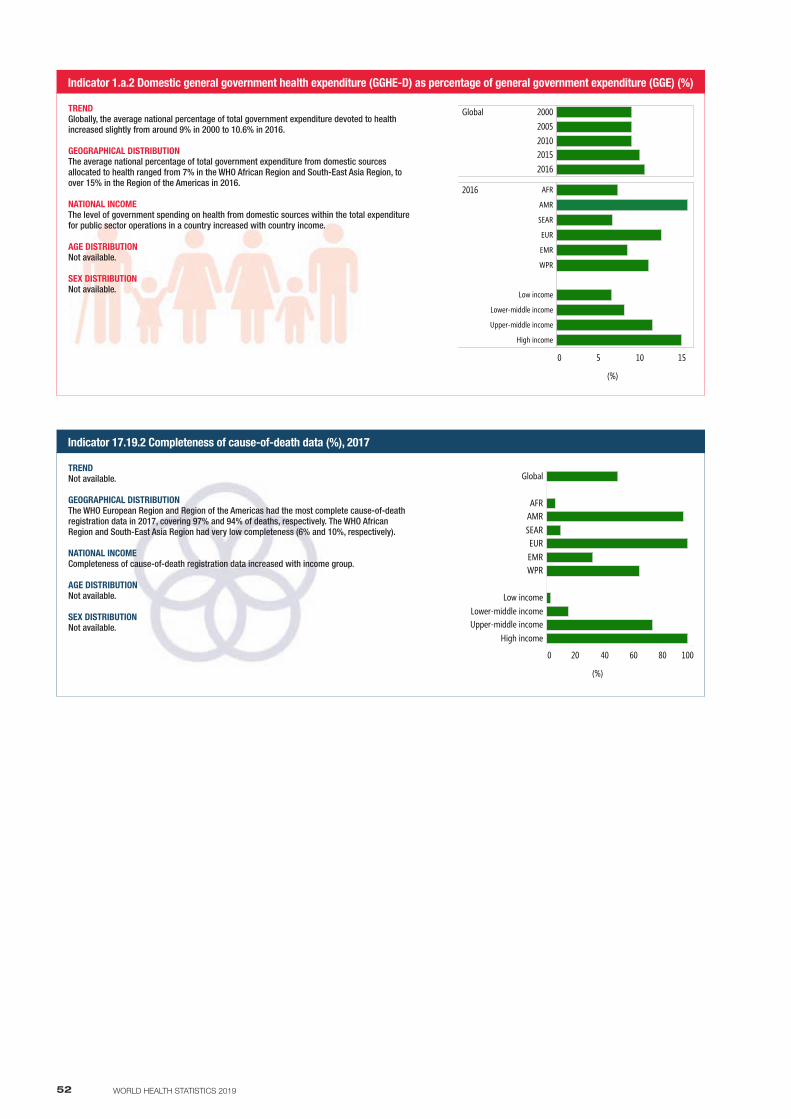
52 WORLD HEALTH STATISTICS 2019
Indicator 1.a.2 Domestic general government health expenditure (GGHE-D) as percentage of general government expenditure (GGE) (%)
TREND Globally, the average national percentage of total government expenditure devoted to health increased slightly from around 9% in 2000 to 10.6% in 2016.
GEOGRAPHICAL DISTRIBUTIONThe average national percentage of total government expenditure from domestic sources allocated to health ranged from 7% in the WHO African Region and South-East Asia Region, to over 15% in the Region of the Americas in 2016.
NATIONAL INCOMEThe level of government spending on health from domestic sources within the total expenditure for public sector operations in a country increased with country income.
AGE DISTRIBUTIONNot available.
SEX DISTRIBUTIONNot available.
0 5 10 15
2016 AFR
AMR
SEAR
EUR
EMR
WPR
Low income
Lower-middle income
Upper-middle income
High income
(%)
exp1a
Global 20002005201020152016
Indicator 17.19.2 Completeness of cause-of-death data (%), 2017
TREND Not available.
GEOGRAPHICAL DISTRIBUTIONThe WHO European Region and Region of the Americas had the most complete cause-of-death registration data in 2017, covering 97% and 94% of deaths, respectively. The WHO African Region and South-East Asia Region had very low completeness (6% and 10%, respectively).
NATIONAL INCOMECompleteness of cause-of-death registration data increased with income group.
AGE DISTRIBUTIONNot available.
SEX DISTRIBUTIONNot available.
0 20 40 60 80 100
Global
AFRAMRSEAREUREMRWPR
Low incomeLower-middle incomeUpper-middle income
High income
(%)
CODcoverage
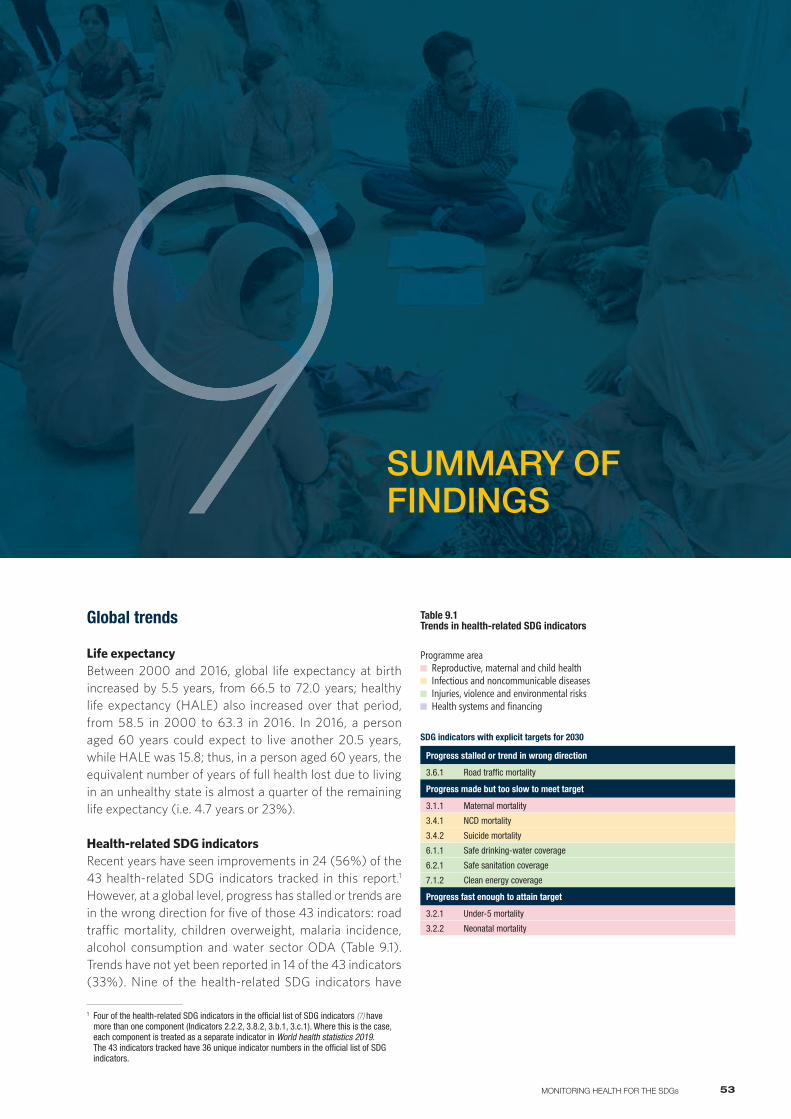
53MONITORING HEALTH FOR THE SDGs
SUMMARY OF FINDINGS9
Global trends
Life expectancyBetween 2000 and 2016, global life expectancy at birth increased by 5.5 years, from 66.5 to 72.0 years; healthy life expectancy (HALE) also increased over that period, from 58.5 in 2000 to 63.3 in 2016. In 2016, a person aged 60 years could expect to live another 20.5 years, while HALE was 15.8; thus, in a person aged 60 years, the equivalent number of years of full health lost due to living in an unhealthy state is almost a quarter of the remaining life expectancy (i.e. 4.7 years or 23%).
Health-related SDG indicatorsRecent years have seen improvements in 24 (56%) of the 43 health-related SDG indicators tracked in this report.1 However, at a global level, progress has stalled or trends are in the wrong direction for five of those 43 indicators: road traffic mortality, children overweight, malaria incidence, alcohol consumption and water sector ODA (Table 9.1). Trends have not yet been reported in 14 of the 43 indicators (33%). Nine of the health-related SDG indicators have
1 Four of the health-related SDG indicators in the official list of SDG indicators (7) have more than one component (Indicators 2.2.2, 3.8.2, 3.b.1, 3.c.1). Where this is the case, each component is treated as a separate indicator in World health statistics 2019. The 43 indicators tracked have 36 unique indicator numbers in the official list of SDG indicators.
SDG indicators with explicit targets for 2030
Progress stalled or trend in wrong direction
3.6.1 Road traffic mortality
Progress made but too slow to meet target
3.1.1 Maternal mortality
3.4.1 NCD mortality
3.4.2 Suicide mortality
6.1.1 Safe drinking-water coverage
6.2.1 Safe sanitation coverage
7.1.2 Clean energy coverage
Progress fast enough to attain target
3.2.1 Under-5 mortality
3.2.2 Neonatal mortality
Programme area Reproductive, maternal and child health Infectious and noncommunicable diseases Injuries, violence and environmental risks Health systems and financing
Table 9.1 Trends in health-related SDG indicators
54 WORLD HEALTH STATISTICS 2019
Table 9.1, continued
SDG indicators with no explicit targets for 2030
Progress stalled or trend in wrong direction
2.2.2 Children overweight
3.3.3 Malaria incidence
3.5.2 Alcohol consumption
6.a.1 Water sector ODA
Progress made
3.1.2 Skilled birth attendance
3.7.1 Met need for family planning
3.7.2 Adolescent birth rate
2.2.1 Stunting in children
3.b.1 DTP3 coverage
MCV2 coverage
PCV3 coverage
3.3.1 New HIV infections
3.3.2 Tuberculosis incidence
3.3.4 Hepatitis B prevalence
3.3.5 Need for NTD interventions
3.a.1 Tobacco use in persons ≥15 years
16.1.1 Homicide
3.9.3 Poisoning mortality
3.b.2 ODA medical research & basic health sectors
1.a.2 Domestic government health expenditure
Trend not yet reported
2.2.2 Wasting in children
3.9.1 Air pollution mortality
3.9.2 Unsafe water and sanitation mortality
5.2.1 Intimate partner violence
11.6.2 Fine particulate matter in urban areas
3.8.1 UHC service coverage index
3.c.1 Medical doctor density
Nurse/midwife density
Dentist density
Pharmacist density
3.d.1 International Health Regulations capacity
3.8.2 Household health expenditures >10%
Household health expenditures >25%
17.9.2 Completeness of cause-of-death data
explicit targets for 2030, but only two of those indicators are on track to meet 2030 targets: those for under-5 mortality rate and neonatal mortality rate. However, it is estimated that on current trends 51 countries will miss the target for under-5 mortality, and more than 60 countries will miss the target for neonatal mortality in 2030.
Underlying data for tracking the health-related SDGs
Monitoring of the health-related SDGs is based on statistics of two types:
• primary data – data compiled by international agencies from routine reporting by countries or publicly available sources such as DHS. Statistics are presented as they are reported or with modest adjustment; and
• comparable estimates – country data are adjusted or modelled to allow comparisons between countries or over time. Comparable estimates are produced for countries with underlying primary data and, in some cases, also for those without.
Sections 2–8 of this report presented SDG indicator values with respect to trends over time, geographical comparisons and sex disaggregation. Another aspect that needs to be considered is the availability and timeliness of the data underlying each SDG indicator value. Health-related SDG indicators have varying definitions and methodologies; thus, what is considered as underlying data can vary by indicator. Some complex indicators use multiple parameters from multiple data sources from different years. In such cases, the most important parameter (or parameters) was selected as the defining criteria of underlying data. The quality of underlying data may also vary. This assessment is based on the underlying data used as inputs for the SDG indicator, regardless of any adjustments made to the data in the estimation process. The “latest available year of underlying data” refers to the most recent year of the reference period for the available input data that were used to generate an estimate.
For 18 SDG indicators that are reported as primary data, the proportion of countries with available primary data within the past 10 years ranged from 32% for intimate partner violence, to 100% for four indicators (Fig. 9.1). The proportion of countries with available recent primary data, that is, within the past 5 years, ranged from 5% to 100%.
For 25 SDG indicators that are reported as comparable estimates, the availability of underlying data also varies across indicators (Fig. 9.2). Indicators that were adopted for global monitoring before the SDG era – for example, under-5 mortality, TB incidence, and vaccination coverage – tend to have relatively high availability of underlying data, even though such data may not be recent for all countries. In contrast, availability of underlying data tends to be lower for new global indicators such as cause-specific mortality rates, and population using safely managed drinking-water and safely managed sanitation services. The average lag between the year of the estimate and the latest available year of underlying data ranged from 0 for HIV, TB, malaria incidence and immunizations, to 5 years for hepatitis B prevalence. The year of estimates ranges from 2015 for maternal mortality to 2017 for HIV, TB and malaria incidence, vaccination coverage and clean energy coverage.
Of the 43 health and health-related SDG indicators reported in World health statistics 2019, sex disaggregation would potentially be informative for 28 indicators (Table 9.2). Sex disaggregation is not possible for the 10 indicators
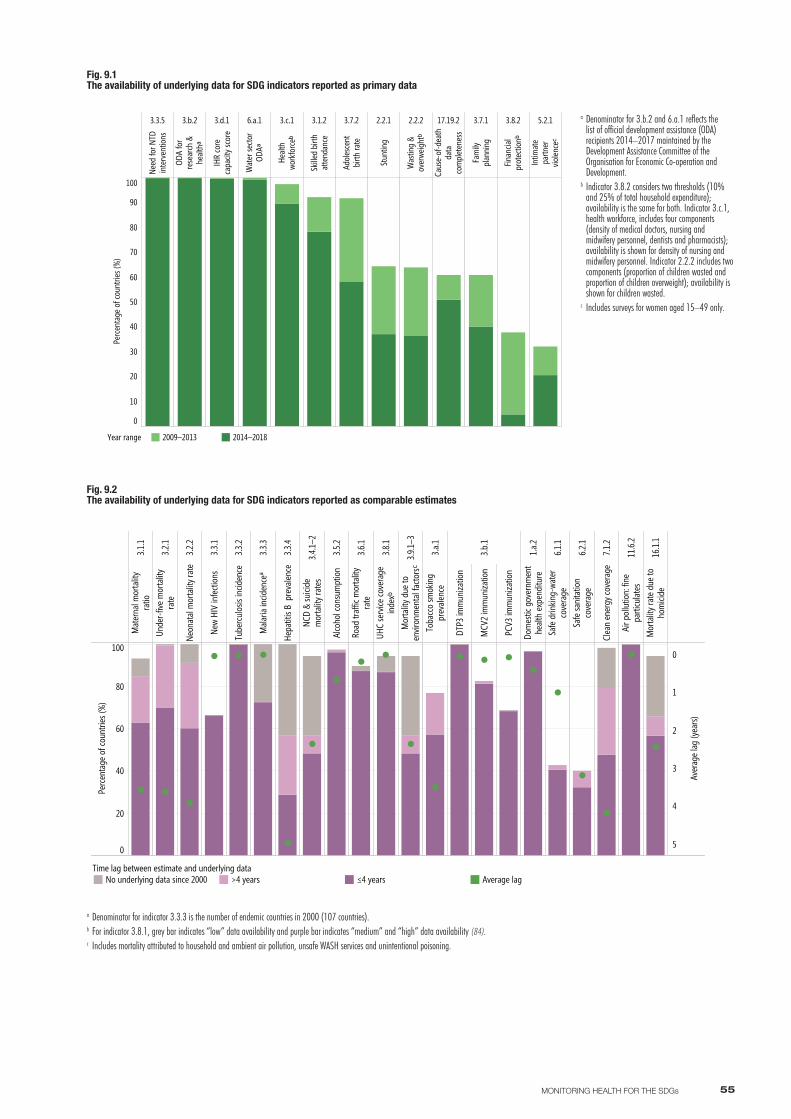
55MONITORING HEALTH FOR THE SDGs
3.3.5
Need
for N
TDin
terv
entio
ns
3.b.2
ODA
for
rese
arch
&he
althᵃ
3.d.1
IHR
core
capa
city s
core
6.a.1
Wat
er se
ctor
ODAᵃ
3.c.1
Healt
hwo
rkfo
rceᵇ
3.1.2
Skille
d bi
rthat
tend
ance
3.7.2
Adol
esce
ntbi
rth ra
te
2.2.1
Stun
ting
2.2.2
Was
ting
&ov
erwe
ightᵇ
17.19.2
Caus
e-of
-dea
thda
taco
mpl
eten
ess
3.7.1
Fam
ilypl
anni
ng
3.8.2
Finan
cial
prot
ectio
nᵇ
5.2.1
Intim
ate
partn
ervio
lence
ᶜ
0
10
20
30
40
50
60
70
80
90
100
Perc
enta
ge o
f cou
ntrie
s (%
)
Year range 2009–2013 2014–2018
a Denominator for 3.b.2 and 6.a.1 reflects the list of official development assistance (ODA) recipients 2014–2017 maintained by the Development Assistance Committee of the Organisation for Economic Co-operation and Development.
b Indicator 3.8.2 considers two thresholds (10% and 25% of total household expenditure); availability is the same for both. Indicator 3.c.1, health workforce, includes four components (density of medical doctors, nursing and midwifery personnel, dentists and pharmacists); availability is shown for density of nursing and midwifery personnel. Indicator 2.2.2 includes two components (proportion of children wasted and proportion of children overweight); availability is shown for children wasted.
c Includes surveys for women aged 15–49 only.
Fig. 9.1 The availability of underlying data for SDG indicators reported as primary data
Fig. 9.2 The availability of underlying data for SDG indicators reported as comparable estimates
3.1.1
Mat
erna
l mor
talit
yra
tio
3.2.1
Unde
r-five
mor
talit
yra
te
3.2.2
Neon
atal
mor
talit
y rat
e
3.3.1
New
HIV
infe
ction
s
3.3.2
Tube
rcul
osis
incid
ence
3.3.3
Mala
ria in
ciden
ceª
3.3.4
Hepa
titis
B p
reva
lence
3.4.1–
2NC
D &
suici
dem
orta
lity r
ates
3.5.2
Alco
hol c
onsu
mpt
ion
3.6.1
Road
traf
fic m
orta
lity
rate
3.8.1
UHC
serv
ice co
vera
gein
dexᵇ
3.9.1–
3M
orta
lity d
ue to
envir
onm
enta
l fac
torsᶜ
3.a.1
Toba
cco
smok
ing
prev
alenc
e
3.b.1
DTP3
imm
uniza
tion
MCV
2 im
mun
izatio
n
PCV3
imm
uniza
tion
1.a.2
Dom
estic
gov
ernm
ent
healt
h ex
pend
iture
6.1.1
Safe
drin
king-
wate
rco
vera
ge
6.2.1
Safe
sani
tatio
nco
vera
ge
7.1.2
Clea
n en
ergy
cove
rage
11.6.
2Ai
r pol
lutio
n: fi
nepa
rticu
lates
16.1.
1M
orta
lity r
ate
due
toho
mici
de
0
20
40
60
80
100
Perc
enta
ge o
f cou
ntrie
s (%
)
0
1
2
3
4
5
Aver
age
lag (y
ears
)
Time lag between estimate and underlying dataNo underlying data since 2000 >4 years ≤4 years Average lag
a Denominator for indicator 3.3.3 is the number of endemic countries in 2000 (107 countries).b For indicator 3.8.1, grey bar indicates “low” data availability and purple bar indicates “medium” and “high” data availability (84).c Includes mortality attributed to household and ambient air pollution, unsafe WASH services and unintentional poisoning.
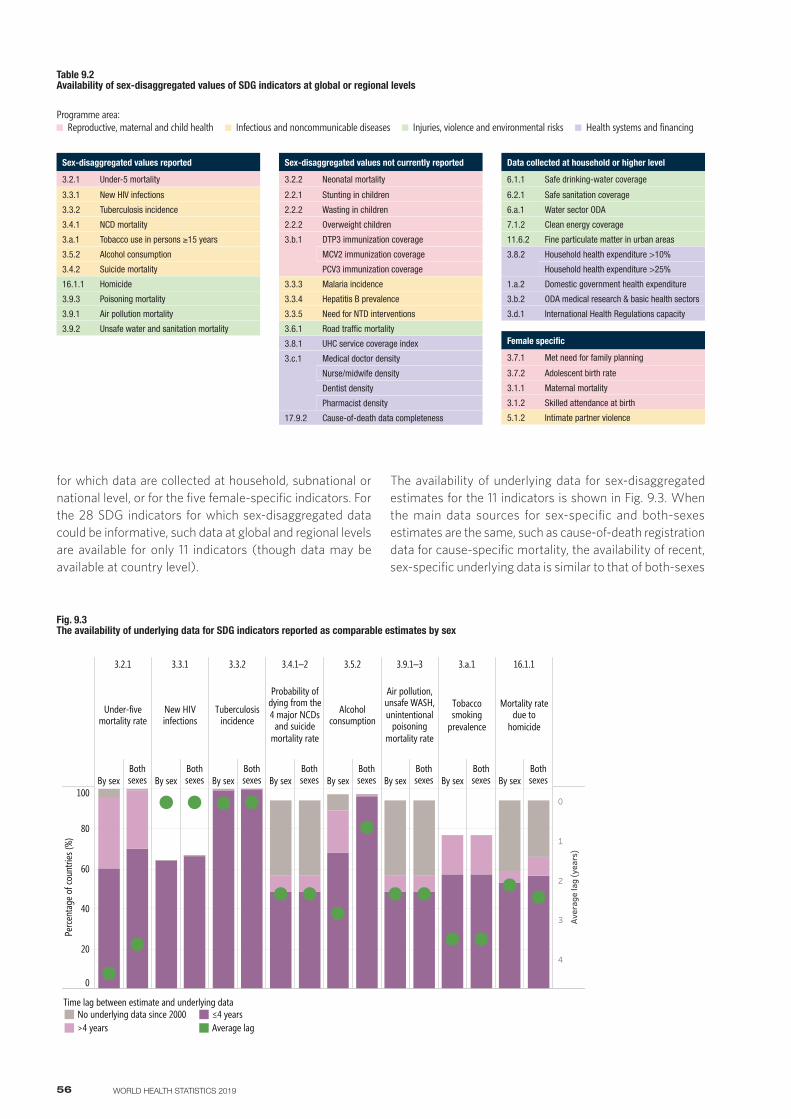
56 WORLD HEALTH STATISTICS 2019
for which data are collected at household, subnational or national level, or for the five female-specific indicators. For the 28 SDG indicators for which sex-disaggregated data could be informative, such data at global and regional levels are available for only 11 indicators (though data may be available at country level).
Sex-disaggregated values reported
3.2.1 Under-5 mortality
3.3.1 New HIV infections
3.3.2 Tuberculosis incidence
3.4.1 NCD mortality
3.a.1 Tobacco use in persons ≥15 years
3.5.2 Alcohol consumption
3.4.2 Suicide mortality
16.1.1 Homicide
3.9.3 Poisoning mortality
3.9.1 Air pollution mortality
3.9.2 Unsafe water and sanitation mortality
Sex-disaggregated values not currently reported
3.2.2 Neonatal mortality
2.2.1 Stunting in children
2.2.2 Wasting in children
2.2.2 Overweight children
3.b.1 DTP3 immunization coverage
MCV2 immunization coverage
PCV3 immunization coverage
3.3.3 Malaria incidence
3.3.4 Hepatitis B prevalence
3.3.5 Need for NTD interventions
3.6.1 Road traffic mortality
3.8.1 UHC service coverage index
3.c.1 Medical doctor density
Nurse/midwife density
Dentist density
Pharmacist density
17.9.2 Cause-of-death data completeness
Data collected at household or higher level
6.1.1 Safe drinking-water coverage
6.2.1 Safe sanitation coverage
6.a.1 Water sector ODA
7.1.2 Clean energy coverage
11.6.2 Fine particulate matter in urban areas
3.8.2 Household health expenditure >10%
Household health expenditure >25%
1.a.2 Domestic government health expenditure
3.b.2 ODA medical research & basic health sectors
3.d.1 International Health Regulations capacity
Female specific
3.7.1 Met need for family planning
3.7.2 Adolescent birth rate
3.1.1 Maternal mortality
3.1.2 Skilled attendance at birth
5.1.2 Intimate partner violence
Programme area: Reproductive, maternal and child health Infectious and noncommunicable diseases Injuries, violence and environmental risks Health systems and financing
Table 9.2 Availability of sex-disaggregated values of SDG indicators at global or regional levels
The availability of underlying data for sex-disaggregated estimates for the 11 indicators is shown in Fig. 9.3. When the main data sources for sex-specific and both-sexes estimates are the same, such as cause-of-death registration data for cause-specific mortality, the availability of recent, sex-specific underlying data is similar to that of both-sexes
Fig. 9.3 The availability of underlying data for SDG indicators reported as comparable estimates by sex
3.2.1
Under-fivemortality rate
By sexBothsexes
3.3.1
New HIVinfections
By sexBothsexes
3.3.2
Tuberculosisincidence
By sexBothsexes
3.4.1–2
Probability ofdying from the4 major NCDs
and suicidemortality rate
By sexBothsexes
3.5.2
Alcoholconsumption
By sexBothsexes
3.9.1–3
Air pollution,unsafe WASH,unintentional
poisoningmortality rate
By sexBothsexes
3.a.1
Tobaccosmoking
prevalence
By sexBothsexes
16.1.1
Mortality ratedue to
homicide
By sexBothsexes
0
20
40
60
80
100
Perc
enta
ge o
f cou
ntrie
s (%
)
0
1
2
3
4
Aver
age
lag
(yea
rs)
Time lag between estimate and underlying dataNo underlying data since 2000>4 years
≤4 yearsAverage lag
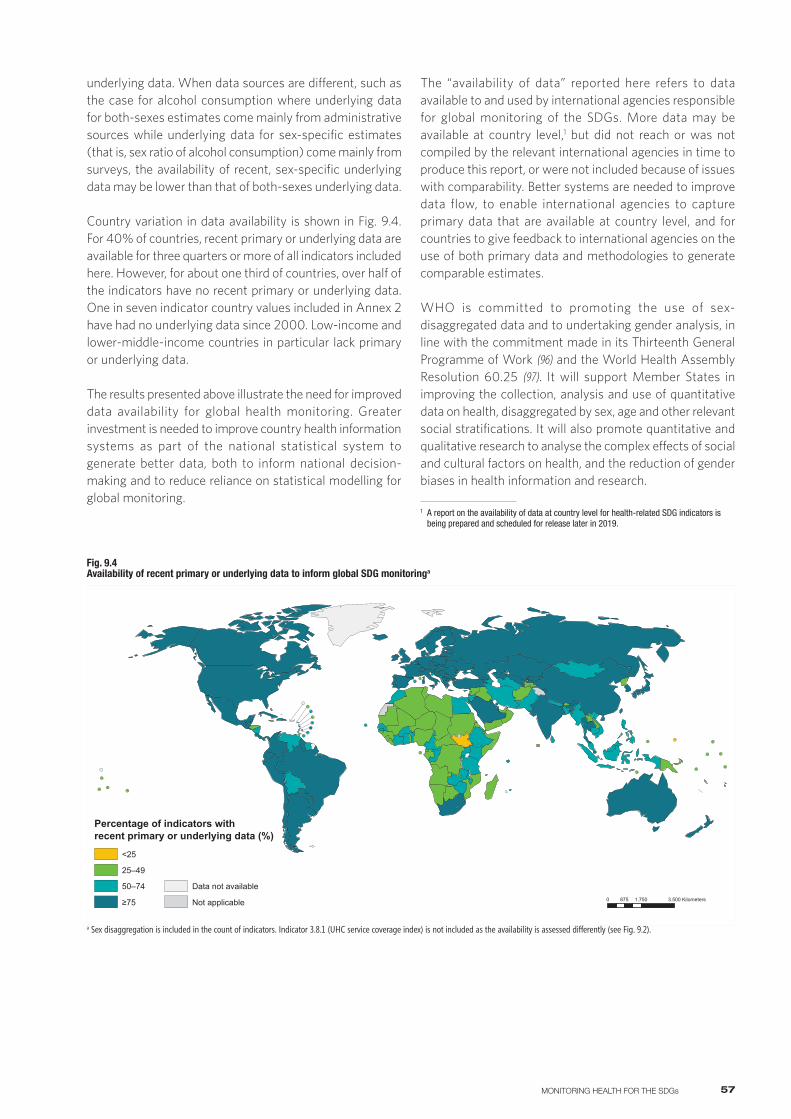
57MONITORING HEALTH FOR THE SDGs
underlying data. When data sources are different, such as the case for alcohol consumption where underlying data for both-sexes estimates come mainly from administrative sources while underlying data for sex-specific estimates (that is, sex ratio of alcohol consumption) come mainly from surveys, the availability of recent, sex-specific underlying data may be lower than that of both-sexes underlying data.
Country variation in data availability is shown in Fig. 9.4. For 40% of countries, recent primary or underlying data are available for three quarters or more of all indicators included here. However, for about one third of countries, over half of the indicators have no recent primary or underlying data. One in seven indicator country values included in Annex 2 have had no underlying data since 2000. Low-income and lower-middle-income countries in particular lack primary or underlying data.
The results presented above illustrate the need for improved data availability for global health monitoring. Greater investment is needed to improve country health information systems as part of the national statistical system to generate better data, both to inform national decision-making and to reduce reliance on statistical modelling for global monitoring.
The “availability of data” reported here refers to data available to and used by international agencies responsible for global monitoring of the SDGs. More data may be available at country level,1 but did not reach or was not compiled by the relevant international agencies in time to produce this report, or were not included because of issues with comparability. Better systems are needed to improve data flow, to enable international agencies to capture primary data that are available at country level, and for countries to give feedback to international agencies on the use of both primary data and methodologies to generate comparable estimates.
WHO is committed to promoting the use of sex-disaggregated data and to undertaking gender analysis, in line with the commitment made in its Thirteenth General Programme of Work (96) and the World Health Assembly Resolution 60.25 (97). It will support Member States in improving the collection, analysis and use of quantitative data on health, disaggregated by sex, age and other relevant social stratifications. It will also promote quantitative and qualitative research to analyse the complex effects of social and cultural factors on health, and the reduction of gender biases in health information and research.
1 A report on the availability of data at country level for health-related SDG indicators is being prepared and scheduled for release later in 2019.
Fig. 9.4 Availability of recent primary or underlying data to inform global SDG monitoringa
0 1.750 3.500875 Kilometers
Percentage of indicators withrecent primary or underlying data (%)
<25
25–49
50–74
≥75
Data not available
Not applicable
a Sex disaggregation is included in the count of indicators. Indicator 3.8.1 (UHC service coverage index) is not included as the availability is assessed differently (see Fig. 9.2).
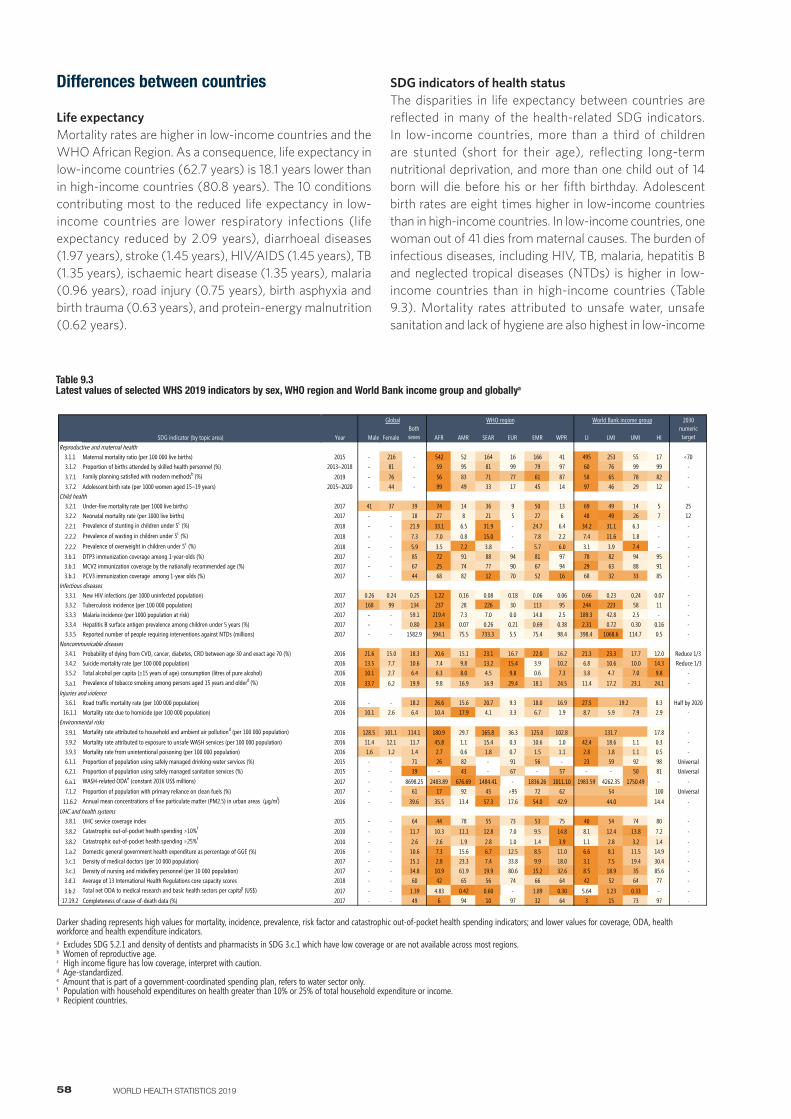
58 WORLD HEALTH STATISTICS 2019
Differences between countries
Life expectancyMortality rates are higher in low-income countries and the WHO African Region. As a consequence, life expectancy in low-income countries (62.7 years) is 18.1 years lower than in high-income countries (80.8 years). The 10 conditions contributing most to the reduced life expectancy in low-income countries are lower respiratory infections (life expectancy reduced by 2.09 years), diarrhoeal diseases (1.97 years), stroke (1.45 years), HIV/AIDS (1.45 years), TB (1.35 years), ischaemic heart disease (1.35 years), malaria (0.96 years), road injury (0.75 years), birth asphyxia and birth trauma (0.63 years), and protein-energy malnutrition (0.62 years).
SDG indicators of health statusThe disparities in life expectancy between countries are reflected in many of the health-related SDG indicators. In low-income countries, more than a third of children are stunted (short for their age), reflecting long-term nutritional deprivation, and more than one child out of 14 born will die before his or her fifth birthday. Adolescent birth rates are eight times higher in low-income countries than in high-income countries. In low-income countries, one woman out of 41 dies from maternal causes. The burden of infectious diseases, including HIV, TB, malaria, hepatitis B and neglected tropical diseases (NTDs) is higher in low-income countries than in high-income countries (Table 9.3). Mortality rates attributed to unsafe water, unsafe sanitation and lack of hygiene are also highest in low-income
Table 9.3 Latest values of selected WHS 2019 indicators by sex, WHO region and World Bank income group and globallya
2030
Year Male FemaleBoth sexes AFR AMR SEAR EUR EMR WPR LI LMI UMI HI
numerictarget
Reproductive and maternal health 2 3 4 5 6 7 8 9 10 11 12 13 14 15 163.1.1 Maternal mortality ratio (per 100 000 live births) 2015 - 216 - 542 52 164 16 166 41 495 253 55 17 <703.1.2 Proportion of births attended by skilled health personnel (%) 2013–2018 - 81 - 59 95 81 99 79 97 60 76 99 99 -
3.7.1 Family planning satisfied with modern methodsb (%) 2019 - 76 - 56 83 71 77 61 87 58 65 78 82 -3.7.2 Adolescent birth rate (per 1000 women aged 15–19 years) 2015–2020 - 44 - 99 49 33 17 45 14 97 46 29 12 -
Child health3.2.1 Under-five mortality rate (per 1000 live births) 2017 41 37 39 74 14 36 9 50 13 69 49 14 5 253.2.2 Neonatal mortality rate (per 1000 live births) 2017 - - 18 27 8 21 5 27 6 48 49 26 7 12
2.2.1 Prevalence of stunting in children under 5c (%) 2018 - - 21.9 33.1 6.5 31.9 - 24.7 6.4 34.2 31.1 6.3 - -
2.2.2 Prevalence of wasting in children under 5c (%) 2018 - - 7.3 7.0 0.8 15.0 - 7.8 2.2 7.4 11.6 1.8 - -
2.2.2 Prevalence of overweight in children under 5c (%) 2018 - - 5.9 3.5 7.2 3.8 - 5.7 6.0 3.1 3.9 7.4 - -3.b.1 DTP3 immunization coverage among 1-year-olds (%) 2017 - - 85 72 91 88 94 81 97 78 82 94 95 -3.b.1 MCV2 immunization coverage by the nationally recommended age (%) 2017 - - 67 25 74 77 90 67 94 29 63 88 91 -3.b.1 PCV3 immunization coverage among 1-year olds (%) 2017 - - 44 68 82 12 70 52 16 68 32 33 85 -
Infectious diseases3.3.1 New HIV infections (per 1000 uninfected population) 2017 0.26 0.24 0.25 1.22 0.16 0.08 0.18 0.06 0.06 0.66 0.23 0.24 0.07 -3.3.2 Tuberculosis incidence (per 100 000 population) 2017 168 99 134 237 28 226 30 113 95 244 223 58 11 -3.3.3 Malaria incidence (per 1000 population at risk) 2017 - - 59.1 219.4 7.3 7.0 0.0 14.8 2.5 189.3 42.8 2.5 - -3.3.4 Hepatitis B surface antigen prevalence among children under 5 years (%) 2017 - - 0.80 2.34 0.07 0.26 0.21 0.69 0.38 2.31 0.72 0.30 0.16 -3.3.5 Reported number of people requiring interventions against NTDs (millions) 2017 - - 1582.9 594.1 75.5 733.3 5.5 75.4 98.4 398.4 1068.6 114.7 0.5 -
Noncommunicable diseases3.4.1 Probability of dying from CVD, cancer, diabetes, CRD between age 30 and exact age 70 (%) 2016 21.6 15.0 18.3 20.6 15.1 23.1 16.7 22.0 16.2 21.3 23.3 17.7 12.0 Reduce 1/33.4.2 Suicide mortality rate (per 100 000 population) 2016 13.5 7.7 10.6 7.4 9.8 13.2 15.4 3.9 10.2 6.8 10.6 10.0 14.3 Reduce 1/33.5.2 Total alcohol per capita (≥15 years of age) consumption (litres of pure alcohol) 2016 10.1 2.7 6.4 6.3 8.0 4.5 9.8 0.6 7.3 3.8 4.7 7.0 9.8 -
3.a.1 Prevalence of tobacco smoking among persons aged 15 years and olderd (%) 2016 33.7 6.2 19.9 9.8 16.9 16.9 29.4 18.1 24.5 11.4 17.2 23.1 24.1 -Injuries and violence
3.6.1 Road traffic mortality rate (per 100 000 population) 2016 - - 18.2 26.6 15.6 20.7 9.3 18.0 16.9 27.5 8.3 Half by 202016.1.1 Mortality rate due to homicide (per 100 000 population) 2016 10.1 2.6 6.4 10.4 17.9 4.1 3.3 6.7 1.9 8.7 5.9 7.9 2.9 -
Environmental risks3.9.1 Mortality rate attributed to household and ambient air pollutiond (per 100 000 population) 2016 128.5 101.1 114.1 180.9 29.7 165.8 36.3 125.0 102.8 17.8 -3.9.2 Mortality rate attributed to exposure to unsafe WASH services (per 100 000 population) 2016 11.4 12.1 11.7 45.8 1.1 15.4 0.3 10.6 1.0 42.4 18.6 1.1 0.3 -3.9.3 Mortality rate from unintentional poisoning (per 100 000 population) 2016 1.6 1.2 1.4 2.7 0.6 1.8 0.7 1.5 1.1 2.8 1.8 1.1 0.5 -6.1.1 Proportion of population using safely managed drinking-water services (%) 2015 - - 71 26 82 - 91 56 - 23 59 92 98 Universal6.2.1 Proportion of population using safely managed sanitation services (%) 2015 - - 39 - 43 - 67 - 57 - - 50 81 Universal
6.a.1 WASH-related ODAe (constant 2016 US$ millions) 2017 - - 8698.25 2483.89 676.69 1484.41 - 1836.26 1011.10 1983.59 4262.35 1750.49 - -7.1.2 Proportion of population with primary reliance on clean fuels (%) 2017 - - 61 17 92 45 >95 72 62 100 Universal
11.6.2 Annual mean concentrations of fine particulate matter (PM2.5) in urban areas (µg/m3) 2016 - - 39.6 35.5 13.4 57.3 17.6 54.0 42.9 14.4 -UHC and health systems
3.8.1 UHC service coverage index 2015 - - 64 44 78 55 73 53 75 40 54 74 80 -
3.8.2 Catastrophic out-of-pocket health spending >10%f 2010 - - 11.7 10.3 11.1 12.8 7.0 9.5 14.8 8.1 12.4 13.8 7.2 -
3.8.2 Catastrophic out-of-pocket health spending >25%f 2010 - - 2.6 2.6 1.9 2.8 1.0 1.4 3.9 1.1 2.8 3.2 1.4 -1.a.2 Domestic general government health expenditure as percentage of GGE (%) 2016 - - 10.6 7.3 15.6 6.7 12.5 8.5 11.0 6.6 8.1 11.5 14.9 -3.c.1 Density of medical doctors (per 10 000 population) 2017 - - 15.1 2.8 23.3 7.4 33.8 9.9 18.0 3.1 7.5 19.4 30.4 -3.c.1 Density of nursing and midwifery personnel (per 10 000 population) 2017 - - 34.8 10.9 61.9 19.9 80.6 15.2 32.6 8.5 18.9 35 85.6 -3.d.1 Average of 13 International Health Regulations core capacity scores 2018 - - 60 42 65 56 74 66 64 42 52 64 77 -
3.b.2 Total net ODA to medical research and basic health sectors per capitag (US$) 2017 - - 1.39 4.83 0.42 0.60 - 1.89 0.30 5.64 1.23 0.33 - -17.19.2 Completeness of cause-of-death data (%) 2017 - - 49 6 94 10 97 32 64 3 15 73 97 -
SDG indicator (by topic area)
19.2
131.7
54
44.0
Global WHO region World Bank income group
Darker shading represents high values for mortality, incidence, prevalence, risk factor and catastrophic out-of-pocket health spending indicators; and lower values for coverage, ODA, health workforce and health expenditure indicators.a Excludes SDG 5.2.1 and density of dentists and pharmacists in SDG 3.c.1 which have low coverage or are not available across most regions.b Women of reproductive age.c High income figure has low coverage, interpret with caution.d Age-standardized.e Amount that is part of a government-coordinated spending plan, refers to water sector only.f Population with household expenditures on health greater than 10% or 25% of total household expenditure or income.g Recipient countries.
59MONITORING HEALTH FOR THE SDGs
countries, as are mortality rates for road traffic injuries and unintentional poisoning. Although NCDs are often associated with a more prosperous lifestyle, the probability of dying prematurely from CVD, cancer, diabetes and chronic respiratory disease is highest in low-income and lower-middle-income countries.
There are some exceptions to poor health being primarily associated with low-income countries, and in locations where geography also has an influence. Highest wasting rates are observed in the WHO South-East Asia Region (15%) and Eastern Mediterranean Region (7.8%). Mortality rates from homicide are highest in the WHO Region of the Americas. Suicide mortality rates are highest in the WHO European Region, and lowest in the Eastern Mediterranean Region.
SDG indicators of health service coverage and financingPopulations in low-income countries generally have poorer coverage of essential health services and values of the UHC service coverage index are lower. The proportion of women who had their family planning needs met with a modern contraceptive method, and the skilled birth attendance rate were lowest in low-income and lower -middle-income countries, where 95% of maternal deaths occur. Immunization coverage rates are also generally lower in low-income countries. Health workforce densities are lower in low-income countries, and domestic government health expenditure as a proportion of total general government expenditures is lower (despite lower absolute levels of general government expenditure and greater health needs). The proportion of the population that suffer catastrophic health expenditures (>10% or >25% of total household expenditures or income) is higher in middle-income countries than in low- or high-income countries. However, at all income levels people can suffer catastrophic health expenditures, even in high-income countries and in countries where most of the out-of-pocket health spending is due to medicines.
SDG indicators of exposure to risk factorsPopulations in lower-income countries are less likely to use safely managed drinking-water, and clean fuels and technology; also, they have greater exposure to fine particulate matter in cities. In contrast, tobacco use and alcohol consumption are the highest in high-income countries, although the health impact of alcohol is greater among disadvantaged populations for the same levels of alcohol consumption.
Differences between men and women
Life expectancyGlobally, women have a longer life expectancy than men: 74.2 versus 69.8 years at birth, and 21.9 versus 19.0 years at age 60 years. HALE is also greater in women than men
at birth (64.8 versus 62.0 years) and at age 60 years (16.8 versus 14.8 years). However, the number of equivalent years of full health lost through living in unhealthy states is also greater in women than men (9.5 versus 7.8 years). Globally, the sex ratio at birth has ranged between 105–110 males to every 100 females; however, because mortality rates are higher in men, the number of men for every 100 women decreases to 100 in the age group 50–54 years and to 95 by the age group 60–64 years, falling sharply thereafter.
Some of the differences in mortality rates and life expectancy are due to biological sex differences between men and women. For example, X-linked immune regulators may enhance immune responses in female children, resulting in reduced mortality among girls aged under 5 years. Others are linked to gender differences; that is, the socially constructed roles, norms, behaviours, activities and attributes that a given society considers appropriate for men, women boys and girls. For example, child marriage increases the risks related to early pregnancy among girls whereas higher rates of male employment in the transport industry expose men to higher risks of death on the roads. The exact contributions that biological differences and gender roles make to health status are often difficult to separate because they do not operate independently.
Men’s reduced life expectancy compared with that of women is not due to a single or a small number of causes. Of the 40 leading causes of death, 33 causes contribute more to reduced life expectancy in men than in women. The main causes of death that contribute to a lower life expectancy for men than for women are ischaemic heart disease (0.84 years), road injuries (0.47), lung cancer (0.40), chronic obstructive pulmonary disease (0.36), stroke (0.32), cirrhosis of the liver (0.27), TB (0.23), prostate cancer (0.22) and interpersonal violence (0.21). Breast cancer (0.30 years), maternal conditions (0.23) and cervical cancer (0.15) are the causes of death that have the most effect on female rather than male global life expectancy.
SDG indicators of health statusThe differences between men and women in health status are reflected in the majority of health-related SDG indicators, where sex disaggregation has been possible. In 2017, male children were 11% more likely to die than female children before the age of 5 years, compared with only 6% in 2000, indicating that the decline in under-5 mortality rate since 2000 has been faster in females than in males. Given that boys generally have a higher under-5 mortality rate than girls for biological reasons, the similarity of the under-5 mortality rate between boys and girls in the WHO South-East Asia Region is indicative of high rates of avoidable mortality among female children. Although global estimates are not available, household surveys indicate that rates of stunting and wasting are generally higher in boys than girls. Similarly, the proportion of boys overweight is higher than girls.
60 WORLD HEALTH STATISTICS 2019
Globally in 2017, the incidence rate of new HIV infections was 1.09 times higher in men than in women. In the WHO African Region, the incidence rate was 1.28 times higher in women than in men; however, in all other WHO regions, the incidence rates were higher in men than women. The incidence rate of TB was 1.7 higher in men than in women globally in 2017. In 2016, the probability of a man aged 30 years dying from an NCD before 70 years of age was 1.44 times higher than for a woman aged 30 years. Globally in 2016, suicide mortality rates were 1.75 times higher in men than in women.
Deaths rates from road injury are more than twice as high in men as in women from age 15 years, and mortality rates due to homicide are four times higher in men than in women. One in five of all homicides is committed by an intimate partner or family member, with women making up most of the victims (75). Beyond mortality, violence against women is not only widespread, but carries a high burden of morbidity and ill health. Worldwide in 2013, it was estimated that 35% of women and girls aged 15–49 years reported physical or sexual intimate partner violence or non-partner sexual violence in their lifetime. Women and girls may also experience harmful practices, such as female genital mutilation (FGM) and early and forced marriage. As of 2017, at least 200 million girls and women had undergone FGM in the 30 countries where the practice is concentrated (78). Globally, 21% of women aged between 20 and 24 years reported that they were married or in an informal union before age 18 years (77). Also, it is estimated that in 2015–2020 more than one in 25 adolescent girls aged 15–19 years will give birth (1).
Mortality rates attributed to household and ambient air pollution are 1.27 times higher in men than in women.
In contrast, the global mortality rate attributed to unsafe water, unsafe sanitation and lack of hygiene is 1.06 higher in women than in men, although there is much regional variation.
SDG indicators of health service coverageAccess to many services for prevention or treatment of infectious diseases and NCDs is not part of the SDG monitoring framework, except as part of the UHC service coverage index, which cannot be sex-disaggregated using currently available data and methodologies. Nevertheless, some relevant observations have been made through other global health reports. Household surveys suggest that vaccination rates are similar in boys and girls. The risk of not using a condom during sex with a non-regular partner appears to be higher in women than in men. However, in countries with generalized HIV epidemics, men are less likely than women to take an HIV test and less likely to access antiretroviral therapy; also, men are more likely than women to die of an AIDS-related illness (51). Similarly, male TB patients appear to be less likely to seek care than female TB patients (52–55, 98), as reflected in lower rates of case notification compared with the estimated total of cases. Death rates for some NCDs may also be influenced by access to diagnosis and treatment; for example, cervical cancer mortality rates are higher in low-income countries that have poorer access to health services.
SDG indicators of exposure to risk factorsAge-standardized prevalence of tobacco smoking was five times higher in men than in women in 2016, with the largest M/F ratio observed in the WHO Eastern Mediterranean Region. Globally, per capita alcohol consumption was almost 4 times higher in men than in women in 2016.
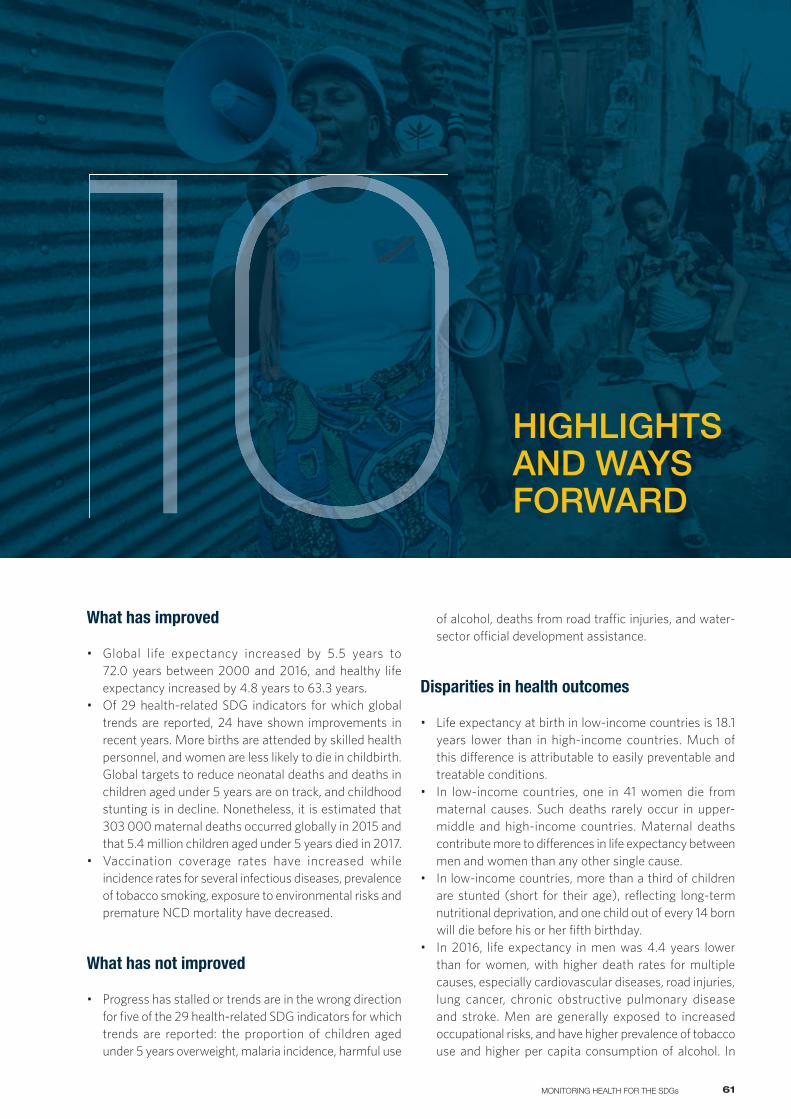
61MONITORING HEALTH FOR THE SDGs
10 HIGHLIGHTS AND WAYS FORWARD
What has improved
• Global life expectancy increased by 5.5 years to 72.0 years between 2000 and 2016, and healthy life expectancy increased by 4.8 years to 63.3 years.
• Of 29 health-related SDG indicators for which global trends are reported, 24 have shown improvements in recent years. More births are attended by skilled health personnel, and women are less likely to die in childbirth. Global targets to reduce neonatal deaths and deaths in children aged under 5 years are on track, and childhood stunting is in decline. Nonetheless, it is estimated that 303 000 maternal deaths occurred globally in 2015 and that 5.4 million children aged under 5 years died in 2017.
• Vaccination coverage rates have increased while incidence rates for several infectious diseases, prevalence of tobacco smoking, exposure to environmental risks and premature NCD mortality have decreased.
What has not improved
• Progress has stalled or trends are in the wrong direction for five of the 29 health-related SDG indicators for which trends are reported: the proportion of children aged under 5 years overweight, malaria incidence, harmful use
of alcohol, deaths from road traffic injuries, and water-sector official development assistance.
Disparities in health outcomes
• Life expectancy at birth in low-income countries is 18.1 years lower than in high-income countries. Much of this difference is attributable to easily preventable and treatable conditions.
• In low-income countries, one in 41 women die from maternal causes. Such deaths rarely occur in upper-middle and high-income countries. Maternal deaths contribute more to differences in life expectancy between men and women than any other single cause.
• In low-income countries, more than a third of children are stunted (short for their age), reflecting long-term nutritional deprivation, and one child out of every 14 born will die before his or her fifth birthday.
• In 2016, life expectancy in men was 4.4 years lower than for women, with higher death rates for multiple causes, especially cardiovascular diseases, road injuries, lung cancer, chronic obstructive pulmonary disease and stroke. Men are generally exposed to increased occupational risks, and have higher prevalence of tobacco use and higher per capita consumption of alcohol. In
62 WORLD HEALTH STATISTICS 2019
many settings, men use health services less than women, even after taking into account reproductive-related consultations. The health gap between men and women is widest in high-income countries.
Data availability
The World health statistics 2019 report reviews, for the first time, the availability of country data for global SDG reporting. This review suggests that major improvements are needed to country data systems: • one in seven indicator country values included in this
report have had no underlying data since 2000; low-income and lower-middle-income countries in particular lack underlying data;
• for about one third of countries, over half of the indicators have no recent primary or underlying data;
• 11 health-related SDG indicators require cause-of-death data, yet only around half of countries are able to register more than 80% of adult deaths, and less than one third of countries have good-quality data on cause of death; and
• sex disaggregation is currently available for less than half (11/28) of relevant SDG indicators at global level where it would be of interest.
Ways forward
Some key actions are suggested based on the findings of this report; these actions are outlined below.
1. Improve access to health services For many conditions, particularly in low-income countries, premature deaths can be averted by improving access to and use of preventive and curative health services. Efforts in support of UHC must focus on reaching those whom services are not reaching, such as marginalized, stigmatized and geographically isolated people of all ages and genders. This may require a strengthened health workforce and increased provision of health facilities, equipment, medicines and vaccines. It will also require removing barriers to accessing services including economic barriers (as a consequence of out-of-pocket expenses and insufficient public financing) and cultural barriers (where the workforce providing services does not have the necessary cultural sensitivity). In some circumstances it will be necessary to address societal barriers to accessing care and this may require actions that lie beyond the traditional remit of ministries of health. Nonetheless, the health sector
can play a key role in raising awareness and catalysing the development of multisectoral policies and programmes to reduce barriers to access. In some countries, health and social systems are strained by natural disasters or conflict, and the populations affected can account for a large proportion of unmet SDG need. Stronger and more resilient national health systems need to be backed by the regional and global alert and response mechanisms that will mitigate the impact of health emergencies.
2. Address risks to healthThe health of populations can also be improved by reducing exposure to risk factors such as unsafe water and sanitation, air pollution, violence, unsafe roads, tobacco use and alcohol consumption. The health sector also has a key role to play in raising awareness and catalysing the development of multisectoral policies and programmes to reduce exposure to these risk factors.
3. Make health systems responsive to sex and genderHealth planning needs to allow for the different needs of men and women, regarding exposure to risk factors, barriers to access and use of services and health outcomes. In many circumstances, men experience poorer health outcomes than women do. Although some of these poorer health outcomes may have a biological basis, they may be amplified by gender roles. Gender analysis and health policies should consider women, men and gender-diverse population groups, to ensure equitable health outcomes. It is also necessary to formulate gender-responsive human-resource policies and regulations, ensure equal pay for work of equal value, and address barriers faced by women in progressing to leadership roles.
4. Invest in data systems for health, including disaggregated dataProgress in achieving the SDG goals is inhibited by incomplete or outdated information on several health-related indicators. The countries lacking underlying data are often those with limited resources and the greatest health need. Collecting, analysing and utilizing data of good quality is an important step to progressing health care, allowing better allocation of resources and timely interventions, and reducing costs while also improving the health care received. By ensuring that data can be disaggregated by sex, place of residence and other dimensions, there is potential to act to reduce inequality. Routine information systems, health facility or household surveys, and civil registration and vital statistics systems must be designed to provide relevant, timely and accurate data.
1. World population prospects: the 2017 revision. Geneva: United Nations, Department of Economic and Social Affairs, Population Division; 2017 (https://population.un.org/wpp/, accessed 31 March 2019).
2. Global health estimates 2016 (deaths by cause, age, sex, by country and by region, 2000–2016; and life expectancy, 2000–2016). Geneva: World Health Organization; 2018.
3. Mielke MM, Ferretti MT, Iulita MF, Hayden K, Khachaturian AS. Sex and gender in Alzheimer’s disease – does it matter? Alzheimer’s & Dementia. 2018;14(9):1101 (https://www.ncbi.nlm.nih.gov/pubmed/30196887, accessed 26 March 2019).
4. Beltran-Sanchez H, Preston SH, Canudas-Romo V. An integrated approach to cause-of-death analysis: cause-deleted life tables and decompositions of life expectancy. Demogr Res. 2008;19:1323 (https://www.ncbi.nlm.nih.gov/pubmed/20165568, accessed 31 April 2019).
5. Rosano GM, Panina G. Oestrogens and the heart. Therapie. 1999;54(3):381–5 (https://www.ncbi.nlm.nih.gov/pubmed/10500455, accessed 26 March 2019).
6. Nhamoyebonde S, Leslie A. Biological differences between the sexes and susceptibility to tuberculosis. J Infect Dis. 2014;209(suppl 3):S100–S6 (https://dx.doi.org/10.1093/infdis/jiu147, accessed 17 March 2019).
7. Hawkes S, Buse K. Gender and global health: evidence, policy, and inconvenient truths. Lancet. 2013;381(9879):1783–7 (https://doi.org/10.1016/S0140-6736(13)60253-6, accessed 14 May 2019).
8. O’Donnell O, Van Doorslaer E, Wagstaff A, Lindelow M. Analyzing health equity using household survey data: a guide to techniques and their implementation. The World Bank; 2007 (https://elibrary.worldbank.org/doi/abs/10.1596/978-0-8213-6933-3, accessed 22 April 2019).
9. Trends in maternal mortality: 1990 to 2015: estimates by WHO, UNICEF, UNFPA, World Bank Group and the United Nations Population Division. Geneva: World Health Organization; 2015 (https://apps.who.int/iris/bitstream/ handle/10665/194254/9789241565141_eng.pdf, accessed 31 April 2019).
10. Zimicki S. The relationship between fertility and maternal mortality. In: Parnell A (ed), Contraceptive use and controlled fertility: health issues for women and children (background papers). Washington DC: National Research Council (US), National Academies Press (US); 1989 (https://www.ncbi.nlm.nih.gov/books/ NBK235085/, accessed 17 March 2019).
11. New country classifications by income level: 2018–2019 [website]. World Bank; 2018 (https://blogs.worldbank.org/opendata/new-country-classifications-income-level-2018-2019, accessed 22 April 2019).
12. Ganchimeg T, Ota E, Morisaki N, Laopaiboon M, Lumbiganon P, Zhang J et al. Pregnancy and childbirth outcomes among adolescent mothers: a World Health Organization multicountry study. BJOG. 2014;121:40–8 (https://dx.doi. org/10.1111/1471-0528.12630, accessed 17 March 2019).
13. Early and unintended pregnancy and the education sector: evidence review and recommendations. Paris: UNESCO; 2007 (https://unesdoc.unesco.org/ark:/48223/pf0000251509, accessed 17 March 2019).
14. Motherhood in childhood. Facing the challenge of adolescent pregnancy. New York: United Nations Population Fund; 2013 (https://www.unfpa.org/sites/default/files/pub-pdf/EN-SWOP2013.pdf, accessed 17 March 2019).
15. Bergman A-S, Axberg U, Hanson E. When a parent dies – a systematic review of the effects of support programs for parentally bereaved children and their caregivers. BMC Palliat Care. 2017;16(1) (https://dx.doi.org/10.1186/s12904-017-0223-y, accessed 17 March 2019).
16. Zhou H, Zhang L, Ye F, Wang H-j, Huntington D, Huang Y et al. The effect of maternal death on the health of the husband and children in a rural area of China: a prospective cohort study. PLOS ONE. 2016;11(6):e0157122 (https://dx.doi.org/10.1371/journal.pone.0157122, accessed 17 March 2019).
17. Finlay JE, Moucheraud C, Goshev S, Levira F, Mrema S, Canning D et al. The effects of maternal mortality on infant and child survival in rural Tanzania: a cohort study. Matern Child Health J 2015;19(11):2393–402 (https://dx.doi.org/10.1007/s10995-015-1758-2, accessed 17 March 2019).
18. Moucheraud C, Worku A, Molla M, Finlay JE, Leaning J, Yamin AE. Consequences of maternal mortality on infant and child survival: a 25-year longitudinal analysis in Butajira Ethiopia (1987–2011). Reprod Health. 2015;12(S1) (https://dx.doi.org/10.1186/1742-4755-12-s1-s4, accessed 17 March 2019).
19. Ronsmans C, Chowdhury ME, Dasgupta SK, Ahmed A, Koblinsky M. Effect of parent’s death on child survival in rural Bangladesh: a cohort study. Lancet. 2010;375(9730):2024–31 (https://dx.doi.org/10.1016/s0140-6736(10)60704-0, accessed 17 March 2019).
20. Kes A, Ogwang S, Pande RP, Douglas Z, Karuga R, Odhiambo FO et al. The economic burden of maternal mortality on households: evidence from three sub-counties in rural western Kenya. Reprod Health. 2015;12(S1) (https://dx.doi.org/10.1186/1742-4755-12-s1-s3, accessed 17 March 2019).
21. Wang H, Ye F, Wang Y, Huntington D. Economic impact of maternal death on households in rural China: a prospective cohort study. PLoS ONE. 2013;8(10):e76624 (https://dx.doi.org/10.1371/journal.pone.0076624, accessed 17 March 2019).
22. Ye F, Wang H, Huntington D, Zhou H, Li Y, You F et al. The immediate economic impact of maternal deaths on rural Chinese households. PLoS ONE. 2012;7(6):e38467 (https://dx.doi.org/10.1371/journal.pone.0038467, accessed 17 March 2019).
23. WHO, MCEE. MCEE-WHO estimates for child causes of death 2000–2017. Geneva: World Health Organization Department of Evidence, Information and Research, and Maternal Child Epidemiology Estimation (MCEE); 2018 (https://www.who.int/healthinfo/global_burden_disease/estimates/en/index2.html, accessed 22 April 2019).
24. Waldron I. Sex differences in human mortality: the role of genetic factors. Soc Sci Med. 1983;17(6):321–33 (https://dx.doi.org/10.1016/0277-9536(83)90234-4, accessed 17 March 2019).
25. Waldron I. Sex differences in infant and early childhood mortality: major causes of death and possible biological causes, Too young to die: genes or gender? New York: United Nations Department of Economic and Social Affairs, Population Division; 1998:64–83.
26. Wamani H, Åstrøm AN, Peterson S, Tumwine JK, Tylleskär T. Boys are more stunted than girls in sub-Saharan Africa: a meta-analysis of 16 demographic and health surveys. BMC Pediatr. 2007;7(1) (https://dx.doi.org/10.1186/1471-2431-7-17, accessed 17 March 2019).
27. Calu Costa J, Wehrmeister FC, Barros AJD, Victora CG. Gender bias in careseeking practices in 57 low- and middle-income countries. J Glob Health. 2017;7(1) (https://dx.doi.org/10.7189/jogh.07.010418, accessed 17 March 2019).
28. Common childhood infections and gender inequalities: a systematic review. Maternal, newborn and child health working paper. New York: United Nations Children’s Fund; 2015 (https://www.unicef.org/health/files/Systematic_review_of_childhood_infections_and_gender_FINAL.pdf, accessed 17 March 2019).
29. Khera R, Jain S, Lodha R, Ramakrishnan S. Gender bias in child care and child health: global patterns. Arch Dis Child. 2013;99(4):369–74 (https://dx.doi.org/10.1136/archdischild-2013-303889, accessed 17 March 2019).
30. WHO. Global Health Observatory (GHO) data: Health equity assessment toolkit. Geneva: World Health Organization (https://www.who.int/gho/health_equity/assessment_toolkit/en/, accessed 22 April 2019).
31. Alkema L, Chao F, You D, Pedersen J, Sawyer CC. National, regional, and global sex ratios of infant, child, and under-5 mortality and identification of countries with outlying ratios: a systematic assessment. Lancet Glob Health. 2014;2(9):e521–e30 (https://dx.doi.org/10.1016/s2214-109x(14)70280-3, accessed 17 March 2019).
32. Costa JC, da Silva ICM, Victora CG. Gender bias in under-five mortality in low/middle-income countries. BMJ Glob Health. 2017;2(2):e000350 (https://dx.doi.org/10.1136/bmjgh-2017-000350, accessed 17 March 2019).
33. Iqbal N, Gkiouleka A, Milner A, Montag D, Gallo V. Girls’ hidden penalty: analysis of gender inequality in child mortality with data from 195 countries. BMJ Glob Health. 2018;3(5):e001028 (https://dx.doi.org/10.1136/bmjgh-2018-001028, accessed 17 March 2019).
63MONITORING HEALTH FOR THE SDGs
REFERENCES
34. Pradhan E, Pearson E, Puri M, Maharjan M, Maharjan DC, Shah I. Determinants of imbalanced sex ratio at birth in Nepal: evidence from secondary analysis of a large hospital-based study and nationally-representative survey data. BMJ Open. 2019;9(1):e023021 (https://dx.doi.org/10.1136/bmjopen-2018-023021, accessed 17 March 2019).
35. Preventing gender-biased sex selection: an interagency statement OHCHR, UNFPA, UNICEF, UN Women and WHO. Geneva: World Health Organization; 2011 (https://apps.who.int/iris/bitstream/handle/10665/44577/9789241501460_eng.pdf, accessed 24 April 2019).
36. Miles to go closing gaps breaking barriers righting injustices: global AIDS update. Geneva: Joint United Nations Programme on HIV/AIDS; 2018 (https://www.unaids.org/en/resources/documents/2018/global-aids-update, accessed 17 March 2019).
37. DeBeck K, Cheng T, Montaner JS, Beyrer C, Elliott R, Sherman S et al. HIV and the criminalisation of drug use among people who inject drugs: a systematic review. Lancet HIV. 2017;4(8):e357–e74 (https://dx.doi.org/10.1016/s2352-3018(17)30073-5, accessed 17 March 2019).
38. Decker MR, Pearson E, Illangasekare SL, Clark E, Sherman SG. Violence against women in sex work and HIV risk implications differ qualitatively by perpetrator. BMC Pub Health. 2013;13(1) (https://dx.doi.org/10.1186/1471-2458-13-876, accessed 17 March 2019).
39. Deering KN, Amin A, Shoveller J, Nesbitt A, Garcia-Moreno C, Duff P et al. A systematic review of the correlates of violence against sex workers. Am J Public Health. 2014;104(5):e42–e54 (https://dx.doi.org/10.2105/ajph.2014.301909, accessed 17 March 2019).
40. Hladik W, Barker J, Ssenkusu JM, Opio A, Tappero JW, Hakim A et al. HIV infection among men who have sex with men in Kampala, Uganda – a respondent driven sampling survey. PLoS ONE. 2012;7(5):e38143 (https://dx.doi.org/10.1371/journal.pone.0038143, accessed 17 March 2019).
41. Schwartz SR, Nowak RG, Orazulike I, Keshinro B, Ake J, Kennedy S et al. The immediate effect of the Same-Sex Marriage Prohibition Act on stigma, discrimination, and engagement on HIV prevention and treatment services in men who have sex with men in Nigeria: analysis of prospective data from the TRUST cohort. Lancet HIV. 2015;2(7):e299–e306 (https://dx.doi.org/10.1016/s2352-3018(15)00078-8, accessed 17 March 2019).
42. Decker MR, Crago A-L, Chu SKH, Sherman SG, Seshu MS, Buthelezi K et al. Human rights violations against sex workers: burden and effect on HIV. Lancet. 2015;385(9963):186–99 (https://www.ncbi.nlm.nih.gov/pubmed/25059943, accessed 17 March 2019).
43. Dunkle KL, Decker MR. Gender-based violence and HIV: reviewing the evidence for links and causal pathways in the general population and high-risk groups. Am J Reprod Immunol. 2012;69:20–6 (https://dx.doi.org/10.1111/aji.12039, accessed 17 March 2019).
44. Dunkle KL, Jewkes RK, Brown HC, Gray GE, McIntryre JA, Harlow SD. Transactional sex among women in Soweto, South Africa: prevalence, risk factors and association with HIV infection. Soc Sci Med. 2004;59(8):1581–92 (https://dx.doi.org/10.1016/j.socscimed.2004.02.003, accessed 17 March 2019).
45. Garcia-Moreno C, Watts C. Violence against women: its importance for HIV/AIDS. AIDS. 2000;14:S253. (https://www.ncbi.nlm.nih.gov/pubmed/11086869, accessed 17 March 2019).
46. Jewkes R. Gender inequities must be addressed in HIV prevention. Science. 2010;329(5988):145–7 (https://dx.doi.org/10.1126/science.1193794, accessed 17 March 2019).
47. Maman S, Campbell J, Sweat MD, Gielen AC. The intersections of HIV and violence: directions for future research and interventions. Soc Sci Med. 2000;50(4):459–78 (https://dx.doi.org/10.1016/s0277-9536(99)00270-1, accessed 17 March 2019).
48. Dlamini-Simelane TTT, Moyer E. ‘Lost to follow up’: rethinking delayed and interrupted HIV treatment among married Swazi women. Health Policy Plan. 2017;(32.2):248–56 (https://dx.doi.org/10.1093/heapol/czw117, accessed 17 March 2019).
49. Gamarel KE, Nelson KM, Stephenson R, Santiago Rivera OJ, Chiaramonte D, Miller RL. Anticipated HIV stigma and delays in regular HIV testing behaviors among sexually-active young gay, bisexual, and other men who have sex with men and transgender women. AIDS and Behavior. 2017;22(2):522–30 (https://dx.doi.org/10.1007/s10461-017-2005-1, accessed 17 March 2019).
50. Merten S, Ntalasha H, Musheke M. Non-uptake of HIV testing in children at risk in two urban and rural settings in Zambia: a mixed-methods study. PLOS ONE. 2016;11(6):e0155510 (https://dx.doi.org/10.1371/journal.pone.0155510, accessed 17 March 2019).
51. Blind spot: addressing a blind spot in the response to HIV. Geneva: Joint United Nations Programme on HIV/AIDS; 2017 (https://www.unaids.org/en/resources/documents/2017/blind_spot, accessed 17 March 2019).
52. Amere GA, Nayak P, Salindri AD, Narayan KMV, Magee MJ. Contribution of smoking to tuberculosis incidence and mortality in high-tuberculosis-burden countries. Am J Epidemiol. 2018;187(9):1846–55 (https://dx.doi.org/10.1093/aje/kwy081, accessed 17 March 2019).
53. Narasimhan P, Wood J, MacIntyre CR, Mathai D. Risk factors for tuberculosis. J Pulm Med. 2013;2013:1–11 (https://dx.doi.org/10.1155/2013/828939, accessed 17 March 2019).
54. Global tuberculosis report 2018. Geneva: World Health Organization; 2018 (http://apps.who.int/iris/bitstream/handle/10665/274453/9789241565646-eng.pdf?ua=1, accessed 31 August 2019).
55. Dodd PJ, Looker C, Plumb ID, Bond V, Schaap A, Shanaube K et al. Age- and sex-specific social contact patterns and incidence of mycobacterium tuberculosis infection. Am J Epidemiol. 2015;183:156–66 (https://dx.doi.org/10.1093/aje/kwv160, accessed 17 March 2019).
56. Carnevale P, Frézil JL, Bosseno MF, Le Pont F, Lancien J. Etude de l’agressivité D’Anopheles gamiae A en fonction de l’âge et du sexe dessujets humains. Bull World Health Organ. 1978;56(1):147–54 (https://www.ncbi.nlm.nih.gov/pubmed/307444, accessed 17 March 2019).
57. Golenda CF, Gambel JM, Solberg VB, Wirtz RA, Burge R. Gender-related efficacy difference to an extended duration formulation of topical N,N-diethyl-m-toluamide (DEET). Am J Trop Med Hyg. 1999;60(4):654–7 (https://dx.doi.org/10.4269/ajtmh.1999.60.654, accessed 17 March 2019).
58. Brabin BJ. An analysis of malaria in pregnancy in Africa. Bull World Health Organ. 1983;61(6):1005–16 (https://www.ncbi.nlm.nih.gov/pubmed/6370484, accessed 17 March 2019).
59. Pryce J, Richardson M, Lengeler C. Insecticide-treated nets for preventing malaria. Cochrane Database Syst Rev. 2018;11 (https://dx.doi.org/10.1002/14651858.cd000363.pub3, accessed 17 March 2019).
60. Bhatt S, Weiss DJ, Cameron E, Bisanzio D, Mappin B, Dalrymple U et al. The effect of malaria control on Plasmodium falciparum in Africa between 2000 and 2015. Nature. 2015;526(7572):207–11 (https://dx.doi.org/10.1038/nature15535, accessed 17 March 2019).
61. The DHS Program malaria indicator surveys (MIS) [website]. United States Agency for International Development (USAID) (https://dhsprogram.com/What-We-Do/Survey-Types/MIS.cfm, accessed 22 April 2019).
62. Noor AM, Kirui VC, Brooker SJ, Snow RW. The use of insecticide treated nets by age: implications for universal coverage in Africa. BMC Pub Health. 2009;9(1) (https://dx.doi.org/10.1186/1471-2458-9-369, accessed 17 March 2019).
63. Coalson JE, Cohee LM, Buchwald AG, Nyambalo A, Kubale J, Seydel KB et al. Simulation models predict that school-age children are responsible for most human-to-mosquito Plasmodium falciparum transmission in southern Malawi. Malaria Journal. 2018;17(1)(https://dx.doi.org/10.1186/s12936-018-2295-4, accessed 17 March 2019).
64. Liu WC, Liu QY. Molecular mechanisms of gender disparity in hepatitis B virus-associated hepatocellular carcinoma. World J Gastroenterol. 2014;20(20):6252 (https://dx.doi.org/10.3748/wjg.v20.i20.6252, accessed 17 March 2019).
65. Rilkoff H, Tukahebwa EM, Fleming FM, Leslie J, Cole DC. Exploring gender dimensions of treatment programmes for neglected tropical diseases in Uganda. PLoS Negl Trop Dis. 2013;7(7):e2312 (https://dx.doi.org/10.1371/journal.pntd.0002312, accessed 17 March 2019).
66. Vouking MZ, Tamo VC, Tadenfok CN. Contribution and performance of female community-directed distributors in the treatment of onchocerciasis with ivermectin in Sub-Saharan Africa: a systematic review. Pan African Medical Journal. 2015;20(1) (https://www.panafrican-med-journal.com/content/article/20/188/full/#.WMFM2LhBq70, accessed 17 March 2019).
67. Wolff S, Puts DA. Sex differences: summarizing more than a century of scientific research. Arch Sex Behav. 2009;38(6):1070–2 (https://dx.doi.org/10.1007/s10508-009-9538-y, accessed 17 March 2019).
64 WORLD HEALTH STATISTICS 2019
68. Denny L, de Sanjose S, Mutebi M, Anderson BO, Kim J, Jeronimo J et al. Interventions to close the divide for women with breast and cervical cancer between low-income and middle-income countries and high-income countries. Lancet. 2017;389(10071):861–70 (https://www.ncbi.nlm.nih.gov/pubmed/27814963, accessed 22 April 2019).
69. Hitchman SC, Fong GT. Gender empowerment and female-to-male smoking prevalence ratios. Bull World Health Organ. 2011;89(3):195–202 (https://dx.doi.org/10.2471/blt.10.079905, accessed 17 March 2019).
70. Pompili M, Serafini G, Innamorati M, Dominici G, Ferracuti S, Kotzalidis GD et al. Suicidal behavior and alcohol abuse. Int J Environ Res Public Health. 2010;7(4):1392–431 (https://dx.doi.org/10.3390/ijerph7041392, accessed 17 March 2019).
71. Guthold R, Stevens GA, Riley LM, Bull FC. Worldwide trends in insufficient physical activity from 2001 to 2016: a pooled analysis of 358 population-based surveys with 1.9 million participants. Lancet Glob Health. 2018;6(10):e1077–e86 (https://dx.doi.org/10.1016/s2214-109x(18)30357-7, accessed 17 March 2019).
72. Physical activity [website]. Geneva: World Health Organization; 2018 (https://www.who.int/news-room/fact-sheets/detail/physical-activity, accessed 17 March 2019).
73. NCD Risk Factor Collaboration. Worldwide trends in body-mass index, underweight, overweight, and obesity from 1975 to 2016: a pooled analysis of 2416 population-based measurement studies in 128.9 million children, adolescents, and adults. Lancet. 2017;390(10113):2627–42 (https://www.ncbi.nlm.nih.gov/pubmed/29029897, accessed 22 April 2019).
74. Mehta LS, Beckie TM, DeVon HA, Grines CL, Krumholz HM, Johnson MN et al. Acute myocardial infarction in women: a scientific statement from the American Heart Association. Circulation. 2016;133(9):916–47 (https://www.ncbi.nlm.nih.gov/pubmed/26811316, accessed 22 April 2019).
75. Global study on homicide: gender-related killing of women and girls. Vienna: United Nations Office on Drugs and Crime; 2018 (https://www.unodc.org/documents/data-and-analysis/GSH2018/GSH18_Gender-related_killing_of_women_and_girls.pdf, accessed 17 March 2019).
76. Global and regional estimates of violence against women: prevalence and health effects of intimate partner violence and non-partner sexual violence. Geneva: World Health Organization; 2013 (https://apps.who.int/iris/bitstream/handle/10665/85239/9789241564625_eng.pdf, accessed 17 March 2019).
77. Child marriage: latest trends and future prospects. New York: United Nations Children’s Fund; 2018 (https://data.unicef.org/wp-content/uploads/2018/07/Child-Marriage-Data-Brief.pdf, accessed 5 April 2019).
78. Female genital mutilation (UNICEF Data) [website]. New York: United Nations Children’s Fund (UNICEF); 2018 (https://data.unicef.org/topic/child-protection/female-genital-mutilation/, accessed 5 April 2019).
79. Inspire: seven strategies for ending violence against children. Geneva: World Health Organization; 2016 (https://apps.who.int/iris/bitstream/handle/10665/207717/9789241565356-eng.pdf?sequence=1, accessed 17 March 2019).
80. Gender, climate change and health. Geneva: World Health Organization; 2014 (http://apps.who.int//iris/bitstream/10665/144781/1/9789241508186_eng.pdf?ua=1, accessed 5 April 2019).
81. Chemicals and gender. United Nations Development Programme; 2011 (https://www.undp.org/content/undp/en/home/librarypage/environment-energy/chemicals_management/chemicals-and-gender.html, accessed 17 March 2019).
82. Burning opportunity: clean household energy for health, sustainable development, and wellbeing of women and children. Geneva: World Health Organization; 2016 (http://www.who.int/iris/bitstream/10665/204717/1/9789241565233_eng.pdf?ua=1, accessed 17 March 2019).
83. WHO/UNICEF Joint Water Supply, Sanitation Monitoring Programme. Progress on drinking water and sanitation: 2014 Update. Geneva: World Health Organization; 2014. (http://apps.who.int/iris/bitstream/10665/112727/1/9789241507240_eng.pdf?ua=1, accessed 31 March 2019)
84. WHO, World Bank. Tracking universal health coverage: 2017 global monitoring report. Geneva: World Health Organization and the International Bank for Reconstruction and Development / The World Bank; 2017 (https://apps.who.int/iris/bitstream/handle/10665/259817/9789241513555-eng.pdf, accessed 22 April 2019).
85. Public spending on health: a closer look at global trends (WHO/HIS/HGF/HFWorkingPaper/18.3). Geneva: World Health Organization; 2018 (https://apps.who.int/iris/bitstream/handle/10665/276728/WHO-HIS-HGF-HF-WorkingPaper-18.3-eng.pdf?ua=1, accessed 22 March 2019).
86. Health workforce: data and statistics. Geneva: World Health Organization; 2018 (https://www.who.int/hrh/statistics/en/, accessed 22 March 2019).
87. Stenberg K, Hanssen O, Edejer TT-T, Bertram M, Brindley C, Meshreky A et al. Financing transformative health systems towards achievement of the health sustainable development goals: a model for projected resource needs in 67 low-income and middle-income countries. Lancet Global Health. 2017;5(9):e875–e87 (https://dx.doi.org/10.1016/s2214-109x(17)30263-2, accessed 22 March 2019).
88. International Labour Organization. Report for discussion at the tripartite meeting on improving employment and working conditions in health services. 2017 (https://www.ilo.org/sector/activities/sectoral-meetings/WCMS_548288/lang--en/index.htm, accessed 22 March 2019).
89. Langer A, Meleis A, Knaul FM, Atun R, Aran M, Arreola-Ornelas H et al. Women and health: the key for sustainable development. Lancet. 2015;386(9999):1165–210 (https://www.ncbi.nlm.nih.gov/pubmed/26051370, accessed 22 March 2019).
90. Magar V, Gerecke M, Dhillon I, Campbell J. Women’s contributions to sustainable development through work in health: using a gender lens to advance a transformative 2030 agenda. Health employment and economic growth: an evidence base. Geneva: World Health Organization; 2017 (https://www.who.int/hrh/resources/health_employment-and-economic-growth/en/, accessed 20 February 2019).
91. Boniol M, McIsaac M, Xu L, Wuliji T, Diallo K. Gender equity in the health workforce: analysis of 104 countries. Geneva: World Health Organization; 2019 (https://www.who.int/iris/handle/10665/311314, accessed 22 April 2019).
92. Ghebreyesus TA, Fisseha S. How gender parity improves global health. 2019 (https://www.project-syndicate.org/commentary/gender-parity-improves-global-health-by-tedros-adhanom-ghebreyesus-and-senait-fisseha-2019-03, accessed 22 March 2019).
93. Global Observatory on Health R&D [website]. Geneva: World Health Organization (https://www.who.int/research-observatory/en/, accessed 22 March 2019).
94. International health regulations (2005). Geneva: World Health Organization; 2016 (http://apps.who.int/iris/bitstream/10665/246107/1/9789241580496-eng.pdf?ua=1, accessed 22 March 2019).
95. OECD.Stat [online database]. Paris: Organisation for Economic Co-operation and Development (https://stats.oecd.org/, accessed 19 January 2019).
96. WHO Thirteenth general programme of work, 2019–2023. Geneva: World Health Organization; 2018 (https://apps.who.int/gb/ebwha/pdf_files/WHA71/A71_4-en.pdf?ua=1, accessed 24 April 2019).
97. Strategy for integrating gender analysis and actions into the work of WHO. Geneva: World Health Organization; 2007 (https://apps.who.int/iris/bitstream/handle/10665/69857/WHO_FCH_GWH_08.1_eng.pdf?sequence=1, accessed 24 April 2019).
98. Horton KC, MacPherson P, Houben RMGJ, White RG, Corbett EL. Sex differences in tuberculosis burden and notifications in low- and middle-income countries: a systematic review and meta-analysis. PLOS Med. 2016;13(9):e1002119 (https://www.ncbi.nlm.nih.gov/pubmed/27598345, accessed 14 May 2019).
65MONITORING HEALTH FOR THE SDGs

67MONITORING HEALTH FOR THE SDGs
ANNEX 1 Regional highlights of health-related SDG indicators
Explanatory notes
The statistics shown below represent official World Health Organization (WHO) statistics for selected health-related Sustainable Development Goal (SDG) indicators, based on evidence available in early 2019. They have been compiled primarily from publications and databases produced and maintained by WHO or by United Nations (UN) groups of which WHO is a member. Unless otherwise noted, all statistics presented here are available in Annex 2. Owing to limited space, indicators are often referred to here using SDG targets, along with a shorter indicator name (Annex 2 has the full indicator names and references).
Comparable estimates are subject to considerable uncertainty, especially for countries where the availability and quality of the underlying primary data are limited. Uncertainty intervals and other details on the indicators and statistics presented here can be found online at the WHO Global Health Observatory.1
1 The Global Health Observatory (GHO) is WHO’s portal providing access to data and analyses for monitoring the global health situation (available at https://www.who.int/gho/en/, accessed 28 March 2019).
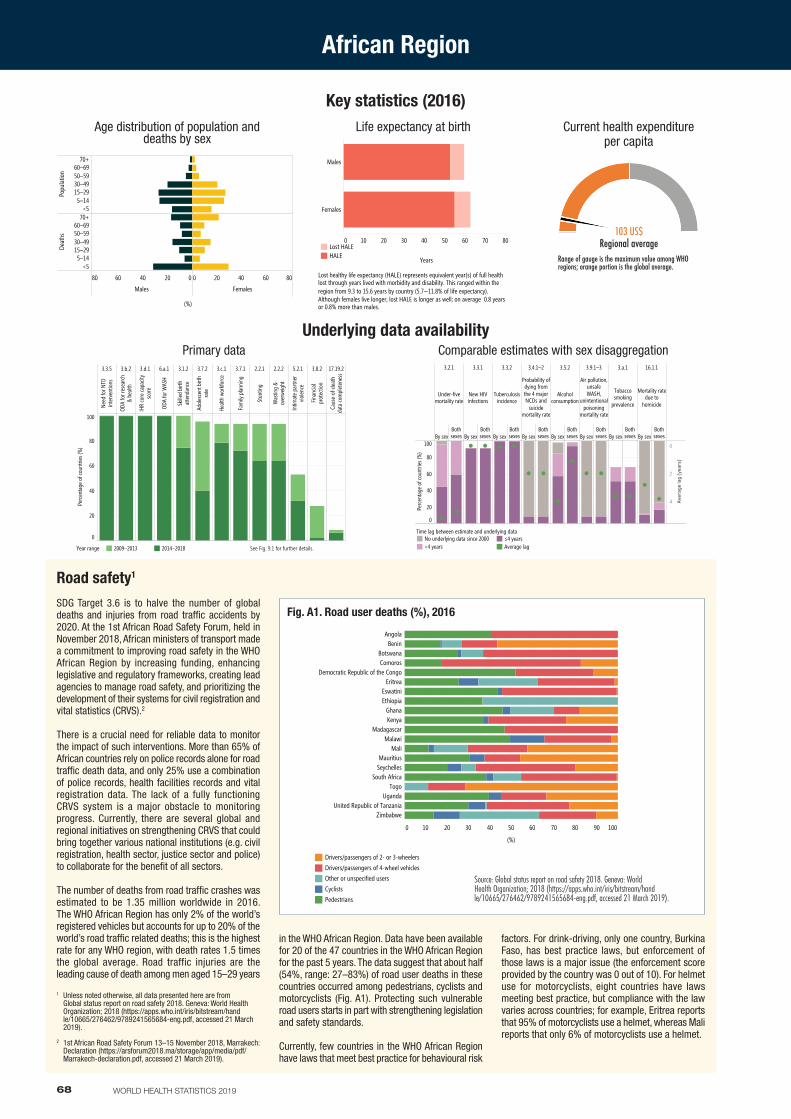
SDG Target 3.6 is to halve the number of global deaths and injuries from road traffic accidents by 2020. At the 1st African Road Safety Forum, held in November 2018, African ministers of transport made a commitment to improving road safety in the WHO African Region by increasing funding, enhancing legislative and regulatory frameworks, creating lead agencies to manage road safety, and prioritizing the development of their systems for civil registration and vital statistics (CRVS).2
There is a crucial need for reliable data to monitor the impact of such interventions. More than 65% of African countries rely on police records alone for road traffic death data, and only 25% use a combination of police records, health facilities records and vital registration data. The lack of a fully functioning CRVS system is a major obstacle to monitoring progress. Currently, there are several global and regional initiatives on strengthening CRVS that could bring together various national institutions (e.g. civil registration, health sector, justice sector and police) to collaborate for the benefit of all sectors.
The number of deaths from road traffic crashes was estimated to be 1.35 million worldwide in 2016. The WHO African Region has only 2% of the world’s registered vehicles but accounts for up to 20% of the world’s road traffic related deaths; this is the highest rate for any WHO region, with death rates 1.5 times the global average. Road traffic injuries are the leading cause of death among men aged 15–29 years
Road safety1
in the WHO African Region. Data have been available for 20 of the 47 countries in the WHO African Region for the past 5 years. The data suggest that about half (54%, range: 27–83%) of road user deaths in these countries occurred among pedestrians, cyclists and motorcyclists (Fig. A1). Protecting such vulnerable road users starts in part with strengthening legislation and safety standards.
Currently, few countries in the WHO African Region have laws that meet best practice for behavioural risk
factors. For drink-driving, only one country, Burkina Faso, has best practice laws, but enforcement of those laws is a major issue (the enforcement score provided by the country was 0 out of 10). For helmet use for motorcyclists, eight countries have laws meeting best practice, but compliance with the law varies across countries; for example, Eritrea reports that 95% of motorcyclists use a helmet, whereas Mali reports that only 6% of motorcyclists use a helmet.
68 WORLD HEALTH STATISTICS 2019
African Region
3.2.1
Under-fivemortality rate
By sexBothsexes
3.3.1
New HIVinfections
By sexBothsexes
3.3.2
Tuberculosisincidence
By sexBothsexes
3.4.1–2
Probability ofdying fromthe 4 majorNCDs and
suicidemortality rate
By sexBothsexes
3.5.2
Alcoholconsumption
By sexBothsexes
3.9.1–3
Air pollution,unsafeWASH,
unintentionalpoisoning
mortality rate
By sexBothsexes
3.a.1
Tobaccosmoking
prevalence
By sexBothsexes
16.1.1
Mortality ratedue to
homicide
By sexBothsexes
0
20
40
60
80
100
Perc
enta
ge o
f cou
ntrie
s (%
)
0
2
4 Aver
age
lag
(yea
rs)
Time lag between estimate and underlying dataNo underlying data since 2000>4 years
≤4 yearsAverage lag
Comparable estimates with sex disaggregation
Age distribution of population and deaths by sex
020406080
Males
0 20 40 60 80
Females
Popu
latio
n
70+60–6950–5930–4915–295–14
<5
Deat
hs
70+60–6950–5930–4915–295–14
<5
Age distribution of population and deaths by sex
(%)
Current health expenditure per capita
Underlying data availability
Key statistics (2016)
103 US$Regional average
Range of gauge is the maximum value among WHO regions; orange portion is the global average.
Life expectancy at birth
0 10 20 30 40 50 60 70 80
Years
Males
Females
Life expectancy at birth
Lost healthy life expectancy (HALE) represents equivalent year(s) of full healthlost through years lived with morbidity and disability. This ranged within theregion from 9.3 to 15.6 years by country (5.7–11.8% of life expectancy).Although females live longer, lost HALE is longer as well; on average 0.8 yearsor 0.8% more than males.
Lost HALEHALE
0 10 20 30 40 50 60 70 80 90 100
(%)
AngolaBenin
BotswanaComoros
Democratic Republic of the CongoEritrea
EswatiniEthiopia
GhanaKenya
MadagascarMalawi
MaliMauritius
SeychellesSouth Africa
TogoUganda
United Republic of TanzaniaZimbabwe
Drivers/passengers of 2- or 3-wheelersDrivers/passengers of 4-wheel vehiclesOther or unspecified usersCyclistsPedestrians
Fig. A1. Road user deaths (%), 2016
Source: Global status report on road safety 2018. Geneva: World Health Organization; 2018 (https://apps.who.int/iris/bitstream/handle/10665/276462/9789241565684-eng.pdf, accessed 21 March 2019).
1 Unless noted otherwise, all data presented here are from Global status report on road safety 2018. Geneva: World Health Organization; 2018 (https://apps.who.int/iris/bitstream/handle/10665/276462/9789241565684-eng.pdf, accessed 21 March 2019).
2 1st African Road Safety Forum 13–15 November 2018, Marrakech: Declaration (https://arsforum2018.ma/storage/app/media/pdf/Marrakech-declaration.pdf, accessed 21 March 2019).
3.3.5
Need
for N
TDin
terv
entio
ns
3.b.2
ODA
for r
esea
rch
& he
alth
3.d.1
IHR
core
capa
city
scor
e
6.a.1
ODA
for W
ASH
3.1.2
Skille
d bi
rthat
tend
ance
3.7.2
Adol
esce
nt b
irth
rate
3.c.1
Healt
h wo
rkfo
rce
3.7.1
Fam
ily p
lanni
ng
2.2.1
Stun
ting
2.2.2
Was
ting
&ov
erwe
ight
5.2.1
Intim
ate
partn
ervio
lence
3.8.2
Finan
cial
prot
ectio
n
17.19.2
Caus
e-of
-dea
thda
ta co
mpl
eten
ess
0
20
40
60
80
100
Perc
enta
ge o
f cou
ntrie
s (%
)
See Figure 9.1 for further details.Year range 2009–2013 2014–2018
Primary data
See Fig. 9.1 for further details.
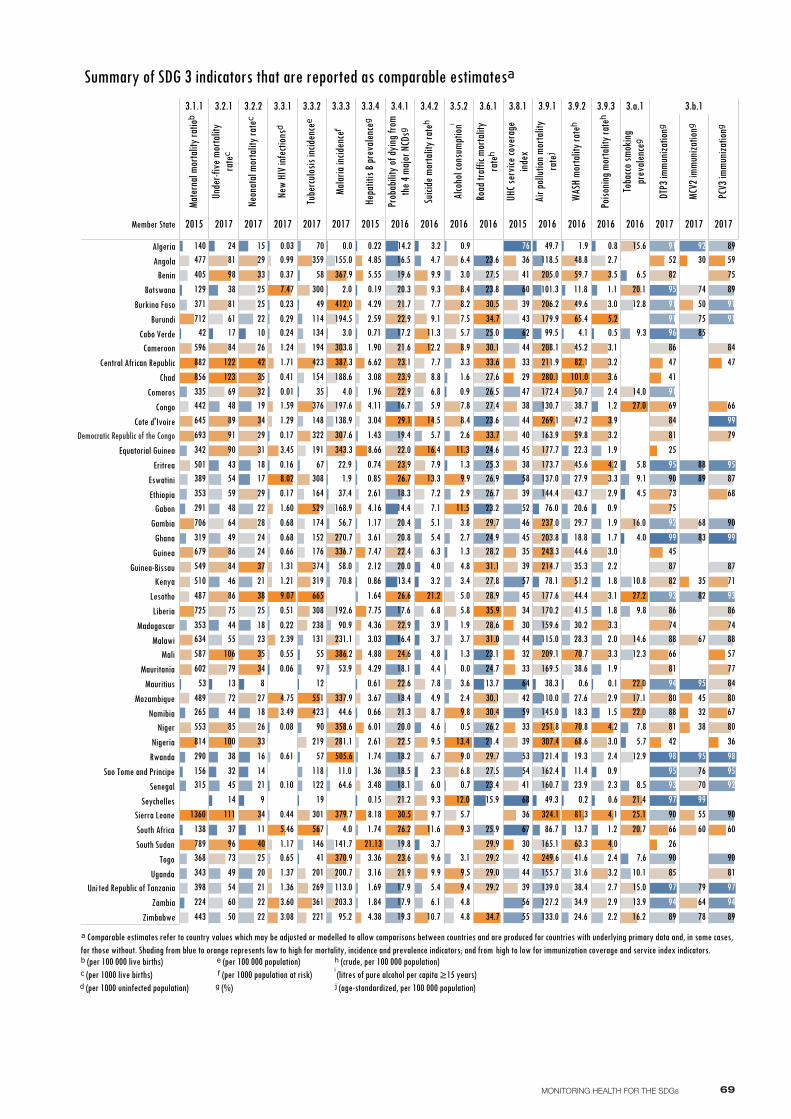
69MONITORING HEALTH FOR THE SDGs
Member State
3.1.1
Mate
rnal
morta
lity r
atioᵇ
2015
3.2.1
Unde
r-five
mor
talit
yra
teᶜ
2017
3.2.2
Neon
atal
morta
lity r
ateᶜ
2017
3.3.1
New
HIV i
nfec
tionsᵈ
2017
3.3.2
Tube
rculos
is inc
idenc
eᵉ
2017
3.3.3
Malar
ia inc
idenc
eᶠ
2017
3.3.4
Hepa
titis
B pre
valen
ceᵍ
2015
3.4.1
Prob
abilit
y of d
ying f
rom
the 4
majo
r NCD
sᵍ
2016
3.4.2
Suici
de m
orta
lity r
ateʰ
2016
3.5.2
Alco
hol c
onsu
mptio
nⁱ
2016
3.6.1
Road
traf
fic m
orta
lity
rateʰ
2016
3.8.1
UHC s
ervic
e cov
erag
eind
ex
2015
3.9.1
Air p
ollut
ion m
orta
lity
rateʲ
2016
3.9.2
WASH
mor
talit
y rat
eʰ
2016
3.9.3
Poiso
ning m
orta
lity r
ateʰ
2016
3.a.1
Toba
cco sm
oking
prev
alenc
eᵍ
2016
3.b.1
DTP3
immu
nizat
ionᵍ
2017
MCV2
immu
nizat
ionᵍ
2017
PCV3
immu
nizat
ionᵍ
2017
AlgeriaAngola
BeninBotswana
Burkina FasoBurundi
Cabo VerdeCameroon
Central African RepublicChad
ComorosCongo
Cote d'IvoireDemocratic Republic of the C..
Equatorial GuineaEritrea
EswatiniEthiopia
GabonGambia
GhanaGuinea
Guinea-BissauKenya
LesothoLiberia
MadagascarMalawi
MaliMauritania
MauritiusMozambique
NamibiaNiger
NigeriaRwanda
Sao Tome and PrincipeSenegal
SeychellesSierra LeoneSouth AfricaSouth Sudan
TogoUganda
Uni ted Republic of TanzaniaZambia
Zimbabwe
882856
814
789
725
712
706
693
679
645
634
602
596
587
553
549
53
510
501
489
487
477
443
442
42
405
398
389
371
368
353
353
343
342
335
319
315
291
290
265
224
156
140
1381360
12998
96
9190
89
86
86
85
84
84
81
81
79
75
73
72
69
64
61
60
59
55
54
54
50
49
49
48
48
46
45
44
44
43
38
38
37
32
24
17
14
13
123122
111
106
100
9
8
42
40
38
37
35
35
34
34
34
33
33
32
31
29
29
29
28
27
26
26
25
25
2525
2424
23
2222
22
22
21
21
21
20
19
18
18
1817
16
15
14
11
10
9.07
8.02
7.47
5.46
4.75
3.60
3.49
3.45
3.08
2.39
1.71
1.60
1.59
1.371.36
1.31
1.29
1.24
1.21
1.17
0.99
0.680.68
0.66
0.65
0.61
0.55
0.51
0.44
0.41
0.37
0.290.24
0.23
0.22
0.17
0.17
0.16
0.10
0.08
0.06
0.03
0.01
97
90
70
67
665
58
57
567
551
55
529
49
423
423
41
376
374
361
359
35
322
319
308
308
301
300
269
238
221
219
201
194
191
19
176
174
164
154
152
148
146
134
131
122
12
118
114
95.2
90.9
70.8
64.6
58.0
56.7
53.9
505.6
44.6
412.0
4.0
4.0
387.3
386.2
379.7
370.9
37.4
367.9
358.6
343.3
337.9
336.7
307.6
303.83.0
281.1
270.7
231.1
22.9
203.3
200.7
2.0
197.6
194.5
192.6
188.6
168.9
155.0
141.7
138.9
113.0
11.0
1.9
0.0
8.66
8.18
7.75
7.47
6.62
6.01
5.55
4.88
4.85
4.38
4.36
4.29
4.29
4.16
4.11
3.67
3.61
3.48
3.363.16
3.08
3.04
3.03
21.13
2.61
2.61
2.59
2.12
1.96
1.90
1.84
1.74
1.74
1.69
1.64
1.43
1.36
1.17
0.86
0.850.74
0.71
0.66
0.61
0.22
0.19
0.1530.5
29.1
26.7
26.6
26.2
24.6
23.9
23.9
23.6
23.1
22.9
22.9
22.9
22.6
22.5
22.4
22.0
21.9
21.7
21.6
21.3
21.2
20.820.4
20.3
20.0
20.0
19.8
19.6
19.4
19.3
18.5
18.4
18.3
18.2
18.1
18.1
17.917.9
17.6
17.2
16.7
16.5
16.4
14.4
14.2
13.4
9.9
9.9
9.7
9.6
9.5
9.3
9.3
9.1
8.8
8.7
7.9
7.8
7.7
7.7
7.27.1
6.8
6.8
6.7
6.3
6.1
6.0
5.9
5.7
5.4
5.45.1
4.9
4.8
4.7
4.6
4.4
4.0
3.9
3.7
3.7
3.2
3.2
21.2
2.3
16.4
14.5
13.3
12.2
11.6
11.3
10.7
9.9
9.8
9.59.4
9.3
9.0
8.9
8.4
8.48.2
7.8
7.5
6.8
6.4
5.8
5.7
5.7
5.0
4.84.8
4.8
3.8
3.7
3.6
3.4
3.3
3.1
3.0
2.9
2.7
2.6
2.4
13.4
12.0
11.5
11.3
1.9
1.6
1.3
1.3
1.3
0.9
0.9
0.7
0.5
0.0
35.9
34.7
34.7
33.7
33.6
31.1
31.0
30.5
30.430.1
30.1
29.9
29.7
29.7
29.2
29.229.0
28.9
28.6
28.2
27.8
27.6
27.5
27.5
27.4
26.926.7
26.5
26.2
25.9
25.3
25.0
24.9
24.7
24.6
23.8
23.6
23.6
23.4
23.2
23.1
21.4
15.9
13.7
68
67
64
62
60
59
58
57
5655
5453
52
47
46
45
45
45
44
44
44
44
43
42
42
41
41
40
39
39
39
39
39
38
38
36
36
35
34
33
33
33
32
30
30
29
76
99.5
86.7
78.1
76.0
49.7
49.3
38.3
324.1
307.4
280.1
269.1
251.8
249.6
243.3
237.0
214.7
211.9
209.1
208.1
206.2
205.0
203.8
179.9
177.7
177.6
173.7
172.4
170.2
169.5
165.1
163.9
162.4160.7
159.6
155.7
145.0
144.4
139.0
137.0
133.0
130.7
127.2
121.4
118.5
115.0
110.0
101.3
82.1
81.3
70.8
70.7
68.6
65.4
63.3
59.8
59.7
51.2
50.7
49.6
48.8
47.2
45.6
45.2
44.6
44.4
43.7
41.6
41.5
4.1
38.7
38.6
38.4
35.3
34.9
31.6
30.2
29.7
28.3
27.9
27.6
24.6
23.9
22.3
20.6
19.3
18.8
18.3
13.7
11.8
11.4
101.0
1.9
0.6
0.2
5.2
4.2
4.2
4.1
4.0
3.9
3.6
3.5
3.3
3.3
3.3
3.2
3.2
3.2
3.1
3.1
3.0
3.0
3.0
2.9
2.9
2.9
2.7
2.7
2.4
2.4
2.4
2.3
2.2
2.2
2.0
1.9
1.9
1.9
1.8
1.8
1.7
1.5
1.2
1.2
1.1
0.9
0.9
0.8
0.6
0.5
0.1
9.8
9.3
9.1
8.5
7.8
7.6
6.5
5.8
5.7
4.5
4.0
27.2
27.0
25.1
22.0
22.0
21.4
20.7
20.1
17.1
16.2
16.0
15.6
15.0
14.6
14.0
13.9
12.9
12.8
12.3
10.8
10.190
90
90
89
88
88
87
86
86
85
84
82
82
81
81
81
80
75
74
73
69
66
66
52
47
45
42
41
26
25
99
98
97
97
96
95
95
95
94
94
93
93
92
91
9191
91
8988
85
83
82
79
78
76
75
74
70
68
67
64
6055
50
45
38
35
32
30
99
95
95
92
90
90
90
89
89
89
88
87
87
86
84
84
81
80
80
79
77
75
74
71
68
67
66
60
59
57
47
36
99
99
98
97
95
95
94
93
92
9191
Summary of SDG 3 indicators that are reported as comparable estimatesᵃ
ᵃ Comparable estimates refer to country values which may be adjusted or modelled to allow comparisons between countries and are produced for countries with underlying primary data and, in some cases,for those without. Shading from blue to orange represents low to high for mortality, incidence and prevalence indicators; and from high to low for immunization coverage and service index indicators.ᵇ (per 100 000 live births) ᵉ (per 100 000 population) ʰ (crude, per 100 000 population)ᶜ (per 1000 live births) ᶠ (per 1000 population at risk) i (litres of pure alcohol per capita ≥15 years)ᵈ (per 1000 uninfected population) ᵍ (%) ʲ (age-standardized, per 100 000 population)
Democratic Republic of the Congo
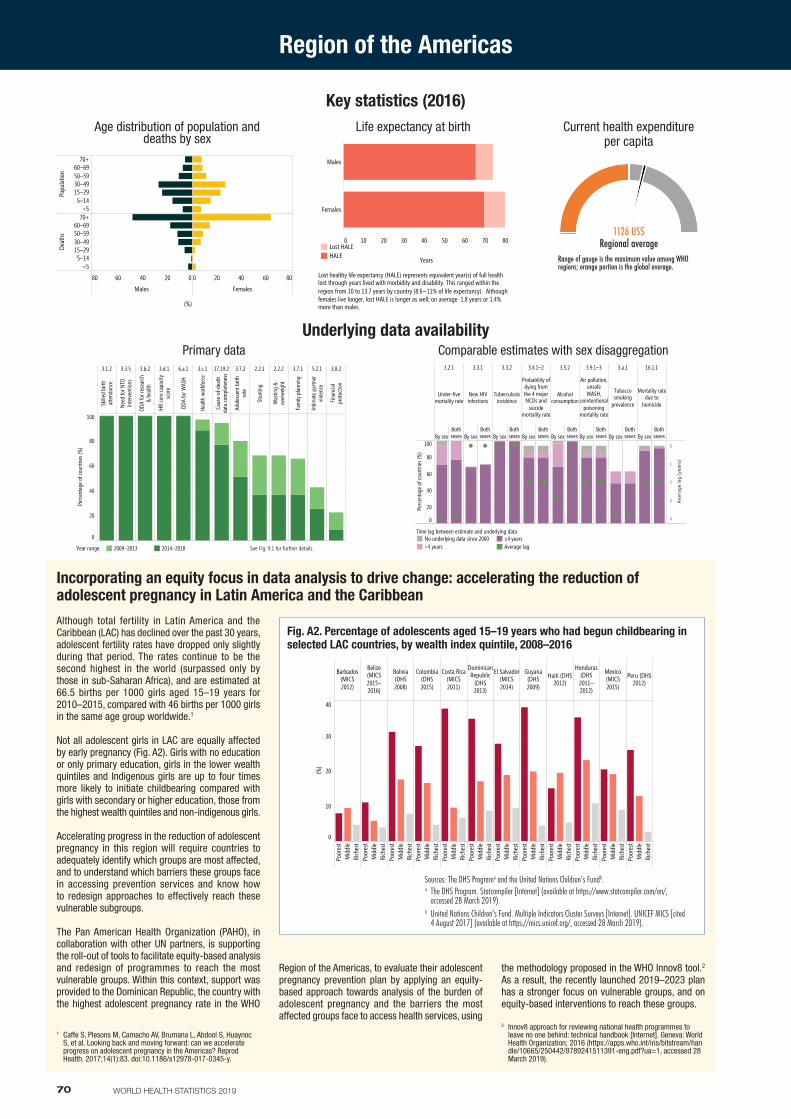
Although total fertility in Latin America and the Caribbean (LAC) has declined over the past 30 years, adolescent fertility rates have dropped only slightly during that period. The rates continue to be the second highest in the world (surpassed only by those in sub-Saharan Africa), and are estimated at 66.5 births per 1000 girls aged 15–19 years for 2010–2015, compared with 46 births per 1000 girls in the same age group worldwide.1
Not all adolescent girls in LAC are equally affected by early pregnancy (Fig. A2). Girls with no education or only primary education, girls in the lower wealth quintiles and Indigenous girls are up to four times more likely to initiate childbearing compared with girls with secondary or higher education, those from the highest wealth quintiles and non-indigenous girls.
Accelerating progress in the reduction of adolescent pregnancy in this region will require countries to adequately identify which groups are most affected, and to understand which barriers these groups face in accessing prevention services and know how to redesign approaches to effectively reach these vulnerable subgroups.
The Pan American Health Organization (PAHO), in collaboration with other UN partners, is supporting the roll-out of tools to facilitate equity-based analysis and redesign of programmes to reach the most vulnerable groups. Within this context, support was provided to the Dominican Republic, the country with the highest adolescent pregnancy rate in the WHO
Incorporating an equity focus in data analysis to drive change: accelerating the reduction of adolescent pregnancy in Latin America and the Caribbean
Region of the Americas, to evaluate their adolescent pregnancy prevention plan by applying an equity-based approach towards analysis of the burden of adolescent pregnancy and the barriers the most affected groups face to access health services, using
the methodology proposed in the WHO Innov8 tool.2 As a result, the recently launched 2019–2023 plan has a stronger focus on vulnerable groups, and on equity-based interventions to reach these groups.
70 WORLD HEALTH STATISTICS 2019
Region of the Americas
Current health expenditure per capita
Key statistics (2016)
1126 US$Regional average
Range of gauge is the maximum value among WHO regions; orange portion is the global average.
Age distribution of population and deaths by sex
020406080
Males
0 20 40 60 80
Females
Popu
latio
n
70+60–6950–5930–4915–295–14
<5
Deat
hs
70+60–6950–5930–4915–295–14
<5
Age distribution of population and deaths by sex
(%)
Life expectancy at birth
0 10 20 30 40 50 60 70 80
Years
Males
Females
Life expectancy at birth
Lost healthy life expectancy (HALE) represents equivalent year(s) of full healthlost through years lived with morbidity and disability. This ranged within theregion from 10 to 13.7 years by country (8.6–11% of life expectancy). Althoughfemales live longer, lost HALE is longer as well; on average 1.8 years or 1.4%more than males.
Lost HALEHALE
1 Caffe S, Plesons M, Camacho AV, Brumana L, Abdool S, Huaynoc S, et al. Looking back and moving forward: can we accelerate progress on adolescent pregnancy in the Americas? Reprod Health. 2017;14(1):83. doi:10.1186/s12978-017-0345-y.
Barbados(MICS2012)
Belize(MICS2015–2016)
Bolivia(DHS2008)
Colombia(DHS2015)
Costa Rica(MICS2011)
DominicanRepublic
(DHS2013)
El Salvador(MICS2014)
Guyana(DHS2009)
Haiti (DHS2012)
Honduras(DHS2011–2012)
Mexico(MICS2015)
Peru (DHS2012)
Poor
est
Mid
dle
Rich
est
Poor
est
Mid
dle
Rich
est
Poor
est
Mid
dle
Rich
est
Poor
est
Mid
dle
Rich
est
Poor
est
Mid
dle
Rich
est
Poor
est
Mid
dle
Rich
est
Poor
est
Mid
dle
Rich
est
Poor
est
Mid
dle
Rich
est
Poor
est
Mid
dle
Rich
est
Poor
est
Mid
dle
Rich
est
Poor
est
Mid
dle
Rich
est
Poor
est
Mid
dle
Rich
est
0
10
20
30
40
(%)
Fig. A2. Percentage of adolescents aged 15–19 years who had begun childbearing in selected LAC countries, by wealth index quintile, 2008–2016
Sources: The DHS Programa and the United Nations Children’s Fundb. a The DHS Program. Statcompiler [Internet] (available at https://www.statcompiler.com/en/,
accessed 28 March 2019).b United Nations Children’s Fund. Multiple Indicators Cluster Surveys [Internet]. UNICEF MICS [cited
4 August 2017] (available at https://mics.unicef.org/, accessed 28 March 2019).
2 Innov8 approach for reviewing national health programmes to leave no one behind: technical handbook [Internet]. Geneva: World Health Organization; 2016 (https://apps.who.int/iris/bitstream/handle/10665/250442/9789241511391-eng.pdf?ua=1, accessed 28 March 2019).
3.2.1
Under-fivemortality rate
By sexBothsexes
3.3.1
New HIVinfections
By sexBothsexes
3.3.2
Tuberculosisincidence
By sexBothsexes
3.4.1–2
Probability ofdying fromthe 4 majorNCDs and
suicidemortality rate
By sexBothsexes
3.5.2
Alcoholconsumption
By sexBothsexes
3.9.1–3
Air pollution,unsafeWASH,
unintentionalpoisoning
mortality rate
By sexBothsexes
3.a.1
Tobaccosmoking
prevalence
By sexBothsexes
16.1.1
Mortality ratedue to
homicide
By sexBothsexes
0
20
40
60
80
100
Perc
enta
ge o
f cou
ntrie
s (%
)
0
1
2
3
4
Aver
age
lag
(yea
rs)
Time lag between estimate and underlying dataNo underlying data since 2000>4 years
≤4 yearsAverage lag
Comparable estimates with sex disaggregationUnderlying data availability
3.1.2
Skille
d bi
rthat
tend
ance
3.3.5
Need
for N
TDin
terv
entio
ns
3.b.2
ODA
for r
esea
rch
& he
alth
3.d.1
IHR
core
capa
city
scor
e
6.a.1
ODA
for W
ASH
3.c.1
Healt
h wo
rkfo
rce
17.19.2
Caus
e-of
-dea
thda
ta co
mpl
eten
ess
3.7.2
Adol
esce
nt b
irth
rate
2.2.1
Stun
ting
2.2.2
Was
ting
&ov
erwe
ight
3.7.1
Fam
ily p
lanni
ng
5.2.1
Intim
ate
partn
ervio
lence
3.8.2
Finan
cial
prot
ectio
n
0
20
40
60
80
100
Perc
enta
ge o
f cou
ntrie
s (%
)
See Figure 9.1 for further details.Year range 2009–2013 2014–2018
Primary data
See Fig. 9.1 for further details.
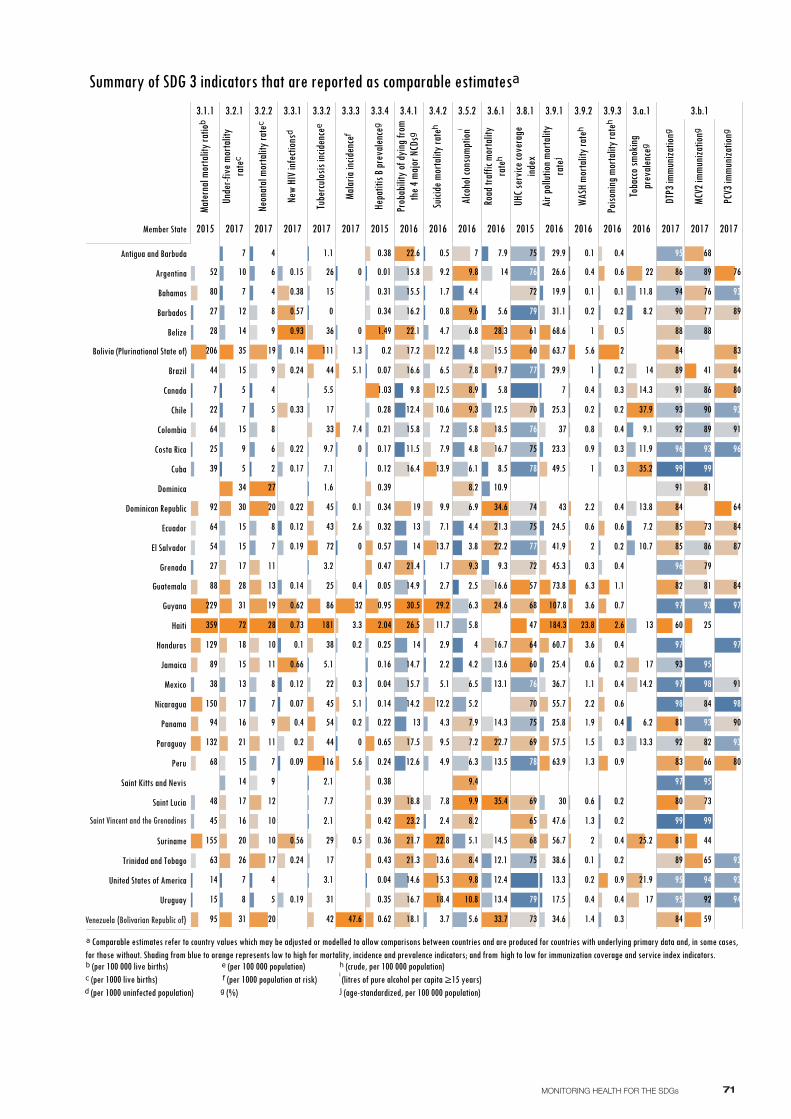
71MONITORING HEALTH FOR THE SDGs
Member State
3.1.1
Mate
rnal
morta
lity r
atioᵇ
2015
3.2.1
Unde
r-five
mor
talit
yra
teᶜ
2017
3.2.2
Neon
atal
morta
lity r
ateᶜ
2017
3.3.1
New
HIV i
nfec
tionsᵈ
2017
3.3.2
Tube
rculos
is inc
idenc
eᵉ
2017
3.3.3
Malar
ia inc
idenc
eᶠ
2017
3.3.4
Hepa
titis
B pre
valen
ceᵍ
2015
3.4.1
Prob
abilit
y of d
ying f
rom
the 4
majo
r NCD
sᵍ
2016
3.4.2
Suici
de m
orta
lity r
ateʰ
2016
3.5.2
Alco
hol c
onsu
mptio
nⁱ
2016
3.6.1
Road
traf
fic m
orta
lity
rateʰ
2016
3.8.1
UHC s
ervic
e cov
erag
eind
ex
2015
3.9.1
Air p
ollut
ion m
orta
lity
rateʲ
2016
3.9.2
WASH
mor
talit
y rat
eʰ
2016
3.9.3
Poiso
ning m
orta
lity r
ateʰ
2016
3.a.1
Toba
cco sm
oking
prev
alenc
eᵍ
2016
3.b.1
DTP3
immu
nizat
ionᵍ
2017
MCV2
immu
nizat
ionᵍ
2017
PCV3
immu
nizat
ionᵍ
2017
Antigua and Barbuda
Argentina
Bahamas
Barbados
Belize
Bolivia (Plurinational State of)
Brazil
Canada
Chile
Colombia
Costa Rica
Cuba
Dominica
Dominican Republic
Ecuador
El Salvador
Grenada
Guatemala
Guyana
Haiti
Honduras
Jamaica
Mexico
Nicaragua
Panama
Paraguay
Peru
Saint Kitts and Nevis
Saint Lucia
Saint Vincent and the Grenadin..
Suriname
Trinidad and Tobago
United States of America
Uruguay
Venezuela (Bolivarian Republic..
359
229
206
155
150
132
129
95
94
92
89
88
80
68
64
64
63
54
52
48
45
44
39
38
28
27
27
25
22
15
14
7
72
35
34
31
31
30
28
26
21
20
18
17
17
17
16
16
15
15
15
15
15
15
14
14
13
12
10
9
8
7
7
7
7
5
5
28
27
20
20
19
19
17
13
12
11
11
11
10
10
10
9
9
9
9
8
8
8
8
7
7
7
6
6
5
5
4
4
4
4
2
0.93
0.73
0.66
0.62
0.57
0.56
0.4
0.38
0.33
0.24
0.24
0.22
0.22
0.2
0.19
0.19
0.17
0.15
0.14
0.14
0.12
0.12
0.1
0.09
0.07
181
116
111
86
72
54
45
45
44
44
43
42
38
36
33
31
29
26
25
22
17
17
15
9.7
7.7
7.1
5.5
5.1
3.2
3.1
2.1
2.1
1.6
1.1
0
47.6
32
7.4
5.6
5.1
5.1
3.3
2.6
1.3
0.5
0.4
0.3
0.2
0.2
0.1
0
0
0
0
0
2.04
1.49
1.03
0.95
0.65
0.62
0.57
0.47
0.43
0.42
0.39
0.39
0.38
0.38
0.36
0.35
0.34
0.34
0.32
0.31
0.28
0.25
0.24
0.22
0.21
0.2
0.17
0.16
0.14
0.12
0.07
0.05
0.04
0.04
0.01
30.5
26.5
23.2
22.6
22.1
21.7
21.4
21.3
19
18.8
18.1
17.5
17.2
16.7
16.6
16.4
16.2
15.8
15.8
15.7
15.5
14.9
14.7
14.6
14.2
14
14
13
13
12.6
12.4
11.5
9.8
29.2
22.8
18.4
15.3
13.9
13.7
13.6
12.5
12.2
12.2
11.7
10.6
9.9
9.5
9.2
7.9
7.8
7.2
7.1
6.5
5.1
4.9
4.7
4.3
3.7
2.9
2.7
2.4
2.2
1.7
1.7
0.8
0.5
10.8
9.9
9.8
9.8
9.6
9.4
9.3
9.3
8.9
8.4
8.2
8.2
7.9
7.8
7.2
7
6.9
6.8
6.5
6.3
6.3
6.1
5.8
5.8
5.6
5.2
5.1
4.8
4.8
4.4
4.4
4.2
4
3.8
2.5
35.4
34.6
33.7
28.3
24.6
22.7
22.2
21.3
19.7
18.5
16.7
16.7
16.6
15.5
14.5
14.3
14
13.6
13.5
13.4
13.1
12.5
12.4
12.1
10.9
9.3
8.5
7.9
5.8
5.6
75
75
75
75
75
74
73
72
72
70
70
69
69
68
68
65
64
61
60
60
57
47
79
79
78
78
77
77
76
76
76
184.3
107.8
73.8
68.6
63.9
63.7
60.7
57.5
56.7
55.7
49.5
47.6
45.3
43
41.9
38.6
37
36.7
34.6
31.1
30
29.9
29.9
26.6
25.8
25.4
25.3
24.5
23.3
19.9
17.5
13.3
7
23.8
6.3
5.6
3.6
3.6
2.2
2.2
2
2
1.9
1.5
1.4
1.3
1.3
1.1
1
1
1
0.9
0.8
0.6
0.6
0.6
0.4
0.4
0.4
0.3
0.2
0.2
0.2
0.1
0.1
0.1
2.6
2
1.1
0.9
0.9
0.7
0.6
0.6
0.6
0.5
0.4
0.4
0.4
0.4
0.4
0.4
0.4
0.4
0.4
0.3
0.3
0.3
0.3
0.3
0.2
0.2
0.2
0.2
0.2
0.2
0.2
0.2
0.1
37.9
35.2
25.2
22
21.9
17
17
14.3
14.2
14
13.8
13.3
13
11.9
11.8
10.7
9.1
8.2
7.2
6.2
94
93
93
92
92
91
91
90
89
89
88
86
85
85
84
84
84
83
82
81
81
80
60
99
99
98
97
97
97
97
96
96
95
95
95
92
90
89
89
88
86
86
84
82
81
81
79
77
76
73
73
68
66
65
59
44
41
25
99
99
98
95
95
94
93
93
93
91
91
90
89
87
84
84
84
83
80
80
76
64
98
97
97
96
94
93
93
93
93
93
Summary of SDG 3 indicators that are reported as comparable estimatesᵃ
ᵃ Comparable estimates refer to country values which may be adjusted or modelled to allow comparisons between countries and are produced for countries with underlying primary data and, in some cases,for those without. Shading from blue to orange represents low to high for mortality, incidence and prevalence indicators; and from high to low for immunization coverage and service index indicators.ᵇ (per 100 000 live births) ᵉ (per 100 000 population) ʰ (crude, per 100 000 population)ᶜ (per 1000 live births) ᶠ (per 1000 population at risk) i (litres of pure alcohol per capita ≥15 years)ᵈ (per 1000 uninfected population) ᵍ (%) ʲ (age-standardized, per 100 000 population)
Saint Vincent and the Grenadines
Venezuela (Bolivarian Republic of)
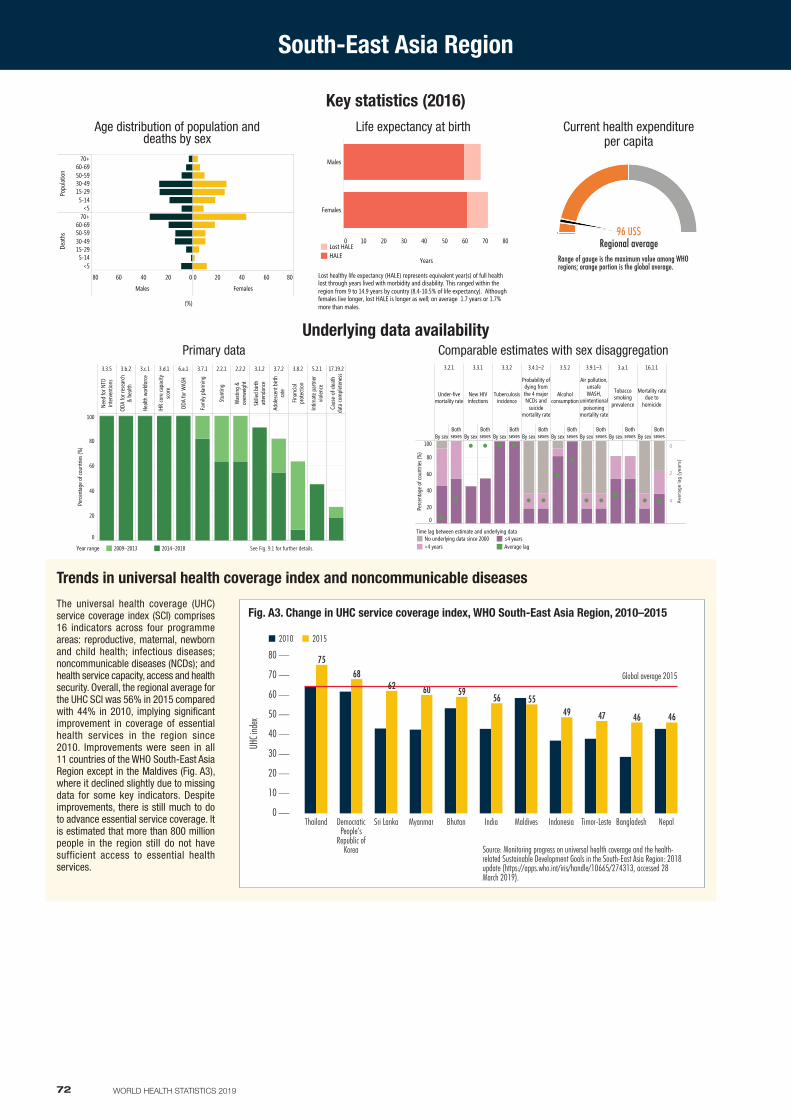
The universal health coverage (UHC) service coverage index (SCI) comprises 16 indicators across four programme areas: reproductive, maternal, newborn and child health; infectious diseases; noncommunicable diseases (NCDs); and health service capacity, access and health security. Overall, the regional average for the UHC SCI was 56% in 2015 compared with 44% in 2010, implying significant improvement in coverage of essential health services in the region since 2010. Improvements were seen in all 11 countries of the WHO South-East Asia Region except in the Maldives (Fig. A3), where it declined slightly due to missing data for some key indicators. Despite improvements, there is still much to do to advance essential service coverage. It is estimated that more than 800 million people in the region still do not have sufficient access to essential health services.
Trends in universal health coverage index and noncommunicable diseases
72 WORLD HEALTH STATISTICS 2019
South-East Asia Region
Current health expenditure per capita
Key statistics (2016)
96 US$Regional average
Range of gauge is the maximum value among WHO regions; orange portion is the global average.
Age distribution of population and deaths by sex
020406080
Males
0 20 40 60 80
Females
Popu
latio
n
70+60-6950-5930-4915-295-14
<5
Deat
hs
70+60-6950-5930-4915-295-14
<5
Age distribution of population and deaths by sex
(%)
Life expectancy at birth
0 10 20 30 40 50 60 70 80
Years
Males
Females
Life expectancy at birth
Lost healthy life expectancy (HALE) represents equivalent year(s) of full healthlost through years lived with morbidity and disability. This ranged within theregion from 9 to 14.9 years by country (8.4-10.5% of life expectancy). Althoughfemales live longer, lost HALE is longer as well; on average 1.7 years or 1.7%more than males.
Lost HALEHALE
Fig. A3. Change in UHC service coverage index, WHO South-East Asia Region, 2010–2015
Source: Monitoring progress on universal health coverage and the health-related Sustainable Development Goals in the South-East Asia Region: 2018 update (https://apps.who.int/iris/handle/10665/274313, accessed 28 March 2019).
70 —
0 —
60 —
80 —
2010 2015
50 —
40 —
20 —
10 —
30 —
UHC i
ndex
Thailand
75
Democratic People’s
Republic of Korea
68
Sri Lanka Myanmar
60
Bhutan
59
India
56
Maldives
55
Indonesia
49
Timor-Leste
47
Bangladesh
46
Nepal
46
Global average 201562
3.2.1
Under-fivemortality rate
By sexBothsexes
3.3.1
New HIVinfections
By sexBothsexes
3.3.2
Tuberculosisincidence
By sexBothsexes
3.4.1–2
Probability ofdying fromthe 4 majorNCDs and
suicidemortality rate
By sexBothsexes
3.5.2
Alcoholconsumption
By sexBothsexes
3.9.1–3
Air pollution,unsafeWASH,
unintentionalpoisoning
mortality rate
By sexBothsexes
3.a.1
Tobaccosmoking
prevalence
By sexBothsexes
16.1.1
Mortality ratedue to
homicide
By sexBothsexes
0
20
40
60
80
100
Perc
enta
ge o
f cou
ntrie
s (%
)
0
2
4 Aver
age
lag
(yea
rs)
Time lag between estimate and underlying dataNo underlying data since 2000>4 years
≤4 yearsAverage lag
Comparable estimates with sex disaggregationUnderlying data availability
3.3.5
Need
for N
TDin
terv
entio
ns
3.b.2
ODA
for r
esea
rch
& he
alth
3.c.1
Healt
h wo
rkfo
rce
3.d.1
IHR
core
capa
city
scor
e
6.a.1
ODA
for W
ASH
3.7.1
Fam
ily p
lanni
ng
2.2.1
Stun
ting
2.2.2
Was
ting
&ov
erwe
ight
3.1.2
Skille
d bi
rthat
tend
ance
3.7.2
Adol
esce
nt b
irth
rate
3.8.2
Finan
cial
prot
ectio
n
5.2.1
Intim
ate
partn
ervio
lence
17.19.2
Caus
e-of
-dea
thda
ta co
mpl
eten
ess
0
20
40
60
80
100
Perc
enta
ge o
f cou
ntrie
s (%
)
See Figure 9.1 for further details.Year range 2009–2013 2014–2018
Primary data
See Fig. 9.1 for further details.
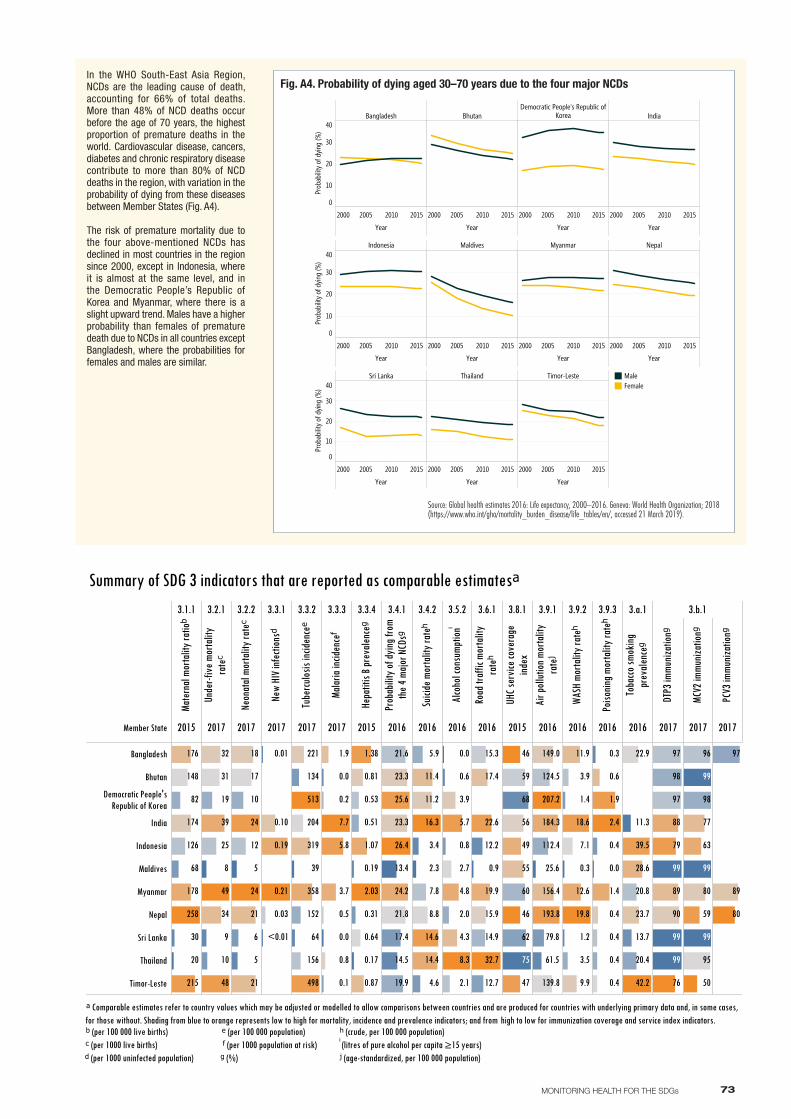
In the WHO South-East Asia Region, NCDs are the leading cause of death, accounting for 66% of total deaths. More than 48% of NCD deaths occur before the age of 70 years, the highest proportion of premature deaths in the world. Cardiovascular disease, cancers, diabetes and chronic respiratory disease contribute to more than 80% of NCD deaths in the region, with variation in the probability of dying from these diseases between Member States (Fig. A4).
The risk of premature mortality due to the four above-mentioned NCDs has declined in most countries in the region since 2000, except in Indonesia, where it is almost at the same level, and in the Democratic People’s Republic of Korea and Myanmar, where there is a slight upward trend. Males have a higher probability than females of premature death due to NCDs in all countries except Bangladesh, where the probabilities for females and males are similar.
73MONITORING HEALTH FOR THE SDGs
Member State
3.1.1
Mate
rnal
morta
lity r
atioᵇ
2015
3.2.1
Unde
r-five
mor
talit
yra
teᶜ
2017
3.2.2
Neon
atal
morta
lity r
ateᶜ
2017
3.3.1
New
HIV i
nfec
tionsᵈ
2017
3.3.2
Tube
rculos
is inc
idenc
eᵉ
2017
3.3.3
Malar
ia inc
idenc
eᶠ
2017
3.3.4
Hepa
titis
B pre
valen
ceᵍ
2015
3.4.1
Prob
abilit
y of d
ying f
rom
the 4
majo
r NCD
sᵍ
2016
3.4.2
Suici
de m
orta
lity r
ateʰ
2016
3.5.2
Alco
hol c
onsu
mptio
nⁱ
2016
3.6.1
Road
traf
fic m
orta
lity
rateʰ
2016
3.8.1
UHC s
ervic
e cov
erag
eind
ex
2015
3.9.1
Air p
ollut
ion m
orta
lity
rateʲ
2016
3.9.2
WASH
mor
talit
y rat
eʰ
2016
3.9.3Po
isonin
g mor
talit
y rat
eʰ
2016
3.a.1
Toba
cco sm
oking
prev
alenc
eᵍ
2016
3.b.1
DTP3
immu
nizat
ionᵍ
2017
MCV2
immu
nizat
ionᵍ
2017PC
V3 im
muniz
ation
ᵍ2017
Bangladesh
Bhutan
Democratic People'sRepublic of Korea
India
Indonesia
Maldives
Myanmar
Nepal
Sri Lanka
Thailand
Timor-Leste
82
68
30
258
215
20
178
176
174
148
126
9
8
49
48
39
34
32
31
25
19
10
6
5
5
24
24
21
21
18
17
12
10
0.21
0.19
0.10
0.03
0.01
<0.01 64
513
498
39
358
319
221
204
156
152
134
7.7
5.8
3.7
1.9
0.8
0.5
0.2
0.1
0.0
0.0
2.03
1.38
1.07
0.87
0.81
0.64
0.53
0.51
0.31
0.19
0.17
26.4
25.6
24.2
23.3
23.3
21.8
21.6
19.9
17.4
14.5
13.4
8.8
7.8
5.9
4.6
3.4
2.3
16.3
14.6
14.4
11.4
11.2
8.3
5.7
4.8
4.3
3.9
2.7
2.1
2.0
0.8
0.6
0.0
32.7
22.6
19.9
17.4
15.9
15.3
14.9
12.7
12.2
0.9
68
62
60
59
56
55
49
47
46
46
75
79.8
61.5
25.6
207.2
193.8
184.3
156.4
149.0
139.8
124.5
112.4
9.9
7.1
3.9
3.5
19.8
18.6
12.6
11.9
1.4
1.2
0.3
2.4
1.9
1.4
0.6
0.4
0.4
0.4
0.4
0.4
0.3
0.0
42.2
39.5
28.6
23.7
22.9
20.8
20.4
13.7
11.3
98
97
97
90
89
88
79
76
99
99
99
98
96
95
80
77
63
59
50
99
99
99
97
89
80
Summary of SDG 3 indicators that are reported as comparable estimatesᵃ
ᵃ Comparable estimates refer to country values which may be adjusted or modelled to allow comparisons between countries and are produced for countries with underlying primary data and, in some cases,for those without. Shading from blue to orange represents low to high for mortality, incidence and prevalence indicators; and from high to low for immunization coverage and service index indicators.ᵇ (per 100 000 live births) ᵉ (per 100 000 population) ʰ (crude, per 100 000 population)ᶜ (per 1000 live births) ᶠ (per 1000 population at risk) i (litres of pure alcohol per capita ≥15 years)ᵈ (per 1000 uninfected population) ᵍ (%) ʲ (age-standardized, per 100 000 population)
Bangladesh BhutanDemocratic People's Republic of
Korea India
2000 2005 2010 2015
Year
2000 2005 2010 2015
Year
2000 2005 2010 2015
Year
2000 2005 2010 2015
Year
0
10
20
30
40
Prob
abilit
y of d
ying
(%)
Indonesia Maldives Myanmar Nepal
2000 2005 2010 2015
Year
2000 2005 2010 2015
Year
2000 2005 2010 2015
Year
2000 2005 2010 2015
Year
0
10
20
30
40
Prob
abilit
y of d
ying
(%)
Sri Lanka Thailand Timor-Leste
2000 2005 2010 2015
Year
2000 2005 2010 2015
Year
2000 2005 2010 2015
Year
0
10
20
30
40
Prob
abilit
y of d
ying
(%)
MaleFemale
Fig. A4. Probability of dying aged 30–70 years due to the four major NCDs
Source: Global health estimates 2016: Life expectancy, 2000–2016. Geneva: World Health Organization; 2018 (https://www.who.int/gho/mortality_burden_disease/life_tables/en/, accessed 21 March 2019).
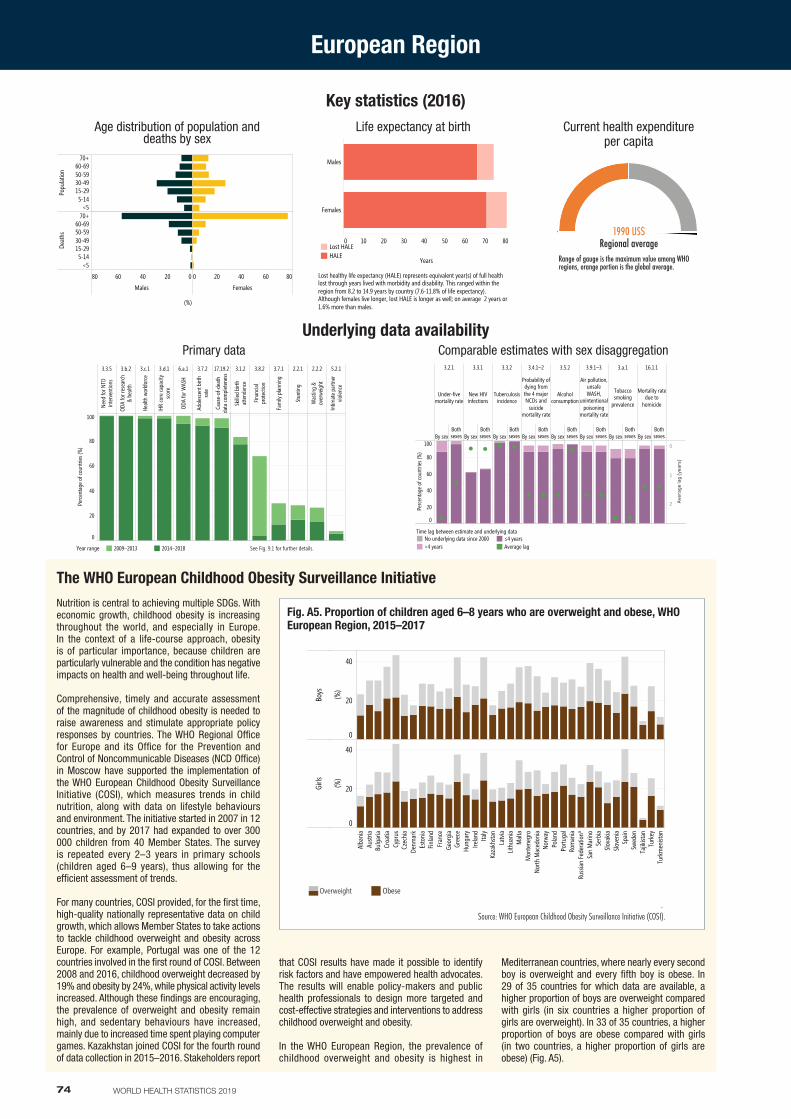
74 WORLD HEALTH STATISTICS 2019
European Region
Age distribution of population and deaths by sex
020406080
Males
0 20 40 60 80
Females
Popu
latio
n
70+60-6950-5930-4915-295-14
<5
Deat
hs
70+60-6950-5930-4915-295-14
<5
Age distribution of population and deaths by sex
(%)
Current health expenditure per capita
Range of gauge is the maximum value among WHO regions, orange portion is the global average.
1990 US$Regional average
Key statistics (2016)Life expectancy at birth
0 10 20 30 40 50 60 70 80
Years
Males
Females
Life expectancy at birth
Lost healthy life expectancy (HALE) represents equivalent year(s) of full healthlost through years lived with morbidity and disability. This ranged within theregion from 8.2 to 14.9 years by country (7.6-11.8% of life expectancy).Although females live longer, lost HALE is longer as well; on average 2 years or1.6% more than males.
Lost HALEHALE
Nutrition is central to achieving multiple SDGs. With economic growth, childhood obesity is increasing throughout the world, and especially in Europe. In the context of a life-course approach, obesity is of particular importance, because children are particularly vulnerable and the condition has negative impacts on health and well-being throughout life.
Comprehensive, timely and accurate assessment of the magnitude of childhood obesity is needed to raise awareness and stimulate appropriate policy responses by countries. The WHO Regional Office for Europe and its Office for the Prevention and Control of Noncommunicable Diseases (NCD Office) in Moscow have supported the implementation of the WHO European Childhood Obesity Surveillance Initiative (COSI), which measures trends in child nutrition, along with data on lifestyle behaviours and environment. The initiative started in 2007 in 12 countries, and by 2017 had expanded to over 300 000 children from 40 Member States. The survey is repeated every 2–3 years in primary schools (children aged 6–9 years), thus allowing for the efficient assessment of trends.
For many countries, COSI provided, for the first time, high-quality nationally representative data on child growth, which allows Member States to take actions to tackle childhood overweight and obesity across Europe. For example, Portugal was one of the 12 countries involved in the first round of COSI. Between 2008 and 2016, childhood overweight decreased by 19% and obesity by 24%, while physical activity levels increased. Although these findings are encouraging, the prevalence of overweight and obesity remain high, and sedentary behaviours have increased, mainly due to increased time spent playing computer games. Kazakhstan joined COSI for the fourth round of data collection in 2015–2016. Stakeholders report
The WHO European Childhood Obesity Surveillance Initiative
that COSI results have made it possible to identify risk factors and have empowered health advocates. The results will enable policy-makers and public health professionals to design more targeted and cost-effective strategies and interventions to address childhood overweight and obesity.
In the WHO European Region, the prevalence of childhood overweight and obesity is highest in
Mediterranean countries, where nearly every second boy is overweight and every fifth boy is obese. In 29 of 35 countries for which data are available, a higher proportion of boys are overweight compared with girls (in six countries a higher proportion of girls are overweight). In 33 of 35 countries, a higher proportion of boys are obese compared with girls (in two countries, a higher proportion of girls are obese) (Fig. A5).
Fig. A5. Proportion of children aged 6–8 years who are overweight and obese, WHO European Region, 2015–2017
a Pertains to Moscow only.Source: WHO European Childhood Obesity Surveillance Initiative (COSI).
3.2.1
Under-fivemortality rate
By sexBothsexes
3.3.1
New HIVinfections
By sexBothsexes
3.3.2
Tuberculosisincidence
By sexBothsexes
3.4.1–2
Probability ofdying fromthe 4 majorNCDs and
suicidemortality rate
By sexBothsexes
3.5.2
Alcoholconsumption
By sexBothsexes
3.9.1–3
Air pollution,unsafeWASH,
unintentionalpoisoning
mortality rate
By sexBothsexes
3.a.1
Tobaccosmoking
prevalence
By sexBothsexes
16.1.1
Mortality ratedue to
homicide
By sexBothsexes
0
20
40
60
80
100
Perc
enta
ge o
f cou
ntrie
s (%
)
0
1
2 Aver
age
lag
(yea
rs)
Time lag between estimate and underlying dataNo underlying data since 2000>4 years
≤4 yearsAverage lag
Comparable estimates with sex disaggregationUnderlying data availability
3.3.5
Need
for N
TDin
terv
entio
ns
3.b.2
ODA
for r
esea
rch
& he
alth
3.c.1
Healt
h wo
rkfo
rce
3.d.1
IHR
core
capa
city
scor
e
6.a.1
ODA
for W
ASH
3.7.2
Adol
esce
nt b
irth
rate
17.19.2
Caus
e-of
-dea
thda
ta co
mpl
eten
ess
3.1.2
Skille
d bi
rthat
tend
ance
3.8.2
Finan
cial
prot
ectio
n
3.7.1
Fam
ily p
lanni
ng
2.2.1
Stun
ting
2.2.2
Was
ting
&ov
erwe
ight
5.2.1
Intim
ate
partn
ervio
lence
0
20
40
60
80
100
Perc
enta
ge o
f cou
ntrie
s (%
)
See Figure 9.1 for further details.Year range 2009–2013 2014–2018
Primary data
See Fig. 9.1 for further details.
Alba
nia
Austr
iaBu
lgar
iaCr
oatia
Cypr
usCz
echi
aDe
nmar
kEs
toni
aFin
land
Fran
ceGe
orgi
aGr
eece
Hung
ary
Irelan
dIta
lyKa
zakh
stan
Latv
iaLit
huan
iaM
alta
Mon
tene
gro
North
Mac
edon
iaNo
rway
Polan
dPo
rtuga
lRo
man
iaRu
ssian
Fed
erat
ionª
San
Mar
ino
Serb
iaSlo
vakia
Slove
nia
Spain
Swed
enTa
jikist
anTu
rkey
Turk
men
istan
Boys
Girls
0
20
40
(%)
0
20
40
(%)
Overweight ObesityObese
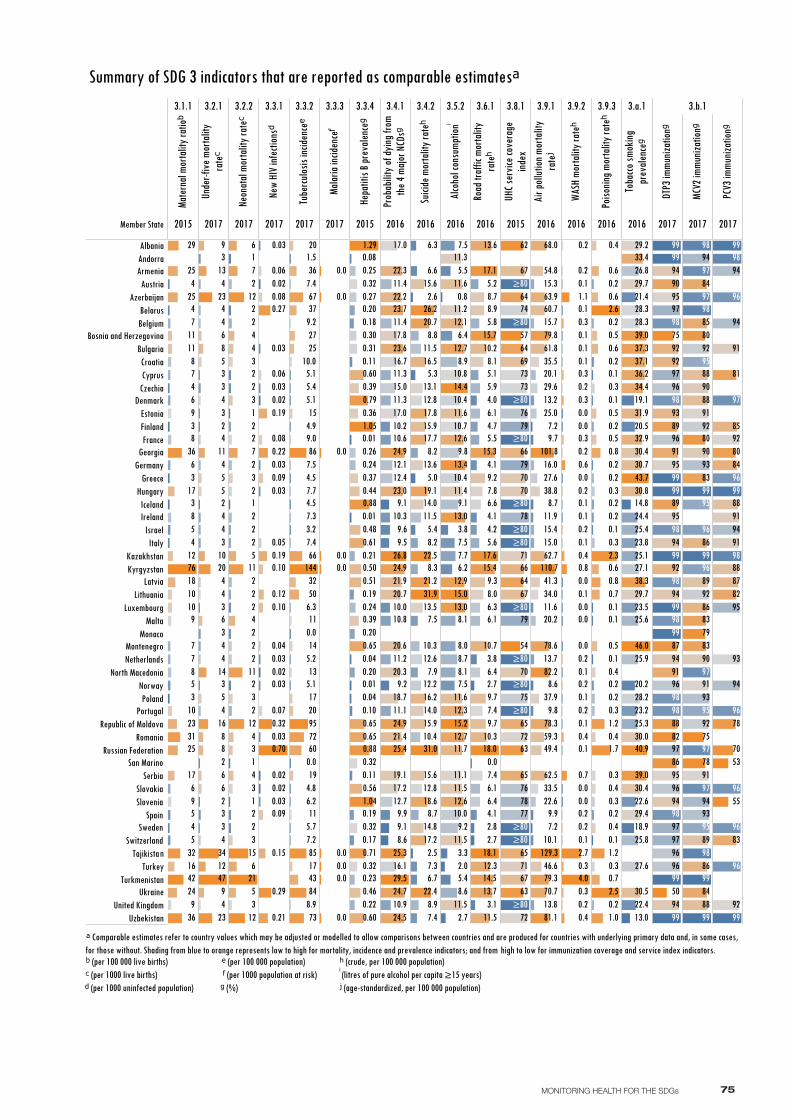
75MONITORING HEALTH FOR THE SDGs
Member State
3.1.1
Mate
rnal
morta
lity r
atioᵇ
2015
3.2.1
Unde
r-five
mor
talit
yra
teᶜ
2017
3.2.2
Neon
atal
morta
lity r
ateᶜ
2017
3.3.1
New
HIV i
nfec
tionsᵈ
2017
3.3.2
Tube
rculos
is inc
idenc
eᵉ
2017
3.3.3
Malar
ia inc
idenc
eᶠ
2017
3.3.4
Hepa
titis
B pre
valen
ceᵍ
2015
3.4.1
Prob
abilit
y of d
ying f
rom
the 4
majo
r NCD
sᵍ
2016
3.4.2
Suici
de m
orta
lity r
ateʰ
2016
3.5.2
Alco
hol c
onsu
mptio
nⁱ
2016
3.6.1
Road
traf
fic m
orta
lity
rateʰ
2016
3.8.1
UHC s
ervic
e cov
erag
eind
ex
2015
3.9.1
Air p
ollut
ion m
orta
lity
rateʲ
2016
3.9.2
WASH
mor
talit
y rat
eʰ
2016
3.9.3
Poiso
ning m
orta
lity r
ateʰ
2016
3.a.1
Toba
cco sm
oking
prev
alenc
eᵍ
2016
3.b.1
DTP3
immu
nizat
ionᵍ
2017
MCV2
immu
nizat
ionᵍ
2017
PCV3
immu
nizat
ionᵍ
2017
AlbaniaAndorraArmenia
AustriaAzerbaijan
BelarusBelgium
Bosnia and HerzegovinaBulgariaCroatiaCyprus
CzechiaDenmark
EstoniaFinlandFrance
GeorgiaGermany
GreeceHungaryIcelandIreland
IsraelItaly
KazakhstanKyrgyzstan
LatviaLithuania
LuxembourgMalta
MonacoMontenegroNetherlands
North MacedoniaNorwayPoland
PortugalRepublic of Moldova
RomaniaRussian Federation
San MarinoSerbia
SlovakiaSlovenia
SpainSweden
SwitzerlandTajikistan
TurkeyTurkmenistan
UkraineUnited Kingdom
Uzbekistan9
9
9
9
8
8
8
8
76
77
7
7
6
6
6
5
5
5
5
42
4
4
4
4
4
36
36
32
31
3
3
3
3
29
25
25
25
24
23
18
17
17
16
12
1111
10
1010
9
9
88
8
66
6
6
5
55
5
47
4
4
4
44
44
44
4
4
4
44
4
34
33
3
3
3
3
3
33
3
23
23
20
2
2
2
2
16
14
13
12
11
10
7
7
6
6
5
5
4
4
4
44
3
3
3
3
3
3
3
3
21
22
2
2
222
222
222
2
2
22
22
22
2
15
12
12
12
11
11
1
1
1
1
1
0.70
0.32
0.29
0.27
0.22
0.21
0.19
0.19
0.15
0.120.10
0.10
0.09
0.09
0.08
0.08
0.07
0.06
0.06
0.05
0.04
0.03
0.03
0.03
0.03
0.03
0.03
0.03
0.03
0.03
0.020.02
0.02
0.02
0.02
95
9.2
9.086
85
848.973
72
7.7
7.5
7.4
7.4
7.3
7.2
67
66
60
6.3
6.2
50
5.7
5.4
5.2
5.1
5.1
5.1
43
4.9
4.8
4.5
4.5
37
36
32
3.2
2725
20
20
19
17
17
15
144
14
13
11
11
10.0
1.5
0.0
0.0
0.0
0.00.00.0
0.00.0
0.0
0.0
0.0
1.29
1.05
1.04
0.88
0.88
0.79
0.71
0.650.65
0.65
0.61
0.60
0.60
0.56
0.510.50
0.48
0.46
0.44
0.39
0.39
0.37
0.36
0.32
0.32
0.32
0.32
0.310.30
0.27
0.26
0.25
0.24
0.24
0.23
0.22
0.21
0.20
0.20
0.20
0.19
0.19
0.18
0.17
0.11
0.11
0.10
0.08
0.04
0.04
0.01
0.01
0.01
9.9
9.69.5
9.2
9.1
9.1
8.6
29.5
26.8
25.4
25.3
24.9
24.9
24.9
24.7
24.5
23.7
23.6
23.0
22.3
22.2
21.9
21.4
20.7
20.6
20.3
19.1
18.7
17.8
17.2
17.0
17.0
16.7
16.1
15.0
12.7
12.412.1
11.4
11.4
11.3
11.3
11.2
11.1
10.9
10.8
10.6
10.3
10.2
10.0
8.9
8.8
8.7
8.3
8.2
8.2
7.9
7.5
7.4
7.36.7
6.6
6.3
5.4
5.3
5.0
31.9
31.0
26.2
22.5
22.4
21.2
20.7
2.6
2.5
19.1
18.6
17.8
17.7
17.2
16.5
16.2
15.9
15.9
15.6
15.6
14.8
14.0
14.0
13.6
13.5
13.1
12.8
12.8
12.6
12.2
11.5
11.5
10.4
10.3
9.8
9.2
9.1
8.9
8.7
8.6
8.1
8.1
8.0
7.7
7.5
7.5
7.5
6.4
6.2
5.5
5.4
3.8
3.3
2.7
2.0
15.2
15.0
14.4
13.4
13.0
13.0
12.9
12.7
12.7
12.6
12.6
12.3
12.1
11.7
11.6
11.6
11.6
11.5
11.5
11.5
11.4
11.3
11.2
11.1
10.8
10.7
10.4
10.4
10.0
0.8
9.7
9.7
9.3
9.2
8.98.7
8.1
8.0
7.8
7.4
7.4
6.6
6.4
6.4
6.3
6.1
6.1
6.1
5.9
5.8
5.6
5.5
5.2
5.1
4.7
4.2
4.1
4.1
4.1
4.0
3.8
3.1
2.82.7
2.7
18.1
18.0
17.6
17.1
15.7
15.4
15.3
14.513.7
13.6
12.3
11.5
10.7
10.3
10.2
0.0
79
79
79
78
78
77
76
76
75
74
7373
72
72
71
71
70
7070
69
67
67
67
66
66
65
65
65
64
64
64
63
63
62
57
54
≥80
≥80≥80
≥80
≥80
≥80
≥80
≥80≥80
≥80
≥80
≥80
≥80
≥80
9.9
9.8
9.7
82.2
81.1
8.7
8.6
79.8
79.3
78.6
78.3
70.7
7.2
7.2
68.0
63.9
62.7
62.5
61.8
60.7
59.3
54.8
49.4
46.6
41.3
38.8
37.9
35.5
34.0
33.5
29.6
27.6
25.0
22.6
20.2
20.1
16.0
15.7
15.4
15.3
15.0
13.8
13.7
13.2
129.3
110.7
11.9
11.6
101.8
10.1
4.0
2.7
1.1
0.8
0.7
0.6
0.4
0.4
0.4
0.3
0.3
0.3
0.3
0.3
0.3
0.2
0.20.2
0.2
0.2
0.2
0.2
0.2
0.2
0.2
0.2
0.2
0.1
0.1
0.1
0.1
0.1
0.1
0.1
0.10.1
0.10.10.1
0.1
0.1
0.00.0
0.0
0.00.0
0.0
0.0
0.00.0
2.6
2.5
2.3
1.7
1.2
1.2
1.0
0.8
0.8
0.7
0.7
0.6
0.6
0.6
0.6
0.5
0.5
0.5
0.5
0.4
0.4
0.4
0.4
0.4
0.3
0.3
0.3
0.3
0.3
0.3
0.3
0.2
0.2
0.20.2
0.20.2
0.20.2
0.2
0.2
0.2
0.2
0.1
0.1
0.10.1
0.1
0.1
0.1
46.0
43.7
40.9
39.0
39.0
38.3
37.337.136.234.4
33.4
32.9
31.9
30.8
30.7
30.5
30.4
30.4
30.0
29.7
29.7
29.4
29.2
28.328.3
28.2
27.6
27.1
26.8
25.9
25.8
25.6
25.4
25.3
25.1
24.4
23.8
23.5
23.2
22.6
22.4
21.4
20.5
20.2
19.1
18.9
14.8
13.0
9797
97
97
97
9696
96
96
96
96
95
95
95
95
94
94
94
94
94
94
93
92
9292
91
91
90
89
89
88
87
86
82
75
50
99
99
99
99
99
9999
9999
98
9898
98
98
98
98
98
94
94
93
93
93
92
92
92
92
91
91
91
90
90
90
89
89
88
88
88
86
86
86
85
84
84
83
83
83
80
80
79
78
75
99
99
99
99
98
98
98
97
97
97
97
97
96
96
95
95
95
95
95
94
94
94
94
93
92
92
91
91
91
88
88
87
85
84
83
82
81
80
78
70
55
53
99
99
99
98
98
97
96
96
96
96
96
96
Summary of SDG 3 indicators that are reported as comparable estimatesᵃ
ᵃ Comparable estimates refer to country values which may be adjusted or modelled to allow comparisons between countries and are produced for countries with underlying primary data and, in some cases,for those without. Shading from blue to orange represents low to high for mortality, incidence and prevalence indicators; and from high to low for immunization coverage and service index indicators.ᵇ (per 100 000 live births) ᵉ (per 100 000 population) ʰ (crude, per 100 000 population)ᶜ (per 1000 live births) ᶠ (per 1000 population at risk) i (litres of pure alcohol per capita ≥15 years)ᵈ (per 1000 uninfected population) ᵍ (%) ʲ (age-standardized, per 100 000 population)
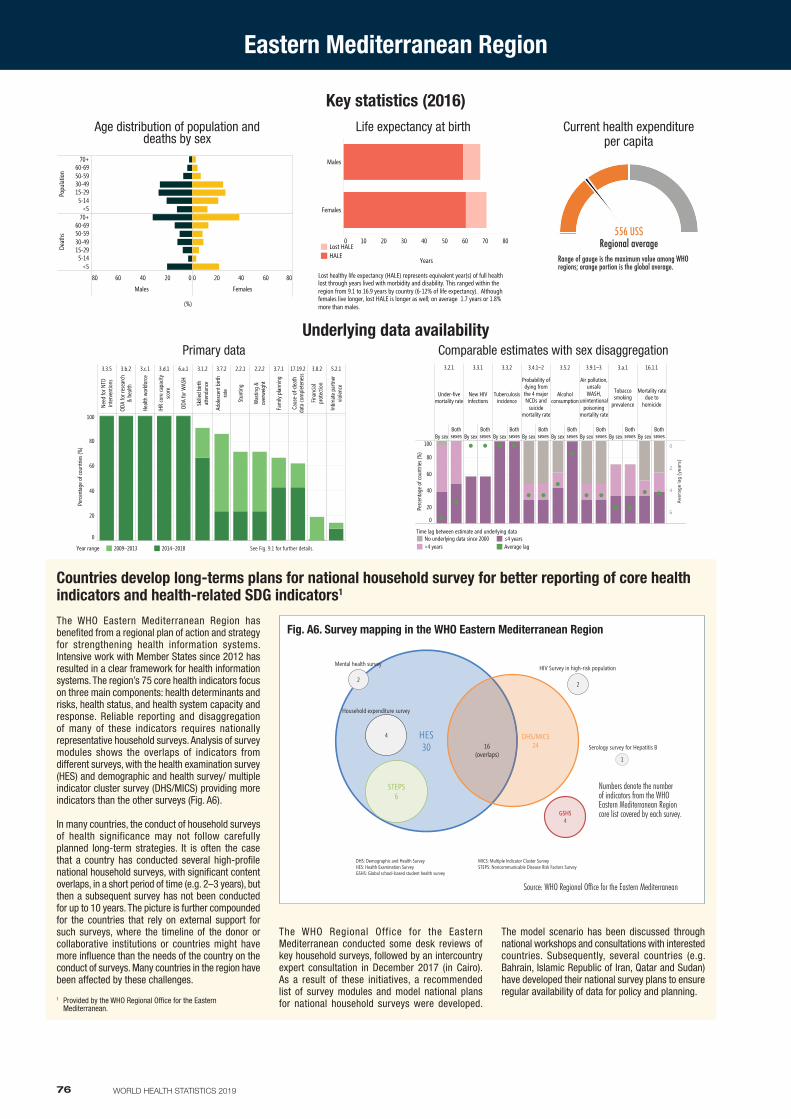
76 WORLD HEALTH STATISTICS 2019
Eastern Mediterranean Region
Current health expenditure per capita
Key statistics (2016)
556 US$Regional average
Range of gauge is the maximum value among WHO regions; orange portion is the global average.
Age distribution of population and deaths by sex
020406080
Males
0 20 40 60 80
Females
Popu
latio
n
70+60-6950-5930-4915-295-14
<5
Deat
hs
70+60-6950-5930-4915-295-14
<5
Age distribution of population and deaths by sex
(%)
Life expectancy at birth
0 10 20 30 40 50 60 70 80
Years
Males
Females
Life expectancy at birth
Lost healthy life expectancy (HALE) represents equivalent year(s) of full healthlost through years lived with morbidity and disability. This ranged within theregion from 9.1 to 16.9 years by country (6-12% of life expectancy). Althoughfemales live longer, lost HALE is longer as well; on average 1.7 years or 1.8%more than males.
Lost HALEHALE
The WHO Eastern Mediterranean Region has benefited from a regional plan of action and strategy for strengthening health information systems. Intensive work with Member States since 2012 has resulted in a clear framework for health information systems. The region’s 75 core health indicators focus on three main components: health determinants and risks, health status, and health system capacity and response. Reliable reporting and disaggregation of many of these indicators requires nationally representative household surveys. Analysis of survey modules shows the overlaps of indicators from different surveys, with the health examination survey (HES) and demographic and health survey/ multiple indicator cluster survey (DHS/MICS) providing more indicators than the other surveys (Fig. A6).
In many countries, the conduct of household surveys of health significance may not follow carefully planned long-term strategies. It is often the case that a country has conducted several high-profile national household surveys, with significant content overlaps, in a short period of time (e.g. 2–3 years), but then a subsequent survey has not been conducted for up to 10 years. The picture is further compounded for the countries that rely on external support for such surveys, where the timeline of the donor or collaborative institutions or countries might have more influence than the needs of the country on the conduct of surveys. Many countries in the region have been affected by these challenges.
Countries develop long-terms plans for national household survey for better reporting of core health indicators and health-related SDG indicators1
The WHO Regional Office for the Eastern Mediterranean conducted some desk reviews of key household surveys, followed by an intercountry expert consultation in December 2017 (in Cairo). As a result of these initiatives, a recommended list of survey modules and model national plans for national household surveys were developed.
The model scenario has been discussed through national workshops and consultations with interested countries. Subsequently, several countries (e.g. Bahrain, Islamic Republic of Iran, Qatar and Sudan) have developed their national survey plans to ensure regular availability of data for policy and planning.
1 Provided by the WHO Regional Office for the Eastern Mediterranean.
Fig. A6. Survey mapping in the WHO Eastern Mediterranean Region
Source: WHO Regional Office for the Eastern Mediterranean
HES30
1
GSHS4
Serology survey for Hepatitis B
1
DHS/MICS24
STEPS6
HIV Survey in high-risk population
2
Household expenditure survey
4
16(overlaps)
Mental health survey
2
DHS: Demographic and Health SurveyHES: Health Examination SurveyGSHS: Global school-based student health survey
MICS: Multiple Indicator Cluster SurveySTEPS: Noncommunicable Disease Risk Factors Survey
Numbers denote the number of indicators from the WHO Eastern Mediterranean Region core list covered by each survey.
3.2.1
Under-fivemortality rate
By sexBothsexes
3.3.1
New HIVinfections
By sexBothsexes
3.3.2
Tuberculosisincidence
By sexBothsexes
3.4.1–2
Probability ofdying fromthe 4 majorNCDs and
suicidemortality rate
By sexBothsexes
3.5.2
Alcoholconsumption
By sexBothsexes
3.9.1–3
Air pollution,unsafeWASH,
unintentionalpoisoning
mortality rate
By sexBothsexes
3.a.1
Tobaccosmoking
prevalence
By sexBothsexes
16.1.1
Mortality ratedue to
homicide
By sexBothsexes
0
20
40
60
80
100
Perc
enta
ge o
f cou
ntrie
s (%
)
0
2
4
6
Aver
age
lag
(yea
rs)
Time lag between estimate and underlying dataNo underlying data since 2000>4 years
≤4 yearsAverage lag
Comparable estimates with sex disaggregationUnderlying data availability
3.3.5
Need
for N
TDin
terv
entio
ns
3.b.2
ODA
for r
esea
rch
& he
alth
3.c.1
Healt
h wo
rkfo
rce
3.d.1
IHR
core
capa
city
scor
e
6.a.1
ODA
for W
ASH
3.1.2
Skille
d bi
rthat
tend
ance
3.7.2
Adol
esce
nt b
irth
rate
2.2.1
Stun
ting
2.2.2
Was
ting
&ov
erwe
ight
3.7.1
Fam
ily p
lanni
ng
17.19.2
Caus
e-of
-dea
thda
ta co
mpl
eten
ess
3.8.2
Finan
cial
prot
ectio
n
5.2.1
Intim
ate
partn
ervio
lence
0
20
40
60
80
100
Perc
enta
ge o
f cou
ntrie
s (%
)
See Figure 9.1 for further details.Year range 2009–2013 2014–2018
Primary data
See Fig. 9.1 for further details.
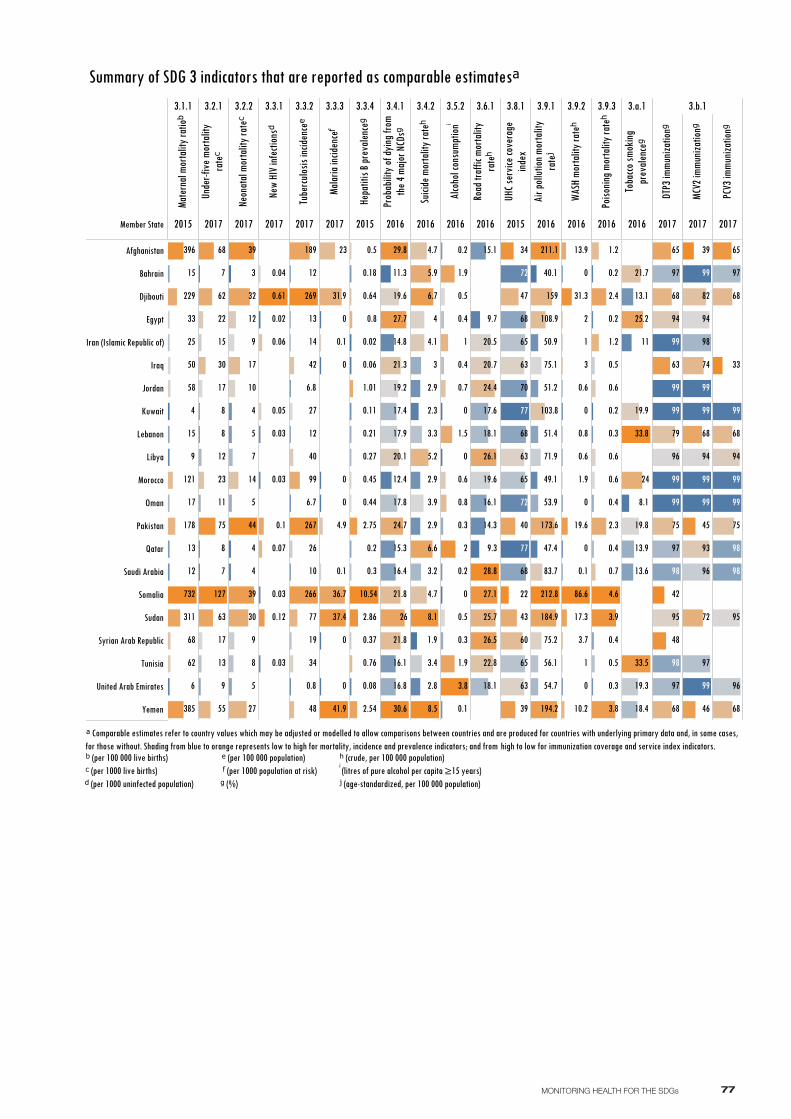
77MONITORING HEALTH FOR THE SDGs
Member State
3.1.1
Mate
rnal
morta
lity r
atioᵇ
2015
3.2.1
Unde
r-five
mor
talit
yra
teᶜ
2017
3.2.2
Neon
atal
morta
lity r
ateᶜ
2017
3.3.1
New
HIV i
nfec
tionsᵈ
2017
3.3.2
Tube
rculos
is inc
idenc
eᵉ
2017
3.3.3
Malar
ia inc
idenc
eᶠ
2017
3.3.4
Hepa
titis
B pre
valen
ceᵍ
2015
3.4.1
Prob
abilit
y of d
ying f
rom
the 4
majo
r NCD
sᵍ
2016
3.4.2
Suici
de m
orta
lity r
ateʰ
2016
3.5.2
Alco
hol c
onsu
mptio
nⁱ
2016
3.6.1
Road
traf
fic m
orta
lity
rateʰ
2016
3.8.1
UHC s
ervic
e cov
erag
eind
ex
2015
3.9.1
Air p
ollut
ion m
orta
lity
rateʲ
2016
3.9.2
WASH
mor
talit
y rat
eʰ
2016
3.9.3
Poiso
ning m
orta
lity r
ateʰ
2016
3.a.1
Toba
cco sm
oking
prev
alenc
eᵍ
2016
3.b.1
DTP3
immu
nizat
ionᵍ
2017
MCV2
immu
nizat
ionᵍ
2017
PCV3
immu
nizat
ionᵍ
2017
Afghanistan
Bahrain
Djibouti
Egypt
Iran (Islamic Republic of)
Iraq
Jordan
Kuwait
Lebanon
Libya
Morocco
Oman
Pakistan
Qatar
Saudi Arabia
Somalia
Sudan
Syrian Arab Republic
Tunisia
United Arab Emirates
Yemen
732
396
385
311
229
178
121
68
62
58
50
33
25
17
15
15
13
12
9
6
4
127
75
68
63
62
55
30
23
22
17
17
15
13
12
11
9
8
8
8
7
7
44
39
39
32
30
27
17
14
12
10
9
9
8
7
5
5
5
4
4
4
3
0.61
0.12
0.1
0.07
0.06
0.05
0.04
0.03
0.03
0.03
0.03
0.02
269
267
266
189
99
77
48
42
40
34
27
26
19
14
13
12
12
10
6.8
6.7
0.8
41.9
37.4
36.7
31.9
23
4.9
0.1
0.1
0
0
0
0
0
0
10.54
2.86
2.75
2.54
1.01
0.8
0.76
0.64
0.5
0.45
0.44
0.37
0.3
0.27
0.21
0.2
0.18
0.11
0.08
0.06
0.02
30.6
29.8
27.7
26
24.7
21.8
21.8
21.3
20.1
19.6
19.2
17.9
17.8
17.4
16.8
16.4
16.1
15.3
14.8
12.4
11.3
8.5
8.1
6.7
6.6
5.9
5.2
4.7
4.7
4.1
4
3.9
3.4
3.3
3.2
3
2.9
2.9
2.9
2.8
2.3
1.9
3.8
2
1.9
1.9
1.5
1
0.8
0.7
0.6
0.5
0.5
0.4
0.4
0.3
0.3
0.2
0.2
0.1
0
0
0
28.8
27.1
26.5
26.1
25.7
24.4
22.8
20.7
20.5
19.6
18.1
18.1
17.6
16.1
15.1
14.3
9.7
9.3
70
68
68
68
65
65
65
63
63
63
60
47
43
40
39
34
22
77
77
72
72
212.8
211.1
194.2
184.9
173.6
159
108.9
103.8
83.7
75.2
75.1
71.9
56.1
54.7
53.9
51.4
51.2
50.9
49.1
47.4
40.1
86.6
31.3
19.6
17.3
13.9
10.2
3.7
3
2
1.9
1
1
0.8
0.6
0.6
0.1
0
0
0
0
0
4.6
3.9
3.8
2.4
2.3
1.2
1.2
0.7
0.6
0.6
0.6
0.5
0.5
0.4
0.4
0.4
0.3
0.3
0.2
0.2
0.2
33.8
33.5
25.2
24
21.7
19.9
19.8
19.3
18.4
13.9
13.6
13.1
11
8.1
97
97
97
96
95
94
79
75
68
68
65
63
48
42
99
99
99
99
99
98
98
98
97
96
94
94
93
82
74
72
68
46
45
39
99
99
99
99
99
99 97
96
95
94
75
68
68
68
65
33
99
99
99
98
98
Summary of SDG 3 indicators that are reported as comparable estimatesᵃ
ᵃ Comparable estimates refer to country values which may be adjusted or modelled to allow comparisons between countries and are produced for countries with underlying primary data and, in some cases,for those without. Shading from blue to orange represents low to high for mortality, incidence and prevalence indicators; and from high to low for immunization coverage and service index indicators.ᵇ (per 100 000 live births) ᵉ (per 100 000 population) ʰ (crude, per 100 000 population)ᶜ (per 1000 live births) ᶠ (per 1000 population at risk) i (litres of pure alcohol per capita ≥15 years)ᵈ (per 1000 uninfected population) ᵍ (%) ʲ (age-standardized, per 100 000 population)
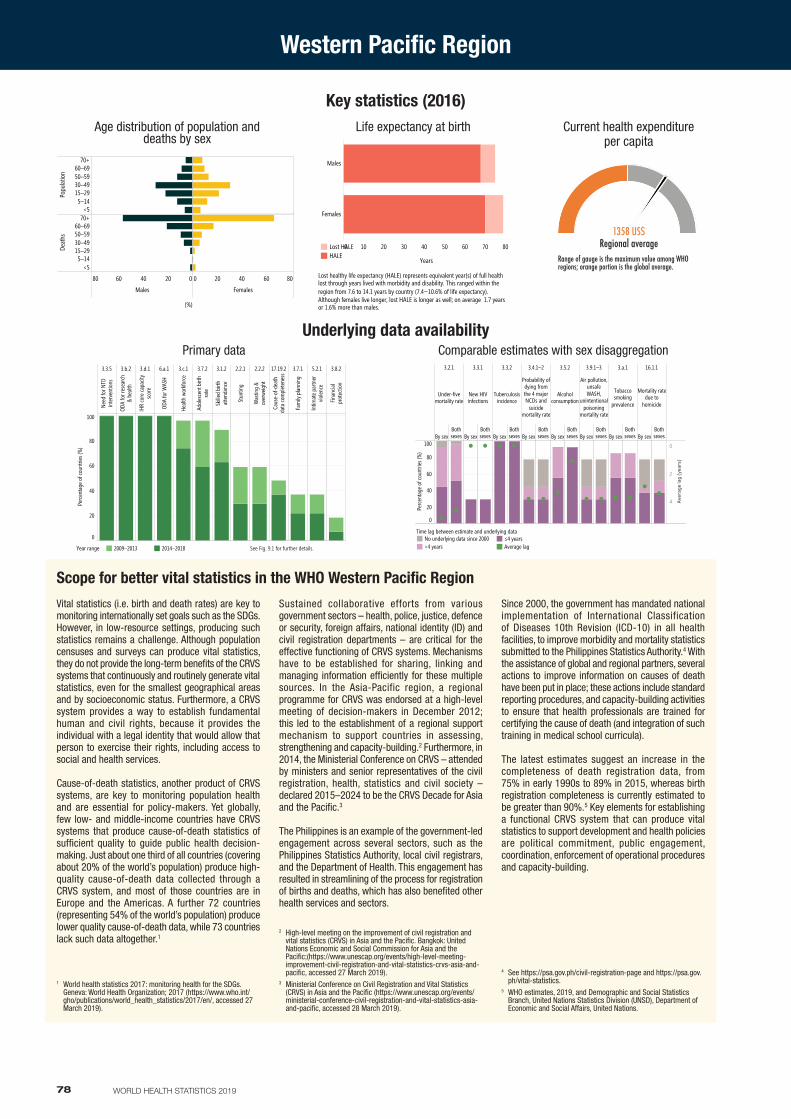
78 WORLD HEALTH STATISTICS 2019
Western Pacific Region
Current health expenditure per capita
Key statistics (2016)
1358 US$Regional average
Range of gauge is the maximum value among WHO regions; orange portion is the global average.
Age distribution of population and deaths by sex
020406080
Males
0 20 40 60 80
Females
Popu
latio
n
70+60–6950–5930–4915–295–14
<5
Deat
hs
70+60–6950–5930–4915–295–14
<5
Age distribution of population and deaths by sex
(%)
Life expectancy at birth
0 10 20 30 40 50 60 70 80
Years
Males
Females
Life expectancy at birth
Lost healthy life expectancy (HALE) represents equivalent year(s) of full healthlost through years lived with morbidity and disability. This ranged within theregion from 7.6 to 14.1 years by country (7.4–10.6% of life expectancy).Although females live longer, lost HALE is longer as well; on average 1.7 yearsor 1.6% more than males.
Lost HALEHALE
Vital statistics (i.e. birth and death rates) are key to monitoring internationally set goals such as the SDGs. However, in low-resource settings, producing such statistics remains a challenge. Although population censuses and surveys can produce vital statistics, they do not provide the long-term benefits of the CRVS systems that continuously and routinely generate vital statistics, even for the smallest geographical areas and by socioeconomic status. Furthermore, a CRVS system provides a way to establish fundamental human and civil rights, because it provides the individual with a legal identity that would allow that person to exercise their rights, including access to social and health services.
Cause-of-death statistics, another product of CRVS systems, are key to monitoring population health and are essential for policy-makers. Yet globally, few low- and middle-income countries have CRVS systems that produce cause-of-death statistics of sufficient quality to guide public health decision-making. Just about one third of all countries (covering about 20% of the world’s population) produce high-quality cause-of-death data collected through a CRVS system, and most of those countries are in Europe and the Americas. A further 72 countries (representing 54% of the world’s population) produce lower quality cause-of-death data, while 73 countries lack such data altogether.1
Scope for better vital statistics in the WHO Western Pacific Region
Sustained collaborative efforts from various government sectors – health, police, justice, defence or security, foreign affairs, national identity (ID) and civil registration departments – are critical for the effective functioning of CRVS systems. Mechanisms have to be established for sharing, linking and managing information efficiently for these multiple sources. In the Asia-Pacific region, a regional programme for CRVS was endorsed at a high-level meeting of decision-makers in December 2012; this led to the establishment of a regional support mechanism to support countries in assessing, strengthening and capacity-building.2 Furthermore, in 2014, the Ministerial Conference on CRVS – attended by ministers and senior representatives of the civil registration, health, statistics and civil society – declared 2015–2024 to be the CRVS Decade for Asia and the Pacific.3
The Philippines is an example of the government-led engagement across several sectors, such as the Philippines Statistics Authority, local civil registrars, and the Department of Health. This engagement has resulted in streamlining of the process for registration of births and deaths, which has also benefited other health services and sectors.
Since 2000, the government has mandated national implementation of International Classification of Diseases 10th Revision (ICD-10) in all health facilities, to improve morbidity and mortality statistics submitted to the Philippines Statistics Authority.4 With the assistance of global and regional partners, several actions to improve information on causes of death have been put in place; these actions include standard reporting procedures, and capacity-building activities to ensure that health professionals are trained for certifying the cause of death (and integration of such training in medical school curricula).
The latest estimates suggest an increase in the completeness of death registration data, from 75% in early 1990s to 89% in 2015, whereas birth registration completeness is currently estimated to be greater than 90%.5 Key elements for establishing a functional CRVS system that can produce vital statistics to support development and health policies are political commitment, public engagement, coordination, enforcement of operational procedures and capacity-building.
1 World health statistics 2017: monitoring health for the SDGs. Geneva: World Health Organization; 2017 (https://www.who.int/gho/publications/world_health_statistics/2017/en/, accessed 27 March 2019).
4 See https://psa.gov.ph/civil-registration-page and https://psa.gov.ph/vital-statistics.
5 WHO estimates, 2019, and Demographic and Social Statistics Branch, United Nations Statistics Division (UNSD), Department of Economic and Social Affairs, United Nations.
2 High-level meeting on the improvement of civil registration and vital statistics (CRVS) in Asia and the Pacific. Bangkok: United Nations Economic and Social Commission for Asia and the Pacific;(https://www.unescap.org/events/high-level-meeting-improvement-civil-registration-and-vital-statistics-crvs-asia-and-pacific, accessed 27 March 2019).
3 Ministerial Conference on Civil Registration and Vital Statistics (CRVS) in Asia and the Pacific (https://www.unescap.org/events/ministerial-conference-civil-registration-and-vital-statistics-asia-and-pacific, accessed 28 March 2019).
3.2.1
Under-fivemortality rate
By sexBothsexes
3.3.1
New HIVinfections
By sexBothsexes
3.3.2
Tuberculosisincidence
By sexBothsexes
3.4.1–2
Probability ofdying fromthe 4 majorNCDs and
suicidemortality rate
By sexBothsexes
3.5.2
Alcoholconsumption
By sexBothsexes
3.9.1–3
Air pollution,unsafeWASH,
unintentionalpoisoning
mortality rate
By sexBothsexes
3.a.1
Tobaccosmoking
prevalence
By sexBothsexes
16.1.1
Mortality ratedue to
homicide
By sexBothsexes
0
20
40
60
80
100
Perc
enta
ge o
f cou
ntrie
s (%
)
0
2
4 Aver
age
lag
(yea
rs)
Time lag between estimate and underlying dataNo underlying data since 2000>4 years
≤4 yearsAverage lag
Comparable estimates with sex disaggregationUnderlying data availability
3.3.5
Need
for N
TDin
terv
entio
ns
3.b.2
ODA
for r
esea
rch
& he
alth
3.d.1
IHR
core
capa
city
scor
e
6.a.1
ODA
for W
ASH
3.c.1
Healt
h wo
rkfo
rce
3.7.2
Adol
esce
nt b
irth
rate
3.1.2
Skille
d bi
rthat
tend
ance
2.2.1
Stun
ting
2.2.2
Was
ting
&ov
erwe
ight
17.19.2
Caus
e-of
-dea
thda
ta co
mpl
eten
ess
3.7.1
Fam
ily p
lanni
ng
5.2.1
Intim
ate
partn
ervio
lence
3.8.2
Finan
cial
prot
ectio
n
0
20
40
60
80
100
Perc
enta
ge o
f cou
ntrie
s (%
)
See Figure 9.1 for further details.Year range 2009–2013 2014–2018
Primary data
See Fig. 9.1 for further details.
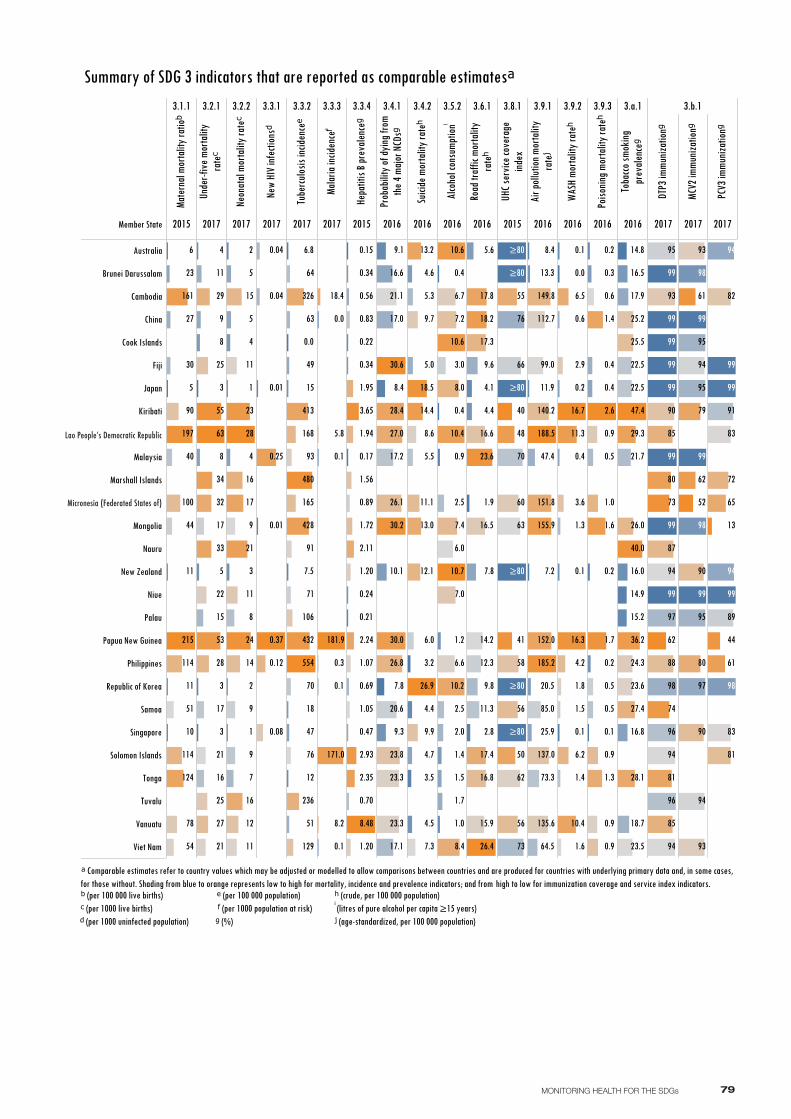
79MONITORING HEALTH FOR THE SDGs
Member State
3.1.1
Mate
rnal
morta
lity r
atioᵇ
2015
3.2.1
Unde
r-five
mor
talit
yra
teᶜ
2017
3.2.2
Neon
atal
morta
lity r
ateᶜ
2017
3.3.1
New
HIV i
nfec
tionsᵈ
2017
3.3.2
Tube
rculos
is inc
idenc
eᵉ
2017
3.3.3
Malar
ia inc
idenc
eᶠ
2017
3.3.4
Hepa
titis
B pre
valen
ceᵍ
2015
3.4.1
Prob
abilit
y of d
ying f
rom
the 4
majo
r NCD
sᵍ
2016
3.4.2
Suici
de m
orta
lity r
ateʰ
2016
3.5.2
Alco
hol c
onsu
mptio
nⁱ
2016
3.6.1
Road
traf
fic m
orta
lity
rateʰ
2016
3.8.1
UHC s
ervic
e cov
erag
eind
ex
2015
3.9.1
Air p
ollut
ion m
orta
lity
rateʲ
2016
3.9.2
WASH
mor
talit
y rat
eʰ
2016
3.9.3
Poiso
ning m
orta
lity r
ateʰ
2016
3.a.1
Toba
cco sm
oking
prev
alenc
eᵍ
2016
3.b.1
DTP3
immu
nizat
ionᵍ
2017
MCV2
immu
nizat
ionᵍ
2017
PCV3
immu
nizat
ionᵍ
2017
Australia
Brunei Darussalam
Cambodia
China
Cook Islands
Fiji
Japan
Kiribati
Lao People's DemocraticRepublic
Malaysia
Marshall Islands
Micronesia (FederatedStates of)
Mongolia
Nauru
New Zealand
Niue
Palau
Papua New Guinea
Philippines
Republic of Korea
Samoa
Singapore
Solomon Islands
Tonga
Tuvalu
Vanuatu
Viet Nam
90
78
6
54
51
5
44
40
30
27
23
215
197
161
124
114
114
11
11
100
10
9
8
8
63
55
53
5
4
34
33
32
3
3
3
29
28
27
25
25
22
21
21
17
17
16
15
11
9
9
9
8
7
5
5
4
4
3
28
24
23
21
2
2
17
16
16
15
14
12
11
11
11
1
1
0.37
0.25
0.12
0.08
0.04
0.04
0.01
0.01
93
91
76
71
70
7.5
64
63
6.8
554
51
49
480
47
432
428
413
326
236
18
168
165
15
129
12
106
0.0
8.2
5.8
181.9
18.4
171.0
0.3
0.1
0.1
0.1
0.0
8.48
3.65
2.93
2.35
2.24
2.11
1.95
1.94
1.72
1.56
1.20
1.20
1.07
1.05
0.89
0.83
0.70
0.69
0.56
0.47
0.34
0.34
0.24
0.22
0.21
0.17
0.15
9.3
9.1
8.4
7.8
30.6
30.2
30.0
28.4
27.0
26.8
26.1
23.8
23.3
23.3
21.1
20.6
17.2
17.1
17.0
16.6
10.1
9.9
9.7
8.6
7.3
6.0
5.5
5.3
5.0
4.7
4.6
4.5
4.4
3.5
3.2
26.9
18.5
14.4
13.2
13.0
12.1
11.1
8.4
8.0
7.4
7.2
7.0
6.7
6.6
6.0
3.0
2.5
2.5
2.0
10.7
10.6
10.6
10.4
10.2
1.7
1.5
1.4
1.2
1.0
0.9
0.4
0.4
9.8
9.6
7.8
5.6
4.4
4.1
26.4
23.6
2.8
18.2
17.8
17.4
17.3
16.8
16.6
16.5
15.9
14.2
12.3
11.3
1.9
76
73
70
66
63
62
60
58
56
56
55
50
48
41
40
≥80
≥80
≥80
≥80
≥80
≥80
99.0
85.0
8.4
73.3
7.2
64.5
47.4
25.9
20.5
188.5
185.2
155.9
152.0
151.8
149.8
140.2
137.0
135.6
13.3
112.7
11.9
6.5
6.2
4.2
3.6
2.9
16.7
16.3
11.3
10.4
1.8
1.6
1.5
1.4
1.3
0.6
0.4
0.2
0.1
0.1
0.1
0.0
2.6
1.7
1.6
1.4
1.3
1.0
0.9
0.9
0.9
0.9
0.6
0.5
0.5
0.5
0.4
0.4
0.3
0.2
0.2
0.2
0.1
47.4
40.0
36.2
29.3
28.1
27.4
26.0
25.5
25.2
24.3
23.6
23.5
22.5
22.5
21.7
18.7
17.9
16.8
16.5
16.0
15.2
14.9
14.8
98
97
96
96
95
94
94
94
93
90
88
87
85
85
81
80
74
73
62
99
99
99
99
99
99
99
99
97
95
95
95
94
94
93
93
90
90
80
79
62
61
52
99
99
99
98
98
91
89
83
83
82
81
72
65
61
44
13
99
99
99
98
94
94
Summary of SDG 3 indicators that are reported as comparable estimatesᵃ
ᵃ Comparable estimates refer to country values which may be adjusted or modelled to allow comparisons between countries and are produced for countries with underlying primary data and, in some cases,for those without. Shading from blue to orange represents low to high for mortality, incidence and prevalence indicators; and from high to low for immunization coverage and service index indicators.ᵇ (per 100 000 live births) ᵉ (per 100 000 population) ʰ (crude, per 100 000 population)ᶜ (per 1000 live births) ᶠ (per 1000 population at risk) i (litres of pure alcohol per capita ≥15 years)ᵈ (per 1000 uninfected population) ᵍ (%) ʲ (age-standardized, per 100 000 population)
Micronesia (Federated States of)
Lao People’s Democratic Republic

81MONITORING HEALTH FOR THE SDGs
ANNEX 2 Tables of health statistics by country, WHO region and globally
Explanatory notes
The statistics shown below represent official World Health Organization (WHO) statistics for selected health-related Sustainable Development Goal (SDG) indicators, based on evidence available in early 2019. In addition, summary measures of health, such as (healthy) life expectancy, and basic demographic and health-economic statistics are included to provide a general indication of the situation.
These statistics have been compiled primarily from publications and databases produced and maintained by WHO, or United Nations (UN) groups of which WHO is a member. A number of statistics have been derived from data produced and maintained by other international organizations. For each indicator, the source of the data series is provided.
The type of data used for each data series (comparable estimate or primary data) is also provided. Comparable estimates are subject to considerable uncertainty, especially for countries where the availability and quality of the underlying primary data are limited. Uncertainty intervals and other details on the indicators and statistics presented here can be found online at the WHO Global Health Observatory.1
For the first time in the World Health Statistics series, the availability of the underlying data is indicated in the annex table for SDGs2 for country values. Indicators that are of primary or other data type are formatted in bold font if the reference year is 2014 onwards, and in normal font if the reference year is between 2009 and 2013. For comparable estimates, data are formatted in bold if primary data were available 4 years preceding the estimate year, normal font if they were available outside of the 4 preceding years and faded font if country estimates were imputed without primary data.
Although every effort has been made to maximize the comparability of statistics across countries and over time, data series based on primary data may differ in terms of the definitions, data-collection methods, population coverage and estimation methods used. For indicators with a reference period expressed as a range, country values refer to the latest available year in the range unless otherwise noted; the accompanying footnotes provide more details. In some cases, because SDG indicator definitions are being refined and baseline data are being collected, proxy indicators have been presented in this annex; where this is the case, proxy indicators have been clearly indicated as such through accompanying footnotes.
Unless otherwise stated, the WHO regional and global aggregates for rates and ratios are weighted averages when relevant, whereas for absolute numbers they are the sums. Aggregates are shown only if data are available for at least 50% of the population (or other denominator) within an indicated group. For indicators with a reference period expressed as a range, aggregates are for the reference period shown in the corresponding table column heading, unless otherwise noted. Some WHO regional and global aggregates may include country estimates that are not individually reported.
Changes in the values shown for indicators reported on in previous editions of the World Health Statistics series should not be assumed to accurately reflect underlying trends. This applies to all data types (comparable estimates, primary data and other data) and all reporting levels (country, regional and global). The data presented here may also differ from, and should not be regarded as, the official national statistics of individual WHO Member States.
1 The Global Health Observatory (GHO) is WHO’s portal providing access to data and analyses for monitoring the global health situation (available at https://www.who.int/gho/en/, accessed 28 March 2019).
2 Excludes total population, life expectancy, healthy life expectancy and current health expenditure (CHE) indicators, which are not official SDG indicators.
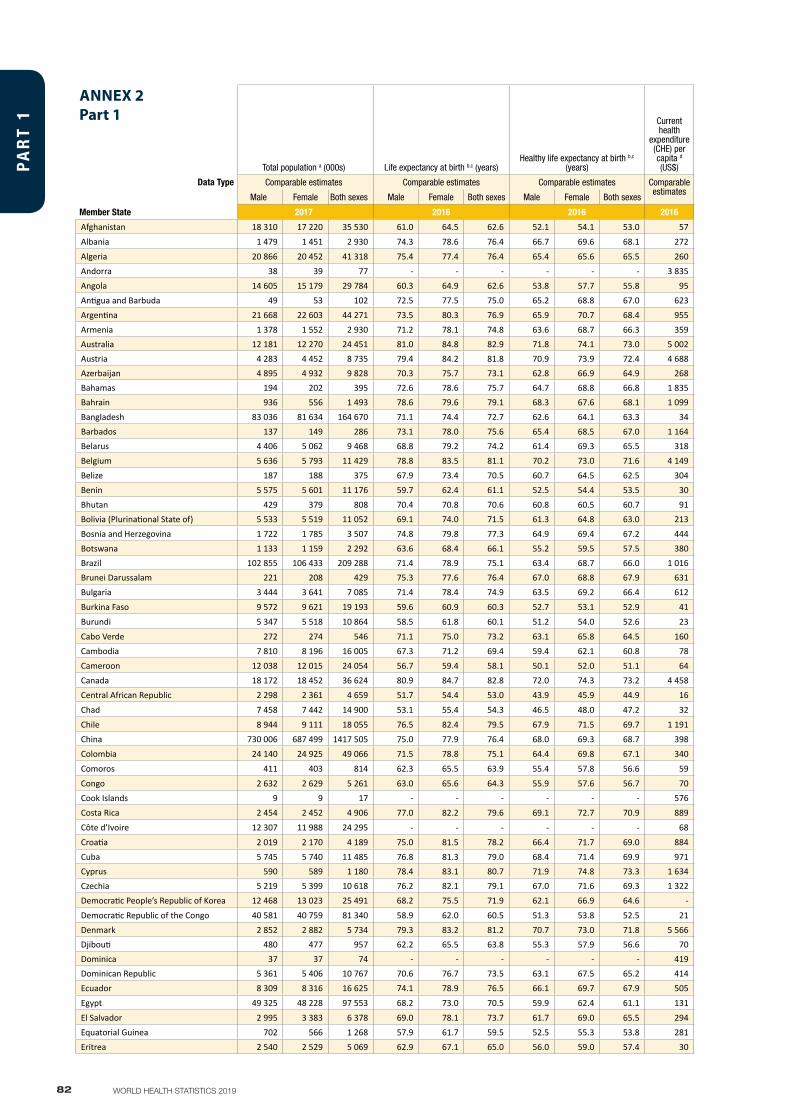
82 WORLD HEALTH STATISTICS 2019
3.1 3.2 3.3
ANNEX 2Part 1
Total population a (000s) Life expectancy at birth b,c (years)Healthy life expectancy at birth b,c
(years)
Current health
expenditure (CHE) per capita d (US$)
Current health
expenditure (CHE) as
percentage of gross domestic product
(GDP) d (%)
Maternal mortality
ratio e (per 100 000
live births)
Proportion of births attended by skilled
health personnel f
(%)Under-five mortality rate g
(per 1000 live births)
Neonatal mortality rate g (per 1000 live
births)New HIV infections h
(per 1000 uninfected population)
Data Type Comparable estimates Comparable estimates Comparable estimates Comparable estimates
Comparable estimates
Comparable estimates
Primary data
Comparable estimates Comparable estimates
Comparable estimates
Male Female Both sexes Male Female Both sexes Male Female Both sexes Male Female Both sexes Male Female Both sexes
Member State 2017 2016 2016 2016 2016 2015 2009–2018 2017 2017 2017 Member State
Afghanistan 18 310 17 220 35 530 61.0 64.5 62.6 52.1 54.1 53.0 57 10.2 396 59 72 64 68 39 - - - Afghanistan
Albania 1 479 1 451 2 930 74.3 78.6 76.4 66.7 69.6 68.1 272 6.7 29 100 10 8 9 6 0.05 0.02 0.03 Albania
Algeria 20 866 20 452 41 318 75.4 77.4 76.4 65.4 65.6 65.5 260 6.6 140 97 26 23 24 15 0.03 0.03 0.03 AlgeriaAndorra 38 39 77 - - - - - - 3 835 10.4 - 100 ah 4 3 3 1 - - - AndorraAngola 14 605 15 179 29 784 60.3 64.9 62.6 53.8 57.7 55.8 95 2.9 477 47 87 75 81 29 0.73 1.23 0.99 AngolaAntigua and Barbuda 49 53 102 72.5 77.5 75.0 65.2 68.8 67.0 623 4.3 - 100 ai 8 7 7 4 - - - Antigua and BarbudaArgentina 21 668 22 603 44 271 73.5 80.3 76.9 65.9 70.7 68.4 955 7.5 52 94 11 9 10 6 0.21 0.09 0.15 ArgentinaArmenia 1 378 1 552 2 930 71.2 78.1 74.8 63.6 68.7 66.3 359 9.9 25 100 ah 14 11 13 7 0.09 0.03 0.06 ArmeniaAustralia 12 181 12 270 24 451 81.0 84.8 82.9 71.8 74.1 73.0 5 002 9.3 6 97 ai 4 3 4 2 0.07 0.01 0.04 AustraliaAustria 4 283 4 452 8 735 79.4 84.2 81.8 70.9 73.9 72.4 4 688 10.4 4 98 ai 4 3 4 2 0.04 0.01 0.02 AustriaAzerbaijan 4 895 4 932 9 828 70.3 75.7 73.1 62.8 66.9 64.9 268 6.9 25 100 ah 25 21 23 12 0.11 0.04 0.08 AzerbaijanBahamas 194 202 395 72.6 78.6 75.7 64.7 68.8 66.8 1 835 6.4 80 99 ai 8 7 7 4 0.54 0.23 0.38 BahamasBahrain 936 556 1 493 78.6 79.6 79.1 68.3 67.6 68.1 1 099 4.9 15 100 ai 8 7 7 3 0.04 0.03 0.04 BahrainBangladesh 83 036 81 634 164 670 71.1 74.4 72.7 62.6 64.1 63.3 34 2.4 176 68 35 30 32 18 0.01 0.01 0.01 BangladeshBarbados 137 149 286 73.1 78.0 75.6 65.4 68.5 67.0 1 164 7.0 27 99 ai 14 11 12 8 0.83 0.33 0.57 BarbadosBelarus 4 406 5 062 9 468 68.8 79.2 74.2 61.4 69.3 65.5 318 6.3 4 100 ah 4 3 4 2 0.34 0.20 0.27 BelarusBelgium 5 636 5 793 11 429 78.8 83.5 81.1 70.2 73.0 71.6 4 149 10.0 7 - 4 3 4 2 - - - BelgiumBelize 187 188 375 67.9 73.4 70.5 60.7 64.5 62.5 304 6.1 28 92 ai 16 13 14 9 1.03 0.83 0.93 BelizeBenin 5 575 5 601 11 176 59.7 62.4 61.1 52.5 54.4 53.5 30 3.9 405 78 104 93 98 33 0.30 0.44 0.37 BeninBhutan 429 379 808 70.4 70.8 70.6 60.8 60.5 60.7 91 3.5 148 96 ah 34 28 31 17 - - - BhutanBolivia (Plurinational State of) 5 533 5 519 11 052 69.1 74.0 71.5 61.3 64.8 63.0 213 6.9 206 71 ai 38 31 35 19 0.19 0.08 0.14 Bolivia (Plurinational State of)Bosnia and Herzegovina 1 722 1 785 3 507 74.8 79.8 77.3 64.9 69.4 67.2 444 9.2 11 100 6 5 6 4 - - - Bosnia and HerzegovinaBotswana 1 133 1 159 2 292 63.6 68.4 66.1 55.2 59.5 57.5 380 5.5 129 100 ai 41 34 38 25 6.61 8.38 7.47 BotswanaBrazil 102 855 106 433 209 288 71.4 78.9 75.1 63.4 68.7 66.0 1 016 11.8 44 99 ai 17 13 15 9 0.33 0.14 0.24 BrazilBrunei Darussalam 221 208 429 75.3 77.6 76.4 67.0 68.8 67.9 631 2.3 23 100 ah 11 10 11 5 - - - Brunei DarussalamBulgaria 3 444 3 641 7 085 71.4 78.4 74.9 63.5 69.2 66.4 612 8.2 11 100 8 7 8 4 0.05 0.01 0.03 Bulgaria
Burkina Faso 9 572 9 621 19 193 59.6 60.9 60.3 52.7 53.1 52.9 41 6.8 371 80 85 77 81 25 0.22 0.24 0.23 Burkina Faso
Burundi 5 347 5 518 10 864 58.5 61.8 60.1 51.2 54.0 52.6 23 7.7 712 85 66 56 61 22 0.25 0.34 0.29 Burundi
Cabo Verde 272 274 546 71.1 75.0 73.2 63.1 65.8 64.5 160 5.3 42 93 19 16 17 10 0.20 0.27 0.24 Cabo VerdeCambodia 7 810 8 196 16 005 67.3 71.2 69.4 59.4 62.1 60.8 78 6.1 161 89 ah 33 26 29 15 0.04 0.04 0.04 CambodiaCameroon 12 038 12 015 24 054 56.7 59.4 58.1 50.1 52.0 51.1 64 4.7 596 65 90 78 84 26 0.94 1.54 1.24 CameroonCanada 18 172 18 452 36 624 80.9 84.7 82.8 72.0 74.3 73.2 4 458 10.5 7 98 ai 6 5 5 4 - - - CanadaCentral African Republic 2 298 2 361 4 659 51.7 54.4 53.0 43.9 45.9 44.9 16 4.3 882 40 128 115 122 42 1.51 1.92 1.71 Central African Republic
Chad 7 458 7 442 14 900 53.1 55.4 54.3 46.5 48.0 47.2 32 4.5 856 20 130 116 123 35 0.35 0.47 0.41 Chad
Chile 8 944 9 111 18 055 76.5 82.4 79.5 67.9 71.5 69.7 1 191 8.5 22 100 8 7 7 5 0.48 0.19 0.33 ChileChina 730 006 687 499 1417 505 75.0 77.9 76.4 68.0 69.3 68.7 398 5.0 27 100 ah 10 9 9 5 - - - ChinaColombia 24 140 24 925 49 066 71.5 78.8 75.1 64.4 69.8 67.1 340 5.9 64 99 16 13 15 8 - - - Colombia
Comoros 411 403 814 62.3 65.5 63.9 55.4 57.8 56.6 59 7.6 335 82 74 63 69 32 0.02 0.01 0.01 Comoros
Congo 2 632 2 629 5 261 63.0 65.6 64.3 55.9 57.6 56.7 70 4.6 442 91 52 43 48 19 1.17 2.02 1.59 CongoCook Islands 9 9 17 - - - - - - 576 3.4 - 100 ah 8 7 8 4 - - - Cook IslandsCosta Rica 2 454 2 452 4 906 77.0 82.2 79.6 69.1 72.7 70.9 889 7.6 25 99 10 8 9 6 0.31 0.13 0.22 Costa Rica
Côte d’Ivoire 12 307 11 988 24 295 - - - - - - 68 4.4 645 74 97 80 89 34 1.24 1.33 1.29 Côte d’Ivoire
Croatia 2 019 2 170 4 189 75.0 81.5 78.2 66.4 71.7 69.0 884 7.2 8 100 5 4 5 3 - - - CroatiaCuba 5 745 5 740 11 485 76.8 81.3 79.0 68.4 71.4 69.9 971 12.2 39 100 ai 6 5 5 2 0.24 0.09 0.17 CubaCyprus 590 589 1 180 78.4 83.1 80.7 71.9 74.8 73.3 1 634 6.9 7 96 ai 3 3 3 2 0.09 0.02 0.06 CyprusCzechia 5 219 5 399 10 618 76.2 82.1 79.1 67.0 71.6 69.3 1 322 7.1 4 100 ai 4 3 3 2 0.05 <0.01 0.03 CzechiaDemocratic People’s Republic of Korea 12 468 13 023 25 491 68.2 75.5 71.9 62.1 66.9 64.6 - - 82 100 21 17 19 10 - - - Democratic People’s Republic of Korea
Democratic Republic of the Congo 40 581 40 759 81 340 58.9 62.0 60.5 51.3 53.8 52.5 21 3.9 693 80 98 84 91 29 0.12 0.23 0.17 Democratic Republic of the CongoDenmark 2 852 2 882 5 734 79.3 83.2 81.2 70.7 73.0 71.8 5 566 10.4 6 95 ai 5 4 4 3 0.04 0.01 0.02 DenmarkDjibouti 480 477 957 62.2 65.5 63.8 55.3 57.9 56.6 70 3.5 229 87 ah 67 56 62 32 0.53 0.69 0.61 DjiboutiDominica 37 37 74 - - - - - - 419 5.3 - 97 ai 37 31 34 27 - - - DominicaDominican Republic 5 361 5 406 10 767 70.6 76.7 73.5 63.1 67.5 65.2 414 6.2 92 100 ai 33 27 30 20 0.24 0.21 0.22 Dominican RepublicEcuador 8 309 8 316 16 625 74.1 78.9 76.5 66.1 69.7 67.9 505 8.4 64 96 16 13 15 8 0.18 0.08 0.12 Ecuador
Egypt 49 325 48 228 97 553 68.2 73.0 70.5 59.9 62.4 61.1 131 4.6 33 92 23 21 22 12 0.03 0.01 0.02 Egypt
El Salvador 2 995 3 383 6 378 69.0 78.1 73.7 61.7 69.0 65.5 294 7.0 54 100 16 13 15 7 0.27 0.12 0.19 El SalvadorEquatorial Guinea 702 566 1 268 57.9 61.7 59.5 52.5 55.3 53.8 281 3.4 342 68 ah 96 83 90 31 3.19 3.76 3.45 Equatorial GuineaEritrea 2 540 2 529 5 069 62.9 67.1 65.0 56.0 59.0 57.4 30 3.0 501 34 48 38 43 18 0.12 0.20 0.16 Eritrea
PA
RT
1
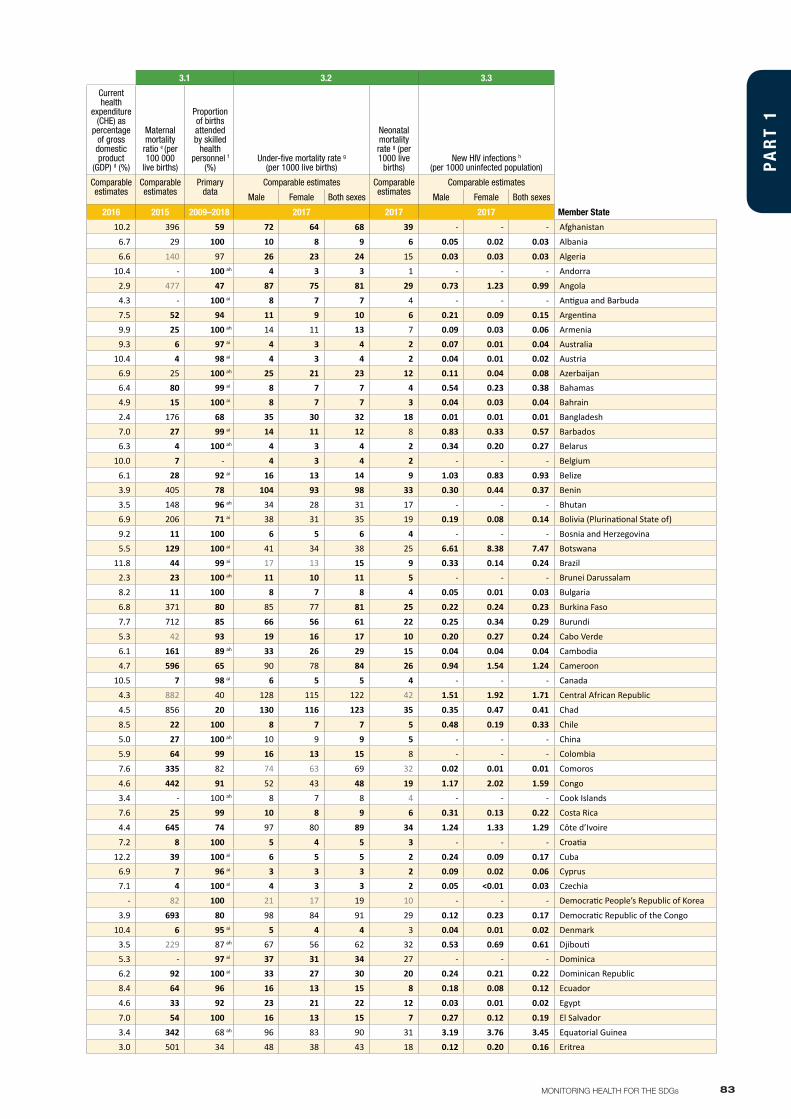
83MONITORING HEALTH FOR THE SDGs
3.1 3.2 3.3
ANNEX 2Part 1
Total population a (000s) Life expectancy at birth b,c (years)Healthy life expectancy at birth b,c
(years)
Current health
expenditure (CHE) per capita d (US$)
Current health
expenditure (CHE) as
percentage of gross domestic product
(GDP) d (%)
Maternal mortality
ratio e (per 100 000
live births)
Proportion of births attended by skilled
health personnel f
(%)Under-five mortality rate g
(per 1000 live births)
Neonatal mortality rate g (per 1000 live
births)New HIV infections h
(per 1000 uninfected population)
Data Type Comparable estimates Comparable estimates Comparable estimates Comparable estimates
Comparable estimates
Comparable estimates
Primary data
Comparable estimates Comparable estimates
Comparable estimates
Male Female Both sexes Male Female Both sexes Male Female Both sexes Male Female Both sexes Male Female Both sexes
Member State 2017 2016 2016 2016 2016 2015 2009–2018 2017 2017 2017 Member State
Afghanistan 18 310 17 220 35 530 61.0 64.5 62.6 52.1 54.1 53.0 57 10.2 396 59 72 64 68 39 - - - Afghanistan
Albania 1 479 1 451 2 930 74.3 78.6 76.4 66.7 69.6 68.1 272 6.7 29 100 10 8 9 6 0.05 0.02 0.03 Albania
Algeria 20 866 20 452 41 318 75.4 77.4 76.4 65.4 65.6 65.5 260 6.6 140 97 26 23 24 15 0.03 0.03 0.03 AlgeriaAndorra 38 39 77 - - - - - - 3 835 10.4 - 100 ah 4 3 3 1 - - - AndorraAngola 14 605 15 179 29 784 60.3 64.9 62.6 53.8 57.7 55.8 95 2.9 477 47 87 75 81 29 0.73 1.23 0.99 AngolaAntigua and Barbuda 49 53 102 72.5 77.5 75.0 65.2 68.8 67.0 623 4.3 - 100 ai 8 7 7 4 - - - Antigua and BarbudaArgentina 21 668 22 603 44 271 73.5 80.3 76.9 65.9 70.7 68.4 955 7.5 52 94 11 9 10 6 0.21 0.09 0.15 ArgentinaArmenia 1 378 1 552 2 930 71.2 78.1 74.8 63.6 68.7 66.3 359 9.9 25 100 ah 14 11 13 7 0.09 0.03 0.06 ArmeniaAustralia 12 181 12 270 24 451 81.0 84.8 82.9 71.8 74.1 73.0 5 002 9.3 6 97 ai 4 3 4 2 0.07 0.01 0.04 AustraliaAustria 4 283 4 452 8 735 79.4 84.2 81.8 70.9 73.9 72.4 4 688 10.4 4 98 ai 4 3 4 2 0.04 0.01 0.02 AustriaAzerbaijan 4 895 4 932 9 828 70.3 75.7 73.1 62.8 66.9 64.9 268 6.9 25 100 ah 25 21 23 12 0.11 0.04 0.08 AzerbaijanBahamas 194 202 395 72.6 78.6 75.7 64.7 68.8 66.8 1 835 6.4 80 99 ai 8 7 7 4 0.54 0.23 0.38 BahamasBahrain 936 556 1 493 78.6 79.6 79.1 68.3 67.6 68.1 1 099 4.9 15 100 ai 8 7 7 3 0.04 0.03 0.04 BahrainBangladesh 83 036 81 634 164 670 71.1 74.4 72.7 62.6 64.1 63.3 34 2.4 176 68 35 30 32 18 0.01 0.01 0.01 BangladeshBarbados 137 149 286 73.1 78.0 75.6 65.4 68.5 67.0 1 164 7.0 27 99 ai 14 11 12 8 0.83 0.33 0.57 BarbadosBelarus 4 406 5 062 9 468 68.8 79.2 74.2 61.4 69.3 65.5 318 6.3 4 100 ah 4 3 4 2 0.34 0.20 0.27 BelarusBelgium 5 636 5 793 11 429 78.8 83.5 81.1 70.2 73.0 71.6 4 149 10.0 7 - 4 3 4 2 - - - BelgiumBelize 187 188 375 67.9 73.4 70.5 60.7 64.5 62.5 304 6.1 28 92 ai 16 13 14 9 1.03 0.83 0.93 BelizeBenin 5 575 5 601 11 176 59.7 62.4 61.1 52.5 54.4 53.5 30 3.9 405 78 104 93 98 33 0.30 0.44 0.37 BeninBhutan 429 379 808 70.4 70.8 70.6 60.8 60.5 60.7 91 3.5 148 96 ah 34 28 31 17 - - - BhutanBolivia (Plurinational State of) 5 533 5 519 11 052 69.1 74.0 71.5 61.3 64.8 63.0 213 6.9 206 71 ai 38 31 35 19 0.19 0.08 0.14 Bolivia (Plurinational State of)Bosnia and Herzegovina 1 722 1 785 3 507 74.8 79.8 77.3 64.9 69.4 67.2 444 9.2 11 100 6 5 6 4 - - - Bosnia and HerzegovinaBotswana 1 133 1 159 2 292 63.6 68.4 66.1 55.2 59.5 57.5 380 5.5 129 100 ai 41 34 38 25 6.61 8.38 7.47 BotswanaBrazil 102 855 106 433 209 288 71.4 78.9 75.1 63.4 68.7 66.0 1 016 11.8 44 99 ai 17 13 15 9 0.33 0.14 0.24 BrazilBrunei Darussalam 221 208 429 75.3 77.6 76.4 67.0 68.8 67.9 631 2.3 23 100 ah 11 10 11 5 - - - Brunei DarussalamBulgaria 3 444 3 641 7 085 71.4 78.4 74.9 63.5 69.2 66.4 612 8.2 11 100 8 7 8 4 0.05 0.01 0.03 Bulgaria
Burkina Faso 9 572 9 621 19 193 59.6 60.9 60.3 52.7 53.1 52.9 41 6.8 371 80 85 77 81 25 0.22 0.24 0.23 Burkina Faso
Burundi 5 347 5 518 10 864 58.5 61.8 60.1 51.2 54.0 52.6 23 7.7 712 85 66 56 61 22 0.25 0.34 0.29 Burundi
Cabo Verde 272 274 546 71.1 75.0 73.2 63.1 65.8 64.5 160 5.3 42 93 19 16 17 10 0.20 0.27 0.24 Cabo VerdeCambodia 7 810 8 196 16 005 67.3 71.2 69.4 59.4 62.1 60.8 78 6.1 161 89 ah 33 26 29 15 0.04 0.04 0.04 CambodiaCameroon 12 038 12 015 24 054 56.7 59.4 58.1 50.1 52.0 51.1 64 4.7 596 65 90 78 84 26 0.94 1.54 1.24 CameroonCanada 18 172 18 452 36 624 80.9 84.7 82.8 72.0 74.3 73.2 4 458 10.5 7 98 ai 6 5 5 4 - - - CanadaCentral African Republic 2 298 2 361 4 659 51.7 54.4 53.0 43.9 45.9 44.9 16 4.3 882 40 128 115 122 42 1.51 1.92 1.71 Central African Republic
Chad 7 458 7 442 14 900 53.1 55.4 54.3 46.5 48.0 47.2 32 4.5 856 20 130 116 123 35 0.35 0.47 0.41 Chad
Chile 8 944 9 111 18 055 76.5 82.4 79.5 67.9 71.5 69.7 1 191 8.5 22 100 8 7 7 5 0.48 0.19 0.33 ChileChina 730 006 687 499 1417 505 75.0 77.9 76.4 68.0 69.3 68.7 398 5.0 27 100 ah 10 9 9 5 - - - ChinaColombia 24 140 24 925 49 066 71.5 78.8 75.1 64.4 69.8 67.1 340 5.9 64 99 16 13 15 8 - - - Colombia
Comoros 411 403 814 62.3 65.5 63.9 55.4 57.8 56.6 59 7.6 335 82 74 63 69 32 0.02 0.01 0.01 Comoros
Congo 2 632 2 629 5 261 63.0 65.6 64.3 55.9 57.6 56.7 70 4.6 442 91 52 43 48 19 1.17 2.02 1.59 CongoCook Islands 9 9 17 - - - - - - 576 3.4 - 100 ah 8 7 8 4 - - - Cook IslandsCosta Rica 2 454 2 452 4 906 77.0 82.2 79.6 69.1 72.7 70.9 889 7.6 25 99 10 8 9 6 0.31 0.13 0.22 Costa Rica
Côte d’Ivoire 12 307 11 988 24 295 - - - - - - 68 4.4 645 74 97 80 89 34 1.24 1.33 1.29 Côte d’Ivoire
Croatia 2 019 2 170 4 189 75.0 81.5 78.2 66.4 71.7 69.0 884 7.2 8 100 5 4 5 3 - - - CroatiaCuba 5 745 5 740 11 485 76.8 81.3 79.0 68.4 71.4 69.9 971 12.2 39 100 ai 6 5 5 2 0.24 0.09 0.17 CubaCyprus 590 589 1 180 78.4 83.1 80.7 71.9 74.8 73.3 1 634 6.9 7 96 ai 3 3 3 2 0.09 0.02 0.06 CyprusCzechia 5 219 5 399 10 618 76.2 82.1 79.1 67.0 71.6 69.3 1 322 7.1 4 100 ai 4 3 3 2 0.05 <0.01 0.03 CzechiaDemocratic People’s Republic of Korea 12 468 13 023 25 491 68.2 75.5 71.9 62.1 66.9 64.6 - - 82 100 21 17 19 10 - - - Democratic People’s Republic of Korea
Democratic Republic of the Congo 40 581 40 759 81 340 58.9 62.0 60.5 51.3 53.8 52.5 21 3.9 693 80 98 84 91 29 0.12 0.23 0.17 Democratic Republic of the CongoDenmark 2 852 2 882 5 734 79.3 83.2 81.2 70.7 73.0 71.8 5 566 10.4 6 95 ai 5 4 4 3 0.04 0.01 0.02 DenmarkDjibouti 480 477 957 62.2 65.5 63.8 55.3 57.9 56.6 70 3.5 229 87 ah 67 56 62 32 0.53 0.69 0.61 DjiboutiDominica 37 37 74 - - - - - - 419 5.3 - 97 ai 37 31 34 27 - - - DominicaDominican Republic 5 361 5 406 10 767 70.6 76.7 73.5 63.1 67.5 65.2 414 6.2 92 100 ai 33 27 30 20 0.24 0.21 0.22 Dominican RepublicEcuador 8 309 8 316 16 625 74.1 78.9 76.5 66.1 69.7 67.9 505 8.4 64 96 16 13 15 8 0.18 0.08 0.12 Ecuador
Egypt 49 325 48 228 97 553 68.2 73.0 70.5 59.9 62.4 61.1 131 4.6 33 92 23 21 22 12 0.03 0.01 0.02 Egypt
El Salvador 2 995 3 383 6 378 69.0 78.1 73.7 61.7 69.0 65.5 294 7.0 54 100 16 13 15 7 0.27 0.12 0.19 El SalvadorEquatorial Guinea 702 566 1 268 57.9 61.7 59.5 52.5 55.3 53.8 281 3.4 342 68 ah 96 83 90 31 3.19 3.76 3.45 Equatorial GuineaEritrea 2 540 2 529 5 069 62.9 67.1 65.0 56.0 59.0 57.4 30 3.0 501 34 48 38 43 18 0.12 0.20 0.16 Eritrea
PA
RT
1
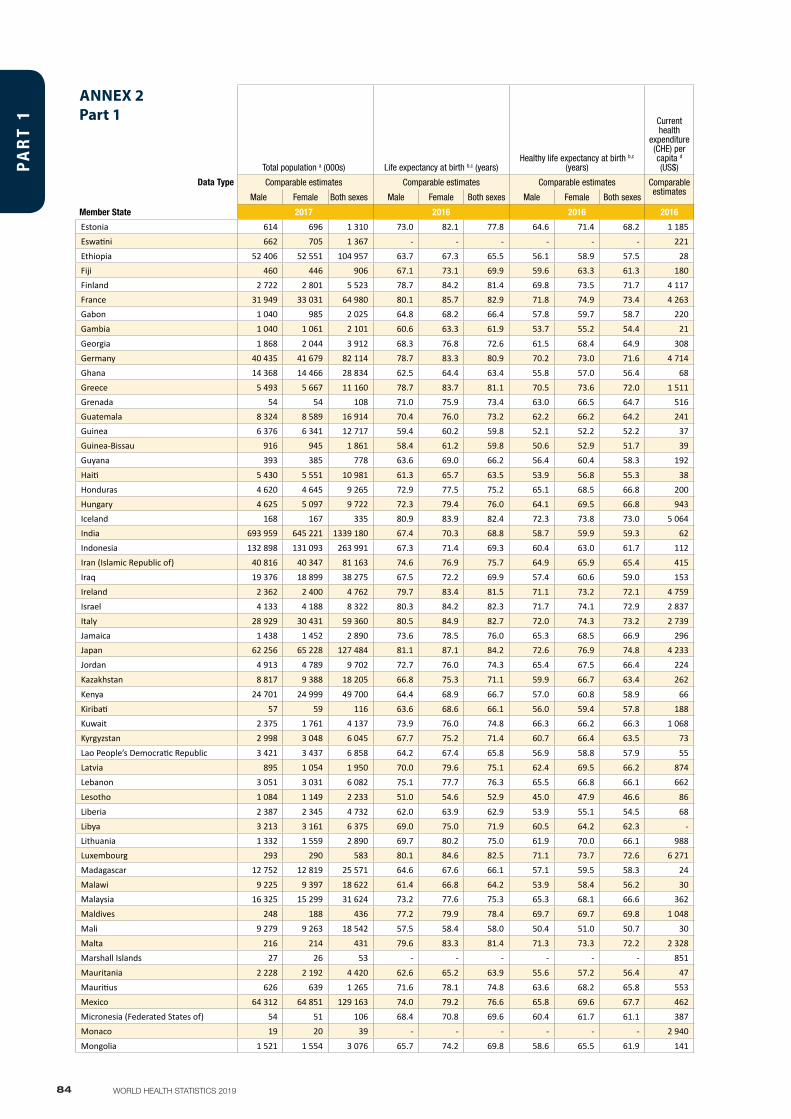
84 WORLD HEALTH STATISTICS 2019
3.1 3.2 3.3
ANNEX 2Part 1
Total population a (000s) Life expectancy at birth b,c (years)Healthy life expectancy at birth b,c
(years)
Current health
expenditure (CHE) per capita d (US$)
Current health
expenditure (CHE) as
percentage of gross domestic product
(GDP) d (%)
Maternal mortality
ratio e (per 100 000
live births)
Proportion of births attended by skilled
health personnel f
(%)Under-five mortality rate g
(per 1000 live births)
Neonatal mortality rate g (per 1000 live
births)New HIV infections h
(per 1000 uninfected population)
Data Type Comparable estimates Comparable estimates Comparable estimates Comparable estimates
Comparable estimates
Comparable estimates
Primary data
Comparable estimates Comparable estimates
Comparable estimates
Male Female Both sexes Male Female Both sexes Male Female Both sexes Male Female Both sexes Male Female Both sexes
Member State 2017 2016 2016 2016 2016 2015 2009–2018 2017 2017 2017 Member State
Estonia 614 696 1 310 73.0 82.1 77.8 64.6 71.4 68.2 1 185 6.7 9 99 ai 3 3 3 1 0.30 0.10 0.19 EstoniaEswatini 662 705 1 367 - - - - - - 221 7.7 389 88 58 49 54 17 6.77 9.32 8.02 EswatiniEthiopia 52 406 52 551 104 957 63.7 67.3 65.5 56.1 58.9 57.5 28 4.0 353 28 ah 65 52 59 29 0.14 0.21 0.17 EthiopiaFiji 460 446 906 67.1 73.1 69.9 59.6 63.3 61.3 180 3.5 30 100 ah 28 23 25 11 - - - FijiFinland 2 722 2 801 5 523 78.7 84.2 81.4 69.8 73.5 71.7 4 117 9.5 3 100 ai 3 2 2 2 - - - FinlandFrance 31 949 33 031 64 980 80.1 85.7 82.9 71.8 74.9 73.4 4 263 11.5 8 98 ai 5 4 4 2 0.11 0.05 0.08 FranceGabon 1 040 985 2 025 64.8 68.2 66.4 57.8 59.7 58.7 220 3.1 291 89 ah 53 44 48 22 1.02 2.23 1.60 GabonGambia 1 040 1 061 2 101 60.6 63.3 61.9 53.7 55.2 54.4 21 4.4 706 57 68 59 64 28 0.63 0.73 0.68 Gambia
Georgia 1 868 2 044 3 912 68.3 76.8 72.6 61.5 68.4 64.9 308 8.4 36 100 12 10 11 7 0.38 0.08 0.22 GeorgiaGermany 40 435 41 679 82 114 78.7 83.3 80.9 70.2 73.0 71.6 4 714 11.1 6 99 ai 4 3 4 2 - - 0.03 GermanyGhana 14 368 14 466 28 834 62.5 64.4 63.4 55.8 57.0 56.4 68 4.4 319 78 54 44 49 24 0.51 0.86 0.68 GhanaGreece 5 493 5 667 11 160 78.7 83.7 81.1 70.5 73.6 72.0 1 511 8.5 3 100 ah 6 5 5 3 0.14 0.03 0.09 GreeceGrenada 54 54 108 71.0 75.9 73.4 63.0 66.5 64.7 516 5.2 27 99 ai 18 15 17 11 - - - GrenadaGuatemala 8 324 8 589 16 914 70.4 76.0 73.2 62.2 66.2 64.2 241 5.8 88 69 ai 30 25 28 13 0.18 0.11 0.14 GuatemalaGuinea 6 376 6 341 12 717 59.4 60.2 59.8 52.1 52.2 52.2 37 5.5 679 63 ah 91 81 86 24 0.58 0.74 0.66 GuineaGuinea-Bissau 916 945 1 861 58.4 61.2 59.8 50.6 52.9 51.7 39 6.1 549 45 ah 90 78 84 37 1.16 1.46 1.31 Guinea-BissauGuyana 393 385 778 63.6 69.0 66.2 56.4 60.4 58.3 192 4.2 229 86 35 27 31 19 0.67 0.56 0.62 Guyana
Haiti 5 430 5 551 10 981 61.3 65.7 63.5 53.9 56.8 55.3 38 5.4 359 42 77 66 72 28 0.69 0.71 0.73 HaitiHonduras 4 620 4 645 9 265 72.9 77.5 75.2 65.1 68.5 66.8 200 8.4 129 74 ai 20 16 18 10 0.14 0.06 0.10 HondurasHungary 4 625 5 097 9 722 72.3 79.4 76.0 64.1 69.5 66.8 943 7.4 17 100 ah 5 4 5 2 0.05 0.01 0.03 HungaryIceland 168 167 335 80.9 83.9 82.4 72.3 73.8 73.0 5 064 8.3 3 98 ai 2 2 2 1 - - - IcelandIndia 693 959 645 221 1339 180 67.4 70.3 68.8 58.7 59.9 59.3 62 3.6 174 81 ah 39 40 39 24 - - 0.10 IndiaIndonesia 132 898 131 093 263 991 67.3 71.4 69.3 60.4 63.0 61.7 112 3.1 126 94 28 22 25 12 0.24 0.14 0.19 IndonesiaIran (Islamic Republic of) 40 816 40 347 81 163 74.6 76.9 75.7 64.9 65.9 65.4 415 8.1 25 99 ah 16 14 15 9 0.09 0.03 0.06 Iran (Islamic Republic of)Iraq 19 376 18 899 38 275 67.5 72.2 69.9 57.4 60.6 59.0 153 3.3 50 96 33 27 30 17 - - - IraqIreland 2 362 2 400 4 762 79.7 83.4 81.5 71.1 73.2 72.1 4 759 7.4 8 100 ai 4 3 4 2 - - - IrelandIsrael 4 133 4 188 8 322 80.3 84.2 82.3 71.7 74.1 72.9 2 837 7.3 5 - 4 3 4 2 - - - IsraelItaly 28 929 30 431 59 360 80.5 84.9 82.7 72.0 74.3 73.2 2 739 8.9 4 100 ai 4 3 3 2 0.07 0.02 0.05 ItalyJamaica 1 438 1 452 2 890 73.6 78.5 76.0 65.3 68.5 66.9 296 6.1 89 98 ai 17 13 15 11 - - 0.66 JamaicaJapan 62 256 65 228 127 484 81.1 87.1 84.2 72.6 76.9 74.8 4 233 10.9 5 100 ai 3 2 3 1 0.02 <0.01 0.01 JapanJordan 4 913 4 789 9 702 72.7 76.0 74.3 65.4 67.5 66.4 224 5.5 58 100 18 16 17 10 - - - Jordan
Kazakhstan 8 817 9 388 18 205 66.8 75.3 71.1 59.9 66.7 63.4 262 3.5 12 99 11 9 10 5 0.28 0.12 0.19 Kazakhstan
Kenya 24 701 24 999 49 700 64.4 68.9 66.7 57.0 60.8 58.9 66 4.5 510 62 50 42 46 21 0.99 1.44 1.21 KenyaKiribati 57 59 116 63.6 68.6 66.1 56.0 59.4 57.8 188 11.9 90 98 ah 59 50 55 23 - - - KiribatiKuwait 2 375 1 761 4 137 73.9 76.0 74.8 66.3 66.2 66.3 1 068 3.9 4 100 ai 9 8 8 4 0.07 0.03 0.05 KuwaitKyrgyzstan 2 998 3 048 6 045 67.7 75.2 71.4 60.7 66.4 63.5 73 6.6 76 98 22 18 20 11 0.14 0.06 0.10 Kyrgyzstan
Lao People’s Democratic Republic 3 421 3 437 6 858 64.2 67.4 65.8 56.9 58.8 57.9 55 2.4 197 64 69 58 63 28 - - - Lao People’s Democratic RepublicLatvia 895 1 054 1 950 70.0 79.6 75.1 62.4 69.5 66.2 874 6.2 18 100 ai 5 4 4 2 - - - LatviaLebanon 3 051 3 031 6 082 75.1 77.7 76.3 65.5 66.8 66.1 662 8.0 15 - 8 7 8 5 0.04 0.01 0.03 Lebanon
Lesotho 1 084 1 149 2 233 51.0 54.6 52.9 45.0 47.9 46.6 86 8.1 487 78 93 79 86 38 8.03 10.13 9.07 Lesotho
Liberia 2 387 2 345 4 732 62.0 63.9 62.9 53.9 55.1 54.5 68 9.6 725 61 80 69 75 25 0.43 0.60 0.51 LiberiaLibya 3 213 3 161 6 375 69.0 75.0 71.9 60.5 64.2 62.3 - - 9 100 ah 14 11 12 7 - - - LibyaLithuania 1 332 1 559 2 890 69.7 80.2 75.0 61.9 70.0 66.1 988 6.7 10 100 ah 5 4 4 2 0.18 0.06 0.12 LithuaniaLuxembourg 293 290 583 80.1 84.6 82.5 71.1 73.7 72.6 6 271 6.2 10 100 ai 3 2 3 2 0.17 0.04 0.10 LuxembourgMadagascar 12 752 12 819 25 571 64.6 67.6 66.1 57.1 59.5 58.3 24 6.0 353 44 48 40 44 18 0.30 0.13 0.22 MadagascarMalawi 9 225 9 397 18 622 61.4 66.8 64.2 53.9 58.4 56.2 30 9.8 634 90 ah 60 50 55 23 2.10 2.69 2.39 MalawiMalaysia 16 325 15 299 31 624 73.2 77.6 75.3 65.3 68.1 66.6 362 3.8 40 100 ah 9 7 8 4 0.43 0.07 0.25 MalaysiaMaldives 248 188 436 77.2 79.9 78.4 69.7 69.7 69.8 1 048 10.6 68 96 9 7 8 5 - - - Maldives
Mali 9 279 9 263 18 542 57.5 58.4 58.0 50.4 51.0 50.7 30 3.8 587 44 111 101 106 35 0.48 0.62 0.55 MaliMalta 216 214 431 79.6 83.3 81.4 71.3 73.3 72.2 2 328 9.3 9 100 ai 7 6 6 4 - - - MaltaMarshall Islands 27 26 53 - - - - - - 851 23.3 - 92 40 32 34 16 - - - Marshall Islands
Mauritania 2 228 2 192 4 420 62.6 65.2 63.9 55.6 57.2 56.4 47 4.2 602 69 85 73 79 34 0.08 0.05 0.06 MauritaniaMauritius 626 639 1 265 71.6 78.1 74.8 63.6 68.2 65.8 553 5.7 53 100 ah 14 12 13 8 - - - MauritiusMexico 64 312 64 851 129 163 74.0 79.2 76.6 65.8 69.6 67.7 462 5.5 38 98 15 12 13 8 0.18 0.05 0.12 MexicoMicronesia (Federated States of) 54 51 106 68.4 70.8 69.6 60.4 61.7 61.1 387 12.6 100 100 ah 35 29 32 17 - - - Micronesia (Federated States of)Monaco 19 20 39 - - - - - - 2 940 1.7 - - 4 3 3 2 - - - Monaco
Mongolia 1 521 1 554 3 076 65.7 74.2 69.8 58.6 65.5 61.9 141 3.8 44 99 20 14 17 9 0.02 <0.01 0.01 Mongolia
PA
RT
1
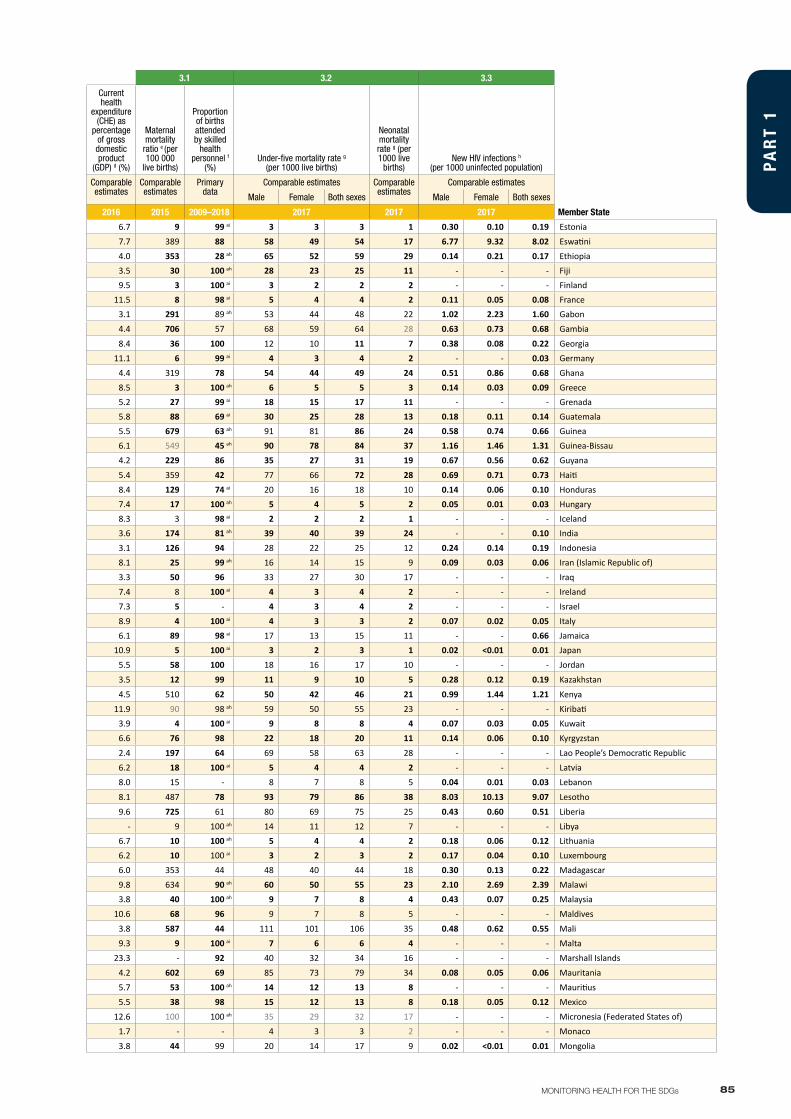
85MONITORING HEALTH FOR THE SDGs
3.1 3.2 3.3
ANNEX 2Part 1
Total population a (000s) Life expectancy at birth b,c (years)Healthy life expectancy at birth b,c
(years)
Current health
expenditure (CHE) per capita d (US$)
Current health
expenditure (CHE) as
percentage of gross domestic product
(GDP) d (%)
Maternal mortality
ratio e (per 100 000
live births)
Proportion of births attended by skilled
health personnel f
(%)Under-five mortality rate g
(per 1000 live births)
Neonatal mortality rate g (per 1000 live
births)New HIV infections h
(per 1000 uninfected population)
Data Type Comparable estimates Comparable estimates Comparable estimates Comparable estimates
Comparable estimates
Comparable estimates
Primary data
Comparable estimates Comparable estimates
Comparable estimates
Male Female Both sexes Male Female Both sexes Male Female Both sexes Male Female Both sexes Male Female Both sexes
Member State 2017 2016 2016 2016 2016 2015 2009–2018 2017 2017 2017 Member State
Estonia 614 696 1 310 73.0 82.1 77.8 64.6 71.4 68.2 1 185 6.7 9 99 ai 3 3 3 1 0.30 0.10 0.19 EstoniaEswatini 662 705 1 367 - - - - - - 221 7.7 389 88 58 49 54 17 6.77 9.32 8.02 EswatiniEthiopia 52 406 52 551 104 957 63.7 67.3 65.5 56.1 58.9 57.5 28 4.0 353 28 ah 65 52 59 29 0.14 0.21 0.17 EthiopiaFiji 460 446 906 67.1 73.1 69.9 59.6 63.3 61.3 180 3.5 30 100 ah 28 23 25 11 - - - FijiFinland 2 722 2 801 5 523 78.7 84.2 81.4 69.8 73.5 71.7 4 117 9.5 3 100 ai 3 2 2 2 - - - FinlandFrance 31 949 33 031 64 980 80.1 85.7 82.9 71.8 74.9 73.4 4 263 11.5 8 98 ai 5 4 4 2 0.11 0.05 0.08 FranceGabon 1 040 985 2 025 64.8 68.2 66.4 57.8 59.7 58.7 220 3.1 291 89 ah 53 44 48 22 1.02 2.23 1.60 GabonGambia 1 040 1 061 2 101 60.6 63.3 61.9 53.7 55.2 54.4 21 4.4 706 57 68 59 64 28 0.63 0.73 0.68 Gambia
Georgia 1 868 2 044 3 912 68.3 76.8 72.6 61.5 68.4 64.9 308 8.4 36 100 12 10 11 7 0.38 0.08 0.22 GeorgiaGermany 40 435 41 679 82 114 78.7 83.3 80.9 70.2 73.0 71.6 4 714 11.1 6 99 ai 4 3 4 2 - - 0.03 GermanyGhana 14 368 14 466 28 834 62.5 64.4 63.4 55.8 57.0 56.4 68 4.4 319 78 54 44 49 24 0.51 0.86 0.68 GhanaGreece 5 493 5 667 11 160 78.7 83.7 81.1 70.5 73.6 72.0 1 511 8.5 3 100 ah 6 5 5 3 0.14 0.03 0.09 GreeceGrenada 54 54 108 71.0 75.9 73.4 63.0 66.5 64.7 516 5.2 27 99 ai 18 15 17 11 - - - GrenadaGuatemala 8 324 8 589 16 914 70.4 76.0 73.2 62.2 66.2 64.2 241 5.8 88 69 ai 30 25 28 13 0.18 0.11 0.14 GuatemalaGuinea 6 376 6 341 12 717 59.4 60.2 59.8 52.1 52.2 52.2 37 5.5 679 63 ah 91 81 86 24 0.58 0.74 0.66 GuineaGuinea-Bissau 916 945 1 861 58.4 61.2 59.8 50.6 52.9 51.7 39 6.1 549 45 ah 90 78 84 37 1.16 1.46 1.31 Guinea-BissauGuyana 393 385 778 63.6 69.0 66.2 56.4 60.4 58.3 192 4.2 229 86 35 27 31 19 0.67 0.56 0.62 Guyana
Haiti 5 430 5 551 10 981 61.3 65.7 63.5 53.9 56.8 55.3 38 5.4 359 42 77 66 72 28 0.69 0.71 0.73 HaitiHonduras 4 620 4 645 9 265 72.9 77.5 75.2 65.1 68.5 66.8 200 8.4 129 74 ai 20 16 18 10 0.14 0.06 0.10 HondurasHungary 4 625 5 097 9 722 72.3 79.4 76.0 64.1 69.5 66.8 943 7.4 17 100 ah 5 4 5 2 0.05 0.01 0.03 HungaryIceland 168 167 335 80.9 83.9 82.4 72.3 73.8 73.0 5 064 8.3 3 98 ai 2 2 2 1 - - - IcelandIndia 693 959 645 221 1339 180 67.4 70.3 68.8 58.7 59.9 59.3 62 3.6 174 81 ah 39 40 39 24 - - 0.10 IndiaIndonesia 132 898 131 093 263 991 67.3 71.4 69.3 60.4 63.0 61.7 112 3.1 126 94 28 22 25 12 0.24 0.14 0.19 IndonesiaIran (Islamic Republic of) 40 816 40 347 81 163 74.6 76.9 75.7 64.9 65.9 65.4 415 8.1 25 99 ah 16 14 15 9 0.09 0.03 0.06 Iran (Islamic Republic of)Iraq 19 376 18 899 38 275 67.5 72.2 69.9 57.4 60.6 59.0 153 3.3 50 96 33 27 30 17 - - - IraqIreland 2 362 2 400 4 762 79.7 83.4 81.5 71.1 73.2 72.1 4 759 7.4 8 100 ai 4 3 4 2 - - - IrelandIsrael 4 133 4 188 8 322 80.3 84.2 82.3 71.7 74.1 72.9 2 837 7.3 5 - 4 3 4 2 - - - IsraelItaly 28 929 30 431 59 360 80.5 84.9 82.7 72.0 74.3 73.2 2 739 8.9 4 100 ai 4 3 3 2 0.07 0.02 0.05 ItalyJamaica 1 438 1 452 2 890 73.6 78.5 76.0 65.3 68.5 66.9 296 6.1 89 98 ai 17 13 15 11 - - 0.66 JamaicaJapan 62 256 65 228 127 484 81.1 87.1 84.2 72.6 76.9 74.8 4 233 10.9 5 100 ai 3 2 3 1 0.02 <0.01 0.01 JapanJordan 4 913 4 789 9 702 72.7 76.0 74.3 65.4 67.5 66.4 224 5.5 58 100 18 16 17 10 - - - Jordan
Kazakhstan 8 817 9 388 18 205 66.8 75.3 71.1 59.9 66.7 63.4 262 3.5 12 99 11 9 10 5 0.28 0.12 0.19 Kazakhstan
Kenya 24 701 24 999 49 700 64.4 68.9 66.7 57.0 60.8 58.9 66 4.5 510 62 50 42 46 21 0.99 1.44 1.21 KenyaKiribati 57 59 116 63.6 68.6 66.1 56.0 59.4 57.8 188 11.9 90 98 ah 59 50 55 23 - - - KiribatiKuwait 2 375 1 761 4 137 73.9 76.0 74.8 66.3 66.2 66.3 1 068 3.9 4 100 ai 9 8 8 4 0.07 0.03 0.05 KuwaitKyrgyzstan 2 998 3 048 6 045 67.7 75.2 71.4 60.7 66.4 63.5 73 6.6 76 98 22 18 20 11 0.14 0.06 0.10 Kyrgyzstan
Lao People’s Democratic Republic 3 421 3 437 6 858 64.2 67.4 65.8 56.9 58.8 57.9 55 2.4 197 64 69 58 63 28 - - - Lao People’s Democratic RepublicLatvia 895 1 054 1 950 70.0 79.6 75.1 62.4 69.5 66.2 874 6.2 18 100 ai 5 4 4 2 - - - LatviaLebanon 3 051 3 031 6 082 75.1 77.7 76.3 65.5 66.8 66.1 662 8.0 15 - 8 7 8 5 0.04 0.01 0.03 Lebanon
Lesotho 1 084 1 149 2 233 51.0 54.6 52.9 45.0 47.9 46.6 86 8.1 487 78 93 79 86 38 8.03 10.13 9.07 Lesotho
Liberia 2 387 2 345 4 732 62.0 63.9 62.9 53.9 55.1 54.5 68 9.6 725 61 80 69 75 25 0.43 0.60 0.51 LiberiaLibya 3 213 3 161 6 375 69.0 75.0 71.9 60.5 64.2 62.3 - - 9 100 ah 14 11 12 7 - - - LibyaLithuania 1 332 1 559 2 890 69.7 80.2 75.0 61.9 70.0 66.1 988 6.7 10 100 ah 5 4 4 2 0.18 0.06 0.12 LithuaniaLuxembourg 293 290 583 80.1 84.6 82.5 71.1 73.7 72.6 6 271 6.2 10 100 ai 3 2 3 2 0.17 0.04 0.10 LuxembourgMadagascar 12 752 12 819 25 571 64.6 67.6 66.1 57.1 59.5 58.3 24 6.0 353 44 48 40 44 18 0.30 0.13 0.22 MadagascarMalawi 9 225 9 397 18 622 61.4 66.8 64.2 53.9 58.4 56.2 30 9.8 634 90 ah 60 50 55 23 2.10 2.69 2.39 MalawiMalaysia 16 325 15 299 31 624 73.2 77.6 75.3 65.3 68.1 66.6 362 3.8 40 100 ah 9 7 8 4 0.43 0.07 0.25 MalaysiaMaldives 248 188 436 77.2 79.9 78.4 69.7 69.7 69.8 1 048 10.6 68 96 9 7 8 5 - - - Maldives
Mali 9 279 9 263 18 542 57.5 58.4 58.0 50.4 51.0 50.7 30 3.8 587 44 111 101 106 35 0.48 0.62 0.55 MaliMalta 216 214 431 79.6 83.3 81.4 71.3 73.3 72.2 2 328 9.3 9 100 ai 7 6 6 4 - - - MaltaMarshall Islands 27 26 53 - - - - - - 851 23.3 - 92 40 32 34 16 - - - Marshall Islands
Mauritania 2 228 2 192 4 420 62.6 65.2 63.9 55.6 57.2 56.4 47 4.2 602 69 85 73 79 34 0.08 0.05 0.06 MauritaniaMauritius 626 639 1 265 71.6 78.1 74.8 63.6 68.2 65.8 553 5.7 53 100 ah 14 12 13 8 - - - MauritiusMexico 64 312 64 851 129 163 74.0 79.2 76.6 65.8 69.6 67.7 462 5.5 38 98 15 12 13 8 0.18 0.05 0.12 MexicoMicronesia (Federated States of) 54 51 106 68.4 70.8 69.6 60.4 61.7 61.1 387 12.6 100 100 ah 35 29 32 17 - - - Micronesia (Federated States of)Monaco 19 20 39 - - - - - - 2 940 1.7 - - 4 3 3 2 - - - Monaco
Mongolia 1 521 1 554 3 076 65.7 74.2 69.8 58.6 65.5 61.9 141 3.8 44 99 20 14 17 9 0.02 <0.01 0.01 Mongolia
PA
RT
1
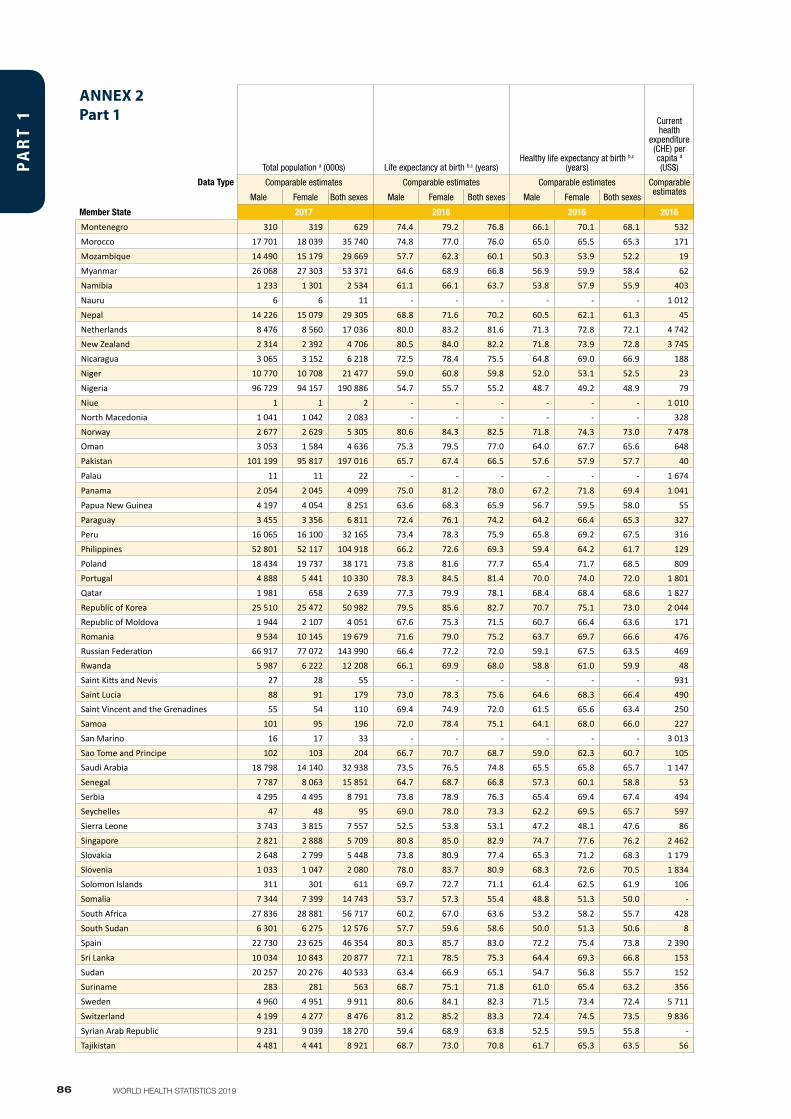
86 WORLD HEALTH STATISTICS 2019
3.1 3.2 3.3
ANNEX 2Part 1
Total population a (000s) Life expectancy at birth b,c (years)Healthy life expectancy at birth b,c
(years)
Current health
expenditure (CHE) per capita d (US$)
Current health
expenditure (CHE) as
percentage of gross domestic product
(GDP) d (%)
Maternal mortality
ratio e (per 100 000
live births)
Proportion of births attended by skilled
health personnel f
(%)Under-five mortality rate g
(per 1000 live births)
Neonatal mortality rate g (per 1000 live
births)New HIV infections h
(per 1000 uninfected population)
Data Type Comparable estimates Comparable estimates Comparable estimates Comparable estimates
Comparable estimates
Comparable estimates
Primary data
Comparable estimates Comparable estimates
Comparable estimates
Male Female Both sexes Male Female Both sexes Male Female Both sexes Male Female Both sexes Male Female Both sexes
Member State 2017 2016 2016 2016 2016 2015 2009–2018 2017 2017 2017 Member State
Montenegro 310 319 629 74.4 79.2 76.8 66.1 70.1 68.1 532 7.6 7 99 4 3 4 2 0.06 0.02 0.04 MontenegroMorocco 17 701 18 039 35 740 74.8 77.0 76.0 65.0 65.5 65.3 171 5.8 121 87 ai 26 21 23 14 0.04 0.02 0.03 MoroccoMozambique 14 490 15 179 29 669 57.7 62.3 60.1 50.3 53.9 52.2 19 5.1 489 73 77 68 72 27 4.12 5.36 4.75 MozambiqueMyanmar 26 068 27 303 53 371 64.6 68.9 66.8 56.9 59.9 58.4 62 5.1 178 60 ah 53 44 49 24 0.29 0.13 0.21 MyanmarNamibia 1 233 1 301 2 534 61.1 66.1 63.7 53.8 57.9 55.9 403 9.1 265 88 48 40 44 18 3.07 3.90 3.49 Namibia
Nauru 6 6 11 - - - - - - 1 012 11.1 - - 36 30 33 21 - - - NauruNepal 14 226 15 079 29 305 68.8 71.6 70.2 60.5 62.1 61.3 45 6.3 258 58 ah 36 31 34 21 0.04 0.02 0.03 NepalNetherlands 8 476 8 560 17 036 80.0 83.2 81.6 71.3 72.8 72.1 4 742 10.4 7 - 4 4 4 2 0.05 0.01 0.03 NetherlandsNew Zealand 2 314 2 392 4 706 80.5 84.0 82.2 71.8 73.9 72.8 3 745 9.2 11 96 ai 6 5 5 3 - - - New ZealandNicaragua 3 065 3 152 6 218 72.5 78.4 75.5 64.8 69.0 66.9 188 8.7 150 90 ai 19 15 17 7 0.09 0.04 0.07 NicaraguaNiger 10 770 10 708 21 477 59.0 60.8 59.8 52.0 53.1 52.5 23 6.2 553 40 88 81 85 26 0.08 0.09 0.08 Niger
Nigeria 96 729 94 157 190 886 54.7 55.7 55.2 48.7 49.2 48.9 79 3.6 814 43 106 94 100 33 - - - NigeriaNiue 1 1 2 - - - - - - 1 010 7.3 - 100 ah 24 19 22 11 - - - NiueNorth Macedonia 1 041 1 042 2 083 - - - - - - 328 6.3 8 100 ah 15 13 14 11 0.04 0.01 0.02 North MacedoniaNorway 2 677 2 629 5 305 80.6 84.3 82.5 71.8 74.3 73.0 7 478 10.5 5 99 ai 3 2 3 2 - - 0.03 NorwayOman 3 053 1 584 4 636 75.3 79.5 77.0 64.0 67.7 65.6 648 4.3 17 100 ah 12 10 11 5 - - - OmanPakistan 101 199 95 817 197 016 65.7 67.4 66.5 57.6 57.9 57.7 40 2.8 178 69 78 71 75 44 0.14 0.06 0.10 Pakistan
Palau 11 11 22 - - - - - - 1 674 11.7 - 100 17 14 15 8 - - - Palau
Panama 2 054 2 045 4 099 75.0 81.2 78.0 67.2 71.8 69.4 1 041 7.3 94 94 18 14 16 9 0.57 0.24 0.40 Panama
Papua New Guinea 4 197 4 054 8 251 63.6 68.3 65.9 56.7 59.5 58.0 55 2.0 215 - 58 49 53 24 0.33 0.42 0.37 Papua New GuineaParaguay 3 455 3 356 6 811 72.4 76.1 74.2 64.2 66.4 65.3 327 8.0 132 97 ai 23 19 21 11 0.28 0.12 0.20 ParaguayPeru 16 065 16 100 32 165 73.4 78.3 75.9 65.8 69.2 67.5 316 5.1 68 93 ai 16 13 15 7 0.14 0.04 0.09 PeruPhilippines 52 801 52 117 104 918 66.2 72.6 69.3 59.4 64.2 61.7 129 4.4 114 84 31 25 28 14 0.21 0.02 0.12 PhilippinesPoland 18 434 19 737 38 171 73.8 81.6 77.7 65.4 71.7 68.5 809 6.5 3 100 ai 5 4 5 3 - - - PolandPortugal 4 888 5 441 10 330 78.3 84.5 81.4 70.0 74.0 72.0 1 801 9.1 10 99 ai 4 3 4 2 0.12 0.03 0.07 PortugalQatar 1 981 658 2 639 77.3 79.9 78.1 68.4 68.4 68.6 1 827 3.1 13 100 8 7 8 4 0.09 0.04 0.07 QatarRepublic of Korea 25 510 25 472 50 982 79.5 85.6 82.7 70.7 75.1 73.0 2 044 7.3 11 100 ai 4 3 3 2 - - - Republic of KoreaRepublic of Moldova 1 944 2 107 4 051 67.6 75.3 71.5 60.7 66.4 63.6 171 9.0 23 100 ah 17 14 16 12 0.45 0.19 0.32 Republic of MoldovaRomania 9 534 10 145 19 679 71.6 79.0 75.2 63.7 69.7 66.6 476 5.0 31 95 ah 9 7 8 4 0.05 0.02 0.03 RomaniaRussian Federation 66 917 77 072 143 990 66.4 77.2 72.0 59.1 67.5 63.5 469 5.3 25 100 ah 8 7 8 3 0.98 0.46 0.70 Russian FederationRwanda 5 987 6 222 12 208 66.1 69.9 68.0 58.8 61.0 59.9 48 6.8 290 91 ah 41 34 38 16 0.51 0.72 0.61 RwandaSaint Kitts and Nevis 27 28 55 - - - - - - 931 5.7 - 100 ai 15 13 14 9 - - - Saint Kitts and NevisSaint Lucia 88 91 179 73.0 78.3 75.6 64.6 68.3 66.4 490 5.3 48 99 ai 18 15 17 12 - - - Saint LuciaSaint Vincent and the Grenadines 55 54 110 69.4 74.9 72.0 61.5 65.6 63.4 250 3.6 45 99 ai 18 15 16 10 - - - Saint Vincent and the GrenadinesSamoa 101 95 196 72.0 78.4 75.1 64.1 68.0 66.0 227 5.5 51 83 ah 18 15 17 9 - - - SamoaSan Marino 16 17 33 - - - - - - 3 013 6.4 - - 2 2 2 1 - - - San MarinoSao Tome and Principe 102 103 204 66.7 70.7 68.7 59.0 62.3 60.7 105 6.0 156 93 ah 36 29 32 14 - - - Sao Tome and PrincipeSaudi Arabia 18 798 14 140 32 938 73.5 76.5 74.8 65.5 65.8 65.7 1 147 5.7 12 100 ah 8 7 7 4 - - - Saudi ArabiaSenegal 7 787 8 063 15 851 64.7 68.7 66.8 57.3 60.1 58.8 53 5.6 315 68 49 41 45 21 0.09 0.12 0.10 SenegalSerbia 4 295 4 495 8 791 73.8 78.9 76.3 65.4 69.4 67.4 494 9.1 17 100 ah 6 5 6 4 0.03 0.01 0.02 SerbiaSeychelles 47 48 95 69.0 78.0 73.3 62.2 69.5 65.7 597 3.9 - 99 ah 15 13 14 9 - - - SeychellesSierra Leone 3 743 3 815 7 557 52.5 53.8 53.1 47.2 48.1 47.6 86 16.5 1 360 69 116 104 111 34 0.40 0.47 0.44 Sierra LeoneSingapore 2 821 2 888 5 709 80.8 85.0 82.9 74.7 77.6 76.2 2 462 4.5 10 100 ai 3 3 3 1 0.14 0.02 0.08 SingaporeSlovakia 2 648 2 799 5 448 73.8 80.9 77.4 65.3 71.2 68.3 1 179 7.1 6 99 ah 6 5 6 3 0.03 0.01 0.02 SlovakiaSlovenia 1 033 1 047 2 080 78.0 83.7 80.9 68.3 72.6 70.5 1 834 8.5 9 100 ai 2 2 2 1 0.06 0.01 0.03 SloveniaSolomon Islands 311 301 611 69.7 72.7 71.1 61.4 62.5 61.9 106 5.2 114 86 ah 23 19 21 9 - - - Solomon IslandsSomalia 7 344 7 399 14 743 53.7 57.3 55.4 48.8 51.3 50.0 - - 732 - 133 121 127 39 0.03 0.04 0.03 Somalia
South Africa 27 836 28 881 56 717 60.2 67.0 63.6 53.2 58.2 55.7 428 8.1 138 97 41 33 37 11 4.63 6.29 5.46 South AfricaSouth Sudan 6 301 6 275 12 576 57.7 59.6 58.6 50.0 51.3 50.6 8 3.2 789 19 ah 101 92 96 40 1.02 1.32 1.17 South SudanSpain 22 730 23 625 46 354 80.3 85.7 83.0 72.2 75.4 73.8 2 390 9.0 5 - 3 3 3 2 0.15 0.03 0.09 Spain
Sri Lanka 10 034 10 843 20 877 72.1 78.5 75.3 64.4 69.3 66.8 153 3.9 30 - 10 8 9 6 <0.01 <0.01 <0.01 Sri LankaSudan 20 257 20 276 40 533 63.4 66.9 65.1 54.7 56.8 55.7 152 5.7 311 78 ah 68 58 63 30 0.13 0.11 0.12 SudanSuriname 283 281 563 68.7 75.1 71.8 61.0 65.4 63.2 356 6.1 155 80 ai 22 17 20 10 0.53 0.58 0.56 SurinameSweden 4 960 4 951 9 911 80.6 84.1 82.3 71.5 73.4 72.4 5 711 10.9 4 - 3 3 3 2 - - - Sweden
Switzerland 4 199 4 277 8 476 81.2 85.2 83.3 72.4 74.5 73.5 9 836 12.2 5 - 5 4 4 3 - - - SwitzerlandSyrian Arab Republic 9 231 9 039 18 270 59.4 68.9 63.8 52.5 59.5 55.8 - - 68 96 ah 19 16 17 9 - - - Syrian Arab RepublicTajikistan 4 481 4 441 8 921 68.7 73.0 70.8 61.7 65.3 63.5 56 7.0 32 95 37 30 34 15 0.22 0.07 0.15 Tajikistan
PA
RT
1
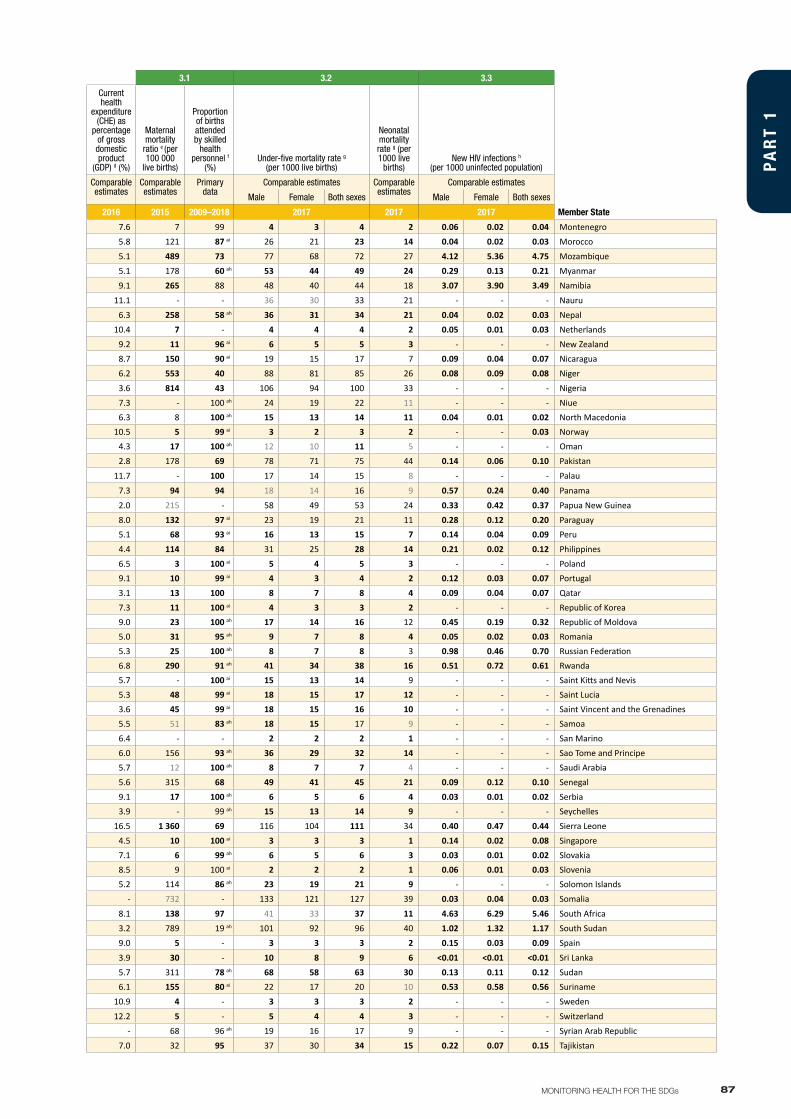
87MONITORING HEALTH FOR THE SDGs
3.1 3.2 3.3
ANNEX 2Part 1
Total population a (000s) Life expectancy at birth b,c (years)Healthy life expectancy at birth b,c
(years)
Current health
expenditure (CHE) per capita d (US$)
Current health
expenditure (CHE) as
percentage of gross domestic product
(GDP) d (%)
Maternal mortality
ratio e (per 100 000
live births)
Proportion of births attended by skilled
health personnel f
(%)Under-five mortality rate g
(per 1000 live births)
Neonatal mortality rate g (per 1000 live
births)New HIV infections h
(per 1000 uninfected population)
Data Type Comparable estimates Comparable estimates Comparable estimates Comparable estimates
Comparable estimates
Comparable estimates
Primary data
Comparable estimates Comparable estimates
Comparable estimates
Male Female Both sexes Male Female Both sexes Male Female Both sexes Male Female Both sexes Male Female Both sexes
Member State 2017 2016 2016 2016 2016 2015 2009–2018 2017 2017 2017 Member State
Montenegro 310 319 629 74.4 79.2 76.8 66.1 70.1 68.1 532 7.6 7 99 4 3 4 2 0.06 0.02 0.04 MontenegroMorocco 17 701 18 039 35 740 74.8 77.0 76.0 65.0 65.5 65.3 171 5.8 121 87 ai 26 21 23 14 0.04 0.02 0.03 MoroccoMozambique 14 490 15 179 29 669 57.7 62.3 60.1 50.3 53.9 52.2 19 5.1 489 73 77 68 72 27 4.12 5.36 4.75 MozambiqueMyanmar 26 068 27 303 53 371 64.6 68.9 66.8 56.9 59.9 58.4 62 5.1 178 60 ah 53 44 49 24 0.29 0.13 0.21 MyanmarNamibia 1 233 1 301 2 534 61.1 66.1 63.7 53.8 57.9 55.9 403 9.1 265 88 48 40 44 18 3.07 3.90 3.49 Namibia
Nauru 6 6 11 - - - - - - 1 012 11.1 - - 36 30 33 21 - - - NauruNepal 14 226 15 079 29 305 68.8 71.6 70.2 60.5 62.1 61.3 45 6.3 258 58 ah 36 31 34 21 0.04 0.02 0.03 NepalNetherlands 8 476 8 560 17 036 80.0 83.2 81.6 71.3 72.8 72.1 4 742 10.4 7 - 4 4 4 2 0.05 0.01 0.03 NetherlandsNew Zealand 2 314 2 392 4 706 80.5 84.0 82.2 71.8 73.9 72.8 3 745 9.2 11 96 ai 6 5 5 3 - - - New ZealandNicaragua 3 065 3 152 6 218 72.5 78.4 75.5 64.8 69.0 66.9 188 8.7 150 90 ai 19 15 17 7 0.09 0.04 0.07 NicaraguaNiger 10 770 10 708 21 477 59.0 60.8 59.8 52.0 53.1 52.5 23 6.2 553 40 88 81 85 26 0.08 0.09 0.08 Niger
Nigeria 96 729 94 157 190 886 54.7 55.7 55.2 48.7 49.2 48.9 79 3.6 814 43 106 94 100 33 - - - NigeriaNiue 1 1 2 - - - - - - 1 010 7.3 - 100 ah 24 19 22 11 - - - NiueNorth Macedonia 1 041 1 042 2 083 - - - - - - 328 6.3 8 100 ah 15 13 14 11 0.04 0.01 0.02 North MacedoniaNorway 2 677 2 629 5 305 80.6 84.3 82.5 71.8 74.3 73.0 7 478 10.5 5 99 ai 3 2 3 2 - - 0.03 NorwayOman 3 053 1 584 4 636 75.3 79.5 77.0 64.0 67.7 65.6 648 4.3 17 100 ah 12 10 11 5 - - - OmanPakistan 101 199 95 817 197 016 65.7 67.4 66.5 57.6 57.9 57.7 40 2.8 178 69 78 71 75 44 0.14 0.06 0.10 Pakistan
Palau 11 11 22 - - - - - - 1 674 11.7 - 100 17 14 15 8 - - - Palau
Panama 2 054 2 045 4 099 75.0 81.2 78.0 67.2 71.8 69.4 1 041 7.3 94 94 18 14 16 9 0.57 0.24 0.40 Panama
Papua New Guinea 4 197 4 054 8 251 63.6 68.3 65.9 56.7 59.5 58.0 55 2.0 215 - 58 49 53 24 0.33 0.42 0.37 Papua New GuineaParaguay 3 455 3 356 6 811 72.4 76.1 74.2 64.2 66.4 65.3 327 8.0 132 97 ai 23 19 21 11 0.28 0.12 0.20 ParaguayPeru 16 065 16 100 32 165 73.4 78.3 75.9 65.8 69.2 67.5 316 5.1 68 93 ai 16 13 15 7 0.14 0.04 0.09 PeruPhilippines 52 801 52 117 104 918 66.2 72.6 69.3 59.4 64.2 61.7 129 4.4 114 84 31 25 28 14 0.21 0.02 0.12 PhilippinesPoland 18 434 19 737 38 171 73.8 81.6 77.7 65.4 71.7 68.5 809 6.5 3 100 ai 5 4 5 3 - - - PolandPortugal 4 888 5 441 10 330 78.3 84.5 81.4 70.0 74.0 72.0 1 801 9.1 10 99 ai 4 3 4 2 0.12 0.03 0.07 PortugalQatar 1 981 658 2 639 77.3 79.9 78.1 68.4 68.4 68.6 1 827 3.1 13 100 8 7 8 4 0.09 0.04 0.07 QatarRepublic of Korea 25 510 25 472 50 982 79.5 85.6 82.7 70.7 75.1 73.0 2 044 7.3 11 100 ai 4 3 3 2 - - - Republic of KoreaRepublic of Moldova 1 944 2 107 4 051 67.6 75.3 71.5 60.7 66.4 63.6 171 9.0 23 100 ah 17 14 16 12 0.45 0.19 0.32 Republic of MoldovaRomania 9 534 10 145 19 679 71.6 79.0 75.2 63.7 69.7 66.6 476 5.0 31 95 ah 9 7 8 4 0.05 0.02 0.03 RomaniaRussian Federation 66 917 77 072 143 990 66.4 77.2 72.0 59.1 67.5 63.5 469 5.3 25 100 ah 8 7 8 3 0.98 0.46 0.70 Russian FederationRwanda 5 987 6 222 12 208 66.1 69.9 68.0 58.8 61.0 59.9 48 6.8 290 91 ah 41 34 38 16 0.51 0.72 0.61 RwandaSaint Kitts and Nevis 27 28 55 - - - - - - 931 5.7 - 100 ai 15 13 14 9 - - - Saint Kitts and NevisSaint Lucia 88 91 179 73.0 78.3 75.6 64.6 68.3 66.4 490 5.3 48 99 ai 18 15 17 12 - - - Saint LuciaSaint Vincent and the Grenadines 55 54 110 69.4 74.9 72.0 61.5 65.6 63.4 250 3.6 45 99 ai 18 15 16 10 - - - Saint Vincent and the GrenadinesSamoa 101 95 196 72.0 78.4 75.1 64.1 68.0 66.0 227 5.5 51 83 ah 18 15 17 9 - - - SamoaSan Marino 16 17 33 - - - - - - 3 013 6.4 - - 2 2 2 1 - - - San MarinoSao Tome and Principe 102 103 204 66.7 70.7 68.7 59.0 62.3 60.7 105 6.0 156 93 ah 36 29 32 14 - - - Sao Tome and PrincipeSaudi Arabia 18 798 14 140 32 938 73.5 76.5 74.8 65.5 65.8 65.7 1 147 5.7 12 100 ah 8 7 7 4 - - - Saudi ArabiaSenegal 7 787 8 063 15 851 64.7 68.7 66.8 57.3 60.1 58.8 53 5.6 315 68 49 41 45 21 0.09 0.12 0.10 SenegalSerbia 4 295 4 495 8 791 73.8 78.9 76.3 65.4 69.4 67.4 494 9.1 17 100 ah 6 5 6 4 0.03 0.01 0.02 SerbiaSeychelles 47 48 95 69.0 78.0 73.3 62.2 69.5 65.7 597 3.9 - 99 ah 15 13 14 9 - - - SeychellesSierra Leone 3 743 3 815 7 557 52.5 53.8 53.1 47.2 48.1 47.6 86 16.5 1 360 69 116 104 111 34 0.40 0.47 0.44 Sierra LeoneSingapore 2 821 2 888 5 709 80.8 85.0 82.9 74.7 77.6 76.2 2 462 4.5 10 100 ai 3 3 3 1 0.14 0.02 0.08 SingaporeSlovakia 2 648 2 799 5 448 73.8 80.9 77.4 65.3 71.2 68.3 1 179 7.1 6 99 ah 6 5 6 3 0.03 0.01 0.02 SlovakiaSlovenia 1 033 1 047 2 080 78.0 83.7 80.9 68.3 72.6 70.5 1 834 8.5 9 100 ai 2 2 2 1 0.06 0.01 0.03 SloveniaSolomon Islands 311 301 611 69.7 72.7 71.1 61.4 62.5 61.9 106 5.2 114 86 ah 23 19 21 9 - - - Solomon IslandsSomalia 7 344 7 399 14 743 53.7 57.3 55.4 48.8 51.3 50.0 - - 732 - 133 121 127 39 0.03 0.04 0.03 Somalia
South Africa 27 836 28 881 56 717 60.2 67.0 63.6 53.2 58.2 55.7 428 8.1 138 97 41 33 37 11 4.63 6.29 5.46 South AfricaSouth Sudan 6 301 6 275 12 576 57.7 59.6 58.6 50.0 51.3 50.6 8 3.2 789 19 ah 101 92 96 40 1.02 1.32 1.17 South SudanSpain 22 730 23 625 46 354 80.3 85.7 83.0 72.2 75.4 73.8 2 390 9.0 5 - 3 3 3 2 0.15 0.03 0.09 Spain
Sri Lanka 10 034 10 843 20 877 72.1 78.5 75.3 64.4 69.3 66.8 153 3.9 30 - 10 8 9 6 <0.01 <0.01 <0.01 Sri LankaSudan 20 257 20 276 40 533 63.4 66.9 65.1 54.7 56.8 55.7 152 5.7 311 78 ah 68 58 63 30 0.13 0.11 0.12 SudanSuriname 283 281 563 68.7 75.1 71.8 61.0 65.4 63.2 356 6.1 155 80 ai 22 17 20 10 0.53 0.58 0.56 SurinameSweden 4 960 4 951 9 911 80.6 84.1 82.3 71.5 73.4 72.4 5 711 10.9 4 - 3 3 3 2 - - - Sweden
Switzerland 4 199 4 277 8 476 81.2 85.2 83.3 72.4 74.5 73.5 9 836 12.2 5 - 5 4 4 3 - - - SwitzerlandSyrian Arab Republic 9 231 9 039 18 270 59.4 68.9 63.8 52.5 59.5 55.8 - - 68 96 ah 19 16 17 9 - - - Syrian Arab RepublicTajikistan 4 481 4 441 8 921 68.7 73.0 70.8 61.7 65.3 63.5 56 7.0 32 95 37 30 34 15 0.22 0.07 0.15 Tajikistan
PA
RT
1
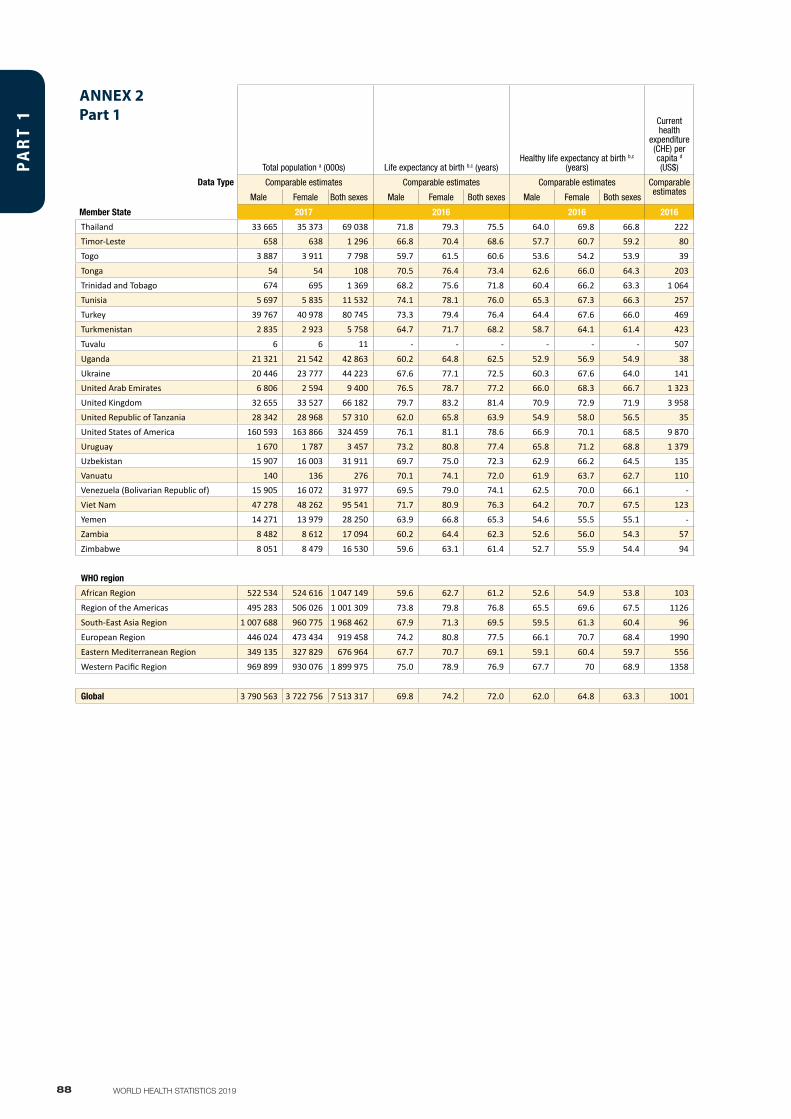
88 WORLD HEALTH STATISTICS 2019
3.1 3.2 3.3
ANNEX 2Part 1
Total population a (000s) Life expectancy at birth b,c (years)Healthy life expectancy at birth b,c
(years)
Current health
expenditure (CHE) per capita d (US$)
Current health
expenditure (CHE) as
percentage of gross domestic product
(GDP) d (%)
Maternal mortality
ratio e (per 100 000
live births)
Proportion of births attended by skilled
health personnel f
(%)Under-five mortality rate g
(per 1000 live births)
Neonatal mortality rate g (per 1000 live
births)New HIV infections h
(per 1000 uninfected population)
Data Type Comparable estimates Comparable estimates Comparable estimates Comparable estimates
Comparable estimates
Comparable estimates
Primary data
Comparable estimates Comparable estimates
Comparable estimates
Male Female Both sexes Male Female Both sexes Male Female Both sexes Male Female Both sexes Male Female Both sexes
Member State 2017 2016 2016 2016 2016 2015 2009–2018 2017 2017 2017 Member State
Thailand 33 665 35 373 69 038 71.8 79.3 75.5 64.0 69.8 66.8 222 3.7 20 99 ah 11 9 10 5 - - - ThailandTimor-Leste 658 638 1 296 66.8 70.4 68.6 57.7 60.7 59.2 80 4.0 215 57 ah 52 44 48 21 - - - Timor-LesteTogo 3 887 3 911 7 798 59.7 61.5 60.6 53.6 54.2 53.9 39 6.6 368 45 79 67 73 25 0.55 0.74 0.65 Togo
Tonga 54 54 108 70.5 76.4 73.4 62.6 66.0 64.3 203 5.3 124 96 14 18 16 7 - - - TongaTrinidad and Tobago 674 695 1 369 68.2 75.6 71.8 60.4 66.2 63.3 1 064 6.5 63 100 ai 29 24 26 17 0.34 0.14 0.24 Trinidad and TobagoTunisia 5 697 5 835 11 532 74.1 78.1 76.0 65.3 67.3 66.3 257 7.0 62 74 14 12 13 8 0.04 0.02 0.03 TunisiaTurkey 39 767 40 978 80 745 73.3 79.4 76.4 64.4 67.6 66.0 469 4.3 16 98 ah 12 11 12 6 - - - TurkeyTurkmenistan 2 835 2 923 5 758 64.7 71.7 68.2 58.7 64.1 61.4 423 6.6 42 100 53 41 47 21 - - - Turkmenistan
Tuvalu 6 6 11 - - - - - - 507 15.5 - - 27 22 25 16 - - - Tuvalu
Uganda 21 321 21 542 42 863 60.2 64.8 62.5 52.9 56.9 54.9 38 6.2 343 74 54 44 49 20 1.20 1.53 1.37 UgandaUkraine 20 446 23 777 44 223 67.6 77.1 72.5 60.3 67.6 64.0 141 6.7 24 100 ah 10 8 9 5 0.36 0.22 0.29 UkraineUnited Arab Emirates 6 806 2 594 9 400 76.5 78.7 77.2 66.0 68.3 66.7 1 323 3.5 6 100 ah 10 8 9 5 - - - United Arab EmiratesUnited Kingdom 32 655 33 527 66 182 79.7 83.2 81.4 70.9 72.9 71.9 3 958 9.8 9 - 5 4 4 3 - - - United KingdomUnited Republic of Tanzania 28 342 28 968 57 310 62.0 65.8 63.9 54.9 58.0 56.5 35 4.1 398 64 ah 58 50 54 21 1.22 1.50 1.36 United Republic of TanzaniaUnited States of America 160 593 163 866 324 459 76.1 81.1 78.6 66.9 70.1 68.5 9 870 17.1 14 99 7 6 7 4 - - - United States of AmericaUruguay 1 670 1 787 3 457 73.2 80.8 77.4 65.8 71.2 68.8 1 379 9.1 15 100 ai 9 7 8 5 0.32 0.07 0.19 UruguayUzbekistan 15 907 16 003 31 911 69.7 75.0 72.3 62.9 66.2 64.5 135 6.3 36 100 ah 26 19 23 12 0.30 0.13 0.21 UzbekistanVanuatu 140 136 276 70.1 74.1 72.0 61.9 63.7 62.7 110 3.7 78 89 ah 29 25 27 12 - - - VanuatuVenezuela (Bolivarian Republic of) 15 905 16 072 31 977 69.5 79.0 74.1 62.5 70.0 66.1 - 3.2 95 95 ai 34 27 31 20 - - - Venezuela (Bolivarian Republic of)Viet Nam 47 278 48 262 95 541 71.7 80.9 76.3 64.2 70.7 67.5 123 5.7 54 94 24 17 21 11 - - - Viet NamYemen 14 271 13 979 28 250 63.9 66.8 65.3 54.6 55.5 55.1 - - 385 45 ah 59 51 55 27 - - - YemenZambia 8 482 8 612 17 094 60.2 64.4 62.3 52.6 56.0 54.3 57 4.5 224 63 65 55 60 22 2.92 3.80 3.60 Zambia
Zimbabwe 8 051 8 479 16 530 59.6 63.1 61.4 52.7 55.9 54.4 94 9.4 443 78 55 45 50 22 2.82 3.33 3.08 Zimbabwe
WHO region WHO region
African Region 522 534 524 616 1 047 149 59.6 62.7 61.2 52.6 54.9 53.8 103 5.9 542 59 79 68 74 27 1.07 1.37 1.22 African Region
Region of the Americas 495 283 506 026 1 001 309 73.8 79.8 76.8 65.5 69.6 67.5 1126 7.5 52 95 16 13 14 8 0.23 0.09 0.16 Region of the Americas
South-East Asia Region 1 007 688 960 775 1 968 462 67.9 71.3 69.5 59.5 61.3 60.4 96 4.0 164 81 36 36 36 21 0.10 0.06 0.08 South-East Asia Region
European Region 446 024 473 434 919 458 74.2 80.8 77.5 66.1 70.7 68.4 1990 8.0 16 99 10 8 9 5 0.24 0.11 0.18 European Region
Eastern Mediterranean Region 349 135 327 829 676 964 67.7 70.7 69.1 59.1 60.4 59.7 556 5.3 166 79 53 47 50 27 0.09 0.04 0.06 Eastern Mediterranean Region
Western Pacific Region 969 899 930 076 1 899 975 75.0 78.9 76.9 67.7 70 68.9 1358 5.6 41 97 14 12 13 6 0.08 0.03 0.06 Western Pacific Region
Global 3 790 563 3 722 756 7 513 317 69.8 74.2 72.0 62.0 64.8 63.3 1001 6.6 216 81 41 37 39 18 0.26 0.24 0.25 Global
PA
RT
1
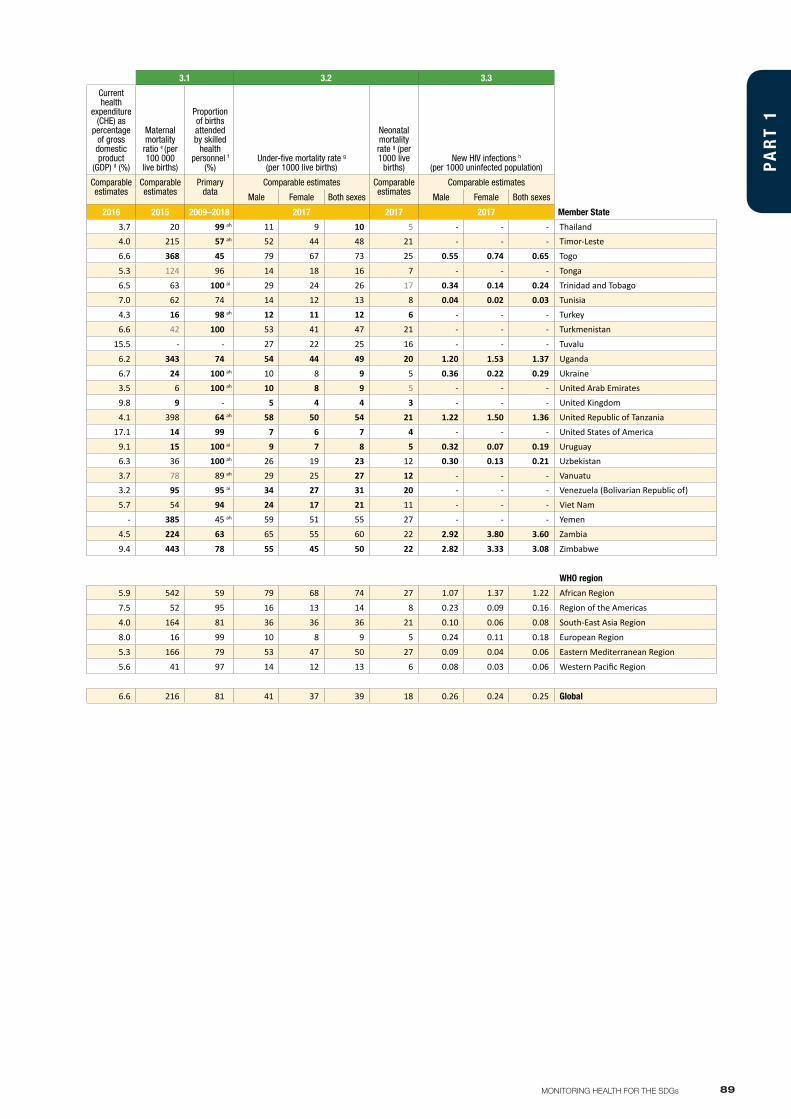
89MONITORING HEALTH FOR THE SDGs
3.1 3.2 3.3
ANNEX 2Part 1
Total population a (000s) Life expectancy at birth b,c (years)Healthy life expectancy at birth b,c
(years)
Current health
expenditure (CHE) per capita d (US$)
Current health
expenditure (CHE) as
percentage of gross domestic product
(GDP) d (%)
Maternal mortality
ratio e (per 100 000
live births)
Proportion of births attended by skilled
health personnel f
(%)Under-five mortality rate g
(per 1000 live births)
Neonatal mortality rate g (per 1000 live
births)New HIV infections h
(per 1000 uninfected population)
Data Type Comparable estimates Comparable estimates Comparable estimates Comparable estimates
Comparable estimates
Comparable estimates
Primary data
Comparable estimates Comparable estimates
Comparable estimates
Male Female Both sexes Male Female Both sexes Male Female Both sexes Male Female Both sexes Male Female Both sexes
Member State 2017 2016 2016 2016 2016 2015 2009–2018 2017 2017 2017 Member State
Thailand 33 665 35 373 69 038 71.8 79.3 75.5 64.0 69.8 66.8 222 3.7 20 99 ah 11 9 10 5 - - - ThailandTimor-Leste 658 638 1 296 66.8 70.4 68.6 57.7 60.7 59.2 80 4.0 215 57 ah 52 44 48 21 - - - Timor-LesteTogo 3 887 3 911 7 798 59.7 61.5 60.6 53.6 54.2 53.9 39 6.6 368 45 79 67 73 25 0.55 0.74 0.65 Togo
Tonga 54 54 108 70.5 76.4 73.4 62.6 66.0 64.3 203 5.3 124 96 14 18 16 7 - - - TongaTrinidad and Tobago 674 695 1 369 68.2 75.6 71.8 60.4 66.2 63.3 1 064 6.5 63 100 ai 29 24 26 17 0.34 0.14 0.24 Trinidad and TobagoTunisia 5 697 5 835 11 532 74.1 78.1 76.0 65.3 67.3 66.3 257 7.0 62 74 14 12 13 8 0.04 0.02 0.03 TunisiaTurkey 39 767 40 978 80 745 73.3 79.4 76.4 64.4 67.6 66.0 469 4.3 16 98 ah 12 11 12 6 - - - TurkeyTurkmenistan 2 835 2 923 5 758 64.7 71.7 68.2 58.7 64.1 61.4 423 6.6 42 100 53 41 47 21 - - - Turkmenistan
Tuvalu 6 6 11 - - - - - - 507 15.5 - - 27 22 25 16 - - - Tuvalu
Uganda 21 321 21 542 42 863 60.2 64.8 62.5 52.9 56.9 54.9 38 6.2 343 74 54 44 49 20 1.20 1.53 1.37 UgandaUkraine 20 446 23 777 44 223 67.6 77.1 72.5 60.3 67.6 64.0 141 6.7 24 100 ah 10 8 9 5 0.36 0.22 0.29 UkraineUnited Arab Emirates 6 806 2 594 9 400 76.5 78.7 77.2 66.0 68.3 66.7 1 323 3.5 6 100 ah 10 8 9 5 - - - United Arab EmiratesUnited Kingdom 32 655 33 527 66 182 79.7 83.2 81.4 70.9 72.9 71.9 3 958 9.8 9 - 5 4 4 3 - - - United KingdomUnited Republic of Tanzania 28 342 28 968 57 310 62.0 65.8 63.9 54.9 58.0 56.5 35 4.1 398 64 ah 58 50 54 21 1.22 1.50 1.36 United Republic of TanzaniaUnited States of America 160 593 163 866 324 459 76.1 81.1 78.6 66.9 70.1 68.5 9 870 17.1 14 99 7 6 7 4 - - - United States of AmericaUruguay 1 670 1 787 3 457 73.2 80.8 77.4 65.8 71.2 68.8 1 379 9.1 15 100 ai 9 7 8 5 0.32 0.07 0.19 UruguayUzbekistan 15 907 16 003 31 911 69.7 75.0 72.3 62.9 66.2 64.5 135 6.3 36 100 ah 26 19 23 12 0.30 0.13 0.21 UzbekistanVanuatu 140 136 276 70.1 74.1 72.0 61.9 63.7 62.7 110 3.7 78 89 ah 29 25 27 12 - - - VanuatuVenezuela (Bolivarian Republic of) 15 905 16 072 31 977 69.5 79.0 74.1 62.5 70.0 66.1 - 3.2 95 95 ai 34 27 31 20 - - - Venezuela (Bolivarian Republic of)Viet Nam 47 278 48 262 95 541 71.7 80.9 76.3 64.2 70.7 67.5 123 5.7 54 94 24 17 21 11 - - - Viet NamYemen 14 271 13 979 28 250 63.9 66.8 65.3 54.6 55.5 55.1 - - 385 45 ah 59 51 55 27 - - - YemenZambia 8 482 8 612 17 094 60.2 64.4 62.3 52.6 56.0 54.3 57 4.5 224 63 65 55 60 22 2.92 3.80 3.60 Zambia
Zimbabwe 8 051 8 479 16 530 59.6 63.1 61.4 52.7 55.9 54.4 94 9.4 443 78 55 45 50 22 2.82 3.33 3.08 Zimbabwe
WHO region WHO region
African Region 522 534 524 616 1 047 149 59.6 62.7 61.2 52.6 54.9 53.8 103 5.9 542 59 79 68 74 27 1.07 1.37 1.22 African Region
Region of the Americas 495 283 506 026 1 001 309 73.8 79.8 76.8 65.5 69.6 67.5 1126 7.5 52 95 16 13 14 8 0.23 0.09 0.16 Region of the Americas
South-East Asia Region 1 007 688 960 775 1 968 462 67.9 71.3 69.5 59.5 61.3 60.4 96 4.0 164 81 36 36 36 21 0.10 0.06 0.08 South-East Asia Region
European Region 446 024 473 434 919 458 74.2 80.8 77.5 66.1 70.7 68.4 1990 8.0 16 99 10 8 9 5 0.24 0.11 0.18 European Region
Eastern Mediterranean Region 349 135 327 829 676 964 67.7 70.7 69.1 59.1 60.4 59.7 556 5.3 166 79 53 47 50 27 0.09 0.04 0.06 Eastern Mediterranean Region
Western Pacific Region 969 899 930 076 1 899 975 75.0 78.9 76.9 67.7 70 68.9 1358 5.6 41 97 14 12 13 6 0.08 0.03 0.06 Western Pacific Region
Global 3 790 563 3 722 756 7 513 317 69.8 74.2 72.0 62.0 64.8 63.3 1001 6.6 216 81 41 37 39 18 0.26 0.24 0.25 Global
PA
RT
1
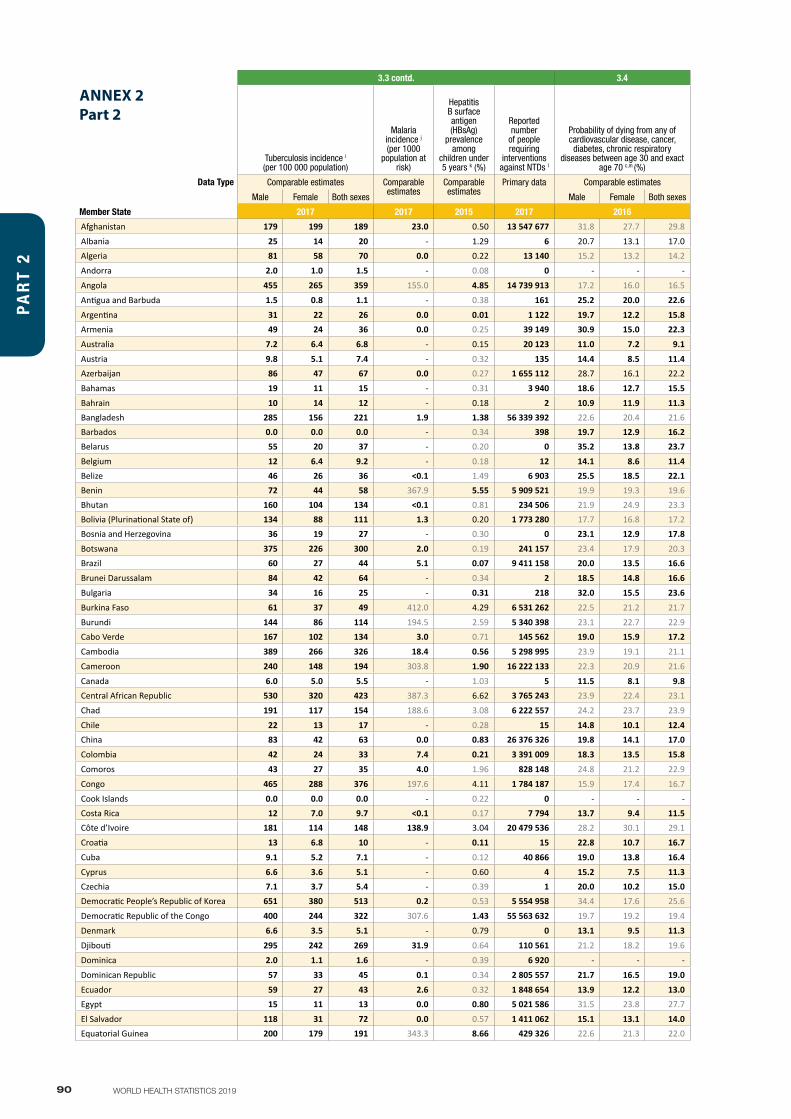
90 WORLD HEALTH STATISTICS 2019
3.3 contd. 3.4 3.4 3.6 3.7
ANNEX 2Part 2
Tuberculosis incidence i (per 100 000 population)
Malaria incidence j
(per 1000 population at
risk)
Hepatitis B surface antigen (HBsAg)
prevalence among
children under 5 years k (%)
Reported number
of people requiring
interventions against NTDs l
Probability of dying from any of cardiovascular disease, cancer,
diabetes, chronic respiratory diseases between age 30 and exact
age 70 c,m (%)Suicide mortality rate c,m (per 100 000 population)
Total alcohol per capita (>age 15 years) consumption n (litres of pure
alcohol)
Road traffic mortality rate o (per 100 000 population)
Proportion of women of reproductive
age who have their need for
family planning satisfied
with modern methods p (%)
Adolescent birth rate q (per 1000 women aged 15–19
years)
Data Type Comparable estimates Comparable estimates
Comparable estimates
Primary data Comparable estimates Comparable estimates Comparable estimates Comparable estimates
Primary data Primary data
Member State
Male Female Both sexes Male Female Both sexes Male Female Both sexes Male Female Both sexes
2017 2017 2015 2017 2016 2016 2016 2016 2009–2018 2009–2017 Member State
Afghanistan 179 199 189 23.0 0.50 13 547 677 31.8 27.7 29.8 7.6 1.5 4.7 0.4 0.0 0.2 15.1 42.2 aj 87.0 Afghanistan
Albania 25 14 20 - 1.29 6 20.7 13.1 17.0 7.9 4.7 6.3 12.5 2.6 7.5 13.6 4.9 18.9 AlbaniaAlgeria 81 58 70 0.0 0.22 13 140 15.2 13.2 14.2 4.7 1.7 3.2 1.7 0.2 0.9 - 77.2 aj 12.4 Algeria
Andorra 2.0 1.0 1.5 - 0.08 0 - - - - - - 18.0 4.7 11.3 - - 3.1 Andorra
Angola 455 265 359 155.0 4.85 14 739 913 17.2 16.0 16.5 7.0 2.5 4.7 10.7 2.3 6.4 23.6 29.8 163.0 Angola
Antigua and Barbuda 1.5 0.8 1.1 - 0.38 161 25.2 20.0 22.6 0.0 0.9 0.5 12.2 2.5 7.0 7.9 - - Antigua and Barbuda
Argentina 31 22 26 0.0 0.01 1 122 19.7 12.2 15.8 15.1 3.5 9.2 16.1 4.0 9.8 14.0 - 65.5 ArgentinaArmenia 49 24 36 0.0 0.25 39 149 30.9 15.0 22.3 10.8 2.8 6.6 10.4 1.6 5.5 17.1 36.9 aj 24.1 Armenia
Australia 7.2 6.4 6.8 - 0.15 20 123 11.0 7.2 9.1 19.5 7.0 13.2 16.7 4.7 10.6 5.6 - 11.9 Australia
Austria 9.8 5.1 7.4 - 0.32 135 14.4 8.5 11.4 23.9 7.7 15.6 18.5 5.1 11.6 5.2 - 7.6 AustriaAzerbaijan 86 47 67 0.0 0.27 1 655 112 28.7 16.1 22.2 4.2 1.1 2.6 1.5 0.2 0.8 8.7 - 52.8 Azerbaijan
Bahamas 19 11 15 - 0.31 3 940 18.6 12.7 15.5 3.0 0.5 1.7 7.6 1.4 4.4 - - 32.0 Bahamas
Bahrain 10 14 12 - 0.18 2 10.9 11.9 11.3 8.4 1.9 5.9 2.8 0.3 1.9 - - 14.3 BahrainBangladesh 285 156 221 1.9 1.38 56 339 392 22.6 20.4 21.6 4.7 7.0 5.9 0.0 0.0 0.0 15.3 72.6 aj 78.0 BangladeshBarbados 0.0 0.0 0.0 - 0.34 398 19.7 12.9 16.2 1.0 0.5 0.8 16.6 3.4 9.6 5.6 70.0 aj - BarbadosBelarus 55 20 37 - 0.20 0 35.2 13.8 23.7 46.9 8.2 26.2 18.0 5.5 11.2 8.9 74.2 aj 16.1 Belarus
Belgium 12 6.4 9.2 - 0.18 12 14.1 8.6 11.4 27.8 13.8 20.7 19.4 5.2 12.1 5.8 - 6.6 BelgiumBelize 46 26 36 <0.1 1.49 6 903 25.5 18.5 22.1 7.9 1.6 4.7 11.4 2.2 6.8 28.3 65.9 aj 69.0 BelizeBenin 72 44 58 367.9 5.55 5 909 521 19.9 19.3 19.6 13.9 5.9 9.9 5.3 0.8 3.0 27.5 25.9 aj 94.0 BeninBhutan 160 104 134 <0.1 0.81 234 506 21.9 24.9 23.3 14.0 8.5 11.4 0.9 0.1 0.6 17.4 84.6 aj 28.4 BhutanBolivia (Plurinational State of) 134 88 111 1.3 0.20 1 773 280 17.7 16.8 17.2 15.8 8.6 12.2 8.0 1.6 4.8 15.5 50.3 aj 71.0 Bolivia (Plurinational State of)Bosnia and Herzegovina 36 19 27 - 0.30 0 23.1 12.9 17.8 14.1 3.6 8.8 10.9 2.1 6.4 15.7 21.9 aj 10.7 Bosnia and Herzegovina
Botswana 375 226 300 2.0 0.19 241 157 23.4 17.9 20.3 14.2 4.5 9.3 14.4 2.4 8.4 23.8 - 37.5 BotswanaBrazil 60 27 44 5.1 0.07 9 411 158 20.0 13.5 16.6 10.0 3.1 6.5 13.4 2.4 7.8 19.7 - 60.8 Brazil
Brunei Darussalam 84 42 64 - 0.34 2 18.5 14.8 16.6 6.4 2.7 4.6 0.6 0.2 0.4 - - 11.4 Brunei Darussalam
Bulgaria 34 16 25 - 0.31 218 32.0 15.5 23.6 18.2 5.1 11.5 21.0 4.9 12.7 10.2 - 39.4 Bulgaria
Burkina Faso 61 37 49 412.0 4.29 6 531 262 22.5 21.2 21.7 10.2 5.3 7.7 14.2 2.4 8.2 30.5 56.4 122.0 Burkina Faso
Burundi 144 86 114 194.5 2.59 5 340 398 23.1 22.7 22.9 13.4 4.9 9.1 13.0 2.2 7.5 34.7 38.0 58.0 BurundiCabo Verde 167 102 134 3.0 0.71 145 562 19.0 15.9 17.2 16.5 6.1 11.3 10.0 1.7 5.7 25.0 - 80.0 Cabo Verde
Cambodia 389 266 326 18.4 0.56 5 298 995 23.9 19.1 21.1 7.8 2.9 5.3 11.9 2.0 6.7 17.8 56.5 57.0 Cambodia
Cameroon 240 148 194 303.8 1.90 16 222 133 22.3 20.9 21.6 17.1 7.4 12.2 15.2 2.7 8.9 30.1 47.0 119.0 Cameroon
Canada 6.0 5.0 5.5 - 1.03 5 11.5 8.1 9.8 18.1 7.0 12.5 14.6 3.4 8.9 5.8 - 11.1 CanadaCentral African Republic 530 320 423 387.3 6.62 3 765 243 23.9 22.4 23.1 11.5 4.0 7.7 5.7 1.0 3.3 33.6 28.7 aj 229.0 Central African Republic
Chad 191 117 154 188.6 3.08 6 222 557 24.2 23.7 23.9 10.3 7.4 8.8 2.7 0.4 1.6 27.6 20.2 179.0 Chad
Chile 22 13 17 - 0.28 15 14.8 10.1 12.4 17.2 4.0 10.6 15.0 3.7 9.3 12.5 - 40.6 ChileChina 83 42 63 0.0 0.83 26 376 326 19.8 14.1 17.0 9.1 10.3 9.7 11.7 2.5 7.2 18.2 - 9.2 China
Colombia 42 24 33 7.4 0.21 3 391 009 18.3 13.5 15.8 11.6 2.8 7.2 10.1 1.8 5.8 18.5 86.6 71.6 Colombia
Comoros 43 27 35 4.0 1.96 828 148 24.8 21.2 22.9 9.9 3.6 6.8 1.6 0.2 0.9 26.5 28.8 70.0 Comoros
Congo 465 288 376 197.6 4.11 1 784 187 15.9 17.4 16.7 8.4 3.3 5.9 12.9 2.8 7.8 27.4 43.2 147.0 Congo
Cook Islands 0.0 0.0 0.0 - 0.22 0 - - - - - - 17.5 3.7 10.6 17.3 - 67.0 Cook IslandsCosta Rica 12 7.0 9.7 <0.1 0.17 7 794 13.7 9.4 11.5 13.5 2.4 7.9 8.2 1.4 4.8 16.7 89.1 aj 53.2 Costa RicaCôte d’Ivoire 181 114 148 138.9 3.04 20 479 536 28.2 30.1 29.1 20.6 8.3 14.5 14.0 2.4 8.4 23.6 39.4 aj 129.0 Côte d’Ivoire
Croatia 13 6.8 10 - 0.11 15 22.8 10.7 16.7 25.6 7.9 16.5 15.1 3.3 8.9 8.1 - 9.6 Croatia
Cuba 9.1 5.2 7.1 - 0.12 40 866 19.0 13.8 16.4 22.1 5.8 13.9 10.2 1.9 6.1 8.5 88.8 50.4 Cuba
Cyprus 6.6 3.6 5.1 - 0.60 4 15.2 7.5 11.3 8.2 2.3 5.3 17.1 4.2 10.8 5.1 - 4.9 CyprusCzechia 7.1 3.7 5.4 - 0.39 1 20.0 10.2 15.0 21.4 5.1 13.1 23.2 6.2 14.4 5.9 - 11.6 CzechiaDemocratic People’s Republic of Korea 651 380 513 0.2 0.53 5 554 958 34.4 17.6 25.6 14.1 8.5 11.2 6.7 1.2 3.9 - 89.8 aj - Democratic People’s Republic of Korea
Democratic Republic of the Congo 400 244 322 307.6 1.43 55 563 632 19.7 19.2 19.4 8.4 2.9 5.7 4.4 0.8 2.6 33.7 18.9 138.0 Democratic Republic of the Congo
Denmark 6.6 3.5 5.1 - 0.79 0 13.1 9.5 11.3 17.3 8.2 12.8 16.5 4.5 10.4 4.0 - 2.5 Denmark
Djibouti 295 242 269 31.9 0.64 110 561 21.2 18.2 19.6 9.0 4.3 6.7 0.9 0.1 0.5 - - 20.6 Djibouti
Dominica 2.0 1.1 1.6 - 0.39 6 920 - - - - - - 13.8 2.7 8.2 10.9 - - Dominica
Dominican Republic 57 33 45 0.1 0.34 2 805 557 21.7 16.5 19.0 16.8 3.1 9.9 11.6 2.2 6.9 34.6 81.7 45.3 Dominican Republic
Ecuador 59 27 43 2.6 0.32 1 848 654 13.9 12.2 13.0 10.3 3.9 7.1 7.4 1.5 4.4 21.3 79.4 56.5 EcuadorEgypt 15 11 13 0.0 0.80 5 021 586 31.5 23.8 27.7 6.4 1.5 4.0 0.7 0.1 0.4 9.7 80.0 aj 56.0 Egypt
El Salvador 118 31 72 0.0 0.57 1 411 062 15.1 13.1 14.0 24.2 4.5 13.7 6.9 1.1 3.8 22.2 80.0 69.2 El SalvadorEquatorial Guinea 200 179 191 343.3 8.66 429 326 22.6 21.3 22.0 23.5 7.7 16.4 17.4 4.7 11.3 24.6 20.7 aj 176.0 Equatorial Guinea
PA
RT
2

91MONITORING HEALTH FOR THE SDGs
3.3 contd. 3.4 3.4 3.6 3.7
ANNEX 2Part 2
Tuberculosis incidence i (per 100 000 population)
Malaria incidence j
(per 1000 population at
risk)
Hepatitis B surface antigen (HBsAg)
prevalence among
children under 5 years k (%)
Reported number
of people requiring
interventions against NTDs l
Probability of dying from any of cardiovascular disease, cancer,
diabetes, chronic respiratory diseases between age 30 and exact
age 70 c,m (%)Suicide mortality rate c,m (per 100 000 population)
Total alcohol per capita (>age 15 years) consumption n (litres of pure
alcohol)
Road traffic mortality rate o (per 100 000 population)
Proportion of women of reproductive
age who have their need for
family planning satisfied
with modern methods p (%)
Adolescent birth rate q (per 1000 women aged 15–19
years)
Data Type Comparable estimates Comparable estimates
Comparable estimates
Primary data Comparable estimates Comparable estimates Comparable estimates Comparable estimates
Primary data Primary data
Member State
Male Female Both sexes Male Female Both sexes Male Female Both sexes Male Female Both sexes
2017 2017 2015 2017 2016 2016 2016 2016 2009–2018 2009–2017 Member State
Afghanistan 179 199 189 23.0 0.50 13 547 677 31.8 27.7 29.8 7.6 1.5 4.7 0.4 0.0 0.2 15.1 42.2 aj 87.0 Afghanistan
Albania 25 14 20 - 1.29 6 20.7 13.1 17.0 7.9 4.7 6.3 12.5 2.6 7.5 13.6 4.9 18.9 AlbaniaAlgeria 81 58 70 0.0 0.22 13 140 15.2 13.2 14.2 4.7 1.7 3.2 1.7 0.2 0.9 - 77.2 aj 12.4 Algeria
Andorra 2.0 1.0 1.5 - 0.08 0 - - - - - - 18.0 4.7 11.3 - - 3.1 Andorra
Angola 455 265 359 155.0 4.85 14 739 913 17.2 16.0 16.5 7.0 2.5 4.7 10.7 2.3 6.4 23.6 29.8 163.0 Angola
Antigua and Barbuda 1.5 0.8 1.1 - 0.38 161 25.2 20.0 22.6 0.0 0.9 0.5 12.2 2.5 7.0 7.9 - - Antigua and Barbuda
Argentina 31 22 26 0.0 0.01 1 122 19.7 12.2 15.8 15.1 3.5 9.2 16.1 4.0 9.8 14.0 - 65.5 ArgentinaArmenia 49 24 36 0.0 0.25 39 149 30.9 15.0 22.3 10.8 2.8 6.6 10.4 1.6 5.5 17.1 36.9 aj 24.1 Armenia
Australia 7.2 6.4 6.8 - 0.15 20 123 11.0 7.2 9.1 19.5 7.0 13.2 16.7 4.7 10.6 5.6 - 11.9 Australia
Austria 9.8 5.1 7.4 - 0.32 135 14.4 8.5 11.4 23.9 7.7 15.6 18.5 5.1 11.6 5.2 - 7.6 AustriaAzerbaijan 86 47 67 0.0 0.27 1 655 112 28.7 16.1 22.2 4.2 1.1 2.6 1.5 0.2 0.8 8.7 - 52.8 Azerbaijan
Bahamas 19 11 15 - 0.31 3 940 18.6 12.7 15.5 3.0 0.5 1.7 7.6 1.4 4.4 - - 32.0 Bahamas
Bahrain 10 14 12 - 0.18 2 10.9 11.9 11.3 8.4 1.9 5.9 2.8 0.3 1.9 - - 14.3 BahrainBangladesh 285 156 221 1.9 1.38 56 339 392 22.6 20.4 21.6 4.7 7.0 5.9 0.0 0.0 0.0 15.3 72.6 aj 78.0 BangladeshBarbados 0.0 0.0 0.0 - 0.34 398 19.7 12.9 16.2 1.0 0.5 0.8 16.6 3.4 9.6 5.6 70.0 aj - BarbadosBelarus 55 20 37 - 0.20 0 35.2 13.8 23.7 46.9 8.2 26.2 18.0 5.5 11.2 8.9 74.2 aj 16.1 Belarus
Belgium 12 6.4 9.2 - 0.18 12 14.1 8.6 11.4 27.8 13.8 20.7 19.4 5.2 12.1 5.8 - 6.6 BelgiumBelize 46 26 36 <0.1 1.49 6 903 25.5 18.5 22.1 7.9 1.6 4.7 11.4 2.2 6.8 28.3 65.9 aj 69.0 BelizeBenin 72 44 58 367.9 5.55 5 909 521 19.9 19.3 19.6 13.9 5.9 9.9 5.3 0.8 3.0 27.5 25.9 aj 94.0 BeninBhutan 160 104 134 <0.1 0.81 234 506 21.9 24.9 23.3 14.0 8.5 11.4 0.9 0.1 0.6 17.4 84.6 aj 28.4 BhutanBolivia (Plurinational State of) 134 88 111 1.3 0.20 1 773 280 17.7 16.8 17.2 15.8 8.6 12.2 8.0 1.6 4.8 15.5 50.3 aj 71.0 Bolivia (Plurinational State of)Bosnia and Herzegovina 36 19 27 - 0.30 0 23.1 12.9 17.8 14.1 3.6 8.8 10.9 2.1 6.4 15.7 21.9 aj 10.7 Bosnia and Herzegovina
Botswana 375 226 300 2.0 0.19 241 157 23.4 17.9 20.3 14.2 4.5 9.3 14.4 2.4 8.4 23.8 - 37.5 BotswanaBrazil 60 27 44 5.1 0.07 9 411 158 20.0 13.5 16.6 10.0 3.1 6.5 13.4 2.4 7.8 19.7 - 60.8 Brazil
Brunei Darussalam 84 42 64 - 0.34 2 18.5 14.8 16.6 6.4 2.7 4.6 0.6 0.2 0.4 - - 11.4 Brunei Darussalam
Bulgaria 34 16 25 - 0.31 218 32.0 15.5 23.6 18.2 5.1 11.5 21.0 4.9 12.7 10.2 - 39.4 Bulgaria
Burkina Faso 61 37 49 412.0 4.29 6 531 262 22.5 21.2 21.7 10.2 5.3 7.7 14.2 2.4 8.2 30.5 56.4 122.0 Burkina Faso
Burundi 144 86 114 194.5 2.59 5 340 398 23.1 22.7 22.9 13.4 4.9 9.1 13.0 2.2 7.5 34.7 38.0 58.0 BurundiCabo Verde 167 102 134 3.0 0.71 145 562 19.0 15.9 17.2 16.5 6.1 11.3 10.0 1.7 5.7 25.0 - 80.0 Cabo Verde
Cambodia 389 266 326 18.4 0.56 5 298 995 23.9 19.1 21.1 7.8 2.9 5.3 11.9 2.0 6.7 17.8 56.5 57.0 Cambodia
Cameroon 240 148 194 303.8 1.90 16 222 133 22.3 20.9 21.6 17.1 7.4 12.2 15.2 2.7 8.9 30.1 47.0 119.0 Cameroon
Canada 6.0 5.0 5.5 - 1.03 5 11.5 8.1 9.8 18.1 7.0 12.5 14.6 3.4 8.9 5.8 - 11.1 CanadaCentral African Republic 530 320 423 387.3 6.62 3 765 243 23.9 22.4 23.1 11.5 4.0 7.7 5.7 1.0 3.3 33.6 28.7 aj 229.0 Central African Republic
Chad 191 117 154 188.6 3.08 6 222 557 24.2 23.7 23.9 10.3 7.4 8.8 2.7 0.4 1.6 27.6 20.2 179.0 Chad
Chile 22 13 17 - 0.28 15 14.8 10.1 12.4 17.2 4.0 10.6 15.0 3.7 9.3 12.5 - 40.6 ChileChina 83 42 63 0.0 0.83 26 376 326 19.8 14.1 17.0 9.1 10.3 9.7 11.7 2.5 7.2 18.2 - 9.2 China
Colombia 42 24 33 7.4 0.21 3 391 009 18.3 13.5 15.8 11.6 2.8 7.2 10.1 1.8 5.8 18.5 86.6 71.6 Colombia
Comoros 43 27 35 4.0 1.96 828 148 24.8 21.2 22.9 9.9 3.6 6.8 1.6 0.2 0.9 26.5 28.8 70.0 Comoros
Congo 465 288 376 197.6 4.11 1 784 187 15.9 17.4 16.7 8.4 3.3 5.9 12.9 2.8 7.8 27.4 43.2 147.0 Congo
Cook Islands 0.0 0.0 0.0 - 0.22 0 - - - - - - 17.5 3.7 10.6 17.3 - 67.0 Cook IslandsCosta Rica 12 7.0 9.7 <0.1 0.17 7 794 13.7 9.4 11.5 13.5 2.4 7.9 8.2 1.4 4.8 16.7 89.1 aj 53.2 Costa RicaCôte d’Ivoire 181 114 148 138.9 3.04 20 479 536 28.2 30.1 29.1 20.6 8.3 14.5 14.0 2.4 8.4 23.6 39.4 aj 129.0 Côte d’Ivoire
Croatia 13 6.8 10 - 0.11 15 22.8 10.7 16.7 25.6 7.9 16.5 15.1 3.3 8.9 8.1 - 9.6 Croatia
Cuba 9.1 5.2 7.1 - 0.12 40 866 19.0 13.8 16.4 22.1 5.8 13.9 10.2 1.9 6.1 8.5 88.8 50.4 Cuba
Cyprus 6.6 3.6 5.1 - 0.60 4 15.2 7.5 11.3 8.2 2.3 5.3 17.1 4.2 10.8 5.1 - 4.9 CyprusCzechia 7.1 3.7 5.4 - 0.39 1 20.0 10.2 15.0 21.4 5.1 13.1 23.2 6.2 14.4 5.9 - 11.6 CzechiaDemocratic People’s Republic of Korea 651 380 513 0.2 0.53 5 554 958 34.4 17.6 25.6 14.1 8.5 11.2 6.7 1.2 3.9 - 89.8 aj - Democratic People’s Republic of Korea
Democratic Republic of the Congo 400 244 322 307.6 1.43 55 563 632 19.7 19.2 19.4 8.4 2.9 5.7 4.4 0.8 2.6 33.7 18.9 138.0 Democratic Republic of the Congo
Denmark 6.6 3.5 5.1 - 0.79 0 13.1 9.5 11.3 17.3 8.2 12.8 16.5 4.5 10.4 4.0 - 2.5 Denmark
Djibouti 295 242 269 31.9 0.64 110 561 21.2 18.2 19.6 9.0 4.3 6.7 0.9 0.1 0.5 - - 20.6 Djibouti
Dominica 2.0 1.1 1.6 - 0.39 6 920 - - - - - - 13.8 2.7 8.2 10.9 - - Dominica
Dominican Republic 57 33 45 0.1 0.34 2 805 557 21.7 16.5 19.0 16.8 3.1 9.9 11.6 2.2 6.9 34.6 81.7 45.3 Dominican Republic
Ecuador 59 27 43 2.6 0.32 1 848 654 13.9 12.2 13.0 10.3 3.9 7.1 7.4 1.5 4.4 21.3 79.4 56.5 EcuadorEgypt 15 11 13 0.0 0.80 5 021 586 31.5 23.8 27.7 6.4 1.5 4.0 0.7 0.1 0.4 9.7 80.0 aj 56.0 Egypt
El Salvador 118 31 72 0.0 0.57 1 411 062 15.1 13.1 14.0 24.2 4.5 13.7 6.9 1.1 3.8 22.2 80.0 69.2 El SalvadorEquatorial Guinea 200 179 191 343.3 8.66 429 326 22.6 21.3 22.0 23.5 7.7 16.4 17.4 4.7 11.3 24.6 20.7 aj 176.0 Equatorial Guinea
PA
RT
2
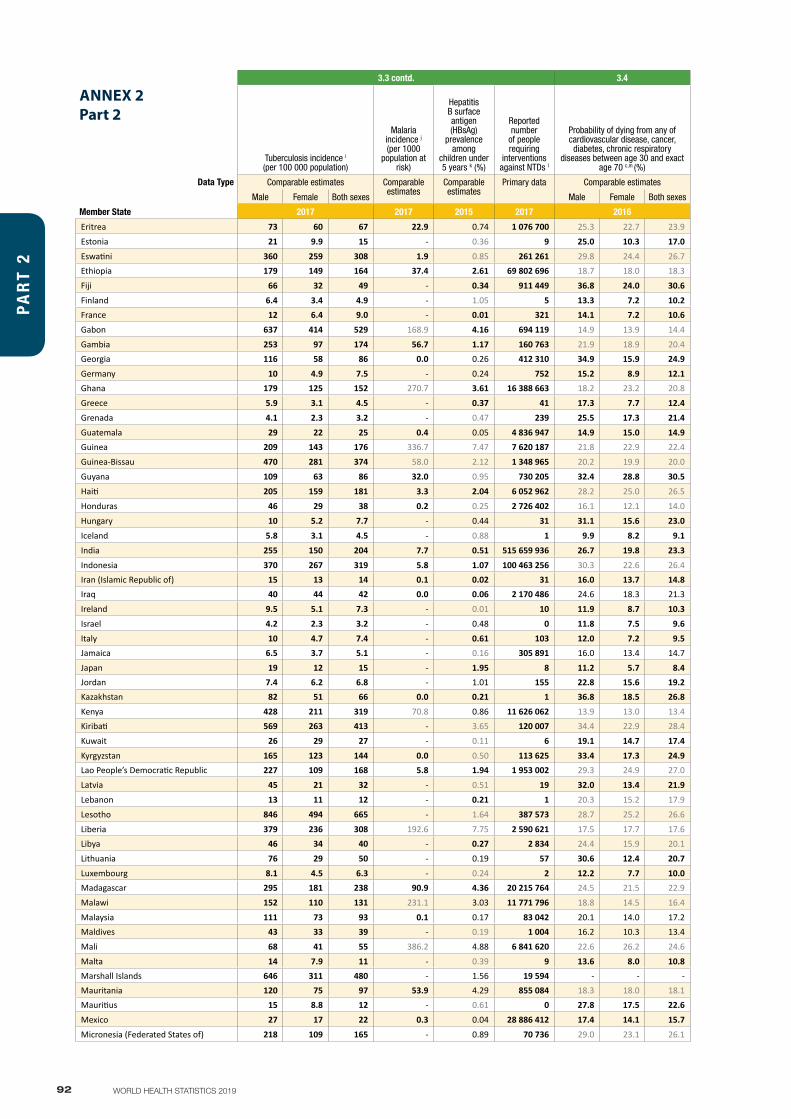
92 WORLD HEALTH STATISTICS 2019
3.3 contd. 3.4 3.4 3.6 3.7
ANNEX 2Part 2
Tuberculosis incidence i (per 100 000 population)
Malaria incidence j
(per 1000 population at
risk)
Hepatitis B surface antigen (HBsAg)
prevalence among
children under 5 years k (%)
Reported number
of people requiring
interventions against NTDs l
Probability of dying from any of cardiovascular disease, cancer,
diabetes, chronic respiratory diseases between age 30 and exact
age 70 c,m (%)Suicide mortality rate c,m (per 100 000 population)
Total alcohol per capita (>age 15 years) consumption n (litres of pure
alcohol)
Road traffic mortality rate o (per 100 000 population)
Proportion of women of reproductive
age who have their need for
family planning satisfied
with modern methods p (%)
Adolescent birth rate q (per 1000 women aged 15–19
years)
Data Type Comparable estimates Comparable estimates
Comparable estimates
Primary data Comparable estimates Comparable estimates Comparable estimates Comparable estimates
Primary data Primary data
Member State
Male Female Both sexes Male Female Both sexes Male Female Both sexes Male Female Both sexes
2017 2017 2015 2017 2016 2016 2016 2016 2009–2018 2009–2017 Member State
Eritrea 73 60 67 22.9 0.74 1 076 700 25.3 22.7 23.9 12.3 3.6 7.9 2.2 0.3 1.3 25.3 21.0 - Eritrea
Estonia 21 9.9 15 - 0.36 9 25.0 10.3 17.0 30.6 6.6 17.8 19.4 4.9 11.6 6.1 - 12.5 Estonia
Eswatini 360 259 308 1.9 0.85 261 261 29.8 24.4 26.7 19.5 7.5 13.3 17.3 2.9 9.9 26.9 82.9 87.0 EswatiniEthiopia 179 149 164 37.4 2.61 69 802 696 18.7 18.0 18.3 11.2 3.1 7.2 5.0 0.8 2.9 26.7 62.3 aj 80.0 Ethiopia
Fiji 66 32 49 - 0.34 911 449 36.8 24.0 30.6 7.5 2.4 5.0 5.2 0.7 3.0 9.6 - 40.0 Fiji
Finland 6.4 3.4 4.9 - 1.05 5 13.3 7.2 10.2 23.9 8.1 15.9 17.2 4.4 10.7 4.7 - 6.2 FinlandFrance 12 6.4 9.0 - 0.01 321 14.1 7.2 10.6 23.9 11.7 17.7 20.3 5.4 12.6 5.5 - 5.0 France
Gabon 637 414 529 168.9 4.16 694 119 14.9 13.9 14.4 10.7 3.2 7.1 18.1 4.6 11.5 23.2 44.0 91.0 Gabon
Gambia 253 97 174 56.7 1.17 160 763 21.9 18.9 20.4 6.6 3.7 5.1 6.6 1.1 3.8 29.7 26.7 88.0 GambiaGeorgia 116 58 86 0.0 0.26 412 310 34.9 15.9 24.9 14.2 2.7 8.2 17.7 2.9 9.8 15.3 52.8 aj 43.6 Georgia
Germany 10 4.9 7.5 - 0.24 752 15.2 8.9 12.1 19.7 7.7 13.6 21.3 5.9 13.4 4.1 - 7.8 GermanyGhana 179 125 152 270.7 3.61 16 388 663 18.2 23.2 20.8 8.7 2.1 5.4 4.7 0.7 2.7 24.9 46.2 aj 59.0 Ghana
Greece 5.9 3.1 4.5 - 0.37 41 17.3 7.7 12.4 8.1 2.0 5.0 17.2 4.1 10.4 9.2 - 8.0 Greece
Grenada 4.1 2.3 3.2 - 0.47 239 25.5 17.3 21.4 1.5 1.9 1.7 15.4 3.1 9.3 9.3 - - Grenada
Guatemala 29 22 25 0.4 0.05 4 836 947 14.9 15.0 14.9 3.7 1.8 2.7 4.3 0.7 2.5 16.6 66.1 92.0 GuatemalaGuinea 209 143 176 336.7 7.47 7 620 187 21.8 22.9 22.4 7.5 5.0 6.3 2.2 0.3 1.3 28.2 21.5 aj 146.0 Guinea
Guinea-Bissau 470 281 374 58.0 2.12 1 348 965 20.2 19.9 20.0 4.7 3.3 4.0 8.3 1.3 4.8 31.1 55.7 106.0 Guinea-Bissau
Guyana 109 63 86 32.0 0.95 730 205 32.4 28.8 30.5 43.7 14.4 29.2 10.6 1.9 6.3 24.6 51.5 74.0 Guyana
Haiti 205 159 181 3.3 2.04 6 052 962 28.2 25.0 26.5 17.0 6.5 11.7 10.0 1.8 5.8 - 43.1 55.0 Haiti
Honduras 46 29 38 0.2 0.25 2 726 402 16.1 12.1 14.0 4.4 1.5 2.9 6.9 1.2 4.0 16.7 76.0 103.0 Honduras
Hungary 10 5.2 7.7 - 0.44 31 31.1 15.6 23.0 29.7 9.6 19.1 19.1 4.5 11.4 7.8 - 22.8 Hungary
Iceland 5.8 3.1 4.5 - 0.88 1 9.9 8.2 9.1 22.3 5.6 14.0 14.5 3.8 9.1 6.6 - 8.0 Iceland
India 255 150 204 7.7 0.51 515 659 936 26.7 19.8 23.3 17.8 14.7 16.3 9.4 1.7 5.7 22.6 67.2 28.1 India
Indonesia 370 267 319 5.8 1.07 100 463 256 30.3 22.6 26.4 4.8 2.0 3.4 1.4 0.2 0.8 12.2 77.6 40.1 IndonesiaIran (Islamic Republic of) 15 13 14 0.1 0.02 31 16.0 13.7 14.8 5.0 3.1 4.1 1.9 0.1 1.0 20.5 68.6 aj 37.9 Iran (Islamic Republic of)Iraq 40 44 42 0.0 0.06 2 170 486 24.6 18.3 21.3 3.4 2.6 3.0 0.7 0.1 0.4 20.7 54.6 aj 82.0 Iraq
Ireland 9.5 5.1 7.3 - 0.01 10 11.9 8.7 10.3 18.5 4.6 11.5 20.4 5.8 13.0 4.1 - 8.7 Ireland
Israel 4.2 2.3 3.2 - 0.48 0 11.8 7.5 9.6 8.1 2.7 5.4 6.4 1.4 3.8 4.2 - 9.7 Israel
Italy 10 4.7 7.4 - 0.61 103 12.0 7.2 9.5 12.1 4.5 8.2 12.5 2.8 7.5 5.6 - 5.1 ItalyJamaica 6.5 3.7 5.1 - 0.16 305 891 16.0 13.4 14.7 3.3 1.0 2.2 7.1 1.2 4.2 13.6 79.2 aj 45.7 Jamaica
Japan 19 12 15 - 1.95 8 11.2 5.7 8.4 26.0 11.4 18.5 13.5 2.9 8.0 4.1 - 4.1 JapanJordan 7.4 6.2 6.8 - 1.01 155 22.8 15.6 19.2 3.6 2.2 2.9 1.3 0.2 0.7 24.4 56.7 aj 26.0 JordanKazakhstan 82 51 66 0.0 0.21 1 36.8 18.5 26.8 38.3 7.6 22.5 13.6 2.4 7.7 17.6 79.4 aj 36.0 Kazakhstan
Kenya 428 211 319 70.8 0.86 11 626 062 13.9 13.0 13.4 5.1 1.2 3.2 5.8 0.9 3.4 27.8 76.0 96.0 KenyaKiribati 569 263 413 - 3.65 120 007 34.4 22.9 28.4 24.1 5.0 14.4 0.8 0.1 0.4 4.4 35.8 aj 49.9 Kiribati
Kuwait 26 29 27 - 0.11 6 19.1 14.7 17.4 2.8 1.7 2.3 0.0 0.0 0.0 17.6 - 6.1 Kuwait
Kyrgyzstan 165 123 144 0.0 0.50 113 625 33.4 17.3 24.9 13.2 3.5 8.3 11.0 1.7 6.2 15.4 66.2 38.1 KyrgyzstanLao People’s Democratic Republic 227 109 168 5.8 1.94 1 953 002 29.3 24.9 27.0 11.4 5.7 8.6 17.6 3.3 10.4 16.6 71.6 aj 75.6 Lao People’s Democratic Republic
Latvia 45 21 32 - 0.51 19 32.0 13.4 21.9 37.6 7.3 21.2 21.7 5.7 12.9 9.3 - 18.0 Latvia
Lebanon 13 11 12 - 0.21 1 20.3 15.2 17.9 4.2 2.4 3.3 2.7 0.3 1.5 18.1 - - Lebanon
Lesotho 846 494 665 - 1.64 387 573 28.7 25.2 26.6 17.8 24.4 21.2 8.9 1.3 5.0 28.9 78.9 94.0 Lesotho
Liberia 379 236 308 192.6 7.75 2 590 621 17.5 17.7 17.6 7.1 6.6 6.8 9.9 1.6 5.8 35.9 41.4 104.8 LiberiaLibya 46 34 40 - 0.27 2 834 24.4 15.9 20.1 8.1 2.2 5.2 0.1 0.0 0.0 26.1 24.0 aj 10.9 Libya
Lithuania 76 29 50 - 0.19 57 30.6 12.4 20.7 58.1 9.5 31.9 24.9 6.9 15.0 8.0 - 14.1 Lithuania
Luxembourg 8.1 4.5 6.3 - 0.24 2 12.2 7.7 10.0 18.6 8.3 13.5 19.7 6.3 13.0 6.3 - 5.6 LuxembourgMadagascar 295 181 238 90.9 4.36 20 215 764 24.5 21.5 22.9 5.6 2.2 3.9 3.4 0.5 1.9 28.6 60.5 aj 152.0 Madagascar
Malawi 152 110 131 231.1 3.03 11 771 796 18.8 14.5 16.4 5.8 1.6 3.7 6.4 1.0 3.7 31.0 73.9 136.0 Malawi
Malaysia 111 73 93 0.1 0.17 83 042 20.1 14.0 17.2 7.8 3.2 5.5 1.6 0.3 0.9 23.6 - 11.5 MalaysiaMaldives 43 33 39 - 0.19 1 004 16.2 10.3 13.4 3.0 1.3 2.3 4.8 0.6 2.7 0.9 42.5 aj 12.9 Maldives
Mali 68 41 55 386.2 4.88 6 841 620 22.6 26.2 24.6 6.9 2.7 4.8 2.2 0.3 1.3 23.1 35.0 174.0 Mali
Malta 14 7.9 11 - 0.39 9 13.6 8.0 10.8 12.1 2.8 7.5 13.2 2.9 8.1 6.1 - 11.4 MaltaMarshall Islands 646 311 480 - 1.56 19 594 - - - - - - - - - - - 84.5 Marshall IslandsMauritania 120 75 97 53.9 4.29 855 084 18.3 18.0 18.1 6.6 2.2 4.4 0.1 0.0 0.0 24.7 30.4 aj 77.0 MauritaniaMauritius 15 8.8 12 - 0.61 0 27.8 17.5 22.6 13.3 2.4 7.8 6.3 1.0 3.6 13.7 40.8 aj 24.1 Mauritius
Mexico 27 17 22 0.3 0.04 28 886 412 17.4 14.1 15.7 8.0 2.3 5.1 11.1 2.1 6.5 13.1 79.8 66.2 Mexico
Micronesia (Federated States of) 218 109 165 - 0.89 70 736 29.0 23.1 26.1 15.8 6.3 11.1 4.2 0.6 2.5 1.9 - 44.0 Micronesia (Federated States of)
PA
RT
2
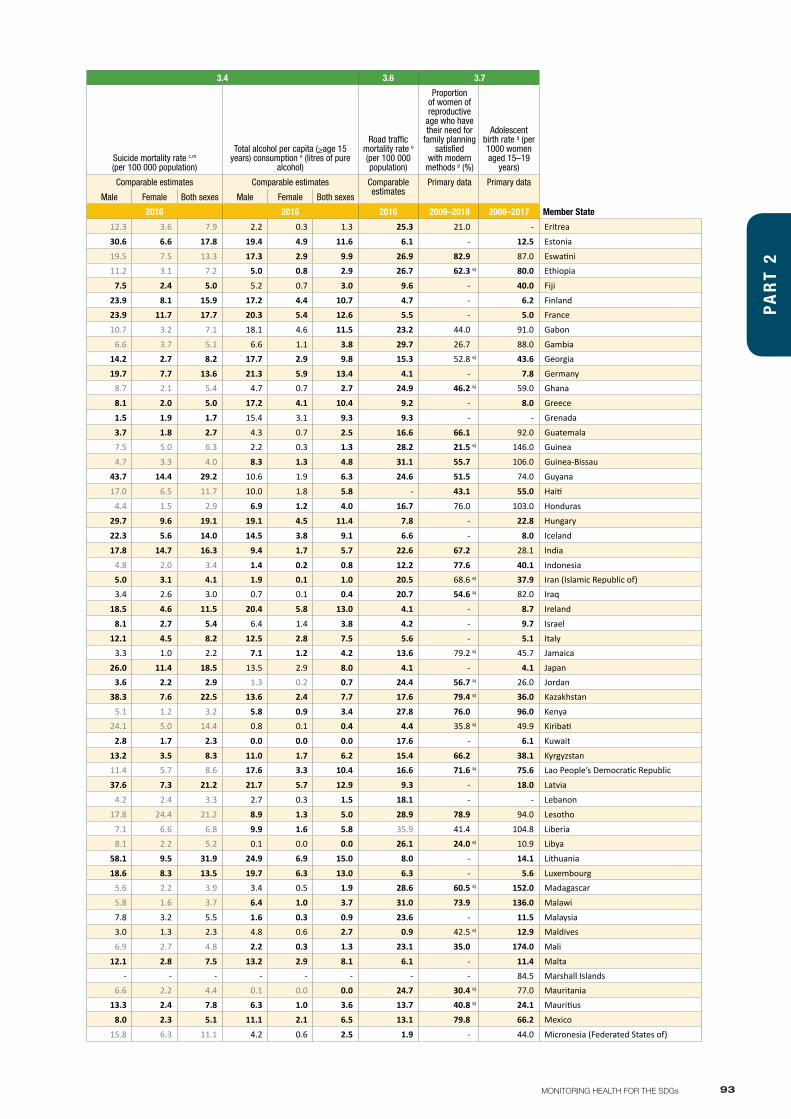
93MONITORING HEALTH FOR THE SDGs
3.3 contd. 3.4 3.4 3.6 3.7
ANNEX 2Part 2
Tuberculosis incidence i (per 100 000 population)
Malaria incidence j
(per 1000 population at
risk)
Hepatitis B surface antigen (HBsAg)
prevalence among
children under 5 years k (%)
Reported number
of people requiring
interventions against NTDs l
Probability of dying from any of cardiovascular disease, cancer,
diabetes, chronic respiratory diseases between age 30 and exact
age 70 c,m (%)Suicide mortality rate c,m (per 100 000 population)
Total alcohol per capita (>age 15 years) consumption n (litres of pure
alcohol)
Road traffic mortality rate o (per 100 000 population)
Proportion of women of reproductive
age who have their need for
family planning satisfied
with modern methods p (%)
Adolescent birth rate q (per 1000 women aged 15–19
years)
Data Type Comparable estimates Comparable estimates
Comparable estimates
Primary data Comparable estimates Comparable estimates Comparable estimates Comparable estimates
Primary data Primary data
Member State
Male Female Both sexes Male Female Both sexes Male Female Both sexes Male Female Both sexes
2017 2017 2015 2017 2016 2016 2016 2016 2009–2018 2009–2017 Member State
Eritrea 73 60 67 22.9 0.74 1 076 700 25.3 22.7 23.9 12.3 3.6 7.9 2.2 0.3 1.3 25.3 21.0 - Eritrea
Estonia 21 9.9 15 - 0.36 9 25.0 10.3 17.0 30.6 6.6 17.8 19.4 4.9 11.6 6.1 - 12.5 Estonia
Eswatini 360 259 308 1.9 0.85 261 261 29.8 24.4 26.7 19.5 7.5 13.3 17.3 2.9 9.9 26.9 82.9 87.0 EswatiniEthiopia 179 149 164 37.4 2.61 69 802 696 18.7 18.0 18.3 11.2 3.1 7.2 5.0 0.8 2.9 26.7 62.3 aj 80.0 Ethiopia
Fiji 66 32 49 - 0.34 911 449 36.8 24.0 30.6 7.5 2.4 5.0 5.2 0.7 3.0 9.6 - 40.0 Fiji
Finland 6.4 3.4 4.9 - 1.05 5 13.3 7.2 10.2 23.9 8.1 15.9 17.2 4.4 10.7 4.7 - 6.2 FinlandFrance 12 6.4 9.0 - 0.01 321 14.1 7.2 10.6 23.9 11.7 17.7 20.3 5.4 12.6 5.5 - 5.0 France
Gabon 637 414 529 168.9 4.16 694 119 14.9 13.9 14.4 10.7 3.2 7.1 18.1 4.6 11.5 23.2 44.0 91.0 Gabon
Gambia 253 97 174 56.7 1.17 160 763 21.9 18.9 20.4 6.6 3.7 5.1 6.6 1.1 3.8 29.7 26.7 88.0 GambiaGeorgia 116 58 86 0.0 0.26 412 310 34.9 15.9 24.9 14.2 2.7 8.2 17.7 2.9 9.8 15.3 52.8 aj 43.6 Georgia
Germany 10 4.9 7.5 - 0.24 752 15.2 8.9 12.1 19.7 7.7 13.6 21.3 5.9 13.4 4.1 - 7.8 GermanyGhana 179 125 152 270.7 3.61 16 388 663 18.2 23.2 20.8 8.7 2.1 5.4 4.7 0.7 2.7 24.9 46.2 aj 59.0 Ghana
Greece 5.9 3.1 4.5 - 0.37 41 17.3 7.7 12.4 8.1 2.0 5.0 17.2 4.1 10.4 9.2 - 8.0 Greece
Grenada 4.1 2.3 3.2 - 0.47 239 25.5 17.3 21.4 1.5 1.9 1.7 15.4 3.1 9.3 9.3 - - Grenada
Guatemala 29 22 25 0.4 0.05 4 836 947 14.9 15.0 14.9 3.7 1.8 2.7 4.3 0.7 2.5 16.6 66.1 92.0 GuatemalaGuinea 209 143 176 336.7 7.47 7 620 187 21.8 22.9 22.4 7.5 5.0 6.3 2.2 0.3 1.3 28.2 21.5 aj 146.0 Guinea
Guinea-Bissau 470 281 374 58.0 2.12 1 348 965 20.2 19.9 20.0 4.7 3.3 4.0 8.3 1.3 4.8 31.1 55.7 106.0 Guinea-Bissau
Guyana 109 63 86 32.0 0.95 730 205 32.4 28.8 30.5 43.7 14.4 29.2 10.6 1.9 6.3 24.6 51.5 74.0 Guyana
Haiti 205 159 181 3.3 2.04 6 052 962 28.2 25.0 26.5 17.0 6.5 11.7 10.0 1.8 5.8 - 43.1 55.0 Haiti
Honduras 46 29 38 0.2 0.25 2 726 402 16.1 12.1 14.0 4.4 1.5 2.9 6.9 1.2 4.0 16.7 76.0 103.0 Honduras
Hungary 10 5.2 7.7 - 0.44 31 31.1 15.6 23.0 29.7 9.6 19.1 19.1 4.5 11.4 7.8 - 22.8 Hungary
Iceland 5.8 3.1 4.5 - 0.88 1 9.9 8.2 9.1 22.3 5.6 14.0 14.5 3.8 9.1 6.6 - 8.0 Iceland
India 255 150 204 7.7 0.51 515 659 936 26.7 19.8 23.3 17.8 14.7 16.3 9.4 1.7 5.7 22.6 67.2 28.1 India
Indonesia 370 267 319 5.8 1.07 100 463 256 30.3 22.6 26.4 4.8 2.0 3.4 1.4 0.2 0.8 12.2 77.6 40.1 IndonesiaIran (Islamic Republic of) 15 13 14 0.1 0.02 31 16.0 13.7 14.8 5.0 3.1 4.1 1.9 0.1 1.0 20.5 68.6 aj 37.9 Iran (Islamic Republic of)Iraq 40 44 42 0.0 0.06 2 170 486 24.6 18.3 21.3 3.4 2.6 3.0 0.7 0.1 0.4 20.7 54.6 aj 82.0 Iraq
Ireland 9.5 5.1 7.3 - 0.01 10 11.9 8.7 10.3 18.5 4.6 11.5 20.4 5.8 13.0 4.1 - 8.7 Ireland
Israel 4.2 2.3 3.2 - 0.48 0 11.8 7.5 9.6 8.1 2.7 5.4 6.4 1.4 3.8 4.2 - 9.7 Israel
Italy 10 4.7 7.4 - 0.61 103 12.0 7.2 9.5 12.1 4.5 8.2 12.5 2.8 7.5 5.6 - 5.1 ItalyJamaica 6.5 3.7 5.1 - 0.16 305 891 16.0 13.4 14.7 3.3 1.0 2.2 7.1 1.2 4.2 13.6 79.2 aj 45.7 Jamaica
Japan 19 12 15 - 1.95 8 11.2 5.7 8.4 26.0 11.4 18.5 13.5 2.9 8.0 4.1 - 4.1 JapanJordan 7.4 6.2 6.8 - 1.01 155 22.8 15.6 19.2 3.6 2.2 2.9 1.3 0.2 0.7 24.4 56.7 aj 26.0 JordanKazakhstan 82 51 66 0.0 0.21 1 36.8 18.5 26.8 38.3 7.6 22.5 13.6 2.4 7.7 17.6 79.4 aj 36.0 Kazakhstan
Kenya 428 211 319 70.8 0.86 11 626 062 13.9 13.0 13.4 5.1 1.2 3.2 5.8 0.9 3.4 27.8 76.0 96.0 KenyaKiribati 569 263 413 - 3.65 120 007 34.4 22.9 28.4 24.1 5.0 14.4 0.8 0.1 0.4 4.4 35.8 aj 49.9 Kiribati
Kuwait 26 29 27 - 0.11 6 19.1 14.7 17.4 2.8 1.7 2.3 0.0 0.0 0.0 17.6 - 6.1 Kuwait
Kyrgyzstan 165 123 144 0.0 0.50 113 625 33.4 17.3 24.9 13.2 3.5 8.3 11.0 1.7 6.2 15.4 66.2 38.1 KyrgyzstanLao People’s Democratic Republic 227 109 168 5.8 1.94 1 953 002 29.3 24.9 27.0 11.4 5.7 8.6 17.6 3.3 10.4 16.6 71.6 aj 75.6 Lao People’s Democratic Republic
Latvia 45 21 32 - 0.51 19 32.0 13.4 21.9 37.6 7.3 21.2 21.7 5.7 12.9 9.3 - 18.0 Latvia
Lebanon 13 11 12 - 0.21 1 20.3 15.2 17.9 4.2 2.4 3.3 2.7 0.3 1.5 18.1 - - Lebanon
Lesotho 846 494 665 - 1.64 387 573 28.7 25.2 26.6 17.8 24.4 21.2 8.9 1.3 5.0 28.9 78.9 94.0 Lesotho
Liberia 379 236 308 192.6 7.75 2 590 621 17.5 17.7 17.6 7.1 6.6 6.8 9.9 1.6 5.8 35.9 41.4 104.8 LiberiaLibya 46 34 40 - 0.27 2 834 24.4 15.9 20.1 8.1 2.2 5.2 0.1 0.0 0.0 26.1 24.0 aj 10.9 Libya
Lithuania 76 29 50 - 0.19 57 30.6 12.4 20.7 58.1 9.5 31.9 24.9 6.9 15.0 8.0 - 14.1 Lithuania
Luxembourg 8.1 4.5 6.3 - 0.24 2 12.2 7.7 10.0 18.6 8.3 13.5 19.7 6.3 13.0 6.3 - 5.6 LuxembourgMadagascar 295 181 238 90.9 4.36 20 215 764 24.5 21.5 22.9 5.6 2.2 3.9 3.4 0.5 1.9 28.6 60.5 aj 152.0 Madagascar
Malawi 152 110 131 231.1 3.03 11 771 796 18.8 14.5 16.4 5.8 1.6 3.7 6.4 1.0 3.7 31.0 73.9 136.0 Malawi
Malaysia 111 73 93 0.1 0.17 83 042 20.1 14.0 17.2 7.8 3.2 5.5 1.6 0.3 0.9 23.6 - 11.5 MalaysiaMaldives 43 33 39 - 0.19 1 004 16.2 10.3 13.4 3.0 1.3 2.3 4.8 0.6 2.7 0.9 42.5 aj 12.9 Maldives
Mali 68 41 55 386.2 4.88 6 841 620 22.6 26.2 24.6 6.9 2.7 4.8 2.2 0.3 1.3 23.1 35.0 174.0 Mali
Malta 14 7.9 11 - 0.39 9 13.6 8.0 10.8 12.1 2.8 7.5 13.2 2.9 8.1 6.1 - 11.4 MaltaMarshall Islands 646 311 480 - 1.56 19 594 - - - - - - - - - - - 84.5 Marshall IslandsMauritania 120 75 97 53.9 4.29 855 084 18.3 18.0 18.1 6.6 2.2 4.4 0.1 0.0 0.0 24.7 30.4 aj 77.0 MauritaniaMauritius 15 8.8 12 - 0.61 0 27.8 17.5 22.6 13.3 2.4 7.8 6.3 1.0 3.6 13.7 40.8 aj 24.1 Mauritius
Mexico 27 17 22 0.3 0.04 28 886 412 17.4 14.1 15.7 8.0 2.3 5.1 11.1 2.1 6.5 13.1 79.8 66.2 Mexico
Micronesia (Federated States of) 218 109 165 - 0.89 70 736 29.0 23.1 26.1 15.8 6.3 11.1 4.2 0.6 2.5 1.9 - 44.0 Micronesia (Federated States of)
PA
RT
2
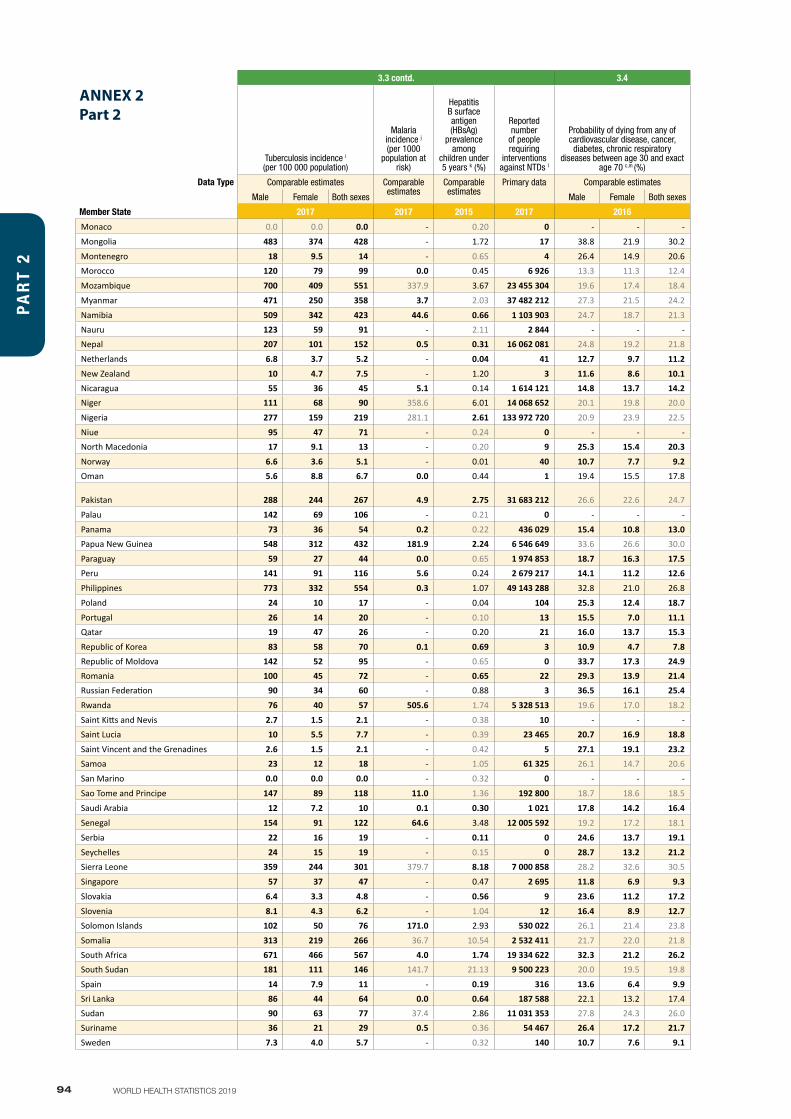
94 WORLD HEALTH STATISTICS 2019
3.3 contd. 3.4 3.4 3.6 3.7
ANNEX 2Part 2
Tuberculosis incidence i (per 100 000 population)
Malaria incidence j
(per 1000 population at
risk)
Hepatitis B surface antigen (HBsAg)
prevalence among
children under 5 years k (%)
Reported number
of people requiring
interventions against NTDs l
Probability of dying from any of cardiovascular disease, cancer,
diabetes, chronic respiratory diseases between age 30 and exact
age 70 c,m (%)Suicide mortality rate c,m (per 100 000 population)
Total alcohol per capita (>age 15 years) consumption n (litres of pure
alcohol)
Road traffic mortality rate o (per 100 000 population)
Proportion of women of reproductive
age who have their need for
family planning satisfied
with modern methods p (%)
Adolescent birth rate q (per 1000 women aged 15–19
years)
Data Type Comparable estimates Comparable estimates
Comparable estimates
Primary data Comparable estimates Comparable estimates Comparable estimates Comparable estimates
Primary data Primary data
Member State
Male Female Both sexes Male Female Both sexes Male Female Both sexes Male Female Both sexes
2017 2017 2015 2017 2016 2016 2016 2016 2009–2018 2009–2017 Member State
Monaco 0.0 0.0 0.0 - 0.20 0 - - - - - - - - - - - - Monaco
Mongolia 483 374 428 - 1.72 17 38.8 21.9 30.2 22.6 3.5 13.0 12.8 2.1 7.4 16.5 65.2 26.7 Mongolia
Montenegro 18 9.5 14 - 0.65 4 26.4 14.9 20.6 15.4 5.3 10.3 13.5 2.8 8.0 10.7 42.8 11.1 MontenegroMorocco 120 79 99 0.0 0.45 6 926 13.3 11.3 12.4 2.3 3.4 2.9 1.1 0.1 0.6 19.6 68.6 aj - Morocco
Mozambique 700 409 551 337.9 3.67 23 455 304 19.6 17.4 18.4 7.4 2.5 4.9 4.3 0.7 2.4 30.1 55.5 167.0 Mozambique
Myanmar 471 250 358 3.7 2.03 37 482 212 27.3 21.5 24.2 5.9 9.5 7.8 8.5 1.3 4.8 19.9 74.9 36.0 Myanmar
Namibia 509 342 423 44.6 0.66 1 103 903 24.7 18.7 21.3 14.1 3.6 8.7 17.3 2.9 9.8 30.4 80.4 82.0 NamibiaNauru 123 59 91 - 2.11 2 844 - - - - - - 10.5 1.6 6.0 - - 94.0 NauruNepal 207 101 152 0.5 0.31 16 062 081 24.8 19.2 21.8 9.7 7.9 8.8 3.6 0.6 2.0 15.9 56.0 aj 88.0 Nepal
Netherlands 6.8 3.7 5.2 - 0.04 41 12.7 9.7 11.2 16.2 9.0 12.6 13.9 3.6 8.7 3.8 - 3.2 Netherlands
New Zealand 10 4.7 7.5 - 1.20 3 11.6 8.6 10.1 17.9 6.6 12.1 17.2 4.6 10.7 7.8 - 16.0 New ZealandNicaragua 55 36 45 5.1 0.14 1 614 121 14.8 13.7 14.2 19.3 5.3 12.2 9.1 1.5 5.2 - 92.6 aj 92.0 NicaraguaNiger 111 68 90 358.6 6.01 14 068 652 20.1 19.8 20.0 5.9 3.3 4.6 0.9 0.1 0.5 26.2 45.5 aj 146.0 Niger
Nigeria 277 159 219 281.1 2.61 133 972 720 20.9 23.9 22.5 9.9 9.2 9.5 21.9 4.6 13.4 21.4 42.8 145.0 Nigeria
Niue 95 47 71 - 0.24 0 - - - - - - 12.0 2.1 7.0 - - 20.0 NiueNorth Macedonia 17 9.1 13 - 0.20 9 25.3 15.4 20.3 11.9 3.9 7.9 13.5 2.8 8.1 6.4 22.3 aj 16.2 North Macedonia
Norway 6.6 3.6 5.1 - 0.01 40 10.7 7.7 9.2 15.9 8.4 12.2 11.6 3.2 7.5 2.7 - 4.6 NorwayOman 5.6 8.8 6.7 0.0 0.44 1 19.4 15.5 17.8 5.6 0.8 3.9 1.0 0.1 0.8 16.1 39.6 aj 13.5 Oman
Pakistan 288 244 267 4.9 2.75 31 683 212 26.6 22.6 24.7 2.7 3.0 2.9 0.6 0.1 0.3 14.3 48.5aj,
ak 44.0 Pakistan
Palau 142 69 106 - 0.21 0 - - - - - - - - - - - 27.0 Palau
Panama 73 36 54 0.2 0.22 436 029 15.4 10.8 13.0 7.4 1.2 4.3 13.2 2.6 7.9 14.3 73.3 78.8 PanamaPapua New Guinea 548 312 432 181.9 2.24 6 546 649 33.6 26.6 30.0 8.6 3.3 6.0 2.1 0.3 1.2 14.2 - - Papua New Guinea
Paraguay 59 27 44 0.0 0.65 1 974 853 18.7 16.3 17.5 12.4 6.5 9.5 12.2 2.1 7.2 22.7 78.9 - ParaguayPeru 141 91 116 5.6 0.24 2 679 217 14.1 11.2 12.6 7.2 2.7 4.9 10.5 2.2 6.3 13.5 66.6 aj 49.4 Peru
Philippines 773 332 554 0.3 1.07 49 143 288 32.8 21.0 26.8 4.3 2.0 3.2 11.3 1.9 6.6 12.3 52.5 47.0 Philippines
Poland 24 10 17 - 0.04 104 25.3 12.4 18.7 28.9 4.3 16.2 19.2 4.7 11.6 9.7 - 12.3 Poland
Portugal 26 14 20 - 0.10 13 15.5 7.0 11.1 22.2 6.5 14.0 20.5 5.1 12.3 7.4 - 8.2 PortugalQatar 19 47 26 - 0.20 21 16.0 13.7 15.3 8.5 0.9 6.6 2.5 0.4 2.0 9.3 68.9 aj 10.5 Qatar
Republic of Korea 83 58 70 0.1 0.69 3 10.9 4.7 7.8 38.4 15.4 26.9 16.7 3.9 10.2 9.8 - 1.3 Republic of KoreaRepublic of Moldova 142 52 95 - 0.65 0 33.7 17.3 24.9 27.9 4.7 15.9 25.2 6.1 15.2 9.7 60.4 aj 26.7 Republic of MoldovaRomania 100 45 72 - 0.65 22 29.3 13.9 21.4 17.9 3.3 10.4 21.0 5.0 12.7 10.3 - 35.3 RomaniaRussian Federation 90 34 60 - 0.88 3 36.5 16.1 25.4 55.9 9.4 31.0 18.7 5.8 11.7 18.0 72.4 aj 24.0 Russian Federation
Rwanda 76 40 57 505.6 1.74 5 328 513 19.6 17.0 18.2 9.7 3.8 6.7 16.0 2.9 9.0 29.7 62.9 45.0 Rwanda
Saint Kitts and Nevis 2.7 1.5 2.1 - 0.38 10 - - - - - - 15.5 3.4 9.4 - - - Saint Kitts and NevisSaint Lucia 10 5.5 7.7 - 0.39 23 465 20.7 16.9 18.8 13.5 2.2 7.8 16.7 3.4 9.9 35.4 72.4 aj - Saint Lucia
Saint Vincent and the Grenadines 2.6 1.5 2.1 - 0.42 5 27.1 19.1 23.2 3.9 0.9 2.4 13.7 2.7 8.2 - - 63.7 Saint Vincent and the GrenadinesSamoa 23 12 18 - 1.05 61 325 26.1 14.7 20.6 6.7 1.9 4.4 4.3 0.6 2.5 11.3 39.4 aj 39.2 Samoa
San Marino 0.0 0.0 0.0 - 0.32 0 - - - - - - - - - 0.0 - 0.0 San Marino
Sao Tome and Principe 147 89 118 11.0 1.36 192 800 18.7 18.6 18.5 3.0 1.6 2.3 11.8 2.0 6.8 27.5 52.2 92.0 Sao Tome and Principe
Saudi Arabia 12 7.2 10 0.1 0.30 1 021 17.8 14.2 16.4 4.5 1.5 3.2 0.3 0.1 0.2 28.8 - - Saudi Arabia
Senegal 154 91 122 64.6 3.48 12 005 592 19.2 17.2 18.1 9.3 2.9 6.0 1.3 0.2 0.7 23.4 50.9 80.0 Senegal
Serbia 22 16 19 - 0.11 0 24.6 13.7 19.1 23.5 8.1 15.6 18.5 4.1 11.1 7.4 38.7 16.4 Serbia
Seychelles 24 15 19 - 0.15 0 28.7 13.2 21.2 16.4 2.4 9.3 19.7 4.1 12.0 15.9 - 65.8 SeychellesSierra Leone 359 244 301 379.7 8.18 7 000 858 28.2 32.6 30.5 11.3 8.1 9.7 9.8 1.6 5.7 - 44.7 aj 125.0 Sierra Leone
Singapore 57 37 47 - 0.47 2 695 11.8 6.9 9.3 13.8 6.1 9.9 3.3 0.8 2.0 2.8 - 2.7 Singapore
Slovakia 6.4 3.3 4.8 - 0.56 9 23.6 11.2 17.2 22.7 3.5 12.8 18.9 4.6 11.5 6.1 - 24.3 Slovakia
Slovenia 8.1 4.3 6.2 - 1.04 12 16.4 8.9 12.7 30.4 6.9 18.6 20.4 5.1 12.6 6.4 - 4.5 SloveniaSolomon Islands 102 50 76 171.0 2.93 530 022 26.1 21.4 23.8 6.8 2.6 4.7 2.5 0.3 1.4 17.4 38.0 aj 78.0 Solomon Islands
Somalia 313 219 266 36.7 10.54 2 532 411 21.7 22.0 21.8 6.3 3.1 4.7 0.0 0.0 0.0 27.1 - 64.0 SomaliaSouth Africa 671 466 567 4.0 1.74 19 334 622 32.3 21.2 26.2 18.7 4.7 11.6 16.2 2.7 9.3 25.9 77.9 aj 71.0 South AfricaSouth Sudan 181 111 146 141.7 21.13 9 500 223 20.0 19.5 19.8 4.9 2.6 3.7 - - - 29.9 5.6 aj - South Sudan
Spain 14 7.9 11 - 0.19 316 13.6 6.4 9.9 13.1 4.5 8.7 16.4 4.0 10.0 4.1 - 7.7 SpainSri Lanka 86 44 64 0.0 0.64 187 588 22.1 13.2 17.4 23.5 6.4 14.6 7.7 1.2 4.3 14.9 74.3 aj - Sri LankaSudan 90 63 77 37.4 2.86 11 031 353 27.8 24.3 26.0 12.2 4.0 8.1 0.9 0.1 0.5 25.7 30.1 aj 87.0 SudanSuriname 36 21 29 0.5 0.36 54 467 26.4 17.2 21.7 34.7 10.9 22.8 8.7 1.6 5.1 14.5 73.2 aj 57.7 Suriname
Sweden 7.3 4.0 5.7 - 0.32 140 10.7 7.6 9.1 19.1 10.5 14.8 14.6 3.8 9.2 2.8 - 4.5 Sweden
PA
RT
2

95MONITORING HEALTH FOR THE SDGs
3.3 contd. 3.4 3.4 3.6 3.7
ANNEX 2Part 2
Tuberculosis incidence i (per 100 000 population)
Malaria incidence j
(per 1000 population at
risk)
Hepatitis B surface antigen (HBsAg)
prevalence among
children under 5 years k (%)
Reported number
of people requiring
interventions against NTDs l
Probability of dying from any of cardiovascular disease, cancer,
diabetes, chronic respiratory diseases between age 30 and exact
age 70 c,m (%)Suicide mortality rate c,m (per 100 000 population)
Total alcohol per capita (>age 15 years) consumption n (litres of pure
alcohol)
Road traffic mortality rate o (per 100 000 population)
Proportion of women of reproductive
age who have their need for
family planning satisfied
with modern methods p (%)
Adolescent birth rate q (per 1000 women aged 15–19
years)
Data Type Comparable estimates Comparable estimates
Comparable estimates
Primary data Comparable estimates Comparable estimates Comparable estimates Comparable estimates
Primary data Primary data
Member State
Male Female Both sexes Male Female Both sexes Male Female Both sexes Male Female Both sexes
2017 2017 2015 2017 2016 2016 2016 2016 2009–2018 2009–2017 Member State
Monaco 0.0 0.0 0.0 - 0.20 0 - - - - - - - - - - - - Monaco
Mongolia 483 374 428 - 1.72 17 38.8 21.9 30.2 22.6 3.5 13.0 12.8 2.1 7.4 16.5 65.2 26.7 Mongolia
Montenegro 18 9.5 14 - 0.65 4 26.4 14.9 20.6 15.4 5.3 10.3 13.5 2.8 8.0 10.7 42.8 11.1 MontenegroMorocco 120 79 99 0.0 0.45 6 926 13.3 11.3 12.4 2.3 3.4 2.9 1.1 0.1 0.6 19.6 68.6 aj - Morocco
Mozambique 700 409 551 337.9 3.67 23 455 304 19.6 17.4 18.4 7.4 2.5 4.9 4.3 0.7 2.4 30.1 55.5 167.0 Mozambique
Myanmar 471 250 358 3.7 2.03 37 482 212 27.3 21.5 24.2 5.9 9.5 7.8 8.5 1.3 4.8 19.9 74.9 36.0 Myanmar
Namibia 509 342 423 44.6 0.66 1 103 903 24.7 18.7 21.3 14.1 3.6 8.7 17.3 2.9 9.8 30.4 80.4 82.0 NamibiaNauru 123 59 91 - 2.11 2 844 - - - - - - 10.5 1.6 6.0 - - 94.0 NauruNepal 207 101 152 0.5 0.31 16 062 081 24.8 19.2 21.8 9.7 7.9 8.8 3.6 0.6 2.0 15.9 56.0 aj 88.0 Nepal
Netherlands 6.8 3.7 5.2 - 0.04 41 12.7 9.7 11.2 16.2 9.0 12.6 13.9 3.6 8.7 3.8 - 3.2 Netherlands
New Zealand 10 4.7 7.5 - 1.20 3 11.6 8.6 10.1 17.9 6.6 12.1 17.2 4.6 10.7 7.8 - 16.0 New ZealandNicaragua 55 36 45 5.1 0.14 1 614 121 14.8 13.7 14.2 19.3 5.3 12.2 9.1 1.5 5.2 - 92.6 aj 92.0 NicaraguaNiger 111 68 90 358.6 6.01 14 068 652 20.1 19.8 20.0 5.9 3.3 4.6 0.9 0.1 0.5 26.2 45.5 aj 146.0 Niger
Nigeria 277 159 219 281.1 2.61 133 972 720 20.9 23.9 22.5 9.9 9.2 9.5 21.9 4.6 13.4 21.4 42.8 145.0 Nigeria
Niue 95 47 71 - 0.24 0 - - - - - - 12.0 2.1 7.0 - - 20.0 NiueNorth Macedonia 17 9.1 13 - 0.20 9 25.3 15.4 20.3 11.9 3.9 7.9 13.5 2.8 8.1 6.4 22.3 aj 16.2 North Macedonia
Norway 6.6 3.6 5.1 - 0.01 40 10.7 7.7 9.2 15.9 8.4 12.2 11.6 3.2 7.5 2.7 - 4.6 NorwayOman 5.6 8.8 6.7 0.0 0.44 1 19.4 15.5 17.8 5.6 0.8 3.9 1.0 0.1 0.8 16.1 39.6 aj 13.5 Oman
Pakistan 288 244 267 4.9 2.75 31 683 212 26.6 22.6 24.7 2.7 3.0 2.9 0.6 0.1 0.3 14.3 48.5aj,
ak 44.0 Pakistan
Palau 142 69 106 - 0.21 0 - - - - - - - - - - - 27.0 Palau
Panama 73 36 54 0.2 0.22 436 029 15.4 10.8 13.0 7.4 1.2 4.3 13.2 2.6 7.9 14.3 73.3 78.8 PanamaPapua New Guinea 548 312 432 181.9 2.24 6 546 649 33.6 26.6 30.0 8.6 3.3 6.0 2.1 0.3 1.2 14.2 - - Papua New Guinea
Paraguay 59 27 44 0.0 0.65 1 974 853 18.7 16.3 17.5 12.4 6.5 9.5 12.2 2.1 7.2 22.7 78.9 - ParaguayPeru 141 91 116 5.6 0.24 2 679 217 14.1 11.2 12.6 7.2 2.7 4.9 10.5 2.2 6.3 13.5 66.6 aj 49.4 Peru
Philippines 773 332 554 0.3 1.07 49 143 288 32.8 21.0 26.8 4.3 2.0 3.2 11.3 1.9 6.6 12.3 52.5 47.0 Philippines
Poland 24 10 17 - 0.04 104 25.3 12.4 18.7 28.9 4.3 16.2 19.2 4.7 11.6 9.7 - 12.3 Poland
Portugal 26 14 20 - 0.10 13 15.5 7.0 11.1 22.2 6.5 14.0 20.5 5.1 12.3 7.4 - 8.2 PortugalQatar 19 47 26 - 0.20 21 16.0 13.7 15.3 8.5 0.9 6.6 2.5 0.4 2.0 9.3 68.9 aj 10.5 Qatar
Republic of Korea 83 58 70 0.1 0.69 3 10.9 4.7 7.8 38.4 15.4 26.9 16.7 3.9 10.2 9.8 - 1.3 Republic of KoreaRepublic of Moldova 142 52 95 - 0.65 0 33.7 17.3 24.9 27.9 4.7 15.9 25.2 6.1 15.2 9.7 60.4 aj 26.7 Republic of MoldovaRomania 100 45 72 - 0.65 22 29.3 13.9 21.4 17.9 3.3 10.4 21.0 5.0 12.7 10.3 - 35.3 RomaniaRussian Federation 90 34 60 - 0.88 3 36.5 16.1 25.4 55.9 9.4 31.0 18.7 5.8 11.7 18.0 72.4 aj 24.0 Russian Federation
Rwanda 76 40 57 505.6 1.74 5 328 513 19.6 17.0 18.2 9.7 3.8 6.7 16.0 2.9 9.0 29.7 62.9 45.0 Rwanda
Saint Kitts and Nevis 2.7 1.5 2.1 - 0.38 10 - - - - - - 15.5 3.4 9.4 - - - Saint Kitts and NevisSaint Lucia 10 5.5 7.7 - 0.39 23 465 20.7 16.9 18.8 13.5 2.2 7.8 16.7 3.4 9.9 35.4 72.4 aj - Saint Lucia
Saint Vincent and the Grenadines 2.6 1.5 2.1 - 0.42 5 27.1 19.1 23.2 3.9 0.9 2.4 13.7 2.7 8.2 - - 63.7 Saint Vincent and the GrenadinesSamoa 23 12 18 - 1.05 61 325 26.1 14.7 20.6 6.7 1.9 4.4 4.3 0.6 2.5 11.3 39.4 aj 39.2 Samoa
San Marino 0.0 0.0 0.0 - 0.32 0 - - - - - - - - - 0.0 - 0.0 San Marino
Sao Tome and Principe 147 89 118 11.0 1.36 192 800 18.7 18.6 18.5 3.0 1.6 2.3 11.8 2.0 6.8 27.5 52.2 92.0 Sao Tome and Principe
Saudi Arabia 12 7.2 10 0.1 0.30 1 021 17.8 14.2 16.4 4.5 1.5 3.2 0.3 0.1 0.2 28.8 - - Saudi Arabia
Senegal 154 91 122 64.6 3.48 12 005 592 19.2 17.2 18.1 9.3 2.9 6.0 1.3 0.2 0.7 23.4 50.9 80.0 Senegal
Serbia 22 16 19 - 0.11 0 24.6 13.7 19.1 23.5 8.1 15.6 18.5 4.1 11.1 7.4 38.7 16.4 Serbia
Seychelles 24 15 19 - 0.15 0 28.7 13.2 21.2 16.4 2.4 9.3 19.7 4.1 12.0 15.9 - 65.8 SeychellesSierra Leone 359 244 301 379.7 8.18 7 000 858 28.2 32.6 30.5 11.3 8.1 9.7 9.8 1.6 5.7 - 44.7 aj 125.0 Sierra Leone
Singapore 57 37 47 - 0.47 2 695 11.8 6.9 9.3 13.8 6.1 9.9 3.3 0.8 2.0 2.8 - 2.7 Singapore
Slovakia 6.4 3.3 4.8 - 0.56 9 23.6 11.2 17.2 22.7 3.5 12.8 18.9 4.6 11.5 6.1 - 24.3 Slovakia
Slovenia 8.1 4.3 6.2 - 1.04 12 16.4 8.9 12.7 30.4 6.9 18.6 20.4 5.1 12.6 6.4 - 4.5 SloveniaSolomon Islands 102 50 76 171.0 2.93 530 022 26.1 21.4 23.8 6.8 2.6 4.7 2.5 0.3 1.4 17.4 38.0 aj 78.0 Solomon Islands
Somalia 313 219 266 36.7 10.54 2 532 411 21.7 22.0 21.8 6.3 3.1 4.7 0.0 0.0 0.0 27.1 - 64.0 SomaliaSouth Africa 671 466 567 4.0 1.74 19 334 622 32.3 21.2 26.2 18.7 4.7 11.6 16.2 2.7 9.3 25.9 77.9 aj 71.0 South AfricaSouth Sudan 181 111 146 141.7 21.13 9 500 223 20.0 19.5 19.8 4.9 2.6 3.7 - - - 29.9 5.6 aj - South Sudan
Spain 14 7.9 11 - 0.19 316 13.6 6.4 9.9 13.1 4.5 8.7 16.4 4.0 10.0 4.1 - 7.7 SpainSri Lanka 86 44 64 0.0 0.64 187 588 22.1 13.2 17.4 23.5 6.4 14.6 7.7 1.2 4.3 14.9 74.3 aj - Sri LankaSudan 90 63 77 37.4 2.86 11 031 353 27.8 24.3 26.0 12.2 4.0 8.1 0.9 0.1 0.5 25.7 30.1 aj 87.0 SudanSuriname 36 21 29 0.5 0.36 54 467 26.4 17.2 21.7 34.7 10.9 22.8 8.7 1.6 5.1 14.5 73.2 aj 57.7 Suriname
Sweden 7.3 4.0 5.7 - 0.32 140 10.7 7.6 9.1 19.1 10.5 14.8 14.6 3.8 9.2 2.8 - 4.5 Sweden
PA
RT
2
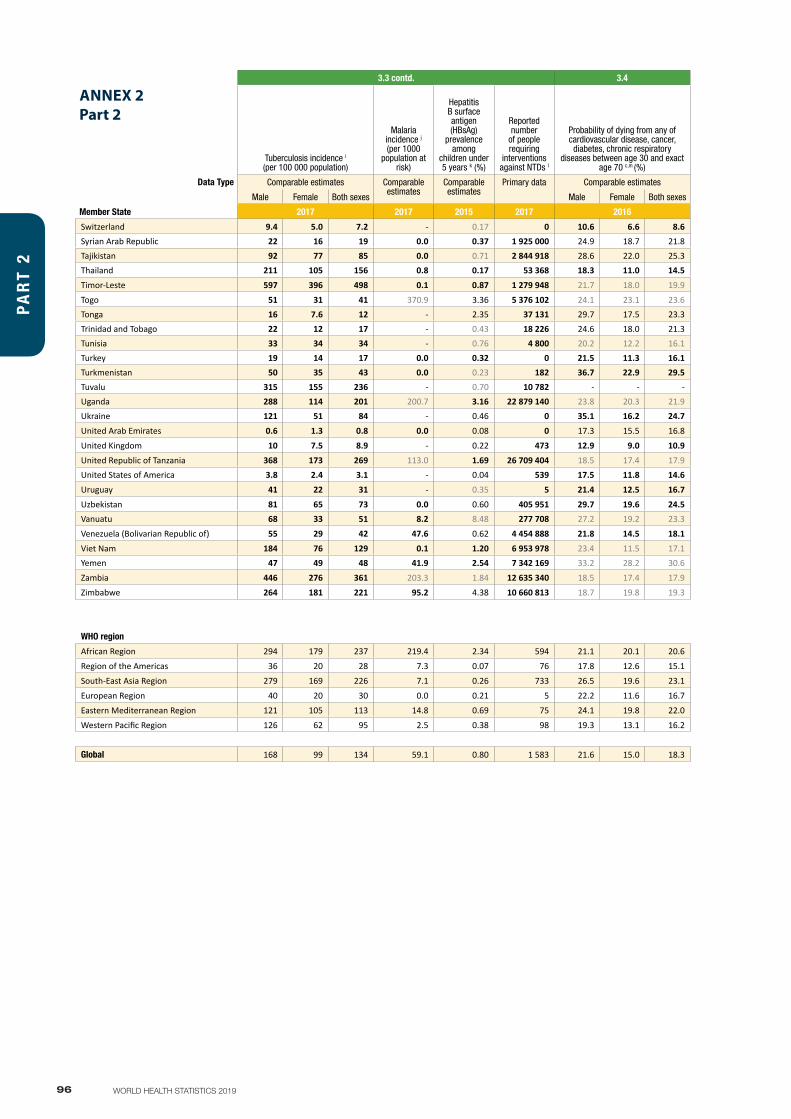
96 WORLD HEALTH STATISTICS 2019
3.3 contd. 3.4 3.4 3.6 3.7
ANNEX 2Part 2
Tuberculosis incidence i (per 100 000 population)
Malaria incidence j
(per 1000 population at
risk)
Hepatitis B surface antigen (HBsAg)
prevalence among
children under 5 years k (%)
Reported number
of people requiring
interventions against NTDs l
Probability of dying from any of cardiovascular disease, cancer,
diabetes, chronic respiratory diseases between age 30 and exact
age 70 c,m (%)Suicide mortality rate c,m (per 100 000 population)
Total alcohol per capita (>age 15 years) consumption n (litres of pure
alcohol)
Road traffic mortality rate o (per 100 000 population)
Proportion of women of reproductive
age who have their need for
family planning satisfied
with modern methods p (%)
Adolescent birth rate q (per 1000 women aged 15–19
years)
Data Type Comparable estimates Comparable estimates
Comparable estimates
Primary data Comparable estimates Comparable estimates Comparable estimates Comparable estimates
Primary data Primary data
Member State
Male Female Both sexes Male Female Both sexes Male Female Both sexes Male Female Both sexes
2017 2017 2015 2017 2016 2016 2016 2016 2009–2018 2009–2017 Member State
Switzerland 9.4 5.0 7.2 - 0.17 0 10.6 6.6 8.6 22.0 12.4 17.2 18.1 5.1 11.5 2.7 - 5.5 SwitzerlandSyrian Arab Republic 22 16 19 0.0 0.37 1 925 000 24.9 18.7 21.8 2.9 0.9 1.9 0.6 0.1 0.3 26.5 53.3 aj 54.0 Syrian Arab RepublicTajikistan 92 77 85 0.0 0.71 2 844 918 28.6 22.0 25.3 3.7 1.3 2.5 5.7 0.8 3.3 18.1 44.8 aj 54.0 TajikistanThailand 211 105 156 0.8 0.17 53 368 18.3 11.0 14.5 23.4 5.9 14.4 14.3 2.5 8.3 32.7 89.2 aj 42.5 Thailand
Timor-Leste 597 396 498 0.1 0.87 1 279 948 21.7 18.0 19.9 6.2 2.9 4.6 3.5 0.5 2.1 12.7 37.4 50.0 Timor-Leste
Togo 51 31 41 370.9 3.36 5 376 102 24.1 23.1 23.6 12.8 6.4 9.6 5.4 0.9 3.1 29.2 37.4 85.0 TogoTonga 16 7.6 12 - 2.35 37 131 29.7 17.5 23.3 4.3 2.7 3.5 2.7 0.4 1.5 16.8 47.9 aj 30.0 TongaTrinidad and Tobago 22 12 17 - 0.43 18 226 24.6 18.0 21.3 23.0 4.5 13.6 13.9 3.1 8.4 12.1 58.2 aj 38.0 Trinidad and TobagoTunisia 33 34 34 - 0.76 4 800 20.2 12.2 16.1 4.4 2.3 3.4 3.6 0.2 1.9 22.8 73.2 aj 6.9 TunisiaTurkey 19 14 17 0.0 0.32 0 21.5 11.3 16.1 11.4 3.3 7.3 3.7 0.4 2.0 12.3 59.7 aj 26.9 TurkeyTurkmenistan 50 35 43 0.0 0.23 182 36.7 22.9 29.5 10.1 3.5 6.7 9.5 1.5 5.4 14.5 75.6 aj 28.0 TurkmenistanTuvalu 315 155 236 - 0.70 10 782 - - - - - - 3.1 0.4 1.7 - - 28.0 TuvaluUganda 288 114 201 200.7 3.16 22 879 140 23.8 20.3 21.9 10.7 9.1 9.9 16.1 3.0 9.5 29.0 53.5 aj 141.0 UgandaUkraine 121 51 84 - 0.46 0 35.1 16.2 24.7 41.1 6.3 22.4 14.1 4.0 8.6 13.7 68.0 aj 26.1 Ukraine
United Arab Emirates 0.6 1.3 0.8 0.0 0.08 0 17.3 15.5 16.8 3.6 0.7 2.8 4.8 0.6 3.8 18.1 - 34.2 United Arab Emirates
United Kingdom 10 7.5 8.9 - 0.22 473 12.9 9.0 10.9 13.5 4.4 8.9 18.4 4.8 11.5 3.1 - 13.7 United Kingdom
United Republic of Tanzania 368 173 269 113.0 1.69 26 709 404 18.5 17.4 17.9 7.7 3.2 5.4 16.0 2.9 9.4 29.2 54.0 132.0 United Republic of TanzaniaUnited States of America 3.8 2.4 3.1 - 0.04 539 17.5 11.8 14.6 23.6 7.2 15.3 15.8 4.1 9.8 12.4 77.2 aj 20.3 United States of America
Uruguay 41 22 31 - 0.35 5 21.4 12.5 16.7 29.2 8.3 18.4 17.8 4.5 10.8 13.4 - 51.3 Uruguay
Uzbekistan 81 65 73 0.0 0.60 405 951 29.7 19.6 24.5 9.9 4.8 7.4 4.8 0.7 2.7 11.5 - 29.5 UzbekistanVanuatu 68 33 51 8.2 8.48 277 708 27.2 19.2 23.3 6.6 2.2 4.5 1.8 0.2 1.0 15.9 50.7 aj 78.0 Vanuatu
Venezuela (Bolivarian Republic of) 55 29 42 47.6 0.62 4 454 888 21.8 14.5 18.1 6.3 1.1 3.7 9.7 1.7 5.6 33.7 - 94.5 Venezuela (Bolivarian Republic of)
Viet Nam 184 76 129 0.1 1.20 6 953 978 23.4 11.5 17.1 10.9 3.7 7.3 14.5 2.5 8.4 26.4 69.6 30.1 Viet NamYemen 47 49 48 41.9 2.54 7 342 169 33.2 28.2 30.6 11.3 5.6 8.5 0.1 0.0 0.1 - 37.7 aj 67.0 Yemen
Zambia 446 276 361 203.3 1.84 12 635 340 18.5 17.4 17.9 8.8 3.5 6.1 8.4 1.4 4.8 - 62.4 141.0 Zambia
Zimbabwe 264 181 221 95.2 4.38 10 660 813 18.7 19.8 19.3 15.7 6.0 10.7 8.5 1.3 4.8 34.7 84.8 110.0 Zimbabwe
WHO region WHO region
African Region 294 179 237 219.4 2.34 594 21.1 20.1 20.6 9.9 4.9 7.4 10.3 2.4 6.3 26.6 55.7 99.1 African Region
Region of the Americas 36 20 28 7.3 0.07 76 17.8 12.6 15.1 15.1 4.6 9.8 12.4 3.6 8.0 15.6 82.8 48.6 Region of the Americas
South-East Asia Region 279 169 226 7.1 0.26 733 26.5 19.6 23.1 14.8 11.6 13.2 7.5 1.6 4.5 20.7 71.4 33.0 South-East Asia Region
European Region 40 20 30 0.0 0.21 5 22.2 11.6 16.7 24.8 6.6 15.4 15.8 4.5 9.8 9.3 76.7 16.6 European Region
Eastern Mediterranean Region 121 105 113 14.8 0.69 75 24.1 19.8 22.0 5.1 2.7 3.9 0.9 0.1 0.6 18.0 60.8 44.5 Eastern Mediterranean Region
Western Pacific Region 126 62 95 2.5 0.38 98 19.3 13.1 16.2 10.9 9.4 10.2 11.3 3.2 7.3 16.9 87.2 14.2 Western Pacific Region
Global 168 99 134 59.1 0.80 1 583 21.6 15.0 18.3 13.5 7.7 10.6 10.1 2.7 6.4 18.2 75.7 43.9 Global
PA
RT
2
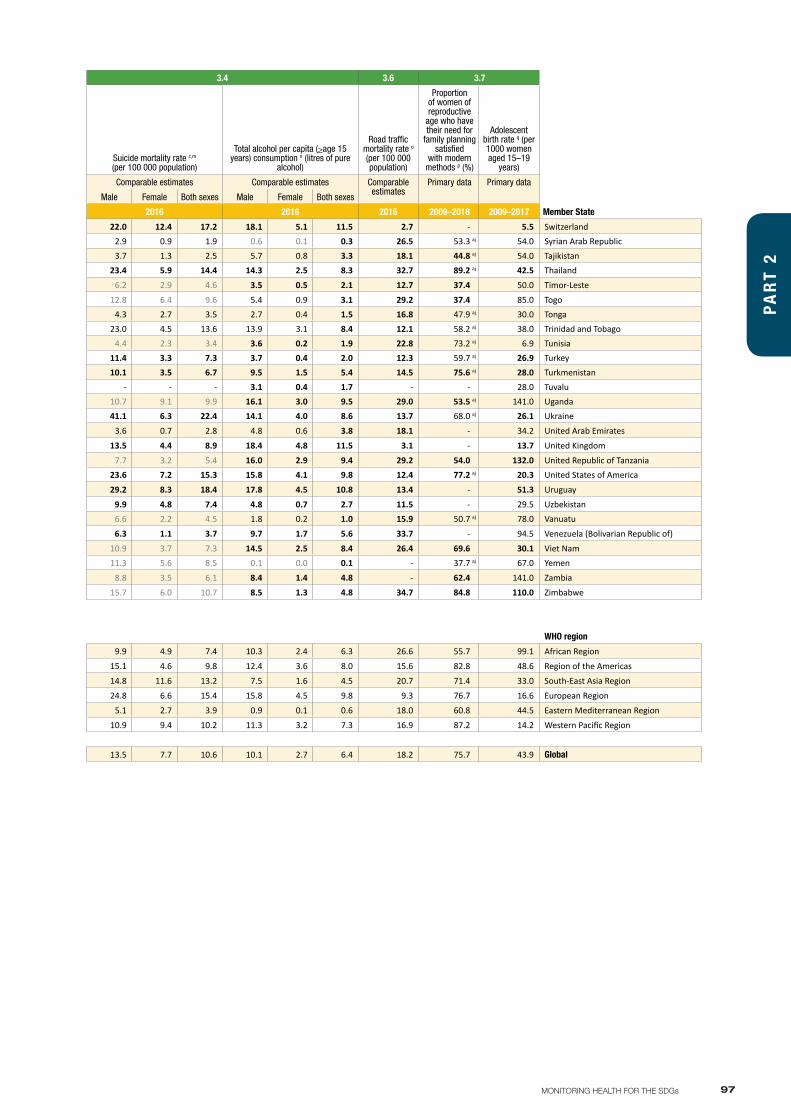
97MONITORING HEALTH FOR THE SDGs
3.3 contd. 3.4 3.4 3.6 3.7
ANNEX 2Part 2
Tuberculosis incidence i (per 100 000 population)
Malaria incidence j
(per 1000 population at
risk)
Hepatitis B surface antigen (HBsAg)
prevalence among
children under 5 years k (%)
Reported number
of people requiring
interventions against NTDs l
Probability of dying from any of cardiovascular disease, cancer,
diabetes, chronic respiratory diseases between age 30 and exact
age 70 c,m (%)Suicide mortality rate c,m (per 100 000 population)
Total alcohol per capita (>age 15 years) consumption n (litres of pure
alcohol)
Road traffic mortality rate o (per 100 000 population)
Proportion of women of reproductive
age who have their need for
family planning satisfied
with modern methods p (%)
Adolescent birth rate q (per 1000 women aged 15–19
years)
Data Type Comparable estimates Comparable estimates
Comparable estimates
Primary data Comparable estimates Comparable estimates Comparable estimates Comparable estimates
Primary data Primary data
Member State
Male Female Both sexes Male Female Both sexes Male Female Both sexes Male Female Both sexes
2017 2017 2015 2017 2016 2016 2016 2016 2009–2018 2009–2017 Member State
Switzerland 9.4 5.0 7.2 - 0.17 0 10.6 6.6 8.6 22.0 12.4 17.2 18.1 5.1 11.5 2.7 - 5.5 SwitzerlandSyrian Arab Republic 22 16 19 0.0 0.37 1 925 000 24.9 18.7 21.8 2.9 0.9 1.9 0.6 0.1 0.3 26.5 53.3 aj 54.0 Syrian Arab RepublicTajikistan 92 77 85 0.0 0.71 2 844 918 28.6 22.0 25.3 3.7 1.3 2.5 5.7 0.8 3.3 18.1 44.8 aj 54.0 TajikistanThailand 211 105 156 0.8 0.17 53 368 18.3 11.0 14.5 23.4 5.9 14.4 14.3 2.5 8.3 32.7 89.2 aj 42.5 Thailand
Timor-Leste 597 396 498 0.1 0.87 1 279 948 21.7 18.0 19.9 6.2 2.9 4.6 3.5 0.5 2.1 12.7 37.4 50.0 Timor-Leste
Togo 51 31 41 370.9 3.36 5 376 102 24.1 23.1 23.6 12.8 6.4 9.6 5.4 0.9 3.1 29.2 37.4 85.0 TogoTonga 16 7.6 12 - 2.35 37 131 29.7 17.5 23.3 4.3 2.7 3.5 2.7 0.4 1.5 16.8 47.9 aj 30.0 TongaTrinidad and Tobago 22 12 17 - 0.43 18 226 24.6 18.0 21.3 23.0 4.5 13.6 13.9 3.1 8.4 12.1 58.2 aj 38.0 Trinidad and TobagoTunisia 33 34 34 - 0.76 4 800 20.2 12.2 16.1 4.4 2.3 3.4 3.6 0.2 1.9 22.8 73.2 aj 6.9 TunisiaTurkey 19 14 17 0.0 0.32 0 21.5 11.3 16.1 11.4 3.3 7.3 3.7 0.4 2.0 12.3 59.7 aj 26.9 TurkeyTurkmenistan 50 35 43 0.0 0.23 182 36.7 22.9 29.5 10.1 3.5 6.7 9.5 1.5 5.4 14.5 75.6 aj 28.0 TurkmenistanTuvalu 315 155 236 - 0.70 10 782 - - - - - - 3.1 0.4 1.7 - - 28.0 TuvaluUganda 288 114 201 200.7 3.16 22 879 140 23.8 20.3 21.9 10.7 9.1 9.9 16.1 3.0 9.5 29.0 53.5 aj 141.0 UgandaUkraine 121 51 84 - 0.46 0 35.1 16.2 24.7 41.1 6.3 22.4 14.1 4.0 8.6 13.7 68.0 aj 26.1 Ukraine
United Arab Emirates 0.6 1.3 0.8 0.0 0.08 0 17.3 15.5 16.8 3.6 0.7 2.8 4.8 0.6 3.8 18.1 - 34.2 United Arab Emirates
United Kingdom 10 7.5 8.9 - 0.22 473 12.9 9.0 10.9 13.5 4.4 8.9 18.4 4.8 11.5 3.1 - 13.7 United Kingdom
United Republic of Tanzania 368 173 269 113.0 1.69 26 709 404 18.5 17.4 17.9 7.7 3.2 5.4 16.0 2.9 9.4 29.2 54.0 132.0 United Republic of TanzaniaUnited States of America 3.8 2.4 3.1 - 0.04 539 17.5 11.8 14.6 23.6 7.2 15.3 15.8 4.1 9.8 12.4 77.2 aj 20.3 United States of America
Uruguay 41 22 31 - 0.35 5 21.4 12.5 16.7 29.2 8.3 18.4 17.8 4.5 10.8 13.4 - 51.3 Uruguay
Uzbekistan 81 65 73 0.0 0.60 405 951 29.7 19.6 24.5 9.9 4.8 7.4 4.8 0.7 2.7 11.5 - 29.5 UzbekistanVanuatu 68 33 51 8.2 8.48 277 708 27.2 19.2 23.3 6.6 2.2 4.5 1.8 0.2 1.0 15.9 50.7 aj 78.0 Vanuatu
Venezuela (Bolivarian Republic of) 55 29 42 47.6 0.62 4 454 888 21.8 14.5 18.1 6.3 1.1 3.7 9.7 1.7 5.6 33.7 - 94.5 Venezuela (Bolivarian Republic of)
Viet Nam 184 76 129 0.1 1.20 6 953 978 23.4 11.5 17.1 10.9 3.7 7.3 14.5 2.5 8.4 26.4 69.6 30.1 Viet NamYemen 47 49 48 41.9 2.54 7 342 169 33.2 28.2 30.6 11.3 5.6 8.5 0.1 0.0 0.1 - 37.7 aj 67.0 Yemen
Zambia 446 276 361 203.3 1.84 12 635 340 18.5 17.4 17.9 8.8 3.5 6.1 8.4 1.4 4.8 - 62.4 141.0 Zambia
Zimbabwe 264 181 221 95.2 4.38 10 660 813 18.7 19.8 19.3 15.7 6.0 10.7 8.5 1.3 4.8 34.7 84.8 110.0 Zimbabwe
WHO region WHO region
African Region 294 179 237 219.4 2.34 594 21.1 20.1 20.6 9.9 4.9 7.4 10.3 2.4 6.3 26.6 55.7 99.1 African Region
Region of the Americas 36 20 28 7.3 0.07 76 17.8 12.6 15.1 15.1 4.6 9.8 12.4 3.6 8.0 15.6 82.8 48.6 Region of the Americas
South-East Asia Region 279 169 226 7.1 0.26 733 26.5 19.6 23.1 14.8 11.6 13.2 7.5 1.6 4.5 20.7 71.4 33.0 South-East Asia Region
European Region 40 20 30 0.0 0.21 5 22.2 11.6 16.7 24.8 6.6 15.4 15.8 4.5 9.8 9.3 76.7 16.6 European Region
Eastern Mediterranean Region 121 105 113 14.8 0.69 75 24.1 19.8 22.0 5.1 2.7 3.9 0.9 0.1 0.6 18.0 60.8 44.5 Eastern Mediterranean Region
Western Pacific Region 126 62 95 2.5 0.38 98 19.3 13.1 16.2 10.9 9.4 10.2 11.3 3.2 7.3 16.9 87.2 14.2 Western Pacific Region
Global 168 99 134 59.1 0.80 1 583 21.6 15.0 18.3 13.5 7.7 10.6 10.1 2.7 6.4 18.2 75.7 43.9 Global
PA
RT
2
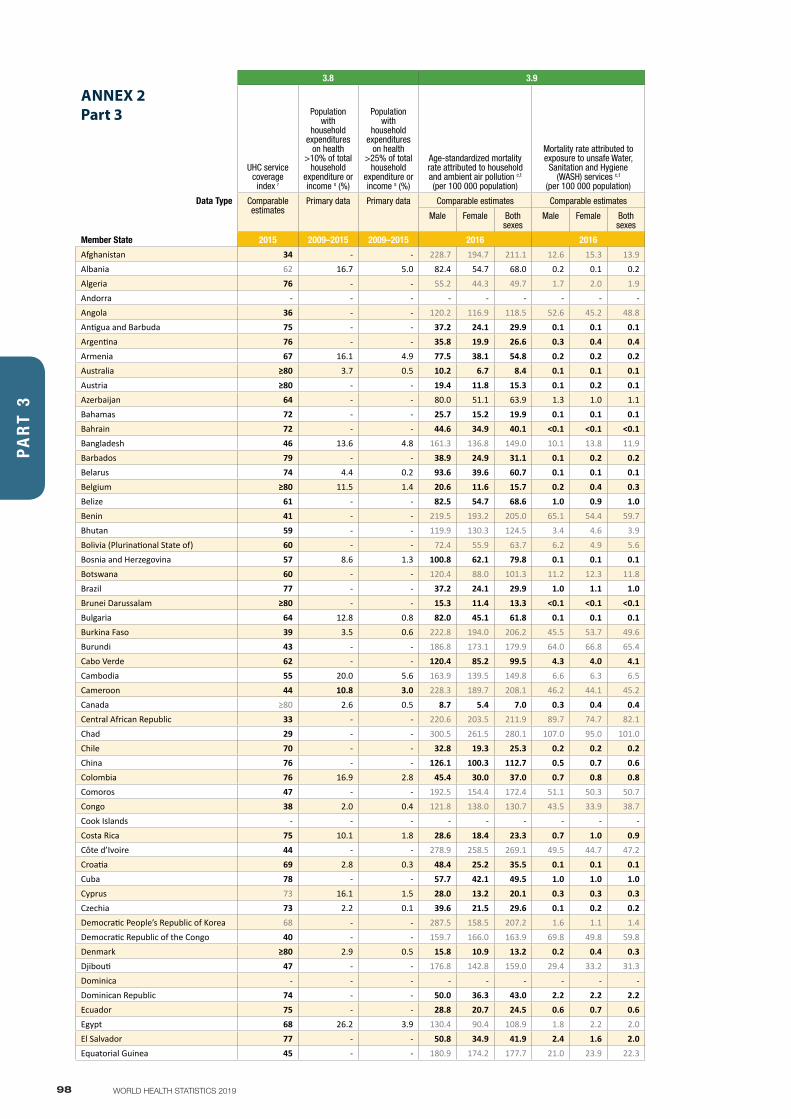
98 WORLD HEALTH STATISTICS 2019
3.8 3.9 3.9 3.a 3.b
ANNEX 2Part 3
UHC service coverage
index r
Population with
household expenditures
on health >10% of total
household expenditure or income s (%)
Population with
household expenditures
on health >25% of total
household expenditure or income s (%)
Age-standardized mortality rate attributed to household and ambient air pollution c,t (per 100 000 population)
Mortality rate attributed to exposure to unsafe Water,
Sanitation and Hygiene (WASH) services c,t
(per 100 000 population)
Mortality rate from unintentional poisoning c,m (per 100 000 population)
Age-standardized prevalence of tobacco smoking among
persons aged 15 years and older u (%)
Diphtheria-tetanus-pertussis (DTP3)
immunization coverage among
1-year-olds v
(%)
Measles-containing-
vaccine second-dose
(MCV2) immunization coverage by the nationally recommended
age v (%)
Pneumococcal conjugate 3rd dose (PCV3)
immunization coverage
among 1-year olds v (%)
Total net official
development assistance to medical
research and basic health sectors per
capita w (US$), by recipient
country
Data Type Comparable estimates
Primary data Primary data Comparable estimates Comparable estimates Comparable estimates Comparable estimates Comparable estimates
Comparable estimates
Comparable estimates
Primary data
Male Female Both sexes
Male Female Both sexes
Male Female Both sexes
Males Females Both sexes
Member State 2015 2009–2015 2009–2015 2016 2016 2016 2016 2017 2017 2017 2017 Member State
Afghanistan 34 - - 228.7 194.7 211.1 12.6 15.3 13.9 0.5 1.9 1.2 - - - 65 39 65 5.70 AfghanistanAlbania 62 16.7 5.0 82.4 54.7 68.0 0.2 0.1 0.2 0.5 0.4 0.4 51.2 7.1 29.2 99 98 99 0.78 AlbaniaAlgeria 76 - - 55.2 44.3 49.7 1.7 2.0 1.9 0.9 0.6 0.8 30.4 0.7 15.6 91 92 89 0.01 AlgeriaAndorra - - - - - - - - - - - - 37.8 29.0 33.4 99 94 98 - AndorraAngola 36 - - 120.2 116.9 118.5 52.6 45.2 48.8 3.4 2.0 2.7 - - - 52 30 59 2.09 AngolaAntigua and Barbuda 75 - - 37.2 24.1 29.9 0.1 0.1 0.1 0.3 0.4 0.4 - - - 95 68 - 0.41 Antigua and BarbudaArgentina 76 - - 35.8 19.9 26.6 0.3 0.4 0.4 0.8 0.5 0.6 27.7 16.2 22.0 86 89 76 0.03 ArgentinaArmenia 67 16.1 4.9 77.5 38.1 54.8 0.2 0.2 0.2 0.9 0.4 0.6 52.1 1.5 26.8 94 97 94 2.12 ArmeniaAustralia ≥80 3.7 0.5 10.2 6.7 8.4 0.1 0.1 0.1 0.2 0.2 0.2 16.5 13.0 14.8 95 93 94 - AustraliaAustria ≥80 - - 19.4 11.8 15.3 0.1 0.2 0.1 0.3 0.2 0.2 30.9 28.4 29.7 90 84 - - AustriaAzerbaijan 64 - - 80.0 51.1 63.9 1.3 1.0 1.1 0.8 0.3 0.6 42.5 0.3 21.4 95 97 96 0.85 AzerbaijanBahamas 72 - - 25.7 15.2 19.9 0.1 0.1 0.1 0.2 0.1 0.1 20.4 3.1 11.8 94 76 93 - BahamasBahrain 72 - - 44.6 34.9 40.1 <0.1 <0.1 <0.1 0.3 0.1 0.2 37.6 5.8 21.7 97 99 97 - BahrainBangladesh 46 13.6 4.8 161.3 136.8 149.0 10.1 13.8 11.9 0.3 0.2 0.3 44.7 1.0 22.9 97 96 97 1.37 BangladeshBarbados 79 - - 38.9 24.9 31.1 0.1 0.2 0.2 0.2 0.2 0.2 14.5 1.9 8.2 90 77 89 - BarbadosBelarus 74 4.4 0.2 93.6 39.6 60.7 0.1 0.1 0.1 4.3 1.1 2.6 46.1 10.5 28.3 97 98 - 0.32 BelarusBelgium ≥80 11.5 1.4 20.6 11.6 15.7 0.2 0.4 0.3 0.3 0.2 0.2 31.4 25.1 28.3 98 85 94 - BelgiumBelize 61 - - 82.5 54.7 68.6 1.0 0.9 1.0 0.7 0.3 0.5 - - - 88 88 - 5.47 BelizeBenin 41 - - 219.5 193.2 205.0 65.1 54.4 59.7 4.3 2.7 3.5 12.3 0.6 6.5 82 - 75 7.87 BeninBhutan 59 - - 119.9 130.3 124.5 3.4 4.6 3.9 0.7 0.5 0.6 - - - 98 99 - 3.19 BhutanBolivia (Plurinational State of) 60 - - 72.4 55.9 63.7 6.2 4.9 5.6 2.6 1.4 2.0 - - - 84 - 83 1.93 Bolivia (Plurinational State of)Bosnia and Herzegovina 57 8.6 1.3 100.8 62.1 79.8 0.1 0.1 0.1 0.6 0.4 0.5 47.7 30.2 39.0 75 80 - 9.76 Bosnia and HerzegovinaBotswana 60 - - 120.4 88.0 101.3 11.2 12.3 11.8 1.2 1.1 1.1 34.4 5.7 20.1 95 74 89 7.64 BotswanaBrazil 77 - - 37.2 24.1 29.9 1.0 1.1 1.0 0.2 0.2 0.2 17.9 10.1 14.0 89 41 84 0.03 BrazilBrunei Darussalam ≥80 - - 15.3 11.4 13.3 <0.1 <0.1 <0.1 0.4 0.2 0.3 30.9 2.0 16.5 99 98 - - Brunei DarussalamBulgaria 64 12.8 0.8 82.0 45.1 61.8 0.1 0.1 0.1 0.8 0.4 0.6 44.4 30.1 37.3 92 92 91 - BulgariaBurkina Faso 39 3.5 0.6 222.8 194.0 206.2 45.5 53.7 49.6 3.4 2.6 3.0 23.9 1.6 12.8 91 50 91 4.37 Burkina FasoBurundi 43 - - 186.8 173.1 179.9 64.0 66.8 65.4 6.8 3.7 5.2 - - - 91 75 91 8.75 BurundiCabo Verde 62 - - 120.4 85.2 99.5 4.3 4.0 4.1 0.6 0.5 0.5 16.5 2.1 9.3 96 85 - 2.99 Cabo VerdeCambodia 55 20.0 5.6 163.9 139.5 149.8 6.6 6.3 6.5 0.7 0.5 0.6 33.7 2.0 17.9 93 61 82 4.83 CambodiaCameroon 44 10.8 3.0 228.3 189.7 208.1 46.2 44.1 45.2 4.0 2.2 3.1 - - - 86 - 84 2.46 CameroonCanada ≥80 2.6 0.5 8.7 5.4 7.0 0.3 0.4 0.4 0.3 0.3 0.3 16.6 12.0 14.3 91 86 80 - CanadaCentral African Republic 33 - - 220.6 203.5 211.9 89.7 74.7 82.1 4.2 2.3 3.2 - - - 47 - 47 10.49 Central African RepublicChad 29 - - 300.5 261.5 280.1 107.0 95.0 101.0 4.8 2.4 3.6 - - - 41 - - 2.44 ChadChile 70 - - 32.8 19.3 25.3 0.2 0.2 0.2 0.3 0.1 0.2 41.5 34.2 37.9 93 90 93 0.03 ChileChina 76 - - 126.1 100.3 112.7 0.5 0.7 0.6 1.1 1.6 1.4 48.4 1.9 25.2 99 99 - 0.10 ChinaColombia 76 16.9 2.8 45.4 30.0 37.0 0.7 0.8 0.8 0.5 0.2 0.4 13.5 4.7 9.1 92 89 91 0.22 ColombiaComoros 47 - - 192.5 154.4 172.4 51.1 50.3 50.7 2.8 1.9 2.4 23.6 4.4 14.0 91 - - 2.92 ComorosCongo 38 2.0 0.4 121.8 138.0 130.7 43.5 33.9 38.7 1.4 1.0 1.2 52.3 1.7 27.0 69 - 66 1.43 CongoCook Islands - - - - - - - - - - - - 29.8 21.2 25.5 99 95 - 4.78 Cook IslandsCosta Rica 75 10.1 1.8 28.6 18.4 23.3 0.7 1.0 0.9 0.5 0.1 0.3 17.4 6.4 11.9 96 93 96 0.06 Costa RicaCôte d’Ivoire 44 - - 278.9 258.5 269.1 49.5 44.7 47.2 5.1 2.8 3.9 - - - 84 - 99 3.98 Côte d’IvoireCroatia 69 2.8 0.3 48.4 25.2 35.5 0.1 0.1 0.1 0.2 0.1 0.2 39.9 34.3 37.1 92 95 - - CroatiaCuba 78 - - 57.7 42.1 49.5 1.0 1.0 1.0 0.1 0.5 0.3 53.3 17.1 35.2 99 99 - 0.06 CubaCyprus 73 16.1 1.5 28.0 13.2 20.1 0.3 0.3 0.3 0.1 0.1 0.1 52.7 19.6 36.2 97 88 81 - CyprusCzechia 73 2.2 0.1 39.6 21.5 29.6 0.1 0.2 0.2 0.4 0.2 0.3 38.3 30.5 34.4 96 90 - - CzechiaDemocratic People’s Republic of Korea 68 - - 287.5 158.5 207.2 1.6 1.1 1.4 2.0 1.8 1.9 - - - 97 98 - 0.98 Democratic People’s Republic of KoreaDemocratic Republic of the Congo 40 - - 159.7 166.0 163.9 69.8 49.8 59.8 3.9 2.5 3.2 - - - 81 - 79 5.32 Democratic Republic of the CongoDenmark ≥80 2.9 0.5 15.8 10.9 13.2 0.2 0.4 0.3 0.2 0.1 0.1 18.8 19.3 19.1 98 88 97 - DenmarkDjibouti 47 - - 176.8 142.8 159.0 29.4 33.2 31.3 2.9 1.8 2.4 24.5 1.7 13.1 68 82 68 8.85 DjiboutiDominica - - - - - - - - - - - - - - - 91 81 - 0.49 DominicaDominican Republic 74 - - 50.0 36.3 43.0 2.2 2.2 2.2 0.4 0.4 0.4 19.1 8.5 13.8 84 - 64 0.39 Dominican RepublicEcuador 75 - - 28.8 20.7 24.5 0.6 0.7 0.6 0.8 0.4 0.6 12.3 2.0 7.2 85 73 84 0.47 EcuadorEgypt 68 26.2 3.9 130.4 90.4 108.9 1.8 2.2 2.0 0.3 0.2 0.2 50.1 0.2 25.2 94 94 - 0.05 EgyptEl Salvador 77 - - 50.8 34.9 41.9 2.4 1.6 2.0 0.3 0.1 0.2 18.8 2.5 10.7 85 86 87 1.01 El SalvadorEquatorial Guinea 45 - - 180.9 174.2 177.7 21.0 23.9 22.3 2.2 1.5 1.9 - - - 25 - - 2.00 Equatorial Guinea
PA
RT
3
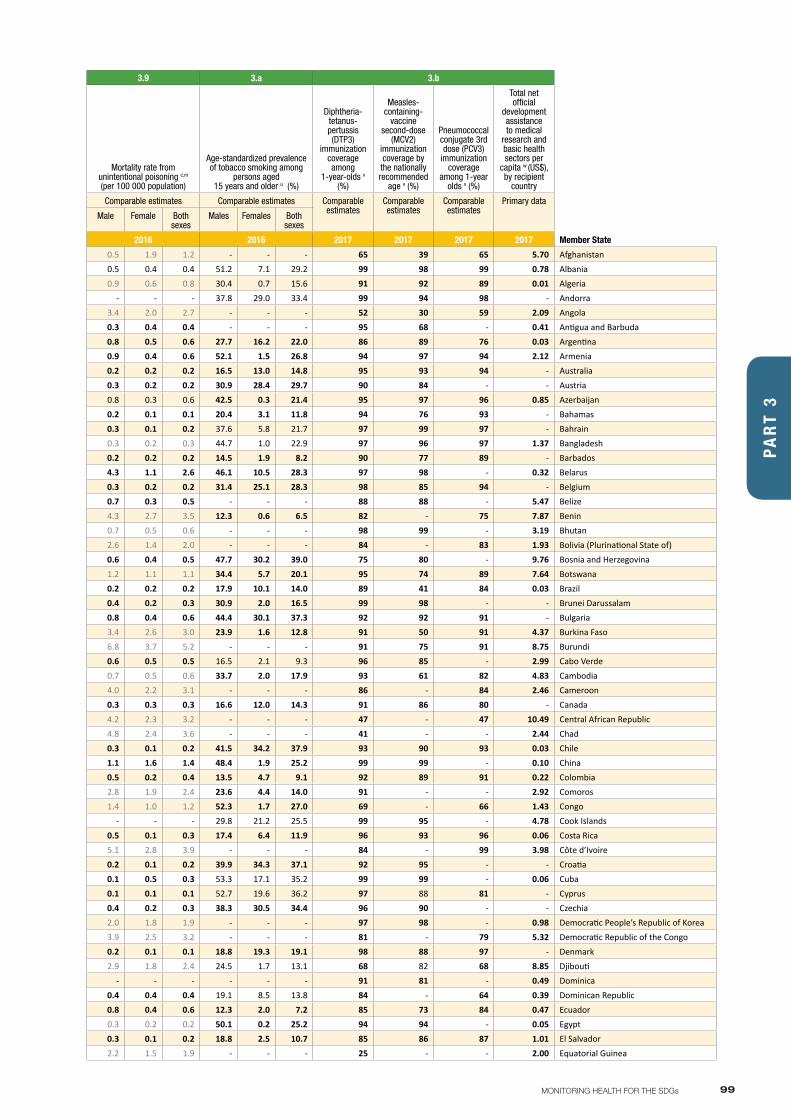
99MONITORING HEALTH FOR THE SDGs
3.8 3.9 3.9 3.a 3.b
ANNEX 2Part 3
UHC service coverage
index r
Population with
household expenditures
on health >10% of total
household expenditure or income s (%)
Population with
household expenditures
on health >25% of total
household expenditure or income s (%)
Age-standardized mortality rate attributed to household and ambient air pollution c,t (per 100 000 population)
Mortality rate attributed to exposure to unsafe Water,
Sanitation and Hygiene (WASH) services c,t
(per 100 000 population)
Mortality rate from unintentional poisoning c,m (per 100 000 population)
Age-standardized prevalence of tobacco smoking among
persons aged 15 years and older u (%)
Diphtheria-tetanus-pertussis (DTP3)
immunization coverage among
1-year-olds v
(%)
Measles-containing-
vaccine second-dose
(MCV2) immunization coverage by the nationally recommended
age v (%)
Pneumococcal conjugate 3rd dose (PCV3)
immunization coverage
among 1-year olds v (%)
Total net official
development assistance to medical
research and basic health sectors per
capita w (US$), by recipient
country
Data Type Comparable estimates
Primary data Primary data Comparable estimates Comparable estimates Comparable estimates Comparable estimates Comparable estimates
Comparable estimates
Comparable estimates
Primary data
Male Female Both sexes
Male Female Both sexes
Male Female Both sexes
Males Females Both sexes
Member State 2015 2009–2015 2009–2015 2016 2016 2016 2016 2017 2017 2017 2017 Member State
Afghanistan 34 - - 228.7 194.7 211.1 12.6 15.3 13.9 0.5 1.9 1.2 - - - 65 39 65 5.70 AfghanistanAlbania 62 16.7 5.0 82.4 54.7 68.0 0.2 0.1 0.2 0.5 0.4 0.4 51.2 7.1 29.2 99 98 99 0.78 AlbaniaAlgeria 76 - - 55.2 44.3 49.7 1.7 2.0 1.9 0.9 0.6 0.8 30.4 0.7 15.6 91 92 89 0.01 AlgeriaAndorra - - - - - - - - - - - - 37.8 29.0 33.4 99 94 98 - AndorraAngola 36 - - 120.2 116.9 118.5 52.6 45.2 48.8 3.4 2.0 2.7 - - - 52 30 59 2.09 AngolaAntigua and Barbuda 75 - - 37.2 24.1 29.9 0.1 0.1 0.1 0.3 0.4 0.4 - - - 95 68 - 0.41 Antigua and BarbudaArgentina 76 - - 35.8 19.9 26.6 0.3 0.4 0.4 0.8 0.5 0.6 27.7 16.2 22.0 86 89 76 0.03 ArgentinaArmenia 67 16.1 4.9 77.5 38.1 54.8 0.2 0.2 0.2 0.9 0.4 0.6 52.1 1.5 26.8 94 97 94 2.12 ArmeniaAustralia ≥80 3.7 0.5 10.2 6.7 8.4 0.1 0.1 0.1 0.2 0.2 0.2 16.5 13.0 14.8 95 93 94 - AustraliaAustria ≥80 - - 19.4 11.8 15.3 0.1 0.2 0.1 0.3 0.2 0.2 30.9 28.4 29.7 90 84 - - AustriaAzerbaijan 64 - - 80.0 51.1 63.9 1.3 1.0 1.1 0.8 0.3 0.6 42.5 0.3 21.4 95 97 96 0.85 AzerbaijanBahamas 72 - - 25.7 15.2 19.9 0.1 0.1 0.1 0.2 0.1 0.1 20.4 3.1 11.8 94 76 93 - BahamasBahrain 72 - - 44.6 34.9 40.1 <0.1 <0.1 <0.1 0.3 0.1 0.2 37.6 5.8 21.7 97 99 97 - BahrainBangladesh 46 13.6 4.8 161.3 136.8 149.0 10.1 13.8 11.9 0.3 0.2 0.3 44.7 1.0 22.9 97 96 97 1.37 BangladeshBarbados 79 - - 38.9 24.9 31.1 0.1 0.2 0.2 0.2 0.2 0.2 14.5 1.9 8.2 90 77 89 - BarbadosBelarus 74 4.4 0.2 93.6 39.6 60.7 0.1 0.1 0.1 4.3 1.1 2.6 46.1 10.5 28.3 97 98 - 0.32 BelarusBelgium ≥80 11.5 1.4 20.6 11.6 15.7 0.2 0.4 0.3 0.3 0.2 0.2 31.4 25.1 28.3 98 85 94 - BelgiumBelize 61 - - 82.5 54.7 68.6 1.0 0.9 1.0 0.7 0.3 0.5 - - - 88 88 - 5.47 BelizeBenin 41 - - 219.5 193.2 205.0 65.1 54.4 59.7 4.3 2.7 3.5 12.3 0.6 6.5 82 - 75 7.87 BeninBhutan 59 - - 119.9 130.3 124.5 3.4 4.6 3.9 0.7 0.5 0.6 - - - 98 99 - 3.19 BhutanBolivia (Plurinational State of) 60 - - 72.4 55.9 63.7 6.2 4.9 5.6 2.6 1.4 2.0 - - - 84 - 83 1.93 Bolivia (Plurinational State of)Bosnia and Herzegovina 57 8.6 1.3 100.8 62.1 79.8 0.1 0.1 0.1 0.6 0.4 0.5 47.7 30.2 39.0 75 80 - 9.76 Bosnia and HerzegovinaBotswana 60 - - 120.4 88.0 101.3 11.2 12.3 11.8 1.2 1.1 1.1 34.4 5.7 20.1 95 74 89 7.64 BotswanaBrazil 77 - - 37.2 24.1 29.9 1.0 1.1 1.0 0.2 0.2 0.2 17.9 10.1 14.0 89 41 84 0.03 BrazilBrunei Darussalam ≥80 - - 15.3 11.4 13.3 <0.1 <0.1 <0.1 0.4 0.2 0.3 30.9 2.0 16.5 99 98 - - Brunei DarussalamBulgaria 64 12.8 0.8 82.0 45.1 61.8 0.1 0.1 0.1 0.8 0.4 0.6 44.4 30.1 37.3 92 92 91 - BulgariaBurkina Faso 39 3.5 0.6 222.8 194.0 206.2 45.5 53.7 49.6 3.4 2.6 3.0 23.9 1.6 12.8 91 50 91 4.37 Burkina FasoBurundi 43 - - 186.8 173.1 179.9 64.0 66.8 65.4 6.8 3.7 5.2 - - - 91 75 91 8.75 BurundiCabo Verde 62 - - 120.4 85.2 99.5 4.3 4.0 4.1 0.6 0.5 0.5 16.5 2.1 9.3 96 85 - 2.99 Cabo VerdeCambodia 55 20.0 5.6 163.9 139.5 149.8 6.6 6.3 6.5 0.7 0.5 0.6 33.7 2.0 17.9 93 61 82 4.83 CambodiaCameroon 44 10.8 3.0 228.3 189.7 208.1 46.2 44.1 45.2 4.0 2.2 3.1 - - - 86 - 84 2.46 CameroonCanada ≥80 2.6 0.5 8.7 5.4 7.0 0.3 0.4 0.4 0.3 0.3 0.3 16.6 12.0 14.3 91 86 80 - CanadaCentral African Republic 33 - - 220.6 203.5 211.9 89.7 74.7 82.1 4.2 2.3 3.2 - - - 47 - 47 10.49 Central African RepublicChad 29 - - 300.5 261.5 280.1 107.0 95.0 101.0 4.8 2.4 3.6 - - - 41 - - 2.44 ChadChile 70 - - 32.8 19.3 25.3 0.2 0.2 0.2 0.3 0.1 0.2 41.5 34.2 37.9 93 90 93 0.03 ChileChina 76 - - 126.1 100.3 112.7 0.5 0.7 0.6 1.1 1.6 1.4 48.4 1.9 25.2 99 99 - 0.10 ChinaColombia 76 16.9 2.8 45.4 30.0 37.0 0.7 0.8 0.8 0.5 0.2 0.4 13.5 4.7 9.1 92 89 91 0.22 ColombiaComoros 47 - - 192.5 154.4 172.4 51.1 50.3 50.7 2.8 1.9 2.4 23.6 4.4 14.0 91 - - 2.92 ComorosCongo 38 2.0 0.4 121.8 138.0 130.7 43.5 33.9 38.7 1.4 1.0 1.2 52.3 1.7 27.0 69 - 66 1.43 CongoCook Islands - - - - - - - - - - - - 29.8 21.2 25.5 99 95 - 4.78 Cook IslandsCosta Rica 75 10.1 1.8 28.6 18.4 23.3 0.7 1.0 0.9 0.5 0.1 0.3 17.4 6.4 11.9 96 93 96 0.06 Costa RicaCôte d’Ivoire 44 - - 278.9 258.5 269.1 49.5 44.7 47.2 5.1 2.8 3.9 - - - 84 - 99 3.98 Côte d’IvoireCroatia 69 2.8 0.3 48.4 25.2 35.5 0.1 0.1 0.1 0.2 0.1 0.2 39.9 34.3 37.1 92 95 - - CroatiaCuba 78 - - 57.7 42.1 49.5 1.0 1.0 1.0 0.1 0.5 0.3 53.3 17.1 35.2 99 99 - 0.06 CubaCyprus 73 16.1 1.5 28.0 13.2 20.1 0.3 0.3 0.3 0.1 0.1 0.1 52.7 19.6 36.2 97 88 81 - CyprusCzechia 73 2.2 0.1 39.6 21.5 29.6 0.1 0.2 0.2 0.4 0.2 0.3 38.3 30.5 34.4 96 90 - - CzechiaDemocratic People’s Republic of Korea 68 - - 287.5 158.5 207.2 1.6 1.1 1.4 2.0 1.8 1.9 - - - 97 98 - 0.98 Democratic People’s Republic of KoreaDemocratic Republic of the Congo 40 - - 159.7 166.0 163.9 69.8 49.8 59.8 3.9 2.5 3.2 - - - 81 - 79 5.32 Democratic Republic of the CongoDenmark ≥80 2.9 0.5 15.8 10.9 13.2 0.2 0.4 0.3 0.2 0.1 0.1 18.8 19.3 19.1 98 88 97 - DenmarkDjibouti 47 - - 176.8 142.8 159.0 29.4 33.2 31.3 2.9 1.8 2.4 24.5 1.7 13.1 68 82 68 8.85 DjiboutiDominica - - - - - - - - - - - - - - - 91 81 - 0.49 DominicaDominican Republic 74 - - 50.0 36.3 43.0 2.2 2.2 2.2 0.4 0.4 0.4 19.1 8.5 13.8 84 - 64 0.39 Dominican RepublicEcuador 75 - - 28.8 20.7 24.5 0.6 0.7 0.6 0.8 0.4 0.6 12.3 2.0 7.2 85 73 84 0.47 EcuadorEgypt 68 26.2 3.9 130.4 90.4 108.9 1.8 2.2 2.0 0.3 0.2 0.2 50.1 0.2 25.2 94 94 - 0.05 EgyptEl Salvador 77 - - 50.8 34.9 41.9 2.4 1.6 2.0 0.3 0.1 0.2 18.8 2.5 10.7 85 86 87 1.01 El SalvadorEquatorial Guinea 45 - - 180.9 174.2 177.7 21.0 23.9 22.3 2.2 1.5 1.9 - - - 25 - - 2.00 Equatorial Guinea
PA
RT
3
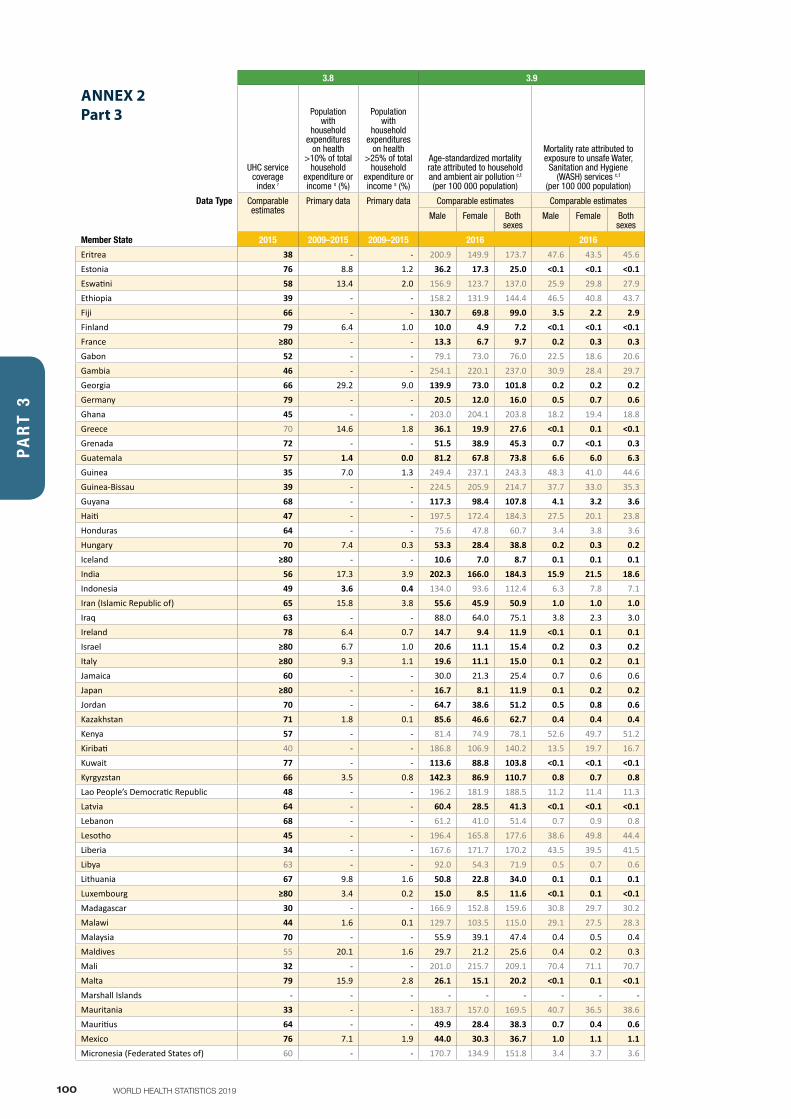
100 WORLD HEALTH STATISTICS 2019
3.8 3.9 3.9 3.a 3.b
ANNEX 2Part 3
UHC service coverage
index r
Population with
household expenditures
on health >10% of total
household expenditure or income s (%)
Population with
household expenditures
on health >25% of total
household expenditure or income s (%)
Age-standardized mortality rate attributed to household and ambient air pollution c,t (per 100 000 population)
Mortality rate attributed to exposure to unsafe Water,
Sanitation and Hygiene (WASH) services c,t
(per 100 000 population)
Mortality rate from unintentional poisoning c,m (per 100 000 population)
Age-standardized prevalence of tobacco smoking among
persons aged 15 years and older u (%)
Diphtheria-tetanus-pertussis (DTP3)
immunization coverage among
1-year-olds v
(%)
Measles-containing-
vaccine second-dose
(MCV2) immunization coverage by the nationally recommended
age v (%)
Pneumococcal conjugate 3rd dose (PCV3)
immunization coverage
among 1-year olds v (%)
Total net official
development assistance to medical
research and basic health sectors per
capita w (US$), by recipient
country
Data Type Comparable estimates
Primary data Primary data Comparable estimates Comparable estimates Comparable estimates Comparable estimates Comparable estimates
Comparable estimates
Comparable estimates
Primary data
Male Female Both sexes
Male Female Both sexes
Male Female Both sexes
Males Females Both sexes
Member State 2015 2009–2015 2009–2015 2016 2016 2016 2016 2017 2017 2017 2017 Member State
Eritrea 38 - - 200.9 149.9 173.7 47.6 43.5 45.6 5.6 2.7 4.2 11.4 0.2 5.8 95 88 95 5.39 EritreaEstonia 76 8.8 1.2 36.2 17.3 25.0 <0.1 <0.1 <0.1 0.8 0.2 0.5 39.3 24.5 31.9 93 91 - - EstoniaEswatini 58 13.4 2.0 156.9 123.7 137.0 25.9 29.8 27.9 3.2 3.4 3.3 16.5 1.7 9.1 90 89 87 10.02 EswatiniEthiopia 39 - - 158.2 131.9 144.4 46.5 40.8 43.7 3.6 2.2 2.9 8.5 0.4 4.5 73 - 68 3.64 EthiopiaFiji 66 - - 130.7 69.8 99.0 3.5 2.2 2.9 0.7 0.2 0.4 34.8 10.2 22.5 99 94 99 5.90 FijiFinland 79 6.4 1.0 10.0 4.9 7.2 <0.1 <0.1 <0.1 0.3 0.2 0.2 22.6 18.3 20.5 89 92 85 - FinlandFrance ≥80 - - 13.3 6.7 9.7 0.2 0.3 0.3 0.3 0.6 0.5 35.6 30.1 32.9 96 80 92 - FranceGabon 52 - - 79.1 73.0 76.0 22.5 18.6 20.6 1.1 0.8 0.9 - - - 75 - - 1.27 GabonGambia 46 - - 254.1 220.1 237.0 30.9 28.4 29.7 2.3 1.5 1.9 31.2 0.7 16.0 92 68 90 23.75 GambiaGeorgia 66 29.2 9.0 139.9 73.0 101.8 0.2 0.2 0.2 1.2 0.5 0.8 55.5 5.3 30.4 91 90 80 2.05 GeorgiaGermany 79 - - 20.5 12.0 16.0 0.5 0.7 0.6 0.1 0.2 0.2 33.1 28.2 30.7 95 93 84 - GermanyGhana 45 - - 203.0 204.1 203.8 18.2 19.4 18.8 2.0 1.3 1.7 7.7 0.3 4.0 99 83 99 4.56 GhanaGreece 70 14.6 1.8 36.1 19.9 27.6 <0.1 0.1 <0.1 0.3 0.1 0.2 52.0 35.3 43.7 99 83 96 - GreeceGrenada 72 - - 51.5 38.9 45.3 0.7 <0.1 0.3 0.4 0.3 0.4 - - - 96 79 - 0.19 GrenadaGuatemala 57 1.4 0.0 81.2 67.8 73.8 6.6 6.0 6.3 1.4 0.8 1.1 - - - 82 81 84 1.50 GuatemalaGuinea 35 7.0 1.3 249.4 237.1 243.3 48.3 41.0 44.6 3.8 2.1 3.0 - - - 45 - - 6.27 GuineaGuinea-Bissau 39 - - 224.5 205.9 214.7 37.7 33.0 35.3 2.9 1.5 2.2 - - - 87 - 87 11.97 Guinea-BissauGuyana 68 - - 117.3 98.4 107.8 4.1 3.2 3.6 0.7 0.7 0.7 - - - 97 93 97 4.60 GuyanaHaiti 47 - - 197.5 172.4 184.3 27.5 20.1 23.8 3.0 2.2 2.6 23.1 2.9 13.0 60 25 - 8.85 HaitiHonduras 64 - - 75.6 47.8 60.7 3.4 3.8 3.6 0.6 0.2 0.4 - - - 97 - 97 1.16 HondurasHungary 70 7.4 0.3 53.3 28.4 38.8 0.2 0.3 0.2 0.4 0.1 0.3 34.8 26.8 30.8 99 99 99 - HungaryIceland ≥80 - - 10.6 7.0 8.7 0.1 0.1 0.1 0.3 0.1 0.2 15.2 14.3 14.8 89 95 88 - IcelandIndia 56 17.3 3.9 202.3 166.0 184.3 15.9 21.5 18.6 2.8 1.9 2.4 20.6 1.9 11.3 88 77 - 0.21 IndiaIndonesia 49 3.6 0.4 134.0 93.6 112.4 6.3 7.8 7.1 0.6 0.2 0.4 76.1 2.8 39.5 79 63 - 1.38 IndonesiaIran (Islamic Republic of) 65 15.8 3.8 55.6 45.9 50.9 1.0 1.0 1.0 1.6 0.8 1.2 21.1 0.8 11.0 99 98 - 0.02 Iran (Islamic Republic of)Iraq 63 - - 88.0 64.0 75.1 3.8 2.3 3.0 0.6 0.4 0.5 - - - 63 74 33 0.17 IraqIreland 78 6.4 0.7 14.7 9.4 11.9 <0.1 0.1 0.1 0.3 0.1 0.2 25.7 23.0 24.4 95 - 91 - IrelandIsrael ≥80 6.7 1.0 20.6 11.1 15.4 0.2 0.3 0.2 0.2 0.1 0.1 35.4 15.4 25.4 98 96 94 - IsraelItaly ≥80 9.3 1.1 19.6 11.1 15.0 0.1 0.2 0.1 0.2 0.3 0.3 27.8 19.8 23.8 94 86 91 - ItalyJamaica 60 - - 30.0 21.3 25.4 0.7 0.6 0.6 0.2 0.2 0.2 28.6 5.3 17.0 93 95 - 0.92 JamaicaJapan ≥80 - - 16.7 8.1 11.9 0.1 0.2 0.2 0.6 0.3 0.4 33.7 11.2 22.5 99 95 99 - JapanJordan 70 - - 64.7 38.6 51.2 0.5 0.8 0.6 0.5 0.8 0.6 - - - 99 99 - 4.05 JordanKazakhstan 71 1.8 0.1 85.6 46.6 62.7 0.4 0.4 0.4 3.3 1.3 2.3 43.1 7.0 25.1 99 99 98 0.64 KazakhstanKenya 57 - - 81.4 74.9 78.1 52.6 49.7 51.2 2.5 1.1 1.8 20.4 1.2 10.8 82 35 71 4.98 KenyaKiribati 40 - - 186.8 106.9 140.2 13.5 19.7 16.7 3.1 2.0 2.6 58.9 35.9 47.4 90 79 91 22.30 KiribatiKuwait 77 - - 113.6 88.8 103.8 <0.1 <0.1 <0.1 0.2 0.1 0.2 37.0 2.7 19.9 99 99 99 - KuwaitKyrgyzstan 66 3.5 0.8 142.3 86.9 110.7 0.8 0.7 0.8 0.8 0.4 0.6 50.5 3.6 27.1 92 96 88 4.08 KyrgyzstanLao People’s Democratic Republic 48 - - 196.2 181.9 188.5 11.2 11.4 11.3 1.0 0.8 0.9 51.2 7.3 29.3 85 - 83 4.68 Lao People’s Democratic RepublicLatvia 64 - - 60.4 28.5 41.3 <0.1 <0.1 <0.1 1.5 0.3 0.8 51.0 25.6 38.3 98 89 87 - LatviaLebanon 68 - - 61.2 41.0 51.4 0.7 0.9 0.8 0.3 0.3 0.3 40.7 26.9 33.8 79 68 68 6.44 LebanonLesotho 45 - - 196.4 165.8 177.6 38.6 49.8 44.4 3.0 3.3 3.1 53.9 0.4 27.2 93 82 93 14.01 LesothoLiberia 34 - - 167.6 171.7 170.2 43.5 39.5 41.5 2.5 1.1 1.8 18.1 1.5 9.8 86 - 86 13.78 LiberiaLibya 63 - - 92.0 54.3 71.9 0.5 0.7 0.6 0.8 0.4 0.6 - - - 96 94 94 0.89 LibyaLithuania 67 9.8 1.6 50.8 22.8 34.0 0.1 0.1 0.1 1.2 0.3 0.7 38.0 21.3 29.7 94 92 82 - LithuaniaLuxembourg ≥80 3.4 0.2 15.0 8.5 11.6 <0.1 0.1 <0.1 0.1 0.1 0.1 26.0 20.9 23.5 99 86 95 - LuxembourgMadagascar 30 - - 166.9 152.8 159.6 30.8 29.7 30.2 4.0 2.6 3.3 - - - 74 - 74 3.22 MadagascarMalawi 44 1.6 0.1 129.7 103.5 115.0 29.1 27.5 28.3 2.5 1.5 2.0 24.7 4.4 14.6 88 67 88 15.55 MalawiMalaysia 70 - - 55.9 39.1 47.4 0.4 0.5 0.4 0.6 0.3 0.5 42.4 1.0 21.7 99 99 - 0.08 MalaysiaMaldives 55 20.1 1.6 29.7 21.2 25.6 0.4 0.2 0.3 0.0 0.0 0.0 55.0 2.1 28.6 99 99 - 1.42 MaldivesMali 32 - - 201.0 215.7 209.1 70.4 71.1 70.7 4.2 2.4 3.3 23.0 1.6 12.3 66 - 57 7.08 MaliMalta 79 15.9 2.8 26.1 15.1 20.2 <0.1 0.1 <0.1 0.2 0.1 0.1 30.2 20.9 25.6 98 83 - - MaltaMarshall Islands - - - - - - - - - - - - - - - 80 62 72 3.77 Marshall IslandsMauritania 33 - - 183.7 157.0 169.5 40.7 36.5 38.6 2.5 1.2 1.9 - - - 81 - 77 3.66 MauritaniaMauritius 64 - - 49.9 28.4 38.3 0.7 0.4 0.6 0.1 0.1 0.1 40.7 3.2 22.0 94 95 84 0.87 MauritiusMexico 76 7.1 1.9 44.0 30.3 36.7 1.0 1.1 1.1 0.6 0.3 0.4 21.4 6.9 14.2 97 98 91 0.03 MexicoMicronesia (Federated States of) 60 - - 170.7 134.9 151.8 3.4 3.7 3.6 1.4 0.6 1.0 - - - 73 52 65 1.03 Micronesia (Federated States of)
PA
RT
3
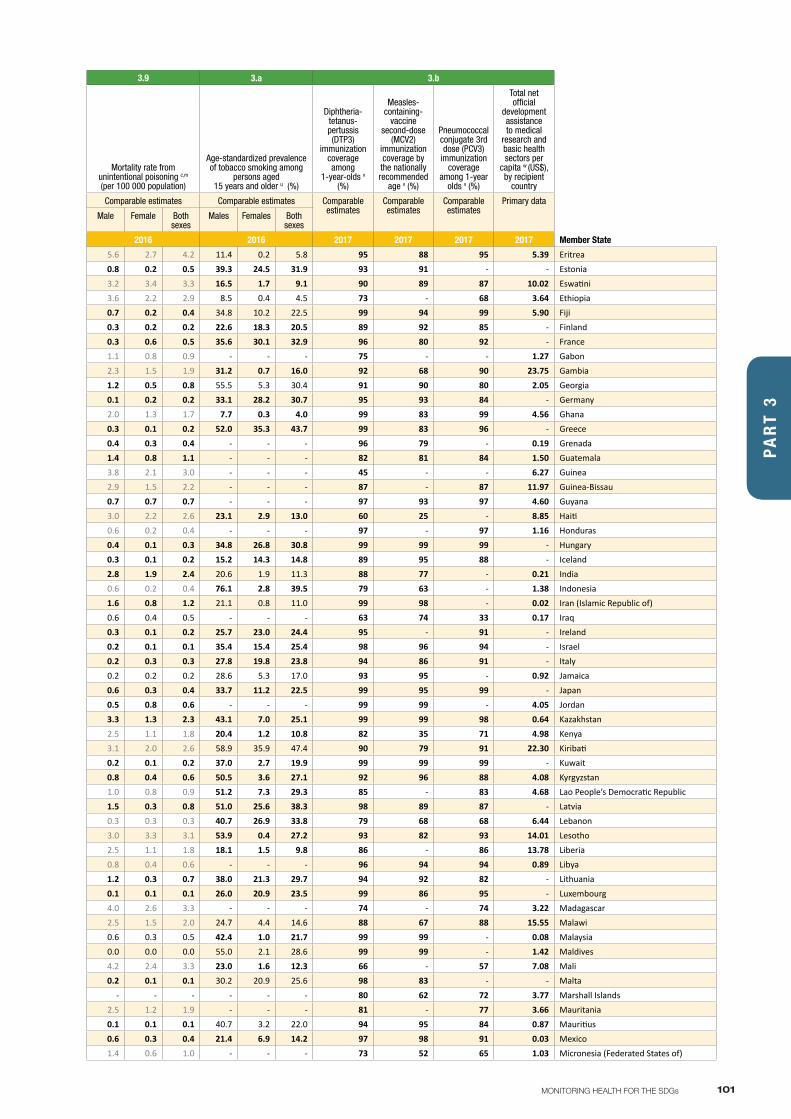
101MONITORING HEALTH FOR THE SDGs
3.8 3.9 3.9 3.a 3.b
ANNEX 2Part 3
UHC service coverage
index r
Population with
household expenditures
on health >10% of total
household expenditure or income s (%)
Population with
household expenditures
on health >25% of total
household expenditure or income s (%)
Age-standardized mortality rate attributed to household and ambient air pollution c,t (per 100 000 population)
Mortality rate attributed to exposure to unsafe Water,
Sanitation and Hygiene (WASH) services c,t
(per 100 000 population)
Mortality rate from unintentional poisoning c,m (per 100 000 population)
Age-standardized prevalence of tobacco smoking among
persons aged 15 years and older u (%)
Diphtheria-tetanus-pertussis (DTP3)
immunization coverage among
1-year-olds v
(%)
Measles-containing-
vaccine second-dose
(MCV2) immunization coverage by the nationally recommended
age v (%)
Pneumococcal conjugate 3rd dose (PCV3)
immunization coverage
among 1-year olds v (%)
Total net official
development assistance to medical
research and basic health sectors per
capita w (US$), by recipient
country
Data Type Comparable estimates
Primary data Primary data Comparable estimates Comparable estimates Comparable estimates Comparable estimates Comparable estimates
Comparable estimates
Comparable estimates
Primary data
Male Female Both sexes
Male Female Both sexes
Male Female Both sexes
Males Females Both sexes
Member State 2015 2009–2015 2009–2015 2016 2016 2016 2016 2017 2017 2017 2017 Member State
Eritrea 38 - - 200.9 149.9 173.7 47.6 43.5 45.6 5.6 2.7 4.2 11.4 0.2 5.8 95 88 95 5.39 EritreaEstonia 76 8.8 1.2 36.2 17.3 25.0 <0.1 <0.1 <0.1 0.8 0.2 0.5 39.3 24.5 31.9 93 91 - - EstoniaEswatini 58 13.4 2.0 156.9 123.7 137.0 25.9 29.8 27.9 3.2 3.4 3.3 16.5 1.7 9.1 90 89 87 10.02 EswatiniEthiopia 39 - - 158.2 131.9 144.4 46.5 40.8 43.7 3.6 2.2 2.9 8.5 0.4 4.5 73 - 68 3.64 EthiopiaFiji 66 - - 130.7 69.8 99.0 3.5 2.2 2.9 0.7 0.2 0.4 34.8 10.2 22.5 99 94 99 5.90 FijiFinland 79 6.4 1.0 10.0 4.9 7.2 <0.1 <0.1 <0.1 0.3 0.2 0.2 22.6 18.3 20.5 89 92 85 - FinlandFrance ≥80 - - 13.3 6.7 9.7 0.2 0.3 0.3 0.3 0.6 0.5 35.6 30.1 32.9 96 80 92 - FranceGabon 52 - - 79.1 73.0 76.0 22.5 18.6 20.6 1.1 0.8 0.9 - - - 75 - - 1.27 GabonGambia 46 - - 254.1 220.1 237.0 30.9 28.4 29.7 2.3 1.5 1.9 31.2 0.7 16.0 92 68 90 23.75 GambiaGeorgia 66 29.2 9.0 139.9 73.0 101.8 0.2 0.2 0.2 1.2 0.5 0.8 55.5 5.3 30.4 91 90 80 2.05 GeorgiaGermany 79 - - 20.5 12.0 16.0 0.5 0.7 0.6 0.1 0.2 0.2 33.1 28.2 30.7 95 93 84 - GermanyGhana 45 - - 203.0 204.1 203.8 18.2 19.4 18.8 2.0 1.3 1.7 7.7 0.3 4.0 99 83 99 4.56 GhanaGreece 70 14.6 1.8 36.1 19.9 27.6 <0.1 0.1 <0.1 0.3 0.1 0.2 52.0 35.3 43.7 99 83 96 - GreeceGrenada 72 - - 51.5 38.9 45.3 0.7 <0.1 0.3 0.4 0.3 0.4 - - - 96 79 - 0.19 GrenadaGuatemala 57 1.4 0.0 81.2 67.8 73.8 6.6 6.0 6.3 1.4 0.8 1.1 - - - 82 81 84 1.50 GuatemalaGuinea 35 7.0 1.3 249.4 237.1 243.3 48.3 41.0 44.6 3.8 2.1 3.0 - - - 45 - - 6.27 GuineaGuinea-Bissau 39 - - 224.5 205.9 214.7 37.7 33.0 35.3 2.9 1.5 2.2 - - - 87 - 87 11.97 Guinea-BissauGuyana 68 - - 117.3 98.4 107.8 4.1 3.2 3.6 0.7 0.7 0.7 - - - 97 93 97 4.60 GuyanaHaiti 47 - - 197.5 172.4 184.3 27.5 20.1 23.8 3.0 2.2 2.6 23.1 2.9 13.0 60 25 - 8.85 HaitiHonduras 64 - - 75.6 47.8 60.7 3.4 3.8 3.6 0.6 0.2 0.4 - - - 97 - 97 1.16 HondurasHungary 70 7.4 0.3 53.3 28.4 38.8 0.2 0.3 0.2 0.4 0.1 0.3 34.8 26.8 30.8 99 99 99 - HungaryIceland ≥80 - - 10.6 7.0 8.7 0.1 0.1 0.1 0.3 0.1 0.2 15.2 14.3 14.8 89 95 88 - IcelandIndia 56 17.3 3.9 202.3 166.0 184.3 15.9 21.5 18.6 2.8 1.9 2.4 20.6 1.9 11.3 88 77 - 0.21 IndiaIndonesia 49 3.6 0.4 134.0 93.6 112.4 6.3 7.8 7.1 0.6 0.2 0.4 76.1 2.8 39.5 79 63 - 1.38 IndonesiaIran (Islamic Republic of) 65 15.8 3.8 55.6 45.9 50.9 1.0 1.0 1.0 1.6 0.8 1.2 21.1 0.8 11.0 99 98 - 0.02 Iran (Islamic Republic of)Iraq 63 - - 88.0 64.0 75.1 3.8 2.3 3.0 0.6 0.4 0.5 - - - 63 74 33 0.17 IraqIreland 78 6.4 0.7 14.7 9.4 11.9 <0.1 0.1 0.1 0.3 0.1 0.2 25.7 23.0 24.4 95 - 91 - IrelandIsrael ≥80 6.7 1.0 20.6 11.1 15.4 0.2 0.3 0.2 0.2 0.1 0.1 35.4 15.4 25.4 98 96 94 - IsraelItaly ≥80 9.3 1.1 19.6 11.1 15.0 0.1 0.2 0.1 0.2 0.3 0.3 27.8 19.8 23.8 94 86 91 - ItalyJamaica 60 - - 30.0 21.3 25.4 0.7 0.6 0.6 0.2 0.2 0.2 28.6 5.3 17.0 93 95 - 0.92 JamaicaJapan ≥80 - - 16.7 8.1 11.9 0.1 0.2 0.2 0.6 0.3 0.4 33.7 11.2 22.5 99 95 99 - JapanJordan 70 - - 64.7 38.6 51.2 0.5 0.8 0.6 0.5 0.8 0.6 - - - 99 99 - 4.05 JordanKazakhstan 71 1.8 0.1 85.6 46.6 62.7 0.4 0.4 0.4 3.3 1.3 2.3 43.1 7.0 25.1 99 99 98 0.64 KazakhstanKenya 57 - - 81.4 74.9 78.1 52.6 49.7 51.2 2.5 1.1 1.8 20.4 1.2 10.8 82 35 71 4.98 KenyaKiribati 40 - - 186.8 106.9 140.2 13.5 19.7 16.7 3.1 2.0 2.6 58.9 35.9 47.4 90 79 91 22.30 KiribatiKuwait 77 - - 113.6 88.8 103.8 <0.1 <0.1 <0.1 0.2 0.1 0.2 37.0 2.7 19.9 99 99 99 - KuwaitKyrgyzstan 66 3.5 0.8 142.3 86.9 110.7 0.8 0.7 0.8 0.8 0.4 0.6 50.5 3.6 27.1 92 96 88 4.08 KyrgyzstanLao People’s Democratic Republic 48 - - 196.2 181.9 188.5 11.2 11.4 11.3 1.0 0.8 0.9 51.2 7.3 29.3 85 - 83 4.68 Lao People’s Democratic RepublicLatvia 64 - - 60.4 28.5 41.3 <0.1 <0.1 <0.1 1.5 0.3 0.8 51.0 25.6 38.3 98 89 87 - LatviaLebanon 68 - - 61.2 41.0 51.4 0.7 0.9 0.8 0.3 0.3 0.3 40.7 26.9 33.8 79 68 68 6.44 LebanonLesotho 45 - - 196.4 165.8 177.6 38.6 49.8 44.4 3.0 3.3 3.1 53.9 0.4 27.2 93 82 93 14.01 LesothoLiberia 34 - - 167.6 171.7 170.2 43.5 39.5 41.5 2.5 1.1 1.8 18.1 1.5 9.8 86 - 86 13.78 LiberiaLibya 63 - - 92.0 54.3 71.9 0.5 0.7 0.6 0.8 0.4 0.6 - - - 96 94 94 0.89 LibyaLithuania 67 9.8 1.6 50.8 22.8 34.0 0.1 0.1 0.1 1.2 0.3 0.7 38.0 21.3 29.7 94 92 82 - LithuaniaLuxembourg ≥80 3.4 0.2 15.0 8.5 11.6 <0.1 0.1 <0.1 0.1 0.1 0.1 26.0 20.9 23.5 99 86 95 - LuxembourgMadagascar 30 - - 166.9 152.8 159.6 30.8 29.7 30.2 4.0 2.6 3.3 - - - 74 - 74 3.22 MadagascarMalawi 44 1.6 0.1 129.7 103.5 115.0 29.1 27.5 28.3 2.5 1.5 2.0 24.7 4.4 14.6 88 67 88 15.55 MalawiMalaysia 70 - - 55.9 39.1 47.4 0.4 0.5 0.4 0.6 0.3 0.5 42.4 1.0 21.7 99 99 - 0.08 MalaysiaMaldives 55 20.1 1.6 29.7 21.2 25.6 0.4 0.2 0.3 0.0 0.0 0.0 55.0 2.1 28.6 99 99 - 1.42 MaldivesMali 32 - - 201.0 215.7 209.1 70.4 71.1 70.7 4.2 2.4 3.3 23.0 1.6 12.3 66 - 57 7.08 MaliMalta 79 15.9 2.8 26.1 15.1 20.2 <0.1 0.1 <0.1 0.2 0.1 0.1 30.2 20.9 25.6 98 83 - - MaltaMarshall Islands - - - - - - - - - - - - - - - 80 62 72 3.77 Marshall IslandsMauritania 33 - - 183.7 157.0 169.5 40.7 36.5 38.6 2.5 1.2 1.9 - - - 81 - 77 3.66 MauritaniaMauritius 64 - - 49.9 28.4 38.3 0.7 0.4 0.6 0.1 0.1 0.1 40.7 3.2 22.0 94 95 84 0.87 MauritiusMexico 76 7.1 1.9 44.0 30.3 36.7 1.0 1.1 1.1 0.6 0.3 0.4 21.4 6.9 14.2 97 98 91 0.03 MexicoMicronesia (Federated States of) 60 - - 170.7 134.9 151.8 3.4 3.7 3.6 1.4 0.6 1.0 - - - 73 52 65 1.03 Micronesia (Federated States of)
PA
RT
3
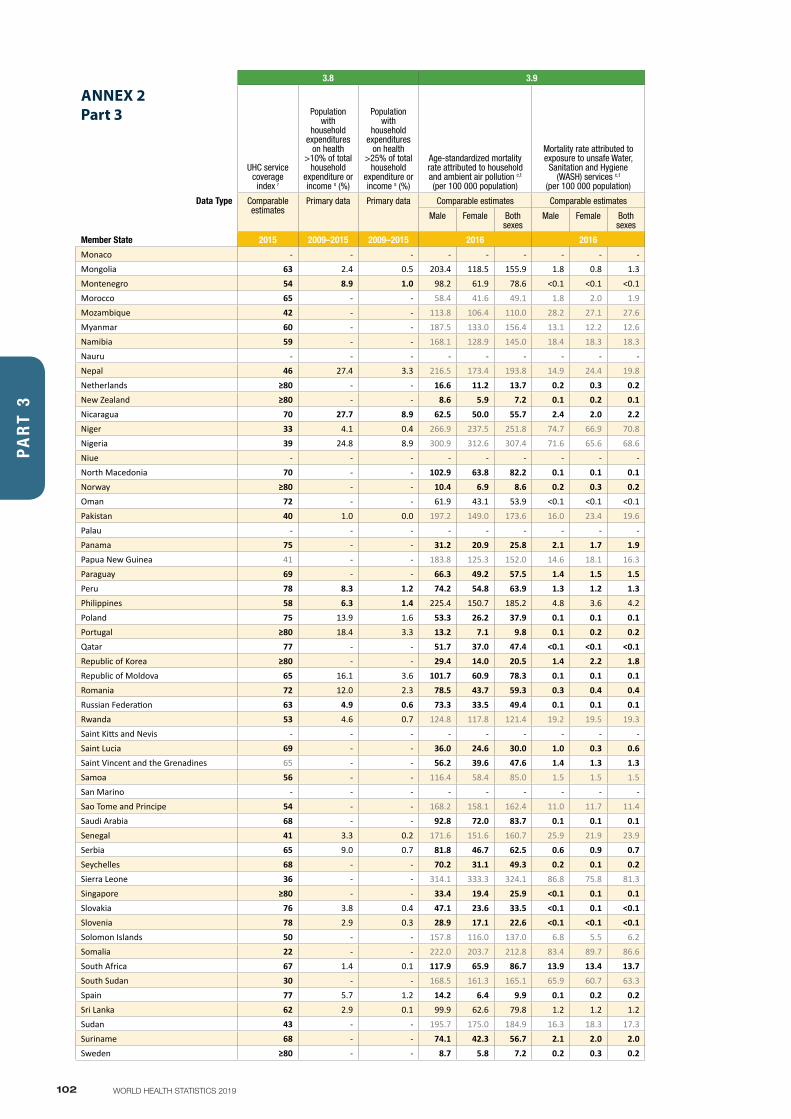
102 WORLD HEALTH STATISTICS 2019
3.8 3.9 3.9 3.a 3.b
ANNEX 2Part 3
UHC service coverage
index r
Population with
household expenditures
on health >10% of total
household expenditure or income s (%)
Population with
household expenditures
on health >25% of total
household expenditure or income s (%)
Age-standardized mortality rate attributed to household and ambient air pollution c,t (per 100 000 population)
Mortality rate attributed to exposure to unsafe Water,
Sanitation and Hygiene (WASH) services c,t
(per 100 000 population)
Mortality rate from unintentional poisoning c,m (per 100 000 population)
Age-standardized prevalence of tobacco smoking among
persons aged 15 years and older u (%)
Diphtheria-tetanus-pertussis (DTP3)
immunization coverage among
1-year-olds v
(%)
Measles-containing-
vaccine second-dose
(MCV2) immunization coverage by the nationally recommended
age v (%)
Pneumococcal conjugate 3rd dose (PCV3)
immunization coverage
among 1-year olds v (%)
Total net official
development assistance to medical
research and basic health sectors per
capita w (US$), by recipient
country
Data Type Comparable estimates
Primary data Primary data Comparable estimates Comparable estimates Comparable estimates Comparable estimates Comparable estimates
Comparable estimates
Comparable estimates
Primary data
Male Female Both sexes
Male Female Both sexes
Male Female Both sexes
Males Females Both sexes
Member State 2015 2009–2015 2009–2015 2016 2016 2016 2016 2017 2017 2017 2017 Member State
Monaco - - - - - - - - - - - - - - - 99 79 - - MonacoMongolia 63 2.4 0.5 203.4 118.5 155.9 1.8 0.8 1.3 2.2 1.0 1.6 46.5 5.5 26.0 99 98 13 3.79 MongoliaMontenegro 54 8.9 1.0 98.2 61.9 78.6 <0.1 <0.1 <0.1 0.6 0.4 0.5 47.9 44.0 46.0 87 83 - 0.07 MontenegroMorocco 65 - - 58.4 41.6 49.1 1.8 2.0 1.9 0.7 0.5 0.6 47.1 0.8 24.0 99 99 99 0.62 MoroccoMozambique 42 - - 113.8 106.4 110.0 28.2 27.1 27.6 3.5 2.4 2.9 29.1 5.1 17.1 80 45 80 7.76 MozambiqueMyanmar 60 - - 187.5 133.0 156.4 13.1 12.2 12.6 0.9 1.9 1.4 35.2 6.3 20.8 89 80 89 2.22 MyanmarNamibia 59 - - 168.1 128.9 145.0 18.4 18.3 18.3 1.6 1.5 1.5 34.2 9.7 22.0 88 32 67 5.37 NamibiaNauru - - - - - - - - - - - - 36.9 43.0 40.0 87 - - 39.58 NauruNepal 46 27.4 3.3 216.5 173.4 193.8 14.9 24.4 19.8 0.6 0.3 0.4 37.8 9.5 23.7 90 59 80 2.09 NepalNetherlands ≥80 - - 16.6 11.2 13.7 0.2 0.3 0.2 0.1 0.1 0.1 27.3 24.4 25.9 94 90 93 - NetherlandsNew Zealand ≥80 - - 8.6 5.9 7.2 0.1 0.2 0.1 0.3 0.1 0.2 17.2 14.8 16.0 94 90 94 - New ZealandNicaragua 70 27.7 8.9 62.5 50.0 55.7 2.4 2.0 2.2 0.8 0.4 0.6 - - - 98 84 98 4.92 NicaraguaNiger 33 4.1 0.4 266.9 237.5 251.8 74.7 66.9 70.8 5.3 3.0 4.2 15.4 0.1 7.8 81 38 80 4.04 NigerNigeria 39 24.8 8.9 300.9 312.6 307.4 71.6 65.6 68.6 3.7 2.2 3.0 10.8 0.6 5.7 42 - 36 3.51 NigeriaNiue - - - - - - - - - - - - 19.3 10.5 14.9 99 99 99 30.10 NiueNorth Macedonia 70 - - 102.9 63.8 82.2 0.1 0.1 0.1 0.5 0.3 0.4 - - - 91 97 - 0.49 North MacedoniaNorway ≥80 - - 10.4 6.9 8.6 0.2 0.3 0.2 0.2 0.1 0.2 20.7 19.6 20.2 96 91 94 - NorwayOman 72 - - 61.9 43.1 53.9 <0.1 <0.1 <0.1 0.6 0.1 0.4 15.6 0.5 8.1 99 99 99 - OmanPakistan 40 1.0 0.0 197.2 149.0 173.6 16.0 23.4 19.6 0.8 3.9 2.3 36.7 2.8 19.8 75 45 75 1.96 PakistanPalau - - - - - - - - - - - - 22.7 7.7 15.2 97 95 89 3.81 PalauPanama 75 - - 31.2 20.9 25.8 2.1 1.7 1.9 0.5 0.2 0.4 9.9 2.4 6.2 81 93 90 1.16 PanamaPapua New Guinea 41 - - 183.8 125.3 152.0 14.6 18.1 16.3 2.6 0.7 1.7 48.8 23.5 36.2 62 - 44 5.45 Papua New GuineaParaguay 69 - - 66.3 49.2 57.5 1.4 1.5 1.5 0.4 0.3 0.3 21.6 5.0 13.3 92 82 93 1.13 ParaguayPeru 78 8.3 1.2 74.2 54.8 63.9 1.3 1.2 1.3 1.2 0.6 0.9 - - - 83 66 80 0.38 PeruPhilippines 58 6.3 1.4 225.4 150.7 185.2 4.8 3.6 4.2 0.3 0.2 0.2 40.8 7.8 24.3 88 80 61 0.72 PhilippinesPoland 75 13.9 1.6 53.3 26.2 37.9 0.1 0.1 0.1 0.3 0.2 0.2 33.1 23.3 28.2 98 93 - - PolandPortugal ≥80 18.4 3.3 13.2 7.1 9.8 0.1 0.2 0.2 0.3 0.2 0.3 30.0 16.3 23.2 98 95 96 - PortugalQatar 77 - - 51.7 37.0 47.4 <0.1 <0.1 <0.1 0.5 0.1 0.4 26.9 0.8 13.9 97 93 98 - QatarRepublic of Korea ≥80 - - 29.4 14.0 20.5 1.4 2.2 1.8 0.7 0.3 0.5 40.9 6.2 23.6 98 97 98 - Republic of KoreaRepublic of Moldova 65 16.1 3.6 101.7 60.9 78.3 0.1 0.1 0.1 1.7 0.7 1.2 44.6 5.9 25.3 88 92 78 3.16 Republic of MoldovaRomania 72 12.0 2.3 78.5 43.7 59.3 0.3 0.4 0.4 0.5 0.3 0.4 37.1 22.9 30.0 82 75 - - RomaniaRussian Federation 63 4.9 0.6 73.3 33.5 49.4 0.1 0.1 0.1 2.7 0.8 1.7 58.3 23.4 40.9 97 97 70 - Russian FederationRwanda 53 4.6 0.7 124.8 117.8 121.4 19.2 19.5 19.3 3.2 1.5 2.4 21.0 4.7 12.9 98 95 98 7.16 RwandaSaint Kitts and Nevis - - - - - - - - - - - - - - - 97 95 - - Saint Kitts and NevisSaint Lucia 69 - - 36.0 24.6 30.0 1.0 0.3 0.6 0.2 0.2 0.2 - - - 80 73 - 3.07 Saint LuciaSaint Vincent and the Grenadines 65 - - 56.2 39.6 47.6 1.4 1.3 1.3 0.2 0.2 0.2 - - - 99 99 - - Saint Vincent and the GrenadinesSamoa 56 - - 116.4 58.4 85.0 1.5 1.5 1.5 0.7 0.3 0.5 38.1 16.7 27.4 74 - - 20.90 SamoaSan Marino - - - - - - - - - - - - - - - 86 78 53 - San MarinoSao Tome and Principe 54 - - 168.2 158.1 162.4 11.0 11.7 11.4 1.6 0.1 0.9 - - - 95 76 95 30.44 Sao Tome and PrincipeSaudi Arabia 68 - - 92.8 72.0 83.7 0.1 0.1 0.1 0.8 0.5 0.7 25.4 1.8 13.6 98 96 98 - Saudi ArabiaSenegal 41 3.3 0.2 171.6 151.6 160.7 25.9 21.9 23.9 3.0 1.6 2.3 16.6 0.4 8.5 93 70 92 4.53 SenegalSerbia 65 9.0 0.7 81.8 46.7 62.5 0.6 0.9 0.7 0.4 0.2 0.3 40.2 37.7 39.0 95 91 - 2.86 SerbiaSeychelles 68 - - 70.2 31.1 49.3 0.2 0.1 0.2 0.7 0.5 0.6 35.7 7.1 21.4 97 99 - 0.19 SeychellesSierra Leone 36 - - 314.1 333.3 324.1 86.8 75.8 81.3 5.2 3.1 4.1 41.3 8.8 25.1 90 55 90 8.72 Sierra LeoneSingapore ≥80 - - 33.4 19.4 25.9 <0.1 0.1 0.1 0.1 0.1 0.1 28.3 5.2 16.8 96 90 83 - SingaporeSlovakia 76 3.8 0.4 47.1 23.6 33.5 <0.1 0.1 <0.1 0.5 0.3 0.4 37.7 23.1 30.4 96 97 96 - SlovakiaSlovenia 78 2.9 0.3 28.9 17.1 22.6 <0.1 <0.1 <0.1 0.4 0.2 0.3 25.0 20.1 22.6 94 94 55 - SloveniaSolomon Islands 50 - - 157.8 116.0 137.0 6.8 5.5 6.2 1.4 0.4 0.9 - - - 94 - 81 7.15 Solomon IslandsSomalia 22 - - 222.0 203.7 212.8 83.4 89.7 86.6 5.9 3.2 4.6 - - - 42 - - 3.74 SomaliaSouth Africa 67 1.4 0.1 117.9 65.9 86.7 13.9 13.4 13.7 1.3 1.1 1.2 33.2 8.1 20.7 66 60 60 2.15 South AfricaSouth Sudan 30 - - 168.5 161.3 165.1 65.9 60.7 63.3 5.3 2.7 4.0 - - - 26 - - 13.79 South SudanSpain 77 5.7 1.2 14.2 6.4 9.9 0.1 0.2 0.2 0.2 0.2 0.2 31.4 27.4 29.4 98 93 - - SpainSri Lanka 62 2.9 0.1 99.9 62.6 79.8 1.2 1.2 1.2 0.6 0.3 0.4 27.0 0.3 13.7 99 99 - 2.35 Sri LankaSudan 43 - - 195.7 175.0 184.9 16.3 18.3 17.3 5.0 2.9 3.9 - - - 95 72 95 2.10 SudanSuriname 68 - - 74.1 42.3 56.7 2.1 2.0 2.0 0.4 0.3 0.4 42.9 7.4 25.2 81 44 - 4.94 SurinameSweden ≥80 - - 8.7 5.8 7.2 0.2 0.3 0.2 0.5 0.3 0.4 18.9 18.8 18.9 97 95 96 - Sweden
PA
RT
3
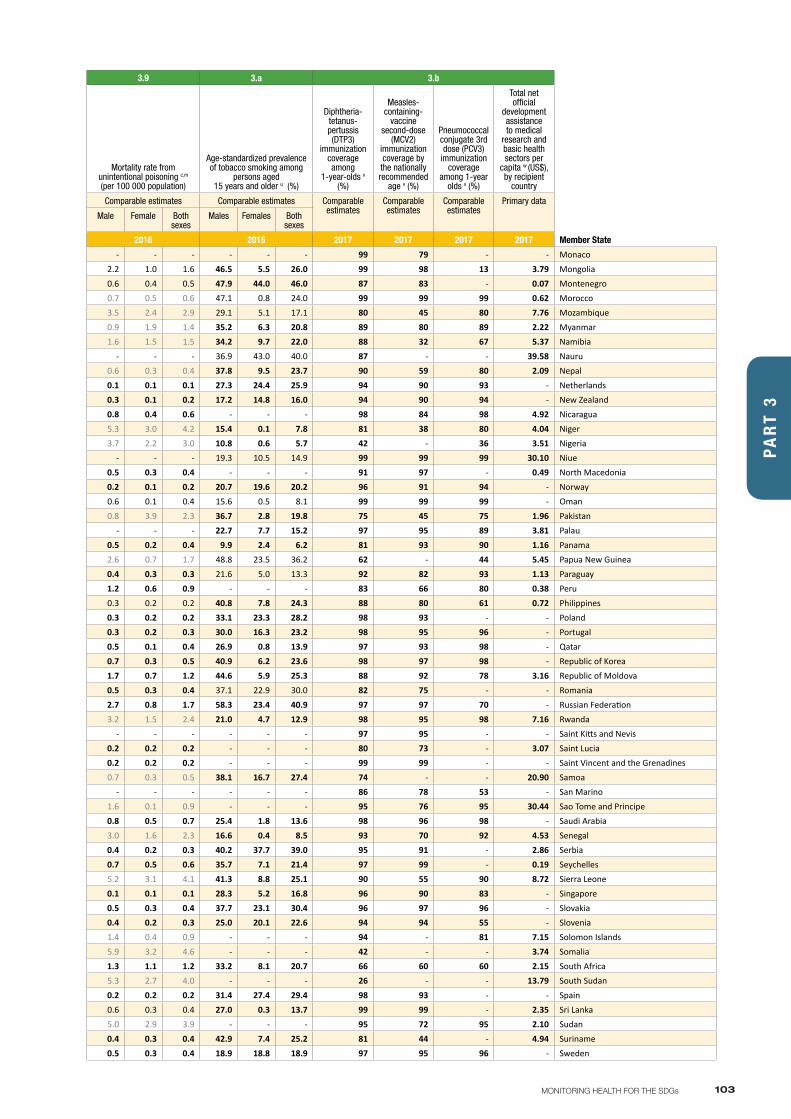
103MONITORING HEALTH FOR THE SDGs
3.8 3.9 3.9 3.a 3.b
ANNEX 2Part 3
UHC service coverage
index r
Population with
household expenditures
on health >10% of total
household expenditure or income s (%)
Population with
household expenditures
on health >25% of total
household expenditure or income s (%)
Age-standardized mortality rate attributed to household and ambient air pollution c,t (per 100 000 population)
Mortality rate attributed to exposure to unsafe Water,
Sanitation and Hygiene (WASH) services c,t
(per 100 000 population)
Mortality rate from unintentional poisoning c,m (per 100 000 population)
Age-standardized prevalence of tobacco smoking among
persons aged 15 years and older u (%)
Diphtheria-tetanus-pertussis (DTP3)
immunization coverage among
1-year-olds v
(%)
Measles-containing-
vaccine second-dose
(MCV2) immunization coverage by the nationally recommended
age v (%)
Pneumococcal conjugate 3rd dose (PCV3)
immunization coverage
among 1-year olds v (%)
Total net official
development assistance to medical
research and basic health sectors per
capita w (US$), by recipient
country
Data Type Comparable estimates
Primary data Primary data Comparable estimates Comparable estimates Comparable estimates Comparable estimates Comparable estimates
Comparable estimates
Comparable estimates
Primary data
Male Female Both sexes
Male Female Both sexes
Male Female Both sexes
Males Females Both sexes
Member State 2015 2009–2015 2009–2015 2016 2016 2016 2016 2017 2017 2017 2017 Member State
Monaco - - - - - - - - - - - - - - - 99 79 - - MonacoMongolia 63 2.4 0.5 203.4 118.5 155.9 1.8 0.8 1.3 2.2 1.0 1.6 46.5 5.5 26.0 99 98 13 3.79 MongoliaMontenegro 54 8.9 1.0 98.2 61.9 78.6 <0.1 <0.1 <0.1 0.6 0.4 0.5 47.9 44.0 46.0 87 83 - 0.07 MontenegroMorocco 65 - - 58.4 41.6 49.1 1.8 2.0 1.9 0.7 0.5 0.6 47.1 0.8 24.0 99 99 99 0.62 MoroccoMozambique 42 - - 113.8 106.4 110.0 28.2 27.1 27.6 3.5 2.4 2.9 29.1 5.1 17.1 80 45 80 7.76 MozambiqueMyanmar 60 - - 187.5 133.0 156.4 13.1 12.2 12.6 0.9 1.9 1.4 35.2 6.3 20.8 89 80 89 2.22 MyanmarNamibia 59 - - 168.1 128.9 145.0 18.4 18.3 18.3 1.6 1.5 1.5 34.2 9.7 22.0 88 32 67 5.37 NamibiaNauru - - - - - - - - - - - - 36.9 43.0 40.0 87 - - 39.58 NauruNepal 46 27.4 3.3 216.5 173.4 193.8 14.9 24.4 19.8 0.6 0.3 0.4 37.8 9.5 23.7 90 59 80 2.09 NepalNetherlands ≥80 - - 16.6 11.2 13.7 0.2 0.3 0.2 0.1 0.1 0.1 27.3 24.4 25.9 94 90 93 - NetherlandsNew Zealand ≥80 - - 8.6 5.9 7.2 0.1 0.2 0.1 0.3 0.1 0.2 17.2 14.8 16.0 94 90 94 - New ZealandNicaragua 70 27.7 8.9 62.5 50.0 55.7 2.4 2.0 2.2 0.8 0.4 0.6 - - - 98 84 98 4.92 NicaraguaNiger 33 4.1 0.4 266.9 237.5 251.8 74.7 66.9 70.8 5.3 3.0 4.2 15.4 0.1 7.8 81 38 80 4.04 NigerNigeria 39 24.8 8.9 300.9 312.6 307.4 71.6 65.6 68.6 3.7 2.2 3.0 10.8 0.6 5.7 42 - 36 3.51 NigeriaNiue - - - - - - - - - - - - 19.3 10.5 14.9 99 99 99 30.10 NiueNorth Macedonia 70 - - 102.9 63.8 82.2 0.1 0.1 0.1 0.5 0.3 0.4 - - - 91 97 - 0.49 North MacedoniaNorway ≥80 - - 10.4 6.9 8.6 0.2 0.3 0.2 0.2 0.1 0.2 20.7 19.6 20.2 96 91 94 - NorwayOman 72 - - 61.9 43.1 53.9 <0.1 <0.1 <0.1 0.6 0.1 0.4 15.6 0.5 8.1 99 99 99 - OmanPakistan 40 1.0 0.0 197.2 149.0 173.6 16.0 23.4 19.6 0.8 3.9 2.3 36.7 2.8 19.8 75 45 75 1.96 PakistanPalau - - - - - - - - - - - - 22.7 7.7 15.2 97 95 89 3.81 PalauPanama 75 - - 31.2 20.9 25.8 2.1 1.7 1.9 0.5 0.2 0.4 9.9 2.4 6.2 81 93 90 1.16 PanamaPapua New Guinea 41 - - 183.8 125.3 152.0 14.6 18.1 16.3 2.6 0.7 1.7 48.8 23.5 36.2 62 - 44 5.45 Papua New GuineaParaguay 69 - - 66.3 49.2 57.5 1.4 1.5 1.5 0.4 0.3 0.3 21.6 5.0 13.3 92 82 93 1.13 ParaguayPeru 78 8.3 1.2 74.2 54.8 63.9 1.3 1.2 1.3 1.2 0.6 0.9 - - - 83 66 80 0.38 PeruPhilippines 58 6.3 1.4 225.4 150.7 185.2 4.8 3.6 4.2 0.3 0.2 0.2 40.8 7.8 24.3 88 80 61 0.72 PhilippinesPoland 75 13.9 1.6 53.3 26.2 37.9 0.1 0.1 0.1 0.3 0.2 0.2 33.1 23.3 28.2 98 93 - - PolandPortugal ≥80 18.4 3.3 13.2 7.1 9.8 0.1 0.2 0.2 0.3 0.2 0.3 30.0 16.3 23.2 98 95 96 - PortugalQatar 77 - - 51.7 37.0 47.4 <0.1 <0.1 <0.1 0.5 0.1 0.4 26.9 0.8 13.9 97 93 98 - QatarRepublic of Korea ≥80 - - 29.4 14.0 20.5 1.4 2.2 1.8 0.7 0.3 0.5 40.9 6.2 23.6 98 97 98 - Republic of KoreaRepublic of Moldova 65 16.1 3.6 101.7 60.9 78.3 0.1 0.1 0.1 1.7 0.7 1.2 44.6 5.9 25.3 88 92 78 3.16 Republic of MoldovaRomania 72 12.0 2.3 78.5 43.7 59.3 0.3 0.4 0.4 0.5 0.3 0.4 37.1 22.9 30.0 82 75 - - RomaniaRussian Federation 63 4.9 0.6 73.3 33.5 49.4 0.1 0.1 0.1 2.7 0.8 1.7 58.3 23.4 40.9 97 97 70 - Russian FederationRwanda 53 4.6 0.7 124.8 117.8 121.4 19.2 19.5 19.3 3.2 1.5 2.4 21.0 4.7 12.9 98 95 98 7.16 RwandaSaint Kitts and Nevis - - - - - - - - - - - - - - - 97 95 - - Saint Kitts and NevisSaint Lucia 69 - - 36.0 24.6 30.0 1.0 0.3 0.6 0.2 0.2 0.2 - - - 80 73 - 3.07 Saint LuciaSaint Vincent and the Grenadines 65 - - 56.2 39.6 47.6 1.4 1.3 1.3 0.2 0.2 0.2 - - - 99 99 - - Saint Vincent and the GrenadinesSamoa 56 - - 116.4 58.4 85.0 1.5 1.5 1.5 0.7 0.3 0.5 38.1 16.7 27.4 74 - - 20.90 SamoaSan Marino - - - - - - - - - - - - - - - 86 78 53 - San MarinoSao Tome and Principe 54 - - 168.2 158.1 162.4 11.0 11.7 11.4 1.6 0.1 0.9 - - - 95 76 95 30.44 Sao Tome and PrincipeSaudi Arabia 68 - - 92.8 72.0 83.7 0.1 0.1 0.1 0.8 0.5 0.7 25.4 1.8 13.6 98 96 98 - Saudi ArabiaSenegal 41 3.3 0.2 171.6 151.6 160.7 25.9 21.9 23.9 3.0 1.6 2.3 16.6 0.4 8.5 93 70 92 4.53 SenegalSerbia 65 9.0 0.7 81.8 46.7 62.5 0.6 0.9 0.7 0.4 0.2 0.3 40.2 37.7 39.0 95 91 - 2.86 SerbiaSeychelles 68 - - 70.2 31.1 49.3 0.2 0.1 0.2 0.7 0.5 0.6 35.7 7.1 21.4 97 99 - 0.19 SeychellesSierra Leone 36 - - 314.1 333.3 324.1 86.8 75.8 81.3 5.2 3.1 4.1 41.3 8.8 25.1 90 55 90 8.72 Sierra LeoneSingapore ≥80 - - 33.4 19.4 25.9 <0.1 0.1 0.1 0.1 0.1 0.1 28.3 5.2 16.8 96 90 83 - SingaporeSlovakia 76 3.8 0.4 47.1 23.6 33.5 <0.1 0.1 <0.1 0.5 0.3 0.4 37.7 23.1 30.4 96 97 96 - SlovakiaSlovenia 78 2.9 0.3 28.9 17.1 22.6 <0.1 <0.1 <0.1 0.4 0.2 0.3 25.0 20.1 22.6 94 94 55 - SloveniaSolomon Islands 50 - - 157.8 116.0 137.0 6.8 5.5 6.2 1.4 0.4 0.9 - - - 94 - 81 7.15 Solomon IslandsSomalia 22 - - 222.0 203.7 212.8 83.4 89.7 86.6 5.9 3.2 4.6 - - - 42 - - 3.74 SomaliaSouth Africa 67 1.4 0.1 117.9 65.9 86.7 13.9 13.4 13.7 1.3 1.1 1.2 33.2 8.1 20.7 66 60 60 2.15 South AfricaSouth Sudan 30 - - 168.5 161.3 165.1 65.9 60.7 63.3 5.3 2.7 4.0 - - - 26 - - 13.79 South SudanSpain 77 5.7 1.2 14.2 6.4 9.9 0.1 0.2 0.2 0.2 0.2 0.2 31.4 27.4 29.4 98 93 - - SpainSri Lanka 62 2.9 0.1 99.9 62.6 79.8 1.2 1.2 1.2 0.6 0.3 0.4 27.0 0.3 13.7 99 99 - 2.35 Sri LankaSudan 43 - - 195.7 175.0 184.9 16.3 18.3 17.3 5.0 2.9 3.9 - - - 95 72 95 2.10 SudanSuriname 68 - - 74.1 42.3 56.7 2.1 2.0 2.0 0.4 0.3 0.4 42.9 7.4 25.2 81 44 - 4.94 SurinameSweden ≥80 - - 8.7 5.8 7.2 0.2 0.3 0.2 0.5 0.3 0.4 18.9 18.8 18.9 97 95 96 - Sweden
PA
RT
3
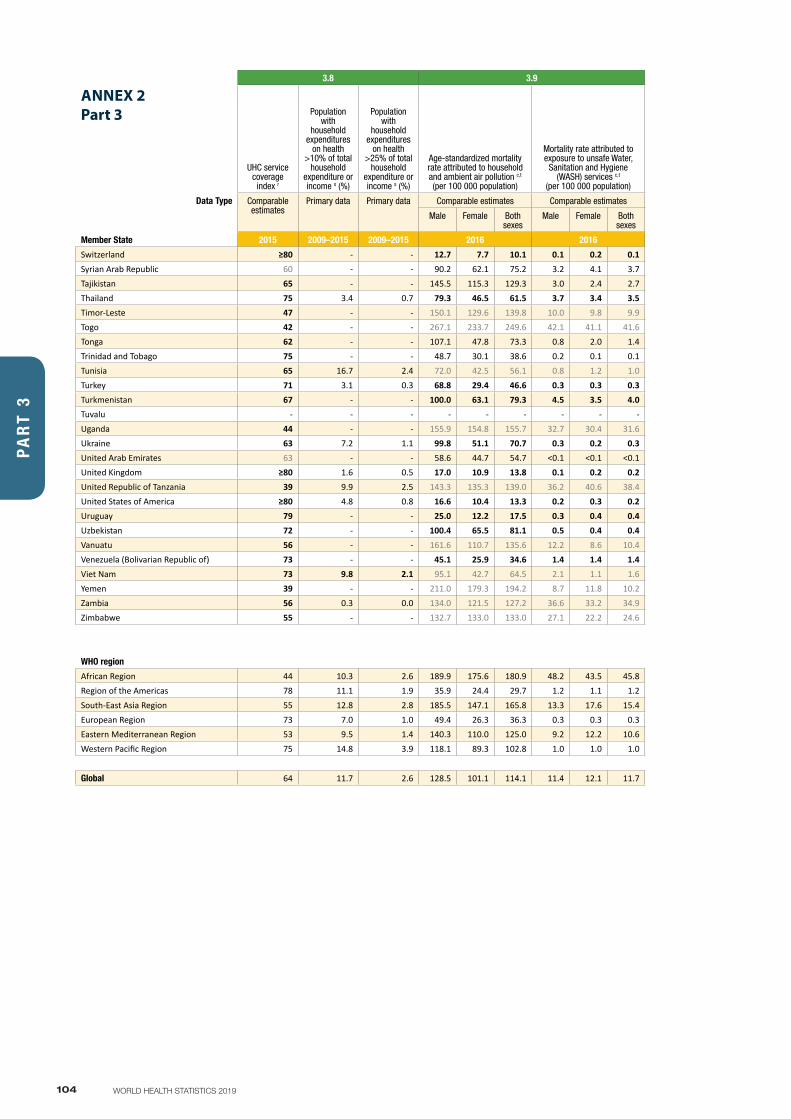
104 WORLD HEALTH STATISTICS 2019
3.8 3.9 3.9 3.a 3.b
ANNEX 2Part 3
UHC service coverage
index r
Population with
household expenditures
on health >10% of total
household expenditure or income s (%)
Population with
household expenditures
on health >25% of total
household expenditure or income s (%)
Age-standardized mortality rate attributed to household and ambient air pollution c,t (per 100 000 population)
Mortality rate attributed to exposure to unsafe Water,
Sanitation and Hygiene (WASH) services c,t
(per 100 000 population)
Mortality rate from unintentional poisoning c,m (per 100 000 population)
Age-standardized prevalence of tobacco smoking among
persons aged 15 years and older u (%)
Diphtheria-tetanus-pertussis (DTP3)
immunization coverage among
1-year-olds v
(%)
Measles-containing-
vaccine second-dose
(MCV2) immunization coverage by the nationally recommended
age v (%)
Pneumococcal conjugate 3rd dose (PCV3)
immunization coverage
among 1-year olds v (%)
Total net official
development assistance to medical
research and basic health sectors per
capita w (US$), by recipient
country
Data Type Comparable estimates
Primary data Primary data Comparable estimates Comparable estimates Comparable estimates Comparable estimates Comparable estimates
Comparable estimates
Comparable estimates
Primary data
Male Female Both sexes
Male Female Both sexes
Male Female Both sexes
Males Females Both sexes
Member State 2015 2009–2015 2009–2015 2016 2016 2016 2016 2017 2017 2017 2017 Member State
Switzerland ≥80 - - 12.7 7.7 10.1 0.1 0.2 0.1 0.1 0.1 0.1 28.9 22.6 25.8 97 89 83 - SwitzerlandSyrian Arab Republic 60 - - 90.2 62.1 75.2 3.2 4.1 3.7 0.4 0.4 0.4 - - - 48 - - 1.59 Syrian Arab RepublicTajikistan 65 - - 145.5 115.3 129.3 3.0 2.4 2.7 1.4 0.9 1.2 - - - 96 98 - 4.19 TajikistanThailand 75 3.4 0.7 79.3 46.5 61.5 3.7 3.4 3.5 0.5 0.3 0.4 38.8 1.9 20.4 99 95 - 0.55 ThailandTimor-Leste 47 - - 150.1 129.6 139.8 10.0 9.8 9.9 0.5 0.4 0.4 78.1 6.3 42.2 76 50 - 9.29 Timor-LesteTogo 42 - - 267.1 233.7 249.6 42.1 41.1 41.6 3.0 1.8 2.4 14.2 0.9 7.6 90 - 90 5.66 TogoTonga 62 - - 107.1 47.8 73.3 0.8 2.0 1.4 1.5 1.2 1.3 44.4 11.8 28.1 81 - - 36.07 TongaTrinidad and Tobago 75 - - 48.7 30.1 38.6 0.2 0.1 0.1 0.3 0.2 0.2 - - - 89 65 93 - Trinidad and TobagoTunisia 65 16.7 2.4 72.0 42.5 56.1 0.8 1.2 1.0 0.5 0.4 0.5 65.8 1.1 33.5 98 97 - 0.46 TunisiaTurkey 71 3.1 0.3 68.8 29.4 46.6 0.3 0.3 0.3 0.4 0.2 0.3 41.1 14.1 27.6 96 86 96 2.06 TurkeyTurkmenistan 67 - - 100.0 63.1 79.3 4.5 3.5 4.0 0.9 0.6 0.7 - - - 99 99 - 0.47 TurkmenistanTuvalu - - - - - - - - - - - - - - - 96 94 - 9.02 TuvaluUganda 44 - - 155.9 154.8 155.7 32.7 30.4 31.6 4.0 2.4 3.2 16.7 3.4 10.1 85 - 81 5.19 UgandaUkraine 63 7.2 1.1 99.8 51.1 70.7 0.3 0.2 0.3 4.3 1.1 2.5 47.4 13.5 30.5 50 84 - 0.77 UkraineUnited Arab Emirates 63 - - 58.6 44.7 54.7 <0.1 <0.1 <0.1 0.2 0.3 0.3 37.4 1.2 19.3 97 99 96 - United Arab EmiratesUnited Kingdom ≥80 1.6 0.5 17.0 10.9 13.8 0.1 0.2 0.2 0.3 0.2 0.2 24.7 20.0 22.4 94 88 92 - United KingdomUnited Republic of Tanzania 39 9.9 2.5 143.3 135.3 139.0 36.2 40.6 38.4 3.2 2.2 2.7 26.7 3.3 15.0 97 79 97 5.11 United Republic of TanzaniaUnited States of America ≥80 4.8 0.8 16.6 10.4 13.3 0.2 0.3 0.2 1.0 0.8 0.9 24.6 19.1 21.9 95 94 93 - United States of AmericaUruguay 79 - - 25.0 12.2 17.5 0.3 0.4 0.4 0.6 0.3 0.4 19.9 14.0 17.0 95 92 94 0.06 UruguayUzbekistan 72 - - 100.4 65.5 81.1 0.5 0.4 0.4 1.5 0.5 1.0 24.7 1.3 13.0 99 99 99 1.25 UzbekistanVanuatu 56 - - 161.6 110.7 135.6 12.2 8.6 10.4 1.3 0.4 0.9 34.5 2.8 18.7 85 - - 14.82 VanuatuVenezuela (Bolivarian Republic of) 73 - - 45.1 25.9 34.6 1.4 1.4 1.4 0.4 0.2 0.3 - - - 84 59 - 0.03 Venezuela (Bolivarian Republic of)Viet Nam 73 9.8 2.1 95.1 42.7 64.5 2.1 1.1 1.6 1.7 0.1 0.9 45.9 1.0 23.5 94 93 - 0.92 Viet NamYemen 39 - - 211.0 179.3 194.2 8.7 11.8 10.2 4.8 2.7 3.8 29.2 7.6 18.4 68 46 68 10.09 YemenZambia 56 0.3 0.0 134.0 121.5 127.2 36.6 33.2 34.9 3.8 2.1 2.9 24.7 3.1 13.9 94 64 94 12.79 ZambiaZimbabwe 55 - - 132.7 133.0 133.0 27.1 22.2 24.6 2.2 2.3 2.2 30.7 1.6 16.2 89 78 89 8.98 Zimbabwe
WHO region WHO region
African Region 44 10.3 2.6 189.9 175.6 180.9 48.2 43.5 45.8 3.4 2.1 2.7 17.5 2.2 9.8 72 25 68 4.83 African RegionRegion of the Americas 78 11.1 1.9 35.9 24.4 29.7 1.2 1.1 1.2 0.7 0.5 0.6 21.4 12.4 16.9 91 74 82 0.42 Region of the AmericasSouth-East Asia Region 55 12.8 2.8 185.5 147.1 165.8 13.3 17.6 15.4 2.1 1.4 1.8 31.6 2.2 16.9 88 77 12 0.60 South-East Asia RegionEuropean Region 73 7.0 1.0 49.4 26.3 36.3 0.3 0.3 0.3 1.0 0.4 0.7 38.1 20.7 29.4 94 90 70 - European RegionEastern Mediterranean Region 53 9.5 1.4 140.3 110.0 125.0 9.2 12.2 10.6 1.2 1.8 1.5 34.0 2.2 18.1 81 67 52 1.89 Eastern Mediterranean RegionWestern Pacific Region 75 14.8 3.9 118.1 89.3 102.8 1.0 1.0 1.0 1.0 1.3 1.1 46.0 3.0 24.5 97 94 16 0.30 Western Pacific Region
Global 64 11.7 2.6 128.5 101.1 114.1 11.4 12.1 11.7 1.6 1.2 1.4 33.7 6.2 19.9 85 67 44 1.39 Global
PA
RT
3
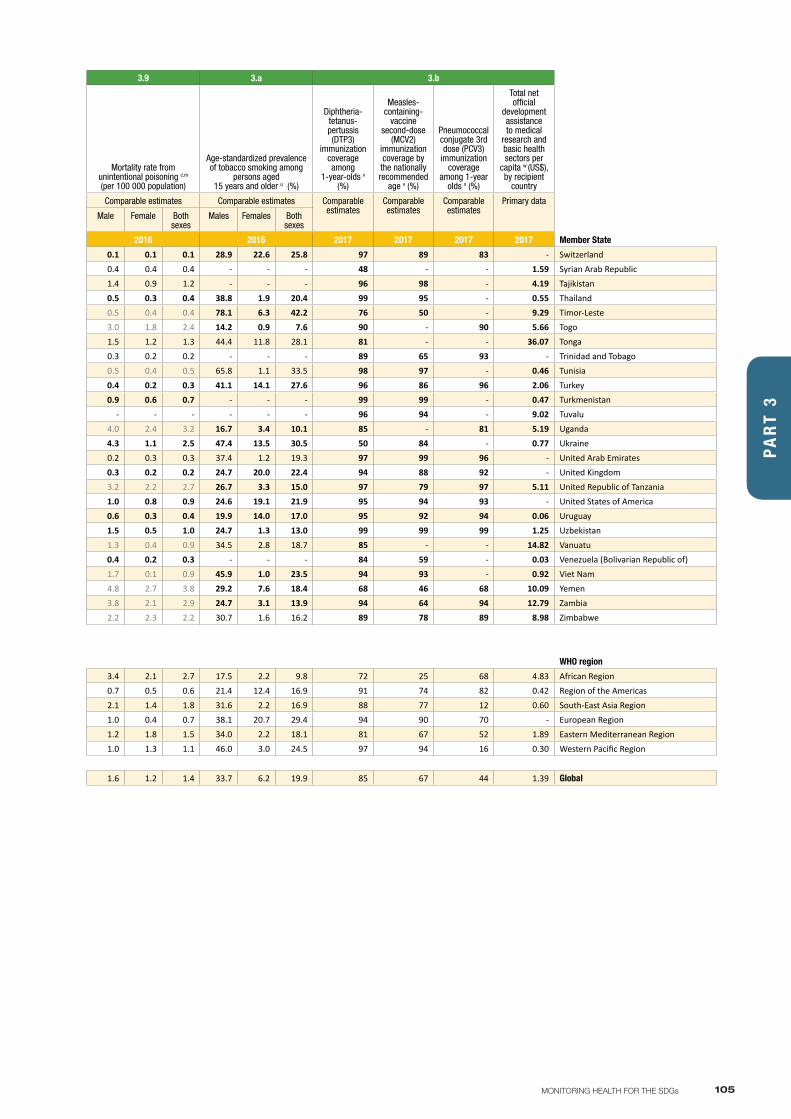
105MONITORING HEALTH FOR THE SDGs
3.8 3.9 3.9 3.a 3.b
ANNEX 2Part 3
UHC service coverage
index r
Population with
household expenditures
on health >10% of total
household expenditure or income s (%)
Population with
household expenditures
on health >25% of total
household expenditure or income s (%)
Age-standardized mortality rate attributed to household and ambient air pollution c,t (per 100 000 population)
Mortality rate attributed to exposure to unsafe Water,
Sanitation and Hygiene (WASH) services c,t
(per 100 000 population)
Mortality rate from unintentional poisoning c,m (per 100 000 population)
Age-standardized prevalence of tobacco smoking among
persons aged 15 years and older u (%)
Diphtheria-tetanus-pertussis (DTP3)
immunization coverage among
1-year-olds v
(%)
Measles-containing-
vaccine second-dose
(MCV2) immunization coverage by the nationally recommended
age v (%)
Pneumococcal conjugate 3rd dose (PCV3)
immunization coverage
among 1-year olds v (%)
Total net official
development assistance to medical
research and basic health sectors per
capita w (US$), by recipient
country
Data Type Comparable estimates
Primary data Primary data Comparable estimates Comparable estimates Comparable estimates Comparable estimates Comparable estimates
Comparable estimates
Comparable estimates
Primary data
Male Female Both sexes
Male Female Both sexes
Male Female Both sexes
Males Females Both sexes
Member State 2015 2009–2015 2009–2015 2016 2016 2016 2016 2017 2017 2017 2017 Member State
Switzerland ≥80 - - 12.7 7.7 10.1 0.1 0.2 0.1 0.1 0.1 0.1 28.9 22.6 25.8 97 89 83 - SwitzerlandSyrian Arab Republic 60 - - 90.2 62.1 75.2 3.2 4.1 3.7 0.4 0.4 0.4 - - - 48 - - 1.59 Syrian Arab RepublicTajikistan 65 - - 145.5 115.3 129.3 3.0 2.4 2.7 1.4 0.9 1.2 - - - 96 98 - 4.19 TajikistanThailand 75 3.4 0.7 79.3 46.5 61.5 3.7 3.4 3.5 0.5 0.3 0.4 38.8 1.9 20.4 99 95 - 0.55 ThailandTimor-Leste 47 - - 150.1 129.6 139.8 10.0 9.8 9.9 0.5 0.4 0.4 78.1 6.3 42.2 76 50 - 9.29 Timor-LesteTogo 42 - - 267.1 233.7 249.6 42.1 41.1 41.6 3.0 1.8 2.4 14.2 0.9 7.6 90 - 90 5.66 TogoTonga 62 - - 107.1 47.8 73.3 0.8 2.0 1.4 1.5 1.2 1.3 44.4 11.8 28.1 81 - - 36.07 TongaTrinidad and Tobago 75 - - 48.7 30.1 38.6 0.2 0.1 0.1 0.3 0.2 0.2 - - - 89 65 93 - Trinidad and TobagoTunisia 65 16.7 2.4 72.0 42.5 56.1 0.8 1.2 1.0 0.5 0.4 0.5 65.8 1.1 33.5 98 97 - 0.46 TunisiaTurkey 71 3.1 0.3 68.8 29.4 46.6 0.3 0.3 0.3 0.4 0.2 0.3 41.1 14.1 27.6 96 86 96 2.06 TurkeyTurkmenistan 67 - - 100.0 63.1 79.3 4.5 3.5 4.0 0.9 0.6 0.7 - - - 99 99 - 0.47 TurkmenistanTuvalu - - - - - - - - - - - - - - - 96 94 - 9.02 TuvaluUganda 44 - - 155.9 154.8 155.7 32.7 30.4 31.6 4.0 2.4 3.2 16.7 3.4 10.1 85 - 81 5.19 UgandaUkraine 63 7.2 1.1 99.8 51.1 70.7 0.3 0.2 0.3 4.3 1.1 2.5 47.4 13.5 30.5 50 84 - 0.77 UkraineUnited Arab Emirates 63 - - 58.6 44.7 54.7 <0.1 <0.1 <0.1 0.2 0.3 0.3 37.4 1.2 19.3 97 99 96 - United Arab EmiratesUnited Kingdom ≥80 1.6 0.5 17.0 10.9 13.8 0.1 0.2 0.2 0.3 0.2 0.2 24.7 20.0 22.4 94 88 92 - United KingdomUnited Republic of Tanzania 39 9.9 2.5 143.3 135.3 139.0 36.2 40.6 38.4 3.2 2.2 2.7 26.7 3.3 15.0 97 79 97 5.11 United Republic of TanzaniaUnited States of America ≥80 4.8 0.8 16.6 10.4 13.3 0.2 0.3 0.2 1.0 0.8 0.9 24.6 19.1 21.9 95 94 93 - United States of AmericaUruguay 79 - - 25.0 12.2 17.5 0.3 0.4 0.4 0.6 0.3 0.4 19.9 14.0 17.0 95 92 94 0.06 UruguayUzbekistan 72 - - 100.4 65.5 81.1 0.5 0.4 0.4 1.5 0.5 1.0 24.7 1.3 13.0 99 99 99 1.25 UzbekistanVanuatu 56 - - 161.6 110.7 135.6 12.2 8.6 10.4 1.3 0.4 0.9 34.5 2.8 18.7 85 - - 14.82 VanuatuVenezuela (Bolivarian Republic of) 73 - - 45.1 25.9 34.6 1.4 1.4 1.4 0.4 0.2 0.3 - - - 84 59 - 0.03 Venezuela (Bolivarian Republic of)Viet Nam 73 9.8 2.1 95.1 42.7 64.5 2.1 1.1 1.6 1.7 0.1 0.9 45.9 1.0 23.5 94 93 - 0.92 Viet NamYemen 39 - - 211.0 179.3 194.2 8.7 11.8 10.2 4.8 2.7 3.8 29.2 7.6 18.4 68 46 68 10.09 YemenZambia 56 0.3 0.0 134.0 121.5 127.2 36.6 33.2 34.9 3.8 2.1 2.9 24.7 3.1 13.9 94 64 94 12.79 ZambiaZimbabwe 55 - - 132.7 133.0 133.0 27.1 22.2 24.6 2.2 2.3 2.2 30.7 1.6 16.2 89 78 89 8.98 Zimbabwe
WHO region WHO region
African Region 44 10.3 2.6 189.9 175.6 180.9 48.2 43.5 45.8 3.4 2.1 2.7 17.5 2.2 9.8 72 25 68 4.83 African RegionRegion of the Americas 78 11.1 1.9 35.9 24.4 29.7 1.2 1.1 1.2 0.7 0.5 0.6 21.4 12.4 16.9 91 74 82 0.42 Region of the AmericasSouth-East Asia Region 55 12.8 2.8 185.5 147.1 165.8 13.3 17.6 15.4 2.1 1.4 1.8 31.6 2.2 16.9 88 77 12 0.60 South-East Asia RegionEuropean Region 73 7.0 1.0 49.4 26.3 36.3 0.3 0.3 0.3 1.0 0.4 0.7 38.1 20.7 29.4 94 90 70 - European RegionEastern Mediterranean Region 53 9.5 1.4 140.3 110.0 125.0 9.2 12.2 10.6 1.2 1.8 1.5 34.0 2.2 18.1 81 67 52 1.89 Eastern Mediterranean RegionWestern Pacific Region 75 14.8 3.9 118.1 89.3 102.8 1.0 1.0 1.0 1.0 1.3 1.1 46.0 3.0 24.5 97 94 16 0.30 Western Pacific Region
Global 64 11.7 2.6 128.5 101.1 114.1 11.4 12.1 11.7 1.6 1.2 1.4 33.7 6.2 19.9 85 67 44 1.39 GlobalP
AR
T 3
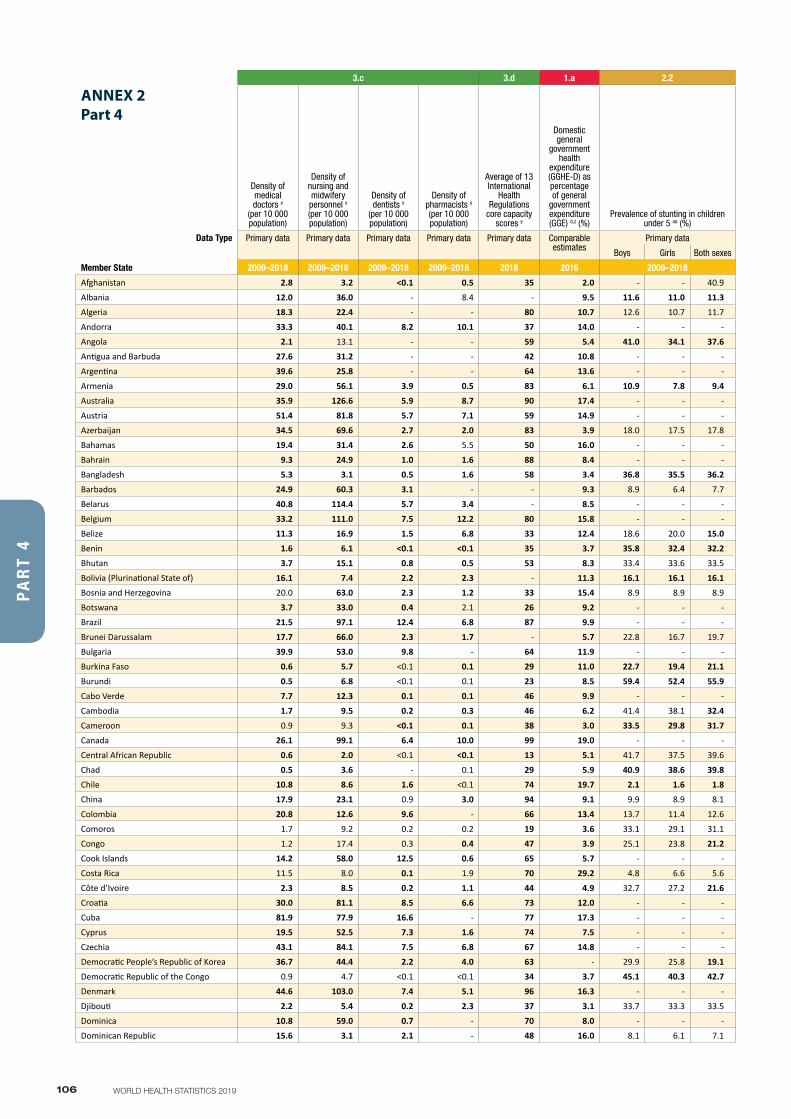
106 WORLD HEALTH STATISTICS 2019
3.c 3.d 1.a 2.2 2.2 5.2 6.1 6.2 6.a
ANNEX 2Part 4
Density of medical doctors x
(per 10 000 population)
Density of nursing and midwifery personnel x (per 10 000 population)
Density of dentists x
(per 10 000 population)
Density of pharmacists x (per 10 000 population)
Average of 13 International
Health Regulations
core capacity scores y
Domestic general
government health
expenditure (GGHE-D) as percentage of general
government expenditure (GGE) d,z (%)
Prevalence of stunting in children under 5 aa (%)
Prevalence of wasting in children under 5 aa (%)
Prevalence of overweight in children under 5 aa (%)
Proportion of ever-partnered
women and girls aged
15 years and older subjected
to physical, sexual or
psychological violence by a current or
former intimate partner in the previous 12
months ab (%)
Proportion of population
using safely managed
drinking-water services ac (%)
Proportion of population
using safely managed sanitation
services ac (%)
Amount of water- and sanitation-
related official development assistance
that is part of a
government-coordinated
spending plan ad
(constant 2016 US$ millions)
Data Type Primary data Primary data Primary data Primary data Primary data Comparable estimates
Primary data Primary data Primary data Primary data Comparable estimates
Comparable estimates
Primary data
Boys Girls Both sexes Boys Girls Both sexes Boys Girls Both sexes
Member State 2009–2018 2009–2018 2009–2018 2009–2018 2018 2016 2009–2018 2009–2018 2009–2018 2009–2017 2015 2015 2017 Member State
Afghanistan 2.8 3.2 <0.1 0.5 35 2.0 - - 40.9 - - 9.5 - - 5.4 46 - - 91.15 Afghanistan
Albania 12.0 36.0 - 8.4 - 9.5 11.6 11.0 11.3 1.2 2.0 1.6 17.3 15.4 16.4 - 69 65 58.99 Albania
Algeria 18.3 22.4 - - 80 10.7 12.6 10.7 11.7 4.4 3.8 4.1 12.9 12.0 12.4 - - 19 3.66 Algeria
Andorra 33.3 40.1 8.2 10.1 37 14.0 - - - - - - - - - - - 100 - Andorra
Angola 2.1 13.1 - - 59 5.4 41.0 34.1 37.6 5.6 4.3 4.9 3.1 3.6 3.4 26 - - 46.64 Angola
Antigua and Barbuda 27.6 31.2 - - 42 10.8 - - - - - - - - - - - - 0.37 Antigua and Barbuda
Argentina 39.6 25.8 - - 64 13.6 - - - - - - - - - - - 26 11.39 Argentina
Armenia 29.0 56.1 3.9 0.5 83 6.1 10.9 7.8 9.4 4.0 5.0 4.5 14.6 12.7 13.7 4 61 - 76.78 Armenia
Australia 35.9 126.6 5.9 8.7 90 17.4 - - - - - - - - - - - 74 - Australia
Austria 51.4 81.8 5.7 7.1 59 14.9 - - - - - - - - - - 99 97 - Austria
Azerbaijan 34.5 69.6 2.7 2.0 83 3.9 18.0 17.5 17.8 4.0 2.1 3.2 15.1 12.8 14.1 - 72 - 84.61 Azerbaijan
Bahamas 19.4 31.4 2.6 5.5 50 16.0 - - - - - - - - - - - - - Bahamas
Bahrain 9.3 24.9 1.0 1.6 88 8.4 - - - - - - - - - - 99 93 - Bahrain
Bangladesh 5.3 3.1 0.5 1.6 58 3.4 36.8 35.5 36.2 15.1 13.6 14.4 1.6 1.5 1.6 29 ah 56 - 283.77 Bangladesh
Barbados 24.9 60.3 3.1 - - 9.3 8.9 6.4 7.7 8.3 5.0 6.8 11.3 13.3 12.2 - - - - Barbados
Belarus 40.8 114.4 5.7 3.4 - 8.5 - - - - - - - - - - 94 76 2.79 Belarus
Belgium 33.2 111.0 7.5 12.2 80 15.8 - - - - - - - - - - 98 97 - Belgium
Belize 11.3 16.9 1.5 6.8 33 12.4 18.6 20.0 15.0 3.2 3.4 1.8 8.6 7.1 7.3 - - - 0.36 Belize
Benin 1.6 6.1 <0.1 <0.1 35 3.7 35.8 32.4 32.2 6.3 4.4 5.0 2.2 1.3 1.9 - - - 29.08 Benin
Bhutan 3.7 15.1 0.8 0.5 53 8.3 33.4 33.6 33.5 6.2 5.5 5.9 7.5 7.6 7.6 - 34 - 11.64 Bhutan
Bolivia (Plurinational State of) 16.1 7.4 2.2 2.3 - 11.3 16.1 16.1 16.1 2.5 1.4 2.0 11.1 9.2 10.1 27 ah - 19 193.23 Bolivia (Plurinational State of)
Bosnia and Herzegovina 20.0 63.0 2.3 1.2 33 15.4 8.9 8.9 8.9 2.3 2.4 2.3 16.7 18.0 17.4 - 89 23 49.03 Bosnia and Herzegovina
Botswana 3.7 33.0 0.4 2.1 26 9.2 - - - - - - - - - - - - 0.08 Botswana
Brazil 21.5 97.1 12.4 6.8 87 9.9 - - - - - - - - - - - 39 94.88 Brazil
Brunei Darussalam 17.7 66.0 2.3 1.7 - 5.7 22.8 16.7 19.7 2.7 3.0 2.9 8.9 7.8 8.3 - - - - Brunei Darussalam
Bulgaria 39.9 53.0 9.8 - 64 11.9 - - - - - - - - - - 97 74 - Bulgaria
Burkina Faso 0.6 5.7 <0.1 0.1 29 11.0 22.7 19.4 21.1 9.7 7.5 8.6 2.0 1.3 1.7 9 - - 110.81 Burkina Faso
Burundi 0.5 6.8 <0.1 0.1 23 8.5 59.4 52.4 55.9 5.6 4.6 5.1 1.5 1.2 1.4 28 - - 22.88 Burundi
Cabo Verde 7.7 12.3 0.1 0.1 46 9.9 - - - - - - - - - - - - 32.79 Cabo Verde
Cambodia 1.7 9.5 0.2 0.3 46 6.2 41.4 38.1 32.4 11.4 10.6 9.8 1.8 1.9 2.2 11 24 - 159.90 Cambodia
Cameroon 0.9 9.3 <0.1 0.1 38 3.0 33.5 29.8 31.7 5.6 4.8 5.2 7.1 6.2 6.7 33 - - 120.14 Cameroon
Canada 26.1 99.1 6.4 10.0 99 19.0 - - - - - - - - - - - 77 - Canada
Central African Republic 0.6 2.0 <0.1 <0.1 13 5.1 41.7 37.5 39.6 8.8 6.3 7.6 2.1 1.7 1.9 - - - 3.48 Central African Republic
Chad 0.5 3.6 - 0.1 29 5.9 40.9 38.6 39.8 14.7 11.9 13.3 2.8 2.8 2.8 18 - - 42.99 Chad
Chile 10.8 8.6 1.6 <0.1 74 19.7 2.1 1.6 1.8 0.3 0.2 0.3 10.0 8.7 9.3 - 98 85 4.63 Chile
China 17.9 23.1 0.9 3.0 94 9.1 9.9 8.9 8.1 2.4 2.1 1.9 7.5 5.6 9.1 - - 60 87.60 China
Colombia 20.8 12.6 9.6 - 66 13.4 13.7 11.4 12.6 0.9 0.9 0.9 5.4 4.2 4.8 18 71 20 12.40 Colombia
Comoros 1.7 9.2 0.2 0.2 19 3.6 33.1 29.1 31.1 11.7 10.9 11.3 11.2 10.0 10.6 5 - - 4.02 Comoros
Congo 1.2 17.4 0.3 0.4 47 3.9 25.1 23.8 21.2 6.3 5.8 8.2 3.5 3.5 5.9 - 37 - 9.34 Congo
Cook Islands 14.2 58.0 12.5 0.6 65 5.7 - - - - - - - - - 9 ah - - 3.30 Cook Islands
Costa Rica 11.5 8.0 0.1 1.9 70 29.2 4.8 6.6 5.6 0.6 1.5 1.0 8.3 7.9 8.1 - 90 - 28.66 Costa Rica
Côte d’Ivoire 2.3 8.5 0.2 1.1 44 4.9 32.7 27.2 21.6 9.3 6.0 6.1 3.5 3.0 1.5 22 ah 46 - 7.55 Côte d’Ivoire
Croatia 30.0 81.1 8.5 6.6 73 12.0 - - - - - - - - - - 90 60 - Croatia
Cuba 81.9 77.9 16.6 - 77 17.3 - - - - - - - - - - - 31 37.30 Cuba
Cyprus 19.5 52.5 7.3 1.6 74 7.5 - - - - - - - - - - 100 76 - Cyprus
Czechia 43.1 84.1 7.5 6.8 67 14.8 - - - - - - - - - - 98 91 - Czechia
Democratic People’s Republic of Korea 36.7 44.4 2.2 4.0 63 - 29.9 25.8 19.1 4.1 3.8 2.5 - - 2.3 - - - 1.00 Democratic People’s Republic of Korea
Democratic Republic of the Congo 0.9 4.7 <0.1 <0.1 34 3.7 45.1 40.3 42.7 9.3 6.9 8.1 4.5 4.4 4.4 37 - - 132.18 Democratic Republic of the Congo
Denmark 44.6 103.0 7.4 5.1 96 16.3 - - - - - - - - - - 97 93 - Denmark
Djibouti 2.2 5.4 0.2 2.3 37 3.1 33.7 33.3 33.5 22.8 20.4 21.6 7.8 8.5 8.1 - - - 20.46 Djibouti
Dominica 10.8 59.0 0.7 - 70 8.0 - - - - - - - - - - - - 2.71 Dominica
Dominican Republic 15.6 3.1 2.1 - 48 16.0 8.1 6.1 7.1 2.8 2.0 2.4 7.9 7.3 7.6 16 - - 35.99 Dominican Republic
PA
RT
4
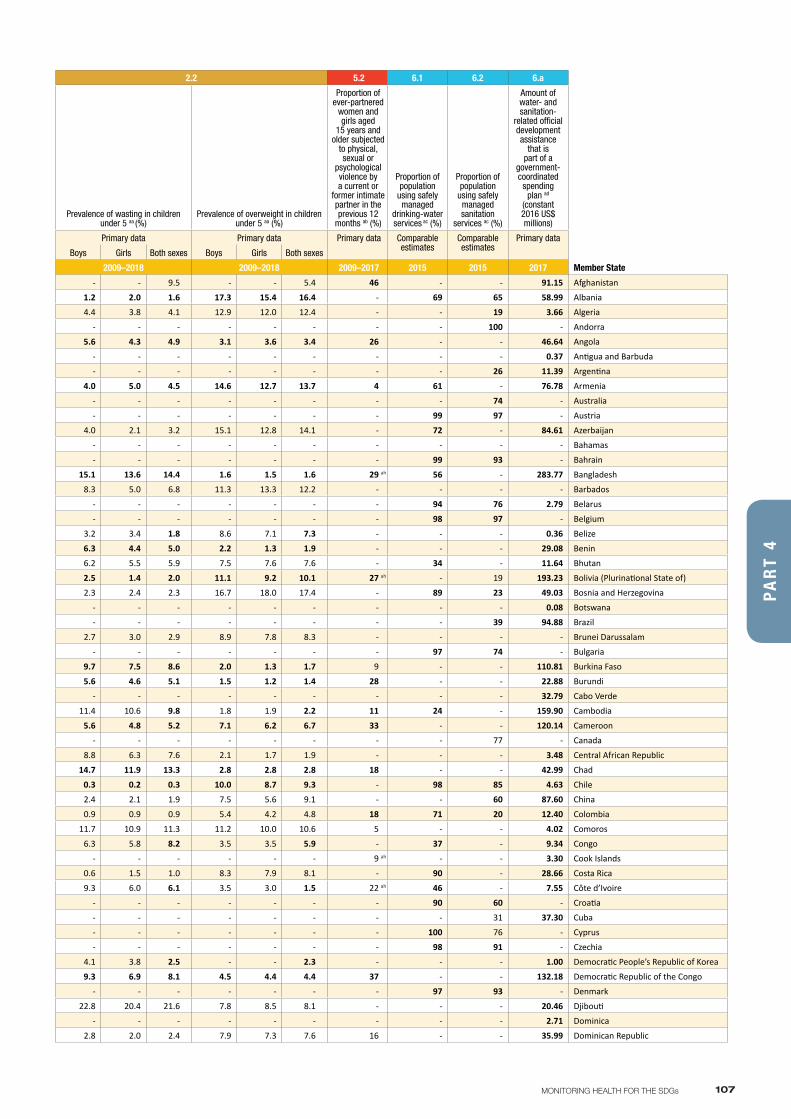
107MONITORING HEALTH FOR THE SDGs
3.c 3.d 1.a 2.2 2.2 5.2 6.1 6.2 6.a
ANNEX 2Part 4
Density of medical doctors x
(per 10 000 population)
Density of nursing and midwifery personnel x (per 10 000 population)
Density of dentists x
(per 10 000 population)
Density of pharmacists x (per 10 000 population)
Average of 13 International
Health Regulations
core capacity scores y
Domestic general
government health
expenditure (GGHE-D) as percentage of general
government expenditure (GGE) d,z (%)
Prevalence of stunting in children under 5 aa (%)
Prevalence of wasting in children under 5 aa (%)
Prevalence of overweight in children under 5 aa (%)
Proportion of ever-partnered
women and girls aged
15 years and older subjected
to physical, sexual or
psychological violence by a current or
former intimate partner in the previous 12
months ab (%)
Proportion of population
using safely managed
drinking-water services ac (%)
Proportion of population
using safely managed sanitation
services ac (%)
Amount of water- and sanitation-
related official development assistance
that is part of a
government-coordinated
spending plan ad
(constant 2016 US$ millions)
Data Type Primary data Primary data Primary data Primary data Primary data Comparable estimates
Primary data Primary data Primary data Primary data Comparable estimates
Comparable estimates
Primary data
Boys Girls Both sexes Boys Girls Both sexes Boys Girls Both sexes
Member State 2009–2018 2009–2018 2009–2018 2009–2018 2018 2016 2009–2018 2009–2018 2009–2018 2009–2017 2015 2015 2017 Member State
Afghanistan 2.8 3.2 <0.1 0.5 35 2.0 - - 40.9 - - 9.5 - - 5.4 46 - - 91.15 Afghanistan
Albania 12.0 36.0 - 8.4 - 9.5 11.6 11.0 11.3 1.2 2.0 1.6 17.3 15.4 16.4 - 69 65 58.99 Albania
Algeria 18.3 22.4 - - 80 10.7 12.6 10.7 11.7 4.4 3.8 4.1 12.9 12.0 12.4 - - 19 3.66 Algeria
Andorra 33.3 40.1 8.2 10.1 37 14.0 - - - - - - - - - - - 100 - Andorra
Angola 2.1 13.1 - - 59 5.4 41.0 34.1 37.6 5.6 4.3 4.9 3.1 3.6 3.4 26 - - 46.64 Angola
Antigua and Barbuda 27.6 31.2 - - 42 10.8 - - - - - - - - - - - - 0.37 Antigua and Barbuda
Argentina 39.6 25.8 - - 64 13.6 - - - - - - - - - - - 26 11.39 Argentina
Armenia 29.0 56.1 3.9 0.5 83 6.1 10.9 7.8 9.4 4.0 5.0 4.5 14.6 12.7 13.7 4 61 - 76.78 Armenia
Australia 35.9 126.6 5.9 8.7 90 17.4 - - - - - - - - - - - 74 - Australia
Austria 51.4 81.8 5.7 7.1 59 14.9 - - - - - - - - - - 99 97 - Austria
Azerbaijan 34.5 69.6 2.7 2.0 83 3.9 18.0 17.5 17.8 4.0 2.1 3.2 15.1 12.8 14.1 - 72 - 84.61 Azerbaijan
Bahamas 19.4 31.4 2.6 5.5 50 16.0 - - - - - - - - - - - - - Bahamas
Bahrain 9.3 24.9 1.0 1.6 88 8.4 - - - - - - - - - - 99 93 - Bahrain
Bangladesh 5.3 3.1 0.5 1.6 58 3.4 36.8 35.5 36.2 15.1 13.6 14.4 1.6 1.5 1.6 29 ah 56 - 283.77 Bangladesh
Barbados 24.9 60.3 3.1 - - 9.3 8.9 6.4 7.7 8.3 5.0 6.8 11.3 13.3 12.2 - - - - Barbados
Belarus 40.8 114.4 5.7 3.4 - 8.5 - - - - - - - - - - 94 76 2.79 Belarus
Belgium 33.2 111.0 7.5 12.2 80 15.8 - - - - - - - - - - 98 97 - Belgium
Belize 11.3 16.9 1.5 6.8 33 12.4 18.6 20.0 15.0 3.2 3.4 1.8 8.6 7.1 7.3 - - - 0.36 Belize
Benin 1.6 6.1 <0.1 <0.1 35 3.7 35.8 32.4 32.2 6.3 4.4 5.0 2.2 1.3 1.9 - - - 29.08 Benin
Bhutan 3.7 15.1 0.8 0.5 53 8.3 33.4 33.6 33.5 6.2 5.5 5.9 7.5 7.6 7.6 - 34 - 11.64 Bhutan
Bolivia (Plurinational State of) 16.1 7.4 2.2 2.3 - 11.3 16.1 16.1 16.1 2.5 1.4 2.0 11.1 9.2 10.1 27 ah - 19 193.23 Bolivia (Plurinational State of)
Bosnia and Herzegovina 20.0 63.0 2.3 1.2 33 15.4 8.9 8.9 8.9 2.3 2.4 2.3 16.7 18.0 17.4 - 89 23 49.03 Bosnia and Herzegovina
Botswana 3.7 33.0 0.4 2.1 26 9.2 - - - - - - - - - - - - 0.08 Botswana
Brazil 21.5 97.1 12.4 6.8 87 9.9 - - - - - - - - - - - 39 94.88 Brazil
Brunei Darussalam 17.7 66.0 2.3 1.7 - 5.7 22.8 16.7 19.7 2.7 3.0 2.9 8.9 7.8 8.3 - - - - Brunei Darussalam
Bulgaria 39.9 53.0 9.8 - 64 11.9 - - - - - - - - - - 97 74 - Bulgaria
Burkina Faso 0.6 5.7 <0.1 0.1 29 11.0 22.7 19.4 21.1 9.7 7.5 8.6 2.0 1.3 1.7 9 - - 110.81 Burkina Faso
Burundi 0.5 6.8 <0.1 0.1 23 8.5 59.4 52.4 55.9 5.6 4.6 5.1 1.5 1.2 1.4 28 - - 22.88 Burundi
Cabo Verde 7.7 12.3 0.1 0.1 46 9.9 - - - - - - - - - - - - 32.79 Cabo Verde
Cambodia 1.7 9.5 0.2 0.3 46 6.2 41.4 38.1 32.4 11.4 10.6 9.8 1.8 1.9 2.2 11 24 - 159.90 Cambodia
Cameroon 0.9 9.3 <0.1 0.1 38 3.0 33.5 29.8 31.7 5.6 4.8 5.2 7.1 6.2 6.7 33 - - 120.14 Cameroon
Canada 26.1 99.1 6.4 10.0 99 19.0 - - - - - - - - - - - 77 - Canada
Central African Republic 0.6 2.0 <0.1 <0.1 13 5.1 41.7 37.5 39.6 8.8 6.3 7.6 2.1 1.7 1.9 - - - 3.48 Central African Republic
Chad 0.5 3.6 - 0.1 29 5.9 40.9 38.6 39.8 14.7 11.9 13.3 2.8 2.8 2.8 18 - - 42.99 Chad
Chile 10.8 8.6 1.6 <0.1 74 19.7 2.1 1.6 1.8 0.3 0.2 0.3 10.0 8.7 9.3 - 98 85 4.63 Chile
China 17.9 23.1 0.9 3.0 94 9.1 9.9 8.9 8.1 2.4 2.1 1.9 7.5 5.6 9.1 - - 60 87.60 China
Colombia 20.8 12.6 9.6 - 66 13.4 13.7 11.4 12.6 0.9 0.9 0.9 5.4 4.2 4.8 18 71 20 12.40 Colombia
Comoros 1.7 9.2 0.2 0.2 19 3.6 33.1 29.1 31.1 11.7 10.9 11.3 11.2 10.0 10.6 5 - - 4.02 Comoros
Congo 1.2 17.4 0.3 0.4 47 3.9 25.1 23.8 21.2 6.3 5.8 8.2 3.5 3.5 5.9 - 37 - 9.34 Congo
Cook Islands 14.2 58.0 12.5 0.6 65 5.7 - - - - - - - - - 9 ah - - 3.30 Cook Islands
Costa Rica 11.5 8.0 0.1 1.9 70 29.2 4.8 6.6 5.6 0.6 1.5 1.0 8.3 7.9 8.1 - 90 - 28.66 Costa Rica
Côte d’Ivoire 2.3 8.5 0.2 1.1 44 4.9 32.7 27.2 21.6 9.3 6.0 6.1 3.5 3.0 1.5 22 ah 46 - 7.55 Côte d’Ivoire
Croatia 30.0 81.1 8.5 6.6 73 12.0 - - - - - - - - - - 90 60 - Croatia
Cuba 81.9 77.9 16.6 - 77 17.3 - - - - - - - - - - - 31 37.30 Cuba
Cyprus 19.5 52.5 7.3 1.6 74 7.5 - - - - - - - - - - 100 76 - Cyprus
Czechia 43.1 84.1 7.5 6.8 67 14.8 - - - - - - - - - - 98 91 - Czechia
Democratic People’s Republic of Korea 36.7 44.4 2.2 4.0 63 - 29.9 25.8 19.1 4.1 3.8 2.5 - - 2.3 - - - 1.00 Democratic People’s Republic of Korea
Democratic Republic of the Congo 0.9 4.7 <0.1 <0.1 34 3.7 45.1 40.3 42.7 9.3 6.9 8.1 4.5 4.4 4.4 37 - - 132.18 Democratic Republic of the Congo
Denmark 44.6 103.0 7.4 5.1 96 16.3 - - - - - - - - - - 97 93 - Denmark
Djibouti 2.2 5.4 0.2 2.3 37 3.1 33.7 33.3 33.5 22.8 20.4 21.6 7.8 8.5 8.1 - - - 20.46 Djibouti
Dominica 10.8 59.0 0.7 - 70 8.0 - - - - - - - - - - - - 2.71 Dominica
Dominican Republic 15.6 3.1 2.1 - 48 16.0 8.1 6.1 7.1 2.8 2.0 2.4 7.9 7.3 7.6 16 - - 35.99 Dominican Republic
PA
RT
4
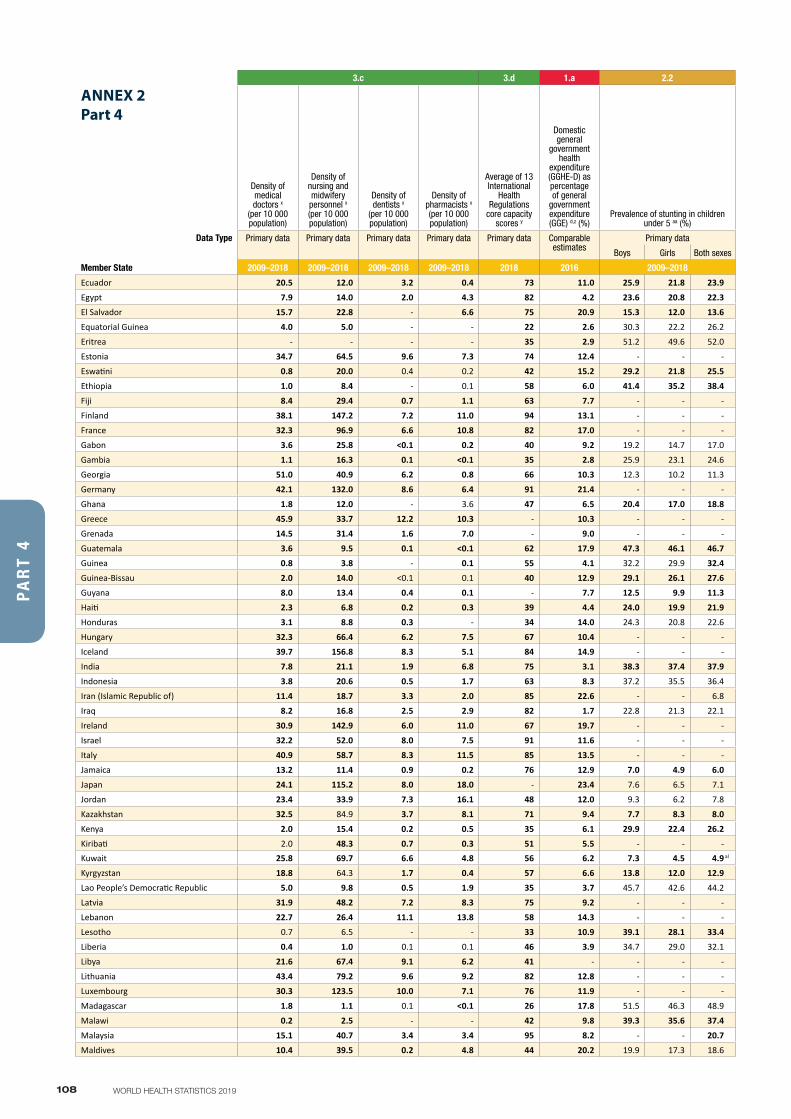
108 WORLD HEALTH STATISTICS 2019
3.c 3.d 1.a 2.2 2.2 5.2 6.1 6.2 6.a
ANNEX 2Part 4
Density of medical doctors x
(per 10 000 population)
Density of nursing and midwifery personnel x (per 10 000 population)
Density of dentists x
(per 10 000 population)
Density of pharmacists x (per 10 000 population)
Average of 13 International
Health Regulations
core capacity scores y
Domestic general
government health
expenditure (GGHE-D) as percentage of general
government expenditure (GGE) d,z (%)
Prevalence of stunting in children under 5 aa (%)
Prevalence of wasting in children under 5 aa (%)
Prevalence of overweight in children under 5 aa (%)
Proportion of ever-partnered
women and girls aged
15 years and older subjected
to physical, sexual or
psychological violence by a current or
former intimate partner in the previous 12
months ab (%)
Proportion of population
using safely managed
drinking-water services ac (%)
Proportion of population
using safely managed sanitation
services ac (%)
Amount of water- and sanitation-
related official development assistance
that is part of a
government-coordinated
spending plan ad
(constant 2016 US$ millions)
Data Type Primary data Primary data Primary data Primary data Primary data Comparable estimates
Primary data Primary data Primary data Primary data Comparable estimates
Comparable estimates
Primary data
Boys Girls Both sexes Boys Girls Both sexes Boys Girls Both sexes
Member State 2009–2018 2009–2018 2009–2018 2009–2018 2018 2016 2009–2018 2009–2018 2009–2018 2009–2017 2015 2015 2017 Member State
Ecuador 20.5 12.0 3.2 0.4 73 11.0 25.9 21.8 23.9 1.8 1.4 1.6 8.4 7.6 8.0 11 ah 74 42 46.00 Ecuador
Egypt 7.9 14.0 2.0 4.3 82 4.2 23.6 20.8 22.3 9.4 9.5 9.5 16.3 15.0 15.7 14 - 61 144.62 Egypt
El Salvador 15.7 22.8 - 6.6 75 20.9 15.3 12.0 13.6 2.6 1.7 2.1 6.2 6.6 6.4 7 ah - - 12.71 El Salvador
Equatorial Guinea 4.0 5.0 - - 22 2.6 30.3 22.2 26.2 2.7 3.6 3.1 11.6 7.9 9.7 44 - - - Equatorial Guinea
Eritrea - - - - 35 2.9 51.2 49.6 52.0 16.6 14.1 15.3 1.6 2.1 2.0 - - - 0.65 Eritrea
Estonia 34.7 64.5 9.6 7.3 74 12.4 - - - - - - - - - - 82 93 - Estonia
Eswatini 0.8 20.0 0.4 0.2 42 15.2 29.2 21.8 25.5 2.3 1.7 2.0 9.0 8.9 9.0 - - - 5.02 Swaziland
Ethiopia 1.0 8.4 - 0.1 58 6.0 41.4 35.2 38.4 10.2 9.8 10.0 3.1 2.8 2.9 20 11 - 214.62 Ethiopia
Fiji 8.4 29.4 0.7 1.1 63 7.7 - - - - - - - - - - - - 2.63 Fiji
Finland 38.1 147.2 7.2 11.0 94 13.1 - - - - - - - - - - 97 92 - Finland
France 32.3 96.9 6.6 10.8 82 17.0 - - - - - - - - - - 93 92 - France
Gabon 3.6 25.8 <0.1 0.2 40 9.2 19.2 14.7 17.0 3.7 3.2 3.4 9.2 6.2 7.7 32 - - 3.85 Gabon
Gambia 1.1 16.3 0.1 <0.1 35 2.8 25.9 23.1 24.6 12.1 9.9 11.0 3.0 3.3 3.2 7 - - 1.67 Gambia
Georgia 51.0 40.9 6.2 0.8 66 10.3 12.3 10.2 11.3 1.8 1.5 1.6 21.3 18.3 19.9 - 73 - 66.69 Georgia
Germany 42.1 132.0 8.6 6.4 91 21.4 - - - - - - - - - - 99 95 - Germany
Ghana 1.8 12.0 - 3.6 47 6.5 20.4 17.0 18.8 4.3 5.1 4.7 3.6 1.6 2.6 - 27 - 71.56 Ghana
Greece 45.9 33.7 12.2 10.3 - 10.3 - - - - - - - - - - 99 75 - Greece
Grenada 14.5 31.4 1.6 7.0 - 9.0 - - - - - - - - - - - - 3.61 Grenada
Guatemala 3.6 9.5 0.1 <0.1 62 17.9 47.3 46.1 46.7 1.0 0.4 0.8 5.1 4.8 4.9 9 61 - 14.61 Guatemala
Guinea 0.8 3.8 - 0.1 55 4.1 32.2 29.9 32.4 10.4 9.5 8.1 4.5 3.0 4.0 - - - 19.38 Guinea
Guinea-Bissau 2.0 14.0 <0.1 0.1 40 12.9 29.1 26.1 27.6 6.3 5.6 6.0 2.7 1.9 2.3 - - - 4.64 Guinea-Bissau
Guyana 8.0 13.4 0.4 0.1 - 7.7 12.5 9.9 11.3 6.7 6.2 6.4 5.7 4.8 5.3 - - - 14.21 Guyana
Haiti 2.3 6.8 0.2 0.3 39 4.4 24.0 19.9 21.9 4.2 3.3 3.7 4.0 2.8 3.4 14 - - 34.34 Haiti
Honduras 3.1 8.8 0.3 - 34 14.0 24.3 20.8 22.6 1.8 0.9 1.4 5.5 4.8 5.2 11 - - 10.21 Honduras
Hungary 32.3 66.4 6.2 7.5 67 10.4 - - - - - - - - - - 82 76 - Hungary
Iceland 39.7 156.8 8.3 5.1 84 14.9 - - - - - - - - - - 98 69 - Iceland
India 7.8 21.1 1.9 6.8 75 3.1 38.3 37.4 37.9 21.7 19.8 20.8 2.4 2.4 2.4 22 - - 663.51 India
Indonesia 3.8 20.6 0.5 1.7 63 8.3 37.2 35.5 36.4 14.2 12.7 13.5 11.8 11.3 11.5 - - - 121.90 Indonesia
Iran (Islamic Republic of) 11.4 18.7 3.3 2.0 85 22.6 - - 6.8 - - 4.0 - - - - 91 - 1.17 Iran (Islamic Republic of)
Iraq 8.2 16.8 2.5 2.9 82 1.7 22.8 21.3 22.1 6.6 6.4 6.5 11.8 10.8 11.4 - - 32 208.66 Iraq
Ireland 30.9 142.9 6.0 11.0 67 19.7 - - - - - - - - - - 99 70 - Ireland
Israel 32.2 52.0 8.0 7.5 91 11.6 - - - - - - - - - - 99 93 - Israel
Italy 40.9 58.7 8.3 11.5 85 13.5 - - - - - - - - - - 94 95 - Italy
Jamaica 13.2 11.4 0.9 0.2 76 12.9 7.0 4.9 6.0 3.5 3.7 3.6 7.7 9.0 8.3 9 ah - - 0.55 Jamaica
Japan 24.1 115.2 8.0 18.0 - 23.4 7.6 6.5 7.1 2.9 1.7 2.3 1.9 1.1 1.5 - 97 100 - Japan
Jordan 23.4 33.9 7.3 16.1 48 12.0 9.3 6.2 7.8 2.4 2.4 2.4 5.6 3.8 4.7 14 93 77 508.32 Jordan
Kazakhstan 32.5 84.9 3.7 8.1 71 9.4 7.7 8.3 8.0 2.9 3.3 3.1 8.7 10.0 9.3 - - - 0.71 Kazakhstan
Kenya 2.0 15.4 0.2 0.5 35 6.1 29.9 22.4 26.2 4.5 3.9 4.2 4.7 3.5 4.1 26 - - 213.78 Kenya
Kiribati 2.0 48.3 0.7 0.3 51 5.5 - - - - - - - - - - - - 9.83 KiribatiKuwait 25.8 69.7 6.6 4.8 56 6.2 7.3 4.5 4.9 al 2.8 2.0 3.1 al 8.9 8.6 6.0 al - 100 100 - Kuwait
Kyrgyzstan 18.8 64.3 1.7 0.4 57 6.6 13.8 12.0 12.9 2.8 2.9 2.8 7.8 6.1 7.0 17 66 - 11.65 Kyrgyzstan
Lao People’s Democratic Republic 5.0 9.8 0.5 1.9 35 3.7 45.7 42.6 44.2 6.9 5.8 6.4 1.9 2.1 2.0 6 ah - - 64.60 Lao People’s Democratic Republic
Latvia 31.9 48.2 7.2 8.3 75 9.2 - - - - - - - - - - 82 78 - Latvia
Lebanon 22.7 26.4 11.1 13.8 58 14.3 - - - - - - - - - - 48 20 97.58 Lebanon
Lesotho 0.7 6.5 - - 33 10.9 39.1 28.1 33.4 2.6 3.1 2.8 8.1 6.9 7.5 - - - 10.91 Lesotho
Liberia 0.4 1.0 0.1 0.1 46 3.9 34.7 29.0 32.1 5.9 5.3 5.6 3.1 3.3 3.2 - - - 80.19 Liberia
Libya 21.6 67.4 9.1 6.2 41 - - - - - - - - - - - - 26 2.21 Libya
Lithuania 43.4 79.2 9.6 9.2 82 12.8 - - - - - - - - - - 92 61 - Lithuania
Luxembourg 30.3 123.5 10.0 7.1 76 11.9 - - - - - - - - - - 98 94 - Luxembourg
Madagascar 1.8 1.1 0.1 <0.1 26 17.8 51.5 46.3 48.9 9.8 6.0 7.9 1.0 1.1 1.1 - - - 26.77 Madagascar
Malawi 0.2 2.5 - - 42 9.8 39.3 35.6 37.4 3.4 2.2 2.8 5.9 3.3 4.6 24 - - 107.74 Malawi
Malaysia 15.1 40.7 3.4 3.4 95 8.2 - - 20.7 - - 11.5 - - 6.0 - 92 82 1.77 Malaysia
Maldives 10.4 39.5 0.2 4.8 44 20.2 19.9 17.3 18.6 10.9 10.7 10.8 6.2 6.0 6.1 - - - 3.19 Maldives
PA
RT
4
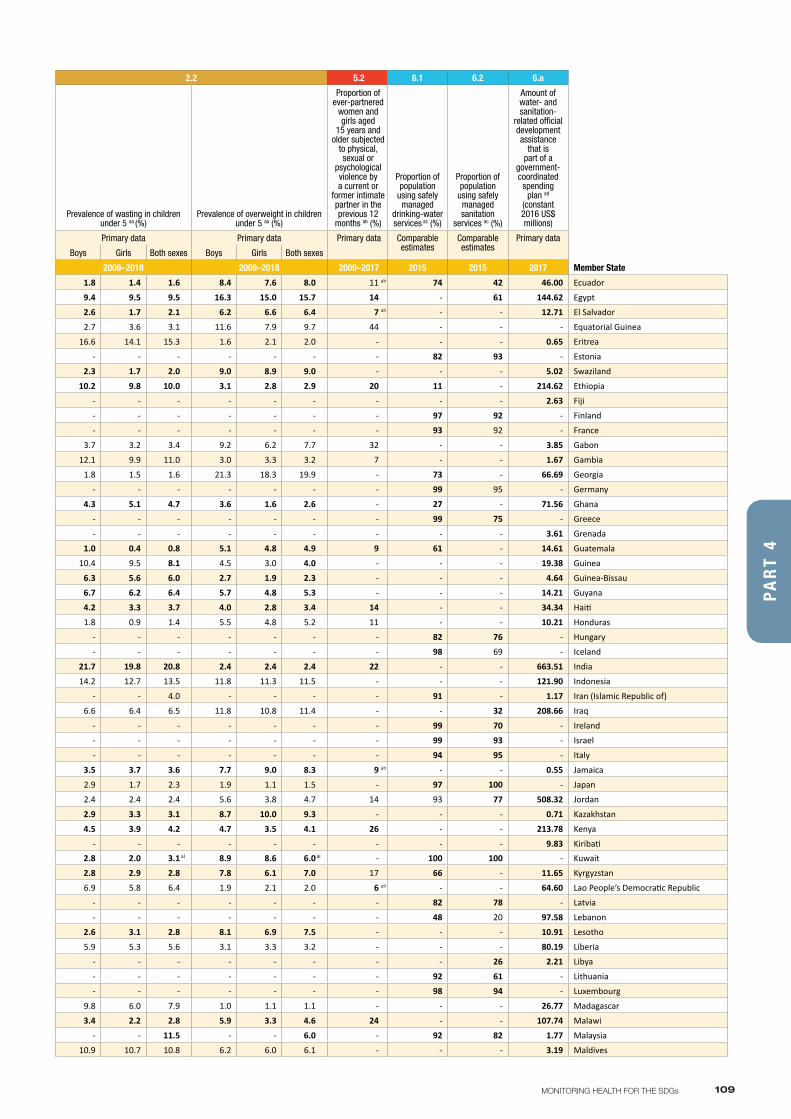
109MONITORING HEALTH FOR THE SDGs
3.c 3.d 1.a 2.2 2.2 5.2 6.1 6.2 6.a
ANNEX 2Part 4
Density of medical doctors x
(per 10 000 population)
Density of nursing and midwifery personnel x (per 10 000 population)
Density of dentists x
(per 10 000 population)
Density of pharmacists x (per 10 000 population)
Average of 13 International
Health Regulations
core capacity scores y
Domestic general
government health
expenditure (GGHE-D) as percentage of general
government expenditure (GGE) d,z (%)
Prevalence of stunting in children under 5 aa (%)
Prevalence of wasting in children under 5 aa (%)
Prevalence of overweight in children under 5 aa (%)
Proportion of ever-partnered
women and girls aged
15 years and older subjected
to physical, sexual or
psychological violence by a current or
former intimate partner in the previous 12
months ab (%)
Proportion of population
using safely managed
drinking-water services ac (%)
Proportion of population
using safely managed sanitation
services ac (%)
Amount of water- and sanitation-
related official development assistance
that is part of a
government-coordinated
spending plan ad
(constant 2016 US$ millions)
Data Type Primary data Primary data Primary data Primary data Primary data Comparable estimates
Primary data Primary data Primary data Primary data Comparable estimates
Comparable estimates
Primary data
Boys Girls Both sexes Boys Girls Both sexes Boys Girls Both sexes
Member State 2009–2018 2009–2018 2009–2018 2009–2018 2018 2016 2009–2018 2009–2018 2009–2018 2009–2017 2015 2015 2017 Member State
Ecuador 20.5 12.0 3.2 0.4 73 11.0 25.9 21.8 23.9 1.8 1.4 1.6 8.4 7.6 8.0 11 ah 74 42 46.00 Ecuador
Egypt 7.9 14.0 2.0 4.3 82 4.2 23.6 20.8 22.3 9.4 9.5 9.5 16.3 15.0 15.7 14 - 61 144.62 Egypt
El Salvador 15.7 22.8 - 6.6 75 20.9 15.3 12.0 13.6 2.6 1.7 2.1 6.2 6.6 6.4 7 ah - - 12.71 El Salvador
Equatorial Guinea 4.0 5.0 - - 22 2.6 30.3 22.2 26.2 2.7 3.6 3.1 11.6 7.9 9.7 44 - - - Equatorial Guinea
Eritrea - - - - 35 2.9 51.2 49.6 52.0 16.6 14.1 15.3 1.6 2.1 2.0 - - - 0.65 Eritrea
Estonia 34.7 64.5 9.6 7.3 74 12.4 - - - - - - - - - - 82 93 - Estonia
Eswatini 0.8 20.0 0.4 0.2 42 15.2 29.2 21.8 25.5 2.3 1.7 2.0 9.0 8.9 9.0 - - - 5.02 Swaziland
Ethiopia 1.0 8.4 - 0.1 58 6.0 41.4 35.2 38.4 10.2 9.8 10.0 3.1 2.8 2.9 20 11 - 214.62 Ethiopia
Fiji 8.4 29.4 0.7 1.1 63 7.7 - - - - - - - - - - - - 2.63 Fiji
Finland 38.1 147.2 7.2 11.0 94 13.1 - - - - - - - - - - 97 92 - Finland
France 32.3 96.9 6.6 10.8 82 17.0 - - - - - - - - - - 93 92 - France
Gabon 3.6 25.8 <0.1 0.2 40 9.2 19.2 14.7 17.0 3.7 3.2 3.4 9.2 6.2 7.7 32 - - 3.85 Gabon
Gambia 1.1 16.3 0.1 <0.1 35 2.8 25.9 23.1 24.6 12.1 9.9 11.0 3.0 3.3 3.2 7 - - 1.67 Gambia
Georgia 51.0 40.9 6.2 0.8 66 10.3 12.3 10.2 11.3 1.8 1.5 1.6 21.3 18.3 19.9 - 73 - 66.69 Georgia
Germany 42.1 132.0 8.6 6.4 91 21.4 - - - - - - - - - - 99 95 - Germany
Ghana 1.8 12.0 - 3.6 47 6.5 20.4 17.0 18.8 4.3 5.1 4.7 3.6 1.6 2.6 - 27 - 71.56 Ghana
Greece 45.9 33.7 12.2 10.3 - 10.3 - - - - - - - - - - 99 75 - Greece
Grenada 14.5 31.4 1.6 7.0 - 9.0 - - - - - - - - - - - - 3.61 Grenada
Guatemala 3.6 9.5 0.1 <0.1 62 17.9 47.3 46.1 46.7 1.0 0.4 0.8 5.1 4.8 4.9 9 61 - 14.61 Guatemala
Guinea 0.8 3.8 - 0.1 55 4.1 32.2 29.9 32.4 10.4 9.5 8.1 4.5 3.0 4.0 - - - 19.38 Guinea
Guinea-Bissau 2.0 14.0 <0.1 0.1 40 12.9 29.1 26.1 27.6 6.3 5.6 6.0 2.7 1.9 2.3 - - - 4.64 Guinea-Bissau
Guyana 8.0 13.4 0.4 0.1 - 7.7 12.5 9.9 11.3 6.7 6.2 6.4 5.7 4.8 5.3 - - - 14.21 Guyana
Haiti 2.3 6.8 0.2 0.3 39 4.4 24.0 19.9 21.9 4.2 3.3 3.7 4.0 2.8 3.4 14 - - 34.34 Haiti
Honduras 3.1 8.8 0.3 - 34 14.0 24.3 20.8 22.6 1.8 0.9 1.4 5.5 4.8 5.2 11 - - 10.21 Honduras
Hungary 32.3 66.4 6.2 7.5 67 10.4 - - - - - - - - - - 82 76 - Hungary
Iceland 39.7 156.8 8.3 5.1 84 14.9 - - - - - - - - - - 98 69 - Iceland
India 7.8 21.1 1.9 6.8 75 3.1 38.3 37.4 37.9 21.7 19.8 20.8 2.4 2.4 2.4 22 - - 663.51 India
Indonesia 3.8 20.6 0.5 1.7 63 8.3 37.2 35.5 36.4 14.2 12.7 13.5 11.8 11.3 11.5 - - - 121.90 Indonesia
Iran (Islamic Republic of) 11.4 18.7 3.3 2.0 85 22.6 - - 6.8 - - 4.0 - - - - 91 - 1.17 Iran (Islamic Republic of)
Iraq 8.2 16.8 2.5 2.9 82 1.7 22.8 21.3 22.1 6.6 6.4 6.5 11.8 10.8 11.4 - - 32 208.66 Iraq
Ireland 30.9 142.9 6.0 11.0 67 19.7 - - - - - - - - - - 99 70 - Ireland
Israel 32.2 52.0 8.0 7.5 91 11.6 - - - - - - - - - - 99 93 - Israel
Italy 40.9 58.7 8.3 11.5 85 13.5 - - - - - - - - - - 94 95 - Italy
Jamaica 13.2 11.4 0.9 0.2 76 12.9 7.0 4.9 6.0 3.5 3.7 3.6 7.7 9.0 8.3 9 ah - - 0.55 Jamaica
Japan 24.1 115.2 8.0 18.0 - 23.4 7.6 6.5 7.1 2.9 1.7 2.3 1.9 1.1 1.5 - 97 100 - Japan
Jordan 23.4 33.9 7.3 16.1 48 12.0 9.3 6.2 7.8 2.4 2.4 2.4 5.6 3.8 4.7 14 93 77 508.32 Jordan
Kazakhstan 32.5 84.9 3.7 8.1 71 9.4 7.7 8.3 8.0 2.9 3.3 3.1 8.7 10.0 9.3 - - - 0.71 Kazakhstan
Kenya 2.0 15.4 0.2 0.5 35 6.1 29.9 22.4 26.2 4.5 3.9 4.2 4.7 3.5 4.1 26 - - 213.78 Kenya
Kiribati 2.0 48.3 0.7 0.3 51 5.5 - - - - - - - - - - - - 9.83 KiribatiKuwait 25.8 69.7 6.6 4.8 56 6.2 7.3 4.5 4.9 al 2.8 2.0 3.1 al 8.9 8.6 6.0 al - 100 100 - Kuwait
Kyrgyzstan 18.8 64.3 1.7 0.4 57 6.6 13.8 12.0 12.9 2.8 2.9 2.8 7.8 6.1 7.0 17 66 - 11.65 Kyrgyzstan
Lao People’s Democratic Republic 5.0 9.8 0.5 1.9 35 3.7 45.7 42.6 44.2 6.9 5.8 6.4 1.9 2.1 2.0 6 ah - - 64.60 Lao People’s Democratic Republic
Latvia 31.9 48.2 7.2 8.3 75 9.2 - - - - - - - - - - 82 78 - Latvia
Lebanon 22.7 26.4 11.1 13.8 58 14.3 - - - - - - - - - - 48 20 97.58 Lebanon
Lesotho 0.7 6.5 - - 33 10.9 39.1 28.1 33.4 2.6 3.1 2.8 8.1 6.9 7.5 - - - 10.91 Lesotho
Liberia 0.4 1.0 0.1 0.1 46 3.9 34.7 29.0 32.1 5.9 5.3 5.6 3.1 3.3 3.2 - - - 80.19 Liberia
Libya 21.6 67.4 9.1 6.2 41 - - - - - - - - - - - - 26 2.21 Libya
Lithuania 43.4 79.2 9.6 9.2 82 12.8 - - - - - - - - - - 92 61 - Lithuania
Luxembourg 30.3 123.5 10.0 7.1 76 11.9 - - - - - - - - - - 98 94 - Luxembourg
Madagascar 1.8 1.1 0.1 <0.1 26 17.8 51.5 46.3 48.9 9.8 6.0 7.9 1.0 1.1 1.1 - - - 26.77 Madagascar
Malawi 0.2 2.5 - - 42 9.8 39.3 35.6 37.4 3.4 2.2 2.8 5.9 3.3 4.6 24 - - 107.74 Malawi
Malaysia 15.1 40.7 3.4 3.4 95 8.2 - - 20.7 - - 11.5 - - 6.0 - 92 82 1.77 Malaysia
Maldives 10.4 39.5 0.2 4.8 44 20.2 19.9 17.3 18.6 10.9 10.7 10.8 6.2 6.0 6.1 - - - 3.19 Maldives
PA
RT
4
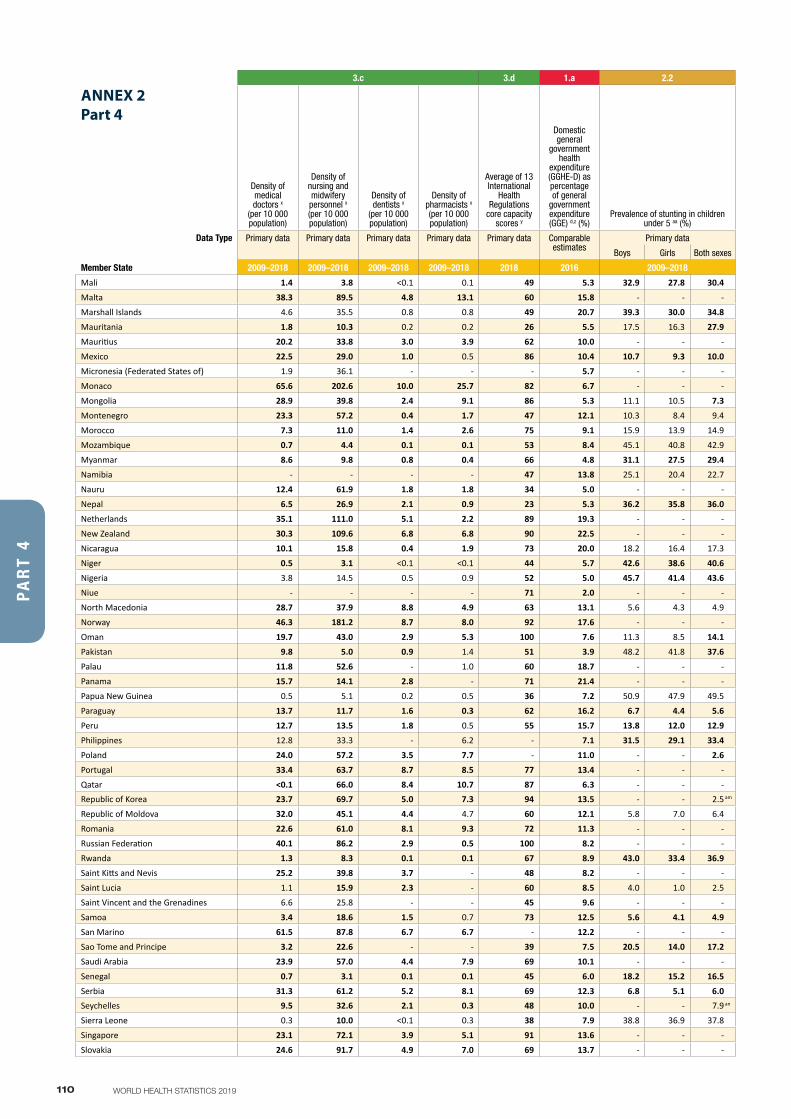
110 WORLD HEALTH STATISTICS 2019
3.c 3.d 1.a 2.2 2.2 5.2 6.1 6.2 6.a
ANNEX 2Part 4
Density of medical doctors x
(per 10 000 population)
Density of nursing and midwifery personnel x (per 10 000 population)
Density of dentists x
(per 10 000 population)
Density of pharmacists x (per 10 000 population)
Average of 13 International
Health Regulations
core capacity scores y
Domestic general
government health
expenditure (GGHE-D) as percentage of general
government expenditure (GGE) d,z (%)
Prevalence of stunting in children under 5 aa (%)
Prevalence of wasting in children under 5 aa (%)
Prevalence of overweight in children under 5 aa (%)
Proportion of ever-partnered
women and girls aged
15 years and older subjected
to physical, sexual or
psychological violence by a current or
former intimate partner in the previous 12
months ab (%)
Proportion of population
using safely managed
drinking-water services ac (%)
Proportion of population
using safely managed sanitation
services ac (%)
Amount of water- and sanitation-
related official development assistance
that is part of a
government-coordinated
spending plan ad
(constant 2016 US$ millions)
Data Type Primary data Primary data Primary data Primary data Primary data Comparable estimates
Primary data Primary data Primary data Primary data Comparable estimates
Comparable estimates
Primary data
Boys Girls Both sexes Boys Girls Both sexes Boys Girls Both sexes
Member State 2009–2018 2009–2018 2009–2018 2009–2018 2018 2016 2009–2018 2009–2018 2009–2018 2009–2017 2015 2015 2017 Member State
Mali 1.4 3.8 <0.1 0.1 49 5.3 32.9 27.8 30.4 15.0 11.9 13.5 1.9 1.9 1.9 - - - 135.66 Mali
Malta 38.3 89.5 4.8 13.1 60 15.8 - - - - - - - - - - 100 93 - Malta
Marshall Islands 4.6 35.5 0.8 0.8 49 20.7 39.3 30.0 34.8 4.6 2.4 3.5 4.9 3.2 4.1 20 ah - - 1.94 Marshall Islands
Mauritania 1.8 10.3 0.2 0.2 26 5.5 17.5 16.3 27.9 13.1 10.0 14.8 1.1 1.2 1.3 - - - 56.55 Mauritania
Mauritius 20.2 33.8 3.0 3.9 62 10.0 - - - - - - - - - - - - 0.15 Mauritius
Mexico 22.5 29.0 1.0 0.5 86 10.4 10.7 9.3 10.0 2.6 1.4 2.0 19.0 22.4 5.3 10 ah 43 45 12.73 Mexico
Micronesia (Federated States of) 1.9 36.1 - - - 5.7 - - - - - - - - - 26 ah - - 1.19 Micronesia (Federated States of)
Monaco 65.6 202.6 10.0 25.7 82 6.7 - - - - - - - - - - 100 100 - Monaco
Mongolia 28.9 39.8 2.4 9.1 86 5.3 11.1 10.5 7.3 1.2 0.8 1.3 10.9 10.0 11.7 15 ah - - 10.60 Mongolia
Montenegro 23.3 57.2 0.4 1.7 47 12.1 10.3 8.4 9.4 3.1 2.4 2.8 24.7 19.6 22.3 - 90 - 9.60 Montenegro
Morocco 7.3 11.0 1.4 2.6 75 9.1 15.9 13.9 14.9 2.8 1.8 2.3 12.6 8.9 10.8 - 69 38 156.28 Morocco
Mozambique 0.7 4.4 0.1 0.1 53 8.4 45.1 40.8 42.9 6.7 5.6 6.1 8.1 7.6 7.8 - - - 113.58 Mozambique
Myanmar 8.6 9.8 0.8 0.4 66 4.8 31.1 27.5 29.4 7.0 6.2 6.6 1.9 1.1 1.5 11 - - 75.91 Myanmar
Namibia - - - - 47 13.8 25.1 20.4 22.7 9.0 5.3 7.1 3.8 4.2 4.0 20 - - 5.26 Namibia
Nauru 12.4 61.9 1.8 1.8 34 5.0 - - - - - - - - - - - - 0.11 Nauru
Nepal 6.5 26.9 2.1 0.9 23 5.3 36.2 35.8 36.0 9.4 9.9 9.6 1.3 1.0 1.2 11 27 - 172.21 Nepal
Netherlands 35.1 111.0 5.1 2.2 89 19.3 - - - - - - - - - - 100 97 - Netherlands
New Zealand 30.3 109.6 6.8 6.8 90 22.5 - - - - - - - - - - 100 76 - New Zealand
Nicaragua 10.1 15.8 0.4 1.9 73 20.0 18.2 16.4 17.3 2.2 2.1 2.2 8.6 7.9 8.3 8 ah 59 - 29.76 Nicaragua
Niger 0.5 3.1 <0.1 <0.1 44 5.7 42.6 38.6 40.6 12.3 8.0 10.1 1.2 1.0 1.1 - - 9 80.66 Niger
Nigeria 3.8 14.5 0.5 0.9 52 5.0 45.7 41.4 43.6 11.9 9.6 10.8 1.7 1.3 1.5 11 19 - 152.34 Nigeria
Niue - - - - 71 2.0 - - - - - - - - - - 97 - 0.03 Niue
North Macedonia 28.7 37.9 8.8 4.9 63 13.1 5.6 4.3 4.9 2.2 1.4 1.8 13.4 11.4 12.4 - 83 - 16.26 North Macedonia
Norway 46.3 181.2 8.7 8.0 92 17.6 - - - - - - - - - - 95 78 - Norway
Oman 19.7 43.0 2.9 5.3 100 7.6 11.3 8.5 14.1 8.1 6.0 7.5 1.5 2.0 4.4 - 89 - - Oman
Pakistan 9.8 5.0 0.9 1.4 51 3.9 48.2 41.8 37.6 11.1 9.8 7.1 4.7 4.8 2.5 - 36 - 259.76 Pakistan
Palau 11.8 52.6 - 1.0 60 18.7 - - - - - - - - - 10 ah - 20 5.39 Palau
Panama 15.7 14.1 2.8 - 71 21.4 - - - - - - - - - 10 ah - - 4.70 Panama
Papua New Guinea 0.5 5.1 0.2 0.5 36 7.2 50.9 47.9 49.5 14.4 13.7 14.1 14.3 13.0 13.7 - - - 28.53 Papua New Guinea
Paraguay 13.7 11.7 1.6 0.3 62 16.2 6.7 4.4 5.6 1.0 0.9 1.0 13.0 11.9 12.4 - - - 8.51 Paraguay
Peru 12.7 13.5 1.8 0.5 55 15.7 13.8 12.0 12.9 0.7 0.4 0.5 9.0 7.1 8.0 11 50 30 57.59 Peru
Philippines 12.8 33.3 - 6.2 - 7.1 31.5 29.1 33.4 8.2 7.5 7.1 5.4 4.6 3.9 6 - - 71.91 Philippines
Poland 24.0 57.2 3.5 7.7 - 11.0 - - 2.6 - - - - - - - 94 77 - Poland
Portugal 33.4 63.7 8.7 8.5 77 13.4 - - - - - - - - - - 95 62 - Portugal
Qatar <0.1 66.0 8.4 10.7 87 6.3 - - - - - - - - - - - 88 - QatarRepublic of Korea 23.7 69.7 5.0 7.3 94 13.5 - - 2.5 am - - 1.2 am - - 7.3 am - 98 98 - Republic of Korea
Republic of Moldova 32.0 45.1 4.4 4.7 60 12.1 5.8 7.0 6.4 2.1 1.8 1.9 6.0 3.7 4.9 - 70 - 18.36 Republic of Moldova
Romania 22.6 61.0 8.1 9.3 72 11.3 - - - - - - - - - - 82 57 - Romania
Russian Federation 40.1 86.2 2.9 0.5 100 8.2 - - - - - - - - - - 76 - - Russian Federation
Rwanda 1.3 8.3 0.1 0.1 67 8.9 43.0 33.4 36.9 2.5 2.1 2.0 8.5 7.4 5.6 21 - - 57.13 Rwanda
Saint Kitts and Nevis 25.2 39.8 3.7 - 48 8.2 - - - - - - - - - - - - - Saint Kitts and Nevis
Saint Lucia 1.1 15.9 2.3 - 60 8.5 4.0 1.0 2.5 4.1 3.4 3.7 8.9 3.8 6.3 - - - 2.74 Saint Lucia
Saint Vincent and the Grenadines 6.6 25.8 - - 45 9.6 - - - - - - - - - - - - 0.03 Saint Vincent and the Grenadines
Samoa 3.4 18.6 1.5 0.7 73 12.5 5.6 4.1 4.9 3.0 4.9 3.9 6.2 4.3 5.3 - - - 14.17 Samoa
San Marino 61.5 87.8 6.7 6.7 - 12.2 - - - - - - - - - - 100 78 - San Marino
Sao Tome and Principe 3.2 22.6 - - 39 7.5 20.5 14.0 17.2 4.7 3.3 4.0 2.6 2.2 2.4 26 - - 7.83 Sao Tome and Principe
Saudi Arabia 23.9 57.0 4.4 7.9 69 10.1 - - - - - - - - - - - 84 - Saudi Arabia
Senegal 0.7 3.1 0.1 0.1 45 6.0 18.2 15.2 16.5 9.8 8.2 9.0 0.7 1.1 0.9 12 - 24 71.02 Senegal
Serbia 31.3 61.2 5.2 8.1 69 12.3 6.8 5.1 6.0 4.2 3.6 3.9 15.6 12.0 13.9 - 88 24 42.24 SerbiaSeychelles 9.5 32.6 2.1 0.3 48 10.0 - - 7.9 an - - 4.3 an - - 10.2 an - - - 0.18 Seychelles
Sierra Leone 0.3 10.0 <0.1 0.3 38 7.9 38.8 36.9 37.8 10.8 8.2 9.5 8.6 8.9 8.8 29 - - 39.87 Sierra Leone
Singapore 23.1 72.1 3.9 5.1 91 13.6 - - - - - - - - - - 100 100 - Singapore
Slovakia 24.6 91.7 4.9 7.0 69 13.7 - - - - - - - - - - 93 82 - Slovakia
PA
RT
4
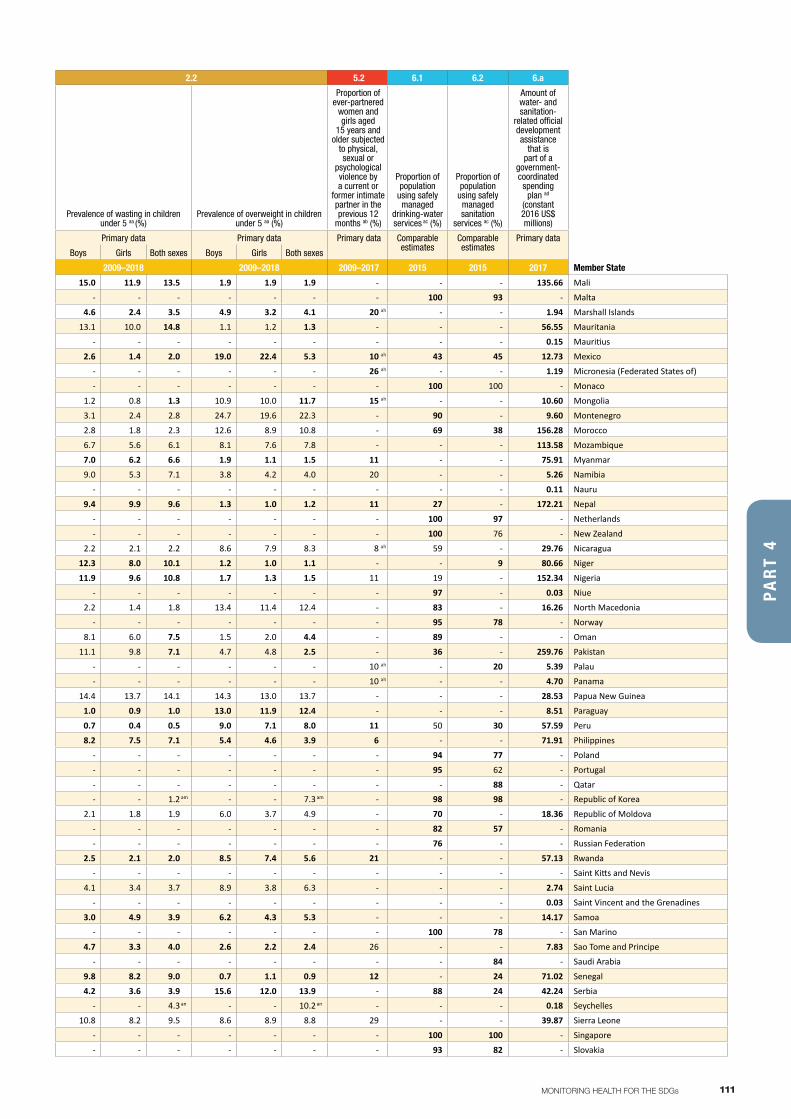
111MONITORING HEALTH FOR THE SDGs
3.c 3.d 1.a 2.2 2.2 5.2 6.1 6.2 6.a
ANNEX 2Part 4
Density of medical doctors x
(per 10 000 population)
Density of nursing and midwifery personnel x (per 10 000 population)
Density of dentists x
(per 10 000 population)
Density of pharmacists x (per 10 000 population)
Average of 13 International
Health Regulations
core capacity scores y
Domestic general
government health
expenditure (GGHE-D) as percentage of general
government expenditure (GGE) d,z (%)
Prevalence of stunting in children under 5 aa (%)
Prevalence of wasting in children under 5 aa (%)
Prevalence of overweight in children under 5 aa (%)
Proportion of ever-partnered
women and girls aged
15 years and older subjected
to physical, sexual or
psychological violence by a current or
former intimate partner in the previous 12
months ab (%)
Proportion of population
using safely managed
drinking-water services ac (%)
Proportion of population
using safely managed sanitation
services ac (%)
Amount of water- and sanitation-
related official development assistance
that is part of a
government-coordinated
spending plan ad
(constant 2016 US$ millions)
Data Type Primary data Primary data Primary data Primary data Primary data Comparable estimates
Primary data Primary data Primary data Primary data Comparable estimates
Comparable estimates
Primary data
Boys Girls Both sexes Boys Girls Both sexes Boys Girls Both sexes
Member State 2009–2018 2009–2018 2009–2018 2009–2018 2018 2016 2009–2018 2009–2018 2009–2018 2009–2017 2015 2015 2017 Member State
Mali 1.4 3.8 <0.1 0.1 49 5.3 32.9 27.8 30.4 15.0 11.9 13.5 1.9 1.9 1.9 - - - 135.66 Mali
Malta 38.3 89.5 4.8 13.1 60 15.8 - - - - - - - - - - 100 93 - Malta
Marshall Islands 4.6 35.5 0.8 0.8 49 20.7 39.3 30.0 34.8 4.6 2.4 3.5 4.9 3.2 4.1 20 ah - - 1.94 Marshall Islands
Mauritania 1.8 10.3 0.2 0.2 26 5.5 17.5 16.3 27.9 13.1 10.0 14.8 1.1 1.2 1.3 - - - 56.55 Mauritania
Mauritius 20.2 33.8 3.0 3.9 62 10.0 - - - - - - - - - - - - 0.15 Mauritius
Mexico 22.5 29.0 1.0 0.5 86 10.4 10.7 9.3 10.0 2.6 1.4 2.0 19.0 22.4 5.3 10 ah 43 45 12.73 Mexico
Micronesia (Federated States of) 1.9 36.1 - - - 5.7 - - - - - - - - - 26 ah - - 1.19 Micronesia (Federated States of)
Monaco 65.6 202.6 10.0 25.7 82 6.7 - - - - - - - - - - 100 100 - Monaco
Mongolia 28.9 39.8 2.4 9.1 86 5.3 11.1 10.5 7.3 1.2 0.8 1.3 10.9 10.0 11.7 15 ah - - 10.60 Mongolia
Montenegro 23.3 57.2 0.4 1.7 47 12.1 10.3 8.4 9.4 3.1 2.4 2.8 24.7 19.6 22.3 - 90 - 9.60 Montenegro
Morocco 7.3 11.0 1.4 2.6 75 9.1 15.9 13.9 14.9 2.8 1.8 2.3 12.6 8.9 10.8 - 69 38 156.28 Morocco
Mozambique 0.7 4.4 0.1 0.1 53 8.4 45.1 40.8 42.9 6.7 5.6 6.1 8.1 7.6 7.8 - - - 113.58 Mozambique
Myanmar 8.6 9.8 0.8 0.4 66 4.8 31.1 27.5 29.4 7.0 6.2 6.6 1.9 1.1 1.5 11 - - 75.91 Myanmar
Namibia - - - - 47 13.8 25.1 20.4 22.7 9.0 5.3 7.1 3.8 4.2 4.0 20 - - 5.26 Namibia
Nauru 12.4 61.9 1.8 1.8 34 5.0 - - - - - - - - - - - - 0.11 Nauru
Nepal 6.5 26.9 2.1 0.9 23 5.3 36.2 35.8 36.0 9.4 9.9 9.6 1.3 1.0 1.2 11 27 - 172.21 Nepal
Netherlands 35.1 111.0 5.1 2.2 89 19.3 - - - - - - - - - - 100 97 - Netherlands
New Zealand 30.3 109.6 6.8 6.8 90 22.5 - - - - - - - - - - 100 76 - New Zealand
Nicaragua 10.1 15.8 0.4 1.9 73 20.0 18.2 16.4 17.3 2.2 2.1 2.2 8.6 7.9 8.3 8 ah 59 - 29.76 Nicaragua
Niger 0.5 3.1 <0.1 <0.1 44 5.7 42.6 38.6 40.6 12.3 8.0 10.1 1.2 1.0 1.1 - - 9 80.66 Niger
Nigeria 3.8 14.5 0.5 0.9 52 5.0 45.7 41.4 43.6 11.9 9.6 10.8 1.7 1.3 1.5 11 19 - 152.34 Nigeria
Niue - - - - 71 2.0 - - - - - - - - - - 97 - 0.03 Niue
North Macedonia 28.7 37.9 8.8 4.9 63 13.1 5.6 4.3 4.9 2.2 1.4 1.8 13.4 11.4 12.4 - 83 - 16.26 North Macedonia
Norway 46.3 181.2 8.7 8.0 92 17.6 - - - - - - - - - - 95 78 - Norway
Oman 19.7 43.0 2.9 5.3 100 7.6 11.3 8.5 14.1 8.1 6.0 7.5 1.5 2.0 4.4 - 89 - - Oman
Pakistan 9.8 5.0 0.9 1.4 51 3.9 48.2 41.8 37.6 11.1 9.8 7.1 4.7 4.8 2.5 - 36 - 259.76 Pakistan
Palau 11.8 52.6 - 1.0 60 18.7 - - - - - - - - - 10 ah - 20 5.39 Palau
Panama 15.7 14.1 2.8 - 71 21.4 - - - - - - - - - 10 ah - - 4.70 Panama
Papua New Guinea 0.5 5.1 0.2 0.5 36 7.2 50.9 47.9 49.5 14.4 13.7 14.1 14.3 13.0 13.7 - - - 28.53 Papua New Guinea
Paraguay 13.7 11.7 1.6 0.3 62 16.2 6.7 4.4 5.6 1.0 0.9 1.0 13.0 11.9 12.4 - - - 8.51 Paraguay
Peru 12.7 13.5 1.8 0.5 55 15.7 13.8 12.0 12.9 0.7 0.4 0.5 9.0 7.1 8.0 11 50 30 57.59 Peru
Philippines 12.8 33.3 - 6.2 - 7.1 31.5 29.1 33.4 8.2 7.5 7.1 5.4 4.6 3.9 6 - - 71.91 Philippines
Poland 24.0 57.2 3.5 7.7 - 11.0 - - 2.6 - - - - - - - 94 77 - Poland
Portugal 33.4 63.7 8.7 8.5 77 13.4 - - - - - - - - - - 95 62 - Portugal
Qatar <0.1 66.0 8.4 10.7 87 6.3 - - - - - - - - - - - 88 - QatarRepublic of Korea 23.7 69.7 5.0 7.3 94 13.5 - - 2.5 am - - 1.2 am - - 7.3 am - 98 98 - Republic of Korea
Republic of Moldova 32.0 45.1 4.4 4.7 60 12.1 5.8 7.0 6.4 2.1 1.8 1.9 6.0 3.7 4.9 - 70 - 18.36 Republic of Moldova
Romania 22.6 61.0 8.1 9.3 72 11.3 - - - - - - - - - - 82 57 - Romania
Russian Federation 40.1 86.2 2.9 0.5 100 8.2 - - - - - - - - - - 76 - - Russian Federation
Rwanda 1.3 8.3 0.1 0.1 67 8.9 43.0 33.4 36.9 2.5 2.1 2.0 8.5 7.4 5.6 21 - - 57.13 Rwanda
Saint Kitts and Nevis 25.2 39.8 3.7 - 48 8.2 - - - - - - - - - - - - - Saint Kitts and Nevis
Saint Lucia 1.1 15.9 2.3 - 60 8.5 4.0 1.0 2.5 4.1 3.4 3.7 8.9 3.8 6.3 - - - 2.74 Saint Lucia
Saint Vincent and the Grenadines 6.6 25.8 - - 45 9.6 - - - - - - - - - - - - 0.03 Saint Vincent and the Grenadines
Samoa 3.4 18.6 1.5 0.7 73 12.5 5.6 4.1 4.9 3.0 4.9 3.9 6.2 4.3 5.3 - - - 14.17 Samoa
San Marino 61.5 87.8 6.7 6.7 - 12.2 - - - - - - - - - - 100 78 - San Marino
Sao Tome and Principe 3.2 22.6 - - 39 7.5 20.5 14.0 17.2 4.7 3.3 4.0 2.6 2.2 2.4 26 - - 7.83 Sao Tome and Principe
Saudi Arabia 23.9 57.0 4.4 7.9 69 10.1 - - - - - - - - - - - 84 - Saudi Arabia
Senegal 0.7 3.1 0.1 0.1 45 6.0 18.2 15.2 16.5 9.8 8.2 9.0 0.7 1.1 0.9 12 - 24 71.02 Senegal
Serbia 31.3 61.2 5.2 8.1 69 12.3 6.8 5.1 6.0 4.2 3.6 3.9 15.6 12.0 13.9 - 88 24 42.24 SerbiaSeychelles 9.5 32.6 2.1 0.3 48 10.0 - - 7.9 an - - 4.3 an - - 10.2 an - - - 0.18 Seychelles
Sierra Leone 0.3 10.0 <0.1 0.3 38 7.9 38.8 36.9 37.8 10.8 8.2 9.5 8.6 8.9 8.8 29 - - 39.87 Sierra Leone
Singapore 23.1 72.1 3.9 5.1 91 13.6 - - - - - - - - - - 100 100 - Singapore
Slovakia 24.6 91.7 4.9 7.0 69 13.7 - - - - - - - - - - 93 82 - Slovakia
PA
RT
4
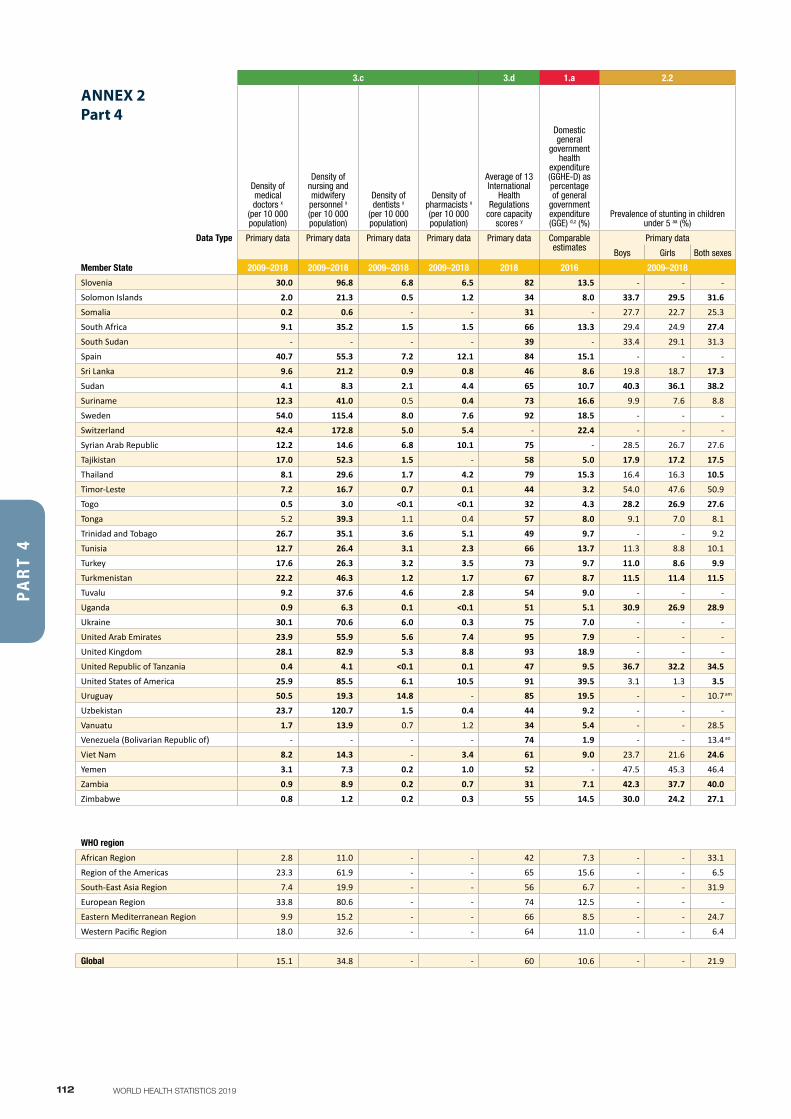
112 WORLD HEALTH STATISTICS 2019
3.c 3.d 1.a 2.2 2.2 5.2 6.1 6.2 6.a
ANNEX 2Part 4
Density of medical doctors x
(per 10 000 population)
Density of nursing and midwifery personnel x (per 10 000 population)
Density of dentists x
(per 10 000 population)
Density of pharmacists x (per 10 000 population)
Average of 13 International
Health Regulations
core capacity scores y
Domestic general
government health
expenditure (GGHE-D) as percentage of general
government expenditure (GGE) d,z (%)
Prevalence of stunting in children under 5 aa (%)
Prevalence of wasting in children under 5 aa (%)
Prevalence of overweight in children under 5 aa (%)
Proportion of ever-partnered
women and girls aged
15 years and older subjected
to physical, sexual or
psychological violence by a current or
former intimate partner in the previous 12
months ab (%)
Proportion of population
using safely managed
drinking-water services ac (%)
Proportion of population
using safely managed sanitation
services ac (%)
Amount of water- and sanitation-
related official development assistance
that is part of a
government-coordinated
spending plan ad
(constant 2016 US$ millions)
Data Type Primary data Primary data Primary data Primary data Primary data Comparable estimates
Primary data Primary data Primary data Primary data Comparable estimates
Comparable estimates
Primary data
Boys Girls Both sexes Boys Girls Both sexes Boys Girls Both sexes
Member State 2009–2018 2009–2018 2009–2018 2009–2018 2018 2016 2009–2018 2009–2018 2009–2018 2009–2017 2015 2015 2017 Member State
Slovenia 30.0 96.8 6.8 6.5 82 13.5 - - - - - - - - - - 98 76 - Slovenia
Solomon Islands 2.0 21.3 0.5 1.2 34 8.0 33.7 29.5 31.6 8.4 8.5 8.5 4.6 4.4 4.5 - - - 9.96 Solomon Islands
Somalia 0.2 0.6 - - 31 - 27.7 22.7 25.3 16.4 13.4 15.0 2.8 3.1 3.0 - - 14 19.85 Somalia
South Africa 9.1 35.2 1.5 1.5 66 13.3 29.4 24.9 27.4 5.2 6.0 2.5 18.7 15.6 13.3 - - - 1.81 South Africa
South Sudan - - - - 39 - 33.4 29.1 31.3 27.4 21.1 24.3 5.9 5.7 5.8 - - - 47.62 South Sudan
Spain 40.7 55.3 7.2 12.1 84 15.1 - - - - - - - - - - 98 97 - Spain
Sri Lanka 9.6 21.2 0.9 0.8 46 8.6 19.8 18.7 17.3 12.1 11.5 15.1 0.7 1.0 2.0 - - - 142.80 Sri Lanka
Sudan 4.1 8.3 2.1 4.4 65 10.7 40.3 36.1 38.2 17.3 16.2 16.8 3.2 2.8 3.0 - - - 20.70 Sudan
Suriname 12.3 41.0 0.5 0.4 73 16.6 9.9 7.6 8.8 6.3 5.2 5.8 5.0 3.0 4.0 - - - 1.60 Suriname
Sweden 54.0 115.4 8.0 7.6 92 18.5 - - - - - - - - - - 98 92 - Sweden
Switzerland 42.4 172.8 5.0 5.4 - 22.4 - - - - - - - - - - 95 99 - Switzerland
Syrian Arab Republic 12.2 14.6 6.8 10.1 75 - 28.5 26.7 27.6 12.5 10.5 11.5 17.8 18.1 17.9 - - - 8.19 Syrian Arab Republic
Tajikistan 17.0 52.3 1.5 - 58 5.0 17.9 17.2 17.5 6.1 5.0 5.6 17.3 15.3 3.3 19 47 - 17.92 Tajikistan
Thailand 8.1 29.6 1.7 4.2 79 15.3 16.4 16.3 10.5 7.4 6.1 5.4 10.1 11.6 8.2 - - - 2.61 Thailand
Timor-Leste 7.2 16.7 0.7 0.1 44 3.2 54.0 47.6 50.9 12.6 8.4 10.5 1.2 1.5 1.4 35 - - 5.87 Timor-Leste
Togo 0.5 3.0 <0.1 <0.1 32 4.3 28.2 26.9 27.6 7.6 5.6 6.6 1.8 2.2 2.0 13 - - 16.76 Togo
Tonga 5.2 39.3 1.1 0.4 57 8.0 9.1 7.0 8.1 5.4 5.1 5.2 18.6 16.0 17.3 19 ah - - 2.30 Tonga
Trinidad and Tobago 26.7 35.1 3.6 5.1 49 9.7 - - 9.2 - - 6.4 - - 11.4 7 ah - - - Trinidad and Tobago
Tunisia 12.7 26.4 3.1 2.3 66 13.7 11.3 8.8 10.1 4.2 2.3 3.3 14.7 13.7 14.2 - 93 73 162.01 Tunisia
Turkey 17.6 26.3 3.2 3.5 73 9.7 11.0 8.6 9.9 1.6 2.2 1.9 11.9 10.2 11.1 11 ah - 44 84.80 Turkey
Turkmenistan 22.2 46.3 1.2 1.7 67 8.7 11.5 11.4 11.5 4.4 3.9 4.2 6.0 5.7 5.9 - 86 - - Turkmenistan
Tuvalu 9.2 37.6 4.6 2.8 54 9.0 - - - - - - - - - - - 9 0.95 Tuvalu
Uganda 0.9 6.3 0.1 <0.1 51 5.1 30.9 26.9 28.9 4.1 2.9 3.5 4.9 2.6 3.7 30 6 - 151.62 Uganda
Ukraine 30.1 70.6 6.0 0.3 75 7.0 - - - - - - - - - - 92 - 32.02 Ukraine
United Arab Emirates 23.9 55.9 5.6 7.4 95 7.9 - - - - - - - - - - - 93 - United Arab Emirates
United Kingdom 28.1 82.9 5.3 8.8 93 18.9 - - - - - - - - - - 96 98 - United Kingdom
United Republic of Tanzania 0.4 4.1 <0.1 0.1 47 9.5 36.7 32.2 34.5 5.2 3.8 4.5 3.8 3.6 3.7 30 - - 66.53 United Republic of Tanzania
United States of America 25.9 85.5 6.1 10.5 91 39.5 3.1 1.3 3.5 0.4 0.8 0.4 5.1 6.9 9.4 - 99 89 - United States of AmericaUruguay 50.5 19.3 14.8 - 85 19.5 - - 10.7 am - - 1.3 am - - 7.2 am 3 ah - 64 0.68 Uruguay
Uzbekistan 23.7 120.7 1.5 0.4 44 9.2 - - - - - - - - - - - - 63.08 Uzbekistan
Vanuatu 1.7 13.9 0.7 1.2 34 5.4 - - 28.5 - - 4.4 - - 4.6 44 ah - - 2.13 VanuatuVenezuela (Bolivarian Republic of) - - - - 74 1.9 - - 13.4 ao - - 4.1 ao - - 6.4 ao - - 19 0.17 Venezuela (Bolivarian Republic of)
Viet Nam 8.2 14.3 - 3.4 61 9.0 23.7 21.6 24.6 4.5 4.3 6.4 5.4 3.4 5.3 - - - 532.27 Viet Nam
Yemen 3.1 7.3 0.2 1.0 52 - 47.5 45.3 46.4 17.9 14.8 16.4 2.4 2.5 2.5 - - - 34.53 Yemen
Zambia 0.9 8.9 0.2 0.7 31 7.1 42.3 37.7 40.0 6.5 6.0 6.2 6.6 5.9 6.2 27 - - 130.05 Zambia
Zimbabwe 0.8 1.2 0.2 0.3 55 14.5 30.0 24.2 27.1 3.3 3.3 3.3 6.2 5.1 5.6 20 - - 22.85 Zimbabwe
WHO region WHO region
African Region 2.8 11.0 - - 42 7.3 - - 33.1 - - 7.0 - - 3.5 - 26 - 2483.89 African Region
Region of the Americas 23.3 61.9 - - 65 15.6 - - 6.5 - - 0.8 - - 7.2 - 82 43 676.69 Region of the Americas
South-East Asia Region 7.4 19.9 - - 56 6.7 - - 31.9 - - 15.1 - - 3.8 - - - 1484.41 South-East Asia Region
European Region 33.8 80.6 - - 74 12.5 - - - - - - - - - - 91 67 - European Region
Eastern Mediterranean Region 9.9 15.2 - - 66 8.5 - - 24.7 - - 7.8 - - 5.7 - 56 - 1836.26 Eastern Mediterranean Region
Western Pacific Region 18.0 32.6 - - 64 11.0 - - 6.4 - - 2.2 - - 6.0 - - 57 1011.10 Western Pacific Region
Global 15.1 34.8 - - 60 10.6 - - 21.9 - - 7.3 - - 5.9 - 71 39 8698.25 Global
PA
RT
4
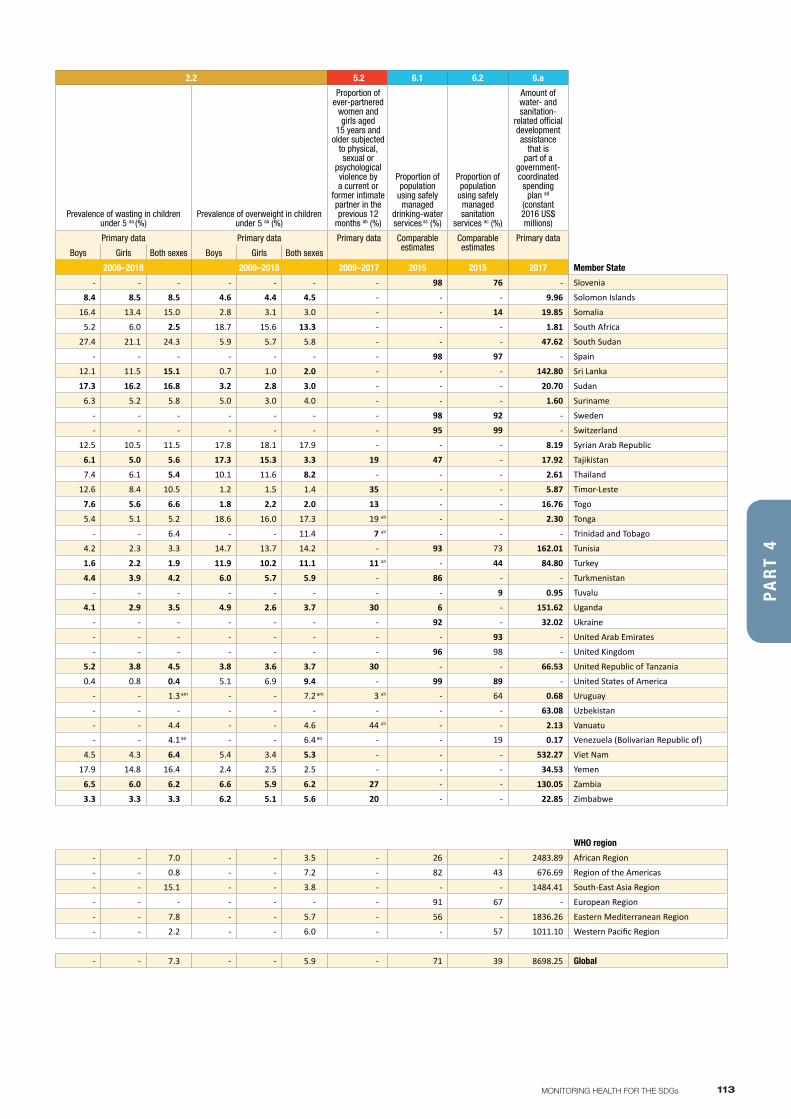
113MONITORING HEALTH FOR THE SDGs
3.c 3.d 1.a 2.2 2.2 5.2 6.1 6.2 6.a
ANNEX 2Part 4
Density of medical doctors x
(per 10 000 population)
Density of nursing and midwifery personnel x (per 10 000 population)
Density of dentists x
(per 10 000 population)
Density of pharmacists x (per 10 000 population)
Average of 13 International
Health Regulations
core capacity scores y
Domestic general
government health
expenditure (GGHE-D) as percentage of general
government expenditure (GGE) d,z (%)
Prevalence of stunting in children under 5 aa (%)
Prevalence of wasting in children under 5 aa (%)
Prevalence of overweight in children under 5 aa (%)
Proportion of ever-partnered
women and girls aged
15 years and older subjected
to physical, sexual or
psychological violence by a current or
former intimate partner in the previous 12
months ab (%)
Proportion of population
using safely managed
drinking-water services ac (%)
Proportion of population
using safely managed sanitation
services ac (%)
Amount of water- and sanitation-
related official development assistance
that is part of a
government-coordinated
spending plan ad
(constant 2016 US$ millions)
Data Type Primary data Primary data Primary data Primary data Primary data Comparable estimates
Primary data Primary data Primary data Primary data Comparable estimates
Comparable estimates
Primary data
Boys Girls Both sexes Boys Girls Both sexes Boys Girls Both sexes
Member State 2009–2018 2009–2018 2009–2018 2009–2018 2018 2016 2009–2018 2009–2018 2009–2018 2009–2017 2015 2015 2017 Member State
Slovenia 30.0 96.8 6.8 6.5 82 13.5 - - - - - - - - - - 98 76 - Slovenia
Solomon Islands 2.0 21.3 0.5 1.2 34 8.0 33.7 29.5 31.6 8.4 8.5 8.5 4.6 4.4 4.5 - - - 9.96 Solomon Islands
Somalia 0.2 0.6 - - 31 - 27.7 22.7 25.3 16.4 13.4 15.0 2.8 3.1 3.0 - - 14 19.85 Somalia
South Africa 9.1 35.2 1.5 1.5 66 13.3 29.4 24.9 27.4 5.2 6.0 2.5 18.7 15.6 13.3 - - - 1.81 South Africa
South Sudan - - - - 39 - 33.4 29.1 31.3 27.4 21.1 24.3 5.9 5.7 5.8 - - - 47.62 South Sudan
Spain 40.7 55.3 7.2 12.1 84 15.1 - - - - - - - - - - 98 97 - Spain
Sri Lanka 9.6 21.2 0.9 0.8 46 8.6 19.8 18.7 17.3 12.1 11.5 15.1 0.7 1.0 2.0 - - - 142.80 Sri Lanka
Sudan 4.1 8.3 2.1 4.4 65 10.7 40.3 36.1 38.2 17.3 16.2 16.8 3.2 2.8 3.0 - - - 20.70 Sudan
Suriname 12.3 41.0 0.5 0.4 73 16.6 9.9 7.6 8.8 6.3 5.2 5.8 5.0 3.0 4.0 - - - 1.60 Suriname
Sweden 54.0 115.4 8.0 7.6 92 18.5 - - - - - - - - - - 98 92 - Sweden
Switzerland 42.4 172.8 5.0 5.4 - 22.4 - - - - - - - - - - 95 99 - Switzerland
Syrian Arab Republic 12.2 14.6 6.8 10.1 75 - 28.5 26.7 27.6 12.5 10.5 11.5 17.8 18.1 17.9 - - - 8.19 Syrian Arab Republic
Tajikistan 17.0 52.3 1.5 - 58 5.0 17.9 17.2 17.5 6.1 5.0 5.6 17.3 15.3 3.3 19 47 - 17.92 Tajikistan
Thailand 8.1 29.6 1.7 4.2 79 15.3 16.4 16.3 10.5 7.4 6.1 5.4 10.1 11.6 8.2 - - - 2.61 Thailand
Timor-Leste 7.2 16.7 0.7 0.1 44 3.2 54.0 47.6 50.9 12.6 8.4 10.5 1.2 1.5 1.4 35 - - 5.87 Timor-Leste
Togo 0.5 3.0 <0.1 <0.1 32 4.3 28.2 26.9 27.6 7.6 5.6 6.6 1.8 2.2 2.0 13 - - 16.76 Togo
Tonga 5.2 39.3 1.1 0.4 57 8.0 9.1 7.0 8.1 5.4 5.1 5.2 18.6 16.0 17.3 19 ah - - 2.30 Tonga
Trinidad and Tobago 26.7 35.1 3.6 5.1 49 9.7 - - 9.2 - - 6.4 - - 11.4 7 ah - - - Trinidad and Tobago
Tunisia 12.7 26.4 3.1 2.3 66 13.7 11.3 8.8 10.1 4.2 2.3 3.3 14.7 13.7 14.2 - 93 73 162.01 Tunisia
Turkey 17.6 26.3 3.2 3.5 73 9.7 11.0 8.6 9.9 1.6 2.2 1.9 11.9 10.2 11.1 11 ah - 44 84.80 Turkey
Turkmenistan 22.2 46.3 1.2 1.7 67 8.7 11.5 11.4 11.5 4.4 3.9 4.2 6.0 5.7 5.9 - 86 - - Turkmenistan
Tuvalu 9.2 37.6 4.6 2.8 54 9.0 - - - - - - - - - - - 9 0.95 Tuvalu
Uganda 0.9 6.3 0.1 <0.1 51 5.1 30.9 26.9 28.9 4.1 2.9 3.5 4.9 2.6 3.7 30 6 - 151.62 Uganda
Ukraine 30.1 70.6 6.0 0.3 75 7.0 - - - - - - - - - - 92 - 32.02 Ukraine
United Arab Emirates 23.9 55.9 5.6 7.4 95 7.9 - - - - - - - - - - - 93 - United Arab Emirates
United Kingdom 28.1 82.9 5.3 8.8 93 18.9 - - - - - - - - - - 96 98 - United Kingdom
United Republic of Tanzania 0.4 4.1 <0.1 0.1 47 9.5 36.7 32.2 34.5 5.2 3.8 4.5 3.8 3.6 3.7 30 - - 66.53 United Republic of Tanzania
United States of America 25.9 85.5 6.1 10.5 91 39.5 3.1 1.3 3.5 0.4 0.8 0.4 5.1 6.9 9.4 - 99 89 - United States of AmericaUruguay 50.5 19.3 14.8 - 85 19.5 - - 10.7 am - - 1.3 am - - 7.2 am 3 ah - 64 0.68 Uruguay
Uzbekistan 23.7 120.7 1.5 0.4 44 9.2 - - - - - - - - - - - - 63.08 Uzbekistan
Vanuatu 1.7 13.9 0.7 1.2 34 5.4 - - 28.5 - - 4.4 - - 4.6 44 ah - - 2.13 VanuatuVenezuela (Bolivarian Republic of) - - - - 74 1.9 - - 13.4 ao - - 4.1 ao - - 6.4 ao - - 19 0.17 Venezuela (Bolivarian Republic of)
Viet Nam 8.2 14.3 - 3.4 61 9.0 23.7 21.6 24.6 4.5 4.3 6.4 5.4 3.4 5.3 - - - 532.27 Viet Nam
Yemen 3.1 7.3 0.2 1.0 52 - 47.5 45.3 46.4 17.9 14.8 16.4 2.4 2.5 2.5 - - - 34.53 Yemen
Zambia 0.9 8.9 0.2 0.7 31 7.1 42.3 37.7 40.0 6.5 6.0 6.2 6.6 5.9 6.2 27 - - 130.05 Zambia
Zimbabwe 0.8 1.2 0.2 0.3 55 14.5 30.0 24.2 27.1 3.3 3.3 3.3 6.2 5.1 5.6 20 - - 22.85 Zimbabwe
WHO region WHO region
African Region 2.8 11.0 - - 42 7.3 - - 33.1 - - 7.0 - - 3.5 - 26 - 2483.89 African Region
Region of the Americas 23.3 61.9 - - 65 15.6 - - 6.5 - - 0.8 - - 7.2 - 82 43 676.69 Region of the Americas
South-East Asia Region 7.4 19.9 - - 56 6.7 - - 31.9 - - 15.1 - - 3.8 - - - 1484.41 South-East Asia Region
European Region 33.8 80.6 - - 74 12.5 - - - - - - - - - - 91 67 - European Region
Eastern Mediterranean Region 9.9 15.2 - - 66 8.5 - - 24.7 - - 7.8 - - 5.7 - 56 - 1836.26 Eastern Mediterranean Region
Western Pacific Region 18.0 32.6 - - 64 11.0 - - 6.4 - - 2.2 - - 6.0 - - 57 1011.10 Western Pacific Region
Global 15.1 34.8 - - 60 10.6 - - 21.9 - - 7.3 - - 5.9 - 71 39 8698.25 Global
PA
RT
4
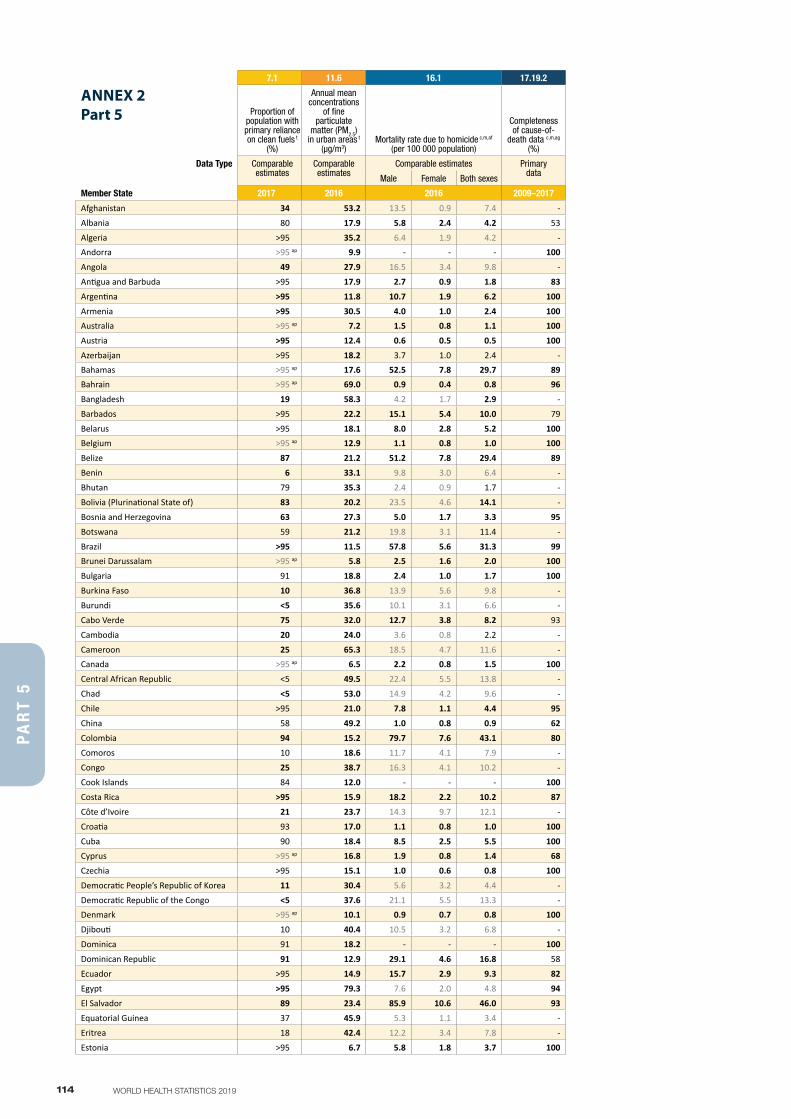
114 WORLD HEALTH STATISTICS 2019
7.1 11.6 16.1 17.19.2
ANNEX 2Part 5 Proportion of
population with primary reliance on clean fuels t
(%)
Annual mean concentrations
of fine particulate
matter (PM2.5) in urban areas t
(µg/m3)Mortality rate due to homicide c,m,af
(per 100 000 population)
Completeness of cause-of-
death data c,m,ag
(%)
Data Type Comparable estimates
Comparable estimates
Comparable estimates Primary data
Male Female Both sexes
Member State 2017 2016 2016 2009–2017
Afghanistan 34 53.2 13.5 0.9 7.4 -
Albania 80 17.9 5.8 2.4 4.2 53
Algeria >95 35.2 6.4 1.9 4.2 -Andorra >95 ap 9.9 - - - 100
Angola 49 27.9 16.5 3.4 9.8 -
Antigua and Barbuda >95 17.9 2.7 0.9 1.8 83
Argentina >95 11.8 10.7 1.9 6.2 100
Armenia >95 30.5 4.0 1.0 2.4 100Australia >95 ap 7.2 1.5 0.8 1.1 100
Austria >95 12.4 0.6 0.5 0.5 100
Azerbaijan >95 18.2 3.7 1.0 2.4 -Bahamas >95 ap 17.6 52.5 7.8 29.7 89Bahrain >95 ap 69.0 0.9 0.4 0.8 96
Bangladesh 19 58.3 4.2 1.7 2.9 -
Barbados >95 22.2 15.1 5.4 10.0 79
Belarus >95 18.1 8.0 2.8 5.2 100Belgium >95 ap 12.9 1.1 0.8 1.0 100
Belize 87 21.2 51.2 7.8 29.4 89
Benin 6 33.1 9.8 3.0 6.4 -
Bhutan 79 35.3 2.4 0.9 1.7 -
Bolivia (Plurinational State of) 83 20.2 23.5 4.6 14.1 -
Bosnia and Herzegovina 63 27.3 5.0 1.7 3.3 95
Botswana 59 21.2 19.8 3.1 11.4 -
Brazil >95 11.5 57.8 5.6 31.3 99Brunei Darussalam >95 ap 5.8 2.5 1.6 2.0 100
Bulgaria 91 18.8 2.4 1.0 1.7 100
Burkina Faso 10 36.8 13.9 5.6 9.8 -
Burundi <5 35.6 10.1 3.1 6.6 -
Cabo Verde 75 32.0 12.7 3.8 8.2 93
Cambodia 20 24.0 3.6 0.8 2.2 -
Cameroon 25 65.3 18.5 4.7 11.6 -Canada >95 ap 6.5 2.2 0.8 1.5 100
Central African Republic <5 49.5 22.4 5.5 13.8 -
Chad <5 53.0 14.9 4.2 9.6 -
Chile >95 21.0 7.8 1.1 4.4 95
China 58 49.2 1.0 0.8 0.9 62
Colombia 94 15.2 79.7 7.6 43.1 80
Comoros 10 18.6 11.7 4.1 7.9 -
Congo 25 38.7 16.3 4.1 10.2 -
Cook Islands 84 12.0 - - - 100
Costa Rica >95 15.9 18.2 2.2 10.2 87
Côte d’Ivoire 21 23.7 14.3 9.7 12.1 -
Croatia 93 17.0 1.1 0.8 1.0 100
Cuba 90 18.4 8.5 2.5 5.5 100Cyprus >95 ap 16.8 1.9 0.8 1.4 68
Czechia >95 15.1 1.0 0.6 0.8 100
Democratic People’s Republic of Korea 11 30.4 5.6 3.2 4.4 -
Democratic Republic of the Congo <5 37.6 21.1 5.5 13.3 -Denmark >95 ap 10.1 0.9 0.7 0.8 100
Djibouti 10 40.4 10.5 3.2 6.8 -
Dominica 91 18.2 - - - 100
Dominican Republic 91 12.9 29.1 4.6 16.8 58
Ecuador >95 14.9 15.7 2.9 9.3 82
Egypt >95 79.3 7.6 2.0 4.8 94
El Salvador 89 23.4 85.9 10.6 46.0 93
Equatorial Guinea 37 45.9 5.3 1.1 3.4 -
Eritrea 18 42.4 12.2 3.4 7.8 -
Estonia >95 6.7 5.8 1.8 3.7 100
PA
RT
5
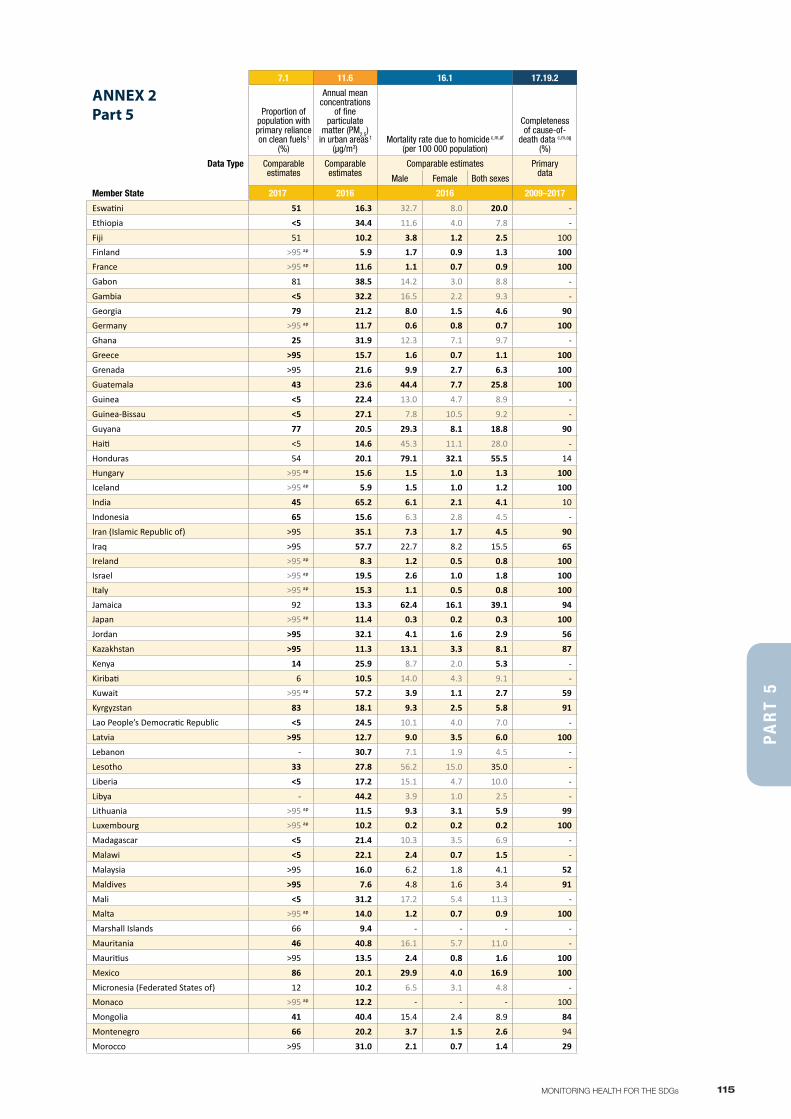
115MONITORING HEALTH FOR THE SDGs
7.1 11.6 16.1 17.19.2
ANNEX 2Part 5 Proportion of
population with primary reliance on clean fuels t
(%)
Annual mean concentrations
of fine particulate
matter (PM2.5) in urban areas t
(µg/m3)Mortality rate due to homicide c,m,af
(per 100 000 population)
Completeness of cause-of-
death data c,m,ag
(%)
Data Type Comparable estimates
Comparable estimates
Comparable estimates Primary data
Male Female Both sexes
Member State 2017 2016 2016 2009–2017
Eswatini 51 16.3 32.7 8.0 20.0 -
Ethiopia <5 34.4 11.6 4.0 7.8 -
Fiji 51 10.2 3.8 1.2 2.5 100Finland >95 ap 5.9 1.7 0.9 1.3 100France >95 ap 11.6 1.1 0.7 0.9 100
Gabon 81 38.5 14.2 3.0 8.8 -
Gambia <5 32.2 16.5 2.2 9.3 -
Georgia 79 21.2 8.0 1.5 4.6 90Germany >95 ap 11.7 0.6 0.8 0.7 100
Ghana 25 31.9 12.3 7.1 9.7 -
Greece >95 15.7 1.6 0.7 1.1 100
Grenada >95 21.6 9.9 2.7 6.3 100
Guatemala 43 23.6 44.4 7.7 25.8 100
Guinea <5 22.4 13.0 4.7 8.9 -
Guinea-Bissau <5 27.1 7.8 10.5 9.2 -
Guyana 77 20.5 29.3 8.1 18.8 90
Haiti <5 14.6 45.3 11.1 28.0 -
Honduras 54 20.1 79.1 32.1 55.5 14Hungary >95 ap 15.6 1.5 1.0 1.3 100Iceland >95 ap 5.9 1.5 1.0 1.2 100
India 45 65.2 6.1 2.1 4.1 10
Indonesia 65 15.6 6.3 2.8 4.5 -
Iran (Islamic Republic of) >95 35.1 7.3 1.7 4.5 90
Iraq >95 57.7 22.7 8.2 15.5 65Ireland >95 ap 8.3 1.2 0.5 0.8 100Israel >95 ap 19.5 2.6 1.0 1.8 100Italy >95 ap 15.3 1.1 0.5 0.8 100
Jamaica 92 13.3 62.4 16.1 39.1 94Japan >95 ap 11.4 0.3 0.2 0.3 100
Jordan >95 32.1 4.1 1.6 2.9 56
Kazakhstan >95 11.3 13.1 3.3 8.1 87
Kenya 14 25.9 8.7 2.0 5.3 -
Kiribati 6 10.5 14.0 4.3 9.1 -Kuwait >95 ap 57.2 3.9 1.1 2.7 59
Kyrgyzstan 83 18.1 9.3 2.5 5.8 91
Lao People’s Democratic Republic <5 24.5 10.1 4.0 7.0 -
Latvia >95 12.7 9.0 3.5 6.0 100
Lebanon - 30.7 7.1 1.9 4.5 -
Lesotho 33 27.8 56.2 15.0 35.0 -
Liberia <5 17.2 15.1 4.7 10.0 -
Libya - 44.2 3.9 1.0 2.5 -Lithuania >95 ap 11.5 9.3 3.1 5.9 99Luxembourg >95 ap 10.2 0.2 0.2 0.2 100
Madagascar <5 21.4 10.3 3.5 6.9 -
Malawi <5 22.1 2.4 0.7 1.5 -
Malaysia >95 16.0 6.2 1.8 4.1 52
Maldives >95 7.6 4.8 1.6 3.4 91
Mali <5 31.2 17.2 5.4 11.3 -Malta >95 ap 14.0 1.2 0.7 0.9 100
Marshall Islands 66 9.4 - - - -
Mauritania 46 40.8 16.1 5.7 11.0 -
Mauritius >95 13.5 2.4 0.8 1.6 100
Mexico 86 20.1 29.9 4.0 16.9 100
Micronesia (Federated States of) 12 10.2 6.5 3.1 4.8 -Monaco >95 ap 12.2 - - - 100
Mongolia 41 40.4 15.4 2.4 8.9 84
Montenegro 66 20.2 3.7 1.5 2.6 94
Morocco >95 31.0 2.1 0.7 1.4 29
PA
RT
5
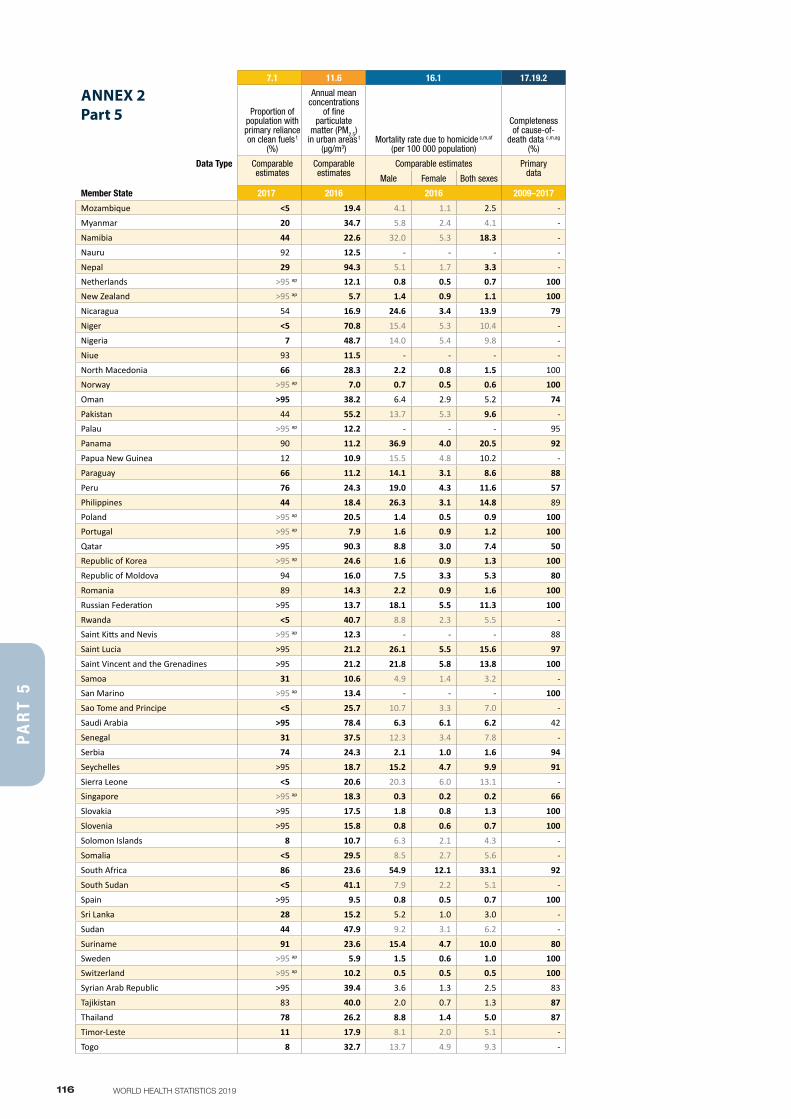
116 WORLD HEALTH STATISTICS 2019
7.1 11.6 16.1 17.19.2
ANNEX 2Part 5 Proportion of
population with primary reliance on clean fuels t
(%)
Annual mean concentrations
of fine particulate
matter (PM2.5) in urban areas t
(µg/m3)Mortality rate due to homicide c,m,af
(per 100 000 population)
Completeness of cause-of-
death data c,m,ag
(%)
Data Type Comparable estimates
Comparable estimates
Comparable estimates Primary data
Male Female Both sexes
Member State 2017 2016 2016 2009–2017
Mozambique <5 19.4 4.1 1.1 2.5 -
Myanmar 20 34.7 5.8 2.4 4.1 -
Namibia 44 22.6 32.0 5.3 18.3 -
Nauru 92 12.5 - - - -
Nepal 29 94.3 5.1 1.7 3.3 -Netherlands >95 ap 12.1 0.8 0.5 0.7 100New Zealand >95 ap 5.7 1.4 0.9 1.1 100
Nicaragua 54 16.9 24.6 3.4 13.9 79
Niger <5 70.8 15.4 5.3 10.4 -
Nigeria 7 48.7 14.0 5.4 9.8 -
Niue 93 11.5 - - - -
North Macedonia 66 28.3 2.2 0.8 1.5 100Norway >95 ap 7.0 0.7 0.5 0.6 100
Oman >95 38.2 6.4 2.9 5.2 74
Pakistan 44 55.2 13.7 5.3 9.6 -Palau >95 ap 12.2 - - - 95
Panama 90 11.2 36.9 4.0 20.5 92
Papua New Guinea 12 10.9 15.5 4.8 10.2 -
Paraguay 66 11.2 14.1 3.1 8.6 88
Peru 76 24.3 19.0 4.3 11.6 57
Philippines 44 18.4 26.3 3.1 14.8 89Poland >95 ap 20.5 1.4 0.5 0.9 100Portugal >95 ap 7.9 1.6 0.9 1.2 100
Qatar >95 90.3 8.8 3.0 7.4 50Republic of Korea >95 ap 24.6 1.6 0.9 1.3 100
Republic of Moldova 94 16.0 7.5 3.3 5.3 80
Romania 89 14.3 2.2 0.9 1.6 100
Russian Federation >95 13.7 18.1 5.5 11.3 100
Rwanda <5 40.7 8.8 2.3 5.5 -Saint Kitts and Nevis >95 ap 12.3 - - - 88
Saint Lucia >95 21.2 26.1 5.5 15.6 97
Saint Vincent and the Grenadines >95 21.2 21.8 5.8 13.8 100
Samoa 31 10.6 4.9 1.4 3.2 -San Marino >95 ap 13.4 - - - 100
Sao Tome and Principe <5 25.7 10.7 3.3 7.0 -
Saudi Arabia >95 78.4 6.3 6.1 6.2 42
Senegal 31 37.5 12.3 3.4 7.8 -
Serbia 74 24.3 2.1 1.0 1.6 94
Seychelles >95 18.7 15.2 4.7 9.9 91
Sierra Leone <5 20.6 20.3 6.0 13.1 -Singapore >95 ap 18.3 0.3 0.2 0.2 66
Slovakia >95 17.5 1.8 0.8 1.3 100
Slovenia >95 15.8 0.8 0.6 0.7 100
Solomon Islands 8 10.7 6.3 2.1 4.3 -
Somalia <5 29.5 8.5 2.7 5.6 -
South Africa 86 23.6 54.9 12.1 33.1 92
South Sudan <5 41.1 7.9 2.2 5.1 -
Spain >95 9.5 0.8 0.5 0.7 100
Sri Lanka 28 15.2 5.2 1.0 3.0 -
Sudan 44 47.9 9.2 3.1 6.2 -
Suriname 91 23.6 15.4 4.7 10.0 80Sweden >95 ap 5.9 1.5 0.6 1.0 100Switzerland >95 ap 10.2 0.5 0.5 0.5 100
Syrian Arab Republic >95 39.4 3.6 1.3 2.5 83
Tajikistan 83 40.0 2.0 0.7 1.3 87
Thailand 78 26.2 8.8 1.4 5.0 87
Timor-Leste 11 17.9 8.1 2.0 5.1 -
Togo 8 32.7 13.7 4.9 9.3 -
PA
RT
5
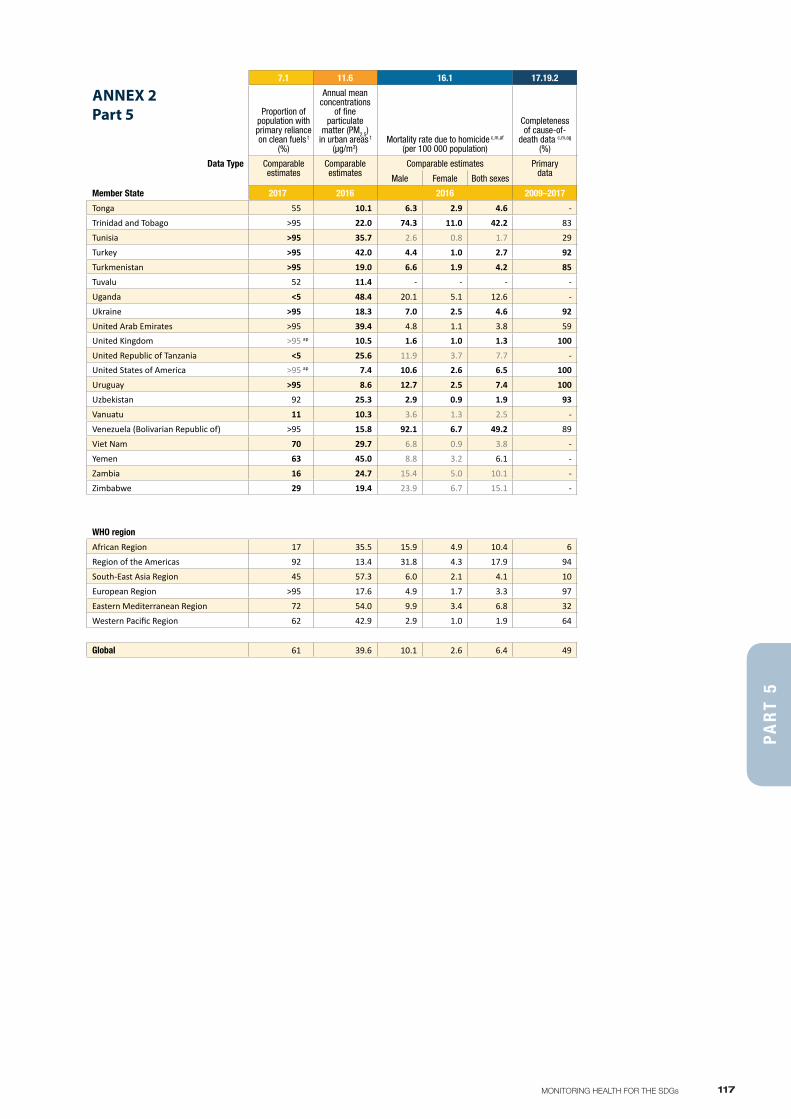
117MONITORING HEALTH FOR THE SDGs
7.1 11.6 16.1 17.19.2
ANNEX 2Part 5 Proportion of
population with primary reliance on clean fuels t
(%)
Annual mean concentrations
of fine particulate
matter (PM2.5) in urban areas t
(µg/m3)Mortality rate due to homicide c,m,af
(per 100 000 population)
Completeness of cause-of-
death data c,m,ag
(%)
Data Type Comparable estimates
Comparable estimates
Comparable estimates Primary data
Male Female Both sexes
Member State 2017 2016 2016 2009–2017
Tonga 55 10.1 6.3 2.9 4.6 -
Trinidad and Tobago >95 22.0 74.3 11.0 42.2 83
Tunisia >95 35.7 2.6 0.8 1.7 29
Turkey >95 42.0 4.4 1.0 2.7 92
Turkmenistan >95 19.0 6.6 1.9 4.2 85
Tuvalu 52 11.4 - - - -
Uganda <5 48.4 20.1 5.1 12.6 -
Ukraine >95 18.3 7.0 2.5 4.6 92
United Arab Emirates >95 39.4 4.8 1.1 3.8 59United Kingdom >95 ap 10.5 1.6 1.0 1.3 100
United Republic of Tanzania <5 25.6 11.9 3.7 7.7 -United States of America >95 ap 7.4 10.6 2.6 6.5 100
Uruguay >95 8.6 12.7 2.5 7.4 100
Uzbekistan 92 25.3 2.9 0.9 1.9 93
Vanuatu 11 10.3 3.6 1.3 2.5 -
Venezuela (Bolivarian Republic of) >95 15.8 92.1 6.7 49.2 89
Viet Nam 70 29.7 6.8 0.9 3.8 -
Yemen 63 45.0 8.8 3.2 6.1 -
Zambia 16 24.7 15.4 5.0 10.1 -
Zimbabwe 29 19.4 23.9 6.7 15.1 -
WHO region
African Region 17 35.5 15.9 4.9 10.4 6
Region of the Americas 92 13.4 31.8 4.3 17.9 94
South-East Asia Region 45 57.3 6.0 2.1 4.1 10
European Region >95 17.6 4.9 1.7 3.3 97
Eastern Mediterranean Region 72 54.0 9.9 3.4 6.8 32
Western Pacific Region 62 42.9 2.9 1.0 1.9 64
Global 61 39.6 10.1 2.6 6.4 49
PA
RT
5
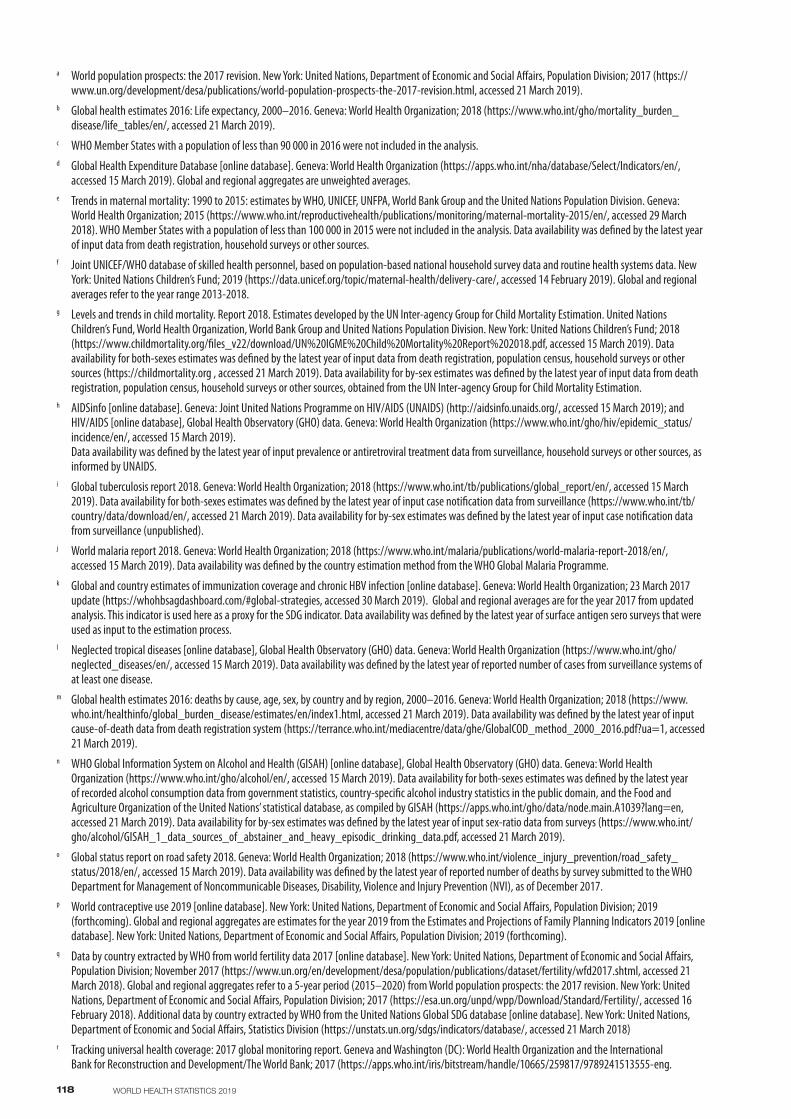
118 WORLD HEALTH STATISTICS 2019
a World population prospects: the 2017 revision. New York: United Nations, Department of Economic and Social Affairs, Population Division; 2017 (https://www.un.org/development/desa/publications/world-population-prospects-the-2017-revision.html, accessed 21 March 2019).
b Global health estimates 2016: Life expectancy, 2000–2016. Geneva: World Health Organization; 2018 (https://www.who.int/gho/mortality_burden_disease/life_tables/en/, accessed 21 March 2019).
c WHO Member States with a population of less than 90 000 in 2016 were not included in the analysis.d Global Health Expenditure Database [online database]. Geneva: World Health Organization (https://apps.who.int/nha/database/Select/Indicators/en/,
accessed 15 March 2019). Global and regional aggregates are unweighted averages.e Trends in maternal mortality: 1990 to 2015: estimates by WHO, UNICEF, UNFPA, World Bank Group and the United Nations Population Division. Geneva:
World Health Organization; 2015 (https://www.who.int/reproductivehealth/publications/monitoring/maternal-mortality-2015/en/, accessed 29 March 2018). WHO Member States with a population of less than 100 000 in 2015 were not included in the analysis. Data availability was defined by the latest year of input data from death registration, household surveys or other sources.
f Joint UNICEF/WHO database of skilled health personnel, based on population-based national household survey data and routine health systems data. New York: United Nations Children’s Fund; 2019 (https://data.unicef.org/topic/maternal-health/delivery-care/, accessed 14 February 2019). Global and regional averages refer to the year range 2013-2018.
g Levels and trends in child mortality. Report 2018. Estimates developed by the UN Inter-agency Group for Child Mortality Estimation. United Nations Children’s Fund, World Health Organization, World Bank Group and United Nations Population Division. New York: United Nations Children’s Fund; 2018 (https://www.childmortality.org/files_v22/download/UN%20IGME%20Child%20Mortality%20Report%202018.pdf, accessed 15 March 2019). Data availability for both-sexes estimates was defined by the latest year of input data from death registration, population census, household surveys or other sources (https://childmortality.org , accessed 21 March 2019). Data availability for by-sex estimates was defined by the latest year of input data from death registration, population census, household surveys or other sources, obtained from the UN Inter-agency Group for Child Mortality Estimation.
h AIDSinfo [online database]. Geneva: Joint United Nations Programme on HIV/AIDS (UNAIDS) (http://aidsinfo.unaids.org/, accessed 15 March 2019); and HIV/AIDS [online database], Global Health Observatory (GHO) data. Geneva: World Health Organization (https://www.who.int/gho/hiv/epidemic_status/incidence/en/, accessed 15 March 2019). Data availability was defined by the latest year of input prevalence or antiretroviral treatment data from surveillance, household surveys or other sources, as informed by UNAIDS.
i Global tuberculosis report 2018. Geneva: World Health Organization; 2018 (https://www.who.int/tb/publications/global_report/en/, accessed 15 March 2019). Data availability for both-sexes estimates was defined by the latest year of input case notification data from surveillance (https://www.who.int/tb/country/data/download/en/, accessed 21 March 2019). Data availability for by-sex estimates was defined by the latest year of input case notification data from surveillance (unpublished).
j World malaria report 2018. Geneva: World Health Organization; 2018 (https://www.who.int/malaria/publications/world-malaria-report-2018/en/, accessed 15 March 2019). Data availability was defined by the country estimation method from the WHO Global Malaria Programme.
k Global and country estimates of immunization coverage and chronic HBV infection [online database]. Geneva: World Health Organization; 23 March 2017 update (https://whohbsagdashboard.com/#global-strategies, accessed 30 March 2019). Global and regional averages are for the year 2017 from updated analysis. This indicator is used here as a proxy for the SDG indicator. Data availability was defined by the latest year of surface antigen sero surveys that were used as input to the estimation process.
l Neglected tropical diseases [online database], Global Health Observatory (GHO) data. Geneva: World Health Organization (https://www.who.int/gho/neglected_diseases/en/, accessed 15 March 2019). Data availability was defined by the latest year of reported number of cases from surveillance systems of at least one disease.
m Global health estimates 2016: deaths by cause, age, sex, by country and by region, 2000–2016. Geneva: World Health Organization; 2018 (https://www.who.int/healthinfo/global_burden_disease/estimates/en/index1.html, accessed 21 March 2019). Data availability was defined by the latest year of input cause-of-death data from death registration system (https://terrance.who.int/mediacentre/data/ghe/GlobalCOD_method_2000_2016.pdf?ua=1, accessed 21 March 2019).
n WHO Global Information System on Alcohol and Health (GISAH) [online database], Global Health Observatory (GHO) data. Geneva: World Health Organization (https://www.who.int/gho/alcohol/en/, accessed 15 March 2019). Data availability for both-sexes estimates was defined by the latest year of recorded alcohol consumption data from government statistics, country-specific alcohol industry statistics in the public domain, and the Food and Agriculture Organization of the United Nations’ statistical database, as compiled by GISAH (https://apps.who.int/gho/data/node.main.A1039?lang=en, accessed 21 March 2019). Data availability for by-sex estimates was defined by the latest year of input sex-ratio data from surveys (https://www.who.int/gho/alcohol/GISAH_1_data_sources_of_abstainer_and_heavy_episodic_drinking_data.pdf, accessed 21 March 2019).
o Global status report on road safety 2018. Geneva: World Health Organization; 2018 (https://www.who.int/violence_injury_prevention/road_safety_status/2018/en/, accessed 15 March 2019). Data availability was defined by the latest year of reported number of deaths by survey submitted to the WHO Department for Management of Noncommunicable Diseases, Disability, Violence and Injury Prevention (NVI), as of December 2017.
p World contraceptive use 2019 [online database]. New York: United Nations, Department of Economic and Social Affairs, Population Division; 2019 (forthcoming). Global and regional aggregates are estimates for the year 2019 from the Estimates and Projections of Family Planning Indicators 2019 [online database]. New York: United Nations, Department of Economic and Social Affairs, Population Division; 2019 (forthcoming).
q Data by country extracted by WHO from world fertility data 2017 [online database]. New York: United Nations, Department of Economic and Social Affairs, Population Division; November 2017 (https://www.un.org/en/development/desa/population/publications/dataset/fertility/wfd2017.shtml, accessed 21 March 2018). Global and regional aggregates refer to a 5-year period (2015–2020) from World population prospects: the 2017 revision. New York: United Nations, Department of Economic and Social Affairs, Population Division; 2017 (https://esa.un.org/unpd/wpp/Download/Standard/Fertility/, accessed 16 February 2018). Additional data by country extracted by WHO from the United Nations Global SDG database [online database]. New York: United Nations, Department of Economic and Social Affairs, Statistics Division (https://unstats.un.org/sdgs/indicators/database/, accessed 21 March 2018)
r Tracking universal health coverage: 2017 global monitoring report. Geneva and Washington (DC): World Health Organization and the International Bank for Reconstruction and Development/The World Bank; 2017 (https://apps.who.int/iris/bitstream/handle/10665/259817/9789241513555-eng.
119MONITORING HEALTH FOR THE SDGs
pdf?sequence=1, accessed 15 March 2019). WHO Member States with a population of less than 90 000 in 2015 were not included in the analysis. Data availability was defined according to the analysis undertaken for the above-mentioned report. Normal font indicates “low” data availability, and bold font indicates “medium” and “high” data availability.
s Tracking universal health coverage: 2017 global monitoring report. Geneva and Washington (DC): World Health Organization and the International Bank for Reconstruction and Development/The World Bank; 2017 (https://apps.who.int/iris/bitstream/handle/10665/259817/9789241513555-eng.pdf?sequence=1, accessed 15 March 2019). Global and regional aggregates refer to year 2010 and they include country data not show in the table.
t Public health and environment [online database], Global Health Observatory (GHO) data. Geneva: World Health Organization (https://www.who.int/gho/phe/en/, accessed 21 March 2019). Solid fuels: Data availability was defined by the latest year of input data on household fuels for cooking, heating and lighting from household surveys and censuses (https://www.who.int/airpollution/data/household-energy-database/en/, accessed 21 March 2019). Particulate matter: Data availability was defined by the latest year of input data on particulate matter ground measurement (https://www.who.int/airpollution/data/cities/en/, accessed 21 March 2019) and satellite data.
u WHO global report on trends in prevalence of tobacco smoking, 2nd edition. Geneva: World Health Organization; 2018 (https://www.who.int/tobacco/publications/surveillance/trends-tobacco-smoking-second-edition/en/, accessed 15 March 2019). Data availability was defined by the latest year of input prevalence data from surveys.
v WHO/UNICEF estimates of national immunization coverage [online database]. July 2018 revision (https://www.who.int/immunization/monitoring_surveillance/routine/coverage/en/index4.html, accessed 15 March 2019). Data availability was defined by the latest year of input coverage data from administrative records, household surveys and other sources (https://www.who.int/immunization/monitoring_surveillance/data/Coverage_survey_data.xls?ua=1, accessed February 2019).
w OECD.Stat [online database]. Paris: Organisation for Economic Co-operation and Development (https://stats.oecd.org/, accessed 19 January 2019).x WHO Global Health Workforce Statistics [online database], Global Health Observatory (GHO) data. Geneva: World Health Organization (https://who.int/hrh/
statistics/hwfstats/en/, accessed 15 March 2019). Country comparisons are affected by differences in the occupations included. Please refer to the source for country-specific definitions and other descriptive metadata. The global and WHO regional averages are for 2017, and were calculated using countries with values between 2013 and 2018. Some country estimates were used that are not shown in the annex table.
y International Health Regulations (2005) Monitoring Framework [online database], Global Health Observatory (GHO) data. Geneva: World Health Organization (https://www.who.int/gho/ihr/en/, accessed 21 March 2019). Responses received as of 24 April 2019.
z This indicator is presented here because it could constitute the health-related portion of the SDG Indicator 1.a.2. As a composite indicator including several categories of health expenditure, the data availability status was determined by the largest component: government transfers for health. The indicator was classified as documented if a primary source such as a government budget has been used.
aa Levels and trends in child malnutrition. UNICEF/WHO/World Bank Group Joint Child Malnutrition Estimates. New York, Geneva and Washington (DC): United Nations Children’s Fund, World Health Organization and the World Bank Group; 2018. Global and regional aggregates are for the year 2018.
ab Global SDG Indicators Database [online database]. New York: United Nations, Statistics Division (https://unstats.un.org/sdgs/indicators/database/, accessed 15 March 2019). Includes surveys for women aged 15–49 only.
ac Progress on drinking water, sanitation and hygiene – 2017 update and SDG baselines. Geneva and New York: World Health Organization and United Nations Children’s Fund; 2017 (https://washdata.org/sites/default/files/documents/reports/2018-01/JMP-2017-report-final.pdf, accessed 31 March 2018); and Water and sanitation [online database], Global Health Observatory (GHO) data. Geneva: World Health Organization (https://www.who.int/gho/mdg/environmental_sustainability/en/, accessed 21 March 2019).
ad Comparable estimates are only shown for countries with recent primary data. Data availability was defined by the latest year that had a measurement of water quality and the latest year with a measurement of one or more sanitation-related variables. These unpublished data were provided by the WHO WASH programme.
ae Official development assistance for the water sector (water supply and sanitation, agricultural water resources, flood prevention/control, and hydro-electric power plants), OECD-CRS, 2018 (https://stats.oecd.org/Index.aspx?DataSetCode=crs1, accessed 21 March 2019). Includes CRS purpose codes for water supply and sanitation (CRS 14000), agricultural water resources (CRS 31140), flood prevention / control (CRS 41050), and hydro-electric power plants (CRS 23220).
af Data availability was defined by the latest year of input cause-of-death data from the death registration system (http://terrance.who.int/mediacentre/data/ghe/GlobalCOD_method_2000_2016.pdf?ua=1, accessed 21 March 2019) and from criminal justice data as used for homicide estimates published in the Global status report on violence prevention 2014 (https://www.who.int/violence_injury_prevention/violence/status_report/2014/en/, accessed 21 March 2019).
ag Completeness was assessed relative to the de facto resident populations, and values refer to the latest available value for the period 2009–2017. Global and regional aggregates are for 2017.
ah Non-standard definition. See indicator footnote for more details.ai Proportion of institutional births (%) used as proxy for the SDG indicator.aj Data pertain to a non-standard age or marital status group. For more details, see the World contraceptive use 2019 (footnote p).ak Preliminary data.al Prevalence of overweight was calculated using BMI-for-age z-scores.am Survey data did not cover the 0–59 months age range, and data were adjusted for comparability.an Data are from a facility-based surveillance system, and they include 80% of health centres in the country.ao Conversion of estimates were based on the old NCHS/WHO references to WHO child growth standards when raw data were not available to allow
comparability.ap For high-income countries with no information on clean fuel use, usage is assumed to be over 95%.
120 WORLD HEALTH STATISTICS 2019
ANNEX 3 WHO regional groupings
WHO African Region: Algeria, Angola, Benin, Botswana, Burkina Faso, Burundi, Cabo Verde, Cameroon, Central African Republic, Chad, Comoros, Congo, Côte d’Ivoire, Democratic Republic of the Congo, Equatorial Guinea, Eritrea, Eswatini, Ethiopia, Gabon, Gambia, Ghana, Guinea, Guinea-Bissau, Kenya, Lesotho, Liberia, Madagascar, Malawi, Mali, Mauritania, Mauritius, Mozambique, Namibia, Niger, Nigeria, Rwanda, Sao Tome and Principe, Senegal, Seychelles, Sierra Leone, South Africa, South Sudan, Togo, Uganda, United Republic of Tanzania, Zambia, Zimbabwe.
WHO Region of the Americas: Antigua and Barbuda, Argentina, Bahamas, Barbados, Belize, Bolivia (Plurinational State of), Brazil, Canada, Chile, Colombia, Costa Rica, Cuba, Dominica, Dominican Republic, Ecuador, El Salvador, Grenada, Guatemala, Guyana, Haiti, Honduras, Jamaica, Mexico, Nicaragua, Panama, Paraguay, Peru, Saint Kitts and Nevis, Saint Lucia, Saint Vincent and the Grenadines, Suriname, Trinidad and Tobago, the United States of America, Uruguay, Venezuela (Bolivarian Republic of).
WHO South-East Asia Region: Bangladesh, Bhutan, Democratic People’s Republic of Korea, India, Indonesia, Maldives, Myanmar, Nepal, Sri Lanka, Thailand, Timor-Leste.
WHO European Region: Albania, Andorra, Armenia, Austria, Azerbaijan, Belarus, Belgium, Bosnia and Herzegovina, Bulgaria, Croatia, Cyprus, Czechia, Denmark, Estonia, Finland, France, Georgia, Germany, Greece, Hungary, Iceland, Ireland, Israel, Italy, Kazakhstan, Kyrgyzstan, Latvia, Lithuania, Luxembourg, Malta, Monaco, Montenegro, Netherlands, North Macedonia, Norway, Poland, Portugal, Republic of Moldova, Romania, Russian Federation, San Marino, Serbia, Slovakia, Slovenia, Spain, Sweden, Switzerland, Tajikistan, Turkey, Turkmenistan, Ukraine, United Kingdom of Great Britain and Northern Ireland, Uzbekistan.
WHO Eastern Mediterranean Region: Afghanistan, Bahrain, Djibouti, Egypt, Iran (Islamic Republic of), Iraq, Jordan, Kuwait, Lebanon, Libya, Morocco, Oman, Pakistan, Qatar, Saudi Arabia, Somalia, Sudan, Syrian Arab Republic, Tunisia, United Arab Emirates, Yemen.
WHO Western Pacific Region: Australia, Brunei Darussalam, Cambodia, China, Cook Islands, Fiji, Japan, Kiribati, Lao People’s Democratic Republic, Malaysia, Marshall Islands, Micronesia (Federated States of), Mongolia, Nauru, New Zealand, Niue, Palau, Papua New Guinea, Philippines, Republic of Korea, Samoa, Singapore, Solomon Islands, Tonga, Tuvalu, Vanuatu, Viet Nam.

Notes. . . . . . . . . . . . . . . . . . . . . . . . . . . . . . . . . . . . . . . . . . . . . . . . . . . . . . . . . . . . . . . . . . . . . . . . . . . . . . . . . . . . . . . . . . . . . . . . . . . . .
. . . . . . . . . . . . . . . . . . . . . . . . . . . . . . . . . . . . . . . . . . . . . . . . . . . . . . . . . . . . . . . . . . . . . . . . . . . . . . . . . . . . . . . . . . . . . . . . . . . . .
. . . . . . . . . . . . . . . . . . . . . . . . . . . . . . . . . . . . . . . . . . . . . . . . . . . . . . . . . . . . . . . . . . . . . . . . . . . . . . . . . . . . . . . . . . . . . . . . . . . . .
. . . . . . . . . . . . . . . . . . . . . . . . . . . . . . . . . . . . . . . . . . . . . . . . . . . . . . . . . . . . . . . . . . . . . . . . . . . . . . . . . . . . . . . . . . . . . . . . . . . . .
. . . . . . . . . . . . . . . . . . . . . . . . . . . . . . . . . . . . . . . . . . . . . . . . . . . . . . . . . . . . . . . . . . . . . . . . . . . . . . . . . . . . . . . . . . . . . . . . . . . . .
. . . . . . . . . . . . . . . . . . . . . . . . . . . . . . . . . . . . . . . . . . . . . . . . . . . . . . . . . . . . . . . . . . . . . . . . . . . . . . . . . . . . . . . . . . . . . . . . . . . . .
. . . . . . . . . . . . . . . . . . . . . . . . . . . . . . . . . . . . . . . . . . . . . . . . . . . . . . . . . . . . . . . . . . . . . . . . . . . . . . . . . . . . . . . . . . . . . . . . . . . . .
. . . . . . . . . . . . . . . . . . . . . . . . . . . . . . . . . . . . . . . . . . . . . . . . . . . . . . . . . . . . . . . . . . . . . . . . . . . . . . . . . . . . . . . . . . . . . . . . . . . . .
. . . . . . . . . . . . . . . . . . . . . . . . . . . . . . . . . . . . . . . . . . . . . . . . . . . . . . . . . . . . . . . . . . . . . . . . . . . . . . . . . . . . . . . . . . . . . . . . . . . . .
. . . . . . . . . . . . . . . . . . . . . . . . . . . . . . . . . . . . . . . . . . . . . . . . . . . . . . . . . . . . . . . . . . . . . . . . . . . . . . . . . . . . . . . . . . . . . . . . . . . . .
. . . . . . . . . . . . . . . . . . . . . . . . . . . . . . . . . . . . . . . . . . . . . . . . . . . . . . . . . . . . . . . . . . . . . . . . . . . . . . . . . . . . . . . . . . . . . . . . . . . . .
. . . . . . . . . . . . . . . . . . . . . . . . . . . . . . . . . . . . . . . . . . . . . . . . . . . . . . . . . . . . . . . . . . . . . . . . . . . . . . . . . . . . . . . . . . . . . . . . . . . . .
. . . . . . . . . . . . . . . . . . . . . . . . . . . . . . . . . . . . . . . . . . . . . . . . . . . . . . . . . . . . . . . . . . . . . . . . . . . . . . . . . . . . . . . . . . . . . . . . . . . . .
. . . . . . . . . . . . . . . . . . . . . . . . . . . . . . . . . . . . . . . . . . . . . . . . . . . . . . . . . . . . . . . . . . . . . . . . . . . . . . . . . . . . . . . . . . . . . . . . . . . . .
. . . . . . . . . . . . . . . . . . . . . . . . . . . . . . . . . . . . . . . . . . . . . . . . . . . . . . . . . . . . . . . . . . . . . . . . . . . . . . . . . . . . . . . . . . . . . . . . . . . . .
. . . . . . . . . . . . . . . . . . . . . . . . . . . . . . . . . . . . . . . . . . . . . . . . . . . . . . . . . . . . . . . . . . . . . . . . . . . . . . . . . . . . . . . . . . . . . . . . . . . . .
. . . . . . . . . . . . . . . . . . . . . . . . . . . . . . . . . . . . . . . . . . . . . . . . . . . . . . . . . . . . . . . . . . . . . . . . . . . . . . . . . . . . . . . . . . . . . . . . . . . . .
. . . . . . . . . . . . . . . . . . . . . . . . . . . . . . . . . . . . . . . . . . . . . . . . . . . . . . . . . . . . . . . . . . . . . . . . . . . . . . . . . . . . . . . . . . . . . . . . . . . . .
. . . . . . . . . . . . . . . . . . . . . . . . . . . . . . . . . . . . . . . . . . . . . . . . . . . . . . . . . . . . . . . . . . . . . . . . . . . . . . . . . . . . . . . . . . . . . . . . . . . . .
. . . . . . . . . . . . . . . . . . . . . . . . . . . . . . . . . . . . . . . . . . . . . . . . . . . . . . . . . . . . . . . . . . . . . . . . . . . . . . . . . . . . . . . . . . . . . . . . . . . . .
. . . . . . . . . . . . . . . . . . . . . . . . . . . . . . . . . . . . . . . . . . . . . . . . . . . . . . . . . . . . . . . . . . . . . . . . . . . . . . . . . . . . . . . . . . . . . . . . . . . . .
. . . . . . . . . . . . . . . . . . . . . . . . . . . . . . . . . . . . . . . . . . . . . . . . . . . . . . . . . . . . . . . . . . . . . . . . . . . . . . . . . . . . . . . . . . . . . . . . . . . . .
. . . . . . . . . . . . . . . . . . . . . . . . . . . . . . . . . . . . . . . . . . . . . . . . . . . . . . . . . . . . . . . . . . . . . . . . . . . . . . . . . . . . . . . . . . . . . . . . . . . . .
. . . . . . . . . . . . . . . . . . . . . . . . . . . . . . . . . . . . . . . . . . . . . . . . . . . . . . . . . . . . . . . . . . . . . . . . . . . . . . . . . . . . . . . . . . . . . . . . . . . . .
. . . . . . . . . . . . . . . . . . . . . . . . . . . . . . . . . . . . . . . . . . . . . . . . . . . . . . . . . . . . . . . . . . . . . . . . . . . . . . . . . . . . . . . . . . . . . . . . . . . . .
. . . . . . . . . . . . . . . . . . . . . . . . . . . . . . . . . . . . . . . . . . . . . . . . . . . . . . . . . . . . . . . . . . . . . . . . . . . . . . . . . . . . . . . . . . . . . . . . . . . . .
. . . . . . . . . . . . . . . . . . . . . . . . . . . . . . . . . . . . . . . . . . . . . . . . . . . . . . . . . . . . . . . . . . . . . . . . . . . . . . . . . . . . . . . . . . . . . . . . . . . . .
. . . . . . . . . . . . . . . . . . . . . . . . . . . . . . . . . . . . . . . . . . . . . . . . . . . . . . . . . . . . . . . . . . . . . . . . . . . . . . . . . . . . . . . . . . . . . . . . . . . . .
. . . . . . . . . . . . . . . . . . . . . . . . . . . . . . . . . . . . . . . . . . . . . . . . . . . . . . . . . . . . . . . . . . . . . . . . . . . . . . . . . . . . . . . . . . . . . . . . . . . . .
. . . . . . . . . . . . . . . . . . . . . . . . . . . . . . . . . . . . . . . . . . . . . . . . . . . . . . . . . . . . . . . . . . . . . . . . . . . . . . . . . . . . . . . . . . . . . . . . . . . . .
. . . . . . . . . . . . . . . . . . . . . . . . . . . . . . . . . . . . . . . . . . . . . . . . . . . . . . . . . . . . . . . . . . . . . . . . . . . . . . . . . . . . . . . . . . . . . . . . . . . . .
. . . . . . . . . . . . . . . . . . . . . . . . . . . . . . . . . . . . . . . . . . . . . . . . . . . . . . . . . . . . . . . . . . . . . . . . . . . . . . . . . . . . . . . . . . . . . . . . . . . . .
. . . . . . . . . . . . . . . . . . . . . . . . . . . . . . . . . . . . . . . . . . . . . . . . . . . . . . . . . . . . . . . . . . . . . . . . . . . . . . . . . . . . . . . . . . . . . . . . . . . . .
. . . . . . . . . . . . . . . . . . . . . . . . . . . . . . . . . . . . . . . . . . . . . . . . . . . . . . . . . . . . . . . . . . . . . . . . . . . . . . . . . . . . . . . . . . . . . . . . . . . . .


2019 2019
ISBN 978 92 4 156570 7
Top Related
Copyright © 2022 FDOKUMEN

