


Bahasa
Halaman
Hukum


Maderas. Ciencia y tecnología 8(1): 15-24, 2006
15
ISSN 0717-3644ISSN online 0718-221X
1, 2Department of Chemical Engineering, University of Sydney, Sydney, Australia 2006.1E-mail: [email protected] [email protected]
Corresponding author: [email protected]
Received: November 04, 2005. Accepted: March 26, 2006.
WITHIN-TREE VARIABILITY IN THE DRYING PROPERTIES FOR
BLACKBUTT TIMBER IN NEW SOUTH WALES
S. J. Cabardo1, T. A. G. Langrish2
ABSTRACT
The within-tree variability of drying properties, including the green and final moisture contents,
the basic density, and the diffusion coefficient, has been investigated for regrowth blackbutt timber
(Eucalyptus pilularis Sm).Timber boards from two regrowth trees were taken from Northern New
South Wales in Australia, and dried in a lab scale kiln. The pattern of variation within the two trees was
similar, such that the diffusion coefficient was strongly correlated with the initial moisture content and
basic density. Principal components analysis suggested that the timber boards with low basic densities
and high initial moisture contents had higher diffusion coefficients. A potential reason is that if there is
less wood material per unit volume, then this leaves more space for water to occupy, and there is also
less resistance for the diffusive transport of moisture. In addition, this suggested correlation was also
evident in the analysis of variance (ANOVA).
A simulation study, using the timber data measured from the experiments in this paper, was also
conducted to estimate how different hardwood drying schedules are likely to affect the distribution of
the final moisture contents, and the time taken to reach an average stack moisture content of 0.15 kg/
kg. A revised version of the drying schedule used for the experiments in this paper, i.e. adding 5ºC to
the dry and wet-bulb temperatures, has been predicted to be a better drying schedule out of the four
drying schedules studied, due to it drying the timber quicker as well as having a small dispersion of
final moisture contents.
Keywords: diffusion, drying schedules, density, moisture content
INTRODUCTION
Australia produces close to 1 million cubic metres of sawn hardwood timber each year and imports
another 142,000 cubic metres, of which more than 90% comes from Indonesia and Malaysia (Caswell,
2005). It is predicted that 9.2 million cubic metres of logs per year will be harvested in the latter half of
the present decade (Ferguson et al., 2002). In New South Wales alone, the consumption of eucalypts
sawn wood was 263,000 m3 in 2000-01 (ABARE, 2001). Therefore, the less timber that is harvested
locally, the more the country will have to rely on imports to meet increasing consumer demand. To
reduce the importation of sawn timber from overseas, Australian timber drying companies may have to
rely on getting most of their timber supplies from these hardwood plantations. However, timber
companies report a growing difficulty in handling plantation timber for a number of reasons, one of
which is the increased amount of variation in timber properties that can affect the dried quality of the
timber. As a result, it is possible that large variations in intrinsic properties may require better control,
hence optimized drying schedules that account for these variabilities may need to be developed.
Trial and error has been used for the development of kiln drying schedules in the past (Campbell,
1980; Mills, 1991). Subsequently, more rational approaches have been undertaken for the optimization
of kiln drying schedules. Optimized kiln drying schedules have been developed from simulations (Cronin

Maderas. Ciencia y tecnología 8(1): 15-24, 2006
16
Universidad del Bío - Bío
et al., 2003) that have considered the variability of final moisture contents. Continuous kiln drying
schedules (Booker, 1994; Alexiou, 1993; Langrish et al., 1997) have also accounted for stress, strain,
and checking/cracking. Pordage and Langrish (2000) developed a method for generating kiln drying
schedules that considered the variability of timber properties, using very limited data on variability
from Doe and Innes (1999). In addition, the variability of the biological parameters was assumed by
Pordage and Langrish (2000) to be normally distributed, and the parameters were assumed to be
uncorrelated with one another. Kayihan (1993) also assumed that there was no correlation between the
green moisture content and the drying-rate parameters. Siau (1984) suggested that the variability in the
green moisture content may be correlated with the variability in the timber density but this hypothesis
has yet to be confirmed. Overall, there is little information about the variability in timber properties
with respect to drying, including how strongly they are correlated. The remaining challenges in
optimizing kiln drying schedules thus include getting sufficient data on the variability of timber
properties, and carrying out the optimization both to minimize cracking and to minimize the dispersion
of final moisture contents.
The tree species chosen for this study was blackbutt (E.pilularis), because blackbutt is the
predominant planted hardwood species in NSW, Australia (Boland et al., 1989) and is considered to be
one of the most important eucalypts for planting in NSW (Johnson and Nikles, 1996).
Since the amount of variability is a key issue in the processing of timber, the variation of diffusion
coefficients, basic densities, and green and final moisture contents for regrowth blackbutt, has been
investigated in this paper. These investigations have been followed by a simulation study of the effects
of different drying schedules on 12 blackbutt boards used in the experiments.
MATERIALS AND METHODS
Preparation of Samples
Blackbutt boards, 28 mm thick x 108 mm wide x 900 mm long, were cut from two regrowth logs
(Log 1 and Log 2). Each log was approximately 4.8 m in length. The boards were taken from different
locations within each log, as shown in Figures 1 and 2. Each ‘A’ board has its corresponding ‘E’ board
that was taken from the top end of each log. The boards were wrapped in thick polythene film until
further processing. Thereafter, a 20 mm thick sample was taken from each end of each green ‘A’ and
‘E’ board to calculate its corresponding initial moisture content using the oven-dry method. The final
length of each green timber board was 800 mm after the moisture content, the green modulus of elasticity
(MOE) and the shrinkage samples were taken. However, the results for the green MOE and shrinkage
tests are not shown in this paper. The remaining board length was end-sealed using silicone and aluminum
foil. Thereafter, the timber boards were kiln dried in a drying tunnel, using the conventional drying
schedule published in the Australian Timber Seasoning manual (Mills, 1991) suited for mixed sawn
blackbutt boards, 25 mm in thickness, shown in Table 1.
Each kiln charge consisted of six boards. One board was taken from close to the pith, another
board was taken from close to the bark, and another board was taken at a certain circumferential
distance from the two boards. The remaining three boards were at the same radial and circumferential
distances but at the other end of the log. This procedure was followed for the first four drying experiments.
The fifth kiln charge consisted of 12 boards (equivalent to two previous experiments) to increase the
amount of data gathered per experiment. The boards were stacked on top of each other, separated by
stickers, with the schedule changed on the basis of the day number. Each experiment took 21 days to
run. The final moisture contents were calculated by cutting another 20 mm sample from each board at
the end of the drying process, and repeating an oven-dry test. The actual moisture contents of each
board were calculated daily by weighing of the individual boards. The boards were rotated within the

Maderas. Ciencia y tecnología 8(1): 15-24, 2006
17
Within -Tree...: Cabardo and Langrish.
FIGURE 1. Cross-section of the bottom end of
log 685, showing where each ‘A’ board was taken.
FIGURE 2. Cross-section of the bottom end of
log 686, showing where each ‘A’ board was taken.
Drying Tunnel
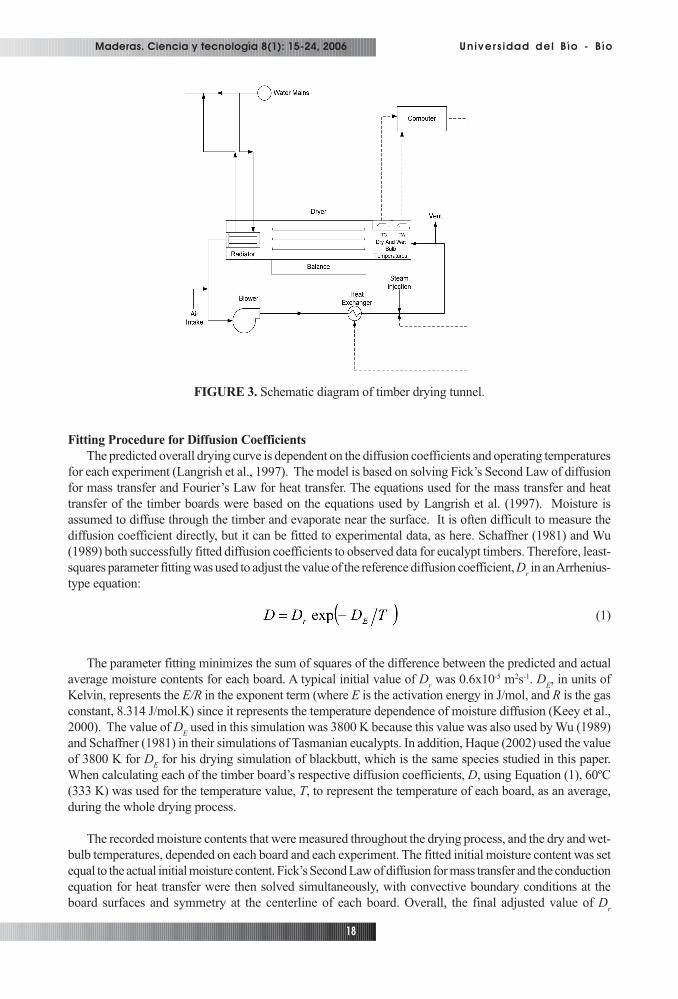
Figure 3 shows the overall design of the pilot-scale batch dryer used for drying 800 mm timber
boards. This conventional kiln was used to produce controlled drying conditions, with initial dry-bulb
and wet-bulb temperatures of 55ºC and 52ºC (Table 1), respectively, and an air velocity of 1.3 m/s
across the flat surfaces of the boards. Manipulating the steam flowrate to a steam-injection system was
used to control the wet-bulb temperature to its desired setpoint. The steam-injection system consisted
of a dryer and six-point steam injection pipe over a 300 mm duct. The control mechanism for the dry-
bulb temperature involved the flowrate adjustment of 100 kPa (gauge) steam to a finned heat exchanger
using a control valve. The overall size of the kiln working section has a volumetric capacity of 0.162
m3, a height of 0.45 m, a stream-wise length of 0.4 m, and a cross-stream width of 0.9 m. The mass of
each board was measured and used to calculate the average moisture content of each board on a daily
basis. An overall mean of these averages was then used to determine if the set points of the dry-bulb
and wet-bulb temperatures had to be altered according to the drying schedules shown in Table 1.
Overall, each experiment had the same change over times.
Table 1. Drying schedule used for all experiments (Mills, 1991).
kiln stack, on a daily basis, to minimise stacking effects on drying. Timber density was based on the
oven-dry weight/green volume, where the original sample dimensions were measured for the calculation
of the green volume.
Maderas. Ciencia y tecnología 8(1): 15-24, 2006
18
Universidad del Bío - Bío
FIGURE 3. Schematic diagram of timber drying tunnel.
Fitting Procedure for Diffusion Coefficients
The predicted overall drying curve is dependent on the diffusion coefficients and operating temperatures
for each experiment (Langrish et al., 1997). The model is based on solving Fick’s Second Law of diffusion
for mass transfer and Fourier’s Law for heat transfer. The equations used for the mass transfer and heat
transfer of the timber boards were based on the equations used by Langrish et al. (1997). Moisture is
assumed to diffuse through the timber and evaporate near the surface. It is often difficult to measure the
diffusion coefficient directly, but it can be fitted to experimental data, as here. Schaffner (1981) and Wu
(1989) both successfully fitted diffusion coefficients to observed data for eucalypt timbers. Therefore, least-
squares parameter fitting was used to adjust the value of the reference diffusion coefficient, Dr in an Arrhenius-
type equation:
(1)
The parameter fitting minimizes the sum of squares of the difference between the predicted and actual
average moisture contents for each board. A typical initial value of Dr was 0.6x10⁻⁵ m2s-1. D
E, in units of
Kelvin, represents the E/R in the exponent term (where E is the activation energy in J/mol, and R is the gas
constant, 8.314 J/mol.K) since it represents the temperature dependence of moisture diffusion (Keey et al.,
2000). The value of DE used in this simulation was 3800 K because this value was also used by Wu (1989)
and Schaffner (1981) in their simulations of Tasmanian eucalypts. In addition, Haque (2002) used the value
of 3800 K for DE for his drying simulation of blackbutt, which is the same species studied in this paper.
When calculating each of the timber board’s respective diffusion coefficients, D, using Equation (1), 60ºC
(333 K) was used for the temperature value, T, to represent the temperature of each board, as an average,
during the whole drying process.
The recorded moisture contents that were measured throughout the drying process, and the dry and wet-
bulb temperatures, depended on each board and each experiment. The fitted initial moisture content was set
equal to the actual initial moisture content. Fick’s Second Law of diffusion for mass transfer and the conduction
equation for heat transfer were then solved simultaneously, with convective boundary conditions at the
board surfaces and symmetry at the centerline of each board. Overall, the final adjusted value of Dr

Maderas. Ciencia y tecnología 8(1): 15-24, 2006
19
Within -Tree...: Cabardo and Langrish.
characterized the drying behaviour of the corresponding timber board, and along with the DE value of 3800
K and 60ºC as the value for T, the individual board’s diffusion coefficient, D, was calculated.
RESULTS AND DISCUSSION
Drying Properties and Analysis of Variance (ANOVA)
The fitting procedure fitted the drying behaviour over 95% of the cases within experimental uncertainties
when comparing the measured and the predicted average moisture content. The range of the diffusion
coefficients, the initial and final moisture contents, and the basic densities, are shown in Table 2. The initial
moisture contents decreased from pith to bark, and the basic densities increased from pith to bark. Preliminary
ANOVAs were performed on each log separately with a 75% confidence level (with 12 boards representing
each log). The preliminary ANOVA showed that circumferential and radial effects were significant sources
of the within-tree variation for the diffusion coefficients, the initial moisture contents and the basic densities.
No effects were significant for the variation of the final moisture contents within trees. Moreover, the results
for the initial moisture contents and basic densities agreed with the work reviewed by Walker (1993) regarding
hardwoods such as Yellow Birch, American Beech, and Shining Gum. He observed the same behaviour
within a single tree, i.e. initial moisture contents and basic densities varied from pith to bark. In addition,
Wimmer (2000) observed an increase in basic density and a decrease in moisture content from pith to bark
for softwoods, similar to our results with hardwoods. Walker (1993) also suggested that wood material with
low basic density had a high initial moisture content and vice versa. Wood with a low basic density has a
considerable volume of void space that water can fill when the timber is green, because the low basic
density means a small volume of wood material in the cell walls. Furthermore, the ANOVA showed that the
height effect (except for initial moisture content) is not a significant source of variation for the basic densities
and the diffusion coefficients. For this work, an ANOVA using 18 boards from each log was also conducted,
and the results emphasise that only radial effects were likely to be significant sources of variation for the
diffusion coefficient. Overall, these results support the previous suggestion that the behaviour of these three
parameters changes across the radius of the log.
Table 2. Timber properties for blackbutt timber (thirty-six boards).
Principal Components Analysis
A correlation between high initial moisture contents, higher diffusion coefficients, and low basic densities
was observed with the measured and calculated drying properties. The timber boards with higher densities
had more wood material per unit volume. This may either be due to large cell volumes and/or more cell-wall
material, leaving less space for water to occupy, which explains the low initial moisture contents for timber
boards with high densities (Keey et al., 2000; Walker, 1993). In addition, more wood material means a
higher resistance to diffusive transport of moisture (Keey et al., 2000). Therefore the diffusion coefficient is
expected to be low in high density wood. A principal component analysis (PCA) (Smith, 2002) was performed
on the three parameters. If these parameters are closely correlated, then the PCA should result in only one
large principal component, and one large eigenvalue and eigenvector (Smith, 2002; Britton et al., 1999).
The results of the PCA showed that the first and largest eigenvalue accounted for 96% of the total amount of
variation within these parameters, shown in Figure 4, giving some evidence in support of the above-mentioned

Maderas. Ciencia y tecnología 8(1): 15-24, 2006
20
Universidad del Bío - Bío
correlation between the parameters. The strong correlation between the diffusion coefficient, D, and the
initial moisture content, Xi (and basic density) is represented by Equation (2):
(2)
Figure 4 shows that boards with high initial moisture contents have low basic densities, and thus high
diffusion coefficients. One board from log 1 had a high basic density, but had a high diffusion rate; possibly
due to the crack present throughout the length of the board.
FIGURE 4. Three-dimensional plot of the parameters from Principal Components Analysis, together
with the principal eigenvector.
Comparing the Effects of Different Drying Schedules
The effects of different drying schedules and the measured variabilities of initial moisture contents and
diffusion coefficients on the variability of final moisture contents, when the average moisture content within
a stack of timber reached 15%, were predicted by using the same drying model. Tables 3 to 5 show the
drying schedules used for this comparison. These drying schedules were used by Kärki (2002), whose
experiment dried European aspen (hardwood), Innes and Redman (2003) to model the drying of six different
regrowth hardwoods including blackbutt, and for this study, a revised drying schedule by adding 5ºC to the
dry and wet-bulb temperatures to the drying schedule in Table 1. The results from these drying schedules
have then been compared, in terms of the dispersion of the final moisture contents, with the drying schedule
used for the experiment in this paper (Table 1). The data used with the 12 timber boards chosen for this
simulation were the boards with the highest and lowest initial moisture contents from each drying experiment.

Maderas. Ciencia y tecnología 8(1): 15-24, 2006
21
Within -Tree...: Cabardo and Langrish.
Table 3. Drying schedule used by Kärki (2002) to dry European aspen.
Table 4. Drying schedule used by Innes and Redman (2003) to dry blackbutt timber.
Table 5. Revised drying schedule, for this study, by using the drying schedule from Mills (1991) to dry
25 mm thick blackbutt timber and adding 5ºC to the temperatures.
Table 6. Statistical analysis of the predicted final moisture contents using the different drying schedules.
Table 6 shows the different effects of each drying schedule on the time that it takes for the timber stack
to reach an average moisture content of 0.15 kg/kg, and the dispersion of final moisture contents. These
results show a trade off between the shortness of the drying schedule and the dispersion of final moisture
contents. Drying schedule 2 gave the shortest time for the stack of timber to reach the target average moisture

Maderas. Ciencia y tecnología 8(1): 15-24, 2006
22
Universidad del Bío - Bío
content, but its conditions produced the largest dispersion of final moisture contents. Drying schedule 3
gave the longest drying time, but the dispersion of final moisture contents was two times smaller (0.093)
compared with the dispersion of final moisture contents from drying schedule number 2 (0.193). On the
other hand, the conditions of drying schedules 1 and 4 seem to be similar in terms of the distribution of final
moisture contents. However, increasing all the temperatures in drying schedule 1 by 5ºC (drying schedule 4)
reduced the drying time. Elevated temperatures increase the diffusion coefficient and hence the drying rate,
decreasing the drying time.
There are limitations, however, associated when using high temperatures in kiln drying. Collapse is an
abnormal shrinkage in the timber at moisture contents above the fibre saturation point during drying, and
many Australian eucalypt timbers are prone to collapse (Chafe et al., 1992; Innes, 1996). Innes (1995) used
a stress-strain model to assess the stress and strain distributions within the fibre cell walls of Tasmanian
eucalypt and found that the stresses and strains in the fibre cell wall were sensitive to small variations in
temperature. In another study comparing three drying strategies aimed to avoid collapse checking for
Tasmanian eucalypt, Innes (1996) suggested there was a "collapse threshold" temperature for any timber
specimen, above which collapse was likely to be severe. In addition, due to reactions involving some
constituents in the wood along with the combined effect of high temperature and relative humidity (MTC,
2002), sometimes discolouration of the timber occurs when kiln drying. The discolouration of the timber
may become unacceptable, especially for appearance grade products (AS/NZS 4787:2001). McCurdy et al.
(2003) reported that high drying temperatures (as high as 120ºC) enhanced the darkening of Pinus radiata
sapwood boards and thus, both temperature and drying time were significant factors for timber discolouration
during drying.
In general, from this study, it may be possible to develop a drying schedule that increases the productivity
of timber, i.e. amount of good quality timber divided by the drying time, (Pordage and Langrish, 2000) by
accounting for biological variability and considering the mentioned limitations (which were stress and
strain constraints, and the maximum temperatures that can be reached before collapse and discolouration
occurs). This development can be done by using the data for this variability in the diffusion coefficients, the
initial moisture contents, and the basic densities measured in this work, and the shrinkage coefficients
(which are not reported in this paper).
CONCLUSIONS
Within a tree, the initial moisture contents decreased from pith to bark, and the basic densities increased
from pith to bark. A correlation between the initial moisture content, the basic density, and the diffusion
coefficient, using Principal Components Analysis (PCA), was observed from each board. Timber boards
with high initial moisture contents had low basic densities and high diffusion coefficients. This observation
may be connected with the link between less wood material, more space for water in the green timber, and
the increased ease with which moisture can diffuse through the timber board.
Different drying schedules affected the time taken to reach an average stack moisture content of 15%,
and the distribution of final moisture contents of the 12 timber boards. The drying schedule that was also
used for the experiments, and the revised version of the same schedule, were similar in terms of the dispersion
of final moisture contents, but the latter producing a shorter drying time. Overall, from this simulation study,
the presence of variability in the timber properties implicitly affects the drying rate and the dispersion of
final moisture contents by the choice of the drying schedule used.
ACKNOWLEDGEMENTS
This work is supported by the Australian Research Council, Forests NSW- a special mention to Dr. Ross
Dickson and Mr. Bill Joe, and J. Notaras and Sons, Grafton. The authors are very grateful for their support
and help for this project.
Maderas. Ciencia y tecnología 8(1): 15-24, 2006
23
Within -Tree...: Cabardo and Langrish.
REFERENCES
ABARE. 2001. Australian Forest and Wood Products Statistics, March and June quarters 2001. ABARE,
Canberra, p. 13.
Alexiou, P.N. 1993. Accelerated Kiln-Drying and Drying Stresses in Regrowth Blackbutt Eucalyptus
Pilularis Sm. M. Sci. Thesis, Australian National University, Australia, pp. 31-44, 57-75.
Australian/New Zealand Standard™ AS/NZS 4787:2001. Timber – Assessment of Drying Quality,
Standards Australia, Standards New Zealand, accessed March 12, 2003.
Boland, D.J.; Booker, M.I.H.; Chippendale, G.M.; Hall, N.; Hyland, B.P.M.; Johnston, R.D.;
Kleinig, D.A.; Turner, J.D. 1989. Forest Trees of Australia, CSIRO Melbourne.http://data.brs.gov.au/
mapserv/plant/species.php?speciesid=14, accessed November 24, 2003.
Booker, J. 1994. Improved Hardwood Timber Seasoning Productivity. PhD Thesis, Faculty of
Engineering, University of Tasmania, Australia, pp. iv-ix, 46-64, 116-126.
Britton, S.C.; Coleman. C.E.; Henderson, J. 1999. The Little Blue Book. School of Mathematics and
Statistics, University of Sydney, pp. 60-62.
Campbell, G.S. 1980. Index of Kiln Drying Schedules for Timber Dried in Australia. Commonwealth
Scientific and Industrial Research Organisation Building Research Division.
Caswell, T. 2005. Native Forestry is a way for wood. The Australian Newspaper, March 21, 2005, p. 30.
Chafe, S.C.; Barnacle, J.E.; Hunter, A.J.; Ilic, J.; Northway, R.L.; Rozsa, A.N. 1992. Collapse: An
Introduction. CSIRO Division of Forest Products, Melbourne, Australia.
Cronin, K.; Baucour, P.; Abodayeh, K.; Barbot Da Silva., A. 2003. Probabilistic Analysis of Timber
Drying Schedules. Drying Technology 21(8): 1433-1456.
Doe, P.E; Innes, T.C. 1999. Seasonability Determination from In-Log Property Measurements.
Proceedings Sixth IUFRO International Wood Drying Conference, Stellenbosch, South Africa, pp. 117-
120.
Doe, P.E.; Oliver, A.R.; Booker, J.D. 1994. A Non-Linear Strain and Moisture Content Model of
Variable Hardwood Drying Schedules. Proceedings Fourth IUFRO International Wood Drying Conference,
Rotorua, New Zealand, pp.203-210.
Ferguson, I.S.; Fox, J.; Baker, T.; Stackpole, D.; Wild, I. 2002. National and Regional Plantation
Wood Availability 2001-2044. Consultant’s Report for National Forest Inventory, Bureau of Rural Sciences,
Canberra.
Haque, N. 2002. Modelling of Solar Kilns and the Development of an Optimised Schedule for Drying
Hardwood Timber. PhD Thesis. The University of Sydney, Australia, pp. 78-79, 158.
Innes, T.C. 1995. Stress Model of a Wood Fibre in Relation to Collapse. Wood Science and Technology
29: 363-376.
Innes, T.C. 1996. Pre-drying of Collapse Prone Wood Free of Surface and Internal Checking. Holz als
Roh- und Werkstoff 54: 195-199.
Maderas. Ciencia y tecnología 8(1): 15-24, 2006
24
Universidad del Bío - Bío
Innes, T.C.; Redman, A.L. 2003. Comparative Drying Characteristics of Six Regrowth Australian
Hardwoods, Proceedings Eight International IUFRO Wood Drying Conference, Brasov, Romania, Aug 24-
29; International Union of Forest Research Organizations; 101-105.
Johnson, I.G. and Nikles, D.G. 1996. Plan for Developing and Deploying Genetically- Improved
Varieties of Blackbutt (E.pilularis Smith) in NSW. State Forests of New South Wales Technical Paper,
Number 63, pp. 1-5.
Kärki, T. 2002. Drying Quality of European Aspen (Populus tremula) Timber. Holz als Roh- und Werkstoff
60: 369-371.
Kayihan, F. 1993. Adaptive Control of Stochastic Batch Lumber Kilns. Computers and Chemical
Engineering 17(3): 265-273.
Keey, R.B.; Langrish. T.A.G.; Walker, J.C.F. 2000. Kiln Drying of Lumber. Springer Verlag, Berlin,
pp. 65-115, 175-181.
Langrish, T.A.G.; Brooke, A.S.; Davis, C.L., Musch, H.E; Barton, G.W. 1997. An Improved Drying
Schedule for Australian Ironbark Timber: Optimization and Experimental Validation. Drying Technology
15(1): 47-70.
Malaysian Timber Council (MTC). 2002. Staining and Discolouration. http://www.mtc.com.my/
publication/library/drying/ch46.htm, accessed May 4, 2005.
McCurdy, M.; Pang, S.; Keey, R. 2003. Measurements of Colour Development in Pinus radiata Sapwood
Boards During Drying at Various Schedules , Proceedings Eight International IUFRO Wood Drying
Conference, Brasov, Romania, Aug 24-29; International Union of Forest Research Organizations; 445-449.
Mills, R. 1991. Australian Timber Seasoning Manual. Australian Furniture Research and Development
Institute Limited, pp. 160-166.
Pordage, L.J.; Langrish, T.A.G. 2000. Optimization of Hardwood Drying Schedules Allowing for
Biological Variability. Drying Technology 18(8): 1797-1815.
Schaffner, R.D. 1981. Fundamental Aspects of Timber Seasoning, M.Eng.Sci. Thesis, Faculty of
Engineering Science, Faculty of Engineering, University of Tasmania, Australia, pp. 130-135.
Siau, J.F. 1984. Transport Processes in Wood. Springer Verlag, New York, p. 25.
Smith, L.I. 2002. A Tutorial on Principal Components Analysis.http://www.cs.otago.ac.nz/cosc453/
student_tutorials/principal_components.pdf, accessed March 19, 2004.
Walker, J.C.F. 1993. Primary Wood Processing. Chapman & Hall, London, pp. 68-74.
Wimmer, R. 2000. Wood Quality - Causes, Methods, Control.http://www.boku.ac.at/botanik/wood/
woodquality/Chapter4.pdf, accessed August 15, 2003.
Wu, Q. 1989. An Investigation of Some Problems in Drying of Tasmanian Eucalypt Timbers. M.Eng.Sci.
Thesis, University of Tasmania, Hobart, pp. 140-141
Top Related
Copyright © 2022 FDOKUMEN

