


Bahasa
Halaman
Hukum

1318 volume 118 | number 9 | September 2010 • Environmental Health Perspectives
Research | Children’s Health
The National Children’s Study (NCS) is the most ambitious study ever attempted in the United States, and arguably the world, to assess how environmental factors affect child health and development. To complete the project, 100,000 children from across the United States—the largest pregnancy cohort in the history of the country—will be fol-lowed from gestation until 21 years of age. The ultimate goal of the study is to improve the health and well-being of children (NCS 2010). Its appropriately broad definition of environment encompasses the following:•Naturalandhuman-madeenvironmental
factors•Biologicalandchemicalfactors•Physicalsurroundings•Socialfactors•Culturalandfamilyinfluencesanddifferences•Geographiclocations.
Populationhealthdisparitiesareviewedas a function of gradients in environmen-tal exposures; health care access, utilization, orquality;andhealthstatus(Carter-PokrasandBaquet2002;Gibbons2005).TheNCSwill combine direct measures of environ-mental media and biological specimens with
indirect questionnaire measures (e.g., health care access, utilization, and quality; health sta-tus, age, sex, income, education) and extant demographic, geographic, and environmental data(Needhametal.2005).TheNCSrepre-sents a strategic opportunity to synthesize les-sons and methods from epidemiology, clinical science,andriskassessment(Gillilandetal.2005;Trasandeetal.2009).
To reach NCS goals, new inter disciplinary methods are needed, including methods to select a sample representative of children nation-wide, a “unique and demanding challenge” (Scheidtetal.2009).Asafirstsamplingstage,NCSinvestigatorschose105studysitesbasedon geographic and demographic characteris-tics, including 10 pilot Vanguard Centers and 95othersitestobeimplementedinthreewaves(waves 1, 2, and 3). Investigators must then determine site-specific protocols to stratify local populations in accordance with health- relevant social and environmental characteristics, to maximize their power to detect associations. For example, one Vanguard Center, Queens County,NewYork, used community boundar-ies previously defined in 2007 by the NewYorkCityDepartmentofCityPlanningtodelineate
18 strata,andthencheckedforhomogeneitywithin strata using census data on race, ethnic-ity, education, income, and foreign-born status (Lioyetal.2009).
In this report we describe the stratification process developed for the wave 1 Worcester County, Massachusetts, site that began in 2007 as the Mass CHILD (Massachusetts Child Health Indicators and Life Determinants) project under the aegis of the University of Massachusetts Medical School. Specifically, we discuss the process used to divide Worcester County into viable strata that represent its health-relevant environmental and socio-demographic variability, and the potential our approach has to inform stratification elsewhere.
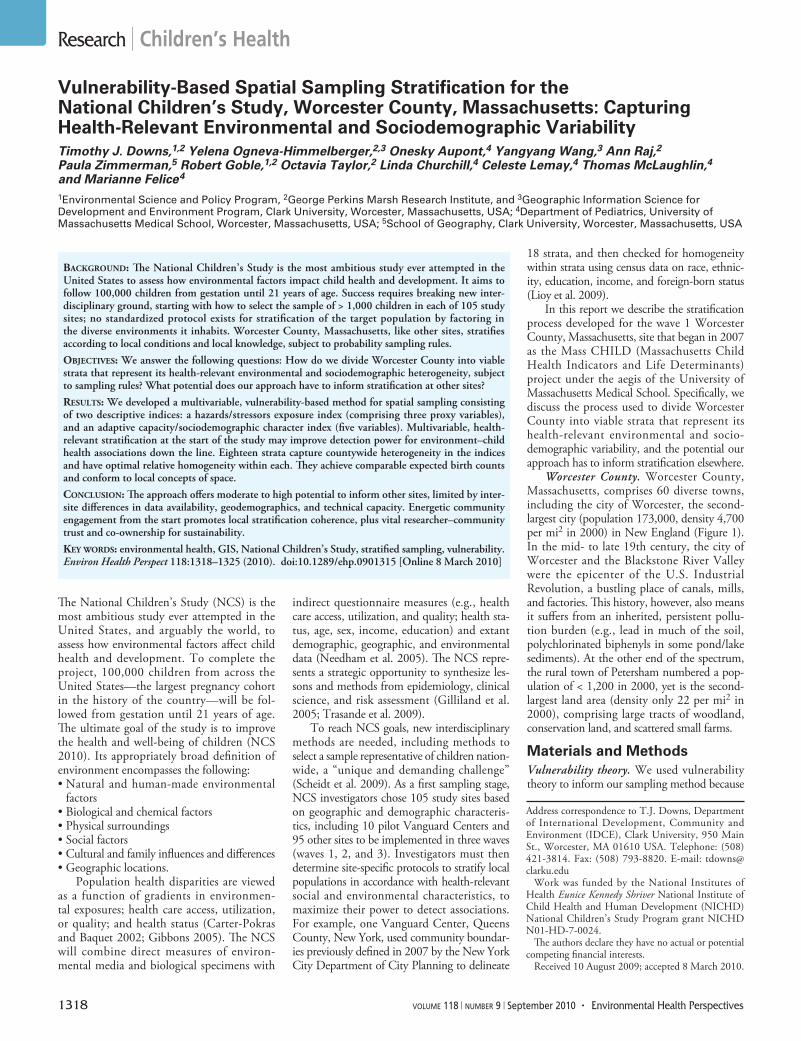
Worcester County. Worcester County, Massachusetts, comprises 60 diverse towns, including the city of Worcester, the second-largest city (population 173,000, density 4,700 per mi2 in 2000) in New England (Figure 1). In the mid- to late19thcentury,thecity of WorcesterandtheBlackstoneRiverValleywere the epicenter of the U.S. Industrial Revolution,abustlingplaceofcanals,mills, and factories. This history, however, also means it suffers from an inherited, persistent pollu-tion burden (e.g., lead in much of the soil, polychlorinated biphenyls insomepond/lakesediments).Attheotherendofthespectrum,theruraltownofPetershamnumbereda pop-ulation of < 1,200 in 2000, yet is the second-largest land area (density only 22 per mi2 in 2000), comprising large tracts of woodland, conservation land, and scattered small farms.
Materials and MethodsVulnerability theory. We used vulnerability theory to inform our sampling method because
AddresscorrespondencetoT.J.Downs,Departmentof International Development, Community and Environment(IDCE),ClarkUniversity,950MainSt.,Worcester,MA01610USA.Telephone:(508)421-3814.Fax:(508)793-8820.E-mail: [email protected] fundedby theNational Institutes of
Health Eunice Kennedy Shriver National Institute of Child Health and Human Development (NICHD) NationalChildren’sStudyProgramgrant NICHD N01-HD-7-0024.
The authors declare they have no actual or potential competing financial interests.Received10August2009;accepted8March2010.
Vulnerability-Based Spatial Sampling Stratification for the National Children’s Study, Worcester County, Massachusetts: Capturing Health-Relevant Environmental and Sociodemographic VariabilityTimothy J. Downs,1,2 Yelena Ogneva-Himmelberger,2,3 Onesky Aupont,4 Yangyang Wang,3 Ann Raj,2 Paula Zimmerman,5 Robert Goble,1,2 Octavia Taylor,2 Linda Churchill,4 Celeste Lemay,4 Thomas McLaughlin,4 and Marianne Felice4
1Environmental Science and Policy Program, 2George Perkins Marsh Research Institute, and 3Geographic Information Science for Development and Environment Program, Clark University, Worcester, Massachusetts, USA; 4Department of Pediatrics, University of Massachusetts Medical School, Worcester, Massachusetts, USA; 5School of Geography, Clark University, Worcester, Massachusetts, USA
Background: The National Children’s Study is the most ambitious study ever attempted in the United States to assess how environmental factors impact child health and development. It aims to follow 100,000 children from gestation until 21 years of age. Success requires breaking new inter-disciplinary ground, starting with how to select the sample of > 1,000 children in each of 105 study sites; no standardized protocol exists for stratification of the target population by factoring in the diverse environments it inhabits. Worcester County, Massachusetts, like other sites, stratifies according to local conditions and local knowledge, subject to probability sampling rules.
oBjectives: We answer the following questions: How do we divide Worcester County into viable strata that represent its health-relevant environmental and sociodemographic heterogeneity, subject to sampling rules? What potential does our approach have to inform stratification at other sites?
results: We developed a multivariable, vulnerability-based method for spatial sampling consisting of two descriptive indices: a hazards/stressors exposure index (comprising three proxy variables), and an adaptive capacity/sociodemographic character index (five variables). Multivariable, health-relevant stratification at the start of the study may improve detection power for environment–child health associations down the line. Eighteen strata capture countywide heterogeneity in the indices and have optimal relative homogeneity within each. They achieve comparable expected birth counts and conform to local concepts of space.
conclusion: The approach offers moderate to high potential to inform other sites, limited by inter-site differences in data availability, geodemographics, and technical capacity. Energetic community engagement from the start promotes local stratification coherence, plus vital researcher–community trust and co-ownership for sustainability.
key words: environmental health, GIS, National Children’s Study, stratified sampling, vulnerability. Environ Health Perspect 118:1318–1325 (2010). doi:10.1289/ehp.0901315 [Online 8 March 2010]
Vulnerability-based sampling stratification
Environmental Health Perspectives • volume 118 | number 9 | September 2010 1319
it contemplates both exposure to stressors and adaptive capacity, lending itself to the expan-sive notion of environment. Vulnerability to adverse health and developmental outcomes is alsoinfluencedbyage,sex,andgenetics.Anextensionofrisktheory,vulnerabilityhasbeendefined as “differential capacity to deal with hazards, based on the position of groups and individuals within both the physical and social worlds”[Ahmadetal.2001;NEJAC(NationalEnvironmentalJusticeAdvisoryCouncil)/U.S.Environmental Protection Agency (EPA) 2004]. Dimensions of vulnerability include•Differentialexposuretoriskagentsorstres-
sors (e.g., toxics, blight, crime—a function of the physical and social environments)
•Differential susceptibility and sensitivity to adverse consequences of exposure. Whereas susceptibility ispredispositionor lackofresistanceandisrelatedtothelikelihoodofoutcomes occurring, sensitivity is related to howthatlikelihoodchangeswithchangesinexposure; and both are functions of genetics, sex, age, and immune status.
•Differential individualandgroupcoping/adaptive capacity and preparedness to respond—a function of biological variables such as health status and socioeconomic vari-ables such as access to financial resources, sociopoliticalnetworks,andinformation
•Differentialindividualandgroupresilience/ability to recover from adverse effects—also a function of sociobiological variables (Downs and Larson 2007).
Sampling theory. The sampling frame for the NCS consists of a list of women who are pregnantorlikelytobecomepregnantandwhoreside in the selected segments/strata at the time of sampling and recruitment (one-quarter of total sample size each year for 4 years, antici-pated 2011/2012 to 2014/2015 for our site). The probability of selection is equal for all women in the sampling frame at all stages of the selection process. Eligible women are selected independently of one another. Spatial sampling is used to define segments/strata from which the probability sample is drawn. It starts with construction of a frame that separates eligible women into strata according to where they live. Strata must be relatively homogeneous within each stratum (small variances of attributes cho-sen), but heterogeneous among themselves (Mulvey1983),representingtheheterogene-ity of vulnerability in the county. In addition, strata were limited to a reasonably small number (preferably12–15andnotexceeding20)andhad to fully cover the county, be contiguous, have comparable (mean ± 10%) measures of size (MOS; expected births/year), and conform to local concepts of space to be coherent to local people. Each stratum is subsequently subdivided into smaller spatial segments with comparable MOS that also conform to local neighborhood characteristics. One segment is then randomly
selected from each stratum, and together these segments constitute the representative random sample of geographic space in the county inhab-itedbywomenwhoarepregnantorlikelytobecome pregnant (Montaquila et al. 2007).
During the stratification process, data at fourspatialscaleswereconsidered:censusblock,censusblock-group,censustract,andtown.Weconsideredthecensusblock-grouptobethe most appropriate scale because it is neither too small with too much data nor too large to lose spatial resolution. In addition, valuable sociodemographic data from U.S. Census are readilyavailableattheblock-groupscale.Weused Census 2000 data at the block-group level (U.S.CensusBureau2001)asthebasis foraggregation and used more recent intercensus data available for areas that have populations of 20,000 or more (currently, 6 of 60 towns in
Worcester County, according to the 2008 pop-ulation estimates from the U.S. CensusBureau’swebpage,accessed14December2009).Thereare595block-groupsinWorcesterCounty, Massachusetts. On average, 1,262 people were livinginacensusblock-groupin2000,butwithwidevariation(SD650;range104–4,332).
Descriptive vulnerability indices. We cre-ated two spatially explicit descriptive indices, one comprising proxies for hazards and stressors exposure (H), the second comprising indica-tors that describe adaptive capacity and social character(A).Theapproachisforward-casting,inthatweuseHandAdescriptorstodefinestrata because we assume they will be associ-ated with health and development variability in children; they cannot be predictive at this stage. Our indices are similar to other descrip-tive indices such as the Human Development
Figure 1. Map of Worcester County. Shows land use/land cover types, town boundaries and major roads. Data from MassGIS (2009).
City of Worcester
AgricultureVegetationResidentialIndustrial/commercial/transportationWater/pools/beaches
0 5 10 20 kilometers
Downs et al.
1320 volume 118 | number 9 | September 2010 • Environmental Health Perspectives
Index (HDI), a descriptor of development/ poverty status that weights its three constituent variables (indicators of education, income, and health) equally [United Nations Development Programme(UNDP)2009]. Two methods of combiningHandAindicesintoavulnerabilityrating (V) were explored. The first,V=H/A, seems logical, because vulnerability is inversely related to adaptation. However, V = 1/1 = 1 is not equivalent to V = 5/5 = 1, because one unit ofHisnotthesameasoneunitofA.(Contrast thiswith thewell-knowneconomicmetricof cost/benefit ratio). The preferred method preservedinformationintheformV=[H,A], rangingfrom5,1(worst)to1,5(best),yielding25possiblecombinations(Table1).
Hazards/stressors exposure index (H). Three attributes/variables/indicators were used toderiveH.Populationstresswasclassifiedbased on population density (people per square mile per block-group in 2000) (MassGIS2009).Road/transportationstress—aproxyindicatorofairpollution,trafficaccidentrisk,built- environment stressors such as traffic con-gestion, and the urban–rural continuum—was classified based on average daily traffic density [estimated average daily numbers of cars per square mileperblock-group,obtainedfrom Massachusetts Executive Office of Transportation(MassDOT2009)].Pollutionstress was classified according to the density of stationary sources of pollution including 21E MassachusettsContingencyPlanwastecleanupsites,ToxicsReleaseInventory(TRI)toxicsrelease sites, and Superfund sites [specifically, the total number of stationary pollution sources per square mileperblock-groupbasedonTRIand superfund site locations downloaded from the U.S. EnvironmentalProtectionAgency(U.S. EPA2009)andstatewastecleanupsitesobtainedfromMassGIS(2009)].Ineachcase,a higher indicator value indicated higher stress.
Individual indicator values were aggre-gated to population-weighted average values for their parent town and standardized to a range of values between 0 and 10:
Standardized value (SV) = range width × (raw value – min value) ÷ (max value – min value), [1]
where range width is the difference between maximum and minimum standardized values (in our case, range width = 10), raw value is the
value of an indicator for a town, and min and max values are the minimum and maximum values for this indicator in the entire data set.
Once standardized, variables were aggre-gated into a composite index Hs (scale 0–10) using multicriteria tools in geographic infor-mation systems (GIS)(Eastman1999):
Hs = w1 × SV1 + w2 × SV2 + … + wn × SVn, [2]
where w1 – wn are weights assigned respec-tively to n variables/indicators, and SV1 – SVn are standardized values of these indicators for each town.
Values of Hs were then divided into five classes of H (with cut points determined by naturalbreaks indata values), using clas-sification tools inArcGISsoftware (ESRI,Redlands,CA):verylow(1),low(2),moder-ate (3), high (4), and veryhigh(5).
Adaptive capacity/social character index (A). TheAindexcomprisedfivevariablesfromthe U.S. Census 2000 (U.S. Census 2001). Education level was classified based on the percentageof thepopulation>25years of age with high school as the highest level of education. Economic level was based on two indicators: income (median annual house-hold income) and poverty level (percentage of households at or below the poverty level).
Linguistic isolation level was determined by the percentage of households that were not primarilyEnglish-speaking.Minoritylevelwasdetermined by the percentage of the popula-tion from minority groups (e.g.,black,Latino,Asian).Higher values of education level,poverty level, and linguistic isolation level indicate lower adaptive capacity, and higher income level indicates higher adaptive capac-ity.Although it isnotappropriate to inferthat adaptive capacity is a function of race or ethnicity in isolation, a population with high proportions of minority residents in conjunc-tion with very low adaptive capacity based on other indicators is considered a highly vulner-able social group: an “environmental justice” population.AswithindividualHindicators,block-groupvaluesofindividualAindicatorswere aggregated to population-weighted aver-age values at the town scale, then standardized and aggregated and divided into five classes so thatthefinalindexArangesfrom1 to 5.
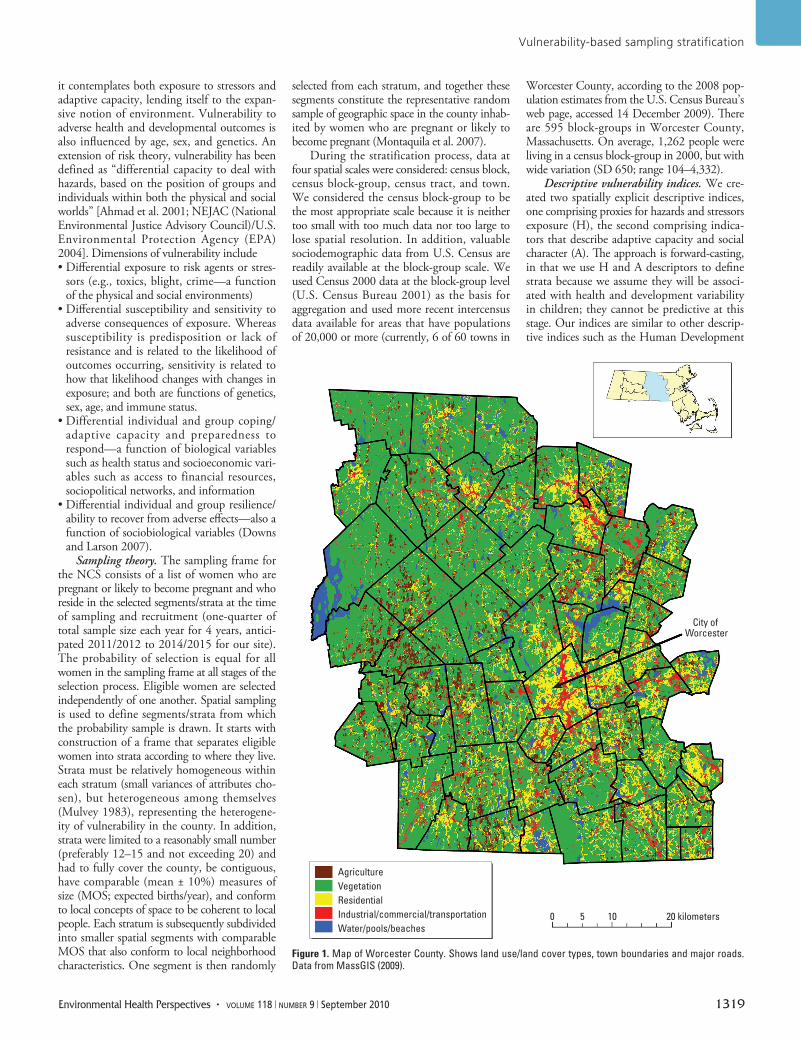
Figure 2 shows the vulnerability rating and MOS for each town. Towns range from very low hazard, very high adaptive capacity rating (1,5)forPetershamtoveryhighhazard,verylowadaptive capacity (5,1) for parts of Worcester City, a full spectrum of possible ratings.
We sought to delineate 18 strata as a rea-sonable number to capture overall hetero-geneity; each stratum was required to have
Table 1. Vulnerability rating scheme V = [H,A] using five classes for both indices.
Hazard index (H)
Adaptation index (A)Very low Low Moderate High Very high
Very low 1,1 1,2 1,3 1,4 1,5 (best)Low 2,1 2,2 2,3 2,4 2,5Moderate 3,1 3,2 3,3 3,4 3,5High 4,1 4,2 4,3 4,4 4,5Very high 5,1 (worst) 5,2 5,3 5,4 5,5 Figure 2. Map showing [H,A] ratings and MOS by town. Number in italics is MOS (expected births/year).
0 10 20 kilometers
Vulnerability-based sampling stratification
Environmental Health Perspectives • volume 118 | number 9 | September 2010 1321
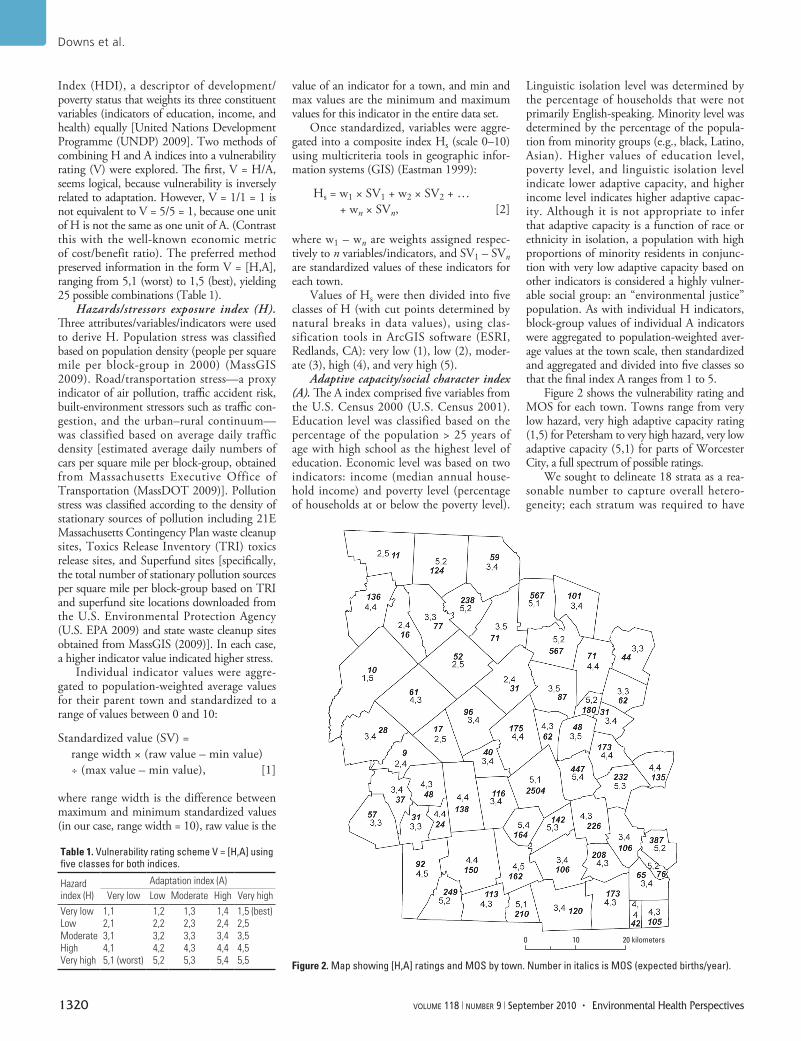
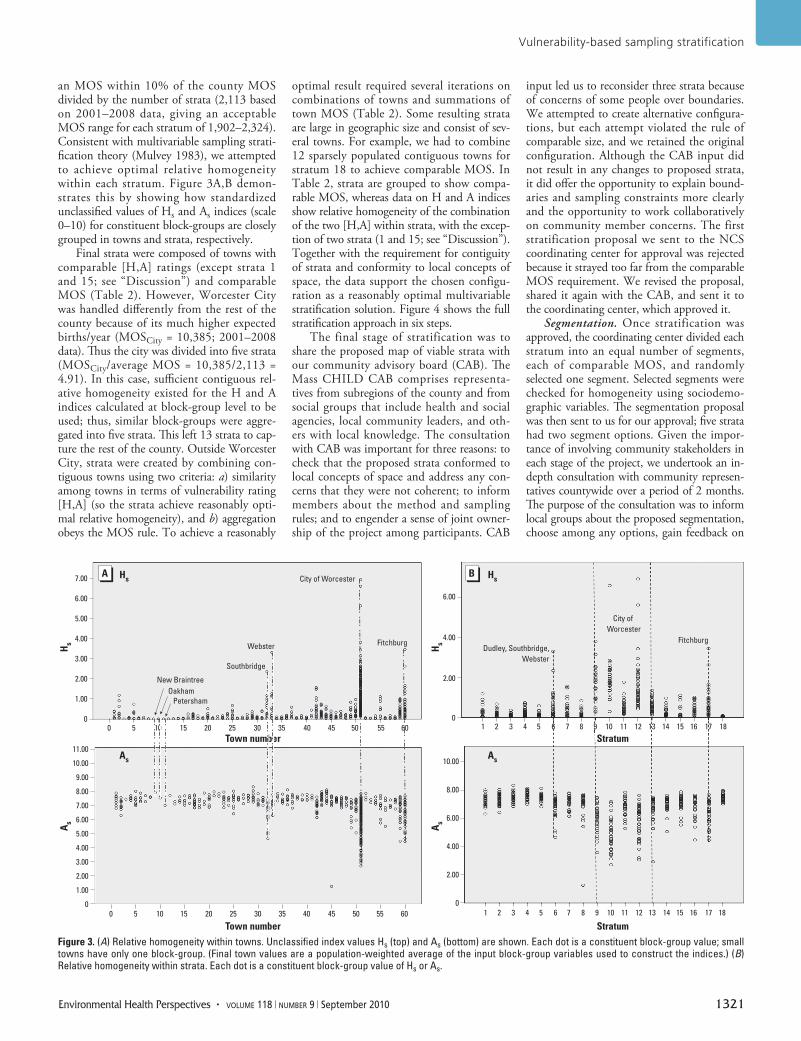
an MOS within 10% of the county MOS divided by the number of strata (2,113 based on 2001–2008 data, giving an acceptable MOS range for each stratum of 1,902–2,324). Consistent with multivariable sampling strati-ficationtheory(Mulvey1983),weattemptedto achieve optimal relative homogeneity withineachstratum.Figure3A,Bdemon-strates this by showing how standardized unclassified values of HsandAs indices (scale 0–10)forconstituentblock-groupsarecloselygrouped in towns and strata, respectively.
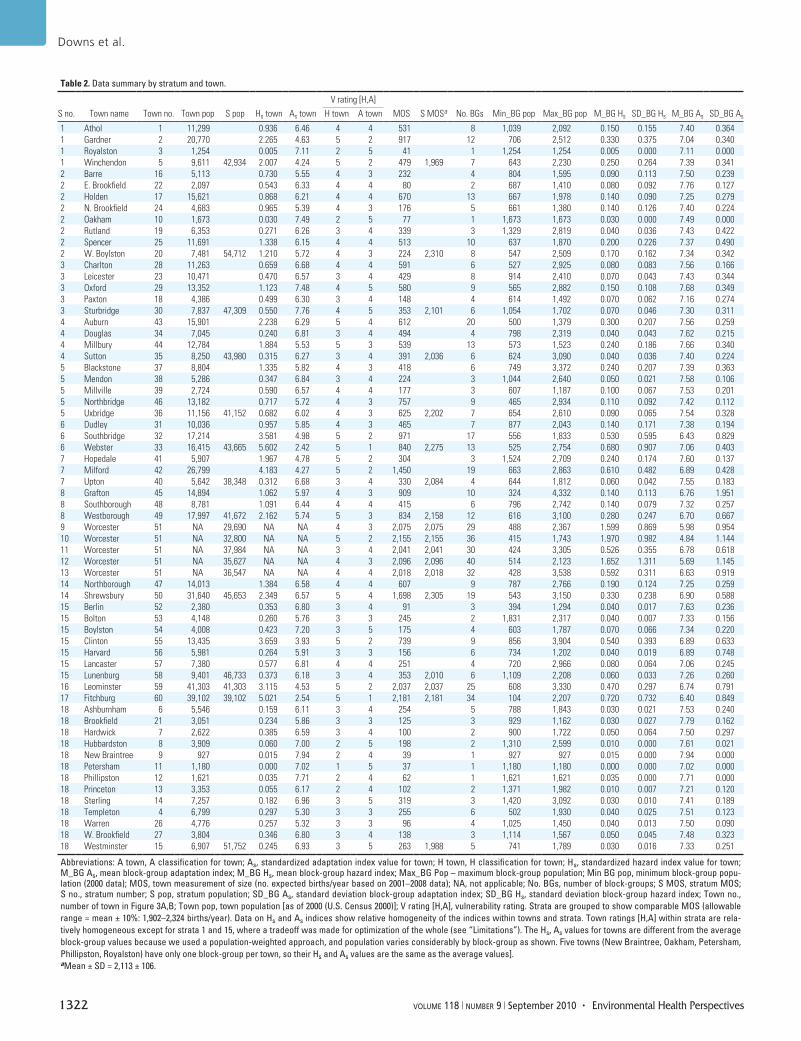
Final strata were composed of towns with comparable [H,A] ratings (except strata 1 and15; see “Discussion”) and comparable MOS (Table 2). However, Worcester City was handled differently from the rest of the county because of its much higher expected births/year (MOSCity=10,385; 2001–2008 data). Thus the city was divided into five strata (MOSCity/average MOS=10,385/2,113=4.91).Inthiscase,sufficientcontiguousrel-ativehomogeneityexistedfor theHandAindicescalculatedatblock-groupleveltobeused; thus,similarblock-groupswereaggre-gated into five strata. This left 13 strata to cap-ture the rest of the county. Outside Worcester City, strata were created by combining con-tiguous towns using two criteria: a) similarity among towns in terms of vulnerability rating [H,A](sothestrataachievereasonablyopti-mal relative homogeneity), and b) aggregation obeys the MOS rule. To achieve a reasonably
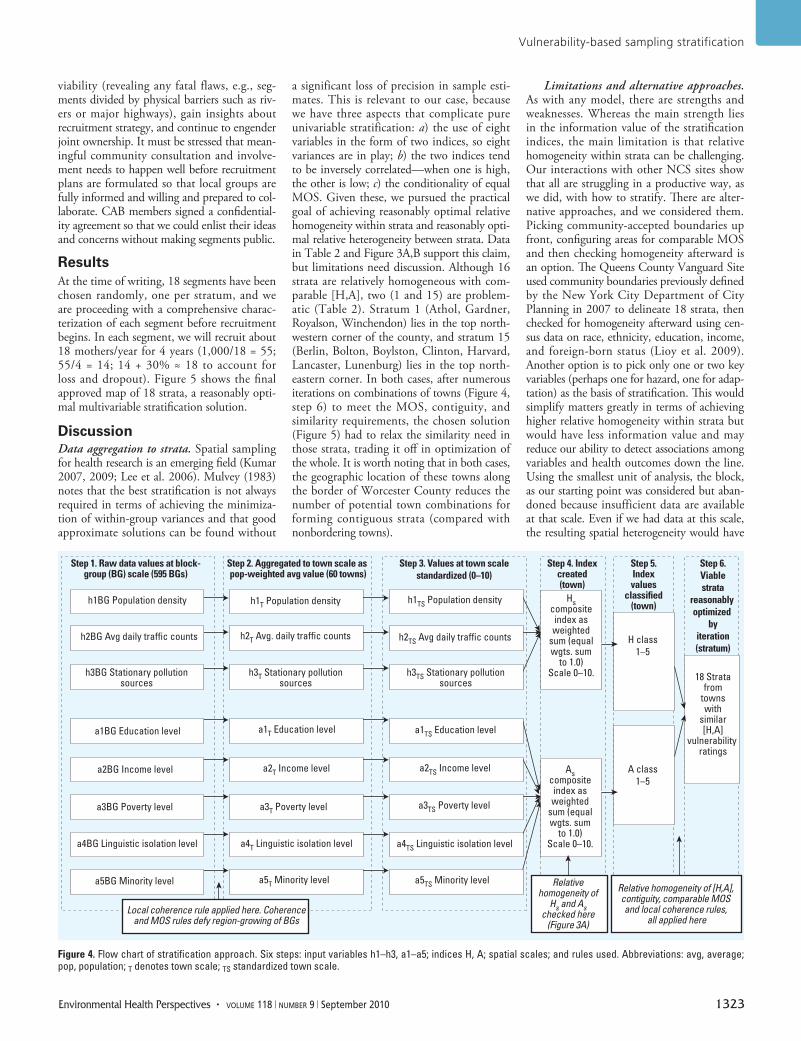
optimal result required several iterations on combinations of towns and summations of town MOS (Table 2). Some resulting strata are large in geographic size and consist of sev-eral towns. For example, we had to combine 12 sparsely populated contiguous towns for stratum 18 to achieve comparable MOS. In Table 2, strata are grouped to show compa-rable MOS, whereas dataonHandAindicesshow relative homogeneity of the combination ofthetwo[H,A]withinstrata,withtheexcep-tionoftwostrata(1and15; see “Discussion”). Together with the requirement for contiguity of strata and conformity to local concepts of space, the data support the chosen configu-ration as a reasonably optimal multivariable stratification solution. Figure 4 shows the full stratification approach in six steps.
The final stage of stratification was to share the proposed map of viable strata with ourcommunityadvisoryboard(CAB).TheMass CHILDCABcomprises representa-tives from subregions of the county and from social groups that include health and social agencies, local community leaders, and oth-erswith localknowledge.TheconsultationwithCABwasimportantforthreereasons:tocheckthattheproposedstrataconformedtolocal concepts of space and address any con-cerns that they were not coherent; to inform members about the method and sampling rules; and to engender a sense of joint owner-shipoftheprojectamongparticipants.CAB
input led us to reconsider three strata because of concerns of some people over boundaries. We attempted to create alternative configura-tions, but each attempt violated the rule of comparable size, and we retained the original configuration. AlthoughtheCABinputdidnot result in any changes to proposed strata, it did offer the opportunity to explain bound-aries and sampling constraints more clearly andtheopportunitytoworkcollaborativelyon community member concerns. The first stratification proposal we sent to the NCS coordinating center for approval was rejected because it strayed too far from the comparable MOS requirement. We revised the proposal, shareditagainwiththeCAB,andsentittothe coordinating center, which approved it.
Segmentation. Once stratification was approved, the coordinating center divided each stratum into an equal number of segments, each of comparable MOS, and randomly selected one segment. Selected segments were checkedforhomogeneityusingsociodemo-graphic variables. The segmentation proposal was then sent to us for our approval; five strata had twosegmentoptions.Giventheimpor-tanceofinvolvingcommunitystakeholdersineachstageoftheproject,weundertookanin-depth consultation with community represen-tatives countywide over a period of 2 months. The purpose of the consultation was to inform local groups about the proposed segmentation, chooseamonganyoptions,gainfeedbackon
Figure 3. (A) Relative homogeneity within towns. Unclassified index values Hs (top) and As (bottom) are shown. Each dot is a constituent block-group value; small towns have only one block-group. (Final town values are a population-weighted average of the input block-group variables used to construct the indices.) (B) Relative homogeneity within strata. Each dot is a constituent block-group value of Hs or As.
7.00
6.00
5.00
4.00
3.00
2.00
1.00
0
6.00
4.00
2.00
0
11.00
10.00
9.00
8.00
7.00
6.00
5.00
4.00
3.00
2.00
1.00
0
10.00
8.00
6.00
4.00
2.00
0
Hs
As
Hs
As
0 1 2 3 4 5 6 7 8 9 10 11 12 13 14 15 16 17 18
1 2 3 4 5 6 7 8 9 10 11 12 13 14 15 16 17 18
10 15
City of Worcester
City of Worcester
Fitchburg Fitchburg
Hs
As
Hs
As
Webster Dudley, Southbridge,Webster
Southbridge
New BraintreeOakham
Petersham
20 25 30 40 50 605535 455
0 10 15 20 25 30 40 50 605535 455
Town number Stratum
StratumTown number
Downs et al.
1322 volume 118 | number 9 | September 2010 • Environmental Health Perspectives
Table 2. Data summary by stratum and town.
S no. Town name Town no. Town pop S pop Hs town As town
V rating [H,A]
MOS S MOSa No. BGs Min_BG pop Max_BG pop M_BG Hs SD_BG Hs M_BG As SD_BG AsH town A town
1 Athol 1 11,299 0.936 6.46 4 4 531 8 1,039 2,092 0.150 0.155 7.40 0.3641 Gardner 2 20,770 2.265 4.63 5 2 917 12 706 2,512 0.330 0.375 7.04 0.3401 Royalston 3 1,254 0.005 7.11 2 5 41 1 1,254 1,254 0.005 0.000 7.11 0.0001 Winchendon 5 9,611 42,934 2.007 4.24 5 2 479 1,969 7 643 2,230 0.250 0.264 7.39 0.3412 Barre 16 5,113 0.730 5.55 4 3 232 4 804 1,595 0.090 0.113 7.50 0.2392 E. Brookfield 22 2,097 0.543 6.33 4 4 80 2 687 1,410 0.080 0.092 7.76 0.1272 Holden 17 15,621 0.868 6.21 4 4 670 13 667 1,978 0.140 0.090 7.25 0.2792 N. Brookfield 24 4,683 0.965 5.39 4 3 176 5 661 1,380 0.140 0.126 7.40 0.2242 Oakham 10 1,673 0.030 7.49 2 5 77 1 1,673 1,673 0.030 0.000 7.49 0.0002 Rutland 19 6,353 0.271 6.26 3 4 339 3 1,329 2,819 0.040 0.036 7.43 0.4222 Spencer 25 11,691 1.338 6.15 4 4 513 10 637 1,870 0.200 0.226 7.37 0.4902 W. Boylston 20 7,481 54,712 1.210 5.72 4 3 224 2,310 8 547 2,509 0.170 0.162 7.34 0.3423 Charlton 28 11,263 0.659 6.68 4 4 591 6 527 2,925 0.080 0.083 7.56 0.1663 Leicester 23 10,471 0.470 6.57 3 4 429 8 914 2,410 0.070 0.043 7.43 0.3443 Oxford 29 13,352 1.123 7.48 4 5 580 9 565 2,882 0.150 0.108 7.68 0.3493 Paxton 18 4,386 0.499 6.30 3 4 148 4 614 1,492 0.070 0.062 7.16 0.2743 Sturbridge 30 7,837 47,309 0.550 7.76 4 5 353 2,101 6 1,054 1,702 0.070 0.046 7.30 0.3114 Auburn 43 15,901 2.238 6.29 5 4 612 20 500 1,379 0.300 0.207 7.56 0.2594 Douglas 34 7,045 0.240 6.81 3 4 494 4 798 2,319 0.040 0.043 7.62 0.2154 Millbury 44 12,784 1.884 5.53 5 3 539 13 573 1,523 0.240 0.186 7.66 0.3404 Sutton 35 8,250 43,980 0.315 6.27 3 4 391 2,036 6 624 3,090 0.040 0.036 7.40 0.2245 Blackstone 37 8,804 1.335 5.82 4 3 418 6 749 3,372 0.240 0.207 7.39 0.3635 Mendon 38 5,286 0.347 6.84 3 4 224 3 1,044 2,640 0.050 0.021 7.58 0.1065 Millville 39 2,724 0.590 6.57 4 4 177 3 607 1,187 0.100 0.067 7.53 0.2015 Northbridge 46 13,182 0.717 5.72 4 3 757 9 465 2,934 0.110 0.092 7.42 0.1125 Uxbridge 36 11,156 41,152 0.682 6.02 4 3 625 2,202 7 654 2,610 0.090 0.065 7.54 0.3286 Dudley 31 10,036 0.957 5.85 4 3 465 7 877 2,043 0.140 0.171 7.38 0.1946 Southbridge 32 17,214 3.581 4.98 5 2 971 17 556 1,833 0.530 0.595 6.43 0.8296 Webster 33 16,415 43,665 5.602 2.42 5 1 840 2,275 13 525 2,754 0.680 0.907 7.06 0.4037 Hopedale 41 5,907 1.967 4.78 5 2 304 3 1,524 2,709 0.240 0.174 7.60 0.1377 Milford 42 26,799 4.183 4.27 5 2 1,450 19 663 2,863 0.610 0.482 6.89 0.4287 Upton 40 5,642 38,348 0.312 6.68 3 4 330 2,084 4 644 1,812 0.060 0.042 7.55 0.1838 Grafton 45 14,894 1.062 5.97 4 3 909 10 324 4,332 0.140 0.113 6.76 1.9518 Southborough 48 8,781 1.091 6.44 4 4 415 6 796 2,742 0.140 0.079 7.32 0.2578 Westborough 49 17,997 41,672 2.162 5.74 5 3 834 2,158 12 616 3,100 0.280 0.247 6.70 0.6679 Worcester 51 NA 29,690 NA NA 4 3 2,075 2,075 29 488 2,367 1.599 0.869 5.98 0.95410 Worcester 51 NA 32,800 NA NA 5 2 2,155 2,155 36 415 1,743 1.970 0.982 4.84 1.14411 Worcester 51 NA 37,984 NA NA 3 4 2,041 2,041 30 424 3,305 0.526 0.355 6.78 0.61812 Worcester 51 NA 35,627 NA NA 4 3 2,096 2,096 40 514 2,123 1.652 1.311 5.69 1.14513 Worcester 51 NA 36,547 NA NA 4 4 2,018 2,018 32 428 3,538 0.592 0.311 6.63 0.91914 Northborough 47 14,013 1.384 6.58 4 4 607 9 787 2,766 0.190 0.124 7.25 0.25914 Shrewsbury 50 31,640 45,653 2.349 6.57 5 4 1,698 2,305 19 543 3,150 0.330 0.238 6.90 0.58815 Berlin 52 2,380 0.353 6.80 3 4 91 3 394 1,294 0.040 0.017 7.63 0.23615 Bolton 53 4,148 0.260 5.76 3 3 245 2 1,831 2,317 0.040 0.007 7.33 0.15615 Boylston 54 4,008 0.423 7.20 3 5 175 4 603 1,787 0.070 0.066 7.34 0.22015 Clinton 55 13,435 3.659 3.93 5 2 739 9 856 3,904 0.540 0.393 6.89 0.63315 Harvard 56 5,981 0.264 5.91 3 3 156 6 734 1,202 0.040 0.019 6.89 0.74815 Lancaster 57 7,380 0.577 6.81 4 4 251 4 720 2,966 0.080 0.064 7.06 0.24515 Lunenburg 58 9,401 46,733 0.373 6.18 3 4 353 2,010 6 1,109 2,208 0.060 0.033 7.26 0.26016 Leominster 59 41,303 41,303 3.115 4.53 5 2 2,037 2,037 25 608 3,330 0.470 0.297 6.74 0.79117 Fitchburg 60 39,102 39,102 5.021 2.54 5 1 2,181 2,181 34 104 2,207 0.720 0.732 6.40 0.84918 Ashburnham 6 5,546 0.159 6.11 3 4 254 5 788 1,843 0.030 0.021 7.53 0.24018 Brookfield 21 3,051 0.234 5.86 3 3 125 3 929 1,162 0.030 0.027 7.79 0.16218 Hardwick 7 2,622 0.385 6.59 3 4 100 2 900 1,722 0.050 0.064 7.50 0.29718 Hubbardston 8 3,909 0.060 7.00 2 5 198 2 1,310 2,599 0.010 0.000 7.61 0.02118 New Braintree 9 927 0.015 7.94 2 4 39 1 927 927 0.015 0.000 7.94 0.00018 Petersham 11 1,180 0.000 7.02 1 5 37 1 1,180 1,180 0.000 0.000 7.02 0.00018 Phillipston 12 1,621 0.035 7.71 2 4 62 1 1,621 1,621 0.035 0.000 7.71 0.00018 Princeton 13 3,353 0.055 6.17 2 4 102 2 1,371 1,982 0.010 0.007 7.21 0.12018 Sterling 14 7,257 0.182 6.96 3 5 319 3 1,420 3,092 0.030 0.010 7.41 0.18918 Templeton 4 6,799 0.297 5.30 3 3 255 6 502 1,930 0.040 0.025 7.51 0.12318 Warren 26 4,776 0.257 5.32 3 3 96 4 1,025 1,450 0.040 0.013 7.50 0.09018 W. Brookfield 27 3,804 0.346 6.80 3 4 138 3 1,114 1,567 0.050 0.045 7.48 0.32318 Westminster 15 6,907 51,752 0.245 6.93 3 5 263 1,988 5 741 1,789 0.030 0.016 7.33 0.251
Abbreviations: A town, A classification for town; As, standardized adaptation index value for town; H town, H classification for town; Hs, standardized hazard index value for town; M_BG As, mean block-group adaptation index; M_BG Hs, mean block-group hazard index; Max_BG Pop – maximum block-group population; Min BG pop, minimum block-group popu-lation (2000 data); MOS, town measurement of size (no. expected births/year based on 2001–2008 data); NA, not applicable; No. BGs, number of block-groups; S MOS, stratum MOS; S no., stratum number; S pop, stratum population; SD_BG As, standard deviation block-group adaptation index; SD_BG Hs, standard deviation block-group hazard index; Town no., number of town in Figure 3A,B; Town pop, town population [as of 2000 (U.S. Census 2000)]; V rating [H,A], vulnerability rating. Strata are grouped to show comparable MOS (allowable range = mean ± 10%: 1,902–2,324 births/year). Data on Hs and As indices show relative homogeneity of the indices within towns and strata. Town ratings [H,A] within strata are rela-tively homogeneous except for strata 1 and 15, where a tradeoff was made for optimization of the whole (see “Limitations”). The Hs, As values for towns are different from the average block-group values because we used a population-weighted approach, and population varies considerably by block-group as shown. Five towns (New Braintree, Oakham, Petersham, Phillipston, Royalston) have only one block-group per town, so their Hs and As values are the same as the average values].aMean ± SD = 2,113 ± 106.
Vulnerability-based sampling stratification
Environmental Health Perspectives • volume 118 | number 9 | September 2010 1323
viability (revealing any fatal flaws, e.g., seg-ments divided by physical barriers such as riv-ers or major highways), gain insights about recruitment strategy, and continue to engender joint ownership. It must be stressed that mean-ingful community consultation and involve-ment needs to happen well before recruitment plans are formulated so that local groups are fully informed and willing and prepared to col-laborate.CABmemberssignedaconfidential-ity agreement so that we could enlist their ideas andconcernswithoutmakingsegmentspublic.
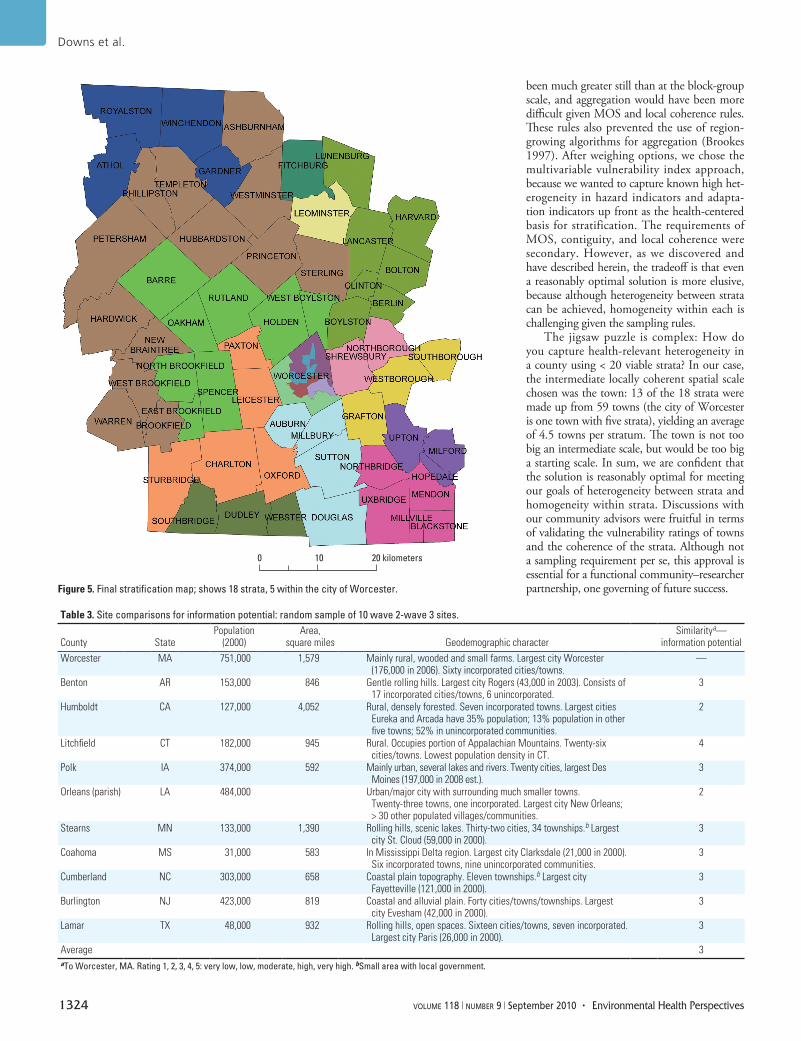
Results Atthetimeofwriting,18segmentshavebeenchosen randomly, one per stratum, and we are proceeding with a comprehensive charac-terization of each segment before recruitment begins. In each segment, we will recruit about 18 mothers/year for 4 years (1,000/18=55;55/4=14;14+30%≈18 toaccount forlossanddropout).Figure5showsthefinalapproved map of 18 strata, a reasonably opti-mal multivariable stratification solution.
DiscussionData aggregation to strata. Spatial sampling for health research is an emerging field (Kumar 2007,2009;Leeet al.2006).Mulvey(1983)notes that the best stratification is not always required in terms of achieving the minimiza-tion of within-group variances and that good approximate solutions can be found without
a significant loss of precision in sample esti-mates. This is relevant to our case, because we have three aspects that complicate pure univariable stratification: a) the use of eight variables in the form of two indices, so eight variances are in play; b) the two indices tend to be inversely correlated—when one is high, the other is low; c) the conditionality of equal MOS.Giventhese,wepursuedthepracticalgoal of achieving reasonably optimal relative homogeneity within strata and reasonably opti-mal relative heterogeneity between strata. Data inTable2andFigure3A,Bsupportthisclaim,but limitations need discussion. Although16strata are relatively homogeneous with com-parable[H,A], two(1and15)areproblem-atic (Table2).Stratum1(Athol,Gardner,Royalson,Winchendon)liesinthetopnorth-western corner of the county, and stratum 15(Berlin,Bolton,Boylston,Clinton,Harvard,Lancaster, Lunenburg) lies in the top north-eastern corner. In both cases, after numerous iterations on combinations of towns (Figure 4, step 6) to meet the MOS, contiguity, and similarity requirements, the chosen solution (Figure5)hadtorelaxthesimilarityneedinthose strata, trading it off in optimization of the whole. It is worth noting that in both cases, the geographic location of these towns along the border of Worcester County reduces the number of potential town combinations for forming contiguous strata (compared with nonbordering towns).
Limitations and alternative approaches. Aswithanymodel, therearestrengthsandweaknesses.Whereas the main strength lies in the information value of the stratification indices, the main limitation is that relative homogeneity within strata can be challenging. Our interactions with other NCS sites show that all are struggling in a productive way, as we did, with how to stratify. There are alter-native approaches, and we considered them. Pickingcommunity-accepted boundaries up front, configuring areas for comparable MOS andthencheckinghomogeneityafterwardisan option. The Queens County Vanguard Site used community boundaries previously defined by the NewYorkCityDepartmentofCityPlanningin2007todelineate18 strata, then checkedforhomogeneityafterwardusingcen-sus data on race, ethnicity, education, income, andforeign-bornstatus (Lioyetal.2009).Anotheroptionistopickonlyoneortwokeyvariables (perhaps one for hazard, one for adap-tation) as the basis of stratification. This would simplify matters greatly in terms of achieving higher relative homogeneity within strata but would have less information value and may reduce our ability to detect associations among variables and health outcomes down the line. Using the smallest unit of analysis,theblock, as our starting point was considered but aban-doned because insufficient data are available at that scale. Even if we had data at this scale, the resulting spatial heterogeneity would have
Figure 4. Flow chart of stratification approach. Six steps: input variables h1–h3, a1–a5; indices H, A; spatial scales; and rules used. Abbreviations: avg, average; pop, population; T denotes town scale; TS standardized town scale.
Step 1. Raw data values at block-group (BG) scale (595 BGs)
Step 2. Aggregated to town scale as pop-weighted avg value (60 towns)
Step 3. Values at town scalestandardized (0–10)
h1BG Population density
h2BG Avg daily traffic counts
h3BG Stationary pollutionsources
a1BG Education level
a2BG Income level
a3BG Poverty level
a4BG Linguistic isolation level
a5BG Minority level
h1T Population density
h2T Avg. daily traffic counts
h3T Stationary pollutionsources
a1T Education level
a2T Income level
a3T Poverty level
a4T Linguistic isolation level
a5T Minority level
Local coherence rule applied here. Coherenceand MOS rules defy region-growing of BGs
h1TS Population density
h2TS Avg daily traffic counts
h3TS Stationary pollutionsources
a1TS Education level
a2TS Income level
a3TS Poverty level
a4TS Linguistic isolation level
a5TS Minority level
Hscompositeindex asweighted
sum (equalwgts. sum
to 1.0)Scale 0–10.
Ascompositeindex asweighted
sum (equalwgts. sum
to 1.0)Scale 0–10.
Relativehomogeneity of
Hs and Aschecked here
(Figure 3A)
Relative homogeneity of [H,A], contiguity, comparable MOS and local coherence rules,
all applied here
18 Stratafrom
townswith
similar[H,A]
vulnerability ratings
H class1–5
A class1–5
Step 4. Indexcreated(town)
Step 5.Indexvalues
classified(town)
Step 6.Viablestrata
reasonably optimized
byiteration(stratum)
Downs et al.
1324 volume 118 | number 9 | September 2010 • Environmental Health Perspectives
beenmuchgreaterstillthanattheblock-groupscale, and aggregation would have been more difficult given MOS and local coherence rules. These rules also prevented the use of region-growingalgorithmsforaggregation(Brookes1997).Afterweighingoptions,wechosethemultivariable vulnerability index approach, becausewewantedtocaptureknownhighhet-erogeneity in hazard indicators and adapta-tion indicators up front as the health-centered basis for stratification. The requirements of MOS, contiguity, and local coherence were secondary. However, as we discovered and have described herein, the tradeoff is that even a reasonably optimal solution is more elusive, because although heterogeneity between strata can be achieved, homogeneity within each is challenging given the sampling rules.
The jigsaw puzzle is complex: How do you capture health-relevant heterogeneity in a county using < 20 viable strata? In our case, the intermediate locally coherent spatial scale chosen was the town: 13 of the 18 strata were madeupfrom59towns(the city of Worcester is one town with five strata), yielding an average of4.5townsperstratum. The town is not too big an intermediate scale, but would be too big a starting scale. In sum, we are confident that the solution is reasonably optimal for meeting our goals of heterogeneity between strata and homogeneity within strata. Discussions with our community advisors were fruitful in terms of validating the vulnerability ratings of towns and the coherence of the strata. Althoughnot a sampling requirement per se, this approval is essential for a functional community–researcher partnership, one governing of future success.Figure 5. Final stratification map; shows 18 strata, 5 within the city of Worcester.
0 10 20 kilometers
Table 3. Site comparisons for information potential: random sample of 10 wave 2-wave 3 sites.
County StatePopulation
(2000)Area,
square miles Geodemographic characterSimilaritya—
information potentialWorcester MA 751,000 1,579 Mainly rural, wooded and small farms. Largest city Worcester
(176,000 in 2006). Sixty incorporated cities/towns.—
Benton AR 153,000 846 Gentle rolling hills. Largest city Rogers (43,000 in 2003). Consists of 17 incorporated cities/towns, 6 unincorporated.
3
Humboldt CA 127,000 4,052 Rural, densely forested. Seven incorporated towns. Largest cities Eureka and Arcada have 35% population; 13% population in other five towns; 52% in unincorporated communities.
2
Litchfield CT 182,000 945 Rural. Occupies portion of Appalachian Mountains. Twenty-six cities/towns. Lowest population density in CT.
4
Polk IA 374,000 592 Mainly urban, several lakes and rivers. Twenty cities, largest Des Moines (197,000 in 2008 est.).
3
Orleans (parish) LA 484,000 Urban/major city with surrounding much smaller towns. Twenty-three towns, one incorporated. Largest city New Orleans; > 30 other populated villages/communities.
2
Stearns MN 133,000 1,390 Rolling hills, scenic lakes. Thirty-two cities, 34 townships.b Largest city St. Cloud (59,000 in 2000).
3
Coahoma MS 31,000 583 In Mississippi Delta region. Largest city Clarksdale (21,000 in 2000). Six incorporated towns, nine unincorporated communities.
3
Cumberland NC 303,000 658 Coastal plain topography. Eleven townships.b Largest city Fayetteville (121,000 in 2000).
3
Burlington NJ 423,000 819 Coastal and alluvial plain. Forty cities/towns/townships. Largest city Evesham (42,000 in 2000).
3
Lamar TX 48,000 932 Rolling hills, open spaces. Sixteen cities/towns, seven incorporated. Largest city Paris (26,000 in 2000).
3
Average 3aTo Worcester, MA. Rating 1, 2, 3, 4, 5: very low, low, moderate, high, very high. bSmall area with local government.
Vulnerability-based sampling stratification
Environmental Health Perspectives • volume 118 | number 9 | September 2010 1325
The lackofastandardizedNCSproto-col for stratification of target populations by factoring in the diverse environments they inhabit is both a challenge and an opportu-nity. What potential does our approach have to inform stratification at other study sites? The method used extant data and offers poten-tial to inform stratification at other sites by remaining adaptable to local conditions and data availability. Several important results from our study are relevant to the other study sites. In theory, the two components of our vulner-ability approach, a proxy of hazards/stressors exposure and a measure of social adaptation/demographic character, could be tailored to each study site according to its own local con-ditions and data availability. The importance ofspatialperspectiveandGISexpertiseinourstudy center became obvious early on in the process. Even though most of our index calcu-lations were done using spreadsheet operations, GISallowedustovisualizeinputandoutputdata and analyze their spatial characteristics. It became an important focus for our analytic effortsandplayedakeyroleinourCABdis-cussions.
In practice, more general applicability of ourGIS-enabledapproachislimitedbythreefactors: particular differences in the extent of technicalfocusonGISamongsites;availabilityof relevant data; and variability in geographic and demographic organization among sites. BasedondiscussionswithotherNCScenters and the coordinating center, we judge enabling GIStohavemoderatepotentialin situ at pres-ent, but moderate to high in terms of build-ing future capacity. U.S. Census data are rich sources of sociodemographic and economic data that could serve as the basis for spatial stratifica-tion, and we strongly recommend NCS Study Centerstakefulladvantageofthem.Similarly,pollutionsitesdatacollectedbytheU.S.EPAand the states (TRI,Superfundsites, and state-level hazardous waste sites) are useful sources. Allofourindicators, except for average daily traffic count, come from publicly available national databases; we judge data availability for the same or similar indicators to be high. For variability in geodemographic organization, we chose a random sample of 10 wave 2–wave 3 sites (2008–2010 locations) (NCS 2010). Table 3 summarizes site characteristics and sim-ilarities with Worcester County and assesses the potential of our method to inform each site. The average rating is moderate. Combining ratings for the three criteria, we judge our approach has moderate to high potential to inform sampling at other sites.
Opportunities for improved technical exchanges between sites using GIS. The NCS offers an opportunity, building on and develop-ing the resources at > 100 sites, to help initiate a program of environmental health mapping
using different types of public domain data. Suchaneffortcouldcreateanetworkofhealth-GISresourcesnationwidethatwouldhaveasits primary purpose the support of NCS objec-tives and better communication and coordina-tionbetweentheNCSsites.GIS technology, because it combines possibilities for visualiza-tion with sophisticated tools for analysis, is well suited as a vehicle for communication and coordination.Thecreationofsuchanetworkwillprovideopportunitiesforfurthernetworkdatabase development to serve multiple public health and environmental objectives.
Community engagement. Adequatecom-munity consultation and involvement needs to happen during each stage of the project: stratification, segmentation, characterization, recruitment, data gathering, and follow-up. For example, unless consultation happens before recruitment plans are formulated, the projectrunstheriskofpushbackandafeelingthattheworkisimposedonlocalcommuni-ties, hospitals, and residents. We have found thatGIScapabilities facilitatecommunityengagement because they provide the opportu-nity on the spot to create maps with multiple featuresinresponsetostakeholderconcerns.The need for meaningful engagement extends to participants: without a sense of joint owner-ship of the research and tangible benefits that improve health over the 21-year period, reten-tion will suffer.
ConclusionMultivariable, health-relevant stratification up front may improve detection power for environment–child health associations down the line. Our method used extant data and offers noteworthy potential to inform strati-fication at other sites. The approach is adapt-able to local conditions and data availability, andtheGISfocusshouldfacilitatedatacom-parisons between sites. The approach with its GISmanifestationalsoencouragedmeaning-ful community engagement, which we con-sider likelytopromotesustainabilityoftheWorcesterCountyNCS effort. Somekeycapacity building in the use of environmen-talhealthscience–GISforcommunicationbetween NCS sites would be desirable. We see exciting opportunities to pursue new analytic methods development and to craft meaningful collaborations among researchers, communi-ties, and participants.
RefeRences
Ahmad QK, Anisimov O, Arnell N, Brown S, Burton I, Campos M et al. 2001. Summary for policy makers. In: Climate change 2001: impacts, adaptation and vulnerability. Contribution of the Working Group II to the Third Assessment Report of the Intergovernmental Panel on Climate Change. (McCarthy JJ, Canziani OF, Leary NA, Dokken DJ, White KS, eds). Cambridge, UK:Cambridge University Press.
Brookes C. 1997. A parameterized region-growing programme
for site allocation on raster suitability maps. Int J Geogr Inf Sci 11(4):375–396.
Carter-Pokras O, Baquet C. 2002. What is a “health disparity”? Public Health Rep 117(5):426–434.
Downs TJ, Larson HJ. 2007. Achieving millennium development goals for health: building understanding, trust and capac-ity to respond. Health Policy 83:144–161.
Eastman JR. 1999. Multi-criteria evaluation and GIS. In: Geographical Information Systems: 1. Principles and Technical Issues (Longley P, Goodchild MF, Maguire DJ, Rhind DW, eds). New York:John Wiley and Sons, 493–502.
Gibbons MC. 2005. A historical overview of health disparities and the potential of ehealth solutions. J Med Internet Res 7(5):e50.
Gilliland F, Avol E, Kinney P, Jarrett M, Dvonch T, Lurmann F, et al. 2005. Air pollution exposure assessment for epide-miologic studies of pregnant women and children: lessons learned from the Centers for Children’s Environmental Health and Disease Prevention Research. Environ Health Perspect 113:1447–1454.
Kumar N. 2007. Spatial sampling design for a demographic and health survey. Popul Res Policy Rev 26:581–599.
Kumar N. 2009. An optimal spatial sampling design for intra-urban population exposure assessment. Atmos Environ 43(5):1153–1155.
Lee C, Velez-Moudon A, Courbois J-Y. 2006. Built environment and behavior: spatial sampling using parcel data. Ann Epidemiol 16(5):387–394.
Lioy PJ, Isukapalli SS, Trasande L, Thorpe, L, Dellarco M, Weisel C, et al. 2009. Using national and local extant data to characterize environmental exposures in the National Children’s Study: Queens County, New York. Environ Health Perspect 117:1494–1504.
MassDOT (Massachusetts Department of Transportation). 2009. Road Inventory. Available: http://www.eot.state.ma.us/default.asp?pgid=content/plan02&sid=about [accessed 15 April 2009].
MassGIS (Office of Geographic and Environmental Information). 2009. Massachusetts Geographic Information System. Available: http://www.mass.gov/mgis/ [accessed 15 April 2009].
Montaquila JM, Brick JM, Curtin LR. 2007. Methods for Sampling Households to Identify 100,000 Births. Proceedings of the Joint Statistical Meetings—Section on Survey Research Methods, American Statistical Association, August 2007, Alexandria, VA, 3227–3232. Available: http://www.amstat.org/sections/srms/Proceedings/y2007/Files/JSM2007-000571.pdf [accessed 15 April 2009].
Mulvey JM. 1983. Multivariate stratified sampling by optimiza-tion. Manage Sci 29(6):715–724.
NCS (National Children’s Study). 2010. National Children’s Study. Available: http://www.nationalchildrensstudy.gov/ [accessed 15 February 2010].
Needham LL, Özkaynak H, Whyatt RM, Barr DB, Wang RY, Naeher L, et al. 2005. Exposure assessment in the National Children’s Study: Introduction. Environ Health Perspect 113:1076–1082.
NEJAC (National Environmental Justice Advisory Council)/EPA. 2004. Ensuring Risk Reduction in Communities with Multiple Stressors: Environmental Justice and Cumulative Risks/Impacts. Report developed from the National Environmental Justice Advisory Council Meeting, 13–16 April 2004. Washington, DC:U.S. Environmental Protection Agency.
Scheidt P, Dellarco M, Dearry A. 2009. A major milestone for the National Children’s Study. Environ Health Perspect 117:A13.
Trasande L, Cronk C, Durkin M, Weiss M, Schoeller DA, Gall EA, et al. 2009. Environment and obesity in the National Children’s Study. Environ Health Perspect 117:159–166.
UNDP (United Nations Development Programme). 2009. Human Development Reports. United Nations Development Programme. Available: http://hdr.undp.org/en/statistics/ [accessed 15 November 2009].
U.S. Census Bureau. 2001. Poverty in the United States: 2000. Available: : http://www.census.gov/did/www/saipe/data/highlights/2008.html [accessed 14 December 2009].
U.S. EPA (U.S. Environmental Protection Agency). 2009. Toxics Release Inventory (TRI) Program. Available: http://www.epa.gov/tri/ [accessed 15 April 2009].
Top Related
Copyright © 2022 FDOKUMEN

