


Bahasa
Halaman
Hukum


VNDIRECT RESEARCH
www.vndirect.com.vn 1
VIETTEL POST JSC (VTP) ─ UPDATE
Market Price Target Price Dividend Yield Rating Sector
VND106,000 VND130,700 1.4% ADD INDUSTRIALS
Short-term catalyst from Viettel Group’s divestment
We expect FY20-22F net profit CAGR at 19.3% thanks to VTP’s strong
efforts to gain market share in Vietnam’s postal delivery market.
Viettel Group’s 6% stake divestment in Nov 2020 is a short-term catalyst.
Recommend ADD rating with TP of VND130,700.
VTP to gain market share in a double-digit growth market
We expect Vietnam postal delivery market value to post an 11.4% CAGR over FY20-22F, fuelled by the vibrant emergence of e-commerce. Based on the outperforming technology capacity against competitors and nationwide postal infrastructure, we believe VTP has the ability to record a 18.5% CAGR in postal delivery during FY20-22F.
Solid earnings growth expected in FY20-22F
We expect VTP’s FY20F earnings to grow 19.4% yoy on the back of a 99.4% yoy increase in revenue, of which postal delivery would grow 20% yoy and commercial sale would surge 400% yoy. We expect FY20-22F net profit CAGR at 19.3%, thanks mainly to FY20-22F CAGR of 18.5% in delivery revenue and 0.11% pts expansion in delivery gross margin during the period.
Viettel Group to sell 6% stake in VTP by Nov 2020
The 6% divestment (equal to 4.98m shares) in VTP will be done through a public auction at the Hanoi Stock Exchange (HNX) by Nov 2020 at the starting price of VND104,800/share. In our view, the divestment is a short-term catalyst for share price, alongside the market re-rating opportunity when VTP is embarking on transforming itself into a hi-tech logistics company.
Recommend ADD with TP of VND130,700
We recommend ADD for VTP with a target price of VND130,700/share, implying an upside of 24.7% for the stock (including dividend yield). Our TP is based on an equal weighting of: (1) 10-year DCF-based valuation and (2) target FY20F P/E of 19.3x. Downside risks include: (1) a prolonged global pandemic or external crisis leading to border closures in countries, which will reduce the volume of outbound parcels to be delivered, and (2) the participation of e-commerce platforms with strong financial capacity, which successfully develop its own delivery systems.
13 October 2020
Outlook – Short term: Positive
Outlook – Long term: Positive
Valuation: Positive
Consensus*: Add:5 Hold:0 Reduce:0
Target price / Consensus: 14.9%
Key changes in the report
N/A
Price performance
Source: VNDIRECT RESEARCH
Key statistics
52w high (VND) 111,500
52w low (VND) 60,705
3m Avg daily value (VNDmn) 8,822
Market cap (VND bn) 8,803
Free float (%) 28
TTM P/E (x) 14.5
Current P/B (x) 6.70
Ownership
Viettel Group 68.1%
Others 31.9%
Source: VNDIRECT RESEARCH
Source: VNDIRECT RESEARCH
Financial summary (VND) 12-18A 12-19A 12-20E 12-21E
Net revenue (bn) 4,922 7,812 15,582 17,857
Revenue growth 22.1% 58.7% 99.5% 14.6%
Gross margin 11.1% 9.9% 6.1% 6.3%
EBITDA margin 8.5% 7.5% 4.5% 4.8%
Net profit (bn) 279 380 454 547
Net profit growth 64.1% 36.2% 19.4% 20.5%
Recurring profit growth 60.3% 41.8% 21.6% 20.2%
Basic EPS 7,854 7,528 6,731 6,586
Adjusted EPS 6,745 6,451 5,769 5,644
BVPS 16,410 16,236 15,389 19,694
ROAE 47.8% 46.2% 40.4% 37.5%
85.0
93.3
101.7
110.0
118.3
126.7
135.0
55,000
65,000
75,000
85,000
95,000
105,000
115,000
Price Close Relative To VNIndex (RHS)
100
200
300
400
10-19 12-19 02-20 04-20 06-20 08-20
Vol th
Analyst(s):
Dung Nguyen Tien

VNDIRECT RESEARCH
www.vndirect.com.vn 2
RIDING ON A DOUBLE-DIGIT GROWTH MARKET
Vietnam market value of postal delivery services is expected to rise 11.4%
p.a. in FY20-22F
The symbiotic relationship between postal delivery and non-store retailing is undeniable, in which postal delivery is the last leg to fulfill the non-retailing process. According to Euromonitor International (Euromonitor), Vietnam’s total non-store retailing value experienced a robust CAGR of 24.9% over FY16-19 thanks to the booming e-commerce, while the CAGR may slow to 11.4% over FY20-22F as the growth momentum has been decreased for recent years. Having a high correlation with non-store retailing growth, Vietnam’s postal delivery market value posted a CAGR of 24.0% over FY16-19 (summarized by Vietnam’s General Statistics Office - GSO). Based on Euromonitor’s forecast and the high correlation between postal delivery growth and non-store retailing growth, we expect the postal delivery market value to rise at a CAGR of 11.4% over FY20-22F, fuelled by the robust growth of e-commerce.
Figure 1: Vietnam’s postal delivery services market value is forecast to post FY20-22F
CAGR of 11.4% (Unit: VND bn)
Source: VNDIRECT RESEARCH, EUROMONITOR, GSO
VTP’s competitiveness is enhanced through inheriting Viettel Group’s
existing strengths
Being one of four pillars in Viettel Group’s development plan over FY21-25F, VTP has been receiving comprehensive supports in state-of-the-art technology and nationwide infrastructure from Viettel Group. These are also VTP’s great competitive advantages in gaining postal delivery market share in coming years.
In terms of technology, with support from Viettel Group’s hi-tech human resource, VTP can develop hi-tech products which help solve three problems: (1) handling large-scale orders; (2) shortening total delivery time, which is the biggest concern of customers while choosing delivery services, and (3) providing a wide range of services and revenue sources. With launched products, VTP has proved its state-of-the-art technology capacity and this is also a competitive edge to gain market share in the postal delivery market.
Title:
Source:
Please fill in the values above to have them entered in your report
0.0%
5.0%
10.0%
15.0%
20.0%
25.0%
30.0%
35.0%
40.0%
-
5,000
10,000
15,000
20,000
25,000
30,000
35,000
40,000
FY16 FY17 FY18 FY19 FY20F FY21F FY22F
Postal delivery services Non-store retailing growth Postal delivery services growth

VNDIRECT RESEARCH
www.vndirect.com.vn 3
Figure 2: Technology development helps VTP improve competitiveness
Source: VNDIRECT RESEARCH, COMPANY REPORTS
Having received the transfer of 823 point of sales from Viettel Telecom in 2019, VTP now owns 1,825 postal hubs and 6,000 collection points. Currently, VTP has the second-largest postal infrastructure in Vietnam behind VNPost, which has about 11,235 postal hubs and collection points. Apart from the prospect of getting more infrastructure in the coming years, VTP can utilise Viettel’s current vast infrastructure to cross-sell its services. In addition to its strength of large postal network with coverage to rural areas, VTP also has a great capacity of transportation with 800 trucks and 12 cars out of total 22 cars in the 40-hour North-South train with an aim to improve transportation speed and quality of transport to customers’ needs. These are VTP’s huge advantages against competitors, which could take many years to get the same infrastructure and capacity similar to VTP.
We expect VTP to grow at a much higher pace than that of industry in FY20-
22F
In our view, VTP’s most notable competitors are the e-commerce platforms building its own delivery systems, such as LazadaVN, given their strong financial resources with the business strategy of cash-burning for growth. However, LazadaVN’s business model is not well-performed as other e-commerce platform like Shopee, which outsources the delivery process to third parties. As a result, LazadaVN’s market share in e-commerce market fell, resulting in a decline of its postal delivery market share from 6.6% in FY17 to 4.8% in FY18.
Thanks to VTP’s outperforming technology capacity and nationwide postal infrastructure, we believe the company has the ability to gain market share from competitors in coming years. We expect VTP's delivery services revenue to post an 18.5% CAGR in FY20-22F, 7.1% pts higher than the postal industry revenue CAGR in FY20-22F, raising its market share to 28.8% in FY22F from 24.0% in FY19.
Figure 3: VTP's market share to grow to 28.8% in FY22F, based on our estimates
Source: VNDIRECT RESEARCH, MIC, COMPANY REPORTS
Product development
Launching
date
Techonology
used Comments
Viettelpost app Jun-18
Cloud-based,
AI, Big Data
Providing postal delivery services for customers, helping the order processing cycle to decrease from 240 seconds
to 8 seconds.
VTSale app Jun-18 Cloud-based
VTSales shop management software is developed as a professional cloud-based software for medium and small
online stores, which help them in inventory management, orders synchronising, payment and shipping methods. The
app also attract more customers using VTP's services.
Automatic mail-sorting
conveyor belt Jul-18 Cross belt
Capacity of 36,000 items per hour, which is the largest mail-sorting conveyor belt in terms of capacity, with an
accuracy rate of 99.5%, the highest rate in Vietnam. The conveyor belt help reduce total delivery time by 4-6 hours.
VTP currently operates 6 conveyor belts nationwide.
Voso.vn Jul-19
Cloud-based,
AI, Big Data An e-commerce infrastructure specialises for agricultural products, an untapped potential market.
MyGo Jul-19
Cloud-based,
AI, Big Data Completing VTP's logistics ecosystem with various last-mile delivery methods.
Title:
Source:
Please fill in the values above to have them entered in your report
21.3%23.0% 20.9%
24.0% 25.6% 27.5% 28.8%35.3%
31.9% 34.1%
12.8%10.3% 7.5%
8.6%
7.5%5.8%
6.6%
4.8%
6.0%
22.0% 20.7% 20.9%
76.0% 74.4% 72.5% 71.2%
0.0%
20.0%
40.0%
60.0%
80.0%
100.0%
FY16 FY17 FY18 FY19 FY20F FY21F FY22F
Vnpost Viettelpost DHL-VNPT EMS LazadaVN GHN express Others

VNDIRECT RESEARCH
www.vndirect.com.vn 4
SOLID EARNINGS GROWTH EXPECTED IN FY20-22F
1H20 results hit by COVID-19 pandemic
Figure 4: 1H20 results overview
Source: VNDIRECT RESEARCH, COMPANY REPORTS
We expect FY20F NP to grow 19.4% yoy, FY20-22F earnings CAGR at
19.3%
Figure 5: FY20-22F business results, based on our estimates (Unit: VND bn)
Source: VNDIRECT RESEARCH, COMPANY REPORTS
We expect VTP’s FY20F revenue to surge 99.4% yoy to VND15,582bn, of which commercial sale may soar 400% yoy to VND8,168bn thanks to the points of sale transferred from Viettel Telecom, while delivery revenue may grow 20.0% yoy to VND7,414bn, fuelled by (1) delivery services demand which is expected to recover in 2H20F, and (2) state-of-the-art technology capacity and nationwide postal infrastructure, which help VTP gain market share from competitors. FY20F GPM may decrease 3.8% pts to 6.1% due to larger revenue contribution
Unit: VNDbn 2Q20 2Q19 %yoy chg 1H20 1H19 %yoy chg Comments
Net revenue 4,339 1,678 158.6% 6,799 3,017 125.3%
Commercial sale 2,766 202 1271.1% 3,841 362 960.0% VTP received 262,000 points of sale from Viettel Telecom in Feb-2020.
Delivery services 1,573 1,476 6.6% 2,957 2,655 11.4%
1H20 growth (11.4% yoy) is lower than 1H19 growth (55.2% yoy) due
to Covid-19 pandemic. VTP's inbound delivery services were affected
by social distancing reusulting to limitation in transportations while
outbound delivery services halted due to the closure of countries'
borders in 1H20.
Gross profit 175 171 2.6% 355 322 10.1%
Blended gross margin 4.0% 10.2% -6.1% pts 5.2% 10.7% -5.5% pts
1H20 blended gross margin decreased 5.5% pts to 5.2% due to larger
revenue contribution of commercial sale with low GM of 0.5%.
GM of comercial sale 0.4% 0.7% -0.3% pts 0.5% 1.4% -0.9% pts
GM of delivery services 10.4% 11.5% -1.1% pts 11.4% 12.0% -0.6% pts
2Q20 delivery services GM was affected by Covid-19 leading to the
0.6% pts decrease in 1H20 delivery services GM.
SG&A 57 70 -18.6% 125 134 -6.7%
Financial income 24 24 3.0% 50 42 18.1% 1H20 average short-term investment rose 15.6% yoy.
Financial expenses 14 12 18.8% 30 22 37.3% 1H20 average short-term borrowing rose 36.4% yoy.
Net profit 103 88 17.1% 200 165 21.3%
NP margin 2.4% 5.2% -2.9% pts 2.9% 5.5% -2.5% pts
EBITDA 161 136 18.9% 317 255 24.5%
EBITDA margin 3.7% 8.1% -4.4% pts 4.7% 8.4% -3.8% pts
FY19 FY20F FY21F FY22F
Revenue growth 58.7% 99.4% 14.6% 12.9%
Commercial sales growth 182.2% 400.0% 10.0% 10.0%
Delivery services growth 42.2% 20.0% 19.7% 15.8%
Net revenue 7,813 15,582 17,857 20,156
Commercial sales 1,634 8,168 8,984 9,883
Delivery services 6,178 7,414 8,873 10,274
COGS 7,036 14,638 16,728 18,846
Gross profit 775 943 1,129 1,311
Gross margin 9.9% 6.1% 6.3% 6.5%
Commercial sales margin 1.1% 0.5% 0.5% 0.5%
Delivery services margin 12.2% 12.2% 12.2% 12.3%
Financial income 94 108 134 163
Financial expenses 49 65 82 94
Selling expenses 49 58 70 81
General and admin expenses 285 340 404 465
Net profit before tax 477 570 686 810
Net profit after tax 380 454 547 645
Net profit margin 4.9% 2.9% 3.1% 3.2%
Net profit growth 36.2% 19.4% 20.5% 17.9%

VNDIRECT RESEARCH
www.vndirect.com.vn 5
of commercial sale with a lower GPM of 0.5%, while delivery services GPM will be unchanged thanks to 2H20 delivery services recovery. Overall, we expect VTP’s FY20F net profit to grow 19.4% yoy to VND454bn, completing 91.6% of its 2020 business plan.
We expect FY20-22F net profit CAGR of 19.3% based on:
Commercial sales revenue growth, which is expected to slow in FY21-22F following the high base in FY20F. Commercial sales GPM in FY21-22F is expected to be equal to that in FY20F.
We expect VTP's delivery services revenue to post an 18.5% CAGR in FY20-22F, thanks to VTP’s strong efforts to gain market share in Vietnam postal delivery market. Delivery services GPM is expected to expand by 0.11% pts during the period thanks to rising economy of scale.
VIETTEL GROUP TARGETS TO OFFLOAD ITS 6% STAKE IN VTP IN NOV
2020
Currently, Viettel Group owns 68.083% of VTP’s charter capital. The divestment of 6% stake (equal to 4.98m of shares) in VTP will be done through a public auction at HNX by Nov 2020 at the starting price of VND104,800/share. According to Viettel Group, the next divestment roadmap, which will reduce Viettel Group’s ownership in VTP to 51%, will be implemented in the next restructuring period of Viettel Group between 2021 and 2025. Viettel Group also has a plan to list VTP shares on the Ho Chi Minh Stock Exchange (HSX) in the 2021-25 period.
In our view, the divestment is a short-term catalyst for share price, alongside the market re-rating opportunity, especially when VTP is embarking on transforming itself into a hi-tech logistics company instead of being a traditional postman, leading to a higher valuation thanks to higher multiples of hi-tech enterprises.
VALUATION AND RECOMMENDATION
We recommend an Add rating on VTP, with a target price of VND130,700/share. We value VTP using a combination of DCF valuation and FY20F P/E multiple. We believe DCF valuation is a fundamental method to value a logistics enterprise due to its predictable cash flow but a P/E multiple is more likely to reflect market perception on VTP, especially in the context of Viettel Group’s divestment from VTP in Nov 2020. Therefore, we use an equal weighting to derive a blended valuation for VTP.
We use 10-year DCF to derive VTP’s intrinsic value of VND131,400/share, applying WACC of 9.54% and terminal growth rate of 1%.
For the P/E method, we use peers’ average FY20F P/E of 19.3x as a basis for VTP’s target price. We believe a target FY20F P/E of 19.3x is reasonable for VTP based on the following reasons: (1) its second-largest market share, outstripping other competitors, and VTP now aims to make it the market’s biggest; (2) having state-of-the-art technology and nationwide postal infrastructure; and (3) high ROE. Applying to a FY20F EPS of VND6,731/share, we derive a P/E-based target price of VND129,900.
Downside risks include: (1) a prolonged global pandemic or external crisis leading to border closures in countries, which will reduce the volume of outbound parcels to be delivered, and (2) the participation of e-commerce platforms with strong financial capacity, which successfully develop their own delivery systems, can create a fiercely competitive market.

VNDIRECT RESEARCH
www.vndirect.com.vn 6
Figure 6: DCF Valuation
Source: VNDIRECT RESEARCH
Figure 7: Cost of equity Figure 8: WACC
Source: VNDIRECT RESEARCH Source: VNDIRECT RESEARCH
Figure 9: P/E valuation method Figure 10: Valuation results
Source: VNDIRECT RESEARCH Source: VNDIRECT RESEARCH
Figure 11: Peer comparison
Source: CIMB Research, Bloomberg, VNDIRECT RESEARCH
FY20F FY21F FY22F FY23F FY24F FY25F FY26F FY27F FY28F FY29F
EBIT 634 768 903 993 1,078 1,150 1,204 1,343 1,491 1,649
less: Taxes 116 139 165 179 194 205 212 237 264 293
EBIAT 519 629 739 814 885 945 992 1,105 1,227 1,356
Plus: Depreciation and amortization 72 81 88 95 103 109 112 115 118 122
Less: Capital expenditure -103 -125 -120 -133 -143 -137 -126 -131 -136 -139
Less: Increase in net working capital 32 -59 -54 -60 -60 -64 -55 -57 -53 -63
Unlevered free cash flow (FCFF) 520 526 652 716 785 853 923 1,032 1,156 1,275
Present value of FCF 475 438 496 497 498 494 487 498 509 513
Cumulative Present value of FCFF 4,905
Terminal value 16,351
PV of terminal value 6,571
Enterprise value 11,476
Less: Total debt (978.8)
Less: Preferred securities -
Less: Noncontrolling interest -
Plus: Cash and Cash Equivalents 416.7
Implied equity value 10,914
Outstanding shares 83,047,926
Equity value per share 131,400
Cost of equity 10.49%
Risk free rate 4.00%
Market risk premium 11.00%
Beta 0.59
WACC 9.54%
Cost of debt 7.21%
Target debt to capital ratio 20.00%
Tax 20.00%
Value
Net profit FY20F (VND bn) 454
Outstanding shares 67,428,781
FY20F EPS (VND) 6,731
Target FY20F P/E (peers' average) 19.3
Multiple valuation 129,900
Method Price (VND) Weight Weighted average price
DCF 131,400 50% 65,700
P/E multiple 129,900 50% 64,950
Target price 130,700
Current price 106,000
Upside (including dividend yield) 24.7%
Ticker Company Country
Market
cap
(US$m)
2020F 2021F 2020F 2021F 2020F 2021F 2020F 2021F 2020F 2021F
Express couriers and 3PLs
III TB Equity TRIPLE I LOGISTICS PCL Thailand 82 23.4 19.6 1.9 1.8 8.6% 9.5% 31.7 31.8 2.1% 2.5%
UPS US Equity UNITED PARCEL SERVICE-CL BUnited States 152,282 22.8 21.9 21.6 15.3 118.2% 83.2% 17.8 15.9 2.3% 2.4%
000120 KS Equity CJ LOGISTICS Korea 3,645 28.5 29.2 1.3 1.3 3.4% 4.3% 12.9 11.5 0.0% 0.0%
636 HK Equity KERRY LOGISTICS NETWORK LTDHongkong 3,512 18.4 17.5 1.0 1.0 6.0% 6.0% 8.8 8.4 2.0% 2.2%
Average 23.3 22.0 6.5 4.9 34.1% 25.8% 17.8 16.9 1.6% 1.8%
Postal companies
RMG LN Equity ROYAL MAIL PLC United Kingdom 3,184 13.4 53.9 0.5 0.5 -1.8% 0.4% 8.7 6.8 2.5% 1.1%
DPW GR Equity DEUTSCHE POST AG-REG Germany 60,284 18.4 16.9 3.3 3.1 16.9% 19.6% 8.9 7.8 2.9% 3.1%
BPOST BB Equity BPOST SA Belgium 1,980 11.8 9.8 2.1 1.9 20.2% 19.8% 4.7 4.5 3.0% 5.8%
SPOST SP Equity SINGAPORE POST LTD Singapore 1,141 17.5 16.3 1.0 1.0 5.5% 5.9% 7.7 7.1 3.6% 3.8%
Average 15.3 24.2 1.7 1.6 10.2% 11.4% 7.5 6.5 3.0% 3.5%
Overall average 19.3 23.1 4.1 3.2 22.1% 18.6% 12.6 11.7 2.3% 2.6%
VTP VN Viettel Post JSC Vietnam 379 15.7 16.1 6.9 5.4 40.4% 37.5% 13.2 11.0 1.4% 1.4%
P/E P/B ROE EV/EBITDA Dividend yield Ticker Company Country
Market
cap
(US$m)
2020F 2021F 2020F 2021F 2020F 2021F 2020F 2021F 2020F 2021F
Express couriers and 3PLs
III TB Equity TRIPLE I LOGISTICS PCL Thailand 82 23.4 19.6 1.9 1.8 8.6% 9.5% 31.7 31.8 2.1% 2.5%
UPS US Equity UNITED PARCEL SERVICE-CL BUnited States 152,282 22.8 21.9 21.6 15.3 118.2% 83.2% 17.8 15.9 2.3% 2.4%
000120 KS Equity CJ LOGISTICS Korea 3,645 28.5 29.2 1.3 1.3 3.4% 4.3% 12.9 11.5 0.0% 0.0%
636 HK Equity KERRY LOGISTICS NETWORK LTDHongkong 3,512 18.4 17.5 1.0 1.0 6.0% 6.0% 8.8 8.4 2.0% 2.2%
Average 23.3 22.0 6.5 4.9 34.1% 25.8% 17.8 16.9 1.6% 1.8%
Postal companies
RMG LN Equity ROYAL MAIL PLC United Kingdom 3,184 13.4 53.9 0.5 0.5 -1.8% 0.4% 8.7 6.8 2.5% 1.1%
DPW GR Equity DEUTSCHE POST AG-REG Germany 60,284 18.4 16.9 3.3 3.1 16.9% 19.6% 8.9 7.8 2.9% 3.1%
BPOST BB Equity BPOST SA Belgium 1,980 11.8 9.8 2.1 1.9 20.2% 19.8% 4.7 4.5 3.0% 5.8%
SPOST SP Equity SINGAPORE POST LTD Singapore 1,141 17.5 16.3 1.0 1.0 5.5% 5.9% 7.7 7.1 3.6% 3.8%
Average 15.3 24.2 1.7 1.6 10.2% 11.4% 7.5 6.5 3.0% 3.5%
Overall average 19.3 23.1 4.1 3.2 22.1% 18.6% 12.6 11.7 2.3% 2.6%
VTP VN Viettel Post JSC Vietnam 379 15.7 16.1 6.9 5.4 40.4% 37.5% 13.2 11.0 1.4% 1.4%
P/E P/B ROE EV/EBITDA Dividend yield
VNDIRECT RESEARCH
www.vndirect.com.vn 7
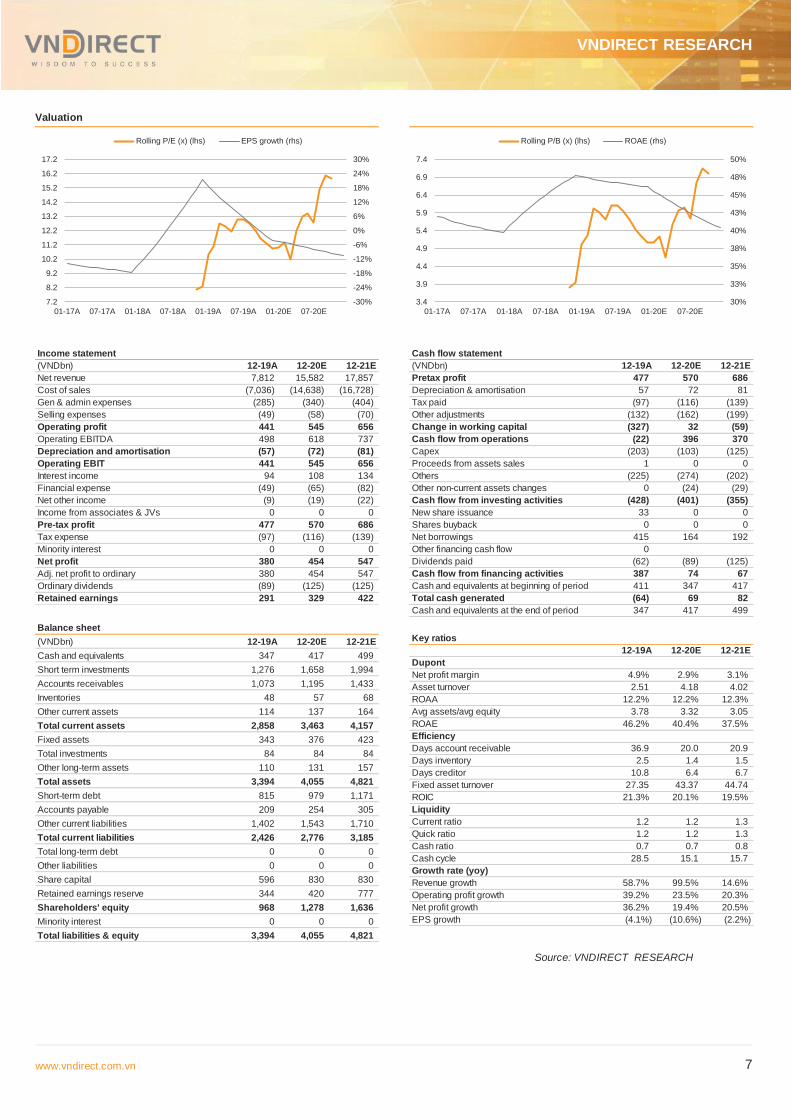
Valuation
Source: VNDIRECT RESEARCH
-30%
-24%
-18%
-12%
-6%
0%
6%
12%
18%
24%
30%
7.2
8.2
9.2
10.2
11.2
12.2
13.2
14.2
15.2
16.2
17.2
01-17A 07-17A 01-18A 07-18A 01-19A 07-19A 01-20E 07-20E
Rolling P/E (x) (lhs) EPS growth (rhs)
30%
33%
35%
38%
40%
43%
45%
48%
50%
3.4
3.9
4.4
4.9
5.4
5.9
6.4
6.9
7.4
01-17A 07-17A 01-18A 07-18A 01-19A 07-19A 01-20E 07-20E
Rolling P/B (x) (lhs) ROAE (rhs)
Income statement
(VNDbn) 12-19A 12-20E 12-21E
Net revenue 7,812 15,582 17,857
Cost of sales (7,036) (14,638) (16,728)
Gen & admin expenses (285) (340) (404)
Selling expenses (49) (58) (70)
Operating profit 441 545 656
Operating EBITDA 498 618 737
Depreciation and amortisation (57) (72) (81)
Operating EBIT 441 545 656
Interest income 94 108 134
Financial expense (49) (65) (82)
Net other income (9) (19) (22)
Income from associates & JVs 0 0 0
Pre-tax profit 477 570 686
Tax expense (97) (116) (139)
Minority interest 0 0 0
Net profit 380 454 547
Adj. net profit to ordinary 380 454 547
Ordinary dividends (89) (125) (125)
Retained earnings 291 329 422
Balance sheet
(VNDbn) 12-19A 12-20E 12-21E
Cash and equivalents 347 417 499
Short term investments 1,276 1,658 1,994
Accounts receivables 1,073 1,195 1,433
Inventories 48 57 68
Other current assets 114 137 164
Total current assets 2,858 3,463 4,157
Fixed assets 343 376 423
Total investments 84 84 84
Other long-term assets 110 131 157
Total assets 3,394 4,055 4,821
Short-term debt 815 979 1,171
Accounts payable 209 254 305
Other current liabilities 1,402 1,543 1,710
Total current liabilities 2,426 2,776 3,185
Total long-term debt 0 0 0
Other liabilities 0 0 0
Share capital 596 830 830
Retained earnings reserve 344 420 777
Shareholders' equity 968 1,278 1,636
Minority interest 0 0 0
Total liabilities & equity 3,394 4,055 4,821
Cash flow statement
(VNDbn) 12-19A 12-20E 12-21E
Pretax profit 477 570 686
Depreciation & amortisation 57 72 81
Tax paid (97) (116) (139)
Other adjustments (132) (162) (199)
Change in working capital (327) 32 (59)
Cash flow from operations (22) 396 370
Capex (203) (103) (125)
Proceeds from assets sales 1 0 0
Others (225) (274) (202)
Other non-current assets changes 0 (24) (29)
Cash flow from investing activities (428) (401) (355)
New share issuance 33 0 0
Shares buyback 0 0 0
Net borrowings 415 164 192
Other financing cash flow 0
Dividends paid (62) (89) (125)
Cash flow from financing activities 387 74 67
Cash and equivalents at beginning of period 411 347 417
Total cash generated (64) 69 82
Cash and equivalents at the end of period 347 417 499
Key ratios
12-19A 12-20E 12-21E
Dupont
Net profit margin 4.9% 2.9% 3.1%
Asset turnover 2.51 4.18 4.02
ROAA 12.2% 12.2% 12.3%
Avg assets/avg equity 3.78 3.32 3.05
ROAE 46.2% 40.4% 37.5%
Efficiency
Days account receivable 36.9 20.0 20.9
Days inventory 2.5 1.4 1.5
Days creditor 10.8 6.4 6.7
Fixed asset turnover 27.35 43.37 44.74
ROIC 21.3% 20.1% 19.5%
Liquidity
Current ratio 1.2 1.2 1.3
Quick ratio 1.2 1.2 1.3
Cash ratio 0.7 0.7 0.8
Cash cycle 28.5 15.1 15.7
Growth rate (yoy)
Revenue growth 58.7% 99.5% 14.6%
Operating profit growth 39.2% 23.5% 20.3%
Net profit growth 36.2% 19.4% 20.5%
EPS growth (4.1%) (10.6%) (2.2%)

Small & Midcap Research
www.vndirect.com.vn 8
DISCLAIMER
This report has been written and distributed by Research Department, VNDIRECT Securities Corporation. The information contained in this report is prepared from data believed to be correct and reliable at the time of issuance of this report. Unless otherwise stated, this report is based upon sources that VNDIRECT considers to be reliable. These sources may include but are not limited to data from the stock exchange or market where the subject security is listed, or, where appropriate, any other market. Information on the company(ies) are based on published statements, information disclosure and announcements of the company(ies), and information resulting from our research. VNDIRECT has no responsibility for the accuracy, adequacy or completeness of such information.
All estimates, projections, forecasts and expression of opinions contained in this report reflect the personal views and opinions of the analyst(s) responsible for the production of this report. These opinions may not represent the views and position of VNDIRECT and may change without notice.
This report has been prepared for information purposes only. The information and opinions in this report should not be considered as an offer, recommendation or solicitation to buy or sell the subject securities, related investments or other financial instruments. VNDIRECT takes no responsibility for any consequences arising from using the content of this report in any form.
This report and all of its content belongs to VNDIRECT. No part of this report may be copied or reproduced in any form or redistributed in whole or in part, for any purpose without the prior written consent of VNDIRECT.
RECOMMENDATION FRAMEWORK
Stock Ratings Definition:
Add The stock’s total return is expected to reach 15% or higher over the next 12 months.
Hold The stock’s total return is expected to be between negative 10% and positive 15% over the next 12
months.
Reduce The stock’s total return is expected to fall below negative 10% over the next 12 months.
The total expected return of a stock is defined as the sum of the: (i) percentage difference between the target price and
the current price and (ii) the forward net dividend yields of the stock. Stock price targets have an investment horizon of 12
months.
Sector Ratings Definition:
Overweight An Overweight rating means stocks in the sector have, on a market cap-weighted basis, a positive
absolute recommendation.
Neutral A Neutral rating means stocks in the sector have, on a market cap-weighted basis, a neutral absolute
recommendation.
Underweight An Underweight rating means stocks in the sector have, on a market cap-weighted basis, a negative
absolute recommendation.
Hien Tran Khanh – Deputy Head of Research
Email: [email protected]
Dung Nguyen Tien – Senior Analyst
Email: [email protected]
–
Email:
–
Email:
–
Email:
–
Email:
VNDIRECT Securities Corporation
1 Nguyen Thuong Hien Str – Hai Ba Trung Dist – Ha Noi
Tel: +84 2439724568
Email: [email protected]
Website: https://vndirect.com.vn
Top Related
Copyright © 2022 FDOKUMEN

