


Bahasa
Halaman
Hukum

Catena 62 (2005) 111–124
www.elsevier.com/locate/catena
Variability of soil surface characteristics influencing
runoff and interrill erosion
Y. Le Bissonnaisa,*, O. Cerdana, V. Lecomtea, H. Benkhadraa,
V. Souchereb, P. Martinb
aINRA SESCPF, Avenue de la Pomme de Pin, BP 20 619, 45 166 Olivet Cedex, FrancebINRA SAD APT, RD 10 (Route de Saint Cyr), 78 026 Versailles Cedex, France
Abstract
Extensive soil surface observations and measurements were conducted in Normandy on loess
soils prone to surface crusting in order to understand the spatial distribution and temporal variability
of soil surface characteristics involved in erosion processes. A database composed of more than 5000
soil surface observations at the field or plot scale was analysed. We classified these observations
according to combinations of three dominant factors: crusting stage, roughness and crop cover.
Frequency analysis showed that three combinations of these factors accounted for more than 50% of
the total observations. Eight other combinations accounted each for more than 2% of the
observations. These dominant and secondary combinations are considered as breference surface
conditionsQ. Their potential range of the infiltration capacity and sediment production were estimated
from field measurements under natural and simulated rainfall. For the loess soils in our study, mean
field infiltration capacity ranged between 2 mm/h and 50 mm/h while mean sediment concentration
ranged between 0.5 g/l and 30 g/l for the different combinations of soil surface and rainfall
characteristics. This work, based on a local case study, allowed the development of a new approach
for erosion prediction modelling (STREAM) which could be transferable to other areas where
Hortonian processes are dominant.
D 2005 Elsevier B.V. All rights reserved.
Keywords: Loess soils; Soil surface conditions; Runoff; Erosion; Crusting; Crop cover; Roughness
0341-8162/$ -
doi:10.1016/j.
* Correspon
E-mail add
see front matter D 2005 Elsevier B.V. All rights reserved.
catena.2005.05.001
ding author. Tel.: +33 4 99 61 22 25.
ress: [email protected] (Y. Le Bissonnais).

Y. Le Bissonnais et al. / Catena 62 (2005) 111–124112
1. Introduction
Soil surface conditions, i.e. surface crust development, roughness and vegetation cover,
have an important influence on infiltration rates, runoff generation and erosion (Papy and
Douyer, 1991; Auzet et al., 1995). On bare, cultivated soils, crusting is the main feature
describing surface-structure evolution. It has a very strong influence on soil hydraulic
properties and runoff rate. Crusting also affects soil surface shear strength and roughness,
which influence, together with vegetation cover, sediment detachment and transport
processes. A knowledge and understanding of the spatial heterogeneity and temporal
dynamics of these surface conditions is a key point for modelling soil erosion by water of
cultivated areas on hillslope and catchment scales (Imeson and Kirkby, 1996; De Roo,
1998; Cerdan et al., 2001).
Surface conditions depend not only on soil characteristics, such as soil texture,
mineralogy, soil organic matter (Fox and Le Bissonnais, 1998), but also on a large range of
surface characteristics related to land use, vegetation cover, biological activity and
interactions with climatic factors. At the small catchment scale (1 to 10 km2), detailed
observations of surface conditions can be used as indicators of less measurable parameters
such as time to ponding, surface storage, time to runoff, hydraulic conductivity and
erodibility. Relationships between the different types of surface conditions and these
quantitative parameters can be explored by several methods such as rainfall simulation and
microrelief measurements. As soon as these relationships are established, qualitative
descriptions of surface conditions for relatively large and homogeneous areas (e.g.
cultivated fields) will facilitate the quantification of average hydraulic and erosion
properties at the field scale (Cerdan et al., 2001, 2002a).
Descriptive methods of soil surface conditions for cultivated areas of Europe were
proposed by Boiffin (1986) who defined several crusting stages, and were later on
improved by Bresson and Boiffin (1990). Building a typology of surface conditions
requires relatively simple but robust descriptors, which should enable the rapid surveying
of large areas in a cost-effective and reproducible way. Such a survey would give a better
knowledge on areas potentially contributing to runoff (Auzet et al., 1995). The location of
these runoff potential areas in relation to the main collecting network (tracks, talwegs,
rivers, etc.) and their potential dynamics through the seasons should help in the upscaling
of runoff and erosion risk modelling from hillslope and small catchments to natural region
(Imeson and Kirkby, 1996; Le Bissonnais et al., 1998b). This approach would be
particularly useful for operational models using simple parameterisation such as the
STREAM model (Cerdan et al., 2001, 2002b). More deterministic models such as WEPP
(Nearing et al., 1989), LISEM (De Roo, 1998) or EUROSEM (Morgan et al., 1994) would
need a more precise parameterisation including physical parameters for crust hydraulic
properties (Le Bissonnais et al., 1998a).
The objective of this paper is: (i) to review the most relevant surface characteristics in
the literature that describe surface conditions with regard to runoff and erosion processes,
(ii) to analyse the range of different surface conditions and their spatial distribution and
seasonal variability for agricultural areas of the European loess belt using a large data base,
and (iii) to identify the dominant situations and assess their potential effects on infiltration,
runoff and erosion.
Y. Le Bissonnais et al. / Catena 62 (2005) 111–124 113
2. Soil surface characteristics
Runoff and erosion modelling studies at catchment scale require data sets and
monitoring strategies, particularly for agricultural areas (Jetten et al., 1996). The catchment
must be subdivided into spatially buniformQ units at a given time (fields or portion of
fields). In addition to slope and soil type, which are permanent characteristics at the
seasonal time scale of observation relevant to this study, the most relevant dynamic
characteristics for describing and classifying these units with regard to interrill erosion are:
(i) surface roughness, (ii) the development of soil surface crusts, (iii) the presence of wheel
tracks, and (iv) the vegetation and plant residue cover (Boiffin et al., 1988; Casenave and
Valentin, 1989; Bradford and Huang, 1994; Auzet et al., 1995; Jetten et al., 1996).
2.1. Surface crusting
Three main stages of surface crusting were originally distinguished by Boiffin (1986)
as initial fragmentary stage (F0), structural crust (F1) and sedimentary crust (F2). Each
one could be subdivided into classes. These morphological types of crusts differ in the
combination of the subprocesses involved in their formation (Bresson and Valentin,
1994). The structural or disruptional crusts are formed by an in situ reorganisation of
existing aggregates and fragments resulting from breakdown, with very limited particle
displacement and without sorting or sedimentation. The sedimentary or depositional
crusts result from particle displacement and sorting during puddling conditions. Bresson
and Boiffin (1990) showed that structural and sedimentary crusts correspond to two
successive stages in a general pattern of crust development. The change from the first to
the second stage depends on the soil surface response to rainfall, which is partly
controlled by structural crust development. Each stage will affect the infiltration
capacity.
Experimental studies that validate this approach can be found in the literature (Boiffin
and Monnier, 1986; Bradford et al., 1987; Le Bissonnais and Singer, 1993; De Roo, 1998).
The classification has further been refined by including intermediate crust stages with
more precise measurements of the relative proportion of structural and sedimentary crust,
and the addition of a stage that corresponds to altered sedimentary crust (F3). Although a
very precise classification could be useful for specific studies by skilled observers, it may
be less robust and reliable for most less-skilled people in other situations. Thus, as a
compromise between precision and robustness, a classification of four crusting stages has
been proposed (Table 1).
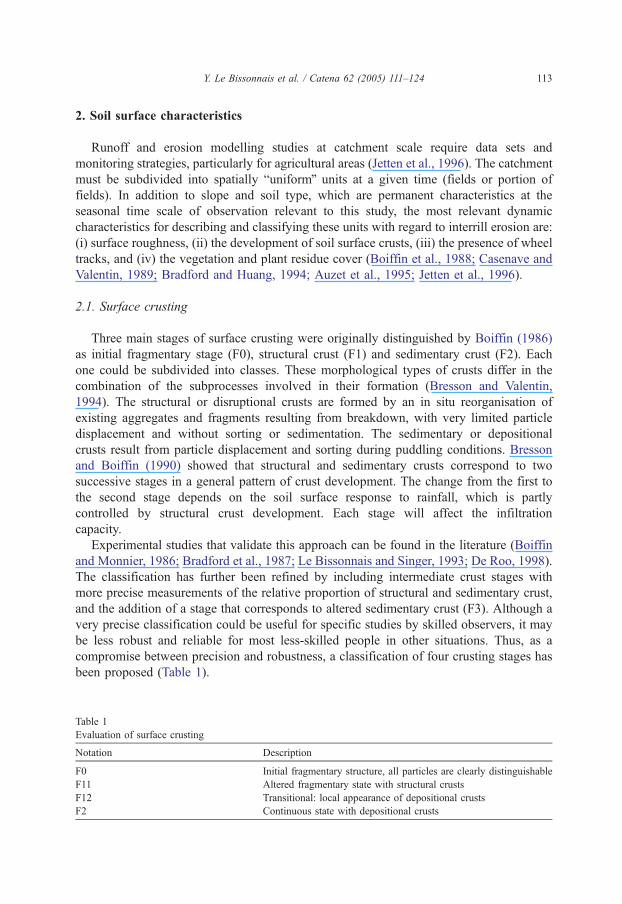
Table 1
Evaluation of surface crusting
Notation Description
F0 Initial fragmentary structure, all particles are clearly distinguishable
F11 Altered fragmentary state with structural crusts
F12 Transitional: local appearance of depositional crusts
F2 Continuous state with depositional crusts
Y. Le Bissonnais et al. / Catena 62 (2005) 111–124114
2.2. Roughness
Surface roughness is a dynamic property that influences numerous soil surface
processes such as infiltration, temporary storage capacity, reflectance, deposition or
detachment of particles. It evolves rapidly under the influence of soil tillage and rainfall
(Zobeck and Onstad, 1987). Romkens and Wang (1986) have described four soil
roughness classes: (1) particles and aggregates related roughness (PR: 0 to 2 mm), (2) the
random roughness (RR: 2 to 100 mm), (3) periodic orientated roughness (OR) induced by
soil tillage (100 to 300 mm), and (4) topographical related roughness. Roughness is often
evaluated by calculating the standard deviation of the measured height at regular tillage
intervals (Zobeck and Onstad, 1987; Huang, 1998). However, the use of roughness index
based on standard deviation of elevation may be inaccurate and it does not describe
adequately particles and aggregates related roughness as well as periodic orientated
roughness. In addition to its effect on the temporary storage capacity of excess water on
the soil surface (Mitchell and Jones, 1978, Kamphorst, 2000), its second major influence is
on the runoff direction and hydraulic resistance. This effect, however, is rarely taken into
account even though many authors know the insufficiency of only topographic criteria
(Fullen and Reed, 1987; Auzet et al., 1993; Souchere et al., 1998; Govers et al., 2000). In
the context of silty soils, Boiffin et al. (1988) made quantitative and qualitative field
observations that distinguished between several roughness classes. This classification was
based on the measurement of elevation differences between depression bottom and outlet,
and on the assessment of connectivity between depressions. It was further refined by
Ludwig et al. (1995), and was used for characterising soil roughness in the tillage direction
(RR) as well as perpendicular to it (OR) (Table 2).
2.3. Crop cover
Good soil coverage is an essential element of soil conservation programmes.
Vegetation protects the soil from eroding in various ways. Rainfall interception by the
plant has two main consequences, the major being that it reduces the erosive power of
impacting raindrops. It also decreases the volume of water reaching the soil surface.
This is most noticeable for short or minor events as the available capacity of
precipitation retention is rapidly met. The ability of vegetation to reduce runoff rates
within a given catchment however is relatively small. In this situation, the stem
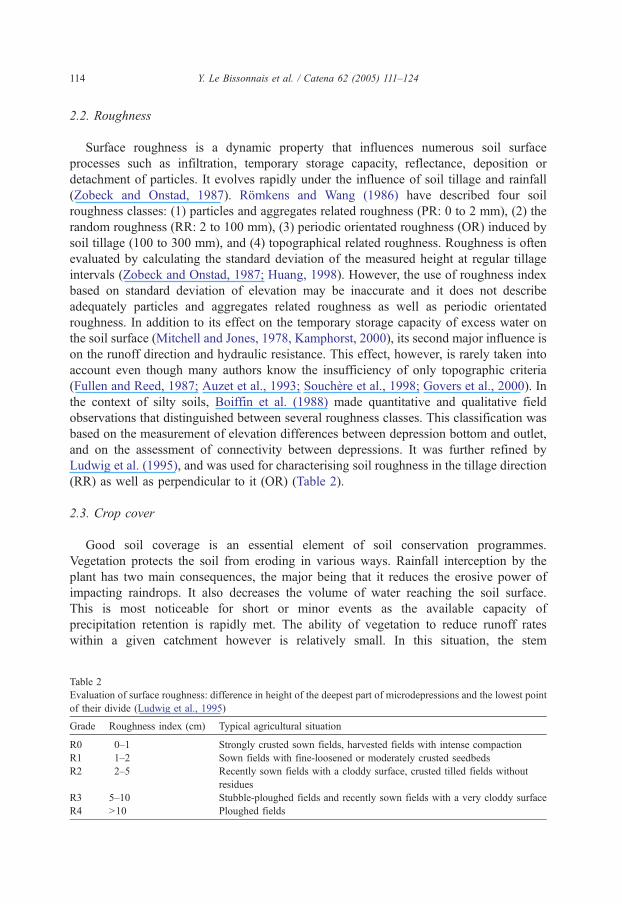
Table 2
Evaluation of surface roughness: difference in height of the deepest part of microdepressions and the lowest point
of their divide (Ludwig et al., 1995)
Grade Roughness index (cm) Typical agricultural situation
R0 0–1 Strongly crusted sown fields, harvested fields with intense compaction
R1 1–2 Sown fields with fine-loosened or moderately crusted seedbeds
R2 2–5 Recently sown fields with a cloddy surface, crusted tilled fields without
residues
R3 5–10 Stubble-ploughed fields and recently sown fields with a very cloddy surface
R4 N10 Ploughed fields
Y. Le Bissonnais et al. / Catena 62 (2005) 111–124 115
represents a preferential infiltration path. We also consider the surface vegetation and the
residue cover that protect the surface from degradation and that contribute to hydraulic
roughness. The classification of vegetation cover is commonly expressed as a percentage
of the area covered by canopy or litter. We distinguished three size classes: (1) from 0 to
20%; (2) from 21% to 60%; and (3) from 61% to 100%. Limits of these classes are
adapted to the development of cultivated vegetation. The hypothesis is that below 20%
of coverage, the canopy or residues do not provide sufficient and continuous protection
against raindrop impact and particles detachment by runoff. For example, class 1
corresponds to the case of Autumn sown cereal cover during the Winter months from
November to February, which is usually not considered as bare soil but corresponds in
fact to very poorly protected surface. At the opposite, above 60% of coverage, the bare
areas are generally too small and discontinuous to contribute to runoff of erosion at the
field scale.
2.4. Additional surface characteristics
Several additional surface characteristics may also influence runoff and erosion.
Among them: (i) the presence of macropores, (ii) biological factors, such as soil fauna,
which may increase the number of macropores and therefore improve infiltration, (iii)
algae on crust, which could be both hydrophobic or hydrophyllic depending on the initial
moisture conditions, (iv) the presence of rock fragments, which generally improve
infiltration and reduce erosion (Poesen and Ingelmo-Sanchez, 1992), and (v) the presence
of wheel tracks. Measurement of the bulk density of the tillage layer as well as description
of the pattern of soil crusting may also improve surface characterisation. These secondary
characteristics, although certainly relevant and crucial in some cases, are time consuming
and more difficult to include explicitly in systematic observations of surface condition at
the catchment scale. However, in a qualitative approach such as described here, they can
be easily included within the three above parameters.
3. Analysis of spatial distribution and temporal variability of surface conditions
3.1. Description of the database
A data set of 5464 field observations from different experiments conducted in the
Normandy region from 1992 to 1998 was available (Gallien et al., 1995; Lecomte et al.,
1997; Le Bissonnais et al., 1998b; Lecomte, 1999; Chaplot and Le Bissonnais, 1999;
Martin, 1999). These observations were made on 600 fields and taken on 40 different dates
spread throughout the year (11 in Autumn, 12 in Winter, 13 in Spring and 4 in Summer
corresponding to 1000 to 2000 observations for each season). The data set corresponds to
an observed area of 12350 ha.
The studied area is covered by silt loam soils developed on the quaternary loess deposit
that contain at least 60% silt in the surface horizons. Soils are classified as Neoluvisol in
the French Classification (orthic Luvisoils) and are described as bexcessively drainedQaccording to the USDA (2003) soil drainage classification. Such soils are very susceptible
Y. Le Bissonnais et al. / Catena 62 (2005) 111–124116
to surface sealing because of low clay (130 to 170 g/kg) and organic matter content (10 to
20 g/kg). When cultivated, large areas are left bare and exposed to rainfall during most of
the cropping season which, if combined with the susceptibility to crusting, render them
vulnerable to runoff and erosion. The topography is relatively smooth with slope gradients
ranging between 1–4% on the plateau and 4–10% on valley sides. The soil physical and
chemical characteristics show very little variation within the study area.
Surface roughness, soil crusting stages and rate of vegetation cover of individual fields
were measured twice a month during the study period. Variables present in the database for
the description of each field are: area (m2), mean slope (%), land use, surface crusting
stage (Table 1), roughness (Table 2), and crop cover.
3.2. Results
Figs. 1–3 show the distribution of the three parameters for the whole set of observations
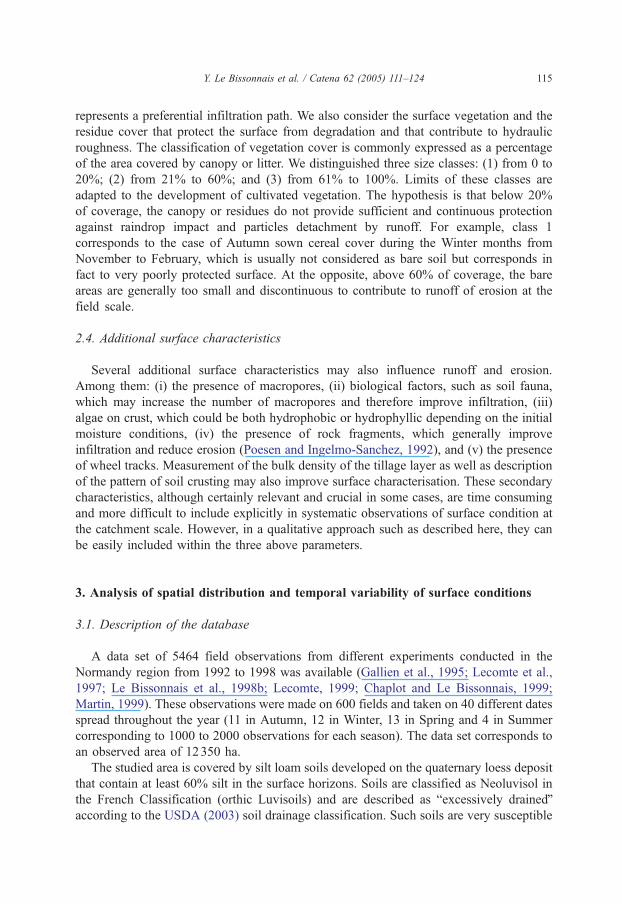
as expressed in surface percentage for each season. Results for crusting conditions (Fig. 1)
show that 70% of the surfaces consisted of well-developed sedimentary crust (F2) in
Winter and 65% in Summer, while only 40% in Spring and 50% in Autumn. Other
surfaces consisted mainly of freshly tilled non-crusted surfaces (F0) that increased from
15% to 30% for Winter, Summer, Autumn and Spring. The intermediate states F11 and
F12 covered less than 10% of the observed surfaces except that F11 in Spring and F12 in
Summer corresponded to the evolution of some Spring sown fields during these two
seasons. These results suggest that the soils of the study area are very prone to surface
crusting: sedimentary crusts are dominant throughout the year and the low proportion of
intermediate states indicates the very fast dynamics of crusting. With a proportion of 50%
of Autumn and Spring crops (Auzet et al., 1993; Jetten et al., 1996) and a frequency of
observation of once every 2 weeks, the decrease of F2 percentage from 70% in Winter to
0
10
20
30
40
50
60
70
80
surf
ace
%
F0 F11 F12 F2
Autumn Winter Spring Summer
Fig. 1. Distribution of the surface crusting stages for the whole set of observations as expressed in surface
percentage for each season. F0: Initial fragmentary structure, all particles are clearly distinguishable; F11: altered
fragmentary state with structural seal; F12: local appearance of depositional seal; F2: continuous state with
depositional seal.
0
10
20
30
40
50
60
70
80
surf
ace
%
0-1 cm 1-2 cm 2-5 cm 5-10 cm 10-20 cm >20 cm
Autumn Winter Spring Summer
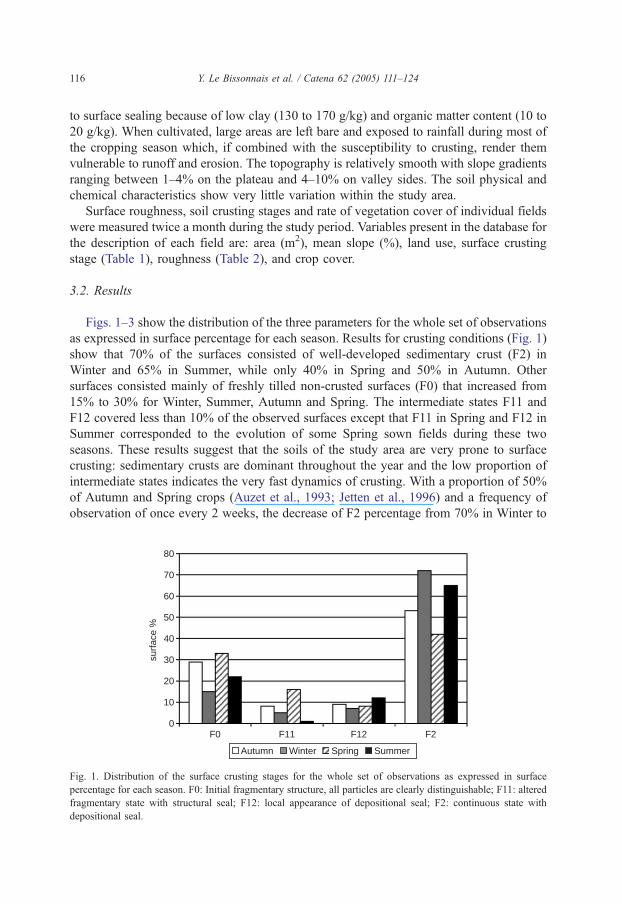
Fig. 2. Distribution of the roughness classes for the whole set of observations as expressed in surface percentage
for each season.
Y. Le Bissonnais et al. / Catena 62 (2005) 111–124 117
40% in Spring followed by an increase up to 65% in Summer indicates that almost all the
Spring tilled surfaces become crusted within less than 3 months.
Roughness observations (Fig. 2) show that 60–70% of the surfaces from Autumn to
Summer correspond to the R1 class (1 to 2 cm). This is attributed to the fact that this class
consisted of both bare, crusted, sowed surfaces and surfaces covered with vegetation with
an initial low roughness such as pastures. Harvested fields may also fall in this class. Other
roughness classes never comprised more than 15% of the observed surfaces. This result is
directly and indirectly related to the low aggregate stability of the soils of this study: (i)
farmers do not keep fields tilled for long periods because they know that structure will be
degraded and that they will have to till again before sowing, (ii) even if a field shows an
important roughness at a given time, it will soon be degraded under rainfall effect and
moved to a lower roughness class.
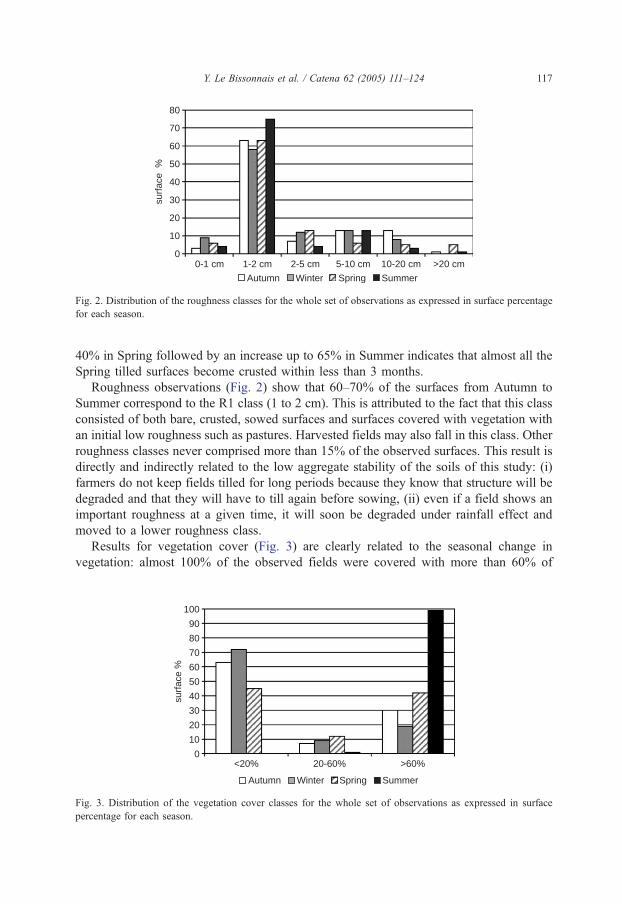
Results for vegetation cover (Fig. 3) are clearly related to the seasonal change in
vegetation: almost 100% of the observed fields were covered with more than 60% of
0
10
20
30
40
50
60
70
80
90
100
surf
ace
%
<20% 20-60% >60%
Autumn Winter Spring Summer
Fig. 3. Distribution of the vegetation cover classes for the whole set of observations as expressed in surface
percentage for each season.
Y. Le Bissonnais et al. / Catena 62 (2005) 111–124118
vegetation in Summer while this class represented only 20% of the surfaces in Winter.
Conversely bbare fieldsQ, i.e. those with less than 20% vegetation cover, were not observed
in Summer while they represented 70%, 60% and 40% of the surfaces in Winter, Autumn
and Spring, respectively. The intermediate class of vegetation cover represented less than
10% of the observed surfaces with a maximum in Spring. This result is due to the rapid
development of vegetation as soon as growth starts.
4. Characteristics of the dominant soil surface conditions
4.1. Dominant surface conditions
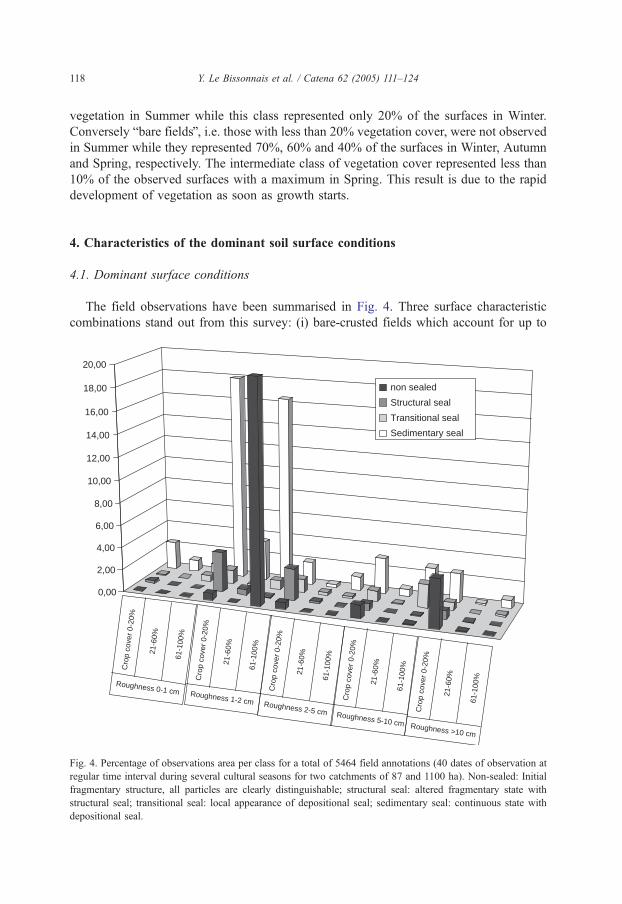
The field observations have been summarised in Fig. 4. Three surface characteristic
combinations stand out from this survey: (i) bare-crusted fields which account for up to
0,00
2,00
4,00
6,00
8,00
10,00
12,00
14,00
16,00
18,00
20,00
non sealed
Structural seal
Transitional seal
Sedimentary seal
Roughness 0-1 cm
Cro
p co
ver
0-20
%
61-1
00%
21-6
0%
Roughness 1-2 cm
Cro
p co
ver
0-20
%
61-1
00%
21-6
0%
Roughness 2-5 cm
Cro
p co
ver
0-20
%
61-1
00%
21-6
0%
Roughness 5-10 cm
Cro
p co
ver
0-20
%
61-1
00%
21-6
0%
Roughness >10 cm
Cro
p co
ver
0-20
%
61-1
00%
21-6
0%
Fig. 4. Percentage of observations area per class for a total of 5464 field annotations (40 dates of observation at
regular time interval during several cultural seasons for two catchments of 87 and 1100 ha). Non-sealed: Initial
fragmentary structure, all particles are clearly distinguishable; structural seal: altered fragmentary state with
structural seal; transitional seal: local appearance of depositional seal; sedimentary seal: continuous state with
depositional seal.
Y. Le Bissonnais et al. / Catena 62 (2005) 111–124 119
38% of the winter observations, (ii) well-developed crops on crusted surfaces which
account for up to 48% of the summer observations, and (iii) grassland which is constant
and account for 14% of the surface throughout the year or well-developed crops on non-
degraded surfaces. Most of the observations concerned the sedimentary crust class and
fluctuated from 42% of the Spring observations to 72% of the Winter observations.
On the average, these three combinations always accounted for more than 50% of the
catchment area. Other significant combinations are: (i) low vegetation cover and high
roughness, non-crusted fields (5% of the observations), which corresponded to freshly
tilled fields; (ii) low vegetation cover and high or medium roughness crusted fields, which
corresponded to the close evolution of the previous combination under the rainfall effect,
(iii) low vegetation cover and low roughness fields with structural crust, and (iv)
intermediate vegetation cover and low roughness crusted fields which were both
transitional combinations before crusting and vegetation development on sowed surfaces.
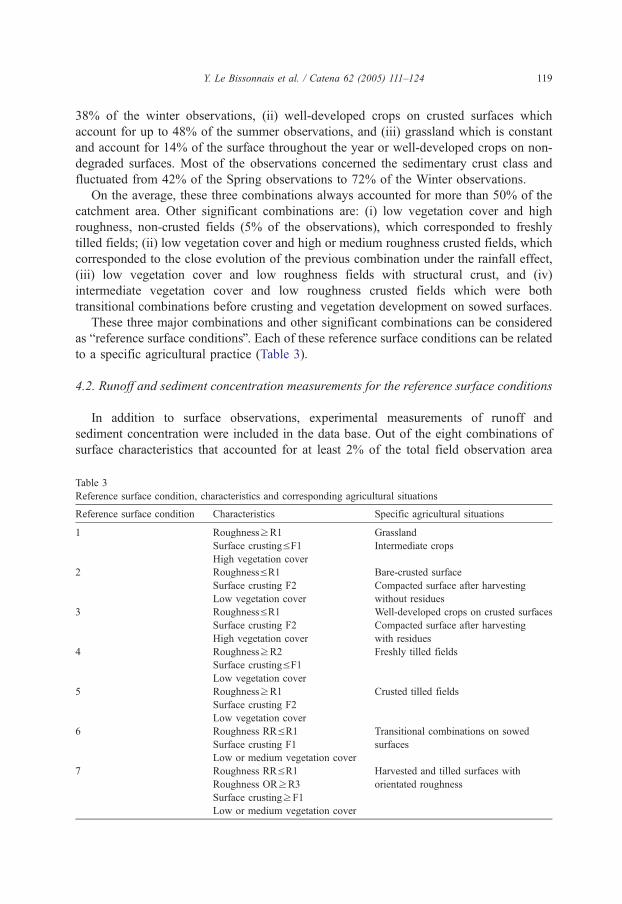
These three major combinations and other significant combinations can be considered
as breference surface conditionsQ. Each of these reference surface conditions can be related
to a specific agricultural practice (Table 3).
4.2. Runoff and sediment concentration measurements for the reference surface conditions
In addition to surface observations, experimental measurements of runoff and
sediment concentration were included in the data base. Out of the eight combinations of
surface characteristics that accounted for at least 2% of the total field observation area
Table 3
Reference surface condition, characteristics and corresponding agricultural situations
Reference surface condition Characteristics Specific agricultural situations
1 RoughnesszR1 Grassland
Surface crustingVF1 Intermediate crops
High vegetation cover
2 RoughnessVR1 Bare-crusted surface
Surface crusting F2 Compacted surface after harvesting
without residuesLow vegetation cover
3 RoughnessVR1 Well-developed crops on crusted surfaces
Surface crusting F2 Compacted surface after harvesting
with residuesHigh vegetation cover
4 RoughnesszR2 Freshly tilled fields
Surface crustingVF1Low vegetation cover
5 RoughnesszR1 Crusted tilled fields
Surface crusting F2
Low vegetation cover
6 Roughness RRVR1 Transitional combinations on sowed
surfacesSurface crusting F1
Low or medium vegetation cover
7 Roughness RRVR1 Harvested and tilled surfaces with
orientated roughnessRoughness ORzR3
Surface crustingzF1
Low or medium vegetation cover
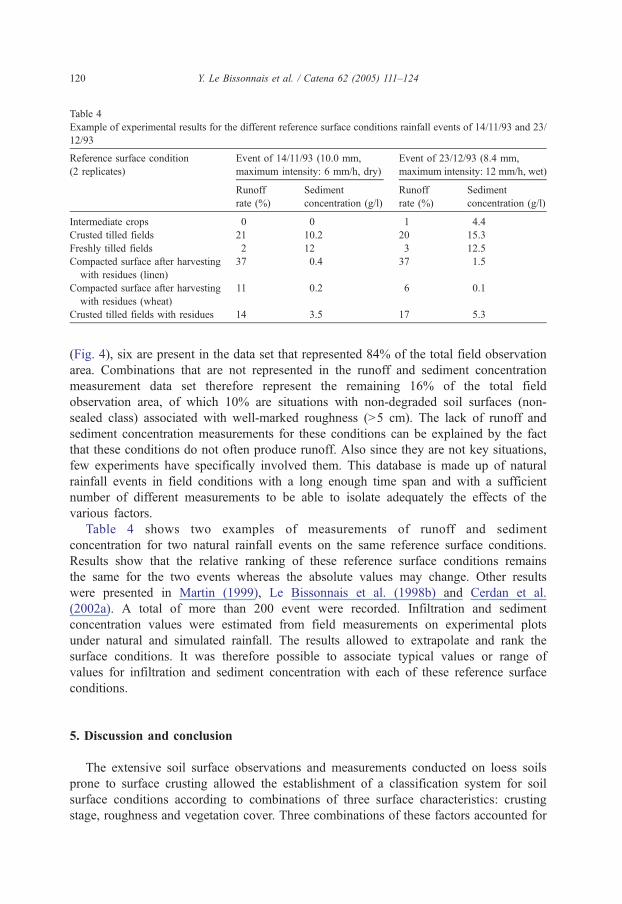
Table 4
Example of experimental results for the different reference surface conditions rainfall events of 14/11/93 and 23/
12/93
Reference surface condition
(2 replicates)
Event of 14/11/93 (10.0 mm,
maximum intensity: 6 mm/h, dry)
Event of 23/12/93 (8.4 mm,
maximum intensity: 12 mm/h, wet)
Runoff
rate (%)
Sediment
concentration (g/l)
Runoff
rate (%)
Sediment
concentration (g/l)
Intermediate crops 0 0 1 4.4
Crusted tilled fields 21 10.2 20 15.3
Freshly tilled fields 2 12 3 12.5
Compacted surface after harvesting
with residues (linen)
37 0.4 37 1.5
Compacted surface after harvesting
with residues (wheat)
11 0.2 6 0.1
Crusted tilled fields with residues 14 3.5 17 5.3
Y. Le Bissonnais et al. / Catena 62 (2005) 111–124120
(Fig. 4), six are present in the data set that represented 84% of the total field observation
area. Combinations that are not represented in the runoff and sediment concentration
measurement data set therefore represent the remaining 16% of the total field
observation area, of which 10% are situations with non-degraded soil surfaces (non-
sealed class) associated with well-marked roughness (N5 cm). The lack of runoff and
sediment concentration measurements for these conditions can be explained by the fact
that these conditions do not often produce runoff. Also since they are not key situations,
few experiments have specifically involved them. This database is made up of natural
rainfall events in field conditions with a long enough time span and with a sufficient
number of different measurements to be able to isolate adequately the effects of the
various factors.
Table 4 shows two examples of measurements of runoff and sediment
concentration for two natural rainfall events on the same reference surface conditions.
Results show that the relative ranking of these reference surface conditions remains
the same for the two events whereas the absolute values may change. Other results
were presented in Martin (1999), Le Bissonnais et al. (1998b) and Cerdan et al.
(2002a). A total of more than 200 event were recorded. Infiltration and sediment
concentration values were estimated from field measurements on experimental plots
under natural and simulated rainfall. The results allowed to extrapolate and rank the
surface conditions. It was therefore possible to associate typical values or range of
values for infiltration and sediment concentration with each of these reference surface
conditions.
5. Discussion and conclusion
The extensive soil surface observations and measurements conducted on loess soils
prone to surface crusting allowed the establishment of a classification system for soil
surface conditions according to combinations of three surface characteristics: crusting
stage, roughness and vegetation cover. Three combinations of these factors accounted for
Y. Le Bissonnais et al. / Catena 62 (2005) 111–124 121
more than 50% of the variation in data composed of more than 5000 soil surface
characteristic observations. Eight other combinations accounted individually for more
than 2% of the observations. These dominant and secondary combinations were
considered as breference surface conditionsQ. Their potential infiltration capacity domains
and sediment production were estimated from field measurements under natural and
simulated rainfall (Gallien et al., 1995; Le Bissonnais et al., 1998b, Martin, 1999). The
results confirm the important spatial and seasonal variability of these key factors for
erosion modelling.
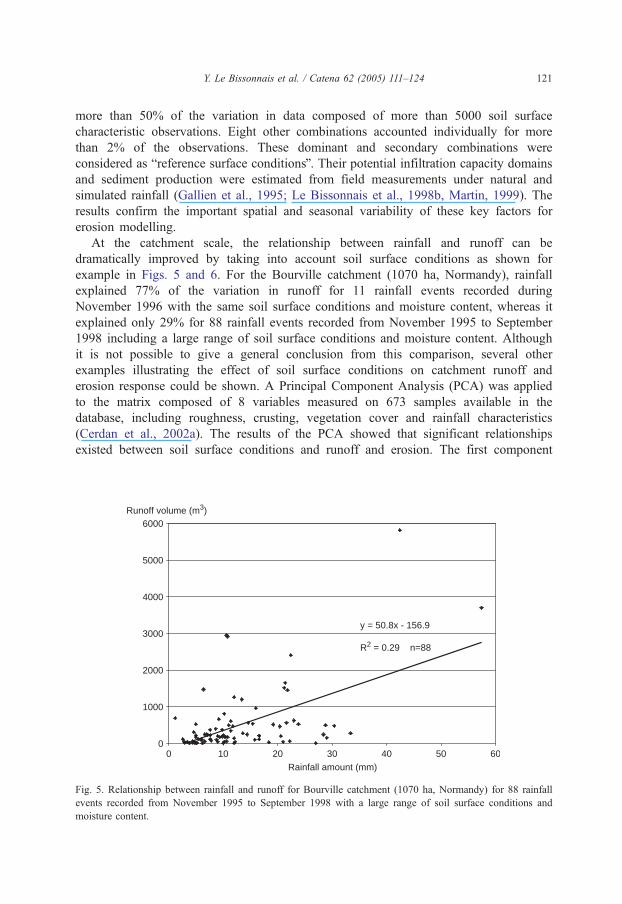
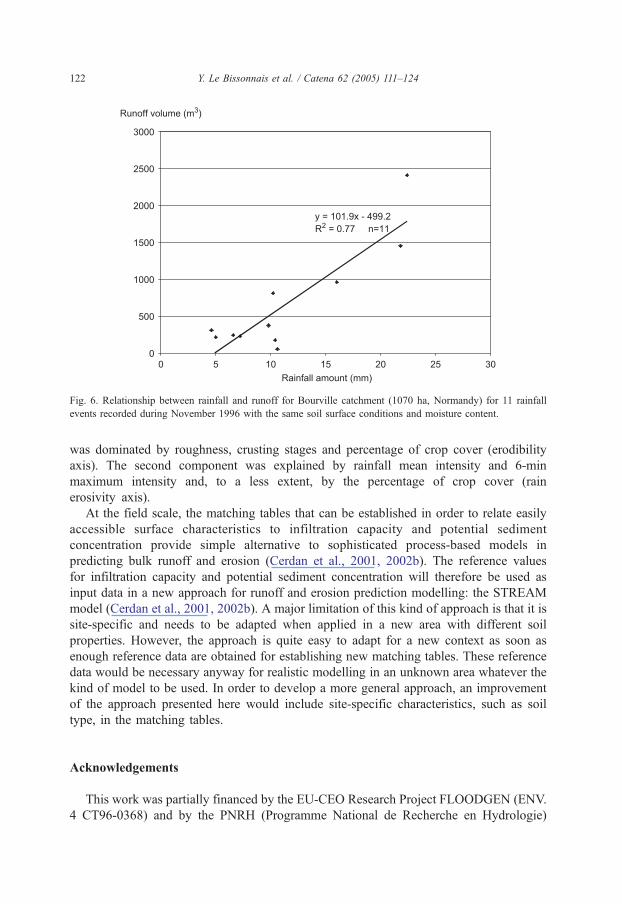
At the catchment scale, the relationship between rainfall and runoff can be
dramatically improved by taking into account soil surface conditions as shown for
example in Figs. 5 and 6. For the Bourville catchment (1070 ha, Normandy), rainfall
explained 77% of the variation in runoff for 11 rainfall events recorded during
November 1996 with the same soil surface conditions and moisture content, whereas it
explained only 29% for 88 rainfall events recorded from November 1995 to September
1998 including a large range of soil surface conditions and moisture content. Although
it is not possible to give a general conclusion from this comparison, several other
examples illustrating the effect of soil surface conditions on catchment runoff and
erosion response could be shown. A Principal Component Analysis (PCA) was applied
to the matrix composed of 8 variables measured on 673 samples available in the
database, including roughness, crusting, vegetation cover and rainfall characteristics
(Cerdan et al., 2002a). The results of the PCA showed that significant relationships
existed between soil surface conditions and runoff and erosion. The first component
y = 50.8x - 156.9
R2 = 0.29 n=88
0
1000
2000
3000
4000
5000
6000
0 10 20 30 40 50 60Rainfall amount (mm)
Runoff volume (m3)
Fig. 5. Relationship between rainfall and runoff for Bourville catchment (1070 ha, Normandy) for 88 rainfall
events recorded from November 1995 to September 1998 with a large range of soil surface conditions and
moisture content.
y = 101.9x - 499.2
R2 = 0.77 n=11
0
500
1000
1500
2000
2500
3000
0 5 10 15 20 25 30
Rainfall amount (mm)
Runoff volume (m3)
Fig. 6. Relationship between rainfall and runoff for Bourville catchment (1070 ha, Normandy) for 11 rainfall
events recorded during November 1996 with the same soil surface conditions and moisture content.
Y. Le Bissonnais et al. / Catena 62 (2005) 111–124122
was dominated by roughness, crusting stages and percentage of crop cover (erodibility
axis). The second component was explained by rainfall mean intensity and 6-min
maximum intensity and, to a less extent, by the percentage of crop cover (rain
erosivity axis).
At the field scale, the matching tables that can be established in order to relate easily
accessible surface characteristics to infiltration capacity and potential sediment
concentration provide simple alternative to sophisticated process-based models in
predicting bulk runoff and erosion (Cerdan et al., 2001, 2002b). The reference values
for infiltration capacity and potential sediment concentration will therefore be used as
input data in a new approach for runoff and erosion prediction modelling: the STREAM
model (Cerdan et al., 2001, 2002b). A major limitation of this kind of approach is that it is
site-specific and needs to be adapted when applied in a new area with different soil
properties. However, the approach is quite easy to adapt for a new context as soon as
enough reference data are obtained for establishing new matching tables. These reference
data would be necessary anyway for realistic modelling in an unknown area whatever the
kind of model to be used. In order to develop a more general approach, an improvement
of the approach presented here would include site-specific characteristics, such as soil
type, in the matching tables.
Acknowledgements
This work was partially financed by the EU-CEO Research Project FLOODGEN (ENV.
4 CT96-0368) and by the PNRH (Programme National de Recherche en Hydrologie)
Y. Le Bissonnais et al. / Catena 62 (2005) 111–124 123
funded RIDES project. The authors are also grateful to J. Wainwright and M. Romkens for
their English language corrections and suggestions that helped to improve the manuscript.
References
Auzet, A.V., Boiffin, J., Papy, F., Ludwig, B., Maucorps, J., 1993. Rill erosion as a function of the characteristics
of cultivated catchments in the north of France. Catena 20, 41–62.
Auzet, A.V., Boiffin, J., Ludwig, B., 1995. Concentrated flow erosion in cultivated catchments: influence of soil
surface state. Earth Surface Processes and Landforms 20, 5–14.
Boiffin, J., 1986. Stages and time dependency of soil crusting in situ. In: Caillebaud, F., Gabriels, D., De Boodt,
M. (Eds.), Assessment of Soil Surface Sealing and Crusting. Flanders Research Center for Soil Erosion and
Soil Conservation, Ghent, pp. 91–98.
Boiffin, J., Monnier, G., 1986. Infiltration rate as affected by soil surface crusting caused by rainfall. In:
Caillebaud, F., Gabriels, D., De Boodt, M. (Eds.), Assessment of Soil Surface Sealing and Crusting. Flanders
Research Center for Soil Erosion and Soil Conservation, Ghent, pp. 210–217.
Boiffin, J., Papy, F., Eimberck, M., 1988. Influence des systemes de culture sur les risques d’erosion
par ruissellement concentre: I. Analyse des conditions de declenchement de l’erosion. Agronomie 8,
663–673.
Bradford, J.M., Huang, C., 1994. Interrill soil erosion as affected by tillage and residue cover. Soil and Tillage
Research 31, 353–361.
Bradford, J.M., Ferris, J.E., Remley, P.A., 1987. Interrill soil erosion processes: relationship of splash detachment
to soil properties. Soil Science Society of America Journal 51, 1571–1575.
Bresson, L.M., Boiffin, J., 1990. Morphological characterisation of soil crust development stages on an
experimental field. Geoderma 47, 301–325.
Bresson, L.M., Valentin, C., 1994. Soil surface crust formation: contribution of micromorphology. In: Ringrose-
Voase, A., Humphreys, G. (Eds.), Soil Micromorphology. Elsevier, Amsterdam, pp. 737–762.
Casenave, A., Valentin, C., 1989. Les etats de surface de la zone sahelienne: influence sur l’infiltration. Orstom,
Paris.
Cerdan, O., Souchere, V., Lecomte, V., Couturier, A., Le Bissonnais, Y., 2001. Incorporating soil surface crusting
processes in an expert-based runoff and erosion model: STREAM (Sealing and Transfer by Runoff and
Erosion related to Agricultural Managment). Catena 46, 189–205.
Cerdan, O., Le Bissonnais, Y., Souchere, V., Martin, P., Lecomte, V., 2002a. Sediment concentration in interrill
flow: interactions between soil surface conditions, vegetation and rainfall. Earth Surface Processes and
Landforms 27, 193–207.
Cerdan, O., Le Bissonnais, Y., Couturier, A., Saby N., 2002b. Modelling interrill erosion processes in an expert-
based runoff and erosion model STREAM. Hydrological Processes 16 (16), 3215–3226.
Chaplot, V., Le Bissonnais, Y., 1999. Field measurements of interrill erosion under different slopes and plot sizes.
Earth Surface Processes and Landforms 24, 1–10.
De Roo, A.P.J., 1998. Modelling runoff and sediment transport in catchment using GIS. Hydrological Processes
12, 905–922.
Fox, D., Le Bissonnais, Y., 1998. A process-based analysis of the influence of aggregate stability on surface
crusting, infiltration, and interrill erosion. Soil Science Society of America Journal 62, 717–724.
Fullen, M.A., Reed, A.H., 1987. Rill erosion on arable loamy sands in the West Midlands of England. In: Bryan,
R.B. (Ed.), Rill Erosion, Processes and Significance, Catena, Suppl., vol. 8, pp. 85–96.
Gallien, E., Le Bissonnais, Y., Eimberck, M., Benkhadra, H., Ligneau, L., Ouvry, J.F., Martin, P., 1995. Influence
des couverts vegetaux de jachere sur le ruissellement et l’erosion diffuse en sol limoneux cultive. Cahiers
Agricultures 4, 171–183.
Govers, G., Takken, I., Helming, K., 2000. Soil roughness and overland flow. Agronomie 20, 131–146.
Huang, C., 1998. Quantification of soil microtopography and surface roughness. In: Baveye, P., Parlange, J.Y.,
Stewart, B.A. (Eds.), Fractals in Soil Science, Advances in Soil Science. CRC Press, pp. 153–168.
Imeson, A.C., Kirkby, M.J., 1996. Scaling up processes and models from the field plot to the watershed and
regional areas. Journal of Soil and Water Conservation 51 (5), 391–396.
Y. Le Bissonnais et al. / Catena 62 (2005) 111–124124
Jetten, V., Boiffin, J., De Roo, A., 1996. Defining monitoring strategies for runoff and erosion studies in
agricultural catchments: a simulation approach. European Journal of Soil Science 47, 579–592.
Kamphorst, E., 2000. Predicting depressional storage from soil surface roughness. Soil Science Society of
America Journal 64, 1749–1758.
Le Bissonnais, Y., Singer, M.J., 1993. Seal formation, runoff and interrill erosion from 17 California soils. Soil
Science Society of America Journal 57, 224–229.
Le Bissonnais, Y., Fox, D., Bresson, L.M., 1998a. Incorporating crusting processes in erosion models. In:
Boardman, J., Favis-Mortlock, D.T. (Eds.), Modelling Soil Erosion by Water. Springer-Verlag NATO-ASI
Global Change Series, Heideilberg, pp. 237–246.
Le Bissonnais, Y., Benkhadra, H., Chaplot, V., Fox, D., King, D., Daroussin, J., 1998b. Crusting, runoff and sheet
erosion on silty loamy soils at various scales and upscaling from m2 to small catchments. Soil and Tillage
Research 46, 69–80.
Lecomte, V., 1999. Transfert de produits phytosanitaires par le ruissellement et l’erosion de la parcelle au bassin
versant: processus, determinisme et modelisation spatiale, These ENGREF-INRA. 242 pp.
Lecomte, V., Le Bissonnais, Y., Renaux, B., Couturier, A., Ligneau, L., 1997. Erosion hydrique et transfert de
produits phytosanitaires dans les eaux de ruissellement. Cahiers Agricultures 6, 175–183.
Ludwig, B., Boiffin, J., Chadoeuf, J., Auzet, A.V., 1995. Hydrological structure and erosion damage caused by
concentrated flow in cultivated catchments. Catena 25, 227–252.
Martin, P., 1999. Reducing flood risk from sediment-laden agricultural runoff using intercrop management
techniques in northern France. Soil and Tillage Research 52, 233–245.
Mitchell, J.K., Jones, A.B., 1978. Micro-relief surface depression storage changes during rainfall events and their
application to rainfall runoff models. Water Resources Bulletin 14, 777–802.
Morgan, R.P.C., Quinton, J.N., Rickson, R.J., 1994. Modelling methodology for soil erosion assessment and soil
conversion design: the EUROSEM approach. Outlook on Agriculture 23, 5–9.
Nearing, M.A., Foster, G.R., Lane, L.J., Finkner, S.C., 1989. A process-based soil erosion model for USDA-water
erosion prediction project technology. Transactions of the ASAE 32, 1587–1593.
Papy, F., Douyer, C., 1991. Influence des etats de surface du territoire agricole sur le declenchement des
inondations catastrophiques. Agronomie 11, 201–215.
Poesen, J., Ingelmo-Sanchez, F., 1992. Runoff and sediment yield from topsoils with different porosity as affected
by rock fragment cover and position. Catena 19, 451–474.
Romkens, M.J.M., Wang, J.Y., 1986. Effect of tillage on surface roughness. Transactions of the ASAE 29,
429–433.
Souchere, V., King, D., Daroussin, J., Papy, F., Capillon, A., 1998. Effects of tillage on runoff directions:
consequences on runoff contributing area in agricultural catchment. Journal of Hydrology 206, 256–267.
U.S. Department of Agriculture, 2003. National Soil Survey Handbook, title 430-VI. [Online] Available: bhttp://
soils.usda.gov/technical/handbook/N.
Zobeck, T.M., Onstad, C.A., 1987. Tillage and rainfall effects on random roughness: a review. Soil and Tillage
Research 9, 1–20.
Top Related
Copyright © 2022 FDOKUMEN

