


Bahasa
Halaman
Hukum


1
VAPOUR REACTIVE DISTILLATION PROCESS FOR HYDROGEN
PRODUCTION BY HI DECOMPOSITION FROM HI-I2-H2O
SOLUTIONS
B. BELAISSAOUI, R.THERY, X.M. MEYER1, M. MEYER, V. GERBAUD and X. JOULIA
LGC-Laboratoire de Génie Chimique, UMR CNRS 5503
5 rue Paulin Talabot 31106 Toulouse Cedex 1, France
Phone : + 33 5 62885826; Fax : + 33 5 62885600
E-mail: [email protected]
Accepted for publication in Chem. Eng. Proc., 47(3), 396-407, 2008
ABSTRACT
In this contribution, a sequential and hierarchical approach for the feasibility analysis and the preliminary
design of reactive distillation columns is extended to systems involving vapour phase chemical reaction
and is successfully applied to the HI vapour phase decomposition to produce H2.
The complex phase and physico chemical behaviour of the quaternary HI-H2-I2-H2O system is
represented by the Neumann’s thermodynamic model and instantaneous vapour phase chemical
equilibrium is assumed.
Then, from minimal information concerning the physicochemical properties of the system, three
successive steps lead to the design of the unit and the specification of its operating conditions: the
feasibility analysis, the synthesis and the design step. First, the analysis of reactive condensation curve map
method (rCCM), assuming infinite internal liquid and vapour flow rate and infinite reflux ratio, is used to
assess the feasibility of the process. It determines the column structure and estimates the attainable
compositions. These results are used as inputs data for the synthesis step. Based on the boundary value

2
design method (BVD), considering finite internal liquid and vapour flow rate and finite reflux ratio while
neglecting all thermal effects and assuming a constant heat of vaporisation, the synthesis step provides
more precise information about the process configuration (minimum reflux ratio, number of theoretical
stages, localisation and number of reactive plates, position of the feed plate). Finally, the BVD method
results are used to initialise rigorous simulations, based on an equilibrium stage model with energy balance,
to estimate the reflux ratio taking into account thermal effect on the process.
The resulting design configuration consists in a single feed and entirely reactive distillation column. The
column operates under a pressure of 22 bars. The feed of the reactive distillation column, coming from
the Bunsen reaction section [xHI=0.10; xI2=0.39 xH2O=0.51], is at its boiling temperature. The residue
consists in pure iodine. Water and produced hydrogen are recovered at the distillate. The column operates
at a reflux ratio of 5 and is composed of 11 theoretical plates including the reboiler and the partial
condenser with the feed at the stage 10 (counted downwards). The obtained HI dissociation yield is
99.6%.
Keywords: Hydrogen production, Sulfur/Iodine thermochemical cycle, vapour phase reactive distillation,
reactive distillation design.
1. INTRODUCTION
In the current context of increasing energy demand, new solutions leading to reduce greenhouse effect gas
emission are investigated. Among various alternatives, hydrogen appears as one of the most attractive
energy vector for the future. The thermochemical water decomposition cycle using nuclear heat is one of
the processes for hydrogen production from water. Hydrogen can be obtained from water at temperatures
lower than the direct water decomposition (~4000K) by combining a set of coupled thermally-driven
chemical reactions.
The sulfur/iodine (S/I) thermochemical cycle is a promising one [1] . The cycle inputs are heat and water.
The outputs are hydrogen and oxygen. It consists of three main reactions with the recycling of iodine and
sulphur dioxide as shown in figure 1 :
9 I2 + SO2 +16 H2O → (2 HI + 10 H2O + 8 I2) + (H2SO4 + 4 H2O) [393K] (R1)

3
2 Η2SΟ4 → 2 SΟ2 + 2 Η2Ο + Ο2 [1123Κ] (R2)
2 HI ↔ H2 + I2 [723K] (R3)
H2O
H2 ½ O2
Water
Hydrogen Oxygen
2HI + H2SO4
I2 + 2 H2O + SO2
H2SO4 ½ O2
SO2+ 2 H2O
H2 + 2 HI I2
Recycling
SO2 ,H2O
Recycling
I2
Heat source
Figure 1. The principle of the thermochemical water decomposition cycle for hydrogen production
The hydrogen production process design leads to three sections as illustrated on figure 2.
In section I, the first reaction R1, called the Bunsen-reaction, proceeds exothermically in a liquid phase and
produces two immiscible acid phases: the hydroiodic acid and sulphuric acid phases. After separation,
these acid phases are concentrated and decomposed in sections II and III according to reactions R2 and
R3. In section II, Reaction R2 is the endothermic H2SO4 decomposition into water, oxygen and sulphur
dioxide and takes place in a gas phase catalytic reactor. In section III, the HI phase is first concentrated by
distillation and the HI-H2O distillate at azeotropic composition (13% molar in HI) is decomposed in the
vapour phase according to reaction R3 which we focus on in this work. It is a catalytic and equilibrium
limited reaction with a small endothermic heat of reaction. Except for hydrogen and oxygen, the products
of the R2 and R3 and the excess of water and iodine are recycled as reactants in the Bunsen-reaction step.

4
0
500
70000
90000
1100
1300
H2SO4 ���� H2O + SO2 + ½ O2
O2
2 HI ⇔⇔⇔⇔ H2+ I2
I2
H2H2
Heat
Bunsen reactionSECTION I
Bunsen reactionSECTION I
Tem
pera
ture
(K
)
H2O
Heat
Heat
SECTION III
HI decomposition
SECTION III
HI decompositionHI decompositionPhase separation
H2O
SO2
HI phase
H2SO4 Phase
HI Phase distillation
Evaporation
H2SO4
I2
H2O
9I2+SO2+16H2O ����
(2HI+10H2O+8I2) + (H2SO4+4H2O)
HI Phase H2SO4 Phase
H2SO4
decomposition
SECTION II
H2SO4
decomposition
SECTION II
Vapour phase reaction
I2H2O,
HI
H2SO4 H2O
H2O
Figure 2. Concept of the Sulfur / Iodine thermochemical cycle for the production of hydrogen
The HI concentration and decomposition section (section III) is one of the most expensive and energy
consuming steps of this cycle and suffers several drawbacks:
(1) The HI decomposition degree is limited by the chemical equilibrium and the conversion at 723K
does not exceed 22.4%
(2) An excess of iodine and water is needed for the separation of the two phases after the Bunsen
reaction R1. Therefore, a large amount of H2O and iodine is recycled to the Bunsen reaction from
the HI distillation column. At least, an excess of 8 moles of I2 and 14 moles of H2O are necessary
to produce one mole of hydrogen.
(3) The HI purity of the azeotropic distillate input to reaction R3 obtained is low (13% molar). A lot
of energy is required to evaporate the water in excess.
Several alternatives have been proposed in order to improve the efficiency of the process in section III.
In order to improve the concentration of the HI phase after the Bunsen reaction, the General Atomic Co
group proposed the use of phosphoric acid (H3PO4) for the concentration of the HI solution [2]. A

5
vapour with a 99.7% molar in HI was obtained. But, the remaining H3PO4 solution was concentrated by
using large amounts of heat and electricity. An electro-electrodialysis (EED) concentration method was
also proposed by Arifal et al. (2002) [3] and Onuki et al. (2001) [4]. Improvement of the HI decomposition
reaction conversion was also investigated using a H2 permselective membrane reactor by Hwang and
Onuki (2001) [5].
Another proposal aimed at reducing the stream obtained at the top of the HI distillation column by
concentrating HI over the azeotropic I2-H2O composition before reaction R3. Indirectly achieving this
goal, reactive distillation was first proposed and investigated by Roth and Knoche (1989) [6]. It consists to
replace both distillation and decomposition steps in the S/I cycle (see figure 3). In this integrated process,
HI is directly decomposed in the vapour phase from the HI-I2-H2O solution [xHI=0.10; xI2=0.39
xH2O=0.51] coming from the Bunsen reaction in section I.
HI concentration + HI decomposition
I2, H2O
I2
To the Bunsen reaction
HI, H2
I2 , H2O
AzotropeHI (13%) – H2O
HI (10%)H2O (51%)I2 (39%)
HI (10%)H2O (51%)I2 (39%)
reactive distillation(Roth and Knoche, 1989)
, H2OI2
H2 , H2O
(HI)
I2 , H2O
HI (10%)H2O (51%)I2 (39%)
To the Bunsen reaction
, H2OI2
H2 , H2O
(HI)
I2 , H2O
HI (10%)H2O (51%)I2 (39%)
HI (10%)H2O (51%)I2 (39%)
To the Bunsen reaction
Reaction
Separation
HI
Equilibrium reaction
2 HI ⇔⇔⇔⇔ H2+I
2
Equilibrium reaction
2 HI ⇔⇔⇔⇔ H 2 +I 2
Section III
Figure 3: Integration of a reactive distillation in the Sulfur / Iodine thermochemical cycle for the production of hydrogen
Combining reaction and separation in a single apparatus of reactive distillation presents numerous
advantages: the continuous removal of one of the products from the reacting mixture shifts the
equilibrium towards the production of I2 and H2 and enables to increase the conversion of HI and reduce
the recycling of vapour HI.
The purpose of this article is to apply the design approach devised by Thery et al.( 2005) [7] extended to
vapour phase reaction to the HI vapour phase decomposition to produce H2.

6
First, the general consideration of the thermodynamic of the HI-H2-I2-H2O system is presented. A
synthesis of the available experimental data for this system in the literature is reported. The adopted model
in the present work is exposed. A comparison between model calculation and experimental data is also
presented. Second, the extended design approach is used to propose a preliminary design for the reactive
distillation column. Results for each step of the design procedure are commented. Finally, the conclusion
and perspectives of the present work are emphasized.
2. THERMODYNAMICS OF HI-H2-I2-H2O SYSTEM
2.1. Thermodynamic and chemical behaviour of HI-H2-I2-H2O system
The HI-H2-I2-H2O system thermodynamic behaviour is complex as a vapour-liquid-liquid-solid phase
coexistence system occurs in the catalytic reactive distillation column. The solid phase is not considered in
this work and figure 4 hints at the remaining complexity. Besides thermodynamic phase behaviour is
characterised namely by:
• Highly immiscible H2O-I2 liquid-liquid equilibrium
• Azeotropic H2O-HI binary exhibiting liquid-liquid equilibrium
• High temperature triple point for I2 (387K)
• HI-I2-H2O ternary mixture displays two separate liquid-liquid regions.
In the HI-H2-I2-H2O system, several chemical reactions occurs and class it among the strong electrolytic
systems:
- Vapour phase HI equilibrium decomposition: 2HI ↔ I2+H2.
- Polyiodide ions formation: I2 + I- ↔ I3-, I2 + H+↔I2H+.
- Ion solvation: 5 H2O + HI ↔ (5 H2O, H+) + I-

7
H2O
Vapor phase
HI
I2
H2
HI
I2
H2O
Liquid phase
2 HI � H2 + I2Complexe formation
5 H2O + HI ↔ (5H2O, H+) + I-
Electrolytic system
Formation of polyiodides ions (I3-, I2H+,..)
I2 + I- ↔ I3-
I2 + H+↔I2H+
Equilibrium limited reaction
Azeotropic mixture
Highly immiscible LLE system
Figure 4. Description of the complex phase behaviour of the HI-H2-I2-H2O system
2.2. Available experimental data for the HI-I2-H2O ternary system
The I2-H2O system has been studied by Kracek [8] in 1931. The solubility of iodine in water was measured
and a miscibility gap lying between the solid-liquid equilibrium point at 385.4K (close to the melting point
of iodine: 386.8K) and an upper temperature of approximately 553K was detected. At 385.4K, the light
aqueous phase contains 0.05% molar of iodine and the heavy phase about 98% molar of iodine.
Total pressures of HI-H2O mixtures have been investigated by Wüster and Vanderzee [9-10]. This system
exhibits an azeotrope whose precise composition depends on temperature and pressure. A synthesis of
these data has been published by Engels and Knoche (1986) [11]. In the ternary HI-I2-H2O system
recently reviewed by Mathias (2005) [12] (see figure 4), the liquid phase exhibits two immiscibility regions
which are the extension of the partly miscible systems I2-H2O and HI-H2O: one for low HI contents, due
to the very low miscibility of I2 in H2O, and the second one, for high HI contents and about H2O/I2 of
30% concentration. The first one tends to disappear with increasing HI concentration probably because of
the formation of polyiodides ions like I3- or I2H+. No data are available for the liquid-liquid equilibrium in
the miscibility region with low HI content.
Engels and Knoche (1986) [11] have performed total pressure measurements for the HI-H2O-I2 ternary
system for various iodine concentrations in the 0 ≤ xHI/xH2O ≤ 0.19 molar compositions and 393K ≤ T ≤
573K temperature domain.
They have found that the dissociation of gaseous HI shifts the HI composition towards lower HI contents
than is expected from the binary HI-H2O azeotrope. Starting from the binary HI-H2O, they have shown

8
that the line of vapour pressure minima of the system goes through the entire concentration field towards
the pure iodine. They called the HI compositions on this line the pseudo-azeotropic compositions.
Engels and Knoche (1986) [11] have found that for HI concentrations higher than the pseudo-azeotropic
composition, the vapour phase is very rich in HI, and for high temperatures (>473K), HI might be
dissociated in the vapour phase in H2 and I2.
They have also found that comparing to the homogeneous gas phase reaction, higher hydrogen partial
pressures are reached in the case of the direct decomposition from HI-H2O-I2 solutions with HI content
greater than the pseudo-azeotropic composition and for low iodine content. They explained this
observation by the fact that the liquid absorbs most of iodine from the vapour and so the reaction
equilibrium of the HI decomposition is shifted strongly to the right side. This result is in agreement with
further experiments done by Berdhauser and Knoche [13].
The HI decomposition is slightly endothermic, thus the chemical equilibrium is promoted by high
temperatures. The kinetic of this reaction is very slow and the use of appropriate catalyst permits to
approach rapidly the chemical equilibrium conversion.
The HI decomposition reaction has been extensively investigated from the early 1900s to the present day.
Extensive experimental work on the heterogenous decomposition of HI including catalyst research
program, applied specifically to thermochemical water splitting, has been extensively conducted at two
laboratories : the National Chemical Laboratory for Industry, Japan, and General Atomics, United States.
Results are reported by O’Keefe et al. (1980)[14].
2.3. The adopted thermodynamic model: Neumann’s model (1987)
In this study, we consider the thermodynamic model proposed by Neumann (1987) [15]. It is based on the
following assumptions:
♦ the vapour phase is ideal, despite high total pressures
♦ in the liquid phase, a solvation equilibrium occurs: 5 H2O + HI ↔ (5H2O, H+) + I-
♦ the polyiodide formation is neglected : I2 + I- ↔ I3- , I2 + H+↔I2H+

9
The non ideality of the liquid phase is represented by the NRTL activity coefficient model with binary
interaction parameters (including solvent-complex) estimated from the experimental vapour - liquid data
computed by Engels and Knoche (1986) [11].
Neumann [15] has identified two sets of parameters corresponding respectively to two temperature ranges:
below and above 423K. He has also identified the expression of the solvation equilibrium constant Ka(T),
T/6692549.8)T(Kln a ++++−−−−==== [1]
with T in K.
The HI decomposition reaction is an equilibrium limited reaction taking place in the vapour phase. The
chemical equilibrium constant is expressed as the ratio of the partial pressure Pi of the component i:
HI
2
IH
eqP
P.PK 22==== [2]
The expression of the HI decomposition chemical equilibrium constant as a function of the temperature T
has been proposed by Neumann (1987) [15] and is expressed as follows:
T/7729.277203684.0)T(Kln eq −−−−−−−−==== [3]
with T in K.
However, modelling inadequacies as well as a lack of fundamental data [12] lead to a non predictive and
non validated behaviour of the vapour – liquid – liquid equilibria that are known to occur. A more reliable
and accurate thermodynamic model for the studied system remains a challenge and the current model of
Neumann can only be safely applied to perform vapour – liquid calculations.
2.4. Comparison between model calculation and experimental data
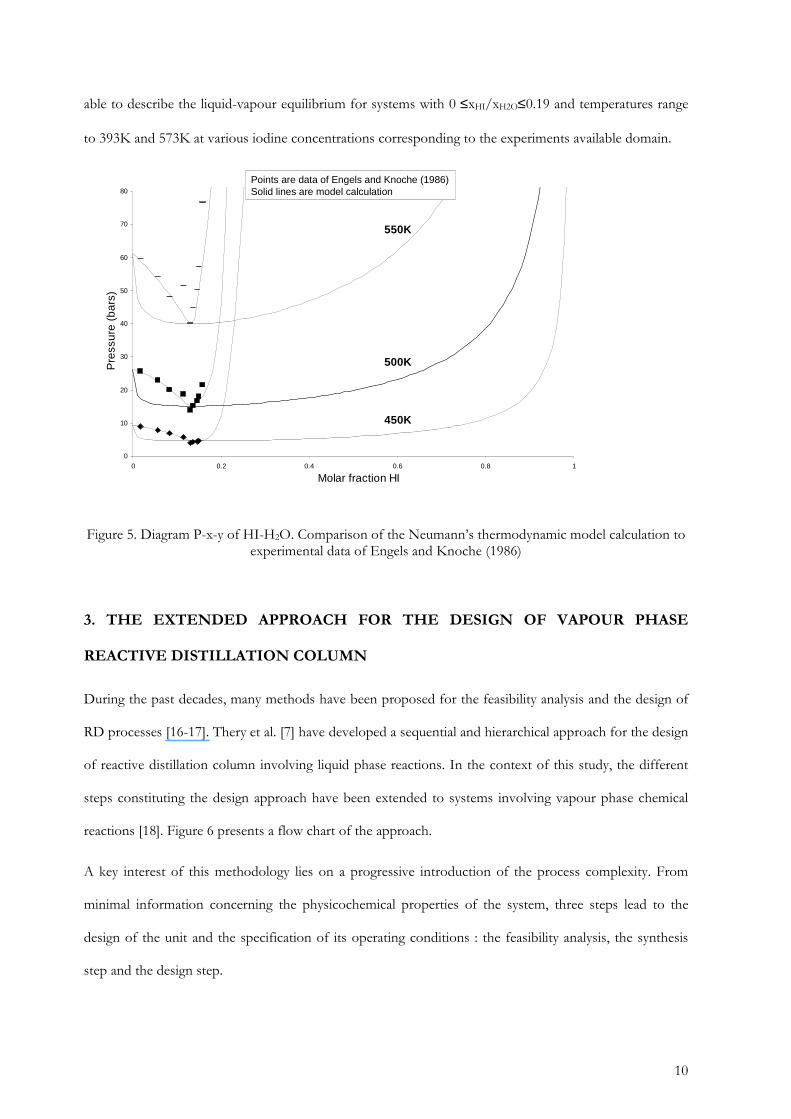
In figure 5, we compare the experimental data of Engels et Knoche (1986) [11] with Neumann’s model
calculation. In this figure, the non reactive diagram P-x-y of the binary HI-H2O for the temperatures of
450K , 500K and 550K is reported. The points are the experimental data where the dissociation of HI is
negligible. The model is clearly able to capture the azeotropic behavior of the system. Thus the model is
10
able to describe the liquid-vapour equilibrium for systems with 0 ≤xHI/xH2O≤0.19 and temperatures range
to 393K and 573K at various iodine concentrations corresponding to the experiments available domain.
0
10
20
30
40
50
60
70
80
0 0.2 0.4 0.6 0.8 1
Molar fraction HI
Pre
ssur
e (b
ars)
450K
500K
550K
Points are data of Engels and Knoche (1986) Solid lines are model calculation
Figure 5. Diagram P-x-y of HI-H2O. Comparison of the Neumann’s thermodynamic model calculation to experimental data of Engels and Knoche (1986)
3. THE EXTENDED APPROACH FOR THE DESIGN OF VAPOUR PHASE
REACTIVE DISTILLATION COLUMN
During the past decades, many methods have been proposed for the feasibility analysis and the design of
RD processes [16-17]. Thery et al. [7] have developed a sequential and hierarchical approach for the design
of reactive distillation column involving liquid phase reactions. In the context of this study, the different
steps constituting the design approach have been extended to systems involving vapour phase chemical
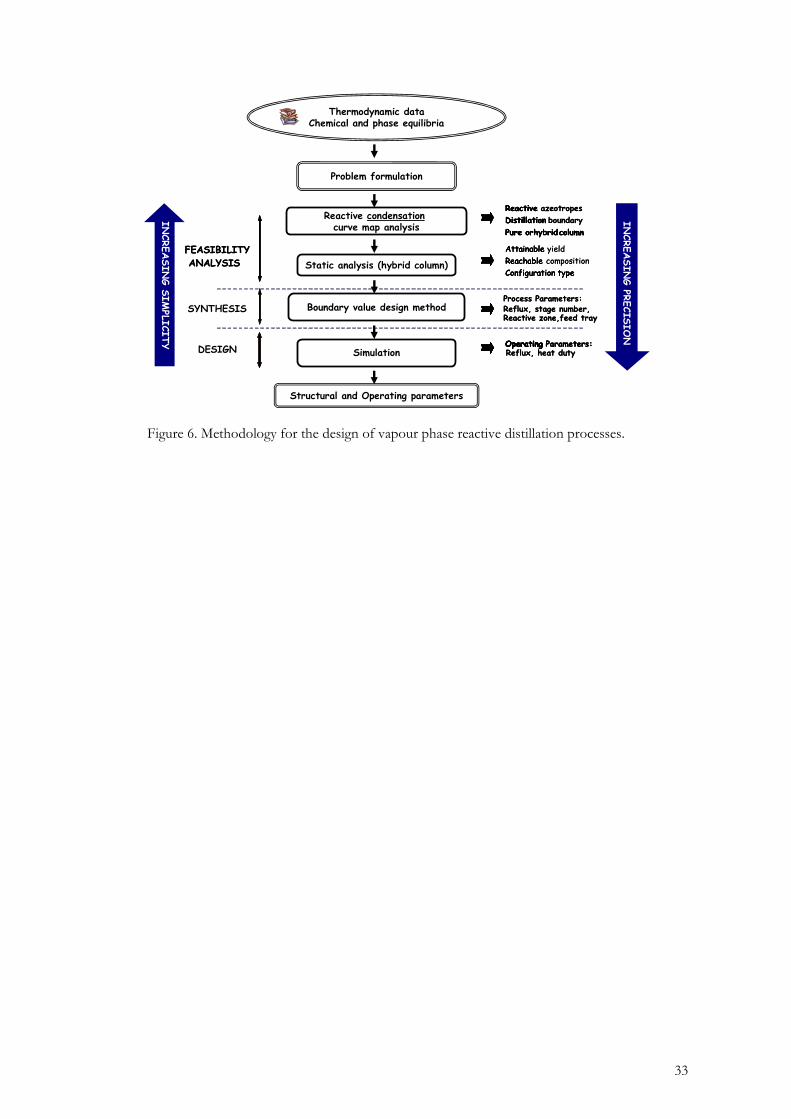
reactions [18]. Figure 6 presents a flow chart of the approach.
A key interest of this methodology lies on a progressive introduction of the process complexity. From
minimal information concerning the physicochemical properties of the system, three steps lead to the
design of the unit and the specification of its operating conditions : the feasibility analysis, the synthesis
step and the design step.

11
FEASIBILITYANALYSISFEASIBILITYANALYSIS
SYNTHESIS
DESIGN
INCREASIN
G PR
ECISIO
N
INCREASIN
G SIM
PLICIT
Y
Reactive azeotropes
Distillation boundary
Pure or hybridcolumn
Reactive
Distillation
Pure or hybridcolumn
Reactive azeotropes
Distillation boundary
Pure or hybridcolumn
Reactive
Distillation
Pure or hybridcolumn
Attainable yield
Reachable composition
Configuration type
Attainable
Reachable
Configuration type
Attainable yield
Reachable composition
Configuration type
Attainable
Reachable
Configuration type
Process Parameters:
Reactive zone,feed trayReflux, stage number, Process Parameters:
Reactive zone,feed trayReflux, stage number,
Reactive condensationcurve map analysis
Thermodynamic dataChemical and phase equilibria
Static analysis (hybrid column)
Boundary value design method
Simulation
Problem formulation
Structural and Operating parameters
Operating Parameters:Operating Reflux, heat dutyOperating Parameters:Operating Operating Parameters:Operating Reflux, heat duty
Figure 6. Methodology for the design of vapour phase reactive distillation processes.
3.1. Feasibility Analysis
3.1.1. Analysis of the reactive condensation curve map
The qualitative analysis of the reactive residue curve map (rRCM) first proposed by Barbosa and Doherty
[19] can be readily used. However, because the reaction occurs in the vapour phase, condensation curve
separatrices should be analysed instead of residue curve separatrices [20]. The reactive condensation curve
map (rCCM) are computed by simulating an open condensation process experiencing equilibrium reaction
for various initial vapour compositions and by representing the locus of vapour composition in physical
and chemical equilibrium with the liquid phase. The feasibility analysis aims at making sure that the
specifications are physically attainable. It defines the most favourable feed composition and the column
structure necessary to obtain the desired product (requirement of a pure separation section, requirement of
one or two feed plates).
3.1.2. Static Analysis
The static analysis (SA) method assesses the feasibility of partially reactive columns. Assuming infinite
flowrates, the composition profile in the column can be represented by the distillation line. The obtained
number of stages corresponds to the minimal number of stages. The method enables to determine the
attainable extent of the reaction, the distillate and bottom products compositions and hints at the column

12
configuration (approximate number of stages, localization and size of the reactive zone). The SA method
assumptions [21] hold whatever the reactive phase, so that its extension to handle vapour phase reaction is
straight forward, the mixture resulting from the reaction step and entering the separation device being
then in vapour state.
3.2. Synthesis step
The synthesis step is based on the boundary value design (BVD) method that provide precise information
about the process configuration and characteristics (minimum and maximum reflux ratios, number of
theoretical stages, localisation and number of reactive plates, position of the feed plate). Constant Molar
Overflow (CMO) assumptions are formulated so that thermal effects are not considered and composition
profiles are deduced from the mass balance equations [22-23].
Furthermore, assuming instantaneous vapour phase equilibrium, transformed composition variables [24]
can be used.
3.3. Design Step
Thermal phenomena (heat of reaction, difference between components vaporisation enthalpy…) have
been ignored so far and are considered in the design step, through the introduction of energy balances in a
MESH model suitable for simulation. The former steps have set the column configuration and the design
step aims at adjusting the operating parameters taking into account the overall complexity of the process.
Simulation is carried out using ProSimPlus [25]. Given the pressure and the column configuration, the
degree of freedom of the MESH model is equal to 2: to saturate this degree of freedom, the purity and the
partial flow rate of the desired component (at the top or at the bottom) are fixed. Then, the required reflux
ratio and heat duties are deduced from the model resolution. To help the calculations, compositions and
temperature profiles estimated during the synthesis step are used as initialization points. At the end of this
step, a column structure and the associated operating parameters necessary to achieve the initial
specifications are available.
13
4. APPLICATION OF THE DESIGN APPROACH TO THE HYDROIODIC ACID-
HYDROGEN-IODINE–WATER SYSTEM
In this section, we present the results of the application of the extended reactive distillation design
approach to the hydroiodic acid - hydrogen – iodine – water system.
4.1. Pressure Choice
Because remarkable hydrogen partial pressures are only found for solutions with a HI content higher than
the azeotropic molar fraction [11], an operating pressure of 22 bars has been proposed by Roth and
Knoche [6]. It corresponds to the minimum pressure of the boiling feed stream (with composition fixed
by the Bunsen reaction [xHI=0.10; xI2=0.39 xH2O=0.51]) in order to have a HI molar fraction suitable for
the production of hydrogen. The global design approach is applied below for this pressure.
4.2. Feasibility analysis
4.2.1. Non reactive condensation curve map (nrCCM) of the ternary HI-I2-H2O system
The non-reactive condensation curve map of the HI-I2-H2O system under the pressure of 22 bars is
represented on the figure 7. It exhibits four singular points, namely the three pure components, iodine,
water and hydroiodic acid and the binary azeotrope HI-H2O (Tboiling=518.28K; xHI=0.133 molar).
This binary azeotrope stability is a saddle which generates a non reactive boundary distillation and leads to
two distillation regions. In the first distillation region, H2O is a stable node. In the second distillation
region, HI is a stable node. I2 is a unstable node in both distillation region.
Figure 8 shows the influence of the I2 concentration on the maximum bubble temperature of the ternary
system HI-I2-H2O. The crest, corresponding to the non reactive boundary distillation of the HI-I2-H2O
system, relies the pure iodine point (T=642.32K) to the binary azeotrope HI-H2O (T=518.28K). This
result is in agreement with the one obtained from the non reactive Condensation Curve Map (nrCCM) of
the ternary HI-I2-H2O system.

14
I2 (642.32K) HI ( 344.23K)
H2O (490.50K)
Binary azeotrope HI-H2O (518.28K)
Non reactive boudarydistillation
Figure 7. Non reactive condensation curve map of the ternary HI-I2-H2O system under 22 bars
350
450
550
650
0 0.02 0.04 0.06 0.08 0.1 0.12 0.14 0.16 0.18 0.2 0.22
Molar fraction HI
Bub
ble
tem
pera
ture
(K
)
90% I2
60% I270% I2
80% I2
50% I240% I2
20% I230% I210% I2
0% I2
HI-H2O azeotrope
Pure Iodine
Figure 8. Influence of I2 concentration on the maximum bubble temperature of the non reactive ternary system HI-I2-H2O
4.2.2 Reactive condensation curve map (rCCM) of the quaternary HI-H2-I2-H2O system.
4.2.2.1. Singular points
The reactive condensation curve map of the hydroiodic acid-hydrogen-iodine-water system under the
pressure of 22 bars is presented on figure 9. This rCCM is represented using reactive compositions [24]
15
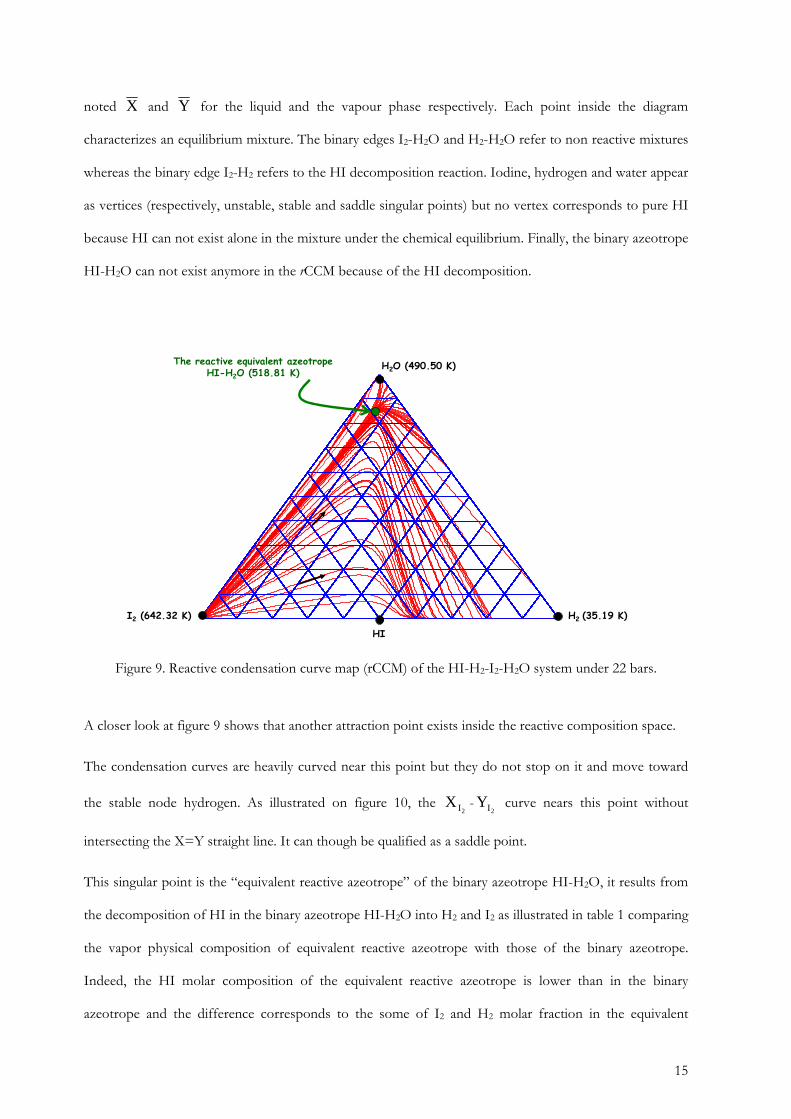
noted X and Y for the liquid and the vapour phase respectively. Each point inside the diagram
characterizes an equilibrium mixture. The binary edges I2-H2O and H2-H2O refer to non reactive mixtures
whereas the binary edge I2-H2 refers to the HI decomposition reaction. Iodine, hydrogen and water appear
as vertices (respectively, unstable, stable and saddle singular points) but no vertex corresponds to pure HI
because HI can not exist alone in the mixture under the chemical equilibrium. Finally, the binary azeotrope
HI-H2O can not exist anymore in the rCCM because of the HI decomposition.
H2 (35.19 K)
H2O (490.50 K)
I2 (642.32 K)
The reactive equivalent azeotropeHI-H2O (518.81 K)
HI
Figure 9. Reactive condensation curve map (rCCM) of the HI-H2-I2-H2O system under 22 bars.
A closer look at figure 9 shows that another attraction point exists inside the reactive composition space.
The condensation curves are heavily curved near this point but they do not stop on it and move toward
the stable node hydrogen. As illustrated on figure 10, the 2IX -
2IY curve nears this point without
intersecting the X=Y straight line. It can though be qualified as a saddle point.
This singular point is the “equivalent reactive azeotrope” of the binary azeotrope HI-H2O, it results from
the decomposition of HI in the binary azeotrope HI-H2O into H2 and I2 as illustrated in table 1 comparing
the vapor physical composition of equivalent reactive azeotrope with those of the binary azeotrope.
Indeed, the HI molar composition of the equivalent reactive azeotrope is lower than in the binary
azeotrope and the difference corresponds to the some of I2 and H2 molar fraction in the equivalent

16
reactive azeotrope. According to the steoechiometry of the reaction, the I2 and H2 molar fraction are
equal. Because H2O is an inert in this case, its molar fraction remains the same. The equivalent reactive
azeotrope is at the temperature of 518.81K while the binary azeotrope HI-H2O is at 518.28K.
0
0.1
0.2
0.3
0.4
0.5
0.6
0.7
0.8
0.9
1
0 0.1 0.2 0.3 0.4 0.5 0.6 0.7 0.8 0.9 1
Liquid reactive composition XI2
vapo
r re
activ
e co
mpo
sitio
n Y
I2
Liquid reactive composition XI2
Vap
our
reac
tive
com
posi
tion
YI 2
Figure 10. 2IX -
2IY diagram of the HI-H2-I2-H2O system under 22 bars
Table 1. Approximated vapor physical composition of the equivalent reactive azeotrope compared to the binary azeotrope (P=22bars)
4.2.2.2. Feasible specifications
The vapour-liquid region where the thermodynamic model is considered reliable is shown on figure 11, it
is the miscibility zone inside the delineated liquid reactive composition region.
According to the feasibility rules introduced by Ung and Doherty [26], a reactive distillation process is
feasible at total reflux if in the reactive composition space, the distillate (D), feed (F) and bottom (B)
points are aligned and if D and B belong to the same reactive condensation curve.
As the feed composition is given by the Bunsen reaction step (point F in figure 11), reachable
specifications are a mixture close to pure iodine in the bottom product and a ternary hydroiodic acid -
HI H2 I2 H2O
Equivalent reactive azeotrope 0.1170 0.0080 0.0080 0.8670
Binary azeotrope 0.1330 0.0000 0.0000 0.8670

17
hydrogen - water mixture in the distillate product. They belong to the region where the thermodynamic
model is considered as reliable. Consequently, the next design steps are performed below so that the
column mass balance lies in the reliable region. As we aim to get a residue exempt from the reactant HI, in
order to increase the HI conversion, we then consider pure iodine at the bottom.
Miscibility zone
(Inside the delineated liquidreactive composition region)
Reliable thermodynamic model
I2 (642.32 K)
Vapordistillate
Liquid fromthe condenser
Feed(liquid)
Residue(liquid)
H2(35.19 K)
H2O (490.50 K)
The reactive equivalentazeotrope HI-H2O (518.81 K)
Figure 11. Neumann’s thermodynamic model validity region of the quaternary HI-H2-I2-H2O system
under 22 bars
The set of attainable product compositions is presented in Table 2 and calculated so as to satisfy the
several specifications, namely, HI dissociation yield of 99.6% molar; 100% I2 recovery ratio in the bottom
product and 99% molar I2 purity in the bottom product.

18
Table 2: Production of hydrogen- P=22 bars-set of attainable products
- input data for the synthesis step
Molar compositions
Liquid feed Vapour distillate Liquid residue
HI 0.10 0.2 10-4 0.85 10-3
H2 0.00 0.8962 10-1 0.00000
I2 0.39 0.00000 0.99000
H2O 0.51 0.91036 0.915 10-2
4.3. Synthesis step
The set of attainable products obtained from the feasibility analysis step (Table 2) are exploited as starting
data for the synthesis step based on the boundary value design (BVD) method. From these data, the
composition and temperature profiles in the different sections of the column are computed stage by stage
for different values of the variable parameter of the method : the reboil ratio noted s. The feed of the
column is at its boiling temperature. A partial condenser is considered.
The first purpose of the boundary value design method consist in determining the minimum reboil ratio.
The vapour reactive stripping profile (full circles) and the vapour reactive rectifying profile (empty circles)
are represented on figure 12 for reboil ratio values above and below its minimum value. The preset residue
liquid composition is also displayed on figure 12.
At the minimum reboil ratio of about 5.573 an infinite number of stages is required to perform the
separation. Above this value, the profiles intersect and the process is feasible. Hereafter, an effective reboil
ratio of s=8 is considered.

19
I2
H2O
H2 I2
H2O
H2
Reactive rectifying profile
Reactive stripping profiles=5.572, r= 3.454
s< smin
s=5.573, r= 3.455
s> smin
LIQUID
RESIDUE
VAPOUR
DISTILLATE
VAPOUR FROM
THE REBOILER
VAPOUR
DISTILLATE
VAPOUR FROM
THE REBOILER
LIQUID
RESIDUE
Figure 12. Vapour reactive profile in the reactive distillation column of a ternary HI-I2-H2O mixture for s<smin and s>smin
The corresponding calculated reflux ratio is r=5.39 and the reactive rectifying and reactive stripping
profiles are represented in the diagram on figure 13. The resulting configuration consists of 9 reactive
rectifying stages (including the condenser) and 2 reactive stripping stages (including the boiler), with a feed
at stage 10 (counted downwards).
I2
H2O
H2
LIQUID
RESIDUE
VAPOUR
DISTILLATE
s=8, r= 5.39Reactive rectifying profile
Reactive stripping profile
VAPOUR FROM
THE REBOILER
Figure 13. Vapour reactive profiles in the reactive distillation column of a ternary HI-I2-H2O mixture for s=8 and r=5.39
The resulting vapour composition profiles are presented on figure 14. Despite the high HI dissociation
yield specified (99.6% molar), the hydrogen content remains low because of the low HI content in the

20
feed (10% molar). Besides, because of the high volatility of water versus iodine, the water content in the
vapour phase showed in figure 14 remains very high.
HI
H2
I2
H2O
HI
H2
I2
H2O
HI
H2
I2
H2O
HI
H2
I2
H2O
HI
H2
I2
H2O
HI
H2
I2
H2O
HI
H2
I2
H2O
HI
H2
I2
H2O
Design Synthesis
0.0
0.1
0.2
0.3
0.4
0.5
0.6
0.7
0.8
0.9
1.0
0 1 2 3 4 5 6 7 8 9 10 11
Plate ( downwards)
vapo
r m
olar
frac
tion
Figure 14. Comparison of the reactive profiles from the synthesis and design steps in the reactive distillation column of a ternary HI-I2-H2O mixture
A zoom on the composition displayed in figure 14 is shown in figure 15 to be able to analyze the HI, I2
and H2 vapour composition profile in the column. This figure shows that hydrogen production is obtained
only for very low iodine content in the rectifying section because, in this condition, the reaction
equilibrium is shifted towards the production of hydrogen, according to Le Chatelier’s law. HI
decomposition mostly occurs in the upper rectifying part of the column that lead to the recovery of
hydrogen. In the stripping section, almost pure iodine is recovered at the bottom in the liquid residue.

21
0.00
0.02
0.04
0.06
0.08
0.10
0.12
0.14
0.16
0 1 2 3 4 5 6 7 8 9 10 11
Plate ( downwards)
vapo
r mol
ar fr
actio
nReactive rectifying Reactive stripping
Feed
HI
H2
I2
Figure 7: Zoom on the vapour composition profile in the column
Figure 15. Zoom on the vapour composition profile in the reactive distillation column of a ternary HI-I2-
H2O mixture
4.4. Design step
The previous step leads to a column configuration and a reboil ratio that permits to reach the initial
specifications. But these results have been obtained neglecting all thermal phenomena (heat of reaction,
difference between components vaporisation enthalpy). Based on ProSimPlus simulations [25], the design
step recalculates the operating parameters without modifying the column configuration but taking into
account heat balances.
In order to saturate the two degrees of freedom, the partial molar flow rate of H2 in the distillate is set
equal to 4.98 mol/s (for a molar feed flow of 100 mol/s) corresponding to the HI molar dissociation yield
of 99.6% and a molar purity of I2 in the bottom equal to 99% molar.
The resulting reflux ratio considering a heat effect is equal to 5.00 and is close to the reflux ratio obtained
through the synthesis step of 5.39. That means that the assumptions formulated in the synthesis step are
validated. Indeed, the thermal effects of the studied system are not so important ( low endothermic heat of
reaction and low difference between components vaporisation enthalpy).
Figure 14 compares the vapour profiles obtained through the synthesis and the design step. Both profiles
are very similar. The temperature profile along the column is showed on figure 16. The temperature

22
increase observed in the lower part of the column can be related to the increase in the heavy boiling
compound iodine content. In the upper part of the column, the temperature decrease is related to the
increase in the light boiling compound hydrogen content.
Figure 17 presents the vapour and liquid composition profile in the column in the reactive composition
space. It shows that both liquid and vapour profile belong to the vapour-liquid region with a turning in the
vicinity of the equivalent reactive azeotrope behaving as an attraction point as mentioned above.
450
480
510
540
570
600
630
1 2 3 4 5 6 7 8 9 10 11Plate (downwards)
Tem
pera
ture
(°K
)
Figure 16. Temperature profile in the reactive distillation column of a ternary HI-I2-H2O mixture
I2(642.32K) H
2( 35.19 K)
H2O (490.50 K)
Vapour profile
Liquid profile
LIQUID
BOTTOM
VAPOUR
DISTILLATE
VAPOUR FROM
THE REBOILER
LIQUID FROM
THE CONDENSER
Figure 17. Vapour and liquid composition profile in the reactive composition space for the reactive distillation of a ternary HI-I2-H2O mixture
23
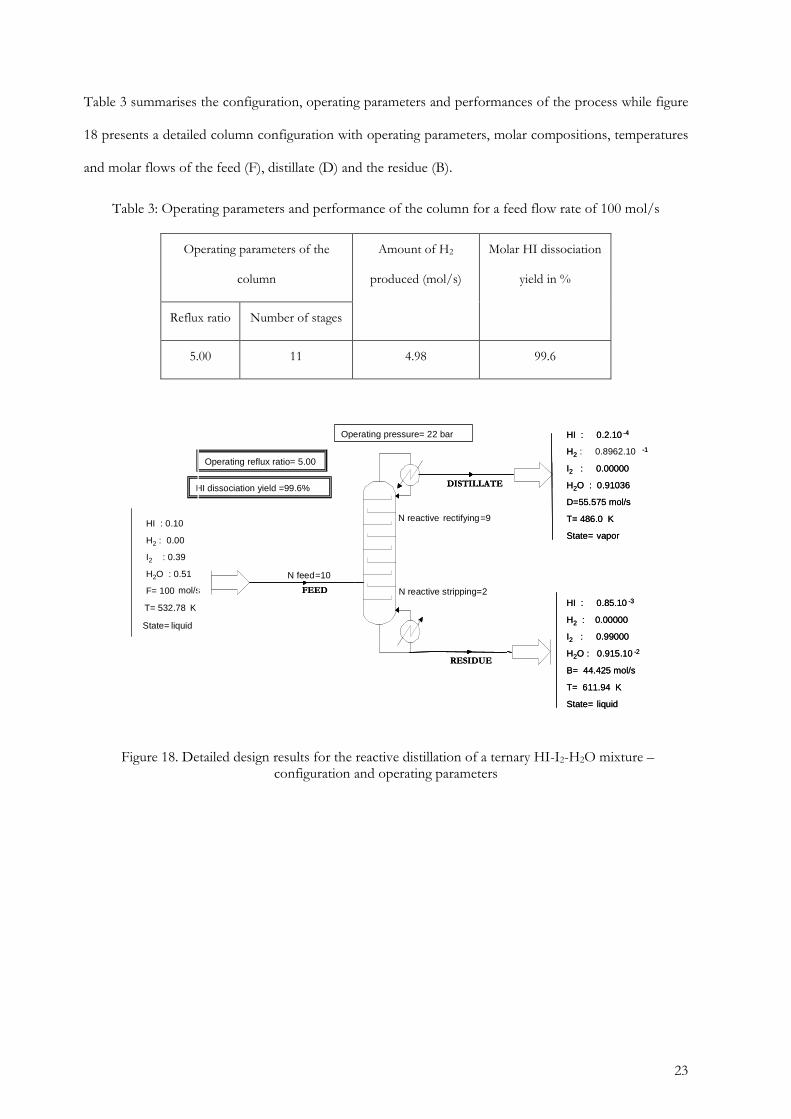
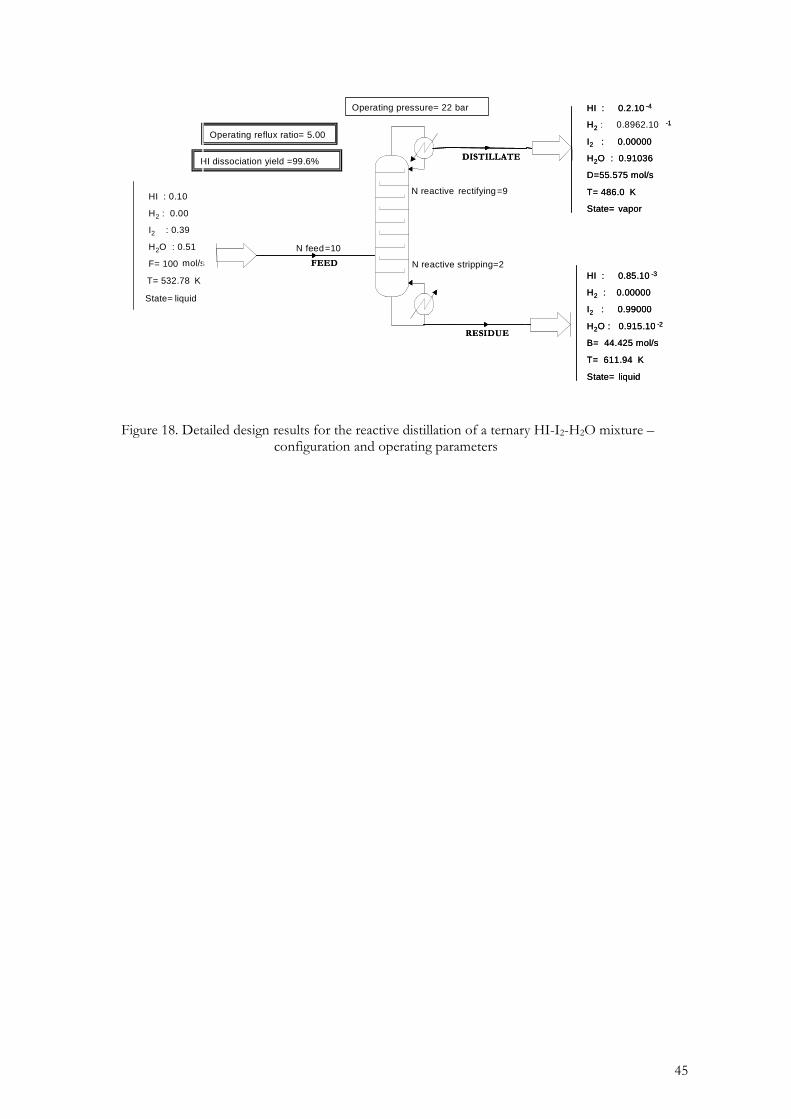
Table 3 summarises the configuration, operating parameters and performances of the process while figure
18 presents a detailed column configuration with operating parameters, molar compositions, temperatures
and molar flows of the feed (F), distillate (D) and the residue (B).
Table 3: Operating parameters and performance of the column for a feed flow rate of 100 mol/s
Operating parameters of the
column
Reflux ratio Number of stages
Amount of H2
produced (mol/s)
Molar HI dissociation
yield in %
5.00 11 4.98 99.6
N reactive stripping=2
N reactive rectifying=9
N feed=10
HI dissociation yield =99.6%
Operating reflux ratio= 5.00
Operating pressure= 22 bar
HI : 0.10
H2 : 0.00
I2 : 0.39
H2O : 0.51
F= 100 mol/s
T= 532.78 K
State= liquid
FEED
RESIDUE
DISTILLATE
FEED
RESIDUE
DISTILLATE
HI : 0.2.10 --44
H2 : 0.8962.10 -1
I2 : 0.00000
H2O : 0.91036
D=55.575 mol/s
T= 486.0 K
State= vapor
HI : 0.2.10 --44
H2-1
I2 : 0.00000
H2O : 0.91036
D=55.575 mol/s
T= 486.0 K
State= vapor
HI : 0.85.10 -3
H2 : 0.00000
I2 : 0.99000
H2O : 0.915.10 -2
B= 44.425 mol/s
T= 611.94 K
State= liquid
HI : 0.85.10 -3
H2 : 0.00000
I2 : 0.99000
H2O : 0.915.10 -2
B= 44.425 mol/s
T= 611.94 K
State= liquid
Figure 18. Detailed design results for the reactive distillation of a ternary HI-I2-H2O mixture –
configuration and operating parameters

24
CONCLUSIONS AND OUTLOOKS
An extended global design approach for the feasibility, synthesis and design of reactive distillation
columns involving vapour phase chemical reactions is applied to the vapour phase decomposition of HI to
produce H2. From minimal information concerning the physicochemical properties of the system, three
successive steps lead to the design of the unit and the specification of its operating conditions: the
feasibility analysis based on the analysis of reactive condensation curve map method (rCCM), the synthesis
step based on the boundary value design method (BVD) and the design step based on rigorous
simulations. Thanks to the application of the design approach, better performances in term of HI
conversion rate are found than those of the initial reactive distillation column proposed by Roth and
Knoche [24].
A feasible reactive distillation column configuration is proposed, for a residue consisting in pure iodine,
under a pressure of 22 bars and for a fixed feed composition coming from the Bunsen reaction. This
configuration can not be considered as an optimal design and can be used as a good initialization point for
an MINLP optimization procedure. The influence of the pressure and the feed composition on the
configuration and operating parameters of the reactive distillation column are planned to be studied.
It would be interesting to integrate the column configuration with side stream in the design methodology,
in order to explore the possible improvement of the column configuration where H2O is recovered in the
side stream, H2 at the top of the column and I2 at the bottom.
Performance increase with potential modification of the original process of the HI concentration and
decomposition section is expected.
REFERENCES
[1] Norman, J.H., G.E.Besenbruch and D.R. O’Keefe, Thermochemical water- Splitting Cycle for
hydrogen production, GRI-A 16713 (1981)
[2] D. O'Keefe, C. Allen, G. Besenbruch, L. Brown, J. Norman, R. Sharp and K. McCorckle, Preliminary
results from bench scale testing of a sulfur iodine thermochemical water splitting cycle, Int. J. of Hydrogen
Energy, 7 (1982) 381-392.

25
[3] G. Arifal, J. Hwang and K. Onuki, Electro-electrodialysis of hydroiodique acid using the cation
exchange membrane cross-linked by accelerated electron radiation. Journal of membrane science, 201
(2002) 39-44.
[4] K. Onuki, G. Hwang, G. Arifal and S. Shimizu, Electro-electrodialysis of hydroiodic acid in the
presence of iodine at elevated temperature, Journal of membrane science, 192 (2001) 193-199.
[5] G. Hwang and K. Onuki, Simulation study on the catalytic decomposition of hydrogen iodide in the
membrane reactor with a silica membrane for the thermochemical water-splitting IS process, Journal of
membrane science, 194 (2001) 207-215.
[6] M. Roth and K.F. Knoche, Thermochemical water splitting through direct HI decomposition from
H2O-HI-I2 solutions, Int. J. Hydrogen Energy, 14(8) (1989) 545-549.
[7] R. Thery, X.M. Meyer, X. Joulia and M. Meyer, Preliminary Design of reactive distillation columns,
Chem. Eng. Res. Des., 83(A4) (2005) 379-400.
[8] F.C. Kracek, Solubilities in the system water-iodine to 200°C, J. Phys. Chem., 35 (1931) 417
[9] G. Wuster, Dissertation, RWTH- Aachen, 1979.
[10] C. Vanderzee, L. Gier, The enthalpy of solution of gaseous hydrogen iodide in water, and the relative
apparent molar enthalpies of hydroiodic acid, J. Chem. Thermodyn., 6 (1974) 441-452
[11] H. Engels and K. F. Knoche, Vapour pressures of the system H2O-HI-I2 system and H2, Int. J. of
Hydrogen Energy, 11 (1986) 703-707.
[12] P.M Mathias, Applied thermodynamics in chemical technology: current practice and future challenges,
Fluid Phase Equilibria, 228-229 (2005) 49-57.
[13] C. Berndahauser and K.F. Knoche, Experimental investigations of thermal HI decomposition from
H2O- HI-I2 solutions, Int. J. Hydrogen Energy, 19(3) (1989) 239-244
[14] D. O’Keefe, J. H. Norman, D. G. Williamson., Catalysis research in thermochemical water-splitting
processes, Catal. Rev. Sci. Eng., 22(3) (1980) 325-369.
[15] Neumann, Diplomaufgabe, RWTH Aachen, 28-01-1987.
[16] C.P.Almeida-Rivera., P.L.J. Swinkels., Grievink J., Designing reactive distillation processes: present
and future, Comp. Chem. Eng., 28 (2004) 1997-2020.
[17] R. Thery, X.M. Meyer and X. Joulia, Analyse de faisabilité, Synthèse et Conception de procédés de
distillation réactive: état de l’art et analyse critique, Can. Jour. Chem. Eng., 83 (2005) 242-266.
26
[18] B.Belaissaoui, Extension of a reactive distillation process design methodology: application to the
hydrogen production through the iodine-sulfure thermochemical cycle, thèse de l’Institut National
Polytechnique de Toulouse, 2006INPT003G, 2006.
[19] D. Barbosa and M.F. Doherty, The simple distillation of homogeneous reactive mixtures, Chem. Eng.
Sci., 43(3) (1987a) 541-550.
[20] V.N. Kiva, E.K. Hilmen and S. Skogestad, Azeotropic phase equilibrium diagrams: a survey. Chem.
Eng. Sci., 58 (2003) 1903-1953.
[21] Yu.A.Pisarenko, L.A.Serafimov, C.A.Cardona, D.L.Efremov and A.S.Shuwalov, Reactive distillation
design: analysis of the process statics Reviews in chemical enginnering, 17(4) (2001) 253-327.
[22] D. Barbosa, M.F. Doherty, Design and minimum reflux calculations for single-feed multicomponent
reactive distillation columns, Chem. Eng. Sci., 43(7) (1987b) 1523-1537.
[23] D. Barbosa, M.F. Doherty, Design and minimum reflux calculations for double-feed multicomponent
reactive distillation columns, Chem. Eng. Sci., 43(9) (1987c) 2377-2389.
[24] D. Barbosa and M.F. Doherty, A new set of composition variables for the representation of reactive
phase diagrams, Proc. R. Soc. Lond., A413 (1987d) 459-464.
[25] http://www.prosim.net
[26] Ung S.,Doherty M.F., Synthesis of reactive distillation systems with multiple equilibrium chemical
reactions, Ind. Eng.Chem. Res, 34, (1995) 2555-2565

27
FIGURES CAPTION
Figure 1. The principle of the thermochemical water decomposition cycle for hydrogen production
Figure 2. Concept of the Sulfur / Iodine thermochemical cycle for the production of hydrogen
Figure 3: Integration of a reactive distillation in the Sulfur / Iodine thermochemical cycle for the
production of hydrogen
Figure 4. Description of the complex phase behaviour of the HI-H2-I2-H2O system
Figure 5. Diagram P-x-y of HI-H2O. Comparison of the Neumann’s thermodynamic model calculation to
experimental data of Engels and Knoche (1986)
Figure 6. Methodology for the design of vapour phase reactive distillation processes.
Figure 7. Non reactive condensation curve map of the ternary HI-I2-H2O system under 22 bars
Figure 9. Reactive condensation curve map (rCCM) of the HI-H2-I2-H2O system under 22 bars.
Figure 10. 2IX -
2IY diagram of the HI-H2-I2-H2O system under 22 bars
Figure 11. Neumann’s thermodynamic model validity region of the quaternary HI-H2-I2-H2O system
under 22 bars
Figure 12. Vapour reactive profile in the reactive distillation column of a ternary HI-I2-H2O mixture for
s<smin and s>smin
Figure 13. Vapour reactive profiles in the reactive distillation column of a ternary HI-I2-H2O mixture for
s=8 and r=5.39
Figure 14. Comparison of the reactive profiles from the synthesis and design steps in the reactive
distillation column of a ternary HI-I2-H2O mixture
Figure 15. Zoom on the vapour composition profile in the reactive distillation column of a ternary HI-I2-
H2O mixture
Figure 16. Temperature profile in the reactive distillation column of a ternary HI-I2-H2O mixture
Figure 17. Vapour and liquid composition profile in the reactive composition space for the reactive
distillation of a ternary HI-I2-H2O mixture
Figure 18. Detailed design results for the reactive distillation of a ternary HI-I2-H2O mixture –
configuration and operating parameters

28
H2O
H2 ½ O2
Water
Hydrogen Oxygen
2HI + H2SO4
I2 + 2 H2O + SO2
H2SO4 ½ O2
SO2+ 2 H2O
H2 + 2 HI I2
Recycling
SO2 ,H2O
Recycling
I2
Heat source
Figure 1. The principle of the thermochemical water decomposition cycle for hydrogen production

29
0
500
70000
90000
1100
1300
H2SO4 ���� H2O + SO2 + ½ O2
O2
2 HI ⇔⇔⇔⇔ H2+ I2
I2
H2H2
Heat
Bunsen reactionSECTION I
Bunsen reactionSECTION I
Tem
pera
ture
(K
)
H2O
Heat
Heat
SECTION III
HI decomposition
SECTION III
HI decompositionHI decompositionPhase separation
H2O
SO2
HI phase
H2SO4 Phase
HI Phase distillation
Evaporation
H2SO4
I2
H2O
9I2+SO2+16H2O ����
(2HI+10H2O+8I2) + (H2SO4+4H2O)
HI Phase H2SO4 Phase
H2SO4
decomposition
SECTION II
H2SO4
decomposition
SECTION II
Vapour phase reaction
I2H2O,
HI
H2SO4 H2O
H2O
Figure 2. Concept of the Sulfur / Iodine thermochemical cycle for the production of hydrogen

30
HI concentration + HI decomposition
I2, H2O
I2
To the Bunsen reaction
HI, H2
I2 , H2O
AzotropeHI (13%) – H2O
HI (10%)H2O (51%)I2 (39%)
HI (10%)H2O (51%)I2 (39%)
reactive distillation(Roth and Knoche, 1989)
, H2OI2
H2 , H2O
(HI)
I2 , H2O
HI (10%)H2O (51%)I2 (39%)
To the Bunsen reaction
, H2OI2
H2 , H2O
(HI)
I2 , H2O
HI (10%)H2O (51%)I2 (39%)
HI (10%)H2O (51%)I2 (39%)
To the Bunsen reaction
Reaction
Separation
HI
Equilibrium reaction
2 HI ⇔⇔⇔⇔ H2+I
2
Equilibrium reaction
2 HI ⇔⇔⇔⇔ H 2 +I 2
Section III
Figure 3: Integration of a reactive distillation in the Sulfur / Iodine thermochemical cycle for the production of hydrogen

31
H2O
Vapor phase
HI
I2
H2
HI
I2
H2O
Liquid phase
2 HI � H2 + I2Complexe formation
5 H2O + HI ↔ (5H2O, H+) + I-
Electrolytic system
Formation of polyiodides ions (I3-, I2H+,..)
I2 + I- ↔ I3-
I2 + H+↔I2H+
Equilibrium limited reaction
Azeotropic mixture
Highly immiscible LLE system
Figure 4. Description of the complex phase behaviour of the HI-H2-I2-H2O system

32
0
10
20
30
40
50
60
70
80
0 0.2 0.4 0.6 0.8 1
Molar fraction HI
Pre
ssur
e (b
ars)
450K
500K
550K
Points are data of Engels and Knoche (1986) Solid lines are model calculation
Figure 5. Diagram P-x-y of HI-H2O. Comparison of the Neumann’s thermodynamic model calculation to experimental data of Engels and Knoche (1986)
33
FEASIBILITYANALYSISFEASIBILITYANALYSIS
SYNTHESIS
DESIGN
INCREASIN
G PR
ECISIO
N
INCREASIN
G SIM
PLICIT
Y
Reactive azeotropes
Distillation boundary
Pure or hybridcolumn
Reactive
Distillation
Pure or hybridcolumn
Reactive azeotropes
Distillation boundary
Pure or hybridcolumn
Reactive
Distillation
Pure or hybridcolumn
Attainable yield
Reachable composition
Configuration type
Attainable
Reachable
Configuration type
Attainable yield
Reachable composition
Configuration type
Attainable
Reachable
Configuration type
Process Parameters:
Reactive zone,feed trayReflux, stage number, Process Parameters:
Reactive zone,feed trayReflux, stage number,
Reactive condensationcurve map analysis
Thermodynamic dataChemical and phase equilibria
Static analysis (hybrid column)
Boundary value design method
Simulation
Problem formulation
Structural and Operating parameters
Operating Parameters:Operating Reflux, heat dutyOperating Parameters:Operating Operating Parameters:Operating Reflux, heat duty
Figure 6. Methodology for the design of vapour phase reactive distillation processes.

34
I2 (642.32K) HI ( 344.23K)
H2O (490.50K)
Binary azeotrope HI-H2O (518.28K)
Non reactive boudarydistillation
Figure 7. Non reactive condensation curve map of the ternary HI-I2-H2O system under 22 bars

35
350
450
550
650
0 0.02 0.04 0.06 0.08 0.1 0.12 0.14 0.16 0.18 0.2 0.22
Molar fraction HI
Bub
ble
tem
pera
ture
(K
)
90% I2
60% I270% I2
80% I2
50% I240% I2
20% I230% I210% I2
0% I2
HI-H2O azeotrope
Pure Iodine
Figure 8. Influence of I2 concentration on the maximum bubble temperature of the non reactive ternary system HI-I2-H2O

36
H2 (35.19 K)
H2O (490.50 K)
I2 (642.32 K)
The reactive equivalent azeotropeHI-H2O (518.81 K)
HI
Figure 9. Reactive condensation curve map (rCCM) of the HI-H2-I2-H2O system under 22 bars.

37
0
0.1
0.2
0.3
0.4
0.5
0.6
0.7
0.8
0.9
1
0 0.1 0.2 0.3 0.4 0.5 0.6 0.7 0.8 0.9 1
Liquid reactive composition XI2
vapo
r re
activ
e co
mpo
sitio
n Y
I2
Liquid reactive composition XI2
Vap
our
reac
tive
com
posi
tion
YI 2
Figure 10. 2IX -
2IY diagram of the HI-H2-I2-H2O system under 22 bars

38
Miscibility zone
(Inside the delineated liquidreactive composition region)
Reliable thermodynamic model
I2 (642.32 K)
Vapordistillate
Liquid fromthe condenser
Feed(liquid)
Residue(liquid)
H2(35.19 K)
H2O (490.50 K)
The reactive equivalentazeotrope HI-H2O (518.81 K)
Figure 11. Neumann’s thermodynamic model validity region of the quaternary HI-H2-I2-H2O system
under 22 bars

39
I2
H2O
H2 I2
H2O
H2
Reactive rectifying profile
Reactive stripping profiles=5.572, r= 3.454
s< smin
s=5.573, r= 3.455
s> smin
LIQUID
RESIDUE
VAPOUR
DISTILLATE
VAPOUR FROM
THE REBOILER
VAPOUR
DISTILLATE
VAPOUR FROM
THE REBOILER
LIQUID
RESIDUE
Figure 12. Vapour reactive profile in the reactive distillation column of a ternary HI-I2-H2O mixture for s<smin and s>smin

40
I2
H2O
H2
LIQUID
RESIDUE
VAPOUR
DISTILLATE
s=8, r= 5.39Reactive rectifying profile
Reactive stripping profile
VAPOUR FROM
THE REBOILER
Figure 13. Vapour reactive profiles in the reactive distillation column of a ternary HI-I2-H2O mixture for s=8 and r=5.39

41
HI
H2
I2
H2O
HI
H2
I2
H2O
HI
H2
I2
H2O
HI
H2
I2
H2O
HI
H2
I2
H2O
HI
H2
I2
H2O
HI
H2
I2
H2O
HI
H2
I2
H2O
Design Synthesis
0.0
0.1
0.2
0.3
0.4
0.5
0.6
0.7
0.8
0.9
1.0
0 1 2 3 4 5 6 7 8 9 10 11
Plate ( downwards)
vapo
r m
olar
frac
tion
Figure 14. Comparison of the reactive profiles from the synthesis and design steps in the reactive distillation column of a ternary HI-I2-H2O mixture

42
0.00
0.02
0.04
0.06
0.08
0.10
0.12
0.14
0.16
0 1 2 3 4 5 6 7 8 9 10 11
Plate ( downwards)
vapo
r mol
ar fr
actio
nReactive rectifying Reactive stripping
Feed
HI
H2
I2
Figure 7: Zoom on the vapour composition profile in the column
Figure 15. Zoom on the vapour composition profile in the reactive distillation column of a ternary HI-I2-
H2O mixture

43
450
480
510
540
570
600
630
1 2 3 4 5 6 7 8 9 10 11Plate (downwards)
Tem
pera
ture
(°K
)
Figure 16. Temperature profile in the reactive distillation column of a ternary HI-I2-H2O mixture

44
I2(642.32K) H
2( 35.19 K)
H2O (490.50 K)
Vapour profile
Liquid profile
LIQUID
BOTTOM
VAPOUR
DISTILLATE
VAPOUR FROM
THE REBOILER
LIQUID FROM
THE CONDENSER
Figure 17. Vapour and liquid composition profile in the reactive composition space for the reactive distillation of a ternary HI-I2-H2O mixture
45
N reactive stripping=2
N reactive rectifying=9
N feed=10
HI dissociation yield =99.6%
Operating reflux ratio= 5.00
Operating pressure= 22 bar
HI : 0.10
H2 : 0.00
I2 : 0.39
H2O : 0.51
F= 100 mol/s
T= 532.78 K
State= liquid
FEED
RESIDUE
DISTILLATE
FEED
RESIDUE
DISTILLATE
HI : 0.2.10 --44
H2 : 0.8962.10 -1
I2 : 0.00000
H2O : 0.91036
D=55.575 mol/s
T= 486.0 K
State= vapor
HI : 0.2.10 --44
H2-1
I2 : 0.00000
H2O : 0.91036
D=55.575 mol/s
T= 486.0 K
State= vapor
HI : 0.85.10 -3
H2 : 0.00000
I2 : 0.99000
H2O : 0.915.10 -2
B= 44.425 mol/s
T= 611.94 K
State= liquid
HI : 0.85.10 -3
H2 : 0.00000
I2 : 0.99000
H2O : 0.915.10 -2
B= 44.425 mol/s
T= 611.94 K
State= liquid
Figure 18. Detailed design results for the reactive distillation of a ternary HI-I2-H2O mixture –
configuration and operating parameters

46
TABLES CAPTION
Table 1. Vapor physical composition of the reactive pseudo-azeotrope compared to the binary azeotrope (P=22bars)
Table 2: Production of hydrogen- P=22 bars-set of attainable products-input data for the synthesis step
Table 3: Operating parameters and performance of the column for a feed flow rate of 100 mol/s
Table 1. Approximated vapor physical composition of the equivalent reactive azeotrope compared to the
binary azeotrope (P=22bars)
Table 2: Production of hydrogen- P=22 bars-set of attainable products
- input data for the synthesis step
Molar compositions
Liquid feed Vapour distillate Liquid residue
HI 0.10 0.2 10-4 0.85 10-3
H2 0.00 0.8962 10-1 0.00000
I2 0.39 0.00000 0.99000
H2O 0.51 0.91036 0.915 10-2
Table 3: Operating parameters and performance of the column for a feed flow rate of 100 mol/s
Operating parameters of the
column
Reflux ratio Number of stages
Amount of H2
produced (mol/s)
Molar HI dissociation
yield in %
5.00 11 4.98 99.6
HI H2 I2 H2O
Equivalent reactive azeotrope 0.1170 0.0080 0.0080 0.8670
Binary azeotrope 0.1330 0.0000 0.0000 0.8670
Copyright © 2022 FDOKUMEN

