


Bahasa
Halaman
Hukum


�����������������
Citation: Cherewyk, J.; Grusie-Ogilvie,
T.; Blakley, B.; Al-Dissi, A. Validation
of a New Sensitive Method for the
Detection and Quantification of R
and S-Epimers of Ergot Alkaloids in
Canadian Spring Wheat Utilizing
Deuterated Lysergic Acid Diethylamide
as an Internal Standard. Toxins 2022,
14, 22. https://doi.org/10.3390/
toxins14010022
Received: 17 November 2021
Accepted: 29 December 2021
Published: 31 December 2021
Publisher’s Note: MDPI stays neutral
with regard to jurisdictional claims in
published maps and institutional affil-
iations.
Copyright: © 2021 by the authors.
Licensee MDPI, Basel, Switzerland.
This article is an open access article
distributed under the terms and
conditions of the Creative Commons
Attribution (CC BY) license (https://
creativecommons.org/licenses/by/
4.0/).
toxins
Article
Validation of a New Sensitive Method for the Detection andQuantification of R and S-Epimers of Ergot Alkaloids inCanadian Spring Wheat Utilizing Deuterated Lysergic AcidDiethylamide as an Internal StandardJensen Cherewyk 1,* , Taylor Grusie-Ogilvie 2, Barry Blakley 1 and Ahmad Al-Dissi 3
1 Department of Veterinary Biomedical Sciences, Western College of Veterinary Medicine, University ofSaskatchewan, Saskatoon, SK S7N 5B4, Canada; [email protected]
2 Prairie Diagnostic Services (PDS), Saskatoon, SK S7N 5B4, Canada; [email protected] Department of Veterinary Pathology, Western College of Veterinary Medicine, University of Saskatchewan,
Saskatoon, SK S7N 5B4, Canada; [email protected]* Correspondence: [email protected]
Abstract: Ergot sclerotia effect cereal crops intended for consumption. Ergot alkaloids within ergotsclerotia are assessed to ensure contamination is below safety standards established for human andanimal health. Ergot alkaloids exist in two configurations, the R and S-epimers. It is important toquantify both configurations. The objective of this study was to validate a new ultra-high performanceliquid chromatography tandem mass spectrometry (UHPLC-MS/MS) method for quantification ofsix R and six S-epimers of ergot alkaloids in hard red spring wheat utilizing deuterated lysergic aciddiethylamide (LSD-D3) as an internal standard. Validation parameters such as linearity, limit of de-tection (LOD), limit of quantification (LOQ), matrix effects, recovery and precision were investigated.For the 12 epimers analyzed, low LOD and LOQ values were observed, allowing for the sensitivedetection of ergot epimers. Matrix effects ranged between 101–113% in a representative wheat matrix.Recovery was 68.3–119.1% with an inter-day precision of <24% relative standard deviation (RSD).The validation parameters conform with previous studies and exhibit differences between the R andS-epimers which has been rarely documented. This new sensitive method allows for the use of a newinternal standard and can be incorporated and applied to research or diagnostic laboratories.
Keywords: Claviceps purpurea; liquid chromatography; mass spectrometry
Key Contribution: A new sensitive method for the detection and quantification of the R and S-epimers of ergot alkaloids utilizing deuterated lysergic acid diethylamide (LSD-D3) as an internalstandard. Validation differences between R and S-epimers are highlighted.
1. Introduction
Mycotoxins continue to be a concern for the safety and quality of food and feed [1,2].Specifically, the fungus Claviceps purpurea infects cereal crops forming visibly dark sclerotiathat contain secondary metabolites known as ergot alkaloids [3]. Ergot alkaloids have twoconfigurations known as the R-epimer and S-epimer. Rotation of a functional group on thechemical structure at the carbon-8 defines the epimer. The R-epimer exhibits a left-handrotation, whereas the S-epimer exhibits a right-hand rotation [4–6]. Of the ergot alkaloidsproduced by Claviceps purpurea, six R and six corresponding S epimers are quantified infood and feed samples [7]. The six R-epimers are, ergocornine, ergocristine, ergocryptine,ergometrine, ergosine and ergotamine [8]. The corresponding S-epimers are ergocorninine,ergocristinine, ergocryptinine, ergometrinine, ergosinine and ergotaminine. Ergot epimershave different concentrations within the sclerotia depending on the geographic locationand crop type [9].
Toxins 2022, 14, 22. https://doi.org/10.3390/toxins14010022 https://www.mdpi.com/journal/toxins
Toxins 2022, 14, 22 2 of 14
In North America, diagnostic laboratories routinely include R-epimers in their ana-lytical methods for ergot alkaloid detection and quantification. However, the S-epimersare often not included in diagnostic assays or analytical studies [10–12]. The S-epimershave been considered non [13] or less [14] bioactive compared to the corresponding R-epimers. The R-epimers are known to cause adverse effects when consumed by humansand animals [15]. Similarly, the S-epimers may also affect physiological systems [16,17]. Itis, therefore, important to quantifying S-epimers in ergot-contaminated samples.
Ergot alkaloids can epimerize between the R and S-epimer [18]. Komarova andTolkachev (2001) noted that the rate of conversion may be associated with the side groupof a particular epimer. The conversion, also known as epimerization, between R andS-epimers, has also been associated with pH, light, matrix, and temperature [19–22]. IfS-epimers constitute a large portion of the total concentration of ergot epimers [3], it isimperative to include them in an analysis for regulatory or diagnostic considerations.
Multiple instruments and techniques have been used to quantify ergot alkaloids.The use of an ultra-high performance liquid chromatography tandem mass spectrometry(UHPLC-MS/MS) method has been used to quantify mycotoxins [23,24]. The UHPLC-MS/MS technique can quantify both R and S-epimers of ergot alkaloids and have becomethe method of choice for detection [25]. Additionally, methods such as high-performancethin-layer chromatography (HPTLC) [26], and liquid chromatography with fluorescencedetection [27] have been recently utilized for the detection of the R and S-epimers of ergotalkaloids. Conversely, the use of an enzyme linked immunosorbent assay (ELISA) cannotdistinguish differences among epimers [28]. The European Union recommends that bothR and S-epimers of ergot alkaloids should be quantified [29]. In contrast, the CanadianFood Inspection Agency (CFIA) currently only considers the R-epimers in their safetystandards [30].
Internal standards are regularly utilized in analytical quantification. Structural ana-logues, isotopic labeled, and deuterated compounds have been used as internal stan-dards [20]. Isotopically label internal standards are ideal since they behave in a similarmanner to the analytes of interest. However, such labeled internal standards are limitedfor all ergot epimers. Usually, one or two internal standards are used to account for lossesduring extraction and analysis of ergot epimers [3,27,31]. Internal standards that can suc-cessfully behave in a similar way to the analytes of interest and account for any losses ofthe analytes throughout extraction and analysis, are beneficial in analytical methods.
The simultaneous detection and quantification ergot R and S-epimers are beneficial interms of time and ease of interpretation. Only low concentrations of ergot epimers in feedare accepted according to regulatory standards. Therefore, a sensitive and timely methodfor epimer quantification is required. Assessing similarities and differences between the Rand S-epimers in terms of validation may provide useful information for future analyticalmethods. The objective of this study was to validate a new method for the simultaneousdetection and quantification of R and S-epimers of ergot alkaloids utilizing deuteratedlysergic acid diethylamide (LSD-D3) as a new internal standard. Deuterated lysergic aciddiethylamide has not been utilized previously to quantify ergot epimers, to the authorsknowledge. A second objective was to use the validated method to quantify R and S-epimers of ergot alkaloids in naturally contaminated hard red spring wheat samples.
2. Results2.1. Method Validation
The calibration curves obtain from this method had a r2 > 0.99 (Table 1). The limit of de-tection (LOD) and limit of quantification (LOQ) were calculated according to the GuidanceDocument on the Estimation of LOD and LOQ for Measurements in the Field of Contami-nants in Feed and Food [32]. The instrumental LOD ranged from 0.00893–0.225 µg/kg andthe instrumental LOQ ranged from 0.0295–0.744 µg/kg for all 12 ergot epimers (Table 1).The LOD and LOQ, are lower for the S-epimers than the R-epimers with an exceptionfor ergocristine/ergocristinine. The peak area (counts × minutes) for ergocorninine, er-

Toxins 2022, 14, 22 3 of 14
gocristinine, ergometrinine and ergotaminine (S) were greater than their correspondingR-epimers at the same concentration. Matrix effects (ME) for all 12 epimers in wheatranged from 101–113% (Table 2). All S-epimers had lower matrix effects than their respec-tive R-epimers. For recovery, the low concentration spike (0.75 µg/kg) had a recoveryof 78.8–115.3% and the mid concentration spike (5 µg/kg) had a recovery of 68.3–119.1%(Table 2). Recovery was greater for all S-epimers, compared to their R-epimers, exceptfor ergometrine/ergometrinine. Inter-day precision for both spiked concentrations for allepimers was <24% RSD (relative standard deviation) and intra-day precision had a RSDof <14% (Table 2). The usefulness of LSD-D3 as an internal standard to account for epimerlosses are shown in Table 3.
Table 1. Linear equation of calibration curve, instrumental limit of detection and instrumental limitof quantification for the analysis of ergot epimers.
Epimer Linear Equation a,b r2 c Sy,bd b e Instrumental LOD f
(µg/kg)Instrumental LOQ g
(µg/kg)
Ergometrine (R) y = 2.77x + 0.0642 0.998 0.123 2.86 0.167 0.552Ergometrinine (S) y = 17.7x − 0.997 0.999 0.0379 16.6 0.00893 0.0295
Ergosinine (S) y = 4.87x − 0.441 0.999 0.0449 4.41 0.0398 0.131Ergosine (R) y = 8.49x − 0.217 0.998 0.0906 8.11 0.0436 0.144
Ergotaminine (S) y = 21.4x − 2.15 0.999 0.0828 5.01 0.0645 0.213Ergotamine (R) y = 6.25x − 0.633 0.999 0.118 5.50 0.0839 0.277
Ergocryptinine (S) y = 5.16x − 0.436 0.998 0.201 10.4 0.0757 0.250Ergocryptine (R) y = 11.3x + 0.303 0.994 0.336 11.6 0.113 0.372Ergocorninine (S) y = 22.3x − 0.753 0.998 0.189 20.8 0.0354 0.117Ergocornine (R) y = 11.0x − 0.593 0.998 0.406 7.02 0.225 0.744
Ergocristinine (S) y = 21.3x − 0.445 0.999 0.257 4.59 0.219 0.721Ergocristine (R) y = 6.92x + 0.267 0.995 0.274 19.5 0.0548 0.181
a y: ratio of peak area of analyte and internal standard, b x: concentration, c r2: coefficient of determination,d Sy,b: Standard deviation of pseudo-blank signals (clean wheat, n = 10), e b: Slope of the calibration curveat concentrations close to expected LOD, f Limit of detection (LOD) = 3.9 × S(y,b)/b, g Limit of quantification(LOQ) = 3.3 × LOD. These results are from a single analytical run using ultra-high performance liquid chromatog-raphy tandem mass spectrometry (UHPLC-MS/MS).
Table 2. Matrix effects, recovery, and inter-day precision of ergot epimers in a hard red spring wheat matrix.
Epimer ME a Recovery b Intra-Day Precision c Inter-Day Percision d
Low Spike(n = 18)
Mid Spike(n = 18)
Low Spike e
(n = 6)Mid Spike f
(n = 6)Low Spike
(n = 18)Mid Spike
(n = 18)
% % % % RSD g % RSD % RSD % RSD
Ergometrine 108 109.7 119.1 3.1 12.7 23.9 22Ergometrinine 103 115.0 118.9 2.5 12.8 18.8 19.5
Ergosinine 101 106.8 99.84 3.0 10.7 10.1 11.3Ergosine 113 98.5 92.7 6.1 10.7 16.9 12.2
Ergotaminine 104 102.3 88.1 2.3 12.2 11.9 8.3Ergotamine 116 87.4 74.9 3.8 7.9 9.9 9.1
Ergocryptinine 100 105.5 95.9 3.8 11.9 8.9 9.3Ergocryptine 108 88.6 83.2 8.2 11.1 12.5 7.9Ergocorninine 103 115.3 114.4 1.9 13.3 15.9 12.4Ergocornine 111 95.3 85.2 3.3 9.3 14.1 9.3
Ergocristinine 106 100.6 87.1 3.1 12.5 5.9 8.0Ergocristine 107 78.8 68.3 13.8 9.14 8.7 8.8
a Matrix effects (ME)(%) = (Slope in spiked extract)/(Slope in pure solvent) × 100, b Recovery: Recovery (%) = (Con-centration measured (µg/kg))/(Concentration spiked (µg/kg)) × 100 (n = 6 samples/concentration/3 days),c Intra-day Precision: % RSD for n = 6 samples on a single day, d Inter-day precision: % RSD for n = 6 sampleson three different days (n = 18), e Low Spike: Clean wheat spiked at a concentration of 0.75 µg/kg, f Mid Spike:Clean wheat spiked at a concentration of 5 µg/kg, g % RSD: Relative Standard Deviation (RSD) = (Standarddeviation/Mean) × 100. Ultra-high performance liquid chromatography tandem mass spectrometry was utilizedfor this analysis.
Toxins 2022, 14, 22 4 of 14
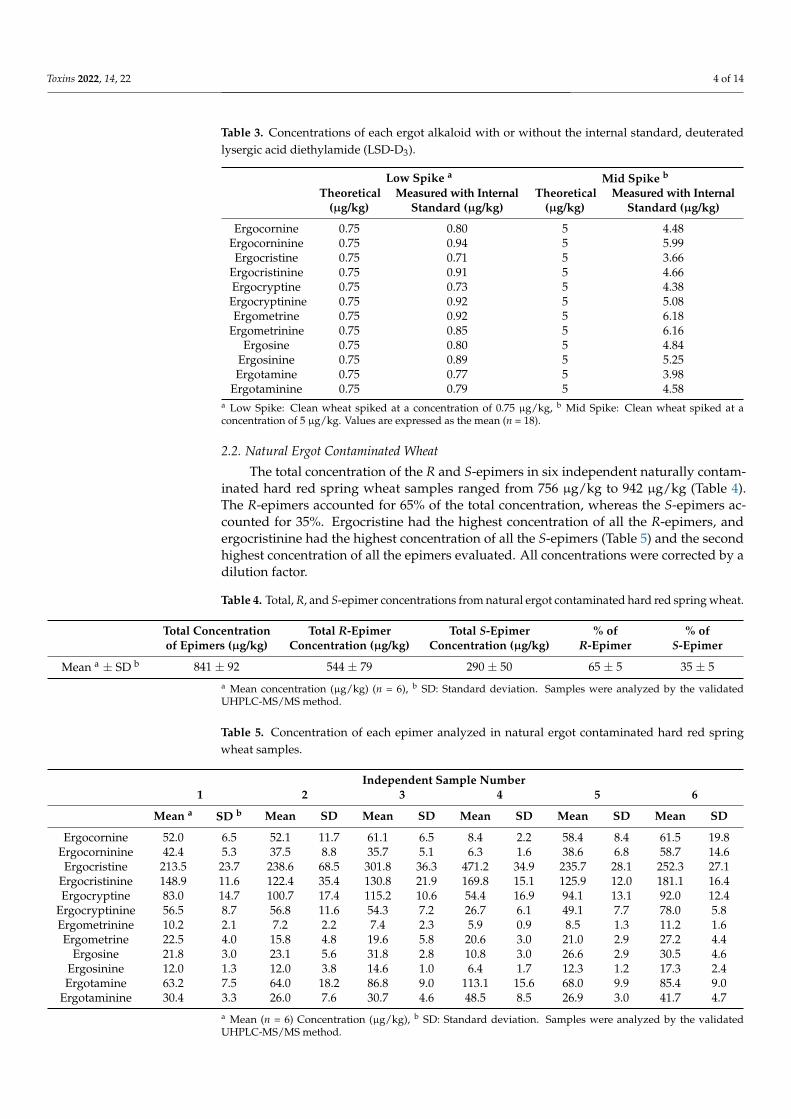
Table 3. Concentrations of each ergot alkaloid with or without the internal standard, deuteratedlysergic acid diethylamide (LSD-D3).
Low Spike a Mid Spike b
Theoretical(µg/kg)
Measured with InternalStandard (µg/kg)
Theoretical(µg/kg)
Measured with InternalStandard (µg/kg)
Ergocornine 0.75 0.80 5 4.48Ergocorninine 0.75 0.94 5 5.99Ergocristine 0.75 0.71 5 3.66
Ergocristinine 0.75 0.91 5 4.66Ergocryptine 0.75 0.73 5 4.38Ergocryptinine 0.75 0.92 5 5.08Ergometrine 0.75 0.92 5 6.18
Ergometrinine 0.75 0.85 5 6.16Ergosine 0.75 0.80 5 4.84
Ergosinine 0.75 0.89 5 5.25Ergotamine 0.75 0.77 5 3.98
Ergotaminine 0.75 0.79 5 4.58a Low Spike: Clean wheat spiked at a concentration of 0.75 µg/kg, b Mid Spike: Clean wheat spiked at aconcentration of 5 µg/kg. Values are expressed as the mean (n = 18).
2.2. Natural Ergot Contaminated Wheat
The total concentration of the R and S-epimers in six independent naturally contam-inated hard red spring wheat samples ranged from 756 µg/kg to 942 µg/kg (Table 4).The R-epimers accounted for 65% of the total concentration, whereas the S-epimers ac-counted for 35%. Ergocristine had the highest concentration of all the R-epimers, andergocristinine had the highest concentration of all the S-epimers (Table 5) and the secondhighest concentration of all the epimers evaluated. All concentrations were corrected by adilution factor.
Table 4. Total, R, and S-epimer concentrations from natural ergot contaminated hard red spring wheat.
Total Concentrationof Epimers (µg/kg)
Total R-EpimerConcentration (µg/kg)
Total S-EpimerConcentration (µg/kg)
% ofR-Epimer
% ofS-Epimer
Mean a ± SD b 841 ± 92 544 ± 79 290 ± 50 65 ± 5 35 ± 5a Mean concentration (µg/kg) (n = 6), b SD: Standard deviation. Samples were analyzed by the validatedUHPLC-MS/MS method.
Table 5. Concentration of each epimer analyzed in natural ergot contaminated hard red springwheat samples.
Independent Sample Number1 2 3 4 5 6
Mean a SD b Mean SD Mean SD Mean SD Mean SD Mean SD
Ergocornine 52.0 6.5 52.1 11.7 61.1 6.5 8.4 2.2 58.4 8.4 61.5 19.8Ergocorninine 42.4 5.3 37.5 8.8 35.7 5.1 6.3 1.6 38.6 6.8 58.7 14.6Ergocristine 213.5 23.7 238.6 68.5 301.8 36.3 471.2 34.9 235.7 28.1 252.3 27.1
Ergocristinine 148.9 11.6 122.4 35.4 130.8 21.9 169.8 15.1 125.9 12.0 181.1 16.4Ergocryptine 83.0 14.7 100.7 17.4 115.2 10.6 54.4 16.9 94.1 13.1 92.0 12.4
Ergocryptinine 56.5 8.7 56.8 11.6 54.3 7.2 26.7 6.1 49.1 7.7 78.0 5.8Ergometrinine 10.2 2.1 7.2 2.2 7.4 2.3 5.9 0.9 8.5 1.3 11.2 1.6Ergometrine 22.5 4.0 15.8 4.8 19.6 5.8 20.6 3.0 21.0 2.9 27.2 4.4
Ergosine 21.8 3.0 23.1 5.6 31.8 2.8 10.8 3.0 26.6 2.9 30.5 4.6Ergosinine 12.0 1.3 12.0 3.8 14.6 1.0 6.4 1.7 12.3 1.2 17.3 2.4Ergotamine 63.2 7.5 64.0 18.2 86.8 9.0 113.1 15.6 68.0 9.9 85.4 9.0
Ergotaminine 30.4 3.3 26.0 7.6 30.7 4.6 48.5 8.5 26.9 3.0 41.7 4.7a Mean (n = 6) Concentration (µg/kg), b SD: Standard deviation. Samples were analyzed by the validatedUHPLC-MS/MS method.
Toxins 2022, 14, 22 5 of 14
3. Discussion
This study describes a new and validated sensitive method for the analysis of Rand S-epimers of ergot alkaloids. The validation of this method followed the validationprocedures outline in the Commission Decision 2002/657/EC [33]. Various parameterswere adapted from the ThermoFisher Scientific method [34], however, improved sensitivityand matrix effects are observed in the present study. The improvements could be associatedwith differences in the methods and/or the use of an IS. During the method validation, alimited quantity of ergot epimer standards were available to use based on cost. A lesseramount of grain and solvent were utilized to minimize cost and excessive use of standards.This allows laboratories to save money and resources, especially when sample replicationis necessary and spiking at the beginning of the extraction process is important.
The linearity of r2 > 0.99 for the calibration curves are defined as good [29]. The LODand LOQ were calculated using the ‘Guidance Document on the Estimation of LOD andLOQ for Measurements in the Field of Contaminants in Feed and Food’ [32]. Similarly,Arroyo-Manzanares et al., 2018 [23] and Schummer et al., 2020 [35] used the same approach.The calculated instrumental LOD and LOQ (µg/kg) from this study are low compared toArroyo-Manzanares et al., 2018 [23], using the same matrix. The LOD for all 12 epimersare below the lowest concentration on the linear calibration curve. Food for children andinfants may contain a very low concentration of ergot alkaloids according to regulatorylimits [36], therefore, a new sensitive method with low LOD’s and LOQ’s are beneficial.This sensitive analytical method can be utilized in research or diagnostic research to obtainlow and actuate concentrations.
For each R/S-epimer pair for each ergot alkaloids, similar and different LOD andLOQ values are observed. That could be associated with differing functional groupsfor certain R/S-epimer pairs. Potentially, the lower LOD and LOQ for most S-epimerscould be associated with better ionization which may be related to the greater peak area(counts × minute) observed.
A common approach to determine the LOD and LOQ of a method includes the ‘meanof 3 and 10 SD’ in samples that are uninfected [29] (p. 7037) or a signal to noise ratio of3 and 10 [31] (p. 295). The Guidance Document mentioned above suggests that commonmethods to determine the LOD and LOQ should not be utilized. Pascale et al., 2019 [37]mentioned that the LOD and LOQ may vary between laboratories. Therefore, the guidancedocument describes an approach to measure those parameters in a way to incapsulate thewhole procedure to help decrease those discrepancies. Sulyok et al., 2020 [38] noted thatthe LOD and LOQ do not need to be reassessed for different matrices unless there is noiseat a high concentration spike level. The rationale for utilizing a representative wheat matrixin the current study is supported.
Matrix effects are commonly observed when using UHPLC-MS/MS. Matrix effects ofgreater than 100% can infer signal enhancement, while matrix effect of less than 100% caninfer signal suppression [29,31]. Variable matrix effects are observed in multiple matriceswhen analyzing ergot epimers [31]. Similarly, the variability in matrix effects betweenstudies can be associated with the differences in analytical methods and instruments. Inthe current study, the matrix effects appear to be minimal. This is associated with MEvalues for each epimer occurring around 100%. There are no guidelines on the acceptableamount of matrix effects [38]. Matrix effects can be defined as soft, moderate or strongdepending on the plus minus from 100%. According to that classification, the current studyobserved soft enhancement (100 + 20%). Associated with reasonable matrix effects and theuse of an internal standard, matrix match calibration curves were not deemed necessary.Solvent calibration curves have also been utilized in recent analytical studies assessingmycotoxins [38,39]. Likewise, injecting small quantities of a matrix can minimize the needfor matrix matched calibration curves [37], which was utilized in the current method.
The S-epimers of all ergot alkaloids had lower matrix effects, closer to 100%, comparedto the R-epimers. This could be associated with the differences in ionization between the
Toxins 2022, 14, 22 6 of 14
two epimer configurations. A lower matrix effect for the S-epimers may allow for a moreaccurate concentration analyzed.
Recovery results in the present study are similar to other analytical methods analyzingsimilar analytes. The low (0.75 µg/kg) spike concentration had similar recoveries for allergot epimers (79–115%) compared to the mid (5 µg/kg) spike concentration (68–119%).Arroyo-Manzanares et al., 2018 [23] observed similar values for percent recovery with arange of 60–89% for all ergot epimers using higher spike concentrations (10 and 150 µg/kg).Tittlemier et al., 2015 [3] also observed percent recoveries ranging from 60–132% for 10 ergotepimers. Interestingly, Tkachenko et al., 2021 [39] saw greater accuracy/recovery for theS-epimers compared to the R-epimers. Similarly, this study observed the same trend exceptfor ergometrine/-inine. However, the recovery for ergometrinine and ergometrinine arevery similar. Factors such as greater ionization or greater stability may be associated withthe greater recovery of the S-epimers compared to the R-epimers.
The percent recovery observed in the current study aligns with other mycotoxinstandards stated in the European Commission Regulation (2006) [40], although it is statedthat recovery in terms of mycotoxins is under review [38]. Krska et al., 2008 [6] relatedthe criteria for mycotoxins as having satisfactory values of 60–120% for recovery and aRSD < 30%. Ergot alkaloids are not explicitly defined in terms of recovery in the EuropeanCommission (EC) Regulation (2006) [40].
Precision is commonly calculated using percent relative standard deviation (% RSD).Arroyo-Manzanares et al., 2018 [23] had a RSD of 13% or lower for all mycotoxins analyzed.Likewise, Guo et al., 2016 [29] had RSD values of lower than 15%. In the current study,the intra-day precision ranged from 1.86–13.81% RSD and inter-day precision rangedfrom 5.88–23.9% RSD for both spike concentrations. Diana Di Mavungu et al., 2012 [31]had similar results for repeatability (12–26% RSD) and within laboratory reproducibility(12–24% RSD) for the lowest spiked concentration used analyzing 12 ergot epimers. A RSDof less than 20% conforms with the European Commission Regulation (2006) [40]. Anacceptable RSD ≤ 20% for 97% of the analytes quantified in different food matrices hasbeen reported [41]. In the current study, only one analyte, ergometrine, had >20% RSD forinter-day precision. There appeared to be no trends in the similarity or differences betweenthe R and S-epimers in terms of precision.
Internal standards are used in analytical methods to account for the loss of analytesthroughout the extraction process and analytical procedure. Internal standards account forlosses associated with the cleanup and detection of ergot alkaloids [20]. Ideally, for eachergot epimer analyzed, there would be an isotopically labeled internal standard. However,such internal standards are not available [36]. Therefore, in the current study, the internalstandard, LSD-D3, was used to account for any potential losses throughout the extractionprocedure and analysis. Without the internal standard, a decrease in concentration wasobserved which was deemed inaccurate. The observed decrease in concentration observedwas associated with the dry down of the extraction solvent. Through recovery assessment,it was deemed that the use of the internal standard accounted sufficiently for the loss of allthe epimers. The concentration of epimers with the correction of the internal standard wereclose to the actual concentration spiked. Therefore, the internal standard can be addedbefore the dry down step to account for any potential losses. Tittlemier et al., 2015 [3]and Fabregat-Cabello et al., 2016 [42] added IS to their samples in a similar manner. TheLSD-D3 has similar physiochemical properties to the ergot epimers, similar shape to theergoline ring of the ergot epimers and elutes on the chromatogram similar to some epimers.A limitation of LSD-D3 is the deuterated atoms are cleaved during fragmentation [20].However, the molecular ion with the deuterated atoms still attached is used for quantifica-tion. Additionally, deuterated compounds must not to have the same molecular weightas naturally occurring isotopes. Three or more deuterated atoms are recommended. Thecurrent internal standard utilized may not be ideal for all epimers analyzed compared toC13 isotopically labeled internal standard, however, it acts sufficiently for accounting forany losses. Holderied et al., 2019 used lysergic acid diethylamide (LSD) as their internal
Toxins 2022, 14, 22 7 of 14
standard to detect and quantify ergot epimers associated with structural and chemical simi-larities. Conveniently, LSD-D3 can be easily purchased and is readily available, whereasLSD is a control substance in Canada. The LSD-D3 can now be included as an internalstandard to quantify ergot alkaloids and may be adopted into current or future methods.
Epimerization of ergot epimers in analytical methods can be of concern. Cool tempera-ture autosamplers are recommended to minimize epimerization [31,43], which was utilizedin the present study. Epimerization was also minimized using amber vials and black plasticbags to limit light exposure throughout sample handling and extraction. The ultra-highperformance liquid chromatography (UHPLC) column was maintain at a temperature of40 ◦C. A previous method also utilized the same temperature for the quantification of ergotalkaloids [34]. As noted in the chromatogram (see materials and methods), the epimershave sharp peaks and, with the exception of ergotamine/ergotaminine, do not have a‘saddle’ between their peaks, indicating on column epimerization is unlikely [44].
This current validated method quantified 12 ergot epimers in naturally contaminatedwheat. These 12 epimers are the major ergot alkaloids produced by Claviceps purpurea andconstitute a large portion of the ergot alkaloid metabolome [45]. Wheat samples from west-ern Canada have had similar concentrations to the present study [3]. The R-epimers of eachergot alkaloid had greater concentrations than the S-epimers. However, the concentrationsof some R/S-epimer pairs were similar to each other. Ergocristine and ergocristinine hadthe greatest concentrations of all R and S-epimers analyzed. Similarity, they have been re-ported to be the most dominate R and S-epimer in terms of concentration [19]. Interestingly,independent sample number 4 had low concentrations of ergocornine/ergocorninine com-pared to the other independent samples. The high proportion of S-epimers in contaminatedgrain may be contributed to the epimerization of R to S-epimers over time. Consequently,the large concentration of S-epimers supports the quantification in a diagnostic and analyt-ical setting. Similarly, including the S-epimers of ergot alkaloids in food and feed safetystandards is important.
4. Conclusions
This new sensitive validated UHPLC-MS/MS analytical method, through evaluationand comparison of several parameters, successfully assesses both R and S ergot epimers ofergot alkaloids. The use of LSD-D3 can be successfully utilized as an internal standard forthe quantification of both R and S-epimers. The R and S-epimers of ergot alkaloids behavedifferently in this analytical method. The S-epimers have lower LOD and LOQ, a greaterpeak area, lower matrix effects, and a greater recovery than the R-epimers. The differencesbetween the R and S-epimers may help advance future analytical research on ergot epimers.The high sensitivity of this method to detect and quantify ergot epimers supports theuse of this method in analytical research and diagnostic settings. Especially since lowconcentrations of ergot alkaloids are used in regulatory standards [36]. Screening both Rand S-epimers, is important because they pose a risk to the health of human and animalsthat consume contaminated food and feed which is currently a public health concernin developing countries [46] and in livestock feed [35]. Naturally ergot-contaminatedhard red spring wheat was chosen as a representative matrix for the validation of thisanalytical method because it is routinely analyzed in diagnostic laboratories and multipleindependent samples were readily available. Future studies will focus on validating theabove method for the analysis and quantification of other matrices. This method can beused to quantify R and S-epimers of ergot alkaloids in spiked, and widely variable naturalcontaminated wheat samples, that are typical of a research and diagnostic setting.
5. Materials and Methods5.1. Sample Preparation, Extraction, and Analysis5.1.1. Standards
Standards of six ergot R-epimers (ergotamine (95.1 ± 4.9% purity), ergometrine(98 ± 2.0% purity), ergocristine (98.7 ± 1.3% purity), ergocryptine (99.6 ± 0.4% purity),
Toxins 2022, 14, 22 8 of 14
ergocornine (97.8 ± 2.2%), ergosine (95.9 ± 4.1%) and six ergot S-epimers (ergotaminine(95.8 ± 4.2% purity), ergometrinine (98.0 ± 2.0% purity), ergocristinine (96.6 ± 3.4% pu-rity), ergocryptinine (99.2 ± 0.8%), ergocorninine (95.6 ± 4.4%), ergosinine (99.0 ± 1.0%)were purchased from Romer Labs (Tulln, Austria). Deuterated lysergic acid diethylamide(LSD-D3) was purchased from Sigma Aldrich (Oakville, ON, Canada) and used as aninternal standard. Each dried standard was reconstituted in liquid chromatography-massspectrometry (LC-MS) grade acetonitrile (≥99.9% purity) (Fisher Scientific, Edmonton,AB, Canada) to obtain concentrations of 100 µg/kg and 25 µg/kg for R and S-epimers,respectively. A working standard was made by mixing aliquots from each epimer in ahigh-performance liquid chromatography (HPLC) amber vial (Agilent, Santa Clara, CA,USA), with a final concentration of 312.5 µg/mL for each epimer. The working standardwas dried down with nitrogen using a multivap nitrogen evaporator (Organomation, Berlin,MA, USA), capped, and stored at −80 ◦C until use.
5.1.2. Sample Preparation
Six independent samples of ergot-contaminated hard red spring wheat were obtainedfrom the Canadian Feed Research Centre (North Battleford, SK, Canada). Visually, eachsample contained a high quantity of ergot sclerotia. Therefore, the concentration of theergot alkaloids within each of the contaminated samples was obtained from a previousstudy. A serial dilution was conducted to obtain a starting concentration of ergot alkaloidsthat is within the proposed linear range and is relevant to ergot contamination detectedroutinely in feed and food samples. This was executed, instead of diluting the samples withsolvent in subsequent steps, to obtain samples with more practical epimer concentrationsthat are observed in feed samples submitted to diagnostic labs for testing. Visually, thecontaminated samples had a homogenous mixture in terms of ergot sclerotia and grainkernels. A 10 g portion of each contaminated sample was mixed with 100 g of clean hardred spring wheat by hand, whisking until a homogenous mixture was observed, with afinal weight of 110 g. A Sartorius BP2100 scale (Elk Grove, CA, USA) was utilized to weighthe grain and for subsequent weighing measures. The mixture was ground using a UDYCyclone Sample Mill (Fort Collins, CO, USA, Model #3010-060, 1 mm mesh) and mixedby hand to ensure homogeneity. Four to six grams of the mixed ground sample (amountdepended on the starting concentration of the sample) was further diluted into a finalweight of 404–406 g using ground clean hard red spring wheat. The final diluted samplewas mixed by hand with a whisk until homogenous and was utilized for subsequentextraction and analysis.
5.1.3. Extraction
The extraction procedure followed a similar approach to ThermoFisher Scientific [34],with modifications. A 5 g ground sample of the final dilution for each ergot contaminatedsample was placed in a 50 mL plastic trace metal free centrifuge tube (Labconco, KansasCity, MO, USA). An extraction solvent containing 20 mL of acetonitrile:water (80:20) wasadded to the tube and mixed (Benchmixer Multi-tube Vortexer, Sayreville, MA, USA) forone hour. The sample was centrifuged (Beckman GPR, Indianapolis, IN, USA) for 10 min at3500 rpm. One mL of supernatant was filtered through a 0.45 µm polytetrafluoroethylene(PTFE) syringe filter (Fisher Scientific, Edmonton, AB, Canada) into a 12 × 75 mm glassculture tube. An aliquot of 160 µL of the filtered sample was pipetted into a HPLC ambervial (Agilent, Santa Clara, CA, USA) plus 40 µL of internal standard at a concentration of20 µg/kg. The sample was vortexed and dry down with a gentle stream of nitrogen usingthe multivap nitrogen evaporator at approximately 20 ◦C. Samples were reconstitutedin 200 µL of LC-MS grade methanol (≥99.9% purity): water (50:50) (Fisher Scientific,Edmonton, AB, Canada), capped and vortexed for approximately 15 sec. A 200 µL volumeof the reconstituted sample was transferred to a HPLC amber vial with 200 µL springHPLC vial inserts (MicroSol, Eatontown, NJ, USA) and capped. The vial was centrifuged at3500 rpm for 10 min prior to UHPLC-MS/MS analysis.
Toxins 2022, 14, 22 9 of 14
5.1.4. UHPLC-MS/MS Operation and Analysis
The operation and analysis utilized some parameters outlined in ThermosFisher Sci-entific [34], with modifications. Separation of the ergot epimers was conducted using aThermoFisher Scientific Vanquish UHPLC with a 2.1 mm ID filter cartridge and a Hyper-sil GOLD 100 mm × 2.1 mm × 1.9µm C18 Selectivity column (ThermoFisher Scientific,Waltham, MA, USA). The mobile phases consisted of LC-MS grade water (mobile phase A)and methanol (mobile phase B) each with 0.1% LC-MS grade formic acid added (FisherScientific, Edmonton, AB, Canada). The percent of the organic phase (mobile phase B) wasmodified throughout the analytical run according to the following specification: 0 min, 5%;0.5 min, 5%; 7 min, 70%, 9 min, 100%; 12 min, 100%; 12.1 min, 5%. The total instrumentmethod run time was 16 min per sample. The column chamber was at 40 ◦C [34], with aflow of 0.3 mL/min. The autosampler was maintained at a cool temperature of 5 ◦C with asmall injection volume of 2 µL.
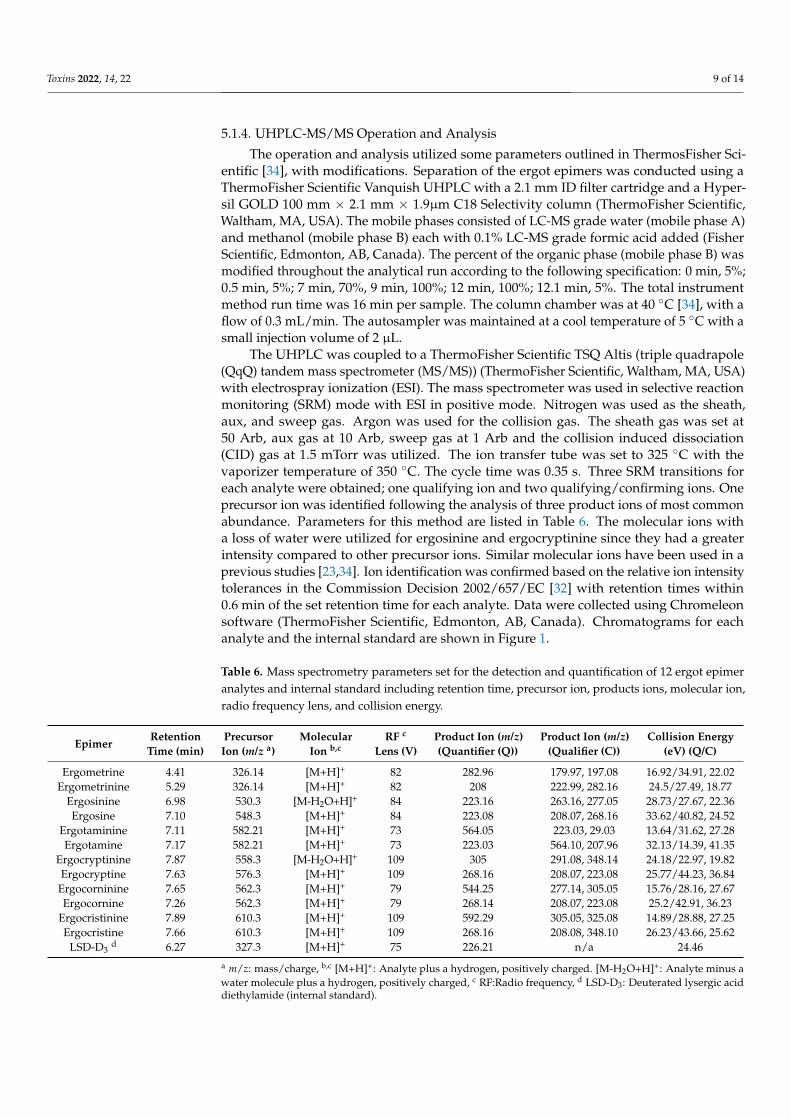
The UHPLC was coupled to a ThermoFisher Scientific TSQ Altis (triple quadrapole(QqQ) tandem mass spectrometer (MS/MS)) (ThermoFisher Scientific, Waltham, MA, USA)with electrospray ionization (ESI). The mass spectrometer was used in selective reactionmonitoring (SRM) mode with ESI in positive mode. Nitrogen was used as the sheath,aux, and sweep gas. Argon was used for the collision gas. The sheath gas was set at50 Arb, aux gas at 10 Arb, sweep gas at 1 Arb and the collision induced dissociation(CID) gas at 1.5 mTorr was utilized. The ion transfer tube was set to 325 ◦C with thevaporizer temperature of 350 ◦C. The cycle time was 0.35 s. Three SRM transitions foreach analyte were obtained; one qualifying ion and two qualifying/confirming ions. Oneprecursor ion was identified following the analysis of three product ions of most commonabundance. Parameters for this method are listed in Table 6. The molecular ions witha loss of water were utilized for ergosinine and ergocryptinine since they had a greaterintensity compared to other precursor ions. Similar molecular ions have been used in aprevious studies [23,34]. Ion identification was confirmed based on the relative ion intensitytolerances in the Commission Decision 2002/657/EC [32] with retention times within0.6 min of the set retention time for each analyte. Data were collected using Chromeleonsoftware (ThermoFisher Scientific, Edmonton, AB, Canada). Chromatograms for eachanalyte and the internal standard are shown in Figure 1.
Table 6. Mass spectrometry parameters set for the detection and quantification of 12 ergot epimeranalytes and internal standard including retention time, precursor ion, products ions, molecular ion,radio frequency lens, and collision energy.
EpimerRetention
Time (min)PrecursorIon (m/z a)
MolecularIon b,c
RF c
Lens (V)Product Ion (m/z)(Quantifier (Q))
Product Ion (m/z)(Qualifier (C))
Collision Energy(eV) (Q/C)
Ergometrine 4.41 326.14 [M+H]+ 82 282.96 179.97, 197.08 16.92/34.91, 22.02Ergometrinine 5.29 326.14 [M+H]+ 82 208 222.99, 282.16 24.5/27.49, 18.77
Ergosinine 6.98 530.3 [M-H2O+H]+ 84 223.16 263.16, 277.05 28.73/27.67, 22.36Ergosine 7.10 548.3 [M+H]+ 84 223.08 208.07, 268.16 33.62/40.82, 24.52
Ergotaminine 7.11 582.21 [M+H]+ 73 564.05 223.03, 29.03 13.64/31.62, 27.28Ergotamine 7.17 582.21 [M+H]+ 73 223.03 564.10, 207.96 32.13/14.39, 41.35
Ergocryptinine 7.87 558.3 [M-H2O+H]+ 109 305 291.08, 348.14 24.18/22.97, 19.82Ergocryptine 7.63 576.3 [M+H]+ 109 268.16 208.07, 223.08 25.77/44.23, 36.84
Ergocorninine 7.65 562.3 [M+H]+ 79 544.25 277.14, 305.05 15.76/28.16, 27.67Ergocornine 7.26 562.3 [M+H]+ 79 268.14 208.07, 223.08 25.2/42.91, 36.23
Ergocristinine 7.89 610.3 [M+H]+ 109 592.29 305.05, 325.08 14.89/28.88, 27.25Ergocristine 7.66 610.3 [M+H]+ 109 268.16 208.08, 348.10 26.23/43.66, 25.62
LSD-D3d 6.27 327.3 [M+H]+ 75 226.21 n/a 24.46
a m/z: mass/charge, b,c [M+H]+: Analyte plus a hydrogen, positively charged. [M-H2O+H]+: Analyte minus awater molecule plus a hydrogen, positively charged, c RF:Radio frequency, d LSD-D3: Deuterated lysergic aciddiethylamide (internal standard).

Toxins 2022, 14, 22 10 of 14
Figure 1. Extracted Ion Chromatograms. (a) Representative chromatogram of each ergot epimeranalyzed at the lowest concentration on the standard curve (0.25 µg/kg) and internal standard(LSD-D3) at 20 µg/kg. (b,c) Zoomed versions of the chromatogram for each epimer.
A control wheat matrix sample containing all 12 ergot epimers and a solvent-spikedsample, with a concentration (2 µg/kg) in the mid linear range, were used as qualitycontrol samples for this analytical method to monitor performance. To measure instrumentvariability, each amber vial within an analytical run, containing reconstituted extract, wasinjected twice and analyzed. An average value for the duplicate injection was utilized.
5.2. Method Validation
Clean hard red spring wheat (visually free of ergot sclerotia) was analyzed to ensurethe grain was free of analytes to evaluate matrix effects. Associated with low concentrationsof analytes in the clean grain, the concentrations of all 12 ergot epimers were adjustedby subtracting the background concentrations [3]. This clean wheat was also used as thepseudo-blank samples (n = 10) for the calculation of the LOD and LOQ.
Solvent calibration curves [38,39] were used to assess linearity with the equationy = mx + b, where (y) is the peak area of analyte/peak area of internal standard and (x) isconcentration. The calibration curves were weighted using ‘1/Amount’. This allows forequal weighting of the calibration points for each concentration. This is associated withthe calibration curve analyzed at the beginning and end of each analytical run. Calibrationcurves contained seven standards for each epimer at concentrations of 0.25, 0.5, 1, 2, 10,50, and 250 µg/kg. The dried down working standard containing all 12 ergot epimerswas removed from the −80 ◦C freezer the day of analysis. Using methanol:water (50:50),the working standard was reconstituted in 300 µL. A series of dilutions from the workingstandard created the seven standard concentrations used in the calibration curve. To createthe calibration curve, 160 µL of each standard concentration containing all 12 ergot epimersand 40 µL of internal standard was added to an amber autosampler vial with 200 µLspring HPLC inserts. This approach is commonly utilized [42]. The LOD and LOQ were

Toxins 2022, 14, 22 11 of 14
calculated according to the Guidance Document on the Estimation of LOD and LOQ forMeasurements in the Field of Contaminants in Feed and Food [32]. See Equations (1) and(2) (described in the guidance document).
XLOD = 3.9 ×(Sy,b
b
)(1)
XLOQ = 3.3 × XLOQ (2)
XLOD: Limit of detectionSy,b: Standard deviation of pseudo-blank signalsb: Slope of the calibration curve at concentrations close to expected LODXLOQ: Limit of quantificationMatrix effects were evaluated using Equation (3) [29]. Two working standards, con-
taining all epimers, were reconstituted in either methanol:water (50:50) (solvent matrix) orclean hard red spring wheat matrix that was extracted with acetonitrile:water (80:20), dried,and reconstituted with methanol:water (50:50) (wheat matrix). Serial dilutions from eachof the working standards were conducted to obtain seven samples with concentrations of0.25, 0.5, 1, 2, 10, 50, and 250 µg/kg for each epimer. The wheat and solvent matrix sampleswere then analyzed as stated previously. The analysis produced a graph of peak area ofanalyte (epimer) (y) vs. concentration (x) for the clean wheat matrix and solvent matrix foreach epimer. The slopes from each graph for each epimer were used to calculate ME for thespecific epimer. The internal standard was excluded from this calculation.
ME (%) =
(Slope in spiked clean wheat
Slope in spiked solvent
)× 100 (3)
Recovery and precision of all 12 ergot epimers were assessed by spiking all 12 epimersin ground clean wheat samples at two different concentrations, with six replicates ateach concentration. The concentrations chosen were based on the linear range with amid (5 µg/kg) concentration and a low (0.75 µg/kg) concentration. These concentrationsrepresent the concentration spiked in the diluted samples that the instrument would detect.Availability and price of standards to spike was a limitation. Therefore, the samples wereextracted as mentioned previously, however, using 1 g of ground wheat in a 25 mL plasticcentrifuge tube with 4 mL of extraction solvent. The samples were diluted by a factor of 4(4 mL extraction solvent/1 g sample).This was repeated on three separate days. Recoverywas calculated as per Equation (4) [31] and averaged across all three days. Precision wasexamined by inter and intra-day repeatability [23]. The percent relative standard deviation(% RSD) for all six replicates on three different days was calculated to determine inter dayprecision for each spike concentration. Intra-day precision was determined by the % RSDfrom a single analysis within one day.
Recovery (%) =
(Concentration measured (µg/kg)
Concentration spiked (µg/kg)
)× 100 (4)
Carry over was monitored and minimized by injecting blank samples followinghigh epimer concentration sample analysis. A needle wash was preformed between allinjections though washing the outside of the needle in a reservoir with a rinse solutioncontaining 50:50 Acetone (Honeywell, Fisher Scientific, Edmonton, AB, Canada): water(Fisher Scientific, Edmonton, AB, Canada). Acceptable carry over was deemed when thepeak area of all 12 epimers was below the lowest concentration on the calibration curve(0.25 µg/kg), in the blank sample. This method was validated following procedures fromthe Commission Decision 2002/657/EC [33].

Toxins 2022, 14, 22 12 of 14
5.3. Natural Ergot Contaminated Wheat
Six subsamples of five grams each, from each of the six independent ground anddiluted ergot contaminated samples were extracted and analyzed for the concentrationof 12 ergot R and S-epimers (ergotamine, ergotaminine, ergocornine, ergocorninine, er-gocristine, ergocristinine, ergocryptine, ergocryptinine, ergometrine, ergometrinine, er-gosine and ergosinine), using the validated method above. A dilution factor of 4 (20 mLextraction solvent/5 g ground sample) was applied to obtain the actual concentration ofthe epimers within the samples.
Author Contributions: Conceptualization, J.C. and T.G.-O.; methodology, J.C. and T.G.-O.; validation,J.C. and T.G.-O.; formal analysis, J.C.; writing—original draft preparation, J.C.; writing—review andediting, J.C., T.G.-O., B.B. and A.A.-D.; supervision, B.B. and A.A.-D. All authors have read andagreed to the published version of the manuscript.
Funding: This research was funded by the Toxicology Graduate Devolved Scholarship, partialsupport from the Western College of Veterinary Medicine (WCVM) in kind, and The SaskatchewanMinistry of Agriculture-Agriculture Development Fund (ADF), ADF grant number: 20180361. TheAPC was funded by an internal grant from the WCVM.
Institutional Review Board Statement: Not applicable.
Informed Consent Statement: Not applicable.
Data Availability Statement: The data presented in this study are available through the correspond-ing author.
Acknowledgments: The authors would like to thank Prairie Diagnostic Services (PDS) for theresources and instrument usage, Olivier Collin for his expertise, Canadian Feed Research Centre forthe ergot contaminated grain, and Cherewyk Farms for the clean grain.
Conflicts of Interest: The authors declare no conflict of interest.
References1. Ma, R.; Zhang, L.; Liu, M.; Su, Y.-T.; Xie, W.-M.; Zhang, N.-Y.; Dai, J.-F.; Wang, Y.; Rajput, S.A.; Qi, D.-S.; et al. Individual and
Combined Occurrence of Mycotoxins in Feed Ingredients and Complete Feeds in China. Toxins 2018, 10, 113. [CrossRef] [PubMed]2. Zhao, L.; Zhang, L.; Xu, Z.; Liu, X.; Chen, L.; Dai, J.; Karrow, N.A.; Sun, L. Occurrence of Aflatoxin B1, deoxynivalenol and
zearalenone in feeds in China during 2018–2020. J. Anim. Sci. Biotechnol. 2021, 12, 74. [CrossRef] [PubMed]3. Tittlemier, S.A.; Drul, D.; Roscoe, M.; Mckendry, T. Occurrence of Ergot and Ergot Alkaloids in Western Canadian Wheat and
Other Cereals. J. Agric. Food Chem. 2015, 63, 6644–6650. [CrossRef]4. Babic, J.; Tavcar-Kalcher, G.; Celar, F.A.; Kos, K.; Cervek, M.; Jakovac-Strajn, B. Ergot and Ergot Alkaloids in Cereal Grains
Intended for Animal Feeding Collected in Slovenia: Occurrence, Pattern and Correlations. Toxins 2020, 12, 730. [CrossRef][PubMed]
5. Komarova, E.L.; Tolkachev, O.N. The chemistry of peptide ergot alkaloids. Part 1. Classification and chemistry of ergot peptides.Pharm. Chem. J. 2001, 35, 504–513. [CrossRef]
6. Krska, R.; Stubbings, G.; MacArthur, R.; Crews, C. Simultaneous determination of six major ergot alkaloids and their epimers incereals and foodstuffs by LC-MS-MS. Anal. Bioanal. Chem. 2008, 391, 563–576. [CrossRef] [PubMed]
7. European Food Safety Authority (EFSA). Opinion on ergot as undesirable substance in animal feed. EFSA J. 2005, 225, 1–27.8. Agriopoulou, S. Ergot Alkaloids Mycotoxins in Cereals and Cereal-Derived Food Products: Characteristics, Toxicity, Prevalence,
and Control Strategies. Agronomy 2021, 11, 931. [CrossRef]9. Grusie, T.; Cowan, V.; Singh, J.; McKinnon, J.; Blakley, B. Correlation and variability between weighing, counting and analytical
methods to determine ergot (Claviceps purpurea) contamination of grain. World Mycotoxin J. 2017, 10, 209–218. [CrossRef]10. Mohamed, R.; Gremaud, E.; Richoz-Payot, J.; Tabet, J.-C.; Guy, P.A. Quantitative determination of five ergot alkaloids in rye flour
by liquid chromatography–electrospray ionisation tandem mass spectrometry. J. Chromatogr. A 2006, 1114, 62–72. [CrossRef]11. Ruhland, M.; Tischler, J. Determination of ergot alkaloids in feed by HPLC. Mycotoxin Res. 2008, 24, 73–79. [CrossRef]12. Shi, H.; Schwab, W.; Liu, N.; Yu, P. Major ergot alkaloids in naturally contaminated cool-season barley grain grown under a
cold climate condition in western Canada, explored with near-infrared (NIR) and fourier transform mid-infrared (ATR-FT/MIR)spectroscopy. Food Control 2019, 102, 221–230. [CrossRef]
13. Merkel, S.; Dib, B.; Maul, R.; Köppen, R.; Koch, M.; Nehls, I. Degradation and epimerization of ergot alkaloids after baking andin vitro digestion. Anal. Bioanal. Chem. 2012, 404, 2489–2497. [CrossRef]
14. Bryła, M.; Szymczyk, K.; Jedrzejczak, R.; Roszko, M. Application of liquid chromatography/ion trap mass spectrometry techniqueto determine ergot alkaloids in grain products. Food Technol. Biotechnol. 2015, 53, 18–28. [CrossRef] [PubMed]

Toxins 2022, 14, 22 13 of 14
15. Haarmann, T.; Rolke, Y.; Giesbert, S.; Tudzynski, P. Plant diseases that changed the world: Ergot: From witchcraft to biotechnology.Mol. Plant Pathol. 2009, 10, 563–577. [CrossRef]
16. Mulac, D.; Hüwel, S.; Galla, H.J.; Humpf, H.U. Permeability of ergot alkaloids across the blood-brain barrier in vitro and influenceon the barrier integrity. Mol. Nutr. Food Res. 2012, 56, 475–485. [CrossRef]
17. Cherewyk, J.E.; Parker, S.E.; Blakley, B.R.; Al-Dissi, A.N. Assessment of the vasoactive effects of the (S)-epimers of ergot alkaloidsin vitro. J. Anim. Sci. 2020, 98, skaa203. [CrossRef]
18. Andrae, K.; Merkel, S.; Durmaz, V.; Fackeldey, K.; Köppen, R.; Weber, M.; Koch, M. Investigation of the Ergopeptide EpimerizationProcess. Computation 2014, 2, 102–111. [CrossRef]
19. Coufal-Majewski, S.; Stanford, K.; Mcallister, T.; Wang, Y.; Blakley, B.; Mckinnon, J.; Chaves, A. V Effects of pelleting dietscontaining cereal ergot alkaloids on nutrient digestibility, growth performance and carcass traits of lambs. Anim. Feed Sci. Technol.2017, 230, 103–113. [CrossRef]
20. Crews, C. Analysis of ergot alkaloids. Toxins 2015, 7, 2024–2050. [CrossRef] [PubMed]21. Krska, R.; Crews, C. Significance, chemistry and determination of ergot alkaloids: A review. Food Addit. Contam. Part A Chem.
Anal. Control Expo. Risk Assess. 2008, 25, 722–731. [CrossRef]22. Smith, D.J.; Shappell, N.W. Technical note: Epimerization of ergopeptine alkaloids in organic and aqueous solvents. J. Anim. Sci.
2002, 80, 1616–1622. [CrossRef]23. Arroyo-Manzanares, N.; De Ruyck, K.; Uka, V.; Gámiz-Gracia, L.; García-Campaña, A.M.; De Saeger, S.; Di Mavungu, J.D.
In-house validation of a rapid and efficient procedure for simultaneous determination of ergot alkaloids and other mycotoxins inwheat and maize. Anal. Bioanal. Chem. 2018, 410, 5567–5581. [CrossRef]
24. Lauwers, M.; De Baere, S.; Letor, B.; Rychlik, M.; Croubels, S.; Devreese, M. Multi LC-MS/MS and LC-HRMS Methods forDetermination of 24 Mycotoxins including Major Phase I and II Biomarker Metabolites in Biological Matrices from Pigs andBroiler Chickens. Toxins 2019, 11, 171. [CrossRef] [PubMed]
25. Tittlemier, S.A.; Cramer, B.; Dall’Asta, C.; Iha, M.H.; Lattanzio, V.M.T.; Maragos, C.; Solfrizzo, M.; Stranska, M.; Stroka, J.;Sumarah, M. Developments in mycotoxin analysis: An update for 2018–2019. World Mycotoxin J. 2020, 13, 3–24. [CrossRef]
26. Berthiller, F.; Cramer, B.; Iha, M.H.; Krska, R.; Lattanzio, V.M.T.; MacDonald, S.; Malone, R.J.; Maragos, C.; Solfrizzo, M.;Stranska-Zachariasova, M.; et al. Developments in mycotoxin analysis: An update for 2016–2017. World Mycotoxin J. 2017, 10, 5–29.[CrossRef]
27. Holderied, I.; Rychlik, M.; Elsinghorst, P. Optimized Analysis of Ergot Alkaloids in Rye Products by Liquid Chromatography-Fluorescence Detection Applying Lysergic Acid Diethylamide as an Internal Standard. Toxins 2019, 11, 184. [CrossRef]
28. Kodisch, A.; Oberforster, M.; Raditschnig, A.; Rodemann, B.; Tratwal, A.; Danielewicz, J.; Korbas, M.; Schmiedchen, B.; Eifler, J.;Gordillo, A.; et al. Covariation of Ergot Severity and Alkaloid Content Measured by HPLC and One ELISA Method in InoculatedWinter Rye across Three Isolates and Three European Countries. Toxins 2020, 12, 676. [CrossRef] [PubMed]
29. Guo, Q.; Shao, B.; Du, Z.; Zhang, J. Simultaneous Determination of 25 Ergot Alkaloids in Cereal Samples by UltraperformanceLiquid Chromatography−Tandem Mass Spectrometry. J. Agric. Food Chem. 2016, 64, 7033–7039. [CrossRef]
30. Canadian Food Inspection Agency (CFIA). RG-8 Regulatory Guidance: Contaminants in Feed (Formerly RG-1, Chapter 7).Available online: https://www.inspection.gc.ca/animal-health/livestock-feeds/regulatory-guidance/rg-8/eng/1347383943203/1347384015909?chap=0 (accessed on 30 September 2021).
31. Di Mavungu, J.D.; Malysheva, S.V.; Sanders, M.; Larionova, D.; Robbens, J.; Dubruel, P.; Van Peteghem, C.; De Saeger, S.Development and validation of a new LC-MS/MS method for the simultaneous determination of six major ergot alkaloids andtheir corresponding epimers. Application to some food and feed commodities. Food Chem. 2012, 135, 292–303. [CrossRef]
32. Wenzl, T.; Haedrich, J.; Schaechtele, A.; Robouch, P.; Stroka, J. Guidance Document on the Estimation of LOD and LOQ for Measurementsin the Field of Contaminants in Feed and Food; EUR 28099; Publications Office of the European Union: Luxembourg City, Luxembourg,2016; pp. 1–58. ISBN 978-92-79-61768-3.
33. European Commission. Commission Decision of 12 August 2002 implementing Council Directive 96/23/EC concerning theperformance of analytical methods and the interpretation of results (2002/657/EC). Off. J. Eur. Communities 2002, 221, 8–36.
34. Hofmann, S.; Scheibner, O. Quantification of 48 Myco- and Phytoxins in Cereal Using Liquid Chromotography-Triple QuadrupoleMass Spectrometry. ThermoFisher Scientific, Application Note 65969. pp. 1–9. Available online: https://assets.thermofisher.com/TFS-Assets/CMD/Application-Notes/an-65969-mycotoxin-phytotoxins-cereal-tsq-quantis-an65969-en.pdf (accessed on29 November 2021).
35. Schummer, C.; Zandonella, I.; van Nieuwenhuyse, A.; Moris, G. Epimerization of ergot alkaloids in feed. Heliyon 2020, 6, e04336.[CrossRef]
36. Chung, S.W.C. A critical review of analytical methods for ergot alkaloids in cereals and feed and in particular suitability ofmethod performance for regulatory monitoring and epimer-specific quantification. Food Addit. Contam. Part A 2021, 38, 997–1012.[CrossRef]
37. Pascale, M.; De Girolamo, A.; Lippolis, V.; Stroka, J.; Mol, H.G.J.; Lattanzio, V.M.T. Performance Evaluation of LC-MS Methods forMultimycotoxin Determination. J. AOAC Int. 2019, 102, 1708–1720. [CrossRef]
38. Sulyok, M.; Stadler, D.; Steiner, D.; Krska, R. Validation of an LC-MS/MS-based dilute-and-shoot approach for the quantificationof >500 mycotoxins and other secondary metabolites in food crops: Challenges and solutions. Anal. Bioanal. Chem. 2020,412, 2607–2620. [CrossRef]
Toxins 2022, 14, 22 14 of 14
39. Tkachenko, A.; Benson, K.; Mostrom, M.; Guag, J.; Reimschuessel, R.; Webb, B. Extensive Evaluation via Blinded Testing of anUHPLC-MS/MS Method for Quantitation of Ten Ergot Alkaloids in Rye and Wheat Grains. J. AOAC Int. 2021, 104, 546–554.[CrossRef] [PubMed]
40. European Commission. Commission Regulation (EC), No. 401/2006 laying down the methods of sampling and analysis for theofficial control of the concentration of mycotoxins in foodstuffs. Off. J. Eur. Communities 2006, 70, 12–34.
41. Malachová, A.; Sulyok, M.; Beltrán, E.; Berthiller, F.; Krska, R. Optimization and validation of a quantitative liquidchromatography-tandem mass spectrometric method covering 295 bacterial and fungal metabolites including all regulatedmycotoxins in four model food matrices. J. Chromatogr. A 2016, 136, 145–156. [CrossRef]
42. Fabregat-Cabello, N.; Zomer, P.; Sancho, J.V.; Roig-Navarro, A.F.; Mol, H.G.J. Comparison of approaches to deal with matrixeffects in LC-MS/MS based determinations of mycotoxins in food and feed. World Mycotoxin J. 2016, 9, 149–161. [CrossRef]
43. Hafner, M.; Sulyok, M.; Schuhmacher, R.; Crews, C.; Krska, R. Stability and epimerisation behaviour of ergot alkaloids in varioussolvents. World Mycotoxin J. 2008, 1, 67–78. [CrossRef]
44. Liquid Chromatography Problem Solving and Troubleshooting. J. Chromatogr. Sci. 1995, 33, 598. Available online: https://academic.oup.com/chromsci/article-abstract/33/10/598/530950?redirectedFrom=PDF (accessed on 29 December 2021). [CrossRef]
45. Uhlig, S.; Rangel-Huerta, O.D.; Divon, H.H.; Rolén, E.; Pauchon, K.; Sumarah, M.W.; Vrålstad, T.; Renaud, J.B. Unravelingthe Ergot Alkaloid and Indole Diterpenoid Metabolome in the Claviceps purpurea Species Complex Using LC−HRMS/MSDiagnostic Fragmentation Filtering. J. Agric. Food Chem. 2021, 69, 7137–7148. [CrossRef] [PubMed]
46. Debegnach, F.; Patriarca, S.; Brera, C.; Gregori, E.; Sonego, E.; Moracci, G.; De Santis, B. Ergot Alkaloids in Wheat and Rye DerivedProducts in Italy. Foods 2019, 8, 150. [CrossRef] [PubMed]
Top Related
Copyright © 2022 FDOKUMEN

