


Bahasa
Halaman
Hukum


Qual Quant (2009) 43:999–1009DOI 10.1007/s11135-008-9170-2
RESEARCH NOTE
Using OWA aggregation technique in QFD: a case studyin education in a textile engineering department
Ayse Okur · Efendi N. Nasibov · Musa Kiliç ·Murat Yavuz
Published online: 23 April 2008© Springer Science+Business Media B.V. 2008
Abstract Quality Function Deployment (QFD) is a systematic approach that considerscustomer needs through design, production, marketing, and support stages. Customer needsare the main input for QFD, so voice of customer must be understood well and changes,innovations, and treatments must be held in this view. In QFD applications, determiningthe priorities of customer needs is a fairly important stage. This is mostly held by AnalyticHierarchy Process (AHP) a multicriteria decision making technique. Nonetheless, OrderedWeighted Averaging (OWA) is an aggregation technique mostly used in decision mak-ing for multicriteria decision problems. So, combining these two techniques will give adifferent viewpoint for prioritizing the customer needs in QFD applications. The aim ofthis study is to show the use of Ordered Weighted Averaging (OWA) aggregation tech-nique in QFD applications. For this purpose a case study in Dokuz Eylül University Tex-tile Engineering Department was held. It was aimed to support the efforts on increasingthe education quality by determining the students’ needs and opinions using QFD withOWA.
Keywords Quality function deployment (QFD) · Ordered weighted averaging (OWA) ·Education · Textile engineering
1 Introduction
Quality Function Deployment (QFD) was first developed in Japan in the early 1970s byProfessor Yoji Akao and Professor Shigeru Mizuno. QFD means delivering products andservices which meet the customer needs efficiently. It is a unique system for developing
A. Okur · M. Kiliç (B) · M. YavuzFaculty of Engineering, Department of Textile Engineering, Dokuz Eylül University,35100 Bornova, Izmir, Turkeye-mail: [email protected]
E. N. NasibovFaculty of Science, Department of Statistics, Dokuz Eylül University, 35160 Buca, Izmir, Turkey
123

1000 A. Okur et al.
new products which aims to assure that the initial quality of the product or service willsatisfy the customer. QFD aims customer satisfaction. Therefore, voice of customer (VOC)must be understood well. QFD focuses on delivering positive value by seeking both spo-ken and unspoken needs, translating these into actions and designs, and communicatingthese throughout each organization on the value chain to the end customer (Bolt and Mazur1999). According to Akao, QFD is a method for developing a design quality aimed atsatisfying the consumer and then translating the consumer’s demand into design targetsand major quality assurance points to be used throughout the production phase (Akao1990). American Supplier Institute defines QFD as a systematic process that helps com-panies quickly understand and integrate clients’ needs into their products or services(American Supplier Institute 2006).
QFD can be applied into many areas. Education is one of those. It is possible to findout several applications of QFD on education in recent years. Jaraiedi and Ritz (1994)used QFD to dissect advising and teaching. They searched for possible solutions that wouldimprove the advising and teaching perceptions in students’ eyes. Shaffer and Pfeiffer (1995)applied the corporate-based process of QFD to develop training modules for the contin-uing education of nurses and tested these modules in four large health-care facilities in theUnited States. Pitman et al. (1995, 1996) discussed about evaluating the customer satisfac-tion in educational fields using QFD and got very successful results. Bier and Cornesky(2001) stated in their article how RainStar University used QFD techniques to construct amaster’s degree in acupuncture and oriental medicine (MS in AOM) program curriculumthat would meet the requirements of the specialty programmatic accrediting body for acu-puncture and oriental medicine, the Accrediting Commission for Acupuncture and OrientalMedicine. Using QFD techniques, RainStar not only met but also exceeded the professionalcompetencies.
Various aggregation techniques (Nasibov and Nasibova 2003, 2005; Calvo and Mesiar2001) can be used for combining different opinions in QFD applications. In this study it wasaimed to use QFD with OWA aggregation approach to determine the needs and opinions ofthe university students on education and specify technical characteristics to meet these needsand opinions.
2 Material
Universities serve various fields such as society, industry, private sector, public sector, stu-dents’ parents, etc. So, each of these fields can be thought as customers of universities. Butindeed real customers are students who take the education service directly. From this point ofview in this study Dokuz Eylül University Textile Engineering Department’s students weretaken as customer and QFD application on education was performed in respect of these stu-dents’ needs and opinions. In Table 1 numbers of the students that join the study are shownfor each class.
Table 1 Numbers ofstudents for each class
Class Numbers of students
1 562 213 344 55
123

Using OWA in QFD: a case study in education 1001
3 Method
For the first step of the study a QFD team was constituted. Then, students’ needs and opinionsabout education were determined by a survey study. The priorities of these needs were estab-lished by Analytic Hierarchy Process (AHP) using Ordered Weighted Averaging (OWA).Then technical characteristics which would meet students’ needs were determined by brainstorming technique in the QFD team meeting and relations matrix was formed to designatethe priorities of technical characteristics. After completing the study, results were presentedto department and faculty managements.
4 QFD Team
QFD team is the main executive and decision authority for the QFD application (Akao 1990).In this study, QFD team was consisted of seven persons that symbolize the department. Teammembers were as follows: an assistant professor from the department management, twoprofessors, three research assistants and one student.
5 Determining the students’ needs
The QFD team came together biweekly for four times along the study. At the first meetinga representation about QFD was presented to team members and then 48 survey questionswhich would expose the students’ needs about the education were determined by brain storm-ing technique. Some of these questions were as follows:
• Are you satisfied from the lecturers’ abilities and performances in the courses?• Do you think the courses will be useful for you in your future business life?• Do you think the courses in foreign language are useful for you?• Do you think the classrooms are clean enough?• Do you think our department’s social possibilities are enough?• Do you think our apprenticeship system is appropriate?• Can you please write down your opinions about education in our department?
A scale from 1 to 5 was used for answers. “1” meant student did not agree and “5” meantstudent agreed with the statement. After this meeting above mentioned survey was applied toall students. The answers of the survey were evaluated by SPSS program and pie charts wereformed for each question. At the second meeting of the QFD team 26 of those 48 questionswere determined as students’ needs by evaluating the pie charts. These needs are given inTable 2.
6 Establishing priorities using AHP with OWA
The Analytic Hierarchy Process (AHP), developed by Saaty (1980), is a technique to rank afinite number of alternatives based on a finite number of criteria (Das et al. 1997). The processrequires the decision maker to provide judgments about the relative importance of each ofthe criteria and then to specify a preference for each decision alternative on each criterion.The output of the AHP is a prioritized ranking indicating the overall preference for each ofthe decision alternatives (Anderson et al. 2005).
123

1002 A. Okur et al.
Table 2 26 students’ needs after survey study
1 Lecturers’ teaching methods should be better2 Lecturers should teach the way that students can understand3 Lecturers should have much more time for students outside the lessons4 Contents of different courses should not be similar5 Professional courses should not be in foreign language6 Students’ opinions should be considered for execution of the courses7 There should be much more time between midterm and final exams8 Exam questions should make students think, not memorize9 All of the exam results should be given to web pages10 Compulsory attendance to courses should be abolished11 Courses should not be held in the sheds12 Practice possibilities should be created besides the test laboratories13 Computer laboratory fees should be decreased14 There should be more references in mother language in the library15 Number of classrooms should be increased16 Classrooms’ capacities should be appropriate for the courses17 Classrooms’ physical conditions should be improved18 Cleanliness of classrooms should be considered19 Cleanliness of corridors and toilets should be considered20 Department’s social possibilities (cafeterias, sports areas, etc.) should be improved21 Number of the seminars should be increased22 Workshop training should be abolished23 An informative meeting should be arranged before trainings24 Much more social activities and technical tours should be arranged by the department25 Students’ community should work more efficient26 Department management should support and encourage students’ community
Table 3 Pairwise comparisonscale for the AHP preferences
Verbal judgment of preference Numerical rating
“A” need is extremely preferred than “B” 9“A” need is very strongly preferred than “B” 7“A” need is strongly preferred than “B” 5“A” need is moderately preferred than “B” 3“A” and “B” needs are equally preferred 1“B” need is moderately preferred than “A” 1/3“B” need is strongly preferred than “A” 1/5“B” need is very strongly preferred than “A” 1/7“B” need is extremely preferred than “A” 1/9
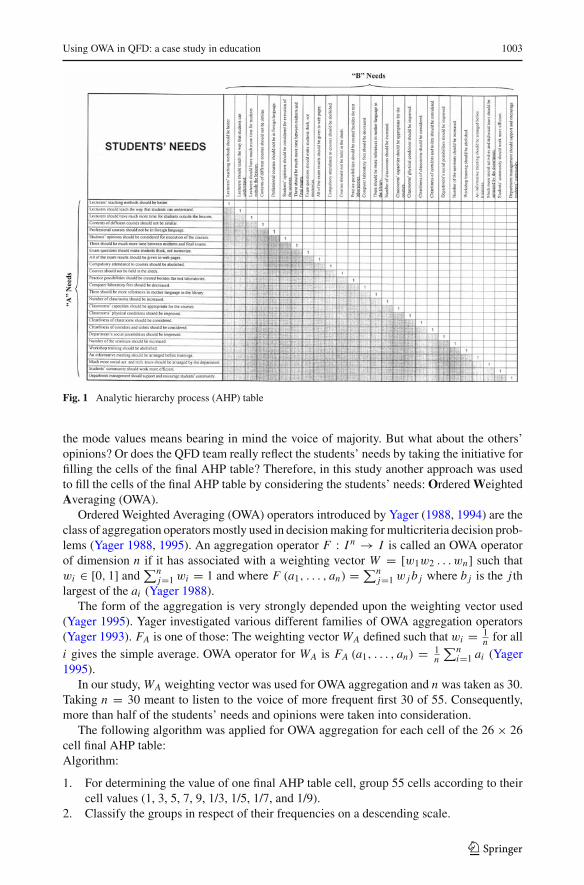
After the second meeting of the QFD team, an AHP table (Fig. 1) was formed to estab-lish the priorities of those 26 students’ needs. For this purpose, the 26 students’ needs werewritten in both rows and columns of a matrix called pairwise comparison matrix. The scalein Table 3 was used for pairwise comparisons for the AHP preferences (Saaty 1980). Then,55 last year students filled 55 pairwise comparison matrixes of needs. AHP tables were justfilled by the last year students on account of having much more idea about the departmentthan the others.
After collecting the AHP tables from 55 students, 55 different preferences for each cell ofthe 26 × 26 matrix were obtained. It is usually seen that the mode value of those 55 values isused for a final AHP table cell (Yenginol 2000) or the QFD team decides the final cell valuesconsidering the customers’ preferences (Göksen and Abasov 2002). Thus, a final AHP tableis obtained. But these approaches may not always reflect the whole’s thoughts as well. Taking
123
Using OWA in QFD: a case study in education 1003
Fig. 1 Analytic hierarchy process (AHP) table
the mode values means bearing in mind the voice of majority. But what about the others’opinions? Or does the QFD team really reflect the students’ needs by taking the initiative forfilling the cells of the final AHP table? Therefore, in this study another approach was usedto fill the cells of the final AHP table by considering the students’ needs: Ordered WeightedAveraging (OWA).
Ordered Weighted Averaging (OWA) operators introduced by Yager (1988, 1994) are theclass of aggregation operators mostly used in decision making for multicriteria decision prob-lems (Yager 1988, 1995). An aggregation operator F : I n → I is called an OWA operatorof dimension n if it has associated with a weighting vector W = [w1w2 . . . wn] such thatwi ∈ [0, 1] and
∑nj=1 wi = 1 and where F (a1, . . . , an) = ∑n
j=1 w j b j where b j is the j thlargest of the ai (Yager 1988).
The form of the aggregation is very strongly depended upon the weighting vector used(Yager 1995). Yager investigated various different families of OWA aggregation operators(Yager 1993). FA is one of those: The weighting vector WA defined such that wi = 1
n for alli gives the simple average. OWA operator for WA is FA (a1, . . . , an) = 1
n
∑ni=1 ai (Yager
1995).In our study, WA weighting vector was used for OWA aggregation and n was taken as 30.
Taking n = 30 meant to listen to the voice of more frequent first 30 of 55. Consequently,more than half of the students’ needs and opinions were taken into consideration.
The following algorithm was applied for OWA aggregation for each cell of the 26 × 26cell final AHP table:Algorithm:
1. For determining the value of one final AHP table cell, group 55 cells according to theircell values (1, 3, 5, 7, 9, 1/3, 1/5, 1/7, and 1/9).
2. Classify the groups in respect of their frequencies on a descending scale.
123

1004 A. Okur et al.
Fig. 2 An example of OWA based grouping
3. If the frequencies of some groups are equal then combine them and change the cell valuesby taking the average considering the whole group. Get a new group.
4. Repeat the 3rd step until no more equal frequency groups exist.5. Take the average of first 30 of 55 values for OWA aggregation, so determine the value
of final AHP table cell.
The 3rd step was the most important step for our approach while using OWA. If the 3rdstep was not performed, then deciding the order of the same frequency groups would be aproblem for the solution. Furthermore, the 3rd step was needed to understand the voice ofminority. Namely, in some cases combined amount of the equal small-frequency groups hadpriority with their increasing frequencies. Finally above mentioned algorithm was appliedfor all cells and the 26 × 26 cell final AHP table was constituted.
An example is given in Fig. 2 to understand the above mentioned algorithm better. InFig. 2a, 55 students’ preferences for one AHP table cell are seen. In Fig. 2b, these 55 valuesare grouped according to their cell values (1st step). In Fig. 2c, groups are classified in respectof their frequencies on a descending scale (2nd step). In Fig. 2c, it is also seen that two equalfrequency groups exist. So in Fig. 2d these groups are combined and new cell values arecalculated by taking the average of those six values (3rd step). Then the groups are reordered
123
Using OWA in QFD: a case study in education 1005
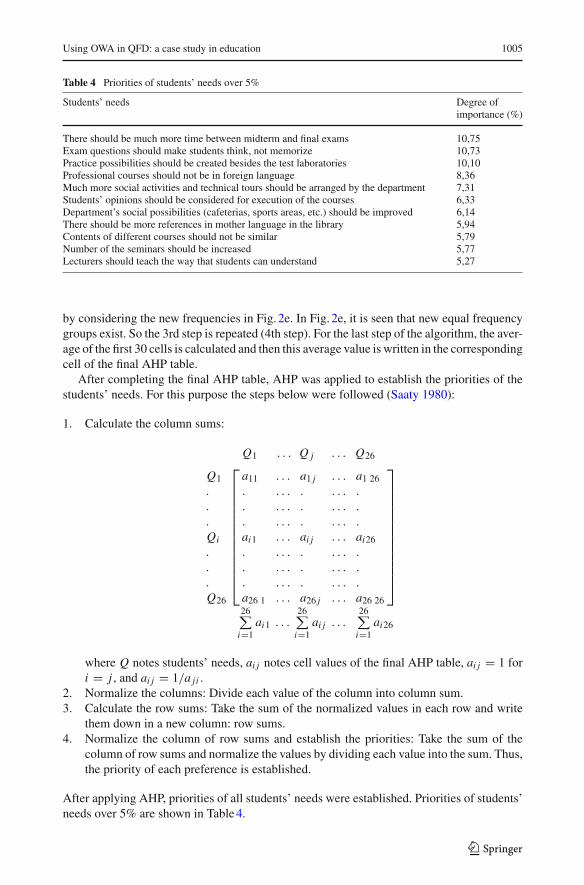
Table 4 Priorities of students’ needs over 5%
Students’ needs Degree ofimportance (%)
There should be much more time between midterm and final exams 10,75Exam questions should make students think, not memorize 10,73Practice possibilities should be created besides the test laboratories 10,10Professional courses should not be in foreign language 8,36Much more social activities and technical tours should be arranged by the department 7,31Students’ opinions should be considered for execution of the courses 6,33Department’s social possibilities (cafeterias, sports areas, etc.) should be improved 6,14There should be more references in mother language in the library 5,94Contents of different courses should not be similar 5,79Number of the seminars should be increased 5,77Lecturers should teach the way that students can understand 5,27
by considering the new frequencies in Fig. 2e. In Fig. 2e, it is seen that new equal frequencygroups exist. So the 3rd step is repeated (4th step). For the last step of the algorithm, the aver-age of the first 30 cells is calculated and then this average value is written in the correspondingcell of the final AHP table.
After completing the final AHP table, AHP was applied to establish the priorities of thestudents’ needs. For this purpose the steps below were followed (Saaty 1980):
1. Calculate the column sums:
Q1 . . . Q j . . . Q26
Q1
.
.
.
Qi
.
.
.
Q26
⎡
⎢⎢⎢⎢⎢⎢⎢⎢⎢⎢⎢⎢⎣
a11 . . . a1 j . . . a1 26
. . . . . . . . .
. . . . . . . . .
. . . . . . . . .
ai1 . . . ai j . . . ai26
. . . . . . . . .
. . . . . . . . .
. . . . . . . . .
a26 1 . . . a26 j . . . a26 26
⎤
⎥⎥⎥⎥⎥⎥⎥⎥⎥⎥⎥⎥⎦
26∑
i=1ai1 . . .
26∑
i=1ai j . . .
26∑
i=1ai26
where Q notes students’ needs, ai j notes cell values of the final AHP table, ai j = 1 fori = j , and ai j = 1/a ji .
2. Normalize the columns: Divide each value of the column into column sum.3. Calculate the row sums: Take the sum of the normalized values in each row and write
them down in a new column: row sums.4. Normalize the column of row sums and establish the priorities: Take the sum of the
column of row sums and normalize the values by dividing each value into the sum. Thus,the priority of each preference is established.
After applying AHP, priorities of all students’ needs were established. Priorities of students’needs over 5% are shown in Table 4.
123

1006 A. Okur et al.
7 Determining the technical characteristics
Technical characteristics can be described as the suggestions of the QFD team to meet thecustomer needs (Akao 1990). At the third meeting of the QFD team, technical characteristicsthat were hoped to meet students’ needs were determined by brain storming technique. Thesetechnical characteristics are written in Table 5.
8 Relations matrix and priorities of the technical characteristics
Relations matrix determines the relationships between the customer needs and the techni-cal characteristics. Relationships are mostly specified by some symbols that correspond tonumeric values to define the degree of the relationships (Akao 1990; Hermann and Yim2003). These symbols are shown in Table 6 (Tetsuichi and Kazuo 1990). The output of therelations matrix defines the prioritized technical characteristics.
At the last meeting of the QFD team relations matrix was formed by writing the 26 stu-dents’ needs in rows and 23 technical characteristics in columns of a 26 × 23 matrix. Then,relationships between the students’ needs and the technical characteristics were determined
Table 5 The technical characteristics
1 An information meeting will be arranged for lecturers about the students’ needs2 Lecturers will be advised for publishing reference books in mother language3 There won’t be any midterm exams at the last week of the term4 The situation of the courses in foreign language will be revised5 Contents of the courses will be revised6 More creative exam questions will be prepared7 Weaving, knitting, and clothing workshops will be improved8 The situation of the computer laboratory in the department will be revised9 Lecturers will give homeworks to make students use library10 A new arrangement for classrooms usage will be asked from the dean of the faculty11 The situation of the current classrooms will be revised12 A cleanup schedule will be prepared and it will be followed13 Everybody will be warned both in written and verbal ways about the cleanliness of the department14 The department will have a much more effective role on arranging the social activities for the students15 Department will encourage the students’ community16 Department will make an attempt for environmental arrangement.17 Benches will be placed outside the department18 Air conditioning system will be established for all of the classrooms19 All the classrooms will be curtained20 Windows of the classrooms will be double glazed21 Students’ cafeteria will be made look better22 Number and variety of the seminars will be increased23 The request of “Abolishing the compulsory attendance to courses” will be mentioned in the faculty
committee
Table 6 Symbols usedin relations matrix
Symbol Meaning Numeric value
� Weak relation 1© Medium relation 3� Strong relation 9
123

Using OWA in QFD: a case study in education 1007
Fig. 3 Relations matrix
Table 7 Priorities of the technical characteristics over 5%
Technical Characteristics Degree of technicalimportance (%)
An information meeting will be arranged for lecturers about the students’ needs 25,2The department will have a much more effective role on arranging the social
activities for the students7,2
Contents of the courses will be revised 7,2A new arrangement for classrooms usage will be asked from the dean of the
faculty6,4
Lecturers will be advised for publishing reference books in mother language 6,2Department will encourage the students’ community 6,0More creative exam questions will be prepared 5,4
by pairwise comparisons and appropriate symbols were written in respect of importance ofthe relations (Fig. 3).
To determine the degree of technical importance for each column the sum of the multipli-cations of degree of importance by numeric value of corresponding symbol was calculated(Fig. 3). After normalizing the degree of technical importance values, the priorities of thetechnical characteristics were obtained. Table 7 shows the priorities of the technical charac-teristics over 5%.
9 Conclusions
In this study it was aimed to show the use of Ordered Weighted Averaging (OWA) aggrega-tion technique in QFD applications. For this purpose a case study in Dokuz Eylül UniversityTextile Engineering Department was held to contribute the efforts for improving the edu-cation quality. The main idea of the QFD was to understand the needs and opinions of thecustomers and execute the future activities from this point of view. Therefore, in the studyfirstly the main customer of the university was tried to be determined. It was thought that theuniversities directly serve the students, so that their needs and opinions had to be taken intoconsideration at first. Then a survey study was performed to lay off the needs and opinions of
123

1008 A. Okur et al.
the students and these needs and opinions were prioritized by “Analytic Hierarchy Process(AHP)” with an OWA operator based approach. OWA based approach gave the possibilityof understanding these needs and opinions better. So the priorities of the technical charac-teristics which meet these needs and opinions were determined accurately. It was hoped thatthis study will give a different viewpoint for evaluating the QFD applications.
When the results of the case study were analyzed carefully, it was easily seen that thestudents’ needs were mostly about execution of the exams and the courses, practice pos-sibilities, and social possibilities. Some of the needs had been known by the departmentpreviously: for example the disability of the social possibilities because of the location ofthe department. But some of the needs were really cautionary for the department: for exam-ple much more time between the midterm and the final exams or much more creative examquestions to make students think or dissimilar contents for different courses. After QFD teamevaluated these needs, the most important action was determined as to arrange an informationmeeting for lecturers about students’ needs (25.2%). For this purpose the outputs of the studywere presented both to department’s lecturers and to deanship of the faculty.
References
Akao, Y.: Quality Function Deployment QFD, Integrating Customer Requirements into Product Design.Productivity Press, Cambridge (1990)
American Supplier Institute: http://www.amsup.com/qfd/index.htm. (2006)Anderson, D.R., Sweeney, D.J., Williams, T.A.: An Introduction to Management Science: Quantitative
Approaches to Decision Making, 11th edn. South-Western College Pub., Cincinnati (2005)Bier, I.D., Cornesky, R.: Using QFD to construct a higher education curriculum. Quality progress. 34(4),
64–68 (2001)Bolt, A., Mazur, G.H.: Jurassic QFD integrating service and product quality function deployment. In: The
Eleventh Symposium on Quality Function Deployment. Novi, Michigan (1999)Calvo, T., Mesiar, R.: Generalized medians. Fuzzy Sets Syst. 124, 59–64 (2001)Das, S., Islam, R., Chattopadhyay, A.B.: A simple approach for on-line tool wear monitoring using the analytic
hierarchy process. Proceedings of the I MECH E Part B Journal of Engineering Manufacture 211(1),19–27 (1997)
Göksen, Y., Abasov, V.: Quality function deployment and application in a textile firm. In: 1st National QualityFunction Deployment Symposium. Izmir, Turkey (2002)
Hermann, C., Yim, H.: Eco-voice of customer (VOC) on QFD. In: Proceedings of EcoDesign 2003 Third Inter-national Symposium on Environmentally Conscious Design and Inverse Manufacturing. Tokyo, Japan,pp. 618–625 (2003)
Jaraiedi, M., Ritz, D.: Total quality management applied to engineering education. Quality Assur. Edu. 2(1),32–40 (1994)
Nasibov, E.N., Nasibova, R.A.: OWA and MIN aggregation methods in fuzzy bin-packing problem, transac.of the national academy of sciences of azerbaijan. Phus. Tech. Math. (2), 45–50 (2003)
Nasibov, E.N., Nasibova, R.A.: Information aggregation for resolving the fuzzy bin packing problem. Automat.Control Comp. Sci. 39(3), 29–36 (2005)
Pitman, G., Motwani, J., Kumar, A., Cheng, C.H.: QFD Application in an educational setting: a pilot fieldstudy. Int. J. Quality Reliabil. Manage. 12(6), 63–72 (1995)
Pitman, G., Motwani, J., Kumar, A., Cheng, C.H.: QFD Application in an educational setting: a pilot fieldstudy. Int. J. Quality Reliabil. Manage. 13(4), 99–108 (1996)
Saaty, T.L.: The Analytic Hierarchy Process. Mc-Graw Hill, New York (1980)Shaffer, M.K., Pfeiffer, I.L.: A blueprint for training. Training Develop. 49(3), 31–33 (1995)Tetsuichi, A., Kazuo, O.: Handbook of Quality Tools—The Japanese Approach. Productivity Press, Cambridge
(1990)Yager, R.R.: On ordered weighted averaging aggregation operators in multicriteria decisionmaking. IEEE
Trans. Syst., Man Cybernet. 18(1), 183–190 (1988)Yager, R.R.: Families of OWA Operators. Fuzzy Sets Syst. 59(2), 125–148 (1993)Yager, R.R.: Interpreting linguistically quantified propositions. Int. J. Intell. Syst. 9(6), 541–569 (1994)
123

Using OWA in QFD: a case study in education 1009
Yager, R.R.: Multicriteria decision making using fuzzy quantifiers. In: IEEE/IAFE Conference on Computa-tional Intelligence for Financial Engineering, Proceedings (CIFEr), 42–46 (1995)
Yenginol, F.: A method which converts customers needs and requirements into technical characteristics: qualityfunction deployment. PhD. Thesis, Dokuz Eylül University Institute of Social Sciences, Izmir, Turkey(2000)
123
Top Related
Copyright © 2022 FDOKUMEN

