


Bahasa
Halaman
Hukum

1
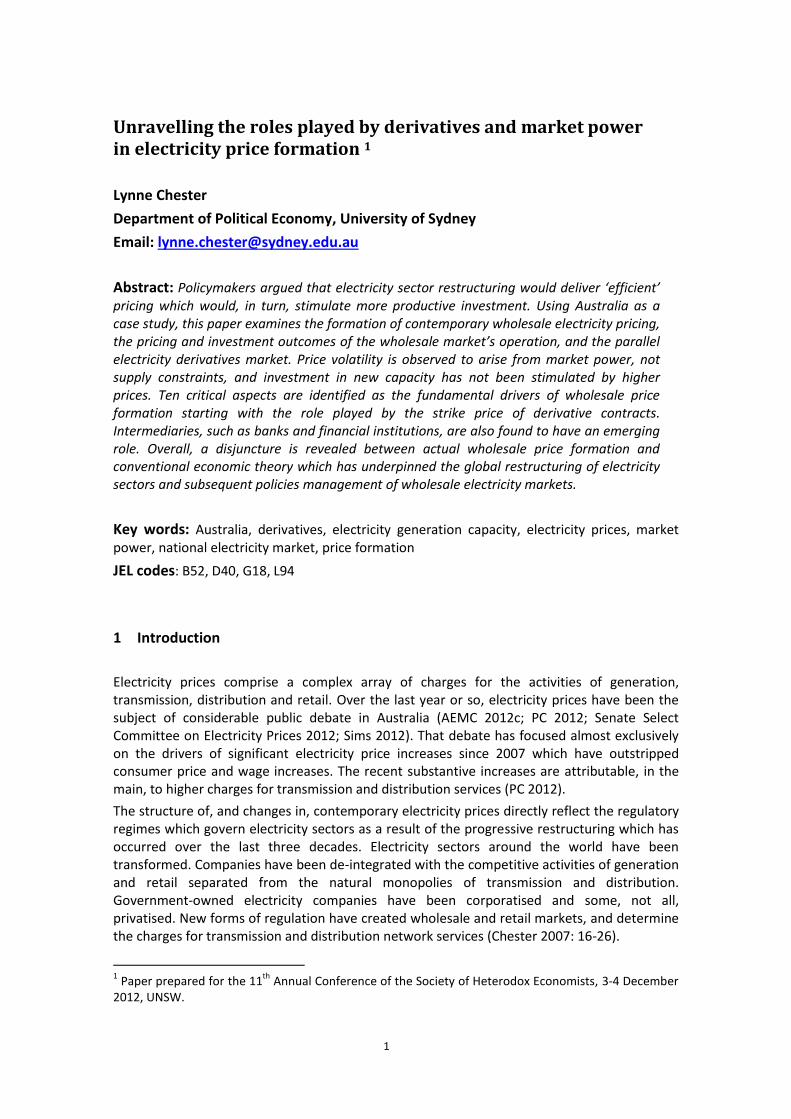
Unravelling the roles played by derivatives and market power in electricity price formation 1
Lynne Chester
Department of Political Economy, University of Sydney
Email: [email protected]
Abstract: Policymakers argued that electricity sector restructuring would deliver ‘efficient’ pricing which would, in turn, stimulate more productive investment. Using Australia as a case study, this paper examines the formation of contemporary wholesale electricity pricing, the pricing and investment outcomes of the wholesale market’s operation, and the parallel electricity derivatives market. Price volatility is observed to arise from market power, not supply constraints, and investment in new capacity has not been stimulated by higher prices. Ten critical aspects are identified as the fundamental drivers of wholesale price formation starting with the role played by the strike price of derivative contracts. Intermediaries, such as banks and financial institutions, are also found to have an emerging role. Overall, a disjuncture is revealed between actual wholesale price formation and conventional economic theory which has underpinned the global restructuring of electricity sectors and subsequent policies management of wholesale electricity markets.
Key words: Australia, derivatives, electricity generation capacity, electricity prices, market power, national electricity market, price formation
JEL codes: B52, D40, G18, L94
1 Introduction
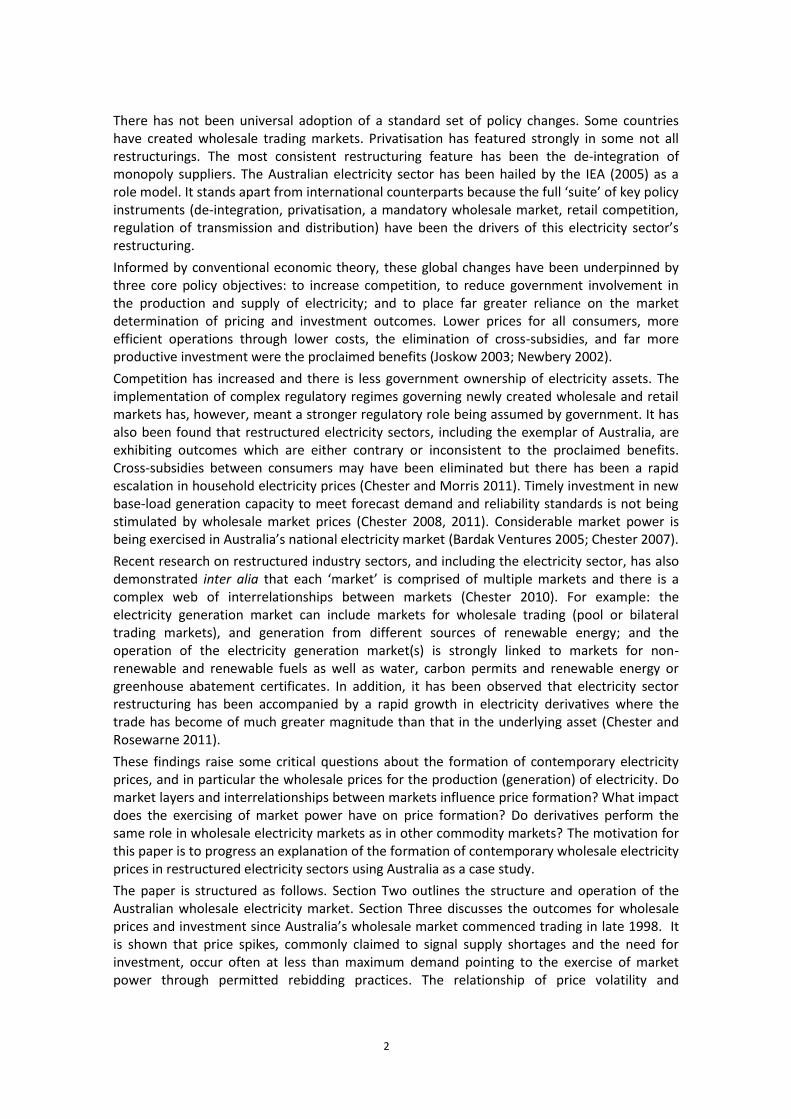
Electricity prices comprise a complex array of charges for the activities of generation, transmission, distribution and retail. Over the last year or so, electricity prices have been the subject of considerable public debate in Australia (AEMC 2012c; PC 2012; Senate Select Committee on Electricity Prices 2012; Sims 2012). That debate has focused almost exclusively on the drivers of significant electricity price increases since 2007 which have outstripped consumer price and wage increases. The recent substantive increases are attributable, in the main, to higher charges for transmission and distribution services (PC 2012).
The structure of, and changes in, contemporary electricity prices directly reflect the regulatory regimes which govern electricity sectors as a result of the progressive restructuring which has occurred over the last three decades. Electricity sectors around the world have been transformed. Companies have been de-integrated with the competitive activities of generation and retail separated from the natural monopolies of transmission and distribution. Government-owned electricity companies have been corporatised and some, not all, privatised. New forms of regulation have created wholesale and retail markets, and determine the charges for transmission and distribution network services (Chester 2007: 16-26).
1 Paper prepared for the 11
th Annual Conference of the Society of Heterodox Economists, 3-4 December
2012, UNSW.
2
There has not been universal adoption of a standard set of policy changes. Some countries have created wholesale trading markets. Privatisation has featured strongly in some not all restructurings. The most consistent restructuring feature has been the de-integration of monopoly suppliers. The Australian electricity sector has been hailed by the IEA (2005) as a role model. It stands apart from international counterparts because the full ‘suite’ of key policy instruments (de-integration, privatisation, a mandatory wholesale market, retail competition, regulation of transmission and distribution) have been the drivers of this electricity sector’s restructuring.
Informed by conventional economic theory, these global changes have been underpinned by three core policy objectives: to increase competition, to reduce government involvement in the production and supply of electricity; and to place far greater reliance on the market determination of pricing and investment outcomes. Lower prices for all consumers, more efficient operations through lower costs, the elimination of cross-subsidies, and far more productive investment were the proclaimed benefits (Joskow 2003; Newbery 2002).
Competition has increased and there is less government ownership of electricity assets. The implementation of complex regulatory regimes governing newly created wholesale and retail markets has, however, meant a stronger regulatory role being assumed by government. It has also been found that restructured electricity sectors, including the exemplar of Australia, are exhibiting outcomes which are either contrary or inconsistent to the proclaimed benefits. Cross-subsidies between consumers may have been eliminated but there has been a rapid escalation in household electricity prices (Chester and Morris 2011). Timely investment in new base-load generation capacity to meet forecast demand and reliability standards is not being stimulated by wholesale market prices (Chester 2008, 2011). Considerable market power is being exercised in Australia’s national electricity market (Bardak Ventures 2005; Chester 2007).
Recent research on restructured industry sectors, and including the electricity sector, has also demonstrated inter alia that each ‘market’ is comprised of multiple markets and there is a complex web of interrelationships between markets (Chester 2010). For example: the electricity generation market can include markets for wholesale trading (pool or bilateral trading markets), and generation from different sources of renewable energy; and the operation of the electricity generation market(s) is strongly linked to markets for non-renewable and renewable fuels as well as water, carbon permits and renewable energy or greenhouse abatement certificates. In addition, it has been observed that electricity sector restructuring has been accompanied by a rapid growth in electricity derivatives where the trade has become of much greater magnitude than that in the underlying asset (Chester and Rosewarne 2011).
These findings raise some critical questions about the formation of contemporary electricity prices, and in particular the wholesale prices for the production (generation) of electricity. Do market layers and interrelationships between markets influence price formation? What impact does the exercising of market power have on price formation? Do derivatives perform the same role in wholesale electricity markets as in other commodity markets? The motivation for this paper is to progress an explanation of the formation of contemporary wholesale electricity prices in restructured electricity sectors using Australia as a case study.
The paper is structured as follows. Section Two outlines the structure and operation of the Australian wholesale electricity market. Section Three discusses the outcomes for wholesale prices and investment since Australia’s wholesale market commenced trading in late 1998. It is shown that price spikes, commonly claimed to signal supply shortages and the need for investment, occur often at less than maximum demand pointing to the exercise of market power through permitted rebidding practices. The relationship of price volatility and
3
investment in new generation capacity is found to be tenuous at best. Section Four discusses the emergence and scale of activity in the Australian electricity derivatives market. The discussion in Section Five identifies ten critical aspects, from the operation of the wholesale electricity and derivatives markets, as the fundamental drivers of wholesale price formation. The strike price of derivatives contracts is found to be only one of these aspects. The discussion also reveals the disjuncture between the empirical evidence and conventional economics’ notion of ‘efficient’ pricing, which underpins the policy framework of restructured electricity sectors. A final section concludes.
2 The structure and operation of the Australian wholesale electricity market
Australia’s electricity sector has undergone major structural change since mid-1990s. Complex Federal and State regulatory regimes have been introduced. Government monopolies have been broken up and many of the new companies sold. The functions of generation and retail are exposed to competition, and the monopoly functions of transmission and distribution are regulated. The majority of Australian households can choose their electricity supplier. The ‘centrepiece’ of the sector’s transformation is generally regarded as the creation of a wholesale trading market and since December 1998, the majority of electricity generated and consumed in Australia has been traded through the National Electricity Market (NEM).2 Just prior to the NEM’s commencement, 45 electricity companies operated in the sector compared to 169 registered NEM participants in September 2012 (AEMO 2012a).
The Australian Energy Market Commission (AEMC) and the Australian Energy Regulator are responsible for the oversight and regulation of the NEM. The National Electricity Rules (Rules) prescribe the NEM’s day-to-day operation including the terms under which participants will engage in the market. The Rules are structured around a mandatory requirement that each generator, with a capacity greater than 30 Megawatts (MW), must sell all electricity produced through the NEM.
The Rules also require the market and system operator – the Australian Energy Market Operator (AEMO) - to monitor demand, forecast supply capacity and operate a centralised process whereby generating units are scheduled and dispatched into production to ensure instantaneous matching of supply and demand. The dispatch process is driven by generators’ bids to produce a volume at particular prices. Bids may contain up to ten price bands of increasing price. Each price band represents an incremental amount of generation. Bids are ‘stacked’ in order of ascending price as the AEMO matches the generating capacity declared available against forecast demand. The least-cost solution is selected to meet demand.3 As demand increases, the more costly bids are scheduled into production. The design of this bidding and scheduling process assumes that bids will reflect the marginal cost of bringing extra capacity into production. The AEMO issues a pre-dispatch schedule that matches forecast supply and demand for each trading interval of the next trading day. The schedule is based on submitted bids although, up until about five minutes before dispatch, a generator may rebid the quantity it will produce “if the material conditions or circumstances upon which the original bid was based change”
2 The NEM covers southern and eastern Australia (Queensland, NSW, ACT, Victoria, Tasmania and
South Australia). The geographic remoteness of the population centres of WA and the NT make the cost of transmission interconnection to a national grid prohibitive. Restructuring of the WA electricity sector has essentially mirrored that involving the NEM. 3 On occasion, generators may be scheduled out of price order due to capacity limits of the transmission
network (AEMO 2010: 10).
4
(NEMMCO 2005: 11). The volume of electricity can be changed in a rebid but the original bid price cannot change (AEMC 2012a: 140). Re-bidding has drawn considerable criticism because many consider the practice is open to exploitation and exposes the NEM to generators wielding market power (For example: Booth 2003; Chester 2008; COAG Energy Market Review 2002; Quiggin 2003). The potential for considerable financial gain from re-bidding is shown in the hypothetical example of Table 1. In this example, 600MW of capacity is bid at four different
price bands and then the re-bid changes the volumes for two price-bands. The financial outcome of the hypothetical rebid is nearly ten per cent more advantageous for the generator.
Table 1: Financial outcomes of a hypothetical bid and a rebid
Original bid Re-bid
100MW @ -$20 per MW -$2,000 4 100MW @ -$20 per MW -$2,000
3
200MW @ $25 per MW $5,000 280MW @ $25 per MW $7,000
100MW @ $60 per MW $6,000 120MW @ $60 per MW $7,200
200MW @ $120 per MW $24,000 200MW @ $120 per MW $24,000
TOTAL $33,000 $36,200
The National Electricity Rules also set out the process to determine the wholesale price paid to generators. First, the price for each five minute dispatch interval is derived (which is most commonly the highest-bid generator brought into production to meet demand). Second, a time-weighted average is calculated of the six dispatch prices for each half hour trading interval for each NEM region.5 There is no single NEM wholesale price. The Rules also specify the maximum price which generators may bid.6
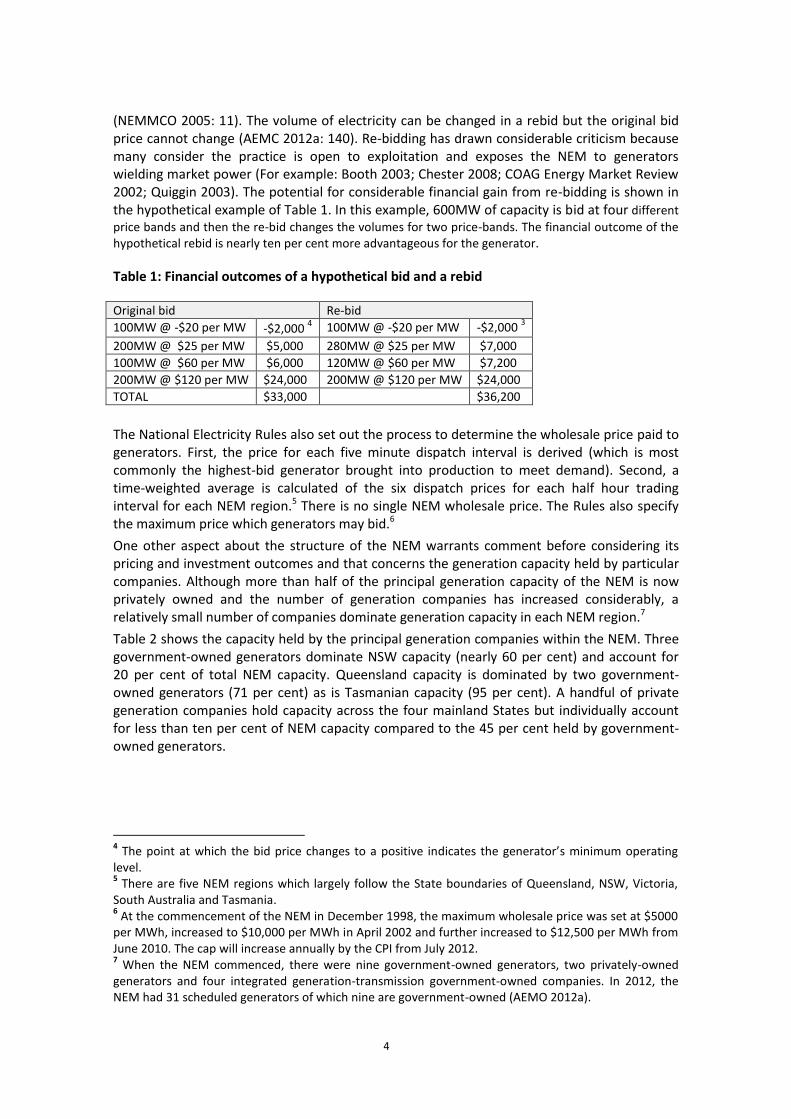
One other aspect about the structure of the NEM warrants comment before considering its pricing and investment outcomes and that concerns the generation capacity held by particular companies. Although more than half of the principal generation capacity of the NEM is now privately owned and the number of generation companies has increased considerably, a relatively small number of companies dominate generation capacity in each NEM region.7
Table 2 shows the capacity held by the principal generation companies within the NEM. Three government-owned generators dominate NSW capacity (nearly 60 per cent) and account for 20 per cent of total NEM capacity. Queensland capacity is dominated by two government-owned generators (71 per cent) as is Tasmanian capacity (95 per cent). A handful of private generation companies hold capacity across the four mainland States but individually account for less than ten per cent of NEM capacity compared to the 45 per cent held by government-owned generators.
4 The point at which the bid price changes to a positive indicates the generator’s minimum operating
level. 5 There are five NEM regions which largely follow the State boundaries of Queensland, NSW, Victoria,
South Australia and Tasmania. 6 At the commencement of the NEM in December 1998, the maximum wholesale price was set at $5000
per MWh, increased to $10,000 per MWh in April 2002 and further increased to $12,500 per MWh from June 2010. The cap will increase annually by the CPI from July 2012. 7 When the NEM commenced, there were nine government-owned generators, two privately-owned
generators and four integrated generation-transmission government-owned companies. In 2012, the NEM had 31 scheduled generators of which nine are government-owned (AEMO 2012a).
5
Table 2: Principal generation capacity and NEM share, 2012
NEM region
Generation plant/company
Owner
Capacity (MW)
Share of
NEM region
capacity (%)
Share of total NEM capacity
(%)
NSW Macquarie Public 4,750 28.9% 9.9%
Delta Electricity Public 2,588 15.7% 5.4%
Origin Private 3,684 22.4% 7.7%
Snowy Hydro Public 2,256 13.7% 4.7%
TRUenergy Private 2,822 17.2% 5.9%
Other Mixed 339 2.1% 0.7%
Total
16,439
34.4%
Victoria Loy Yang Power Private 2,195 20.4% 4.6%
Snowy Hydro Public 2,120 19.7% 4.4%
Hazelwood Power Private 1,600 14.8% 3.4%
Yallourn/TRUenergy Private 1,480 13.7% 3.1%
Loy Yang B/IPR-GDF-SUEZ Private 1,000 9.3% 2.1%
Ecogen Energy Private 959 8.9% 2.0%
AGL Energy Private 837 7.8% 1.8%
Energy Brix Private 195 1.8% 0.4%
Other Private 391 3.7% 0.9%
Total
10,777
22.6%
Queensland Stanwell Corporation Public 4,811 36.4% 10.1%
CS Energy Public 4,530 34.2% 9.5%
Origin Energy Private 1133 8.6% 2.4%
Millmerran (Intergen) Private 852 6.4% 1.8%
Arrow Energy Private 519 3.9% 1.1%
Alinta Energy Private 504 3.8% 1.1%
AGL Energy Private 528 4.0% 1.1%
Other Mixed 357 2.7% 0.7%
Total
13,234
27.7%
South AGL Energy Private 1,578 36.0% 3.3%
Australia IPR-GDF SUEZ Private 860.5 19.6% 1.8%
Alinta Energy Private 780 17.8% 1.6%
TRUenergy Private 296 6.8% 0.6%
Origin Energy Private 304 6.9% 0.6%
Osborne Private 160 3.7% 0.3%
Other Private 404.4 9.2% 0.8%
Total
4,383
9.2%
Tasmania Hydro Tasmania Public 2,283 78.3% 4.8%
Aurora Energy Public 491 16.9% 1.0%
Other Private 139.8 4.8% 0.3%
Total
2,914
6.1%
Source: ESAA (2012)
6
3 Pricing and investment outcomes for the NEM
As previously noted, the wholesale market’s design assumes that pricing bids reflect the marginal cost of bringing extra capacity into production. The long run marginal cost (LRMC) is considered by conventional economic theory, and the NEM’s regulators, to be the market’s ‘efficient’ price level (AEMC 2012). One study found average annual and monthly NEM prices to be commonly at the lower end of the estimated range of long run marginal cost (LRMC) (Chester 2007). A recent report also found the average 2006-07 annual NEM price to be very close to the lower band of the LRMC, well above the estimated range in 2006-07, within range during the subsequent two years, and substantially below the range in 2009-10 and 2010-11 (NERA 2012: 16).
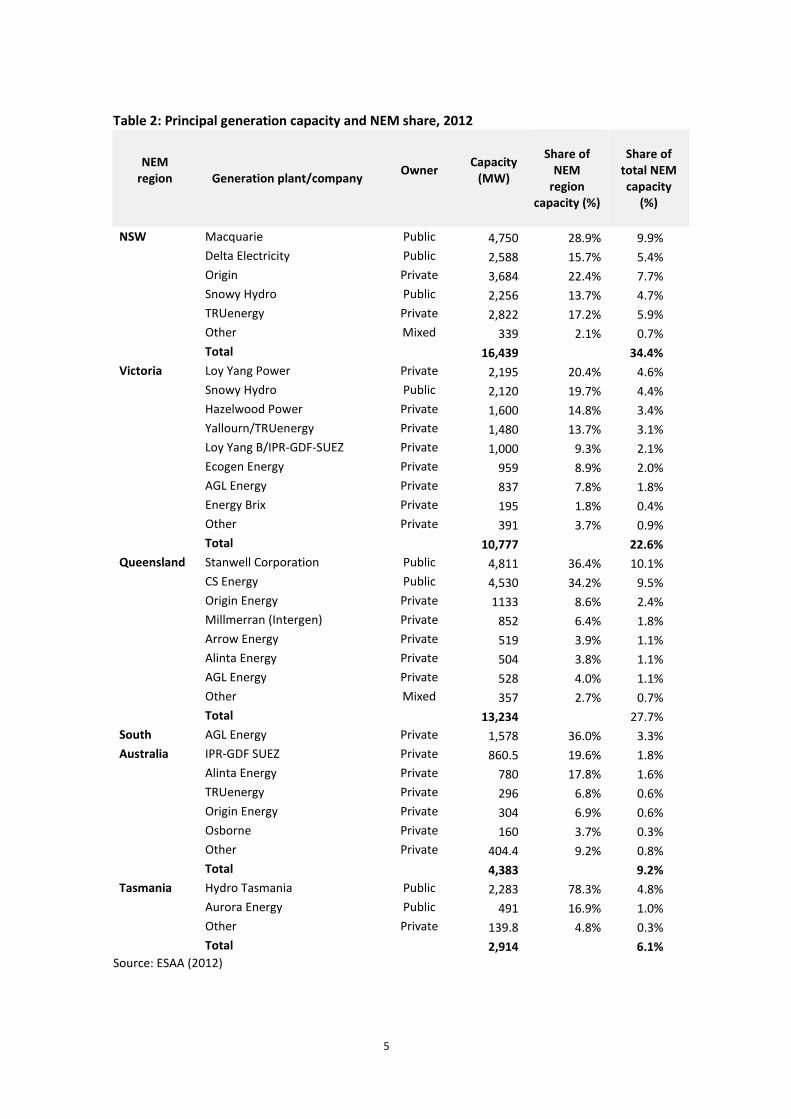
The average annual (or spot) prices for each NEM region are shown in Figure 1. Until 2006 there was a general downward trend in all regions with the exception of NSW. This trend has been resumed since 2007 and 2008 when all regions exhibited above-trend prices.
Figure 1: Average annual NEM prices, 1998-99 to 2011-12 8
Source: AEMO (2012b)
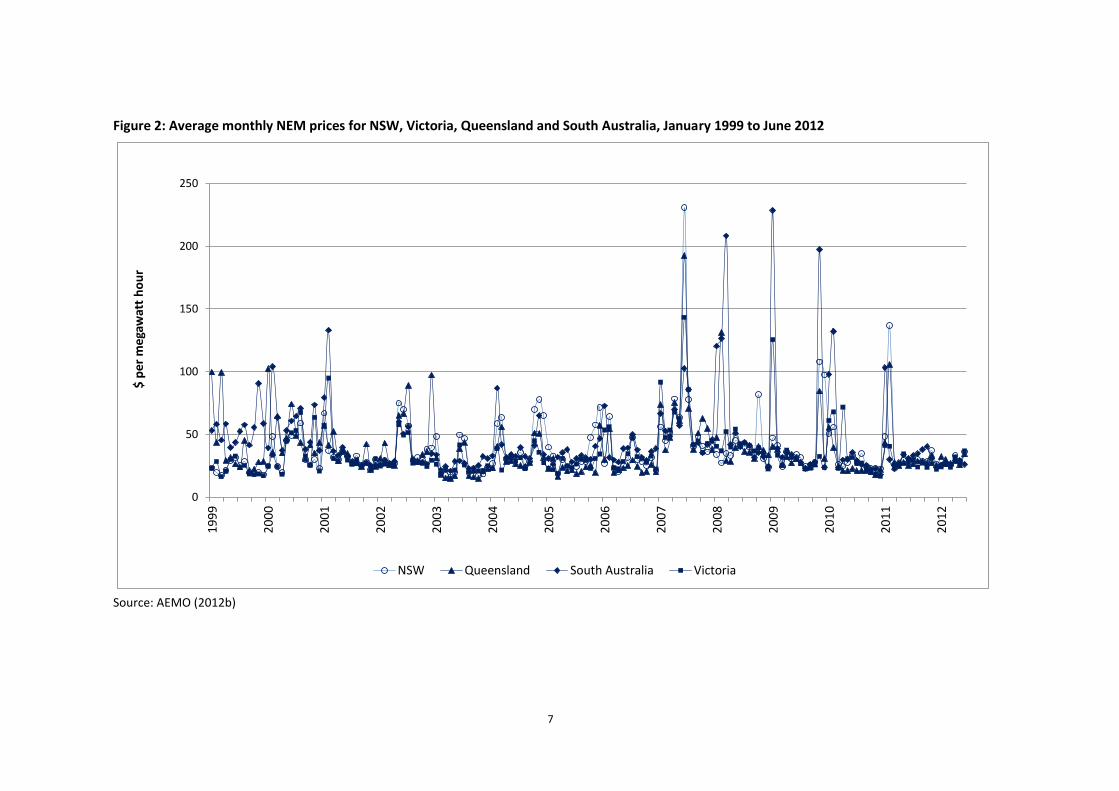
A somewhat different picture of trends emerges when we consider average monthly prices (Figure 2). Regional divergence remains evident. A downward trend until 2007 is also apparent for Queensland and South Australia, and to a lesser extent Victoria. NSW, on the other hand, exhibits an upward trend in the eight years after 1999. The period 2007 to 2011 is generally marked by greater volatility, and particularly for South Australia and NSW. The strongest picture, however, apparent from Figure 2 is one of greater volatility compared to the annual average prices suggesting further volatility underlying these figures given the considerable ‘smoothing’ which occurs with monthly averages.9 Price volatility within the NEM has been consistently acknowledged (ABARE 2002; Australian Government 2004; PC 2005). Fluctuations in demand have not been the principal driver of price volatility, nor can this volatility be attributed to shortages of supply due to transmission
8 Tasmania joined the NEM in 2005.
9 Average monthly figures for each region are derived from over 1,400 prices given the 48 half-hour
trading intervals per day and, for the majority of the year, at least 30 trading days per month.
7
Figure 2: Average monthly NEM prices for NSW, Victoria, Queensland and South Australia, January 1999 to June 2012
0
50
100
150
200
250
19
99
20
00
20
01
20
02
20
03
20
04
20
05
20
06
20
07
20
08
20
09
20
10
20
11
20
12
$ p
er
me
gaw
att
ho
ur
NSW Queensland South Australia Victoria
Source: AEMO (2012b)
8
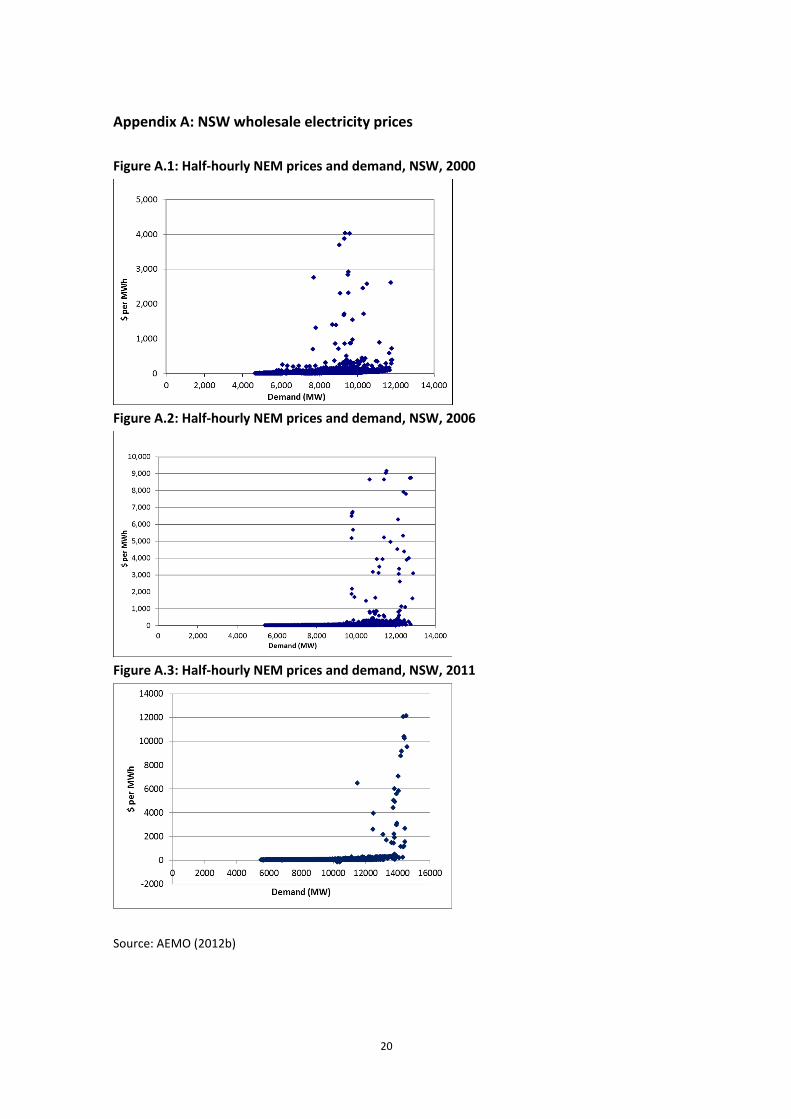
congestion or capacity being offline for scheduled maintenance (Chester 2008; COAG Energy Market Review 2002). Booth’s (2002) analysis of price and demand data for the first few years of the NEM showed that wholesale price spikes were at levels well below maximum demand. This pattern was also found for the period 2002 to 2006 (Chester 2007: 416-23). However, the frequency of price spikes at less than maximum demand has started to fall in recent years as illustrated by the examples of NSW wholesale prices in Appendix A. It has been observed that the NEM’s permitted rebidding practices result primarily in rebids that do not reflect the marginal cost of bringing extra capacity into production – assumed by the market’s design – but a short-term spike at a higher price to yield a more advantageous financial outcome for the generation company concerned (Bardak Ventures 2005). Thus generators are able to make substantial financial gains by exercising their market power, without breaching the NEM’s rebidding rules, and these same generation companies have made substantial annual dividend and tax equivalent payments to their State government owners (Chester 2007). The 2002 COAG Energy Market Review noted the use of market power by NSW generation companies and the Australian Competition and Consumer Commission has acknowledged the ability of generators to withhold capacity and cause price spikes (Willett 2005). A recent AEMC (2012b) review, however, considered there was insufficient evidence of ‘substantial market power’ defined as sustained long-term average prices above the ‘efficient’ level of long-run marginal cost. Notably this does not preclude temporary spikes which yield considerable financial gain (Bardak Ventures 2005). The AEMC (2012) considers these occurrences to reflect ‘transient’ not ‘substantive’ market power.
A critical aspect of price volatility is the extent of the spike and its duration. The Australian Government’s White Paper, Securing Australia’s Energy Future, stated that price spikes in 2002, while “lasting for only 3.2% of the annual duration of the market accounted for 36% of total spot market costs” (2004: 70). Quiggin (2003: 60) estimates that half of annual generator revenue could be created by a peak price of $10,000 per MWh for four hours, during each of four days, if the spot price is usually $20 per MWh. In other words, a small number of price spikes can create significant costs which can also form a high proportion of annual revenue for generation companies.
Consistent with conventional economic theory, and contrary to the evidence of price spikes regularly occurring well at levels below maximum demand, it is claimed that wholesale price volatility or spikes signal the need for investment in additional generation capacity (AEMO 2010; AER 2011: 42). “As the capacity of available generation to meet demand diminishes, relative scarcity will lead to an increase in the spot price, and new generation or network capacity will be attracted into the market” (AEMO 2010: 7). According to this logic, the pattern of volatility shown in Figure 2 indicates less need for additional capacity to meet demand until 2007. As noted above, from 2007 to 2011 volatility has increased considerably and especially for NSW and South Australian wholesale prices.
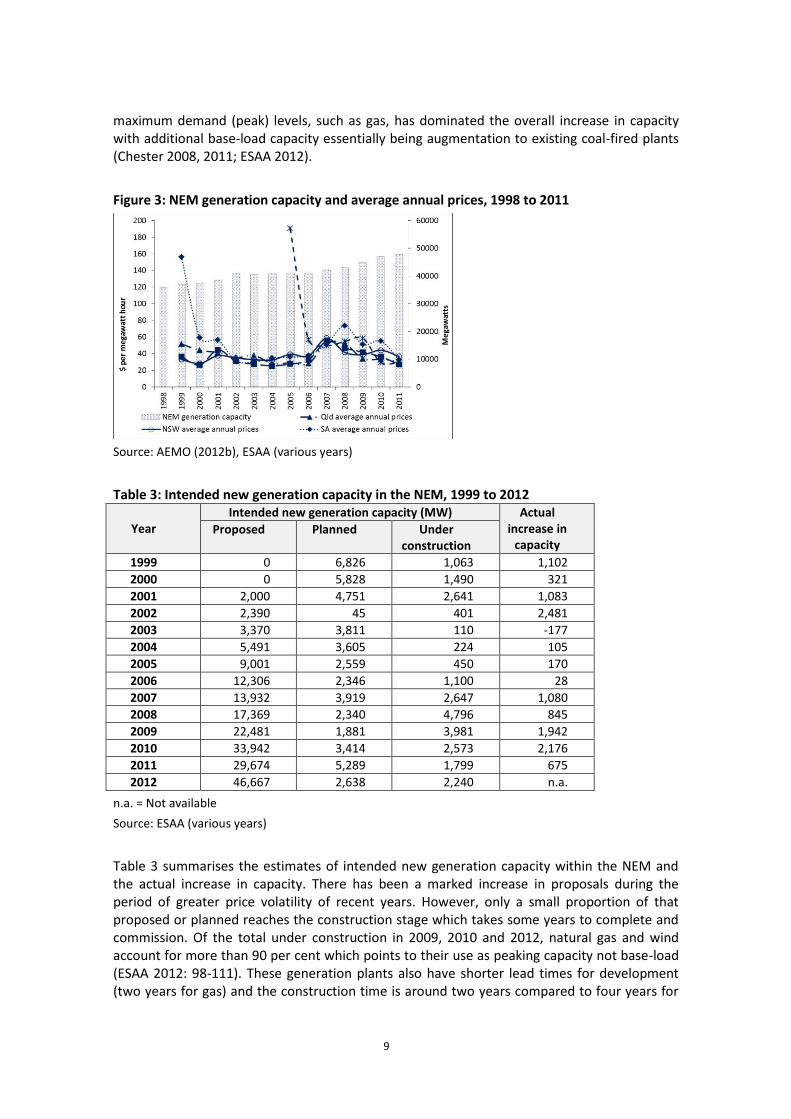
Figure 3 shows the change in the NEM’s generation capacity from 1998 to 2011 overlaid with the annual wholesale prices of Figure 1. From 1998 to 2011, generation capacity in the NEM increased by 33 per cent (about 11,830 MW) with Queensland accounting for more than half (5,970MW). The other two large States of NSW and Victoria accounted for only 28 per cent of the total increase in new capacity.10 Nearly 6,200 MW of capacity (52 per cent) was added in the eight years to 2007, when there was far less price volatility, with the balance of 5,636 MW occurring in the subsequent four years of greater volatility. Generation capacity to meet
10
The Snowy Mountains region of the NEM was abolished from 2008 with the installed capacity being split between the NSW and Victorian regions. This reallocation of capacity accounted for over 50 per cent of the increase in the generation capacity of these two regions since 1998.
9
maximum demand (peak) levels, such as gas, has dominated the overall increase in capacity with additional base-load capacity essentially being augmentation to existing coal-fired plants (Chester 2008, 2011; ESAA 2012).
Figure 3: NEM generation capacity and average annual prices, 1998 to 2011
Source: AEMO (2012b), ESAA (various years)
Table 3: Intended new generation capacity in the NEM, 1999 to 2012
Year Intended new generation capacity (MW) Actual
increase in capacity
Proposed Planned Under construction
1999 0 6,826 1,063 1,102
2000 0 5,828 1,490 321
2001 2,000 4,751 2,641 1,083
2002 2,390 45 401 2,481
2003 3,370 3,811 110 -177
2004 5,491 3,605 224 105
2005 9,001 2,559 450 170
2006 12,306 2,346 1,100 28
2007 13,932 3,919 2,647 1,080
2008 17,369 2,340 4,796 845
2009 22,481 1,881 3,981 1,942
2010 33,942 3,414 2,573 2,176
2011 29,674 5,289 1,799 675
2012 46,667 2,638 2,240 n.a.
n.a. = Not available
Source: ESAA (various years)
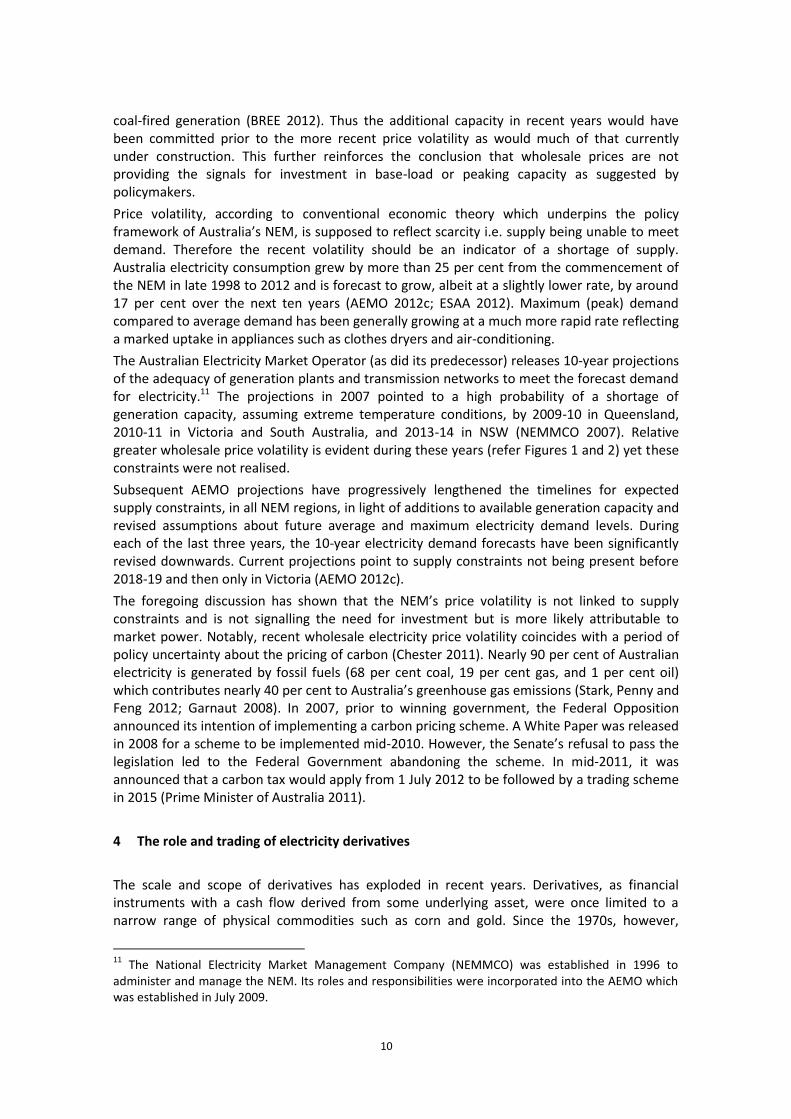
Table 3 summarises the estimates of intended new generation capacity within the NEM and the actual increase in capacity. There has been a marked increase in proposals during the period of greater price volatility of recent years. However, only a small proportion of that proposed or planned reaches the construction stage which takes some years to complete and commission. Of the total under construction in 2009, 2010 and 2012, natural gas and wind account for more than 90 per cent which points to their use as peaking capacity not base-load (ESAA 2012: 98-111). These generation plants also have shorter lead times for development (two years for gas) and the construction time is around two years compared to four years for
10
coal-fired generation (BREE 2012). Thus the additional capacity in recent years would have been committed prior to the more recent price volatility as would much of that currently under construction. This further reinforces the conclusion that wholesale prices are not providing the signals for investment in base-load or peaking capacity as suggested by policymakers.
Price volatility, according to conventional economic theory which underpins the policy framework of Australia’s NEM, is supposed to reflect scarcity i.e. supply being unable to meet demand. Therefore the recent volatility should be an indicator of a shortage of supply. Australia electricity consumption grew by more than 25 per cent from the commencement of the NEM in late 1998 to 2012 and is forecast to grow, albeit at a slightly lower rate, by around 17 per cent over the next ten years (AEMO 2012c; ESAA 2012). Maximum (peak) demand compared to average demand has been generally growing at a much more rapid rate reflecting a marked uptake in appliances such as clothes dryers and air-conditioning.
The Australian Electricity Market Operator (as did its predecessor) releases 10-year projections of the adequacy of generation plants and transmission networks to meet the forecast demand for electricity.11 The projections in 2007 pointed to a high probability of a shortage of generation capacity, assuming extreme temperature conditions, by 2009-10 in Queensland, 2010-11 in Victoria and South Australia, and 2013-14 in NSW (NEMMCO 2007). Relative greater wholesale price volatility is evident during these years (refer Figures 1 and 2) yet these constraints were not realised.
Subsequent AEMO projections have progressively lengthened the timelines for expected supply constraints, in all NEM regions, in light of additions to available generation capacity and revised assumptions about future average and maximum electricity demand levels. During each of the last three years, the 10-year electricity demand forecasts have been significantly revised downwards. Current projections point to supply constraints not being present before 2018-19 and then only in Victoria (AEMO 2012c).
The foregoing discussion has shown that the NEM’s price volatility is not linked to supply constraints and is not signalling the need for investment but is more likely attributable to market power. Notably, recent wholesale electricity price volatility coincides with a period of policy uncertainty about the pricing of carbon (Chester 2011). Nearly 90 per cent of Australian electricity is generated by fossil fuels (68 per cent coal, 19 per cent gas, and 1 per cent oil) which contributes nearly 40 per cent to Australia’s greenhouse gas emissions (Stark, Penny and Feng 2012; Garnaut 2008). In 2007, prior to winning government, the Federal Opposition announced its intention of implementing a carbon pricing scheme. A White Paper was released in 2008 for a scheme to be implemented mid-2010. However, the Senate’s refusal to pass the legislation led to the Federal Government abandoning the scheme. In mid-2011, it was announced that a carbon tax would apply from 1 July 2012 to be followed by a trading scheme in 2015 (Prime Minister of Australia 2011).
4 The role and trading of electricity derivatives
The scale and scope of derivatives has exploded in recent years. Derivatives, as financial instruments with a cash flow derived from some underlying asset, were once limited to a narrow range of physical commodities such as corn and gold. Since the 1970s, however,
11
The National Electricity Market Management Company (NEMMCO) was established in 1996 to administer and manage the NEM. Its roles and responsibilities were incorporated into the AEMO which was established in July 2009.
11
derivatives have been developed for “just about everything conceivable” (Pirrong 2009) including the weather, electricity and most recently, carbon. Apart from swaps, these financial contracts take many other forms (e.g. caps, floors, collars, swaptions, Asian options, futures) varying in complexity but all based around an agreed contract price in relation to the expected future wholesale spot price. Over-the-counter (OTC), or bilateral, derivatives are the most commonly traded form i.e. a financial contract between two parties. Futures are a type of derivative contract traded on an exchange.
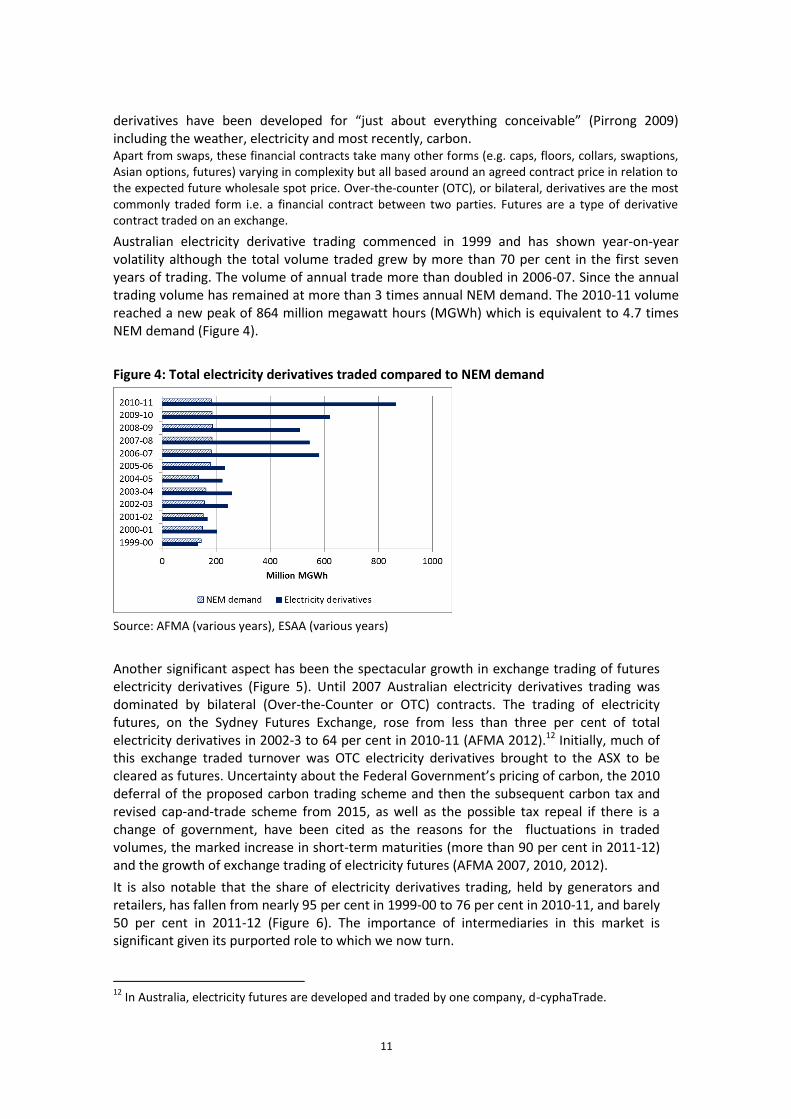
Australian electricity derivative trading commenced in 1999 and has shown year-on-year volatility although the total volume traded grew by more than 70 per cent in the first seven years of trading. The volume of annual trade more than doubled in 2006-07. Since the annual trading volume has remained at more than 3 times annual NEM demand. The 2010-11 volume reached a new peak of 864 million megawatt hours (MGWh) which is equivalent to 4.7 times NEM demand (Figure 4).
Figure 4: Total electricity derivatives traded compared to NEM demand
Source: AFMA (various years), ESAA (various years)
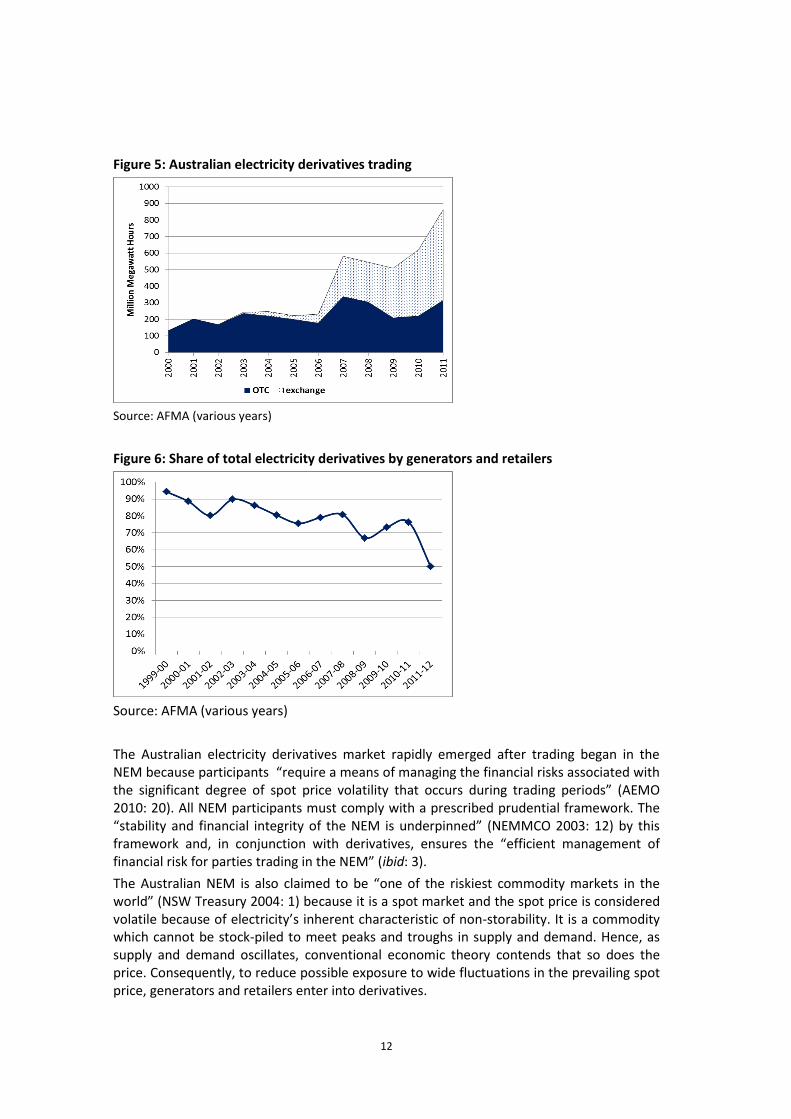
Another significant aspect has been the spectacular growth in exchange trading of futures electricity derivatives (Figure 5). Until 2007 Australian electricity derivatives trading was dominated by bilateral (Over-the-Counter or OTC) contracts. The trading of electricity futures, on the Sydney Futures Exchange, rose from less than three per cent of total electricity derivatives in 2002-3 to 64 per cent in 2010-11 (AFMA 2012).12 Initially, much of this exchange traded turnover was OTC electricity derivatives brought to the ASX to be cleared as futures. Uncertainty about the Federal Government’s pricing of carbon, the 2010 deferral of the proposed carbon trading scheme and then the subsequent carbon tax and revised cap-and-trade scheme from 2015, as well as the possible tax repeal if there is a change of government, have been cited as the reasons for the fluctuations in traded volumes, the marked increase in short-term maturities (more than 90 per cent in 2011-12) and the growth of exchange trading of electricity futures (AFMA 2007, 2010, 2012).
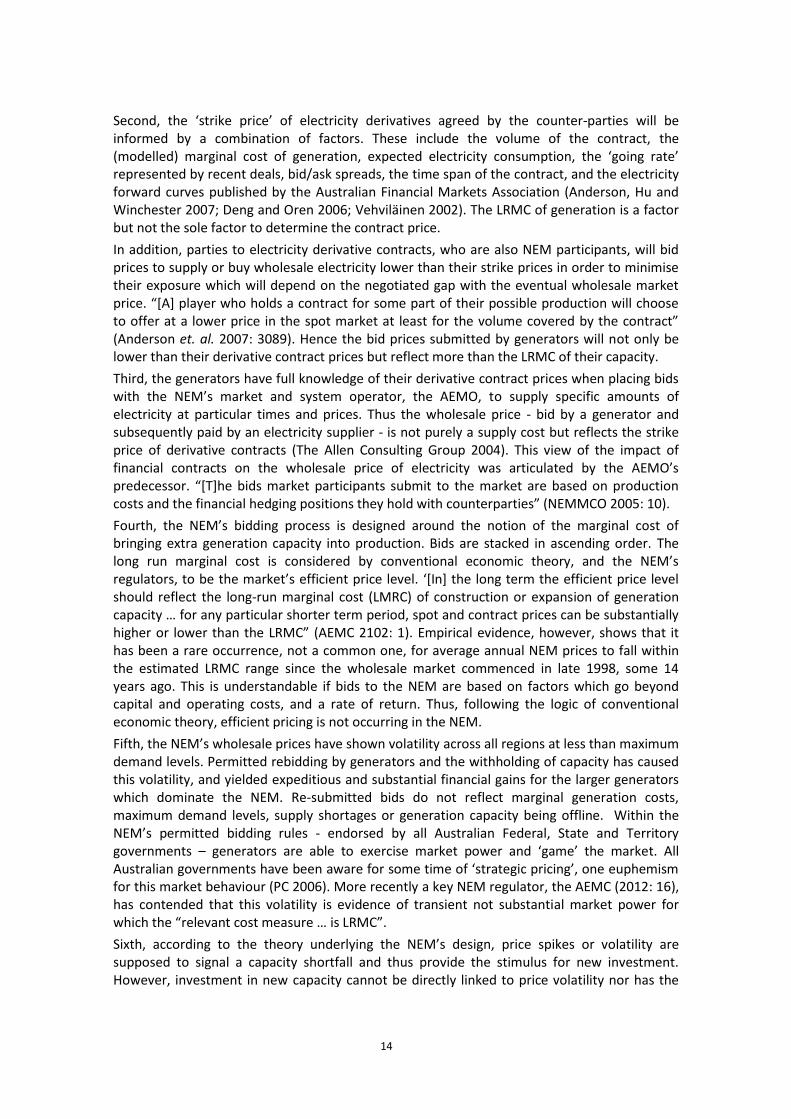
It is also notable that the share of electricity derivatives trading, held by generators and retailers, has fallen from nearly 95 per cent in 1999-00 to 76 per cent in 2010-11, and barely 50 per cent in 2011-12 (Figure 6). The importance of intermediaries in this market is significant given its purported role to which we now turn.
12
In Australia, electricity futures are developed and traded by one company, d-cyphaTrade.
12
Figure 5: Australian electricity derivatives trading
Source: AFMA (various years)
Figure 6: Share of total electricity derivatives by generators and retailers
Source: AFMA (various years)
The Australian electricity derivatives market rapidly emerged after trading began in the NEM because participants “require a means of managing the financial risks associated with the significant degree of spot price volatility that occurs during trading periods” (AEMO 2010: 20). All NEM participants must comply with a prescribed prudential framework. The “stability and financial integrity of the NEM is underpinned” (NEMMCO 2003: 12) by this framework and, in conjunction with derivatives, ensures the “efficient management of financial risk for parties trading in the NEM” (ibid: 3).
The Australian NEM is also claimed to be “one of the riskiest commodity markets in the world” (NSW Treasury 2004: 1) because it is a spot market and the spot price is considered volatile because of electricity’s inherent characteristic of non-storability. It is a commodity which cannot be stock-piled to meet peaks and troughs in supply and demand. Hence, as supply and demand oscillates, conventional economic theory contends that so does the price. Consequently, to reduce possible exposure to wide fluctuations in the prevailing spot price, generators and retailers enter into derivatives.

13
The primary objective of using derivatives is to lock in the future price of electricity that will be supplied or purchased. The value these financial contracts is derived from the trading of rights to a specific quantity of electricity. Under the basic form of these contracts, the parties agree to make payments against a future spot price for a notional amount of electricity. For example, under a ‘two way hedge’ or ‘swap’, the seller agrees to pay the buyer (or receive from the buyer) the difference between the agreed contract price, the ‘strike price’, and an agreed future spot price if this is above or below the agreed contract price. Fundamentally, the parties agree to ‘swap’ spot prices for an agreed fixed price (AEMO 2010: 20; Tham, Outhred and MacGill 2004). Ultimately, the extent of exposure depends on the negotiated gap with the eventual market price.
Generators and retailers fundamentally agree to make payments to each other according to the difference between the contract and spot prices for a notional amount of electricity, which means that each party takes a view about future spot prices. The generally accepted view is that the prices of Australian electricity derivative contracts reflect expectations about future NEM prices (d-cyphaTrade 2005; Tham, Outhred et al. 2004).
5 Dissecting the pricing labyrinth
The foregoing discussion has illuminated the complexity which surrounds wholesale electricity price formation as evidenced by the Australian NEM. The discussion has also foreshadowed a number of inconsistencies between the price formation in contemporary electricity markets with conventional economic theory which underpins the public policies used to create and manage these markets. This section unravels this complexity to provide a more coherent understanding of the drivers of wholesale electricity price formation along with the contradictions and inconsistencies inherent to the policy framework which supports the Australian NEM. Ten critical, although not necessarily mutually exclusive, aspects are identifiable.
First, it has been shown that trading in electricity derivatives is of much greater magnitude than that in the underlying asset. The NEM’s demand for electricity in 2010-11 was equivalent to 21 per cent of the trade in electricity derivatives. Conventional economic theory views derivatives markets as ‘deepening’ markets to underscore the price of the underlying asset. The efficient markets hypothesis, broadly speaking, tells us that the prices generated by financial markets represent the best possible estimate of the value of the underlying asset.
The COAG Energy Market Review (2002: 28, emphasis added) stated:
[W]ith all electricity required to be offered into the pool every five minutes and settled at half hourly intervals, the financial contract market is the only way for sellers or buyers of electricity to agree on the price to be paid for the product. It was always intended that the overwhelming majority of electricity would effectively be sold via the financial contracts market, rather than the pool. A liquid and deep financial contracts market allows market participants to continually adjust their positions. This reduces risk … (COAG Energy Market Review, 2002: 28, emphasis added).
In other words, electricity derivatives trading will determine the actual price for wholesale electricity and “act as a medium for price discovery” (NERA 2007: 88). Thus the wholesale electricity price – the NEM price set by the AEMO - is based on prices agreed by NEM participants operating in a parallel market. The wholesale price is not formed within the context of supply and demand for a commodity in a single market, as conventional economic textbooks overwhelmingly suggest (e.g. Stigler 2005).
14
Second, the ‘strike price’ of electricity derivatives agreed by the counter-parties will be informed by a combination of factors. These include the volume of the contract, the (modelled) marginal cost of generation, expected electricity consumption, the ‘going rate’ represented by recent deals, bid/ask spreads, the time span of the contract, and the electricity forward curves published by the Australian Financial Markets Association (Anderson, Hu and Winchester 2007; Deng and Oren 2006; Vehviläinen 2002). The LRMC of generation is a factor but not the sole factor to determine the contract price.
In addition, parties to electricity derivative contracts, who are also NEM participants, will bid prices to supply or buy wholesale electricity lower than their strike prices in order to minimise their exposure which will depend on the negotiated gap with the eventual wholesale market price. “[A] player who holds a contract for some part of their possible production will choose to offer at a lower price in the spot market at least for the volume covered by the contract” (Anderson et. al. 2007: 3089). Hence the bid prices submitted by generators will not only be lower than their derivative contract prices but reflect more than the LRMC of their capacity.
Third, the generators have full knowledge of their derivative contract prices when placing bids with the NEM’s market and system operator, the AEMO, to supply specific amounts of electricity at particular times and prices. Thus the wholesale price - bid by a generator and subsequently paid by an electricity supplier - is not purely a supply cost but reflects the strike price of derivative contracts (The Allen Consulting Group 2004). This view of the impact of financial contracts on the wholesale price of electricity was articulated by the AEMO’s predecessor. “[T]he bids market participants submit to the market are based on production costs and the financial hedging positions they hold with counterparties” (NEMMCO 2005: 10).
Fourth, the NEM’s bidding process is designed around the notion of the marginal cost of bringing extra generation capacity into production. Bids are stacked in ascending order. The long run marginal cost is considered by conventional economic theory, and the NEM’s regulators, to be the market’s efficient price level. ‘[In] the long term the efficient price level should reflect the long-run marginal cost (LMRC) of construction or expansion of generation capacity … for any particular shorter term period, spot and contract prices can be substantially higher or lower than the LRMC” (AEMC 2102: 1). Empirical evidence, however, shows that it has been a rare occurrence, not a common one, for average annual NEM prices to fall within the estimated LRMC range since the wholesale market commenced in late 1998, some 14 years ago. This is understandable if bids to the NEM are based on factors which go beyond capital and operating costs, and a rate of return. Thus, following the logic of conventional economic theory, efficient pricing is not occurring in the NEM.
Fifth, the NEM’s wholesale prices have shown volatility across all regions at less than maximum demand levels. Permitted rebidding by generators and the withholding of capacity has caused this volatility, and yielded expeditious and substantial financial gains for the larger generators which dominate the NEM. Re-submitted bids do not reflect marginal generation costs, maximum demand levels, supply shortages or generation capacity being offline. Within the NEM’s permitted bidding rules - endorsed by all Australian Federal, State and Territory governments – generators are able to exercise market power and ‘game’ the market. All Australian governments have been aware for some time of ‘strategic pricing’, one euphemism for this market behaviour (PC 2006). More recently a key NEM regulator, the AEMC (2012: 16), has contended that this volatility is evidence of transient not substantial market power for which the “relevant cost measure … is LRMC”.
Sixth, according to the theory underlying the NEM’s design, price spikes or volatility are supposed to signal a capacity shortfall and thus provide the stimulus for new investment. However, investment in new capacity cannot be directly linked to price volatility nor has the
15
volatility reflected a shortage of capacity. NEM wholesale prices are not providing the so-called market signals for new investment.
Seven, the electricity derivatives market is intended to manage the risk of trading price volatility caused by a shortage of supply. Paradoxically the NEM’s price volatility is being created by its own participants, generation companies - the majority of which are currently owned by State governments - seeking above-normal profits. Thus NEM participants need to actively engage in hedging strategies to manage trading price volatility created by dominant market players not the market adjusting to an equilibrium position.
Eight, Australia’s restructured electricity sector has a wholesale trading market designed around conventional economic theory’s notion of a perfectly competitive market with many buyers and sellers, no price-setting strategies, optimal quantities being produced at the lowest possible cost, and firms earning ‘normal profits’ by producing output where marginal cost equals marginal revenue (i.e. the market price). Firms in this rarely found (according to many conventional economic textbooks) market are regarded as price-takers – not price-setters - never needing to review their price schedules and their prices change continually in response to shifts in demand and supply. The reality is very different. NEM generation companies are price-makers rather than the price-takers. NEM prices are in fact ‘sticky’ being based on bids by generation companies which are constantly reviewed and may be re-bid, consistent with the findings of Blinder, Canetti, Lebow and Rudd (1998). costs are, in turn, determined by the expectations held by the contracting parties (including generation companies) about future NEM prices and the information available to each buyer and seller constructs those expectations
Nine, trade in bilateral electricity derivatives, dominant in Australia until recently, limits the accessibility of pricing information. There is little information available about the prices ‘struck’ for bilateral (OTC) derivative contracts because such details invariably remain confidential between the parties. Although the amount of information about potential future NEM prices has risen with the growth in exchange trading of electricity futures, there is little price information available for periods exceeding three years (NERA 2007). These outcomes contradict the efficient markets hypothesis of conventional economics which asserts financial markets are ‘informationally efficient’ i.e. prices on traded assets reflect all known information and thus reflect the collective expectations of market participants (Malkeil 2003). Ten, the Australian NEM is one of the few purely cash settled electricity markets which enables participants such as banks and hedge funds to buy and sell electricity derivatives without the need to own electricity generation assets. With the growth of electricity derivatives, the trading share held by generators and retailers has fallen to barely 50 per cent in 2011-12. This declining share parallels the growth of exchange traded electricity futures and the growing re-integration of generation and retailing companies which provides a natural hedge cover. Most importantly, this means that intermediaries – not owners of generation capacity - have emerged as key players in the formation of wholesale electricity prices.
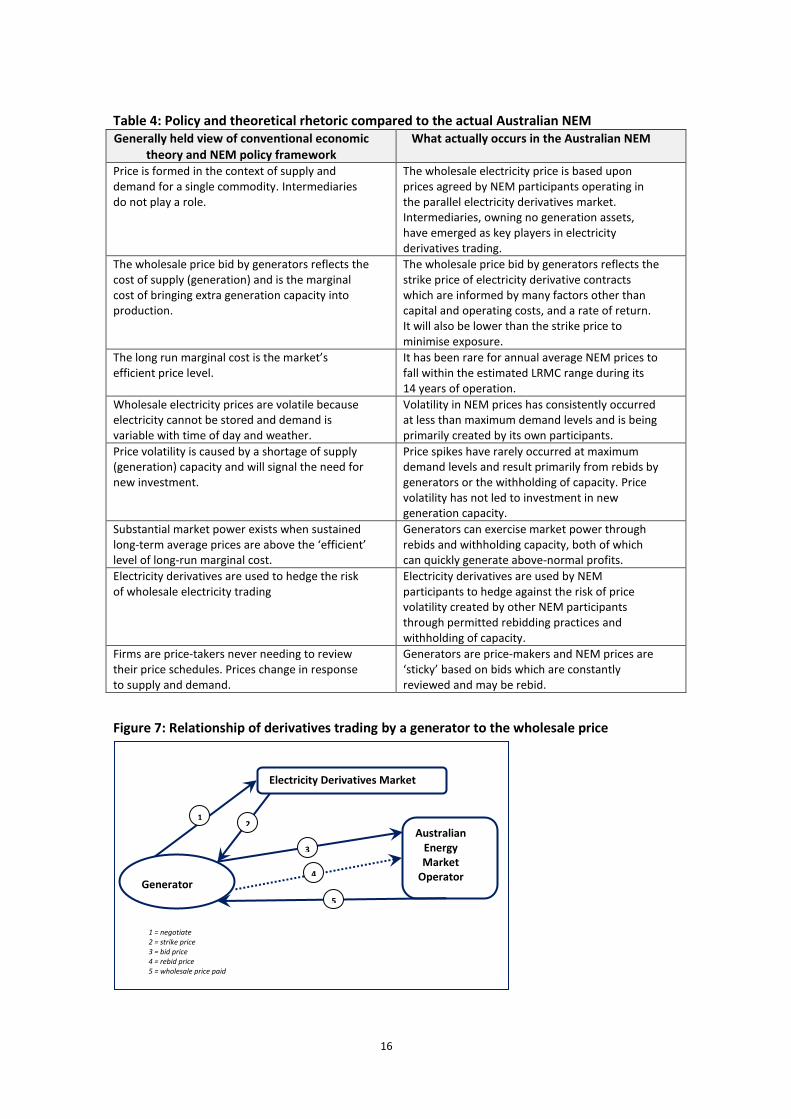
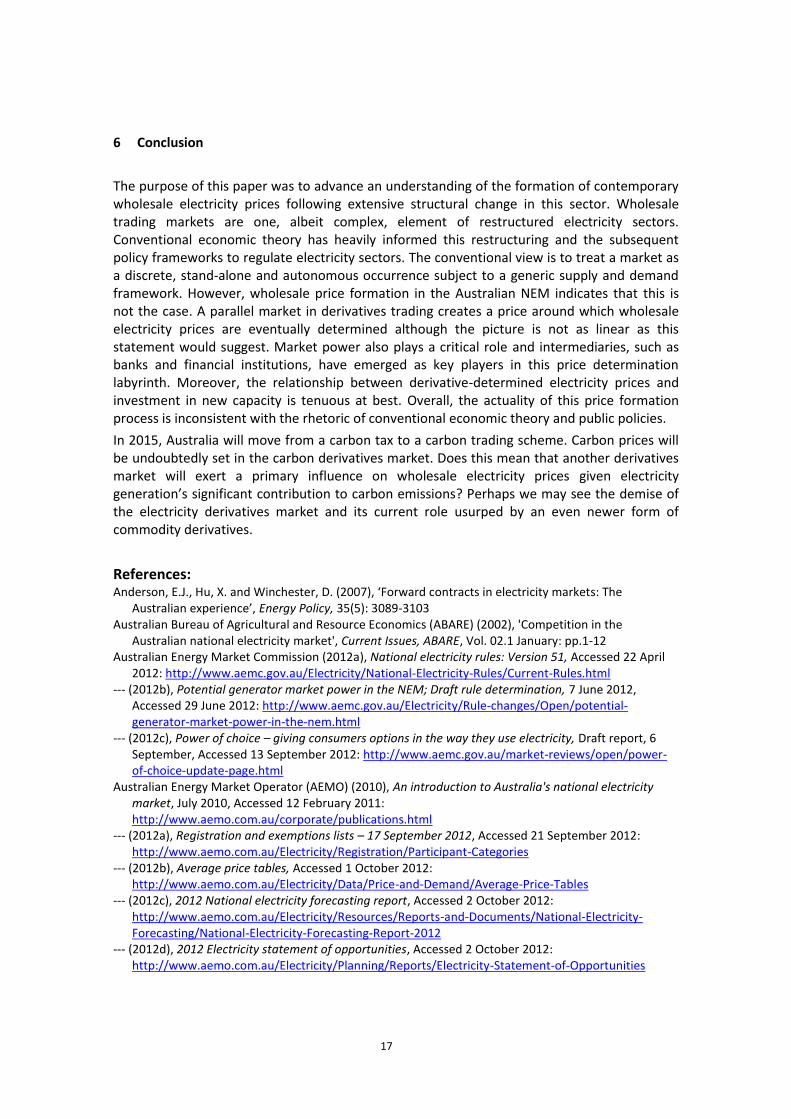
Table 4 provides a synthesis of the core inconsistencies and contradictions of the NEM’s policy framework and the actuality of the market’s outcomes particularly with respect to wholesale price formation. A simplified depiction of the relationship between derivatives trading by a generator and the wholesale price is presented in Figure 7.
16
Table 4: Policy and theoretical rhetoric compared to the actual Australian NEM Generally held view of conventional economic
theory and NEM policy framework What actually occurs in the Australian NEM
Price is formed in the context of supply and demand for a single commodity. Intermediaries do not play a role.
The wholesale electricity price is based upon prices agreed by NEM participants operating in the parallel electricity derivatives market. Intermediaries, owning no generation assets, have emerged as key players in electricity derivatives trading.
The wholesale price bid by generators reflects the cost of supply (generation) and is the marginal cost of bringing extra generation capacity into production.
The wholesale price bid by generators reflects the strike price of electricity derivative contracts which are informed by many factors other than capital and operating costs, and a rate of return. It will also be lower than the strike price to minimise exposure.
The long run marginal cost is the market’s efficient price level.
It has been rare for annual average NEM prices to fall within the estimated LRMC range during its 14 years of operation.
Wholesale electricity prices are volatile because electricity cannot be stored and demand is variable with time of day and weather.
Volatility in NEM prices has consistently occurred at less than maximum demand levels and is being primarily created by its own participants.
Price volatility is caused by a shortage of supply (generation) capacity and will signal the need for new investment.
Price spikes have rarely occurred at maximum demand levels and result primarily from rebids by generators or the withholding of capacity. Price volatility has not led to investment in new generation capacity.
Substantial market power exists when sustained long-term average prices are above the ‘efficient’ level of long-run marginal cost.
Generators can exercise market power through rebids and withholding capacity, both of which can quickly generate above-normal profits.
Electricity derivatives are used to hedge the risk of wholesale electricity trading
Electricity derivatives are used by NEM participants to hedge against the risk of price volatility created by other NEM participants through permitted rebidding practices and withholding of capacity.
Firms are price-takers never needing to review their price schedules. Prices change in response to supply and demand.
Generators are price-makers and NEM prices are ‘sticky’ based on bids which are constantly reviewed and may be rebid.
Figure 7: Relationship of derivatives trading by a generator to the wholesale price
Electricity Derivatives Market
Australian Energy Market
Operator
1 2
4
3
Generator
5
1 = negotiate 2 = strike price 3 = bid price 4 = rebid price 5 = wholesale price paid
17
6 Conclusion
The purpose of this paper was to advance an understanding of the formation of contemporary wholesale electricity prices following extensive structural change in this sector. Wholesale trading markets are one, albeit complex, element of restructured electricity sectors. Conventional economic theory has heavily informed this restructuring and the subsequent policy frameworks to regulate electricity sectors. The conventional view is to treat a market as a discrete, stand-alone and autonomous occurrence subject to a generic supply and demand framework. However, wholesale price formation in the Australian NEM indicates that this is not the case. A parallel market in derivatives trading creates a price around which wholesale electricity prices are eventually determined although the picture is not as linear as this statement would suggest. Market power also plays a critical role and intermediaries, such as banks and financial institutions, have emerged as key players in this price determination labyrinth. Moreover, the relationship between derivative-determined electricity prices and investment in new capacity is tenuous at best. Overall, the actuality of this price formation process is inconsistent with the rhetoric of conventional economic theory and public policies.
In 2015, Australia will move from a carbon tax to a carbon trading scheme. Carbon prices will be undoubtedly set in the carbon derivatives market. Does this mean that another derivatives market will exert a primary influence on wholesale electricity prices given electricity generation’s significant contribution to carbon emissions? Perhaps we may see the demise of the electricity derivatives market and its current role usurped by an even newer form of commodity derivatives.
References: Anderson, E.J., Hu, X. and Winchester, D. (2007), ‘Forward contracts in electricity markets: The
Australian experience’, Energy Policy, 35(5): 3089-3103 Australian Bureau of Agricultural and Resource Economics (ABARE) (2002), 'Competition in the
Australian national electricity market', Current Issues, ABARE, Vol. 02.1 January: pp.1-12 Australian Energy Market Commission (2012a), National electricity rules: Version 51, Accessed 22 April
2012: http://www.aemc.gov.au/Electricity/National-Electricity-Rules/Current-Rules.html --- (2012b), Potential generator market power in the NEM; Draft rule determination, 7 June 2012,
Accessed 29 June 2012: http://www.aemc.gov.au/Electricity/Rule-changes/Open/potential-generator-market-power-in-the-nem.html
--- (2012c), Power of choice – giving consumers options in the way they use electricity, Draft report, 6 September, Accessed 13 September 2012: http://www.aemc.gov.au/market-reviews/open/power-of-choice-update-page.html
Australian Energy Market Operator (AEMO) (2010), An introduction to Australia's national electricity market, July 2010, Accessed 12 February 2011: http://www.aemo.com.au/corporate/publications.html
--- (2012a), Registration and exemptions lists – 17 September 2012, Accessed 21 September 2012: http://www.aemo.com.au/Electricity/Registration/Participant-Categories
--- (2012b), Average price tables, Accessed 1 October 2012: http://www.aemo.com.au/Electricity/Data/Price-and-Demand/Average-Price-Tables
--- (2012c), 2012 National electricity forecasting report, Accessed 2 October 2012: http://www.aemo.com.au/Electricity/Resources/Reports-and-Documents/National-Electricity-Forecasting/National-Electricity-Forecasting-Report-2012
--- (2012d), 2012 Electricity statement of opportunities, Accessed 2 October 2012: http://www.aemo.com.au/Electricity/Planning/Reports/Electricity-Statement-of-Opportunities
18
Australian Energy Regulator (2011), State of the energy market 2011, Accessed 7 January 2012: http://www.aer.gov.au/node/6311
Australian Financial Markets Association (AFMA) (various years), Australian financial markets report, AFMA, AXISS Australia and ASX, Sydney
Australian Government (2004), Securing Australia's energy future, Canberra: Department of Prime Minister and Cabinet
Bardak Ventures (2005), The effect of industry structure on generation competition and end-user prices in the national electricity market, Report prepared for the Energy Users Association of Australia, the Energy Action Group, the Energy Markets Reform Forum, the Electricity Consumers Coalition of South Australia and the Energy Users Coalition of Victoria, Bowman Queensland: Bardak Ventures Pty Ltd
Bureau of Resources and Energy Economics (2012), Australian energy technology assessment, Accessed 24 August 2012: http://www.bree.gov.au/publications/aeta.html
Blinder, A.S., Canetti, E., Lebow, D. and Rudd, J.B. (1998), Asking about prices: A new approach to understanding price stickiness’, New York: Russell Sage Foundation
Booth, R.R. (2002), A submission to the COAG energy market review, Bardak Ventures Pty Ltd, Bowman, Queensland, 2 April.
Chester, L. (2007), What are the outcomes and who benefits from the restructuring of the Australian electricity sector? Unpublished PhD thesis, University of New South Wales. Available at: http://www.library.unsw.edu.au/~thesis/adt-NUN/public/adt-NUN20071017.113919/
--- (2008), ‘The parlous investment environment for Australian electricity generation and transmission’, IAEE Energy Forum, Second quarter, pp. 29-35
--- (2010), ‘Understanding the socio-economic impact of actually existing markets: An analytical framework for empirical research’, Association for Heterodox Economics: 12
th Annual Conference,
Université de Bordeaux, France, 7-10 July 2010 --- (2011), ‘An inevitable or avertable energy crisis?’, in Argyrous, G. and Stilwell, F. (eds), Readings in
Political Economy: Economics as a Social Science, 3rd
edition, Prahran: Tilde University Press, pp. 299-306
Chester, L. and Morris, A. (2011), ‘A new form of energy poverty is the hallmark of liberalised energy sectors’, Australian Journal of Social Issues, 46(4): 435-59
Chester, L. and Rosewarne, S. (2011), ‘What is the relationship between derivative markets and carbon prices?’, Paper presented to the Nature™ Inc? Questioning the Market Panacea in Environmental Policy and Conservation Conference, The Hague, 30 June – 2 July 2011
Council of Australian Governments (COAG) Energy Market Review, (2002), Towards a truly national and efficient energy market, AusInfo, Canberra, Final report (W. Parer, Chairman), 20 December
d-cyphaTrade (2005), 'Wholesale electricity price index', d-cyphaTrade, Accessed 21 November 2005: http://d-cyphatrade.com.au/products/wholesale_electricity_price_i
Deng, S.J. and Oren S.S. (2006), ‘Electricity derivatives and risk management’, Energy, 31(6-7): 940-953 Energy Supply Association of Australia (various years), Electricity Gas Australia, Melbourne: ESAA Garnaut, R. (2008), The Garnaut climate change review, Melbourne: Cambridge University Press International Energy Agency (2005), Energy policies of IEA countries: Australia 2005 review, Paris:
OECD/IEA Joskow, P. L. (2003), The difficult transition to competitive markets in the U.S., University of Cambridge
(Mass) and Cambridge-MIT Institute, Cambridge Working Papers in Economics/CMI Working Paper, CWPE 0328/CMI 28, May
Malkiel, B.G. (2003), ‘The efficient market hypothesis and its critics’, CEPS Working Paper No. 91, April 2003, Accessed 3 April 2011: http://www.princeton.edu/~ceps/workingpapers/91malkiel.pdf
National Electricity Market Management Company (NEMMCO) (2003), 'Financial risk management', NEMMCO, Accessed 15 May 2005: http://www.nemmco.com.au/publications/whitebook/financial.htm
--- (2005), Wholesale market operation, NEMMCO, Melbourne, Executive briefing --- (2007), Statement of opportunities 2007, Melbourne: NEMMCO, October. NERA Economic Consulting (2007), The wholesale electricity market in Australia: A report to the
Australian Energy Market Commission, Sydney: NERA Economic Consulting, June --- (2012), Benchmarking NEM wholesale prices against estimates of long run marginal cost: A report for
19
the AEMC, NERA Economic Consulting, 12 April Newbery, D.L. (2002), Issues and options for restructuring electricity supply industries, University of
Cambridge (Mass) and Cambridge-MIT Institute, DAE-CMI Working Paper (Cambridge-MIT Electricity Project), 0210
NSW Treasury (2004), A risk management proposal for New South Wales' electricity businesses, Research and information paper, TRP 04-1, Sydney: New South Wales Treasury
Pirrong, C. (2009), Market oversight for cap-and-trade: Efficiently regulating the carbon derivatives market, The Brookings Energy Security Initiative, Policy Brief 09-04
Prime Minister of Australia (2011), ‘Putting a price on carbon pollution’, Media Release, Accessed 10 July 2011: http://www.pm.gov.au/press-office/putting-price-carbon-pollution
Productivity Commission (PC) (2005), Modelling impacts of infrastructure industry change over the 1990s: Supplement to review of national competition policy reforms, Productivity Commission, Canberra, Productivity Commission Inquiry Report No.33, February
--- (2006), Potential benefits of the national reform agenda, Report to the Council of Australian Governments, Canberra, Productivity Commission Research Paper.
--- (2012), Electricity network regulatory frameworks, Draft Report, Volumes 1 and 2, Canberra Senate Select Committee on Electricity Prices (2012), Reducing energy bills and improving efficiency,
November 2012, Accessed 1 November 2012: http://www.aph.gov.au/Parliamentary_Business/Committees/Senate_Committees?url=electricityprices_ctte/electricityprices/report/index.htm
Sims, R. (2012), ‘Addressing the key drivers of electricity price increases’, Speech to the Annual Conference of the Energy Users Association of Australia, 24 October, Accessed 24 October 2012: http://www.accc.gov.au/content/item.phtml?itemId=1086424&nodeId=ee1b581adb25660dd4a51e014829ac49&fn=Addressing%20the%20key%20drivers%20of%20%20electricity%20price%20increases.pdf
Stigler, G. (2005), The theory of price, 4th
edition, Prentice Hall: New Delhi Stark, C., Penney, K. and Feng, A. (2012), 2012 Australian energy update, Bureau of Resource and Energy
Economics, Canberra, July Tham, P.W., Outhred, H.R. and MacGill, I.F. (2004), ‘Derivative markets in the Australian NEM: Roles and
issues’, Paper presented to Australasian Universities Power Engineering Conference 26-29 September 2004, Brisbane
The Allen Consulting Group (2004), Final report: Energy wholesale price study, Report to Essential Service Commission of South Australia, 13 September
Vehviläinen, I. (2002), ‘Basics of electricity derivative pricing in competitive markets’, Applied Mathematical Finance, 9(1): 45-60
20
Appendix A: NSW wholesale electricity prices
Figure A.1: Half-hourly NEM prices and demand, NSW, 2000
Figure A.2: Half-hourly NEM prices and demand, NSW, 2006
Figure A.3: Half-hourly NEM prices and demand, NSW, 2011
Source: AEMO (2012b)
Top Related
Copyright © 2022 FDOKUMEN

