


Bahasa
Halaman
Hukum


i
TITLE PAGE
INFLUENCE OF ENVIRONMENTAL FACTORS ON GROUNDWATER QUALITY IN
RURAL COMMUNITIES OF UDENU LOCAL GOVERNMENT AREA, OF ENUGU
STATE
BY
MAMAH, KINGSLEY IFEANYICHUKWU
B.Sc (U.N.N.)
PG/M.Sc/14/68415
A PROJECT SUBMITTED TO THE SCHOOL OF POSTGRADUATE STUDIES AND
THE DEPARTMENT OF GEOGRAPHY, UNIVERSITY OF NIGERIA, NSUKKA IN
PARTIAL FULFILMENT OF THE REQUIREMENT FOR THE AWARD OF MASTERS
OF SCIENCE DEGREE IN GEOGRAPHY (ENVIRONMENTAL MANAGEMENT)
DEPARTMENT OF GEOGRAPHY
DECEMBER, 2016

ii
CERTIFICATION
Mr. Mamah, Kingsley Ifeanyichukwu, a postgraduate student in the department of Geography,
specializing in Environmental management, has satisfactorily completed the requirement for the
course and research work for the award of the degree of Master of Science (M.Sc) in Geography
(Environmental Management). The work embodied in this thesis is original and has not been
submitted in part or full for any other Diploma or Degree of this or any other University.
…………………………………… ………………………………..
Dr. M.C. OBETA PROF. P.A. ODJUGO
(Supervisor) (External Examiner)
…………………………………..
PROF. P.O. PHIL-EZE
(Head, Department of Geography)
………………………………….
REV. FR.PROF.H.C. ACHUNIKE
(Dean, Faculty of Social Science)
DECEMBER, 2016

iii
DEDICATION
This work is dedicated to my beloved parents Mr. and Mrs. Pius Mamah and my lovely siblings

iv
TABLE OF CONTENTS
Title Page - - - - - - - - - - i
Certification - - - - - - - - - - ii
Dedication - - - - - - - - - - iii
Table of content - - - - - - - - - iv
Acknowledgement - - - - - - - - - vii
List of Tables - - - - - - - - - - viii
List of Figures - - - - - - - - - ix
List of Plates - - - - - - - - - - x
Abstract - - - - - - - - - - xi
CHAPTER ONE: INTRODUCTION
1.1 Background of the Study - - - - - - - 1
1.2 Statement of the Research Problem - - - - - - 5
1.3 Aim and Objectives of the Study - - - - - - 8
1.4 Study Area - - - - - - - - - 9
1.4.1 Location - - - - - - - - - 9
1.4.2 Geology - - - - - - - - - 11
1.4.3 Relief and Drainage - - - - - - - - 12
1.4.4 Climate - - - - - - - - - 13
1.4.5 Soil and Vegetation - - - - - - - - 14
1.4.6 Population and Socio-Economic Activities - - - - - 14
1.5 Literature Review - - - - - - - - 15
1.6 Conceptual Framework - - - - - - - 28
1.7 Research Hypotheses - - - - - - - 30
1.8 Research Methodology - - - - - - - 30
1.8.1 Reconnaissance Survey - - - - - - - 30
1.8.2 Selection of Communities Used in the Study - - - - 31
1.8.3 Selection of the Environmental Factors Used in the Study - - - 32
1.8.4 Mearsurement of the Environmental Factors Used in the Study - - 34
1.8.5 Water Sample Collection - - - - - - - 38

v
1.8.6 Description of Sampled sites - - - - - - - 39
1.8.7 Water Sample Preservation - - - - - - - 41
1.8.8 Choice of Water Quality Parameters - - - - - - 41
1.8.9 Laboratory Analysis - - - - - - - - 42
1.8.10 In-Situ Analysis of Groundwater Samples - - - - - 42
1.8.11 Water Quality Index (WQI) Analysis - - - - - 44
1.8.12 Oral Interview - - - - - - - - - 45
1.8.13 Secondary Data - - - - - - - - 46
1.8.14 Method of Data Analysis - - - - - - - 46
1.9 Plan of the Project - - - - - - - - 47
CHAPTERTWO: CHARACTERIZATION OF WELLS /BOREHOLES AND PATTERNS
OF USE IN THE STUDY AREA
2.1 Introduction - - - - - - - - 48
2.1.1 Wells - - - - - - - - - - 48
2.1.2 Boreholes - - - - - - - - - - 50
2.2 Water Use Patterns in the Sampled Communities - - - - 51
CHAPTER THREE: PHYSICO-CHEMICAL AND BACTERIOLOGICAL
CHARACTERISTICS OF GROUNDWATER IN THE STUDY AREA
3.1 Introduction - - - - - - - - - 54
3.1.1 pH - - - - - - - - - - 56
3.1.2 Temperature - - - - - - - - 56
3.1.3 Electrical Conductivity - - - - - - - 56
3.1.4 Turbidity - - - - - - - - - 56
3.1.5 Calcium - - - - - - - - - 57
3.1.6 Magnesium - - - - - - - - - 57
3.1.7 Iron - - - - - - - - - - 57
3.1.8 Chloride - - - - - - - - - 58
3.1.9 Nitrate - - - - - - - - - 58
3.1.10 Total Dissolved Solids - - - - - - - 58
3.1.11 Sulphate - - - - - - - - - 59

vi
3.1.12 Total Alkalinity - - - - - - - - 59
3.1.13 Total Hardness - - - - - - - - 59
3.1.14 Total Coliform - - - - - - - - 59
3.1.15 Escherichia Coli - - - - - - - - 60
3.2 Variations in Values of Analyzed Groundwater Quality Parameters between the upland
and the lowland Sections of the Study Area - - - - - 60
3.3 Summary and Spatial Variation of Water Quality Index of the Study Area - 63
3.4 Test of Significances in the Variations between Pollutant Concentrations in the Hand-dug
Well and Borehole Water Samples - - - - - - 65
CHAPTER FOUR: ANALYSIS OF THE INFULENCE OF ENVIRONMENTAL FACTORS ON
BOREHOLE AND WELL WATER QUALITY IN THE STUDY AREA
4.0 Introduction: - - - - - - - - - 68
4.1 Statistical Summary of Groundwater Parameters - - - - 68
4.2 Principal Component Analysis of the Environmental factors Affecting Borehole and Hand-
dug Well Water Quality in the Study Area - - - - 80
CHAPTER FIVE: PLANNING IMPLICATIONS OF THE FINDINGS AND OPTIONS FOR
IMPROVED HAND-DUG WELL/BOREHOLE WATER MANAGEMENT IN THE STUDY AREA
5.0 Policy Implications of the Findings - - - - - - 84
5.1 Options for Improved hand-dug well/borehole water management in the area 85
5.1.1 Control of Agricultural Inputs used on farms - - - - - 85
5.1.2 Sanitation around the hand-dug wells/borehole environments - - 86
5.1.3 Awareness Creation - - - - - - - - 87
5.1.4 Institutional Support Programme - - - - - - 87
5.1.5 Aquifer Classification - - - - - - - - 87
5.1.6 Remediation Strategy - - - - - - - - 88
5.1.7 Monitoring System - - - - - - - - 89
CHAPTER SIX: CONCLUSION, SUMMARY AND RECOMMENDATION
6.1 Summary of the Research Findings - - - - - - 90
6.2 Recommendations - - - - - - - - 92
6.3 Conclusion - - - - - - - - - 93
REFERENCES - - - - - - - - - 94
vii
ACKNOWLEDGEMENT
I wish to thank God who is the only source of hope, inspiration, knowledge, health and
wisdom. In my struggle to get this work to fruitful completion, you stood by me. I remain ever
grateful to you Lord. You are really God indeed.
I would like to use this opportunity to express my profound gratitude to my supervisor,
Dr.M.C. Obeta, for his guidance all through the writing of this work and for his fatherly advice,
necessary information, and disposition which was the key to the completion of this work.
My profound gratitude also goes to the whole academic staff of the department of
Geography UNN for their untiring effort in making me a complete academic being. You people
contributed immensely to this achievement.
I wish to thank all those who assisted me during my fieldwork. Notable among them are:
Mr. Onyekachi Edwin, Mr. Mamah Michael; and Mr. Ugwueze I.K of Enugu State Ministry of
Water Resources, Dr S. Onwuka of Geology department UNN, as well as all the entire staff of
Enugu state water corporation for all the necessary input and time. You people were awesome
throughout the period.
I owe my gratitude also to Mr. A.T Mozie who has been helpful to me. Your necessary
advice, disposition and encouragement kept me going during the course of writing this project. To
Dr.T.C Nzeadibe, you were always disposed and available whenever I called; may God reward
you abundantly.
Special recognition and gratitude go to my lovely parents: Mr. and Mrs. P.U. Mamah, for
their love, care and support. I could not have asked for better parents; you are the best and may
God fulfill your dreams and heart desires. Also, I cannot forget my lovely siblings: Chinenye,
Obiageri, Chizoba, Ogonna, Ifunanya and Chimuamanda who were always there to assist me;
worthy to mention too is my uncles and aunts; you are all dear to me. May God bless you all and
assist you too in time of your needs. I love you all.
To my good friends who contributed to my success, I remain indebted to you all. Most
notable are; Udenwagu Chiamaka, Ekwezuo Chukwudi and Ocheje Johnmark who gave me the
necessary assistance when I was writing this work. May God reward you all.
KINGSLEY IFEANYICHUKWU MAMAH
DECEMBER, 2016

viii
LIST OF TABLES
Table 1: List of Communities Used in the Study - - - - - 31
Table 2: Natural and Anthropogenic Environmental factors used in the study - 33
Table 3: Paramatization of Environmental factors - - - - - 37
Table 4: Sample Site Description - - - - - - - 40
Table 5: List of Parameters used in the Study - - - - - 41
Table 6: Summary Characteristics of the Sampled Hand-dug Wells in the area - 49
Table 7: Summary Characteristics of the Sampled Boreholes in the area - - 50
Table 8: Physico-Chemical and Bacteriological Characteristics of Groundwater Samples 55
Table 9: Weighted Arithmetic Index Level of Water Quality - - - 64
Table 10: Quality of Groundwater from Ten Rural Communities of Udenu LGA - 64
Table 11: Test of Significance in the Variations of Parameter Values - - 66
Table 12: Statistical Summary of Groundwater Parameters of the Upland Area - 68
Table 13: Statistical Summary of Groundwater Parameters of the Lowland Area - 71
Table 14: Reported Causes of Boreholes/Well water Contamination - - 75
Table 15: Factor loading after varimax rotation, eigen value, variability, and cumulative% of each
of the extracted components of environmental variables - - - - - 81

ix
LIST OF FIGURES
Figure 1: Nigeria Showing Enugu State - - - - - - 9
Figure 2: Enugu State Showing Udenu and other LGAs - - - - 10
Figure 3: Udenu LGA Showing the Communities - - - - - 11
Figure 4: Udenu LGA showing relief and drainage - - - - - 13
Figure 5: Conceptual Framework for Sustainable Rural Water Supply - - 30
Figure 6: Udenu LGA showing the sampled stations - - - - - 39
Figure 7: Percentage Variability of Groundwater use in Udenu LGA - - 53
Figure 8: Variations in pH of the water samples - - - - - 61
Figure 9: Variations in Temperature of the water samples - - - - 61
Figure 10: Variations in Electrical conductivity of the water samples - - 61
Figure 11: Variations in Iron of the water samples - - - - - 61
Figure 12: Variations in Turbidity of the water samples - - - - 61
Figure 13: Variations in Chloride of the water samples - - - - 61
Figure 14: Variations in Calcium of the water samples - - - - 62
Figure 15: Variations in Alkalinity of the water samples - - - - 62
Figure 16: Variations in Magnesium of the water samples - - - 62
Figure 17: Variations in Nitrate of the water samples - - - - 62
Figure 18: Variations in Total dissolved solids of the water samples - - 62
Figure 19: Variations in Sulphate of the water samples - - - - 62
Figure 20: Variations in Hardness of the water samples - - - - 62
Figure 21: Variations in Total coliform of the water samples - - - 63
Figure 22: Variations in Escherichia coli of the water samples - - - 63
Figure 23: Udenu LGA showing variations in groundwater quality distribution in the
study area - - - - - - - - - - - 65
Figure 24: Udenu LGA showing E-coli distribution in the sampled communities - 78
Figure 25: Udenu LGA showing pH concentration in the sampled communities - 78
Figure 26: Udenu LGA showing temperature concentration in the sampled communities 79
Figure 27: Udenu LGA showing magnesium concentration in the sampled communities 79
x
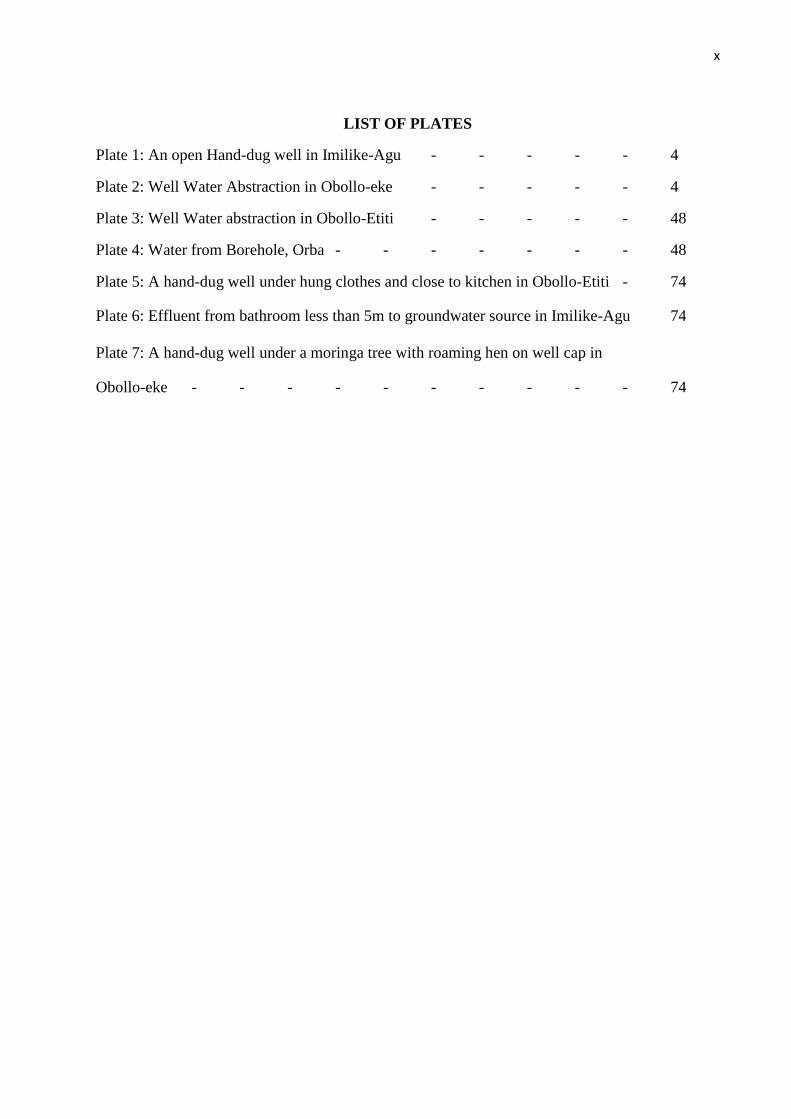
LIST OF PLATES
Plate 1: An open Hand-dug well in Imilike-Agu - - - - - 4
Plate 2: Well Water Abstraction in Obollo-eke - - - - - 4
Plate 3: Well Water abstraction in Obollo-Etiti - - - - - 48
Plate 4: Water from Borehole, Orba - - - - - - - 48
Plate 5: A hand-dug well under hung clothes and close to kitchen in Obollo-Etiti - 74
Plate 6: Effluent from bathroom less than 5m to groundwater source in Imilike-Agu 74
Plate 7: A hand-dug well under a moringa tree with roaming hen on well cap in
Obollo-eke - - - - - - - - - - 74

xi
ABSTRACT
The study examined the influence of environmental factors on groundwater water
quality in 10 rural communities of Udenu Local Government Area of Enugu State, Nigeria with
a view to securing information that may guide future efforts at improving water quality in the
study area. The objectives of the study were to; characterize the wells/boreholes and describe
the patterns of water uses in the area; determine and compare the physico-chemical and
microbiological characteristics of well and borehole water in the upper and lower sections of
the study area ; examine the environmental factors that affect the quality of groundwater in the
study area; examine planning implications of the findings and suggest management options to
minimize or eliminate groundwater contamination in the study area. Relevant data were sourced
through water sample analysis, field observation, oral interview as well as, from official gazette
of government and non-governmental organizations. Water samples were collected from
boreholes and wells in ten communities namely; Amalla, Umundu, Orba, Imilike-uno, Ezimo-
uno, Imilike-agu, Ezimo-agu, Obollo-eke, Obollo-etiti, and Ogboduaba and analyzed for: pH,
Temperature, Electrical conductivity, Turbidity, Nitrate, Iron, Total dissolved solids, Sulphate,
Alkalinity, Total hardness, Chloride, Calcium, Magnesium, Total coliform, and E.coli. The
analysis was carried out as prescribed in the standard method for examination of water. The
results of the laboratory analyses were evaluated against the WHO benchmarks for drinking
water quality. Findings show that pH, mg2+, nitrate, Fe2+, temp (oC) and E-coli are the
parameters that exceeded the WHO (2011) allowable limits for drinking water in the area. The
students’ t test result showed significant difference (p<0.05) in pH, EC, turbidity, calcium,
magnesium, nitrate, TDS, hardness, total coliform and E.coli in between water sample collected
from the upland and the lowland sections of the study area. Principal Component Analysis
(PCA) was applied to fourteen environmental variables identified to be influencing the quality
of groundwater under study. Five components were extracted from the PCA namely;
well/borehole protection, mineral properties in rocks, organic pollutants, unsanitary
surroundings and agricultural activities, which collectively were responsible for about 84.5% of
the total variance of the variables. The work recommends that understanding of environmental
characteristics is important if quality is to be guaranteed in the area. Proper construction of hand-
dug wells and boreholes, awareness creation among the water users and water monitoring are
necessary in protecting groundwater quality in the area.

1
CHAPTER ONE
INTRODUCTION
1.1 Background of the Study
Environmental factors, according to WHO (2006) refer to a variety of the natural and
human phenomenon found within the living space of both man and other organisms. Such factors
play decisive roles in determining the quality of air, water, soil and other elements on which man
and other living creatures subsist on, on the earth planet (Ajayi and Adesina, 2005). Envirnmental
factors which influence well and borehole water quality are known to fall into two broad categories,
namely, natural and anthropogenic. The natural environmental factors include, among others, the
atmosphere, plants, terrestrial surfaces, and the hydrosphere in their natural states; while the human
environmental factors comprise things that result from humans in their immediate or remote
surroundings and which interact with and/or impinge on live and on the earth planet (Okafor,
Hassan and Doyin-Hassan 2008).
Natural contamination resulting from environmental factors, such as carbonate rocks and
seepage, is difficult , if not impossible, to control (NWMQS, 1995). In contrast, human –induced
environmental factors which contaminate well and borehole water is usually the result of
carelessness, ignorance,or negligence (Wateraid, 2011). Causes of such contamination range from
improper disposal of household wastes, through over application of manure/chemical fertilisers,oil
spillage to the mishandling of wastes at industrial sites. The environment in its natural state consists
of complex elements of natural and cultural landscape (Ajayi and Adesina, 2005). These elements
need to be maintained in their purest forms in order to permit the existence and functional
relationship between them and the living things that subsist on their various spheres.
One of the natural compounds on the earth planet that is frequently influenced by
environmental factors is groundwater which consists of the waters in saturation zone of the earth

2
planet (WHO, 2006). Groundwater is sourced variously in the world and is used in varied ways to
solve the domestic, agricultural, industrial and other associated needs of man (WHO, 1993).
Groundwater exists beneath the surface of the earth in the spaces between particles of rock or soil
or in the crevices and cracks in rocks and plays fundamental roles in human existence (WHO,
2006; SGS, 2011). Groundwater has been termed the “hidden sea”- because of the large amount of
it and ‘hidden’ because it is not visible; thus pollution pathways and processes within it are not
readily perceived (Chapelle, 1997). It is the largest accessible store of freshwater on earth and it
has been estimated to account for 94% of all fresh water (Ayoade, 1988). It plays an important role
in providing water for people in rural and urban areas for various domestic activities like washing
of clothes, washing of plates, cooking, bathing, drinking, e.t.c ( UNEP, 2006)
Access to safe groundwater is vital component for health protection (Ezemonye, 2009).
The subsystems which make up the human body system run largely on water although the patterns
and proportions required to keep the body alive vary (Mozie, 2010). Water acts like lubricants,
helps protect tissues from external injury and gives flexibility to the muscles, tendons, cartilages
and bones (Chima and Digha, 2010). The body of an average man contains about 40 liters of water
while the grey matter of the brain is about 85% water (Grace, 2001). Water is the vehicle for the
dilution and movement of essential minerals salts in the body of animals.
In an ideal situation, water of good quality should be readily available for consumption by
every person and household (Umar and Yaro, 2009). In the same vein, the taps should run
continually such that water whenever it is needed can be accessed and utilized (Ezemonye, 2009).
For any water to be of consumable quality, it must attain a certain degree of purity. Governments
and other stakeholders in the water supply sector often commission studies to ascertain this fact.
For instance, Ganeshkumar and Jaideep (2011) in a work commissioned by the Telugu Water
Board assessed the groundwater quality of Taiml Nadu region in India using the Water Quality
Index (WQI) approach. Forty-four groundwater samples were collected from bore and tube wells.

3
The result of the study indicated that natural as well as anthropogenic sources are contaminating
the groundwater in the study area and that the groundwater samples are not suitable for drinking
purposes. This study revealed that 66% of groundwater sources during post monsoon season and
29% during summer season are not suitable for domestic purpose.
Groundwater, as shown by the above and other sources (USEPA, 1985; Ocheri, Odoma,
and Umar, 2014) is under threat from several environmental factors arising from either human life
style or by the low level of hygiene practiced in the developing nations (Ikem, Ximing and Sarah,
2012). Storm runoff and/or effluent discharges laden with particle pollutants, for instance, are
harmful to man and aquatic ecosystems (McMahon, 2010). Similarly, the garbage in a landfill can
create water pollution if rainwater, percolating through the garbage, absorbs toxins before it
sinks into the soil and contaminates the underlying groundwater to a shallower depth of about
33m in tropical environments with low level of metal accumulation within the soil (Hart, 2009).
Groundwater can also be contaminated by naturally occurring substances in the environment. The
chemistry of groundwater is largely the chemistry of the rocks in which it resides. Also, certain
metals within the rock strata can be leached by groundwater (which itself is chemically potent
solvent) into the reservoir and cause the quality of water to deteriorate.
The quality of groundwater, as revealed by the above narrative, can adversely be affected
by several environmental factors. Literature evidence shows that the quality of groundwater has
continued to degrade in different countries due to natural and human factors (Fetter, 2007).
Impaired water accounts for over 1.7 million deaths worldwide every year (i.e 3.1% of all deaths)
and 3.7% of all Disability-Adjusted Life Years (DALYs) (Ashbolt, 2004). Cech (2005) is of the
opinion that 1.1 billion people were still using water from unimproved sources in sub-Sahara Africa
and 42% of the population is still without potable water supply. Studies have also shown high
prevalence of water borne diseases such as cholera, diarrhea, dysentery, hepatitis, e.t.c among
Nigerians (Oguntoke Aboderin and Bankole 2009; Raji and Ibrahim, 2011). A recent survey by

4
Adeyinka, Wasiu, and Akintayo (2014) demonstrated the prevalence of common waterborne
diseases in some parts of Nigeria. Typhoid cases ranked highest among the water related diseases
recorded between 2002 and 2008 in Nigeria, followed by cholera, hepatitis and dracunculiasis.
Udenu LGA, our study area is endowed with groundwater resources (Ugwueze, 2015). This
endowed natural resource is used by the people for various purposes; washing of clothes, bathing,
cooking, drinking, irrigation of crops, building, or construction, industrial activities, and other
socio-economic activities such as car wash, laundry services etc. See plates 1 and 2.
Plate 1: An Open Well in Imilike-Agu Plate 2: Well water abstraction from Obollo-eke
Groundwater is an important source of potable water in the rural communities of the study
area where wells and boreholes are routinely dug to access it. Groundwater typically contains more
minerals in solution than surface water which may require treatment to soften the water by
removing minerals like Arsenic, iron, manganese, etc (Ocheri et al., 2014). However, rigorous
research is required to isolate and determine the concentration levels of the minerals contained in
such water and the problem(s) resulting from such minerals. This is necessary especially in rural
communities, like our study area, where the quality status and the unhealthy conditions which the
consumption of unsafe water may pose are largely unknown. Already some water-borne diseases
like, dysentery, cholera, typhoid, and diarrhea, have been observed every year in the study area
both in rainy and dry season. Against this background, this research seeks to examine the
environmental factors affecting the quality status of groundwater abstracted and consumed in the

5
study area and investigate the variations in the pollutants contamination between the upper and low
land sections of the study area.
1.2 Statement of the Research Problem
Environmental pollution is not something new in the world (Offiong, 2011). It existed in
human societies as early as the first century B.C when the drinking waters of Rome were
reported to be polluted (Ruff, 1993). Ever since then, problems of poor water quality arising from
environmental pollutants have continued to dominate different areas of scientific research up to
this 21st century. In the words of Breslin (2007), there are still at least over 1.2 billion people
across the world that do not have access to safe, clean drinking water. Many of these people live
in the rural areas and are among the poorest and the most vulnerable to be found anywhere in the
world. In sub-Saharan Africa alone, up to 300 million rural people have no access to safe water
supply (United Nations, 2000; MacDonald, Davis, Calow, and Chilton, 2005).
Contaminated groundwater when ingested, contributes to the spread of water-related diseases
amongst human beings and animals. The concern for the quality of water available to consumers
in the world today has drawn the attention of many researchers, academics, policy makers, scholars,
government and non-governmental organizations (Longe and Balogun, 2009). Previous studies on
the quality of water consumed in rural communities of Nigeria from scholars like; (Adekunle,
Adetunji, Gbadebo, and Banjoko 2007; Essien and Bassey, 2002), compared the quality status of
hand-dug wells or borehole water with the WHO drinking water standard in Igbora and Uyo,
Nigeria, and indicated that the quality of water from hand-dug wells and the boreholes were
polluted by human activities and were unsuitable for human consumption. Similarly, the work of
Adediji and Ajibade (2005), confirmed the unsuitability of well water for human consumption
when compared to W.H.O drinking water standard in Ede area of southwest Nigeria and identified
human activities as likely sources of pollutants to the groundwater. The work of Ocheri (2010),
examined the spatial distribution of iron across rural communities of Benue State and attributed

6
the variations in iron concentration to the geology of the area. Moreover, Omoboriowo et al.
(2012), observe that the groundwater in Arochukwu area of Afikpo Basin, were generally soft, free
from saltwater intrusion; low with iron constituents.
Olushola, Albert, and Aderonke (2014), observe that the groundwater problems in
Majidun-Ilaje rural community of Ikorodu west LGA of Lagos State was due to the pollution of
groundwater by pollutants from diverse source. Weli and Ogbonna (2015), examine the
relationship between water quality parameters and water borne diseases and the influence of depth
on four examined parameters: pH, magnesium, turbidity and total hardness in Emohua
Communities of Rivers State. Uzoije, Onunkwo, Ibeneme, and Obioha (2014), ascertain the
chemical constituents of deep and shallow aquifer waters in the rural areas of Nsukka and the
contributions of household, industrial and agricultural pollutants to its impaired quality. Similarly,
Onunkwo, Uzoije, Darlington, and Cosmos (2014), investigated the water quality status of
shallow and deep aquifers from the rural areas of Nsukka and discovered that while the aquifers
are highly polluted by iron, the shallow aquifers are polluted by pollutants which may have arisen
from human activities.
In many developing countries borehole and well water are frequently contaminated due to
the combination of environmental and human- related factors (Langan, 2009; Majuru, Michael
Mokoena, Jagals, and Hunter, 2011). One such human-related factor is the technology in use. A
large hole is drilled to a predetermined depth or to a confining formation (clay or bedrock, for
example) and a smaller hole for the well is completed from that point forward. Wells, in many,
poor, rural and backward communities are not typically cased from the surface down into the
smaller hole with a casing that are of the same diameter as that holes. The annular space between
the large hole and the smaller casing may not be filled with bentonite clay, concrete or other sealant
materials. This creates a permeable seal from the surface to the next confining layer and permits
contaminants to travel downwards along the side walls of the casing into the aquifer.

7
In addition, many wells are not capped or properly capped (see plate 1) with either an
engineered well cap or seal that vent air through a screen into the well. When wells are not properly
capped, then insects, small animals, refuse, sediments, and other forms of contaminants cannot be
prevented from accessing the well water. At the ‘mouth’ of well, based on construction, screening
devices, filter packs and slotted casings may not be fitted to prevent unwanted contaminants from
accessing the well water (USGS, 1991; Waller, 2013). In situations like these, environmental
contaminants, access, dissolve and contaminate well water and the aquifers (Adeoye, Adeolu, and
Ibrahim, 2013).
In our study area, clean, reliable and potable water availability still remain a challenge. The
population living in the rural communities, particularly at the upland section, is very dense. It is
not uncommon to notice that many households in the rural communities discharge their wastes
directly to the immediate surrounding without the standard pre-treatment which could negate their
effects on the nearby water sources. There is a near total dependence on groundwater (wells and
boreholes) in most of the communities largely due to absence of surface drainage (Ofomata, 1978).
The absence of surface drainage in many of the communities according to Ofomata (1978) is, due
to the fact that the underlying sandstones are highly permeable and pervious. Thus the groundwater
resource endowment of the area is high and this is massively exploited to meet the community
water needs. During the dry season when there is no more rain water to be harvested and all
seasonal streams dry up, every one turns to either wells or boreholes. These sources of water supply
exist in all the 13 autonomous communities within the local government area. Majority of the wells
are hand-dug, shallow; not cased and not capped with either an engineered well cap or seal (see
plate 3); impurities from the surface easily enter the wells and boreholes. Thus, the risk of
contamination of these water sources is very high.
In addition, other environmental factors, especially, those resulting from the land use
pattern of the area and attitudes of the people can easily contaminate these groundwater sources.

8
Also some of these water sources are located close to pit latrines; soak away, dumpsites and
agricultural farmlands. Some never considered the topographic nature of the environment before
digging their wells; as some were dug in down slope areas where runoff washed down impurities
from the highland areas can easily access the well water.
Given the fact that groundwater usage is ubiquitous in the study area; an effective
groundwater pollution control and sustainable water resources management in the area is necessary
to safeguard the health of the water users and/or tackle the challenges of water quality. These
require a lot of research work that can provide an in-depth understanding of the current
groundwater quality status and of the natural and anthropogenic factors influencing the
groundwater chemistry of the areas; which is currently lacking at present. This is necessary both
for planning purposes and to verify the concerns of the people about the deteriorating quality of
water they consume and its attendant consequences.
1.3 Aim and objectives of the Study
The aim of this study is to examine the environmental factors that influence the quality of
groundwater in the 13 autonomous rural communities of Udenu local government area of Enugu
State. To achieve this aim the following objectives will be pursued; to:
(1) Characterize the wells/boreholes in the study area as well as describe the patterns of
groundwater uses from the sources.
(2) Determine and compare the physico-chemical and microbiological characteristics of well and
borehole water in the upper and lower sections of the study area
(3) Assess the environmental factors that influences the quality of groundwater in the study area.
(4) Examine planning implications of the findings and suggest management options to minimize
or eliminate groundwater water contamination in the study area.

9
1.4 Study Area
1.4.1 Location
The study area is Udenu local Government Area of Enugu State, Nigeria. Obollo-Afor is
the administrative headquarter of the Local Government Area. The study area lies approximately
at latitudes 6° 481N and 6° 581N and Longitudes 7° 261E and 7° 401E. It covers an area of 248km2.
It is bounded to the northwest by Kogi State, Northeast by Benue State, to the West by Igbo-Eze
North LGA, to the east by Isi-uzo LGA and to the South by Nsukka LGA. (Fig.1 and 2).
FIG 1. Nigeria Showing Enugu State
Source: GIS Laboratory, Department of Geography, University of Nigeria, Nsukka

10
FIG .2: Enugu State Showing Udenu LGA.
Source: GIS Laboratory, Department of Geography, University of Nigeria, Nsukka
The LGA is made up of thirteen (13) autonomous communities namely: Obollo-Afor, Obollo-Eke,
Obollo-Etiti, Imilike-Uno, Imilike-Agu, Umundu, Ezimo-Uno, Ezimo-Agu, Igugu, Amalla,
Ogbodu-Aba, and Orba and Agu-Orba (Fig.3)

11
FIG. 3: Udenu L.G.A Showing the Autonomous Communities
Source: Secretary’s office, Udenu LGA
1.4.2 Geology
The study area is underlain by the following geologic formations, the Ajalli Sandstone and
the Mamu Formation. The Mamu Formation (Simpson, 1954) is the oldest outcrop in the study
area. It outcrops further east of Nsukka, around Obollo-Afor to Obollo-Eke area. Only deep
boreholes of up to 220-250m at Obollo-Afor encounter the Mamu. The lithology is made up of
sandstone, shales, sandy shales and coal (De Swardt and Casey, 1963). Nwachukwu (1978),
describe the Mamu from well log in Ezimo in the following succession: 5 Shale or sandy shale, 4
Sandstone with few shaley, layers, 3 carbonaceous shale, 2 Coal with shaley top, 1 Shale to sandy
shale. The Ajalli Sandstone underlies the Nsukka Formation (Reyment, 1965). The Ajalli
Sandstone (Agagu, Fayose, and Peter, 1985) belongs to the Maastrichtian. Nwachukwu (1978)
describe it as having a thickness of 336 metres but Reyment (1965) and Agagu et al. (1985)

12
suggested a thickness of 457 metres. The lithology is made up of a cyclic sequence of friable, cross-
bedded fine-medium-coarse grained sandstone that is very permeable.
1.4.3 Relief and Drainage
The topography of the study area falls within the four major landform division: western
lowland, a plateau zone, escarpment zone and eastern zone identified by Ofomata (1978). Some of
the communities like Obollo-afor, Orba, Imilike, fall under the zone which are associated with the
Nsukka plateau. While parts of Orba are found in the escarpment zone of the Nsukka-Okigwe
cuesta and Ezimo sits on this ridge. Surface drainage is sparse and lacking in some of these
communities. This according to Ofomata (1978) is among other reasons, due to the fact that the
underlying sandstones are highly permeable and pervious. Other communities like Obollo-Eke,
Obollo-Etiti, Imilike Agu, and parts of Ezimo fall under the eastern lowland region. It has physical
geographic features among which are monotonous rolling type of landscape and a good number of
streams (Madu, 2000). Udenu LGA is mainly drained by the Ebonyi river. It flows through
communities such as Obollo-Etiti and Obollo-Eke. The rest of the areas are drained by springs.
This was also acknowledged by Eze (2007) that the Ebonyi River is the dominant hydrological
feature of the area. It has a network of tributaries and distributaries. Numerous irregular branches
of gully formations respond to local runoff flows into streams and rivulets from where they
converge into the Ebonyi River.

13
FIG. 4: Udenu L.G.A Showing the Relief of the Study Area
(*Communities east of the scarp face are regarded as “lowland communities”)
Source: GIS Laboratory, Department of Geography, University of Nigeria, Nsukka
1.4.4 Climate
The climate of Udenu LGA falls under the same climate of Enugu state, Nigeria. It is a
tropical wet and dry (Aw) climate type according to Koppen’s classification system. The two
seasons are influenced by two air masses. The dry tropical continental air mass under the influence
of the Azores-Saharan anticyclone that is prevalent during the dry season and the tropical maritime
air mass under the influence of the St Helena anticyclone which is prevalent during the wet seasons.
It is characterized by eight months of rainfall and four months of dry season, that runs through
March to October and November to December respectively. The total annual rainfall ranges from
1500mm to 2000mm with most of the rain falling in the months of July and August. Udenu
experiences short spell of harmattan. This harmattan occurs between December and January
characterized by very cold temperature and dust laden wind blowing Sahara dust over the land

14
leading to the inconvenience of dust every. Mean monthly temperatures vary from 25°C to 29°C.
The period of maximum dryness is February which is also the hottest month.
1.4.5 Soil and Vegetation
Udenu L.G.A falls within the derived savanna belt. The vegetation is characterized by the
mixture of trees and tall grasses that are thick and evergreen during the wet season and dispersed
during the dry season. This vegetation is also the largest vegetation zone in Nigeria and most of
the trees are deciduous. Common economic tree species in this vegetation belt are Elaeis guinensis
(oil palm), Anarcardium occidentals(Cashew), Magnifera indica (Mango), Caricae papaya
(Pawpaw), Ceratonia siliqua (Locust bean), Pentaclethra macrophylla (Oil bean) Musa acuminate
colla (Banana), etc. Important local grass and herbs species found in the study area are: Adopogon
tectorum, Pennisetum purpurem, Sida acuta, Aspilia africana, e.t.c.
The soil in the area is as a result of weathering and organic matter (Areola, 1982). A loose
sandy soil type that is pervious, well drained and reddish in colour occupies two thirds of the area
while the extreme lowland areas are spatially distributed with the mixtures of loamy and clay soil
that are sticky when wet but fine and loose when dry.
1.4.6 Population and Socio-Economic Activities
Udenu L.G.A as at the 2006 population census, has a total population of 178,687 and an
area of 248km2 with 88,381 males and 90,306 females (NPC, 2010). The population growth rate
was estimated to be 2.5% annually. If the growth rate remains at 2.5%, a projection of the
population to 2016 is estimated to be 228,734.
However, about seventy percent of the inhabitants of Udenu practice one form of
agriculture or the other. These farmers produce crops like cassava, yam, groundnut, cocoa-yam,
maize etc. The women rely on the rich abundance of palm trees as their economic resource. They
make palm oil which they take to the market to sell. Some of this produced palm oil are stored and
later exported in large quantity to neighbouring countries like Benin Republic and Niger. The

15
kernel are as well cracked and exported to industries for soap and oil production. Because of this
resource also, agro allied industries using palm kernel have been established. It is also worthy to
note that everything about palm tree is money. As a result, the men are engaged in palm wine
tapping which they do in commercial quantity because people travel all the way from the
neighboring states like Kogi and Benue to buy from them. The people are also engaged in honey
extraction from bees as it has become pronounced that people from all works of life visit the
communities just to get original honey. The people operate the four Igbo market days (Eke, Afor,
Nkwo, and Orie) although the major markets in the LGA are found in the administrative (Obollo-
Afor) headquarter and Orba respectively. The people also engage in local craft making such as
woodcarving, basket making, and blacksmithing.
1.5 Literature Review
Literature survey revealed that the assessment of the influence of environmental factors on
groundwater quality has emerged as a subject of great interest, and various facets of the topic had
been discussed in different parts of the world. In Europe, the work of Baba, Kaya, and Birsoy
(2003), considered the Yatagan thermal power plant in Mugula, Turkey as a factor affecting the
quality of groundwater and surface water. Their investigations revealed that the concentrations of
calcium (Ca2+), cadmium (Cd2), lead (Pb2), antimony (Sb2), and sulphate (S042-) in some samples
exceeded the limits set by Turkish Drinking water, the U.S. EPA and WHO. Isotope analyses were
also carried out to determine the origins of contaminations in the water. The outcome showed that
contaminations were taking place in the vicinity of the waste disposal site. Also, the work of
Schwarzenbach and Westall (1981), studied the groundwater/surface water contaminant
interactions based on laboratory simulations of field conditions beneath a river valley in
Switzerland. They conducted a classic set of sorption studies and showed sorption to organic
carbon to be a key process in retarding the transport of non-polar organic compounds across the
groundwater/surface water interface.

16
In America, Zacharia, Doug, Brian, Jesse, Jayme, Josh, Jonathan, Stephanie, Phillip, Drew,
Akinde, Corey, Paul, Taylour, Hanadi, and Kevin (2015), investigated the concerns of the people
of Texas, about the potential effects of unconventional oil and gas extraction (UOG) on the
environment and its effects on groundwater. Groundwater samples of 550 wells were collected
from water wells that draw from the Trinity and Woodbine aquifers overlying the Barnett shale
formation of Texas (referred to as the “Barnett shale region). Of the 550 samples, 350 came from
private wells serving residential purposes, while 59 samples came from agricultural water wells,
and 141 samples came from municipal or public water supply wells serving communities
throughout the Dallas-Fort Worth Metroplex. Measurements for basic water quality parameters
such as temperature, dissolved oxygen (DO), conductivity, total dissolved solids (TDS), salinity,
pH and oxidation-reduction potential (ORP) were performed with a YSI Professional Plus multi-
parametric probe, and each water well was purged until measurements for these parameters had
stabilized, indicating that samples were representative of fresh groundwater from the underlying
aquifer. They detected multiple volatile organic carbon compounds throughout the region,
including various 60 alcohols, the BTEX family of compounds, and several chlorinated
compounds. These data do not necessarily identify UOG activities as the source of contamination;
however, they do provide a strong impetus for further monitoring and analysis of groundwater
quality in this region as many of the compounds they detected are known to be associated
with UOG techniques.
Also, in the work of Hudak (2003), chloride concentrations and chloride/bromide ratios
from 198 water wells in the Edwards-Trinity Plateau Aquifer were compiled, mapped, and
evaluated within the context of regional geology and land use. The study area occupies eight
counties in west-central Texas, within which oil production and agriculture are predominant land
uses. Samples from 49 wells had chloride concentrations above the 250 mg/l secondary drinking
water standard, 22 samples had greater than 500 mg/l chloride, and 9 samples exceeded 1000 mg/l
17
chloride. Of the 22 samples above 500 mg/l chloride, 10 had relatively low chloride/bromide ratios
of less than 300, consistent with oilfield brine, and 2 had ratios above 2000, consistent with
groundwater impacted by evaporite dissolution. The remaining ten samples had chloride/bromide
ratios ranging from 300 to 2000, consistent with partial mixing of unimpaired groundwater with
evaporite-laden water. There were no significant correlations between chloride concentration and
well depth, inconsistent with contaminants originating at the land surface. Results of this study
suggest that evaporite dissolution and oilfield brine locally impact the Edwards-Trinity Plateau
Aquifer, but the problem is not regionally pervasive.
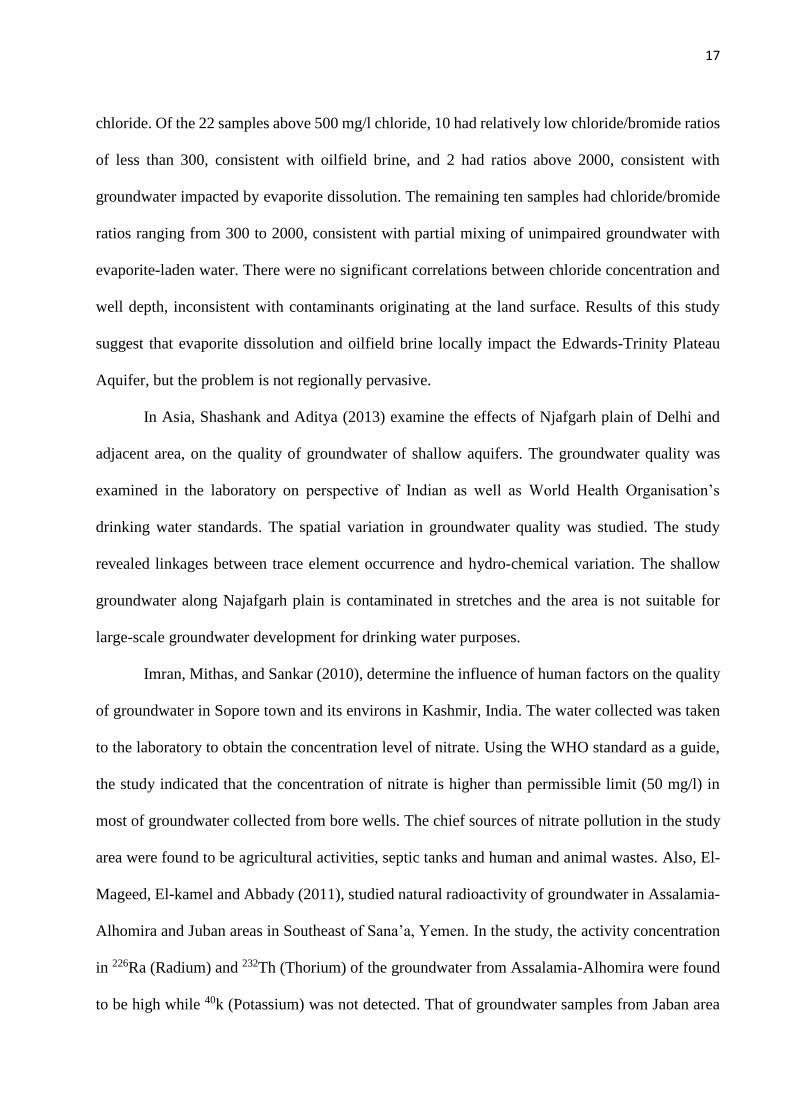
In Asia, Shashank and Aditya (2013) examine the effects of Njafgarh plain of Delhi and
adjacent area, on the quality of groundwater of shallow aquifers. The groundwater quality was
examined in the laboratory on perspective of Indian as well as World Health Organisation’s
drinking water standards. The spatial variation in groundwater quality was studied. The study
revealed linkages between trace element occurrence and hydro-chemical variation. The shallow
groundwater along Najafgarh plain is contaminated in stretches and the area is not suitable for
large-scale groundwater development for drinking water purposes.
Imran, Mithas, and Sankar (2010), determine the influence of human factors on the quality
of groundwater in Sopore town and its environs in Kashmir, India. The water collected was taken
to the laboratory to obtain the concentration level of nitrate. Using the WHO standard as a guide,
the study indicated that the concentration of nitrate is higher than permissible limit (50 mg/l) in
most of groundwater collected from bore wells. The chief sources of nitrate pollution in the study
area were found to be agricultural activities, septic tanks and human and animal wastes. Also, El-
Mageed, El-kamel and Abbady (2011), studied natural radioactivity of groundwater in Assalamia-
Alhomira and Juban areas in Southeast of Sana’a, Yemen. In the study, the activity concentration
in 226Ra (Radium) and 232Th (Thorium) of the groundwater from Assalamia-Alhomira were found
to be high while 40k (Potassium) was not detected. That of groundwater samples from Jaban area

18
was also high for 226Ra, 232Th and 40k, respectively. Similar investigation was carried out by Ahmed
(2004) on the concentration of natural radioactivity of ground and drinking water in some areas in
Upper Egypt where phosphate are mixed using gamma ray spectroscopy with hyper pure
germanium detector. In his investigation, drinking water and groundwater in Qena Upper Egypt,
Safaga and Quseir, red Sea region contains 226Ra and 232Th.
Aravindal, Sankaran, Manivel, and Chandrasekar (2003), examine the influence of hard
rock on the chemistry of groundwater within Gadilam River Basin, TamilNadu area in two
different seasons of summer and winter. They made use of ‘Statgraph’- a statistical package to
carry out principal component analysis. Their study ascertained the spatial variations of Ca-HCO3,
Na-Cl, Na+ and K between summer and winter. The findings of the study revealed that Ca-HCO3
facies of summer changes to Na-Cl facies during winter. Their study further showed that during
winter, Na+ and K were closely correlated with chloride but in summer the concentration of Na+
and K was not very high. Also, Anbalagan and Nair (2004), extended this study by using GIS
techniques to map the geo-chemical analysis of groundwater to indicate the level of quality for
drinking and irrigation purposes. This was done in order to identify the regions having
suitable/unsuitable water for drinking and irrigation purposes within the Panvel basin of
Maharashtra state. The chemical parameter such as chloride, hardness, TDS and salinity were
represented using GIS techniques. Similarly, Mithas, Sankar, and Imran (2010) evaluated
groundwater quality of parts of Palar river basin, Tamilnadu, in order to determine the influence
of rock minerals of the river basin on groundwater. It was found that Ca concentration was
dominant among cations and HCO₃ among anions. Presence of fluoride bearing minerals in the
host rocks and their interaction with water is considered to be the main cause for fluoride
enrichment in groundwater. The decomposition, dissociation and dissolution are the main chemical
processes responsible for mobility and transport of fluoride into groundwater.

19
Nosrat and Asghar (2010), assess the groundwater of Oshnavieh plain in Northwest of Iran.
The study evaluated Physical, hydro-geologic, and hydro-chemical factors from the groundwater
system in order to determine the main factors and mechanisms controlling the chemistry of
groundwater in the area. In order to evaluate the quality of groundwater in study area, 31
groundwater samples were collected and analyzed for various parameters. Physical and chemical
parameters of groundwater such as electrical conductivity, pH, total dissolved solids, Na, K, Ca,
Mg, Cl, HCO₃, CO₃, SO₄, NO₃, NH₃, PO₄, Fe, and F were determined. Chemical index like
percentage of sodium, sodium adsorption ratio, and residual sodium carbonated, permeability
index (PI) and chloroalkaline indices were calculated. Based on the analytical results, groundwater
in the area is generally fresh and hard to very hard. The abundance of the major ions is as follows:
HCO₃ > SO₄ > Cl and Ca > Mg > Na > K. The dominant hydro chemical facieses of groundwater
is Ca-HCO₃ and Ca-Mg-HCO₃ type. Samples fall in the rock dominance field and the chemical
quality of groundwater is related to the lithology of the area. The results of calculation saturation
index by computer program PHREEQC shows that nearly all of the water samples were over
saturated with respect to carbonate minerals and under saturated with respect to sulfate minerals.
Assessment of water samples from various methods indicated that groundwater in study area is
chemically suitable for drinking and agricultural uses. Fluoride and nitrate are within the
permissible limits for human consumption and crops as per the international standards. Assessment
of water samples from various methods indicated that groundwater in study area is chemically
suitable for drinking and agricultural uses. Fluoride and nitrate are within the permissible limits
for human consumption and crops as per the international standards.
Denise and Geoff (2002), assess the impact of organic wastes on the groundwater of South
Cork. The groundwater sample were chemically analyzed in the laboratory and the result revealed
that, faecal bacteria, nitrate, ammonia, high K/Na ratio and chloride are present which are
indications of contamination by organic waste. However, only the high K/Na helps distinguish

20
between septic tank effluent and farmyard wastes. So in many instances, while the analyses can
show potential problems, other information is needed to complete the assessment .In a related
study, Suresh and Kottureshwara (2009), in their groundwater quality studies of Hospettaluka
region in Bellary district, Karnataka, India, collected 40 groundwater samples and chemically
analysed them. The analysis revealed that the water was slightly alkaline (pH: 7.1 - 8.2),
moderately hard (TH: 130 - 892 mg/L) and TDS values ranged from 240 to 1650 mg/L. The other
parameters like sodium adsorption ratio (SAR) (2.7-13.5), percent sodium (10.2 - 54.0) and
magnesium ratio (7.8 -21.5) were also below the desirable limits. Fluoride was most dominant ion
responsible for contamination of the groundwater. Eleven water samples of the study area were
prone to excess fluoride concentration (>1.2mg/L) and not suitable for drinking purpose.
According to USSL diagram, most of the samples falls in C2S1, C2S2, C3S1 and C3S2, which
indicating its suitable nature for drinking and irrigation purposes. Based on the Piper trilinear
diagram it was confirmed that the dug wells were characterized by secondary alkalinity in the study
area. The presence of E-coli in only five dug wells, and only one dug well indicated potential
dangerous fecal contamination, which requires immediate attention.
In Africa, many research works have been done on groundwater quality. Ackah,
Agyemang, Anim, Osei, Bentil, Kpattah, Gyamfi, and Hanson (2011), for instance, assess the
quality of groundwater in a predominantly farming environment and sprawling settlement in the
Ga East municipality in Ghana for purposes of drinking and agricultural activities. Their results
showed that temperature range of 19.50C-26.70C, pH range of 4-7.4, conductivity range of 214-
283µS/cm, total dissolved solids, 110-1384 mg/L, bicarbonate, 8.53-287.7mg/L, sulphide, 16.35-
149.88mg/L. Metal concentrations of Fe ranging from 0.212-3.396 mg/L, Mn 0.01-0.1 mg/L. The
ionic dominance for the major cations and the anions respectively were in these order;
Na+>K+>Mg+>Ca+ and Cl->HCOȝ- >SO₄2_ >NO₃-. Most of the samples analyzed were within the

21
guidelines set by both national and international bodies for drinking water and the US salinity
Laboratory Classification of C2-S1 (medium salinity-low SAR).
Aidoo (2013), examine the effects of pit latrines on dug-wells in the Asankrangwa
community in the Western Region of Ghana. Water samples were collected from 16 dug-wells
sited closer than 30 metres and analyzed for some physical, chemical and bacteriological
parameters. The results show that all the physico-chemical parameters analysed (except turbidity)
fell within the Ghana EPA standards for drinking water. The bacteriological analyses, however,
showed that the water was contaminated with total coliforms (15.50-71.62cfu/100ml), faecal
coliforms (0.00-13.00 cfu/100ml) and E. coli (0.00-4.25 cfu/100ml) which was attributed to the
likely presence of the pit latrines and the sanitation around the dug-wells as well as the use of
multiple receptacles and the nature of the dug-wells (uncovered, unlined and unpaved dug-wells).
In a similar study, Kiptum and Ndambuki (2012), carried out a study on the well water
contamination by pit latrines in Langas which is peri-urban settlement of Eldoret town, Kenya. The
study sought to establish the safety (quality) of water in wells located near pit latrines on
individual plots of the settlement. The results show that most wells were contaminated and posed
a health risk to the dwellers of the settlement.
Also, Dzwairo et al. (2006), assess the impacts of pit latrines on groundwater quality in
Kamangira village, Marondera district, Zimbabwe. Groundwater samples from 14 monitoring
boreholes and 3 shallow wells were analysed during 6 sampling campaigns, from February 2005
to May 2005. Parameters analysed were total and faecal coliforms, ammonium-nitrogen, nitrate-
nitrogen, conductivity, turbidity and pH, both for boreholes and shallow wells. Total and faecal
coliforms both ranged 0-TNTC (too-numerous-to count), 78% of results meeting the 0 CFU/100
ml WHO guidelines value. Ammonium-nitrogen range was 0–2.0 mg/l, with 99% of results falling
below the 1.5 mg/l WHO recommended value. Nitrate-nitrogen range was 0.0–6.7 mg/l, within 10
mg/l WHO guidelines value. The range for conductivity values was 46–370lS/cm while the pH

22
range was 6.8–7.9. There are no WHO guideline values for these two parameters. Turbidity ranged
from 1 NTU to 45 NTU, 59% of results meeting the 5 NTU WHO guidelines limit. Depth from the
ground surface to the water table for the period February 2005 to May 2005 was determined for all
sampling points using a tape measure. The drop in water table averaged from 1.1 m to 1.9 m and
these values were obtained by subtracting water table elevations from absolute ground surface
elevation. Soil from the monitoring boreholes was classified as sandy. The soil infiltration layer
was taken as the layer between the pit latrine bottom and the water table. It averaged from 1.3 m
to 1.7 m above the water table for two latrines and 2–3.2 m below it for one pit latrine. A
questionnaire survey revealed the prevalence of diarrhoea and structural failure of latrines. Results
indicated that pit latrines were microbiologically impacting on groundwater quality up to 25 m
lateral distance. Nitrogen values were of no immediate threat to health. The shallow water table
increased pollution potential from pit latrines.
In Nigerian, scholars have also worked extensively on groundwater quality. Scholars like
Adekunle, Adetunji, Gbadebo, and Banjoko et al (2007), consider environmental factors such as:
depth, waste dumpsites and open air defecation in selecting sample sites when assessing the quality
of groundwater in typical rural settlement of southwest Nigeria. Water samples were procured from
twelve hand-dug wells whose depths varied from 4 to 12 m, located in the vicinities of municipal
solid-waste dumpsites, open - air defecation sites, twice a month for period of three months in the
dry season and another period of three months in the wet season. Water quality parameters analyzed
in accordance to standard methods were pH, temperature, conductivity, total solids (TS), total
suspended solids (TSS), total dissolved solids (TDS), turbidity, nitrate (NO3-), sulphate (SO₄2-),
phosphate (PO₄3), copper (Cu), lead (Pb), cadmium (Cd), dissolved oxygen (DO), chemical oxygen
demand (COD), biochemical oxygen demand (BOD), fecal coliform (FC) and total coliform (TC)
counts. They discovered that qualities of the well water samples were therefore not suitable for
human consumption without adequate treatment.

23
In Kano metropolis, North-western Nigeria a study by Adamu and Adekiya (2010),
examine the influence of landfill as a factor affecting groundwater quality within the vicinity. It
was revealed from their findings that some samples had low BOD (28.5-46.0mg/dm3) and COD
(55.00 – 89.25mg/dm3) values indicating that active methogenesis process is taking place at the
sites. The suspended solids, total dissolved solid and turbidity results varied significantly between
sites. The study also showed that all the samples contained low concentrations nitrate and sulphate
with phosphate, chloride, lead and manganese in high ranges when compared with the national
regulatory standard.
Christopher and MohdSuffian (2011), examine the effects of dumpsite as a factor polluting
groundwater quality in Akure. The study was done using boreholes located at radial distances of
50m, 80m, and 100m respectively away from the landfill. From their assessment, most of the
parameters indicated traceable pollution but were below the limits set by the World Health
Organisation (WHO) for human consumption. The pH varied from 5.7 to 6.8 indicating toxic
pollution. Turbidity values were between 1.6 and 6.6 NTU and temperature ranged from 26.5 to
27.50C. Concentrations of iron, nitrate, nitrite and calcium ranged from 0.9 to 1.4mg L-, 0.7 to 0.9
mg L-1 and 17 to 122 mg L-1 respectively. For heavy metals, zinc ranged between 0.3 and 2.3 mg
L-1 and lead ranged from 1.1 to 1.2 mg L-1.
Longe and Balogun (2009), examine the level of groundwater contamination near a
municipal landfill site in Alimosho Local Government Area of Lagos state, Nigeria. Water quality
parameters of leachate and groundwater samples were analyzed. The mean concentrations of all
measured parameters except NO₃-, PO₄+ and Cr – met the limit set by the World Health organization
for drinking water standards and the Nigerian Standard for Drinking Water Quality (NSDWQ).
Mean concentration values for TDS, DO, NH₄+, SO₄+, PO₄+, NO₃ - and Cl- are 9.17 mgl, 3.19 mgl,
0.22 mgl, 1.60 mgl, 10.73 mgl, 38.5 mgl, and 7.80 mgl respectively. The results show insignificant
impact of the landfill operations on the groundwater resource. It was however observed that in the

24
absence of properly designed leachate collection system, uncontrolled accumulation of leachates
at the base of the landfill pose potential contamination risk to groundwater resource in the very
near future.
Ayantobo, Oluwasanya, Idowu and Eruola (2012), examine the role of well construction
methods and protection as a factor of groundwater quality in Ibadan, Oyo State Nigeria. They used
one hundred and one (101) hand-dug wells which were randomly selected from four Local
Governments in the core area of Ibadan. The core area includes Ibadan North Local
Government, Ibadan North East Local Government, Ibadan South East Local Government, and
Ibadan South West Local Government. The selection criteria for the wells were based primarily
on construction pattern and mode of operation of the wells. Other considerations include
location in residential areas and accessibility. Water samples were collected for physico-chemical
and microbial analysis (Electrical Conductivity, pH, Temperature, Chlorides, Nitrate, E. coli and
Total Coliform Count) in the laboratory. Results showed that nitrate concentration, E.Coli and total
coliform counts are more pronounced in wells that are installed close to domestic refuse waste,
abattoir, pit latrine, stagnant water, and drainages. The pronounced concentrations decreased with
increasing distance from the pollution sources irrespective of well classification. Protected wells
gave better water quality relative to semi protected and unprotected wells.
Isikwue, Iorver, and Onoja, (2011), examine the effects of depth as a factor of microbial
pollution of shallow wells in the three floodplains of Makurdi metropolis of Benue State, Nigeria.
The assessment was for the presence of coli form bacteria. The species isolated were Salmonella
typhlitis, Escherichia coli, Streptococcus fecalis, Proteus spp. and total coliform. The pollution of
wells was found to increase with decrease in depth and decrease with increase in depth. None of
the wells studied met the limit by World Health organization (WHO) for drinking water which is
0cfu/ml and 10cfu/ml by the National Agency Food and Drugs Administration and Control,
Nigeria (NAFDAC).

25
Ocheri, Iyange, and Obeta in (2010), examine the variations in Nitrate level in hand dug
wells in Markurdi Metropolis, Benue State, Nigeria. In this study, seasonal variation in nitrate
levels in hand dug wells in Makurdi metropolis was examined. A total of 15 water samples were
collected from hand dug wells and analyzed for nitrate level for both wet and dry seasons. The
analysis was done according to standard method of water examination using colorimetric
techniques (APHA-AWWA-WPCF,1985). In the findings, the results of analyses show that 80%
of the wells have nitrate levels above WHO guide limit for drinking water for the wet season as
against 67% for the dry season. This implies that consumers of water from these hand dug wells
especially children stands a very high risk of metheamogolineamia.
Also, Alhassan and Fanan (2011), assess water quality at Masaka, a peri-urban settlement
on the North-Eastern fringes of Abuja, Nigeria’s Federal Capital City. The results indicate that
some elements were found to have significant concentration in water from hand dug wells
at Masaka whereas others were either insignificant or met the safety standard/limit provided
by Federal Ministry of Water Resources and/or World Health Organization. In another related
study, Chidi et al. (2014), evaluated the pH, Iron and Lead levels in borehole water collected
randomly from some selected borehole drinking water in Federal Government College Area in
Warri, Delta State, Nigeria, to ascertain the degree of portability. The results were compared with
NAFDAC, WHO and NSDWQ standards for safe drinking water. Experimental research design
was used to collect and analyze five samples of untreated borehole drinking water all in Federal
Government College, Warri. pH was determined by Winlab Model 290A pH meter, iron and lead
by Atomic Absorption Spectrometer (AAS) and addition of 5.0ml of concentrated HNO₃.
Shafiu, Paul and Omoniyi (2015), examine well depth as a factor affecting the physico-
chemical properties of well water of neighboring villages in close proximity to Rivers Niger
and Benue. Wells of up to 2.8m depth and 300m distance from the River were selected. These
parameters were measured according to the standard method. A total of 120 samples of well water

26
from these villages (Shintaku, Ganaja village, Gbobe and Lokoja metropolis) were taken
and analyzed. Results showed that Total Suspended Solid, (TSS), Total Dissolved Solid
(TDS),Total Solid (TS),turbidity, alkalinity and Total Hardness(TH), shows a range of 13-
450mgL -1, 57-905mgl-1, 10-170mgL -1, 0.611-140 NTU 11.5-18mgl-1 and 202-818mgl-1.
Biochemical Oxygen Demand (BOD), Chemical Oxygen Demand (COD) and Dissolved Oxygen
(DO), shows a range of 0.1-0.45mgl-1, 108-346mgL-1and 0.08-0.75 mg-1 while Electrical
Conductivity (EC) and pH shows a range of 53.5-98.5µscm-1and 5.9-7.5. Ammonia, nitrate and
phosphate also show a range of 0.01-0.3mgl -1, 3.9-43mgl -1 and 1.5-14.95mgl-1 in the dry
season respectively. Total Suspended Solid,(TSS), Total Dissolved Solid (TDS), Total Solid
(TS), turbidity, alkalinity and Total Hardness(TH), shows a range of 13-450mgl-1, 57-905mgl-
1, 10-170mgl-1, 0.611-140 NTU, 59-131 mgl-1 and 130-404 mgl-1. Biochemical Oxygen
Demand (BOD), Chemical Oxygen Demand (COD) and Dissolved Oxygen (DO) shows a
range of 0.2-31 mgl-1, 60-818 mgl-1and 0.9 - 1.2 mgl-1, Electrical Conductivity (EC) and pH shows
a range of 0.611-140 NTU and. Ammonia, nitrate and phosphate show a range of3.1-14.5mgl-1,
7.5 -65mgl-1and 3.1-13.5mgl-1, respectively. During the wet season, it was found that the
nitrate, turbidity and pH increased with depth of the well and the values of TS and TDS also
increases positively with the wells proximity to the river in wet season, which was evident in their
R2 Values (correlation coefficient) as they range from 0.7-0.8.
Onunkwo et al. (2014), did a comparative analysis of the quality of water from shallow
and deep aquifers of Nsukka SE, Nigeria. The result shows that average pH for deep and
shallow aquifer was 5.8 and 6.3, sulphate 14.2 and 10.97, Nitrate 2.5 and 2.2., Phosphate
1.48 and 1.68, iron1.98 and 1.60 magnesium 11.4 and 11.8, Sodium 1.80and 2.4, Chloride 8.4 and
9, Tds 33.51 and 62.17. The coliform count ranges from 3/100 to 7/100 ml only for shallow aquifer
(pollution), magnesium is the major contributors of hardness in both cases. Deep aquifer water
plots as magnesium cation and a no dominant anion and on the transition between fresh and salt

27
water (brackish water), the shallow aquifer has magnesium sulphate and plots in the zone of sea
water, and shows hard water. The SAR for deep aquifer is 0.58, while that of shallow aquifer is
0.32 both are excellent for irrigation. Both waters are ideal for use in industries and homes,
while the aquifers are highly polluted by iron, the shallow aquifer is polluted by water borne
diseases.
Anthony, Aniekan, and Offiong (2012) evaluate groundwater in parts of Mamfe
Embayment, Southeastern Nigeria. Eighty eight (88) water samples were collected from twenty
two (22) locations across four periods to highlight the micro-climatic conditions between January
to September 2005 in three Formations: intrusive, Asu River group and Eze-Aku. In this study, the
relationship between various elements was studied using correlation analysis, cluster analysis and
factor analysis. The data also showed that the aquifer in the study area are vulnerable to faecal
coliform due to water from runoff that infiltrate into the aquifer from the vodose zone during
precipitation in the area. This is evidence that the vulnerability of the study area is controlled by
infiltration and runoff.
Eni, Obiefuna, Oko, and Ekwok (2011), examine the impact of urbanization on sub-surface
water quality in Calabar municipality. The study evaluated problems caused by urbanization on
groundwater in Calabar Municipality. Water samples were collected from (20) twenty locations
within the study area. Aerial photographs of 1972, 1991 and orthophotomap of 2005 were used to
calculate the extent of urban growth. The study reveal that there is an appreciable increase in urban
growth within the study area due to population increase and the struggle to satisfy man’s basic
needs such as food and shelter. The built up area calculated show that 2005 has a higher value of
650m2 at satellite town. The presence of faecal coliform is an indicator of the degree of
contamination by sewage. pH at some locations were high because some boreholes were located
very close to pit latrines, cemeteries and defunct sewages. It was observed that, the deeper the
depth the better the water quality. The result from multiple regressions shows that faecal

28
coliform, pH, Nitrate and Chlorine had a positive relationship with urbanization while
sulphate ions had negative relationship. R2 of 0.0501 was obtained which means that 50.1
percent of urban growth influenced water quality.
From the literature review it is obvious that the deteriorating quality of ground water has
emerged as a global issue. Several researchers have also examined the quality of groundwater
from borehole and wells. Generally, findings revealed that many of the works only compare
analyzed water parameters to W.H.O standard without detail analysis on environmental factors and
spatial variations between groundwater. The existing literatures have not also addressed the
concern of the quality of water used from wells and boreholes in our study area, nor did they
address the environmental factors affecting groundwater quality in the study area. This study
intends to bridge this gap that exists in literature.
1.6 Conceptual Framework
Introduction: A conceptual framework is an analytical tool with several variations and
contexts. It is used to make conceptual distinctions and organize ideas. It is much more than a
literature review. Strong conceptual frameworks capture something real and do this in a way that
is easy to remember and apply.
Rural Water Supply Sustainability Framework
Sustainability is a concept that originates from the debate on sustainable development
during the early 70s (Tadesse, Techane, and Girma, 2013). In the United Nations document entitled
“Our Common Future” (1987) “sustainable development is development that meets the needs of
the present generations without compromising the ability of future generations to meet their own
needs.” This definition lays a foundation on which many scholars have defined sustainability. In
the context of rural water supply the water aid sustainability framework of 2011 adopted a working
definition of sustainability, based on a simple definition given some years ago by Len Abrams. In
the definition of Abrams (1998), “sustainability is about whether or not water and sanitation

29
services and good hygiene practices continue to work overtime. No time limit is set on those
continued services, behaviour changes and outcomes. In other words, sustainability is about lasting
benefits achieved through the continued enjoyment of water supply and sanitation services and
hygiene practices”. Over the years, several conceptual frameworks have been produced to better
understand the essence of rural water supply sustainability (Tadesse et al., 2013). Among those
developed quality rural water supply framework, this study considers the recently developed
framework of Water Aid (2011). First, without real need and demand there is little or no prospect
of changed practices being sustained; if real demand for the services or changes offered is weak,
this can completely undermine prospects for sustainability. Second, there are several aspects of
programme design and implementation which are fundamental to the achievement of effective and
sustainable community-based operation and maintenance (2-4). The evidence of a functioning
community-based management system is to be found in the existence of an active water user
committee, and the others aspects shown in the highlighted box. These factors are interdependent,
interactive and crucial for achieving sustainable water services with a corresponding behavior
changes over time (Carter, 2010). Also, monitoring is a key aspect to achieving sustainability of
water supply in the rural areas. “Monitoring of water will help protect human health, environmental
health and our water bodies from pollution. Thus, there is a logical sequence consisting of three
components: monitoring, assessment, followed by management. Management usually gives rise to
a feedback loop as management inevitably requires compliance monitoring to enforce regulations,
as well as assessments at periodic intervals to verify the effectiveness of management decisions”
(Ezemonye and Emeribe, 2013). Therefore, it suffices to say that you can’t manage what you don’t
measure. Fig 5, would give us a close look at the interplay of these factors.

30
FIG. 5. Conceptual framework for sustainable rural water supply
Source: (Modified from Water Aid Sustainability Framework, 2011)
It is increasingly recognized that the achievement of lasting sustainable water services is
dependent on the interplay of the number of factors represented on the above diagram (Jansz,
2011). Sustainability is compromised when the effectiveness of one or several of these factors fails,
or they cease to even exist. However, given this framework, this study strongly relies on it and
favours it for this research.
1.7 Research Hypothesis
The following hypothesis was formulated to guide the study.
H0 There is no statistically significant difference between the mean values of analyzed
groundwater quality parameters of the upland and lowland sections of the study area (in order
words, groundwater quality is not a function of elevation)
1.8 Research Methodology
1.8.1 Reconnaissance Survey
A reconnaissance survey was carried out essentially to familiarize ourselves with the study
area. This enabled us get relevant information that guided us in data collection for the study. The
reconnaissance involved travelling through the autonomous communities, observing physical
1 Establish need,
demand and full
user participation
2 Quality of
implementation
3 Environmental
aspects properly
addressed
4 Monitoring
system in place
D
esig
n a
nd
im
ple
men
tati
on
• Water user
committee
(WUC)
functioning
•Revenues
collected and
recorded
•Environment
al Monitoring
5 Management and
monitoring systems

31
features, human activities, the settlement pattern, the existing sources of water, methods of water
collection, the distance travelled by the people to fetch water, and the vessels used for water
collection.
1.8 2 Selection of Communities used for the study
Udenu LGA is made up of thirteen (13) autonomous communities, namely: Obollo-Afor,
Obollo-Eke, Obollo-Etiti, Imilike-Uno, Imilike-Agu, Umundu, Ezimo, Ezimo-Agu, Igugu,
Amalla, Ogboduaba, Orba and Agu-Orba. We selected ten communities through stratified
sampling. The selection of the communities considered the two topographic features of the study
area: the high elevated areas and the lowland areas. The highland areas have settlements such as
Obollo-Afor, Imilike-Uno, Umundu, Ezimo-Uno, Igugu, Amalla, and Orba while the lowland area
has settlements such as Obollo-Eke, Obollo-Etiti, Ogbodu-Aba, Imilike-Agu, Ezimo-Agu and
Agu-Orba. The communities on the highland areas have no hand dug wells (because of the depth
of the water table) but boreholes, while the communities on the lower areas have only hand dug
wells and no boreholes. Five (5) communities were selected from the elevated side of the divide
excluding Obollo-Afor the administrative headquarter, and Igugu community for unavailability of
borehole for water collection. Similarly, five communities were also selected from the lower side
of the divide. The selected communities are shown in (Table 1).
TABLE 1: List of Communities Used in the Study S/N Name of Sampled Communities in the Upland Section
1 Amalla
2 Umundu
3 Imilike-Uno
4 Ezimo-Uno
5 Orba
Name of Sampled Communities in the Lowland Section
6 Obollo-Eke
7 Obollo-Etiti
8 Ogboduaba
9 Imilike-Agu
10 Ezimo-Agu
Source: Fieldwork 2016.

32
1.8.3 Selection of the Environmental Factors Used in the Study
Based on the the conceptual framework used in this study, certain aspects of the
environment need to be properly addressed to achieve quality and sustainable groundwater. In view
of this, this study identified fourteen environmental factors that influence groundwater quality in
the study area which are classified into natural and human factors. The natural and human-induced
environmental factors used in this study are shown in Table 2. These environmental factors were
selected based on the observed charateristics of the sampled wells and borehole environments,
opinions from field survey, and consultation with experts.
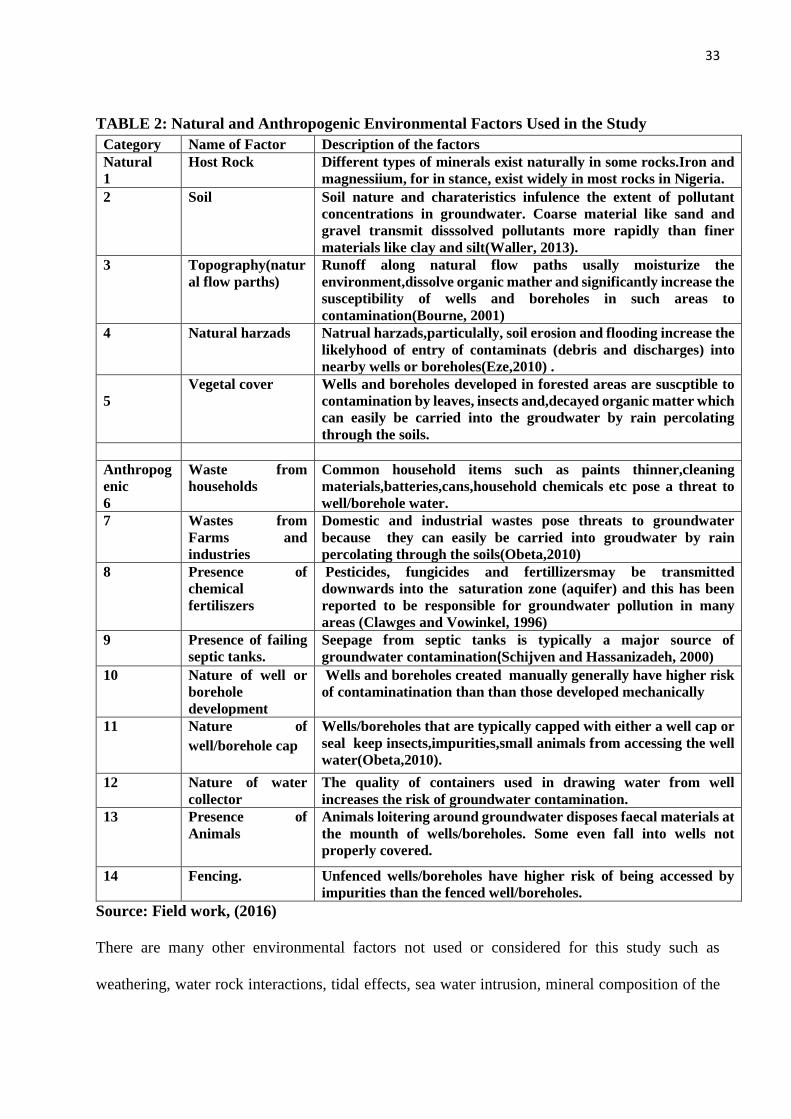
33
TABLE 2: Natural and Anthropogenic Environmental Factors Used in the Study
Category Name of Factor Description of the factors
Natural
1
Host Rock Different types of minerals exist naturally in some rocks.Iron and
magnessiium, for in stance, exist widely in most rocks in Nigeria.
2 Soil Soil nature and charateristics infulence the extent of pollutant
concentrations in groundwater. Coarse material like sand and
gravel transmit disssolved pollutants more rapidly than finer
materials like clay and silt(Waller, 2013).
3 Topography(natur
al flow parths)
Runoff along natural flow paths usally moisturize the
environment,dissolve organic mather and significantly increase the
susceptibility of wells and boreholes in such areas to
contamination(Bourne, 2001)
4 Natural harzads Natrual harzads,particulally, soil erosion and flooding increase the
likelyhood of entry of contaminats (debris and discharges) into
nearby wells or boreholes(Eze,2010) .
5
Vegetal cover Wells and boreholes developed in forested areas are suscptible to
contamination by leaves, insects and,decayed organic matter which
can easily be carried into the groudwater by rain percolating
through the soils.
Anthropog
enic
6
Waste from
households
Common household items such as paints thinner,cleaning
materials,batteries,cans,household chemicals etc pose a threat to
well/borehole water.
7 Wastes from
Farms and
industries
Domestic and industrial wastes pose threats to groundwater
because they can easily be carried into groudwater by rain
percolating through the soils(Obeta,2010)
8 Presence of
chemical
fertiliszers
Pesticides, fungicides and fertillizersmay be transmitted
downwards into the saturation zone (aquifer) and this has been
reported to be responsible for groundwater pollution in many
areas (Clawges and Vowinkel, 1996)
9 Presence of failing
septic tanks.
Seepage from septic tanks is typically a major source of
groundwater contamination(Schijven and Hassanizadeh, 2000)
10 Nature of well or
borehole
development
Wells and boreholes created manually generally have higher risk
of contaminatination than than those developed mechanically
11 Nature of
well/borehole cap
Wells/boreholes that are typically capped with either a well cap or
seal keep insects,impurities,small animals from accessing the well
water(Obeta,2010).
12 Nature of water
collector
The quality of containers used in drawing water from well
increases the risk of groundwater contamination.
13 Presence of
Animals
Animals loitering around groundwater disposes faecal materials at
the mounth of wells/boreholes. Some even fall into wells not
properly covered.
14 Fencing. Unfenced wells/boreholes have higher risk of being accessed by
impurities than the fenced well/boreholes.
Source: Field work, (2016)
There are many other environmental factors not used or considered for this study such as
weathering, water rock interactions, tidal effects, sea water intrusion, mineral composition of the

34
aquifer, etc. These were not used in the study area either because they were not observed to occur
in the area or that the technologies to measure them are currently not in existence in the study area.
This research adopted the criteria described below in order to quantify the identified environmental
factors and use them for analysis.
1.8.4 Mearsurement of the Environmental Factors Used in the Study.
In order to accurately analyse the infulence of the enviromental factors defined and
described in Table 2, we carefully parametised the factors (with a weghting scale of 1-8) as
shown in Table 3.

37
TABLE 3: Parametization of the Environmental Factors
Variable
code
Variable
Names
Category of
variables
Method of parametisation (%)
X1
Host Rock Natural Host rocks rich in mineral salts under investigation (iron and mg
etc) rusted pipes, and littered with metal wastes around, score 8
Host rocks rich in minerals (iron, mg etc), pipes not rusted but
littered with iron materials, score 6
Host rocks rich in iron and mg pipes not rusted and not littered
with iron, score 4
Host rocks rich in either of iron and magnesium score 2
Host rocks not rich in any mineral score 1
X2
Soil type ” HDW/BH developed in sandy areas score 8
” ” devloped in gravel areas score 6
” ” developed in cracks and fault areas score 4
” ” developed in loamy areas score 2
” ” developed in clay or silt areas score 1
X3
Topography
(natural flow
parths)
” HDW/BH in the middle of natural water flow path score 8
” ” 1-5m away from water flow path score 6
” ” 5-10m away from water flow path score 4
” ” 10-15m away from water flow path score 2
” ” Above 15m away from water flow path score 1
X4
Natural
harzads
” Distance of erosion scar to well and boreholes
HDW/BH developed in erosion site score 8
” ” 1-5m away from erosion scar score 6
” ” 5-10m away from erosion scar 4
” ” 10-15m away from erosion scar score 2
” ” >15m away from erosion score 1
X5
Vegetal cover ” HDW/BH fully covered by vegetation score 8
” ” partly covered by vegetation score 6
” ” 1-2m away from vegetation cover score 4
” ” 2- 4m away from vegetation cover score 2
” ” >4m away from vegetation cover score 1
X6
Waste from
households
Anth; HDW/BH 1-5m away to household waste score 8
” ” 5-10m away from household waste score 6
” ” 10-15m away from household waste score 4
” ” 15-20m away from household waste score 2
” ” >20m away from household waste score 1
X7
Wastes from
Farms and
industries
” Distance of Wastes from Farms and industries
HDW/BH 0-5 away to farms/industrial wastes point score 8.
” ” 5-10 away from farms/industrial wastes 6
” ” 10-15m away from farms/industrial wastes score 4
” ” 15-20m away from farms/industrial wastes score 2
” ” >20m away from farms/industrial wastes score 1
X8
Presence of
chemical
ferilizers
” HDW/BH environment with frequent application of fertilizer score
8
HDW/BH environment with Occasional application of fertilizer
score 6
HDW/BH environment with Fertilizer rarely applied score 4
HDW/BH environment with no fertilizer applied score 1
X9
Presece of
failing septic
tanks/pit
latrines.
” Distance of septic tanks/pit latrines
HDW/BH 1-5m away from septic/pit latrine score 8
” ” 5-10m away from septic/pit latrines score 6
” ”10-15m away from septic/pit latrines score 4
” ”15-20m away from septic/ pit latrine score 2
” ” >20m away from septic/pit latrine score 1
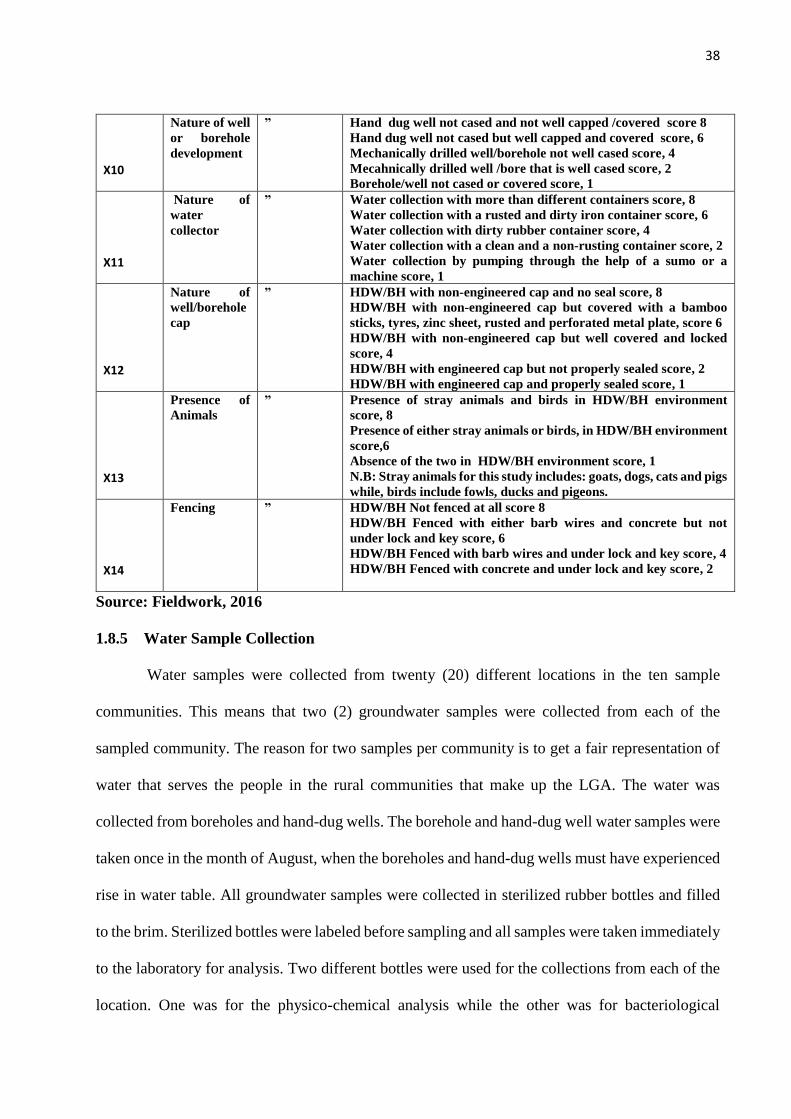
38
X10
Nature of well
or borehole
development
” Hand dug well not cased and not well capped /covered score 8
Hand dug well not cased but well capped and covered score, 6
Mechanically drilled well/borehole not well cased score, 4
Mecahnically drilled well /bore that is well cased score, 2
Borehole/well not cased or covered score, 1
X11
Nature of
water
collector
” Water collection with more than different containers score, 8
Water collection with a rusted and dirty iron container score, 6
Water collection with dirty rubber container score, 4
Water collection with a clean and a non-rusting container score, 2
Water collection by pumping through the help of a sumo or a
machine score, 1
X12
Nature of
well/borehole
cap
” HDW/BH with non-engineered cap and no seal score, 8
HDW/BH with non-engineered cap but covered with a bamboo
sticks, tyres, zinc sheet, rusted and perforated metal plate, score 6
HDW/BH with non-engineered cap but well covered and locked
score, 4
HDW/BH with engineered cap but not properly sealed score, 2
HDW/BH with engineered cap and properly sealed score, 1
X13
Presence of
Animals
” Presence of stray animals and birds in HDW/BH environment
score, 8
Presence of either stray animals or birds, in HDW/BH environment
score,6
Absence of the two in HDW/BH environment score, 1
N.B: Stray animals for this study includes: goats, dogs, cats and pigs
while, birds include fowls, ducks and pigeons.
X14
Fencing ” HDW/BH Not fenced at all score 8
HDW/BH Fenced with either barb wires and concrete but not
under lock and key score, 6
HDW/BH Fenced with barb wires and under lock and key score, 4
HDW/BH Fenced with concrete and under lock and key score, 2
Source: Fieldwork, 2016
1.8.5 Water Sample Collection
Water samples were collected from twenty (20) different locations in the ten sample
communities. This means that two (2) groundwater samples were collected from each of the
sampled community. The reason for two samples per community is to get a fair representation of
water that serves the people in the rural communities that make up the LGA. The water was
collected from boreholes and hand-dug wells. The borehole and hand-dug well water samples were
taken once in the month of August, when the boreholes and hand-dug wells must have experienced
rise in water table. All groundwater samples were collected in sterilized rubber bottles and filled
to the brim. Sterilized bottles were labeled before sampling and all samples were taken immediately
to the laboratory for analysis. Two different bottles were used for the collections from each of the
location. One was for the physico-chemical analysis while the other was for bacteriological

39
analysis. The collection of water in the study area was guided by the availability of and accessibility
to functional boreholes in the community as well as by the willingness of the owners of hand dug
wells to allow water sample to be collected for this study. In communities where we have more
than one functional borehole, then the simple random sampling technique was used to select any
one used in the study; the same applied to communities where we have more than one
functional community well. Where community boreholes and hand-dug wells are not available, the
frequently accessed private owned boreholes and hand-dug wells are sampled.
FIG. 6: Udenu L.G.A Showing the Sampled Stations
Source: Field work, 2016.
1.8.6 Description of sampling sites
The environmental conditions of the different sample points vary widely. The various
sample points and the environmental conditions and shown in Table 4:

40
TABLE 4: Sample site description S/
N
Communities Borehole/
Well
Code
Location
Description of sample site
Northing Easting
1 Amalla 1 BH1 60 561 5911 70 3115811 This area is covered with natural and secondary grasses and trees. There
were signs of agricultural activities taking place around the borehole while
nearby lands are used as dumping ground for refuse.
2 Amalla 2 BH2 60 561 33 70 321 211 Unclean sourrounding with litters of refuse and plant leaves
3 Umundu 1 BH3 60 531 3911 70 3013211 The borehole is located in a residential home. Surroundings are used for
washing and cooking.
4 Umundu 2 BH4 60 531 611 70 2913411 The borehole is fenced with barb wires, to prevent animal intrusion, the
ground is tarred with inter-locked tiles and drainage constructed inside to
prevent water logging.
5 Imilike-Uno 1 BH5 60 521 711 70 2814111 The borehole is fenced but littered with cement and asbestos use for
construction
6 Imilike-Uno 2 BH6 60 521 1211 70 291 2411 Located in a residential home with no drainage system and domestic
wastes disposed to farmlands.
7 Ezimo-Uno 1 BH7 60 511 2411 70 3014811 Located on a hill top with human residents about 7m away from the
borehole. The borehole vicinity which is about 7m radius is free from any
agricultural activities except for the different residential homes close to the
borehole.
8 Ezimo-Uno 2 BH8 60 521 411 70 321 911 Unclean surrounding that is bushy and used as rendevouz by school
children
9 Orba 1 BH9 60 501 4411 70271 1011 Surrounding is characterized by some residential quarters, stores and
retail shops. Domestic wastes and solid wastes were discharged to bare
lands and gutters close to the borehole. The drilled iron pipe is old and
rust which could enhance the dissolution of iron as water is pumped from
the aquifer.
10 Orba 2 BH10 60 501 4211 70 281 5011 Wastes from market are littered within the surrounding.
11 Obollo-Eke 1 HDW1 60 501 2411 70361 5611 Uncased well surrounded by cultivated lands. Domestic wastes, solid
wastes and human excreta from children are discharged directly to lands
less than 5 m from the hand-dug well. The hand-dug well has a secured
well cap covered and locked to prevent substances from entering the well.
12 Obollo-Eke 2 HDW2 60 501 2411 70 371 5011 The well is uncased but covered with a metal plate. Wastes from the
market are littered within the surrounding. Effluents from abattir were
visible.
13 Obollo-Etiti 1 HDW3 60 531 5911 70341 1411 Agricultural activities were close to the well. Open air defecation was also
observed close to the hand dug wells. The hand-dug well is not cased and
the cap is covered with strings of bamboo sticks that have a zinc sheet
placed on them. Nearby lands are used for dumping of refuse.
14 Obollo-Etiti 2 HDW4 60 541 311 70 341 4211 Uncovered and uncased well surrounded by bushy growth and the
surrounding soil is waterlogged.
15 Ogboduaba 1 HDW5 60 481 5211 70 351 1811 An open space covered mainly by grasses. There were no agricultural
activities within the vicinity of the hand-dug well. The well is not cased but
covered with a rusted tin sheet with perforation that can allow substances
to enter the well.
16 Ogboduaba 2 HDW6 60 481 3011 70 371 1311 Bushy surrounding, uncased well covered with plank wood, pit latrine
located near by.
17 Imilike-Agu 1 HDW7 60 501 211 70 341 4211 The well is located under a mango tree. It is uncased and covered with
plank wood and the surrounding is full of litters of leaves and animal
excreta. The compound is also used for fowl rearing as they were allowed
to roam around the compound in search of food.
18 Imilike-Agu 2 HDW8 60 501 1111 70 351 4311 The well is not cased but covered with metal plate. Surrounding area is
clean.
19 Ezimo-Agu 1 HDW9 60 521 1511 70 321 4311 The well is close to gutter and main road. The well is not cased but the cap
of the hand-dug well is well secured and locked with a padlock. The area
is devoid of agricultural activities and growth of natural grasses.
20 Ezimo-Agu 2 HDW10 60 501 5211 70 341 60 Well is about 5m to a bathroom but covered with tyres and a big polytene
material. The well is not also cased.
Source: Fieldwork, 2016.

41
1.8.7 Water Sample Preservation
The preservation of the water samples was done in line with standard procedure for water
quality analysis as described in APHA (1992). The samples were bottled carefully to avoid any
foreign contaminant entering into the containers which may affect the laboratory analysis. The
samples were also preserved with ice block in a cooler in order to slow down the rate of any
biochemical reaction and taken to the laboratory same day for analysis.
1.8.8 Choice of Water Quality Parameters
The water quality parameters used for this study are shown in Table 5. Only fifteen (15)
water parameters were tested in this study. These parameters were selected based on their
environmental relevance, and occurrence statistics in water quality.
TABLE 5: List of Parameters Used in the Study
S/N Selected Water quality Parameters Unit of
Measurement
WHO
Permissible
Limit (2011)
NSDWQ
Permissible
limit (2007)
1
2
3
4
5
6
7
8
9
10
11
12
13
14
15
Temperature
pH
Electrical Conductivity (EC)
Total Dissolved Solids (TDS)
Turbidity
Nitrate (No₃-N)
Iron (Fe2+)
Calcium (Ca2+)
Alkalinity
Total Hardness
Magnesium (mg2+)
Chloride (Cl-)
Sulphate (So₄2-)
Total Coliform
Escherichia. Coli
(0C)
-
mS/m
(mg/l)
(NTU)
(mg/l)
(mg/l)
(mg/l)
(mg/l)
(mg/l)
(mg/l)
(mg/l)
(mg/l)
cfu/100ml
cfu/100ml
25
6.5-8.5
400
500
5.0
10
0.3
75-200
80-120
500
0.2
-
250
10
0
-
6.5-8.5
1000
500
5.0
50
0.3
-
-
150
0.2
250
100
10
0

42
1.8.9 Laboratory Analysis
Water samples collected from the boreholes and hand dug wells underwent laboratory
analysis for Chemical and microbiological parameters in the laboratory of Enugu State Ministry of
Water Resources while making sure the instruments used conform to international standards. The
guidelines that formed the basis of our test are the WHO and the Nigerian Standard for Drinking
Water Quality (NSDWQ). The samples were analyzed for the parameters shown in Table 5.
1.8.10 In-Situ Analysis of groundwater Samples
The physical properties [pH, Turbidity, temperature, Total Dissolved Solids (TDS) and
Electrical Conductivity (EC)] of the groundwater samples were measured in situ using digital
electronic multi-parameter water quality monitoring instrument (HANNA Model HI 9812,
HI 98312 ). The parameters were measured by dipping the electrode of the HANNA instrument
into the groundwater for two minutes, and then pressing and releasing the arrow button
corresponding to the parameter to be measured. The readings were allowed to stabilize, and the
value recorded. However, calibration of sensors was performed and the cuvette was rinsed
three times with distilled water before every survey was conducted. Turbidity was recorded
using Hanna Instrument (HANNA ModelLP 2000). The NTU values were measured by pressing
and releasing the arrow button and the value recorded.
Determination of Total Alkalinity
10 ml of water sample was put in curvet; alkaphot tablet was added, crushed and mixed until
all particles have dissolved. Optical density reading was taken at 570 nm wavelength on a
Wagtech photometer.
Determination of Nitrate
The Wagtech photometer method was used. Nitrate from the sample aliquot was reduced to nitrite
and the resulting nitrite was then determined by a diazonium reaction to form reddish dye. Unique
zinc-based Nitratest Powder and Nitratest Tablet were used in the reduction stage to aid rapid

43
flocculation. The nitrite resulting from the reduction stage was determined by reaction with
sulphanilic acid in the presence of N-(1-naphthyl) ethylene diamine to form a reddish dye. The
intensity of colour produced in the test is proportional to the nitrate concentration and was
measured using the wagtech photometer 7100.
Determination of Total Hardness
Total hardness was analyzed by titration of 50 ml water sample with standard EDTA. The EDTA
was added in drops at pH 10 using Erichrome black T indicator until the colour changed into
purple and the hardness was calculated by multiplying the average number of drops of EDTA
used for the sample by the calibration factor of 20.
Determination of Iron
A cuvette was filled with each water sample plus 0.25% orthophenanthroline solution (1:10
dilution), and optical density was taken at 510 nm wavelength using the Wagtech photometer.
From a standard curve, the concentration of iron in the sample was determined.
Determination of Sulphate (SO42-):
One hundred milliliters (100 ml) of water sample was measured into a 250 ml Erlenmeyer flask.
Five milliliters (5 ml) of conditioning reagent was added and mixed by stirring. One gramme (1 g)
of barium chloride crystals was added while stirring and timed for 60 seconds. The absorbance was
then determined at 420 nm on the spectrophotometer within 5 minutes. The concentration was then
read directly from the calibration curve on the computer screen.
Determination of Calcium (Ca2+):
EDTA Titration Method was used to determine calcium hardness in the sample. Two milliliters
(2.0 ml) of 1 M NaOH was added to 50 ml of the sample. The mixture was stirred and 0.1 g of the
murexide (ammonium purpurate) indicator was added to it. Titration was done immediately after
the addition of the indicator. EDTA titrant was slowly added with continuous stirring until the
colour changed from Salmon to orchid purple. The end point was checked by adding 2 drops of

44
titrant in excess to make sure that no further colour change occurred (APHA, 1992). The value was
calculated using the formula:
Ca (mg/l) = A×B×400.8 ………..…………………………………………1
ml of sample
Where: A = ml of EDTA titrant used; B = ml of standard calcium solution
ml of EDTA titrant
Microbiological Analysis
The enumeration and isolation of coliform bacteria was by the use of the membrane filtration
technique (Eckner, 1998; Jagals et al., 2000) and growth on MacConkey agar. The presence of
Escherichia coli in the water samples was assessed by growth and colour reaction on Eosin
Methylene Blue (EMB) agar, together with standard biochemical reactions as described by
(Barrow and Feltham, 1993).
1.8.11 Water Quality Index (WQI) Analysis
Thirteen (13) water quality parameters were considered in the analyses of water quality
index using the arithmetic method. These parameters were chosen based on their considerable
impact and most widely used for calculation of water quality index (Kankal, Inurkar and Wate,
2012).
Calculation of Sub Index of Quality Rating (Qi)
Let there be i water quality parameters where the quality rating or sub index (Qi) corresponding to
the nth parameter is a number reflecting the relative value of this parameter in the polluted water
with respect to its standard permissible value. The value of Qi is calculated using the following
expression.
Qi = [(Vn - Vi o) / (Si - Vi o)] × 100 …………………………………………….(2)
Where, Qi is Quality rating for the nth water quality parameter, Vn is estimated value of the nth
parameter at a given sampling station, Si is Standard permissible value of ith parameter, and Vi o
is Ideal value of ith parameter in pure water.

45
All the ideal values (Vio) are taken as zero for drinking water except for pH is 7.0 and dissolved
oxygen is 14.6mg/L.
Calculation of Quality Rating For pH:
For pH the ideal value is 7.0 (for natural water) and a permissible value is 8.5 (for polluted water).
Therefore, the quality rating for pH is calculated from the following relation:
QpH = 100 [(VpH -7.0)/(8.5 -7.0)] ……………………………………………………(3)
Where,
VpH is observed value of pH during the study period.
Calculation of Unit Weight (Wi)
Calculation of unit weight (Wi) for various water quality parameters are inversely proportional to
the recommended standards for the corresponding parameters.
Wi = K/Si ……………………………………………………………………..(4)
Where,
Wi is unit weight for nth parameters, Si is standard value for nth parameters and K is constant for
proportionality
Calculation of WQI
WQI is calculated from the following equation:
WQI =∑ 𝑄𝑖𝑊𝑖𝑛𝑖=1
∑ 𝑊𝑖𝑛𝑖=1
………………………………………………… (5)
1.8.12 Oral Interview
Oral interview was conducted on 435 persons, comprising of experts from the Monitoring
and Evaluation Unit of the Enugu State Water Corporation, Borehole Managers, Community
leaders, and water users in the sampled communities. Five (5) experts from the Monitoring and
Evaluating unit, two (2) borehole managers from each of the sampled communities, one (1)
community leader from each of the sampled communities and forty (40) water users from each of

46
the sampled communities were interviewed respectively. The data collected from these sources
include; the characteristics of wells and boreholes in the study area, information on water use
habits, expert opinions on the causes of high dissolved salt concentrations on either the well or
borehole water etc. The data were analyzed with histogram, mean, and simple percentages.
1.8.13 Secondary Data
The secondary data used in this research work were collected from published text books,
journals, magazines, newspapers, conference papers, unpublished but (documented) thesis work,
the internet and from hospital records and health centers. Information was also sourced from the
National Population Commission gazette, WHO reports on drinking water guideline as well as that
of the Federal Ministry of Water Resources of Nigeria.
1.8.14 Method of Data Analysis
The data generated for this study were analyzed through the use of appropriate
statistical techniques. This study made use of descriptive statistics such as: percentages, minimum
and maximum value, mean, standard deviation, range, and principal component analysis (PCA)
which were generated through SPSS version 20 and Microsoft Excel 2007 software. The PCA was
used to extract the main environmental factors affecting the quality of groundwater in the study
area. Relevant information was illustrated with graphs and charts for clarity. The t-test statistical
tool was employed to compare the mean difference in groundwater parameters between the upland
section and lowland sections of the study area at 95% level of confidence. This involves testing for
the significant difference between the values of parameters obtained from the two sections.

47
1.9 Plan of the Project
This research work consists of six (6) chapters. These chapters are as follows;
Chapter One: Introduction: This chapter includes the background of the research, discussion of
statement of research problem, aim and objectives of, description of the study area, literature
review, research methodology and ends with the plan of the project.
Chapter Two: Characterization of the sources of groundwater and patterns of groundwater
use in the area: This chapter examined the characteristics of groundwater, sources of groundwater,
and described the patterns of groundwater use in the study area.
Chapter Three: Physico-Chemical and Bacteriological Characteristics of Groundwater in
Udenu Rural Communities: This chapter examined the physical, chemical and bacteriological
characteristics of groundwater in Udenu rural communities and compared them to the WHO and
NSDWQ standard, examined the variations of the parameters between the upper and lower section
of the study area as well as discussed the water quality index of the study area.
Chapter Four: The Influence of environmental factors on the quality of water from wells and
borehole in the study area: This chapter discussed the environmental factors that affect the
quality of groundwater in the study area.
Chapter Five: Planning implications of the findings and options for improved well/borehole
water management in the study area
This chapter examined planning implication of the finding and suggested options for groundwater
management and improvement in the study area.
Chapter Six: Summary, Recommendation and Conclusion: This chapter comprises of the
summary of the study, recommendation and conclusion.

48
CHAPTER TWO
CHARACTERIZATION OF WELLS AND BOREHOLES AND PATTERNS OF USE IN
THE STUDY AREA
2.1 Introduction:
This chapter describes the groundwater sources (wells and boreholes) and water use
patterns in the rural communities under study (see, plates 3 & 4).
Plate 3: Well water abstraction from Ogdouduaba Plate 4: Water from Borehole, Orba
A comprehensive understanding of the water use patterns is critical not only to the effective
management of water supply but also to the effective design of relevant public water supply
policies (WHO and UNICEF, 2012).
2.1.1 Wells
Generally, water users in the lowland section of the study area (see plate 3) have
traditionally relied on hand–dug wells for decades. This source is wild- spread in the area and has
been used for thousands of years. Two categories of wells were identified in the area; these are the
shallow and the deep wells. Shallow wells are simple, common in the area, easy to provide,
generally hand –dug, seasonal and yield water of doubtful quality. The average depth of wells in
the area was found to be 9.2 meters while the reported average yield of the wells is about 800 liters
per day-making the use of one well for a community difficult. All the communities in the lowland

49
section of the area were found to benefit from plentiful shallow wells. In these communities; water
is drawn by hand through the use of a rope tied to a bucket or a container. Interviewees reported
that during the dry season, the shallow aquifers begin to dry up and water availability becomes a
more critical issue. Over 55% of the respondents in the lowland communities draw water from
shallow aquifers. Water qualities from these wells are not currently monitored by any government
(state or federal) agency; monitoring is the sole responsibility of the owner(s).
In contrast, observed deep wells are fewer in number, generally perennial and mechanically
drilled. The costs of drilling deep wells were considered unusually high by majority (66%) of the
sampled population. Due to the difficulty of drawing water from the deep wells interviewees
reported that, many community users abandon the deep wells during the rainy season when much
of their water needs are met by the stored rain water and vended water. Based on field observations
and on survey responses, the large diameter wells (1-2m diameter) have several unique
characteristics. Table 6 provides summary characteristics of the sampled wells.
TABLE 6: Summary Characteristics of the Sampled Hand-dug Wells in the area Location/Code Northing Easting Ownership Type Functional
ity
MTD of
contr.
Depth
(m)
Soil type Remarks
Obollo-Eke
HDW1
60 521 2011 70361 5611 Private Shallow Functional Hand-
dug
8.7 Sediment
ary
Protected
Obollo-Eke
HDW2
60 501 2411 70 371 5011 Public Shallow Functional Hand-
dug
11.3 Sediment
ary
Unprotect
ed
Obollo-Etiti
HDW3
60 531 5911 70341 1411 Private Shallow Functional Mechan
ical
9.8 Sediment
ary
Unprotect
ed
Obollo-Etiti
HDW4
60 541 311 70 341 4211 Private Shallow Functional Hand-
dug
9.6 Sediment
ary
Unprotect
ed
Ogboduaba
HDW5
60 481 5211 70 351 1811 Public Shallow Functional Hand-
dug
9.2 Sediment
ary
Unprotect
ed
Ogboduaba
HDW6
60 481 3011 70 371 1311 Private Shallow Functional Hand-
dug
9.5 Sediment
ary
Unprotect
ed
Imilike-Agu
HDW7
60 501 211 70 341 4211 Private Shallow Functional Hand-
dug
7.9 Sediment
ary
Unprotect
ed
Imilike-Agu
HDW8
60 501 1111 70 351 4311 Private Shallow Functional Hand-
dug
8.5 Sediment
ary
Protected
Ezimo-
AguHDW9
60 521 1511 70 321 4311 Private Shallow Functional Hand-
dug
8.2 Sediment
ary
Protected
Ezimo-Agu
HDW10
60 501 5211 70 341 60 Private Shallow Functional Hand-
dug
9.3 Sediment
ary
Unprotect
ed
Average 9.2
Source: Fieldwork, 2016.
The protected hand dug wells referred to in this work are those with a closed cap and always under
lock and key.

50
2.1.2 Boreholes
Boreholes are extensively used in upper section of the study area to provide drinking water
to the people. The boreholes are generally equipped with India-made submersible pumps. At the
time of this study, less than two percent of the government’s (Enugu-State)-run boreholes were
operational; the others were broken down and abandoned. The locations, capacities, volume of
water produced and other characteristics of the boreholes are summarized in Table 7.
TABLE 7: Summary characteristics of the sampled Boreholes in the area Location/
Code
Northing Easting Ownership Type Functionality MTD of
constr.
Depth
(m)
Capacity
yield in
(m3) per
yr
Rock
type
Remarks
Amalla
BH1
60 561 5911 70 3115811 Private Submersible Functional Mechan
ical
188.6 1190440 Sedimen
tary
Protected
Amalla
BH2
60 561 33 70 321 211 Public Submersible Functional Mechan
ical
167.7 346,225 Sedimen
tary
Protected
Umundu
BH3
60 531 3911 70 3013211 Private Submersible Functional Mechan
ical
182.8 82,345 Sedimen
tary
Protected
Umundu
BH4
60 531 611 70 2913411 Church Submersible Functional Mechan
ical
152.4 96,232 Sedimen
tary
Protected
Imilike-
Uno BH5
60 521 711 70 2814111 Private Submersible Functional Manual 132.8 112,234 Sedimen
tary
UnProtec
ted
Imilike-
Uno BH6
60 521 1211 70 291 2411 Private Submersible Functional Mechan
ical
157 76.568 Sedimen
tary
Protected
Ezimo-
Uno BH7
60 511 2411 70 3014811 Public Submersible Functional Mechan
ical
198 NA Sedimen
tary
Protected
Ezimo-
Uno BH8
60 521 411 70 321 911 Public Submersible Functional Mechan
ical
152.4 255,269 Sedimen
tary
Protected
Orba
BH9
60 501 4411 70271 1011 Private Submersible Functional Mechan
ical
184.1 63,109 Sedimen
tary
Protected
Orba
BH10
60 501 4211 70 281 5011 Public Submersible Functional Mechan
ical
167 158,114 Sedimen
tary
Protected
Average 168.3
Source: Fieldwork, 2016. NA=Not avaliable
As Table 7 shows, only Imilike-Uno BH5 recorded an unprotected borehole. The borehole was
newly developed and yet to be properly sealed. The public and private boreholes were established
in the communities due to the general absence of reliable alternatives of water supply in the area.
The principal limitation of these boreholes as sources of water supply is the frequent and prolonged
breakdowns in the supply system. At the time of this study, many of the village boreholes were not
fully operational; in addition, the quantities of water abstracted and distributed is low and variable.
No community in the study area relies only on the boreholes for their water needs.

51
2.2 Water Use Patterns in the Sampled Communities
Investigations revealed that water use patterns in the sampled communities is highly
complex and is influenced by many factors including water availability, household characteristics,
attitudes, traditions and cultural practices regarding water conservation, etc. These factors directly
and indirectly drive water consumption and usage behaviours. The source of groundwater that
users chose in the sampled communities was found to depend on the individual household
preference and the current state of the nearby wells/ boreholes. In the communities located in the
lower section of the study area, the primary source were found to be large diameter wells due to
the general absence of functional boreholes in the area. Field survey shows that over 57.5% of the
sampled households secure their water largely from the numerous wells in the communities.
Numerous reasons were given for relying heavily on this source, the five most common being (1)
that wells are available and easy to provide (2) that streams are located in distant, difficult terrain
areas (3) that boreholes are costly to provide and maintain, (4) that boreholes are unreliable and
that users were not guaranteed that they would not breakdown and (5) that it is government
responsibility to provide them with borehole water. The average levels of water consumption for
domestic use were found to be relatively higher in the communities located in the lowland section
of the study area. For instance, the values returned for some of the communities were 76.5 lpcd
(Obollo-Eke), 68.7 lpcd (Ezimo Agu), 67.7 lpcd for Imilike Agu, 74.8 lpcd for Obollo-Etiti, 56.2
lpcd for Ogboduaba and 63.9 lpcd for Agu Orba.
For the communities located at the upper section of the study area, there was a clear
preference for and a near overwhelming dependence on boreholes for the households’ water needs.
Those household that do not obtain their water from public boreholes, which according surveys
were not reliable, turned to other alternative sources, principally, vended water, and stored rain
water. In all, 34% of the sampled households depended mostly on borehole water, 38% depended
on vendors while the rest depended on mixed sources. The average levels of water consumption

52
for domestic use were 58.7 lpcd for Orba (which had regular piped water supply), 51.7 lpcd for
Imilike-uno, 44.3 lpcd for Amalla, 53.5 lpcd for Ezimo-uno, and 43.2 lpcd for Umundu. The
communities with relatively regular water supply were those with privately owned boreholes
(Orba, Imilike-Uno, Umundu).
Fig. 7 summarizes the reported patterns of domestic water use by activity in the sampled
communities in the upland and lowland sections of the study area. By ‘domestic water use’ we
mean the groundwater collected and brought into the household for use (Brett et al., 2007). As
shown in Fig. 7, bathing, which represented 34% and 24% of total water use in either of two major
sections of communities under study, was the activity which consumed more water than other
activities. Cooking represented 21% and 18%, while drinking which represented 10% and 12%
respectively ranked as the third activity in respect of the quantity of water used. Less water is used
for bathing; cooking and drinking in highland communities than on the lowland communities. This
may be attributable to the fact that water scarcity is more severe in these communities. The
communities have less permanent access to perennial water sources especially during the dry
season. Water supplies in these communities are not always sufficient to meet human consumption
needs; and so the residents are used to “managing” i.e. rationing water. The most outstanding
variations were found in the water used for economic activities (poultry and piggery) in either
sections of the study area. More water is used for these activities in the highland communities of
the study area. This may be due to the fact the residents in highland communities own more
livestock than those on the lowland areas who are typically crop-growing farmers.

53
FIG.7: Percentage variability of groundwater use in Udenu LGA
0
5
10
15
20
25
30
35
40
% of Lowland Communities
% of Highland Communities
Per
cen
tage
(%)
Categories of water uses

54
CHAPTER THREE
PHYSICO-CHEMICAL AND BACTERIOLOGICAL CHARACTERISTICS OF
GROUNDWATER IN THE STUDY AREA
3.1 Introduction:
This chapter examines the physical, chemical and bacteriological characteristics of
groundwater quality in the study area. The result of the laboratory analysis is presented
in Table 8 and described briefly thereafter.

55
TABLE 8: Physico-Chemical and Bacteriological Characteristics of Groundwater Sample
Code Ph Temp Ec Turbidity Calcium Magnesium Iron Chloride Nitrate TDS Alkalinity Sulphate Hardness
Total
coliform E.coli
BH1 5.9* 26.5* 23 0.22 1.6 1.36** 0.2 5.3 0.6 41 10 6.4 7.3 0.47 0
BH2 6.2* 25.5* 28 0.34 1.5 0.84** 0.32* 5.6 1.8 56 12 7.3 6.2 0.75 0
BH3 5.6* 27.5* 28.5 1.2 1.87 0.33** 0.23 4.6 1.76 28 19 2.6 6.8 0.65 0
BH4 6.5 26.5* 38.5 1.3 2.4 0.93** 0.31* 3.7 0 38 14 3.7 7.4 0.01 0
BH5 6.4* 25.8* 16 2.6 1.3 0.31** 1.3* 3.2 2.3 63 8 6.2 8.3 0.91 0
BH6 6.3* 26.6* 23 2.3 1.6 0.67** 1.41* 20.1 3.1 52 10 8.6 7.8 2.87 0
BH7 6.6 28.6* 26 2.3 1.52 0.22** 0.43* 9.8 0.39 49.5 11 2.4 7.9 0.66 0
BH8 6.1* 25.4* 43 1.4 1.3 0.32** 0.35* 17.8 2.28 49.3 19 4.6 8.5 2.06 0
BH9 5.2* 28.4* 37 1 1.6 0.4** 0.33* 4.5 1.4 38 8 4.1 10 0.78 0
BH10 6.7 27.3* 33 1.2 1.9 1.54** 0.14* 8.5 3.4 40.1 11 5.6 11.2 0.68 0
HDW1 7.1 27* 64.3 3.5 6.3 1.4** 1.1* 3.5 2.7 120 10.1 10 40 6 1.3*
HDW2 6.8 25.5* 334 6.7* 5.4 4.1** 0.2 7 3.7 140 11.2 8 28 4 0.9*
HDW3 6.5 27.4* 77.4 1.6 4.1 4.8** 0.9* 6 1.8 100 8.2 7 34.2 3 0.8*
HDW4 6.4* 26.2* 167 2.4 3.6 3.7** 0.5* 5.9 2.4 110 7.6 6 30 5 0.2*
HDW5 6.1* 27.6* 128.2 2.9 1.6 3.9** 0.6* 5.1 5.3 200 6.5 6.4 18 2 0.5*
HDW6 6.7 26.1* 220 3.2 3.1 4.5** 0.1 8.4 9.4 180 10 7.4 33.6 5 0.8*
HDW7 6.2* 28* 262.4 5.0 3.8 1.8** 0.2 11.5 5.8 170 14 5.8 26.1 4 1.8*
HDW8 7.2 24.4 123 2.6 4.3 2.6** 0.2 9.3 11.2* 150 15 6.8 24 7 1.2*
HDW9 6.7 26.5* 77 4.5 8 2.4** 0.3 8.5 2.8 140 7 ND 20 3 0.6*
HDW10 7.6 25.3* 147 3.5 7 3.2** 0.2 10.1 6.5 170 12 8.6 31.4 6 1*
Mean 6.44 26.6 94.8 2.5 3.2 1.9 0.5 7.9 3.4 96.7 11.2 5.9 18.3 2.7 0.45
WHO(2011) 6.5-8.5 25 400 5.0 75-200 - 0.3 - 10 500 80-120 250 500 10 0
NSDWQ(2007) 6.5-8.5 - 1000 5.0 - 0.2 0.3 250 50 500 - 100 150 10 0
* Values that exceed WHO (2011) Benchmark
**Values that exceed NSDWQ (2007) Benchmark
- No Guideline Value
ND= Not detected
N.B: The groundwater samples were collected directly from the groundwater source and not through the overhead tank. Source: Fieldwork, 2016

56
3.1.1 pH
By definition, pH is the negative logarithm of the hydrogen ion concentration of a solution
and it is thus a measure of whether the liquid is acid or alkaline (EPA, 2001). The analysis of the
pH level (column 2) of the study area shows recorded values for the boreholes and the hand dug
wells. The recorded pH values of BH10, HDW1, HDW2, HDW3 and HDW6 HDW8, HDW9 and
HDW10 are within the permissible limit of WHO and NSDWQ (6.5 - 8.5) while the others are not
within the permissible level of WHO and NSDWQ for human use.
3.1.2 Temperature (0C)
The effect of temperature, and especially changes in temperature, on living organisms can
be critical. The rates of biological and chemical reactions depend to a large extent on temperature.
Column 3 of Table 8 shows the recorded temperature values for the stations. The temperatures
recorded in the different communities of the study area are well above the WHO recommended
limits of (250C) for drinking water quality except for HDW8.
3.1.3 Electrical Conductivity (EC)
The term electrical conductivity of water is an expression of its ability to conduct electric
current. Dissolution of ions in water gives such water the capacity to conduct electricity. Column
4 of table 8 above shows the electrical conductivity of the study area. The result reveals that the
maximum value of EC 344 mS/m was recorded in HDW2 (Obollo-Eke) while the minimum value
16 mS/m was recorded in BH 5 (Imilike-Uno). The maximum and the minimum values are both
within the permissible limit of WHO and NSDWQ for human.
3.1.4 Turbidity (NTU)
Turbidity in water arises from the presence of very finely divided solids (which are not
filterable by routine methods) (EPA, 2001). Materials that cause water to be turbid include clay,

57
silt, finely divided inorganic and organic matter, algae, soluble coloured organic compounds, and
plankton and other microscopic organisms (USGS, 2015). Column 5 of Table 8 shows the values
of the turbidity in the sampled stations. The recorded values show that Obollo-Eke (HDW2)
recorded the highest value of turbidity in the sampled stations which is above the WHO and
NSDWQ limit of (5.0 NTU) for human use. Although, HDW7 (Imilike-Agu) community returned
a value of 5 NTU that is the permissible limit.
3.1.5 Calcium (Ca2+)
The major natural sources of calcium are from amphiboles, feldspars, gypsum, pyroxenes
aragonite, calcite, dolomite and clay minerals (Ugwueze, 2000). The dissolution of these minerals
can cause the release of Ca2+ into solution. Column 6 of Table 8 shows the values of the analyzed
calcium in the study area. The observed samples from the stations show that all the sampled
communities recorded values of calcium that are within the permissible limit (75 – 200mgl) of
WHO.
3.1.6 Magnesium (Mg2+)
The major sources of magnesium are from amphiboles, olivines, pyroxenes, dolomite,
magnesite and clay minerals (Ugwueze, 2000). The dissolution of these minerals can cause the
release of Mg2+ into solution. Column 7 of Table 8 shows the values of the analyzed magnesium
of the study area. The recorded values for the sample stations are all above the permissible limit
(0.2mg/l) of NSDWQ for human use.
3.1.7 Iron (Fe2+)
Iron is a very common element that is found in many rocks and soils of Nigeria and it is
most characteristics of Nigerian groundwater (Ezeigbo, 1988). It is also a major component of
hemoglobin in the body. Column 8 of Table 8 shows the level of iron in the sample stations. From

58
the analysis, all the stations (except BH1, HDW2, HDW6, HDW7, HDW8, HDW9 and HDW10)
recorded values that are above the WHO and NSDWQ permissible limit of (0.3mgl) for human
use.
3.1.8 Chloride (Cl-)
Chloride exists in all natural waters, the concentrations varying very widely and reaching
a maximum in sea water (up to35, 000 mg/l Cl). In fresh waters, the sources include soil and rock
formations, sea spray and waste discharges (EPA, 2001). Sewage contains large amounts of
chloride, as do some industrial effluents. The level of chloride in the area is shown in Column 9
of Table 8 above. From the analysis, all the sampled stations recorded values of chloride that are
all within the WHO and NSDWQ permissible limit for human use.
3.1.9 Nitrate (NO₃-N)
Most nitrates found on natural waters come from organic and inorganic sources, the former
including waste discharges and the latter comprising chiefly artificial fertilizers (EPA, 2001). The
level of nitrate in the study area is shown in column 10 of Table 8. The highest nitrate value
(11.2mg/l) was recorded in HDW8 (Imilike-Agu) which was not within the permissible limit of
WHO (10 mg/l) for human use.
3.1.10 Total Dissolved Solid (TDS)
The total dissolved solid is simply the amount of dissolved organic and inorganic
substances in water. Column 11 of Table 8 shows the total dissolved solids (TDS) of the study
area. The highest TDS value 200 mg/l was recorded in HDW5 (Ogbodu-Aba). This shows that all
the values recorded never exceeded the permissible limit (500mg/l) of WHO and NSDWQ.

59
3.1.11 Sulphate
The main source of sulphate is from sulphides ore. Other sources are decaying organic
matter, air borne compounds originating from the sea (Ugwueze, 2000). The level of sulphate
concentration of the sampled stations is shown in Column 12 of Table 8. The analyzed values for
sulphate as given in Table 8, has the highest returned value as 10 mg/l in HDW1 (Obollo-Eke).
What this means therefore is that all stations recorded values that are all within the permissible
limit of WHO and NSDWQ that falls between 250 mg/l and 100 mg/l respectively.
3.1.12 Total Alkalinity
It is a measure of the capacity of the water to neutralize acids and it reflects its so-called
buffer capacity (its inherent resistance to pH change). Column 13 of Table 8 shows the values of
the analyzed alkalinity of the sample stations. The recorded values of the sample stations as shown
above, are all within the permissible limit of WHO which falls between (80-200mgl).
3.1.13 Total Hardness
Total hardness is simply the capacity of water not to lather with soap. The level of hardness
concentration of the sampled stations is shown in column 14 of Table 8. The analyzed values of
hardness as given above, has the highest returned value as 40 mg/l in HDW1 (Obollo-Eke). What
this means therefore is that all stations recorded values that are all within the permissible limit of
WHO and NSDWQ that falls between 250 mg/l and 150mg/l respectively.
3.1.14 Total Coliform
Total coliform includes bacteria group of faecal (human and animal waste) origin and also
other bacteria with similar properties which originate in soil that are non faecal (EPA, 2001). The
total coliform counts for the sample stations are shown in column 15 of Table 8. The highest

60
returned value 7cfu/100ml was recorded in HDW8 (Imilike-Agu). The maximum value recorded
for total coliform count is within the permissible limit (10cfu/100ml) of WHO and NSDWQ.
3.1.15 Escherichia Coli
The presence of E coli in water is an indication of faecal contamination. Where E. coli is
present in large numbers, the inference is that heavy, recent pollution by human or animal wastes
have occurred. Column 16 of Table 8 shows the concentration of E.coli in the water of the sampled
stations. The concentrations at the stations show that all the sampled hand dug wells recorded
values which are above the WHO and NSDWQ permissible limit of 0cfu/100ml.
3.2 Variations in Values of Analyzed Groundwater Quality Parameters between the
upland sections and the lowland Sections of the Study Area
Results of the analysis of borehole and well water samples from the upland (BH1 to BH10) and
lowland (HDW1 to HDW10) sections of the study area are displayed in Figures 8 to 22. As shown
in Figure 8, pH values at the lowland section of the study area (values returned from hand-dug
well samples) were generally higher than the values returned from the borehole water samples in
the upland section of the study area. However, values returned at HDW4, HDW5, and HDW7
show that the hand-dug well water at these sites are acidic and outside the accepted national
standards/allowable limits the WHO (2011) benchmark. Ten other parameters (EC, turbidity,
calcium, magnesium, Nitrate, TDS, hardness, Total coli form count and E-coil) showed similar
trends. Generally, these parameters returned higher elevated values for the hand-dug well water
samples than those of the boreholes samples. In fact E-coil was not detected in any of the analyzed
borehole water sample while all the hand-dug well water samples had traces of E-Coil (see Fig.
22). The more elevated values for the hand-dug well water samples indicate more influence of
pollutant releasing factors with the wells as opposed to the boreholes. Interviewees attributed the

61
presence of E-coil in the hand-dug well water samples to fecal contamination of the hand-dug
wells and the unhygienic conditions around the hand-dug wells which make the well environment
conducive for the growth of microorganisms.
FiG.8: Variations in pH FIG.9: Variations in Temperature
FIG. 10: Variations in Electrical conductivity FIG.11: Variation in Iron
FIG. 12: Variations in turbidity FIG. 13: Variations in Chloride
0
2
4
6
8
BH
1
BH
3
BH
5
BH
7
BH
9
HD
W1
HD
W3
HD
W5
HD
W7
HD
W9
Ph
HD
W 1
0 2223242526272829
BH
1
BH
3
BH
5
BH
7
BH
9
HD
W1
HD
W3
HD
W5
HD
W7
HD
W9
Tem
p(O
C)
HD
W 1
0
0
100
200
300
400
BH
1
BH
3
BH
5
BH
7
BH
9
HD
W1
HD
W3
HD
W5
HD
W7
HD
W9
EC (
mS/
m)
HD
W 1
0 0
0.5
1
1.5B
H1
BH
3
BH
5
BH
7
BH
9
HD
W1
HD
W3
HD
W5
HD
W7
HD
W9
Iron
HD
W 1
0
0
2
4
6
8
BH
1
BH
3
BH
5
BH
7
BH
9
HD
W1
HD
W3
HD
W5
HD
W7
HD
W9
Turbidity
HD
W 1
0
0
5
10
15
20
25
BH
1
BH
3
BH
5
BH
7
BH
9
HD
W1
HD
W3
HD
W5
HD
W7
HD
W9
HD
W 1
0

62
FIG. 14: Variations in Calcium FIG. 15: Variations in Alkalinity
FIG. 16: Variation in Magnesium FIG. 17: Variation in Nitrate
FIG. 18: Variation in total dissolved solids FIG. 19: Variations in Sulphate
FIG. 20: Variations in Hardness
02468
10B
H1
BH
3
BH
5
BH
7
BH
9
HD
W1
HD
W3
HD
W5
HD
W7
HD
W9
HD
W 1
0 0
5
10
15
20
BH
1
BH
3
BH
5
BH
7
BH
9
HD
W1
HD
W3
HD
W5
HD
W7
HD
W9
HD
W 1
0
0
2
4
6
BH
1
BH
3
BH
5
BH
7
BH
9
HD
W1
HD
W3
HD
W5
HD
W7
HD
W9
HD
W 1
0 0
5
10
15
BH
1
BH
3
BH
5
BH
7
BH
9
HD
W1
HD
W3
HD
W5
HD
W7
HD
W9
HD
W 1
0
050
100150200250
BH
1
BH
3
BH
5
BH
7
BH
9
HD
W1
HD
W3
HD
W5
HD
W7
HD
W9
HD
W 1
0 02468
1012
BH
1
BH
3
BH
5
BH
7
BH
9
HD
W1
HD
W3
HD
W5
HD
W7
HD
W9
HD
W 1
0
01020304050
BH
1
BH
2
BH
3
BH
4
BH
5
BH
6
BH
7
BH
8
BH
9
BH
10
HD
W1
HD
W2
HD
W3
HD
W4
HD
W5
HD
W6
HD
W7
HD
W8
HD
W9
HD
W1
0

63
FIG. 21: Variations in total coliform FIG. 22: Variations in E.coli
In contrast, sulphate, Alkalinity, temperature, chloride, and iron recorded more elevated values for
the borehole samples than those of the hand-dug wells. The relative high values returned by these
parameters were attributed to the influence of natural factors, principally, the host rocks. Taken
together, all the wells and 30% of the boreholes returned elevated parameter values that were
outside the WHO (2011) allowable limits for drinking water.
3.3 Summary and Spatial Variation of Water Quality Index of Communities in the
Study Area
The core of every geographic research is to show how phenomena vary across space. For
this reason, the spatial pattern of the distribution of pollutant loads in the sampled hand-dug wells
and boreholes in the study area were evaluated by calculating the water quality index at the
different sampled groundwater locations. Water quality index (WQI) according to (EC, 2016) is a
means by which water quality data is summarized for reporting to the public in a consistent
manner. It tells us, in simple terms, what the quality of drinking water is from a drinking water
supply. There are several methods to determine water quality index. The arithmetic method was
adopted in this study and procedure for calculation explained in section 1.8.11 because it classifies
water quality according to the degree of purity by using the most commonly measurable
parameters (Kankal, Inurkar and Wate, 2012). The classification is presented in Table 9.
02468
BH
1
BH
3
BH
5
BH
7
BH
9
HD
W1
HD
W3
HD
W5
HD
W7
HD
W9
HD
W 1
0
0
0.5
1
1.5
2
BH
1
BH
3
BH
5
BH
7
BH
9
HD
W1
HD
W3
HD
W5
HD
W7
HD
W9
HD
W 1
0

64
TABLE 9: Weighted Arithmetic Index level of Water Quality
WQI Level Value Water Quality Grading
0-25 Excellent A
25-50 Good water B
51-75 Poor water C
76-100 Very poor water D
>100 Unfit for drinking purpose E
The result of our analysis is presented in Table 10
TABLE 10: Quality of Groundwater from Ten Rural Communities of Udenu LGA
S/No Names of Communities WQI Water Quality
1 Amalla (BH1) 24 Excellent water
2 Amalla (BH2) 31 Good water
3 Umundu (BH3) 38 Good water
4 Umundu (BH4) 22 Excellent water
5 Imilike-Uno (BH5) 20 Excellent water
6 Imilike_Uno (BH6) 40 Good water
7 Ezimo-Uno (BH7) 45 Good water
8 Ezimo-Uno (BH8) 34 Good water
9 Orba-Uno (BH9) 40 Good water
10 Orba-Uno (BH10) 26 Good water
11 Obollo-eke (HDW 1) 45 Good water
12 Obollo-Eke (HDW2) 70 Poor water
13 Obollo-etiti (HDW3) 32 Good water
14 Obollo-Etiti (HDW4) 44 Good water
15 Ogboduaba (HDW5) 51 Poor water
16 Ogboduaba (HDW6) 58 Poor water
17 Imilike-Agu (HDW7) 69 Poor water
18 Imilike-Agu (HDW8) 57 Poor water
19 Ezimo-Agu (HDW9) 50 Good water
20 Ezimo-Agu (HDW10) 59 Poor water
Source: Fieldwork, 2016.
The water quality index of the groundwater under study indicates that the different groundwater
sample from the different communities have different WQI values hence, different degree of water
quality. From the values in Table 10, all the groundwater from the upland area have water that fall
under the A and B class. However, the groundwater from the lower side of the divide indicates
that 60% of the groundwater is of poor quality. The reason therefore for these variations in the
quality of groundwater from the two different areas may be due to the depth of water. Boreholes
are deep while hand-dug wells are shallow, open and prone to contamination. This is also similar
with the work of (Ocheri, 2009) where he noted that variations in groundwater quality are usually

65
a reflection of the local environment of the water points. The average of the water quality index of
two of the sampled locations from each of the sampled communities were used to further classify
the quality of water from the study area into three categories; very good, good and poor
groundwater (See Fig. 23).
FIG.23: Udenu LGA showing variations in groundwater quality distribution in the study area
` Source: Field work, 2016.
3.4 Test of Significances in the Variations between Pollutant Concentrations in the Well
and Borehole Water Samples
Our H0 hypothesis states that “there is no statistically significant difference between the
values returned by analyzed groundwater quality parameters at the upland (borehole samples) and
lowland (hand-dug well water samples) sections of the study area”. The null hypothesis is

66
subjected to a student t-test at a 0.05 level of significance. The summary of the results are displayed
in Table 11:
TABLE 11: Test of Significance in the Variations of Parameter Values
S/N Parameters Mean
Value
(upland)
Mean
Value
(lowland)
WHO
(2011)
Bench
mark
t value Degree
of
freedom
p-
value
Decision
Rule
Interpretation
1 Ph 6.15 6.73 6.5-8.5 -2.77 18 0.013 Rejected Significant
2 Temp 26.81 26.4 25 0.82 18 0.42 Accepted Not significant
3 E.C 29.6 160 400 -4.66 9.15 0.001 Rejected Significant
4 Turbidity 1.38 3.59 5.0 -4.15 18 0.001 Rejected Significant
5 Calcium 1.65 4.72 75-200 -4.91 9.5 0.001 Rejected Significant
6 Mg 0.59 3.24 - -6.82 11.23 0.00 Rejected Significant
7 Iron 0.5 0.43 0.3 3.99 18 0.69 Rejected Significant
8 Chloride 8.31 7.53 - 3.81 11.9 0.71 Accepted Not significant
9 Nitrate 1.7 5.16 10 -3.26 11.2 0.007 Rejected Significant
10 TDS 45.49 148 500 -9.57 10.82 0.00 Rejected Significant
11 Alkalinity 12.2 10.16 80-120 1.3 18 0.20 Accepted Not significant
12 Sulphate 5.15 6.6 250 -1.37 18 0.18 Rejected Significant
13 Hardness 8.14 28.5 500 -9.32 9.87 0.00 Rejected Significant
14 T.coliform 0.98 4.5 10 -6.21 11.68 0.00 Rejected Significant
15 E.coli 0.0 0.91 0 -6.38 9 0.00 Rejected Significant
Source: Fieldwork, 2016.
From the mean values of groundwater parameters analyzed and displayed in Table 11, the mean
concentrations values of three pollutants (iron, temperature and E-coli) are higher in the water
samples than the WHO (2011) allowable limits for drinking water. These findings are consistent
with the findings of Ezeigbo (1988) and Ugwueze (2000) which showed that elevated iron and E-
coil concentrations are widespread in groundwater samples in Nigeria and are sometimes
underrated constraints to rural water supply in southeastern Nigeria. The result of the comparison
of the mean values of the analyzed parameters in the upland (boreholes water samples) and the
lowland (hand-dug well water samples) sections revealed that the variations between the mean
values of twelve parameters (pH, EC, turbidity, calcium, magnesium, sulphate, iron, nitrate, TDS,
hardness, total coliform and E-.coli) are statistically significant (p<0.05). However, there were no
statistically significant difference between the mean values of temperature, alkalinity and chloride

67
in the two sections of the study area (p>0.05). As shown in the Table 11, the mean concentrations
values of three pollutants (iron, temperature and E-coil) are higher in the water.

68
CHAPTER FOUR
ANALYSIS OF THE INFLUENCE OF ENVIRONMENTAL FACTORS ON BOREHOLE
AND HAND-DUG WELL WATER QUALITY IN THE STUDY AREA
4.0 Introduction
This chapter focuses on the analysis of the environmental factors which, in our opinion,
contribute to the contamination of hand-dug well and borehole water in the study area.
Understanding the contributions of such factors is necessary in designing efficient and effective
water protection strategies (Wateraid, 2011). These factors have earlier been described in section
1.8.3. As noted in section 1.8.3, the factors were grouped into two as natural and anthropogenic
factors. To achieve this, we first present the statistical summaries of the results of borehole and
hand-dug well water quality parameters in both the upland (boreholes) and lowland (wells)
sections of the study area and the perception of experts on the causes of elevated concentration of
pollutants in some of the communities.
4.1 Statistical summary of groundwater parameters
Table 12 presents the statistical summary of the observed borehole water hydro-chemical
and bacteriological parameters in the upland section of the study area.
TABLE 12: Statistical Summary of Groundwater Parameters of the Upland Area Parameters Units Mean Min Max SD No of Locations with
values exceeding the
WHO(2011)/NSDWQ
(2007)Benchmark
Ph** - 6.15 5.2 6.7 0.46
7
Temperature 0C 26.81* 25.4 28.6 1.12 10
Electrical conductivity mS/m 29.6 16 43 8.25 Nil
Turbidity (NTU) 1.37 0.22 2.6 0.80 Nil
Calcium mg/l 1.66 1.3 2.4 0.32 Nil
Magnesium mg/l 0.59* 0.22 1.54 0.41 10
Iron mg/l 0.50* 0.14 1.41 0.45 9
Chloride mg/l 8.31 3.2 20.1 5.99 Nil
Nitrate mg/l 1.70 0 3.4 1.12 Nil
Total dissolved solids mg/l 45.49 28 63 10.31 Nil
Alkalinity mg/l 12.2 8 19 3.99 Nil
Sulphate mg/l 5.15 2.4 8.6 2.02 Nil
Hardness mg/l 8.14 6.2 11.2 1.48 Nil
Coliform cfu/100ml 0.98 0.01 2.87 0.83 Nil
Escherichia coli cfu/100ml 0 0 0 0.0 Nil *Mean values that exceeded WHO (2011)/NSDQ(2007) Benchmark. **Parameter that returned extremely low values

69
As shown in Table 12, seven out of the ten sampled sites returned low pH values for the
borehole water, which were clear signs of alkalinity. The sites with low pH values are BH1&BH2
(Amalla), BH3 (Umundu), BH5 & BH6 (Imilike-Uno), BH8 (Ezimo-Uno), BH9 (Orba-Uno).
These communities are found in the upper section of the study area which is characterized by low
HCO3 and high Fe content. The low pH values of the water samples in affected communities,
according to experts opinions obtained from the Evaluation and Monitoring Unit of the Enugu
State Water Corporation and other experts such as borehole managers, may have resulted from
both the rock type and runoff waterways that moisturize the area and increase the dissolved organic
carbon (DOC), which will eventually lead to a decrease in pH. This is similar to the findings of
(Kura et al., 2013). The dissolution of rocks that are of acid origin is a frequently reported, cause
of low pH in water.
The temperatures recorded in the ten sampling locations of the upland communities, of the
study area, were well above the WHO recommended limits of (250C) for drinking water quality.
Changes in temperature, as noted earlier, affect living organisms. The rates of biological and
chemical reactions depend to a large extent on temperature. The high temperatures recorded in the
different communities of the study area were reported to have resulted from geothermal gradient
which is the rate of increasing temperature with respect to increasing depth in the earth’s interior.
The geothermal gradient varies with location and is typically measured by determining the bottom
open-hole temperature after borehole drilling The depth of the sampled boreholes were found to
be very high (mean depth = 168.3meters). As EPA (2001) noted, there is a positive correlation
between borehole depths in many regions with borehole water temperature. This suggests that
temperature is largely controlled by depths.

70
As shown in Table 12, the mean values of iron were above the WHO (2011) benchmark
for drinking water supplies. In fact, in all the sample stations (except BH1,) recorded values for
this parameter were above the WHO and NSDWQ permissible limit of (0.3mgl) for human use.
Iron exists naturally in rivers, lakes, and underground water (Ezeigbo, 1988). The sources cited
earlier added that iron may also be released to water from natural deposits, industrial wastes,
refining of iron ores and corrosion of iron containing metals. When the groundwater with higher
concentration of iron is abstracted, it quickly oxidizes to ferric state in the form of insoluble ferric
hydroxide, a brown substance. Field investigations revealed that the observed high iron loads in
the water samples could not have come from industrial effluents refining ores, but could have
possibly come from corrosion of iron metal as these existed in borehole environments. In fact the
staff of the Evaluation and Monitoring Unit of the state water agency interviewed stated
emphatically that the high iron contents in the water samples must not have come from the
anthropogenic sources but from rock and soil deposits in study area. Ezeibgo (1988) also
established that iron is a very common element that is found in many rocks and soils of the study
area and these must have been the source of this pollutant in the samples. The work of Ocheri,
(2009) concurs with these findings.
The mean and other values for magnesium in all the sampled stations are above the
permissible limit (0.2mg/l) of NSDWQ for human use. The major sources of magnesium are from
amphiboles, olivines, pyroxenes, dolomite, magnesite and clay minerals (Ugwueze, 2000). These
elements, like magnessium, are found mainly in rocks and soils especially where chemical
reactions influence and redox release the pollutant into groundwater aquifers. This is similar with
the findings of (Ugwueze, 2000; Kural et al., 2013; Onunkwo et al., 2014). The dissolution of
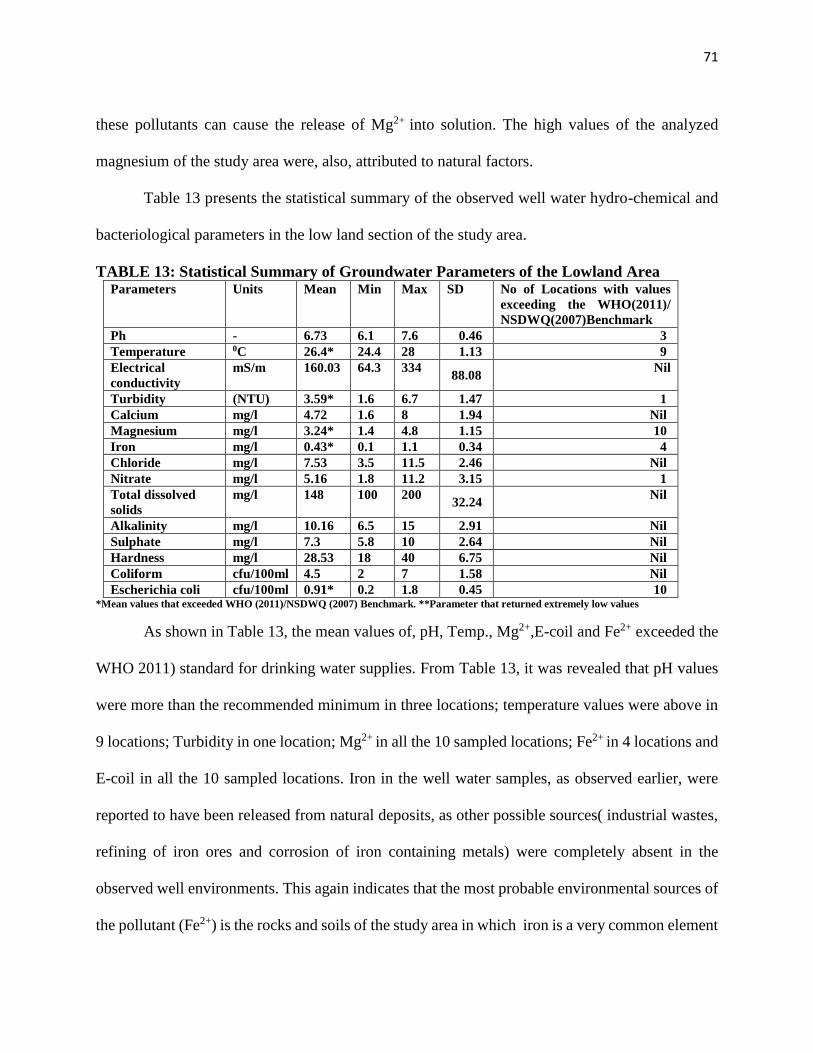
71
these pollutants can cause the release of Mg2+ into solution. The high values of the analyzed
magnesium of the study area were, also, attributed to natural factors.
Table 13 presents the statistical summary of the observed well water hydro-chemical and
bacteriological parameters in the low land section of the study area.
TABLE 13: Statistical Summary of Groundwater Parameters of the Lowland Area Parameters Units Mean Min Max SD No of Locations with values
exceeding the WHO(2011)/
NSDWQ(2007)Benchmark
Ph - 6.73 6.1 7.6 0.46 3
Temperature 0C 26.4* 24.4 28 1.13 9
Electrical
conductivity
mS/m 160.03 64.3 334 88.08
Nil
Turbidity (NTU) 3.59* 1.6 6.7 1.47 1
Calcium mg/l 4.72 1.6 8 1.94 Nil
Magnesium mg/l 3.24* 1.4 4.8 1.15 10
Iron mg/l 0.43* 0.1 1.1 0.34 4
Chloride mg/l 7.53 3.5 11.5 2.46 Nil
Nitrate mg/l 5.16 1.8 11.2 3.15 1
Total dissolved
solids
mg/l 148 100 200 32.24
Nil
Alkalinity mg/l 10.16 6.5 15 2.91 Nil
Sulphate mg/l 7.3 5.8 10 2.64 Nil
Hardness mg/l 28.53 18 40 6.75 Nil
Coliform cfu/100ml 4.5 2 7 1.58 Nil
Escherichia coli cfu/100ml 0.91* 0.2 1.8 0.45 10 *Mean values that exceeded WHO (2011)/NSDWQ (2007) Benchmark. **Parameter that returned extremely low values
As shown in Table 13, the mean values of, pH, Temp., Mg2+,E-coil and Fe2+ exceeded the
WHO 2011) standard for drinking water supplies. From Table 13, it was revealed that pH values
were more than the recommended minimum in three locations; temperature values were above in
9 locations; Turbidity in one location; Mg2+ in all the 10 sampled locations; Fe2+ in 4 locations and
E-coil in all the 10 sampled locations. Iron in the well water samples, as observed earlier, were
reported to have been released from natural deposits, as other possible sources( industrial wastes,
refining of iron ores and corrosion of iron containing metals) were completely absent in the
observed well environments. This again indicates that the most probable environmental sources of
the pollutant (Fe2+) is the rocks and soils of the study area in which iron is a very common element

72
(Ezeigbo, 1988). It also agrees with the work of (Onunkwo et al., 2014) on the quality of waters
from perched aquifers in Nsukka south east.
Turbidity, as shown in Table 13, returned a high value in HDW 3 which is clearly above
the WHO (2011) standard for drinking water. Turbidity, as noted previously, is a measure of
transparency (clarity) or the cloudiness of water due to fine suspended colloidal particles of clay
or silt, waste effluents or microorganisms contained in water. The recorded values for turbidity
for the entire sampled well are low except HDW 2 as summarized in Table 13. Turbidity in water
samples often result from clay, silt, and finely divided soluble inorganic and organic matter
(USGS, 2015). So this high load of turbidity in HDW 2 is an indication of the fact that parent rock
mineralogy is responsible for the turbidity as the hand-dug well is developed in an area rich in fine
particles of clay or silt. This result is similar to the findings of Olomukoro and Oviojie (2014), on
the contamination of hand-dug wells in Udu communities of Delta state.
Values of pH which were lower than the WHO (2011) benchmark were returned in three
well samples. As noted in the borehole samples earlier described earlier, pH values of a water
sample measures its hydrogen ion concentration and indicates whether the sample is acidic, neutral
or basic(EPA, 2001). The observed scenarios were attributed to the shallowness of the wells and
probable dissolution of some rocks that are of acid origin. Interviewees stressed that pH of ground
water can also be lowered by organic acids from decaying vegetation, or from the dissolution of
sulphide minerals and/or carbon dioxide (from organic matters present in the soil). Our informed
respondents opined that any of these could have dissolved and percolated into the aquifer system
of the study area. It is similar to the findings of (Kural et al., 2013; Onunkwo et al., 2014).
Nitrate returned a relatively high value which was above the WHO (2011) standard in one
(HDW 8) sample location. Nitrate shows the effects of organic pollution in water samples. It is the

73
oxidation of ammonium to nitrite followed by the oxidation of nitrite to nitrate by group of
organisms in the environment. High nitrate concentrations have been recorded in similar
groundwater studies in shallow hand-dug well like; (Adelana, et al., 2005; Ifabiyi, 2008; Onunkwo
et al., 2014). Similarly, the high loads of Mg2+ in the hand-dug well water samples were reported
to be from magnesium dolomite and magnesite which are found in some parts of the area. These
elements, like iron, are found mainly in rocks and soils and may be released into the aquifer system,
especially, where chemical reactions influence redox reaction due to leaching from organic
pollutants. The dissolution of these pollutants can cause the release of Mg2+ into solution. The
observed high loads magnesium in the hand-dug well water of the study area is, therefore, due to
natural factors. It is consistent with the findings of (Kural et al., 2013) but differs from the work
of (Olomukoro and Oviojie 2014), which was attributed to the mineral composition of the
environment of the shallow groundwater.
From the analysis of groundwater samples taken from all the hand-dug wells in the study
area , Escherichia coli was recorded in all the hand-dug wells sampled which is an indication of
faecal pollutant. The presence of the Escherichia coli in the hand-dug well water samples is a clear
indication of contamination of water supplies. E.coli indicates faecal contamination of drinking
water which can cause some types of clinical syndromes namely, urinary tract infection, diarrhea
orgastroenteritis, pyogenic infection and septicaemia (EPA, 2001). The presence of this pollutant
was attributed to the unhygienic conditions around well environments which favour the growth of
microorganisms. This is consistent with the work of (Owuna, 2012; Isikwue et al., 2011).

74
Plate 5: A hand-dug well under hung clothes and close to kitchen in Obollo-Etiti
Plate 6: Effluent from bathroom less than 5m to groundwater source in Ogboduaba
Plate 7: A hand-dug well under a moringa tree with a roaming fowl on well cap in Obollo-eke

75
Table 14 shows the reported causes of groundwater water contamination in the study area
while Figures 24, 25, 26 and 27 show the concentration of water pollutants in boreholes and hand
–dug well the study area.
TABLE 14: Reported Causes of Boreholes/well water Contamination Sample
Location
Sample
Code
Pollutant(s) Reported Cause(s) Category
Amalla BH1 Ph Acid from rain or leachates from wastes Natural/Anthropogenic
Temp(0C) Depth to water table and heat transfer
capability of rocks.
Natural
Mg2+ Deposits of magnesium minerals in
rocks/soil.
Natural
BH2 pH Acid from rain or leachates from
wastes.
Natural/Anthropogenic
Temp(0C) Depth to water table and heat transfer
capability of the rock.
Natural
Mg2+ Deposits of magnesium minerals in
rocks/soil.
Natural
Fe Deposits of iron minerals in rocks/soil. Natural
Umundu
BH3
pH Acid from rain or leachates from
wastes.
Natural/Anthropogenic
Temp(0C), Depth to water table and heat transfer
capability of the rock.
Natural
Mg2+ Deposits of magnesium minerals in
rocks/soil.
Natural
BH4
Temp(0C) Depth to water table and heat transfer
capability of the rock.
Natural
Mg2+ Deposits of magnesium minerals in
rocks/soil.
Natural
Fe Deposits of iron minerals in rocks/soil. Natural
Imilike-Uno BH5 pH Acid from rain or leachates from
wastes.
Natural/Anthropogenic
Temp(0C) Depth to water table and heat transfer
capability of the rock.
Natural
Mg2+ Deposits of magnesium minerals in
rocks/soil.
Natural
Fe2+ Deposits of iron minerals in rocks/soil. Natural
BH6 pH Acid from rain or leachates from
wastes.
Natural/Anthropogenic
temp(0C) Depth to water table and heat transfer
capability of the rock.
Natural
Mg2+ Deposits of magnesium minerals in
rocks/soil.
Natural
Fe Deposits of iron minerals in rocks/soil. Natural
Ezimo-Uno BH7
Temp(0C) Depth to water table and heat transfer
capability of the rock.
Natural
Mg2+ Deposits of magnesium minerals in
soil/rocks.
Natural
Fe2+ Deposits of iron minerals in rocks/soil. Natural
BH8
pH Acid from rain or leachates from
wastes.
Natural/Anthropogenic
Temp(0C) Depth to water table and heat transfer
capability of the rock.
Natural

76
Mg2+ Deposits of magnesium minerals in
rocks/soil.
Natural
Fe2+ Deposits of iron minerals in rocks/soil. Natural
Orba BH9 pH Acid from rain or leachates from
wastes.
Natural/Anthropogenic
temp(0C) Depth to water table and heat transfer
capability of the rock.
Natural
Fe2+ Deposits of iron minerals in rocks/soil. Natural
Mg2+ Deposits of magnesium minerals in
rocks/soil.
Natural
BH10
Temp(0C) Depth to water table and heat transfer
capability of the rock.
Natural
Mg2+ Deposits of magnesium minerals in
rocks/soil.
Natural
Fe2+ Deposits of iron minerals in rocks/soil. Natural
Obollo-Eke HDW1
Temp(0C) Depth to water table and heat transfer
capability of the rock.
Natural
Mg2+ Deposits of magnesium minerals in
rocks/soil.
Natural
Fe2+ Deposits of iron minerals in rocks/soil. Natural
E.choli The presence of E.coli in water is an
indication that faecal contamination by
human or animal wastes have occurred.
Anthropogenic
HDW2
Temp(0C) Depth to water table and heat transfer
capability of the rock.
Natural
Turbidity High clay and silt content in the soil. Natural
Mg2+ Deposits of magnesium minerals in
rocks/soil.
Natural
Fe2+ Deposits of iron minerals in soil/rocks. Natural
E.coli The presence of E.coli in water is an
indication that faecal contamination by
human or animal wastes have occurred.
Anthropogenic
Obollo-Etiti HDW3
Temp Depth to water table and heat transfer
capability of the rock.
Natural
Mg2+ Deposits of magnesium minerals in
rocks/soil.
Natural
Fe2+ Deposits of iron minerals in rocks/soil. Natural
E.coli The presence of E.coli in water is an
indication that faecal contamination by
human or animal wastes have occurred.
Anthropogenic
HDW4
pH Acid from rain or leachates from wastes Natural/Anthropogenic
Temp(0C), Depth to water table and heat transfer
capability of the rock.
Natural
Mg2+ Deposits of magnesium minerals in
rocks/soil.
Natural
Fe2+ Deposits of iron minerals in rocks/soil. Natural
E.coli The presence of E.coli in water is an
indication that faecal contamination by
human or animal wastes have occurred.
Anthropogenic
Ogboduaba HDW5 pH Acid from rain or leachates from
wastes.
Natural/Anthropogenic
Temp(0C) Depth to water table and heat transfer
capability of the rock.
Natural
Mg2+ Deposits of magnesium minerals in
rocks/soil.
Natural
Fe2+ Deposits of iron minerals in rocks/soil. Natural

77
E.coli The presence of E.coli in water is an
indication that faecal contamination by
human or animal wastes have occurred.
Anthropogenic
HDW6 Temp(0C) Depth to water table and heat transfer
capability of the rock.
Natural
Mg2+ Deposits of magnesium minerals in
rocks/soil.
Natural
E.coli, The presence of E.coli in water is an
indication that faecal contamination by
human or animal wastes have occurred.
Anthropogenic
Imilike-Agu HDW7 pH Acid from rain or leachates from
wastes.
Natural/Anthropogenic
Temp(0C) Depth to water table and heat transfer
capability of the rock.
Natural
Mg2+ Deposits of magnesium minerals in
rocks/soil.
Natural
E.coli The presence of E.coli in water is an
indication that faecal contamination by
human or animal wastes have occurred.
Anthropogenic
HDW8 Mg2+ Deposits of magnesium minerals in
rocks/soil.
Natural
Nitrate Application of fertilizers and pesticides
in farmlands.
Anthropogenic
E.coli The presence of E.coli in water is an
indication that faecal contamination by
human or animal wastes have occurred.
Anthropogenic
Ezimo-Agu HDW9
Temp(0C) Depth to water table and heat transfer
capability of the rock.
Natural
Mg2+ Deposits of magnesium minerals in
rocks/soil.
Natural
E.coli The presence of E.coli in water is an
indication that faecal contamination by
human or animal wastes have occurred.
Anthropogenic
HDW10
Temp(0C) Depth to water table and heat transfer
capability of the rock.
Natural
Mg2+ Deposits of magnesium minerals in
rocks/soil.
Natural
E.coli The presence of E.coli in water is an
indication that faecal contamination by
human or animal wastes have occurred.
Anthropogenic
Source: Fieldwork, 2016
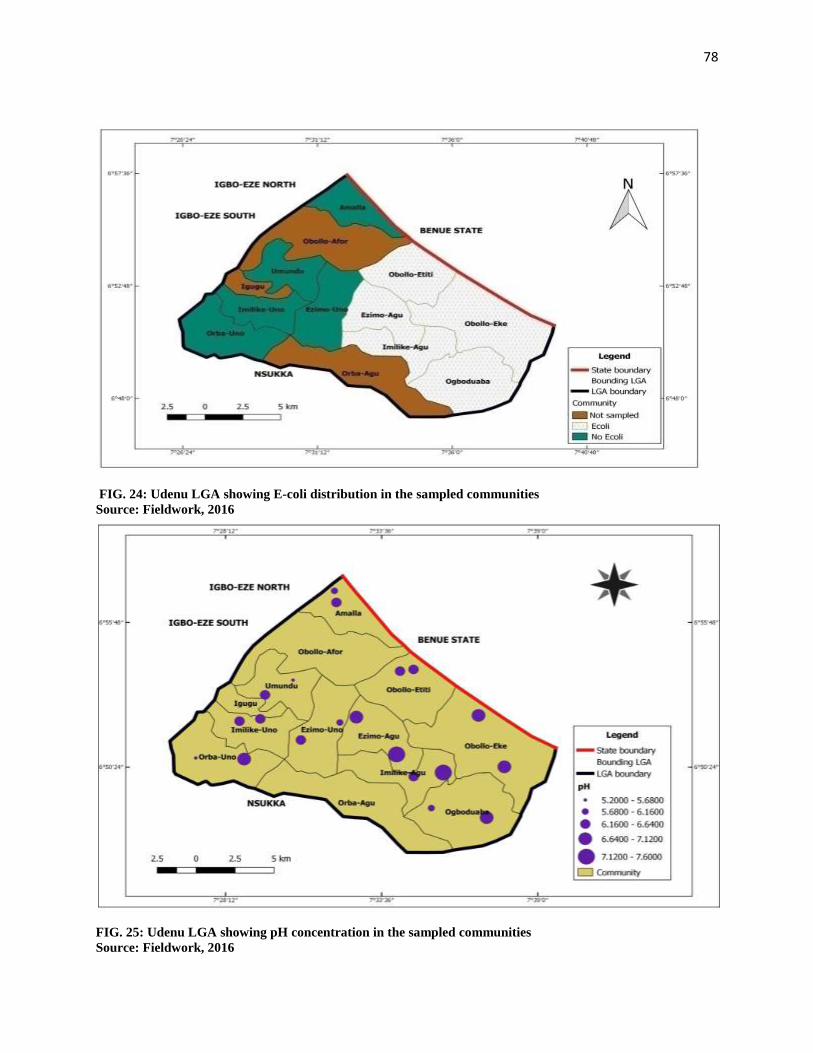
78
FIG. 24: Udenu LGA showing E-coli distribution in the sampled communities
Source: Fieldwork, 2016
FIG. 25: Udenu LGA showing pH concentration in the sampled communities
Source: Fieldwork, 2016

79
FIG. 26: Udenu LGA showing temperature concentration in the sampled communities
Source: Fieldwork, 2016
FIG. 27: Udenu LGA showing magnesium concentration in the sampled communities
Source: Fieldwork, 2016

80
4.2 Principal Component Analysis of the Environmental factors Affecting Borehole and
Well Water Quality in the Study Area
To further strengthen our analysis on the influence of environmental factors on borehole
and hand-dug well water contamination in our study area, we applied PCA to the 14 natural and
anthropogenic factors earlier identified and described in section 1.8.3 by making use of the
obtained weighting score values of the environmental factors. PCA is the most widely used
technique among the families of multivariate statistical analysis (Kura et al, 2013). It is a technique
which identifies patterns in data and then presents them based on their similarities and differences.
The main aim of PCA is to summarize a multivariate dataset by reducing the statistical noise in
the data, exposing the outlier, and then arranging the components in descending order (from the
largest contributor to the least) as accurately as possible with as few principal components as
possible (Kura et al, 2013). Normally the first few PCs will interpret the variables with the highest
variance in the case of large differences in variance.
Only components with eigen values greater than 1 are considered to be the most important
and the possible sources of variance in the data set; with the highest priority ascribed to the
component that has the highest eigen value, (Kaiser, 1960). As such, any component that displays
an eigen value greater than 1.00 is believed to be responsible for a greater amount of variation than
is contributed by one variable. Thus a component with such a characteristic is responsible for a
significant amount of variance and deserves to be retained. This is because the higher the eigen
value of a component, the greater the contribution of that particular component to the variability
of the environmental variables in the area. Also, for the interpretation of the factors that are of high
significance without changing the variance, factor rotation using varimax, which is the most
popular rotation technique (Kaiser, 1960) was employed. Thus, the 14 variables identified and

81
used in our analysis were reduced to five principal components (See Table 15). This is because
each of the observed variables contributes one unit of variance to the total variation in the data set.
The threshold significant loading used in this study is +/-0.7
TABLE 15: Factor loading after varimax rotation Eigen value, variability, and cumulative%
of each of the extracted components of environmental variables
Variables Component
1 2 3 4 5
Nature of water collector .889 -.029 -.041 .171 -.069
Fencing .888 -.004 .014 -.036 .078
Nature of well/borehole
development .877 -.164 .175 .309 -.036
Nature of well/borehole cap .848 -.096 .137 .394 -.025
Presence of animal .692 .179 .132 .048 .520
Rock -.179 .882 .079 -.044 .203
Natural hazards .063 .801 .022 .066 -.433
Soil type -.534 .590 .154 -.036 .503
Topography .178 .495 .313 .415 .219
Vegetation cover -.105 .041 .922 .108 .037
Farm wastes .399 .170 .777 -.074 .150
Septic/latrine .310 -.156 -.186 .867 .046
Household wastes .146 .335 .343 .754 -.215
Fertilizer .053 -.010 .088 -.043 .947
Eigen Values 4.825 2.916 1.816 1.198 1.079
% of Variance 34.464 20.828 12.971 8.555 7.704
Cumulative % 34.464 55.292 68.263 76.818 84.522
The PCA result consists of five components that cumulatively account for 84.5% of the
total variance in the environmental factors. The first component which normally accounts for the
most significant process explains 34.4% of the total variance with an eigen value of 4.8. The
component has high loadings on: nature of water collector, fencing, nature of well/borehole
development, and nature of well/borehole cap. This component shows the influence of poor hand-
dug well and borehole protection in the study area.
Component 2 accounts for 20.8% of the total variance with an eigen value of 2.9. It consists
of high loading of rock type and natural hazard. This component shows the influence of mineral

82
properties of the rocks in the study area. Groundwater is influenced by the rock, and geology that
the water flows through because of various minerals being hosted underground. Also, coarse
material like sand and gravel transmit disssolved pollutants more rapidly than finer materials like
clay and silt (Jamieson and Gorden, 2012). The study area is characterized by two different
underlying rock materials: sandstone(prevalent in the upland area) which is porous and shale
(prevalent in the lowland area) which is less porous (Ofomata, 1978).
Component 3 accounts for 12.9% of the total variance with an eigen value of 1.8. This
component shows high loading of vegetation cover which is an evidence of the influence of
vegetal pollutants and impurities. Litters of plants fall into uncovered hand-dug wells and
contaminate the hand-dug well water. Also, dissolved organic matter significantly increase the
susceptibility of wells and boreholes in such areas to contamination which can easily be carried
into the groundwater by rain percolating through the soils. Surface runoff can as well carry litters
of plants into hand dug wells especially the unprotected ones.
Component 4 accounts for 8.5% of the total variance with an eigen value of 1.1. This
component shows high loading of septic/latrine and household wastes. This is an indication of
unsanitary surroundings around the hand-dug well and borehole environments. Poorly
constructed septic tanks and pit latrines pose major threat to groundwater quality. These septic
tanks and pit latrines are most often located within a 15 m radius to the sampled groundwater. Pit
latrines are dug to about 8-9m which is the average water table of the communities in the lowland
areas. The liquid effluent from a septic system or pit latrines follow the same path as the rain that
percolates into the unsaturated zone. Like the rain, once the effluent reaches the water table, it
flows down the hydraulic gradient, which may be roughly parallel to the slope of the land, to lower
points (Waller, 2013). Thus, again, the location of one's house in relation to neighbouring houses,
83
both upslope and down slope is important. In rural communities where houses are nucleated and
everybody has either a septic tank or pit latrines, effluent recycling can occur if the wells are
shallow or the septic systems and pit latrines are improperly placed (Waller, 2013). Deep wells are
less likely to draw in septic waste. Microbial loads (Escherichia coli) were found in all the hand
dug wells from the five different communities in the lower side of the divide.
Finally, component 5 accounts for 7.7% of the total variance with an eigen value of 1. The
component shows high loading of fertilizer. This is an indication of the influence from
agricultural pollutants in the study area. In the study area of Udenu LGA, every available and
unoccupied land is seen as a viable space for agriculture. Fertilizers and pesticides applied near
features that allow direct access to the water table such as areas with light, sandy soils and a
shallow water table have a high risk of groundwater contamination (Hess et al., 2003).

84
CHAPTER FIVE
PLANNING IMPLICATIONS OF THE FINDINGS AND OPTIONS FOR IMPROVED
GROUNDWATER MANAGEMENT IN THE STUDY AREA
5.0 Policy Implications of the Findings
Groundwater contamination is exacerbated by natural and human related factors. The
factors exhibit differing degrees of severity, particularly with regards to water drawn from
boreholes and hand-dug wells extracted and used in rural communities. The poor water quality
extracted from all the hand-dug wells and 30% of the sampled boreholes in the study area are
attributable to a number of environmental factors, many of which have been isolated by earlier
workers (Ezeigbo, 1988) and so are not unique to the study area.
The threats posed to borehole and hand-dug well water quality in the study area, as revealed
by this study are, however, huge. This work will provide policy makers, borehole managers and
water resources development agencies with knowledge of precise hand-dug well and borehole
water quality problems affecting the study area and can also serve as a guide for the
hydrochemistry assessments of other rural areas in Nigeria that share similar characteristics with
our study area. It may also assist policy makers to isolate sustainable strategies which can
minimize the complex interactions of multiple factors such as host rock, soil characteristics,
topography, and anthropogenic activities that influence the groundwater zone of the varied terrain
of the upland and lowland sections of the study area. This is essential in order to diversify the
economy of the rural communities, achieve universally adopted sustainable development goals,
including ending poverty, enhancing the ecological support functions of water resources in the
area and ensuring that the people enjoy peace and prosperity. Also in the rural communities of our

85
study area, where houses are nucleated and everybody has either a septic tank or pit latrines,
effluent recycling can occur if the wells are shallow or the septic systems and
pit latrines are improperly placed. This work would help provide knowledge to evaluate the
potential hazards arising from the housing pattern with regards to the implications of the locations
of septic/pit latrines and waste-disposal on groundwater quality in the study area. The knowledge
provided from this work may also aid land planning activities in the area. This is needed to ensure
that land development activities take place in areas appropriate to each type of development as this
will help reduce runoff in the area which occasionally washes down to the corresponding lowland
communities.
Groundwater is an important yet vulnerable resource. It is vulnerable to pollutants arising
from a variety of sources. Once contaminated, remediation is a very costly and takes lengthy
process; often by the time the pollution is identified, the aquifer is damaged beyond repair.
Therefore, there is need for well-thought out policy guidelines on its extraction, recharge,
assessment, monitoring, protection and proper management in order to continually improve the
quality and enhance sustainability.
5.1 OPTIONS FOR IMPROVED HAND-DUG WELL/BOREHOLE WATER
MANAGEMENT IN THE AREA
The measures discussed below may assist to achieve sustainability in groundwater resource
management in the area.
5.1.1 Control of Agricultural Inputs used on farms
In some countries like Canada communities restrict the amount and types of chemicals that
can be stored on farms (NWMQS, 1995). This helps to reduce the impacts of agricultural
production on groundwater quality. Farmers in our study area may achieve similar goals through

86
the control of treatment chemicals, (pesticides) animal feeding operations and fertilizer use around
hand-dug well/borehole environments. Pesticide application rate need to be reduced in lowland
section of the study area with light, sandy soils and a shallow water table to reduce the risk of
groundwater contamination. Also, instead of fertilizer broadcasting application methods in areas
with steep slopes; applying it through holes dug and covered with soil may be better. This allows
infiltration and discourages runoff in areas.
5.1.2 Sanitation around the wells/borehole environments.
Pit latrines and septic tanks are widely used in rural area. There are specific options or
recommendations provided for minimizing latrine effect on groundwater quality. Dzwairo et al.,
(2006) for instance, highlight the need to ;1)analyze critical parameters such as depth of the
infiltration layer and direction of groundwater flow; 2) develop alternative sanitation options, such
as raised or lined pit latrines, to minimize ground water impacts; and 3) apply an integrated
approach, involving geotechnology and hydrogeology to solve sanitation problems. Pujari et al.,
(2012) suggested that systematic lithological and hydro geological mapping be conducted and that
parameters such as the depth of the water table, soil characteristics, and rock strata be considered
prior to installing latrines. Banks et al., (2002) suggest that pit latrines should be located no less
than 15–30 m from ground water abstraction points and should terminate no less than 1.5–2.0 m
above the water table. Banerjee (2011) note that the safe distance between a pit latrine and water
source is 10 m. Vinger et al., (2012) suggest that wells are likely to be contaminated if pit latrines
are < 12 m away. WaterAid (2011) suggests that latrines and water sources should be at least 50
m apart. Latrines in our study area must be sited at least 30 m from any well/borehole and the
bottom of the pit must be at least 1.5 m above the maximum height of the water table; while
sanitation systems that separate effluent and solid material should be considered.

87
5.1.3 Awareness Creation
The quality of groundwater in the rural communities of Udenu LGA cannot be well
managed and improved upon when the level of understanding of groundwater by the lay public is
poor. This is in terms of understanding how their activities affect hand-dug well/borehole water
quality. For example, from the field survey, 91% of the sampled population indicated no fear that
the fertilizer applied on farmland are being washed into their water source. This statistic shows
their level of knowledge, hence, the need for public education. Public education is the
comprehensive provision of information to the public to improve awareness of the nature, value
and sensitivity of groundwater resources. Public participation is the involvement of various sectors
of the community in the development and implementation of programs to protect, conserve, use
and monitor groundwater resources (NWMQS, 1995). A first step may be to form task forces that
both inform the users through several channels. The channels could include public seminars, town
hall meetings, and meeting with local public officials and interest groups.
5.1.4 Institutional Support Programme
The management of groundwater quality in rural communities of the study area could still
be addressed through the Institutional support programme strategy as was done in South Africa.
This may, among other things, involve the use of extension services to advise and assist
communities to implement groundwater protection programmes.
5.1.5 Aquifer Classification
This approach has been widely used and recognized in developed world as an effective
strategy in managing groundwater quality. Aquifer classification is used as a means of establishing
the degree of protection that an aquifer may require. NWMQS (1995) observe that it is a common
practice in U.S.A, New Zealand, and Australia while DWAF (2000) also observe the need for

88
aquifer classification program to protect the groundwater resource of South Africa. A working
example of a comprehensive aquifer classification system is the one developed and adopted by the
State of Connecticut in the United States (NWMQS, 1995). The System is a four-class groundwater
classification system based on water use. The most protected class applies to water utility and
municipal drinking water supplies. The next two classes apply to private drinking water supplies,
and water supplies that may require treatment to make them potable because of past impacts upon
water quality. The final class designates areas where there are no plans to use groundwater and in
which certain treated industrial wastes and major residential waste disposal practices are allowed.
In South African aquifers, it is differentiated between those requiring extensive protections, those
requiring protection based on best management practices and those not requiring specific
protection.
5.1.6 Remediation Strategy
Remediation actions make up an important part of groundwater quality management
functions (DWAF, 2000). Ocheri (2009), also cited the adoption of this strategy which has been
effective in the remediation of the effects of pollution in groundwater of South Africa. This strategy
is required where contaminants of groundwater is occurring or has already occurred and where it
is not possible or practicable to apply the law to enforce remediation, where the responsible person
or persons cannot be identified or where the responsible persons have failed to comply with the
provisions of the law. For example; in the study area some parameters such as iron (Fe2+), were
noted to be in concentration above the WHO and NSDWQ standard. This notable concentration
could be remedied through the reverse osmosis process. This process is a water purification
technology that uses a semi permeable membrane to remove ions, molecules, and larger particles
from drinking water.

89
5.1.7 Monitoring System
Water quality within the aquifer of the study area needs to be monitored to protect
against contamination. NWMQS (1995), is of the view that Monitoring the pumping well alone
is inadequate as no warning of an imminent contamination incident is provided. Hence,
monitoring is needed within the aquifer at positions which have sufficient distance up-gradient to
allow time for preventative and if necessary, remedial action to be implemented in the event of
contamination being detected. Communities such as Dayton, in Ohio USA, have installed
groundwater monitoring wells down gradient of known or potential sources of contamination to
provide early warning of impending water quality problems (EC, 2016). Groundwater near the
contamination sources within the zone also needs to be monitored.

90
CHAPTER SIX
CONCLUSION, SUMMARY AND RECOMMENDATION
6.1 Summary of Research Findings
This study examined the environmental factors affecting the quality of groundwater being
harnessed in the rural communities of Udenu LGA through boreholes and hand-dug wells. The
work adopted the rural water sustainability framework that guided the research work. The
conceptual framework helped to characterize the groundwater and the environmental factors
affecting the water quality in the area.
(1) A characterization of the groundwater sources from the study area was done to describe
the groundwater sources and water use patterns in the rural communities. Groundwater is accessed
through wells and boreholes. The sampled wells are generally hand-dug, shallow, unprotected and
privately owned by households. Conversely, the boreholes are relatively deeper, mechanically
drilled, cased and generally owned by the public. Results show that 78% of the boreholes were
established for the communities by ESWC due to the general absence of reliable alternatives of
water supply in the area. The choice of groundwater that users chose in the sampled communities
was found to depend on the individual household preference and the current state of the nearby
hand dug wells/boreholes.
(2) The physico-chemical and bacteriological characteristics of the study area were examined.
The results of the analyses revealed the following parameters: calcium, chloride, sulphate, total
dissolved solids, total alkalinity, hardness and total coliform to have recorded values that are within
the WHO and the NSDWQ acceptable limit in all the boreholes and hand-dug wells. Magnesium
and temperature recorded values that are above the WHO and NSDWQ guideline limit in all the
boreholes and hand-dug wells in the sampled communities except for HDW8 that recorded

91
temperature value that fall within the WHO and NSDWQ acceptable guideline limit. Conversely,
the parameters between the two sections of the study area showed significant variations between
the two sections of the area. Ph, EC, turbidity, calcium, magnesium, Nitrate, TDS, hardness, Total
coli form count and E-coil values at the lowland section of the study area were generally higher
than values from the upland section. Also, the water quality index of the area was calculated and
the result shows that the quality of groundwater in the study area varies spatially across the sampled
communities.
(3) To determine the influence of the environment on groundwater quality of the study area,
the groundwater pollutants, as well as the fourteen environmental variables were critically
analyzed. The identified environmental variables were rated on a scale of 1-8. Based on experts’
opinions, the groundwater of the study area was found to be influenced by natural and
anthropogenic factors of the environment. Pollutants such as: Mg2+, Fe2+, temperature, turbidity,
were attributed to natural factors, pH were attributed to anthropogenic/natural while E.coli was
attributed to anthropogenic factors. The weighted environmental factors were subjected to PCA
analysis. Consequently, the groundwater of the area was found to be influenced by five
components extracted from the PCA namely; poor hand-dug well/borehole protection, mineral
properties of the rocks, influence of organic pollutants, unsanitary surroundings and agricultural
activities.
(4) The planning implications of the study and options for groundwater management in the
study area environment were examined. The implication of the findings as examined, revealed
that; the research findings provides policy makers knowledge on how to isolate sustainable
strategies to minimize multiple effect of interacting factors that influence groundwater of the study

92
area, provides knowledge on groundwater quality of the study area, provides knowledge on
location of groundwater, proximity of septic tanks to groundwater etc.
The implications of these findings therefore are: (1) Those who depend on groundwater in
the study area (especially on boreholes), for domestic uses including drinking, bathing and even
washing, have water of good quality with a very low public health risks than the users of hand-dug
wells. (2) Environmental factors aid concentration of water parameters; consequently, the quality
is influenced.
6.2 Recommendations:
The results of the analysis reveal that the concentration levels of some of the parameters
are above the WHO and NSDWQ guideline limit for drinking water in some of the sample
locations. From the findings of the research therefore, the following recommendations which are
made in line with the rural water sustainability framework would be necessary to enhance
sustainability:
• Based on our findings, we recommend that it is safer to collect water from the boreholes when
compared to the hand dug wells.
• The Enugu state rural water supply and sanitation agency should ensure that the set objectives of
groundwater development are implemented in the rural communities.
• The state government in collaboration with the local government should consider building a
collective waste disposal facility that would help in proper waste collection in rural communities
to avoid indiscriminate waste disposal in areas close to groundwater sources.
• The State government in collaboration with the local government should form alliance with water
user committee in rural communities so as to enhance effective control of phenomena constituting
pollutants to groundwater.

93
• Groundwater should not be developed in areas of water natural flow-paths or in erosion sites.
• It is encouraged that water from the shallow hand dug wells, should be abstracted with a single
and clean container preferably a plastic rubber.
6.3 Conclusion
This study was undertaken to examine the influence of environmental factors on
well/borehole water in selected rural communities of Udenu LGA. The result of the analysis
showed that well/borehole water in the area is polluted by a host of natural and anthropogenic
factors and the water could be hazardous to human health when used primarily for domestic
purposes. However the physico-chemical and bacteriological parameters of groundwater in the
study area show that the results are somewhat varied between the upland and lowland sections 0f
the study area, with the former being more in line with the safe limits of WHO (2011) benchmark.
The work concludes by recommending that to avoid or minimize well/borehole water
contamination, regulatory authorities, among others things, should closely monitor well/borehole
development and management in the study area.
Suggestions for further studies
During the course of this research work, several aspects on water which were not within
the scope of this study were glaring. Hence, further works in the following areas are encouraged:
1. A study on aquifer vulnerability to pollution in Udenu L.G.A.
2. A study on the effects of seasons on groundwater quality in Udenu L.G.A.
94
REFERENCES
ABRAMS, L (1998): “Understanding Sustainability of Local Water Services”, Retrieved
from..http://www.africanwater.org/ sustainability.htm. 29th November, 2015
ACKAH, M., AGYEMANG, O., ANIM, A.K., OSEI, J., BENTIL, N.O, KPATTAH, L.,
GYAMFI, E.T. and HANSON, J.E.K (2011): “Assessment of Groundwater Quality for
Drinking and Irrigation: the case study of Teiman-Oyarifa Community, Ga East
Municipality, Ghana”. Proceedings of the International Academy of Ecology and
Environmental Science. 3(4), 186-194.
ADAMU, G.K and ADEKIYA, O.A. (2010): “An assessment of Water Quality of Boreholes
around selected landfills in Kano Metropolis”. Journal of Africa Scientist,11(2), 129-133.
ADEDIJI, A. and AJIBADE, L.T (2005): “Quality of Well in Ede Area, Southwestern Nigeria”.
Journal of Human Ecology, 17(3), 223-228.
ADEJO, Y., BAGUDO, B.U., TSAFE, A.I and ITODO, A.U. (2013): “Physico-Chemical Quality
Assessment of Groundwater within Gusau Metropolis”. International Journal of Modern
Analytical and Separation Sciences, 2(1), 1-9.
ADEKUNLE, I. M., ADETUNJI, M. T., GBADEBO, A. M., and BANJOKO, O. B. (2007):
“Assessment of Groundwater Quality in a Typical Rural Settlement in Southwest
Nigeria.” International Journal of Environmental Research and Public Health, 4(4), 307-
318.
ADELANA, S.M.A., ABIYE., T.A., NKHUWA., D.C.W., TINDINUGAYA., C. and OGA., M.S.
(2008): “Urban Groundwater Management and Protection in Sub-Saharan Africa”, in
Adelana, S.M.A and MacDonald, A.M, Applied Groundwater studies in Africa.
International Association of Hydrogeologists, selected papers, Pp. 222-259.
ADELANA, S.M.A., BALE, R.B., and WU, M. (2004): “Water Quality in a Growing Urban
Centre Along the Coast of South Western Nigeria”, in Seilder, K,P.W and Xi, R (eds),
Research Basic and Hydrological planning, Balkama. The Netherlands, Pp. 83-92.
ADELANA, S.M.A., BALE, R.B.,OLASEHINDE, P.I. and WU, M. (2005): “The Impact of
Anthropogenic Activities Over Groundwater Quality of Coastal Aquifer in Southwestern
Nigeria”. Proceedings Aquifer Vulnerability and Risks.2nd International Workshop and
4th Congress on the Protection and Management of Groundwater. Raggia di Colorno-
Parma.

95
ADELANA, S.M.A., BALE., R.B. and WU, M. (2003): “Quality of Assessment of Pollution
Vulnerability of Groundwater in Lagos metropolis, SW Nigeria in”. Proceedings of the
Aquifer Vulnerability Risk Conference AURO3 Salamenia Mexico, (2)1-17.
ADEOYE, P.A., ADEOLU, A.R., and IBRAHIM, H.M. (2013): “Appraisal of Rural Water
Supply: Case Study of Kwara State, North Central Nigeria”. International journal of Basic
and Applied Science,1(4), 816 -826.
ADEPETU, A.A. (1971): The Impact of Improved Rural Water Supplies on Hamar and Human
Tribes. Unpublished PH.D Thesis, University of Ibadan, Nigeria.
ADERIBIGBE, S,A., AWOYEMI, A.O and OSAGBEMI, G.K (2008): “Availability, Adequacy
and the Quality of Water Supply in Ilorin Metropolis, Nigeria”. European
Journal of Scientific Research,(23), 536.
ADETOYINBO, A. and ADEBO, B. (2010): “Quality of Hand-dug Wells in Selected Locations
in Lagos Coastal Aquifer, Nigeria”. 2(3), 51-54. Retrieved from
http://www.sciencepub.net/report.
ADETUNDE, L.A and GLOVER, R.L.K(2010): “Bacteriological Quality of Borehole Water Used
by Students of University for Development Studies, Navrongo Campus in Upper East
Region of Ghana”. Current Research Journal of Biological Sciences, 2(6), 361-364.
ADEYEMO, A.M., NJOKU, B.C and UKPERE, D.T.U. (2009): “Analysis of Rural Water Supply
Problems in NigerDelta: A case study of Alu community”. Proceedings National Rural
Development Seminar on Water Supply, Imo State University, Owerri, Nigeria.
ADEYINKA, S.Y., WASIU, J., and AKINTAYO, C. O. (2014): “Review on Prevalence of
Waterborne Diseases in Nigeria”. Journal of Advancement in Medical and Life Sciences,
1(2), 1-3.
ADEYO, A.U (2003): Factors Responsible for Rural Water Scarcity in Guma L.G.A of Benue
State. Unpublished B.Sc Project department of Geography, Benue State University,
Markurdi, Nigeria.
AGAGU, OK, FAYOSE, E.A. and PETER, S.W., (1985): “Stratigraphy and Sedimentation in the
Senommian Anambra Basin of Eastern Nigeria”. Nigeria Journal of Mineral Geology,
(22) 25-36.
AIDOO, A.E (2013): Effect of Pit Latrines on Dug-well Water Quality - a case study of the
Asankrangwa community in the Wassa-Amenfi west district of Ghana. Unpublished

96
M.Sc Project, Department of Environmental Science, Kwame Nkrumah University of
Science and Technology, Kumasi.
AJAYI, D. AND ADESINA, D. (2005): “Man’s Natural Environment”. In Balogun, S.K and
Taiwo, A.O (ed.), Introduction to Basic Concepts in Government, Society, and Economy
GSP Publication Ibadan, Pp.139-146.
AKOTEYON, I. S. and SOLADOYE, O. (2011): “Groundwater Quality Assessment in Eti-Osa,
Lagos- Nigeria using Multivariate Analysis”. Journal of Applied Science & Environmental
Management. 15(1), 121 – 125.
ALHASSAN, M.M., and FANAN, U (2011): “An Assessment of Ground Water Quality for
Drinking from Hand- Dug Wells in Masaka, Nigeria”. http://works.bepress.
com/fanasn_ujoh/7. Retrieved 10th October, 2015.
AMADI, A.N., OLASEHINDE, P.L., and YISA, J. (2010): “Characterization of Groundwater
Chemistry in the Coastal Plain-Sand Aquifer of Owerri using Factor Analysis”.
International Journal of Physical Science, 5(8), 1306-1314.
AMAH, J.I. (2006): Mathematical Modelling of Groundwater Flow System of a Water Table
Aquifer in Nsukka Area, Southeastern Nigeria. Unpublished Ph.D Thesis, University of
Nigeria, Nsukka.
AMAJOR, L.I (1986): “Geochemistry Characteristics of Groundwater in PortHarcourt and
Environs”. Proceedings NIWASA SYMPOSIUM Ikeja, Lagos Nigeria, Pp.365-374.
ANBALANGAN, S. and ARCHANA, M. NAIR (2004): “Geographic Information System and
Groundwater Quality Mapping in Pavel Basin, Maharashtra, India”. Environmental
Geology, (45)753-761.
ANON, J. (1996): World water Environmental Engineering. Cambridge University Press, United
Kingdom.
ANTHONY, U., ANIEKAN, E. and OFFIONG, O. (2012): “Application of Statistical Methods in
Evaluating Groundwater in Parts of Mamfe Embayment, Southeastern Nigeria”. Journal
of Geography and Geology, 4(3), 1-14.
APER, J.A and AGBEHI, S.I., (2011): Determining factors of Rural Water Supply Pattern in
Ugbokolo Community, Benue State, Nigeria. Journal of Sustainable Development, 4 (2).

97
APHA. (1992). American Public Health Association. Standard Methods for the Examination of
Water and Wastewater. 18th Ed.Washington, D.C.
APPELO, C.A., and POSTMA, D.C. (2005): Geochemistry of Groundwater and pollution.
Published by Balkema, Leiden.
APPLEYARD, S. (2006): “Agriculture: Control and protection” in World Health Organization,
Protecting Groundwater for Health: Managing the Quality of Drinking-water Sources.
(ed). Published by IWA Publishing, London, UK.
ARAVINDAN, S., SANKARAN, S., MANIVEL, M., and CHANDRASEKAR, S.V.N (2003):
“Geochemical Modelling of Groundwater by Principal Component Analysis in Hard Rock
Area of Galdilam, Tamil Nadu”. Indian Association of Geochemists, (18) 19-31.
AREOLA, O. (1982): Soil: Nigeria in Maps, Pp. 22-23
ASHBOLT, N.J.(2004): “Microbial Contamination of Drinking Water and Diseases Outcomes in
Developing Regions”. Toxicology, (198) 229-238.
AYANTOBO, O. O., OLUWASANYA G. O., IDOWU O. A. and ERUOLA A. O. (2012): “Water
Quality Evaluation of Hand-dug Wells in Ibadan, Oyo State, Nigeria”. Special Publication
of the Nigerian Association of Hydrological Sciences, Pp. 231-239
AYENI, A.O., BALOGUN, I.I. and SONEYE, A.S.O. (2011): “Seasonal Assessment of Physico-
Chemical Concentration of Polluted Urban River: Case of Ala River in Southern Nigeria”.
Research Journal of Environmental Science, 5(1), 22-33.
AYOADE, J.O. (1988): Tropical Hydrology and Water Resources. Macmillian Publishers Ibadan.
BABA, A., KAYA, A. and BIRSOY Y.K. (2003) “The Effect of Yatagan Thermal Power Plant
(Mugla, Turkey) on the Quality of Surface Ground waters”. Water, Air and Soil Pollution,
Environment Pollution, (149), 93-111.
BANERJEE, G. (2011): “Underground pollution travel from leach pits of on-site sanitation
facilities: a case study”. Clean Technol Environ Policy 13(3),489–497.
BANKS, D. KARNACHUK, O.V., PARNACHEV, V.P., HOLDEN, W., and FRENGSTAD, B.
(2002): “Groundwater contamination from rural pit latrines: examples from Siberia and
Kosova”. Journal of Chartered Institute of Water and Environmental Management 16(2),
147–152.

98
BARROW, G. I. and FELTHAM, R. K. A. (1993): Cowan and Steel’s manual for the identification
of medical bacteria. 3rd Edition, Cambridge University Press, Cambridge, Pp 331.
BGS (British Geological Survey) (2002): Assessing Risk to Groundwater from On-site
Sanitation: Scientific Review and Case Studies. Keyworth, UK:BGS. Available:
http://r4d.dfid.gov.uk/pdf/outputs/r68692.pdf [accessed 28 March, 2016].
BOTKIN, D.B and KELLER, E.A. (1998): Environmental science; Earth as a living planet. New
York. (2ndEdition). John Wiley and Sons Inc Pp. 472-476
BOURNE, A.C (2001): Assessing the Contamination Risk of Private Well Water Supplies in
Virginia. Unpublished M.Sc Thesis, Virginia Polytechnic Institute and State University.
BRESLINE, E (2007): “Sustainable Water Supply in Developing Countries”. Geological society
of America”. (1), 194.
CECH, T.V (2005): Principles of Water Resources History, Development, Management and
Policy. John Wiley and sons, New York
CHAPELLE, F.H. (1997): The Hidden Sea- Groundwater, springs and wells. Tucson, Arizona,
Geoscience Press, pp. 237.
CHIDI, O. H., JEROH, E., and OKOBIEBI, E. B. (2014): “Evaluation of the pH, Iron and Lead
Levels of the Functional Boreholes in Federal Government College, Warri, Delta, Nigeria.
Journal of Environment and Earth Science, (4), 17.
CHIMA, G.N. (1988): Rural Water Supply in Isiala Ngwa L.G.A of Imo State. Unpublished M.sc
Thesis University of Nigeria, Nsukka, Nigeria.
CHINA, J.O. and DIGHA, O.N., (2010): “Bacteriological Investigation of Kolo Greek Surface
Water in Ogbia L.G.A of Bayelsa State, Nigeria”. International Journal of Bioscience
Institute of Research and Development, Oyo Nigeria.
CHRISTOPHER, O. A and MOHDSUFFIAN, Y. (2011): “Assessment of Groundwater Quality
near a Municipal Landfill in Akure, Nigeria”. 2nd International Conference on
Environmental Science and Technology IPCBEE Vol.6 IACSIT Press, Singapore.
CLAWGES, R..M. and VOWINKEL, E.F. (1996): "Variables Indicating Nitrate Contamination
in Bedrock aquifers, Newark Basin, New Jersey."Journal of Water Resources,
32(5),1055-1066.
99
COBBINA, S.J., NYAME, F.K and OBIRI, .S. (2012) “Groundwater Quality in the Sahelian
Region of Northern Ghana, West Africa”. Research Journal of Environmental and Earth
Sciences, 4(4), 482-491.
DAVIE, T. (2002): Fundamentals of Hydrology. Routledge, Taylor and Francis Group, New York.
DE SWARDT, A.M.J., and CASEY, O.P. (1963): “The Coal Resources of Nigeria”. G.S.N. Bull.
(28), 100.
DEEPTI, M., MANISH, M., MOHD, A.K., PRABHA, P. and CHAKRADHA, B. (2009):
“Assessment of Groundwater Quality of Bhavnagar region (Gujara)”. Journal of Scientific
& Industrial Research,(68), 964-966.
DEJU, R.A., BHAPPU,R.B., EVANS G.C., and BAEZ,A.P. (1990): The Environment and its
Resources. Gordon and breach Science Publishers.
DENISE, K. and GEOFF, W. (2012): An Assessment of Groundwater Quality in South Cork.
Geological Survey of Ireland In collaboration with: Cork County Council (Southern
Division) Revised May 2002.
DILLON, P. (1997): Groundwater Pollution by Sanitation on Tropical Islands. IHP-V Project 6–
1. Paris:UNESCO (United Nations Educational, Scientific and Cultural Organization).
Available: http://unesdoc.unesco.org/images/0010/001065/106522eo.pdf[accessed
(29th March, 2016).
DIXEY, F.A. (1972): A practical handbook on water supply. 2nd edition, Murby, London.
DWAF (2000): Policy and Strategy for Groundwater Quality Management in South Africa.
Department of Water Affairs and Forestry, Number W.1.0: First Edition.
DZWAIRO, B. HOKO, Z., LOVE, D., and GUZHA, E (2006): “Assessment of the impacts of
pit latrines on groundwater quality in rural areas: A case study from Marondera district,
Zimbabwe”. Journal of Physics and Chemistry of the Earth, (31), 779–788.
EC (2016): Drinking Water Quality Index. Department of Environment and Conservation,
Newfoundland, Labrador, Canada.
ECKNER, K.F. (1998) : “Comparison of membrane filtration and multiple-tube fermentation
by the Colilert and Enterolert methods for detection of waterborne coliform bacteria,
Escherichia coli, and enterococci used in drinking and bathing water quality monitoring

100
in Southern Sweden”. Journal of Applied and Environmental Microbiology. (64), 3079–
3083.
EDUNGBOLA, L.O and ASAOLU,S.O (1984). “A Parasitological Survey; Onchocerciasis in
Babana District of Kwara State, Nigeria”. American Journal of Tropical Medicine and
Hygiene, 33(999),1147-1154.
EFE, S.I. (2008). “Quality of water from hand-dug wells in Onitsha Metropolitan area”. Journal
of Environmental science, 6(23), 5 – 12.
EGBAI, J.C. ADAIKPOH, E.O and AIGBOGUN, C.O. (2013): “Water Quality Assessment Of
Groundwater In Okwuagbe Community of Delta State Nigeria”. Technical Journal of
Engineering and Applied Sciences (19)2347-235.
EJA, M.E. (2002): Water pollution and sanitation for developing countries. Calabar, Seaprint
(Nig) Co. 9-10.
El-MAGEED, A.L, EL-KAMEL,A.E and ABBADY A.E. (2011): “Natural Radioactivity of
Ground and Hot Spring in Some Areas in Yemen”. Desalination.
Doi:1016/j.desal.2011.11.022
ENI, D. I., EFIONG, J. and UPLA, J.I. (2013): “The Influence of Aquifer Depth on Microbial
Parameters of Borehole Water in Calabar Metropolis, Nigeria”. International Journal of
Science, Environment and Technology 2(2), 286 – 299.
ENI, D.V., OBIEFUNA, J.N, OKO, C and EKWOK, I. (2011): “Impact of urbanization on sub-
surface water quality in Calabar Municipalty, Nigeria”. International Journal of
Humanities and Social Sciences, 1(10), 167-172.
EPA (1994): Groundwater: methodology, Vol II, Washington Dc. USA.
EPA (2001): Parameters of water quality, Interpretation and standard. Published by the
Environmental Protection Agency, Ireland.
ESSIEN, O.E and BASSEY, D.E (2012): “Spatial Variation of Borehole Water Quality with Depth
in Uyo Municipality, Nigeria”. International Journal of Environmental Science,
Management and Engineering Research, 1(1), 1-9.
EVANS, A.S ( 1976): “Causation and Disease: the Henle-Koch Postulates Revisited”. Yale
Journal of Biological Medicine, 49(2), 175-95.

101
EZE, H.I (2007): “Effect of Rainfall Intensity and Energy on Gully Development in Northeastern
Enugu State, Nigeria”. Nigerian Journal of Technology, 26(1).
EZEIGBO, H.I (1988): “Geological and Hydrological Influences on the Nigerian Environment”.
Water Resources (NAH), (1), 37-44.
EZEMONYE, M.N. (2009): Surface and Groundwater Quality of Enugu Urban Area.
Unpublished Ph.D Thesis, Department of Geography, University of Nigeria, Nsukka.
EZEMONYE, M.N. and EMERIBE, C.N (2013): “Strategies for Water Quality Assessment”. In
Anyadike, R.N.C and Obeta, M.C (ed), Water Resources Development and Management
in Nigeria. Merit International Publications, pp 140-152.
FAMTOBI, K. J, AHOYO, T. A., NONFODJI O., and TAOFIKI, A. (2012): “ Groundwater and
Surface Water Quality in the Lagbe Town: Treatment Essays with Moringa oleifera Seeds”.
Journal of Water Resources and Protection, 1001-1008
(http://www.SciRP.org/journal/jwarp)
FANIRAN, A.A (1975): “Rural water supply in Nigeria’s Basement complex: A study of
alternatives”. Proceedings 2nd World Congress on Water Resources New Delhi, India.
111( 89-110).
FETTER, CHIRADZULU C.W. (1994): Applied Hydrogeology. Third Edition. Prentice hall,
Englewood Cliffs, NJ.
FGN(2007): Legal Notice on Publication of the 2006 Census report. Federal Government of
Nigeria official Gazette, 4(84), 1-8.
FINGL, E. (1980): “Laxatives and cathartics”. In Gilman AG (eds), Pharmacological basis of
therapeutics. New York, NY, MacMillan Publishing.
GANESHKUMAR,B. and JAIDEEP,C. (2011):“Groundwater Quality Assessment Using Water
Quality Index (WQI) approach – Case Study in a Coastal Region of Tamil Nadu, India”.
International Journal of Environmental Sciences and Research, 1(2), 55.
GBADEGESIN, A. S. and OLORUNFEMI, F. B. (2007). “Assessment of Rural Water Supply
Management in Selected Rural Areas of Oyo State, Nigeria” African Technology Studies
(ATPS) Network Working Papers No. 47.

102
GORAI, A.K and SUBHASH, K. (2013): “Spatial Distribution Analysis of Groundwater Quality
Index Using GIS: A Case Study of Ranchi Municipal Corporation (RMC) Area”.
International Publisher of Science, Technology and Medicine, pp. 2327-4581.
GOSSELIN, D.C. HEADRICK,J. TREMBLAY, R. CHEN, X-H and SUMMERSIDE, S. (1997):
“Domestic well water quality in rural Nebraska: Focus on nitrate-nitrogen, pesticides, and
coliform bacteria”. Groundwater Monitoring and Remediation, 17(2), 77-87.
GRACE, O.A.(2001): Water Supply, Environmental Hygiene, and Health. Paper at the 28th
International faith and learning Seminar, Babcock University, Nishan-Remo, Ogun State,
Nigeria: Retrieved from http//www.allas,edu/ict/vol.28.Ce-00107.htm.
HART, J. (2008): Water Pollution. Microsoft Encarta.
HOWARI, F.M., ABURUKAH, Y., and SHINEQ, R. (2005): “Hydro-chemical analysis and
evaluation of groundwater resources of North Jordan”. Water Resources, 32(5), 555-564.
HUDAK, P.F (2003): “Oil Production and Groundwater Quality in the Edwards-Trinity Plateau
Aquifer, Texas”. The scientific world journal, (3), 1147-1153.
HUTTON, L. (1983): Field testing of water in developing countries. Water Resources Center,
Unwin Brothers Limited, Britain.
IARC (1977): IARC Monographs Programme on the Evaluation of the Carcinogenic Risk of
Chemicals to Human. Preamble (IARC intern. Rep. No. 79/003)
IFABIYI, I.P. (2008) “Depth of Hand Dug Wells and Water Chemistry: Example from Ibadan
Northeast Local Government Area (L.G.A.),Oyo-State, Nigeria” Journal social science,
17 (3), 261-266.
IKEM, A., OSIBANJO, O., SRIDHAR, M.K.C., AND SOBANDE, A. (2002): “Evaluation of
Groundwater Quality Characteristics near two sites in Ibadan and Lagos, Nigeria”. Water,
Air and soil pollution, 140(1-4),307-333.
IMRAN, A. DAR., MITHAS A DAR and SANKAR, K. (2010): “Nitrate Contamination in
Groundwater of Sopore town and its environs, Kashmir, India”. Arabian Journal
Geosciences, (3), 267-272.
IRO, S.I. and CHUKWUDI, B. (2009): “Surface Water Supply for Rural Domestic Use: Analysis
of some streams in Ahiazu-Mbaise LGA Imo State”. Proceedings National Rural
Development Seminar on Water, Imo state University, Owerri, Nigeria.

103
ISHAYA, S. and ABAJE, I.B. (2009): “Assessment of Borehole Well Water Quality in
Gwagwalada town of FCT Abuja”. Journal of Ecology and Natural Environment, 1(2),
32-36.
ISIKWUE, M.O., IORVER, D. and ONOJA, S.B. (2011): “Effect of Depth on Microbial Pollution
of Shallow Wells in Makurdi Metropolis, Benue State, Nigeria”. British Journal of
Environment & Climate Change, 1 (3), 66-73.
ITAH, A.Y and AKPAN, C.E (2000): “Portability of Drinking Water in an Oil Impacted
Community in Southern Nigeria”. Journal of Applied Science and environmental
management, 91(1), 35-74.
JAGALS, P. GRABOW, W.O.K., GRIESEL, M. and JAGALS, C. (2000): Evaluation of selected
membrane filtration and most probable number methods for the enumeration of faecal
coliforms, Escherichia coli and Enterococci in environmental waters , Quantitative
Microbiology, 2(2), 129-140.
JAMIESON, R.C. and GORDEN, R.J. (2002): Movement and persistence of fecal bacteria in
agricultural soil and subsurface drainage water, Canadian biosystems engineering, Vol
44.
JANNNA, M.M and KOHANDOKER E.H (2002): “Suitability of Groundwater for Agriculture in
Terai, Darjeeling District”. Geographical Review of India, 64(3), 262-271.
JANSZ, S. (2011): “A Study into Rural Water Supply Sustainability in Niassa Province,
Mozambique” WaterAid, pp.1-9.
JOHN,O.O., and EBEHIREMHEN,O.O.(2014):“Physico-Chemical Characteristics and
Bacteriological Studies in Hand Dug Wells in Udu Community of Delta State, Nigeria”.
Journal of Environment and Earth Science, 4(22), 116-120.
KAISER, H.F.(1960): “The Application of Electronic Computers to Factor Analysis”.
Educational and Psychological Measurement,(20), 141-151.
KANKAL, N.C., INDURKAR, M.M., GUDADHE S.K., and WATE, S.R. (2012), “Water
Quality Index of Surface Water Bodies of Gujarat, India”. Asian Journal of
experimental Science, 26 (1), 39-48.
KHWAJA, M. A., and AGGARWAL, V. (2014): “Analysis of Groundwater Quality using
Statistical Techniques: a case study of Aligarh city (INDIA)”. International Journal of
Technical Research and Applications, (2), 5.

104
KIPTUM, C.K AND NDAMBUKI,J.M (2012): “Well water contamination by pit latrines: A
case study of Langas”. International Journal of Water Resources and Environmental
Engineering, 4(2), 35-43.
KURA, N.U., RAMLI, M.F., SULAIMAN, W.N.A., IBRAHIM, S. ARIS, A.Z., and ADAMU, M.
(2013): “Evaluation of Factors Influencing the Groundwater Chemistry in Small Tropical
Island of Malaysia”. International Journal of Environmental Research and Public Health,
(10), 1861-1881.
LANGAN, S.M. (2009): Flares in childhood eczema. Skin Therapy Letter, 14(8),1
http://www.skintherapyletter.com/2009/14.8/2.html
LAWRENCE, A.R., MACDONALD, D.M.J., HOWARD, A.G., BARRETT, M.H., PEDLEY,
S., and AHMED, K.M., (2001): “Guidelines for Assessing the Risk to Groundwater from
On-Site Sanitation”. Keyworth, Nottingham: British Geological Survey. Available:
http://wwwesd.worldbank.org/esd/ard/groundwater/pdfreports/Guidelines_assessing_risk
_to_Gdwtr.PDF [accessed 19 February, 2016].
LEWIS, W.J., FOSTER, S.S.D., and DRASAR, B.S. (1982): The Risk of Ground water Pollution
by On-Site Sanitation in Developing Countries. International Reference Centre for Waste
Disposal Duebendorf, Switzerland.
LONGE, E.O and BALOGUN, M.R. (2009): Groundwater Quality Assessment near a municipal
Landfill, Lagos, Nigeria”. Research Journal of Applied Sciences, Engineering and
Technology, 2(1), 39-44.
MACDONALD, A., DAVIS, J., CALOW, R., and CHILTON, J. (2005): Developing
Groundwater: A Guide to Rural Water Supply, ITDG Publishing, U.K
MADU, I.A (2000): Rural Market as a factor of Rural Development in Nsukka Region,
Southeastern Nigeria. Unpublished Ph.D Thesis, Department of Geography University of
Nigeria, Nsukka.
MAJURU, B., MICHAEL MOKOENA, M., JAGALS, P., and HUNTER, P.R. (2011): “Health
Impacts of Small Community Water Supply Reliability”. International Journal of Hygiene
and Environmental Health, 214(2), 162-166.
MARK, W,R., XIMING, C., and SARAH, A.C., (2002): “World Water and Food to 2025, dealing
with Scarcity”. International food policy research institute, NW, Washington, DC, U.S.A.

105
MCMAHON, J. (2010): Effect of Urbanization on Streams Ecosystem. Retrieved from
http://waterusgs.gov/nawqa/urban/index.html
MILLER, G.J. (1992): Environmental Science Sustaining the Earth. California (3rd edition).
Wardsworth Publishing Company, pp. 232-265.
MITHAS, A. DAR, SANKAR, K., and IMRAN A DAR (2010): “Groundwater Prospects
Evaluation based on Hydrogeo-Morphological Mapping: A Case Study in Kancheepuram
district, Tamilnadu”. Journal of Indian Society of Engineers.
MOHRIR , A.,RAMTEKE,D.S., MOGHE, C.A., WATER, S.R., and SARIN, R . (2002): “Surface
and Groundwater Quality Assessment in Bina Region”. International Journal of
Environment and Pollution, 22(9).
MURUGESAN, A., RAMU, A., and KANNAN, A. (2006): “Water quality assessment for
Uttamapalayan municipality” in Theni District, Tamil Nadu, India. Pollution Research,
25(1),163-166.
NACE, R.L. (1969): “Human Use of Groundwater” in Chorley, R.J (ed), Water, Earth and Man.
Fletcher and son ltd, Norwide, Britain.
NAFDAC (2004): Training Workshop for Packaged Water and Fruit Juice Products. Ikeja,
National Agency for Food and Drugs Administration and Control. pp.10-11
NAS (1977): Drinking water and health. Washington, DC, National Research Council, National
Academy of Sciences.
NAS (2009): National Academic Science; Overview: Safe Drinking Water is Essential.
http://www/ drinking water .org
NASH (1993): “Water Quality and Health”: in Gleick, P.H(ed), Water Crisis. New York
NELSON, D. (2002): Natural Variations in the composition of Groundwater; Drinking Water
Program Oregon Department of Human Services: Springfield, OR, USA.
NIHCC (National Institute of Health Clinical Center) (2009): Dietary Supplement Fact Sheet:
Calcium. Office of Dietary Supplement.<http://ods.od.nih.gov/factsheets/calcium/asp>
(Accessed, March 12th 2016).
NIQUETTE,P., and SERVAIS, R.(2001): “Bacterial Dynamics in the Drinking Water Distribution
System of Brussels”. Water Research, 35(3), 675-682

106
NPC (2010): Population Distribution by Sex, State, LGA & Senatorial District
NNODU, V.C. and ILO. C.I. (2002): “Bacteriological and Physico-Chemical Examination of Well
Water in Enugu South Local Government Area of Enugu State”. Environmental Review
4(1), 600-617.
NOSRAT, A. and ASGHAR A.M. (2010): “Assessment of Groundwater Quality and its Suitability
for Drinking and Agricultural Uses in the Oshnavieh Area, Northwest of Iran”. Journal of
Environmental Protection, (1), 30-40.
NWACHUKWU, S. O. (1978): “The Geology of Nsukka Area”, In Ofomata, G.E.K (ed), The
Nsukka Environment. Fourth Dimension Publishers, Nigeria, 47-58.
NWMQS (1995): National Water Quality Management Strategy: Guidelines for Groundwater
Protection in Australia. Agriculture and Resource Management Council of Australia and
New Zealand Australian and New Zealand Environment and Conservation Council.
OBETA, M.C. (2015): Personal Communication.
OBOT, J.U (1984): The Spatial Problems of Water Resources Management in Cross-River.
Summary Paper 27th Annual Conference, Nigeria Geographical Association, University
of Nigeria, Nsukka, Nigeria.
OCHERI M., IYANGE M., and OBETA, M.C.(2010): “Seasonal Variation in Nitrate Levels in
Hand Dug Wells in Makurdi Metropolis”. Pakistan Journal of Nutrition, 9(6), 539-542.
OCHERI, M and CHUKWU, K. (2012): “Groundwater”. In Anyadike, R.N.C. and Obeta, M.C.
(ed), Fundamentals of Hydrology. Chuka Educational Publishers. pp 81-94.
OCHERI, M.I and ODOMA, L.A. (2013): “Baseline investigation of groundwater quality of
Lokoja, Kogi State Nigeria”. Proceedings, Nigerian Association of Hydrological Sciences
Conference on Water Resources and National Development C.C. Mbajiogu, M.C. Obetta
and Anyanwu, C. (eds) held at University of Nigeria, Nsukka, and Pp.65-71.
ODUMOSU, A.O. (1995): Sustainable Community Water Supply in Nigeria. Paper presented at
the 21st WEDC international Conference, Kampala.
OFFIONG J. O. (2011): “The Dilemma of Implementing Effective Environmental Policies in
Nigeria” JORIND 9 (1), ISSN 1596-8303.www.transcampus.org/journals.
www.ajol.info/journals/jorind

107
OFOMATA, G.E.K (1978): “Landforms” in Ofomata, G.E.K. (ed), Nsukka Environment, Fourth
Dimension Publishers, Enugu. pp 69-85.
OGUNTOKE, O., ABODERIN, O.J AND BANKOLE, A.M. (2009): “Association of Water-
Borne Diseases Morbidity Pattern and Water in Parts of Ibadan City, Nigeria” Tanzania
Journal of Health Research, 11(4), 189-195.
OKAFOR, E.E ., HASSAN, A.R and DOYIN-HASSAN, A. (2008) Environmental Issues and
Corporate Social Responsibility: The Nigeria Experience. Journal of Human
Ecology, 23(2):101- 107.
OKORO, B.U., EZEABASILI, A.C. and DOMINIC, C.M (2014): “Quality Assessment of
Traditional Hand Dug Wells in Awka, Anambra State, Nigeria”. Global Journal of
Engineering, and Design Technology. 3(3), 34-38.
OLOBANIYI, S.O.B., and OWOYEMI, F.B. (2004): “Quality of Groundwater in the Deltaic Plain
Sands Aquifer of Warri and Environs, Delta state, Nigeria”. Water Resources, (15), 38-44.
OLUSHOLA, M.A., ALBERT, C.A, and ADERONKE, A.O. (2014): “The physico-chemical
Quality of Groundwater in Relation to Surface Water Pollution in Majidun Area of
Ikorodu, Lagos State, Nigeria”. American Journal of Water Resources, 2(5), 162-133.
OMOBORIOWO, A., CHIAGHANAM, O.I., SORONNADI-ONONIWU, G.C., ACRA, E.J.,
OKENGWU, K.O., UGWUEZE, C U., YIKAREBOGHA, Y. and MOMTA, P.S. (2012):
“Appraisal of the Groundwater Quality in Arochukwu Area, Afikpo Basin, Nigeria”.
International Journal of Science and Technology, (2), 11.
ONUNKWO, A. A., UZOIJE, A.P., DARLINGTON, A., and COSMOS C.U (2014):
“Comparative Analysis of the Quality of the Shallow and Deep Aquifer Waters of Nsukka
SE, Nigeria – A Preliminary Approach to Water Resource Development”. Journal of
Environment and Earth Science, 4(9) 25-34.
OWUAMA, C. and UZOIJE, A. (2005): “Waste Disposal and Groundwater Quality in Owerri,
Nigeria”. Journal of Environmental Systems, (31), 69-79.
OWUNA, A.E (2012): Quality Assessment of Hand-dug wells water in Otukpo Town and its
Environs, Benue state, Nigeria. Unpublished M.Sc Thesis, Department of Chemistry,
Ahmadu Bello University Zaria.

108
OYEBANDE, D.L. (1976): Planning to Match Water Demand in 2000. Water Resources
Inventory of Greater Lagos”. Summary Paper 19th Annual Conference of Geographical
Association. Ahmadu Bello University, Zaria.
PARRY-JONES, S., REED, R. and SKINNER, B. H. (2001): Sustainable Hand Pump Projects in
Africa: A Literature Review.” WEDC, Loughborough University, Leicestershire.
PRETTY, J. N. (1995): “Participatory Learning for Sustainable Agriculture.” World Development,
23(8), 1247-1263.
PUJARI P.R., PADMAKAR, C. LABHASETWAR, P.K., MAHORE, P., and GANGULY A.K.
(2012): Assessment of the impact of on-site sanitation systems on groundwater pollution
in two diverse geological settings—a case study from India. Environ Monit Assess
184(1):251–263.
RAJI, M.I.O. and IBRAHIM Y.K.E. (2011). “Prevalence of Waterborne Infections in Northwest
Nigeria: A Retrospective Study”. Journal of Public Health and Epidemiology, 3(8), 382-
385.
RAKAD, A., TAANY, A.T, BATAYANEH, and RASHEEDA JARADAT (2007): “Evaluation
of Groundwater quality in Yermouk Basin, North Jordan”. Journal of Environmental
Hydrology, (15), 49-60.
REDMOND, W. A. (2009) Microsoft Corporation, USA. www.scribd.com/doc/52782458/water
pollution and-the-law.(Accessed on 16th February, 2016)
REED, B., (2010): Emergency Excreta Disposal Standards and Options for Haiti. Leicestershire,
UK:DINEPA (Direction Nationale de l’Eau Potable et de l’Assainissement) and Global
WASH Cluster. Available:http://wedc.lboro.ac.uk/resources/pubs/Emergency_EDS_and_
options_for_Haiti.pdf [accessed 17 January, 2016].
REYMENT, R.A., (1965): Aspects of the Geology of Nigeria. University of Ibadan, Nigeria.
ROBINS, N.S., CHILTON, P.J., and COBBING, J.E. (2007): “Adapting existing experience
with aquifer vulnerability and groundwater protection for Africa”. Journal of African
Earth Science 47(1),30–38
RUFF, L.E (1993): “The Economic Common Sense of Pollution”. In Dorfman, R (ed.),
Economics of Environments. New York, W.W.Norton & Company Inc.

109
SAMUEL, Y. (2013): “Assessment of Water Quality of Hand-Dug Wells in Zaria LGA of Kaduna
State, Nigeria”. The International Journal of Engineering and Science (IJES) 2(11), 1-4.
SCHIJVEN, J.F., and HASSANIZADEH, S.M. (2000): “Removal of viruses by soil passage:
overview of modeling, processes and parameters”. Critical Review in Environmental
Science and Technology 30(1),49–127.
SCHWARZENBACH, R.P., and WESTALL, J. (1981): Transport of Nonpolar Organic
Compounds from Surface Water to Groundwater: Laboratory Sorption Studies”.
Environmental Science and Technology, (15), 1360-1367.
SGS,(2011):“Environmental Services ENV 068”: Retrieved from http//www.googl.com.
SHAFIU, S., PAUL, E.D., OMONIYI, K.I (2015): “The Effect of Well Depth
on Physicochemical Variation in Neighboring Villages of River Niger and Benue in
Lokoja Kogi” Journal of Natural Sciences Research, 5(5),106-111.
SHASHANK SHEKHAR and ADITYA SARKAR (2013): “Hydrological Characterization and
Assessment of Groundwater Quality in Shallow Aquifers in Vicinity of Najafgarh Plain of
NCT Delhi”. Journal of Earth Systems Sciences, 122(1), 43-54.
SHIEKH, A.U and EBBAH, D.H (2009): “Challenges of Rural Water Resources Development
and Management in Nigeria: An overview” Proceedings National Rural Development
Seminar on Water Supply, Imo State University, Owerri, Nigeria.
SIMPSON, A., (1954): “The Nigerian Coal Fields”-The Geology of Parts of Onitsha, Owerri and
Benue Provinces. Geol. Sum. Nig. Bull.,24
SINA, D., BIJAN, B., MOHAMMAD, H. M., MARYAM, H., and SOHEILA, D.(2009): “The
Effect of Well Depth on Water Quality in Neiboring Zone of Zayandehroud, Iran” .World
Applied Sciences Journal, (5), 80-83.
SINHA, D.K., SAXENA, S., and SAXENA, R. (2004): “Water Quality index for Ramganga River
Water at Moradabad.” Pollution Research, 23(3), 469-474.
STILL, D.A., and NASH, S.R., (2002): “Groundwater contamination due to pit latrines located in
a sandy aquifer: a case study from Maputaland”. In Water Institute of Southern Africa
Biennial Conference, Durban, South Africa. Water Institute of Southern Africa, 1–6.
Available:
http://www.sswm.info/sites/default/files/reference_attachments/STILL%20and%20NA
110
H%202002%20Groundwater%20contamination%20due%20to%20pit%20latrines%20loc
ated%20in%20a%20sandy%20aquifer.pdf [accessed 19 February, 2016].
SURESH, T. and KOTTURESHWARA N.M.(2009): “Assessment of Groundwater Quality of
Bore wells Water of Hospet Taluka region, Karnataka, India”. Rasayan Journal 2(1), 221-
233.
SWANSON, R.A. (2013): Theory Building in Applied Disciplines. San Francisco, CA: Beerrett-
Koehler Publishers.
TADESSE, A. TECHANE, B. and GIRMA, G. (2013): “Rural Water Supply Management: The
Case of Adama Area, Ethiopia”. Journal of Water Resources and Protection, (5), 208-
221.
TOYOBO, A.E, and TANIMOWO, N.B. (2011): “Evaluation of Rural Water supply Schemes in
Selected communities in Oke-Ogun Area, Oyo State Nigeria”. Global Journal of Science
Frontier Research. (11), 9.
UGWUEZE, I.K (2000): The Hydogeologic Assessment of the Nkporo shale Formation in Isi-Uzo
Local Government Area of Enugu State. Unpublished M.Sc Thesis, Department of
Geology, University of Nigeria, Nsukka.
UGWUEZE, I.K (2015): Personal Communication.
UKPONG, E. C. and OKON B. B. (2013): “Comparative Analysis of Public and Private Borehole
Water Supply Sources in Uruan Local Government Area of Akwa Ibom State”.
International Journal of Applied Science and Technology. (3),1.
UMAR, A and YARO, A. (2009): “Problems of Rural water supply in Shinkafi Local Area of
Katsina State”. Proceedings National Rural Development Seminar on Water, Imo State
University.
UNEP, (2006): Water Quality for Ecosystem and Human Health. United Nations Environment
Program/Global Environment Monitoring System (UNEP/GEMS0 PROGRAM 2006,1-
132).
UNEP/UNESCO (2006): Water Quality Assessment: A guide to use in environment. Africa, Paris.
UNESCO (2000): Groundwater. UNESCO Environmental Development briefs No.214
UNITED NATIONS (2000): Millennium Development Goals.
111
USDHEW (1962): Drinking water standards — 1962. Washington, DC, US Department of Health,
Education and Welfare, Public Health Service; US Government Printing Office
(Publication No. 956).
USEPA (1985): National primary drinking water regulations; synthetic organic chemicals,
inorganic chemicals and microorganisms; proposed rule. US Environmental Protection
Agency. Federal Register, 50(219),46936.
USEPA (1999a): Health effects from exposure to high levels of sulfate in drinking water study.
Washington, DC, US Environmental Protection Agency, Office of Water (EPA 815-R-99-
001).
USEPA (1999b) Health effects from exposure to high levels of sulfate in drinking water workshop.
Washington, DC, US Environmental Protection Agency, Office of Water (EPA 815-R-99-
002).
USGS (2015): Turbidity. http://water.usgs.gov/edu/turbidity.html. Retrieved on 2nd May, 2016.
UZOIJE, A.P, ONUNKWO, A. A, IBENEME, S.I and OBIOHA, E.Y (2014): “Hydrogeology of
Nsukka Southeast, – A Preliminary Approach to Water Resources Development”.
American Journal of Engineering Research, 3(1),150-162.
VINGER, B., HLOPHE, M., and SELVARATNAM, M., (2012): “Relationship between
nitrogenous pollution of borehole waters and distances separating them from pit latrines
and fertilized fields”. Journal of Life Science 9(1):402–407.
W.H.O (1993): Environmental Health criteria 224: Drinking Water Recommendation. World
Health organization, Geneva.
W.H.O (1996): Guidelines for Drinking Water-Quality Volume 2: Health and Other Supporting
Criteria (2nd edition). WHO, Geneva
W.H.O (2005): Make Every Child and Woman Count. World health report 2005.
W.H.O (2006): Guidelines for Drinking Water. 1st addendum to 3rd edition, Recommendation.
World Health Organization. 23-48
W.H.O (World Health Organization) (2006): Protecting Groundwater for Health: Managing the
Quality of Drinking waterSources.Geneva: WHO. Available: http://www.who.int/water_s
anitation_health/publications/protecting_groundwater/en/ [accessed 26th March, 2016].
112
WALLER, R.M (2013): “Ground Water and the Rural Homeowner”. U.S. Geological Survey.
WANIELLISTA, M., KERSTEN, R., and EAGLIN, R. (1997): Hydrology: Water Quantity and
Quality Control. John Wiley and Sons Inc. New York.
WATERAID (2011): Sustainability Framework, WaterAid, UK. http://www.wateraid.org/docum
ents/plugin_documents/sustainability_framework_final.pdf
WELI, V.E and OGBONNA V.A (2015): “An Analysis of Well Water Quality and the Incidence
of Water Borne Diseases in Emohua Communities, Rivers State, Nigeria”. International
Journal of Research and Innovations in Earth Science, 2(2), 2394-1375.
WIKIPEDIA (2015): The Free Encyclopedia. www.google.com.ng/wikipedia. Accessed on, 30th
November, 2015.
WORLD BANK/FEDERAL REPUBLIC OF NIGERIA (2000): Water Supply and Sanitation
Interim Strategy Note. Retrieved on November 27, 2015.
WORLD HEALTH ORGANIZATION WORKING GROUP (1986): Health impact of acidic
deposition. Science of the total environment, (52), 157-187.
YISA, J., and JIMOH, T., (2010): “Analytical Studies on water quality index of river Landzu”.
American journal of Applied sciences, 7(4), 453-458.
ZACARIAH, L.H., DOUG, D.C., BRIAN, F., JESSE, M. M., JAYME, W., JOSH, T.,
JONATHAN, T., STEPHANIE, K.C., PHILLIP,S., DREW, H., AKINDE, F.K.,
COREY, R., PAUL, F.H., T AYLOUR, B., HANADI, S.R., and KEVIN, A.S. (2015): “A
Comprehensive Analysis of Groundwater Quality in The Barnett Shale Region”.
Environmental Science and Technology. DOI: 10.1021/acs.est.5b0152.
Top Related
Copyright © 2022 FDOKUMEN

