


Bahasa
Halaman
Hukum

University access and after: explaining the social composition of degree programmes and the contrasting expectations of students
Authors : Helena Troiano. [email protected]. Departament de sociologia (G6-171). UAB (Autonomous
University of Barcelona). 08193. Bellaterra. Espanya.
Correspondig author : Marina Elias. [email protected]. Departament de Teoria sociològica. (0.10). Campus Mundet. Passeig
de la Vall d’Hebron, 171. 08035. UB (Universitat de Barcelona). Espanya. Telephone : 93-5811789
Fax: 935811152
Acknowledgments
This piece of research is part of the "National Plan for scientific research, technological development and
research" (CSO2008-02812) funded by the Spanish Ministry of Science and Innovation, which is entitled
"Students in front of new university reform’. The authors are part of the GRET, the Education and
Employment Research Group at the Universitat Autònoma de Barcelona. The written version of this
article has been re-drafted and discussed with the rest of the GRET members taking part in this research:
Lidia Daza, Albert Sanchez-Gelabert and Josep Maria Masjuan.
Title Page with ALL Author Contact Information
1
Title: University access and after: explaining the social composition of degree programmes and the
contrasting expectations of students
1. Introduction Early research on the relationship between social class and education found that working-class students
(WC students) encounter specific difficulties when progressing through the education system.
Historically, primary and secondary education have received the most attention, but research on this
phenomenon in higher education has been widely developed recently.
Two major approaches to explain the unequal access, progress and graduation of students from different
social backgrounds have provided important theoretical arguments and empirical grounds for relating
social class and educational success.
The first approach, based on the legacy of Bourdieu and Bernstein, has used the classic concepts of
habitus, rules of the game, invisible pedagogy and codes, though broadening the analysis by exploring
students’ experiences at university1 (Power et al. 2003; Read et al. 2003). The second one, within the
rational choice framework, has identified factors which affect the choice processes in each intersection of
the education system, taking into account actors’ preferences, calculations regarding the risk of actions,
and opportunities and constraints which appear in context.
However, both of these approaches have adopted certain analytical elements from the other approach over
time. As a result, it’s not difficult to find studies that, from a Bourdieuian perspective for example,
consider that greater or lesser dedication to studies depends on the greater or lesser employment
opportunities related to the area of study in question; or which explain different attitudes towards getting
a university degree as dependent on risks involved for students and their families (Archer et al. 2002;
Langa 2003).
It is also common to see how the rational choice model includes choice criteria linked to social rules or
the more or less negotiated assumption of the student’s role. That is, the model has evolved from a very
economistic conception of the individual to a model which understands agents in their social context (Gambetta 1996; Sullivan 2001).
Recently, many studies have focused on educational achievement, distinguishing the consequences of the
differential output in pre-university stages and which determine the range of choice opportunities
(primary or unconditional effects) from decisions actually taken by students depending on their social
background (secondary or conditional effects) (Boudon 1983; Kloosterman 2010; Tieben et al. 2012). In
many countries, the collection of data by age cohort from the beginning of the 20th century has made it
possible to analyse the evolution of inequalities in the access to university in a period of great expansion
in higher education —and also great institutional differentiation for many of the university systems in
these countries (Shavit et al. 2007; Siano-Kyrgiou and Tsiplakides 2011; Iannelli et al. 2011; Reisel 2011;
Triventi 2011; Reimer and Jacob 2010).
In this the basic approach taken is that of individual choice in a context of limited options. Therefore, the
goal of this paper is to relate the choice of university studies to the social composition in each degree
programme and the progress which the students make at mid-career in their studies.
To that end, the following sections have been included: section two contextualises the Spanish university
experience; section three discusses the theoretical principles needed to analyse the results selected for this
study; section four looks at the methodology we use, and section five presents the results.
The results include, first, a description and analysis of the factors which students surveyed in the second
or third year of their degree programme retrospectively claim to be the reasons for their choice of degree
programme; each factor, which previous studies selected as essential in this choice process is analysed by social class. From this analysis, the social composition for each degree programme in the sample is
1 In recent research on higher education, studies on the university experience of so-called non-traditional students (students who do not fit the profile of young white men of middle or upper class) stand out, although different
universities valorise different versions of what a ‘normal’ student experience is (Brennan et al., 2009) and at times this transforms them into a new kind of institution (Reay et al., 2009a).
*ManuscriptClick here to download Manuscript: University access and after revised2_clean.rtf Click here to view linked References
2
obtained. This social composition is described and used as the basis for classifying and clustering degrees
programmes according to the percentage of WC students in them. Finally, student progress at the time of
the survey —at the mid-point in the programme— is related to the expectations that led students to their
degree choice.
2. Higher education context in Spain As in most of the countries in Western Europe, in recent years, Spain has undergone an exponential
increase in the number of students at university, with almost 40% of the current cohort of young adults
mbeing enrolled in higher education.
This increase has only led to a partial decrease in social inequalities. In most European countries, students
from low educational family backgrounds have increased their access to higher education, but they are
still far behind students from families with higher levels of education (Boliver 2010; Crozier et al. 2008;
Eurostat 2009). On the whole, Spanish university students have parents with educational levels lower than
in most other European countries. This is due to having the lowest distribution of educational credentials
among cohorts of parents of young people of university age compared to those countries. However, the
deviation of students toward long or short degree programmes based on their parents’ educational level is
very significant; as a result, we find access inequality overlapping with internal stratification in the
system (Ariño and Llopis 2011; Triventi 2011).
In the Spanish university system there is a hierarchy among degree programmes and, to a lesser extent,
among institutions (attempts have recently been made to introduce these types of differences). Thus,
historically, science and engineering degrees have greater prestige than social science or humanities
degrees; likewise, long-cycle degrees (between four and six years) are more prestigious than short-cycle
ones (three years). Differences in prestige can be explained by four factors, found in different
combinations in each degree programme: 1) prestige related to subsequent employment; 2) completion
difficulty (length of time, rate of failure and drop-out rate); 3) access requirements that are based on the
marks obtained in high school and the nationwide university entrance exam, and 4) percentage of
vocational training students accepted into the degree programme.
Spanish university students profile is characterized by an under-representation of students whose parents have low education levels (ISCED-O, 1 and 2): 36% of the adult population in Spain have low education
levels, while only 26% of students in university come from this background. In contrast, high parental
education level (ISCED-6) is over represented: 26,1% of students have parents with a high education
level, while this group accounts for only 7,4% of the adult population in Spain. Women make up 54% of
university students. Finally, 80% of university students access university through the upper secondary
academic pathway and 10% through vocational training (Ariño and Llopis 2011).
At an individual level, two other phenomena must be taken into account. First, Spanish students if they
can avoid it, rarely leave home when they enrol at university; hence, they often choose institutions by
proximity. Secondly, it is common to combine full-time studies with paid employment. Both phenomena
are closely related to the limited number of grants and loans available, which places the total cost of a
degree on students and their families.
3. Theoretical and conceptual references
3.1 Factors involved in the choice of degree programme
From an individual perspective, choosing the institution and programme is an important process closely
related to certain attitudes and motivations. From an institutional perspective, there is also an emergent
effect through which students of different social backgrounds end up coinciding (or not) in the same
place; in this way, the social composition of each degree programme, college and university is formed.
In order to understand the process through which this social composition is established, it has to be
assumed that the different hierarchizations give greater value and prestige to some institutions and
degrees than to others. In some countries this difference is obvious and is caused by the existence of non-university tertiary education, which either continues secondary vocational studies or has less restricted
access than its academic counterparts. In this case, there is a binary, or even more diversified system, with
a first-tier and a second-tier in higher education (Shavit et al. 2007). There are other systems that, though
formally unified, contain degree programmes of very different duration, orientation and even difficulty,
and which, in practice, place degrees with different values into a hierarchy. Finally, in some countries,
3
hierarchization is not found among degrees, but among institutions; that is, there are universities with
higher prestige than others.
In Spain, the non-divided model with hierarchy based on the duration and difficulty of the studies was
prevalent until the last decade. Nowadays, though effort has been made to make the duration of degree
programmes equal, some differences related to volume and projection of scientific production have
appeared, as has the political intention to introduce competition and hierarchy among universities.
Consequences of such hierarchization and diversification of opportunities are obvious at an individual
level, as graduates find different employment conditions and value placed on their degrees in the labour
market; but there are also consequences for institutions. According to Reay et al. (2009a) ‘universities and
colleges have identifiable institutional habituses in which their organisational culture and ethos are linked
to wider educational and socio-economical cultures through mutual configuration processes’. Thus, while
different institutions accept distinct levels of student performance and competence, it is also expected that
they consolidate the most typical characteristics of the prevailing social group over time.
Within this opportunity framework, the student who has completed higher secondary education must
decide whether or not to enrol in university and which degree programme to choose. This is an important
moment in the life of young people, and their motivation clearly affects their interest in studying. The
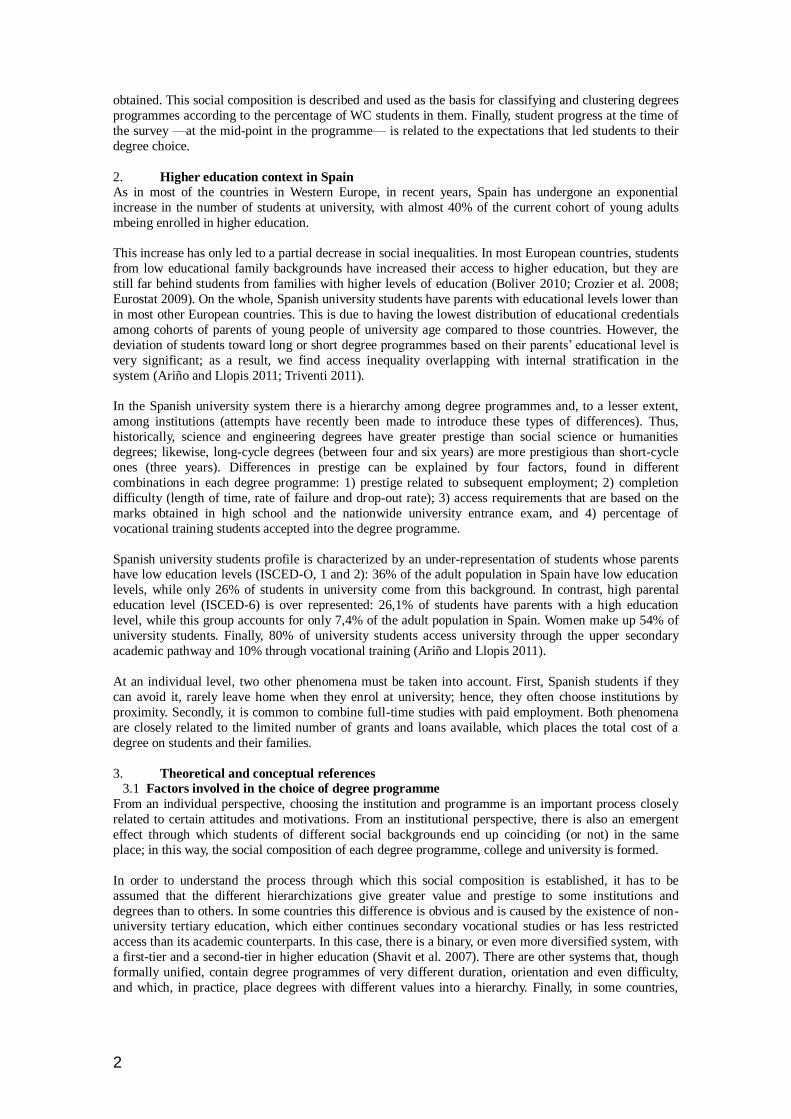
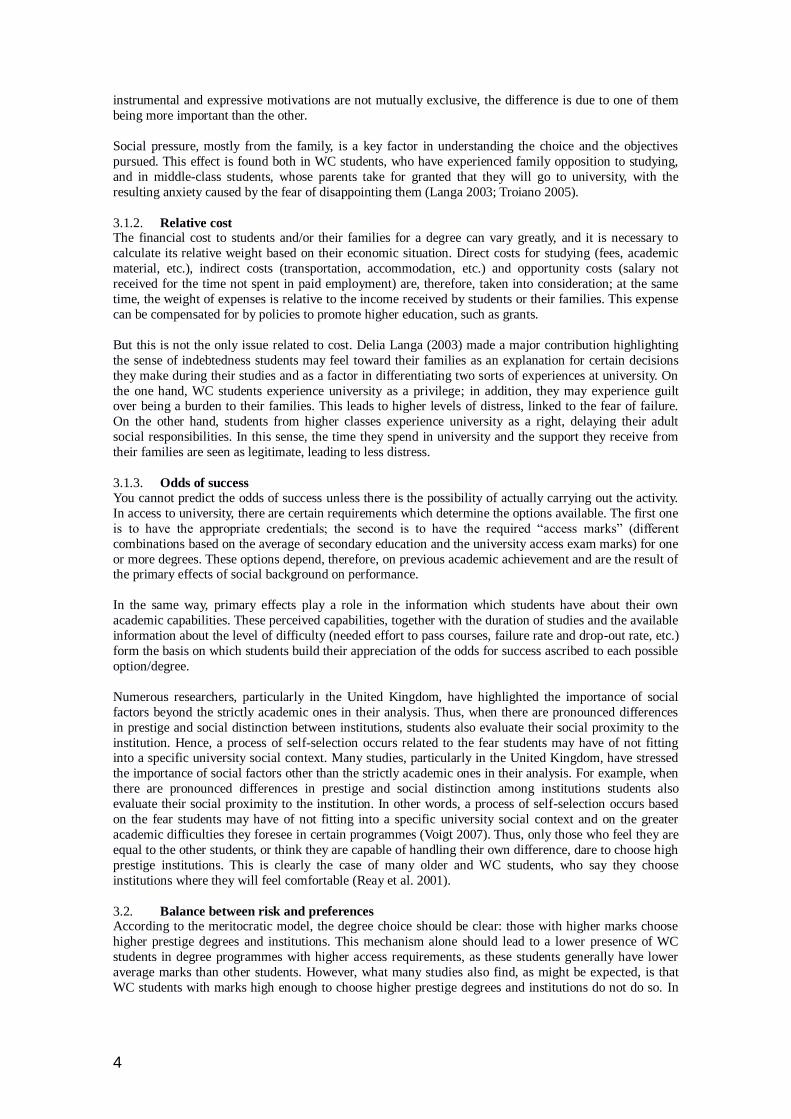
main factors influencing this choice and how they are related are shown in Figure 1. At university the
effects described by Bourdieu and Bernstein are considered primary effects, which have already been
filtered during pre-university education; however, at this level it is necessary to focus on the secondary
effects. The model is broadened not only with intentional factors, but also with "causal" factors linked to
personal and social dispositions, as Diego Gambetta (1996) has done.
Figure 1. Model of analysis.
3.1.1. Preferences Preferences are formed both by personal factors –some of which, e.g. study disposition, are only partially
related to social variables that explain them– and eminently social factors, in particular, those transmitted
by the family. The classic aspiration to equal or exceed family socio-economic status (Breen and
Goldthorpe 1997) leads to specific preferences regarding the orientation of the chosen studies, as do other
factors related to family attitudes toward different university studies.
Our review of the literature leads us to conclude that WC students often choose their degree based on
what they can obtain after graduation (instrumental motivation). Their “promotionist” approach involves
obvious preferences toward degrees that are likely to provide quicker, clearer and more stable access to
the labour market (Boudon 1983; Breen and Goldthorpe 1997).
In contrast, students from higher social classes are not as worried about the future and therefore usually
choose their course of study without considering it. In fact, since studying at university is part of their
parents’ lifestyle, it is easy for them to choose with a more expressive motivation (Read et al. 2003). As
Capabilities
Difficulty and
duration of studies
Success odds
Income
Risk
Social and personal
aspirations
Study disposition
Balance
Oportunities
(options)
Direct and indirect
costs
Preferences
Relative cost
4
instrumental and expressive motivations are not mutually exclusive, the difference is due to one of them
being more important than the other.
Social pressure, mostly from the family, is a key factor in understanding the choice and the objectives
pursued. This effect is found both in WC students, who have experienced family opposition to studying,
and in middle-class students, whose parents take for granted that they will go to university, with the
resulting anxiety caused by the fear of disappointing them (Langa 2003; Troiano 2005).
3.1.2. Relative cost The financial cost to students and/or their families for a degree can vary greatly, and it is necessary to
calculate its relative weight based on their economic situation. Direct costs for studying (fees, academic
material, etc.), indirect costs (transportation, accommodation, etc.) and opportunity costs (salary not
received for the time not spent in paid employment) are, therefore, taken into consideration; at the same
time, the weight of expenses is relative to the income received by students or their families. This expense
can be compensated for by policies to promote higher education, such as grants.
But this is not the only issue related to cost. Delia Langa (2003) made a major contribution highlighting
the sense of indebtedness students may feel toward their families as an explanation for certain decisions
they make during their studies and as a factor in differentiating two sorts of experiences at university. On
the one hand, WC students experience university as a privilege; in addition, they may experience guilt over being a burden to their families. This leads to higher levels of distress, linked to the fear of failure.
On the other hand, students from higher classes experience university as a right, delaying their adult
social responsibilities. In this sense, the time they spend in university and the support they receive from
their families are seen as legitimate, leading to less distress.
3.1.3. Odds of success You cannot predict the odds of success unless there is the possibility of actually carrying out the activity.
In access to university, there are certain requirements which determine the options available. The first one
is to have the appropriate credentials; the second is to have the required “access marks” (different
combinations based on the average of secondary education and the university access exam marks) for one
or more degrees. These options depend, therefore, on previous academic achievement and are the result of the primary effects of social background on performance.
In the same way, primary effects play a role in the information which students have about their own
academic capabilities. These perceived capabilities, together with the duration of studies and the available
information about the level of difficulty (needed effort to pass courses, failure rate and drop-out rate, etc.)
form the basis on which students build their appreciation of the odds for success ascribed to each possible
option/degree.
Numerous researchers, particularly in the United Kingdom, have highlighted the importance of social
factors beyond the strictly academic ones in their analysis. Thus, when there are pronounced differences
in prestige and social distinction between institutions, students also evaluate their social proximity to the
institution. Hence, a process of self-selection occurs related to the fear students may have of not fitting into a specific university social context. Many studies, particularly in the United Kingdom, have stressed
the importance of social factors other than the strictly academic ones in their analysis. For example, when
there are pronounced differences in prestige and social distinction among institutions students also
evaluate their social proximity to the institution. In other words, a process of self-selection occurs based
on the fear students may have of not fitting into a specific university social context and on the greater
academic difficulties they foresee in certain programmes (Voigt 2007). Thus, only those who feel they are
equal to the other students, or think they are capable of handling their own difference, dare to choose high
prestige institutions. This is clearly the case of many older and WC students, who say they choose
institutions where they will feel comfortable (Reay et al. 2001).
3.2. Balance between risk and preferences According to the meritocratic model, the degree choice should be clear: those with higher marks choose
higher prestige degrees and institutions. This mechanism alone should lead to a lower presence of WC
students in degree programmes with higher access requirements, as these students generally have lower
average marks than other students. However, what many studies also find, as might be expected, is that
WC students with marks high enough to choose higher prestige degrees and institutions do not do so. In
5
contrast, students from more advantaged classes even with poor academic records do not hesitate to enrol
in high prestige universities (Power et al. 2003; Siano-Kyrgiou and Tsiplakides 2011).
Here is where other factors become relevant. University students try to minimise the risk (economic,
academic and/or social risk) entailed by their decisions. For students with high family incomes and/or
with reduced costs for studying, the option of accepting low odds for success or extending their studies
becomes viable (Leathwook and O’Connell 2003).
In contrast, WC students completely depend on external circumstances to reduce costs (living near their university, grants policies, low fees, etc.), and they can only reduce the relative costs of studying by
working, which paradoxically may reduce their odds of success. As a result, they try to minimise risk and
maximise the odds of success by other available means: such as enrolling in university when their own
capabilities guarantee their success, choosing shorter degree programmes, those that are perceived as
easier, or programmes without added social difficulties.
Finally, not only risk analysis, but also preferences are part of the final balance. If motivation plays a role
in the final decision – such that among WC students, high levels of motivation offset higher risks, while
middle-class students with low motivation are willing to just give university study a try, because they do
not risk as much – then it would be expected that WC students would have higher levels of motivation
than other students. This is a strong hypothesis; a weaker alternative would be, for instance, that WC students’ motivation is far more instrumental.
4. Research methodology The research on which the results of this article are based comes from an analysis of ten2 degree
programmes at four public universities in the Barcelona Metropolitan Area through questionnaires given
to 857 students. The questionnaire, with seventy questions covering different topics, was developed based
on the analysis of 80 interviews with students from the same degree programmes. Discourses about their
perceptions and motivations are reflected in the questions. The questionnaire was handed out in classes at
the beginning of 2010 and analysed with the SPSS programme.
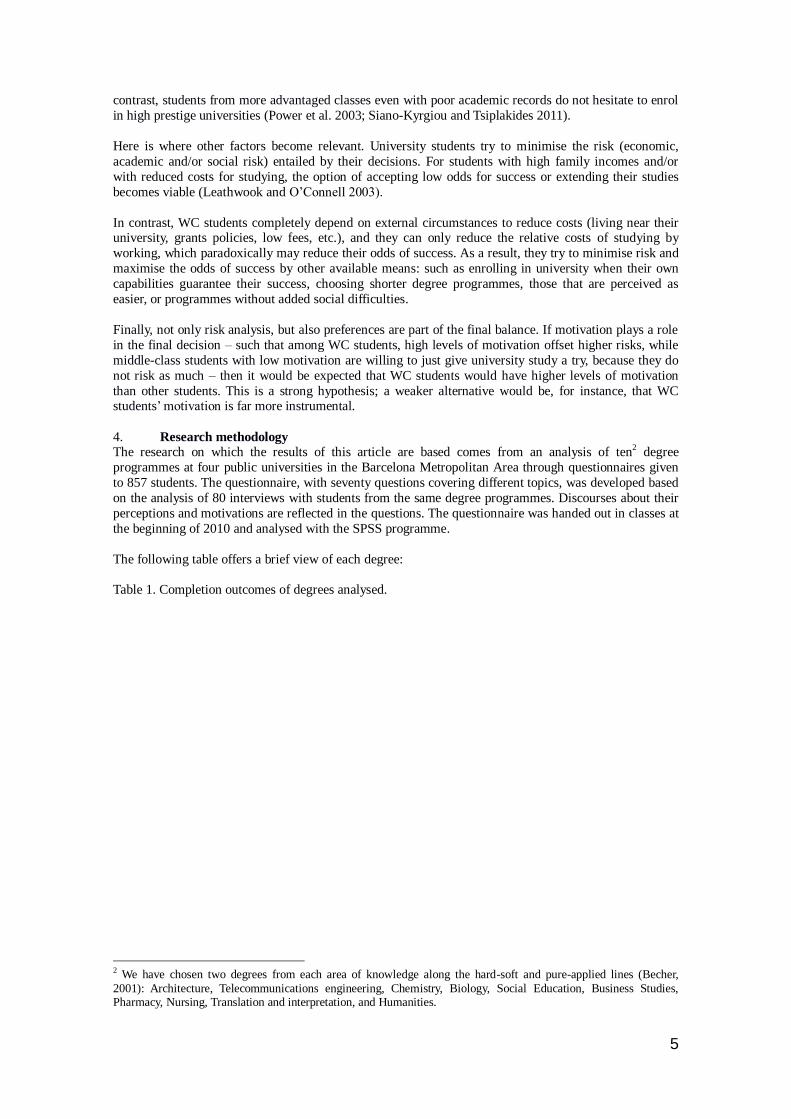
The following table offers a brief view of each degree:
Table 1. Completion outcomes of degrees analysed.
2 We have chosen two degrees from each area of knowledge along the hard-soft and pure-applied lines (Becher,
2001): Architecture, Telecommunications engineering, Chemistry, Biology, Social Education, Business Studies, Pharmacy, Nursing, Translation and interpretation, and Humanities.
6
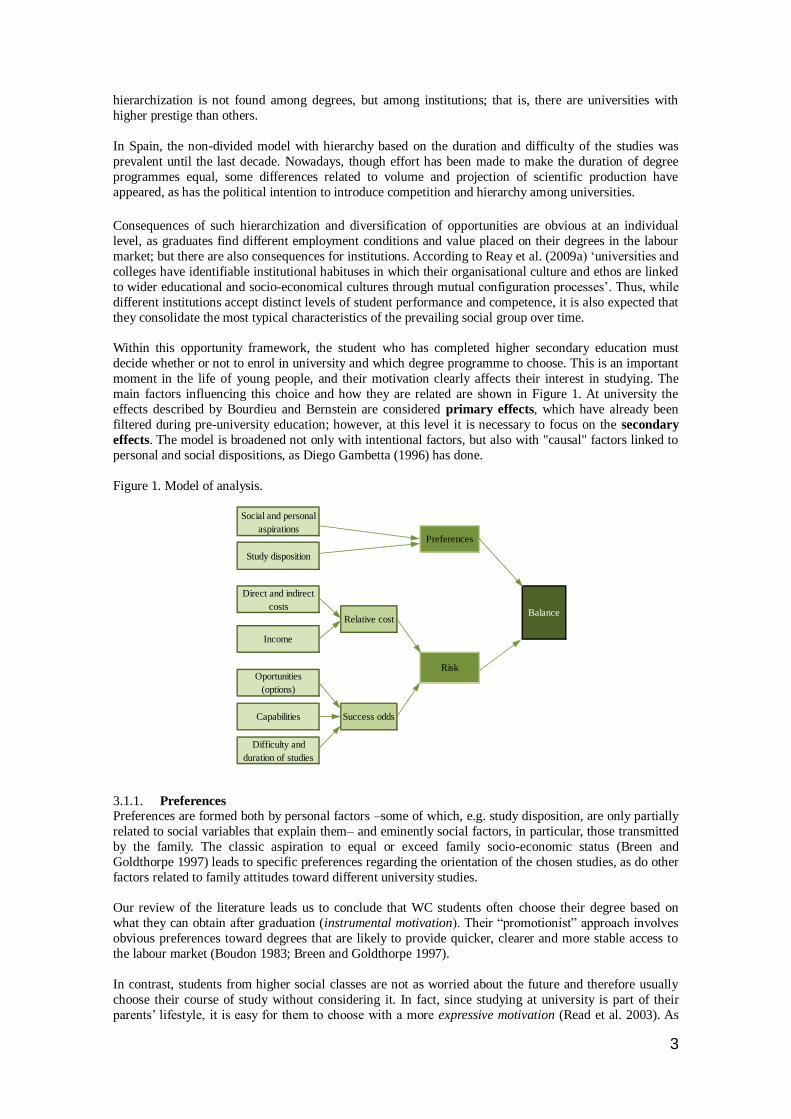
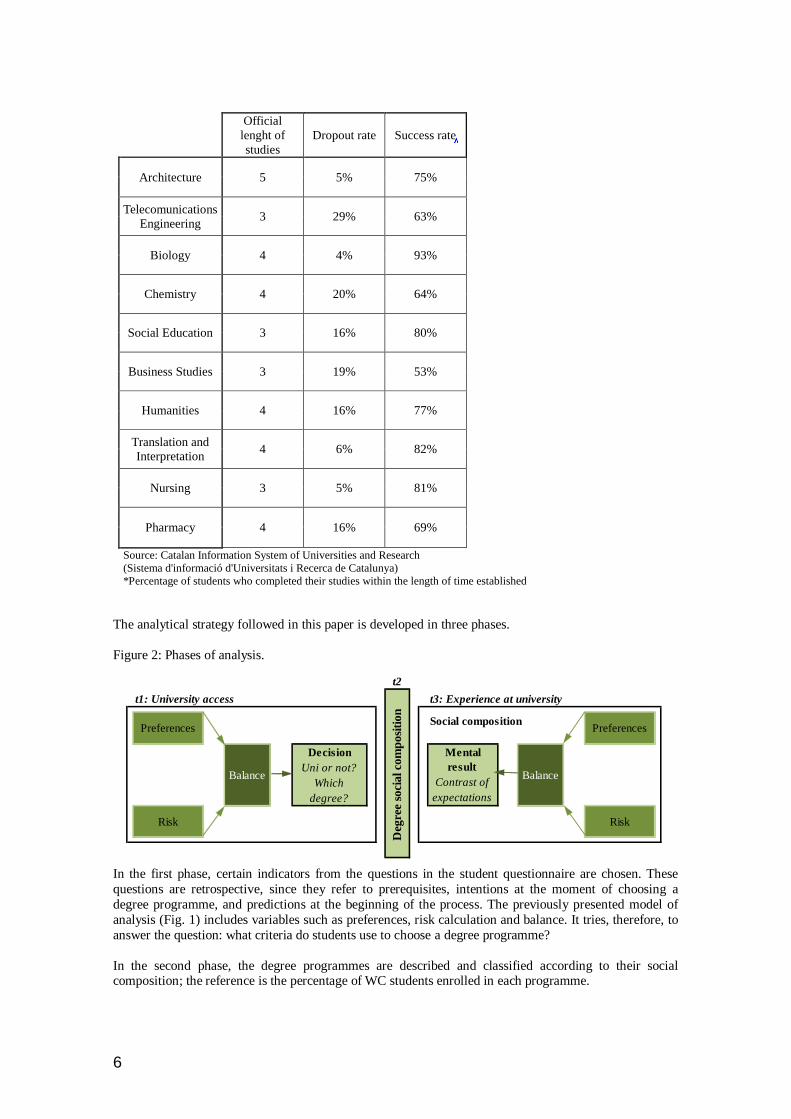
The analytical strategy followed in this paper is developed in three phases.
Figure 2: Phases of analysis.
In the first phase, certain indicators from the questions in the student questionnaire are chosen. These
questions are retrospective, since they refer to prerequisites, intentions at the moment of choosing a
degree programme, and predictions at the beginning of the process. The previously presented model of
analysis (Fig. 1) includes variables such as preferences, risk calculation and balance. It tries, therefore, to
answer the question: what criteria do students use to choose a degree programme?
In the second phase, the degree programmes are described and classified according to their social composition; the reference is the percentage of WC students enrolled in each programme.
Official
lenght of
studies
Dropout rate Success rate
Architecture 5 5% 75%
Telecomunications
Engineering 3 29% 63%
Biology 4 4% 93%
Chemistry 4 20% 64%
Social Education 3 16% 80%
Business Studies 3 19% 53%
Humanities 4 16% 77%
Translation and
Interpretation 4 6% 82%
Nursing 3 5% 81%
Pharmacy 4 16% 69%
Source: Catalan Information System of Universities and Research
(Sistema d'informació d'Universitats i Recerca de Catalunya)
*Percentage of students who completed their studies within the length of time established
t2
t1: University access t3: Experience at university
Social composition
Deg
ree
soci
al co
mp
osi
tio
n
Balance
Preferences
Risk
Preferences
Risk
Balance
Decision
Uni or not?
Which
degree?
Mental
result
Contrast of
expectations
7
Finally, in the third phase, degrees are described according to indicators related to actual progress (mid-
point) in the studies. These indicators tackle the same areas which comprised the initial criteria of degree
choice (preferences and risk calculation) and refer to typical characteristics of the different programmes.
This is how the question of whether these studies really fulfil students’ expectations is approached.
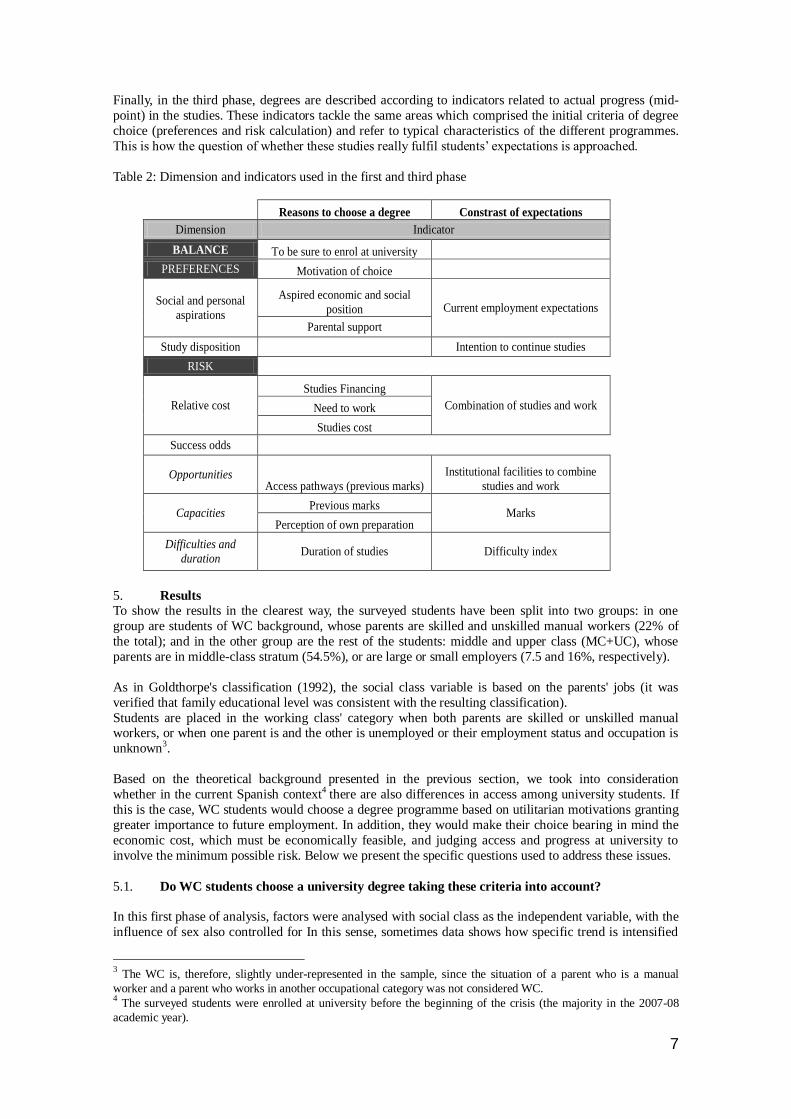
Table 2: Dimension and indicators used in the first and third phase
5. Results To show the results in the clearest way, the surveyed students have been split into two groups: in one
group are students of WC background, whose parents are skilled and unskilled manual workers (22% of
the total); and in the other group are the rest of the students: middle and upper class (MC+UC), whose
parents are in middle-class stratum (54.5%), or are large or small employers (7.5 and 16%, respectively).
As in Goldthorpe's classification (1992), the social class variable is based on the parents' jobs (it was
verified that family educational level was consistent with the resulting classification).
Students are placed in the working class' category when both parents are skilled or unskilled manual workers, or when one parent is and the other is unemployed or their employment status and occupation is
unknown3.
Based on the theoretical background presented in the previous section, we took into consideration
whether in the current Spanish context4 there are also differences in access among university students. If
this is the case, WC students would choose a degree programme based on utilitarian motivations granting
greater importance to future employment. In addition, they would make their choice bearing in mind the
economic cost, which must be economically feasible, and judging access and progress at university to
involve the minimum possible risk. Below we present the specific questions used to address these issues.
5.1. Do WC students choose a university degree taking these criteria into account?
In this first phase of analysis, factors were analysed with social class as the independent variable, with the
influence of sex also controlled for In this sense, sometimes data shows how specific trend is intensified
3 The WC is, therefore, slightly under-represented in the sample, since the situation of a parent who is a manual
worker and a parent who works in another occupational category was not considered WC. 4 The surveyed students were enrolled at university before the beginning of the crisis (the majority in the 2007-08
academic year).
Reasons to choose a degree Constrast of expectations
Dimension Indicator
BALANCE To be sure to enrol at university
PREFERENCES Motivation of choice
Social and personal
aspirations
Aspired economic and social
position Current employment expectations
Parental support
Study disposition Intention to continue studies
RISK
Relative cost
Studies Financing
Combination of studies and work Need to work
Studies cost
Success odds
Opportunities Access pathways (previous marks)
Institutional facilities to combine
studies and work
Capacities Previous marks
Marks Perception of own preparation
Difficulties and
duration Duration of studies Difficulty index
8
by sex-or is rather specific for men or women- but without any statistical interaction with social class
variable. Social class relations are the focus of this article, although taking into account social class and
sex together deserves further analysis in other research work.
It also must be kept in mind that the results shown come from a survey carried out in students’ third year;
as a result, the lack of data on students that dropped out in previous years can lead to a distortion in the
results.
5.1.1. Preferences More WC students chose their degree programme considering the future occupation to which they could
gain access after graduation than other students (WC: 44%/MC+UC: 35%*).5 In addition, they showed
reduced academic motivation –choice of degree programme based on interest in its contents– (WC:
41.5%/MC+UC: 50%*). Consequently, WC students follow a different tendency from the other students
regarding their reasons for choosing to attend university.
In the same sense, WC students aspire to improve their economic situation in relation to their parents
(WC: 73.5%/MC+UC: 48%*), whereas other students are content to maintain the same economic
situation as their parents (WC: 10.2%/MC+UC: 33%*). Though the relationship is not so obvious, this
tendency can also be seen regarding students' social aspirations: WC students want to have a higher social
status than their parents (WC: 38%/MC+UC: 33%), while other students are content with the same social status as their parents (WC: 28%/MC+UC: 38%). Aspirations are related to real improvement
opportunities; there is greater room for improvement among WC students, both economically and
socially, than among middle- and upper-class students.
The parents' attitude toward their children’s studies reveals small but interesting differences. First,
middle-class and upper-class parents have always been more confident that their children would graduate
from university than WC parents (“They have always thought that I would graduate” WC: 31%/MC+UC:
42%*), as if they “normalise” going to university, taking it for granted. Among WC parents, those with a
“supportive” attitude regarding their children’s choice to attend university stand out (“They have always
encouraged me to continue studying” WC: 56%/MC+UC: 48%*). They therefore have a proactive
starting point, without assuming the result of graduating. In contrast, receiving little support from their parents, which part of the literature identifies as typical among WC students, is really reduced: only 3% of
WC parents would have preferred their children to work instead of going to university.
5.1.2. Relative cost
Focusing on the cost of studying, the differences based on social class regarding working while studying
stand out. WC students are highly focused on the need to finance their studies, accommodation, and
transportation (“I need to work quite a lot” or “a lot” WC: 70%/MC+UC: 48%*).
How university studies are financed also differentiates university students. WC students finance their
studies working throughout the academic year (WC: 28%/MC+UC: 17%*) or during their holidays (WC:
22%/MC+UC: 11%*), while other students mainly finance their studies through contributions from their
parents (WC: 40%/MC+UC: 70%*). Although less than a quarter of students finance their studies through grants, there are also differences depending on social class background (WC: 18%/MC+UC: 9%*).
The cost of university has an additional consequence –a feeling of debt arising from this situation (Langa,
2003). Within our student sample, most of the students whose educations are financed by their parents
reveal they feel indebted to them, but in WC students this tendency is greater, a much higher percentage
believes they owe their family something for the financial efforts they have made (WC: 56%/MC+UC:
34%*)6.
Regarding the actual cost of studies for students and their families, direct (fees, school material) and
indirect (transportation and accommodation) costs have been analysed separately. When the total degree
costs are high (more than 400 Euros a month), WC students are under-represented (WC: 24%/MC+UC: 30%). This difference is due more to indirect than to direct costs. That is, WC students try to avoid the
5 An asterisk is added when the difference is statistically significant.
6 Filtered result, only corresponding to those students whose parents pay for their university education.
9
higher cost of choosing a university far from home in order to save on accommodation and transportation
costs.
5.1.3. Odds of success When access conditions are considered, WC students state more frequently that they think they had an
insufficient or very insufficient level of education before starting their university studies (WC:
3.5%/MC+UC: 1.1%*). In contrast, other students are more represented among those who think they had
a high level (WC: 77%/MC+UC: 84%).
Regarding their own capacities, as a whole WC students have lower marks than other students (with low
access marks, WC: 70.6%/MC+UC: 44%* and with high access marks, WC: 12%/MC+UC: 25%*). As a
result, they have fewer possible options (opportunities) than other students. Moreover, a higher
percentage of WC students gain university access through Advanced Level Specific Vocational Training
(WC: 22%/MC+UC: 10%*); in other words, to degree programmes with lower access requirements.
To examine the hypothesis that WC students choose degree programmes which pose the minimum risk,
results from students who studied in short-cycle programmes (three years) have been analysed. Students were asked whether they would have enrolled if the degree programme were 4 years. The results show
that half of WC students stated they were completely sure they would have enrolled, in comparison to
59% of MC+UC students in the same situation.
Combining both variables, an analysis has also been carried out to further explore the hypothesis that
there is higher risk aversion among WC students. First of all, the general distribution of students in this
sample shows the preference for long cycles over short cycles: short 46%/long 56%. But when students
with lower access marks are selected, then the distribution reverses: short 67%/long 33%; and this
tendency is even more pronounced among WC students.
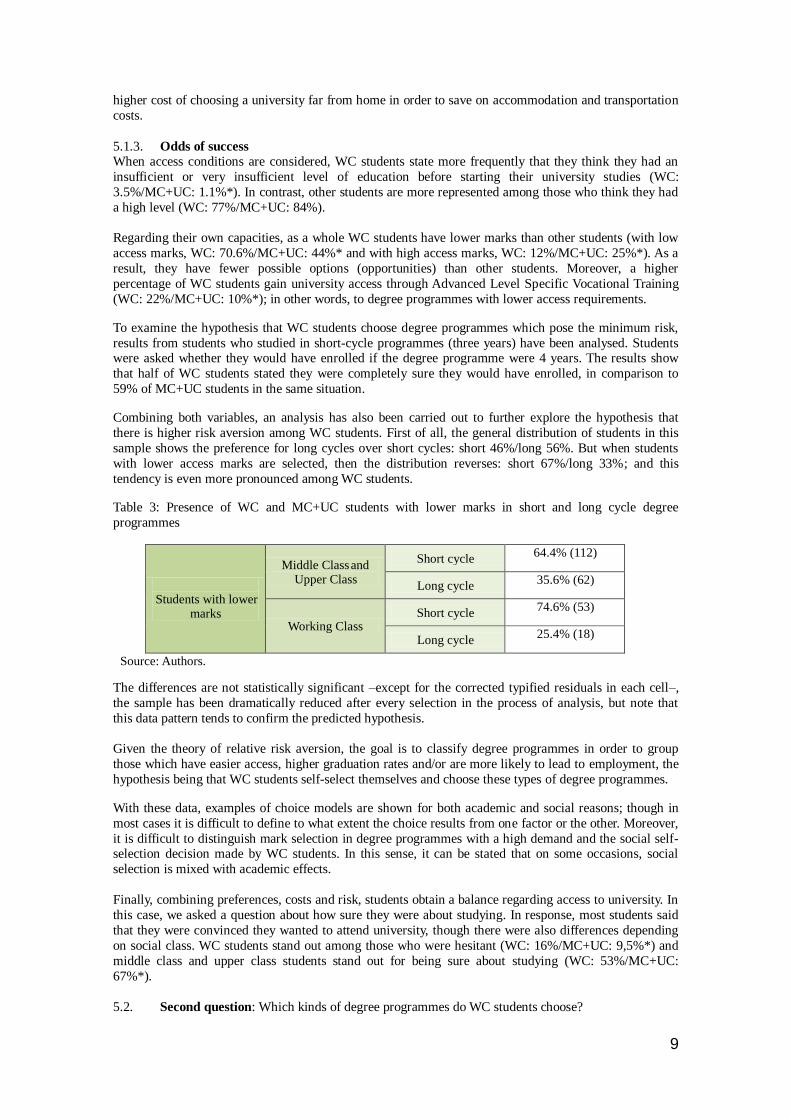
Table 3: Presence of WC and MC+UC students with lower marks in short and long cycle degree
programmes
The differences are not statistically significant –except for the corrected typified residuals in each cell–,
the sample has been dramatically reduced after every selection in the process of analysis, but note that
this data pattern tends to confirm the predicted hypothesis.
Given the theory of relative risk aversion, the goal is to classify degree programmes in order to group
those which have easier access, higher graduation rates and/or are more likely to lead to employment, the
hypothesis being that WC students self-select themselves and choose these types of degree programmes.
With these data, examples of choice models are shown for both academic and social reasons; though in
most cases it is difficult to define to what extent the choice results from one factor or the other. Moreover,
it is difficult to distinguish mark selection in degree programmes with a high demand and the social self-selection decision made by WC students. In this sense, it can be stated that on some occasions, social
selection is mixed with academic effects.
Finally, combining preferences, costs and risk, students obtain a balance regarding access to university. In
this case, we asked a question about how sure they were about studying. In response, most students said
that they were convinced they wanted to attend university, though there were also differences depending
on social class. WC students stand out among those who were hesitant (WC: 16%/MC+UC: 9,5%*) and
middle class and upper class students stand out for being sure about studying (WC: 53%/MC+UC:
67%*).
5.2. Second question: Which kinds of degree programmes do WC students choose?
Students with lower
marks
Middle Class and Upper Class
Short cycle 64.4% (112)
Long cycle 35.6% (62)
Working Class Short cycle
74.6% (53)
Long cycle 25.4% (18)
Source: Authors.
10
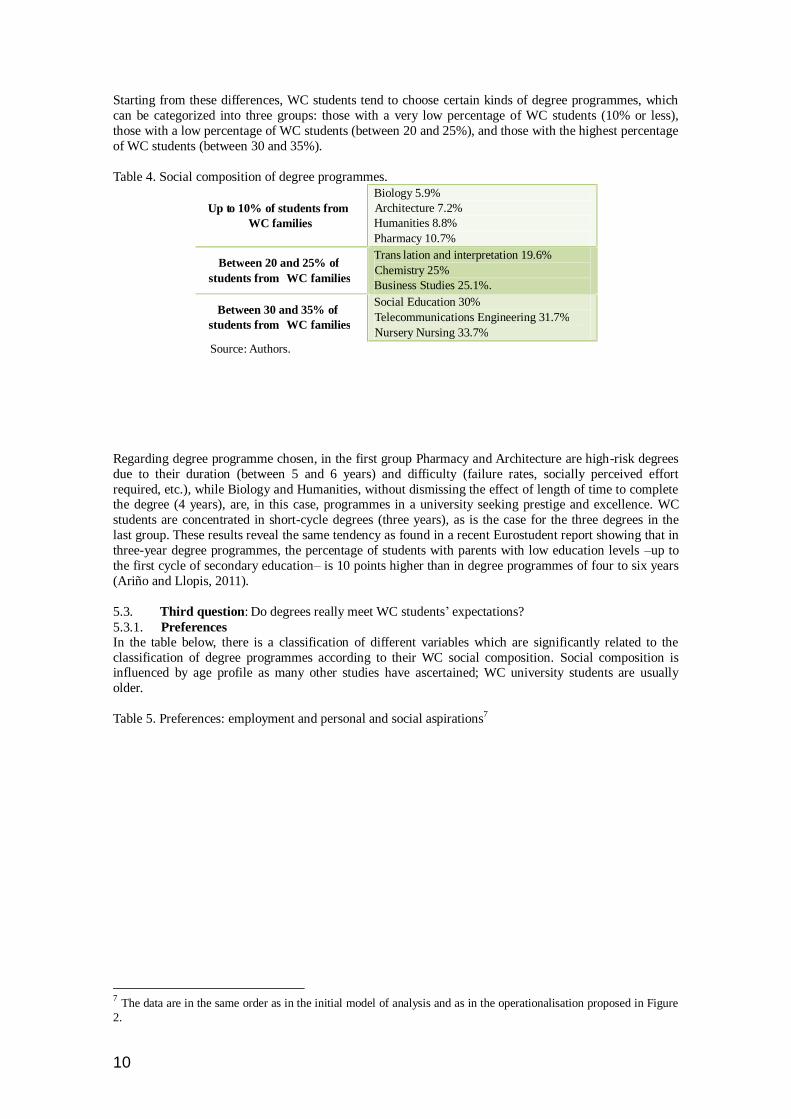
Starting from these differences, WC students tend to choose certain kinds of degree programmes, which
can be categorized into three groups: those with a very low percentage of WC students (10% or less),
those with a low percentage of WC students (between 20 and 25%), and those with the highest percentage
of WC students (between 30 and 35%).
Table 4. Social composition of degree programmes.
Regarding degree programme chosen, in the first group Pharmacy and Architecture are high-risk degrees
due to their duration (between 5 and 6 years) and difficulty (failure rates, socially perceived effort
required, etc.), while Biology and Humanities, without dismissing the effect of length of time to complete the degree (4 years), are, in this case, programmes in a university seeking prestige and excellence. WC
students are concentrated in short-cycle degrees (three years), as is the case for the three degrees in the
last group. These results reveal the same tendency as found in a recent Eurostudent report showing that in
three-year degree programmes, the percentage of students with parents with low education levels –up to
the first cycle of secondary education– is 10 points higher than in degree programmes of four to six years
(Ariño and Llopis, 2011).
5.3. Third question: Do degrees really meet WC students’ expectations?
5.3.1. Preferences In the table below, there is a classification of different variables which are significantly related to the
classification of degree programmes according to their WC social composition. Social composition is influenced by age profile as many other studies have ascertained; WC university students are usually
older.
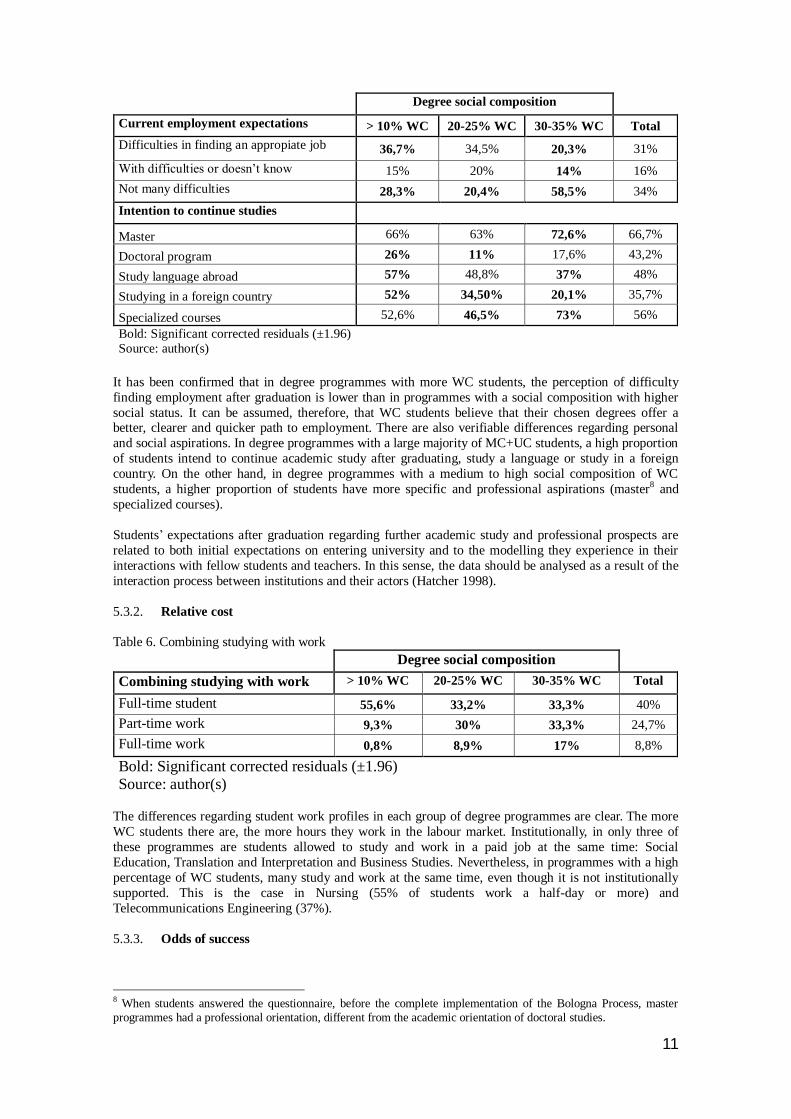
Table 5. Preferences: employment and personal and social aspirations7
7 The data are in the same order as in the initial model of analysis and as in the operationalisation proposed in Figure
2.
Up t o 10% of students from
WC families
Biology 5.9%
Architecture 7.2%
Humanities 8.8%
Pharmacy 10.7%
Betw een 20 and 25% of
students from WC families
Trans lation and interpretation 19.6%
Chemistry 25%
Business Studies 25.1%.
Between 30 and 35% of
students from WC families
Social Education 30%
Telecommunications Engineering 31.7%
Nursery Nursing 33.7%
Source: Authors.
11
It has been confirmed that in degree programmes with more WC students, the perception of difficulty
finding employment after graduation is lower than in programmes with a social composition with higher
social status. It can be assumed, therefore, that WC students believe that their chosen degrees offer a better, clearer and quicker path to employment. There are also verifiable differences regarding personal
and social aspirations. In degree programmes with a large majority of MC+UC students, a high proportion
of students intend to continue academic study after graduating, study a language or study in a foreign
country. On the other hand, in degree programmes with a medium to high social composition of WC
students, a higher proportion of students have more specific and professional aspirations (master8 and
specialized courses).
Students’ expectations after graduation regarding further academic study and professional prospects are
related to both initial expectations on entering university and to the modelling they experience in their
interactions with fellow students and teachers. In this sense, the data should be analysed as a result of the
interaction process between institutions and their actors (Hatcher 1998).
5.3.2. Relative cost
Table 6. Combining studying with work
The differences regarding student work profiles in each group of degree programmes are clear. The more
WC students there are, the more hours they work in the labour market. Institutionally, in only three of
these programmes are students allowed to study and work in a paid job at the same time: Social
Education, Translation and Interpretation and Business Studies. Nevertheless, in programmes with a high
percentage of WC students, many study and work at the same time, even though it is not institutionally
supported. This is the case in Nursing (55% of students work a half-day or more) and
Telecommunications Engineering (37%).
5.3.3. Odds of success
8 When students answered the questionnaire, before the complete implementation of the Bologna Process, master
programmes had a professional orientation, different from the academic orientation of doctoral studies.
Degree social composition
Current employment expectations > 10% WC 20-25% WC 30-35% WC Total
Difficulties in finding an appropiate job 36,7% 34,5% 20,3% 31%
With difficulties or doesn’t know 15% 20% 14% 16%
Not many difficulties 28,3% 20,4% 58,5% 34%
Intention to continue studies
Master 66% 63% 72,6% 66,7%
Doctoral program 26% 11% 17,6% 43,2%
Study language abroad 57% 48,8% 37% 48%
Studying in a foreign country 52% 34,50% 20,1% 35,7%
Specialized courses 52,6% 46,5% 73% 56%
Bold: Significant corrected residuals (±1.96)
Source: author(s)
Degree social composition
Combining studying with work > 10% WC 20-25% WC 30-35% WC Total
Full-time student 55,6% 33,2% 33,3% 40%
Part-time work 9,3% 30% 33,3% 24,7%
Full-time work 0,8% 8,9% 17% 8,8%
Bold: Significant corrected residuals (±1.96) Source: author(s)
12
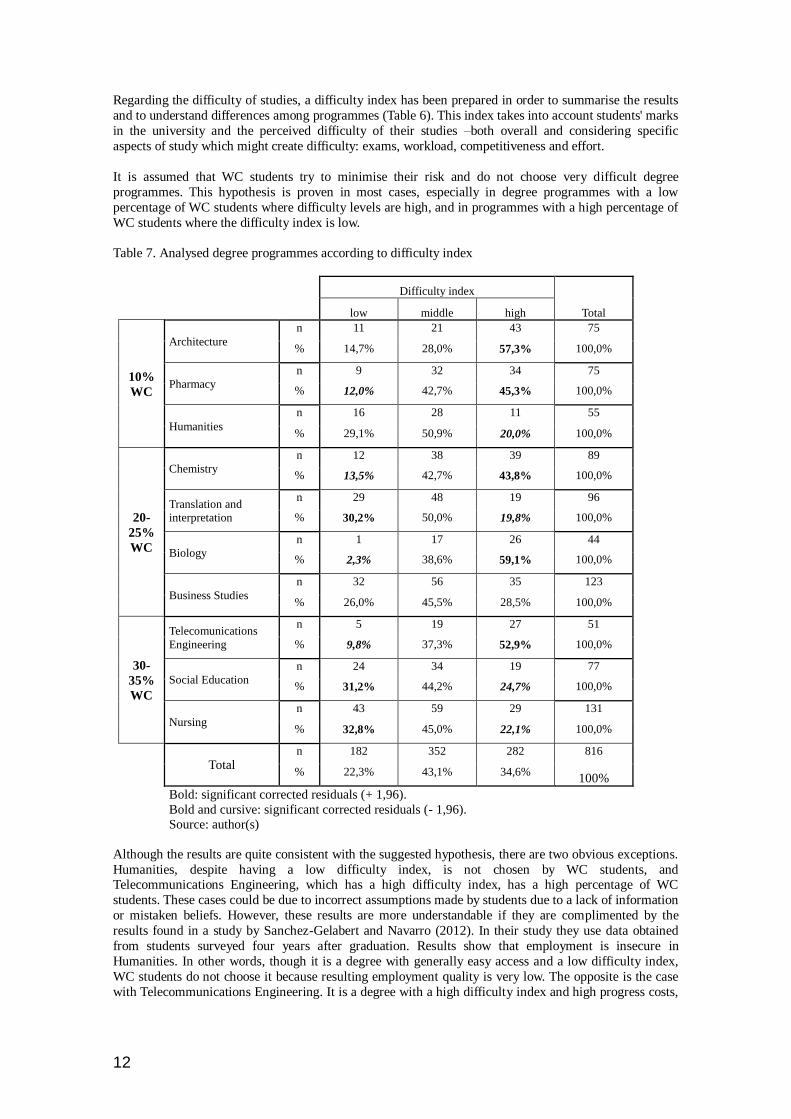
Regarding the difficulty of studies, a difficulty index has been prepared in order to summarise the results
and to understand differences among programmes (Table 6). This index takes into account students' marks
in the university and the perceived difficulty of their studies –both overall and considering specific
aspects of study which might create difficulty: exams, workload, competitiveness and effort.
It is assumed that WC students try to minimise their risk and do not choose very difficult degree
programmes. This hypothesis is proven in most cases, especially in degree programmes with a low
percentage of WC students where difficulty levels are high, and in programmes with a high percentage of
WC students where the difficulty index is low.
Table 7. Analysed degree programmes according to difficulty index
Although the results are quite consistent with the suggested hypothesis, there are two obvious exceptions.
Humanities, despite having a low difficulty index, is not chosen by WC students, and Telecommunications Engineering, which has a high difficulty index, has a high percentage of WC
students. These cases could be due to incorrect assumptions made by students due to a lack of information
or mistaken beliefs. However, these results are more understandable if they are complimented by the
results found in a study by Sanchez-Gelabert and Navarro (2012). In their study they use data obtained
from students surveyed four years after graduation. Results show that employment is insecure in
Humanities. In other words, though it is a degree with generally easy access and a low difficulty index,
WC students do not choose it because resulting employment quality is very low. The opposite is the case
with Telecommunications Engineering. It is a degree with a high difficulty index and high progress costs,
Difficulty index
Total
low middle high
10%
WC
Architecture
n 11 21 43 75
% 14,7% 28,0% 57,3% 100,0%
Pharmacy
n 9 32 34 75
% 12,0% 42,7% 45,3% 100,0%
Humanities
n 16 28 11 55
% 29,1% 50,9% 20,0% 100,0%
20-
25%
WC
Chemistry
n 12 38 39 89
% 13,5% 42,7% 43,8% 100,0%
Translation and
interpretation
n 29 48 19 96
% 30,2% 50,0% 19,8% 100,0%
Biology
n 1 17 26 44
% 2,3% 38,6% 59,1% 100,0%
Business Studies
n 32 56 35 123
% 26,0% 45,5% 28,5% 100,0%
30-
35%
WC
Telecomunications
Engineering
n 5 19 27 51
% 9,8% 37,3% 52,9% 100,0%
Social Education
n 24 34 19 77
% 31,2% 44,2% 24,7% 100,0%
Nursing
n 43 59 29 131
% 32,8% 45,0% 22,1% 100,0%
Total n 182 352 282 816
% 22,3% 43,1% 34,6% 100%
Bold: significant corrected residuals (+ 1,96).
Bold and cursive: significant corrected residuals (- 1,96).
Source: author(s)
13
but taking into account that it is a short-cycle degree and that likely employment is obviously secure, we
can deduce why there is a high percentage of WC students in this degree programme.
With the analysis of the total balance, it is clear that preferences converge for WC students: expectations
of higher professionalisation and orientation to the labour market are met; and regarding risk, it can be
reduced by cutting the economic cost of studying by working at the same time and choosing degree
programmes that are easier to complete. There is, therefore, a connection between balance-degree choices
made by students when they enrol in university and between balance-evaluation made by students when
they are in the middle of their studies.
6. Conclusions
Although university expansion in recent years in Spain has led to the growing presence of WC students in
university, their access to and progress in university is slightly different from middle-class and upper-
class students.
Regarding access, we have found that there is a process of self-selection among students in particular
degree programmes depending on their social background. On the one hand, this is due to the academic
admission requirements, as the average marks of WC students are lower than those of other students;
thus, education inequalities as primary effects become apparent. On the other hand, when making decisions about continuing studies and choosing degree programmes (secondary effects), WC students try
to minimise the risk linked to adverse economic conditions. As a result, they choose programmes that are
easier to complete (as they require fewer years of study) and with clear professional profiles, but not so
much based on the other characteristics as students with lower grades still enrol at university if their
marks allow them to do so; thus, no process of over-selection by access marks can be seen. In addition,
WC students tend to avoid more prestigious degree programmes, where they may feel like outsiders both
academically and socially.
Thus, we can see that all the theoretical and empirical approaches discussed at the beginning of this study
contribute to explaining the unequal access of WC students from our sample to the different degree
programmes analysed, but the decision often made by WC students to choose short-degree programmes (three-year degrees) is the one which has shown to have the greatest weight in this context. The diverted
structure of the system is the relevant point here and, as on many other occasions (Shavit et al. 2007) it
reveals its ability to provide clear opportunities for social mobility, however, at the expense of providing
the possibility of status confirmation, as well.
During the third year of studies, students’ opportunities and preferences are also different depending on
their social background. As shown in previous research regarding students’ experiences, the stress due to
the scarcity of resources affects WC students: it becomes academic stress and affects the way students
experience their time at the university. There is, therefore, some consistency between students’ initial
perceptions and actual objective conditions. Despite this general statement, variations in difficulties
experienced are often small and they also depend on the degree programme. This may be the result of a
process of homogenisation among students from different backgrounds, which could happen before beginning university or after, through the socialisation process they have all undergone in their first three
years of study (Reay et al. 2009b).
Degree programmes with different social compositions project different social images that are maintained
over time and determine the choices of subsequent prospective students. Thus, we can expect that the
student body in these programmes will continue to manifest the most typical characteristics of the
prevailing social group over time (Reay et al. 2009a). And more importantly, this process could
consolidate academic requirements and aspects of the organizational and social climate that contributes to
again attracting similar students in terms of social background. This seems to be the case for the
programmes with a higher proportion of WC students, but at the present time the implementation of the
Bologna Process is bringing about the unification of degree programmes in terms of length (four-year bachelor degrees, with some exceptions). It seems clear that this major structural reform will involve
institutional changes, but perhaps more relevant will be the changes triggered in the decisions made by
potential students from WC backgrounds. The current context of rising university fees along with the
current economic crisis –with high unemployment rates among families with low education levels–
generates further challenges for WC students in gaining access to the Spanish higher education system.
14
7. References Archer, L., Leathwood, C. and Hutchings, M. (2002). Higher Education: A risky business. In A. Hayton,
and A. Pacazuska (Eds.), Access, Participation and Higher Education: policy and practice (pp. 106-
121). London: Kogan Page.
Ariño, A. and Llopis, R. (2011). ¿Universidad sin clases? Condiciones de vida de los estudiantes
universitarios en España (Eurostudent IV). Madrid: Ministerio de Educación.
Becher, T. (2001). Tribus y territorios académicos. Madrid: Gedisa.
Boliver, V. (2010). Expansion, differentiation, and the persistence of social class inequalities in British
higher education. Higher Education, Doi: 10.1007/s10734-010-9374-y. Boudon, R. (1983). La desigualdad de oportunidades. Barcelona: Laia.
Breen, R. and Goldthorpe, J. (1997). Explaining Educational Differentials: Towards a Formal Rational
Action Theory. Rationality and Society, 9(3), 275-305.
Brennan, J., Edmunds, R., Houston, M., Jary, D., Lebeau, Y., Osborne, M. and Richardson, J. (2009)
Improving What is Learned at University: An exploration of the social and organisational diversity of
university education. London: Routledge.
Crozier, G., Reay, D., Clayton, J., Colliander, L. and Grinstead, J. (2008). Different strokes for different
folks: diverse students in diverse institutions – experiences of higher education. Research papers in
education, 23(2), 167-177.
Elias, M. (2010). Impact of the Bologna Process on Spanish Students’ Expectations. International Journal
of Iberian Studies, 23(1), 53–62. Eurostat (2009). The Bologna Process in Higher Education in Europe. Key indicators on the social
dimension and mobility. http://www.eurostudent.eu/download_files/documents/KS-78-09-653-
EN.pdf. Acessed 6 June 2012.
Gambetta, D. (1996). Were they pushed or did they jump? Individual decision mechanisms in education.
Colorado: West View Press.
Goldthorpe, J. (1992). Revised class schema. London: Social and Community Planning Research.
Hatcher, R. (1998). Class Differentiation in Education: Rational choices? British Journal of Sociology of
Education, 19(1), 5-24.
Iannelli, C., Gamoran, A. and Paterson, L. (2011). Scottish higher education, 1987–2001: expansion
through diversion. Oxford Review of Education, 37(6), 717-741.
Kloosterman, J.G. (2010). Social background and children's educational careers: the primary and secondary effects of social background over transitions and over time in the Netherlands. ICS
dissertation series; vol 165. Radboud Universiteit: Nijmegen.
Langa Rosado, D. (2003). Los estudiantes y sus razones prácticas: heterogeneidad de estrategias de
estudiantes universitarios según clase social. Phd dissertion. Universidad Complutense de Madrid.
Departamento de Sociología I.
Leathwood, C. and O’Connell, P. (2003). ‘It’s a struggle’: the construction of the ‘new student’ in higher
education. Journal education policy, 18(6), 597-615.
Power, S., Edwards, T., Whitty, G., and Wigfall, V. (2003). Education and the middle-class. Buckingham:
Open University Pres.
Read, B., Archer, L. and Leathwood, C. (2003). Challenging cultures? Student conceptions of ‘belonging’
and ‘isolation’ at a post-1992 university. Studies in Higher Education, 28(3), 261-276.
Reay, D. Ball, SJ, David, M. and Davies, J. (2001). Choices of Degree or degrees of choice? Social class, race and the higher education choice process. Sociology, 35(4), 855-874.
Reay, D., Crozier, G., and Clayton, J. (2009a). 'Fitting in' or 'standing out': working-class students in UK
higher education. British Educational Research Journal, 32(1), 1-19.
Reay, D., Crozier, G., and Clayton, J. (2009b). 'Strangers in Paradise’?: Working-class students in elite
universities. Sociology, 43(6), 1103-1121.
Reimer, D. and Jacob, M. (2010). Differentiation in higher education and its consequences for social
inequality: introduction to a special issue. Higher Education, 61(3), 223-227.
Reisel, L. (2011). Two Paths to Inequality in Educational Outcomes. Family Background and Educational
Selection in the United States and Norway. Sociology of Education, 84(4), 261-280.
Sanchez-Gelabert, A. and Navarro, J. (2012). ¿Como valoran los estudios los graduados universitarios?
La influencia de la ocupacion en la valoracion de la formacion universitaria y su utilidad, presented at VI Conference Young People and Societies, 7-9th June 2012. Barcelona, Spain.
Shavit, Y., Arum, R. and Gamoran, A. with Menahem, G. (Eds.) (2007). Stratification in Higher
Education: A Comparative Study. Palo Alto: Stanford University Press.
Siano-Kyrgiou, E. and Tsiplakides, I. (2011). Similar performance, but different choices: social class and
higher education choice in Greece. Studies in Higher Education, 36(1), 89-102.
15
Sullivan, A. (2001). Students as Rational Decision-makers: The Question of Beliefs and Desires. Oxford
Sociology Working Paper, 2001-02
Tieben, N. and Wolbers, M.H.J. (2012). Transitions to post-secondary and tertiary education in the
Netherlands: a trend analysis of unconditional and conditional socio-economic background effects,
Higher Education, 60(1), 85-100.
Triventi, M. (2011). Stratification in Higher Education and Its Relationship with Social Inequality: A
Comparative Study of 11 European Countries. European Sociological Review, 20, 1-14.
Troiano, H. (2005). Quand les valeurs et attentes concernant l’avenir professionnel varient avec les profils
motivationnels: la projection professionnelle des étudiants universitaires. In Hadji, Ch., Bargel, T., Masjuan, J.M. (Eds.), Étudier dans une université qui change (pp. 219-247). Grenoble: Presses
Universitaires de Grenoble.
Voigt, K. (2007). Individual choice and unequal participation in higher education. Theory and Research in
Education, 5(1), 87-112.
Top Related
Copyright © 2022 FDOKUMEN

