


Bahasa
Halaman
Hukum

www.elsevier.com/locate/jtrangeo
Journal of Transport Geography 13 (2005) 340–351
Travel behavior within Canada�s older population: a cohort analysis
K. Bruce Newbold *, Darren M. Scott, Jamie E.L. Spinney, Pavlos Kanaroglou,Antonio Paez
School of Geography and Geology, McMaster University, 1280 Main Street West, Hamilton, ON, Canada L8S 4K1
Abstract
The unprecedented demographic change of the aging Canadian society has raised numerous questions, including the provision of
health care and the national pension plan to an increasingly large older population. Surprisingly, however, there is little Canadian
literature regarding the travel behavior of its older population, an oversight that this paper addresses. Using the 1986, 1992, and
1998 General Social Surveys and pseudo-cohort methods, this paper addresses changing driving behavior among older Canadians,
and compares the �old� and �transitional old� to younger-aged cohorts. Results indicate that while older Canadians undertake fewertrips, and travel for different reasons than those in the labor force, their reliance upon the private automobile for transportation is no
less significant. Specifically, we demonstrate that the number of trips by car with older drivers increase over the study period as the
population ages.
� 2004 Elsevier Ltd. All rights reserved.
Keywords: Canada; Older population; Travel behavior
1. Introduction
Forty years ago, the median age of the Canadian
population was 25 years. With the median age of the
Canadian population now exceeding 35 years, and
expected to reach 45 years within the next three decades,
there is little doubt that Canada�s population is aging.Driven by the aging of the baby boom generation,greater life expectancies, and historically low fertility
rates, approximately one in five Canadians will be at
least 65 years old by 2021 (Statistics Canada, 2003).
Moreover, the proportion of the adults aged 80 and over
(what has been referred to as the �old� old) is projected toincrease from approximately 3% in 2001 to 6% by 2021
(Statistics Canada, 2003). At the same time, Canada�solder population is healthier, more affluent, and gener-
0966-6923/$ - see front matter � 2004 Elsevier Ltd. All rights reserved.doi:10.1016/j.jtrangeo.2004.07.007
* Corresponding author. Tel.: +1 905 525 9140x27948; fax: +1 905
546 0463.
E-mail address: [email protected] (K.B. Newbold).
ally more mobile than earlier generations (Chen and
Millar, 2000; Manual and Schultz, 2001), leading to
potentially greater demand for social and leisure activi-
ties, many of which will involve the personal automobile
as the primary source of transportation.
The statement of demographic facts and the unprece-
dented changes in the structure of Canadian society, and
societies elsewhere in the developed world, immediatelyraise questions about the implications of this demo-
graphic change. While Canadian policy makers have
long recognized the importance of an aging population
with respect to Canada�s health care system and nationalpension plan (amongst other issues), the travel behavior
of older Canadians has received surprisingly little atten-
tion. This is not true for other nations. In the United
States, for example, the Transportation Research Boardrecently identified ‘‘an aging population’’ as one of 14
critical issues or challenges facing users or providers of
transportation services today and in the near future
(Pisarski, 2003; Transportation Research Board, 2001).
K.B. Newbold et al. / Journal of Transport Geography 13 (2005) 340–351 341
The implications of Canada�s aging population couldbe significant, with potential impacts including licensing,
public transit provision, traffic congestion, road safety,
transport-related pollution, and deterioration of the
urban environment (see, for example, Transportation
Research Board, 1988, 2001; Janke, 1991; Mercer,1989; OECD, 2001), all of which need to be addressed
via appropriate transportation policy (Caird, 2000;
Alsnih and Hensher, 2003). The 1995 US Nationwide
Personal Transportation Study (NPTS), for example,
found that approximately 92% of all trips made by
Americans aged 65 and older were by private vehicle,
about the same proportion observed for the 16–64 age
group (NPTS, 1995, referenced from Rosenbloom,2001, p. 407). In fact, recent research from the United
States, Australia and some European nations has
suggested that as the respective populations age, they
have become increasingly dependent upon the automo-
bile, that the proportion of older (i.e., 65+) drivers has
increased in these countries (Rosenbloom, 2001), and
that the use of alternative transportation, including
public transportation, is limited (Collia et al., 2003).While Canada is likely experiencing trends similar to
those observed elsewhere in the developed world, it is
unreasonable to assume this. At the same time, studies
from elsewhere provide insight into processes and trends
that may be occurring in Canada. Are, for example,
older Canadians more dependent upon the automobile
now than in the past, consistent with findings from other
countries? Is public transportation a substitute for auto-mobile use, or is public transit a less attractive alterna-
tive as it is elsewhere? Answering these, and other
questions, will allow Canada to better plan for future
transportation needs and its aging population, making
it important to understand the trip behavior of the old
and how it changes with age, including the nature of
out-of-home activities, trip modes, number of trips,
and trip duration. Using �pseudo-cohort� analysis, theprimary purpose of this paper is therefore twofold.
First, the paper documents evidence concerning the tra-
vel behavior of Canada�s older population relative toyounger ages. Second, it considers how travel behavior
changes as people grow older. In both cases, use of the
automobile is focused upon, with travel behavior traced
within population pseudo-cohorts over 1986, 1992 and
1998, utilizing data from Statistics Canada�s GeneralSocial Surveys (GSS).
2. Background
Coming of age in the automobile era, the baby boom
generation has a long and deep attachment to the pri-
vate car. Societal reliance on the automobile is perva-sive, and has both contributed to, and resulted from,
low-density suburban development. Indeed, the auto-
mobile is a symbol of personal freedom and independ-
ence, and contributes to overall quality of life (Ritter
et al., 2002). Consequently, it is unlikely that personal
preferences and reliance upon the private automobile
will be drastically altered in the foreseeable future, even
as the baby boomers age and enter into retirement.Indeed, transportation is an essential component of
day-to-day life that enables mobility and access to
goods and services, employment, and other social con-
tacts or organizations that are frequently scattered
across space (Carp, 1988; Owsley, 1997; Ritter et al.,
2002).
Given the relative lack of Canadian literature, con-
textual evidence drawn from the United States, Europe,and Australia, which are also experiencing population
aging, would tend to suggest that older Canadians are
likely more dependent upon automobiles now than in
earlier generations. Evidence drawn from the 2001 Na-
tional Household Travel survey in the United States
(Collia et al., 2003), for example, reinforces the image
of an older population that is just as dependent upon
the automobile as younger age groups. While the oldstill take fewer trips and travel shorter distances than
the young (Collia et al., 2003), they are also generally
making more trips, spend more time driving, and travel
farther than just a decade ago, with car travel account-
ing for the majority of trips (Noble, 2000; Rosenbloom,
2001; Tacken, 1998). In another recent US study, driv-
ing was the usual mode of transport for 80% of Amer-
icans aged 50 and over (Ritter et al., 2002). Ridesharing was the second most important mode of trans-
portation within this age group, with approximately 1
in 10 older Americans relying upon it. Walking, public
transportation, and other forms of transport were a dis-
tant third, with less than 5% citing these modes as a
source of transportation (Ritter et al., 2002). Increased
access to the private automobile, and the low-density
structure of North American cities that is associatedwith car dependency, are likely accountable for these
trends.
Just as the timing, duration, and number of trips
change with increasing age, so does the nature of trips.
Studies in the United States and Europe have shown
that older people replace work trips with shorter non-
work trips (OECD, 2001). Generally, fewer work-related
trips are noted amongst older Americans (Rosenbloom,2001). Similarly, Noble (2000) reported that the number
of shopping and personal trips made by men older than
55 was much higher than for younger men, peaking in
the mid-70s and reflecting discretionary time and trips.
In Canberra, Australia, shopping and visits to family
or friends were the major reasons for travel (Fildes
et al., 1994). Older residents were also observed to have
fewer trips associated with work, visiting, or sports andentertainment, but more journeys for health-related rea-
sons and to attend meetings. Undoubtedly, the changing
342 K.B. Newbold et al. / Journal of Transport Geography 13 (2005) 340–351
characteristics of older adult transportation behavior re-
flect increased incomes, better health, and more active
lifestyles relative to earlier generations (Marrattoli
et al., 2000). At the same time, their reliance upon public
transportation has decreased (Alsnih and Hensher,
2003; Rosenbloom, 2001). In other words, the popula-tion has become increasingly dependent upon the pri-
vate automobile. Moreover, older drivers tend to have
much higher accident rates, particularly when the rate
is adjusted for mileage, making them relatively more
hazardous despite experiencing fewer accidents per dri-
ver (Burkhardt, 1999; Burkhardt and McGavock,
1999; Chu, 1994; Hildebrand, 2003; Stamatiadis and
Deacon, 1998).While declining health contributes to the loss of
mobility, the percentage of drivers tends to decline
rather slowly with age up to 85 years, with a substantial
drop afterward (Marrattoli et al., 2000). Because of de-
clines in health, finances, or physical abilities, older driv-
ers must decide to continue, limit, or stop driving.
Cessation of driving has significant personal effects, with
an observed decline in the number of trips, social con-tacts and quality of life (Marrattoli et al., 2000). Other
transportation implications include the potential in-
creased demand for public transit services for older indi-
viduals who are no longer able to drive.
While it is reasonable to assume that Canada is expe-
riencing trends similar to those observed elsewhere in
the developed world, drawing inferences from the expe-
riences of other nations is problematic. Consequently, itrequires the separate analysis and documentation of the
travel behavior of the older Canadian population, as
well as how it has changed from a cohort perspective.
Consequently, the travel behavior of Canada�s agingpopulation can be traced over time, enabling some com-
parisons with trends observed elsewhere in the devel-
oped world.
1 RES Research (Ottawa) conducted a time-use pilot study in 1981,
in conjunction with Canada Employment and Immigration, the
Federal Department of Communications, and Statistics Canada.
While meant to be representative of the Canadian population, it
sampled from 11 urban and 3 urban areas, only.2 The full description of the standardization process, including the
original classes, is available from the authors upon request.
3. Data and methods
The following analysis utilizes the General Social
Survey (GSS), a weighted random sample of the Cana-
dian population administered by Statistics Canada (Sta-
tistics Canada, 1999, 2001). First implemented in 1985,
the GSS represents a cross-sectional sample of the Cana-dian population that collects data via telephone surveys
on a standard set of socio-demographic questions, along
with questions pertaining to a core topic or focus that
have included health, time use, and social support and
aging. Three cycles of the GSS, each of which collected
data on time use, are used in the current analysis (1986,
1992, and 1998). Each of these surveys collected data on
time use in diary form, with the 1986 cycle representingthe first national random sample for Canadian time-use
studies that included all 10 provinces. 1 The 1986 single-
day, 24-h diary data were collected from 9946 respond-
ents, who were aged 15 and older excluding those who
lived in institutions, Aboriginal reserves, and the Cana-
dian Territories. The data pertaining to time-use are al-
most evenly distributed over 7 days of the week andwere collected during October, November, and Decem-
ber of 1986. The 1992 and 1998 GSS Canadian Time-
Use Studies collected data from 8996 and 10,749
respondents aged 15 years and older across all 10 prov-
inces, respectively. In both cases, the data are almost
equally distributed over all 7 days and over all 12
months.
Prior to analysis, a number of steps were required toensure that the three data sets were as consistent as pos-
sible. First, the time-use surveys employed different
activity and contextual coding schemes, requiring their
standardization across the three surveys. With respect
to activity codes, for example, a set of twelve mutually
exclusive categories was defined, including employed
work, domestic work, childcare, personal care, and
shopping travel. 2
Second, since the 1986 time-use dataset was not col-
lected over the entire calendar year, it does not account
for seasonal variations in travel behavior. As a result,
and in order to compare these data with the 1992 and
1998 samples, the �same weeks� must be selected fromall three datasets to ensure their comparability. It was
therefore necessary to limit the 1992 and 1998 datasets
to the �same weeks� as found in the 1986 dataset (whichcovered the months of October, November and Decem-
ber, 1986), eliminating any biases introduced from sea-
sonal variations in behavior. The result of this filtering
process does not affect the sample size of the 1986 data-
set, but the 1992 summary file is reduced to 2006
respondents, and the 1998 summary file is reduced to
2667 respondents. Because the reduced 1992 and 1998
datasets represent sub-samples, ‘‘working weights’’ wereproduced, representing rescaled versions of the final per-
son weight, such that the average of all weights in the
sub-sample are equal to 1 (Statistics Canada, 1999).
Third, each GSS cycle represents a cross-section or
�snapshot� of the Canadian population at a particularpoint in time. Ideally, longitudinal data would track
the same group of people over time, therefore offering
insight into the evolution of their individual travelbehavior. However, few such surveys exist at either the
national or urban levels. As an alternative, the data
are defined such as to create �pseudo� or �artificial�

Table 1
Cohort definitionsa
Cohort Age in:
1986 1992 1998
1: Young labor force 15–24 20–29 30–34
2: Young family 25–34 30–39 35–44
3: Mid-labor force 35–44 40–49 45–54
4: Old labor force 45–54 50–59 55–64
5: Transitional old 55–64 60–69 65–74
6: Old 65+ 70+ 75+
a Age definitions within the GSS files prevented the precise matching of age with interval length. Age is defined in 10-year intervals only in the
1986 file, in 5- and 10-year intervals in the 1992 file, and 1-, 5-, and 10-year intervals in the 1998 file.
K.B. Newbold et al. / Journal of Transport Geography 13 (2005) 340–351 343
cohorts, with age in 1986 being the defining characteris-
tic of each cohort. For the purposes of this analysis, six
cohorts were defined based upon age in 1986, with each
cohort then �aged� over the subsequent cycles (Table1). 3 For example, the cohort aged 65 and over in
1986 was aged 70 plus in 1992 and greater than 75 years
in 1998. 4 Younger age cohorts are also included to aid
comparison of results. The advantage of this methodol-ogy lies in the ability to follow groups (as opposed to
individuals) and to track the changes to those groups
over time. In particular, the analyst can define cohorts
that may be followed through time as those cohorts
age and make adjustments in their travel behavior. In
addition to changes in their age profile, other social, eco-
nomic, and demographic characteristics of the cohort
will evolve over the interval.The selection rules allow each cohort to be followed
over the 12-year period along with their travel behavior.
While individuals cannot be followed across time,
changes in aggregate cohort behavior can be evaluated
by comparing statistics (e.g., mean number of trips, trip
duration) for each cohort over each cycle. The selected
cohorts include those who are already old at the time
of the 1986 GSS (cohort 6, aged 65 or greater in 1986and 75+ by 1998, defined as the �old� cohort), and thosewho transition into retirement over the period (cohort 5,
aged 55–64 in 1986 and 65–74 in 1998, defined as the
�transitional old� cohort). While the choice of these co-horts allows sufficiently large sample sizes, their defini-
tion is constrained by coding (namely age) within each
GSS cycle. Additionally, cohort definitions include
embedded and unavoidable differences that potentiallyimpact upon travel behavior and related issues, meaning
the cohorts cannot be perfectly matched and compared.
Cohorts potentially differ with respect to employment
propensities, retirement choices, mortality rates and
health status. However, in the absence of longitudinal
3 Small sample sizes precluded further disaggregation of the elderly
population by age.4 Age definitions within the GSS files prevented the precise
matching of age with interval length. Age is defined in 10-year
intervals only in the 1986 file, in 5- and 10-year intervals in the 1992
file, and 1-, 5-, and 10-year intervals in the 1998 file.
data, the �pseudo-cohort� method provides a superiormeans to evaluate group behavior over time (see, for
example, Borjas, 1985; Myers and Lee, 1996; Newbold,
2001).
The following analysis is descriptive in nature, and
considers measures such as trip duration, mean number
of trips per day, trip mode, and type of out-of-home
activities with respect to cohort. Trip duration is meas-ured in minutes, including average trip duration (average
of all trips per day) and total trip duration (total dura-
tion of all trips per day). Trip mode refers to the
mode of transportation, including car as driver, car-as-
passenger, bus and subway, walking, and bicycle trips,
reported only for the travelers/doers on the day of the
interview. Out-of-home activities are restricted to the
top 20 activities defined as of 1986, focusing only uponthe two oldest cohorts. Our focus is that of time use, and
all activities are considered episodes, meaning that travel
can be broken into specific purposes.
4. Results
The availability of data from the three cycles of theGSS allows the description of the travel behavior of
older Canadians, and changes that occur as they age
into retirement. In particular, comparison of the travel
habits of older cohorts with those transitioning into
retirement, as well as with younger cohorts, is interest-
ing, as most are still active and working.
4.1. Number of trips and trip duration
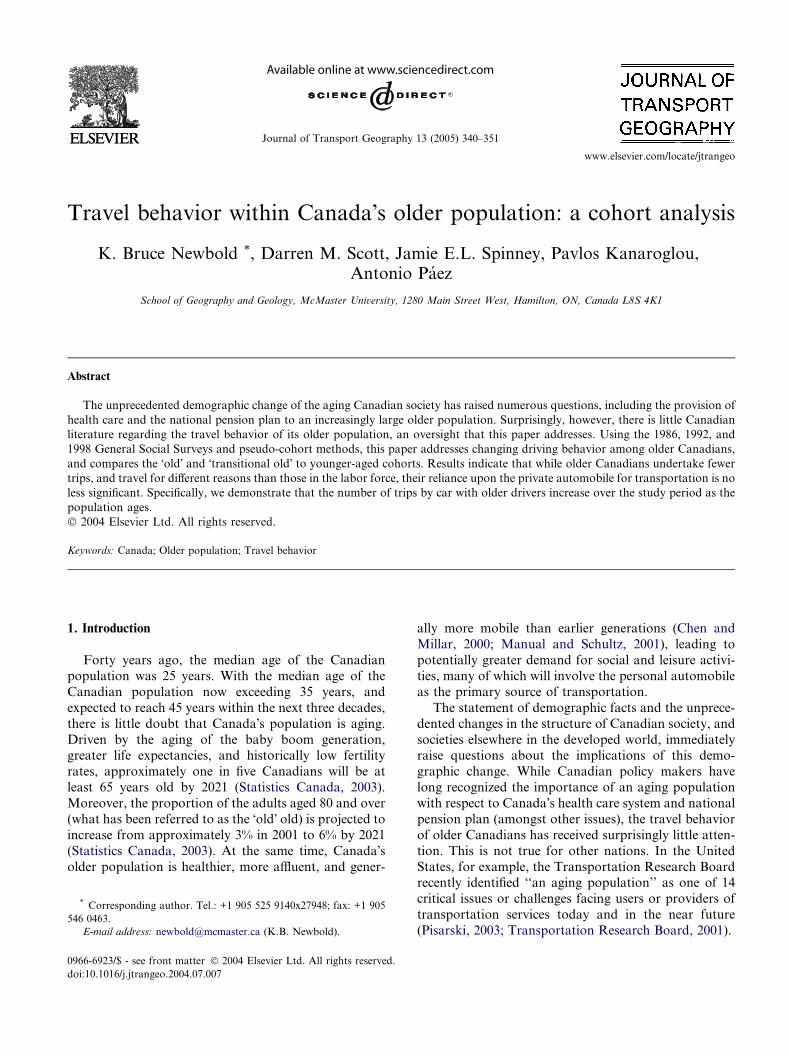
Fig. 1 displays the mean number of trips disaggre-
gated by cohort and gender. In most age cohorts and
periods, men and women made approximately equal
number of trips. While the mean number of trips re-
mained relatively constant over the 12-year interval
(3.8 trips per day in 1986 and 1998 and 3.4 trips in
1992), there was much larger diversity across the indi-vidual cohorts. Relative to the national average, for
example, younger working-age cohorts (cohorts 1, 2,
and 3) tended to make a larger number of trips, typically
Fig. 1. Mean number of trips by cohort, 1986–1998: (a) total population; (b) males; (c) females.
344 K.B. Newbold et al. / Journal of Transport Geography 13 (2005) 340–351
exceeding the national average. Conversely, the old (co-
hort 6) and transitional old (cohort 5) made signifi-
cantly 5 fewer trips over the period, with the oldest
cohort averaging slightly less than 3 trips per day in1986, and just 2.2 by 1998. Similarly, the mean number
of trips among the transitional old declined significantly
over the period, and dipped below 3 by 1992.
Fig. 2 presents the average duration of trips measured
in minutes and disaggregated by cohort and gender.
Overall, while the average duration of trips fell slightly
from 24.4 to 22.6 min between 1985 and 1998, males
tended to undertake trips with slightly longer durationsthan females, although this gender difference was only
significant in 1986 and 1998. With respect to individual
cohorts, the distribution of trip duration was almost
bell-shaped, with trip duration amongst the two mid-
dle-aged cohorts (3 and 4) generally longer than the na-
tional average. Conversely, trip durations amongst the
two youngest and two oldest cohorts was generally less
than the national average. In fact, the average duration
5 Statistical significance is assessed at p < 0.05 throughout this
paper.
of trips for those transitioning into retirement (cohort 5)
declined from 25.8 min in 1986 to 21.5 min in 1998. In
other words, trip duration within this transitional co-
hort initially exceeded the national average while mem-bers were still labor force aged, but was less than the
national average in both 1992 and 1998 as the cohort
transitioned into retirement. However, trip duration
was not statistically different from the national average,
nor was the decline in trip duration for the transitional
old. Trip duration amongst the oldest cohort was con-
sistently less than the national average, and declined
the most abruptly since 1986, with trip duration 5.6min shorter by 1998. This compares with a decline of
less than 2 min overall.
While the average duration of trips decreased over
the period, total daily trip duration for both males and
females (all ages) increased from 82.6 min in 1986 to
84.2 min in 1998 (Fig. 3). Although not a statistically
significant increase, the results provide a somewhat dif-
ferent picture from that of average trip duration. In-deed, for all but the two oldest cohorts, total trip
duration tended to be longer than the national average,
and also tended to increase over the period. Within the
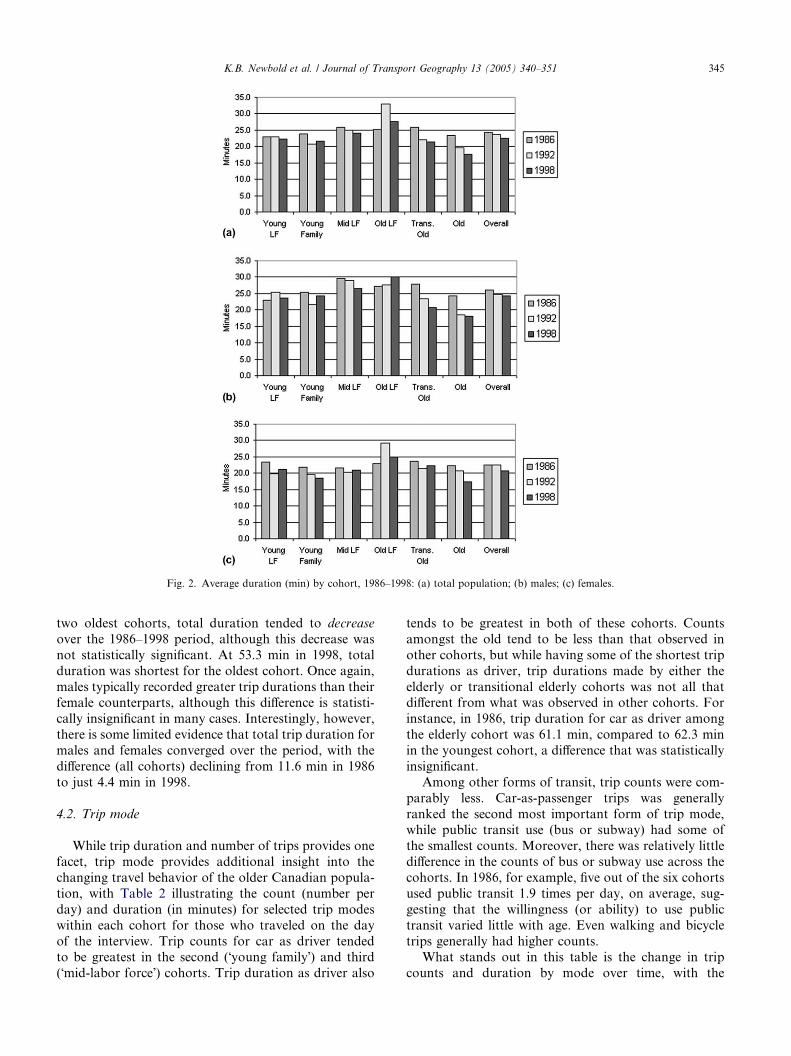
Fig. 2. Average duration (min) by cohort, 1986–1998: (a) total population; (b) males; (c) females.
K.B. Newbold et al. / Journal of Transport Geography 13 (2005) 340–351 345
two oldest cohorts, total duration tended to decrease
over the 1986–1998 period, although this decrease was
not statistically significant. At 53.3 min in 1998, total
duration was shortest for the oldest cohort. Once again,
males typically recorded greater trip durations than theirfemale counterparts, although this difference is statisti-
cally insignificant in many cases. Interestingly, however,
there is some limited evidence that total trip duration for
males and females converged over the period, with the
difference (all cohorts) declining from 11.6 min in 1986
to just 4.4 min in 1998.
4.2. Trip mode
While trip duration and number of trips provides one
facet, trip mode provides additional insight into the
changing travel behavior of the older Canadian popula-
tion, with Table 2 illustrating the count (number per
day) and duration (in minutes) for selected trip modes
within each cohort for those who traveled on the day
of the interview. Trip counts for car as driver tendedto be greatest in the second (�young family�) and third(�mid-labor force�) cohorts. Trip duration as driver also
tends to be greatest in both of these cohorts. Counts
amongst the old tend to be less than that observed in
other cohorts, but while having some of the shortest trip
durations as driver, trip durations made by either the
elderly or transitional elderly cohorts was not all thatdifferent from what was observed in other cohorts. For
instance, in 1986, trip duration for car as driver among
the elderly cohort was 61.1 min, compared to 62.3 min
in the youngest cohort, a difference that was statistically
insignificant.
Among other forms of transit, trip counts were com-
parably less. Car-as-passenger trips was generally
ranked the second most important form of trip mode,while public transit use (bus or subway) had some of
the smallest counts. Moreover, there was relatively little
difference in the counts of bus or subway use across the
cohorts. In 1986, for example, five out of the six cohorts
used public transit 1.9 times per day, on average, sug-
gesting that the willingness (or ability) to use public
transit varied little with age. Even walking and bicycle
trips generally had higher counts.What stands out in this table is the change in trip
counts and duration by mode over time, with the
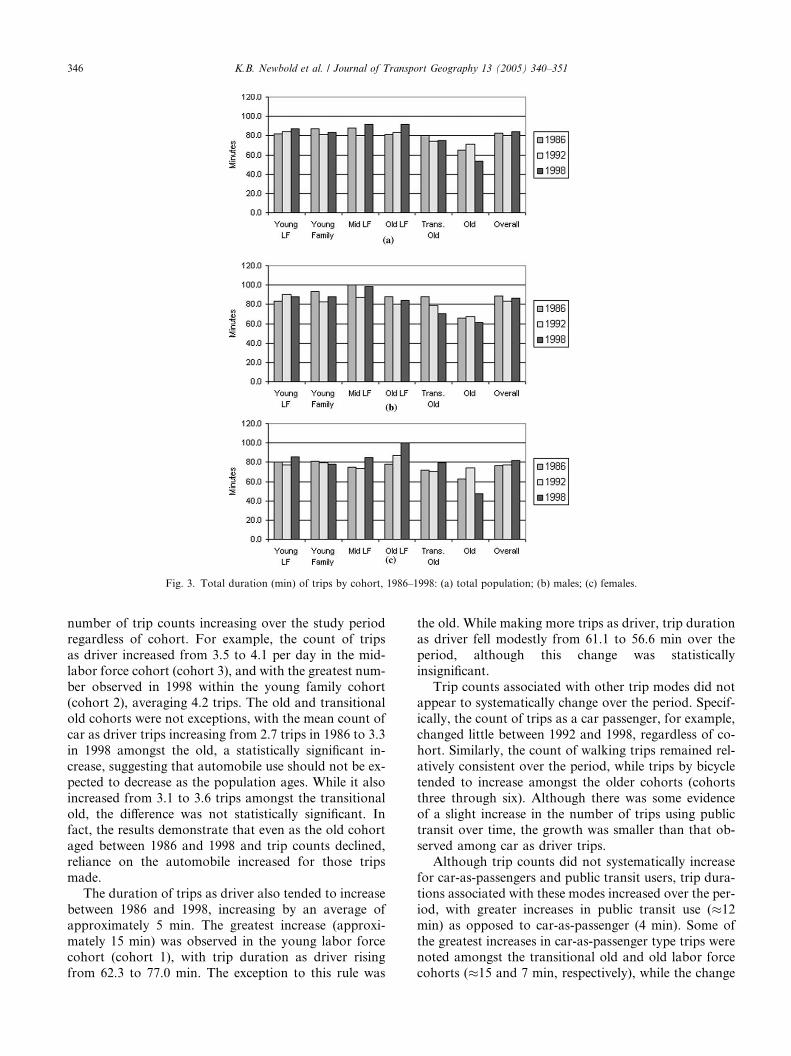
Fig. 3. Total duration (min) of trips by cohort, 1986–1998: (a) total population; (b) males; (c) females.
346 K.B. Newbold et al. / Journal of Transport Geography 13 (2005) 340–351
number of trip counts increasing over the study period
regardless of cohort. For example, the count of trips
as driver increased from 3.5 to 4.1 per day in the mid-
labor force cohort (cohort 3), and with the greatest num-
ber observed in 1998 within the young family cohort(cohort 2), averaging 4.2 trips. The old and transitional
old cohorts were not exceptions, with the mean count of
car as driver trips increasing from 2.7 trips in 1986 to 3.3
in 1998 amongst the old, a statistically significant in-
crease, suggesting that automobile use should not be ex-
pected to decrease as the population ages. While it also
increased from 3.1 to 3.6 trips amongst the transitional
old, the difference was not statistically significant. Infact, the results demonstrate that even as the old cohort
aged between 1986 and 1998 and trip counts declined,
reliance on the automobile increased for those trips
made.
The duration of trips as driver also tended to increase
between 1986 and 1998, increasing by an average of
approximately 5 min. The greatest increase (approxi-
mately 15 min) was observed in the young labor forcecohort (cohort 1), with trip duration as driver rising
from 62.3 to 77.0 min. The exception to this rule was
the old. While making more trips as driver, trip duration
as driver fell modestly from 61.1 to 56.6 min over the
period, although this change was statistically
insignificant.
Trip counts associated with other trip modes did notappear to systematically change over the period. Specif-
ically, the count of trips as a car passenger, for example,
changed little between 1992 and 1998, regardless of co-
hort. Similarly, the count of walking trips remained rel-
atively consistent over the period, while trips by bicycle
tended to increase amongst the older cohorts (cohorts
three through six). Although there was some evidence
of a slight increase in the number of trips using publictransit over time, the growth was smaller than that ob-
served among car as driver trips.
Although trip counts did not systematically increase
for car-as-passengers and public transit users, trip dura-
tions associated with these modes increased over the per-
iod, with greater increases in public transit use (�12min) as opposed to car-as-passenger (4 min). Some of
the greatest increases in car-as-passenger type trips werenoted amongst the transitional old and old labor force
cohorts (�15 and 7 min, respectively), while the change
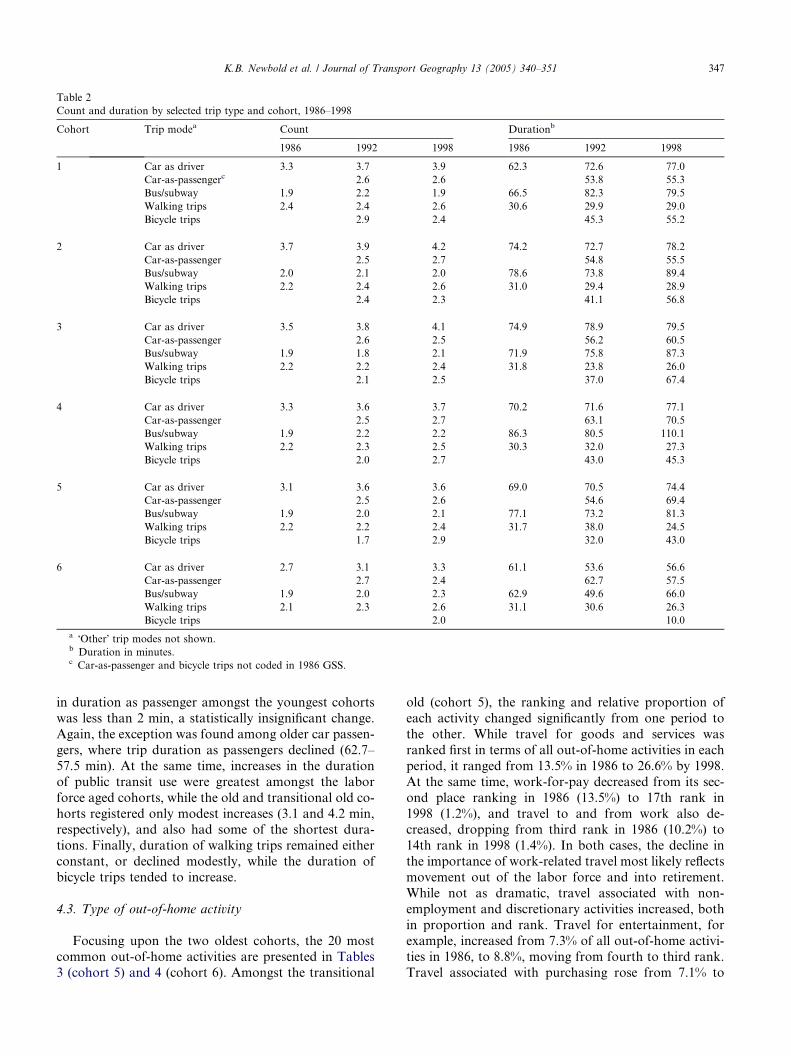
Table 2
Count and duration by selected trip type and cohort, 1986–1998
Cohort Trip modea Count Durationb
1986 1992 1998 1986 1992 1998
1 Car as driver 3.3 3.7 3.9 62.3 72.6 77.0
Car-as-passengerc 2.6 2.6 53.8 55.3
Bus/subway 1.9 2.2 1.9 66.5 82.3 79.5
Walking trips 2.4 2.4 2.6 30.6 29.9 29.0
Bicycle trips 2.9 2.4 45.3 55.2
2 Car as driver 3.7 3.9 4.2 74.2 72.7 78.2
Car-as-passenger 2.5 2.7 54.8 55.5
Bus/subway 2.0 2.1 2.0 78.6 73.8 89.4
Walking trips 2.2 2.4 2.6 31.0 29.4 28.9
Bicycle trips 2.4 2.3 41.1 56.8
3 Car as driver 3.5 3.8 4.1 74.9 78.9 79.5
Car-as-passenger 2.6 2.5 56.2 60.5
Bus/subway 1.9 1.8 2.1 71.9 75.8 87.3
Walking trips 2.2 2.2 2.4 31.8 23.8 26.0
Bicycle trips 2.1 2.5 37.0 67.4
4 Car as driver 3.3 3.6 3.7 70.2 71.6 77.1
Car-as-passenger 2.5 2.7 63.1 70.5
Bus/subway 1.9 2.2 2.2 86.3 80.5 110.1
Walking trips 2.2 2.3 2.5 30.3 32.0 27.3
Bicycle trips 2.0 2.7 43.0 45.3
5 Car as driver 3.1 3.6 3.6 69.0 70.5 74.4
Car-as-passenger 2.5 2.6 54.6 69.4
Bus/subway 1.9 2.0 2.1 77.1 73.2 81.3
Walking trips 2.2 2.2 2.4 31.7 38.0 24.5
Bicycle trips 1.7 2.9 32.0 43.0
6 Car as driver 2.7 3.1 3.3 61.1 53.6 56.6
Car-as-passenger 2.7 2.4 62.7 57.5
Bus/subway 1.9 2.0 2.3 62.9 49.6 66.0
Walking trips 2.1 2.3 2.6 31.1 30.6 26.3
Bicycle trips 2.0 10.0
a �Other� trip modes not shown.b Duration in minutes.c Car-as-passenger and bicycle trips not coded in 1986 GSS.
K.B. Newbold et al. / Journal of Transport Geography 13 (2005) 340–351 347
in duration as passenger amongst the youngest cohorts
was less than 2 min, a statistically insignificant change.
Again, the exception was found among older car passen-
gers, where trip duration as passengers declined (62.7–
57.5 min). At the same time, increases in the duration
of public transit use were greatest amongst the labor
force aged cohorts, while the old and transitional old co-
horts registered only modest increases (3.1 and 4.2 min,respectively), and also had some of the shortest dura-
tions. Finally, duration of walking trips remained either
constant, or declined modestly, while the duration of
bicycle trips tended to increase.
4.3. Type of out-of-home activity
Focusing upon the two oldest cohorts, the 20 mostcommon out-of-home activities are presented in Tables
3 (cohort 5) and 4 (cohort 6). Amongst the transitional
old (cohort 5), the ranking and relative proportion of
each activity changed significantly from one period to
the other. While travel for goods and services was
ranked first in terms of all out-of-home activities in each
period, it ranged from 13.5% in 1986 to 26.6% by 1998.
At the same time, work-for-pay decreased from its sec-
ond place ranking in 1986 (13.5%) to 17th rank in
1998 (1.2%), and travel to and from work also de-creased, dropping from third rank in 1986 (10.2%) to
14th rank in 1998 (1.4%). In both cases, the decline in
the importance of work-related travel most likely reflects
movement out of the labor force and into retirement.
While not as dramatic, travel associated with non-
employment and discretionary activities increased, both
in proportion and rank. Travel for entertainment, for
example, increased from 7.3% of all out-of-home activi-ties in 1986, to 8.8%, moving from fourth to third rank.
Travel associated with purchasing rose from 7.1% to
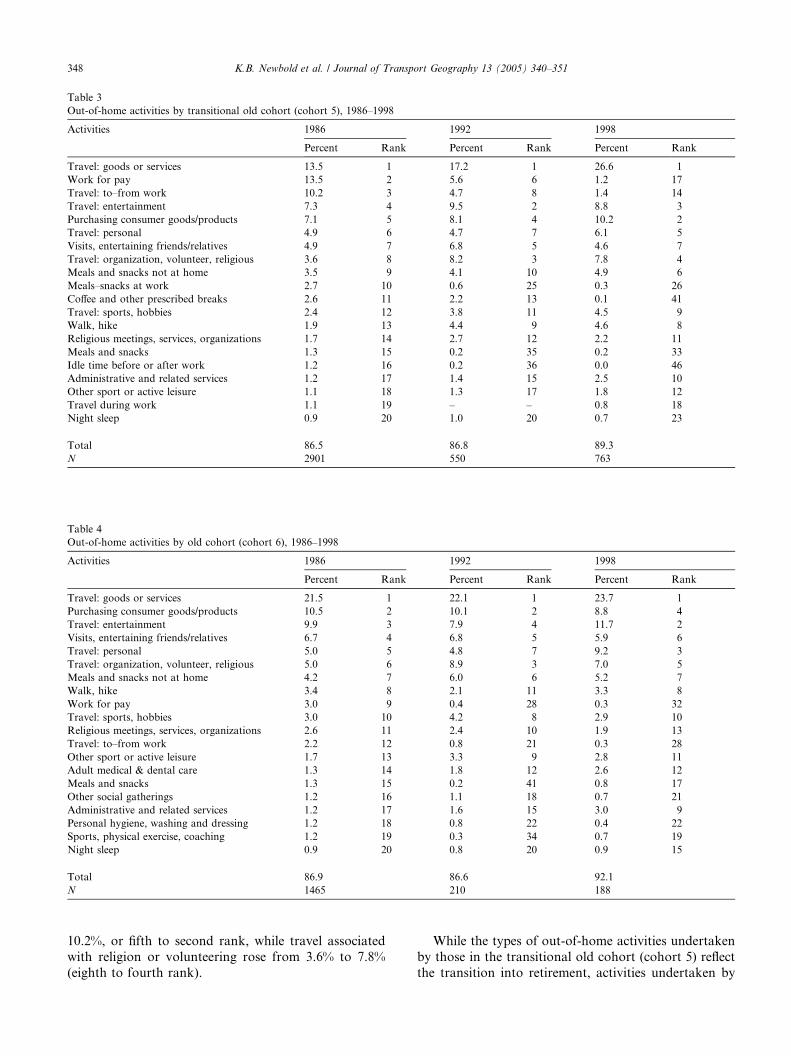
Table 3
Out-of-home activities by transitional old cohort (cohort 5), 1986–1998
Activities 1986 1992 1998
Percent Rank Percent Rank Percent Rank
Travel: goods or services 13.5 1 17.2 1 26.6 1
Work for pay 13.5 2 5.6 6 1.2 17
Travel: to–from work 10.2 3 4.7 8 1.4 14
Travel: entertainment 7.3 4 9.5 2 8.8 3
Purchasing consumer goods/products 7.1 5 8.1 4 10.2 2
Travel: personal 4.9 6 4.7 7 6.1 5
Visits, entertaining friends/relatives 4.9 7 6.8 5 4.6 7
Travel: organization, volunteer, religious 3.6 8 8.2 3 7.8 4
Meals and snacks not at home 3.5 9 4.1 10 4.9 6
Meals–snacks at work 2.7 10 0.6 25 0.3 26
Coffee and other prescribed breaks 2.6 11 2.2 13 0.1 41
Travel: sports, hobbies 2.4 12 3.8 11 4.5 9
Walk, hike 1.9 13 4.4 9 4.6 8
Religious meetings, services, organizations 1.7 14 2.7 12 2.2 11
Meals and snacks 1.3 15 0.2 35 0.2 33
Idle time before or after work 1.2 16 0.2 36 0.0 46
Administrative and related services 1.2 17 1.4 15 2.5 10
Other sport or active leisure 1.1 18 1.3 17 1.8 12
Travel during work 1.1 19 – – 0.8 18
Night sleep 0.9 20 1.0 20 0.7 23
Total 86.5 86.8 89.3
N 2901 550 763
Table 4
Out-of-home activities by old cohort (cohort 6), 1986–1998
Activities 1986 1992 1998
Percent Rank Percent Rank Percent Rank
Travel: goods or services 21.5 1 22.1 1 23.7 1
Purchasing consumer goods/products 10.5 2 10.1 2 8.8 4
Travel: entertainment 9.9 3 7.9 4 11.7 2
Visits, entertaining friends/relatives 6.7 4 6.8 5 5.9 6
Travel: personal 5.0 5 4.8 7 9.2 3
Travel: organization, volunteer, religious 5.0 6 8.9 3 7.0 5
Meals and snacks not at home 4.2 7 6.0 6 5.2 7
Walk, hike 3.4 8 2.1 11 3.3 8
Work for pay 3.0 9 0.4 28 0.3 32
Travel: sports, hobbies 3.0 10 4.2 8 2.9 10
Religious meetings, services, organizations 2.6 11 2.4 10 1.9 13
Travel: to–from work 2.2 12 0.8 21 0.3 28
Other sport or active leisure 1.7 13 3.3 9 2.8 11
Adult medical & dental care 1.3 14 1.8 12 2.6 12
Meals and snacks 1.3 15 0.2 41 0.8 17
Other social gatherings 1.2 16 1.1 18 0.7 21
Administrative and related services 1.2 17 1.6 15 3.0 9
Personal hygiene, washing and dressing 1.2 18 0.8 22 0.4 22
Sports, physical exercise, coaching 1.2 19 0.3 34 0.7 19
Night sleep 0.9 20 0.8 20 0.9 15
Total 86.9 86.6 92.1
N 1465 210 188
348 K.B. Newbold et al. / Journal of Transport Geography 13 (2005) 340–351
10.2%, or fifth to second rank, while travel associated
with religion or volunteering rose from 3.6% to 7.8%
(eighth to fourth rank).
While the types of out-of-home activities undertaken
by those in the transitional old cohort (cohort 5) reflect
the transition into retirement, activities undertaken by
K.B. Newbold et al. / Journal of Transport Geography 13 (2005) 340–351 349
the oldest cohort (cohort 6) are perhaps best described
as discretionary travel behavior. Moreover, the ranking
of activities tended to remain relatively consistent over
the 1986–1998 interval. Travel for goods or services
ranked number one over all three periods, and repre-
sented 21.5%, 22.1% and 23.7% of all out-of-home activ-ities, respectively. Travel to purchase consumer goods or
products ranked second in 1986 (10.5%) and 1992
(10.1%), and fourth in 1998 (8.8%), while travel for
entertainment increased somewhat from 9.9% in 1986
(third rank) to 11.7% (second rank) by 1998. Personal
travel, travel associated with visiting friends and rela-
tives, and travel for religious and volunteer organiza-
tions all ranked highly in each period as well, whiletravel to- and from work or work for pay ranked low,
and decreased over the period. Work for pay travel,
for instance, represented 3.0% (ninth ranked) of
out-of-home activities for the old cohort in 1986, but
decreased to 0.3% by 1998 (ranked 32).
5. Conclusions
While the automobile is linked with independence
and increases the quality of life amongst the old via per-
sonal freedom and increased accessibility, the travel
behavior of Canada�s older population has not been welldocumented. At the same time, Canada�s demographicoutlook over the next three to four decades is one of
continued growth of the older population, with a con-comitant increase in both the number and proportion
of older drivers, necessitating the need to consider this
aspect of the aging population and their use of the auto-
mobile. For policy makers and planners to respond
effectively to transportation-related impacts of an aging
population, they must first understand how the travel
behavior of Canada�s older population differs from thatof other age cohorts and has changed over time.Using cohort analysis techniques, this paper has doc-
umented evidence concerning the travel behavior of
Canada�s older population relative to younger cohorts,along with how travel behavior changes as people grow
older. Overall, the results are suggestive of relative com-
parability between the travel behaviors of older Canadi-
ans with that observed in other countries, as evidenced
by recent literature (Collia et al., 2003; Rosenbloom,2001). More specifically, it would appear that as the
Canadian population ages, it will continue to depend
upon the private automobile as the primary mode for
personal transportation, a phenomenon observed in
nearly every cohort where the number of trips as car dri-
ver increased over the 12 years of data used for this
study. Results indicate that other forms of transporta-
tion, including public transit, will become relatively lessimportant if this trend continues. In other words, the old
will be increasingly less reliant upon public transporta-
tion, and more reliant upon the personal automobile
and the mobility it provides.
Of particular interest are the two oldest cohorts con-
sidered in this analysis. What stands out in both of the
oldest cohorts, however, is changes in trip type. The
count of trips by car by old drivers increased from 2.7in 1986 to 3.3 trips per day in 1998, even as the cohort
ages and both trip count and trip duration decreases,
suggesting increasing reliance upon the car for those
trips. At the same time, both groups generally made few-
er trips per day that are shorter in duration than trips
made by their younger counterparts. Amongst the tran-
sitional old, or those who aged into retirement years
over the course of the study, changing travel behavioras they age is observed. In particular, the proportion
of trips for work-related reasons declined significantly,
while trips associated with goods and services, amongst
other tasks, increased in importance. Still, their mean
number of trips declined, as did the average and total
duration of trips. Already 65 or older in 1986, the old
cohort makes fewer trips of shorter duration, with fewer
trips as car driver, and travel for different reasons thanyounger cohorts. Rather than employment related travel
behavior, for example, most out-of-the home activities
engaged in by the old revolve around travel for enter-
tainment, purchasing goods and services, or religious
and volunteer organizations.
The change in the travel behavior amongst the two
oldest cohorts is most likely work and health related
(Marrattoli et al., 2000), as individuals move out ofthe labor force, limit their trips and distances, or relin-
quish their licenses with declining health. While the old-
est old (i.e., 85 years plus) could not be separately
identified within this analysis and who may be more
likely to use public transit (Alsnih and Hensher, 2003),
there does not seem to be a corresponding increase
in the use of alternative forms of transportation.
Amongst the oldest cohort considered in this paper,for example, the count of car as driver trip types was less
than observed in other cohorts, but count of car-as-pas-
senger or public transit use was similar, and relatively
unchanged over the period. Trip durations for both of
these forms of transit were also less.
If, as expected, the number and rate of older drivers
will increase in coming years, and that older Canadians
will make more auto-based trips in the future, multiplequestions remain to be answered. For example, what
can the experiences of other countries, particularly west-
ern European countries with aging societies, teach Can-
ada? How closely do the Canadian experiences fit what
have been observed elsewhere? While the direct compar-
ison of Canada vis-a-vis other countries was not an
objective of this paper, an overview of the existing liter-
ature, along with the results of this analysis, suggeststhat the patterns and trends of older Canadians are sim-
ilar to those observed elsewhere. Still, this comparability
350 K.B. Newbold et al. / Journal of Transport Geography 13 (2005) 340–351
remains to be firmly established through appropriate
empirical analysis, a task that requires similarly defined
and measured data and that we reserve for future work.
From a policy perspective, there are twin (and re-
lated) needs to better understand trip behavior and
how these trips will impact traffic congestion and pollu-tion levels. Again, studies of the United States and
European countries have shown that older people rely
heavily upon the personal automobile, and replace work
trips with shorter non-work trips (OECD, 2001), find-
ings that are replicated here. Knowledge of trip behavior
amongst the old allows governments to better direct and
support programs and resources aiding mobility of the
older segments of the Canadian population. If, forexample, public transportation is not used as a replace-
ment for the personal automobile as suggested here and
elsewhere in the literature, then what other options are
available that continue to ensure older Canadians the
independence, flexibility, and service that they demand
and have grown to expect, while also ensuring general
public safety? Does the provision of public transit, for
example, need to be re-thought? The 2002 EuropeanConference of Ministers of Transport (ECMT) sug-
gested that public transport would be an option only if
it is accessible, reliable, and safe, while other authors
have suggested that public transport needs to have
greater flexibility in routing and timing (Alsnih and
Hensher, 2003). In addition, what programs can be
implemented to ease the transition of older Canadians
from a lifestyle that is reliant upon the personal automo-bile? How can the safety of the general driving public be
ensured and maintained, given safety concerns sur-
rounding older drivers? (See, for example, Alsnih and
Hensher, 2003; Kostyniuk and Shope, 2003.)
Finally, with respect to the impact of trip behavior,
the replacement of work trips with shorter, non-work
trips has environmental implications that lead to discus-
sions of appropriate urban form (ECMT, 2002; Rosen-bloom, 2001). Given the Canadian environment, short
trips may mean that car engines may never warm up en-
ough for pollution control devices to be effective. To
exacerbate the situation, the Urban Transportation
Modeling System (UTMS), which is the most commonly
employed approach to urban travel demand modeling
within the planning profession (Meyer and Miller,
2001), ignores the impact of older retired drivers on traf-fic congestion and pollution levels and the potential
implications associated with the greater number of dis-
cretionary trips within this age group. We leave this
too for future work.
Acknowledgement
This project is supported financially by GEOIDE
(Geomatics for Informed Decisions) under grant
DEC#SCO (Transportation Implications of Canada�sAging Population).
References
Alsnih, R., Hensher, D.A., 2003. The mobility and accessibility
expectations of seniors in an aging population. Transportation
Research Part A 37, 903–916.
Borjas, G.J., 1985. Assimilation, changes in cohort quality, and the
earnings of immigrants. Journal of Labor Economics 3, 463–489.
Burkhardt, J.E., 1999. Mobility changes: their nature, effects, and
meaning for elders who reduce or cease driving. Transportation
Research Record 1671, 11–19.
Burkhardt, J.E., McGavock, A.T., 1999. Tomorrow�s older drivers:Who? How many? What impact? Transportation Research Record
1693, 62–70.
Caird, J.K., 2000. Anticipating the effects of Canada�s aging popula-tion on older driver safety and mobility. Manuscript prepared for
the Van Horne Institute for Transportation Studies, University of
Calgary.
Carp, F.M., 1988. Significance of mobility for the well-being of the
elderly. In: Transportation in an Aging Society: Improving
Mobility and Safety for Older Persons, vol 2, edited by Transpor-
tation Research Board, Washington DC, National Research
Council, pp. 1–19.
Chen, J., Millar, W.J., 2000. Are recent cohorts healthier than their
predecessors? Statistics Canada, Health Reports 9–24.
Chu, X.H., 1994. The effects of age on the driving habits of the elderly.
Prepared for the office of University Research and Special
Programs Administration, United States Department of Transpor-
tation, Washington, DC.
Collia, D.V., Sharp, J., Giesbrecht, L., 2003. The 2001 national
household travel survey: a look into the travel patterns of older
Americans. Journal of Safety Research 34, 461–470.
European Conference of Ministers of Transport, 2002. Transport and
the Aging of the Population, Paris.
Fildes, B.N., Lee, S.J., Kenny, D., Foddy, W., 1994. Survey of older
road users: behavioral and travel issues. Monash University
Accident Research Center Report #57.
Hildebrand, E.D., 2003. Dimensions in elderly travel behaviour: a
simplified activity-based model using lifestyle clusters. Transpor-
tation 30, 285–306.
Janke, M.K., 1991. Accidents, mileage, and the exaggeration of risk.
Accident Analysis and Prevention 23, 183–188.
Kostyniuk, L.P., Shope, J.T., 2003. Driving alternatives: older drivers
in Michigan. Journal of Safety Research 34, 407–414.
Manual, D.G., Schultz, S.E., 2001. Adding years to life and life to
years: life and health expectancy in Ontario. ICES Atlas Report 1,
Institute for Clinical Evaluative Sciences.
Mercer, G.W., 1989. Traffic accidents and convictions: group totals
versus rate per kilometer driven. Risk Analysis 9, 71–77.
Marrattoli, R.A., Mendes de Leon, C.F., Glass, T.A., Williams, C.S.,
Cooney, L.M., Berkman, L.F., 2000. Consequences of driving
cessation: decreased out-of-home activity levels. Journal of Ger-
ontology, Social Sciences 55B (6), S334–S340.
Meyer, M.D., Miller, E.J., 2001. Urban Transportation Planning: A
Decision-Oriented Approach, second ed. McGraw-Hill, New York.
Myers, D., Lee, S.W., 1996. Immigration cohorts and residential
overcrowding in Southern California. Demography 33 (1), 51–65.
Newbold, K.B., 2001. Measuring migration among the foreign-born:
insights from Canadian data. Review of Regional Studies 31 (2),
177–195.
Noble, B., 2000. Travel characteristics of older people. Transport
Trends 2000 Edition. DETR.
OECD, 2001. Ageing and transport: mobility needs and safety issues.
K.B. Newbold et al. / Journal of Transport Geography 13 (2005) 340–351 351
Owsley, C., 1997. Clinical and research issues in older drivers:
future directions. Alzheimer Disease and Associated Disorders
11, 3–7.
Pisarski, A.E., 2003. Prescriptions for research: reviewing the history
of TRB�s critical issues in transportation. TR News 226, 30–35.Ritter, A.S., Straight, A., Evans, E., 2002. Understanding senior
transportation: Report and analysis of a survey of consumers age
50+. AARP Public Policy Institute, Washington, DC.
Rosenbloom, S., 2001. Sustainability and automobility among
the elderly: an international assessment. Transportation 28, 375–
408.
Stamatiadis, N., Deacon, J.A., 1998. Are older drivers safer today than
in the past? Swedish National Road and Transport Research
Institute, VTI Conference, 9A part 4, pp. 21–39.
Statistics Canada, 2003. http://www.statcan.ca/english/Pgdb/
demo23a.htm.
Statistics Canada, 2001. The General Social Survey: An Overview,
Ottawa, Canada.
Statistics Canada, 1999. General Social Survey, cycle 12: time use
(1998)––Public use microdata file documentation and user�s guide,Ottawa, Canada.
Tacken, M., 1998. Mobility of the elderly in time and space in the
Netherlands: an analysis of the Dutch national travel survey.
Transportation 25, 379–393.
Transportation Research Board, 1988. Transportation in an aging
society. Special Report 218, vol. 1, Washington, DC.
Transportation Research Board, 2001. Critical issues in transportation
2002. TR News 217, pp. 3–11.
Top Related
Copyright © 2022 FDOKUMEN

