


Bahasa
Halaman
Hukum


Transportation System Sustainability Issues in High-,Middle-, and Low-Income Economies: Case Studies
from Georgia „U.S.…, South Korea, Colombia, and GhanaChristy Mihyeon Jeon1; Adjo A. Amekudzi2; and Jorge Vanegas3
Abstract: While there is no standard definition for sustainable transportation, several adopted definitions reflect that a sustainabletransportation system should be effective and efficient in providing safe and equitable access to basic economic and social services,promote economic development and support environmental integrity. Critical priorities, standards, and constraints for attaining sustainabletransportation may be different, however, in different countries depending on prevailing socioeconomic conditions and political andadministrative institutions. This study develops four case studies to characterize some of the major transportation system sustainabilityissues in developed and developing economies. The cases demonstrate that while transportation sustainability issues revolve aroundsimilar issues, the actual process of identifying and addressing pertinent issues to promote transportation system sustainability mayinvolve widely different priorities and constraints that should influence how standards are developed to promote successful movementtoward sustainability in the international community.
DOI: 10.1061/�ASCE�0733-9488�2006�132:3�172�
CE Database subject headings: Sustainable development; Economic factors; Transportation systems; Georgia; Korea; Colombia;Africa.
Introduction
Background
The fact that sustainability is an increasingly important issue intransportation system and services provision is evident in con-gested metropolitan highway systems, declining air quality andrespiratory health, the need for improved and more equitable ac-cess to basic social and economic services in several areas aroundthe world, and a growing number of initiatives to address sustain-ability considerations in transportation planning. Sustainable de-velopment is most commonly defined as development that meetsthe needs of the present without compromising the ability of futuregenerations to meet their own needs �WCED 1987�. While thereis no standard definition for a sustainable transportation system,there is emerging consensus that such a system should be effec-tive and efficient in providing its users with equitable and safe
1Graduate Research Assistant, School of Civil and EnvironmentalEngineering, Georgia Institute of Technology, Atlanta, GA 30332-0355.E-mail: [email protected]
2Associate Professor, School of Civil and Environmental Engineering,Georgia Institute of Technology, Atlanta, GA 30332-0355. E-mail:[email protected]
3Associate Professor, School of Civil and Environmental Engineering,Georgia Institute of Technology, Atlanta, GA 30332-0355. E-mail:[email protected]
Note. Discussion open until February 1, 2007. Separate discussionsmust be submitted for individual papers. To extend the closing date byone month, a written request must be filed with the ASCE ManagingEditor. The manuscript for this paper was submitted for review and pos-sible publication on March 18, 2005; approved on November 17, 2005.This paper is part of the Journal of Urban Planning and Development,Vol. 132, No. 3, September 1, 2006. ©ASCE, ISSN 0733-9488/2006/3-
172–186/$25.00.172 / JOURNAL OF URBAN PLANNING AND DEVELOPMENT © ASCE / SE
access to basic social and economic services, should promote eco-nomic development, and not be harmful to the environment—andindicator systems being developed and used reflect this consensus�Jeon and Amekudzi 2005�. Major organizations such as theWorld Bank, the Organization for Cooperation and Economic De-velopment �OECD�, and Transport Canada have adopted defini-tions for sustainable transportation. The OECD, for example,defines sustainable transportation as transportation that does notendanger public health or ecosystems and meets the needs foraccess consistent with (a) the use of renewable resources at orbelow their rates of regeneration, and (b) the use of nonrenew-able resources below the rates of development of renewable sub-stitutes �OECD 1999�. Table 1 shows several working definitionsof sustainable transportation and sustainability. In the UnitedStates, the mission statements of over 14 state departments oftransportation �DOTs� now include sustainability either explicitlyor implicitly �Jeon and Amekudzi 2005�. In addition, a growingnumber of organizations around the world have begun to developand use indicator systems to measure their progress toward trans-portation system sustainability.
Motivation
While sustainable transportation is a policy objective or issue ofconcern in high-, middle-, and low-income countries, critical fac-tors influencing the attainment of a sustainable transportation/landuse system, the relative priorities accorded various sustainabilityobjectives, and the constraints to be encountered in moving trans-portation systems toward sustainability, may be different in thesedifferent environments. Discussions on sustainable transportationthat remain at a relatively general level may not shed adequatelight on unique issues and priorities that must be addressed rela-tive to attaining sustainable transportation in different socioeco-
nomic contexts. More-detailed assessments are necessary toPTEMBER 2006

understand the drivers of existing transportation systems better, aswell as priorities and constraints for attaining sustainable trans-portation across the range of socioeconomic conditions in theglobal community.
Objective and Outline
The objective of this study is to characterize some of the major
Table 1. Working Definitions of Sustainability �Transportation and Gene
Organization
Ontario Roundtable on Environment andEconomy 1995 �Canada�
�1� Produce outp
�2� Have a low nare used, their uswhen no longer u
�3� Minimize disas well as uses o
Transportation Association of Canada 1999�Canada�
�1� In the naturawithin the urbanrenewable or inenatural resources
�2� In society: prfuture generationwith available wbelow levels acc
�3� In the econommaximize economvibrant and diver
Victoria Transport Policy Institute 2003 �Canada� Providing for a sequitable, caring,
The Center for Sustainable Transportation 2002�Canada�
�1� Allows the bamanner consistengenerations.
�2� Is affordable,economy.
�3� Limits emissiconsumption of nthe use of land a
Organization for Economic Cooperation andDevelopment 1999
Environmentally
“Transportation taccess consistent�b� use of nonren
World Bank General operatiotransport sector�
“Their rates of urates of use of nodeveloped. Theirenvironment.”
Procedures for Recommending OptimalSustainable Planning of European City TransportSystems 2003
A sustainable urbin an efficient waheritage and ecosof future generatwelfare they deri
Department of Sustainable Development 2003�United Kingdom�
Sustainable devegenerations to coand the world aseffective protectimaintenance of h
Note: Adapted from Jeon and Amekudzi �2005�.
issues in transportation sustainability in high-, middle-, and low-
JOURNAL OF URBAN P
income economies. This is done through the development of fourcase studies for selected countries/states with a range of economicconditions: Georgia �United States, high-income status�, SouthKorea �East Asia, recently moved from middle- to high-incomestatus�, Colombia �South America, middle-income status�, andGhana �West Africa, low-income status�. The purpose is three-fold. First, it is to demonstrate that while definitions of sustain-
itions of sustainable transportation and sustainability
issions� at a level capable of being assimilated by the environment.
r inputs of non-renewable resources �where nonrenewablebe for non-consumptive investments and they will be recycledor needed�.
of ecological processes, land �and water area� use is also minimizedtive habitats.
onment: limit emissions and waste �that pollute air, soil, and water�ability to absorb/recycle/cleanse; provide power to vehicles fromble energy sources �such as solar power in the long run�; and recyclen vehicles and infrastructure �such as steel, plastic, etc.�.
quity of access for people and their goods, in this generation and in allnce human health; help support the highest quality of life compatibleacilitate urban development at the human scale; limit noise intrusiony communities; and be safe for people and their property.
financially affordable in each generation; be designed and operated tociency and minimize economic costs; and help support a strong,
nomy.
nd satisfying material future for everyone, in a society that isttentive to basic human needs.
cess needs of individuals and societies to be met safely and in ahuman and ecosystem health, and with equity within and between
es efficiently, offers choice of transport mode, and supports a vibrant
d waste within the planet ability to absorb them, minimizesewable resources, reuses and recycles its components, and minimizesproduction of noise.
able transportation is defined as:
s not endanger public health or ecosystems and that meets needs fora� use of renewable resources at below their rates of regeneration, ande resources below the rates of development of renewable substitutes.”
ciples for physically sustainable societies �not especially for theed as:
enewable resources do not exceed their rates of regeneration. Theirable resources do not exceed the rate at which substitutes are
f pollution do not exceed the assimilative capacity of the
sport and land use system: �1� provides access to goods and servicesall inhabitants of the urban area; �2� protects the environment, culturals for the present generation, and �3� does not endanger the opportunitiesreach at least the same welfare level as those living now, including the
their natural environment and cultural heritage.
t is about ensuring a better quality of life for everyone, now and foris requires meeting four key objectives at the same time in the U.K.le: �1� social progress which recognizes the needs of everyone; �2�he environment; �3� prudent use of natural resources, and �4�d stable levels of economic growth and employment.
ral�
Defin
uts �em
eed foe willseful
ruptionf sensi
l envirarea’sxhaustiused i
ovide es; enhaealth; fepted b
y: beic effi
se eco
ecure aand a
sic act with
operat
ons anon-ren
nd the
sustain
hat doewith �ewabl
nal prinis defin
se of rnrenewrates o
an trany forystem
ions tove from
lopmenme. Tha who
on of tigh an
able transportation seem to revolve around system effectiveness
LANNING AND DEVELOPMENT © ASCE / SEPTEMBER 2006 / 173

and efficiency, safe and equitable access, economic development,and environmental integrity, the actual process of addressing sus-tainability in transportation system and services provision mayinvolve widely different priorities, standards, and constraints.Second, it is to emphasize that there are no universal drivers andso indicator systems for transportation sustainability and that therelative effectiveness of any indicator system is a function of howwell it monitors progress toward the particular vision and stan-dards it was intended to support. Third, it is to show that thedevelopment of definitions, visions, and indicator systems areuseful starting points yet incomplete endeavors in any formal ap-proach to consider sustainability in transportation planning. Gud-mundsson emphasizes this need to link indicator systems withactual policies based on a study that evaluates six sustainabilityindicator systems �Gudmundsson 2003�. Given the widely differ-ent pressures, socioeconomic conditions, and institutional con-straints that exist in different contexts, adopting visions andindicators without explicitly identifying, implementing, andmonitoring realistic policies to promote movement toward thesevisions would at best have limited effectiveness.
The next section presents four case studies for countries/stateswith very different socioeconomic, political, and institutional con-texts to characterize major issues relative to achieving transporta-tion sustainability, and the local contexts in which progresstoward sustainability must occur. The discussion that followshighlights the importance of developing specific priorities, poli-cies, and standards to address transportation sustainability basedon a system-level understanding of the socioeconomic, political,and institutional contexts of the country or other jurisdictionunder consideration.
Transportation Issues in Georgia „United States…,South Korea, Colombia, and Ghana
Because the quality of transportation affects and is affected by theeconomy, priorities, standards, and constraints for sustainabletransportation may differ, sometimes significantly, depending onthe level of socioeconomic development in a country. The WorldBank classifies countries as high, middle, or low income based ontheir gross national income �GNI� per capita. GNI �formerly,gross national product or GNP� is the sum of the value added byall resident producers plus any product taxes �less subsidies� notincluded in the valuation of output plus net receipts of primaryincome �Nationmaster.com 2004�. According to the World BankClassification �The World Bank Group 2002�, low-income econo-mies are defined as those having a per capita GNI of less than$735; lower- to middle-income countries: $736–$2,935; upper-to-middle-income: $2,936–$9,075; and high-income countries: morethan $9,076 per capita. Low- and middle-income economies aresometimes referred to as developing economies, while high-income economies are referred to as developed economies. Whilethe GNI, a broad measure, is considered to be the best singleindicator of economic capacity and progress, it is recognized thatthe GNI does not by itself constitute or measure welfare or suc-cess in development �The World Bank Group 2002�.
Below, four case studies highlight the status of transportationin various economies: the state of Georgia �United States�, highincome; South Korea �East Asia�, high-income/recently middleincome; Colombia �South America�, middle income; and Ghana�West Africa�, low income. These cases were selected to cover therange of economic categories given by the World Bank Classifi-
cation. The writers’ backgrounds were also relevant in selecting174 / JOURNAL OF URBAN PLANNING AND DEVELOPMENT © ASCE / SE
the particular geographic locations as they considered it importantto have first-hand knowledge of the systems in each case. Thestate of Georgia was selected rather than the entire United Statesfor comparability with the other cases, based on population andphysical size. While the cases are by no means exhaustive, everyattempt was made to ensure that the data, obtained from second-ary sources, adequately represent the systems.
Georgia „United States…
BackgroundGeorgia is a state in the southern United States �U.S.�, the world’sfourth largest nation in land area �after Russia, Canada, andChina�, extending from the Atlantic coast to the Pacific Ocean andsharing land borders with Canada in the north and Mexico in thesouth �About 2004�. The country has 50 locally autonomousstates with a total population of 290 million �2004�, and a percapita GNI of U.S.$33,684 �2003� �Nationmaster.com 2004�. Ithas the second largest �after the European Union� and most tech-nologically advanced economy in the world. U.S. firms are at ornear the forefront in technological advances, especially in com-puter, medical, aerospace, and military equipment. Although thecountry has rich mineral resources and various agricultural prod-ucts, the biggest sector is service industries, employing about75% of U.S. residents.
With a land area of 57,906 sq mi �149,976 km2�, Georgia isthe largest state east of the Mississippi River �24th overall�. At-lanta, the state’s capital, is the largest city followed by Savannah,one of the busiest ports in the United States. Based on the 2000census, the population of Georgia was just over 8 million, makingit the 10th most populous state. Nearly half of the state’s popula-tion lives in the Atlanta metropolitan area, which has experiencedphenomenal growth in the past decade. From 1990–2000, Geor-gia’s population grew by over 20%, as shown in Table 2. Geor-gia’s 1999 total gross state product of $275 billion placed it at10th in the nation, and its per capita personal income of $28,145placed it at 23rd in the nation in 2000. Service sector employmentaccounted for about 26% of the state’s jobs, followed by retailwith about 18%, and government with about 15%. The state’sindustrial outputs are textiles and apparel, transportation equip-ment, food processing, paper products, chemical products, electricequipment, and tourism. Agriculture also plays a major role in thestate’s economy, contributing about five billion dollars annually�Wikipedia 2004�.
Transportation System
General Characteristics. As in several metropolitan areasaround the world, the automobile is the dominant mode of trans-portation in the Atlanta Metropolitan Area. In 2002, the AtlantaRegional Commission �ARC�, the region’s Metropolitan PlanningOrganization, recorded a mode share of home-based work trips at91.78%, with single occupancy vehicle share at 80.72%, carpoolshare at 11.06%, and public transit share at 8.22% �ARC 2002�.Highways are thus the predominant infrastructure for transporta-tion. In 2002, Georgia’s transportation system encompassed113,655 mi �182,910 km� of public roads, 4,853 mi �7,810 km�of railroad, 103 publicly owned airports, and four shipping ports.Georgia is also served by 12 urban transit systems including theMetropolitan Atlanta Rapid Transit Authority, which serves At-lanta, and 82 rural transit systems �GDOT 2002�.
Like several metropolitan areas around the world, Metro At-
PTEMBER 2006
lanta faces severe congestion, with the associated air quality andrespiratory health issues. Rapid population and a boomingeconomy have contributed to increasing traffic congestion andreduced air quality in the Metro Area. To control traffic conges-tion and air pollution, Georgia Department of Transportation�GDOT� has developed a high-tech intelligent transportation sys-tem �ITS�: the NAVIGATOR, which monitors more than over200 miles of highway through the use of state-of-the-art videocameras, changeable message signs, and data management tech-nologies to relay real-time traffic conditions 24 h a day to a trans-portation management center. Complementing the system isGDOT’s network of highway emergency response operators�HERO�: incident response units with specially trained personnelwho can deal quickly with accidents and disabled vehicles.HEROs are important not only for their emergency services butfor congestion management as well because in Metro Atlanta,while slightly under half �48%� of the congestion delay is normalrecurring �volume related�, slightly over half �52%� is from non-recurring �incident-related� delay. Other measures to manage con-gestion include 90 mi of high-occupancy vehicle �HOV� lanes, 88park and ride lots, and 2,943 mi of bicycle and pedestrian routes�GDOT 2004�.
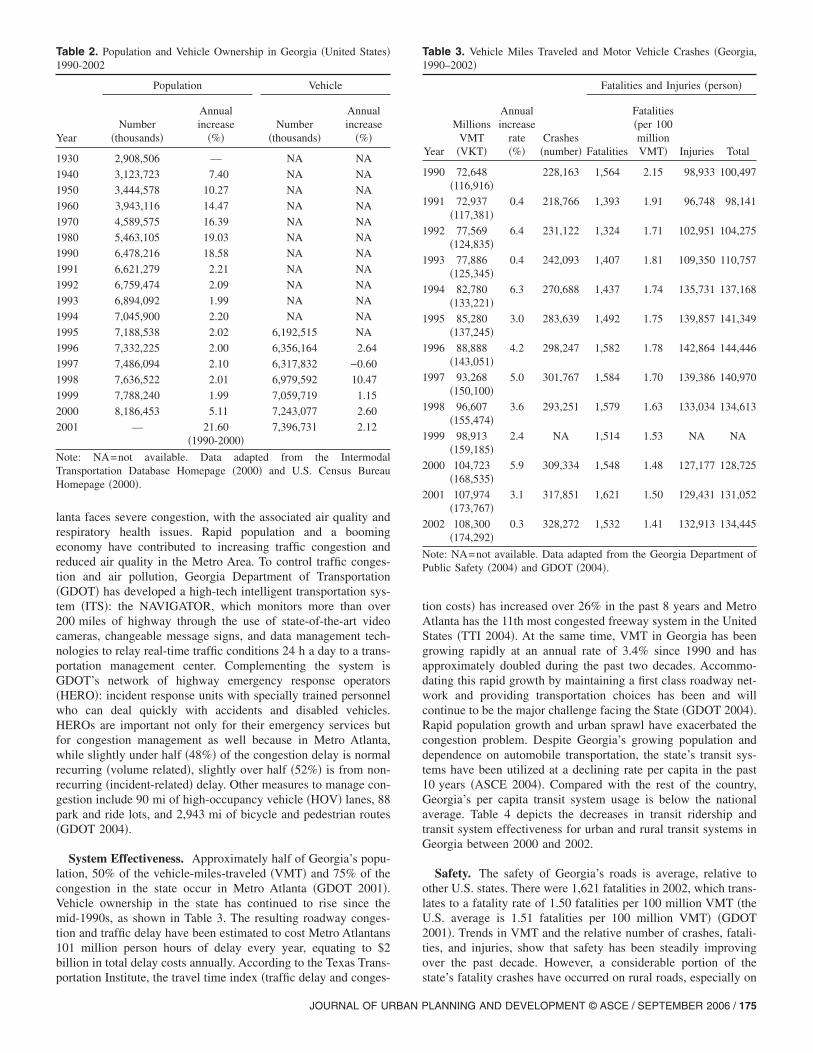
System Effectiveness. Approximately half of Georgia’s popu-lation, 50% of the vehicle-miles-traveled �VMT� and 75% of thecongestion in the state occur in Metro Atlanta �GDOT 2001�.Vehicle ownership in the state has continued to rise since themid-1990s, as shown in Table 3. The resulting roadway conges-tion and traffic delay have been estimated to cost Metro Atlantans101 million person hours of delay every year, equating to $2billion in total delay costs annually. According to the Texas Trans-
Table 2. Population and Vehicle Ownership in Georgia �United States�1990-2002
Year
Population Vehicle
Number�thousands�
Annualincrease
�%�Number
�thousands�
Annualincrease
�%�
1930 2,908,506 — NA NA
1940 3,123,723 7.40 NA NA
1950 3,444,578 10.27 NA NA
1960 3,943,116 14.47 NA NA
1970 4,589,575 16.39 NA NA
1980 5,463,105 19.03 NA NA
1990 6,478,216 18.58 NA NA
1991 6,621,279 2.21 NA NA
1992 6,759,474 2.09 NA NA
1993 6,894,092 1.99 NA NA
1994 7,045,900 2.20 NA NA
1995 7,188,538 2.02 6,192,515 NA
1996 7,332,225 2.00 6,356,164 2.64
1997 7,486,094 2.10 6,317,832 −0.60
1998 7,636,522 2.01 6,979,592 10.47
1999 7,788,240 1.99 7,059,719 1.15
2000 8,186,453 5.11 7,243,077 2.60
2001 — 21.60�1990-2000�
7,396,731 2.12
Note: NA=not available. Data adapted from the IntermodalTransportation Database Homepage �2000� and U.S. Census BureauHomepage �2000�.
portation Institute, the travel time index �traffic delay and conges-
JOURNAL OF URBAN P
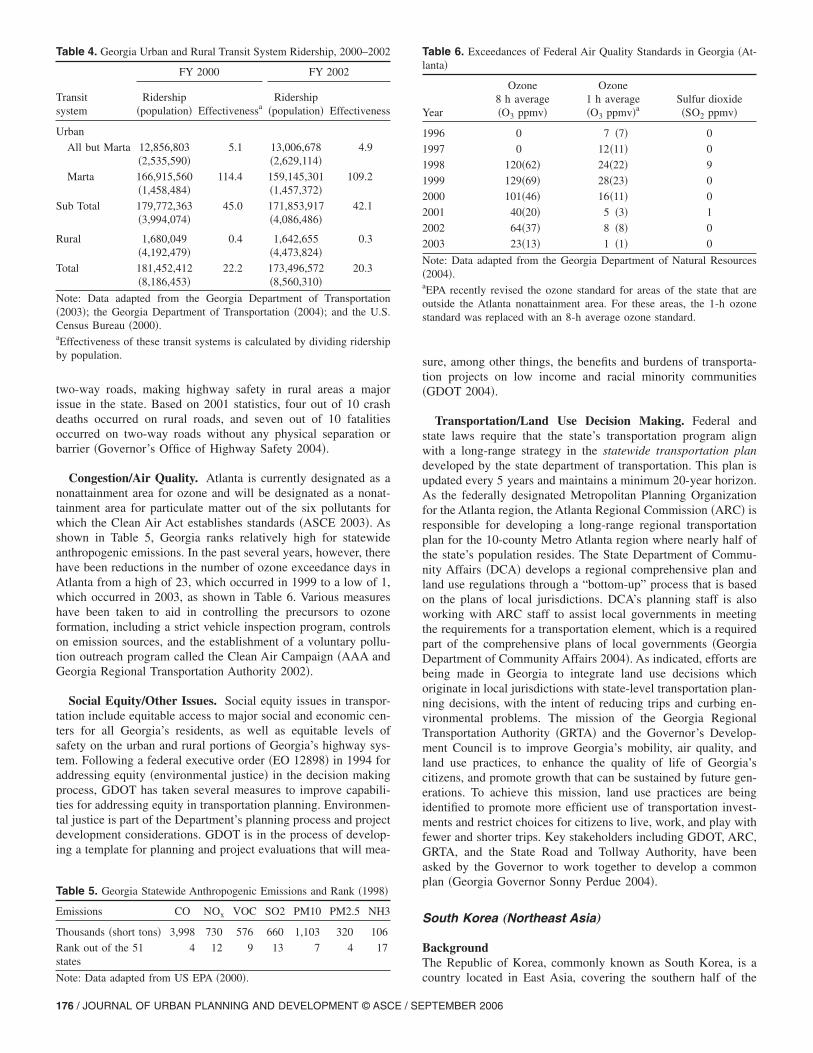
tion costs� has increased over 26% in the past 8 years and MetroAtlanta has the 11th most congested freeway system in the UnitedStates �TTI 2004�. At the same time, VMT in Georgia has beengrowing rapidly at an annual rate of 3.4% since 1990 and hasapproximately doubled during the past two decades. Accommo-dating this rapid growth by maintaining a first class roadway net-work and providing transportation choices has been and willcontinue to be the major challenge facing the State �GDOT 2004�.Rapid population growth and urban sprawl have exacerbated thecongestion problem. Despite Georgia’s growing population anddependence on automobile transportation, the state’s transit sys-tems have been utilized at a declining rate per capita in the past10 years �ASCE 2004�. Compared with the rest of the country,Georgia’s per capita transit system usage is below the nationalaverage. Table 4 depicts the decreases in transit ridership andtransit system effectiveness for urban and rural transit systems inGeorgia between 2000 and 2002.
Safety. The safety of Georgia’s roads is average, relative toother U.S. states. There were 1,621 fatalities in 2002, which trans-lates to a fatality rate of 1.50 fatalities per 100 million VMT �theU.S. average is 1.51 fatalities per 100 million VMT� �GDOT2001�. Trends in VMT and the relative number of crashes, fatali-ties, and injuries, show that safety has been steadily improvingover the past decade. However, a considerable portion of the
Table 3. Vehicle Miles Traveled and Motor Vehicle Crashes �Georgia,1990–2002�
Year
MillionsVMT�VKT�
Annualincrease
rate�%�
Crashes�number�
Fatalities and Injuries �person�
Fatalities
Fatalities�per 100millionVMT� Injuries Total
1990 72,648�116,916�
228,163 1,564 2.15 98,933 100,497
1991 72,937�117,381�
0.4 218,766 1,393 1.91 96,748 98,141
1992 77,569�124,835�
6.4 231,122 1,324 1.71 102,951 104,275
1993 77,886�125,345�
0.4 242,093 1,407 1.81 109,350 110,757
1994 82,780�133,221�
6.3 270,688 1,437 1.74 135,731 137,168
1995 85,280�137,245�
3.0 283,639 1,492 1.75 139,857 141,349
1996 88,888�143,051�
4.2 298,247 1,582 1.78 142,864 144,446
1997 93,268�150,100�
5.0 301,767 1,584 1.70 139,386 140,970
1998 96,607�155,474�
3.6 293,251 1,579 1.63 133,034 134,613
1999 98,913�159,185�
2.4 NA 1,514 1.53 NA NA
2000 104,723�168,535�
5.9 309,334 1,548 1.48 127,177 128,725
2001 107,974�173,767�
3.1 317,851 1,621 1.50 129,431 131,052
2002 108,300�174,292�
0.3 328,272 1,532 1.41 132,913 134,445
Note: NA=not available. Data adapted from the Georgia Department ofPublic Safety �2004� and GDOT �2004�.
state’s fatality crashes have occurred on rural roads, especially on
LANNING AND DEVELOPMENT © ASCE / SEPTEMBER 2006 / 175
two-way roads, making highway safety in rural areas a majorissue in the state. Based on 2001 statistics, four out of 10 crashdeaths occurred on rural roads, and seven out of 10 fatalitiesoccurred on two-way roads without any physical separation orbarrier �Governor’s Office of Highway Safety 2004�.
Congestion/Air Quality. Atlanta is currently designated as anonattainment area for ozone and will be designated as a nonat-tainment area for particulate matter out of the six pollutants forwhich the Clean Air Act establishes standards �ASCE 2003�. Asshown in Table 5, Georgia ranks relatively high for statewideanthropogenic emissions. In the past several years, however, therehave been reductions in the number of ozone exceedance days inAtlanta from a high of 23, which occurred in 1999 to a low of 1,which occurred in 2003, as shown in Table 6. Various measureshave been taken to aid in controlling the precursors to ozoneformation, including a strict vehicle inspection program, controlson emission sources, and the establishment of a voluntary pollu-tion outreach program called the Clean Air Campaign �AAA andGeorgia Regional Transportation Authority 2002�.
Social Equity/Other Issues. Social equity issues in transpor-tation include equitable access to major social and economic cen-ters for all Georgia’s residents, as well as equitable levels ofsafety on the urban and rural portions of Georgia’s highway sys-tem. Following a federal executive order �EO 12898� in 1994 foraddressing equity �environmental justice� in the decision makingprocess, GDOT has taken several measures to improve capabili-ties for addressing equity in transportation planning. Environmen-tal justice is part of the Department’s planning process and projectdevelopment considerations. GDOT is in the process of develop-ing a template for planning and project evaluations that will mea-
Table 4. Georgia Urban and Rural Transit System Ridership, 2000–2002
Transitsystem
FY 2000 FY 2002
Ridership�population� Effectivenessa
Ridership�population� Effectiveness
Urban
All but Marta 12,856,803�2,535,590�
5.1 13,006,678�2,629,114�
4.9
Marta 166,915,560�1,458,484�
114.4 159,145,301�1,457,372�
109.2
Sub Total 179,772,363�3,994,074�
45.0 171,853,917�4,086,486�
42.1
Rural 1,680,049�4,192,479�
0.4 1,642,655�4,473,824�
0.3
Total 181,452,412�8,186,453�
22.2 173,496,572�8,560,310�
20.3
Note: Data adapted from the Georgia Department of Transportation�2003�; the Georgia Department of Transportation �2004�; and the U.S.Census Bureau �2000�.aEffectiveness of these transit systems is calculated by dividing ridershipby population.
Table 5. Georgia Statewide Anthropogenic Emissions and Rank �1998�
Emissions CO NOx VOC SO2 PM10 PM2.5 NH3
Thousands �short tons� 3,998 730 576 660 1,103 320 106
Rank out of the 51states
4 12 9 13 7 4 17
Note: Data adapted from US EPA �2000�.
176 / JOURNAL OF URBAN PLANNING AND DEVELOPMENT © ASCE / SE
sure, among other things, the benefits and burdens of transporta-tion projects on low income and racial minority communities�GDOT 2004�.
Transportation/Land Use Decision Making. Federal andstate laws require that the state’s transportation program alignwith a long-range strategy in the statewide transportation plandeveloped by the state department of transportation. This plan isupdated every 5 years and maintains a minimum 20-year horizon.As the federally designated Metropolitan Planning Organizationfor the Atlanta region, the Atlanta Regional Commission �ARC� isresponsible for developing a long-range regional transportationplan for the 10-county Metro Atlanta region where nearly half ofthe state’s population resides. The State Department of Commu-nity Affairs �DCA� develops a regional comprehensive plan andland use regulations through a “bottom-up” process that is basedon the plans of local jurisdictions. DCA’s planning staff is alsoworking with ARC staff to assist local governments in meetingthe requirements for a transportation element, which is a requiredpart of the comprehensive plans of local governments �GeorgiaDepartment of Community Affairs 2004�. As indicated, efforts arebeing made in Georgia to integrate land use decisions whichoriginate in local jurisdictions with state-level transportation plan-ning decisions, with the intent of reducing trips and curbing en-vironmental problems. The mission of the Georgia RegionalTransportation Authority �GRTA� and the Governor’s Develop-ment Council is to improve Georgia’s mobility, air quality, andland use practices, to enhance the quality of life of Georgia’scitizens, and promote growth that can be sustained by future gen-erations. To achieve this mission, land use practices are beingidentified to promote more efficient use of transportation invest-ments and restrict choices for citizens to live, work, and play withfewer and shorter trips. Key stakeholders including GDOT, ARC,GRTA, and the State Road and Tollway Authority, have beenasked by the Governor to work together to develop a commonplan �Georgia Governor Sonny Perdue 2004�.
South Korea „Northeast Asia…
BackgroundThe Republic of Korea, commonly known as South Korea, is a
Table 6. Exceedances of Federal Air Quality Standards in Georgia �At-lanta�
Year
Ozone8 h average�O3 ppmv�
Ozone1 h average�O3 ppmv�a
Sulfur dioxide�SO2 ppmv�
1996 0 7 �7� 0
1997 0 12�11� 0
1998 120�62� 24�22� 9
1999 129�69� 28�23� 0
2000 101�46� 16�11� 0
2001 40�20� 5 �3� 1
2002 64�37� 8 �8� 0
2003 23�13� 1 �1� 0
Note: Data adapted from the Georgia Department of Natural Resources�2004�.aEPA recently revised the ozone standard for areas of the state that areoutside the Atlanta nonattainment area. For these areas, the 1-h ozonestandard was replaced with an 8-h average ozone standard.
country located in East Asia, covering the southern half of the
PTEMBER 2006

Korean peninsula, which spans 98,480 sq km, about two-thirdsthe size of Georgia. To the north, the peninsula borders China andRussia through the Democratic Republic of Korea �often calledNorth Korea�, while Japan lies across East Sea to the southeast.South Korea’s population, estimated at 47.6 million �2002�, is oneof the most ethnically and linguistically homogeneous in theworld. Korea has a population density of 479 people per sq km.This is more than six times the population of Georgia distributedon a land mass two-thirds the size of Georgia. Seoul, the capital,is a burgeoning megacity �i.e., a city with over 10 million people�.As one of the four East Asian Tigers, South Korea has achievedan incredible record of growth and integration into the high-techmodern world economy over the past 30 years. The per capitaGNP, only $100 in 1963, exceeded $9,800 in 2002 �i.e., per capitaGNI of U.S.$9,930 in 2002� and is equal to that of the lessereconomies of European Union, ranking South Korea as the 12thlargest economy in the world. Korea has been a major world steelproducer since 1990. Also, the nation’s shipbuilding and automo-bile manufacturing industries have reached their peak while itselectronics industry is the leading growth sector and an increas-ingly important foreign exchange generator. With a significantinvestment in information technology �IT�, Korea’s IT industryhas recorded astonishing growth since the 90s, further augment-ing the health of the Korean economy �Wikipedia 2004; Korea.net2004�.
Transportation System
General Characteristics. Roads, handling over 90% of thecountry’s traffic, are the most important type of transportationinfrastructure in Korea as well. The total length of the roads hastripled in the past 40 years and measured a total 96,928 km in2003. Twenty-four expressways measuring 2,778 km in all con-nect Seoul with provincial cities and towns, covering all parts ofthe country and placing any destination in Korea within a day’stravel. As of 2003, there were 56 routes of national highwaysmeasuring 14,234 km in total, making up Korea’s trunk road net-work, together with expressways, providing connections amongmajor cities, ports, airports, and industrial areas. As of 2002, therailway system of Korea encompassed 64 routes spanning 3,129operational kilometers. The Gyeongbu high speed rail, linkingSeoul and Busan, the second largest city on the southeast coast,began service in Korea in April 2004 with the operation of its firsthigh speed train. The subway system network, composed of 12subway lines �411.5 km�, operates in Seoul and three other majorcities, and six new lines extending 134.7 km are under construc-tion. Buses and taxis play a vital role in supplementing thesubway networks in medium and small cities and meeting trans-portation needs in the larger cities �Ministry of Construction andTransportation 2004�.
To increase the efficiency of transportation operations and im-prove safety using information technology, the Korean govern-ment initiated a high-tech Intelligent Transportation System �ITS�in 1992. Korea has implemented a Freeway Traffic ManagementSystem, covering 320 km of expressways, and launched a real-time control system in Seoul. The country is also making effortsto establish an integrated logistics information system for thecommercial vehicle operations component of the system.
System Effectiveness. As a result of rapid industrialization,urbanization, and economic growth, South Korea is facing serioustransportation problems in its cities. Table 7 shows trends of
population and vehicle ownership in Korea. Population growth isJOURNAL OF URBAN P
being smoothed while vehicle ownership has increased dramati-cally more than three times in a little over a decade from 3.4million �1990� to 14 million �2002�, owing to the steady rise inincome and living standards, expansion of suburbs, and the de-velopment of the country’s automobile manufacturing industry.Transit system improvements are being made to ameliorate exist-ing conditions.
Congestion/Air Quality. The phenomenal increases in ve-hicular ownership and transport demand create typical urbantransportation problems such as severe traffic congestion, air andnoise pollution, and serious parking difficulties. Urban transpor-tation policies in Korea are, therefore, in a transitional stage froma supply-oriented to demand-management focus. In addition tocontinued investment in urban highway networks, city govern-ments are implementing transportation demand management�TDM� plans to control automobile traffic. First, congestion pric-ing was introduced at the Namsan Tunnel leading to the centralbusiness district; second, the traffic impact tax was reduced by50% for employers who implemented TDM programs, such ascarpools; third, higher parking fees have been instituted in con-gested areas; and fourth, exclusive bus lanes and smart-card farecollection systems have been implemented �Ministry of Construc-tion and Transportation 2004�.
The problem of air pollution in Korea is still not very severerelative to the allowable limits set by the Ministry of Environ-ment, as shown in Table 8. However, the levels of particulatematter and nitrogen dioxide have gradually increased because ofthe high growth rate of automobile ownership. Table 9 depicts theundesirable trends for carbon monoxide, nitrogen oxides, non-methane volatile organic compounds �VOCs�, and sulfur dioxideemissions. All the emission levels increased from 1990 to 1995,and are assumed to still be on the rise owing to continuing growthin vehicle ownership.
Safety. The high rate of road traffic crashes, in conjunctionwith the absence of order on the road, has long been considered a
Table 7. Population and Vehicle Ownership �Korea, 1990–2002�
Year
Population Vehicle
Number�thousands�
AnnualIncrease �%�
Number�thousands�
AnnualIncrease �%�
1990 42,869 — 3,395 —
1991 43,296 1.0 4,248 25.1
1992 43,748 1.0 5,231 23.1
1993 44,195 1.0 6,273 19.9
1994 44,642 1.0 7,404 18.0
1995 45,093 1.0 8,469 14.4
1996 45,525 1.0 9,553 12.8
1997 45,954 0.9 10,413 9.0
1998 46,287 0.7 10,470 0.5
1999 46,617 0.7 11,164 6.6
2000 47,008 0.8 12,059 8.0
2001 47,343 0.7 12,914 7.1
2002 47,640 0.6 13,949 8.0
Average annualincrease rate
0.9 12.7
Note: Data adapted from the Ministry of Construction and Transportation�2004�.
critical social problem in Korea. Road traffic fatalities were the
LANNING AND DEVELOPMENT © ASCE / SEPTEMBER 2006 / 177
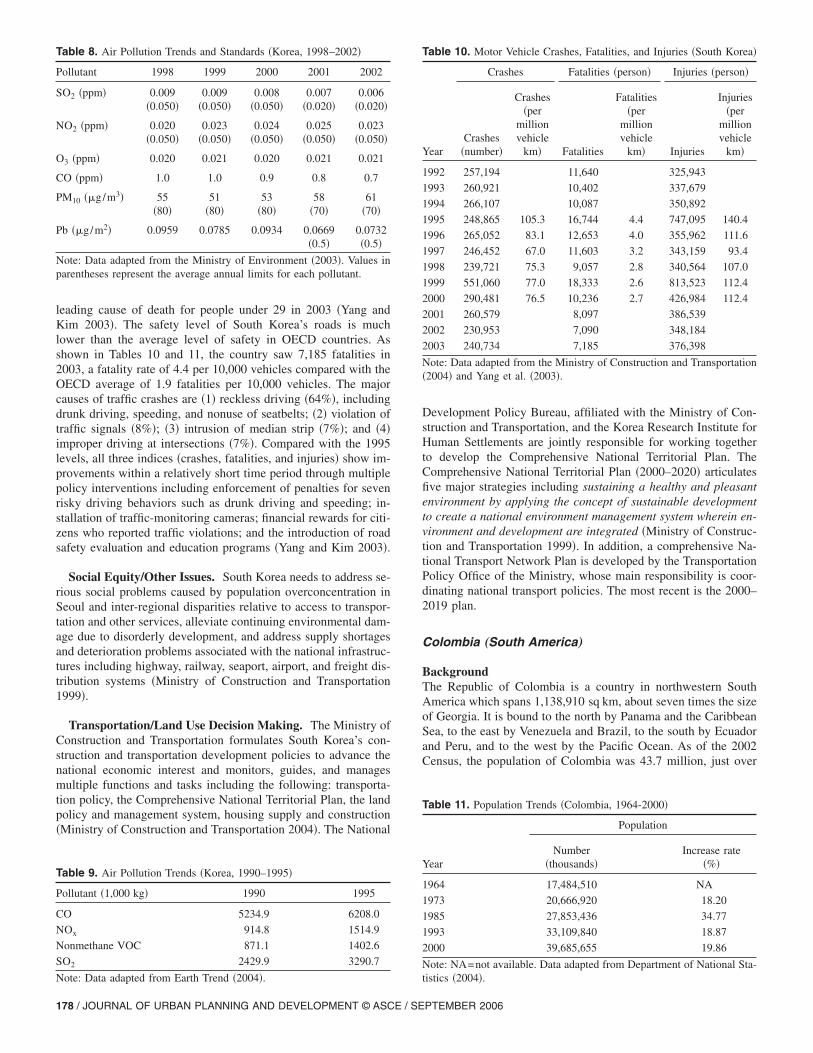
leading cause of death for people under 29 in 2003 �Yang andKim 2003�. The safety level of South Korea’s roads is muchlower than the average level of safety in OECD countries. Asshown in Tables 10 and 11, the country saw 7,185 fatalities in2003, a fatality rate of 4.4 per 10,000 vehicles compared with theOECD average of 1.9 fatalities per 10,000 vehicles. The majorcauses of traffic crashes are �1� reckless driving �64%�, includingdrunk driving, speeding, and nonuse of seatbelts; �2� violation oftraffic signals �8%�; �3� intrusion of median strip �7%�; and �4�improper driving at intersections �7%�. Compared with the 1995levels, all three indices �crashes, fatalities, and injuries� show im-provements within a relatively short time period through multiplepolicy interventions including enforcement of penalties for sevenrisky driving behaviors such as drunk driving and speeding; in-stallation of traffic-monitoring cameras; financial rewards for citi-zens who reported traffic violations; and the introduction of roadsafety evaluation and education programs �Yang and Kim 2003�.
Social Equity/Other Issues. South Korea needs to address se-rious social problems caused by population overconcentration inSeoul and inter-regional disparities relative to access to transpor-tation and other services, alleviate continuing environmental dam-age due to disorderly development, and address supply shortagesand deterioration problems associated with the national infrastruc-tures including highway, railway, seaport, airport, and freight dis-tribution systems �Ministry of Construction and Transportation1999�.
Transportation/Land Use Decision Making. The Ministry ofConstruction and Transportation formulates South Korea’s con-struction and transportation development policies to advance thenational economic interest and monitors, guides, and managesmultiple functions and tasks including the following: transporta-tion policy, the Comprehensive National Territorial Plan, the landpolicy and management system, housing supply and construction�Ministry of Construction and Transportation 2004�. The National
Table 8. Air Pollution Trends and Standards �Korea, 1998–2002�
Pollutant 1998 1999 2000 2001 2002
SO2 �ppm� 0.009�0.050�
0.009�0.050�
0.008�0.050�
0.007�0.020�
0.006�0.020�
NO2 �ppm� 0.020�0.050�
0.023�0.050�
0.024�0.050�
0.025�0.050�
0.023�0.050�
O3 �ppm� 0.020 0.021 0.020 0.021 0.021
CO �ppm� 1.0 1.0 0.9 0.8 0.7
PM10 ��g/m3� 55�80�
51�80�
53�80�
58�70�
61�70�
Pb ��g/m2� 0.0959 0.0785 0.0934 0.0669�0.5�
0.0732�0.5�
Note: Data adapted from the Ministry of Environment �2003�. Values inparentheses represent the average annual limits for each pollutant.
Table 9. Air Pollution Trends �Korea, 1990–1995�
Pollutant �1,000 kg� 1990 1995
CO 5234.9 6208.0
NOx 914.8 1514.9
Nonmethane VOC 871.1 1402.6
SO2 2429.9 3290.7
Note: Data adapted from Earth Trend �2004�.
178 / JOURNAL OF URBAN PLANNING AND DEVELOPMENT © ASCE / SE
Development Policy Bureau, affiliated with the Ministry of Con-struction and Transportation, and the Korea Research Institute forHuman Settlements are jointly responsible for working togetherto develop the Comprehensive National Territorial Plan. TheComprehensive National Territorial Plan �2000–2020� articulatesfive major strategies including sustaining a healthy and pleasantenvironment by applying the concept of sustainable developmentto create a national environment management system wherein en-vironment and development are integrated �Ministry of Construc-tion and Transportation 1999�. In addition, a comprehensive Na-tional Transport Network Plan is developed by the TransportationPolicy Office of the Ministry, whose main responsibility is coor-dinating national transport policies. The most recent is the 2000–2019 plan.
Colombia „South America…
BackgroundThe Republic of Colombia is a country in northwestern SouthAmerica which spans 1,138,910 sq km, about seven times the sizeof Georgia. It is bound to the north by Panama and the CaribbeanSea, to the east by Venezuela and Brazil, to the south by Ecuadorand Peru, and to the west by the Pacific Ocean. As of the 2002Census, the population of Colombia was 43.7 million, just over
Table 10. Motor Vehicle Crashes, Fatalities, and Injuries �South Korea�
Year
Crashes Fatalities �person� Injuries �person�
Crashes�number�
Crashes�per
millionvehicle
km� Fatalities
Fatalities�per
millionvehicle
km� Injuries
Injuries�per
millionvehicle
km�
1992 257,194 11,640 325,943
1993 260,921 10,402 337,679
1994 266,107 10,087 350,892
1995 248,865 105.3 16,744 4.4 747,095 140.4
1996 265,052 83.1 12,653 4.0 355,962 111.6
1997 246,452 67.0 11,603 3.2 343,159 93.4
1998 239,721 75.3 9,057 2.8 340,564 107.0
1999 551,060 77.0 18,333 2.6 813,523 112.4
2000 290,481 76.5 10,236 2.7 426,984 112.4
2001 260,579 8,097 386,539
2002 230,953 7,090 348,184
2003 240,734 7,185 376,398
Note: Data adapted from the Ministry of Construction and Transportation�2004� and Yang et al. �2003�.
Table 11. Population Trends �Colombia, 1964-2000�
Year
Population
Number�thousands�
Increase rate�%�
1964 17,484,510 NA
1973 20,666,920 18.20
1985 27,853,436 34.77
1993 33,109,840 18.87
2000 39,685,655 19.86
Note: NA=not available. Data adapted from Department of National Sta-
tistics �2004�.PTEMBER 2006

five times the population of Georgia, making it the third-mostpopulous country in Latin America, after Brazil and Mexico. Thecountry has experienced significant population growth in the pastfew decades, as depicted by Table 11. The per capita GNI wasU.S.$1,820 in 2002. About 20 million people are considered tolive in poverty and 10 million in extreme poverty. Movementfrom rural to urban areas has been heavy as has been the growthin automobiles as shown in Table 12. The urban population in-creased from 57% of the total population in 1951 to about 74% in1994. Bogotá, the capital city of Colombia, is one of the densestcities in the world, with 7.7 million people living on 35,000 ha�350 sq km�. Ethnic diversity in Colombia is a result of the inter-mingling of indigenous Indians, Spanish colonists, and Africans.Colombia is a free market economy with major commercial andinvestment ties to the United States. The country is poised formoderate growth in the next several years, after recovering from asevere recession in 1999 when the gross domestic product �theGDP the total market value of all goods and services producedwithin the borders of a nation during a specified period� fell byabout 5%. The economy suffered from weak domestic demand,austere government budgets, and a difficult security situation. Thecurrent government faces economic challenges ranging from pen-sion reform to reduction of unemployment that reached a record20% in 1999 and may remain high, contributing to extreme in-equalities in income distribution. In 1999, the share of agriculturalindustries stood at 19% in the overall industrial structure; manu-facturing industries stood at 26%; and service industries at 55%.Two of Colombia’s leading exports, oil and coffee, face an uncer-tain future; new exploration is needed to offset declining oil pro-duction, while coffee harvests and prices are depressed. Besides,the lack of public security is a key concern for investors who arecalling for progress in the government’s peace negotiations withinsurgent groups �The World Bank Group 2002; Wikipedia 2004�.
Transportation System
General Characteristics. Transportation mode share data in-dicates that about half of all trips �46%� are made by bus, 16% bytaxi, 15% by automobile, 8% by pedestrian, 8% by bicycle, and7% by motorcycle �TGI Colombia 2004�. Colombia’s transporta-tion inventory shows that the railway system of the countryspanned 3,340 operational km in 2002, and highway system tra-versed 110,000 km �including paved and unpaved roadways� in2000. Trains serve the densely populated areas of Colombia al-though service is undependable. Buses provide service betweencities on the major routes while taxis offer the most reliable pub-lic transportation in cities. The country has 1,050 airports �includ-ing airports with paved and unpaved runways�; the maininternational airports are El Dorado Airport �Bogotá� and RafaelNunez Airport. A ferry and a boat service operate between someof the ports and cays in Colombia �World Resources Institute
Table 12. Road Traffic �Motor Vehicles in Use �Colombia, 1997–1999��
Year
Passenger cars Buses
Number Percent Number P
1997 1,694,323 NA 126,362
1998 1,776,100 4.83 131,987
1999 1,803,201 1.53 134,799
Note: NA=not available. Data adapted from the International Road Fede
2004�.
JOURNAL OF URBAN P
Infrastructure. The irregular terrain of Colombia makes theconstruction of roads and railroads costly. Urban and rural roadconditions and maintenance are considered poor �Onursal andGuatam 1997; U.S. Department of State Bureau and ConsularAffairs 2004�. Basic infrastructure is deteriorating in most majorcities in Colombia, and the numerous construction projects initi-ated to improve this situation contribute significantly to conges-tion �World Resources Institute 2004�.
Safety. Traffic laws are sporadically followed and rarely en-forced, and a traffic accident is estimated to occur every ten min-utes in Colombia �U.S. Department of State Bureau and ConsularAffairs 2004�. Road traffic fatalities are ranked as the secondleading cause of morbidity and mortality from external causes,exceeded only by homicides. Approximately 20.2% �34,547� ofall deaths recorded between 1995 and 1999 were due to roadtraffic injuries. Pedestrians constitute the largest category of thesetraffic-related casualties accounting for close to 32% of all inju-ries and 40% of the deaths from traffic crashes. The problem ofroad traffic crashes has existed predominantly in the urban areasof Bogotá, Medellin, and Cali. In these main urban centers, pe-destrians constituted nearly 68% of road traffic crash victims. Asshown in Table 13, over 200,000 road traffic crashes were re-ported in 2000, representing a fourfold increase from the crashesreported in 1986. Injuries increased fourfold from the mid-13,000s in 1986 to the mid-51,000s in 2000, while fatalities al-most doubled from 3,535 in 1986 to 6,551 in 2000. This corre-sponds to one person dying every 80 min and a mortality rate of
Goods vehicles Motorcycles
Number Percent Number Percent
179,530 NA 385,378 NA
183,335 2.12 450,283 16.84
184,495 0.63 479,073 6.39
�2004�.
Table 13. Trends on Road Traffic Crashes, Fatalities, and Injuries�Colombia, 1986–2000�
Year Fatalities Injuries Crashes
1986 3,535 13,449 64,289
1987 3,833 15,008 91,723
1988 5,039 19,772 117,933
1989 4,032 18,085 108,506
1990 3,704 16,086 122,112
1991 4,119 18,182 111,462
1992 4,620 21,280 130,304
1993 5,628 33,083 149,940
1994 6,989 45,940 164,202
1995 7,874 52,547 179,820
1996 7,445 50,630 187,966
1997 7,607 49,312 195,442
1998 7,595 52,965 206,283
1999 7,026 52,346 220,225
2000 6,551 51,458 231,974
Total 85,597 510,143 2,282,181
ercent
NA
4.45
2.13
ration
Note: Data adapted from Rodriguez et al. �2003�.
LANNING AND DEVELOPMENT © ASCE / SEPTEMBER 2006 / 179
15.2 deaths per 100,000 population �Rodriguez et al. 2003�. Lawenforcement is lacking in some areas resulting in the prevalenceof bad driving habits and parked cars occupying public spacessuch as sidewalks �Onursal and Guatam 1997�.
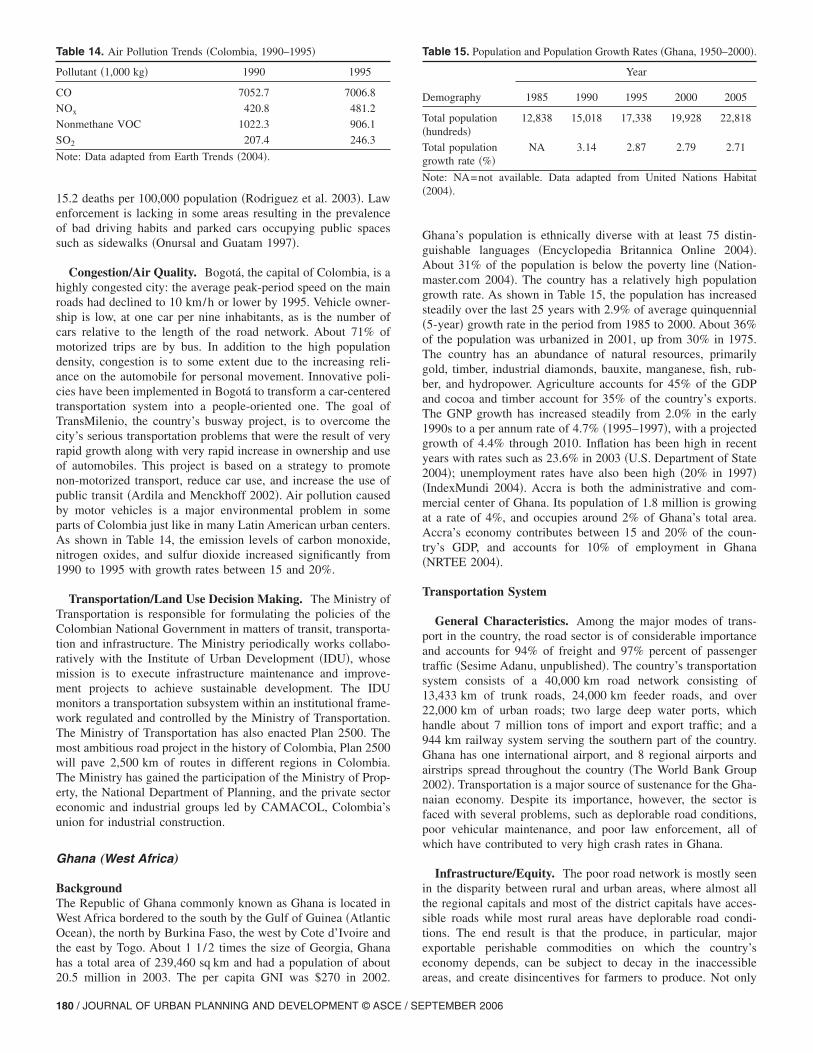
Congestion/Air Quality. Bogotá, the capital of Colombia, is ahighly congested city: the average peak-period speed on the mainroads had declined to 10 km/h or lower by 1995. Vehicle owner-ship is low, at one car per nine inhabitants, as is the number ofcars relative to the length of the road network. About 71% ofmotorized trips are by bus. In addition to the high populationdensity, congestion is to some extent due to the increasing reli-ance on the automobile for personal movement. Innovative poli-cies have been implemented in Bogotá to transform a car-centeredtransportation system into a people-oriented one. The goal ofTransMilenio, the country’s busway project, is to overcome thecity’s serious transportation problems that were the result of veryrapid growth along with very rapid increase in ownership and useof automobiles. This project is based on a strategy to promotenon-motorized transport, reduce car use, and increase the use ofpublic transit �Ardila and Menckhoff 2002�. Air pollution causedby motor vehicles is a major environmental problem in someparts of Colombia just like in many Latin American urban centers.As shown in Table 14, the emission levels of carbon monoxide,nitrogen oxides, and sulfur dioxide increased significantly from1990 to 1995 with growth rates between 15 and 20%.
Transportation/Land Use Decision Making. The Ministry ofTransportation is responsible for formulating the policies of theColombian National Government in matters of transit, transporta-tion and infrastructure. The Ministry periodically works collabo-ratively with the Institute of Urban Development �IDU�, whosemission is to execute infrastructure maintenance and improve-ment projects to achieve sustainable development. The IDUmonitors a transportation subsystem within an institutional frame-work regulated and controlled by the Ministry of Transportation.The Ministry of Transportation has also enacted Plan 2500. Themost ambitious road project in the history of Colombia, Plan 2500will pave 2,500 km of routes in different regions in Colombia.The Ministry has gained the participation of the Ministry of Prop-erty, the National Department of Planning, and the private sectoreconomic and industrial groups led by CAMACOL, Colombia’sunion for industrial construction.
Ghana „West Africa…
BackgroundThe Republic of Ghana commonly known as Ghana is located inWest Africa bordered to the south by the Gulf of Guinea �AtlanticOcean�, the north by Burkina Faso, the west by Cote d’Ivoire andthe east by Togo. About 1 1/2 times the size of Georgia, Ghanahas a total area of 239,460 sq km and had a population of about
Table 14. Air Pollution Trends �Colombia, 1990–1995�
Pollutant �1,000 kg� 1990 1995
CO 7052.7 7006.8
NOx 420.8 481.2
Nonmethane VOC 1022.3 906.1
SO2 207.4 246.3
Note: Data adapted from Earth Trends �2004�.
20.5 million in 2003. The per capita GNI was $270 in 2002.
180 / JOURNAL OF URBAN PLANNING AND DEVELOPMENT © ASCE / SE
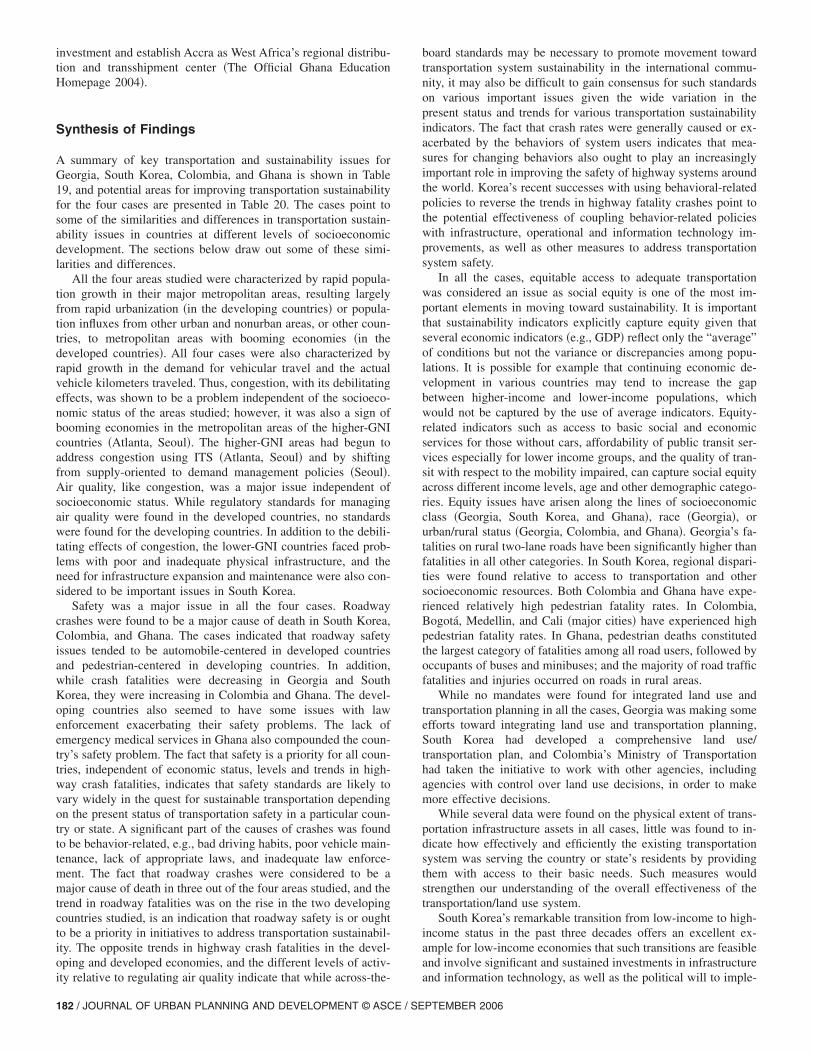
Ghana’s population is ethnically diverse with at least 75 distin-guishable languages �Encyclopedia Britannica Online 2004�.About 31% of the population is below the poverty line �Nation-master.com 2004�. The country has a relatively high populationgrowth rate. As shown in Table 15, the population has increasedsteadily over the last 25 years with 2.9% of average quinquennial�5-year� growth rate in the period from 1985 to 2000. About 36%of the population was urbanized in 2001, up from 30% in 1975.The country has an abundance of natural resources, primarilygold, timber, industrial diamonds, bauxite, manganese, fish, rub-ber, and hydropower. Agriculture accounts for 45% of the GDPand cocoa and timber account for 35% of the country’s exports.The GNP growth has increased steadily from 2.0% in the early1990s to a per annum rate of 4.7% �1995–1997�, with a projectedgrowth of 4.4% through 2010. Inflation has been high in recentyears with rates such as 23.6% in 2003 �U.S. Department of State2004�; unemployment rates have also been high �20% in 1997��IndexMundi 2004�. Accra is both the administrative and com-mercial center of Ghana. Its population of 1.8 million is growingat a rate of 4%, and occupies around 2% of Ghana’s total area.Accra’s economy contributes between 15 and 20% of the coun-try’s GDP, and accounts for 10% of employment in Ghana�NRTEE 2004�.
Transportation System
General Characteristics. Among the major modes of trans-port in the country, the road sector is of considerable importanceand accounts for 94% of freight and 97% percent of passengertraffic �Sesime Adanu, unpublished�. The country’s transportationsystem consists of a 40,000 km road network consisting of13,433 km of trunk roads, 24,000 km feeder roads, and over22,000 km of urban roads; two large deep water ports, whichhandle about 7 million tons of import and export traffic; and a944 km railway system serving the southern part of the country.Ghana has one international airport, and 8 regional airports andairstrips spread throughout the country �The World Bank Group2002�. Transportation is a major source of sustenance for the Gha-naian economy. Despite its importance, however, the sector isfaced with several problems, such as deplorable road conditions,poor vehicular maintenance, and poor law enforcement, all ofwhich have contributed to very high crash rates in Ghana.
Infrastructure/Equity. The poor road network is mostly seenin the disparity between rural and urban areas, where almost allthe regional capitals and most of the district capitals have acces-sible roads while most rural areas have deplorable road condi-tions. The end result is that the produce, in particular, majorexportable perishable commodities on which the country’seconomy depends, can be subject to decay in the inaccessible
Table 15. Population and Population Growth Rates �Ghana, 1950–2000�.
Demography
Year
1985 1990 1995 2000 2005
Total population�hundreds�
12,838 15,018 17,338 19,928 22,818
Total populationgrowth rate �%�
NA 3.14 2.87 2.79 2.71
Note: NA=not available. Data adapted from United Nations Habitat�2004�.
areas, and create disincentives for farmers to produce. Not only
PTEMBER 2006

are the roads bad, but there also exist inequalities in motorableand accessible roads in the country, attributable mainly to eco-nomic resource availability in the different areas. Lack of acces-sibility for vital destinations such as jobs, schools, markets, andhealth care has affected development activities in inaccessibleareas �Sesime Adanu, unpublished�. Besides, many of the roadshave inadequate signs or pavement that is not equipped to handlethe traffic. The country also lacks an effective public transporta-tion system.
Safety. One of the main problems facing Ghana is increasingroad traffic fatalities reflected in the number of lives lost everymonth. The Public Agenda newspaper �2003� revealed that 150people die in the country every month through road accidentsalone �Sesime Adanu, unpublished�. According to 1994–1998 po-lice data, road traffic crashes were a leading cause of death andinjuries in Ghana, beside occupational injuries which involvenon-mechanized farming and ethnic conflicts. Table 16 shows re-cent trends in road traffic crashes, deaths, and injuries and Table17 shows crash and injury rates per 100,000 inhabitants. The ma-jority of road traffic fatalities �61%� and injuries �53%� occurredon roads in rural areas. About 58% more people died on roads inrural areas than in urban areas, and generally more severe crashesoccurred on rural roads compared with urban roads. The numberof reported crashes increased by 63 percent between 1994 and1998. Road traffic injuries increased by 49% and deaths by 65%.In the same period, the number of vehicles involved in crashesincreased by 69%.
The nature of transport-related deaths and injuries in bothurban and rural areas is fundamentally different from that in de-veloped countries: in developed countries, crashes involving oc-cupants of private vehicles predominate and pedestrian injuriesmake up a smaller percentage of all transport-related injuries�Afukaar et al. 2003�. In Ghana, pedestrian deaths constitute thelargest category �46%� of fatalities among all road users, followedby occupants of buses and minibuses. High driving speeds ofpoorly maintained passenger-ferrying vehicles on generally badly
Table 16. Trends in Road Traffic Crashes, Casualties, and VehiclesInvolved �Ghanna, 1994–1998�
Year Crashes Fatalities InjuriesNumber of
vehicles involved
1994 6,580 824 7,663 9,995
1995 8,314 1,026 9,105 12,916
1996 8,489 1,050 9,903 13,368
1997 9,914 1,014 10,431 15,619
1998 10,715 1,362 11,405 16,892
Total 44,012 5,276 48,507 68,790
Percent change 62.8% 65.3% 52.8% 69%
Note: Data adapted from Afukaar et al. �2003�.
Table 17. Crash and Injury Rates per 100,000 Population �Ghana,1994–1998�
RegionInjury
crash rateFatal
injury rateSerious
injury rateSlight
injury rate
Allcasualties
rate
Whole country 139.9 28.7 102.1 161.3 292.1
Note: Data adapted from Ghana Statistical Service �2004�.
JOURNAL OF URBAN P
deteriorated roads, coupled with the lack of emergency medicalservices, have combined to increase fatalities on rural roads �Afu-kaar et al. 2003�.
Congestion/Air Quality. Air quality is deteriorating in urbanareas, particularly in the capital city of Accra and the surroundingmetropolitan area. Ghana’s urban population, especially in Accra,has burgeoned, with annual growth rates estimated as high as 4%.The corresponding rise in vehicle transport has caused major traf-fic congestion and excessive wear and tear on the road network.Road travel, whether motorized or nonmotorized, poses difficul-ties that place considerable hardship on the urban poor �TheOPEC Fund for International Development 2004�. Rapid in-creases in car ownership coupled with poor land use planning,inadequate road space, lack of regulated parking systems, unedu-cated use of the road by pedestrians, and bad driving behavior ofmotorists have also combined to produce serious congestion, es-pecially in Accra �Abane 1993�. Sprawl is evident in several partsof the expanding Accra metropolitan area. As shown in Table 18,the total emissions of carbon monoxide, nitrogen oxides, non-methane VOCs, and sulfur dioxide increased at relatively highrates from 1990 to 1995, and are expected to be on the rise owingto continuing growth in the Accra metropolitan area.
Land Use/Transportation Decision Making. The Ministry ofRoads and Transport is responsible for the development andmaintenance of transport infrastructure and the provision of trans-port services for all modes of transport in Ghana. The GhanaRoads Sector Development Program aims at achieving sustain-able improvement in the supply and performance of roads as wellas road transport services in a regionally equitable manner. Thegoal is to increase Ghana’s competitiveness in foreign trade andpromote linkages in domestic markets which are crucial for rapidand sustained growth �The World Bank Group 2002�. Ghana hasundertaken three transportation projects that have contributed tothe success of the country’s economic recovery program. Theprojects, implemented from 1987 to 1998, rehabilitated economi-cally important roads and instituted maintenance programs to pre-vent road deterioration �Graduate School of Architecture andPreservation 2004�. There is, however, the need to integrate landuse and transportation decisions better to gain better control overcongestion, sprawl, and the associated air quality problems in theAccra metropolitan area. Vision 2020 is Ghana’s road map toachieving middle-income country status by the year 2020. Thebasic objectives of Vision 2020 are to reduce poverty, increaseemployment opportunities and average incomes, and reduce ineq-uities in order to improve the general welfare and the materialwell being of all Ghanaians. In the Vision 2020 framework, thefundamental policy objective of the transport sector is to establishan efficient, modally complementary, and integrated transporta-tion network for the movement of people and goods at the leastpossible cost within the country. This policy is meant to support
Table 18. Air pollution Trends �Ghana, 1990–1995�
Pollutant �1,000 kg� 1990 1995
CO 2227.1 2319.7
NOx 105.9 112.9
Nonmethane VOC 204.2 218.7
SO2 29.7 32.4
Note: Data adapted from Earth Trends �2004�.
Ghana’s Gateway Program, a program intended to attract foreign
LANNING AND DEVELOPMENT © ASCE / SEPTEMBER 2006 / 181
investment and establish Accra as West Africa’s regional distribu-tion and transshipment center �The Official Ghana EducationHomepage 2004�.
Synthesis of Findings
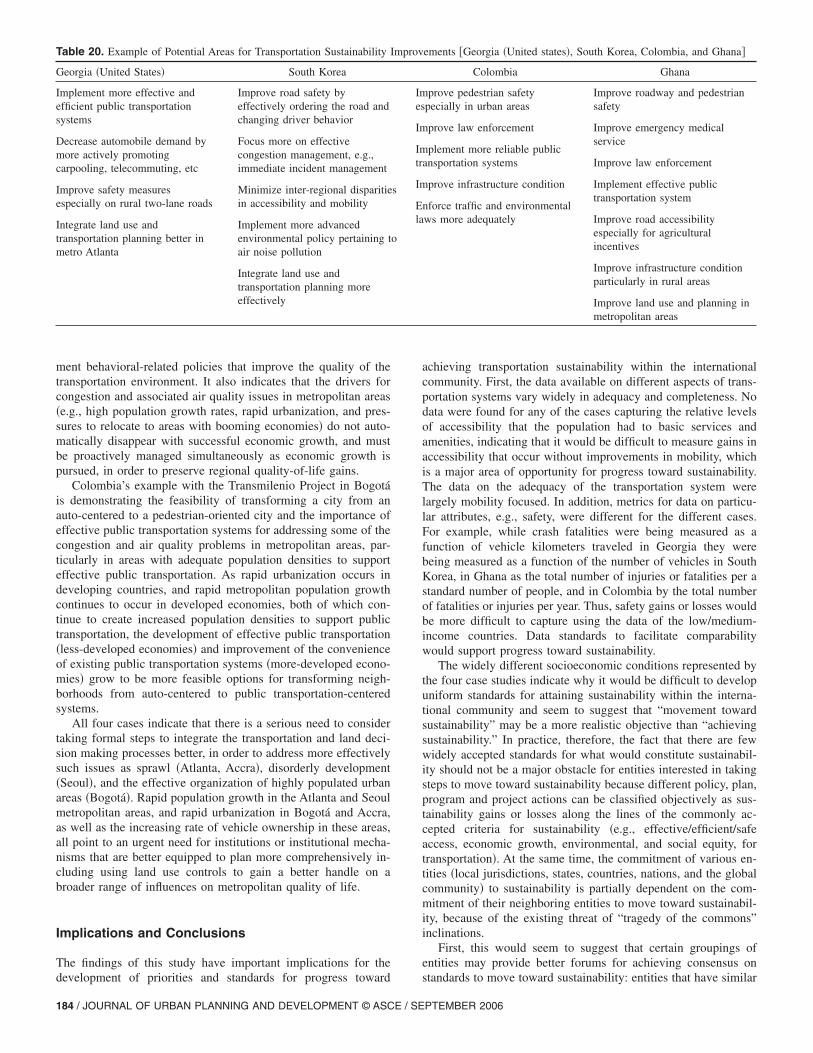
A summary of key transportation and sustainability issues forGeorgia, South Korea, Colombia, and Ghana is shown in Table19, and potential areas for improving transportation sustainabilityfor the four cases are presented in Table 20. The cases point tosome of the similarities and differences in transportation sustain-ability issues in countries at different levels of socioeconomicdevelopment. The sections below draw out some of these simi-larities and differences.
All the four areas studied were characterized by rapid popula-tion growth in their major metropolitan areas, resulting largelyfrom rapid urbanization �in the developing countries� or popula-tion influxes from other urban and nonurban areas, or other coun-tries, to metropolitan areas with booming economies �in thedeveloped countries�. All four cases were also characterized byrapid growth in the demand for vehicular travel and the actualvehicle kilometers traveled. Thus, congestion, with its debilitatingeffects, was shown to be a problem independent of the socioeco-nomic status of the areas studied; however, it was also a sign ofbooming economies in the metropolitan areas of the higher-GNIcountries �Atlanta, Seoul�. The higher-GNI areas had begun toaddress congestion using ITS �Atlanta, Seoul� and by shiftingfrom supply-oriented to demand management policies �Seoul�.Air quality, like congestion, was a major issue independent ofsocioeconomic status. While regulatory standards for managingair quality were found in the developed countries, no standardswere found for the developing countries. In addition to the debili-tating effects of congestion, the lower-GNI countries faced prob-lems with poor and inadequate physical infrastructure, and theneed for infrastructure expansion and maintenance were also con-sidered to be important issues in South Korea.
Safety was a major issue in all the four cases. Roadwaycrashes were found to be a major cause of death in South Korea,Colombia, and Ghana. The cases indicated that roadway safetyissues tended to be automobile-centered in developed countriesand pedestrian-centered in developing countries. In addition,while crash fatalities were decreasing in Georgia and SouthKorea, they were increasing in Colombia and Ghana. The devel-oping countries also seemed to have some issues with lawenforcement exacerbating their safety problems. The lack ofemergency medical services in Ghana also compounded the coun-try’s safety problem. The fact that safety is a priority for all coun-tries, independent of economic status, levels and trends in high-way crash fatalities, indicates that safety standards are likely tovary widely in the quest for sustainable transportation dependingon the present status of transportation safety in a particular coun-try or state. A significant part of the causes of crashes was foundto be behavior-related, e.g., bad driving habits, poor vehicle main-tenance, lack of appropriate laws, and inadequate law enforce-ment. The fact that roadway crashes were considered to be amajor cause of death in three out of the four areas studied, and thetrend in roadway fatalities was on the rise in the two developingcountries studied, is an indication that roadway safety is or oughtto be a priority in initiatives to address transportation sustainabil-ity. The opposite trends in highway crash fatalities in the devel-oping and developed economies, and the different levels of activ-
ity relative to regulating air quality indicate that while across-the-182 / JOURNAL OF URBAN PLANNING AND DEVELOPMENT © ASCE / SE
board standards may be necessary to promote movement towardtransportation system sustainability in the international commu-nity, it may also be difficult to gain consensus for such standardson various important issues given the wide variation in thepresent status and trends for various transportation sustainabilityindicators. The fact that crash rates were generally caused or ex-acerbated by the behaviors of system users indicates that mea-sures for changing behaviors also ought to play an increasinglyimportant role in improving the safety of highway systems aroundthe world. Korea’s recent successes with using behavioral-relatedpolicies to reverse the trends in highway fatality crashes point tothe potential effectiveness of coupling behavior-related policieswith infrastructure, operational and information technology im-provements, as well as other measures to address transportationsystem safety.
In all the cases, equitable access to adequate transportationwas considered an issue as social equity is one of the most im-portant elements in moving toward sustainability. It is importantthat sustainability indicators explicitly capture equity given thatseveral economic indicators �e.g., GDP� reflect only the “average”of conditions but not the variance or discrepancies among popu-lations. It is possible for example that continuing economic de-velopment in various countries may tend to increase the gapbetween higher-income and lower-income populations, whichwould not be captured by the use of average indicators. Equity-related indicators such as access to basic social and economicservices for those without cars, affordability of public transit ser-vices especially for lower income groups, and the quality of tran-sit with respect to the mobility impaired, can capture social equityacross different income levels, age and other demographic catego-ries. Equity issues have arisen along the lines of socioeconomicclass �Georgia, South Korea, and Ghana�, race �Georgia�, orurban/rural status �Georgia, Colombia, and Ghana�. Georgia’s fa-talities on rural two-lane roads have been significantly higher thanfatalities in all other categories. In South Korea, regional dispari-ties were found relative to access to transportation and othersocioeconomic resources. Both Colombia and Ghana have expe-rienced relatively high pedestrian fatality rates. In Colombia,Bogotá, Medellin, and Cali �major cities� have experienced highpedestrian fatality rates. In Ghana, pedestrian deaths constitutedthe largest category of fatalities among all road users, followed byoccupants of buses and minibuses; and the majority of road trafficfatalities and injuries occurred on roads in rural areas.
While no mandates were found for integrated land use andtransportation planning in all the cases, Georgia was making someefforts toward integrating land use and transportation planning,South Korea had developed a comprehensive land use/transportation plan, and Colombia’s Ministry of Transportationhad taken the initiative to work with other agencies, includingagencies with control over land use decisions, in order to makemore effective decisions.
While several data were found on the physical extent of trans-portation infrastructure assets in all cases, little was found to in-dicate how effectively and efficiently the existing transportationsystem was serving the country or state’s residents by providingthem with access to their basic needs. Such measures wouldstrengthen our understanding of the overall effectiveness of thetransportation/land use system.
South Korea’s remarkable transition from low-income to high-income status in the past three decades offers an excellent ex-ample for low-income economies that such transitions are feasibleand involve significant and sustained investments in infrastructure
and information technology, as well as the political will to imple-PTEMBER 2006

Table 19. Summary of Key Transportation and Sustainability Issues
Issue
System attributes case
Georgia �United States� South Korea Colombia Ghana
Effectiveness/efficiency
Severe traffic congestion inmetropolitan Atlanta
Severe traffic congestion inSeoul
Bogotá capital city is highlycongested
Severe congestion in Accrametropolitan area
Demand management throughITS technologies, HOV lanes,public education initiatives topromote carpooling,telecommuting, etc.
Demand management throughITS technologies, congestionpricing, traffic impact taxation;higher parking fees in congestedareas; exclusive bus lanes
Bus is the predominant modeof transportation, and taxisprovide the most reliableservice in the cities
Lack of effective publictransportation system
Train service is undependable Poor infrastructureTransmilenio Busway Projectimplemented to transformcar-centered Bogots topedestrian-centered cityPoor infrastructure conditions
Safety Downward trend for fatalityand injury crashes
Downward trend for fatality andinjury crashes
Upward trend in highwaycrash fatalities
Upward trend in highway crashfatalities
Highest fatalities occur onrural two-lane road
Road traffic fatalities leadingcause of death for people under20 �2003�
Road traffic fatalities secondleading cause of death next tohomicides: one traffic crashoccurs every 10 min
Road crashes are a leading causeof death in the country; themajority of which occur on roadsinn rural areas
Urban pedestrian fatalitiesconstitute highest category oftraffic fatalities
Pedestrain deaths constitute thelargest category of road trafficdeaths followed by buses andminibuses
Economic High income status High income status Middle-income status Low-income statusCommercial transportationpositively impacts agriculturalindustry
Remarkable growth in GNI overthe past 30 years is positivelyassociated with transportationdevelopment made over the pastdecades
High poverty rate is positivelyassociated with poorinfrastructure conditions
Significant percentage ofagricultural exportable producedecay due to poor road access:disincentive for farmers toproduce
High rate of urban pedestriandeaths
Social equity High fatality rates on ruraltwo-lane highways
Inter-regional disparities inaccessibility and mobility
High rate of urban pedestriandeaths
Wide disparities in road accessand infrastructure condition inurban and rural areas
Environmental Poor air quality inmetropolitan Atlanta withassociated respiratory healtheffects
Air pollution in Seoul:increasing trends in particulatematter and nitrogen dioxideemissionsNoise pollution in Seoul
Increasing trends in nitrogenoxides and sulfur dioxideemissions
Rapidly increasing trends incarbon dioxide, nitrogen oxides,and nonmethane VOCs in Accra
Decisionmaking
No formal mandate found forintegrated land use/transportation decisionmaking; however, efforts havebeen made to coordinate theplanning activities of land useand transportation agencies
No formal mandate found forintegrated land/usetransportation decision making;however, there has been thedevelopment of the Nationalcomprehensive Plan includingland use and transportationelements
No formal mandate found forintegrated land use/transportation decisionmaking; however, the Ministryof Transportation is involvingseveral agencies in its decisionmaking
No formal mandate found forintegrated land use/transportationPlanning
Other relatedissues
Sprawl and its impact on poorair quality
Disorderly developmentresulting in environmentaldamage
High level of poverty High level of poverty
Opportunities for integratingland use and transportationplanning better in metroAtlanta
Rapid urbanization Poor infrastructure conditions
Poor enforcement of trafficlaws
Poor law enforcement
Public security issues Lack of emergency medicalservices
Extreme inequality in incomedistribution
Poor land use planning inmetropolitan areas
Leading exports facinguncertain future
JOURNAL OF URBAN PLANNING AND DEVELOPMENT © ASCE / SEPTEMBER 2006 / 183
ment behavioral-related policies that improve the quality of thetransportation environment. It also indicates that the drivers forcongestion and associated air quality issues in metropolitan areas�e.g., high population growth rates, rapid urbanization, and pres-sures to relocate to areas with booming economies� do not auto-matically disappear with successful economic growth, and mustbe proactively managed simultaneously as economic growth ispursued, in order to preserve regional quality-of-life gains.
Colombia’s example with the Transmilenio Project in Bogotáis demonstrating the feasibility of transforming a city from anauto-centered to a pedestrian-oriented city and the importance ofeffective public transportation systems for addressing some of thecongestion and air quality problems in metropolitan areas, par-ticularly in areas with adequate population densities to supporteffective public transportation. As rapid urbanization occurs indeveloping countries, and rapid metropolitan population growthcontinues to occur in developed economies, both of which con-tinue to create increased population densities to support publictransportation, the development of effective public transportation�less-developed economies� and improvement of the convenienceof existing public transportation systems �more-developed econo-mies� grow to be more feasible options for transforming neigh-borhoods from auto-centered to public transportation-centeredsystems.
All four cases indicate that there is a serious need to considertaking formal steps to integrate the transportation and land deci-sion making processes better, in order to address more effectivelysuch issues as sprawl �Atlanta, Accra�, disorderly development�Seoul�, and the effective organization of highly populated urbanareas �Bogotá�. Rapid population growth in the Atlanta and Seoulmetropolitan areas, and rapid urbanization in Bogotá and Accra,as well as the increasing rate of vehicle ownership in these areas,all point to an urgent need for institutions or institutional mecha-nisms that are better equipped to plan more comprehensively in-cluding using land use controls to gain a better handle on abroader range of influences on metropolitan quality of life.
Implications and Conclusions
The findings of this study have important implications for the
Table 20. Example of Potential Areas for Transportation Sustainability I
Georgia �United States� South Korea
Implement more effective andefficient public transportationsystems
Decrease automobile demand bymore actively promotingcarpooling, telecommuting, etc
Improve safety measuresespecially on rural two-lane roads
Integrate land use andtransportation planning better inmetro Atlanta
Improve road safety byeffectively ordering the road andchanging driver behavior
Focus more on effectivecongestion management, e.g.,immediate incident management
Minimize inter-regional disparitiein accessibility and mobility
Implement more advancedenvironmental policy pertaining tair noise pollution
Integrate land use andtransportation planning moreeffectively
development of priorities and standards for progress toward
184 / JOURNAL OF URBAN PLANNING AND DEVELOPMENT © ASCE / SE
achieving transportation sustainability within the internationalcommunity. First, the data available on different aspects of trans-portation systems vary widely in adequacy and completeness. Nodata were found for any of the cases capturing the relative levelsof accessibility that the population had to basic services andamenities, indicating that it would be difficult to measure gains inaccessibility that occur without improvements in mobility, whichis a major area of opportunity for progress toward sustainability.The data on the adequacy of the transportation system werelargely mobility focused. In addition, metrics for data on particu-lar attributes, e.g., safety, were different for the different cases.For example, while crash fatalities were being measured as afunction of vehicle kilometers traveled in Georgia they werebeing measured as a function of the number of vehicles in SouthKorea, in Ghana as the total number of injuries or fatalities per astandard number of people, and in Colombia by the total numberof fatalities or injuries per year. Thus, safety gains or losses wouldbe more difficult to capture using the data of the low/medium-income countries. Data standards to facilitate comparabilitywould support progress toward sustainability.
The widely different socioeconomic conditions represented bythe four case studies indicate why it would be difficult to developuniform standards for attaining sustainability within the interna-tional community and seem to suggest that “movement towardsustainability” may be a more realistic objective than “achievingsustainability.” In practice, therefore, the fact that there are fewwidely accepted standards for what would constitute sustainabil-ity should not be a major obstacle for entities interested in takingsteps to move toward sustainability because different policy, plan,program and project actions can be classified objectively as sus-tainability gains or losses along the lines of the commonly ac-cepted criteria for sustainability �e.g., effective/efficient/safeaccess, economic growth, environmental, and social equity, fortransportation�. At the same time, the commitment of various en-tities �local jurisdictions, states, countries, nations, and the globalcommunity� to sustainability is partially dependent on the com-mitment of their neighboring entities to move toward sustainabil-ity, because of the existing threat of “tragedy of the commons”inclinations.
First, this would seem to suggest that certain groupings ofentities may provide better forums for achieving consensus on
ements �Georgia �United states�, South Korea, Colombia, and Ghana�
Colombia Ghana
prove pedestrian safetypecially in urban areas
prove law enforcement
plement more reliable publicansportation systems
prove infrastructure condition
nforce traffic and environmentalws more adequately
Improve roadway and pedestriansafety
Improve emergency medicalservice
Improve law enforcement
Implement effective publictransportation system
Improve road accessibilityespecially for agriculturalincentives
Improve infrastructure conditionparticularly in rural areas
Improve land use and planning inmetropolitan areas
mprov
s
o
Imes
Im
Imtr
Im
Ela
standards to move toward sustainability: entities that have similar
PTEMBER 2006

socioeconomic conditions, and thus share feasible goals, priori-ties, and constraints. For example, while stabilizing or reversingthe trends in roadway fatalities may be plausible interim targetsfor Colombia and Ghana, such targets are not relevant for SouthKorea and Georgia, and thus lumping these four entities togetherin the development of safety standards for sustainability may notbe a very worthwhile endeavor. Success in building consensus forstandards would entail a convergence of minds, which may morelikely occur among entities that have similar issues to contendwith. Second, it would also seem to suggest that, for practicalpurposes, standards may be movable targets with associated timeframes rather than fixed endpoints anchored at some infinitepoints in time. A plausible objective may be to move “regions ofsimilar status and constraints” toward sustainability throughconsensus-based interim targets that are subject to change overtime. The term region is used in this context to capture entitieswith similar existing socioeconomic conditions with respect toachieving sustainability in a particular domain, e.g., transporta-tion. Thus, such regions may be geographically contiguous butnot necessarily so. For example, entities with vehicle fatalities onthe rise are natural members of a region that would be interestedin reversing trends in roadway fatalities. Thus, the levels of com-parability among a particular group of entities would have a directimpact on their ability to reach consensus on particular targets forsustainability in agreed-upon time frames.
These ideas suggest potential differences in the types of fo-rums that could be successfully adopted to develop intra-regionalstandards in contradistinction with inter-regional standards. Itwould seem that the successful development of intra-regionalstandards �interim targets� would need to be more sensitive to theneeds of members of a particular region. Inter-regional agree-ments, on the other hand, could be negotiated among regionalrepresentatives on issues or “bundles of issues” that are not nec-essarily similar but offer opportunities for give-and-take, takinginto consideration the different needs and interim goals of theparticipating regions. Under such a framework, standards that cutacross regions would not necessarily be similar for all regionalentities involved, but rather acceptable based on a mindset oftradeoffs brought to the negotiation table and an understandingthat the prevailing conditions in different regions can be signifi-cantly different.
One may also argue that some sustainability issues havefarther-reaching influence than others, and that in developingstandards, the former would be more important across regionsthan within regions. For example, vehicle emissions may be con-sidered farther-reaching than crash fatalities in the quest for ac-ceptable across-the-board standards, because the impacts of theformer on neighboring entities are potentially more significantthan the latter. Distinguishing among indicators that have intra-regional versus inter-regional implications could be helpful forunderstanding how much of a driver regional commonalitieswould be in the successful development of standards for sustain-ability, and thus for crafting issues or “bundles of issues” that aremore likely to gain consensus at appropriate levels �local, na-tional, regional, global� of decision making, while temporarilymanaging at more disaggregate level issues that are less likely togain across-the-board consensus.
These ideas are intended to offer food for thought to thebroader community interested in finding more successful modelsto develop standards for promoting movement toward sustainabil-ity in the international community. Perhaps different regionally-based standards that are perceived as equitable across regions
stand more of a chance of being adopted than across-the-boardJOURNAL OF URBAN P
standards that may fail to acknowledge the needs and constraintsof various entities while catering to others �from the very natureof the wide scope of conditions present in different socioeco-nomic contexts�. A model where standards are crafted as movabletargets based on mutually agreed upon time frames and whereentities’ memberships in regions can change, depending on thechanges in their sustainability status, may offer more appropriateincentives for accelerated movement toward sustainability amonga broader scope of entities with widely different socioeconomicconditions and constraints.
Several issues worth considering, while beyond the scope ofthis paper, remain important subject material to advance progresstoward sustainability. Particularly important are the effects ofpopulation densities on achieving and measuring transportationsustainability �in particular, megacities such as Seoul, Los Ange-les, and Lagos may offer a unique set of challenges for the devel-opment of sustainable transportation systems�; understandingcauses and drivers of sustainability and nonsustainability in trans-portation systems, understanding the relationships between imple-mented economic/infrastructure policies and the resulting systemoutcomes �e.g., safety, congestion, air quality�; and appropriateindicator sets for measuring progress toward sustainability at vari-ous levels of socioeconomic development.
Acknowledgments
This material is based upon work supported by the National Sci-ence Foundation under Grant No. 0219607. Any opinions, find-ings, and conclusions or recommendations expressed in thismaterial are those of the writers and do not necessarily reflect theviews of the National Science Foundation. The writers are grate-ful for contributions made by Alexandria McBride and CraigMiller �NASA SHARP apprentices� to the case studies.
References
AAA and Georgia Regional Transportation Authority. �2002�. “2002 an-nual air quality report.” Georgia Regional Transportation Authority,Ga.
Abane, A. M. �1993�. “Tackling traffic congestion in Accra: A road user’sperspective.” J. Adv. Transp., 27�2�.
About. �2004�. �geography.about.com� �accessed June 2004�, About, Inc.Afukaar, F. K., Antwi, P., and Ofosu-Amaah, S. �2003�. “Pattern of road
traffic injuries in Ghana: Implications for control.” Inj. Control SafetyPromotion, 10�1–2�, 69–76.
ASCE. �2003�. “2003 ASCE report card on Georgia infrastructure.”�www.ascega.org/reportcard/07-final-Transit_Brief.pdf�.
ASCE. �2004�. �www.asce.org� �accessed May, 2004�.Ardila, A., and Menckhoff, G. �2002�. “Transportation policies in Bogotá,
Colombia: Building a transportation system for the people.” Transpor-tation Research Record. 1817, Paper No. 02–3858, Transportation Re-search Board, Washington, D.C.
Atlanta Regional Commission �ARC�. �2002�. “Transportation solutionfor a new century: Model documentation �draft�.” Appendix 4, ARC,Atlanta, Ga.
Department of National Statistics. �2004�. �www.dane.gov.co� �accessedMay, 2004�.
Encyclopedia Britannica Online. �2004�. �www.britannica.com/eb/article-55176� �accessed June, 2004�.
Earth Trends. �2004�. “The environmental information portal.” �earth-trends.wri.org� �accessed June, 2004�.
Georgia Department of Community Affairs. �2004�.
�www.dca.state.ga.us/index.asp� �accessed June, 2004�.LANNING AND DEVELOPMENT © ASCE / SEPTEMBER 2006 / 185

Georgia Department of Natural Resources. �2004�. Environmental Protec-tion Division, Air Protection Branch, �www.air.dnr.state.ga.us/amp/index.html� �accessed March, 2004�.
Georgia Department of Public Safety. �2004�. �dps.georgia.gov/02/dps/home/0,2228,5635600,00.html� �accessed June, 2004�.
Georgia Department of Transportation �GDOT�. �2003�. “2003 GeorgiaTransit Program Fact Book.” Office of Intermodal Programs, GDOT,Ga.
Georgia Department of Transportation �GDOT�. �2001�. “StatewideTransportation Plan 2001–2025.” GDOT, Ga.
Georgia Department of Transportation �GDOT�. �2002�. “Annual ReportFiscal Year 2001–2002.” GDOT, Ga.
Georgia Department of Transportation �GDOT�. �2004�. �www.dot.state-.ga.us� �accessed May, 2004�.
Georgia Governor Sonny Perdue. �2004�. �www.gov.state.ga.us/issues_gov/index.shtml� �accessed June 2004�, Atlanta, Ga.
Ghana Statistical Service. �2004�. Accra: National Accident Data, Build-ing and Road Research Institute �www.csir.org.gh/brri.html� �accessedJuly, 2004�.
Governor’s Office of Highway Safety. �2004�. �www.gohs.state.ga.us.��accessed June 2004�.
Graduate School of Architecture and Preservation. �2004�. ColumbiaUniv. �www.arch.columbia.edu/Studio/Spring2003/UP/Accra/html/history.html� �accessed July 2004�.
Gudmundsson, H. �2003�. “Making concepts matter: Sustainable mobilityand indicator systems in transport policy.” Int. Soc. Sci. J., 55�2�,199–217.
IndexMundi. �2004�. �www.indexmundi.com� �accessed July 2004�.International Road Federation. �2004�. World Road Statistics,
�econ.worldbank.org/WBSITE/EXTERNAL/EXTDEC/EXTRESEARCH/0,,contentMDK:20699572~pagePK:64214825~piPK:64214943~theSitePK:469382,00.html� �accessed July 2004�.
Jeon, C. M., and Amekudzi, A. �2005�. “Addressing sustainability intransportation systems: definitions, indicators, and metrics.” J. Infra-struct. Syst., 11�1�, 31–50.
Korea. net. �2004�. �www.korea.net� �accessed May 2004�.Ministry of Construction and Transportation. �2004�. South Korea, �ww-
w.moct.go.kr� �accessed May 2004�.Ministry of Construction and Transportation. �1999�. “Comprehensive na-
tional territorial plan: 2000–2020.” South Korea.Ministry of Environment. �2003�. “Annual Report of Ambient air quality
in Korea 2002.” Annual Rep., Kwachon, South Korea.National Round Table on the Environment and the Economy �NRTEE�.
�2004�. “Prospectus for a Canadian sustainable citiesinitiatives in Accra, Ghana.” �www.nrtee-trnee.ca/eng/programs/
186 / JOURNAL OF URBAN PLANNING AND DEVELOPMENT © ASCE / SE
ArchivedPrograms/Sustainable_Cities/accra_ghana_city_profile.htm��accessed July 2004�.
Nationmaster. com. �2004�. �www.nationmaster.com� �accessed June2004�.
Onursal, B., and Guatam, S. P. �1997�. “Vehicular air pollution: Experi-ences from seven Latin American urban centers.” Technical Paper No.373, World Bank.
Organization for Economic Cooperation and Development �OECD�.�1999�. “Indicators for the integration of environmental concerns intotransport policies.” Environment Directorate, Paris, France.
Rodriguez, D.Y., Fernandez, F. J., and Velasquez, H. A. �2003�. “Roadtraffic injuries in Colombia.” Inj. Conrol Safety Promotion, 10�2�,29–35.
Target Group Index �TGI�. �2004�. �www.zonalatina.com/Zldata98.htm��accessed July 2004�, TGI, IBOPE Colombia.
Texas Transport Institute �TTI�. �2004�. �tti.tamu.edu� �accessed May2004�.
The Intermodal Transportation Database. �2000�. �www.transtats.bts.gov��accessed June 2004�, Bureau of Transportation Statistics.
The Official Ghana Education Homepage. �2004�. �http://www.ghana.edu.gh/prospects/vision.html.� �accessed July 2004�.
The OPEC Fund for International Development. �2004�.�www.opecfund.org/new/press/2004/pr04009.htm� �accessed July2004�.
The World Bank Group. �2002�. �www.worldbank.org/data/countryclass/classgroups.htm� �accessed June 2004�.
United Nations Habitat. �2004�. �www.unhabitat.org/habrdd/conditions/wafrica/ghana.htm� �accessed June 2004�.
U.S. Census Bureau. �2000�. “U.S. Census 2000.” �www.census.gov/main/www/cen2000.html� �accessed June 2004�.
U.S. Department of State Bureau and Consular Affairs. �2004�.�travel.state.gov/colombia.html� �accessed June 2004�.
U.S. Department of State. �2004�. �www.state.gov� �accessed June 2004�.U.S. Environmental Protection Agency �USEPA�. �2000�. “National air
pollutant emission trends, 1900–1998.” EPA-454/R-00-002, Office ofAir Quality, USEPA, Washington, D.C.
Wikipedia. �2004�. Wikimedia Foundation, Inc., �en.wikipedia.org/wiki/United_States� �accessed June 2004�.
World Commission on Environment and Development �WCED�. �1987�.Our common future, Oxford University Press, Oxford, U.K.
World Resources Institute. �2004�. �climate.wri.org/topic_keyissues_text.cfm?cid�1014� �accessed June 2004�.
Yang, B. M., and Kim, J. �2003�. “Road traffic accidents and policyinterventions in Korea.” Inj. Control Safety Promotion, 10�1–2�, 89–94.
PTEMBER 2006
Copyright © 2022 FDOKUMEN

