


Bahasa
Halaman
Hukum


Published online 26 May 2021 Nucleic Acids Research, 2021, Vol. 49, Web Server issue W633–W640https://doi.org/10.1093/nar/gkab424
Thunor: visualization and analysis of high-throughputdose–response datasetsAlexander L.R. Lubbock 1, Leonard A. Harris 2,3,4, Vito Quaranta 1,5, Darren R. Tyson 1
and Carlos F. Lopez 1,5,6,*
1Department of Biochemistry, Vanderbilt University School of Medicine, Nashville, TN, 37232, USA, 2Department ofBiomedical Engineering, University of Arkansas, Fayetteville, AR, 72701, USA, 3Interdisciplinary Graduate Programin Cell and Molecular Biology, University of Arkansas, Fayetteville, AR, 72701, USA, 4Cancer Biology Program,Winthrop P. Rockefeller Cancer Institute, University of Arkansas for Medical Sciences, Little Rock, AR, 72205, USA,5Department of Pharmacology, Vanderbilt University School of Medicine, Nashville, TN, 37232, USA and6Department of Biomedical Informatics, Vanderbilt University Medical Center, Nashville, TN, 37232, USA
Received January 28, 2021; Revised April 25, 2021; Editorial Decision May 03, 2021; Accepted May 04, 2021
ABSTRACT
High-throughput cell proliferation assays to quan-tify drug-response are becoming increasingly com-mon and powerful with the emergence of improvedautomation and multi-time point analysis methods.However, pipelines for analysis of these datasetsthat provide reproducible, efficient, and interactivevisualization and interpretation are sorely lacking.To address this need, we introduce Thunor, anopen-source software platform to manage, analyze,and visualize large, dose-dependent cell prolifera-tion datasets. Thunor supports both end-point andtime-based proliferation assays as input. It providesa simple, user-friendly interface with interactive plotsand publication-quality images of cell proliferationtime courses, dose–response curves, and deriveddose–response metrics, e.g. IC50, including acrossdatasets or grouped by tags. Tags are categorical la-bels for cell lines and drugs, used for aggregation,visualization and statistical analysis, e.g. cell linemutation or drug class/target pathway. A graphicalplate map tool is included to facilitate plate annota-tion with cell lines, drugs and concentrations upondata upload. Datasets can be shared with other usersvia point-and-click access control. We demonstratethe utility of Thunor to examine and gain insightfrom two large drug response datasets: a large, pub-licly available cell viability database and an in-house,high-throughput proliferation rate dataset. Thunor isavailable from www.thunor.net.
GRAPHICAL ABSTRACT
INTRODUCTION
Understanding the effect of drugs and other perturbagenson cell proliferation has relevance to several fields inbiomedicine, most notably in cancer (1,2). Human cell linesprovide a widely available, relatively standardized, and scal-able in vitro system in which such effects can be quanti-fied and compared (3). High throughput screening (HTS)is a framework in which cells can be imaged and countedat scale, across multiple cell lines, drugs and doses usinglarge, robotically automated facilities and more recently us-ing all-in-one incubator and cell imaging devices, e.g. In-cuCyte S3 (Essen Bioscience Inc., Ann Arbor, MI, USA).In these studies, in vitro drug response is traditionally quan-tified in terms of cell viability, i.e. the cell count at a partic-ular time point (usually 72 h) post drug addition as a frac-tion of control (unperturbed) cells (4). Recently, we (5) andothers (6) introduced novel drug-effect metrics based on cel-
*To whom correspondence should be addressed. Tel: +1 615 936 1311; Email: [email protected]
C© The Author(s) 2021. Published by Oxford University Press on behalf of Nucleic Acids Research.This is an Open Access article distributed under the terms of the Creative Commons Attribution License (http://creativecommons.org/licenses/by/4.0/), whichpermits unrestricted reuse, distribution, and reproduction in any medium, provided the original work is properly cited.
Dow
nloaded from https://academ
ic.oup.com/nar/article/49/W
1/W633/6285265 by guest on 24 July 2022
W634 Nucleic Acids Research, 2021, Vol. 49, Web Server issue
lular proliferation rates. These rate-based metrics avoid bi-ases inherent in traditional viability assays, which can pro-duce misleading interpretations, e.g. of cell line sensitivityto drug (5). While estimating proliferation rates is more de-manding than performing traditional end-point assays, newautomated systems (including the IncuCyte) have greatly re-duced this burden. Therefore, for both end-point and time-based measurements, the primary challenge is no longerdata generation but rather dataset management, analysisand visualization at scale. Unfortunately, these tasks ofteninvolve a cumbersome and error-prone workflow involvingprocessing of multiple instrument-exported file types, man-ual aggregation of spreadsheets, and analyses using (oftencostly) commercial software packages or custom code writ-ten in languages such as Matlab, R or Python, which re-quire time and computational skill to set up. Existing graph-ical software is often either specific to certain end-pointonly datasets (7,8) or lacks tools for annotating, storing andsharing datasets as well as interactive, multi-dataset visual-ization and statistics (9).
In this manuscript, we introduce Thunor (THOO-nor),a free software platform to address the challenges of ana-lyzing and visualizing end-point and time-course cell pro-liferation datasets. We provide a description of the softwareand its web interface, inputs, and key features. We demon-strate the utility of Thunor with two case studies. First, weexplore relationships between cell line drug sensitivity, drugpathway/molecular target, and tissue site of origin in thepublicly-available GDSC dataset (10) (we focus on its dose-response data and molecular annotations, while integrationof -omics datasets is planned for a future version). Then,we demonstrate the use of proliferation rate-based data us-ing an in-house, high-throughput proliferation rate screen,and show how Thunor can help check for common qual-ity control issues and explore these data interactively. Wethen provide a brief discussion––methods and software im-plementation are described at the end. Due to significantcomputational demands and the often proprietary natureof dose-response data, Thunor is a self-hosted platform de-signed for in-house use, rather than a centralized web ser-vice. Thunor can be used with a web interface (Thunor Web)or as a Python library (Thunor Core), facilitating collab-oration between programmers and non-programmers. TheThunor software, documentation, and a read-only demon-stration instance are available at www.thunor.net. A ThunorWeb tutorial is available at docs.thunor.net/tutorial.
RESULTS
Software and web server description
Thunor is an open-source software platform that solvesthe storage, sharing, analysis, and visualization challengesof large-scale in vitro drug response datasets––both end-point viability and cell proliferation time courses. The drug-induced proliferation rate (DIP rate) (5) is a quantita-tive metric of cell proliferation calculated from time-coursedata; a set of values obtained from different drug concen-trations can be fit by models of dose–response relationshipsand analyzed in an analogous manner to viability. To ourknowledge, Thunor is the only tool that provides an inter-active graphical interface for both types of data, combined
with a database, group-based dataset sharing, and graphicalannotation tools. A comparison to related software is pro-vided in Supplementary Text S2 and Supplementary TableS1.
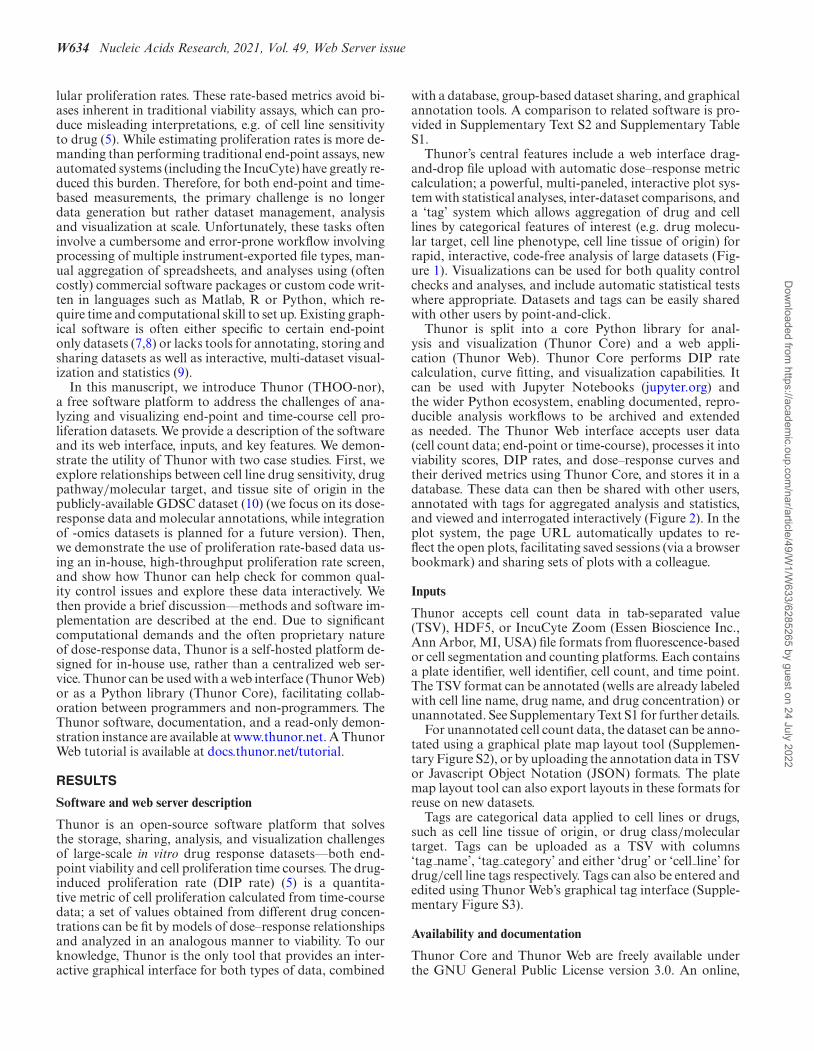
Thunor’s central features include a web interface drag-and-drop file upload with automatic dose–response metriccalculation; a powerful, multi-paneled, interactive plot sys-tem with statistical analyses, inter-dataset comparisons, anda ‘tag’ system which allows aggregation of drug and celllines by categorical features of interest (e.g. drug molecu-lar target, cell line phenotype, cell line tissue of origin) forrapid, interactive, code-free analysis of large datasets (Fig-ure 1). Visualizations can be used for both quality controlchecks and analyses, and include automatic statistical testswhere appropriate. Datasets and tags can be easily sharedwith other users by point-and-click.
Thunor is split into a core Python library for anal-ysis and visualization (Thunor Core) and a web appli-cation (Thunor Web). Thunor Core performs DIP ratecalculation, curve fitting, and visualization capabilities. Itcan be used with Jupyter Notebooks (jupyter.org) andthe wider Python ecosystem, enabling documented, repro-ducible analysis workflows to be archived and extendedas needed. The Thunor Web interface accepts user data(cell count data; end-point or time-course), processes it intoviability scores, DIP rates, and dose–response curves andtheir derived metrics using Thunor Core, and stores it in adatabase. These data can then be shared with other users,annotated with tags for aggregated analysis and statistics,and viewed and interrogated interactively (Figure 2). In theplot system, the page URL automatically updates to re-flect the open plots, facilitating saved sessions (via a browserbookmark) and sharing sets of plots with a colleague.
Inputs
Thunor accepts cell count data in tab-separated value(TSV), HDF5, or IncuCyte Zoom (Essen Bioscience Inc.,Ann Arbor, MI, USA) file formats from fluorescence-basedor cell segmentation and counting platforms. Each containsa plate identifier, well identifier, cell count, and time point.The TSV format can be annotated (wells are already labeledwith cell line name, drug name, and drug concentration) orunannotated. See Supplementary Text S1 for further details.
For unannotated cell count data, the dataset can be anno-tated using a graphical plate map layout tool (Supplemen-tary Figure S2), or by uploading the annotation data in TSVor Javascript Object Notation (JSON) formats. The platemap layout tool can also export layouts in these formats forreuse on new datasets.
Tags are categorical data applied to cell lines or drugs,such as cell line tissue of origin, or drug class/moleculartarget. Tags can be uploaded as a TSV with columns‘tag name’, ‘tag category’ and either ‘drug’ or ‘cell line’ fordrug/cell line tags respectively. Tags can also be entered andedited using Thunor Web’s graphical tag interface (Supple-mentary Figure S3).
Availability and documentation
Thunor Core and Thunor Web are freely available underthe GNU General Public License version 3.0. An online,
Dow
nloaded from https://academ
ic.oup.com/nar/article/49/W
1/W633/6285265 by guest on 24 July 2022
Nucleic Acids Research, 2021, Vol. 49, Web Server issue W635
Figure 1. Thunor Web user workflow. Thunor accepts cell count data from end-point or time course experiments on microtiter (multi-well) plates. Layoutdata (describing cell line, drug and drug concentration metadata) can be included or entered using a graphical interface. Data are automatically processedon upload and stored in a database, where they can be shared with other users, labeled with categorical tags for analysis, or explored using an interactiveplot interface.
open access, read-only demo of Thunor Web is availableat demo.thunor.net, which has been preloaded with the thecase study datasets from this manuscript. A chat room pro-vides an option to ask questions not addressed in the docu-mentation and to contact the authors. These resources areall linked from the Thunor website, thunor.net.
Case study: genomics of drug sensitivity in cancer
The Genomics of Drug Sensitivity in Cancer (GDSC) (1)is a large dataset of cell viability and drug dose–responserelationships. As an example of the utility of Thunor, we
sought to identify drugs targeting cellular processes andpathways that have an outsized effect on collections of celllines, grouped by their primary site/tissue of origin. Tra-ditional analysis would either examine cell lines and drugsindividually, or require custom code to group the data foranalysis (10). Thunor enables these analyses from the graph-ical web interface.
Version 17a of the GDSC dataset (1) was downloadedand converted for use with Thunor HDF5 format (scriptincluded with Thunor Core; see Methods). The converteddataset includes 72 h luminescence-based cell viability as-says for 1074 cell lines and 250 drugs over nine concentra-
Dow
nloaded from https://academ
ic.oup.com/nar/article/49/W
1/W633/6285265 by guest on 24 July 2022
W636 Nucleic Acids Research, 2021, Vol. 49, Web Server issue
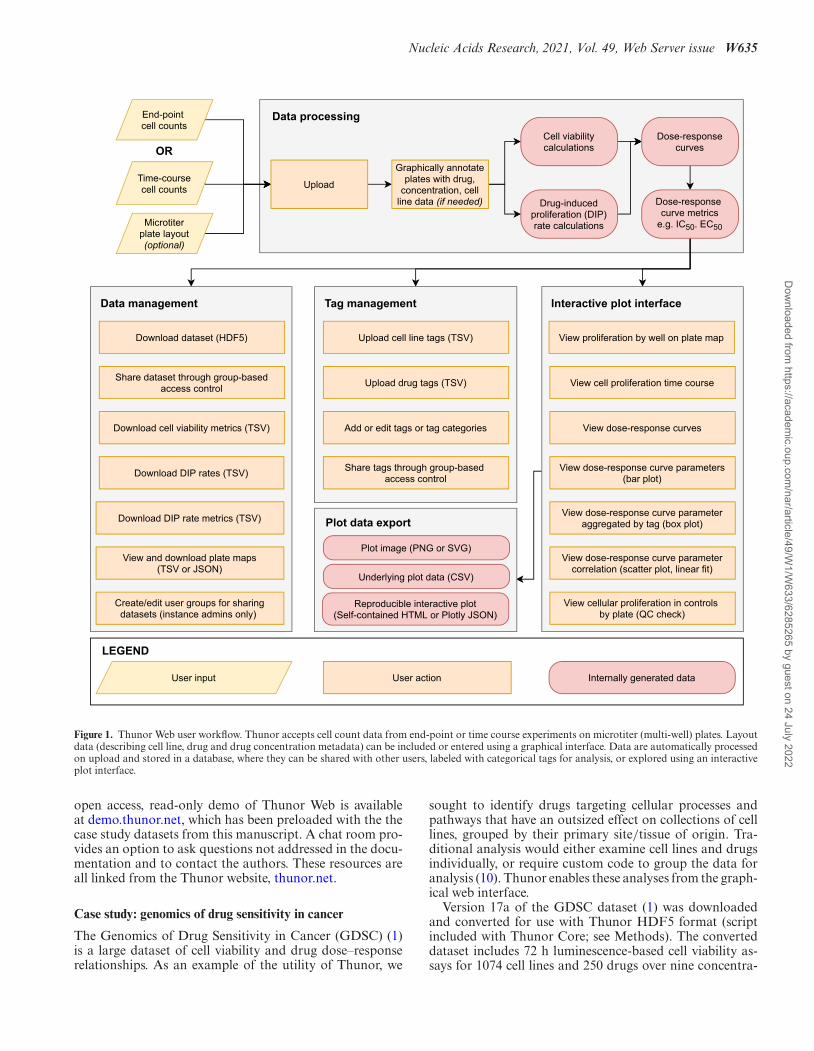
Figure 2. Thunor interactive plot interface. 1. Multi-column layout op-tion. 2. Multi-dataset plot option. 3. Plot toolbar. 4. Download plot images(SVG, PNG) or data (CSV, JSON). 5. Proliferation time course. 6. Auto-matic DIP rate delay detection. 7. Click to show/hide plot traces. 8. Changeplot panel. 9. Flexible data selection and aggregation; by cell line, drug, oruser-defined “tags.” 10. Zoom, pan, and rescale axes. 11. Hover mouse (tapon touch devices) to view underlying data. 12. Comparison of two parame-ters (e.g. IC50 versus EC50), or one parameter across two datasets. 13. Builtin statistical tests. 14. Box plot showing aggregation of cell lines.
tions. Annotation details, including cell lines’ primary site(tissue of origin) and drugs’ molecular targets and path-ways, were similarly obtained, converted into a TSV file andloaded as Thunor tags.
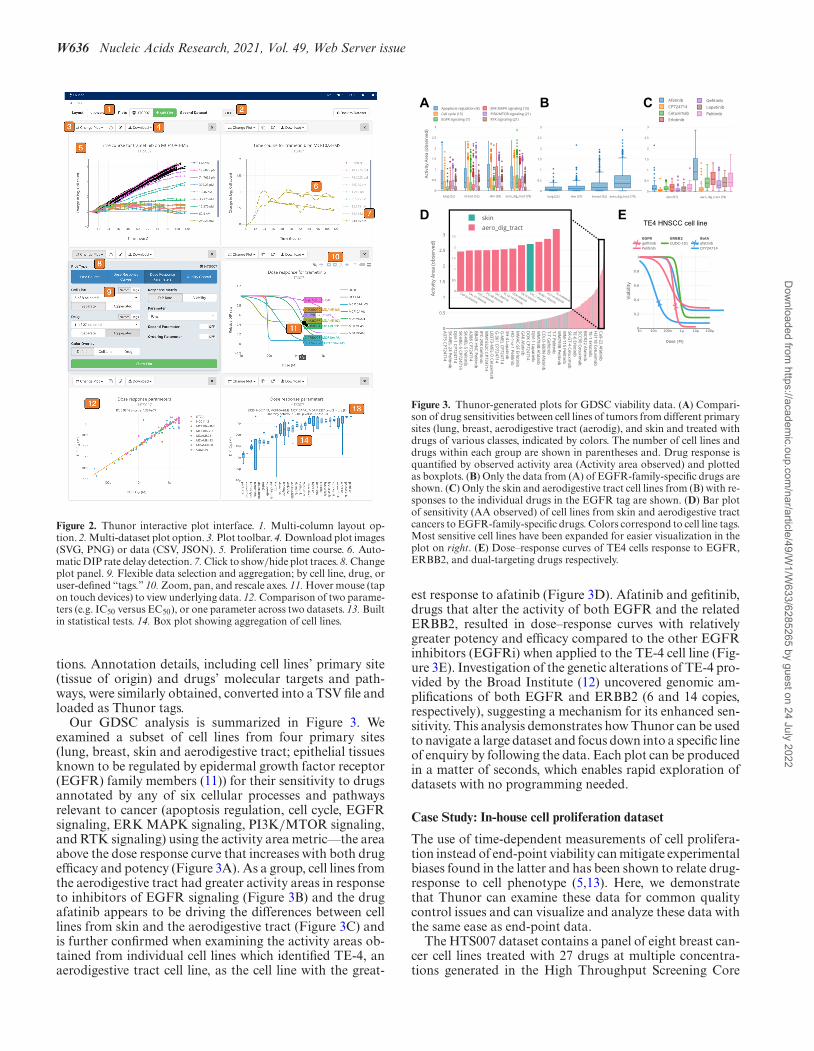
Our GDSC analysis is summarized in Figure 3. Weexamined a subset of cell lines from four primary sites(lung, breast, skin and aerodigestive tract; epithelial tissuesknown to be regulated by epidermal growth factor receptor(EGFR) family members (11)) for their sensitivity to drugsannotated by any of six cellular processes and pathwaysrelevant to cancer (apoptosis regulation, cell cycle, EGFRsignaling, ERK MAPK signaling, PI3K/MTOR signaling,and RTK signaling) using the activity area metric––the areaabove the dose response curve that increases with both drugefficacy and potency (Figure 3A). As a group, cell lines fromthe aerodigestive tract had greater activity areas in responseto inhibitors of EGFR signaling (Figure 3B) and the drugafatinib appears to be driving the differences between celllines from skin and the aerodigestive tract (Figure 3C) andis further confirmed when examining the activity areas ob-tained from individual cell lines which identified TE-4, anaerodigestive tract cell line, as the cell line with the great-
Figure 3. Thunor-generated plots for GDSC viability data. (A) Compari-son of drug sensitivities between cell lines of tumors from different primarysites (lung, breast, aerodigestive tract (aerodig), and skin and treated withdrugs of various classes, indicated by colors. The number of cell lines anddrugs within each group are shown in parentheses and. Drug response isquantified by observed activity area (Activity area observed) and plottedas boxplots. (B) Only the data from (A) of EGFR-family-specific drugs areshown. (C) Only the skin and aerodigestive tract cell lines from (B) with re-sponses to the individual drugs in the EGFR tag are shown. (D) Bar plotof sensitivity (AA observed) of cell lines from skin and aerodigestive tractcancers to EGFR-family-specific drugs. Colors correspond to cell line tags.Most sensitive cell lines have been expanded for easier visualization in theplot on right. (E) Dose–response curves of TE4 cells response to EGFR,ERBB2, and dual-targeting drugs respectively.
est response to afatinib (Figure 3D). Afatinib and gefitinib,drugs that alter the activity of both EGFR and the relatedERBB2, resulted in dose–response curves with relativelygreater potency and efficacy compared to the other EGFRinhibitors (EGFRi) when applied to the TE-4 cell line (Fig-ure 3E). Investigation of the genetic alterations of TE-4 pro-vided by the Broad Institute (12) uncovered genomic am-plifications of both EGFR and ERBB2 (6 and 14 copies,respectively), suggesting a mechanism for its enhanced sen-sitivity. This analysis demonstrates how Thunor can be usedto navigate a large dataset and focus down into a specific lineof enquiry by following the data. Each plot can be producedin a matter of seconds, which enables rapid exploration ofdatasets with no programming needed.
Case Study: In-house cell proliferation dataset
The use of time-dependent measurements of cell prolifera-tion instead of end-point viability can mitigate experimentalbiases found in the latter and has been shown to relate drug-response to cell phenotype (5,13). Here, we demonstratethat Thunor can examine these data for common qualitycontrol issues and can visualize and analyze these data withthe same ease as end-point data.
The HTS007 dataset contains a panel of eight breast can-cer cell lines treated with 27 drugs at multiple concentra-tions generated in the High Throughput Screening Core
Dow
nloaded from https://academ
ic.oup.com/nar/article/49/W
1/W633/6285265 by guest on 24 July 2022
Nucleic Acids Research, 2021, Vol. 49, Web Server issue W637
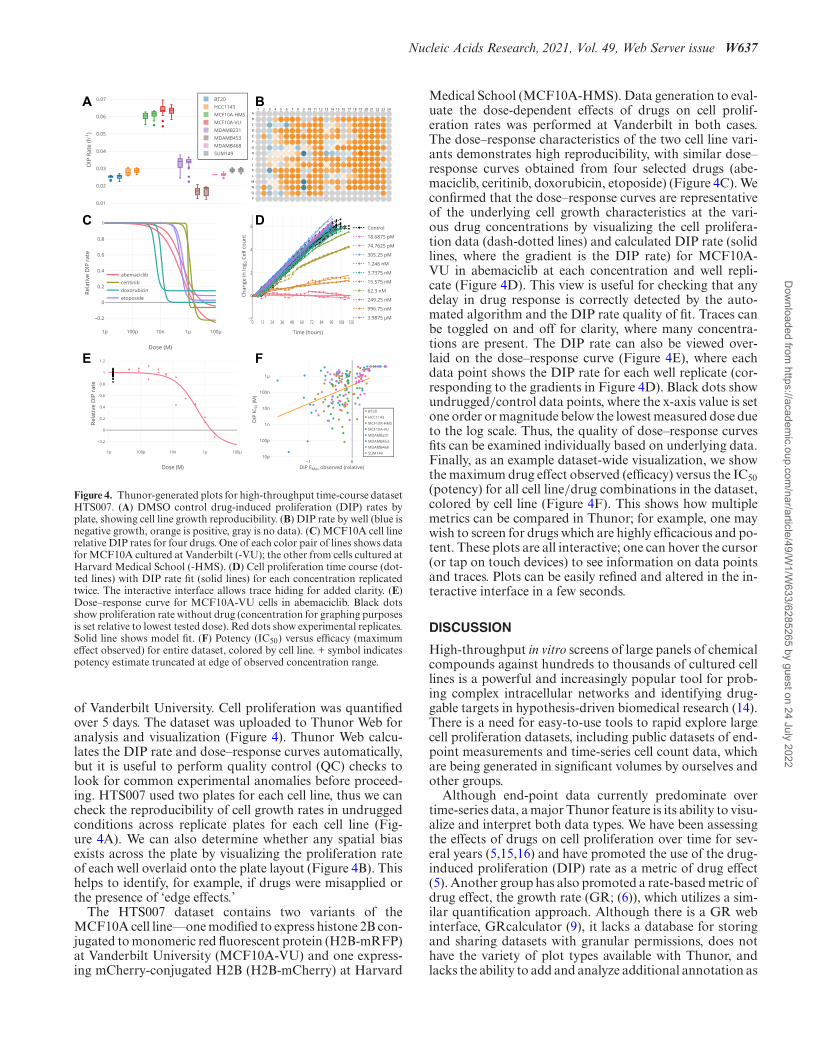
Figure 4. Thunor-generated plots for high-throughput time-course datasetHTS007. (A) DMSO control drug-induced proliferation (DIP) rates byplate, showing cell line growth reproducibility. (B) DIP rate by well (blue isnegative growth, orange is positive, gray is no data). (C) MCF10A cell linerelative DIP rates for four drugs. One of each color pair of lines shows datafor MCF10A cultured at Vanderbilt (-VU); the other from cells cultured atHarvard Medical School (-HMS). (D) Cell proliferation time course (dot-ted lines) with DIP rate fit (solid lines) for each concentration replicatedtwice. The interactive interface allows trace hiding for added clarity. (E)Dose–response curve for MCF10A-VU cells in abemaciclib. Black dotsshow proliferation rate without drug (concentration for graphing purposesis set relative to lowest tested dose). Red dots show experimental replicates.Solid line shows model fit. (F) Potency (IC50) versus efficacy (maximumeffect observed) for entire dataset, colored by cell line. + symbol indicatespotency estimate truncated at edge of observed concentration range.
of Vanderbilt University. Cell proliferation was quantifiedover 5 days. The dataset was uploaded to Thunor Web foranalysis and visualization (Figure 4). Thunor Web calcu-lates the DIP rate and dose–response curves automatically,but it is useful to perform quality control (QC) checks tolook for common experimental anomalies before proceed-ing. HTS007 used two plates for each cell line, thus we cancheck the reproducibility of cell growth rates in undruggedconditions across replicate plates for each cell line (Fig-ure 4A). We can also determine whether any spatial biasexists across the plate by visualizing the proliferation rateof each well overlaid onto the plate layout (Figure 4B). Thishelps to identify, for example, if drugs were misapplied orthe presence of ‘edge effects.’
The HTS007 dataset contains two variants of theMCF10A cell line––one modified to express histone 2B con-jugated to monomeric red fluorescent protein (H2B-mRFP)at Vanderbilt University (MCF10A-VU) and one express-ing mCherry-conjugated H2B (H2B-mCherry) at Harvard
Medical School (MCF10A-HMS). Data generation to eval-uate the dose-dependent effects of drugs on cell prolif-eration rates was performed at Vanderbilt in both cases.The dose–response characteristics of the two cell line vari-ants demonstrates high reproducibility, with similar dose–response curves obtained from four selected drugs (abe-maciclib, ceritinib, doxorubicin, etoposide) (Figure 4C). Weconfirmed that the dose–response curves are representativeof the underlying cell growth characteristics at the vari-ous drug concentrations by visualizing the cell prolifera-tion data (dash-dotted lines) and calculated DIP rate (solidlines, where the gradient is the DIP rate) for MCF10A-VU in abemaciclib at each concentration and well repli-cate (Figure 4D). This view is useful for checking that anydelay in drug response is correctly detected by the auto-mated algorithm and the DIP rate quality of fit. Traces canbe toggled on and off for clarity, where many concentra-tions are present. The DIP rate can also be viewed over-laid on the dose–response curve (Figure 4E), where eachdata point shows the DIP rate for each well replicate (cor-responding to the gradients in Figure 4D). Black dots showundrugged/control data points, where the x-axis value is setone order or magnitude below the lowest measured dose dueto the log scale. Thus, the quality of dose–response curvesfits can be examined individually based on underlying data.Finally, as an example dataset-wide visualization, we showthe maximum drug effect observed (efficacy) versus the IC50(potency) for all cell line/drug combinations in the dataset,colored by cell line (Figure 4F). This shows how multiplemetrics can be compared in Thunor; for example, one maywish to screen for drugs which are highly efficacious and po-tent. These plots are all interactive; one can hover the cursor(or tap on touch devices) to see information on data pointsand traces. Plots can be easily refined and altered in the in-teractive interface in a few seconds.
DISCUSSION
High-throughput in vitro screens of large panels of chemicalcompounds against hundreds to thousands of cultured celllines is a powerful and increasingly popular tool for prob-ing complex intracellular networks and identifying drug-gable targets in hypothesis-driven biomedical research (14).There is a need for easy-to-use tools to rapid explore largecell proliferation datasets, including public datasets of end-point measurements and time-series cell count data, whichare being generated in significant volumes by ourselves andother groups.
Although end-point data currently predominate overtime-series data, a major Thunor feature is its ability to visu-alize and interpret both data types. We have been assessingthe effects of drugs on cell proliferation over time for sev-eral years (5,15,16) and have promoted the use of the drug-induced proliferation (DIP) rate as a metric of drug effect(5). Another group has also promoted a rate-based metric ofdrug effect, the growth rate (GR; (6)), which utilizes a sim-ilar quantification approach. Although there is a GR webinterface, GRcalculator (9), it lacks a database for storingand sharing datasets with granular permissions, does nothave the variety of plot types available with Thunor, andlacks the ability to add and analyze additional annotation as
Dow
nloaded from https://academ
ic.oup.com/nar/article/49/W
1/W633/6285265 by guest on 24 July 2022
W638 Nucleic Acids Research, 2021, Vol. 49, Web Server issue
with Thunor’s tagging system. Few other software packageshave the ability to utilize time-series cell proliferation data.We provide an extended comparison of Thunor with thisand other software in the supplementary information (TextS2, Supplementary Table S1), but we believe Thunor addssignificant value over the alternatives. Its interactive naturefacilitates rapid exploration of any size dataset, and allowsfollow-up questions and hypotheses to be formed and inves-tigated with a few clicks.
We anticipate that Thunor will stimulate collaborationbetween researchers, ease the exchange of drug-responsedata, and improve analysis reproducibility and trans-parency. Thunor is an active project and we encourage in-put and contributions from the research community. Ex-tensions under consideration include drug combination re-sponse modeling, additional statistical analyses, improvedquality control checks on data upload, integration of -omicsdatasets (e.g. RNA-seq) to explore molecular correlates ofdrug sensitivity, and alternative metrics of drug response(e.g., GR, cell death kinetics) (6,17).
METHODS AND IMPLEMENTATION
HTS007 dataset
The HTS007 dataset (Data file S2) contains a panel of eightbreast cancer cell lines treated with 27 drugs at multiple con-centrations (4-fold dilutions). Each cell line was modified toexpress fluorescent histone 2B (H2BmRFP) to enable detec-tion of nuclei via fluorescence microscopy. Cells were im-aged by automated fluorescence microscopy approximatelyevery four hours over five days in the Vanderbilt UniversityHigh Throughput Screening Core. Nuclei were quantifiedby automatic image segmentation. The dataset is includedin the online demo (demo.thunor.net).
DIP rate calculation
The DIP rate is defined (5) as the gradient of the log2 cellcount over time, after any initial stabilization period. Thestabilization period is determined by iteratively excludingmore time points from the beginning of the time course,evaluating goodness of fit at each step using linear regres-sion, the root-mean-square error (RMSE) and adjustedR squared (ARSQ) are calculated. The final time point setis selected as follows:
arg maxm∈1..(N−1)
m ARSQ(X) · (1 − RMSE(X))2 · (n − 3)0.25
where X is the model fit, N is the number of time pointsavailable for the well, m is the index of first time point usedfor the fit, n = N − m + 1 is the number of time points usedfor the DIP fit on the current iteration, and fit is a linear re-gression fit to the data points m..N. A minimum of two timepoints is required for a DIP rate fit (five or more is stronglyrecommended). When exactly two time points are present,the iterative procedure is skipped and the linear regressionfit is used.
Viability calculation
For viability calculations on multi-time point datasets, theclosest time point to 72 h is used. In the Thunor plot in-
terface, the time point used can be verified by hovering thecursor over a viability data point in a dose–response curve.Viability is calculated as the ratio of the cell count in a wellto the mean of the matched control wells’ cell counts at thesame time point. Control wells are defined as wells on thesame plate, using the same cell line, but with no drugs addedto the well.
Dose–response curves
Dose–response curves are fitted using a log-logistic functionwith three (viability) or four (DIP rate) parameters,
f (X, b, c, d, e) = c + d − c1 + eb(ln X−ln e)
.
where X is a vector of concentration values and b (Hillslope), c (Emax), d (E0) and e (EC50) are fit parameters. Inthe three-parameter case, d is set to 1 because viability isrelative to control, i.e., the effect at zero drug concentrationis, by definition, the control viability. The curve fitting is per-formed using the curve fit function in SciPy (scipy.org).Initial values for the fit parameters are estimated from thedata using the same approach as the four-parameter log-logistic (LL.4) function in the drc R package (18).
In the DIP rate case, the curve fit function selects aleast squares fit using the Levenberg-Marquadt algorithm(19). The fit residuals are defined as
R = Y − f (X, P),
where Y is a vector of response values (i.e. DIP rate), X is avector of drug concentrations, P is the set of fit parameters,and f is the log-logistic fit function defined previously. Thestandard error of DIP rate data points is incorporated intothe fit by minimizing
χ2 =∑r∈R
( rσ
)2,
where � is the standard error of a response value. Both con-trol and experiment DIP rate values are used in the curvefit. Since the fit takes place in log2(concentration) space, anon-zero dose must be assigned to controls (log (0) is unde-fined). We set the concentration of controls to ten-fold lessthan the lowest concentration in X. The curve fit is replacedwith a “no effect” model (shown as a horizontal dashed linein plots) if the dose–response curve is not significantly dif-ferent from that no effect model (F-test, p<0.05). The fit isrejected (no dose–response curve shown) if any of the fol-lowing occur: a numerical error occurs in the curve fitfunction, the fit EC50 is less than the minimum concentra-tion observed, or the fit E0 is greater than the mean plus onestandard deviation of the control data points’ DIP rate val-ues (where at least five control data points are used in the fit)or greater than 1.2 × the mean of the control data points’DIP rates (otherwise).
In the viability case, the sum-of-squared-residuals R isminimized directly. Dose–response curves are fitted withparameter constraints by the Trust Region Reflective algo-rithm (20). The parameter constraints are that Hill slope bmust be positive, and Emax must be between 0 and 1 sinceviability cannot be negative.
Dow
nloaded from https://academ
ic.oup.com/nar/article/49/W
1/W633/6285265 by guest on 24 July 2022
Nucleic Acids Research, 2021, Vol. 49, Web Server issue W639
The calculation of derived dose–response curve param-eters like IC50 and activity area, and the available statisti-cal analysis for different plot types, are covered in Supple-mentary Text S1. The difference between activity area basedon the dose–response curve and activity area ‘observed’ isshown in Supplementary Figure S4.
Thunor implementation
Thunor Core is a Python library, which provides corefunctionality, including structuring dose–response data andcurve fit parameters using the Pandas library, automati-cally calculating DIP rate, fitting dose–response curve mod-els, and plotting. Thunor Core can be used standalone, in-tegrated into other processing pipelines, or utilized withinJupyter notebooks (jupyter.org), as shown in the ThunorCore online tutorial (part of the Thunor Core documenta-tion, core.thunor.net). Thunor Web is built on Thunor Core,and is also written in Python using the Django web frame-work. It is deployed using Docker Compose, together with aPostgreSQL database, Redis database and nginx web server.A script is included for easy deployment. An extended de-scription of the software implementation and links to soft-ware dependencies are given in Supplementary Text S1; thearchitecture is shown in Supplementary Figure S1.
Software installation and tutorial
Thunor Core is available from the Python Package In-dex (PyPI) with the command pip install thunor. Itsupports Python ≥3.6.
Thunor Web is installed using Git (git-scm.com) andDocker Compose (docs.docker.com/compose). For conve-nience, a Python script is provided which automates the de-ployment process, including database initialization, creatingan admin user, and adding transport layer security (TLS)encrypted connections, if desired, using Certbot (certbot.eff.org). Installation instructions are provided in Supple-mentary Text S3. An online tutorial is available at docs.thunor.net/tutorial.
Both tools are compatible with Windows, Mac, andLinux. Smaller datasets (e.g., HTS007) require minimal re-sources; however for larger datasets like GDSC, a modernprocessor and 16GB RAM or more are recommended.
GDSC and CTRP format conversion
The GDSC dataset v17a (10) was converted using a scriptincluded with Thunor Core. Instructions are given in Sup-plementary Text S4, where we also describe how to use theincluded conversion script for the Cancer Therapeutics Re-sponse Portal (CTRP) v2.0 dataset (2).
SUPPLEMENTARY DATA
Supplementary Data are available at NAR Online.
ACKNOWLEDGEMENTS
We gratefully acknowledge technical assistance fromJ.A. Bauer at the Vanderbilt High Throughput Screen-ing Core; M. Hafner and P.K. Sorger at Harvard Medical
School for providing cell lines and drugs; C.M. Lovly foraccess to IncuCyte instrument and data; and C.E. Hayford,C. Meyer and D. Westover for useful discussions. We thankO.O. Ortega, Y. Papanna Suresh and P. Wasdin for testingand helpful feedback.
FUNDING
National Science Foundation [1411482, 1942255 toC.F.L.]; National Cancer Institute [U01CA215845,U54CA217450 to V.Q. and C.F.L., R50CA243783 toD.R.T., K22CA237857 to L.A.H.]; National Libraryof Medicine [5T15-LM007450-14 to L.A.H.]; DefenseAdvanced Research Projects Agency [Cooperative Agree-ment no. W911 NF-14-2-0022 to C.F.L.]. Fundingfor open access charge: National Science Foundation[1411482, 1942255 to C.F.L.]; National Cancer Insti-tute [U01CA215845, U54CA217450 to V.Q. and C.F.L.,R50CA243783 to D.R.T., K22CA237857 to L.A.H.];National Library of Medicine [5T15-LM007450-14 toL.A.H.]; Defense Advanced Research Projects Agency[Cooperative Agreement no. W911 NF-14-2-0022 toC.F.L.].Conflict of interest statement. None declared.
REFERENCES1. Yang,W., Soares,J., Greninger,P., Edelman,E.J., Lightfoot,H.,
Forbes,S., Bindal,N., Beare,D., Smith,J.A., Thompson,I.R. et al.(2013) Genomics of Drug Sensitivity in Cancer (GDSC): a resourcefor therapeutic biomarker discovery in cancer cells. Nucleic AcidsRes., 41, D955–D961.
2. Basu,A., Bodycombe,N.E., Cheah,J.H., Price,E.V., Liu,K.,Schaefer,G.I., Ebright,R.Y., Stewart,M.L., Ito,D., Wang,S. et al.(2013) An interactive resource to identify cancer genetic and lineagedependencies targeted by small molecules. Cell, 154, 1151–1161.
3. Ghandi,M., Huang,F.W., Jane-Valbuena,J., Kryukov,G.V., Lo,C.C.,McDonald,E.R., Barretina,J., Gelfand,E.T., Bielski,C.M., Li,H. et al.(2019) Next-generation characterization of the Cancer Cell LineEncyclopedia. Nature, 569, 503–508.
4. Holbeck,S.L., Collins,J.M. and Doroshow,J.H. (2010) Analysis ofFood and Drug Administration-approved anticancer agents in theNCI60 panel of human tumor cell lines. Mol. Cancer Ther., 9,1451–1460.
5. Harris,L.A., Frick,P.L., Garbett,S.P., Hardeman,K.N., Paudel,B.B.,Lopez,C.F., Quaranta,V. and Tyson,D.R. (2016) An unbiased metricof antiproliferative drug effect in vitro. Nat. Methods, 13, 497–500.
6. Hafner,M., Niepel,M., Chung,M. and Sorger,P.K. (2016) Growthrate inhibition metrics correct for confounders in measuringsensitivity to cancer drugs. Nat. Methods, 13, 521–527.
7. Smirnov,P., Kofia,V., Maru,A., Freeman,M., Ho,C., El-Hachem,N.,Adam,G.-A., Ba-alawi,W., Safikhani,Z. and Haibe-Kains,B. (2017)PharmacoDB: an integrative database for mining in vitro anticancerdrug screening studies. Nucleic Acids Res., 46, D994–D1002.
8. Luna,A., Elloumi,F., Varma,S., Wang,Y., Rajapakse,V.,Aladjem,M.I., Robert,J., Sander,C., Pommier,Y. and Reinhold,W.C.(2021) CellMiner Cross-Database (CellMinerCDB) version 1.2:exploration of patient-derived cancer cell line pharmacogenomics.Nucleic Acids Res., 49, D1083–D1093.
9. Clark,N.A., Hafner,M., Kouril,M., Williams,E.H., Muhlich,J.L.,Pilarczyk,M., Niepel,M., Sorger,P.K. and Medvedovic,M. (2017)GRcalculator: an online tool for calculating and miningdose–response data. BMC Cancer, 17, 698.
10. Garnett,M.J., Edelman,E.J., Heidorn,S.J., Greenman,C.D.,Dastur,A., Lau,K.W., Greninger,P., Thompson,I.R., Luo,X.,Soares,J. et al. (2012) Systematic identification of genomic markers ofdrug sensitivity in cancer cells. Nature, 483, 570–575.
Dow
nloaded from https://academ
ic.oup.com/nar/article/49/W
1/W633/6285265 by guest on 24 July 2022
W640 Nucleic Acids Research, 2021, Vol. 49, Web Server issue
11. Kari,C., Chan,T.O., Rocha de Quadros,M. and Rodeck,U. (2003)Targeting the epidermal growth factor receptor in cancer: apoptosistakes center stage. Cancer Res., 63, 1–5.
12. The Broad Institute of MIT & Harvard (2021) https://portals.broadinstitute.org/ccle/page?cell line=TE4 OESOPHAGUS, (26January 2021, date last accessed).
13. Hafner,M., Niepel,M. and Sorger,P.K. (2017) Alternative drugsensitivity metrics improve preclinical cancer pharmacogenomics.Nat. Biotechnol., 35, 500–502.
14. Macarron,R., Banks,M.N., Bojanic,D., Burns,D.J., Cirovic,D.A.,Garyantes,T., Green,D. V.S., Hertzberg,R.P., Janzen,W.P., Paslay,J.W.et al. (2011) Impact of high-throughput screening in biomedicalresearch. Nat. Rev. Drug Discov., 10, 188–195.
15. Quaranta,V., Tyson,D.R., Garbett,S.P., Weidow,B., Harris,M.P. andGeorgescu,W. (2009) Trait variability of cancer cells quantified by
high-content automated microscopy of single cells. Method.Enzymol., 467, 23–57.
16. Tyson,D.R., Garbett,S.P., Frick,P.L. and Quaranta,V. (2012)Fractional proliferation: a method to deconvolve cell populationdynamics from single-cell data. Nat. Methods, 9, 923–928.
17. Inde,Z., Forcina,G.C., Denton,K. and Dixon,S.J. (2020) Kineticheterogeneity of cancer cell fractional killing. Cell Rep., 32, 107845.
18. Ritz,C., Baty,F., Streibig,J.C. and Gerhard,D. (2015) Dose-responseanalysis using R. PLoS One, 10, e0146021.
19. Levenberg,K. (1944) A method for the solution of certain non-linearproblems in least squares. Q. Appl. Math., 2, 164–168.
20. Branch,M., Coleman,T. and Li,Y. (1999) A subspace, interior, andconjugate gradient method for large-scale bound-constrainedminimization problems. SIAM J. Sci. Comput., 21, 1–23.
Dow
nloaded from https://academ
ic.oup.com/nar/article/49/W
1/W633/6285265 by guest on 24 July 2022
Top Related
Copyright © 2022 FDOKUMEN

