


Bahasa
Halaman
Hukum


1
CHAPTER I
INTRODUCTION
This chapter presents: (a) background; (b) problem of study; (c) objective
of the study; (d) significances of the study; (e) hypotheses of the study; and (f)
criteria of testing the hypotheses.
A. Background
Language is a basic for human in communication. According to Scarino
and Liddicoat (2009, p. 2), language is something that people do in their daily
lives dan something they use to express, create and interpret meanings and also
estblish and maintain social and interpersonal relationships. It is a means of
communication for individuals that bring them into relationship with their
environment. Language can become a bridge to connect one another that live in
different places and cultures. Amberg and Vause (2012, p. 2) state that in every
social context, language always becomes a means for communication. We express
our feelings, thought, stimulate action and reaction through language. Therefore,
without language people cannot live and communicate with each other.
One of the languages that people use in communication is English. It
becomes popular than other languages. Most fields of life in the world, such as
education, business, sport, science, medicines, and technology use English.
Meanwhile, in Indonesia, English serves as a foreign language. According to
Richards and Renandya (2002, p. 1), English in different parts of the world where
it is not a native language may have the status of either a “second” or a “foreign”

2
language. In the former case, it is language that it is widely used in society and
learners need to acquire English in order to survive in society.
Indonesia as a developed country uses English as a foreign language. It is
taught in every level from elementary up to university. In the process of teaching
and learning English as a foreign language, there are four language skills that
should be learnt by the students, namely listening, speaking, reading and writing.
It means the students should master in all of four basic skills to make them easily
practice and use language. One of the important skills is reading.
Reading is an important skill that needs to be developed in learning and
teaching activities because people get many knowledge and information by
reading. Medina (2012, p. 81) says that for academic purposes, reading is
important because it is one of the most freuquently used language skills in
everday life to get the information. Reading also has important function for the
students in education field. Kyzykeeva (2006, p. 1) states that reading is the most
importatnt academic language skill for foreign language students. It means that,
students need to be exercised in order to have a good reading skill.
Reading implies both a writer and a reader. When reading the students
need to figure out what is being read. Nunan (2006, p. 69) defines that reading is a
set of skills that involves making sense and deriving meaning from the printed
word. In order to read, we must be able to decode (sound out) the printed words
and also comprehend what we read.
In this research, the writer chose SMP Muhammadiyah 6 Palembang as the
population. The reason for choosing SMP Muhammadiyah 6 Palembang

3
especially for the eighth grade students is because the writer found that the
students had problems in learning English especially in reading skill. Based on the
writer’s interview with one of the the teachers of English and preliminary study to
the class of the eighth grade students at SMP Muhammadiyah 6 Palembang, the
writer faced that the students often get difficulties in reading for some reasons.
Firstly, students got difficulty to comprehend the text because of having lack of
vocabulary. Secondly, students felt that English text is too difficult in order they
were lazy to read the text. The last, students had low motivation in English
learning process.
The problems stated above may be caused by an inappropriate teaching
tehnique or strategy used when the teacher attempted to explain reading material.
In reading class, the teacher just explained a subject in the text book and asked
students to read the text whether silently or loudly, and then students have to
answer some questions that follow. Consequently, reading lesson becomes
monotonous and boring. The English of teacher needs to think of some ways to
improve the condition. In order to develop the learners' reading comprehension,
the teachers are hoped to be more creative in choosing the teaching strategies so
that the learning goal will be achieved. There are some kinds of strategies that can
be applied by the teacher of English in teaching reading.
Regarding this condition, the writer wants to apply one of the strategies
which is called “That Was Then This Is Now Strategy. It is developed by Judy
Tilton Brunner”. That Was Then This Is Now Strategy is a strategy that was
designed to encourage students to think about what they already know, relate the

4
information to what they read from a text and to visualize the text content
(Brunner, 2011, p. 91).
Based on the reasons above, the writer interested to do the research under
the title “Teaching Reading Comprehension by Using That Was Then This Is Now
Strategy to the Eighth Grade Students of SMP Muhammadiyah 6 Palembang”.
B. Problem of the Study
The problem of the study is formulated as follows “Is there any
significant difference on students’ reading comprehension achievement taught
using That Was Then This Is Now Strategy and Teacher’s Method to the Eighth
Grade Students of SMP Muhammadiyah 6 Palembang?”
C. Objective of the Study
Based on the problem above, the objectives of this study is to find out
whether or not there is any significant difference on students’ reading
comprehension achievement taught using That Was Then This Is Now Strategy
and Teacher’s Method to the Eighth Grade Students of SMP Muhammadiyah 6
Palembang.
D. Significance of the Study
The writer really expects that this study will be useful and can give
contribution to some parties, as follow:
1. For the English teacher, they can use this strategy as one of the ways to increase
students’ comprehension in reading skill. It encourages the teachers to develop

5
their creativity and useful as a reference for English teachers to apply in the class
sand help the teachers to create the situation to be more active and interesting.
2. For the students, the use of this strategy in the teaching and learning process
will surely attract the students’ attention to study. The students are motivated to
read as they get new information from the text given. Moreover, their vocabulary
mastery will be increased as a result the students’ English reading comprehension
is improved.
3. For the researcher, this research can enlarge her knowledge, get some
expreriences, and it is expected to be one of the references in teaching reading
comprehension to the students. It can be applied when she becomes a teacher in
the future. This research also would be benefit to the other researchers who want
to have further study on reading activities.
4. For the school, the outcome of this reseach is expected to be source of
information for the school to improve teaching techniques in encouraging
students’ reading comprehension in English.
E. Hypotheses
The writer proposed two hypotheses in this research. They are Null
Hypothesis (Ho) and the Alternative Hypothesis (Ha).
1. Ho: There is no a significant difference on students’ reading comprehension
achievement taught using That Was Then This Is Now Strategy and Teacher’s
Method to the Eighth Grade Students of SMP Muhammadiyah 6 Palembang.

6
2. Ha: There is a significant difference on students’ reading comprehension
achievement taught using That Was Then This Is Now Strategy and Teacher’s
Method to the Eighth Grade Students of SMP Muhammadiyah 6 Palembang.
F. Criteria of Testing the Hypotheses
To prove research problem, testing research hypothesis is required as
follows:
1. If the p-output (sig. 2-tailed) is lower than 0.05, the null hypothesis (Ho) is
rejected and the alternative hypothesis ( Ha) is accepted.
2. If the p-output (sig. 2-tailed) is higher than 0.05, the null hypothesis (Ho) is
accepted and the alternative hypothesis (Ha) is rejected.

7
CHAPTER II
LITERATURE REVIEW
This chapter presents: (a) theoritical framework; (b) previous related
studies; and (c) research setting.
A. Theoretical Framework
This chapter discusses: (1) concept of teaching; (2) concept of reading; (3)
concept of reading comprehension; (4) concept of narrative text; (5) concept of
That Was Then This Is Now strategy; (6) teaching procedures by using That Was
Then This Is Now strategy; (7) the advantages of That Was Then This Is Now
strategy; and (8) teaching procedures by using teacher’s method.
1. Concept of Teaching
There will be a teaching and learning process which always happened
between teacher and students as the initial part of the activity. Teaching is
considered the process of explaining or transforming knowledge and helping the
learners to learn the material that is related to the topic while the process of
teaching and learning take place. According to Brown (2007, pp. 7-8), teaching is
showing or helping someone to learn how to do something, giving instructions,
guiding in the study of something, providing with knowledge, causing to know or
understand. An article from Al-Quran also mentions that:

8
لو عليكم آياتنا ويـزكيكم كما أرسلنا فيكم رس وال منكم يـتـ ويـعلمكم الكتاب واحلكمة ويـعلمكم ما مل تكونوا تـعلمون “... that a similar (favor we have already received) in that we have sent among you a messenger of your own, rehearsing to you our signs, and sanctifying you, and instructing you in Scripture and Wisdom, and instructing you what you do not know yet”. (Surah Al-Baqarah verse:151).
Based on the verse above, God has given the advantages and favors to all
of the believers in general and those who believe the Prophet Muhammad. God
sent a Messengger among us to instruct about knowledge, so that we are easy to
understand everything. We also can watch his behavior to be followed and
emulated his deeds. He teaches us (the Qur’an) as well as the laws of God. In
order, we will know about something that we never know before. In addition,
teaching is the actions of someone who is trying to assist others to reach their
fullest potential in all aspects of development (Moore, 2005, p. 4). It means that
teaching is an activity which is done by the teacher to help the learners in learning
to get some knowledge. Moore (2005, p. 4) states that the result of teaching
process is to having a deep knowledge of the subject matter and a solid
understanding of the principles of teaching and learning.
From the explanations above, it can be concluded that teaching is the
process of transfering the knowledge and guiding the learner to do something
involving classroom which takes place between teacher and students, in order to
help students understand and develop their ability in learning process.

9
2. Concept of Reading
Reading is an active process to get information through written language.
In other word, it can be said that reading is an interactive process that goes on
between the reader and the text, resulting in comprehension. The text presents
letter, words, sentences, and paragraph that encode meaning. Reading also is very
important activity in human’s life. This is due to the fact that people mostly get
information through reading. The following are some definition of reading
proposed by some experts. It will be explained below.
According to Manzo and Manzo (1995, p. 10), reading is comprehending,
interpreting, and applying textual material. It means that, the reader brings a great
deal of information and experience to the page and the reader has to involve the
comprehension to get information in the text. Meanwhile, Nunan (2006, p. 69)
defines that reading is a set of skill that involves making sense and deriving
meaning from printed word. In other word, reading is one of the skills that help
the reader to get the meaning from the text provided.
Furthermore, Aebersold and Field (1997) cited in Rahmawati (2010, p.
69) stated that reading is what happens when people look at the text and assign
meaning to the written symbols in the text, further, the text and the reader are two
physical entities necessary for the reading process to begin. Thus, there is an
interaction between the text and the reader that organize actual reading. It means
that, reading is the activity in which one does not only watch words written on the
paper in order she/he has to look for the meaning intended by the writer of the
text they have just read.

10
In addition, Pang, et.al., (2003, p. 6) state that reading is about
understanding written texts. It is a complex activity that involves both perception
and thought. Reading consists of two relates processes: word recognition and
comprehension. Further, they explain that word recognition refers to the process
of perceiving how written symbols correspond to one’s spoken language. Then,
comprehension refers to the process of making sense of words, sentences and
connected text. They also state that the reader tipically make use of background
knowledge, vocabulary, grammatical knowledge, experience with text and other
strategies to help them understand written text.
Based on the theories above, it can be concluded that reading is an active
process that needs understanding to obtain ideas or meaning from a text, which is
symbolized in written or printed language. Moreover, reading is a process of
communication between the reader and the written text in the way of getting the
author’s message from the text.
3. Concept of Reading Comprehension
Reading is reffering of the activity of pronouncing the printed material of
following each line of written page. It is also more than recognizing words within
a sentence in the text. It includes whole activity of thinking process to evaluate the
information. In order to get some points or informations from the text, the reader
needs understanding and comprehension. Comprehension is the process of
deriving meaning from connected text (Pang et al., 2003, p. 4). Furter, they state
that the reader actively engages with the text to construct the meaning. Therefore,
comprehension could not be separated from reading.

11
According to Snow (2002, p. 11), reading comprehension is the process of
stimultancously extracting and constructing meaning through interaction and
involvement with written language. He also mentions that comprehension needs
three important elements. They are reader, text, and activity. The first important
element of reading comprehension is the reader. The reader who is doing the
comprehending. The second element of reading comprehension is the text. The
text that is to be comprehended. The last important element in reading
comprehension is the activity. The activity in which comprehension is a part.
Furthermore, Richards and Renandya (2002, p. 277) reading for
comprehension is the primary purpose for reading (though this is sometimes
overlooked when students are asked to read overly difficult text) awareness of
main ideas in a text and exploring the organization of a text are essential for good
comprehension. In the other word, reading comprehension is the primary purpose
for reading to raise students awareness to find the main ideas in the text.
Moreover, Lundberg and Linnakyla (1992, p. 11) define that reading
comprehension is a skill which can be divided into a set of subskills, such as
sequencing the events of story, being able to paraphrase, knowing the vocabulary,
predicting outcomes of a story, making inference, finding the main idea,
summarizing, applying the information given, and so on. In addition, Nunan
(2006, p. 71) states that reading comprehension refers to reading for meaning,
understanding, and entertainment.
From the statement above, the writer assumed that reading comprehension
is an interactive process between reader and text to comprehend the written or

12
printed text. Students can be considered as a good reader when they have ability
to find out important indicators of reading including finding the main idea,
communicative purpose of text, reference, and meaning of words based on the
content.
4. Concept of Narrative Text
Dietsch (2006, p. 86) states that narrative text tell a story or relate an event
or anecdote. The writer often sets the scene first, telling who or what when and
where. Description, dialogue, or illustrations may be included to kindle interest
and to clarify. Action verbs keep the story moving. Narratives often build
suspense, reversing a surprise for the end. It means that narrative text is a story
with complication or problematic events and it tries to find the resolations to solve
the problems.
According to Priharini and Yuliani (2013, p. 13), the purpose of narrative
text is to amuse or entertain the readers. They further say that a narrative
paragraph may consists of three parts. Those are an orientation (the first part of
story, the characters are introduced, the place in which the action goes on is
mentioned or described, and the action itself is set going), complication (what
happened with the characters in the story, the story grows more and more intense
until it reaches its highest point or climax), resolution (the story reaches its
conclucion), re-orientation (it contains the final result for better or for worse).
Similarly, Zaida (2009, p. 82) explains that narrative consists of several
parts: 1. Orientation, this part introduce characters and sets the scene
(when/where); 2. Complication, in this part, the main character is faced to a

13
problem; 3. Resolution, this part tells how the problem is resolved, for better or
worse.
From the explanations above, it can be assumsed that a narrative paragraph
is a story that is created in a constructive format that describes a sequence of
fictional or non-fictional events. Narrative is a text which contains about story and
its plot consists of climax of the story (complication) then followed by the
resolution.
5. Concept of That Was Then This Is Now Strategy
In teaching reading, there are many strategies that can be applied by the
teachers. One of them is by using That Was Then This Is Now Strategy. Sethna
(2011, p. 6) mentions that That Was Then This Is Now Strategy is a strategy that
students sketch some things that they know about the topic and then write a
summary about what they already know. After they read a section on the topic,
they sketch what they have learned and write a summary statement. It means that,
students create a before and after reading the text into some lists and compare the
ways in which characters have changed over the course of the story.
According to Brunner (2011, p. 91), That Was Then This Is Now Strategy
is a strategy was designed by McLaughin and Allen in (2002) to encourage
students to think about what they already know, relate the information to what
they read from a text and visualize to the text content. In other word, That Was
Then This Is Now Strategy is a strategy which asks the students to identify about
the topic before reading a text and develop the information after reading the text.
It can be concluded That Was Then This Is Now Strategy is a strategy for

14
reading that the teacher asks the students to use their prior knowledge or making
prediction about the topic before they read the text and asks them to write some
information about it. After that, teacher gives a piece of copy of the text. After
reading the text given, the students also have to find some information and make
them into sketch or summary and compare their ideas before and after reading
based on the summary statement.
6. Teaching Procedures by Using That Was Then This Is Now Strategy
There are some experts who give explanation about the application of That
Was Then This Is Now Strategy. According to Brunner (2011, p. 91), there are the
following steps to present That Was Then This Is Now Strategy. They are as
follow:
1. The teacher identifies the topic and introduce it.
2. The teacher divides students into a group of three or four.
3. The teacher asks one of the students in a group to draw a vertical line in the
center of a sheet of paper.
4. The teacher asks student to write the words “ That Was Then ...“at the top of
column on the left.
5. The teacher asks student to write the words the words “ ... This Is Now” at the
top of column on the right.
6. The teacher asks students to draw or write some of information that they
already know about the topic at the bottom of the left side of the paper.
7. The teacher asks students to write a summary statement at the bottom of the
left paper.

15
8. The teacher gives a text for each group and ask them to read the text (shared
reading or independent) and discuss.
9. The teacher instructs students to draw or write a representation of what they
learned from the reading into summary statement under the column on the right
after complete the reading assignment.
10. The teacher tells students to write summary statement under the column on
the right.
11. The teacher asks the students to compare and discuss their ideas before and
after reading the text based on the summary statements they have written on the
left and right column with whole class.
7. The Advantages of That Was Then This Is Now Strategy
McLaughin and Allen (2002) cited in Brunner (2011, p. 91) states that
there are many advantages of That Was Then This Is Now Strategy. They are as
follow:
a. Building relationship with other where it can be done individually with a small
group
b. Encouraging the creativity by drawing students will exploit their creativity.
c. Moderating advance preparation from the teacher which is needed to make
students enjoy inflowing material.
d. Activating students’ background knowledge about what they currently know
about the story.
e. Facilitating mental imaging by guiding the students’ representation to draw

16
images or sketches.
f. Having students with a wide range of academic ability in the classroom.
g. Providing students to compare and contrast the information by asking students
new idea from the text.
8. Teacher’s Method by Using Grammar Translation Method
Based on the teacher’s method in the school, the practical guides that used
by the teacher are as follows:
1. The teacher gives text to the students while gives motivation to the students.
2. The teacher transfers knowledge to the students and explain the text.
3. The teacher asks students to read the text.
4. The teacher asks students to translate the text into indonesian.
5. The teacher asks the students to answer the questions.
6. Students answer the questions that given by the teacher.
B. Previous Related Study
The writer found out some previous studies which are related to the
writer’s present study. The first thesis is entitled “Teaching Reading of Narrative
Text by using That Was Then This Is Now Strategy at SMP Pertiwi Siteba
Padang’’ written by Yulianto (2013). The objective of the study is to know
whether or not it is effective to teach reading comprehension using That Was Then
This Is Now Strategy at SMP Pertiwi Siteba Padang. By using this strategy, the
students can improve their comprehension about the content of the text and it will
help students in organizing information in the text easily. That Was Then This Is

17
Now Strategy is good and appropriate strategy in teaching reading for junior high
school. While, The results of this research using That Was Then This Is Now
Strategy showed that it was effective to improve students’ reading comprehension
for the second grade student of SMP Pertiwi Siteba Padang. It also can increase
students’ insight and knowledge in reading.
The similarity and difference between the previous and present study are
on sample of research, in previous study the second grade student of SMP Pertiwi
Siteba Padang was taken as sample of his research, while this study will be done
at SMP Muhammadiyah 6 Palembang as a sample for her research. Kind of the
texts in previous and present study is narrative text has been chosen in the
research.
The second thesis related to her thesis was written by Risnelliza (2013)
which is entitled “ Teaching Descriptive Text By Combining That Was Then This
Is Now Strategy and Sketch to Sketch Strategy at Second Grade at SMP Padang.
The objective of the study was to find out whether or not there was a significant
difference on students’ reading comprehension achievement taught using That
Was Then This Is Now Strategy combined Sketch to Sketch Strategy. Combining
That Was Then This Is Now and Sketch to Sketch strategy is designed to help
students in reading comprehension. While, the advantages from combining these
strategies are the students could compare their knowledge before and after reading
the text by sketching or writing the information on the topic into summary
statements. The result of this study has proven that students could increase their
ability in reading.

18
The similarities between previous and present studies are that both studies
use quasi experimental method. Then the differences between the present and
previous studies are: (1) the previous study using That Was Then This Is Now
Strategy combined Sketch Strategy, while this study only using That Was Then
This s Now Strategy. (2) The population of the previous related study is Second
grade student at SMP Padang while population of this study is the Eighth grade
students of SMP Muhammadiyah 6 Palembang.
C. Research Setting
In this study the writer chose SMP Muhammadiyah 6 Palembang as her
research subject. This school was build on 17th July 1978, which is located in Jl.
Ahmad Yani Complex of Muhammadiyah University Palembang. The
headmaster of SMP Muhammadiyah 6 Palembang is mukhsin S.Sos.i. There are
15 rooms which are divided into six classes, one library, one mosque, one
computer room, one headmaster room, two toilets, one storeroom, one kitchen,
one health school unit (UKS). There are 24 teachers in this school and there are
270 students that consist of 110 boys and 160 girls. The seventh grade consist of
94 students and divided into 3 classes, in which every class has different number.
Those are 30, 32, and 32 students. Eighth grade consist of 93 of students and
divided into 3 classes in which every class has different number. Those are 32,31
and 30 student. Moreover, The ninth grade students consist of 83 students and
divided into 3 classes too. Which every class has different number. Those are , 28,
and 27 students. The learning process is divided into two sessions, those are
morning class which started 07.00 a.m – 12.00 a.m and afternoon class strated

19
from 13.00 p.m – 17.00 p.m. The number of students for every class described in
the table below.
The number of students for every class
Table
No Class Number of class Total number of students 1 VII 3 (VII 1, VII 2, VII 3 ) 94 2 VIII 3 ( VIII 1, VIII 2, VIII 3 ) 93 3 IX 3 ( IX 1, IX , IX 3 ) 83
Total 9 270

20
CHAPTER III
METHOD AND PROCEDURE
This chapter presents: (a) research method; (b) research variables; (c)
operational definition; (d) population and sample; (e) techniques for collecting
data; and (f) techniques for analyzing data.
A. Research Method
In this study, the writer used quasi-experimental method. Fraenkel, et. al.,
(2012, p. 275) explain that quasi-experimental designs do not include the use of
random assigment. In this study, the pretest-posttest nonequivalent groups design
is used by the writer which suggested by Best and Khan (1993, p. 151). The form
of pretest-posttest nonequivalent design as follows:
Experimental Group O1 X O2
Control Group O3 C O4
Where:
O1 : Pretest of experimental group
O2 : Posttest of experimental group
O3 : Pretest of control group
O4 : Posttest of control group
X : Treatment of experimental group by using That Was Then This Is Now
Strategy
C : Treatment of control group by using Teacher’s Method

21
B. Variables of Study
According to Best and Khan (1993, p. 137), variables are the conditions or
characteristics that the experimenter manipulates, control and observes. There are
two kinds of variables in this study: dependent and independent variables. The
dependent variable is an attribute or characteristic that is dependent on or
influenced by independent variable (Creswell, 2012, p. 115). In this study, the
dependent variable is reading comprehension of the eighth grade students SMP
Muhammadiyah 6. Furthermore, the independent variable is an attribute or
characteristic that influences or affects an outcome of dependent variable
(Creswell, 2012, p. 116). In this study, the independent variable is That Was Then
This Is Now Strategy.
C. Operational Definitions
In order to avoid misunderstanding the terms used in this study, it is
necessary for the writer to present the operational definition of some key words
used in the title in this study “Teaching Reading Comprehension by Using That
Was Then This is Now Strategy to Eight Grade of Students SMP Muhammadiyah
6 Palembang”. They are teaching, reading comprehension and That Was Then
This Is Now Strategy.
Teaching is showing or helping someone to learn how to do something,
giving instruction, guiding something, providing with knowledge causing to know
or understanding. On the other hand, teaching is an interactive process between
teacher and students in getting new knowledge. Reading comprehension is a
process of interaction between the reader and the text, which includes constant

22
process reacting to a written text in order to get the message and information from
written text. That Was Then This Is Now Strategy is a strategy that is used by the
teacher to improve the students’ comprehension. It is used to compare the ideas or
information from the topic before read a text and after reading a text. Teacher asks
students to make those information into a summary statement. It makes students
understand what the text about.
D. Population and Sample
1. Population
According to Frankel, et. al, (2012, p. 92), the population is the group of
interest to the researcher, the group of whom the researcher would like to
generalize the result of study. Meanwhile, Arikunto (2010, p. 173) defines that
Population is all the subjects of investigation. In this study, the population was
conducted at the Eighth Grade of Students SMP Muhammadiyah 6 Palembang of
the second semester in academic year of 2014-2015. The total numbers are 93
students consists of 51 male and 42 female. The distribution of whole population
can be seen in Table 1.
Table 1
The Population of the Study
No Class Students Total Male Female
1 VIII 1 16 16 32 2 VIII 2 20 11 31 3 VIII 3 15 15 30 TOTAL OF STUDENTS 93
(Source : School Administration of SMP Muhammadiyah 6 Palembang in academic year 2014-2015)

23
2. Sample
Within this target population, researcher selected a sample for study.
Creswell (2012, p. 381) states that sample is the group of participants in a study
selected from the target population from which the researcher generalizes to the
target population. The sample consisted of the students from the population who
are chosen to participate in the study. The sampling method that used in this study
is convenience sampling technique. A convenience sample is a group of
individuals who (conveniently) are available for study (Fraenkle, et. al., 2012, p.
99). Thus, the writer decided to study two classes at the eighth grade where VIII.1
(experimental group) and VIII.2 (control group) as the sample where those classes
are easier for study. Moreover, both of the classes have the problem in English,
especially in reading. The number of the sample is 63 students, 32 students for
experimental group and 31 students for control group. The sample of the study
can be seen in Table 2.
Table 2
The Sample of the Study No Class Number of students
1 VIII 1 (experimental group) 32
2 VIII 2 (control group) 31
Total 63
E. Techniques for Collecting Data
In techniques for collecting the data, it presents tests, research instrument,
and research treatments. They are further illustrated as follows:

24
1. Tests
Brown (2004, p. 3) states that test is a method of measuring person’s
ability, knowledge, or performance in a given domain. In this study, there were
two kinds of test which were used by the writer. The test administrated twice as
pretest that was given before the treatment and posttest that was given after the
treatment in the experimental and control group. The test was a reading test
(multipe choice test) in which the students was assigned to read the text or
passage and then answer some questions related to the text that they have read
before. The total number of question is 40 items. During the treatment, the
students were mainly focused on reading process. At the end of the treatment, a
posstest was given to know the influence of the treatment received by the
students.
a. Pre-test
The pretest is the test that was given before some treatments. The pretest
was conducted to the sample. It was given both an experimental and control
groups. It measures the students’ reading achievement before treatment. The
purpose of given pretest to the students is to know the ability of students in
learning reading before the reading is given using That Was Then This Is Now
Strategy.
b. Post-test
Post-test was given to the experimental and the control group. The type of
posttest item is the same as the pretest. This test aim is to measure students’
ability in reading after the end of instruction. The result of this test was compared

25
with the result of pretest in order to know effect of teaching reading
comprehension through That Was Then This Is Now Strategy to the students’
reading ability. From the posttest, the writer is able to get the data that can be used
to measure the students’ progress taught by using That Was Then This Is Now
Strategy.
2. Research Instruments Analysis
Research instrument is designed for students’ pretest and posttest
activities. The test question items which are used for students’ pretest is the same
as it is given for students’ posttest activities. The instrument that should be
analyzed or checked are validity and reliability.
1. Validity Test
Validity has been defined as referring to the appropriateness,
meaningfulness and usefulness of the specific inferences researchers make based
on the data they collect (Fraenkle, et. al., 2012, p. 148). In this part, there are
three kinds of validity test to be administered for research instrument. They are
construct validity, validity of each question items and content validity.
a. Construct Validity
Construct validity refers to the nature of the psychological construct or
characteristic being measured by the instrument (Fraenkle, et. al., 2012, p. 148).
After constructing the instruments related to some aspects measured, then it is
consulted to achieve some expert judgements from at least three validators to
evaluate whether the components of the instrument can be applied in this research

26
activities. The writer asked her lecturer as validators to estimate her instruments.
They are Manalullaili, M.Ed, Winny Agustia R, M.Pd, and Amalia Hasanah,
M.Pd. the first validator, Manalullaili, M.Ed asked the writer to give clear
directions and time. While second validator, Winny Agustia R, M.Pd aksed the
writer to organize some questions and give the space to each questions of every
text. Then the third validator Amalia Hasanah, M.Pd asked the writer to revise
some questions of the test and revise a few thing in lesson plan. From the three
validators above, it can be assumed that her research instrument and lesson plan
were appropriate for her research study.
b. Validity Test of Each Question Item
Validity test of each question item is used to indicate whether test item of
the instruments in each question is valid or not. To know whether it is valid or not,
the score of significance (r-output) should be compared with the score of r-table
product moment.
In this case, the writer has already tried out her research instrument to 43
students of SMP Muhammadiyah 1 Palembang which consist 15 males and 28
females. There are 60 multiple choice questions that given to the students. The
result of the test was analyzed using Pearson Correltion Coefficients. According
to Basrowi and Soenyono (2007, p. 24), a question item is considered valid if the
result of the test show that r-output is higher than r-table (0.301), it means that the
item is valid. The result analysis of validity of each question by using SPSS 16
software, it was found that there were 15 questions considered invalid. They are
questions item no 1, no 8, no 9, no 11, no 15, no 17, no 18, no 19, no 25, no 26,

27
26, no 30, no 33, no 34, no 40, and no 57. There were 45 questions considered
valid. They are questions item no 2, no 3, no 4, no 5, no 6, no 7, no 10, no 12, no
13, no 14, no 16, no 20, no 21, no 22, no 23, no 24, no 27, no 28, no 29 no 31, no
32, no 35, no 36, no 37, no 38, no 39, no 41, no 42, no 43, no 44, no 45, no 46, no
47, no 48, no 49, no 50, no 51, no 52, no 53, no 54, no 55, no 56, no 58, no 59 and
no 60. The result analysis of each question item is displayed in Table 3.
Table 3 Validity Test Result of Each Question Items
No
Validity Test of Each Question
Item
Sig. (2-tailed) of Pearson
Correlation (r-output)
r-table score
Result
1. Item 1 0 0.301 Invalid 2. Item 2 0.806 0.301 Valid 3. Item 3 0.432 0.301 Valid 4. Item 4 0.859 0.301 Valid 5. Item 5 0.455 0.301 Valid 6. Item 6 0.433 0.301 Valid 7. Item 7 0.302 0.301 Valid 8. Item 8 0.020 0.301 Invalid 9. Item 9 0.022 0.301 Invalid 10. Item 10 0.433 0.301 Valid 11. Item 11 0.117 0.301 Invalid 12. Item 12 0.689 0.301 Valid 13. Item 13 0.371 0.301 Valid 14. Item 14 0.433 0.301 Valid 15. Item 15 0.043 0.301 Invalid 16. Item 16 0.342 0.301 Valid 17. Item 17 0.059 0.301 Invalid 18. Item 18 0.045 0.301 Invalid 19. Item 19 0.115 0.301 Invalid 20. Item 20 0.433 0.301 Valid 21. Item 21 0.689 0.301 Valid 22. Item 22 0.806 0.301 Valid 23. Item 23 0.768 0.301 Valid 24. Item 24 0.493 0.301 Valid 25. Item 25 0.243 0.301 Invalid

28
26. Item 26 0.263 0.301 Invalid 27. Item 27 0.433 0.301 Valid 28. Item 28 0.840 0.301 Valid 29. Item 29 0.433 0.301 Valid 30. Item 30 0.012 0.301 Invalid 31. Item 31 0.455 0.301 Valid 32. Item 32 0.840 0.301 Valid 33. Item 33 0.157 0.301 Invalid 34. Item 34 0.196 0.301 Invalid 35. Item 35 0.577 0.301 Valid 36. Item 36 0.723 0.301 Valid 37. Item 37 0.575 0.301 Valid 38. Item 38 0.452 0.301 Valid 39. Item 39 0.936 0.301 Valid 40. Item 40 0.206 0.301 Invalid 41. Item 41 0.681 0.301 Valid 42. Item 42 0.806 0.301 Valid 43. Item 43 0.677 0.301 Valid 44. Item 44 0.719 0.301 Valid 45. Item 45 0.973 0.301 Valid 46. Item 46 0.577 0.301 Valid 47. Item 47 0.870 0.301 Valid 48. Item 48 0.433 0.301 Valid 49. Item 49 0.900 0.301 Valid 50. Item 50 0.689 0.301 Valid 51. Item 51 0.681 0.301 Valid 52. Item 52 0.371 0.301 Valid 52. Item 53 0.550 0.301 Valid 54. Item 54 0.540 0.301 Valid 55. Item 55 0.577 0.301 Valid 56. Item 56 0.935 0.301 Valid 57. Item 57 0.006 0.301 Invalid 58. Item 58 0.575 0.301 Valid 59. Item 59 0.550 0.301 Valid 60. Item 60 0.986 0.301 Valid
c. Content Validity
The writer estimated the content validity. Fraenkle et. al., (2012, p. 148)
state that content validity refers to the content and format of the instrument. In
order to know if the contents of the test items given were appropriate to the

29
students, the researcher arranged and presented the test items in the table of the
test specification as shown in table 4:
Table 4 Test of Specification
Objective Test
Materials Indicators Number
of items Total Types
of test Answer
key The students are able to respon the written meaning of reading text
The Ant and the the Dove
The students are able to: -to identify the detail information -to find general information -to find reference
1,2 3
4
40
Multiple
choice
b,a c a
The Donkey and the Wolf
The students are able to: -to find antonym -to identify the detail information -to find a concluding sentence
5
6,7 8
b
c,d b
The Grasshopper and the Ant
The students are able to: -to find a concluding sentence - to identify the detail information
9
10,11,12
d
d,c,a
The Wind and the Sun
The students are able to: -to identify the detail information -to identify general information -to identify synonym
13,14
15,
16
c, b a c

30
The Lion and the Mosquito
The students are able to: -to find main idea -to find synonym -to identify general information
17 18 19
b d c
Beauty and the Beast
The students are able to: -to identify general information -to identify main idea To identify general information
20,21
22
23
a, c a c
The Princess who loved to sing
The students are able to: -to identify detail and factual information
24,25,26,27
a,a,a, a
The Lion and the Goat
The students are able to: -to identify general information -to find reference
28,29,30
31
a, d, b a
The Owl and the nightingale
The students are able to: -to identify the detail information -to identify the main idea
32,33
34
b,b a
Snow White The students are able to: -to identify the detail and factual information
35,36,37
a,d,c
The Flowers from the Moon
The students are able to: -to identify the detail and factual information
38,39,40
b,c,a

31
2. Reliability Test
Reliability test measures whether research instrument used for pretest and
posttest activities is reliable or not. Cohen et.al., (2007, p. 146) state a reliable
instrument for a piece of research will yield similar respondents over time.
Further, Fraenkle, et. al., (2012, p. 154) state that reliability refers to the
consistency of the scores obtained-how consistent they are for each individual
from one administration of an instrument to another and from one set of items to
another.
To find out the reliability of the test, the writer used test and re-test
method. Then, the score in test 1 and test 2 was analyzed using Pearson
Correlation Coefficient in SPSS program. The writer tried out the test twice to the
same students from the same school. The writer gave the test in a different time.
The time interval was about two weeks. The test consists of 40 question items and
these questions are tested to the eighth grade students of SMP Muhammadiyah 1
Palembang. The test was indicated reliable whenever the p-output is higher than
0.70. The result of try out score will be described in Table 5.
Table 5
The Score of Try Out Analysis
No Students Name Test Score Test 1 Test 2
1. Alfin Yolanda 75 75 2. M. Roihan 77,5 80 3. Dwi Yulia Agustina 55 60 4. Farah Kencana Putri 75 77,5 5 Pratiwi 80 80 6. Tharissa Oktaverina. P 70 72,5 7. Fitri Alzena 62,5 65

32
8. Annisa Rahmawati 70 72,5 9. Marina Sari 72,5 75 10. Ricka Puspita Sari 70 72,5 11. Zulfebriani 62,5 62,5 12. Rizkika Nur Putri Anti 67,5 70 13. M. Ridho Pratama 57,5 60 14. Rini Angraini 57,5 65 15. M . Iqbal 57,5 62,5 16. Novi Indasari 70 75 17. Kgs. Muhammad Suaidi 65 67,5 18. Ega Anugrah 70 75 19. Risqi Rozan 70 77,5 20. Rama 55 57,5 21. Natia Sahani 60 65 22. Randika Alfikri 60 62,5 23. Rini Andriani 62,5 62,5 24. Fatia Salsabila 67,5 65 25. Sabita Putri 60 60 26. Mutiara Jayanti 75 80 27. Auliya Aghitsni 65 67,5 28. Andi Azrial Akbar 65 70 29. Reza Dwi Wahyudi 70 70 30. Irma Pratiwi 60 70 31. M . Ikhsan Abdillah 57,5 65 32. Nur Septi Cahyani 55 60 33. Fadilah Aprilia 60 62,5 34. Iqbal Maulana 50 52, 35. Suliasti Juliansyah 62,5 67,5 36. Wahidah Kamaliah 70 75 37. M. Rizky Ismail 77,5 82,5 38. Msy. Nur Azizah Aryani 70 67,5 39. Kemas Baihaqi 75 77,5 40. Melanie Andarwati 65 65 41. Puspita Ailya Nabila 65 62,5 42. Selvia Priska Utamai 67,5 75 43. Ismelda 70 75
It could be stated that this instrument was considered reliable for this
study. Because, the p-output (0.917) was higher than 0.70. The result of
reliability test will be described in Table 6.

33
Table 6 Result of Reliability Analysis Using Pearson Correlation
No Number of
Test N Pearson
Correlation Sig. Result
1. Test 1 43 0.917 0.000 Reliable 2. Test 2 43
3. Research Treatments
a. Readability Test
Readability test is done to know the level of reading texts are appropriate
for students’ class level in comprehending the reading texts. The name of
application is Readability Formulas. Readability Formulas test can be measured
using online readability test which can be accessed from:
http//www.readabilityformula.com.
There are seven categories in reading text level. They are: (1) very easy
level whenever the result of flesh reading ease score within 90-100, (2) easy text
level whenever the result of flesh reading ease score is within 80-89, (3) fairly
easy text level whenever the result of flesh reading ease score is within 70-79, (4)
standard text level whenever the result of flesh reading ease score is within 60-69,
(5) fairly difficult text level whenever the result of flesh reading ease score is
within 50-59, (6) difficult text level whenever the result of reading ease score is
within 30-49, (7) very confusing text level whenever the result of reading ease
score is within 0-29. For readability test for research treatments, the writer uses
some books.

34
There are ten texts that the researcer used in this study. The ten texts are
taken from three different booksp. Theye are: Practise Your English Competence
for SMP/MTs Class VII written by Nur Zaida publisher Penerbit Erlngga, Smart
Steps An English Textbook for Junior High School written by Ali Akhmadi and
Ida safrida publisher Exact Ganeca, and English in Focus written by Artono
Wardiman for Grade VIII Junior High School (SMP/MTs) publisher Pusat
Pembukuan Departemen Pendidikan Nasional. The researcher used texts for the
eighth grade students on junior high school based on syllabus in the second
semester. The text is narrative text.
The result of readability test for research instruments will be figured in
Table 7.
Table 7 Result of Readability Test for Research Treatments
No
Text Title
Text Type Text statistics Flesh
Reading Ease Score
Text Category Number
of sentence
Words per sentence
Character per word
1. Beauty and the Beast
Narrative 29 8.10 4.19 79.45 Fairly Easy
2. The Mountain God and the River God
Narrative 28 9.39 3.90 84.72 Easy
3. The Lion and the Hare
Narrative 15 10.73 4.01 84.54 Easy
4. Buggy Races
Narrative 9 13.89 4.08 82.42 Easy
5 Mantu’s Little
Narrative 20 11.25 4.36 78.48 Fairly Easy

35
Elephant
6. The Caliph and the Clown
Narrative 21 10.24 4.42 76.43 Fairly Easy
7. Redfeathers the Hen
Narrative 11 20.36 3.87 79.66 Fairly Easy
8. The Fox and the Crow
Narrative 11 15.55 3.88 82.21 Easy
9. The Crow and the Oyster
Narrative 15 14.60 3.80 83.47 Easy
10. The Singer and the Dolphin
Narrative 11 20.73 4.35 58.15
Fairly Difficult
b. Research Teaching Schedule
The writer did the treatment to the experimental group students suitable
with English teacher schedule for eighth grade students in academic 2014-2015.
The study will be conducted in 12 meetings. There are two meetings for a pretest
and posttest and ten meetings for treatments. In this part, it presents the number of
materials, kinds of materials, and time allocation are illustrated trough a table of
teaching materials for research treatments. The table of teaching materials for
research treatment is figured out in Table 8.
Table 8 Teaching Materials for Research Treatments
No Experiment Reading text Title Research
Treatment Meeting
Day/Date Time
1. Fri/Feb 27,15 13.00-14.20 Beauty and the Beast 1st 2. Tues/Mar 3, 15 13.00-14.20 The Mountain God and the
River God 2nd
3. Fri/Mar 6, 15 13.00-14.20 The Lion and the Hare 3rd
4. Tues/Mar 10, 15 13.00-14.20 Buggy Races 4th

36
5. Thrus/Mar 12, 15 13.00-14.20 Mantu’s Little Elephant 5th
6. Fri/Mar 13, 15 13.00-14.20 The Caliph and the Clown
6th
7. TuesMar 17, 15 13.00-14.20 Redfeathers the Hen 7th
8. Thrus/Mar 19, 15 13.00-14.20 The Fox and the Crow 8th
9. Fri/Mar 20, 15 13.00-14.20 The Crow and the Oyster 9th 10. Fri/ Mar 27, 15 13.00-14.20 The Singer and the
Dolphin 10th
F. Technique for Analyzing Data
In analysing the obtained data, it presents data descriptions, prerequisite
analysis, and result of testing hypothesis.
1. Data Descriptions
In analysing the data description, there are two analyses will be done, they
are distribution of frequency data and descriptive statistics.
a. Distribution of Frequency Data
In distributions of frequency data, the students’ score, frequency,
percentage are achieved. The distributions of frequency data are got from
students’ pretest scores in control group, students’ posttest scores in control
group, the students pretest scores in experimental group, and students’ posttest
scores in experimental group.
b. Descriptive Statistics
Descriptive statistics are obtained from students’ pretest and posttest
scores in control and experimental groups. In descriptive statistics, number of
sample, the score of minimal, maximal, mean, standard deviation, and standard
error of mean are obtained.

37
2. Prerequisite Analysis
Prerequisite analysis is an analysis which is done before testing the
research hypotheses. It measures whether or not the obtained data from students’
pretest and posttest scores in both groups (experiment and control) is normal and
homogenous.
a. Normality Test
Normality test is used to measure the obtained data whether it is normal or
not. The data is obtained from students’ pretest and posttest in control and
experimental groups. The data can be classified into normal whenever the p-
output is higher than 0.05 (Basrowi and Soenyono, 2007, p. 85). In measuring
normality test, one-sample Kolmogorov Smirnov is used.
b. Homogeneity Test
Homogeneity test is used to measure the obtained data whether it is
homogenous or not. The data can be categorized homogenous whenever it is
higher than 0.05 (Basrowi and Soenyono, 2007, p. 106). In measuring
homogeneity test, Levene Statistics in SPSS is used.
3. Hypothesis Testing
Independent Sample t-test is used to compare the means scores of two
independent groups on a given variable. It measures significant difference
between two variables from students’ posttest scores in control and experiment
groups. A significant difference is found whether the p-output is lower than 0,05.

38
CHAPTER IV
FINDINGS AND INTERPRETATIONS
In this chapter, the writer presents: (a) findings and (b) interpretations
A. Findings
This study deals with the title “Teaching Reading Comprehension by
Using That Was Then This Is Now Strategy to the Eighth Grade Students of SMP
Muhammadiyah 6 Palembang”. The findings of this study were to analyzed: (1)
data descriptions, (2) prerequisite analysis, and (3) result of hypothesis testing.
1. Data Descriptions
In data descriptions, there were two analyses will be done. They were
distributions of frequency data and descriptive statistics were analyzed.
a. Distributions of Frequency Data
In the distribution of frequency data, score, frequency, and percentage were
analyzed. The scores were got from: (a) pretest scores in control group, (b)
posttest scores in control group, (c) pretest score in experimental group, and (d)
posttest scores in experimental group. The complete statistical can be seen in
Appendix D.
1) Students’ Pretest Scores in Control Group
In distribution of data frequency, the writer got the interval score,
frequency and percentage. The result of the pretest scores in control group is
described in Table 9.

39
Table 9 Distribution of Data Frequency on Students’ Pretest Scores
in Control Group
Scores Frequency Percentage (%)
40 1 3.2 50 6 19.4
52,5 1 3.2 55 3 9.7 60 7 22.6
62,5 3 9.7 65 4 12.9
67,5 2 6.5 70 3 9.7 75 1 3.2
Total 31 100.0
Based on the result analysis of students’ pretest scores in control group, it
showed that there were one student got 40 (3.2%), six students got 50 (19.4%),
one student got 52.5 (3.2%), three students got 55 (9.7%), seven students got 60
(22.6%), three students got 62.5(9.7%), four students got 65 (12.9%), two
students got 67.5 (10.8%), three students got 70 (9.7%), and one student got 75
(3.2%).
2) Students’ Posttest Scores in Control Group
In distribution of data frequency, the result of the posttest scores in control
group is described in Table 10

40
Table 10 Distribution of Data Frequency on Students’ Posttest Scores
in Control Group
Scores Frequency Percentage (%)
50 3 9.7 52,5 2 6.5 55 4 12.9
57,5 1 3.2 60 5 16.1
62,5 2 6.5 65 7 22.6 70 5 26.1 75 1 3.2 80 1 3.2
Total 31 100.0
Based on the result analysis of students’ pretest scores in control group, it
showed that there were three students got 50 (9.7%), two students got 52,5
(6.5%), four students got 55 (12.9%), one student got 57,5 (3.2%), five students
got 52.5 (16.1%), two students got 62,5 (6.2), seven students got 65 (22.6%), five
students got 70 (16.1%), one student got 75 (3.2%), and one student got 80
(3.2%).
3) Students’ Pretest Scores in Experimental Group
In distribution of data frequency, the result of the pretest scores in
experimental group is described in Table 11.

41
Table 11 Distribution of Data Frequency on Students’ Pretest Scores
in Experimental Group
Scores Frequency Percentage (%)
40 1 3.1 45 5 15.6 50 2 6.2 55 5 15.6
57,5 2 6.2 60 7 21.9
62,5 3 9.4 65 3 9.4 70 3 9.4
72,5 1 3.1 Total 32 100.0
From the analyses above, it was found that there were one student got 40
(3.1%), five students got 45 (15.6%), two students got 50 (6.2%), five student got
55 (15.6%), seven students got 60 (21.9 %), three students got 62,5 (9.4%), three
students got 65 (9.4%), three students who got 70 (9.4%), and one student got
72,5 (3.1%).
4) Students’ Posttest Scores in Experimental Group
In distribution of data frequency, the result of the posttest scores in
experimental group is described in Table 12.

42
Table 12 Distribution of Data Frequency on Students’ Posttest Scores
in Experimental Group
Scores Frequency Percentage (%)
60 1 3.1 62.5 2 6.2 65 5 15.6
67.5 6 18.8 70 8 25.0 75 4 12.5
77,5 2 6.2 80 3 9.4
82,5 1 3.1 Total 32 100.0
From the analyses above, it was found that there were one student got 60
(3.1%), two students got 62.5 (6.2 %), five students got 65 (15.6%), six students
got 67,5 (18.8%), eight students got 70 (25.0%), four students got 75 (12.5%), two
students got 77,5 (6.2%), three students got 67.5 (9.4%), and one student got 82,5
(3.1%).
b. Descriptive Statistics
In the descriptive statistics, the total of sample (N), minimum and maximum
scores, mean score, standard deviation were analyzed. The scores were got from;
(a) pretest scores in control group, (b) posttest scores in control group, (c) pretest
score in experimental group, and (d) posttest scores in experimental group. The
complete statistical can be seen in Appendix E.
43
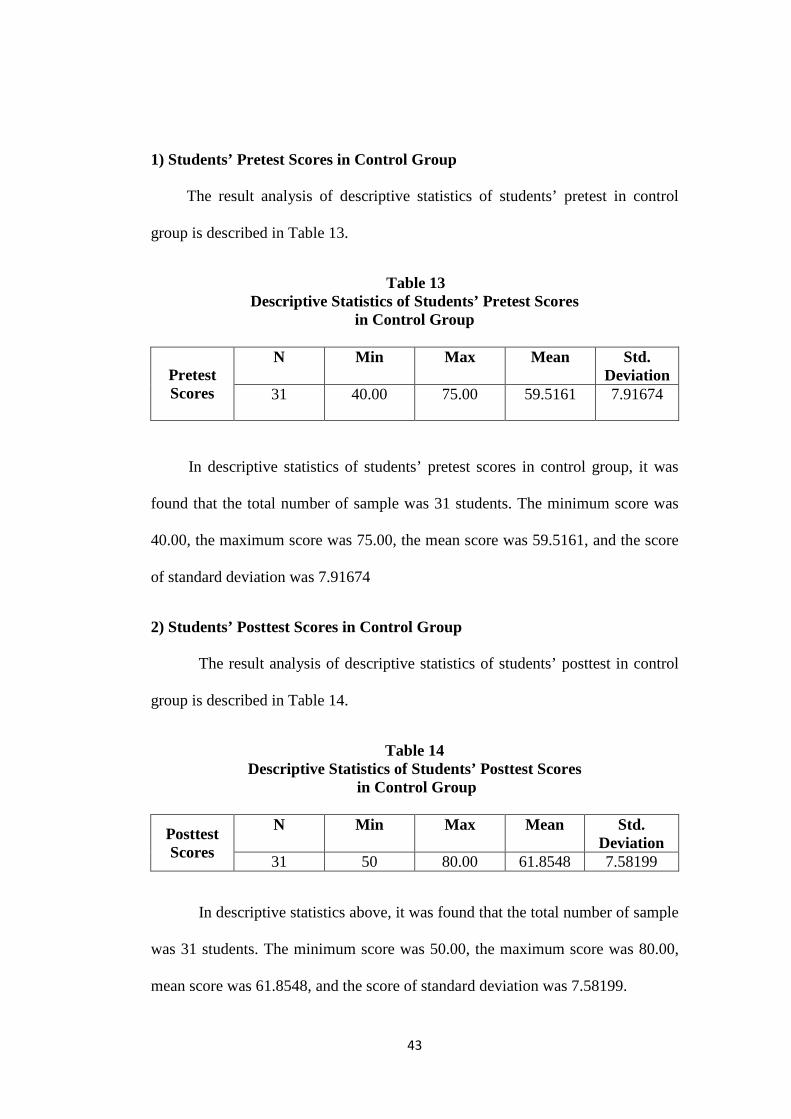
1) Students’ Pretest Scores in Control Group
The result analysis of descriptive statistics of students’ pretest in control
group is described in Table 13.
Table 13 Descriptive Statistics of Students’ Pretest Scores
in Control Group
Pretest Scores
N Min Max Mean Std. Deviation
31 40.00 75.00 59.5161 7.91674
In descriptive statistics of students’ pretest scores in control group, it was
found that the total number of sample was 31 students. The minimum score was
40.00, the maximum score was 75.00, the mean score was 59.5161, and the score
of standard deviation was 7.91674
2) Students’ Posttest Scores in Control Group
The result analysis of descriptive statistics of students’ posttest in control
group is described in Table 14.
Table 14 Descriptive Statistics of Students’ Posttest Scores
in Control Group
Posttest Scores
N Min Max Mean Std. Deviation
31 50 80.00 61.8548 7.58199
In descriptive statistics above, it was found that the total number of sample
was 31 students. The minimum score was 50.00, the maximum score was 80.00,
mean score was 61.8548, and the score of standard deviation was 7.58199.

44
3) Students’ Pretest Scores in Experimental Group
The result analysis of descriptive statistics in experimental group is
described in Table 15.
Table 15 Descriptive Statistics of Students’ Pretest Scores
in Experimental Group
Pretest Scores
N Min Max Mean Std. Deviation
32 40.00 72.50 57.5000 8.44813
In descriptive statistics on students’ pretest scores in experimental group
above, it was found that the total number of sample was 32 students. The
minimum score was 40.00, the maximum score was 72.50, mean score was
57.5000, and the score of standard deviation was 8.44813.
4) Students’ Posttest Scores in Experimental Group
The result analysis of descriptive statistics in experimental group is
described in Table 16.
Table 16 Descriptive Statistics of Students’ Posttest Scores
in Experimental Group
Posttest Score
N Min Max Mean Std. Deviation
32 60.00 82.50 70.3906 5.78894
In descriptive statistics on students’ posttest scores in experimental group
above, it was found that the total number of sample was 32 students. The

45
minimum score was 60.00, the maximum score was 82.50, mean score was
70.3906, and the score of standard deviation was 5.78894.
2. Prerequisite Analysis
In prerequisite analysis, there were two analyses should be done. They
were normality test and homogeneity test were analyzed.
a. Normality Test
In measuring normality test, 1-Kolmogorov-Smirnov is used. The
normality test is used to measure students’ pretest and posttest in control and
experimental groups. The complete statistical can be seen in Appendix F.
1) Students’ Pretest Scores in Control and Experimental Groups
The computations of normality used the computation in SPSS 16. The
result of analysis is figured out in Table 17.
Table 17 Normality Test of Students’ Pretest and Scores
in Control and Experimental groups
No Students’ Pretest N Kolmogorov
Smirnov Sig. Result
1 Control Group 31 0.944 0.335 Normal
2 Experimental Group 32 0.835 0.488 Normal
After the data obtained from the scores of the 31 students in control group
and 32 in experimental group, it was found that the p-output was 0.335 and 0.488.

46
From the result of the p-output, it can be stated that the students’ pretest control
and experimental groups were normal since they were higher than 0.05.
2) Students’ Posttest Scores in Control and Experimental Groups
The computations of normality used the computation in SPSS 16. The
result of analysis is figured out in Table 18.
Table 18 Normality Test on Students’ Posttest Scores
in Control and Experimental Groups
No Students’ Posttest N Kolmogorov
Smirnov Sig. Result
1 Control Group 31 0.631 0.821 Normal
2 Experimental Group 32 1.231 0.106 Normal
After the data obtained from the scores of the 31 students in control group
and 32 in experimental group, it was found that the p-output was 0.631 and 1.231.
From the result of the p-output, it can be stated that the students’ pretest control
and experimental groups were normal since they were higher than 0.05.
b. Homogeneity Test
In the homogeneity test, the students’ pretest and posttest scores in control
and experimental groups were analyzed by using Levene Statistics analysis. The
complete statistical can be seen in Appendix G.
47
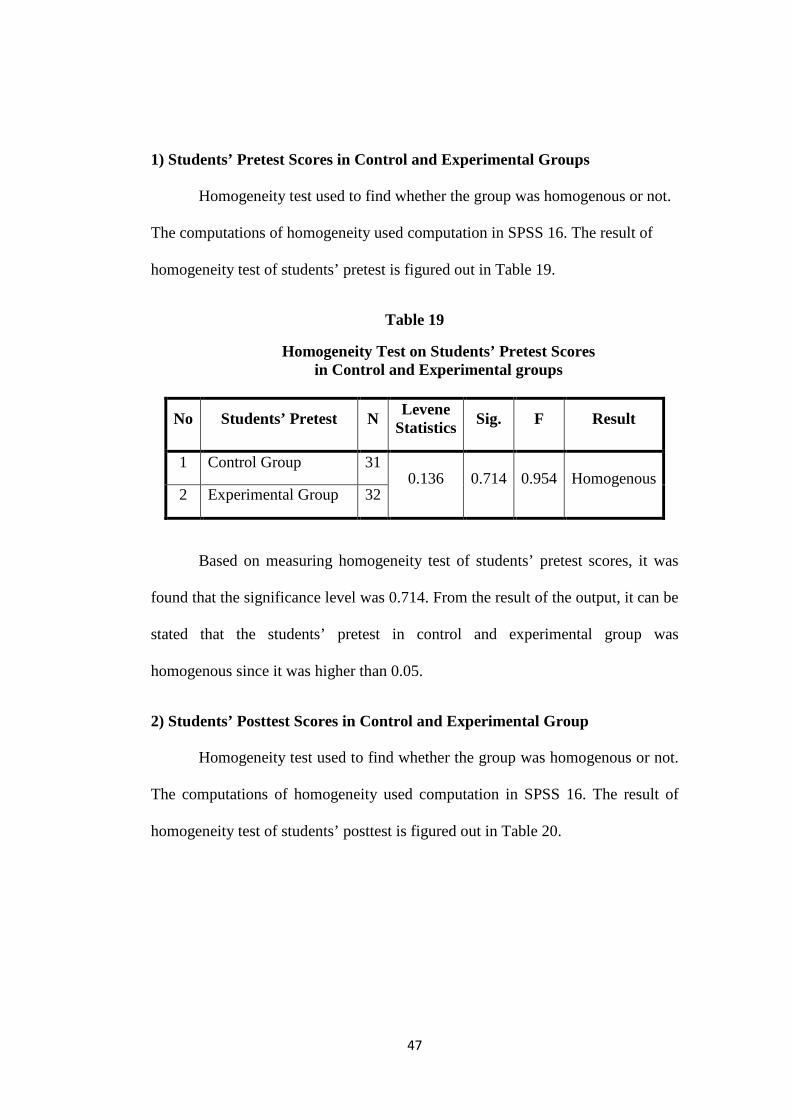
1) Students’ Pretest Scores in Control and Experimental Groups
Homogeneity test used to find whether the group was homogenous or not.
The computations of homogeneity used computation in SPSS 16. The result of
homogeneity test of students’ pretest is figured out in Table 19.
Table 19
Homogeneity Test on Students’ Pretest Scores in Control and Experimental groups
No Students’ Pretest N Levene
Statistics Sig. F Result
1 Control Group 31 0.136 0.714 0.954 Homogenous
2 Experimental Group 32
Based on measuring homogeneity test of students’ pretest scores, it was
found that the significance level was 0.714. From the result of the output, it can be
stated that the students’ pretest in control and experimental group was
homogenous since it was higher than 0.05.
2) Students’ Posttest Scores in Control and Experimental Group
Homogeneity test used to find whether the group was homogenous or not.
The computations of homogeneity used computation in SPSS 16. The result of
homogeneity test of students’ posttest is figured out in Table 20.

48
Table 20
Homogeneity Test on Students’ Posttest Scores in Control and Experimental groups
No Students’ Posttest N Levene
Statistics Sig. F Result
1 Control group 31 2.525 0.117 25.324 Homogenous
2 Experimental group 32
Based on measuring homogeneity test, it was found that the significance
level was 0.117. From the result of the output, it can be stated that the students’
pretest in experimental and control group was homogenous since it was higher
than 0.05.
3. Result of Hypothesis Testing
In this study, independent t-test was used to measure the significant
difference on students’ reading comprehension score taught by using That Was
Then This Is Now Strategy and Teacher’s Method at SMP Muhammadiyah 6
Palembang. The analysis result of independent sample t-test is figured out in
Table 21. The complete statistical can be seen in Appendix H.
Table 21 Result Analysis of independent Sample t-test from Students’ Posttest
Scores in Experimental and Control Groups
Using That Was Then This Is Now Strategy
and Teacher’s Method at SMP
Muhammadiyah 6 Palembang
Independent Sample t-Test
Ho T Df
Sig. (2-tailed)
5.032 61 0.000 Rejected

49
From the table analysis, it was found that the p-output was 0.000 and the t-
value was 5.032. Since the p-output was lower than 0.05 level and the t-value was
higher than critical value of t-table (2.000). It can be stated that there was
significant difference on students’ reading comprehension score taught by using
That Was Then This Is Now Strategy and Teacher’s Method at SMP
Muhammadiyah 6 Palembang.
B. Interpretations
Based on the findings above, some interpretations were made as follows:
First, the writer had already tried out her research instrument. The instrument of
the test was tested to the students of the eighth grade (VIII.A) at SMP
Muhammadiyah 1 Palembang. The total number of the sample is 43 students. The
reason for choosing VIII.A as sample in doing the try out because the students had
problems such as difficult to comprehend text and they could not mention the
main idea or inference in the text. Moreover, the writer was asked by the teacher
of English to examine the try out in VIII.A to know their ability in reading skill.
Meanwhile, the accreditation of SMP Muhammadiyah 1 itself is A category as
well as the researcher will conduct the research at SMP Muhammadiyah 6
Palembang. The instrument that tested to the students were consulted by three
validators. They were Manalullaili who graduated from School of Education
Flinders University in Australia , M.Ed Winny Agustia R, M.Pd who graduated
from Sriwijaya University in Palembang, and Amalia Hasanah, M.Pd who
graduated from Sriwijaya University in Palembang. From the three validators

50
above, they assumed that the instrument was appropriate and could be applied in
this research activities.
The form of the instrument test was multiple choice question. There were
60 questions that given to the students. The questions consisted of finding the
main idea, comprehension, vocabulary (synonym/antonym) and inference. The
writer did the try out to estimate the validity of the instrument. SPSS program was
used by the writer to analyze the validity of each question items. After anlyzing
the obtained data, the writer finally found the result of validity from each question
items. It was found that there was 45 question items categorized valid and 15
question items considered invalid. The most question items were found valid in
comprehension section. It was about 26 question items (55%) in comprehension
section, 11 question items (25%) in vocabulary section, 4 question items (10%) in
finding main idea section and 4 question items (10%) in identifying the inference
section which made each question items clarified valid. Whereas, the invalid
question items were caused that there were many students still hard to answer the
question in vocabulary section. It was found that there were 11 question items
(80%) in vocabulary section, 3 question items (5%) in comprehension, and 1
question item (5%) in the inference section who answered with wrong answers.
The students considered that the questions were difficult to the them. Therefore,
since there was 45 question items valid, the writer selected the easiest questions
and took 40 valid question items as her research instrument for pretest and
posttest that will be done of two groups for her research.

51
In this research, the writer chose the eighth grade students at SMP
Muhammadiyah 6 Palembang where the pretest and posttest were tested to VIII.1
and VIII.2 as sample in conducting the research. The peretest was given before
giving the treatment, while the posttest was given after giving the treatment. The
writer had conducted the pretest in both control and experimental groups. After
the students’ pretest scores obtained from control and experimental groups, the
writer chose VIII.2 as the control group and VIII.1 as experimental group. It was
because the students’ scores in control group was higher than the students’ scores
in experimental group. There were six students got big score where it could be
categorized that those students in good category. On the other hand, the students’
pretest in experimental group were lower because only three students who got big
scores and it also could be seen from the percentage and the total number of
students who got bad scores were fifteen students while in control only eleven
students who got bad scores. The researcher concluded that the pretest scores in
experimental were in poor level while in control group was in average level based
on the students’ mean scores.
Second, That Was Then This Is Now Strategy had increased the students’
achievement significantly in reading class. The factors made students’ could
increase their achievement in experimental group because the students was given
the treatment through That Was Then This Is Now Strategy about ten meetings by
the researcher. In the first to second meeting, the students still felt confused to
follow the steps of That Was Then This Is Now Strategy. Then the researcher
expalined again and stimulated their thoughts. Nevertheless, the third to sixth

52
meeting, the students become motivated and interested to learn and understand the
steps of it. In the seventh to tenth meeting, the students were accustomed with
That Was Then This Is Now Strategy in learning reading skill. It made them easier
to understand and find the main idea or some information in the text. They felt the
benefits when the researcher applied the strategy. The students got motivation to
learn by making predictions or sketching some things using their prior knowledge
that they already know about the topic and what they have learned and they can
write the sumarry from the text easier. Sethna (2011, p. 6) mentions that That Was
Then This Is Now Strategy is a strategy that the students can sketch some things
that they know about the topic and then write a summary about what they already
know. After they read a section on the topic, they sketch what they have learned
and write into a summary statement. The students also could enjoy following the
material where they can learn with their group or their partner in the class. It
supported with Brunner (2011, p. 91) that it requires advance prepearation from
the teacher which make the students enjoy inflowing the material.
Third, the different result from students’ posttest in control and
experimental groups. The researcher has interpreted that students’ posttest in
control and experimental groups. Students’ posttest in control were lower than
posttest scores in experimental group. It was caused that the researcher used
teacher’s method in control group. Meanwhile, the students’ posttest scores in
experimental group are higher or in good level. It caused the researcher conducted
That Was Then This Is Now Strategy to help students in teaching and learning
process of English especially in reading for experimental group. That Was Then

53
This Is Now Strategy made students’ in experimental group to be active readers,
they also could mention some information based on their prior knowledge about
the topic, students could relate the information after they read a text and could
visualize the content of the text. It is line with Brunner (2011, p. 91) who states
that That Was Then This Is Now Strategy is a strategy that was designed to
encourage students to think about what they already know, relate the information
to what they read from a text and to visualize the text content.
In addition, That Was Then This Is Now Strategy gives some advantages to
the students, for instance, it activates students’ background knowledge about what
they already know about the story, encourage students’s creativity, provide
teacher with advance preparation, build the students’ teamwork with other, have a
wide range of academic ability in the classroom and require students to compare
and contrast the information and new idea from the text. Finally, the teacher of
English at the school can use That Was Then This Is Now Strategy in order to
improve the students’ reading comprehension achievement especially in narrative
text.

54
CHAPTER V
CONCLUSIONS AND SUGGESTIONS
In this chapter, the writer presents: (a) conclusion and (b) suggestions
A. Conclusions
Based on the findings and interpretations presented in the previous
chapter, the reseacher concluded that there were a significance on students’
reading comprehension achievement taught by using That Was Then This Is Now
Strategy. The result could be seem from the improvement of the eighth grade
students, as follows:
1. The students become active readers in the class.
2. The students were motivated and interested to learn especially in reading skill.
3. The students were able to find the main idea or information stated in the texts.
4. The students could use their prior or background knowledge to mention the
information about the topic.
5. The students enjoyed following the materials in the class.
6. The students could write the information from the text by visualizing into
summary statements.
7. The students were able to comprehend the narrative text easily.
Therefore, it could be assumed that That Was Then This Is Now Strategy
was effective to the eighth grade students of SMP Muhammadiyah 6 Palembang.
The students also could increase their achievement in reading. It also could be
seem from the result of the test, it implied that That Was Then This Is Now
Strategy could be used as an alternative strategy in teaching reading.

55
B. Suggestions
Based on the conclusion above and based on the study that has been done,
the researcher would like to offer some suggestions to the teachers of English, the
students of SMP Muhammadiyah 6 Palembang, and for other researchers as
follows:
1. For Teachers of English
For the teachers of English at SMP Muhammadiyah 6 Palembang the
writer would like to share contribution for learning and teaching in order to
develop the process of teaching and learning to be success. To achieve the
purpose, it depends on the teacher whether or not they can manage and apply
interesting strategy and media to support their students in order to motivate
learning situation and avoid the students from nervous, bored and stressful while
learning reding skill especially. The used of That Was Then This Is Now Strategy
is a new solution for the teacher when they want to attract students’ attention. To
this point, this strategy has been proved to be effective strategy in teaching reading
comprehension.
2. For Students
For the students the writer suggests the students to be more active to
express and to build their ideas in reading comprehension after they have been
taught by using That Was Then This Is Now Strategy. The writer really hopes that
in the future the students could use That Was Then This Is Now Strategy as their
favourite teaching strategy while learning. So that, they can learn with fun
condition and can get maximal result in reading achievement.
56
3. For Other Researchers
For other researchers who want to conduct the research in teaching reading can
use the result of this research as a basic way for conducting the research and as an
additional references for further relavant research certainly with different
variables and conditions. The other researchers also can consider the weaknesses of
the result from this research to conduct a better research.

57
REFERENCES
Akhmadi, Ali and Ida Safrida. (2007). Smart Steps: The Smartest Way to Learn English An English Texbook for Junior High School Grade VIII. Jakarta, ID: Ganeca Exact.
Amberg, Julie and Deborah J. Vause. (2012). Language in Society. Vol, 41 p. 139- 140
Arikunto, Suharsimi. (2010). Prosedur Penelitian: Suatu Pendekatan Praktik. Jakarta, ID: PT Rineka Cipta.
Basrowi and Soenyono. (2007). Metode Analysis Data Sosial. Kediri, ID: CV. Jenggala Pustaka Utama.
Best, John W and James V. Kahn. (1993). Research in Education (7th Edition). New York, NY: Allyn and Bacon.
Brown, H. Douglas. (2004). Language Assessment: Principes and Classroom Practices. New York, NY: Pearson Education.
Brown, H. Douglas. (2007). Principle of Language Learning and Teaching (5th
Edition). New York, NY: Pearson Education.
Brunner, Juldy Tilton. (2011). I Don’t Get It: Helping Students Understand What They Read. Lanham, UK: The Rowman & Littleyield Education.kmm
Cohen, Louis et. al. (2007). Research Methods in Education. USA and Canada: Routledge.
Creswell, Jhon.W. (2012). Educational Research: Planning, Conducting, and Evaluating Quantitative and Qualitative Research (4th Edition). Boston, MA: Pearson Education Inc.
Departemen Agama RI. (1987). Al-Quran dan Terjemahannya. Bandung, ID: PT Syaamil Cipta Media.
Dietch, Betty M. (2006). Resoning and Writing Well: A Rhetoric, Research Guide, Reader, and Handbook. New York, NY: McGraw-Hill.
Fraenkel, Jack R., Norman E. Wallen, Helen H. Hyun. (2012). How to Design and Evaluate Research in Education. (8th Edition). New York, NY: Mcgraw Hill.

58
Kyzykeeva. (2006). Teaching Reading an in EFL Classroom. Russian: Becthnk KACY.
Lundberg, Ingvar and Linnakyla Pirjo. (1992). Teaching Reading around the World. Hamburg, Gem: IEA.
Manzo, Anthony V and Ula C. Manzo. (1995). Teaching Children to be Literate a Reflective Approach. USA: Ted Buchholz.
Medina, S. Lopera. (2011). Effect of Strategy Instruction in an EFL Reading Comprehension Course: A Case Study. Profile Journal Vol. 14, No 1. P. 79-89.
Moore, Kenneth D. (2005). Effective Instructional Strategies from Theory on Practice. California, USA: Sage Publication.
Nunan, David (2006). Practical English Language Teaching: Young Learners. New York, NY: McGraw-Hill Education.
Pang, Elizabeth S., Angaluki Muaka, Elizabeth B. Bernbardt and Michael L. Kamil. (2003). Teaching Reading: Educational Practices Series. France: SADAG,Bellegarde.
Priharini, A.W.D and Marta Yuliani. (2013). Bahasa Inggris untuk SMA/MA Kelasa XI Semester 1. Klaten, ID: PT Intan Pariwara.
Rahmawati, Fitrya. 2010. Using Picture-Stories to Improve The Students’ Reading Comprehension of Eighth Grade Students at SMPN 1 at Tasikmadu Karanganyar in Academic Year 2009/2010. Unpublished Undergraduate Thesis: Teacher Training and Education Sebelas Maret University Surakarta.
Richards, Jack C and Willy A Renandya. (2002). Methodology in Language Teaching: An Antholohy of Current Practice. New York, NY: Cambridge University Press.
Riznelliza, Aulia Rahmi. (2013). Teaching Descriptive Text by Combining That Was Then This Is Now Strategy and Sketch Strategy at Second Grade of Junior High School. Unpublished Undergraduate Thesis: STKIP PGRI.
Scarino, Angela and Anthony J. Liddicoat. (2009). Teaching and Learning Languages: A Guide. Australia: Commonwealth.
Sethna, Melissa. (2011). Literacy Skills and Strategies for Content Area Teacher: Comprehension and Vocabulary. Mundelein, USA: Mundelein High School.

59
Snow, Catherine. (2002). Reading for Understanding: Toward an R&D Program in Reading Comprehension. Santa Monica, CA: RAND.
Yulianto, Rina. (2013). Teaching Reading of Narrative Text by Using That Was Then This Is Now Strategy at Junior High School. Unpublished Undergraduate Thesis: STKIP PGRI.
Wardiman, Artono, Masduki B. Jahur, and M. Sukirman Djusma. (2008). English in Focus for Grade VIII Junior High School SMP/MTs. Surakarta, ID: CV. PUTRA NUGHRAHA
Zaida, Nur. (2009). Mandiri Practice Your English Competence. Jakarta, ID: Erlangga.

60
Copyright © 2022 FDOKUMEN

