


Bahasa
Halaman
Hukum

RESEARCH Open Access
The “Snacking Child” and its social network: someinsights from an italian surveyDario Gregori1*, Francesca Foltran1, Marco Ghidina2, Federica Zobec2, Simonetta Ballali3, Laura Franchin2 andPaola Berchialla4
Abstract
Background: The hypothesis underlying this work is that the social network of a child might have an impact onthe alimentary behaviors, in particular for what concerns snack consumption patterns.
Methods: 1215 Italian children 6-10 ys old were interviewed using a CATI facility in January 2010. 608 “snackers”and 607 “no-snackers” were identified. Information regarding family composition, child and relatives BMI, motherperception of child weight, child, father and mother physical activity, TV watching, social network, leisure timehabits and dietary habits of peers, were collected. Association of variables with the status of snacker wasinvestigated using a multivariable logistic regression model.
Results: Snackers children seem to be part of more numerous social network (1.40 friends vs 1.14, p = 0.042)where the majority of peers are also eating snacks, this percentage being significantly higher (89.5 vs 76.3, p <0.001) than in the “no-snacker” group. The snacking group is identified by the fact that it tends to practice at least4 hours per week of physical activity (OR: 1.36, CI: 1.03-1.9). No evidence of an association between snackingconsumption and overweight status has been shown by our study.
Conclusions: The snacking child has more active peer-to-peer social relationships, mostly related with sportactivities. However, spending leisure time in sportive activities implies being part of a social environment which isdefinitely a positive one from the point of view of obesity control, and indeed, no increase of overweight/obesityis seen in relation to snack consumption.
Keywords: snacks, overweight in children, social networks, physical activity
BackgroundChild obesity has been described as the product of aninteraction between a susceptible host and an environ-ment promoting the disease, and results when energyintake exceeds energy expenditure [1,2]. Studies finalizedto identify behaviors acting as obesity promoters havebeen mainly focused on evaluating the role of dietaryhabits in terms of energy intake source [3], and the roleof physical activity as a way to increase the energyexpenditure [4]. Moreover, recent studies have beenaddressed to understand individual, familiar and
environmental factors determining behaviors suspectedto be unhealthy [5,6].Among alimentary behaviors, snacking activity has
been identified as one potential cause of obesity and/oroverweight in childhood and adolescent [7]. FollowingHampl [8], a child who’s getting more than 15-20% ofhis/her daily caloric intake from snacks can be definedas a “snacker”. Snacks are suspected to be obesity pro-moters because they are high-fat and high-sugar foods.Nevertheless, even if the percentage of energy from diet-ary fat or from sugar has been widely investigated asdeterminant of body fat accumulation, the existence ofcausal relationships between single nutrients or foodsand obesity is controversial. In fact, while cross-sectionalstudies seem to be suggestive of an association, prospec-tive cohort studies have frequently failed in finding sucha correlation. Moreover, snacking has been related with
* Correspondence: [email protected] of Epidemiological Methods and Biostatistics, Department ofEnvironmental Medicine and Public Health, University of Padova, via Loredan18, 35031 Padova, ItalyFull list of author information is available at the end of the article
Gregori et al. Nutrition Journal 2011, 10:132http://www.nutritionj.com/content/10/1/132
© 2011 Gregori et al; licensee BioMed Central Ltd. This is an Open Access article distributed under the terms of the Creative CommonsAttribution License (http://creativecommons.org/licenses/by/2.0), which permits unrestricted use, distribution, and reproduction inany medium, provided the original work is properly cited.
other behaviors, such as TV watching, which are allbelieved to be, by itself, obesogenic; in this way, a pat-tern of potentially unhealthy behaviors has beendescribed, identifying snacking children as having asedentary lifestyle and spending the majority of leisuretime alone [9]. However, snacking is also related withsocial and group activities, as an accompanying activityduring social meetings and after them [10]. Social pat-tern of interaction are of course very different whenreferred to adults than for children. Nevertheless, forboth, the relevant support provided by social networksin maintaining health and well-being has been recentlyrecognized, but the joint effect of snacking activity andsocial relationships on obesity has been not reallyinvestigated, although several reports suggest the exis-tence of an inverse relation among these factors[11-13].The hypothesis underlying this work is that the social
network might have an impact on the alimentary beha-viors of the child, and in particular, for what is concern-ing the snacking activity, that: (i) “snacking” is not anindividual or family-restricted choice, but instead thatthe involvement of peers is relevant with respect to thisbehavior, thus implying that the probability of being a“snacker” is higher in a context were other peers arealso “snackers”, and that (ii) increased calories intakedue to “snacking” might be even compensated by achild who is inserted in a social network, if the latter isactive from the perspective of exercise and physicalactivity.To this purposes, a survey on children in Italy has
been conducted, identifying both a group of “snackers”and one of “no-snackers”, and comparing them in termsof social networks and leisure time behaviors, as well asin terms of overweight prevalence.
Materials and methodsStudy conduction and identification of the social networkThe survey has been conducted using a CATI (Compu-ter Assisted Telephone Interview) facility on 1215 chil-dren age 6-10 years, in January 2010 in Italy. Calls havebeen conducted by experienced CATI operator. Thesample has been stratified according to the definition ofsnacker, thus collecting information on 608 “snackers”and 607 “no-snackers” children.One-thousand two-hundred fifteen mothers, randomly
selected through an automated system afferent to theItalian landline phone directory have been asked toanswer directly on their child and on the group of theclosest friends of him/her, defined within a limit of 10children per referenced child. The random sample wasconstructed in a way to approximately provide an equalgeographical distribution of the families in the North, inthe Center and in the South of Italy.
InterviewsThe study is based on telephone interview on a ran-domly chosen set of mothers living in Italy and with acable-phone connection. Informed consent was obtainedfrom people interviewed before starting the set ofquestions.First, mothers answering to the phone calls were asked
to provide information useful for stratifying the child as“snacker” or “no-snacker”. Thus, the questionnaire wasdivided into 4 parts. The first part investigated on basicsociodemographic characteristics, like education, com-position of the family and work. In the second sectionmothers were asked to answer about family’s physicalcharacteristics, like weight and height. The third partassessed the behavioral aspects of their children, likeweekly hours of physical activity and more details onthe consumption patterns of snacks. The latter partregarded children’s social network; mothers were askedto answer on their children’s friends, up to a maximumof 10 children, on snacking habits, physical activitiesand perception of their nutritional status.
DefinitionsThe “snacker” has been defined as consuming at least 3or more of the following products per day: filled cakes/sweet snacks, plain cakes/sweet snacks, chocolatesnacks, sodas (no sugar-free) in can or bottle. This addsup to an average of at least 360-400 calories, whichcounts up to 18-22% of the recommended daily caloricintake for a child (about 1700-1900 calories per day inthe age class 6-10) and it is coherent with the definitionof the “snacker” as provided in the literature [8].Body mass index (BMI) was calculated as weight (kg)/
height2 (m). According to the present guidelines, inadults, normal weight, overweight and obesity weredefined as a BMI < 25.0 kg/m2, 25.0- 29.9 kg/m2, and ≥30.0 kg/m2, respectively [14]. Data on weight and heightof the child, used to compute the BMI were updated in76% of the cases to the last three months and they, inthe remaining 24%, never exceeded the year. Childrenwere defined as obese according to the percentile towhich they were belonging, according to their age, asindicated from the CDC (Centers for Disease Controland Prevention) pediatric growths charts [15]; thus, theywere defined as “at risk for overweight” if their weightwas between the 85th and the 95th percentile and as“overweight” is greater than the 95th percentile [16].CDC pediatrics growth charts were chosen as recom-mended when assessing growth’s parameters of childrenolder than 2 years [17,18].
Statistical MethodsContinuous variables are expressed as median and inter-quartile difference and categorical variables as
Gregori et al. Nutrition Journal 2011, 10:132http://www.nutritionj.com/content/10/1/132
Page 2 of 10
percentages and absolute numbers. Differences betweengroups were compared using Wilcoxon and McNemaror Chi-Square tests [19,20], as appropriate.All variables investigated are listed in Tables 1 and 2.
Association of variables with the status of snacker hasbeen investigated using a multivariable logistic regres-sion model. Association of variables with the BMI levelof the children in the “snacker” group has been investi-gated using a multivariable linear regression model. Thefollowing model building strategy applies to both mod-els. Variables related (with a maximum p-value of theassociation, as resulting in the univariable analysis, of0.25), to the network around the snacker have been alsoinserted in the model and final estimates have beenadjusted for inter-network correlation using a Huber-White estimating equation approach.All variables considered were entered into the model
“as is”, i.e. without any transformation or cutting-off. Ifa significant non-linearity using a score test was found,in relating the covariate’s effect with survival, the speci-fic covariate’s effect was modeled using a restrictedcubic spline. Selection criteria was the AIC (AkaikeInformation Criterion) applied backward for selectingsignificant covariates. The final model for each of thethree steps was selected if superior in terms of AIC at asignificance level of 0.05 and p-values have been expli-citly indicated if below the 0.25 threshold, otherwise the“NS” indication is used.To account for possible overfitting in the regression
models secondary to high ratio between covariates andevents, cross-validation and bootstrap (200 runs) techni-ques were applied. For the logistic regression model,Somer’s concordance Index Dxy (the closer to one inabsolute value the better) were obtained and evaluatedfor this purpose.Multivariate Odds Ratios have been presented along
with their 95% confidence intervals for the logisticregression model, whereas for the linear regressionmodel effects on BMI scale have been presented alongwith their 95% confidence levels.The statistical significance was settled at a p-value
<0.05. The R System (release 2.7.0) statistical packageand the Harrell’s Design and Hmisc libraries were usedfor analysis.
ResultsThe interviews were balanced by design in terms of geo-graphical distribution, with 326 (26.8%) in the North,422 (34.7%) in the Center and 467 (38.4%) in the Southof Italy.The sample is described in Table 1 for what concerns
family characteristics and in Table 2 for what regardschildren.
SnacksThe snacking activity, according to the definitionadopted in the study, was eating at least three snacksper day. The distribution of snacks were: Plain cakes230 (39.2%), Cream filled cakes 336 (57.2%), Chocolatecakes 227 (38.7%), Sugar sodas 299 (50.9%) and othertypes 16 (2.7%).
The social networkThe network around the reference child is described inTable 3. The social network identified according thestrict rules adopted in the study was composed by onaverage 1.27 friends per child surveyed, slightly but sig-nificantly higher for “snackers” than for “no-snackers”(1.40 vs 1.14, p = 0.042).
Multivariable analysis for characterizing the “snacker”To understand which individual, familiar or social net-work characteristics are associated with the status of“snacker”, a multivariable model has been built, follow-ing the variable selection procedure as described in thestatistical section among all variables listed in Table 1and in Table 2. Results of the multivariable model arepresented in Table 4.
Multivariable analysis for the BMI levels in the “snacker”groupTo understand which individual, familiar or social net-work characteristics are associated with any given BMIof the “snacker”, a multivariable model has been built,following the variable selection procedure as describedin the statistical section among all variables listed inTable 1 and in Table 2 but limited to the group of the608 “snackers”. Results from this multivariable analysisare shown in Table 5.
DiscussionFamiliar and social environment role in determiningsnacking activityResults of the limited research on behavioral mediatorsof familial patterns of overweight indicate that parents’own eating behaviors and parenting practices influencethe development of children’s eating behaviors, mediat-ing familial patterns of overweight. Parents provide foodenvironments for their children’s early experiences withfood and eating, and overweight parents seem to selectenvironments that promote overweight among theirchildren [21].In our study two parental characteristics have been
evaluated in relation to child eating behavior: parentalBMI and parental habit to practice physical activity.No association between fathers’ BMI and child snack-
ing consumption has been found, while the association
Gregori et al. Nutrition Journal 2011, 10:132http://www.nutritionj.com/content/10/1/132
Page 3 of 10
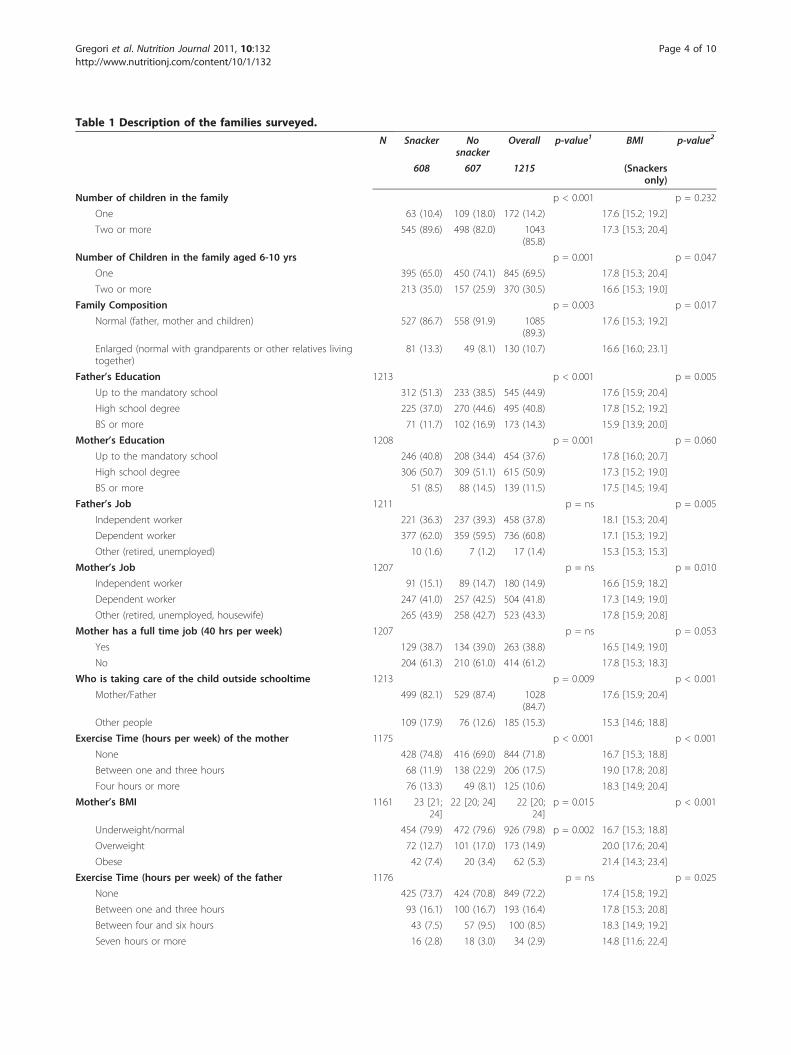
Table 1 Description of the families surveyed.
N Snacker Nosnacker
Overall p-value1 BMI p-value2
608 607 1215 (Snackersonly)
Number of children in the family p < 0.001 p = 0.232
One 63 (10.4) 109 (18.0) 172 (14.2) 17.6 [15.2; 19.2]
Two or more 545 (89.6) 498 (82.0) 1043(85.8)
17.3 [15.3; 20.4]
Number of Children in the family aged 6-10 yrs p = 0.001 p = 0.047
One 395 (65.0) 450 (74.1) 845 (69.5) 17.8 [15.3; 20.4]
Two or more 213 (35.0) 157 (25.9) 370 (30.5) 16.6 [15.3; 19.0]
Family Composition p = 0.003 p = 0.017
Normal (father, mother and children) 527 (86.7) 558 (91.9) 1085(89.3)
17.6 [15.3; 19.2]
Enlarged (normal with grandparents or other relatives livingtogether)
81 (13.3) 49 (8.1) 130 (10.7) 16.6 [16.0; 23.1]
Father’s Education 1213 p < 0.001 p = 0.005
Up to the mandatory school 312 (51.3) 233 (38.5) 545 (44.9) 17.6 [15.9; 20.4]
High school degree 225 (37.0) 270 (44.6) 495 (40.8) 17.8 [15.2; 19.2]
BS or more 71 (11.7) 102 (16.9) 173 (14.3) 15.9 [13.9; 20.0]
Mother’s Education 1208 p = 0.001 p = 0.060
Up to the mandatory school 246 (40.8) 208 (34.4) 454 (37.6) 17.8 [16.0; 20.7]
High school degree 306 (50.7) 309 (51.1) 615 (50.9) 17.3 [15.2; 19.0]
BS or more 51 (8.5) 88 (14.5) 139 (11.5) 17.5 [14.5; 19.4]
Father’s Job 1211 p = ns p = 0.005
Independent worker 221 (36.3) 237 (39.3) 458 (37.8) 18.1 [15.3; 20.4]
Dependent worker 377 (62.0) 359 (59.5) 736 (60.8) 17.1 [15.3; 19.2]
Other (retired, unemployed) 10 (1.6) 7 (1.2) 17 (1.4) 15.3 [15.3; 15.3]
Mother’s Job 1207 p = ns p = 0.010
Independent worker 91 (15.1) 89 (14.7) 180 (14.9) 16.6 [15.9; 18.2]
Dependent worker 247 (41.0) 257 (42.5) 504 (41.8) 17.3 [14.9; 19.0]
Other (retired, unemployed, housewife) 265 (43.9) 258 (42.7) 523 (43.3) 17.8 [15.9; 20.8]
Mother has a full time job (40 hrs per week) 1207 p = ns p = 0.053
Yes 129 (38.7) 134 (39.0) 263 (38.8) 16.5 [14.9; 19.0]
No 204 (61.3) 210 (61.0) 414 (61.2) 17.8 [15.3; 18.3]
Who is taking care of the child outside schooltime 1213 p = 0.009 p < 0.001
Mother/Father 499 (82.1) 529 (87.4) 1028(84.7)
17.6 [15.9; 20.4]
Other people 109 (17.9) 76 (12.6) 185 (15.3) 15.3 [14.6; 18.8]
Exercise Time (hours per week) of the mother 1175 p < 0.001 p < 0.001
None 428 (74.8) 416 (69.0) 844 (71.8) 16.7 [15.3; 18.8]
Between one and three hours 68 (11.9) 138 (22.9) 206 (17.5) 19.0 [17.8; 20.8]
Four hours or more 76 (13.3) 49 (8.1) 125 (10.6) 18.3 [14.9; 20.4]
Mother’s BMI 1161 23 [21;24]
22 [20; 24] 22 [20;24]
p = 0.015 p < 0.001
Underweight/normal 454 (79.9) 472 (79.6) 926 (79.8) p = 0.002 16.7 [15.3; 18.8]
Overweight 72 (12.7) 101 (17.0) 173 (14.9) 20.0 [17.6; 20.4]
Obese 42 (7.4) 20 (3.4) 62 (5.3) 21.4 [14.3; 23.4]
Exercise Time (hours per week) of the father 1176 p = ns p = 0.025
None 425 (73.7) 424 (70.8) 849 (72.2) 17.4 [15.8; 19.2]
Between one and three hours 93 (16.1) 100 (16.7) 193 (16.4) 17.8 [15.3; 20.8]
Between four and six hours 43 (7.5) 57 (9.5) 100 (8.5) 18.3 [14.9; 19.2]
Seven hours or more 16 (2.8) 18 (3.0) 34 (2.9) 14.8 [11.6; 22.4]
Gregori et al. Nutrition Journal 2011, 10:132http://www.nutritionj.com/content/10/1/132
Page 4 of 10
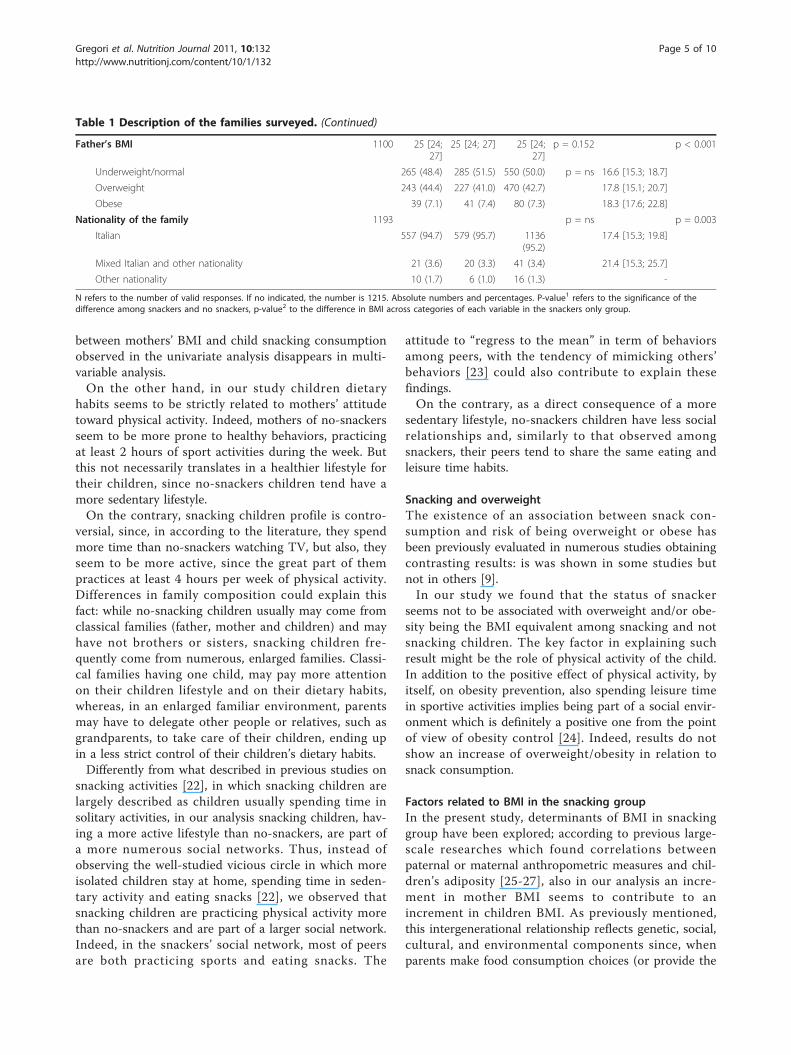
between mothers’ BMI and child snacking consumptionobserved in the univariate analysis disappears in multi-variable analysis.On the other hand, in our study children dietary
habits seems to be strictly related to mothers’ attitudetoward physical activity. Indeed, mothers of no-snackersseem to be more prone to healthy behaviors, practicingat least 2 hours of sport activities during the week. Butthis not necessarily translates in a healthier lifestyle fortheir children, since no-snackers children tend have amore sedentary lifestyle.On the contrary, snacking children profile is contro-
versial, since, in according to the literature, they spendmore time than no-snackers watching TV, but also, theyseem to be more active, since the great part of thempractices at least 4 hours per week of physical activity.Differences in family composition could explain thisfact: while no-snacking children usually may come fromclassical families (father, mother and children) and mayhave not brothers or sisters, snacking children fre-quently come from numerous, enlarged families. Classi-cal families having one child, may pay more attentionon their children lifestyle and on their dietary habits,whereas, in an enlarged familiar environment, parentsmay have to delegate other people or relatives, such asgrandparents, to take care of their children, ending upin a less strict control of their children’s dietary habits.Differently from what described in previous studies on
snacking activities [22], in which snacking children arelargely described as children usually spending time insolitary activities, in our analysis snacking children, hav-ing a more active lifestyle than no-snackers, are part ofa more numerous social networks. Thus, instead ofobserving the well-studied vicious circle in which moreisolated children stay at home, spending time in seden-tary activity and eating snacks [22], we observed thatsnacking children are practicing physical activity morethan no-snackers and are part of a larger social network.Indeed, in the snackers’ social network, most of peersare both practicing sports and eating snacks. The
attitude to “regress to the mean” in term of behaviorsamong peers, with the tendency of mimicking others’behaviors [23] could also contribute to explain thesefindings.On the contrary, as a direct consequence of a more
sedentary lifestyle, no-snackers children have less socialrelationships and, similarly to that observed amongsnackers, their peers tend to share the same eating andleisure time habits.
Snacking and overweightThe existence of an association between snack con-sumption and risk of being overweight or obese hasbeen previously evaluated in numerous studies obtainingcontrasting results: is was shown in some studies butnot in others [9].In our study we found that the status of snacker
seems not to be associated with overweight and/or obe-sity being the BMI equivalent among snacking and notsnacking children. The key factor in explaining suchresult might be the role of physical activity of the child.In addition to the positive effect of physical activity, byitself, on obesity prevention, also spending leisure timein sportive activities implies being part of a social envir-onment which is definitely a positive one from the pointof view of obesity control [24]. Indeed, results do notshow an increase of overweight/obesity in relation tosnack consumption.
Factors related to BMI in the snacking groupIn the present study, determinants of BMI in snackinggroup have been explored; according to previous large-scale researches which found correlations betweenpaternal or maternal anthropometric measures and chil-dren’s adiposity [25-27], also in our analysis an incre-ment in mother BMI seems to contribute to anincrement in children BMI. As previously mentioned,this intergenerational relationship reflects genetic, social,cultural, and environmental components since, whenparents make food consumption choices (or provide the
Table 1 Description of the families surveyed. (Continued)
Father’s BMI 1100 25 [24;27]
25 [24; 27] 25 [24;27]
p = 0.152 p < 0.001
Underweight/normal 265 (48.4) 285 (51.5) 550 (50.0) p = ns 16.6 [15.3; 18.7]
Overweight 243 (44.4) 227 (41.0) 470 (42.7) 17.8 [15.1; 20.7]
Obese 39 (7.1) 41 (7.4) 80 (7.3) 18.3 [17.6; 22.8]
Nationality of the family 1193 p = ns p = 0.003
Italian 557 (94.7) 579 (95.7) 1136(95.2)
17.4 [15.3; 19.8]
Mixed Italian and other nationality 21 (3.6) 20 (3.3) 41 (3.4) 21.4 [15.3; 25.7]
Other nationality 10 (1.7) 6 (1.0) 16 (1.3) -
N refers to the number of valid responses. If no indicated, the number is 1215. Absolute numbers and percentages. P-value1 refers to the significance of thedifference among snackers and no snackers, p-value2 to the difference in BMI across categories of each variable in the snackers only group.
Gregori et al. Nutrition Journal 2011, 10:132http://www.nutritionj.com/content/10/1/132
Page 5 of 10
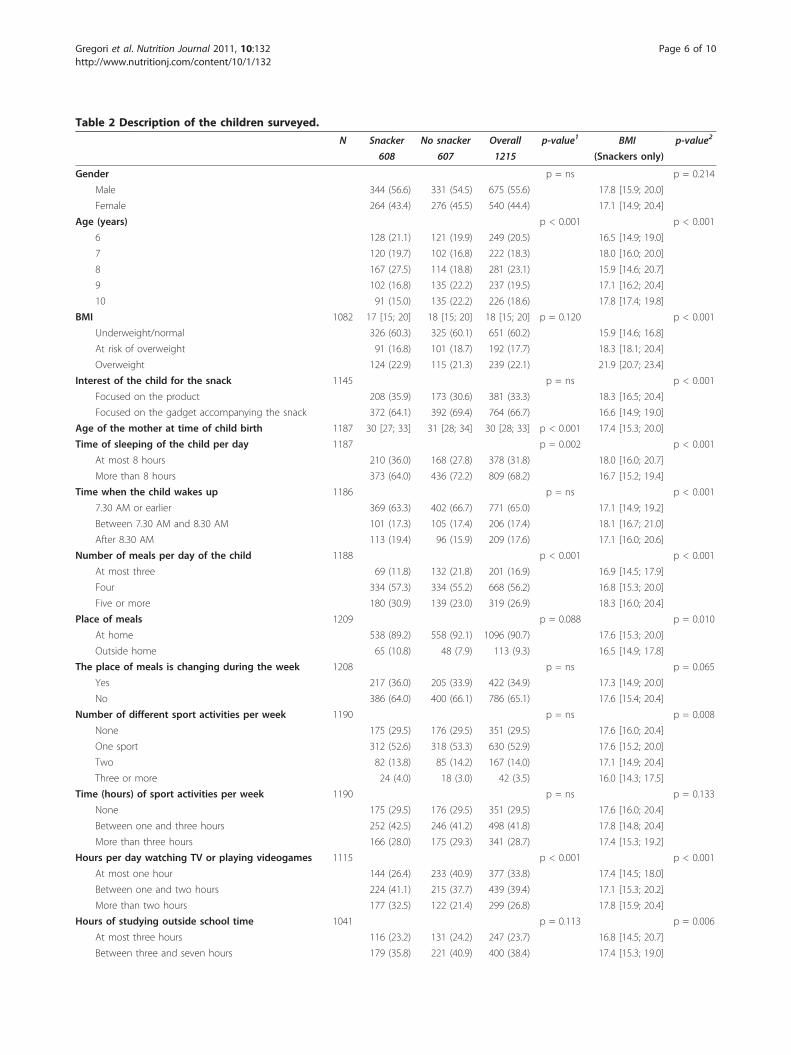
Table 2 Description of the children surveyed.
N Snacker No snacker Overall p-value1 BMI p-value2
608 607 1215 (Snackers only)
Gender p = ns p = 0.214
Male 344 (56.6) 331 (54.5) 675 (55.6) 17.8 [15.9; 20.0]
Female 264 (43.4) 276 (45.5) 540 (44.4) 17.1 [14.9; 20.4]
Age (years) p < 0.001 p < 0.001
6 128 (21.1) 121 (19.9) 249 (20.5) 16.5 [14.9; 19.0]
7 120 (19.7) 102 (16.8) 222 (18.3) 18.0 [16.0; 20.0]
8 167 (27.5) 114 (18.8) 281 (23.1) 15.9 [14.6; 20.7]
9 102 (16.8) 135 (22.2) 237 (19.5) 17.1 [16.2; 20.4]
10 91 (15.0) 135 (22.2) 226 (18.6) 17.8 [17.4; 19.8]
BMI 1082 17 [15; 20] 18 [15; 20] 18 [15; 20] p = 0.120 p < 0.001
Underweight/normal 326 (60.3) 325 (60.1) 651 (60.2) 15.9 [14.6; 16.8]
At risk of overweight 91 (16.8) 101 (18.7) 192 (17.7) 18.3 [18.1; 20.4]
Overweight 124 (22.9) 115 (21.3) 239 (22.1) 21.9 [20.7; 23.4]
Interest of the child for the snack 1145 p = ns p < 0.001
Focused on the product 208 (35.9) 173 (30.6) 381 (33.3) 18.3 [16.5; 20.4]
Focused on the gadget accompanying the snack 372 (64.1) 392 (69.4) 764 (66.7) 16.6 [14.9; 19.0]
Age of the mother at time of child birth 1187 30 [27; 33] 31 [28; 34] 30 [28; 33] p < 0.001 17.4 [15.3; 20.0]
Time of sleeping of the child per day 1187 p = 0.002 p < 0.001
At most 8 hours 210 (36.0) 168 (27.8) 378 (31.8) 18.0 [16.0; 20.7]
More than 8 hours 373 (64.0) 436 (72.2) 809 (68.2) 16.7 [15.2; 19.4]
Time when the child wakes up 1186 p = ns p < 0.001
7.30 AM or earlier 369 (63.3) 402 (66.7) 771 (65.0) 17.1 [14.9; 19.2]
Between 7.30 AM and 8.30 AM 101 (17.3) 105 (17.4) 206 (17.4) 18.1 [16.7; 21.0]
After 8.30 AM 113 (19.4) 96 (15.9) 209 (17.6) 17.1 [16.0; 20.6]
Number of meals per day of the child 1188 p < 0.001 p < 0.001
At most three 69 (11.8) 132 (21.8) 201 (16.9) 16.9 [14.5; 17.9]
Four 334 (57.3) 334 (55.2) 668 (56.2) 16.8 [15.3; 20.0]
Five or more 180 (30.9) 139 (23.0) 319 (26.9) 18.3 [16.0; 20.4]
Place of meals 1209 p = 0.088 p = 0.010
At home 538 (89.2) 558 (92.1) 1096 (90.7) 17.6 [15.3; 20.0]
Outside home 65 (10.8) 48 (7.9) 113 (9.3) 16.5 [14.9; 17.8]
The place of meals is changing during the week 1208 p = ns p = 0.065
Yes 217 (36.0) 205 (33.9) 422 (34.9) 17.3 [14.9; 20.0]
No 386 (64.0) 400 (66.1) 786 (65.1) 17.6 [15.4; 20.4]
Number of different sport activities per week 1190 p = ns p = 0.008
None 175 (29.5) 176 (29.5) 351 (29.5) 17.6 [16.0; 20.4]
One sport 312 (52.6) 318 (53.3) 630 (52.9) 17.6 [15.2; 20.0]
Two 82 (13.8) 85 (14.2) 167 (14.0) 17.1 [14.9; 20.4]
Three or more 24 (4.0) 18 (3.0) 42 (3.5) 16.0 [14.3; 17.5]
Time (hours) of sport activities per week 1190 p = ns p = 0.133
None 175 (29.5) 176 (29.5) 351 (29.5) 17.6 [16.0; 20.4]
Between one and three hours 252 (42.5) 246 (41.2) 498 (41.8) 17.8 [14.8; 20.4]
More than three hours 166 (28.0) 175 (29.3) 341 (28.7) 17.4 [15.3; 19.2]
Hours per day watching TV or playing videogames 1115 p < 0.001 p < 0.001
At most one hour 144 (26.4) 233 (40.9) 377 (33.8) 17.4 [14.5; 18.0]
Between one and two hours 224 (41.1) 215 (37.7) 439 (39.4) 17.1 [15.3; 20.2]
More than two hours 177 (32.5) 122 (21.4) 299 (26.8) 17.8 [15.9; 20.4]
Hours of studying outside school time 1041 p = 0.113 p = 0.006
At most three hours 116 (23.2) 131 (24.2) 247 (23.7) 16.8 [14.5; 20.7]
Between three and seven hours 179 (35.8) 221 (40.9) 400 (38.4) 17.4 [15.3; 19.0]
Gregori et al. Nutrition Journal 2011, 10:132http://www.nutritionj.com/content/10/1/132
Page 6 of 10
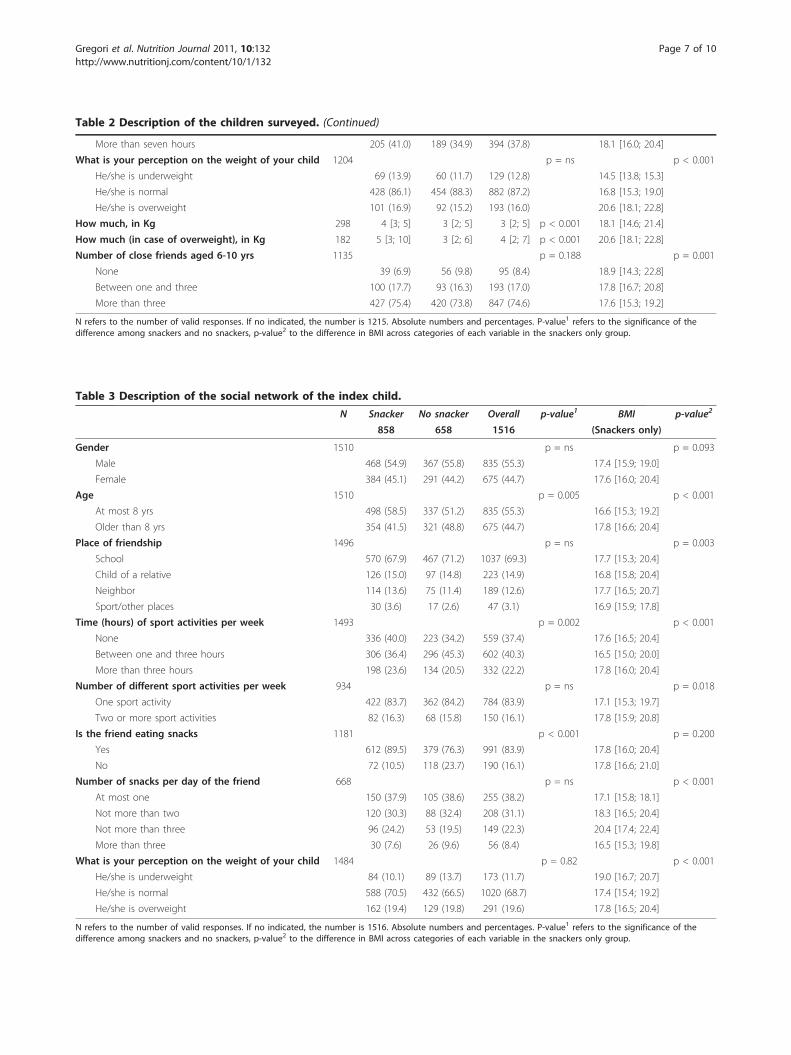
Table 2 Description of the children surveyed. (Continued)
More than seven hours 205 (41.0) 189 (34.9) 394 (37.8) 18.1 [16.0; 20.4]
What is your perception on the weight of your child 1204 p = ns p < 0.001
He/she is underweight 69 (13.9) 60 (11.7) 129 (12.8) 14.5 [13.8; 15.3]
He/she is normal 428 (86.1) 454 (88.3) 882 (87.2) 16.8 [15.3; 19.0]
He/she is overweight 101 (16.9) 92 (15.2) 193 (16.0) 20.6 [18.1; 22.8]
How much, in Kg 298 4 [3; 5] 3 [2; 5] 3 [2; 5] p < 0.001 18.1 [14.6; 21.4]
How much (in case of overweight), in Kg 182 5 [3; 10] 3 [2; 6] 4 [2; 7] p < 0.001 20.6 [18.1; 22.8]
Number of close friends aged 6-10 yrs 1135 p = 0.188 p = 0.001
None 39 (6.9) 56 (9.8) 95 (8.4) 18.9 [14.3; 22.8]
Between one and three 100 (17.7) 93 (16.3) 193 (17.0) 17.8 [16.7; 20.8]
More than three 427 (75.4) 420 (73.8) 847 (74.6) 17.6 [15.3; 19.2]
N refers to the number of valid responses. If no indicated, the number is 1215. Absolute numbers and percentages. P-value1 refers to the significance of thedifference among snackers and no snackers, p-value2 to the difference in BMI across categories of each variable in the snackers only group.
Table 3 Description of the social network of the index child.
N Snacker No snacker Overall p-value1 BMI p-value2
858 658 1516 (Snackers only)
Gender 1510 p = ns p = 0.093
Male 468 (54.9) 367 (55.8) 835 (55.3) 17.4 [15.9; 19.0]
Female 384 (45.1) 291 (44.2) 675 (44.7) 17.6 [16.0; 20.4]
Age 1510 p = 0.005 p < 0.001
At most 8 yrs 498 (58.5) 337 (51.2) 835 (55.3) 16.6 [15.3; 19.2]
Older than 8 yrs 354 (41.5) 321 (48.8) 675 (44.7) 17.8 [16.6; 20.4]
Place of friendship 1496 p = ns p = 0.003
School 570 (67.9) 467 (71.2) 1037 (69.3) 17.7 [15.3; 20.4]
Child of a relative 126 (15.0) 97 (14.8) 223 (14.9) 16.8 [15.8; 20.4]
Neighbor 114 (13.6) 75 (11.4) 189 (12.6) 17.7 [16.5; 20.7]
Sport/other places 30 (3.6) 17 (2.6) 47 (3.1) 16.9 [15.9; 17.8]
Time (hours) of sport activities per week 1493 p = 0.002 p < 0.001
None 336 (40.0) 223 (34.2) 559 (37.4) 17.6 [16.5; 20.4]
Between one and three hours 306 (36.4) 296 (45.3) 602 (40.3) 16.5 [15.0; 20.0]
More than three hours 198 (23.6) 134 (20.5) 332 (22.2) 17.8 [16.0; 20.4]
Number of different sport activities per week 934 p = ns p = 0.018
One sport activity 422 (83.7) 362 (84.2) 784 (83.9) 17.1 [15.3; 19.7]
Two or more sport activities 82 (16.3) 68 (15.8) 150 (16.1) 17.8 [15.9; 20.8]
Is the friend eating snacks 1181 p < 0.001 p = 0.200
Yes 612 (89.5) 379 (76.3) 991 (83.9) 17.8 [16.0; 20.4]
No 72 (10.5) 118 (23.7) 190 (16.1) 17.8 [16.6; 21.0]
Number of snacks per day of the friend 668 p = ns p < 0.001
At most one 150 (37.9) 105 (38.6) 255 (38.2) 17.1 [15.8; 18.1]
Not more than two 120 (30.3) 88 (32.4) 208 (31.1) 18.3 [16.5; 20.4]
Not more than three 96 (24.2) 53 (19.5) 149 (22.3) 20.4 [17.4; 22.4]
More than three 30 (7.6) 26 (9.6) 56 (8.4) 16.5 [15.3; 19.8]
What is your perception on the weight of your child 1484 p = 0.82 p < 0.001
He/she is underweight 84 (10.1) 89 (13.7) 173 (11.7) 19.0 [16.7; 20.7]
He/she is normal 588 (70.5) 432 (66.5) 1020 (68.7) 17.4 [15.4; 19.2]
He/she is overweight 162 (19.4) 129 (19.8) 291 (19.6) 17.8 [16.5; 20.4]
N refers to the number of valid responses. If no indicated, the number is 1516. Absolute numbers and percentages. P-value1 refers to the significance of thedifference among snackers and no snackers, p-value2 to the difference in BMI across categories of each variable in the snackers only group.
Gregori et al. Nutrition Journal 2011, 10:132http://www.nutritionj.com/content/10/1/132
Page 7 of 10
feasible food consumption set) for children for mealseaten at home, this common environment generates acorrelation between generations when both eatunhealthy (or healthy) food together [28].Moreover, a positive relationship between maternal
age and children BMI has also been found, suggestingthat younger mothers tend to pay more attention totheir children’s dietary habits or to encourage them topractice sport.As expected, energy balance-related behaviors, includ-
ing sport activity, studying and watching TV are relatedto children BMI: an increment in the first one induces aBMI reduction, while, more time spent in sedentaryactivity determines a BMI increasing, as expected.Finally, as observed elsewhere [29], a positive relation-
ship between low income (indirectly measured here bythe municipality income) and body weight seems toexist: the association of child and household food inse-curity with childhood overweight has been demonstratedin several studies [30]; moreover, children in low-income families could experience adverse psychosocialconditions which may contribute to poor eating habitsand lower physical activity levels [31].
Study limitationsThis study is a survey, without direct interactionbetween the investigator and the interviewed people andthus relying only on self-reported measurements forwhat concerns anthropometric characteristics, physicalactivity levels and dietary patterns. Although this
approach has been widely used [32], it still presents thegeneral limitation of such approaches, like reportingbias, barrier effect leading to interview refusal, tendencyof ameliorant responses in presence of sensitive ques-tions [31]. The authors used interview and analysis tech-niques to reduce each of such potential biases, like theinvolvement of only highly experienced interviewers ininterview conduction and multivariable modeling forconfounding adjustment.
Final remarksNo evidence of an association between snacking con-sumption and overweight status has been shown by ourstudy. This fact can be explained by the different atti-tude toward physical activity observed in snackers andno-snackers: in fact, differently from common findingsin scientific literature, in our study the snacking childcan be described as practicing sport more than no-sna-kers and, as a consequence, having more active peer-to-peer social relationships, mostly related with sport activ-ities. Among snackers, factors traditionally related tobody weight such as mother BMI, energy balance-related behaviors and municipality income have beenconfirmed as major determinants of children BMI.
ConclusionsObesity control appeared to be positively influenced bypeer-to-peer social relationships, especially those relatedto sport activities. Snacking behavior didn’t presentassociation with overweight and obesity, that instead
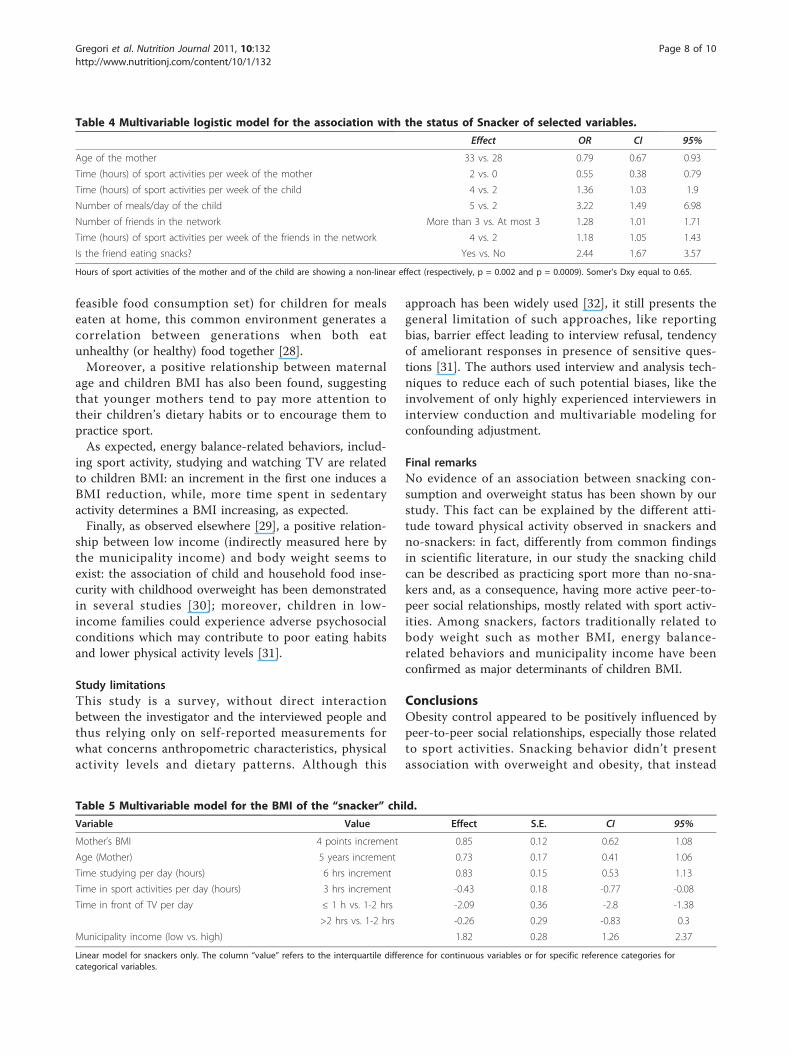
Table 4 Multivariable logistic model for the association with the status of Snacker of selected variables.
Effect OR CI 95%
Age of the mother 33 vs. 28 0.79 0.67 0.93
Time (hours) of sport activities per week of the mother 2 vs. 0 0.55 0.38 0.79
Time (hours) of sport activities per week of the child 4 vs. 2 1.36 1.03 1.9
Number of meals/day of the child 5 vs. 2 3.22 1.49 6.98
Number of friends in the network More than 3 vs. At most 3 1.28 1.01 1.71
Time (hours) of sport activities per week of the friends in the network 4 vs. 2 1.18 1.05 1.43
Is the friend eating snacks? Yes vs. No 2.44 1.67 3.57
Hours of sport activities of the mother and of the child are showing a non-linear effect (respectively, p = 0.002 and p = 0.0009). Somer’s Dxy equal to 0.65.
Table 5 Multivariable model for the BMI of the “snacker” child.
Variable Value Effect S.E. CI 95%
Mother’s BMI 4 points increment 0.85 0.12 0.62 1.08
Age (Mother) 5 years increment 0.73 0.17 0.41 1.06
Time studying per day (hours) 6 hrs increment 0.83 0.15 0.53 1.13
Time in sport activities per day (hours) 3 hrs increment -0.43 0.18 -0.77 -0.08
Time in front of TV per day ≤ 1 h vs. 1-2 hrs -2.09 0.36 -2.8 -1.38
>2 hrs vs. 1-2 hrs -0.26 0.29 -0.83 0.3
Municipality income (low vs. high) 1.82 0.28 1.26 2.37
Linear model for snackers only. The column “value” refers to the interquartile difference for continuous variables or for specific reference categories forcategorical variables.
Gregori et al. Nutrition Journal 2011, 10:132http://www.nutritionj.com/content/10/1/132
Page 8 of 10
were linked with families’ characteristics, like income orparents’ age and BMI. These conclusions point out thechiefly role of energy expenditure in regulating theenergy gap, stressing the necessity of to consider obesityas a multifactorial disease, influenced by social beha-viors, in first instance related with the familiarenvironment.
List of abbreviationsAIC: Akaike Information Criterion; BMI: Body Mass Index; CATI: ComputerAssisted Telephone Interview; CDC: Centers for Disease Control andPrevention; CI: Interval of Confidence; NS: Non Significant; OR: Odds Ratio
AcknowledgementsThe authors would like to thank Zeta Research’s CATI team for its role indata collection.This research was partially funded by an unrestricted grant of the Universityof Padova and of Prochild ONLUS. The research did benefit also from atechnical grant of ZETA Research Ltd for conducting the Survey.
Author details1Laboratory of Epidemiological Methods and Biostatistics, Department ofEnvironmental Medicine and Public Health, University of Padova, via Loredan18, 35031 Padova, Italy. 2ZETA Research Inc., via Caccia 8, 34129 Trieste, Italy.3Prochild ONLUS, Piazza San Giovanni 2, 34122 Trieste, Italy. 4Department ofPublic Health and Microbiology, University of Torino, via Santena 5 bis,10126 Torino, Italy.
Authors’ contributionsDG conceived the study, participated in its design and performed thestatistical analysis; FF participated in the design of the study andcoordinated and helped to draft the manuscript. MG coordinated datacollection and participated in statistical analysis. FZ implemented andsupervised survey conduction. SB participated in manuscript drafting. LFparticipated in manuscript drafting. PB performed the statistical analysis. Allauthors read and approved the final manuscript.
Competing interestsThe authors declare that they have no competing interests.
Received: 22 August 2011 Accepted: 29 November 2011Published: 29 November 2011
References1. James PT, Leach R, Kalamara E, Shayeghi M: The worldwide obesity
epidemic. Obes Res 2001, 9(Suppl 4):228S-233S.2. Bray GA, Bellanger T: Epidemiology, trends, and morbidities of obesity
and the metabolic syndrome. Endocrine 2006, 29(1):109-117.3. Campbell KJ, Crawford DA, Ball K: Family food environment and dietary
behaviors likely to promote fatness in 5-6 year-old children. Int J Obes(Lond) 2006, 30(8):1272-1280.
4. Janssen I, Katzmarzyk PT, Boyce WF, Vereecken C, Mulvihill C, Roberts C,Currie C, Pickett W: Comparison of overweight and obesity prevalence inschool-aged youth from 34 countries and their relationships withphysical activity and dietary patterns. Obes Rev 2005, 6(2):123-132.
5. van der Horst K, Oenema A, Ferreira I, Wendel-Vos W, Giskes K, vanLenthe F, Brug J: A systematic review of environmental correlates ofobesity-related dietary behaviors in youth. Health Educ Res 2007,22(2):203-226.
6. Campbell KJ, Crawford DA, Salmon J, Carver A, Garnett SP, Baur LA:Associations between the home food environment and obesity-promoting eating behaviors in adolescence. Obesity (Silver Spring) 2007,15(3):719-730.
7. Erlanson-Albertsson C, Zetterstrom R: The global obesity epidemic:snacking and obesity may start with free meals during infant feeding.Acta Paediatr 2005, 94(11):1523-1531.
8. Hampl JS, Heaton CL, Taylor CA: Snacking patterns influence energy andnutrient intakes but not body mass index. J Hum Nutr Diet 2003,16(1):3-11.
9. Miller SA, Taveras EM, Rifas-Shiman SL, Gillman MW: Association betweentelevision viewing and poor diet quality in young children. Int J PediatrObes 2008, 3(3):168-176.
10. Ginioux C, Grousset J, Mestari S, Ruiz F: [Prevalence of obesity in childrenand adolescents attending school in Seine Saint-Denis]. Sante publique(Vandoeuvre-les-Nancy, France) 2006, 18(3):389-400.
11. Hainer V, Toplak H, Mitrakou A: Treatment modalities of obesity: what fitswhom? Diabetes care 2008, 31(Suppl 2):S269-277.
12. Browne D: Exercise by prescription. Journal of the Royal Society of Health1997, 117(1):52-55.
13. Brownell KD, Kaye FS: A school-based behavior modification, nutritioneducation, and physical activity program for obese children. TheAmerican journal of clinical nutrition 1982, 35(2):277-283.
14. Clinical guidelines on the identification, evaluation, and treatment ofoverweight and obesity in adults: executive summary. Expert Panel onthe Identification, Evaluation, and Treatment of Overweight in Adults.Am J Clin Nutr 1998, 68(4):899-917.
15. CDC Pediatric Growth Charts. [http://www.cdc.gov/growthcharts].16. Barlow SE, Dietz WH: Obesity evaluation and treatment: Expert
Committee recommendations. The Maternal and Child Health Bureau,Health Resources and Services Administration and the Department ofHealth and Human Services. Pediatrics 1998, 102(3):E29.
17. Lama More RA, Alonso Franch A, Gil-Campos M, Leis Trabazo R, MartinezSuarez V, Morais Lopez A, Moreno Villares JM, Pedron Giner MC: [Childhoodobesity. Recommendations of the Nutrition Committee of the SpanishAssociation of Pediatrics. Part I. Prevention. Early detection. Role of thepediatrician]. An Pediatr (Barc) 2006, 65(6):607-615.
18. Birch LL, Parker L, A B, (eds): Early Childhood Obesity Prevention PoliciesCommittee on Obesity Prevention Policies for Young Children. 2011.
19. McNemar Q: Note on the sampling error of the difference betweencorrelated proportions or percentages. Psychometrika 1947, 12(2):153-157.
20. Wilcoxon F: Individual comparisons of grouped data by rankingmethods. J Econ Entomol 1946, 39:269.
21. Rozin P: The meaning of food in our lives: a cross-cultural perspectiveon eating and well-being. Journal of nutrition education and behavior 2005,37(Suppl 2):S107-112.
22. Gubbels JS, Kremers SP, Stafleu A, Dagnelie PC, de Vries SI, de Vries NK,Thijs C: Clustering of dietary intake and sedentary behavior in 2-year-oldchildren. The Journal of pediatrics 2009, 155(2):194-198.
23. van der Horst K, Timperio A, Crawford D, Roberts R, Brug J, Oenema A: Theschool food environment associations with adolescent soft drink andsnack consumption. Am J Prev Med 2008, 35(3):217-223.
24. Lindsay AC, Sussner KM, Greaney ML, Peterson KE: Influence of SocialContext on Eating, Physical Activity, and Sedentary Behaviors of LatinaMothers and Their Preschool-Age Children. Health Educ Behav 2009,36(1):81-96.
25. Lake JK, Power C, Cole TJ: Child to adult body mass index in the 1958British birth cohort: associations with parental obesity. Archives of diseasein childhood 1997, 77(5):376-381.
26. Danielzik S, Langnase K, Mast M, Spethmann C, Muller MJ: Impact ofparental BMI on the manifestation of overweight 5-7 year old children.Eur J Nutr 2002, 41(3):132-138.
27. Sekine M, Yamagami T, Hamanishi S, Handa K, Saito T, Nanri S,Kawaminami K, Tokui N, Yoshida K, Kagamimori S: Parental obesity,lifestyle factors and obesity in preschool children: results of the ToyamaBirth Cohort study. J Epidemiol 2002, 12(1):33-39.
28. Classen TJ: Measures of the intergenerational transmission of body massindex between mothers and their children in the United States, 1981-2004. Economics and human biology 2010, 8(1):30-43.
29. Laitinen J, Power C, Jarvelin MR: Family social class, maternal body massindex, childhood body mass index, and age at menarche as predictorsof adult obesity. The American journal of clinical nutrition 2001,74(3):287-294.
30. Casey PH, Simpson PM, Gossett JM, Bogle ML, Champagne CM, Connell C,Harsha D, McCabe-Sellers B, Robbins JM, Stuff JE, et al: The association ofchild and household food insecurity with childhood overweight status.Pediatrics 2006, 118(5):e1406-1413.
Gregori et al. Nutrition Journal 2011, 10:132http://www.nutritionj.com/content/10/1/132
Page 9 of 10
31. Gundersen C, Lohman BJ, Garasky S, Stewart S, Eisenmann J: Food security,maternal stressors, and overweight among low-income US children:results from the National Health and Nutrition Examination Survey(1999-2002). Pediatrics 2008, 122(3):e529-540.
32. Kromeyer-Hauschild K, Zellner K, Jaeger U, Hoyer H: Prevalence ofoverweight and obesity among school children in Jena (Germany). Int JObes Relat Metab Disord 1999, 23(11):1143-1150.
doi:10.1186/1475-2891-10-132Cite this article as: Gregori et al.: The “Snacking Child” and its socialnetwork: some insights from an italian survey. Nutrition Journal 201110:132.
Submit your next manuscript to BioMed Centraland take full advantage of:
• Convenient online submission
• Thorough peer review
• No space constraints or color figure charges
• Immediate publication on acceptance
• Inclusion in PubMed, CAS, Scopus and Google Scholar
• Research which is freely available for redistribution
Submit your manuscript at www.biomedcentral.com/submit
Gregori et al. Nutrition Journal 2011, 10:132http://www.nutritionj.com/content/10/1/132
Page 10 of 10
Copyright © 2022 FDOKUMEN

