


Bahasa
Halaman
Hukum


.
752
THE RELATIONSHIP BETWEEN FINANCIAL DEVELOPMENT AND
ECONOMIC GROWTH IN QATAR
Abdulla S. AL-KHULAIFI 1
ABSTRACT
The relationship between financial development and economic growth has attracted a great deal of
attention among economists and policy makers alike. The economy of Qatar did not receive much
attention in the empirical literature. This study attempts at filling this gap in economic literature,
and examines the causal relationship between financial development and economic growth in
Qatar for the period 1980-2012. Annual data were used, and the unit root properties of the data set
are tested using Augmented Dickey-Fuller (ADF) test. Variables were found to be stationary at
first difference. This was followed by Johansen cointegration technique to test the long-run
relationship between variables. Three proxies for financial development were specified. Those
were the ratio of broad money (M2) to Gross Domestic Product (GDP), the ratio of total bank
deposits to GDP and the ratio of total credit to private sector to GDP. Economic growth was found
to be cointegrated with the three proxies for financial development. Granger causality test was
performed, and results suggest that causality runs from economic growth to financial development
in Qatar.
Keywords: Economic growth, Financial development, Qatar
INTRODUCTION
The relationship between financial development and economic growth has received a great deal of
attention in economic literature. The debate on this relationship dates long back, and has received
significant attention in both theoretical and empirical literature in recent years. The views on the
role of financial development in enhancing economic growth vary in economic literature. There is a
strong view that suggests a positive link between financial development and economic growth.
Financial development in this view causes economic growth. Another direction in economic
research supports the hypothesis that growth in real output creates its demand for financial services,
and hence the causality runs from growth to financial development. Other research took more of
1 E-mail: [email protected], P. O. Box 1112 Doha – Qatar
Asian Journal of Empirical Research
journal homepage: http://aessweb.com/journal-detail.php?id=5004

Asian Journal of Empirical Research, 3(6)2013: 752-762
753
neutral position and suggests that financial development does not necessarily causes economic
growth (Ahmed, 2010).
This study aims at empirically investigate the relationship between financial development and
economic growth for Qatar economy using cointegration and Granger causality methodology. To
the best of author’s knowledge, there is no study in the empirical literature that examined this topic
for Qatar. Previous studies on this topic has included Qatar within a group of countries, such as
Middle East North Africa (MENA) region (Al-Malkawi and Abdullah, 2011), Middle East
countries (Eslamloueyan and Sakhaei, 2011), and a large group of developing countries (Al-Yousif,
2002). Our study differ than those in the literature, that it devotes the whole study on Qatar
economy. The period of our study is the longest on Qatar in the literature, and we use more
measures of financial development variable than those previously published work. Therefore, it is
of importance to test this relationship in this point in time to fill the gap in the literature on Qatar.
This paper is structured as follow: Section two gives an overview of the financial sector in Qatar
and its development over recent history. Section three reviews the relevant literature on the
relationship between financial development and economic growth, and gives special attention on
studies of the Gulf and Arab countries. Section four explains the methodology utilized in this
paper. Section five defines the variables used in the model, and provides a discussion of model
results. The paper concludes with a summary of the findings in section six.
Overview of the financial sector in Qatar
Financial and banking sector in Qatar has been greatly influenced by the economic situation of the
country. Prior to commercial oil production in 1949, banks were not in existence in Qatar. The
Indian rupee followed by the Gulf rupee was the currency in circulation in the whole Gulf region.
The first introduction of a national currency was in 1966. Qatar and Dubai riyal (QDR) was the
first national currency, and was introduced in September 1966 with the same value of the Gulf
rupee before its devaluation. First commercial bank to operate in Qatar was the Eastern Bank a
branch of the British Chartered Bank opened in 1950 few months after the commencement of oil
export. As oil production increased new banks were introduced to Qatar. The British Bank of the
Middle East opened a branch in 1954 and the Ottoman Bank (Grindlays Bank) in 1956. The
numbers of banks operating in Qatar increased, but it is not until 1965 when a national bank was
established. Qatar National Bank with its shares equally divided between the government and the
private sector was the first national bank. Qatar attained independence from Britain in September
1971. Crucial changes took place in both economic and politics. Qatar Monetary Agency (QMA)
was established in 1973, with responsibilities of a central bank. Issuing the currency, convertibility
of currency, supervising banking sector and monitoring domestic credits were some of the
functions of QMA. Qatar and Dubai riyal was withdrawn and Qatar riyal (QR) was introduced,
with a value that is determined by the value of special drawing rights of the International Monetary

Asian Journal of Empirical Research, 3(6)2013: 752-762
754
Fund (IMF). Fixed interest rate policy was adopted by QMA. The rate remained fixed during the
period 1979-1990, between 5-7% for long term deposits and 7-9% for credit facilities to be charged
by banks. The number of banks operating in Qatar since the establishment of QMA has increased.
Branches of banks operating in the region were also established in Qatar. Of those were Oman
Bank Limited (now called Al Mashreq Bank) and Pariba Bank of France. More local banks also
came to existence; Qatar Commercial Bank, Doha Bank and Al Ahli Bank were established in the
years 1975, 1979 and 1984 respectively. Islamic banks also came into existence in early 1980s.
Qatar Islamic Bank was established in 1983 as the first Islamic bank in Qatar. This was followed
by Qatar International Islamic Bank in 1991.
In 1993 Qatar Central Bank (QCB) replaced Qatar Monetary Agency. The new law authorized
QCB among its other functions, to issue currency and to act as a state bank. New era in the
development of financial and banking sector in Qatar has taken place (Qatar Central Bank 2002).
QCB adopted a policy of freeing interest rate in the market. At the beginning of August 1995
interest rate on credit was freed. This step was followed by partial freeing of interest rate on
deposits for more than one year maturity. This policy was credited by the increase of the long-term
deposits in banks which was needed to face the increase of government and public sector
borrowing from local market. More new banks were chartered in Qatar. Qatar International Bank,
Alrayan Bank, Alkhaliji Bank and Barwa Bank were established with national capital. Qatar
Development Bank as specialized bank in financing industrial and housing project was also
chartered. The total banks operating in Qatar has increased to eighteen banks, eleven of them are
locally owned, and seven were branches for foreign banks. Four of the eleven national banks are
Islamic banks. Total bank’s capital reached ninety eight billion QR, with total assets of 650 billion
QR by end of year 2011.
LITERATURE REVIEW
The relationship between financial development and economic growth received a great deal of
attention in the literature. So many empirical studies were devoted to investigate this relationship.
According to economists of all persuasions, financial conditions may affect the rate of economic
growth. The McKinnon-Show school predicts that financial liberalization exerts a positive effect on
the rate of economic growth (Fry, 1988). The role of financial sector in economic development has
attracted and received increased attention from both researchers and policy makers. Views were not
always in agreement. The direction and existence of causality between financial development and
economic growth is the subject of extensive debate. While some studies have found the existence
of bi-directional causality between financial development and economic growth (Al-Yousif, 2002,
Akinlo and Egbetunde, 2010; Eslamloueyan and Sakhaei, 2011) other studies found one-way
causality, from financial development to economic growth (Abu-Bader and Abu-Qarn 2008a,b;Eita

Asian Journal of Empirical Research, 3(6)2013: 752-762
755
and Jordaan, 2010; Al-Naif, 2012) and from economic growth to financial development causality
(Adamopoulos, 2010; Ndlovu, 2013).
Chimobi (2010) tested the causal relationship between financial development, trade openness and
economic growth in Nigeria. Annual data for the period 1970-2005 were used and the methods of
cointegration and Granger causality were applied. Augmented Dickey-Fuller test was performed on
time series to find stationarity properties of variables. Variables were found to be stationary when
differenced, and no cointegration between variables was found when Johansen method of
cointegration was used. Therefore no long-run relationship exists between financial development,
trade openness and economic growth for the period of study. Granger causality test revealed that
economic growth Granger cause financial development and the reverse. Three proxies for financial
development were specified. They were private credit to GDP, domestic credit to GDP and M2 to
GDP. Real per capita GDP represented economic growth variable. Ndlovu, (2013) investigated the
relationship between financial development and economic growth in Zimbabwe. Three proxies for
financial development were specified. Domestic credit to private sector, stock market capitalization
ratio to GDP and liquid liabilities to GDP ratio were use with real GDP per capita for economic
growth variables. Using Multivariate Granger causality, the study found unidirectional causality
from economic growth to financial development. Ozturk, (2008) in a paper investigated the
causality between financial development defined as credit to private sector and economic growth in
Turkey for the period 1975-2005. A vector autoregressive framework based on cointegration and
error-correction representation was performed. No cointegration between variables was found, and
causality was found to run from economic growth to financial development.
Perera and Paudel (2009) examined the causal relationship between financial development and
economic growth in Sri Lanka. Annual data for the period 1955-2005 were used, and six proxies
for financial development were specified. Five of the six proxies were found to be cointegrated
with economic growth, and hence an error correction model was estimated to explore the dynamic
of Granger causality. The findings suggest two-way causality between broad money and economic
growth, and the causality run from economic development to three proxies of financial
development. Narrow money, total credit and private sector credit to total domestic credit. The
paper did not find for the view that financial development causes economic growth. Wadud, (2009)
in a paper studied the long-run relationship between financial development and economic growth
for three South Asian countries for the period 1976-2008. The study applied multivariate
cointegration technique proposed by Johansen. The long-run equilibrium relationship between the
variables was tested and an error correction model examined the short-run dynamics between
financial development and economic growth. Financial development was proxied as the ratio of M2
to real GDP, and economic growth was measured as real per capita GDP. The paper found that
there is a long-run relationship between financial development and economic growth in India,
Bangladesh and Pakistan. Granger causality based on error correction model found the causality

Asian Journal of Empirical Research, 3(6)2013: 752-762
756
running from financial development to economic growth, and not the reverse. The results suggest
that higher financial development leads to higher economic growth for India, Bangladesh and
Pakistan. Shahbaz et al. (2008) developed an empirical model using time series approach to study
the growth process in Pakistan. Quarterly data for the period 1991:1 to 2007:4 were used. A
financial development proxy was used and defined as the credit to private sector s share of GDP.
Financial sector’s development was found to be an important factor in stimulating economic
growth in the long-run.
There are several studies that have included results on Qatar economy. A leading paper by Al-
Yousif (2002) examined the nature and direction of relationship between financial development
and economic growth in 30 developing countries. Two proxies of financial development were
specified. One is the ratio of M2 to GDP, and the second is the Currency to narrow money (M1)
ratio. The paper found that economic growth Granger cause financial development in the case of
Qatar. Eslamloueyan and Sakhaei (2011) used annual data for the period 1994-2008 to test the
short run and long run causality between financial development and economic growth in the
Middle East. Qatar data were included in this study. Using a panel data error correction models,
they found bidirectional causality between financial development and economic growth in both the
short-run and long-run. Al-Malkawi and Abdullah, (2011) on the other hand, have found a positive
relationship between financial development and economic growth in thirteen MENA countries that
included Qatar. Annual data for the period 1985-2005 were used. Al-Malkawi et al. (2012) found
bidirectional causality between financial development and economic growth in the United Arab
Emirates (UAE) for the period 1974-2008.
METHODOLOGY
Granger causality test developed by Granger (1969), and according to him a variable is said to
Granger cause a variable if past values of can help predict . This paper applies the Granger
causality test. A simple Granger causality test for testing causality between financial development
(FD) and economic growth (EG) can be written as:
+
+ (1)
+
+ (2)
Where and are uncorrelated.The null hypothesis that are tested: 1: i = 0, i= 1,2,….n, which
means that economic growth does not Granger cause Financial development. 2: i = 0, i= 1,2…n,
this hypothesis tests that financial development does not Granger cause economic growth. If the
first hypothesis is rejected, it shows that economic growth Granger cause financial development.
The rejection of the second hypothesis, then financial development Granger cause economic
Asian Journal of Empirical Research, 3(6)2013: 752-762
757
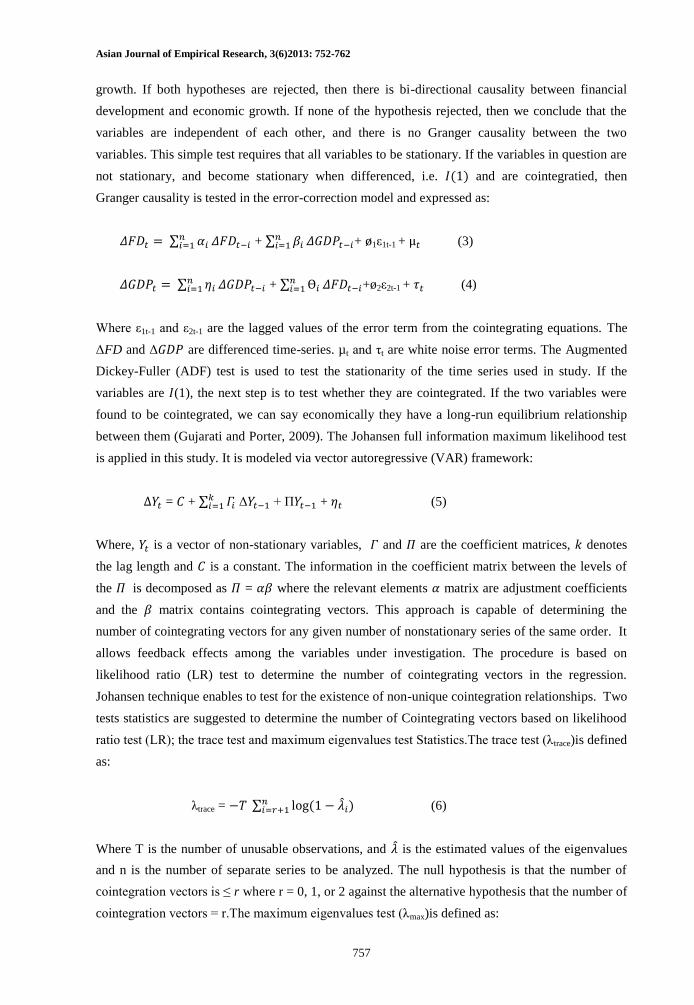
growth. If both hypotheses are rejected, then there is bi-directional causality between financial
development and economic growth. If none of the hypothesis rejected, then we conclude that the
variables are independent of each other, and there is no Granger causality between the two
variables. This simple test requires that all variables to be stationary. If the variables in question are
not stationary, and become stationary when differenced, i.e. and are cointegratied, then
Granger causality is tested in the error-correction model and expressed as:
+
+ 1ε1t-1 + (3)
+
+ø2ε2t-1 + (4)
Where ε1t-1 and ε2t-1 are the lagged values of the error term from the cointegrating equations. The
ΔFD and Δ are differenced time-series. µt and τt are white noise error terms. The Augmented
Dickey-Fuller (ADF) test is used to test the stationarity of the time series used in study. If the
variables are (1), the next step is to test whether they are cointegrated. If the two variables were
found to be cointegrated, we can say economically they have a long-run equilibrium relationship
between them (Gujarati and Porter, 2009). The Johansen full information maximum likelihood test
is applied in this study. It is modeled via vector autoregressive (VAR) framework:
= + Δ + Π + (5)
Where, is a vector of non-stationary variables, and are the coefficient matrices, denotes
the lag length and is a constant. The information in the coefficient matrix between the levels of
the is decomposed as = where the relevant elements matrix are adjustment coefficients
and the matrix contains cointegrating vectors. This approach is capable of determining the
number of cointegrating vectors for any given number of nonstationary series of the same order. It
allows feedback effects among the variables under investigation. The procedure is based on
likelihood ratio (LR) test to determine the number of cointegrating vectors in the regression.
Johansen technique enables to test for the existence of non-unique cointegration relationships. Two
tests statistics are suggested to determine the number of Cointegrating vectors based on likelihood
ratio test (LR); the trace test and maximum eigenvalues test Statistics.The trace test (λtrace)is defined
as:
λtrace = (6)
Where T is the number of unusable observations, and is the estimated values of the eigenvalues
and n is the number of separate series to be analyzed. The null hypothesis is that the number of
cointegration vectors is ≤ r where r = 0, 1, or 2 against the alternative hypothesis that the number of
cointegration vectors = r.The maximum eigenvalues test (λmax)is defined as:

Asian Journal of Empirical Research, 3(6)2013: 752-762
758
λmax= (7)
Which test the null hypothesis that the number of cointegrating vectors = r against the
alternative that there are r+1 cointegrating vectors, the null hypothesis, r = 0 is tested against the
alternative that r = 1, and r = 0 is tested against the alternative r = 2. The λmaxtest has the sharper
alternative hypothesis. It is usually preferred for trying to get the number of cointegrating vectors
(Enders, 2010).
Data and Model Results
Annual data in this study covers the period from 1980-2012. The study uses threeproxies for
financial development variable. The first proxy is the inverse of broad money velocity, which is the
ratio of M2 to GDP. The second proxy is the ratio of total bank deposits to GDP and the third is
total credit extended to private sector to GDP. The ratio of broad money, M2 to GDP is the most
commonly used proxy of financial development in the literature (see Eita and Jordaan, 2010; Al-
Naif, 2012; Abu-Bader and Abu-Qarn, 2008a, b; Akino and Egbetunde, 2010). A higher M2/GDP
ratio indicates larger financial sector and intermediation (Eita and Jordaan, 2010). The ratio of total
bank deposit to GDP is also used in empirical studies as a measure of financial development is also
used in the literature as a measure of financial development (Eita and Jordaan, 2010; Pera and
Paudel, 2009; Al-Naif, 2012). This measure of financial development is used to provide
information about allocation of financial assets. Total bank credit extended to private sector is also
used as a measure of financial development (Abu-Bader and Abu-Qarn, 2008b; Shahbaz et al.
2008; Bhunia, 2012; Adamopoulos, 2010; Shahbaz and Malik 2011; Sunde, 2010) this proxy is
used to assess the allocation of financial asset were previous two proxies cannot provide. For
economic growth variable, real GDP is used. The data is sourced from various issues of Qatar
Central Bank annual report, and Qatar Statistics Authority reports.LM2Y is log of M2/GDP,
LTBDY is log of Total Bank Deposit/GDP, LTCPSY is log of Total Credit to Private Sector/GDP
and Δ is first difference operator. Numbers between parenthesis are lag length using Schwarz Info
criterion automatic maximum lag=4.
The data are tested for unit root using ADF test. Table-1 shows that all variables are non-stationary
in level, and stationary in first difference. Since all variables are (1), the next step is to test for
cointegration. Johansen’s method of cointegration is applied. The lag length was set based on the
Akaike information criterion, final prediction error and Schwartz information criterion.
Cointegration results are depicted in Table-2, Table-3 and Table-4.Tables-2, 3 and 4 show that
there is one cointegrating vector between real GDP and each measure of financial development.
Since there is cointegration, the direction of causality is tested. Causality test results are presented
in table (5). The χ2 (Wald Test) of the explanatory variables in the VAR system indicates the short-
run causal effect, and the direction of causality (Eita and Jordaan, 2010). Results in Table-5 show
that the causality runs from economic growth to financial development in two out of the three

Asian Journal of Empirical Research, 3(6)2013: 752-762
759
proxies of financial development. Real GDP was found to Granger because M2/GDP and total
credit to private sector to GDP. Our results are consistent with earlier findings by Al-Yousef,
(2002).
Table 1: Augmented dickey-fuller unit root test results
Variable Constant Constant and Trend None
LRY 4.199 (0) -0.603 (0) 5.349(0)
ΔLRY -3.442 ** (0) -5.767 ***(0) -0.907(1)
LM2Y -1.9299 (0) -1.6123 (0) -1.401(0)
ΔLM2Y -5.061*** (0) -5.329*** (0) -5.006***(0)
LTBDY -1.8111 (0) -1.467 (0) -1.663(0)
ΔLTBDY -5.046*** (0) -5.352*** (0) -4.941***(0)
LTCPSY -3.183 ** (1) -3.585 **(1) -1.067(0)
ΔLTCPSY -5.18 *** (1) 03.38 ***(1) -5.042***(1)
Note: ** and *** are 5% and 1% level of significance respectively. LRY is log of real GDP,
Table 2: Johansen cointegration tests (lry, lm2y)
H0 H1 Test Statistics 0.05 critical value Prob
Trace Statistics
r=0 r=1 20.2129* 15.4947 0.0090
r=1 r=2 3.16239 3.84146 0.0753
Maximum Eigenvalue Statistics
r=0 r>0 17.0505* 14.2646 0.0177
r≤0 r>0 3.16239 3.84146 0.0753
* Denotes rejection of the null hypothesis at 0.05 levels.
Table 3: Johansen cointegration test results (LRY, LTBDY)
H0 H1 Test Statistics 0.05 critical value Prob
Trace Statistics
r=0 r=1 20.4773* 15.4947 0.008
r=1 r=2 2.22894 3.84146 0.135
Maximum Eigenvalue Statistics
r=0 r>0 18.2483* 14.2646 0.011
r≤0 r>0 2.22894 3.84146 0.135
* Denotes rejection of the null hypothesis at 0.05 levels.

Asian Journal of Empirical Research, 3(6)2013: 752-762
760
Table 4: Johansen cointegration test results (LRY, LTCPSY)
H0 H1 Test Statistics 0.05 critical value Prob
Trace Statistics
r=0 r=1 26.5522* 15.4947 0.0007
r=1 r=2 3.42873 3.8414 0.0641
Maximum Eigenvalue Statistics
r=0 r>0 23.12355* 14.2645 0.0016
r≤0 r>0 3.42873 3.8414 0.0641
* Denotes rejection of the null hypothesis at 0.05 levels.
Table 5: Granger causality test results
Null Hypothesis Wald test/Chi-square Conclusion
LM2Y does not Granger cause LRY 1.082(0.581) Fail to reject H0.
No causality
LRY does not Granger cause LM2Y 4.85 (0.088)* Reject H0.
LTBDY does not Granger cause LRY 2.369(0.305) Fail to reject H0.
No causality.
LRY does not Granger cause LTBDY 2.535(0.281) Fail to reject H0.
No causality.
LTCPSY does not Granger cause LRY 0.925(0.629) Fail to reject Ho.
No causality.
LRY does not Granger cause LTCPSY 7.611(0.022)** Reject H0.
Note: * and ** significant at 10% and 5% level. Probabilities are in parenthesis.
CONCLUSION AND FUTURE RESEARCH
This study attempted at studying the relationship between financial development and economic
growth in Qatar for the period 1980 - 2012. Three proxies were used for financial development
variable. The first proxy is ratio of M2 to GDP. The second proxy is the ratio of total bank deposits
to GDP and the third is total credit extended to private sector to GDP. Real GDP was used as
economic growth variable. Data were tested for statioanrity using Augmented Dickey-Fuller test,
and all variables were found to be stationary after first differencing. Johansen cointegration test was
performed, and variables were found to be cointegrated. The results of Granger causality tests
indicate that economic growth Granger cause financial development.

Asian Journal of Empirical Research, 3(6)2013: 752-762
761
One can interpret from this results that financial development is not a key economic development
factor in Qatar. Improving the services provided by financial intermediaries such as banks and
insurance companies, will lead to enhancing productivity and result in improving total factor
productivity leading to higher rates of growth. Policies that improve economic growth, by fostering
macroeconomic stability and increasing investment will also have an important effect on financial
development. This study is based on available annual data, and chosen proxies for financial
development. Quarterly data will enhance future studies with more observation and more degrees
of freedom. More variables on financial development will most certainly improve results.
REFERENCES
Abu-Bader, S and A. Abu-Qarn (2008a). Financial Development and Economic Growth: Time
Series Evidence from Egypt. Journal of Policy Modeling, Vol. 30, No. 5, pp. 887-898.
Abu-Badr, S and A. Abu-Qarn (2008b). Financial Development and Economic Growht: Empirical
Evidence from Six MENA Countries. Review of Development Economics, Vol. 12, No. 4,
pp. 803-817.
Adamopoulos, A. (2010). Financial Development and Economic Growth an Empirical Analysis for
Ireland. International Journal of Economic Sceinces and Applied Research, Vol. 3, No. 1,
pp. 75-88.
Ahmed, A. (2010). Financial Liberalization, Financial Development and Economic Growth in Sub-
Saharan Africa’s Economic Reform: An Empirical Investigation. Studies in Economics and
Finance, Vol. 27, No. 4, pp. 314-339.
Akinlo, A and T. Egbetunde (2010). Financial Development and Economic Growth: The
Experience of 10 Sub-Saharan African Countries Revisited. The Review of Finance and
Banking, Vol. 2, No. 1, pp. 17-28.
Al-Malkawi, H and N. Abdullah (2011). Finance-Growth Nexus: Evidence from Panel MENA
Countries. International Research Journal of Finance and Economics, Vol. 63, pp. 129-139.
Al-Malkawi, H, H. Marashdeh and N. Abdullah (2012). Financial Development and Economic
Growth in the UAE: Empirical Assesment Using ARDL Approach to Cointegration.
International Journal of Economics and Finance, Vol. 4, No. 5, pp. 105-115.
Al-Naif, K. (2012). Causality Relationship between Financial Development and Economic Growth
in Jordan: Supply-Leading and Demand-Pulling Hypothesis Test. Middle Eastern Finance
and Economics, Vol. 16, pp. 100-109.
Al-Yousif, Y. (2002). Financial Development and Economic Growth another Look at the Evidence
from Developing Countries. Review of Financial Economics, Vol. 11, pp. 131-150.
Bhunia, A. (2012). Causal Relationship between Economic Growth and Financial Development:
An Econometric Analysis. The International Journal of Applied Economics and Finance,
pp. 1-12.
Asian Journal of Empirical Research, 3(6)2013: 752-762
762
Chimobi, O. (2010). The Causal Relationship among Financial Development, Trade Openness and
Economic Growth in Nigeria. International Journal of Economics and Finance, Vol. 2, No.
2, pp. 137-147.
Eita, J and A. Jordaan (2010). A Causality Analysis between Financial Development and Economic
Growth for Botswana. African Finance Journal, Vol. 12, No. 1, pp. 72-89.
Enders, W (2010) Applied Econometrics Time Series 3rd
Edition. Wiley: U. S. A.
Eslamloueyan, K and E. Sakhaei (2011). The Short Runa and Long Run Causality between
Financial Development and Economic Growth in the Middle East. Iranian Journal of
Economic Research, Vol. 16, No. 46, pp. 61-76.
Fry, M. J (1988). Money, Interest, and Banking in Economic Development The Johns Hopkins
University Press: Baltimore and London.
Granger, C.W.J (1969). Investigating Causal Relationships by Econometric Models and Cross-
spectral Models. Econometrica, Vol. 37, No. 3, pp. 424-438.
Gujarati, D. and D. Porter (2009). Basic Econometrics. McGraw-Hill International Edition:
Singapore.
Ndloru, G. (2013). Financial Sector Development and Economic Growth: Evidence from
Zimbabwe. International Journal of Economics and Financial Issues, Vol. 3, No. 2, pp. 435-
446.
Ozturk, I. (2008). Financial Development and Economic Growth: Evidence from Turkey. Applied
Econometrics and International Development, Vol. 8, No. 1, pp. 85-98.
Perera, N and R. Paudel (2009). Financial Development and Economic Growth in Sri Lanka.
Applied Econometrics and International Development, Vol. 9, No. 1, pp. 157-164.
Qatar Central Bank, (2002). The Banking and Financial System in the State of Qatar. Department
of economic Policies. www.qcb.gov.qa
Qatar Central Bank, Annual Reports, Various Issues. www.qcb.gov.qa
Qatar Statistical Authority, National Accounts Bulletin 2012. www.qsa.gov.qa
Shahbaz, M., Ahmed, K. and A. R. Chaudhary (2008). Economic Growth and Its Determinants in
Pakistan. The Pakistan Development Review. Pakistan Institute of Development, Vol. 47,
No. 4, pp. 471-486.
Shahbaz, M. and M. N. Malik (2011). Does Financial Instability Weaken the Finance-Growth
Nexus? A Case for Pakistan. MPRA Paper No. 28666, Posted 6 February 2011 10:22 UTC.
www.mpra.up-muenchen.de/28666/
Sunde, T. (2010). Financial Sector Development and Economic Growth in Namibia. Journal of
Emerging Trends in Economics and Management Sciences, Vol. 1, No. 2, pp. 76-80.
Wadud, M. (2009). Financial Development and Economic Growth: A cointegration and Error-
Correction Modeling for South Asian Countries. Economic Bulletin, Vol. 29, No. 3, pp.
1670-1677.
Top Related
Copyright © 2022 FDOKUMEN

