


Bahasa
Halaman
Hukum


This article was downloaded by: [Collette Schulz Herzenberg]On: 04 August 2014, At: 09:23Publisher: RoutledgeInforma Ltd Registered in England and Wales Registered Number: 1072954 Registeredoffice: Mortimer House, 37-41 Mortimer Street, London W1T 3JH, UK
Journal of Southern African StudiesPublication details, including instructions for authors andsubscription information:http://www.tandfonline.com/loi/cjss20
The Influence of the Social Context onSouth African VotersCollette Schulz-Herzenberga
a Centre for Social Science Research, University of Cape TownPublished online: 31 Jul 2014.
To cite this article: Collette Schulz-Herzenberg (2014) The Influence of the SocialContext on South African Voters, Journal of Southern African Studies, 40:4, 839-859, DOI:10.1080/03057070.2014.932988
To link to this article: http://dx.doi.org/10.1080/03057070.2014.932988
PLEASE SCROLL DOWN FOR ARTICLE
Taylor & Francis makes every effort to ensure the accuracy of all the information (the“Content”) contained in the publications on our platform. However, Taylor & Francis,our agents, and our licensors make no representations or warranties whatsoever as tothe accuracy, completeness, or suitability for any purpose of the Content. Any opinionsand views expressed in this publication are the opinions and views of the authors,and are not the views of or endorsed by Taylor & Francis. The accuracy of the Contentshould not be relied upon and should be independently verified with primary sourcesof information. Taylor and Francis shall not be liable for any losses, actions, claims,proceedings, demands, costs, expenses, damages, and other liabilities whatsoeveror howsoever caused arising directly or indirectly in connection with, in relation to orarising out of the use of the Content.
This article may be used for research, teaching, and private study purposes. Anysubstantial or systematic reproduction, redistribution, reselling, loan, sub-licensing,systematic supply, or distribution in any form to anyone is expressly forbidden. Terms &Conditions of access and use can be found at http://www.tandfonline.com/page/terms-and-conditions

The Influence of the Social Context on South
African Voters*
Collette Schulz-Herzenberg(Centre for Social Science Research, University of Cape Town)
Using data from theComparative National Elections Project 2004 and 2009 South African post-
elections surveys, this paper argues that political discussion within interpersonal discussant
networks plays a primary role in shaping political attitudes and vote choice in South Africa.
The extent of partisan homogeneity or heterogeneity within discussant networks has important
yet distinct implications for voting behaviour. While homogeneous discussion networks tend to
encourage stronger partisan loyalties and fewer defections in vote choice, people in
heterogeneous networks show less consistency in their attitudes and behaviour during elections.
The analysis also showshowmomentous socio-political events at the timeof a particular election
can change the nature of social networks, with important consequences for electoral outcomes.
Citizens derive much of their political information from people in their immediate social
context.1 As political information flows to voters via these discussants, they help to shape
perceptions about political parties and election campaigns. The result, scholars argue, is that
the social context has an important bearing on enduring political attitudes such as
partisanship and voting choice. This paper’s central argument is that, through political
discussion, the social context can play a primary role in shaping political attitudes and vote
choice in South Africa. More specifically, the extent of partisan homogeneity or
heterogeneity within one’s immediate social context has important yet distinct
implications for voting behaviour. Using data from the Comparative National Elections
Project (CNEP) 2004 and 2009 South African post-election surveys, the paper explores the
extent of social context partisan homogeneity in South Africa, and finds that voters are not
overly embedded in homogeneous social contexts.2 Controlling for other important
q 2014 The Editorial Board of the Journal of Southern African Studies
*An earlier version of this paper appeared in the proceedings of the International Conference on Political Science andInternational Relations, held in Venice, Italy on 15–16 August 2013. See C. Schulz-Herzenberg, ‘The Implications ofSocial Context Partisan Homogeneity for Voting Behaviour: Survey Evidence from South Africa’, World Academyof Science, Engineering and Technology (WASET) conference, Issue 80, August 2013. The author would like tothank discussants at the conference for their valuable advice in the paper’s revision. The author would also like toacknowledge the A.W. Mellon Foundation for its financial support towards the postdoctoral scholarship, and to thankProfessor Robert Mattes and Professor Jeremy Seekings at the Centre for Social Science Research, University ofCape Town, for their comments. Any errors or omissions rest solely with the author.
1 B. Berelson, P. Lazarsfeld, and W.N. McPhee, Voting: A Study of Opinion Formation in a PresidentialCampaign (Chicago, University of Chicago Press, 1954); R. Dalton, S. Flanagan and P.A. Beck, ElectoralChange in Advanced Industrial Democracies: Realignment or Dealignment? (Princeton, Princeton UniversityPress, 1984); P.A. Beck, R. Dalton, S. Greene and R. Huckfeldt, ‘The Social Calculus of Voting: InterpersonaljMedia and Organizational Influences on Presidential Choice’, American Political Science Review, 96, 1(2002), pp. 57–73; R. Huckfeldt and J. Sprague, ‘Networks in Context: The Social Flow of PoliticalInformation’, American Political Science Review, 81, 4 (1987), pp. 1197–1216.
2 The Comparative National Elections Project (CNEP) is a multinational project that studies politicalcommunication and social structure within the context of election campaigns using compatible researchdesigns and a common core of survey questions. The South African CNEP surveys were conducted nationallyfollowing each election and each included 1,200 personal interviews. The samples were drawn usingmulti-stage, stratified, area cluster probability sampling.
Journal of Southern African Studies, 2014
Vol. 40, No. 4, 839–859, http://dx.doi.org/10.1080/03057070.2014.932988
Dow
nloa
ded
by [
Col
lette
Sch
ulz
Her
zenb
erg]
at 0
9:23
04
Aug
ust 2
014

predictors, including satisfaction with government’s performance, party identification,
campaign interest, age and race, the paper then demonstrates the consequences of partisan
homogeneity on voting behaviour. Homogeneous social contexts tend to encourage stronger
partisan loyalties and fewer defections in vote choice. In contrast, people in heterogeneous
networks show less consistency in their attitudes and behaviour during elections. They are
more likely to defect from their party identification when they vote, are more likely to defect
from their previous vote choice in subsequent elections, have weaker partisan ties, and are
more likely to consider alternative political homes. Finally, the analysis shows how
momentous socio-political events at the time of a particular election can change the nature of
social contexts, with important consequences for electoral outcomes.
The Social Context and Voter Behaviour
The social context consists of people with whom individuals maintain ongoing relationships
and with whom they discuss important matters, even political matters. Some are discussants
that individuals choose to engage with frequently, and they are often intimates such as a
spouse/partner or a friend or family member. These discussants form a social network for the
individual. However, the flow of political information to an individual can also occur through
weaker, less intimate ties within his/her wider social context and may include neighbours,
co-workers, family members and friends. The social context is said to have an especially
strong influence on electoral decisions when political messages contain a distinctive ‘political
bias’ (when they are perceived as favouring one or another political party) that is ‘congruent’,
or in agreement, with an individual’s political preferences.3 Since people are likely to adopt
the political views of those around them, the stronger the convergence of similar political
influences from their sources the more likely the voter is to follow suit.4
People often exercise discretion in the selection of their discussants, usually preferring to
discuss politics with those who hold agreeable preferences. Moreover, the choice of
discussants is often socially constrained to those within their wider social setting. Chosen
discussants therefore reinforce rather than dilute pre-existing political preferences.5
Nevertheless, many individuals are limited in the control they have over their exposure to
political communication within their social setting. One’s inherent self-selection mechanism
is counteracted by those more distant social interactions within the workplace or
neighbourhood, where political opinions may not always be congruent with the individual.
Thus, for most voters, the choice over and construction of a communication network occurs
with pronounced constraints on the supply of similar political attitudes.6
In the context of a highly divided or polarised society, there are likely to be fewer societal
constraints on the supply of agreeable discussants. The high levels of political homogeneity
(and low levels of political disagreement) within social groups (juxtaposed by high levels of
political polarisation between groups) may mean that the transmission of political
information through personal discussants is likely to be channelled by the dominant cleavage
structure that characterises the social setting. Voters caught up in their social groups will be
primarily exposed to the prevailing political biases of that group. Accordingly, two
3 B. Richardson and P.A. Beck, ‘The Flow of Political Information: Personal Discussants, the Media, andPartisans’, in R. Gunther, J.R. Montero and H.J. Puhle (eds), Democracy, Intermediation, and Voting on FourContinents (New York, Oxford University Press, 2007), p. 188.
4 Beck et al., ‘The Social Calculus of Voting’; Richardson and Beck, ‘The Flow of Political Information’.5 Berelson et al., Voting; M.N. Franklin, Voter Turnout and the Dynamics of Electoral Competition in Established
Democracies since 1945 (New York, Cambridge University Press, 2004), p. 45.6 R. Huckfeldt, P. Johnson and J. Sprague, Political Disagreement: The Survival of Diverse Opinions Within
Communication Networks (Cambridge, Cambridge University Press, 2004), p. 21.
840 Journal of Southern African Studies
Dow
nloa
ded
by [
Col
lette
Sch
ulz
Her
zenb
erg]
at 0
9:23
04
Aug
ust 2
014

interconnected processes transpire – both of which encourage group uniformity in
behaviour.7 The first is that, through inter-personal contacts and flows of communication,
discussants in highly homogeneous communities will in all likelihood provide political
messages that complement an individual’s existing partisan beliefs. The second is that
repetitive exposure to these ‘supportive’ partisan messages will reinforce and strengthen
prevailing partisan beliefs. Consequently, when the social group context is highly
homogeneous, common partisan responses are generated more effectively. Conversely, when
communities are more politically heterogeneous and the partisan cues emanating from
discussants are diverse, partisan behaviour is less predictable and mass volatility should
increase. Evidence from Japan and Sweden suggests that this is the case – their most
heterogeneous communities are the least effective at mobilising votes for the dominant
parties.8 Social contacts reinforce group awareness, encourage individual voters to align their
voting intentions with group interests, and inform voters of the likely voting behaviour of
other group members.9
South Africa – A Model Case for Social Context Effects?
South Africa presents an ideal case for exploring social context effects on voter behaviour.
Due to the legacy of apartheid segregation, South Africa remains a highly divided society,
where most voters live in politically homogeneous social environments. Highly stratified
racial and political contexts predetermine the social context. As a result, many voters are
likely to reside in homogeneous political information networks, where their partisan identities
reflect widely among their personal discussants.
During an election campaign, voters receive repetitive partisan messages from a
multiplicity of sources within their social context, each imparting their particular partisan
bias. One can therefore conceive of individual voters as being embedded in social contexts
that take on particular partisan characteristics. This paper examines the extent of partisan
congruence within the social context and refers to two types of social context. The first is a
more ‘homogeneous partisan social context’, which exists when half or more of the
respondent’s discussants support the same party. The second type is a more ‘heterogeneous
partisan social context’, where half or more of the respondent’s discussants support a political
party different from his/hers. In other words, under scrutiny is the diversity of the
respondent’s social context in terms of the political opinions and attitudes of people within
that context.
When an individual’s social context is politically homogeneous, the chance of his voting
behaviour reflecting others in his immediate context increases. This context type encourages
conformity of partisan attitudes and behaviour, and it is unlikely that voters will support a
different party from the one supported by those around them. Similarly, political
disagreement is less likely where strong partisan attitudes prevail and political passions are
intense.10 Moreover, in politically charged environments where strong partisan attitudes
prevail, conformity to the attitudes and norms of the dominant group bring with it social
rewards, while deviation can elicit social sanctions including rejection and derogation. When
the social context exposes a voter to a more heterogeneous mix of political viewpoints –
where the respondent is exposed to a greater diversity of political information and partisan
attitudes about campaigns, candidates and parties – it should stimulate more complex
7 R. Rose and I. McAllister, The Loyalties of Voters (London, Sage, 1990), p. 109.8 Dalton et al., Electoral Change in Advanced Industrial Democracies, p. 18.9 Franklin, Voter Turnout, p. 45.10 Huckfeldt et al., Political Disagreement, p. 23.
The Influence of the Social Context on South African Voters 841
Dow
nloa
ded
by [
Col
lette
Sch
ulz
Her
zenb
erg]
at 0
9:23
04
Aug
ust 2
014

thinking about politics. So, while one’s political knowledge and decisions should become
more informed, electoral behaviour should become less predictable or less consistent. These
voters should deviate more frequently from their party identification and previous vote
choices, and they should demonstrate weaker partisan ties. Heterogeneous partisan social
contexts are not expected to be as common as their more homogeneous counterparts in South
Africa, but where they exist their collective action should present as macro-level electoral
volatility.
The paper therefore proposes an alternative theoretical sociological explanation, not only
for individual-level voting decisions, but also for the appearance of racial or ethnic census-style
election results in South Africa. In South Africa, loyalty to affective racial or ethnic
group identities, or to expressions of social identity, are often given as the reason for repeated
‘census-style’ electoral outcomes.11 This perspective raises a range of concerns about
democratic politics. If voters are unquestioningly loyal to their parties, are unmoved by
incumbency performance and are unwilling to move their support elsewhere, elections cannot
function as a sanctioning mechanism over elite behaviour.
From a differing perspective, other scholars highlight the importance of inclusive party
imagery, or partisan identification, as well as a range of ‘rational-choice’ variables, such as
voter evaluations of government performance, or economic class, to explain voting outcomes
in South Africa.12 Yet only a handful of analysts have explored how voters of different racial
groups tend to learn about governments, parties and candidates through information networks
that are particularly homogeneous and heavily structured along racial, ethnic and partisan
lines.13
From a ‘social context’ perspective, census-style or racial bloc voting is less a
consequence of enduring, identity-based loyalties than a macro-level result of an overload of
partisan bias in the political information that voters receive from highly homogeneous,
‘sealed’ political environments. Within the context of South Africa’s racially and politically
divided society, patterns of social interaction are such that many voters seldom encounter
other ethnic counterparts within their closely held networks of political communication, apart
from within the workplace. Therefore, the partisan bias received by individual voters reflects
and corresponds to the society’s dominant cleavages, giving the appearance of cleavage-style
voting with the typically characteristic fixed or rigid electoral outcomes.
However, unlike sociological explanations that emphasise the influence of ‘fixed’ or
‘static’ identities, the social context may change over time. When profound socio-political
11 M. Lipset and S. Rokkan, Party Systems and Voter Alignments: Cross-National Perspectives (New York, FreePress, 1967); D. Horowitz, Ethnic Groups in Conflict (Berkeley, University of California Press, 1985);D. Horowitz, A Democratic South Africa? Constitutional Engineering in a Divided Society (Berkeley, Universityof California Press, 1991); L. Schlemmer, ‘South Africa’s First Open Election and the Future of its NewDemocracy’, in H. Giliomee and L. Schlemmer (eds), The Bold Experiment: South Africa’s New Democracy(Halfway House, Southern Publishers, 1994), pp. 149–67; H. Giliomee, ‘The National Party’s Campaign for aLiberation Election’, in A. Reynolds (ed.), Election ’94 South Africa: The Campaigns, Results and FutureProspects (Cape Town, David Philip, 1994), pp. 43–88; S. Friedman, ‘A Voice for Some’, in J. Piombo andL. Nijzink (eds), Electoral Politics in South Africa: Assessing the First Democratic Decade (London, PalgraveMacmillan, 2005), pp. 3–21.
12 K. Ferree, Framing the Race in South Africa: The Political Origins of Racial Census Elections (New York,Cambridge University Press, 2011); K. Ferree, ‘Explaining South Africa’s Racial Census’, Journal of Politics,68, 4 (2006) pp. 803–15; R. Mattes, H. Taylor and C. Africa, ‘Judgment and Choice in the 1999 South AfricanElection’, Politikon: The South African Journal of Political Studies, 26, 2 (1999), pp. 235–47; M. Eldridge andJ. Seekings, ‘Mandela’s Lost Province: The African National Congress and the Western Cape Electorate’,Journal of Southern African Studies, 22, 4 (1994), pp. 517–40.
13 Exceptions include R. Mattes, H. Giliomee and W. James, ‘The Election in the Western Cape’, in R.W. Johnsonand L. Schlemmer (eds), Launching Democracy in South Africa (New Haven, Yale University Press, 1996),pp. 108–67; C. Schulz-Herzenberg, ‘Towards a Silent Revolution? South African Voters in the First Years ofDemocracy, 1994–2006’ (PhD dissertation, University of Cape Town, 2009).
842 Journal of Southern African Studies
Dow
nloa
ded
by [
Col
lette
Sch
ulz
Her
zenb
erg]
at 0
9:23
04
Aug
ust 2
014
events reverberate throughout a society they can transform the nature of social networks by
changing the flow and political content of information gleaned through intermediary
exposure. When this happens there are bound to be important consequences for electoral
behaviour. Scholars have argued that the precise nature and context of a particular election
may have profound effects on political attitudes and behaviour. For instance, turnout
variations have been partly explained by the differences in the political context surrounding
each election.14 The institutional, social and political contexts in which individuals are
embedded at the time of an election can make one election more salient than others.
As Franklin states, ‘It seems that citizens generally understand the “stakes” of any given
election, either through their political discussants, media coverage, or the effects of respective
campaigns’.15 Elections that are perceived as particularly competitive, and especially those
that may result in substantive policy change, tend to increase the political interest of the
individual and bring more people to the polls.16
The 2009 national and provincial elections in South Africa were arguably the most
competitive elections to date. In the years that preceded the elections, a series of
developments brought about several important changes to the political landscape that all
posed significant challenges to the electoral dominance of the African National Congress
(ANC). Few expected the ANC to lose the 2009 elections. Nevertheless, many thought that
the ANC faced new, hitherto unseen, problems that might challenge the party’s
overwhelming electoral victories of the three previous democratic elections. Although the
ANC went on to win the 2009 elections, they did so with a smaller percentage of total votes
(which declined from 69.6 per cent in 2004 to 65.9 per cent in 2009) despite an increase in
voter turnout (from 76.7 per cent in 2004 to 77.3 per cent in 2009).17
Jacob Zuma’s rise to the presidency of the ANC had fuelled the formation of a new
opposition party, the Congress of the People (COPE), by dissidents from within the ruling
party who remained loyal to former president Thabo Mbeki.18 Many regarded COPE as a
long-awaited legitimate alternative to the ANC as a political home, especially for black
African voters. As for the ANC, following a chaotic internal succession struggle and the
victory of Jacob Zuma as party president, it gained a controversial leader who faced charges
of corruption and, later, allegations of political interferences aimed at quelling the National
Prosecuting Authority’s attempts to prosecute him.
A changing political landscape also saw the largest opposition party, the Democratic
Alliance (DA), re-launched in 2009 under a new ‘brand’ and a new style of campaigning.
Under the leadership of Helen Zille, the DA started to project a more racially inclusive image
in an attempt to broaden its support-base in ‘non-traditional’ (black) constituencies, and reach
new audiences. The party also sought to build upon its reputation for competence by
showcasing its performance track record in local government in the city of Cape Town.19
As Jolobe says, ‘[t]he specific goal was to wrestle with the party’s negative image as a white
minority party, to recreate a new DA that would be more diverse, more reflective of South
Africa’s racial, linguistic and cultural heritage’.20 The DA’s 2009 campaign presented a
14 Franklin, Voter Turnout, p. 44.15 Ibid.16 Ibid., p. 151.17 J. Daniel and R. Southall, ‘Zunami! The National and Provincial Electoral Outcomes: Continuity with Change’,
in R. Southall and J. Daniel (eds), Zunami! The 2009 South African Elections (Johannesburg, Jacana and Konrad-Adenauer-Stiftung, 2009), p. 234.
18 R. Southall, ‘Zunami! The context of the 2009 election’, in Southall and Daniel (eds) Zunami!, p. 1.19 Southall, ‘Zunami!’, p. 6; C. Schulz-Herzenberg, ‘Trends in Party Support and Voter Behaviour, 1994–2009’, in
Southall and Daniel (eds), Zunami!, p. 45.20 Z. Jolobe, ‘The Democratic Alliance’, in Southall and Daniel (eds), Zunami!, p. 138.
The Influence of the Social Context on South African Voters 843
Dow
nloa
ded
by [
Col
lette
Sch
ulz
Her
zenb
erg]
at 0
9:23
04
Aug
ust 2
014
marked departure from previous campaigns, which had merely aimed to consolidate the
support of minority or middle-class interests.
Other processes also generated uncertainty about the 2009 election outcomes. An increase
in voters from the born-free generation, those who came of age after apartheid ended,
introduced a new cohort of less predictable voters (with potentially weaker party
identification) into the electorate.21 Moreover, trends in electoral participation since 1994
show a noticeable withdrawal of eligible voters at the polls, which, if remobilised, could
present a significant force for change.22 In addition, rising social discontent with the delivery
of basic essential services culminated in a wave of service delivery protests across local
communities prior to the 2009 elections, raising the possibility that voters once loyal to
the governing party might switch to other political homes. Finally, a distinctive feature of the
elections was the introduction of free campaign advertising on television for political
parties.23 This gave South African electoral contenders, particularly ill-funded opposition
parties, new opportunities to reach beyond traditional constituencies. Political
advertisements, mainly through electronic media adverts, exposed millions more voters to
a richer diversity of political coverage and information than ever before.
The social and political context in South Africa at the time of the 2009 elections was at its
most unpredictable since the founding democratic elections in 1994. Far-reaching changes in
the political landscape, which included a dramatic splinter from the incumbent party, a new
legitimate political contender with potential mass appeal, a rejuvenated and re-focused
opposition party, and the uptake of free television campaign advertising by the largest political
parties, undoubtedly provided heightened stimulus for voters, raising levels of political interest
and discussion about politics during the campaign. Most importantly, however, the combined
effect of these factors should have diversified the partisan content of political information
flowing through intermediaries, thereby increasing the levels of partisan heterogeneity in
many people’s social contexts, and potentially changing the way these voters learnt about and
responded to parties and candidates. In short, during the period leading up to the 2009
elections, the proportion of voters living within a more heterogeneous partisan social context
should have increased compared to the earlier elections, with fewer voters exposed to highly
congruent partisan messages. Subsequently, the ‘reinforcing’ effects of homogeneous social
contexts on voting decisions should have declined from previous years.
Research Questions
The paper is guided by three research questions and related hypotheses.
1. What types of social contexts predominate in South Africa and how much partisan
congruence or diversity do they provide?
I examine levels of partisan homogeneity versus heterogeneity within social contexts, and
the overall distributions of the two context types across two elections. I expect to find a
higher proportion of respondents in politically congruent social contexts in South Africa.
2. Do social context types affect voting behaviour differently?
I explore the effects of the two context types on individual-level voter behaviour and
partisan attitude strength. Individuals in homogeneous partisan social contexts should
21 J. Seekings, ‘The Social and Political Implications of Demographic Change in Post-Apartheid South Africa’,CSSR Working Paper No. 328 (Centre for Social Science Research, University of Cape Town, 2013).
22 Schulz-Herzenberg, ‘Trends in Party Support’, p. 24.23 I. Glenn and R. Mattes, ‘Political Communications in Post-Apartheid South Africa’, in H. Semetko and
M. Scammell (eds), The Sage Handbook of Political Communication (London, Sage, 2010), pp. 494–508.
844 Journal of Southern African Studies
Dow
nloa
ded
by [
Col
lette
Sch
ulz
Her
zenb
erg]
at 0
9:23
04
Aug
ust 2
014

show greater consistency in their voting behaviour, with fewer deviations from
partisanship and previous vote choices, as well as stronger partisan attitudes. In contrast,
voters in heterogeneous contexts are expected to show lower levels of partisan attitude
strength and less consistency in their vote choices.
3. Are there significant differences between the 2004 and 2009 elections regarding: a)
political engagement with discussants; b) the extent of heterogeneity within social
contexts?
I compare the frequency of political discussion among voters and the distribution of
context types across the two elections to evaluate whether, as I expect, political
engagement increased and social contexts became more politically heterogeneous in 2009.
Significance of the Study
The findings hold important implications for democracy. Competitive elections, where
incumbents are unsure of the outcome, are essential to the quality of democracy because they
encourage greater elite responsiveness and accountability to citizens. However, if the flow of
political information for most voters is so excessively homogeneous that it simply reinforces
existing partisan attachments, and eclipses consideration of short-term factors such as policy
or government performance, the ability of voters to make independent and informed choices
is undermined, and the likelihood of inter-party shifts remains low. This scenario
inadvertently consolidates the position of a dominant party by reducing chances for
competitive, unpredictable elections. The implications for democracy are unfavourable. After
all, vote shifts are a prerequisite for the ‘two turnover’ test, a phenomenon widely regarded as
the litmus test of democratic consolidation in countries like South Africa.24
However, if a significant proportion of the electorate is not embedded in politically
homogeneous social contexts they are more likely to be exposed to a diversity of political
communication and contrary opinions. This, in turn, should produce greater levels of
political deliberation and disagreement among citizens, which then encourage greater
political tolerance, increase the quality of opinion formation, and ultimately, enhance
opportunities for electoral change.25 Indeed, the vitality of democratic politics is said to
depend on the presence and survival of political heterogeneity and disagreement among
citizens.26 And, according to Huckfeldt and his colleagues, it is within politically
heterogeneous social networks that political disagreement can best survive.27 Accordingly,
among these voters, partisan loyalties are less fortified, and they are more receptive to
political alternatives. The uncertainty that they bring is the essential ingredient of
competitive democratic elections.
Results
Types of Social Context in South Africa
The CNEP surveys ask respondents a range of questions about their discussions regarding the
election campaign with their discussants, including family members, friends, neighbours,
24 S. Huntington, The Third Wave: Democratization in the Late Twentieth Century (Oklahoma, University ofOklahoma Press, 1991).
25 Huckfeldt et al., Political Disagreement, p. 2.26 Ibid.27 Ibid., p. 18.
The Influence of the Social Context on South African Voters 845
Dow
nloa
ded
by [
Col
lette
Sch
ulz
Her
zenb
erg]
at 0
9:23
04
Aug
ust 2
014

co-workers, as well as chosen intimates such as a spouse/partner or primary discussant.
In particular, CNEP asks respondents about the political preferences of these discussants and
whether the respondent perceives that they support the same party as him/herself.
The analysis starts by assessing the extent of ‘partisan congruence’, or fit between a
respondent’s self-declared partisan preference and his/her discussants.
Partisan Congruence and the Social Context. The data show that highly congruent
partisan relationships exist between voters and members of their social context. When
asked in 2004 whether their family, friends, neighbours and co-workers supported the
same party as themselves, 65 per cent responded positively for family, 46 per cent for
friends, 45 per cent for neighbours, and 31 per cent for co-workers.28 This is in stark
contrast to news media, where no more than 5 per cent of respondents perceive that they
are ever exposed to congruent partisan messages from their news media sources. In 2009,
perceived levels of partisan congruence with neighbours and co-workers decreased,
congruence with friends changed little, and congruence with family rose slightly (Table 1).
The confidence intervals (with a 5 per cent error) around the percentages suggest that the
increase in perceived partisan congruence with family members, as well as the decrease in
congruence with neighbours and co-workers, are changes that can be found in the wider
population. The percentages also move in the expected direction over the consecutive
elections. The two-sample t-test statistic between the two percentages for each year in each
discussant category shows a significant difference at the .05 level for family, neighbours
and co-workers.29
In response to a slightly different set of questions, when asked about perceptions of
partisan congruence with one’s spouse or partner, 19 per cent and 20 per cent of respondents
over the two campaigns, respectively, thought their spouse/partner supported the same party
as themselves (Table 2).30 A small percentage thought otherwise, confirming highly
congruent relationships between respondents and their spouse/partners, when people declare
that they have partners.
A simple correlation between the respondent’s partisanship and the spouse/partner’s
partisanship confirm strong matches between their supported parties.31 In addition, among
only those respondents that declare a spouse/partner, further cross-tabulation between the
partisan direction (ANC vs. Opposition) of the respondent’s and spouse’s party affiliations in
Table 3 again show a good fit. Among ANC identifiers, 87 per cent thought their spouses
supported the ANC, while only 3 per cent thought they supported an opposition party.32
Likewise, 72 per cent of opposition identifiers thought their partners supported an opposition
party, while 6 per cent thought their spouses supported the ANC.33 In 2009, the figures
28 Partisan congruence is measured using the survey item: do you think each of these groups supported the sameparty as you, supported another party, or is their support divided among several different parties, or don’t youknow enough about their views to say? A. Family; B. Friends; C. Neighbours; D. Co-workers. (1) Supportedsame party; (2) Supported another party; (3) Support is divided among different parties; (9) Don’t know.
29 Family: t(2398) ¼ 3.245, p ¼ .001; Friends: t(2398) ¼ 0.787, p ¼ 431; Neighbours: t(2398) ¼ 6.599, p ¼ .001;Co-workers: t(2398) ¼ 2.996, p ¼ .002. The maximum margin of error at 95% confidence for sample sizes of1,200 is 2.8%.
30 Partisan congruence between the respondent and his spouse/partner or primary discussant is operationalised bycoding the respondent and discussants’ party identification and perceived party support so that political partieshave identical response codes. Party choice items for spouse/partner: which party did he/she support in the lastelection? Party choice item for primary discussant: now I would like you to think of someone else with whom youmost frequently talk about matters that are most important to you. Which party did he/she support in the lastelection?
31 2004: contingency coefficient: .769**. In 2009 the statistical fit between the respondents and spouses partysupport strengthens: contingency coefficient: .896**.
32 1.9% thought their spouse/partner did not vote and 8.5% did not know. Cramer’s V: .809**.33 9% thought their spouse/partner did not vote and 13.4% did not know. Cramer’s V: .809**.
846 Journal of Southern African Studies
Dow
nloa
ded
by [
Col
lette
Sch
ulz
Her
zenb
erg]
at 0
9:23
04
Aug
ust 2
014

remained high, with 80 per cent of ANC partisans declaring a match with their spouse34 and
70 per cent of opposition partisans doing the same.35
Respondents and their primary discussants (usually the respondent’s mother, father,
sibling or close friend) are also highly likely to be congruent and share party preferences.
In 2004, 23 per cent of respondents thought their primary discussant supported the same party
as themselves, increasing dramatically to 45 per cent in 2009 (Table 4). Yet, as congruence
rises in 2009, so does a divergence of partisan views with one’s primary discussant. Again, a
simple correlation between the respondent’s partisanship and their primary discussant’s
partisanship confirm high congruence.36 Furthermore, cross-tabulations (Table 5) between
Table 1. Percentage of perceived partisan congruence between respondent and discussants
Social Context 2004 2009 Change
Family 65 71 6
(n ¼ 634) (n ¼ 912)
(CI ¼ ^2.712) (CI ¼ ^2.580)
Friends 46 45 21
(n ¼ 579) (n ¼ 866)
(CI ¼ ^2.826) (CI ¼ ^2.818)
Neighbours 45 32 213
(n ¼ 336) (n ¼ 609)
(CI ¼ ^2.819) (CI ¼ ^2.640)
Co-workers 31 25 26
(n ¼ 195) (n ¼ 395)
(CI ¼ ^2.619) (CI ¼ ^2.467)
Total n n ¼ 1200 n ¼ 1200
Table 2. Percentage of perceived partisan congruence between respondent and spouse/partner
Spouse/partner 2004 2009
No partner/non-identifiers/don’t know 80 78
(n ¼ 958) (n ¼ 928)
Agreement 19 20
(n ¼ 229) (n ¼ 243)
Divergence 1 2
(n ¼ 13) (n ¼ 29)
Total % 100 100
(n ¼ 1200) (n ¼ 1200)
Table 3. Percentage fit between respondent and spouse/partner by party identification
Year Respondent’s PID Spouse: ANC Spouse: Opposition Did not vote Don’t know Total %
2004 ANC 87 3 2 8 100
Opposition 6 72 9 13 100
2009 ANC 80 6 3 11 100
Opposition 12 70 6 12 100
34 3.2% thought their spouse/partner did not vote and 11% did not know. Cramer’s V: .727**.35 5.8% thought their spouse/partner did not vote and 12.5% did not know. Cramer’s V: .727**.36 2004: contingency coefficient: .743**. In 2009 the statistical fit between the respondents and primary discussant
strengthens: contingency coefficient: .799**.
The Influence of the Social Context on South African Voters 847
Dow
nloa
ded
by [
Col
lette
Sch
ulz
Her
zenb
erg]
at 0
9:23
04
Aug
ust 2
014
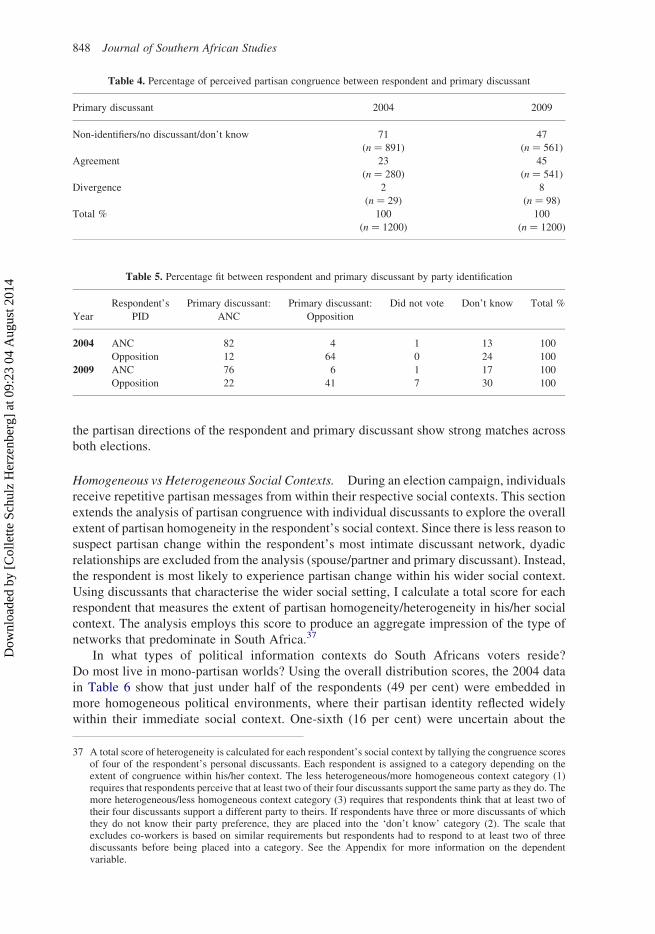
the partisan directions of the respondent and primary discussant show strong matches across
both elections.
Homogeneous vs Heterogeneous Social Contexts. During an election campaign, individuals
receive repetitive partisan messages from within their respective social contexts. This section
extends the analysis of partisan congruence with individual discussants to explore the overall
extent of partisan homogeneity in the respondent’s social context. Since there is less reason to
suspect partisan change within the respondent’s most intimate discussant network, dyadic
relationships are excluded from the analysis (spouse/partner and primary discussant). Instead,
the respondent is most likely to experience partisan change within his wider social context.
Using discussants that characterise the wider social setting, I calculate a total score for each
respondent that measures the extent of partisan homogeneity/heterogeneity in his/her social
context. The analysis employs this score to produce an aggregate impression of the type of
networks that predominate in South Africa.37
In what types of political information contexts do South Africans voters reside?
Do most live in mono-partisan worlds? Using the overall distribution scores, the 2004 data
in Table 6 show that just under half of the respondents (49 per cent) were embedded in
more homogeneous political environments, where their partisan identity reflected widely
within their immediate social context. One-sixth (16 per cent) were uncertain about the
Table 4. Percentage of perceived partisan congruence between respondent and primary discussant
Primary discussant 2004 2009
Non-identifiers/no discussant/don’t know 71 47
(n ¼ 891) (n ¼ 561)
Agreement 23 45
(n ¼ 280) (n ¼ 541)
Divergence 2 8
(n ¼ 29) (n ¼ 98)
Total % 100 100
(n ¼ 1200) (n ¼ 1200)
Table 5. Percentage fit between respondent and primary discussant by party identification
Year
Respondent’s
PID
Primary discussant:
ANC
Primary discussant:
Opposition
Did not vote Don’t know Total %
2004 ANC 82 4 1 13 100
Opposition 12 64 0 24 100
2009 ANC 76 6 1 17 100
Opposition 22 41 7 30 100
37 A total score of heterogeneity is calculated for each respondent’s social context by tallying the congruence scoresof four of the respondent’s personal discussants. Each respondent is assigned to a category depending on theextent of congruence within his/her context. The less heterogeneous/more homogeneous context category (1)requires that respondents perceive that at least two of their four discussants support the same party as they do. Themore heterogeneous/less homogeneous context category (3) requires that respondents think that at least two oftheir four discussants support a different party to theirs. If respondents have three or more discussants of whichthey do not know their party preference, they are placed into the ‘don’t know’ category (2). The scale thatexcludes co-workers is based on similar requirements but respondents had to respond to at least two of threediscussants before being placed into a category. See the Appendix for more information on the dependentvariable.
848 Journal of Southern African Studies
Dow
nloa
ded
by [
Col
lette
Sch
ulz
Her
zenb
erg]
at 0
9:23
04
Aug
ust 2
014

majority of their discussants’ party affiliations, while just over one-third of respondents
(35 per cent) lived in more heterogeneous/pluralistic political environments, where almost
all their discussants held different partisan allegiances from themselves. The 2009 survey
data shows a decline for those living in highly congruent relationships, to 41 per cent; a
small decline in those uncertain about most of their discussants’ partisan preferences
(to 15 per cent); and an increase of 9 percentage points in heterogeneous networks (to 44
per cent). It appears, therefore, that during the 2009 election campaign fewer people lived
in homogeneous environments, far more had incongruent, pluralistic political
relationships, while slightly fewer were uncertain about their regular discussants’ party
support.38
The overlap of racial and partisan differences in South African social spaces implies that
one’s most immediate discussants are likely to have similar political opinions, while
exposure to a diversity of political opinions is most likely to occur in the more distant
workplace. In South Africa, the workplace is the site of most cross-racial interaction.
Similarly, the literature has noted the capacity of the workplace to introduce a more
heterogeneous mix of viewpoints.39 When data on co-workers are excluded from the
analysis, the overall patterns observed in Table 6 remain, but partisan homogeneity
increases, as we might expect.40 This reaffirms that co-workers are the most pluralistic
partisan element within a respondent’s immediate discussant network, and that people who
have employment and discuss politics with co-workers are more likely to reside in
heterogeneous networks. The effects of this network type will be discussed shortly; suffice it
to state at this point that the workplace may have important consequences for individual
political behaviour.
Who Lives in Mono-Partisan Worlds? The results of a multivariate logistic regression
analysis using the 2009 data confirm that one’s spatial location matters independently of other
factors, in that rural people are more likely to live in homogeneous political spaces while
urban residents live in heterogeneous contexts (see Table 7). The results for race show that
coloured voters have a higher chance of living in heterogeneous contexts than black Africans,
whites and Indians. This finding corresponds with previous research, which argues that the
Table 6. Percentage distribution: social context types (scale includes family, friends, neighbours and co-workers)
Social context types 2004 2009 Change
Homogeneous context 49 41 28
(CI ¼ ^4.528) (CI ¼ ^3.468)
Don’t know 16 15 21
(CI ¼ ^3.312) (CI ¼ ^2.501)
Heterogeneous context 35 44 9
(CI ¼ ^4.311) (CI ¼ ^3.496)
Total % 100 100
(n ¼ 472) (n ¼ 778)
38 The confidence intervals (with a 5% error) suggest that the 8% decrease in homogeneous networks between 2004and 2009 can be inferred to the wider population. Similarly, the confidence intervals suggest that the percentageincrease in heterogeneous networks hold true also for the wider population. In addition, the two-sample t-teststatistics between the percentages for 2004 and 2009 were significant at the .05 level for both the homogeneousnetworks and heterogeneous networks categories. Homogeneous networks: t(1248) ¼ 2.794, p ¼ .005;heterogeneous networks: t(1248) ¼ 3.213, p ¼ .001; Don’t know: t(1248) ¼ 0.525, p ¼ .599.
39 Huckfeldt et al., Political Disagreement, p. 24.40 See detailed results in Schulz-Herzenberg, ‘The Implications of Social Context Partisan Homogeneity’, p. 284.
The Influence of the Social Context on South African Voters 849
Dow
nloa
ded
by [
Col
lette
Sch
ulz
Her
zenb
erg]
at 0
9:23
04
Aug
ust 2
014

‘coloured vote’ is not homogeneous and has been divided among a number of political parties
since 1994.41 A new variable, which stands as a rudimentary proxy for poverty status, taps
‘type of house’, and shows that poorer people have greater odds of living in highly
homogeneous political environments. Education loses statistical significance in the
multivariate analysis, and gender and age are insignificant.
The Influence of the Social Context on Voter Behaviour
Does partisan homogeneity within social contexts affect individual-level voting behaviour?
Voters embedded within politically congruent or homogeneous social contexts are more likely
to be exposed to repetitive partisan messages that not only support their prevailing partisan
beliefs but also serve to reinforce and strengthen them. When most of these messages support
the voter’s partisanship, they can have a cumulative effect on the formation of attitudes about
the campaign, and subsequent behaviour. As Beck and Richardson argue, ‘as exposure to
partisan sources that reinforce one’s own partisanship increases so voters become more
embedded into a homogeneous partisan information context’.42 I explore the implications of
being embedded within one of the two context types for individual-level voting behaviour, and
expect to find that these two very different political information networks have different effects
on voter behaviour. Individuals in homogeneous partisan contexts should show greater
consistency and strength in their voting behaviour and attitudes, while those living in
heterogeneous contexts are expected to show less. The analysis explores differences in the
effects of the two contexts on the following aspects of voter behaviour: when a voter decides to
vote; if a voter is a partisan or non-partisan; strength of partisan attitudes; if a voter would
consider voting for another party; defections between partisanship and vote choice in the 2004
and 2009 elections; changes in vote choice across consecutive elections.
Table 7. Logistic regression: social context type and demographics
DV: Partisan context type (0) Homogeneous context (1)
Heterogeneous context
95% CI for Odds ratio (Exp B)
Variables B (SE) Sig. Lower Odds Ratio Upper
Urban (0) rural (1) 2 .629 (.183) .001 .372 .533 .763
Age 2 .001 (.002) .765 .994 .999 1.004
Race (black-ref) .000
(coloured) 1.237(.314) .000 1.860 3.444 6.378
(Asian) 2 .763 (.673) .257 .125 .466 1.746
(white) 21.048 (.318) .001 .188 .351 .654
Education .049 (.050) .329 .952 1.050 1.157
(0) No formal schooling
(8) Post grad
Male (0) Female (1) 2 .144 (.165) .384 .626 .866 1.197
Type of house 2 .310 (.079) .000 .628 .733 .856
(1) Luxury
(6) Shack
Constant 1.320 (.415) .001 3.744
Note: R 2 ¼ .107 (Cox and Snell), .14 (Nagelkerke), Model x2 (8) ¼ 74.96, p , .01**
41 M. Eldridge and J. Seekings, ‘Mandela’s Lost Province: The African National Congress and the Western CapeElectorate in the 1994 South African Elections’, Journal of Southern African Studies, 22, 4 (1996), pp. 517–40;J. Seekings, ‘Partisan Realignment in Cape Town 1994–2004’, Journal of African Elections, 5, 1 (2006),pp. 176–203.
42 Richardson and Beck, ‘The Flow of Political Information’, p. 194.
850 Journal of Southern African Studies
Dow
nloa
ded
by [
Col
lette
Sch
ulz
Her
zenb
erg]
at 0
9:23
04
Aug
ust 2
014

When Did You Decide to Vote? When asked ‘when did you decide to vote for that party?’,
the bivariate correlations in Table 8 show an association between early voting decisions and
homogeneous partisan contexts, and late decisions and heterogeneous partisan contexts in
both elections (2004: Spearman’s rho .207**; 2009: .253**).43
Partisan Identification. Perhaps the most significant political attitude for voting behaviour
is partisan identification.44 When asked if the respondent identifies with any particular
political party, the bivariate correlations in Table 8 show an association between being a
partisan and living within a homogeneous partisan context and being a non-partisan and
living within a heterogeneous context (2004: Spearman’s rho .248**; 2009: .120**). 45
Strength of Partisan Attitudes. Social contexts are recognised for their effects on
individual-level attitude strength. Higher levels of congruence within social contexts increase
the strength of attitudes or opinions because they are validated when anchored in one’s
context. Conversely, heterogeneity decreases attitude strength by reducing the confidence
that people have in the correctness of their attitudes.46 When asked how close the respondent
feels towards that particular party, the bivariate correlations in Table 8 show an association
between being a strong party identifier and living within a homogeneous partisan context
(2004: Spearman’s rho .247**; 2009: .202**).47 Data also confirm that the strength of party
identification increases with exposure to congruent partisan communication with particularly
influential personal discussants, such as one’s spouse/partner (2004: Pearson .430*; 2009:
.263**) and one’s primary discussant (2004: Pearson .510**; 2009: .466**).48 So, when a
voter agrees politically with a regular discussant, or when they live in highly homogeneous
partisan discussant contexts, the intensity of their partisanship increases.
Table 8. Correlation coefficients between homogeneous social contexts and voter behaviour
Homogeneous social context
(1) More homogeneous context
(2) Don’t know
(3) More heterogeneous context 2004 2009
Early voting decision .207** .253**
Partisan (or not) .248** .120**
Strong party identification .247** .202**
Unwilling to consider voting for another party .133** .132**
Spearman’s rho ** ¼ Correlation is significant at the p ,0.01 level.
43 Spearman’s rho is used repeatedly as the non-parametric equivalent of Pearson’s R in this paper. ‘When did youdecide to vote for that party?’ (1) Always intended voting for this party, (2) Before the election campaign started,(3) At least a month before election day, (4) A few weeks before election day, (5) In the last week before electionday, (6) On election day.
44 A. Campbell, P. Converse, W. Miller and D. Stokes, The American Voter (New York, JohnWiley & Sons, 1960);R. Dalton, Citizen Politics: Public Opinion and Political Parties in Advanced Democracies, 3rd edn (New Jersey,Chatham House Publishers, 2002). p. 174.
45 Do you usually think of yourself as close to any particular political party? (1) Partisan, (2) Non-partisan.46 P. Visser and R. Mirabile, ‘Attitudes in the Social Context: The Impact of Social Network Composition on
Individual-Level Attitude Strength’, Journal of Personality And Social Psychology, 87, 6 (2004), p. 780.47 Do you feel very close to this party, somewhat close, or not very close? (1) Very close, (2) Somewhat close,
(3) Not very close, (4) No allegiance.48 When you talk to him/her, do you agree (about the recent election)? (0) never (1) rarely (2) sometimes (3) often
(5) not married/living with partner (9) don’t know. Recoded to (1) Extensive agreement between respondent andsource, (2) Difference of opinions between respondent and source, (3) No party allegiances/non partisan.
The Influence of the Social Context on South African Voters 851
Dow
nloa
ded
by [
Col
lette
Sch
ulz
Her
zenb
erg]
at 0
9:23
04
Aug
ust 2
014

Consider Voting for Another Party. When asked ‘did you consider voting for another
party?’, the bivariate correlations in Table 8 show an expected association between an
unwillingness to consider other party options and living in a homogeneous context, and being
a potential party switcher and living within a heterogeneous context (2004: Spearman’s rho
.133**; 2009: .132**).49
Consistency and Deviation: Party Identification and Vote Choice
A vast literature argues that while vote choice is strongly influenced by party identification the
two constructs remain theoretically and conceptually independent.50 So while party
identification and vote choice should correlate strongly regardless of context type, we can
expect to find a stronger match for respondents in homogeneous contexts. In contrast, variance
between party identification and vote choice should be more pronounced for respondents in
heterogeneous contexts. The data in Table 9 support this observation.51 The differences in the
strength of the co-efficients between the respondent’s self-declared party identification and
party support at the time of the two elections shows that respondents in heterogeneous contexts
aremore likely to vote for a party that differs from their partisanship. For the 2004 elections, the
strength of consistency between party identification and vote choice is stronger for
homogeneous contexts (Spearman’s rho .738**) than for heterogeneous contexts (Spearman’s
rho .341**).52 Again, for the 2009 elections the pattern remains the same, with voters
in homogeneous contexts showing a higher match between their partisanship and vote choice
(Spearman’s rho .597**) than those in heterogeneous contexts (Spearman’s rho .557**).53
Defection in Vote Choice across Elections: Switchers vs Standpatters
Both CNEP 2004 and 2009 surveys ask respondents which party they voted for in the
previous (most recent) election and then also the election that preceded it, to obtain a
Table 9. Bivariate correlations: consistency or match between declared partisanship and vote choice
Homogeneous contexts Heterogeneous contexts
2004 .738** .341**
2009 .597** .557**
Table 10. Bivariate correlations: social context types and defections in vote choice
Homogeneous contexts Heterogeneous contexts
1999–2004 .662** .531**
2004–2009 .501** .332**
49 Did you consider voting for another party? (1) No, (2) Yes.50 Campbell et al., The American Voter; Dalton, Citizen Politics, p. 174.51 Bivariate correlations show the ‘match’ between a variable that taps the respondent’s self-declared party identification
and one that taps the political party that the respondent voted for in the recent election. Both variables have identicalresponse category codes. The dataset is split or layered by the Context Type dependent variable to obtain separatebivariate correlations for the 3 categories (homogeneous contexts, don’t know, and heterogeneous contexts) forcomparison. Respondent’s Partisanship: Do you usually think of yourself as close to any particular political party?Which party is that? Respondent’s Vote Choice: For which party did you vote for national government?
52 Don’t know: .773**53 Don’t know: .489**
852 Journal of Southern African Studies
Dow
nloa
ded
by [
Col
lette
Sch
ulz
Her
zenb
erg]
at 0
9:23
04
Aug
ust 2
014
retrospective impression of each respondent’s vote choice across two consecutive elections.
When I examine shifts in party support between two consecutive elections, where the
respondent defects from the vote choice of the previous election to a new political party in the
subsequent election, there is support for the hypothesis that vote shifting is more frequent
among voters in heterogeneous contexts. Looking at vote shifts between the 1999 and 2004
elections (or the match between the respondent’s choice of political party at both elections),
bivariate correlations for homogeneous contexts in Table 10 are far stronger (Spearman’s rho
.662**) compared to heterogeneous contexts (Spearman’s rho .531**).54 Reported vote shifts
between the 2004 and 2009 elections show that respondents living in homogeneous contexts
are far less likely to shift their support to a new party. The match shown in Table 10 between
their chosen parties in both elections has a higher likelihood of being the same (Spearman’s
rho .501**) compared to respondents in heterogeneous contexts (Spearman’s rho .332**).55
Results for the second election are more pronounced, and probably reflect the more
competitive nature of the 2009 election, and the increase in the diversity of choice for many
more voters.
Multivariate Analysis: Do Social Contexts Make an Independent Contribution?
A number of theoretical explanations for voting behaviour in South Africa appear both
reasonable andpossible.Arguments suggesting that sociological reasonsmotivateSouthAfrican
voters are convincing. After all, domestic politics has pivoted around racial dynamics for many
years. The economic and political performances of government are also important factors: good
economic performancewill determine job-creation in themedium term,while good governance,
proper socio-economic delivery and institutional and leadership performances are keymeasures
of any democratic regime. Partisanship remains a strong indicator of support, and the cognitive
abilities of votersmediate thewaypeopleperceive andprocess political information.To estimate
the unique, independent contribution of social contexts, it is imperative to ensure that the effects
of one’s context type stand up independently against other important predictors of voting
behaviour.
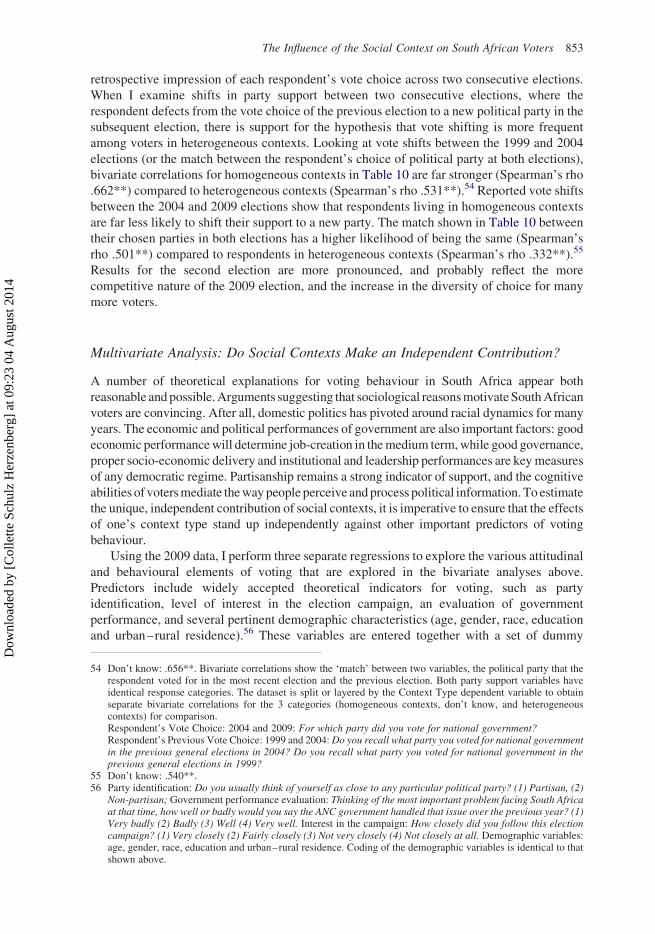
Using the 2009 data, I perform three separate regressions to explore the various attitudinal
and behavioural elements of voting that are explored in the bivariate analyses above.
Predictors include widely accepted theoretical indicators for voting, such as party
identification, level of interest in the election campaign, an evaluation of government
performance, and several pertinent demographic characteristics (age, gender, race, education
and urban–rural residence).56 These variables are entered together with a set of dummy
54 Don’t know: .656**. Bivariate correlations show the ‘match’ between two variables, the political party that therespondent voted for in the most recent election and the previous election. Both party support variables haveidentical response categories. The dataset is split or layered by the Context Type dependent variable to obtainseparate bivariate correlations for the 3 categories (homogeneous contexts, don’t know, and heterogeneouscontexts) for comparison.Respondent’s Vote Choice: 2004 and 2009: For which party did you vote for national government?Respondent’s Previous Vote Choice: 1999 and 2004:Do you recall what party you voted for national governmentin the previous general elections in 2004? Do you recall what party you voted for national government in theprevious general elections in 1999?
55 Don’t know: .540**.56 Party identification: Do you usually think of yourself as close to any particular political party? (1) Partisan, (2)
Non-partisan; Government performance evaluation: Thinking of the most important problem facing South Africaat that time, how well or badly would you say the ANC government handled that issue over the previous year? (1)Very badly (2) Badly (3) Well (4) Very well. Interest in the campaign: How closely did you follow this electioncampaign? (1) Very closely (2) Fairly closely (3) Not very closely (4) Not closely at all. Demographic variables:age, gender, race, education and urban–rural residence. Coding of the demographic variables is identical to thatshown above.
The Influence of the Social Context on South African Voters 853
Dow
nloa
ded
by [
Col
lette
Sch
ulz
Her
zenb
erg]
at 0
9:23
04
Aug
ust 2
014

variables that tap the two context types. Each multivariate analysis is run twice: in the first
regression all the above-listed variables are entered into the regression; in the second
instance, the insignificant predictors are removed from the model and only the statistically
significant results are included in the analysis. These secondary results are presented in
Tables 11–13. The results of the regressions conclusively demonstrate that the effect of one’s
context type continues to make an independent and statistically significant contribution
towards predicting various aspects of voting behaviour (and in the hypothesised direction)
even when other salient factors are considered. Moreover, social context types often make
relatively larger impacts than these other important predictors.
Consider Voting for Another Party? The chances of voters from heterogeneous contexts
considering voting for another party than his/her usual political party choice is 1.8 times
higher than for voters living in homogeneous contexts (Table 11). In addition, the literature
on voter behaviour suggests that voters move their support based on their evaluations of
incumbent performance.57 Table 11 suggests that if voters perceive that government’s
handling of the most important problems is poor they are more likely to consider voting for
another party.58 In other words, evaluations of government’s performance make a
contribution independent from context type to one’s decision about voting for a different
party. Furthermore, younger people are more likely than their older counterparts to consider
voting for another party. The model’s effect size is .092 (Nagelkerke).
Strength of Partisanship
Undoubtedly, the strength of partisanship can be explained by whether one is a party
identifier or not. In addition, however, social context types also matter – voters in
homogeneous contexts have stronger partisan attitudes (Table 12).59 Finally, the intensity of
partisan attitudes increases when levels of interest in the election campaign increase.
The model explains 77 per cent of the variance in the dependent variable.
When Did You Decide to Vote For That Party? Finally, social context types also make an
independent and statistically significant contribution to the timing of a voter’s decision-
making to support a particular party. Voters in homogeneous social contexts are more likely to
make earlier decisions about which party to vote for than individuals living in heterogeneous
contexts (Table 13).60 Partisan voters tend to make earlier decisions than non-partisans, as do
voters who are interested in the campaign, younger voters, more educated voters, and rural
voters. In terms of race, black voters are more likely than coloured voters to make early, firm
decisions about which party to vote for, as are white voters compared to their black African
counterparts. The model explains 12 per cent of the variance in the dependent variable.
Changes to the Social Context: Comparing the 2004 and 2009 elections
If the unique events that preceded the 2009 election affected the partisan content of political
information flowing through communication networks, we can expect to see higher levels of
57 A. Downs, An Economic Theory of Democracy (New Jersey, Prentice Hall, 1957); M. Fiorina, RetrospectiveVoting in American Presidential Elections (New Haven, Yale University Press, 1981).
58 Excluded insignificant variables: partisan identifier, level of interest in the election campaign, gender, race,education, and urban–rural.
59 Excluded insignificant variables: evaluation of government performance, age, education, urban–rural, genderand race.
60 Excluded insignificant variables: evaluation of government performance and gender.
854 Journal of Southern African Studies
Dow
nloa
ded
by [
Col
lette
Sch
ulz
Her
zenb
erg]
at 0
9:23
04
Aug
ust 2
014

political discussion and engagement with regular discussants compared to the previous
election. Data shows an increase in political discussion across the two elections (Table 14).61
Those who frequently discussed politics with family (often or sometimes) increased from 31
per cent in 2004 to 58 per cent in 2009. Similarly, frequent discussion with friends rose from
35 per cent to 53 per cent, for neighbours from 17 per cent to 28 per cent, and for co-workers
from 15 per cent to 23 per cent. There is also a slight increase of 3 percentage points in
political discussion with the respondent’s primary discussant, from 57 per cent to 60 per cent.
Table 12. OLS regression: strength of partisanship
DV: Strength of partisanship 95% CI for B
Variables B SE B b Sig. Lower Upper
(Constant) 2 .679 .059 .000 2 .795 2 .562
Partisan or not 2.151 .038 .823 .000 2.077 2.225
Homogeneous context vs others (dummy) 2 .188 .037 2 .073 .000 2 .261 2 .116
Don’t know vs others (dummy) 2 .118 .055 2 .030 .034 2 .226 2 .009
Interest in campaign .136 .017 .120 .000 .103 .168
Note: R 2 ¼ .775, Adjusted R 2 ¼ .774, DR 2 ¼ .775, (p , .000)
Table 13. OLS regression: when did you decide to vote for that party?
DV: When did you decide to vote for that party? 95% CI for B
Variables B SE B b Sig. Lower Upper
(Constant) 5.603 .238 .000 5.136 6.069
Partisan or not 2 .659 .106 2 .200 .000 2 .867 2 .450
Interest in campaign 2 .118 .044 2 .088 .007 2 .204 2 .033
Homogeneous context vs others (dummy) .406 .093 .140 .000 .223 .589
Don’t know vs others (dummy) .079 .141 .018 .573 2 .197 .356
Age 2 .002 .001 2 .068 .028 2 .003 .000
Education .053 .024 .072 .028 .006 .101
Urban–rural .314 .091 .116 .001 .136 .493
Black vs coloured 2 .357 .153 2 .074 .020 2 .659 2 .056
Black vs Indian .348 .278 .039 .211 2 .198 .893
Black vs white .309 .144 .071 .032 .027 .592
Note: R 2 ¼ .127, Adjusted R 2 ¼ .118, DR 2 ¼ .127, (p , .000)
Table 11. Logistic regression: consider voting for another party?
DV: Consider voting for another party? 95% CI for Odds ratio (Exp B)
Variables B (SE) Sig. Lower Odds Ratio Upper
Age 2 .020 (.007) .004 .967 .981 .994
Homogeneous context (Ref group) .000
Don’t know 2 .880 (.383) .022 .196 .415 .878
Heterogeneous context .612 (.197) .002 1.254 1.844 2.711
Government performance evaluation 2 .322 (.118) .007 .575 .725 .914
(Constant) 2 .064 (.374) .864 .938
Note: R 2 ¼ .062 (Cox and Snell), .092 (Nagelkerke), Model x2 (4) ¼ 42.22, p , .000.
61 How frequently did you talk about the candidates, parties or issues with your: A. Family B. FriendsC. Neighbours D. Co-workers? (0) Never (1) Rarely (2) Sometimes (3) Often.
The Influence of the Social Context on South African Voters 855
Dow
nloa
ded
by [
Col
lette
Sch
ulz
Her
zenb
erg]
at 0
9:23
04
Aug
ust 2
014
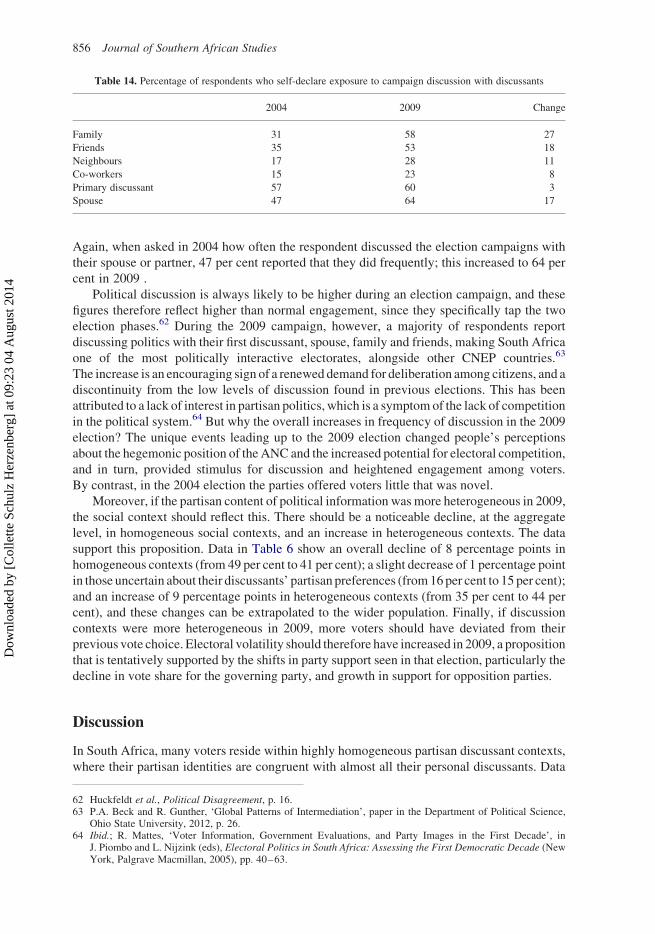
Again, when asked in 2004 how often the respondent discussed the election campaigns with
their spouse or partner, 47 per cent reported that they did frequently; this increased to 64 per
cent in 2009 .
Political discussion is always likely to be higher during an election campaign, and these
figures therefore reflect higher than normal engagement, since they specifically tap the two
election phases.62 During the 2009 campaign, however, a majority of respondents report
discussing politics with their first discussant, spouse, family and friends, making South Africa
one of the most politically interactive electorates, alongside other CNEP countries.63
The increase is an encouraging sign of a renewed demand for deliberation among citizens, and a
discontinuity from the low levels of discussion found in previous elections. This has been
attributed to a lack of interest in partisan politics, which is a symptom of the lack of competition
in the political system.64 But why the overall increases in frequency of discussion in the 2009
election? The unique events leading up to the 2009 election changed people’s perceptions
about the hegemonic position of theANC and the increased potential for electoral competition,
and in turn, provided stimulus for discussion and heightened engagement among voters.
By contrast, in the 2004 election the parties offered voters little that was novel.
Moreover, if the partisan content of political information was more heterogeneous in 2009,
the social context should reflect this. There should be a noticeable decline, at the aggregate
level, in homogeneous social contexts, and an increase in heterogeneous contexts. The data
support this proposition. Data in Table 6 show an overall decline of 8 percentage points in
homogeneous contexts (from 49 per cent to 41 per cent); a slight decrease of 1 percentage point
in those uncertain about their discussants’ partisan preferences (from16per cent to 15 per cent);
and an increase of 9 percentage points in heterogeneous contexts (from 35 per cent to 44 per
cent), and these changes can be extrapolated to the wider population. Finally, if discussion
contexts were more heterogeneous in 2009, more voters should have deviated from their
previous vote choice. Electoral volatility should therefore have increased in 2009, a proposition
that is tentatively supported by the shifts in party support seen in that election, particularly the
decline in vote share for the governing party, and growth in support for opposition parties.
Discussion
In South Africa, many voters reside within highly homogeneous partisan discussant contexts,
where their partisan identities are congruent with almost all their personal discussants. Data
Table 14. Percentage of respondents who self-declare exposure to campaign discussion with discussants
2004 2009 Change
Family 31 58 27
Friends 35 53 18
Neighbours 17 28 11
Co-workers 15 23 8
Primary discussant 57 60 3
Spouse 47 64 17
62 Huckfeldt et al., Political Disagreement, p. 16.63 P.A. Beck and R. Gunther, ‘Global Patterns of Intermediation’, paper in the Department of Political Science,
Ohio State University, 2012, p. 26.64 Ibid.; R. Mattes, ‘Voter Information, Government Evaluations, and Party Images in the First Decade’, in
J. Piombo and L. Nijzink (eds), Electoral Politics in South Africa: Assessing the First Democratic Decade (NewYork, Palgrave Macmillan, 2005), pp. 40–63.
856 Journal of Southern African Studies
Dow
nloa
ded
by [
Col
lette
Sch
ulz
Her
zenb
erg]
at 0
9:23
04
Aug
ust 2
014

from the 2004 election found this phenomenon to be widespread, affecting almost half of the
electorate (49 per cent), decreasing to 41 per cent in 2009. Yet, many more voters are not
embedded in homogeneous political information contexts. Some exist in social contexts
where uncertainty or ambivalence prevails. The rest are subject to cross-pressures, as they
receive a mix of contradictory partisan signals from their politically heterogeneous contexts.
The surprisingly low within-group homogeneity regarding political discussion is important
for democratic politics because, as previously noted, when people are exposed to political
deliberation, and even political disagreement, the quality of opinion formation and,
ultimately, the chance of electoral change increase.65
The data also show that the level of partisan homogeneity within social contexts can
influence individual-level electoral behaviour, even after other salient influences are
considered. Voters who reside within highly homogeneous discussion contexts tend to be far
more consistent in their behaviour, deviating less frequently from their party identification, or
their previous vote choice. They are also stronger party identifiers, making them core
supporters for any political party. Their attitudes towards parties and politics are likely to
continue to be shaped by those closest to them as they experience ongoing reinforcement of
their existing partisan attachments. They will conform to the dominant partisan norm, and are
less likely to move their support to another party. Their behaviour at elections also provides a
plausible explanation for the appearance of strong cleavage voting in South Africa, even
when people are not explicitly expressing their racial identities. Election outcomes are simply
a reflection of racially defined information contexts, which remain politically homogeneous
because of ongoing reinforcement and behavioural conformities. In other words, the
appearance of racial voting simply reflects the compounding effects of the high levels of
partisan bias of the information context within which the voter resides. As Beck et al.
conclude, ‘ . . . voters do not operate in the social vacuum that much of the contemporary
literature seems to assume. Rather, voters’ enduring personal characteristics interact with the
messages they are receiving from the established social context in which they operate’.66
In contrast, voters with politically diverse or heterogeneous discussion contexts are more
likely to defect from their party identification when they vote, are more likely to defect from
their previous vote choice in subsequent elections, have weaker partisan ties and are more
likely to consider alternative political homes. This finding has particular importance for
electoral competition in South Africa’s one-party-dominant democracy. For a substantial
proportion of the electorate, while political discussion and opinion formation is shaped by
partisan attitudes and everyday experience, it is also profoundly influenced by the extent of
diversity of political communication with those around them. And the mere presence of
deliberation, debate and occasional disagreement within these contexts should enrich the
quality of opinion formation at elections. Ultimately, these voters are more receptive to short-
term political developments, are more willing to adjust their political attitudes and therefore
inject a much-needed degree of electoral uncertainty when they do vote.
Finally, the decrease of partisan homogeneity in discussant contexts across the two
elections suggests that momentous socio-political developments – if sufficiently powerful
– can change the nature of social contexts in a society. In the case of South Africa, the
events leading up to the 2009 election that brought about the ANC’s leadership change, and
the rise of COPE, challenged voter loyalties, especially among black South Africans. These
events diversified the partisan content of political information flowing to voters, affecting
the way they learnt about and responded to political parties and candidates. Survey
data support the notion of an exceptional campaign in 2009 – illustrated in the increases in
65 Huckfeldt et al., Political Disagreement, p. 2.66 Beck et al., ‘The Social Calculus of Voting’, p. 69.
The Influence of the Social Context on South African Voters 857
Dow
nloa
ded
by [
Col
lette
Sch
ulz
Her
zenb
erg]
at 0
9:23
04
Aug
ust 2
014

exposure to political news, increases in political discussion, and importantly, the overall
decline in politically congruent social contexts. This potential for increased competition
among the major political parties, plus free television and radio space for political party
advertisements, were suitably inspiring for voters to intensify their political discussions and
exposure to media coverage. With many more voters exposed to more partisan diversity,
their discussant contexts became less politically congruent, accounting for the overall
decline in homogeneous contexts. With more heterogeneous contexts, electoral volatility
should have increased as more voters deviated from their previous vote choice. The decline
in ANC support, new support for COPE, and increase in support for the main opposition
DA certainly suggest some degree of vote shifting as voters sought new political homes.
Overall, this decline in homogeneous contexts during 2009 presents an encouraging
sign for South Africa’s democratic future. If the content of political information flowing
through social contexts continues to diversify in future election campaigns, especially
with the arrival of new, credible political contenders, the ‘buttressing effects’ of partisan
congruence on voting decisions should decrease as homogeneous partisan contexts erode
further. This development should foster new opportunities for political competition.
The emergence of the Economic Freedom Fighters, led by ex-ANC Youth League leader
Julius Malema, as well as the ongoing racial transformation of the leadership profile of the
main opposition party, the Democratic Alliance, should together have introduced greater
choice for many voters during the South Africans’ 2014 elections. The opportunity to vote
for legitimate alternatives to the ANC invited rigorous political debates during
the campaign, which further challenged the traditional partisan proclivities of many
more voters.
COLLETTE SCHULZ-HERZENBERG
Centre for Social Science Research, University of Cape Town, Private Bag X3, Rondebosch,
7701, Cape Town, South Africa. E-mail: [email protected]
858 Journal of Southern African Studies
Dow
nloa
ded
by [
Col
lette
Sch
ulz
Her
zenb
erg]
at 0
9:23
04
Aug
ust 2
014

Appendix
Table A2. Distribution of partisan congruence for social context scales, 2004 and 2009
2004 Aggregate congruence
Friends, family
& neighbours
Friends, family, neighbours
&co-workers
0 – Respondent has no congruent relationships 62.8 (753) 62.6 (751)
1 – Respondent has 1 congruent relationship 17.5 (208) 16.7 (200)
2 – Respondent has 2 congruent relationships 11.6 (140) 10.8 (130)
3 – Respondent has 3 congruent relationships 8.2 (98) 7.3 (88)
4 – Respondent has 4 congruent relationships N/A 2.5 (30)
(Missing) 1 2
Total 100% (1200) 100% (1200)
2009 Aggregate congruence Friends, family
& neighbours
Friends, family, neighbours
& co-workers
0 – Respondent has no congruent relationships 32.6 (391) 31.8 (381)
1 – Respondent has 1 congruent relationship 29.7 (357) 27.9 (335)
2 – Respondent has 2 congruent relationships 22.9 (274) 22.7 (272)
3 – Respondent has 3 congruent relationships 14.8 (178) 9.5 (114)
4 – Respondent has 4 congruent relationships N/A 8 (95)
(Missing) – 2 (3)
Total 100% (1200) 100% (1200)
Table A1. Frequency distribution of dependent variable: social context type, 2004 and 2009
2004 Frequency Per cent Valid per cent
More homogeneous (1) 233 19.5 49.4
Don’t know (2) 75 6.3 15.9
More heterogeneous (3) 164 13.7 34.7
Total 472 39.4 100.0
Missing 723 60.6
Total 1200 100.0
2009 Frequency Per cent Valid per cent
More homogeneous (1) 321 26.8 41.3
Don’t know (2) 115 9.6 14.8
More heterogeneous (3) 341 28.5 43.9
Total 777 64.9 100.0
Missing 423 35.1
Total 1200 100.0
The Influence of the Social Context on South African Voters 859
Dow
nloa
ded
by [
Col
lette
Sch
ulz
Her
zenb
erg]
at 0
9:23
04
Aug
ust 2
014
Top Related
Copyright © 2022 FDOKUMEN

