


Bahasa
Halaman
Hukum

The Impact of State Laws Limiting
Malpractice Awards on the Geographic Distribution of Physicians
Fred J. Hellinger, Ph.D.*
and
William E. Encinosa, Ph.D.*
July 3, 2003
U.S. Department of Health and Human Services Agency for Healthcare Research and Quality
*Center for Organization and Delivery Studies (CODS) 540 Gaither Road, Room 5319 Rockville, Maryland 20850
Phone 301-427-1408 Fax 301-427-1430 E-Mail [email protected]
Abstract
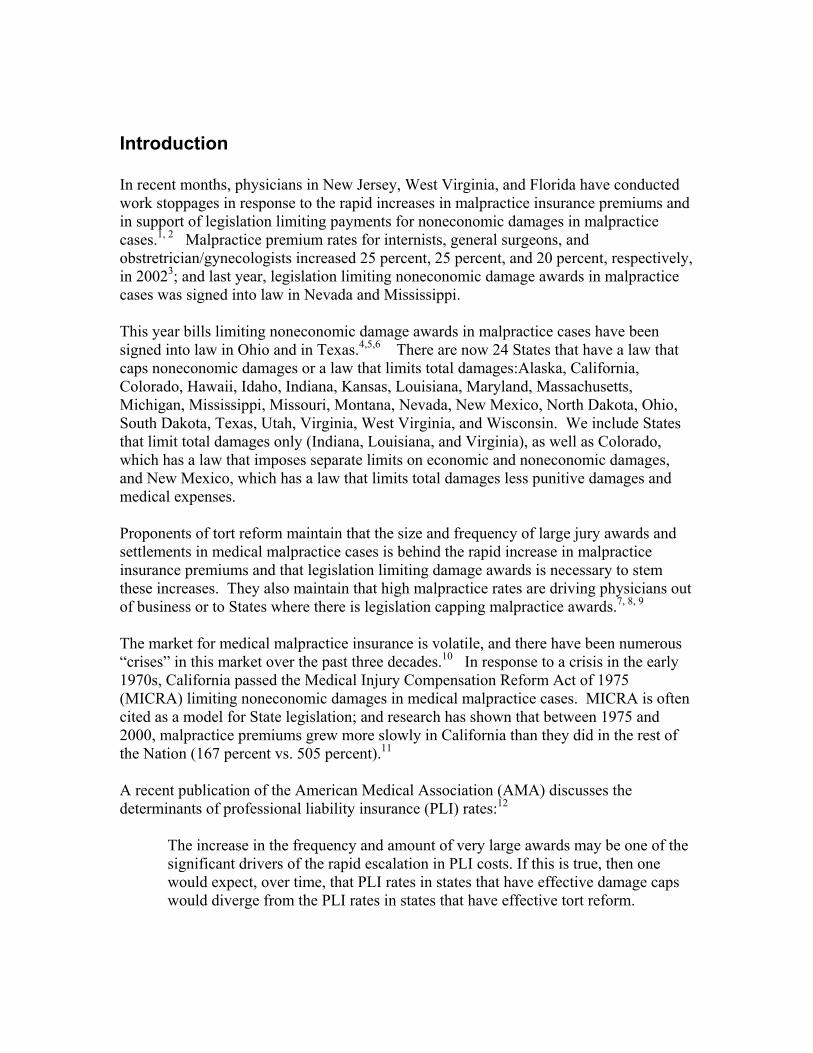
Researchers at the Agency for Healthcare Research and Quality (AHRQ) have examined the impact of different kinds of State laws in a number of previous studies. This study examines the impact of State legislation that caps damage awards in malpractice cases on decisions of physicians about where to practice medicine. Twenty-four States now have laws that limit damage payments in malpractice cases. Most of these laws limit the amounts paid for noneconomic damages (e.g., pain and suffering) but a few limit both economic (e.g., medical expenses and lost wages) and noneconomic damages. There is currently a national debate on the desirability of extending caps on malpractice damage awards to all States, and President Bush recently introduced a proposal to cap payments for noneconomic damages in medical malpractice cases at $250,000. Supporters of legislation to cap damages in malpractice cases maintain that it reduces malpractice premiums and helps insure an adequate supply of physicians. They also assert that escalating, multi-million-dollar jury awards are driving malpractice premium increases and that capping damage awards for pain and suffering helps restrain the rate of increase. Without such a law, it is asserted that the loss of affordable medical malpractice insurance for physicians could eventually lead to the loss of affordable, accessible health care. Opponents of this legislation maintain that insurance companies are trying to compensate for poor business decisions and fading investment income. Although there is some evidence in the literature demonstrating that physicians in States with tort reform laws capping malpractice awards enjoy lower malpractice premiums, there is no evidence about the impact of malpractice cap legislation on decisions by physicians regarding geographic location. This study is the first to supply such evidence. A simple comparison of the supply of physicians per capita between States that did and did not adopt a cap revealed that States with caps experienced a more rapid increase in their supply of physicians. In 1970, before any States had a law capping damage payments in malpractice cases, States that eventually adopted a cap and States that did not eventually adopt a cap had virtually identical levels of physicians per 100,000 citizens per county (69 vs. 67). Thirty years later in 2000, States that adopted a cap averaged 135 physicians per 100,000 citizens per county while States without a cap averaged 120. Adjusting for a variety of factors in a multivariate regression model, we found that States with caps on noneconomic damages experienced about 12 percent more physicians per capita than States without such a cap. Moreover, we found that States with relatively high caps were less likely to experience an increase in physician supply than States with lower caps.
Introduction
In recent months, physicians in New Jersey, West Virginia, and Florida have conducted work stoppages in response to the rapid increases in malpractice insurance premiums and in support of legislation limiting payments for noneconomic damages in malpractice cases.1, 2 Malpractice premium rates for internists, general surgeons, and obstretrician/gynecologists increased 25 percent, 25 percent, and 20 percent, respectively, in 20023; and last year, legislation limiting noneconomic damage awards in malpractice cases was signed into law in Nevada and Mississippi. This year bills limiting noneconomic damage awards in malpractice cases have been signed into law in Ohio and in Texas.4,5,6 There are now 24 States that have a law that caps noneconomic damages or a law that limits total damages:Alaska, California, Colorado, Hawaii, Idaho, Indiana, Kansas, Louisiana, Maryland, Massachusetts, Michigan, Mississippi, Missouri, Montana, Nevada, New Mexico, North Dakota, Ohio, South Dakota, Texas, Utah, Virginia, West Virginia, and Wisconsin. We include States that limit total damages only (Indiana, Louisiana, and Virginia), as well as Colorado, which has a law that imposes separate limits on economic and noneconomic damages, and New Mexico, which has a law that limits total damages less punitive damages and medical expenses. Proponents of tort reform maintain that the size and frequency of large jury awards and settlements in medical malpractice cases is behind the rapid increase in malpractice insurance premiums and that legislation limiting damage awards is necessary to stem these increases. They also maintain that high malpractice rates are driving physicians out of business or to States where there is legislation capping malpractice awards.7, 8, 9 The market for medical malpractice insurance is volatile, and there have been numerous “crises” in this market over the past three decades.10 In response to a crisis in the early 1970s, California passed the Medical Injury Compensation Reform Act of 1975 (MICRA) limiting noneconomic damages in medical malpractice cases. MICRA is often cited as a model for State legislation; and research has shown that between 1975 and 2000, malpractice premiums grew more slowly in California than they did in the rest of the Nation (167 percent vs. 505 percent).11 A recent publication of the American Medical Association (AMA) discusses the determinants of professional liability insurance (PLI) rates:12
The increase in the frequency and amount of very large awards may be one of the significant drivers of the rapid escalation in PLI costs. If this is true, then one would expect, over time, that PLI rates in states that have effective damage caps would diverge from the PLI rates in states that have effective tort reform.
There is a sizable body of economic literature demonstrating that the legal environment in a State affects the frequency of malpractice claims and the size of the awards.13 For examples, Zuckerman, Bovbjerg, and Sloan demonstrated that physicians in States with caps on damages in malpractice cases experience lower premiums than physicians in States without such laws.14 Danzon found that damage awards in States with caps on damages were 23 percent lower than in States without caps.15 In another article, Kessler and McClellan examined the impact of tort reforms on the practice of defensive medicine and found that tort reforms such as reasonable limits on noneconomic damages, which have been in effect in California for 25 years, can reduce health care costs by 5 percent to 9 percent without substantial effects on mortality or medical complications.16 Proponents of tort reform legislation emphasize that only 28 percent of physician payments for malpractice insurance are allotted to patients and that the remaining 72 percent are consumed by administrative and related costs.17 Opponents of tort reform legislation that caps damage awards in malpractice cases maintain that poor quality and poor investments by insurance companies are to blame for the recent spike in malpractice rates. They argue that caps will harm those patients who suffer the most damage and who need help the most, and that payments for medical malpractice claims are not the underlying cause of rapidly increasing malpractice premiums. A recent article states:
“According to the Consumer Federation of America, the average pay-out by medical malpractice insurance companies is about $30,000 per claim and has been virtually unchanged for the last decade.”18
Although there is little agreement about the underlying causes of increases in malpractice premium rates, there is little dispute that rapidly increasing malpractice premium rates have mobilized physicians and engendered considerable support for legislation limiting malpractice damage awards.19 Increasing rates for malpractice premiums and calls for tort reform coincide with increasing concerns about access to care. A recent BlueCross/BlueShield publication adds:
“What is not in dispute is that the medical liability problem has gained prominence at a time when public concerns about access to care and the cost of that care have re-emerged with new strength.”20
Supporters of legislation capping malpractice damage awards maintain that this legislation is necessary to assure adequate access to health care. One newspaper article points out:21
“The American Medical Association says patients’ access to care already is seriously threatened in a dozen states and a crisis is looming in seven others because of rising premiums for malpractice insurance.”
A 2003 report by the U.S. Department of Health and Human Services has stated:
“Increasingly, Americans are at risk of not being able to find a doctor when they most need one. Doctors have given up their practices, limited their practices to patients who do not have health conditions that are more likely to lead to lawsuits, or have moved to states with a fairer legal system where insurance can be obtained at a lower price.”22
And, last year another article reported:
“Nationally, medical liability insurance rates have skyrocketed with several states facing a meltdown of their health care system as a result. In the states with the fastest-growing rates, doctors have begun ‘running bare’, without insurance coverage, or have left the state altogether.”23
Background
Two types of liability are germane to this study: contract and tort.24,25,26 Contracts are voluntary agreements entered into for significant benefit between parties, and contract liability involves implementing the provision of contracts. Contracts specify in detail the services that will be afforded, and the liabilities created by contracts are limited to the cost of the services specified in the contract (e.g., there are no punitive damages for breach of contract or liability for unanticipated outcomes following the breach of contract). This certitude and the limited liability required under contracts have been an effective mechanism by which to assist fruitful relationships among distinct contributors in our economic system, and courts have been hesitant to void the provisions of contracts between consenting parties. Torts are civil wrongs where the injured person asks for monetary damages from an individual in a situation where there is no contractual relationship. Tort law sets in place public procedures about how people and businesses are anticipated to act toward one another. Most people who are engaged in a “learned profession” may be sued in tort for malpractice (e.g., negligence claims by patients against their physicians for malpractice are tort claims). Compensation in malpractice cases may consist of expenses for all harm endured by the patient counting medical care costs, lost wages, pain, and suffering, as well as punitive payments in situations where there was malicious intent.
Methodology
The theoretical structure underlying the empirical analysis in this study is that one of the factors taken into consideration by physicians in selecting a site to practice is the market for medical malpractice insurance.27 In particular, it is hypothesized that physicians are more likely to settle in a State with a law that limits their exposure to malpractice damage awards.
One recent newspaper article maintains:
“On a much broader level, it [the litigation crisis] brought new attention to a national problem that doctors say is obliging many of them to flee certain states or give up certain specialties – or the entire profession – because of skyrocketing insurance premiums linked to soaring jury awards.”28
And another adds:
“Yet while the doctors will be the ones to feel the pain first, it is the patients who will do the real suffering, perhaps, in the form of higher fees, and in declining health care as more doctors hang up their surgical gowns.”29
Our model presupposes that factors affecting the demand for physician services also affect the geographic distribution of physicians. For example, recent research has shown that economic development measured by per capita income is positively correlated with physician supply across a variety of countries.30 In our study, we presume that States with higher personal incomes are more desirable locations in which to practice because they have a higher demand for health services, and this, in turn, will result in higher physician incomes and a greater supply of physicians. For this reason, we include personal income in our model. Similarly, we presume that States with higher unemployment rates are likely to have a lower demand for health services and this will result in lower physician incomes. As a result, we include a State’s unemployment rate in our model. Because of the longer distances involved in seeing patients and the relative scarcity of health care resources, it is assumed that physicians will be more likely to settle in more densely populated areas. In discussing States where physicians have a problem in obtaining affordable malpractice insurance, a recent newspaper article maintains:
Larger malpractice claims mean higher insurance premiums and more money for trial lawyers. They also mean fewer doctors, particularly in the states most affected. Within those states, the hardest hit communities are rural, where a doctor’s income is not enough to offset higher premiums. Those doctors will leave the small towns for the cities, leave the state for a more friendly environment or simply quit practicing.31
For this reason, we include a variable that measures the number of citizens (measured in thousands) per square mile for each State. Older persons have a greater demand for health care services than younger citizens due to the increased frequency of illness. Moreover, persons over the age of 65 are almost always covered by Medicare. Thus, it is hypothesized herein that physicians will be more likely to settle in areas with relatively high proportions of elderly citizens. Consequently, this study includes a variable that measures the proportion of each State’s population that is 65 years or older.
The proportion of persons working on farms is assumed to be negatively related to the demand for health services. Farm workers are more likely to lack insurance and receive low wages and thus are expected to have little disposable income to spend on health care services. Consequently, a variable measuring the percentage of the State domestic product (i.e., a measure of the value of goods and services produced within a State) attributable to farm activities is included in the model. This study estimates the impact of State laws limiting damage awards in malpractice cases on physician availability first using statewide aggregate data and then using county data. Physician availability is measured by the number of active, non-Federal physicians practicing in each State per 100,000 population using data provided by the AMA. The primary independent variable of interest is set equal to 1 if the State has a law that limits the level of damage awards and zero otherwise. That is, this variable is set equal to 1 for the 19 States listed in Table 1A (excluding Alaska). The aforementioned variables are utilized in the analyses based on State data. The State-level analyses are conducted on State characteristics at four points in time: 1985, 1990, 1995, and 2000. To test the robustness of these State-level analyses, we perform an additional analysis at the county level for the final 5 years (1996-2000) using two additional control variables available for these years of county data. First, in our county-level analyses, we use a variable set equal to 1 if a county has a hospital with a physician residency training program, and we hypothesize that this variable has a positive coefficient because medical residents are more likely to settle in areas where they have trained. We do not use this variable in the State-level analyses because every State has at least one hospital with a residency program. Second, in the county-level analysis, we are able to control for the county’s health maintenance organization (HMO) enrollment. We use a variable set equal to 1 if the county has high HMO penetration (an HMO enrollment above 30 percent) at the midpoint of the 5-year period: 1998. We hypothesize that physician availability will be lower for counties with high HMO penetration since HMOs tend to restrict patient access to doctors through closed networks. We do not use this variable in the State-level analyses because of the high correlation between population per square mile and HMO penetration. Physician availability is measured by the number of active, non-Federal physicians practicing in each county per 100,000 population. In addition, in the county analysis, we derive a measure of rural influence from a variable constructed by the U.S. Department of Agriculture that is available in the Area Resource File (ARF). We hypothesize that this variable, which we refer to as “ruralness,” is negatively related to the supply of physicians. We also use a variable measuring the number of births per capita in each county. This variable measures the youthfulness of the population, and we hypothesize that it will have a negative coefficient in our equations.
A variable measuring the unemployment rate in each county also is included. However, we do not utilize a variable that measures the proportion of income attributable to farm activities because this information is not readily available for counties. Finally, we also include a variable that is set equal to 1 if the county has an average annual temperature of 70 degrees or higher. We hypothesize that doctors may tend to set up practice in temperate climates of the country. Moreover, the elderly tend to retire to these areas, and they require a greater level of physician services. We estimate our model using State data and then county data because these approaches have offsetting strengths and weaknesses. The empirical analyses utilizing State data provide information about the effectiveness of State laws limiting damage awards on the supply of physicians in each State. And, because we are interested in ascertaining the impact of State laws on physician supply in a State, the use of the State as a unit of observation is reasonable. However, models using State data provide a relatively blunt instrument to assess the impact of a law that limits payments for damages in medical malpractice cases because this approach obscures the impact of variables within specific markets within a State. Analyses based on county data include information about counties with different characteristics within each State. Thus, analyses based on county data can tell us whether a county with a hospital that has a residency program has a larger supply of physicians than a county without such a hospital. Moreover, the use of county data may be more appropriate than State data to the extent that the impact of specific variables is felt within each county rather than within each State. For example, the unemployment rate of each county (as opposed to the unemployment rate in the State) may be a better measure of the impact of unemployment on physician supply in a given county than the unemployment rate in the State. However, in cases where the market for physician care extends beyond a county’s border, the use of the county as the unit of observation may distort estimates of the impact of the law. Adjusting for the simultaneous impact of multiple factors (i.e., independent variables including the existence of a State law limiting malpractice damage awards) on the dependent variable is accomplished using multivariate linear regression analysis. Coefficients for the independent variables in our multivariate linear regression analysis are estimated using least-squares estimators (i.e., the estimated coefficients are obtained so that they result in the lowest sums of squares of the differences between the actual and estimated value of the dependent variable). This model is estimated under the usual assumptions that the relationship between the dependent and the independent variables is linear and that the error term is normally distributed.32 The robust standard errors in the county analysis are heteroskedasticity-consistent and are corrected for clustering at the county level. Influential outliers were removed from the county data: about 30 counties were dropped since they were coded with either less than
10 doctors per 100,000 residents or over 1,000 doctors per 100,000 residents. This was less than 1 percent of the county sample.
Data
Information about State medical liability laws was obtained from the National Conference of State Legislatures (NCSL),33 the American Tort Reform Association (ATRA),34 and from publications of a large law firm.35 The NCSL provides a listing by State of all State medical liability laws that includes the type of reform implemented (e.g., limit on economic and noneconomic damage awards) and the specific legislation that enacted this reform. In 1994, the ATRA created a publication that displayed the status of each State law on medical liability. This publication has been updated several times since that time, and it is currently available on the ATRA Web site. McCullough, Campbell & Lane is a large general practice law firm located in Chicago with a specialty in insurance law, and this firm publishes a compendium of all legislation relating to medical malpractice for each state. This compendium is available on the McCullough, Campbell & Lane Web site (http://www.mcandl.com/states.html). These data sources were used to ascertain the date of the legislation enacting state laws that limit damage awards in medical malpractice cases (see Table 1A). Five States enacted legislation capping awards before 1985, and the dummy variable for the cap variable in our 1985 data set was set equal to 1 for each of these five States. Each of these laws was enacted in 1975 or 1976 in response to the medical malpractice crisis in the early 1970s. Ten States enacted laws implementing damage caps in malpractice cases in 1985 or 1986 in response to the medical malpractice crisis in the early 1980s. The 1986 Alaska law was exceptional among these laws because it excluded cases involving physical impairment or severe disfigurement, and it is uncertain how many malpractice cases were subject to this exclusion. In any event, we excluded Alaska from our analyses because of this ambiguity and because the empirical relationship between factors affecting physician decisions whether or not to locate in Alaska is likely to be quite different from this relationship for other States. The dummy variable for the cap variable in our 1990 data set was set equal to 1 for each of the nine States (excluding Alaska) that adopted caps in 1985 or 1986. Two States implemented legislation capping damages in 1988, one in 1990, and two in 1995. Thus, we set the dummy variable indicating the existence of a law limiting damage awards to 1 for the 19 States with such a law (excluding Alaska) in our 1995 data set and we set this variable equal to 1 for the same 19 States in our 2000 data set (see Table 1A for a list of the States). Data on State characteristics for the years 1980, 1990, 1995, and 2000 are used in our model, and these data were obtained from various issues of the Statistical Abstract of the
United States. The following paragraphs define each variable and indicate the underlying data source. The variable population per square mile of land area was derived from data on each State’s population and its number of square miles as provided by the U.S. Census Bureau (U.S. Department of Commerce).36 The U.S. Census Bureau issues State population estimates that are updated annually and are based on the preceding decennial census as well as other more limited surveys. Data on proportion of the population 65 years or older for each State were obtained from the U.S. Census Bureau. Data on State unemployment rates were obtained from the U.S. Department of Labor’s Current Population Survey (CPS).37 The CPS is a monthly, random, national survey of the noninstitutionalized population in the United States. About 50,000 households are sampled each month. Data on mean State per capita personal income were obtained from the various issues of the Survey of Current Business, a publication of the Bureau of Economic Analysis, U.S. Department of Commerce. Data on the proportion of the State domestic product attributable to farm income also were obtained from reports issued by the U.S. Department of Commerce.38 Farm income comprises cash receipts from the marketing of crops and livestock as well as government payments made directly to farmers for farm-related activities. Information about the number of hospital beds in each State was obtained from data published by the American Hospital Association (AHA).39 The AHA provides information about the number of hospital beds in non-Federal, short-term community hospitals in each State that are acceptable for registration with AHA. The data in our county analyses were obtained from the 2002 Area Resource File. The ARF is maintained by Quality Resource Systems, Inc., under contract with the Bureau of Health Professions, Health Resources and Services Administration, U.S. Department of Health and Human Services. The ARF is a county database that includes statistics on health facilities, health professions, economic activity, and health training programs. Just as in the Statistical Abstract of the United States, the ARF uses existing data sources. Indeed, in many instances, the Statistical Abstract of the Unites States and the ARF use the same underlying source of data. The dependent variable in both our State-level and county-level analyses is the number of active, non-Federal physicians per 100,000 civilians residing in each State. Both the Statistical Abstract of the Unites States and the ARF obtain the number of active, non-Federal physicians from the AMA.40 AMA publications contain information about the professional and individual characteristics of all practicing physicians. Data on the population in each county are based on publications of the U.S. Bureau of the Census. Data on births in each county were obtained from the National Center for Health
Statistics, Centers for Disease Control and Prevention (CDC), and data on the unemployment rate in each county were provided by the U.S. Department of Labor. Results
There are 196 observations for each variable in our analyses of State data (observations for 49 States at four points in time), and Table 2 presents a list of the variables and their respective means. The average number of active, non-Federal physicians practicing per 100,000 residents in each state was 208, and the average percent of the population in each State over the age of 65 is 13 percent. The average unemployment rate is 5.53 percent, and the average number of beds per 1,000 residents is 4.03. Observations from each of the four time periods in our analyses (1985, 1990, 1995, and 2000) from each of the 49 States in our sample were combined to estimate the impact of State laws that limit payments in malpractice cases on physician availability. Table 3 presents the estimates of the coefficients of each variable derived using ordinary least squares estimation techniques. The coefficients of the independent variables in the equation were estimated using 196 observations, and the independent variables explain 52 percent of the variation between the square of the difference between the estimated and actual value of the dependent variable. All variables entered the equation with the expected signs, and all but one were statistically significant at a 95-percent confidence level. The coefficient for States with a cap on damage awards in malpractice cases is about 24 (Table 3). This implies that States with a cap average 24 more physicians per 100,000 residents than States without such a cap. Thus, States with caps have about 12 percent more physicians per capita than States without a cap (12% = 24/208). The coefficient for the variable measuring the proportion of the population 65 years of age or older in Table 3 indicates that States with a greater proportion of elderly citizens have more physicians. For each percentage-point increase in the age variable, the number of physicians per 100,000 residents increased by about 5. Thus, we would expect Florida, which averaged 18.5 percent of its population 65 years of age or above, to have about 42 more physicians per 100,000 residents than Georgia, which averaged 10.2 percent of its population age 65 or older over the four time periods. Table 3 also shows that a 1-percentage-point increase in the unemployment rate was associated with a decrease in over 6 physicians per 100,000 residents, and that a 1-percentage-point increase in the proportion of a State’s domestic product attributable to farm activities was associated with a decrease of about 5 physicians per 100,000 residents. Income was positively related to physician availability as hypothesized, and an increase of $1,000 per year in income was related to an increase of slightly more than 1 physician per 100,000 residents. Population density as measured by the number of residents in thousands per square mile was also positively related to physician supply as anticipated, and an increase of 1,000
residents per square mile in a State was associated with an increase of about 17 physicians per 100,000 residents. Table 4 presents estimates of coefficients after including dummy variables for three of the four time periods (1990 is the reference time period). This model also was estimated using the ordinary least squares regression technique, and the coefficients for each of the three nonreference time periods were statistically significant. Nevertheless, the size and sign of the coefficient for the variable for States with a law capping damage awards were still positive, statistically significant, and of similar magnitude as that in the model with time variables. Indeed, the magnitude of the coefficient for the damage caps variable was robust across a diversity of models. In each of four equations that was estimated using data from a single time period (results not reported here), the coefficient for the damage cap variable was positive and was only slightly less than the coefficient in the combined runs. Furthermore, the coefficients were statistically significant in three of the four equations. We also estimated our model setting the independent variable for caps equal to 1 only for States listed in a 2003 report by the U.S. Department of Health and Human Services with a cap on noneconomic damage awards of less than $350,000 (California, Hawaii, Indiana, Michigan, Montana, New Mexico, North Dakota, South Dakota, Utah, and Wisconsin)41 and zero otherwise. We then estimated our model where the dummy variable was equal to 1 for the other nine States with a cap on malpractice damage awards above $350,000 (Colorado, Idaho, Kansas, Louisiana, Maryland, Massachusetts, New Mexico, Virginia, West Virginia) and zero otherwise. We found the coefficient for the cap variable in each of these models to be positive, but it was statistically significant only in the model where the dummy variable was equal to 1 for States with a cap on noneconomic damages of less than $350,000. Variables with coefficients that are not statistically significant are considered to have effects that are not distinguishable from a zero-effect. Thus, a State that passes legislation capping payments for noneconomic damages in malpractice cases at relatively high levels might not realize an increase in the number of physicians practicing in the State. Ohio, Oregon, and Texas had provisions that set limits on noneconomic damages in malpractice cases that were struck down by their State Supreme Court, and these limits were in effect for more than 4 years.a We estimated our State data model setting our cap variable equal to 1 during the time periods the State law capping noneconomic payments in malpractice cases was in effect for Ohio, Oregon, and Texas in addition to setting it
a Alabama, Florida, Idaho, Illinois, and Washington also had statutes overturned but they were in effect less than 4 years. Idaho overturned a statute that capped noneconomic damages that applied only to medical liability cases, but another statute that capped noneconomic damages in all liability cases was passed and is still in effect.
equal to 1 for our original 19 States. The coefficient for the cap variable remained positive, significant, and of similar magnitude. While the State data provided a picture of liability caps over the years 1985, 1990, 1995, and 2000, we next used county data to provide a finer, more detailed analysis of the final 5-year period: 1996-2000. Table 5 presents the means of each of the variables used in our analyses based on 14,640 observations from county data over the 5 years from 1996 through 2000. The average number of physicians per 100,000 population was 117 over this time period. This figure is significantly lower than the 208 physicians per 100,000 that we found in our analyses of State data from 1985, 1990, 1995, and 2000. The reason for this is that most counties are rural with a low number of doctors; and since each county has equal weight in the county analysis, the average number of doctors per 100,000 population across all counties (117) is lower than the average number of doctors across all States (208), which is skewed upward by the highly populated metropolitan areas of the State. Table1A lists the number of physicians per 100,000 county residents State by State for States that had caps in the year 2000. In contrast, Table 1B lists the number of physicians per 100,000 county residents State by State for States that either did not have caps or had their caps overturned in court. Table 5 shows that about 10 percent of all counties had a hospital that operated a residency training program, and the average unemployment rate was 5.3 percent. About 22 percent of counties had a high HMO enrollment rate (i.e., an HMO penetration rate greater than 30 percent). Table 6 presents results using county data for the years 1996 through 2000. The coefficient for the variable of interest is 13.65. That is, counties in States without caps have 111.83 doctors per 100,000 population, while counties in States with caps have 13.65 more doctors per 100,000 population (i.e., 125.48 doctors) (The mean number of doctors—111.83 in noncapped States and 125.48 in capped States—is simulated from a linear prediction of the regression results in Table 6.) Thus, States with caps have 12.2 percent more doctors per county than States without caps (i.e., 12.2%=13.65/111.83). This county coefficient is about half the absolute size of the coefficient found using State data because the number of doctors per 100,000 residents is lower at the county level than at the aggregate State level. However, the percentage impact is about the same (12 percent). The coefficient of each of the other variables in the equation was of the expected sign, and all coefficients were statistically significant at a 99 percent level of confidence.
Discussion
Between 1970 and 2000, the supply of physicians per capita increased at a faster rate in those States that passed tort reform laws that capped damage payments in malpractice cases (see Tables 1A and 1B). In 1970, before any States had enacted caps, the average number of physicians per 100,000 population per county was 69 in States that eventually
enacted caps between 1970 and 2000, compared with 67 in States that never enacted caps. This difference (69 vs. 67) is statistically insignificant (P=0.22). However, by the year 2000, the States that had enacted caps had a significantly higher number of doctors per 100,000 population per county (135) compared with States that did not enact caps (120) (P=0.006). This trend indicates that caps may have possibly increased the availability of physicians. To examine whether this was indeed the case, we controlled for other State and county characteristics that may have also impacted physician availability (such as medical residency programs, HMO penetration, etc.). In particular, this study utilizes information about such numerous State characteristics in the years 1985, 1990, 1995, and 2000, as well as information about numerous county characteristics in 1996, 1997, 1998, 1999, and 2000 to ascertain the relationship between State tort reform laws that cap damage payments in malpractice cases and the supply of physicians. This study finds evidence supporting the claim that States with caps on noneconomic damages awards or caps on total damage awards benefit from about 12 percent more physicians per capita than States without such laws. This evidence was derived first in analyses where the State was the unit of observation and then in analyses where the county was the unit of observation. We found that the magnitude of the impact of laws limiting damage payments using State data and county data was similar. Furthermore, we found that the magnitude of the coefficient of the variable representing the existence of a State law limiting damage payments was similar across various specifications of each type of model. The robustness of this finding supports the argument that State laws limiting noneconomic damages in medical malpractice cases increase the number of physicians who practice in the State. Nevertheless, this study has limitations. First, there are factors other than those included in our model that affect the supply of physicians. For example, the proportion of the population without health insurance is likely to be related to physician supply through its influence on the demand for physician services. Nonetheless, the proportion of people without health insurance is likely related to the unemployment level in a State as well as to the proportion of its production attributable to farm activities. Thus, there are variables in our analysis that are likely to account for at least some of the influence of these omitted variables. In any event, the variables in our model explain more than half of the variation around the mean in our State analyses, and this is quite large for a model that is estimated with predominantly cross-sectional data. Second, there are other State laws that may affect physician location decisions. For example, some States have passed laws that permit awards in malpractice cases to be made over a period of time (i.e., they permit periodic payments) and laws that eliminate or weaken the “joint and several liability” principle (the common rule of joint and several liability calls for losing defendants to pay all the damage in spite of their level of fault). Although such laws may be related to the decision of a physician on whether or not to practice in a given geographic area, these types of laws are not nearly as conspicuous as laws that cap payments. Previous research has shown that laws that indirectly affect the

level of malpractice damage awards (e.g. laws permitting periodic payments) have less impact on malpractice premiums than laws that directly limit malpractice damage awards.42 Finally, this study employs State and county data. Consequently, there may be problems with aggregation bias (i.e., the relationships that exist at the individual level may be obscured when observations are viewed as a group).43, 44 There is, however, justification for estimating an equation using State and county data because the independent variable of interest in this study is whether or not a State has a law that limits damage awards in malpractice cases, and we are interested in the impact of this type of State law on the supply of physicians. Although it is not possible to conduct a randomized trial to confirm the findings of this study, future studies should include more variables and utilize data from more time periods. Future studies also should focus on important questions such as: how the level at which noneconomic damages is capped is related to the supply of physicians; whether or not physician supply is related to the length of time since the law has been in effect; and whether or not other types of state tort reform laws such as those that eliminate or weaken the principle of joint and several liability are related to physician supply.
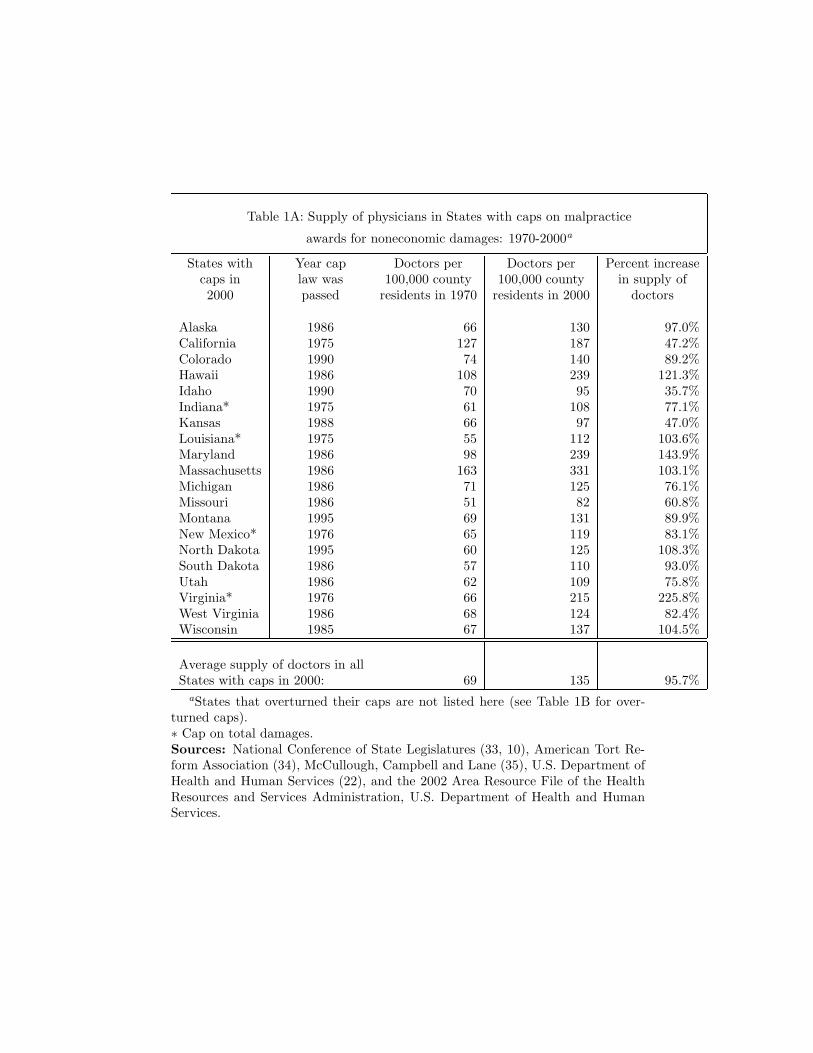
Table 1A: Supply of physicians in States with caps on malpractice
awards for noneconomic damages: 1970-2000a
States with Year cap Doctors per Doctors per Percent increasecaps in law was 100,000 county 100,000 county in supply of2000 passed residents in 1970 residents in 2000 doctors
Alaska 1986 66 130 97.0%California 1975 127 187 47.2%Colorado 1990 74 140 89.2%Hawaii 1986 108 239 121.3%Idaho 1990 70 95 35.7%Indiana* 1975 61 108 77.1%Kansas 1988 66 97 47.0%Louisiana* 1975 55 112 103.6%Maryland 1986 98 239 143.9%Massachusetts 1986 163 331 103.1%Michigan 1986 71 125 76.1%Missouri 1986 51 82 60.8%Montana 1995 69 131 89.9%New Mexico* 1976 65 119 83.1%North Dakota 1995 60 125 108.3%South Dakota 1986 57 110 93.0%Utah 1986 62 109 75.8%Virginia* 1976 66 215 225.8%West Virginia 1986 68 124 82.4%Wisconsin 1985 67 137 104.5%
Average supply of doctors in allStates with caps in 2000: 69 135 95.7%
aStates that overturned their caps are not listed here (see Table 1B for over-turned caps).∗ Cap on total damages.Sources: National Conference of State Legislatures (33, 10), American Tort Re-form Association (34), McCullough, Campbell and Lane (35), U.S. Department ofHealth and Human Services (22), and the 2002 Area Resource File of the HealthResources and Services Administration, U.S. Department of Health and HumanServices.
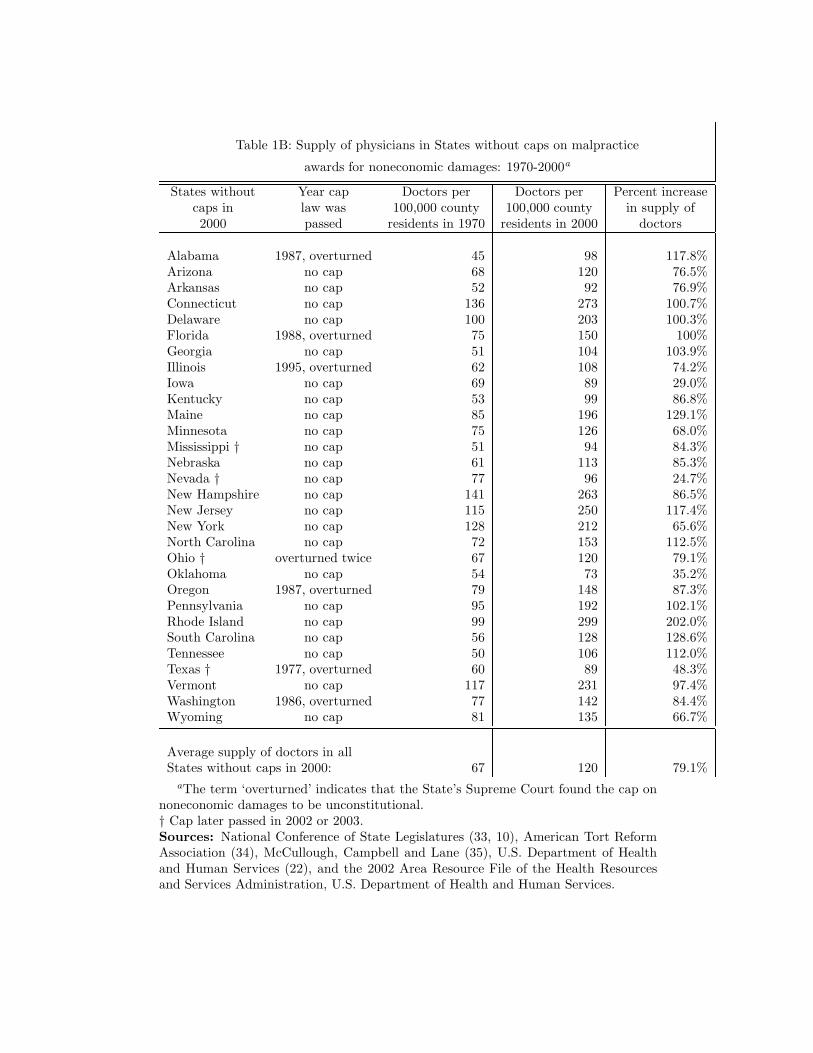
Table 1B: Supply of physicians in States without caps on malpractice
awards for noneconomic damages: 1970-2000a
States without Year cap Doctors per Doctors per Percent increasecaps in law was 100,000 county 100,000 county in supply of2000 passed residents in 1970 residents in 2000 doctors
Alabama 1987, overturned 45 98 117.8%Arizona no cap 68 120 76.5%Arkansas no cap 52 92 76.9%Connecticut no cap 136 273 100.7%Delaware no cap 100 203 100.3%Florida 1988, overturned 75 150 100%Georgia no cap 51 104 103.9%Illinois 1995, overturned 62 108 74.2%Iowa no cap 69 89 29.0%Kentucky no cap 53 99 86.8%Maine no cap 85 196 129.1%Minnesota no cap 75 126 68.0%Mississippi † no cap 51 94 84.3%Nebraska no cap 61 113 85.3%Nevada † no cap 77 96 24.7%New Hampshire no cap 141 263 86.5%New Jersey no cap 115 250 117.4%New York no cap 128 212 65.6%North Carolina no cap 72 153 112.5%Ohio † overturned twice 67 120 79.1%Oklahoma no cap 54 73 35.2%Oregon 1987, overturned 79 148 87.3%Pennsylvania no cap 95 192 102.1%Rhode Island no cap 99 299 202.0%South Carolina no cap 56 128 128.6%Tennessee no cap 50 106 112.0%Texas † 1977, overturned 60 89 48.3%Vermont no cap 117 231 97.4%Washington 1986, overturned 77 142 84.4%Wyoming no cap 81 135 66.7%
Average supply of doctors in allStates without caps in 2000: 67 120 79.1%
aThe term ‘overturned’ indicates that the State’s Supreme Court found the cap onnoneconomic damages to be unconstitutional.† Cap later passed in 2002 or 2003.Sources: National Conference of State Legislatures (33, 10), American Tort ReformAssociation (34), McCullough, Campbell and Lane (35), U.S. Department of Healthand Human Services (22), and the 2002 Area Resource File of the Health Resourcesand Services Administration, U.S. Department of Health and Human Services.
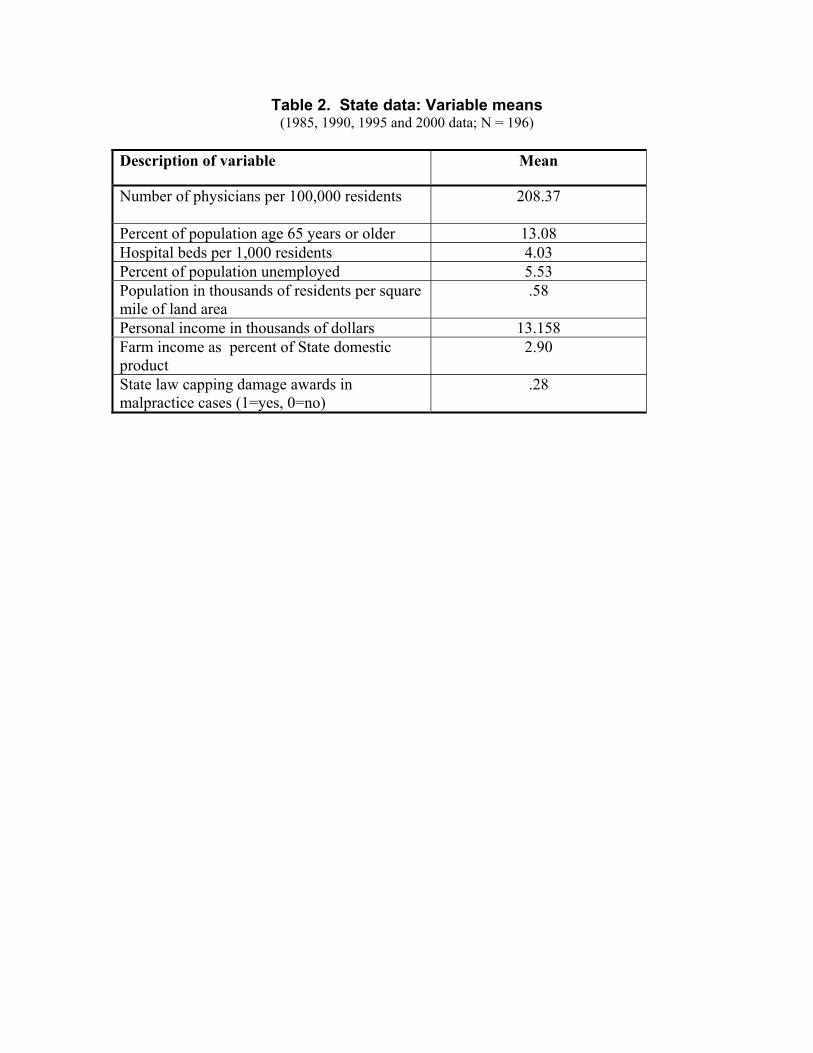
Table 2. State data: Variable means (1985, 1990, 1995 and 2000 data; N = 196)
Description of variable Mean
Number of physicians per 100,000 residents
208.37
Percent of population age 65 years or older 13.08 Hospital beds per 1,000 residents 4.03 Percent of population unemployed 5.53 Population in thousands of residents per square mile of land area
.58
Personal income in thousands of dollars 13.158 Farm income as percent of State domestic product
2.90
State law capping damage awards in malpractice cases (1=yes, 0=no)
.28
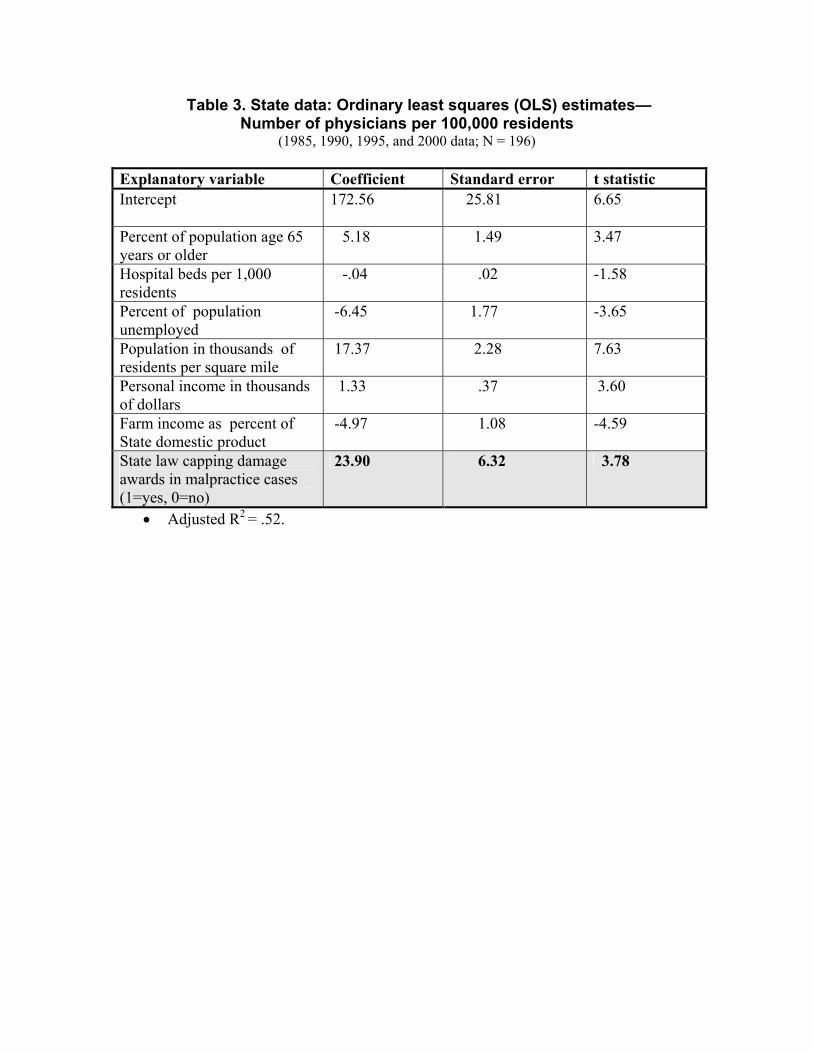
Table 3. State data: Ordinary least squares (OLS) estimates— Number of physicians per 100,000 residents
(1985, 1990, 1995, and 2000 data; N = 196) Explanatory variable Coefficient Standard error t statistic Intercept
172.56 25.81 6.65
Percent of population age 65 years or older
5.18 1.49 3.47
Hospital beds per 1,000 residents
-.04 .02 -1.58
Percent of population unemployed
-6.45 1.77 -3.65
Population in thousands of residents per square mile
17.37 2.28 7.63
Personal income in thousands of dollars
1.33 .37 3.60
Farm income as percent of State domestic product
-4.97 1.08 -4.59
State law capping damage awards in malpractice cases (1=yes, 0=no)
23.90 6.32 3.78
• Adjusted R2 = .52.
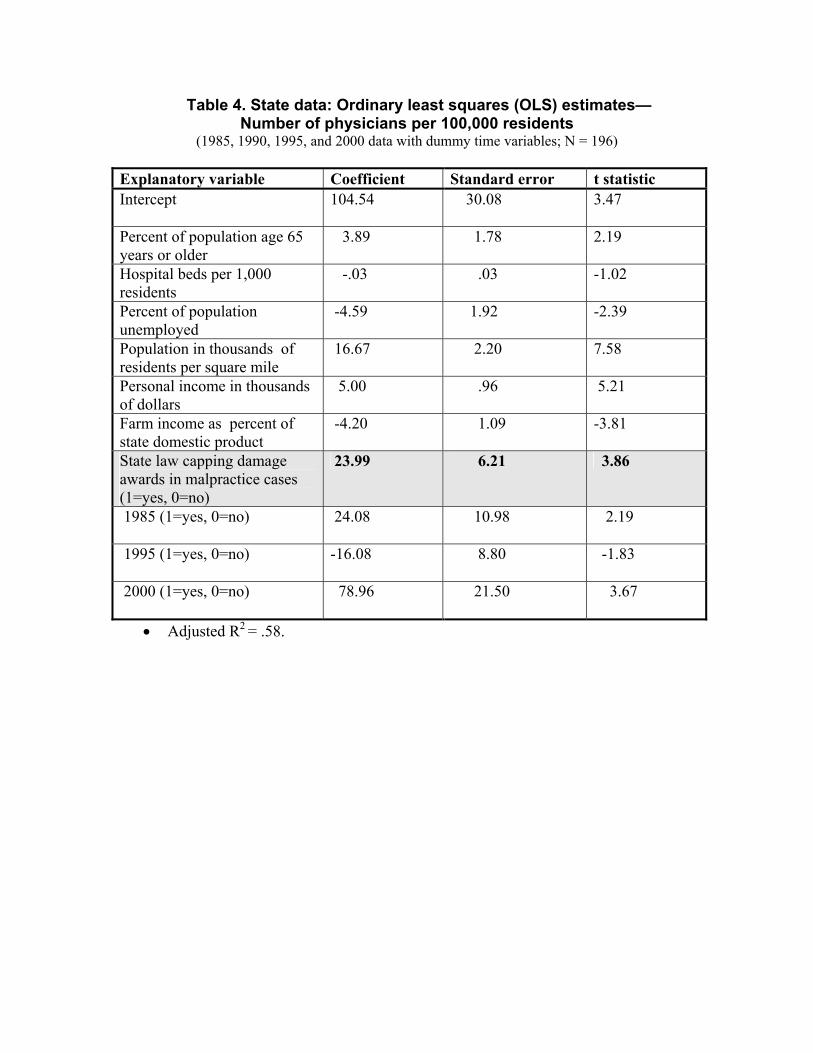
Table 4. State data: Ordinary least squares (OLS) estimates— Number of physicians per 100,000 residents
(1985, 1990, 1995, and 2000 data with dummy time variables; N = 196)
Explanatory variable Coefficient Standard error t statistic Intercept
104.54 30.08 3.47
Percent of population age 65 years or older
3.89 1.78 2.19
Hospital beds per 1,000 residents
-.03 .03 -1.02
Percent of population unemployed
-4.59 1.92 -2.39
Population in thousands of residents per square mile
16.67 2.20 7.58
Personal income in thousands of dollars
5.00 .96 5.21
Farm income as percent of state domestic product
-4.20 1.09 -3.81
State law capping damage awards in malpractice cases (1=yes, 0=no)
23.99 6.21 3.86
1985 (1=yes, 0=no)
24.08 10.98 2.19
1995 (1=yes, 0=no)
-16.08 8.80 -1.83
2000 (1=yes, 0=no)
78.96 21.50 3.67
• Adjusted R2 = .58.
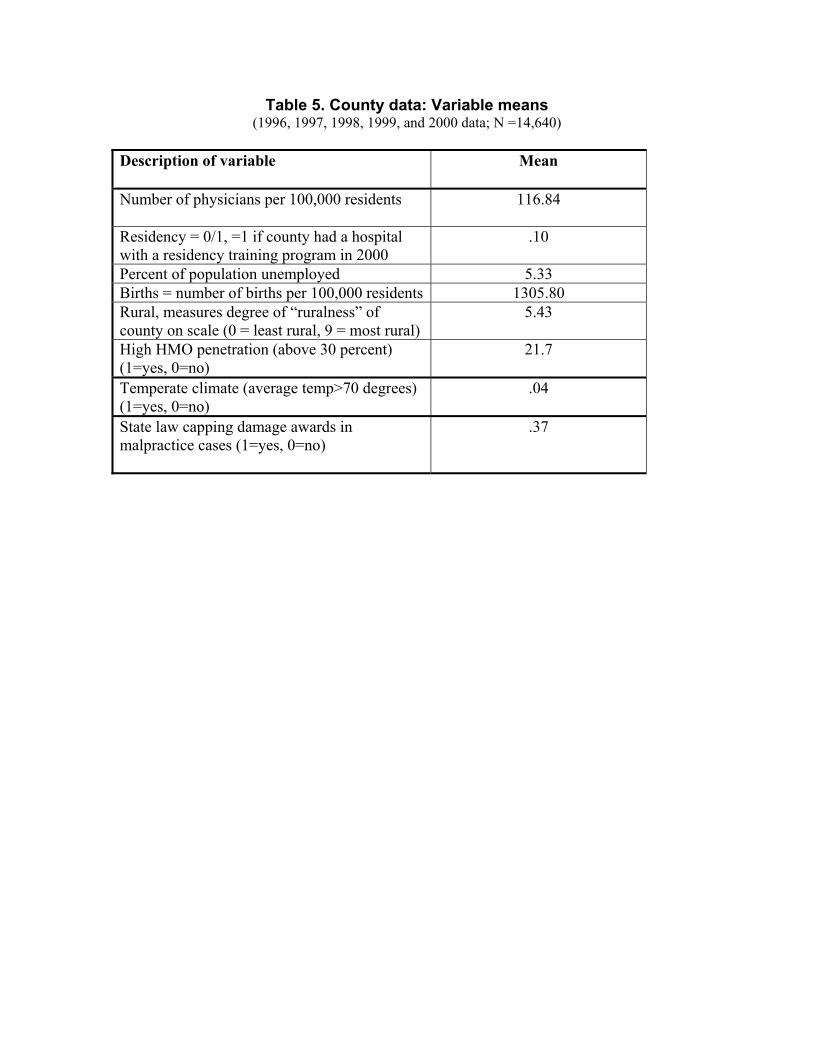
Table 5. County data: Variable means (1996, 1997, 1998, 1999, and 2000 data; N =14,640)
Description of variable Mean
Number of physicians per 100,000 residents
116.84
Residency = 0/1, =1 if county had a hospital with a residency training program in 2000
.10
Percent of population unemployed 5.33 Births = number of births per 100,000 residents 1305.80 Rural, measures degree of “ruralness” of county on scale (0 = least rural, 9 = most rural)
5.43
High HMO penetration (above 30 percent) (1=yes, 0=no)
21.7
Temperate climate (average temp>70 degrees) (1=yes, 0=no)
.04
State law capping damage awards in malpractice cases (1=yes, 0=no)
.37
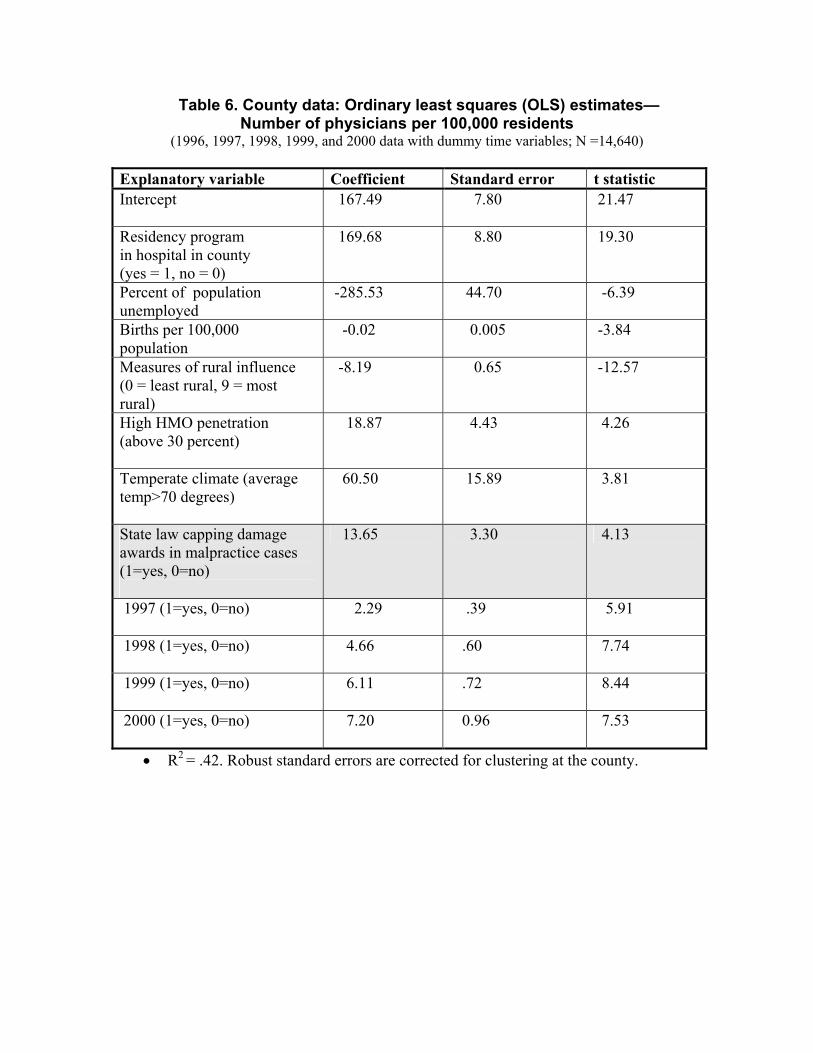
Table 6. County data: Ordinary least squares (OLS) estimates— Number of physicians per 100,000 residents
(1996, 1997, 1998, 1999, and 2000 data with dummy time variables; N =14,640)
Explanatory variable Coefficient Standard error t statistic Intercept
167.49 7.80 21.47
Residency program in hospital in county (yes = 1, no = 0)
169.68 8.80 19.30
Percent of population unemployed
-285.53 44.70 -6.39
Births per 100,000 population
-0.02 0.005 -3.84
Measures of rural influence (0 = least rural, 9 = most rural)
-8.19 0.65 -12.57
High HMO penetration (above 30 percent)
18.87 4.43 4.26
Temperate climate (average temp>70 degrees)
60.50 15.89 3.81
State law capping damage awards in malpractice cases (1=yes, 0=no)
13.65 3.30 4.13
1997 (1=yes, 0=no)
2.29 .39 5.91
1998 (1=yes, 0=no)
4.66 .60 7.74
1999 (1=yes, 0=no)
6.11 .72 8.44
2000 (1=yes, 0=no)
7.20 0.96 7.53
• R2 = .42. Robust standard errors are corrected for clustering at the county.
NOTES AND REFERENCES 1 Johnson, Carla K. “Diagnosis: Medical Error.” Spokesman Review (Spokane, Washington), February 9, 2003, P. B1. 2 Hirschorn, James M. “The Doctors’ Strike in Context.” New Jersey Law Journal, February 17, 2003. 3 U.S. Department of Health and Human Services. Addressing the New Health Care Crisis: Reforming the Medical Litigation System to Improve the Quality of Health Care, Washington DC: Prepared by the Office of the Assistant Secretary for Planning and Evaluation, U.S. Department of Health and Human Services, March 3, 2003. 4 Haussman, Theodore and Brevic, Scott M. “State-Level Action.” National Law Journal, vol. 25, No. 71, February 23, 2003, P. A17. 5 Ullmer, Katherine. “Voinovich Seeking Malpractice Legislation” Dayton Daily News, May 4, 2003, p. 1.
6 Jarvis, Jan. “Financial Pressures are Thinning Doctors’ Ranks.” Fort Worth Star Telegram (Texas), June 16, 2003, p. 1.
7 Scheffey, Thomas B. “Med-Mal Caps Likely to Hurt Doctors’ Patients.” Connecticut Law Tribune, vol. 29, No. 4, January 27, 2003, P. 1. 8 Hollis, Mark “Patients Paying for Crisis: Malpractice Costs Have Forced Physicians to Reduce Services A South Florida Survey Found.” The Orlando Sentinel, January 2, 2003, p. B1. 9 U.S. Department of Health and Human Services. Addressing the New Health Care Crisis: Reforming the Medical Litigation System to Improve the Quality of Health Care, Washington DC: Prepared by the Office of the Assistant Secretary for Planning and Evaluation, U.S. Department of Health and Human Services, March 3, 2003. 10 Calvo, Cheye and Knievel, Erica. “Curing A Crisis in Medical Malpractice.” National Conference of State Legislatures Legisbrief: Briefing Papers on the Important Issues of the Day, vol. 10, No. 38, October 2002, pp. 1-2. 11 NAIC Profitability by Line by State, 2001, presented before the House Judiciary Committee by the Physicians’ Insurance Association of America (PIAA), June 2002. 12 Medical Professional Liability Insurance: Health Care Financial Trends Report, Chicago, IL: American Medical Association, April 2002. 13 Intrilligator, Michael D. and Kehner, Barbara H. “An Econometric Model of Medical
Malpractice.” The Economics of Medical Malpractice, Washington, DC: American Enterprise Institute for Public Policy Research, 1978. 14 Zuckerman, S., Bovbjerg, R.R., and Sloan, F. “Effects of Tort Reforms and Other Factors on Medical Malpractice Insurance Premiums” vol. 47, Inquiry,1990, pp. 167-182. 15 Danzon, P.M. “New Evidence on the Frequency and Severity of Medical Malpractice Claims.” Santa Monica, CA: RAND Report R-3410-1CJ, 1986. 16 Kessler, David and McClellan, Mark “Do Doctors Practice Defensive Medicine?” The Quarterly Journal of Economics, vol. 111, Issue 2, May 1996, pp. 353-390. 17 U.S. Department of Health and Human Services. Addressing the New Health Care Crisis: Reforming the Medical Litigation System to Improve the Quality of Health Care, Washington D.C.: Prepared by the Office of the Assistant Secretary for Planning and Evaluation, U.S. Department of Health and Human Services, March 3, 2003. 18 Salinero, Mike. “Rivals Roll Out Statistics in Malpractice Cap Battle.” Tampa Tribune, November 24, 2002, p. 1. 19 Cermak, Davin. “Medical Malpractice: The New Health Care Crisis or History Repeated?” NAIC Research Quarterly, vol. 8, Issue 3, Fall 2002, pp. 10-15. 20 The Malpractice Insurance Crisis: The Impact on Healthcare Cost and Access Chicago Illinois: BlueCross/BlueShield Association, 2002, p. 1. 21 MacDonald, John A. “Bush: Cap Awards in Malpractice Cases” The Hartford Courant, July 26, 2002, p. A3. 22 U.S. Department of Health and Human Services. Addressing the New Health Care Crisis: Reforming the Medical Litigation System to Improve the Quality of Health Care, Washington D.C.: Prepared by the Office of the Assistant Secretary for Planning and Evaluation, U.S. Department of Health and Human Services, March 3, 2003. 23 Carter, Ray. “Medical Liability Insurance Rates Threaten Health Care System” The Journal Record (Oklahoma City, Ok), September 25, 2002, p. 1. 24 Hans Bernd-Schäfer. "Liability of Experts and the Boundary between Tort and Contract", vol. 3, Theoretical Inquiries in Law (Online Edition): No. 2, Article 5 (2002). http://www.bepress.com/til/default/vol3/iss2/art5. 25 Rubin, Paul H. “Courts and the Torts-Contract Boundary in Product Liability” in Buckley, Frank ed., The Fall and Rise of Freedom of Contract. Durham, NC: Duke University Press, 1999.
26 Weiler, Paul C. Medical Malpractice on Trial. Cambridge MA: Harvard University Press, 1991. 27 Escarce, Jose J.; Polsky, Daniel; Wozniak, Gregory D., and Kletke, Phillip R. “HMO Growth and the Geographical Redistribution of Generalist and Specialist Physicians, 1987-1997.” Health Services Research, vol. 35, No. 4, October 2000, pp. 825-848. 28 “Trauma Over Soaring Insurance: Doctors, Hospitals Say They’re Being Squeezed by Expensive Malpractice Coverage.” The Milwaukee Journal Sentinel, July 21, 2002, p. 11D. 29 Warner, Susan. “Practicing Without a Net.” The New York Times, June 2, 2002, p. 1, (section 14NJ). 30 Cooper, Richard A., Getzen, Thomas E., and Laud, Prakash. “Economic Expansion is a Major Determinant of Physician Supply and Utilization.” Health Services Research, vol. 38 No. 2, April 2003, pp. 675-696. 31 “Medical Trial Lawyers Fuel Malpractice Meltdown.” The Daily Oklahoman, July 17, 2002, p. 2A. 32 Johnston J. Econometric Methods. New York: Macmillan Publishing Company, Inc., 1971. 33 State Medical Liability Laws Table. Washington, DC: National Conference of State Legislatures, October 2002. 34 State Laws on Medical Liability: Medical Liability Reform. Washington DC: American Tort Reform Association, 2002. 35 McCullough, Campbell & Lane. Summary of United States Medical Malpractice Law, available at: http://www.mcandl.com/states.html. 36 U.S. Department of Commerce, Bureau of the Census. Census of Population and Housing, Population and Housing Unit Counts. Washington DC: U.S. Department of Commerce, 1990 and 2000 Census publications. 37 U.S. Department of Labor, Bureau of Labor Statistics. Geographic Profile of Employment and Unemployment, various years. 38 U.S. Department of Commerce, Bureau of Economic Analysis. Survey of Current Business, various issues. 39 American Hospital Association. Hospital Statistics. Chicago, IL: American Hospital Association, various issues.
40 American Medical Association, Physician Characteristics and Distribution in the U.S., Chicago, Illinois: American Medical Association, various issues. 41 The States listed in Table 6 (p. 23) of the U.S. Department of Health and Human Services, Addressing the New Health Care Crisis: Reforming the Medical Litigation System to Improve the Quality of Health Care, Washington DC: Prepared by the Office of the Assistant Secretary for Planning and Evaluation, USDHHS, March 3, 2003, were used. 42 Sloan F.A, Mergenhagen P.M., and Bovbjerg R.R. “Effects of Tort Reforms on the Value of Closed Medical Malpractice Claims: A Microanalysis.” Journal of Health Politics, Policy and Law, vol. 14, 1989, pp. 663-689. 43 Green, H.A. John. Aggregation in Economic Analysis. Princeton NJ: Princeton University Press, 1964. 44 Theil, Henri Linear Aggregation of Economic Relations. Amsterdam, Netherlands: North Holland Publishing Company, 1954.
Top Related
Copyright © 2022 FDOKUMEN

